Embed Size (px)
Citation preview

IZDAVA^ I UREDNI[TVOPublisher and Editorial Office[umarski fakultet Sveu~ili{ta u ZagrebuFaculty of Forestry, University of Zagreb10000 Zagreb, Sveto{imunska 25Hrvatska – CroatiaTel. (+385 1) 235 25 53
SUIZDAVA^ICo-PublishersHrvatsko šumarsko društvo, ZagrebHrvatske šume d.o.o., ZagrebHrvatska komora inženjera šumarstva i drvne tehnologijeOSNIVA^FounderInstitut za drvnoindustrijska istra`ivanja, Zagreb
GLAVNA I ODGOVORNA UREDNICAEditor-in-ChiefRu`ica Beljo Lu~i}
POMO]NIK GLAVNE UREDNICEAssistant Editor-in-chiefJosip MiklečićUREDNI^KI ODBOREditorial BoardVlatka Jirouš-Rajković, HrvatskaBogoslav Šefc, HrvatskaZoran Vlaović, HrvatskaAndreja Pirc Barčić, HrvatskaNikola Španić, HrvatskaMiljenko Klarić, HrvatskaTomislav Sedlar, HrvatskaMaja Moro, HrvatskaMatija Jug, HrvatskaIvana Perić, HrvatskaJerzy Smardzewski, PoljskaMarko Petrič, SlovenijaKatarina Čufar, SlovenijaChristian Brischke, NjemačkaKazimierz Orlowski, PoljskaJakub Sandak, ItalijaŽeljko Gorišek, SlovenijaBorche Iliev, MakedonijaLeon Oblak, SlovenijaHubert Paluš, Slovačka
IZDAVA^KI SAVJETPublishing Councilprof. dr. sc. Ivica Grbac (predsjednik),prof. dr. sc. Stjepan Risovi},prof. dr. sc. Stjepan Pervan,[umarski fakultet Sveu~ili{ta u Zagrebu;Zdravko Jel~i}, dipl. oecc., Spin Valis d.d.;Krunoslav Jakup~i}, dipl. ing., Hrvatske {ume d.o.o.;Oliver Vlaini}, dipl. ing., Hrvatsko {umarsko dru{tvo;Mato Ravli}, Hrast Strizivojna d.o.o.;Mladen Galekovi}, PPS-Galekovi} Tvornica parketa;Silvija Zec, dipl. ing., Hrvatska komora inženjera šumarstva i drvne tehnologije
TEHNI^KI UREDNIKTechnical EditorZoran Vlaovi}
POMO]NICA UREDNI[TVAAssistant to Editorial OfficeDubravka Cvetan
LEKTORICELinguistic AdvisersZlata Babi}, prof. (hrvatski – Croatian)Maja Zaj{ek-Vrhovac, prof. (engleski – English)
DRVNA INDUSTRIJA je ~asopis koji objavljujeznanstvene i stru~ne radove te ostale priloge izcjelokupnog podru~ja iskori{tavanja {uma, istra`ivanja svojstava i primjene drva, mehani~ke i kemijske prera de drva, svih proizvodnih grana te trgovine drvom i drvnim proizvodima.
^asopis izlazi ~etiri puta u godini.
DRVNA INDUSTRIJA journal contains research contributions and reviews covering the entire field of forest ex ploitation, wood properties and application,mechanical and chemical conversion and modificationof wood, and all aspects of manufacturing andtrade of wood and wood products.
The journal is published quarterly.
ZNANSTVENI ^ASOPIS ZA PITANJA DRVNE TEHNOLOGIJESCIENTIFIC JOURNAL OF WOOD TECHNOLOGY
................................. UDK 630*8+674 Coden: Drinat ISSN 0012-6772
DRVNA INDUSTRIJA 71 (2) 113 (2020) 113
Sadržaj .................................................................
114 DRVNA INDUSTRIJA 71 (2) 114 (2020)
NAKLADA (Circulation): 700 koma-da · ^ASOPIS JE REFERIRAN U (Indexed in): Science Citation Index Expanded, Scopus, CAB Abstracts, Compendex, Environment Index, Vet-erinary Science Database, Geobase · PRILOGE treba slati na adresu Uredni{tva. Zna n stveni i stru~ni ~lanci se recenziraju. Rukopisi se ne vra}aju. · MANUSCRIPTS are to be submitted to the editorial office. Scien tific and professional papers are reviewed. Man-uscripts will not be returned. · KON-TAKT s uredni{tvom (Contact with the Editorial) e-mail: editordiºsumfak.hr · PRETPLATA (Subscrip-tion): godi{nja pretplata (annual sub-scription) za sve pretplatnike 55 EUR. Pretplata u Hrvatskoj za sve pretplatni-ke iznosi 300 kn, a za |ake, studente i umirovljenike 100 kn, plativo na `iro ra~un 2360000 – 1101340148 s nazna-kom ”Drvna industrija” · TISAK (Printed by) – DENONA d.o.o., Getal-di}eva 1, Zagreb, tel. 01/2361777, fax. 01/2332753, E-mail: denonaºde no na.hr; URL: www.denona.hr · DESIGN Aljo{a Brajdi} · ^ASOPIS JE DOSTUPAN NA INTERNETU: https://hrcak.srce.hr/drvnaindustrija · NA SLOV-NICA Presjek drva Brachystegia cyn-ometroides Harms, ksilo teka Zavoda za znanost o drvu, [u mar ski fakultet Sveu~ili{ta u Zagrebu
DRVNA INDUSTRIJA · Vol. 71, 2 ·str. 113-224 · ljeto 2020. · ZagrebREDAKCIJA DOVRŠENA 8. 5. 2020.
Sadr`ajContents
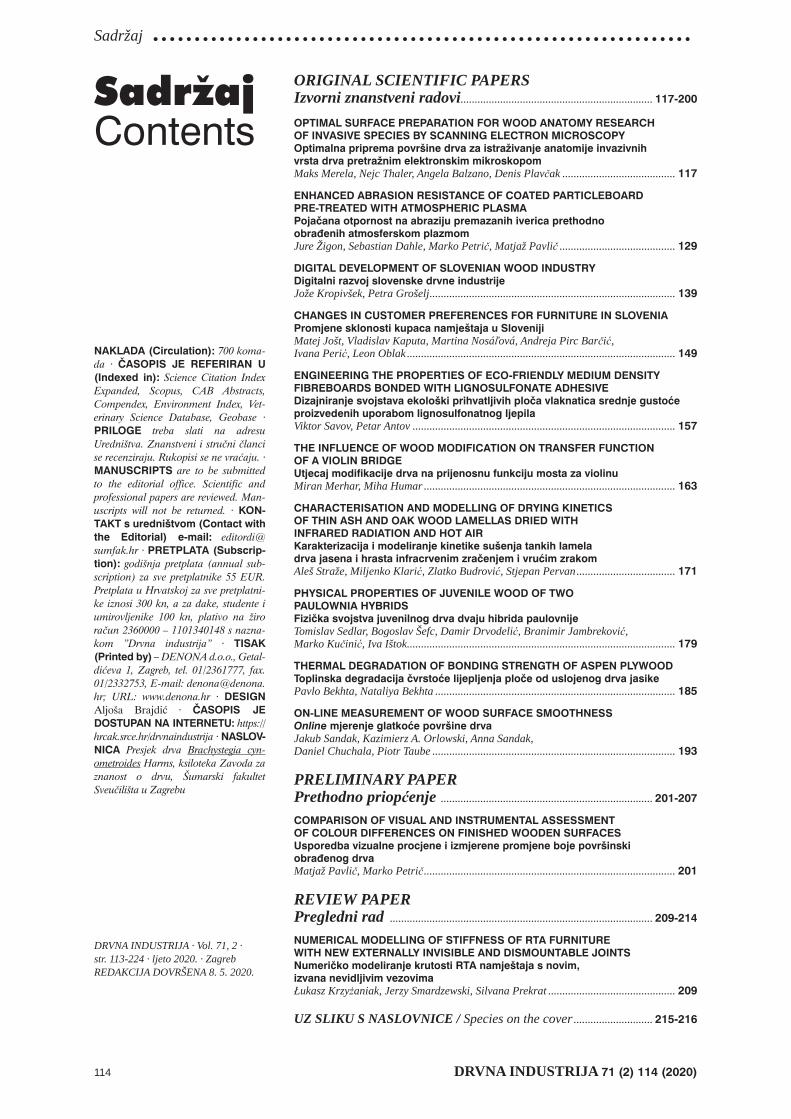
ORIGINAL SCIENTIFIC PAPERS Izvorni znanstveni radovi .................................................................... 117-200
OPTIMAL SURFACE PREPARATION FOR WOOD ANATOMY RESEARCH OF INVASIVE SPECIES BY SCANNING ELECTRON MICROSCOPYOptimalna priprema površine drva za istraživanje anatomije invazivnih vrsta drva pretražnim elektronskim mikroskopomMaks Merela, Nejc Thaler, Angela Balzano, Denis Plavčak ........................................ 117
ENHANCED ABRASION RESISTANCE OF COATED PARTICLEBOARD PRE-TREATED WITH ATMOSPHERIC PLASMAPojačana otpornost na abraziju premazanih iverica prethodno obrađenih atmosferskom plazmomJure Žigon, Sebastian Dahle, Marko Petrič, Matjaž Pavlič ......................................... 129
DIGITAL DEVELOPMENT OF SLOVENIAN WOOD INDUSTRYDigitalni razvoj slovenske drvne industrijeJože Kropivšek, Petra Grošelj ....................................................................................... 139
CHANGES IN CUSTOMER PREFERENCES FOR FURNITURE IN SLOVENIAPromjene sklonosti kupaca namještaja u SlovenijiMatej Jošt, Vladislav Kaputa, Martina Nosáľová, Andreja Pirc Barčić, Ivana Perić, Leon Oblak ............................................................................................... 149
ENGINEERING THE PROPERTIES OF ECO-FRIENDLY MEDIUM DENSITY FIBREBOARDS BONDED WITH LIGNOSULFONATE ADHESIVEDizajniranje svojstava ekološki prihvatljivih ploča vlaknatica srednje gustoće proizvedenih uporabom lignosulfonatnog ljepilaViktor Savov, Petar Antov ............................................................................................. 157
THE INFLUENCE OF WOOD MODIFICATION ON TRANSFER FUNCTION OF A VIOLIN BRIDGEUtjecaj modifikacije drva na prijenosnu funkciju mosta za violinuMiran Merhar, Miha Humar ......................................................................................... 163
CHARACTERISATION AND MODELLING OF DRYING KINETICS OF THIN ASH AND OAK WOOD LAMELLAS DRIED WITH INFRARED RADIATION AND HOT AIRKarakterizacija i modeliranje kinetike sušenja tankih lamela drva jasena i hrasta infracrvenim zračenjem i vrućim zrakomAleš Straže, Miljenko Klarić, Zlatko Budrović, Stjepan Pervan ................................... 171
PHYSICAL PROPERTIES OF JUVENILE WOOD OF TWO PAULOWNIA HYBRIDSFizička svojstva juvenilnog drva dvaju hibrida paulovnijeTomislav Sedlar, Bogoslav Šefc, Damir Drvodelić, Branimir Jambreković, Marko Kučinić, Iva Ištok ............................................................................................... 179
THERMAL DEGRADATION OF BONDING STRENGTH OF ASPEN PLYWOODToplinska degradacija čvrstoće lijepljenja ploče od uslojenog drva jasikePavlo Bekhta, Nataliya Bekhta ..................................................................................... 185
ON-LINE MEASUREMENT OF WOOD SURFACE SMOOTHNESSOnline mjerenje glatkoće površine drvaJakub Sandak, Kazimierz A. Orlowski, Anna Sandak, Daniel Chuchala, Piotr Taube ...................................................................................... 193
PRELIMINARY PAPERPrethodno priopćenje ........................................................................... 201-207
COMPARISON OF VISUAL AND INSTRUMENTAL ASSESSMENT OF COLOUR DIFFERENCES ON FINISHED WOODEN SURFACESUsporedba vizualne procjene i izmjerene promjene boje površinski obrađenog drvaMatjaž Pavlič, Marko Petrič ......................................................................................... 201
REVIEW PAPERPregledni rad ............................................................................................. 209-214
NUMERICAL MODELLING OF STIFFNESS OF RTA FURNITURE WITH NEW EXTERNALLY INVISIBLE AND DISMOUNTABLE JOINTSNumeričko modeliranje krutosti RTA namještaja s novim, izvana nevidljivim vezovimaŁukasz Krzyżaniak, Jerzy Smardzewski, Silvana Prekrat ............................................. 209
UZ SLIKU S NASLOVNICE / Species on the cover ............................ 215-216
..................................................................Uvodnik
DRVNA INDUSTRIJA 71 (2) 115 (2020) 115
Editorial
Last year we celebrated the 70th anniversary of issuing the journal Drvna industrija by different activi-ties dedicated to this important event. One of them was the organization of the scientifi c conference in the framework of the ICWST 2019 conference.
ICWST conference (International Conference of Wood Science and Technology) is a scientifi c two-day conference that takes place at the Faculty of Forestry, University of Zagreb, every year in December. Within the framework of the ICWST 2019 conference, there was a double celebration – 30th edition of the confer-ence and 70th anniversary of the journal Drvna indus-trija, the only scientifi c SCI indexed journal in the fi eld of wood science issued in Croatia.
The conference program committee selected 58 abstracts, among which 5 invited lectures, 33 oral pres-entations and 25 posters were found particularly inter-esting either by their scientifi c novelty, their potential for industrial applicability or by bringing out elaborat-ed synthesis of some high impact subjects.
Among the presented papers, the editorial board of the journal Drvna industrija selected several high quality papers for publication in the journal, based on the relevance to the journal and the reviews of the con-ference abstracts. The authors were asked to prepare a full paper for the journal publication. The prepared full papers went through the regular journal review process and are fi nally presented to the readers of the journal Drvna industrija.
This issue of Drvna industrija contains a collec-tion of 12 selected papers from the ICWST 2019 con-ference and 5 papers will be published in the issue 3/2020. The abstracts of these papers were published in the conference proceedings, while full papers are pub-lished in the journal.
The papers cover a wide range of research topics – wood anatomy, wood fi nishing and gluing, organiza-tion and economy of forest based industry, wood pro-cessing, wood furniture and wood-based panels, and we hope that the readers will enjoy reading these scien-tifi c novelties.
Assistant Editor-in-ChiefAssist. Prof. Josip Miklečić, PhD
Uvodnik
Prošle smo godine obilježili 70. godinu izdavanja časopisa Drvna industrija različitim aktivnostima po-svećenim toj važnoj obljetnici. Jedna od tih aktivnosti bilo je i organiziranje znanstvenog skupa u sklopu kon-ferencije ICWST 2019, na kojemu je održana središnja proslava 70. obljetnice časopisa.
ICWST (International Conference of Wood Sci-ence and Technology) dvodnevna je znanstvena konfe-rencija o drvu i drvnoj tehnologiji koja se održava na Šumarskom fakultetu Sveučilišta u Zagrebu obično svake godine u prosincu. Na prošlogodišnjoj konferen-ciji ICWST 2019 obilježen je dvostruki jubilej – održa-vanje 30. ICWST-a i 70. obljetnica časopisa Drvna in-dustrija, jedinoga znanstvenog časopisa u Hrvatskoj iz područja znanosti o drvu koji je indeksiran u prestižnoj bazi časopisa SCI-Expanded.
Programski je odbor ICWST-a za prezentaciju na konferenciji odabrao 58 radova, među kojima je bilo pet pozvanih predavanja, 33 usmena izlaganja i 25 po-stera, koji su se izdvajali bilo znanstvenim novinama, potencijalom za primjenu u industriji ili predstavlja-njem elaborirane sinteze nekih vrlo važnih tema.
Među radovima koji su prezentirani na konferen-ciji Uredništvo časopisa Drvna industrija izabralo je određen broj visokokvalitetnih članaka za objavljiva-nje u časopisu. Radovi su odabrani na temelju zani-mljivosti i relevantnosti tema te recenzija sažetaka pri-premljenih za konferenciju. Od autora je zatraženo da pripreme cjelovite članke za objavljivanje u časopisu. Tako pripremljeni radovi prošli su redovni postupak recenziranja i predstavljeni su čitateljima u ovom i slje-dećem broju časopisa. I na taj smo način – objavljiva-njem radova u časopisu, dali doprinos obilježavanju duge povijesti časopisa Drvna industrija.
Ovaj broj časopisa Drvna industrija sadržava 12 odabranih radova s konferencije ICWST 2019, a pet radova bit će tiskano u broju 3/2020. Sažetci tih radova objavljeni su u zborniku, radovi su prezentirani na kon-ferenciji putem usmenih priopćenja ili postera, a u ča-sopisu su objavljeni u cijelosti.
Radovi pokrivaju širok raspon istraživačkih tema – od anatomije drva, završne obrade i lijepljenja drva, organizacije i ekonomije u drvnoj industriji do meha-ničke obrade drva te izrade namještaja od drva i proiz-vodnje drvnih ploča. Nadamo se da će čitatelji uživati čitajući predstavljene znanstvene novosti.
Pomoćnik glavne urednicedoc. dr. sc. Josip Miklečić

.......Merela, Thaler, Balzano, Plavčak: Optimal Surface Preparation for Wood Anatomy...
DRVNA INDUSTRIJA 71 (2) 117-127 (2020) 117
Maks Merela1, Nejc Thaler 2, Angela Balzano1, Denis Plavčak1
Optimal Surface Preparation for Wood Anatomy Research of Invasive Species by Scanning Electron MicroscopyOptimalna priprema površine drva za istraživanje anatomije invazivnih vrsta drva pretražnim elektronskim mikroskopom
Original scientifi c paper • Izvorni znanstveni radReceived – prispjelo: 20. 10. 2019.Accepted – prihvaćeno: 28. 4. 2020.UDK: 630*811https://doi.org/10.5552/drvind.2020.1958
ABSTRACT • Research was done to develop the optimal method of wood surface preparation for scanning elec-tron microscopy (SEM). Since 2018, environmental scanning electron microscope (ESEM™) FEI Quanta 250 has been installed at the Department of Wood Science and Technology in Ljubljana. We tested several methods for the pre-preparation and cutting of wood surfaces for SEM analyses. The samples had been either dried, soaked in water and frozen, impregnated with paraffi n or simply moistened before cutting. We analysed wood surfaces ob-tained by splitting, sawing, planing, sanding and cutting on a sliding microtome with different blades. The effect of gold coating on the SEM image quality was also evaluated. Best results were obtained by cutting a pre-moistened surface on a sliding microtome with a low profi le replaceable blade and gold coated afterwards. Determined meth-odology is technically less demanding, not time consuming and obtains results that satisfy needs for wood anatomy research at magnifi cations up to 12.000x. Guidelines for the optimal preparation of samples were prepared, and theoretical and practical basis for investigations of wood anatomy using SEM were provided. The method was afterwards used in analyses of invasive alien plant species – investigating their anatomical structure in the frame-work of the AlienPLAntSpEcies - APPLAUSE project (Urban Innovative Actions initiative). It was demonstrated that the use of the SEM opened new scope in detailed investigations of the wood structure and properties.
Keywords: wood anatomy; wood surface; scanning electron microscopy; SEM; invasive species; sample preparation
SAŽETAK • Istraživanje je provedeno kako bi se razvila optimalna metoda pripreme drvne površine za pretražnu elektronsku mikroskopiju (SEM). Od 2018. na Odsjeku za znanost i tehnologiju o drvu u Ljubljani instaliran je uređaj za pretražnu elektronsku mikroskopiju u uvjetima okoliša (ESEMTM) FEI Quanta 250. Proučavali smo neko-liko metoda za pripremu i rezanje površine drva za SEM analizu. Uzorci su sušeni, potapani u vodi i smrzavani
1 Authors are associate professor, researcher and young researcher at University of Ljubljana, Biotechnical Faculty, Department of Wood Sci-ence and Technology, Ljubljana, Slovenia.
2 Author is head of development at Sivaprodukt d.o.o., Ljubljana, Slovenia.
© 2020 by the author(s).Licensee Faculty of Forestry, University of Zagreb.
This article is an open access article distributedunder the terms and conditions of the
Creative Commons Attribution (CC BY 4.0) license.
Merela, Thaler, Balzano, Plavčak: Optimal Surface Preparation for Wood Anatomy... .......
118 DRVNA INDUSTRIJA 71 (2) 117-127 (2020)
te prije rezanja impregnirani parafi nom ili samo navlaženi. Analizirali smo površine drva dobivene cijepanjem, piljenjem, blanjanjem, brušenjem i rezanjem na mikrotomu različitim oštricama. Također je proučavan utjecaj zlat-nog premaza na kvalitetu SEM fotografi ja. Najbolji rezultati dobiveni su rezanjem prethodno navlažene površine na mikrotomu, i to zamjenjivim noževima niskog profi la, nakon čega je površina drva pozlaćena. Primijenjena je metodologija tehnički manje zahtjevna, ne oduzima mnogo vremena, a dobiveni rezultati zadovoljavaju potrebe istraživanja anatomije drva pri povećanju i do 12 000 puta. Sastavljene su smjernice za optimalnu pripremu uzoraka te je postavljena teorijska i praktična osnova za istraživanje anatomije drva primjenom SEM-a. Metoda je potom primijenjena za istraživanje invazivnih biljnih vrsta – za ispitivanje njihove anatomske strukture u sklopu projekta AlienPLAntSpEcies – APPLAUSE (Urban Innovative Actions). Potvrđeno je da je upotreba SEM-a ot-vorila novo područje u detaljnim istraživanjima strukture i svojstava drva.
Ključne riječi: anatomija drva; površina drva; pretražna elektronska mikroskopija; SEM; invazivne vrste; pri-prema uzorka
1 INTRODUCTION1. UVOD
Wood is a unique natural composite made of sev-eral different cells and biopolymers that characterize its properties. Wood anatomy research is obligatory if we aim to characterize wood properties and if we want to understand wood as a raw material for various prod-ucts. All relevant physical, mechanical as well as aes-thetic properties of wood are refl ected in its heteroge-neous biological cell structure. Most commonly used method for wood anatomy investigation is bright fi eld light microscopy (LM). For this purpose, wood needs to be cut into thin slices, stained and embedded in resin for producing permanent anatomical slides (Prislan et al., 2009). Anatomical structure of wood can also be revealed by several other methods that enable more or less detailed anatomical investigations. Some of re-search techniques also display wood structure based on detection of some other components; water in wood (in the cell wall and/or lumina) is a component that ena-bles research by Nuclear Magnetic Resonance Imaging – MRI method. Latest devices enable MRI microscopy with spatial resolution up to 50 μm and also 3D imag-ing of wood structure (Merela et al., 2005; 2009a; Oven et al., 2008, 2011; Žlahtič et al., 2017). Wood consists of several different chemical elements and is, therefore, appropriate for Proton Induced X ray Emis-sion (PIXE and micro-PIXE) (Merela et al., 2009b), where surface element distribution can also reveal wood tissue structure. Heterogeneous structure of wood is refl ected in different density and this fact is exploited by the Computer Tomography that is com-monly used for log scanning (detecting of internal growth anomalies, knots, rots, etc.) as well as for high resolution imaging as Micro CT (Wagner et al., 1989; Bucur, 2003; Mayo et al., 2010; Craig, 2013).
Variation of thermal conductivity inside wood tissue enables Infrared Thermal imaging. Visualization of the thermal variations of a large area of the stem in real time is well suited for spatial analysis of sap move-ment (Anfodillo et al., 1993; Niemz et al., 1997; Busse, 2001; Chen et al., 2005). Dielectric properties of wood are used in Microwave techniques imaging (Baradit et al., 2005; Hansson et al., 2005; Pastorino et al., 2007; Salvade et al., 2008; Boero et al., 2018), where we can distinguish areas of different density as well as differ-
ent moisture content; this method is useful to detect growth defects like knots, etc.
Among all the developed methods, the Scanning Electron Microscopy (SEM) seems to be one of the most powerful techniques that enable very detailed and high magnifi cation wood structure research. SEM uses a high energy electron beam (accelerated electrons) to produce a topographic image by scanning the surface of a sample. The electron beam, emitted by the electron source (electron gun) and collected by electromagnetic lenses in a vacuum chamber, interacts with the atoms of sample surface, providing information about the sample’s surface topography, tissue orientation, chemi-cal composition, and many other material properties (Zhou et al., 2006; Goldstein et al., 2017).
The application of SEM in wood science began long before the system became commercially available in 1965, since the wood surface and structure are well suited for this technique (Collett, 2007). The results of the fi rst application in the ground wood pulp fi ber were published by Atack and Smith (1956). After that, the po-tential of SEM began to be exploited in wood anatomy and investigation of wood decay observing small cubes of wood cut through the three planes (Resch and Blasch-ke, 1968; Findlay et al., 1969). In 1969, a Finnish publi-cation (Ilvessalo-Pfäffl i, 1969) demonstrated the wide-ranging surface topography capabilities of SEM showing micrographs of paper, crystals, as well as some excellent pictures of wood structure. Finally, a comprehensive at-las of three-dimensional structure of wood was present-ed by Meylan and Butterfi eld (1978a).
Despite development of techniques with other advantages, SEM remains among the most effective tools for understanding ultrastructural and develop-mental aspects of secondary xylem and for investigat-ing topography and distribution of exposed features.
However, successful preparation of wooden specimens for SEM without damaging or modifying the wood surface and structure has proven rather chal-lenging. Different protocols have been developed for wood sample preparation for SEM, which often require complex, technically demanding and time-consuming procedures (Exley et al., 1977; Meylan and Butterfi eld 1978a). Conventional protocols described in literature suggest (before cutting the wood) to soften it in a boil-ing mixture of glycerine and water until the wood be-comes saturated and sinks in the liquid (Jansen et al.,
.......Merela, Thaler, Balzano, Plavčak: Optimal Surface Preparation for Wood Anatomy...
DRVNA INDUSTRIJA 71 (2) 117-127 (2020) 119
1998; Collet, 2007). Treatment with hydro fl uoric acid or ethylene-diamine (Carlquist, 1982) is also suggested for very hard wood species and subsequent washing for at least 12 h before sectioning (Sanderson, 1994). Of-ten bleaching with sodium hypochlorite or house hold bleach (15 %) (60-90 min until the surface has lost color) is recommended to remove any protoplasmic debris or vessel contents from the pit chambers (Mey-lan and Butterfi eld, 1978b; Nagai et al., 1994; Jansen et al., 2000). After the sample is cut with a microtome, most common procedures consist of sample dehydra-tion with mixture of ethanol and distilled water series (50-70-96 %) (Jansen et al., 1998) or with series of Methanol-Acetone-N-pentane, each series lasting for 12 hours (Thomas and Nicholas, 1966; Thomas, 2007). In the last step, different drying methods are reported including oven heating at 100 °C for 3 days and im-mersion of the wood samples in liquid nitrogen and freeze-drying (Jansen et al., 2008).
Clearly, the above-mentioned SEM protocols have some disadvantages. Besides being expensive and time consuming (duration of sample preparation at least few days), they are subject to a relatively high risk for defl ecting structural changes due to chemicals and dehydration process (Hanks and Fairbrothers, 1970; Jansen et al., 2008).
This study aimed to develop a SEM protocol that would enable high performance analyses on a daily ba-sis, achieving high resolution at magnifi cations up to 8.000x of the observed wooden traits with minimum sampling preparation. One of the aims was to check how different woodworking processes affect the fi nal appear-ance of the wood surface. We analyzed wood surfaces obtained by splitting, sawing, planing and sanding. The main purpose of this research was to develop an optimal (technically not too demanding, inexpensive and not time-consuming) wood surface sample preparation for SEM analyses. Our samples for wood anatomical inves-tigations were pre-treated in different ways and cut on a sliding microtome with two different blade types.
The developed method and protocol were after-wards used in analysis of 17 invasive alien plant spe-cies – detailed investigation of anatomical structure in the framework of the Applause project (Applause, 2019). Due to the huge amount of obtained data, in this paper we only present a selection of results referring to the following species: black locust (Robinia pseudoa-cacia), staghorn sumac (Rhus typhina), desert false in-digo (Amorpha fruticosa) and red osier dogwood (Cor-nus sericea).
Black locust (Robinia pseudoacacia) is medium sized, suckering, deciduous tree that typically grows 12-18 m tall. The popularity of R. pseudoacacia as an ornamental, forestry, shelter and land reclamation spe-cies has ensured its wide introduction across many re-gions (Orwa et al., 2019). Native to the Allegheny Mountains, it nowadays covers much of the United States and southern Canada plus parts of Europe, Asia and South America.
The staghorn sumac (Rhus typhina) is a decidu-ous shrub or small tree growing up to 5 m. It originates
from south-eastern Canada and United States, but is widely cultivated as an ornamental tree all over the world (Kossah et al., 2011) becoming one of the most critical invasive alien plant species.
Desert false indigo (Amorpha fruticosa) grows as a thornless shrub up to 6 m height. It is native in most of the United States, south-eastern Canada and north-ern Mexico. Because of its nice purple fl owers with yellow anthers, it is cultivated as an ornamental plant so the species is present in Europe, Asia, and other con-tinents (Wang et al., 1999).
Red osier dogwood (Cornus sericea) is native throughout northern and western North America from Alaska east to Newfoundland, south to Durango and Nuevo León in the west, and Illinois and Virginia in the east (Ashworth et al., 1993). It is frequently used for waterway bank erosion protection and restoration so it often spreads uncontrolled and becomes invasive.
2 MATERIALS AND METHODS2. MATERIJALI I METODE
2.1 Material selection and sample preparation2.1. Odabir materijala i priprema uzoraka
To test all available surface preparations, we se-lected beech (Fagus sylvatica) as a reference wood species (e.g., Novak, 2018). To split the wood in radial and tangential plane, we used a sharp chisel, using a woodworking circular saw (saw blade diameter 400 mm, 96ABT pos 10° tooth at 4000 rpm) to cut the sur-face in all three anatomical planes. To get a planed sur-face (radial and tangential), we used a woodworking surface planer (with 4 blades, head diameter 120 mm and 5000 rpm). Sanding was done on woodworking belt-sanding machine with sand paper grit sequence 80/120/240 in all three wood sections (cross, radial, tangential). All fi nal samples were prepared as 1 cm3 cubes. Split and planed wood was observed on longitu-dinal sections only (as it was impossible to split wood across the axial direction), and sawn and sanded speci-mens on all three xylotomical planes.
A more meticulous approach was developed to perform detailed wood anatomical observations by cut-ting wood with microtome blades. We prepared small strictly oriented wood cubes (1 cm3) processed with several pre-treatments before obtaining the fi nal sur-face for observations.
Samples had been either dried, soaked in distilled water and frozen, or simply moistened for some sec-onds before cutting. One series of samples was also embedded in paraffi n according to the standard proce-dure used for anatomical examinations of micro-cores (Prislan et al., 2009; Rossi et al., 2006; Balzano et al., 2018, Balzano et al., 2019).
Obtained samples were cut with a sliding mi-crotome (Leica LM2010R) using either classic mi-crotome blade (Leica) or replaceable Low Profi le Mi-crotome Blades (Leica DB80 LX) using a special blade holder – Low Profi le Blade Rail Twin set (Leica). We cut 20 μm thick wood slices. When cutting with a mi-crotome, we always trimmed wood surface for optimal
Merela, Thaler, Balzano, Plavčak: Optimal Surface Preparation for Wood Anatomy... .......
120 DRVNA INDUSTRIJA 71 (2) 117-127 (2020)
orientation and position and, thereafter, moved the blade to a new position to make one clear fi nal cut with a new sharp cutting edge.
Finally, the cut samples were dried at laboratory conditions (T = 22 °C and RH = 65 %) before SEM analyses. Samples that were soaked in water and fro-zen were fi rst put at T = 4 °C and RH = 65 % for 24h and afterwards dried in laboratory conditions to pre-vent fast drying and possible drying cracks. One series of frozen samples was freeze-dried (Telstar Lyo Quest).
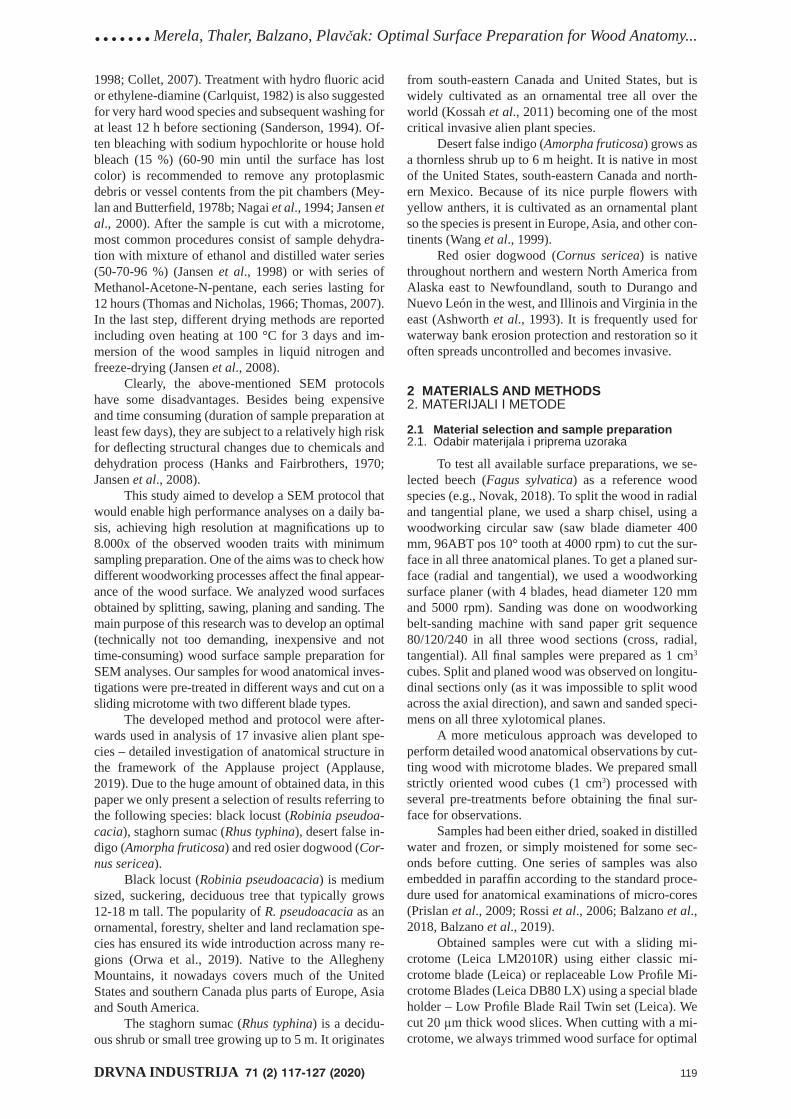
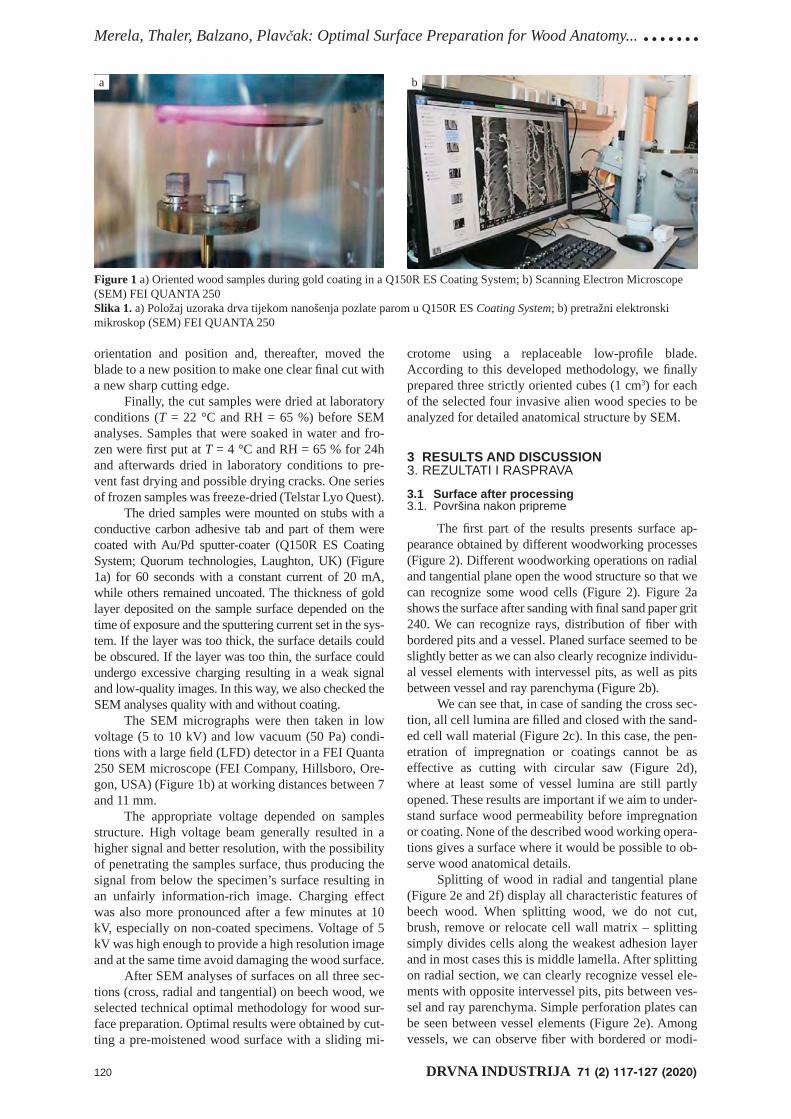
The dried samples were mounted on stubs with a conductive carbon adhesive tab and part of them were coated with Au/Pd sputter-coater (Q150R ES Coating System; Quorum technologies, Laughton, UK) (Figure 1a) for 60 seconds with a constant current of 20 mA, while others remained uncoated. The thickness of gold layer deposited on the sample surface depended on the time of exposure and the sputtering current set in the sys-tem. If the layer was too thick, the surface details could be obscured. If the layer was too thin, the surface could undergo excessive charging resulting in a weak signal and low-quality images. In this way, we also checked the SEM analyses quality with and without coating.
The SEM micrographs were then taken in low voltage (5 to 10 kV) and low vacuum (50 Pa) condi-tions with a large fi eld (LFD) detector in a FEI Quanta 250 SEM microscope (FEI Company, Hillsboro, Ore-gon, USA) (Figure 1b) at working distances between 7 and 11 mm.
The appropriate voltage depended on samples structure. High voltage beam generally resulted in a higher signal and better resolution, with the possibility of penetrating the samples surface, thus producing the signal from below the specimen’s surface resulting in an unfairly information-rich image. Charging effect was also more pronounced after a few minutes at 10 kV, especially on non-coated specimens. Voltage of 5 kV was high enough to provide a high resolution image and at the same time avoid damaging the wood surface.
After SEM analyses of surfaces on all three sec-tions (cross, radial and tangential) on beech wood, we selected technical optimal methodology for wood sur-face preparation. Optimal results were obtained by cut-ting a pre-moistened wood surface with a sliding mi-
crotome using a replaceable low-profi le blade. According to this developed methodology, we fi nally prepared three strictly oriented cubes (1 cm3) for each of the selected four invasive alien wood species to be analyzed for detailed anatomical structure by SEM.
3 RESULTS AND DISCUSSION3. REZULTATI I RASPRAVA
3.1 Surface after processing3.1. Površina nakon pripreme
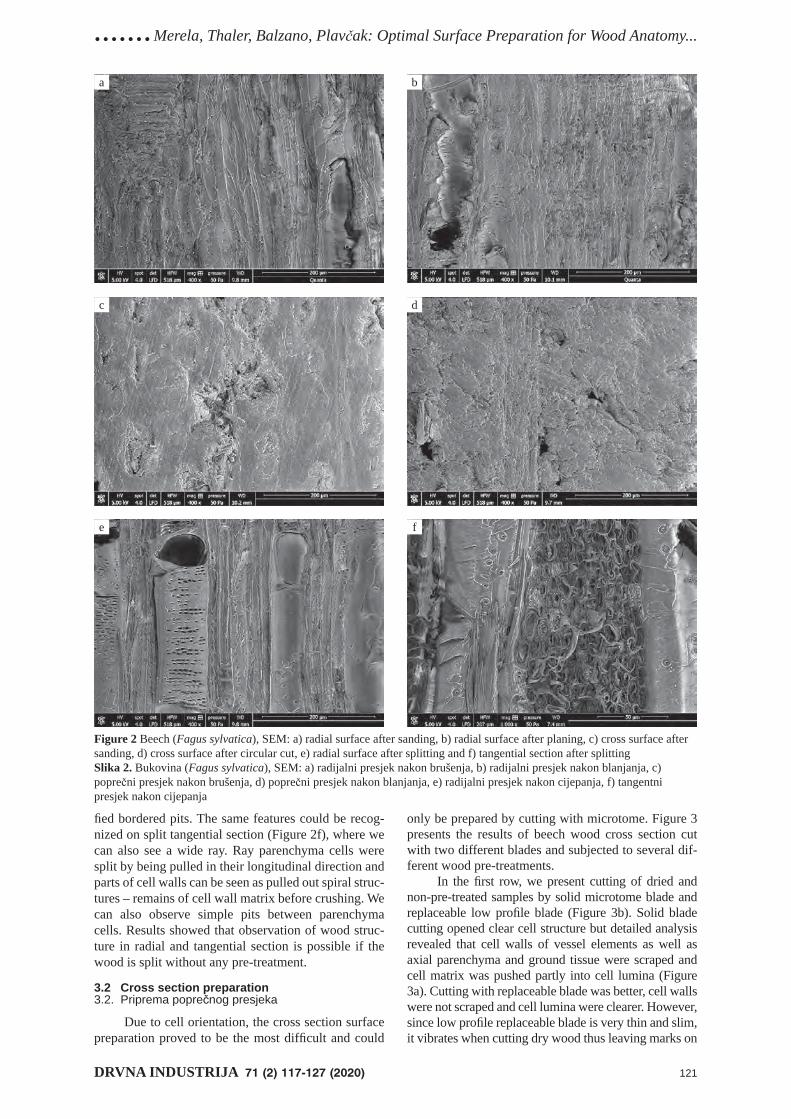
The fi rst part of the results presents surface ap-pearance obtained by different woodworking processes (Figure 2). Different woodworking operations on radial and tangential plane open the wood structure so that we can recognize some wood cells (Figure 2). Figure 2a shows the surface after sanding with fi nal sand paper grit 240. We can recognize rays, distribution of fi ber with bordered pits and a vessel. Planed surface seemed to be slightly better as we can also clearly recognize individu-al vessel elements with intervessel pits, as well as pits between vessel and ray parenchyma (Figure 2b).
We can see that, in case of sanding the cross sec-tion, all cell lumina are fi lled and closed with the sand-ed cell wall material (Figure 2c). In this case, the pen-etration of impregnation or coatings cannot be as effective as cutting with circular saw (Figure 2d), where at least some of vessel lumina are still partly opened. These results are important if we aim to under-stand surface wood permeability before impregnation or coating. None of the described wood working opera-tions gives a surface where it would be possible to ob-serve wood anatomical details.
Splitting of wood in radial and tangential plane (Figure 2e and 2f) display all characteristic features of beech wood. When splitting wood, we do not cut, brush, remove or relocate cell wall matrix – splitting simply divides cells along the weakest adhesion layer and in most cases this is middle lamella. After splitting on radial section, we can clearly recognize vessel ele-ments with opposite intervessel pits, pits between ves-sel and ray parenchyma. Simple perforation plates can be seen between vessel elements (Figure 2e). Among vessels, we can observe fi ber with bordered or modi-
Figure 1 a) Oriented wood samples during gold coating in a Q150R ES Coating System; b) Scanning Electron Microscope (SEM) FEI QUANTA 250Slika 1. a) Položaj uzoraka drva tijekom nanošenja pozlate parom u Q150R ES Coating System; b) pretražni elektronski mikroskop (SEM) FEI QUANTA 250
a b
.......Merela, Thaler, Balzano, Plavčak: Optimal Surface Preparation for Wood Anatomy...
DRVNA INDUSTRIJA 71 (2) 117-127 (2020) 121
fi ed bordered pits. The same features could be recog-nized on split tangential section (Figure 2f), where we can also see a wide ray. Ray parenchyma cells were split by being pulled in their longitudinal direction and parts of cell walls can be seen as pulled out spiral struc-tures – remains of cell wall matrix before crushing. We can also observe simple pits between parenchyma cells. Results showed that observation of wood struc-ture in radial and tangential section is possible if the wood is split without any pre-treatment.
3.2 Cross section preparation3.2. Priprema poprečnog presjeka
Due to cell orientation, the cross section surface preparation proved to be the most diffi cult and could
only be prepared by cutting with microtome. Figure 3 presents the results of beech wood cross section cut with two different blades and subjected to several dif-ferent wood pre-treatments.
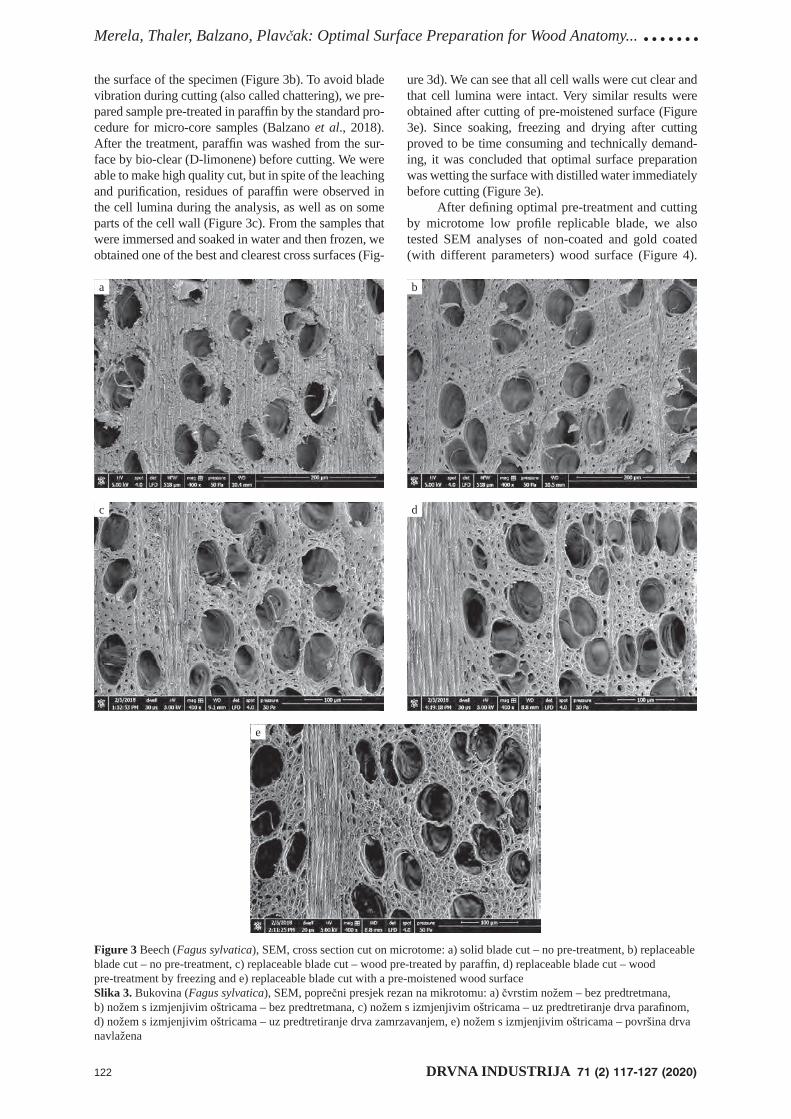
In the fi rst row, we present cutting of dried and non-pre-treated samples by solid microtome blade and replaceable low profi le blade (Figure 3b). Solid blade cutting opened clear cell structure but detailed analysis revealed that cell walls of vessel elements as well as axial parenchyma and ground tissue were scraped and cell matrix was pushed partly into cell lumina (Figure 3a). Cutting with replaceable blade was better, cell walls were not scraped and cell lumina were clearer. However, since low profi le replaceable blade is very thin and slim, it vibrates when cutting dry wood thus leaving marks on
a b
c d
e f
Figure 2 Beech (Fagus sylvatica), SEM: a) radial surface after sanding, b) radial surface after planing, c) cross surface after sanding, d) cross surface after circular cut, e) radial surface after splitting and f) tangential section after splittingSlika 2. Bukovina (Fagus sylvatica), SEM: a) radijalni presjek nakon brušenja, b) radijalni presjek nakon blanjanja, c) poprečni presjek nakon brušenja, d) poprečni presjek nakon blanjanja, e) radijalni presjek nakon cijepanja, f) tangentni presjek nakon cijepanja
Merela, Thaler, Balzano, Plavčak: Optimal Surface Preparation for Wood Anatomy... .......
122 DRVNA INDUSTRIJA 71 (2) 117-127 (2020)
the surface of the specimen (Figure 3b). To avoid blade vibration during cutting (also called chattering), we pre-pared sample pre-treated in paraffi n by the standard pro-cedure for micro-core samples (Balzano et al., 2018). After the treatment, paraffi n was washed from the sur-face by bio-clear (D-limonene) before cutting. We were able to make high quality cut, but in spite of the leaching and purifi cation, residues of paraffi n were observed in the cell lumina during the analysis, as well as on some parts of the cell wall (Figure 3c). From the samples that were immersed and soaked in water and then frozen, we obtained one of the best and clearest cross surfaces (Fig-
ure 3d). We can see that all cell walls were cut clear and that cell lumina were intact. Very similar results were obtained after cutting of pre-moistened surface (Figure 3e). Since soaking, freezing and drying after cutting proved to be time consuming and technically demand-ing, it was concluded that optimal surface preparation was wetting the surface with distilled water immediately before cutting (Figure 3e).
After defi ning optimal pre-treatment and cutting by microtome low profi le replicable blade, we also tested SEM analyses of non-coated and gold coated (with different parameters) wood surface (Figure 4).
Figure 3 Beech (Fagus sylvatica), SEM, cross section cut on microtome: a) solid blade cut – no pre-treatment, b) replaceable blade cut – no pre-treatment, c) replaceable blade cut – wood pre-treated by paraffi n, d) replaceable blade cut – wood pre-treatment by freezing and e) replaceable blade cut with a pre-moistened wood surfaceSlika 3. Bukovina (Fagus sylvatica), SEM, poprečni presjek rezan na mikrotomu: a) čvrstim nožem – bez predtretmana, b) nožem s izmjenjivim oštricama – bez predtretmana, c) nožem s izmjenjivim oštricama – uz predtretiranje drva parafi nom, d) nožem s izmjenjivim oštricama – uz predtretiranje drva zamrzavanjem, e) nožem s izmjenjivim oštricama – površina drva navlažena
a b
c d
e
.......Merela, Thaler, Balzano, Plavčak: Optimal Surface Preparation for Wood Anatomy...
DRVNA INDUSTRIJA 71 (2) 117-127 (2020) 123
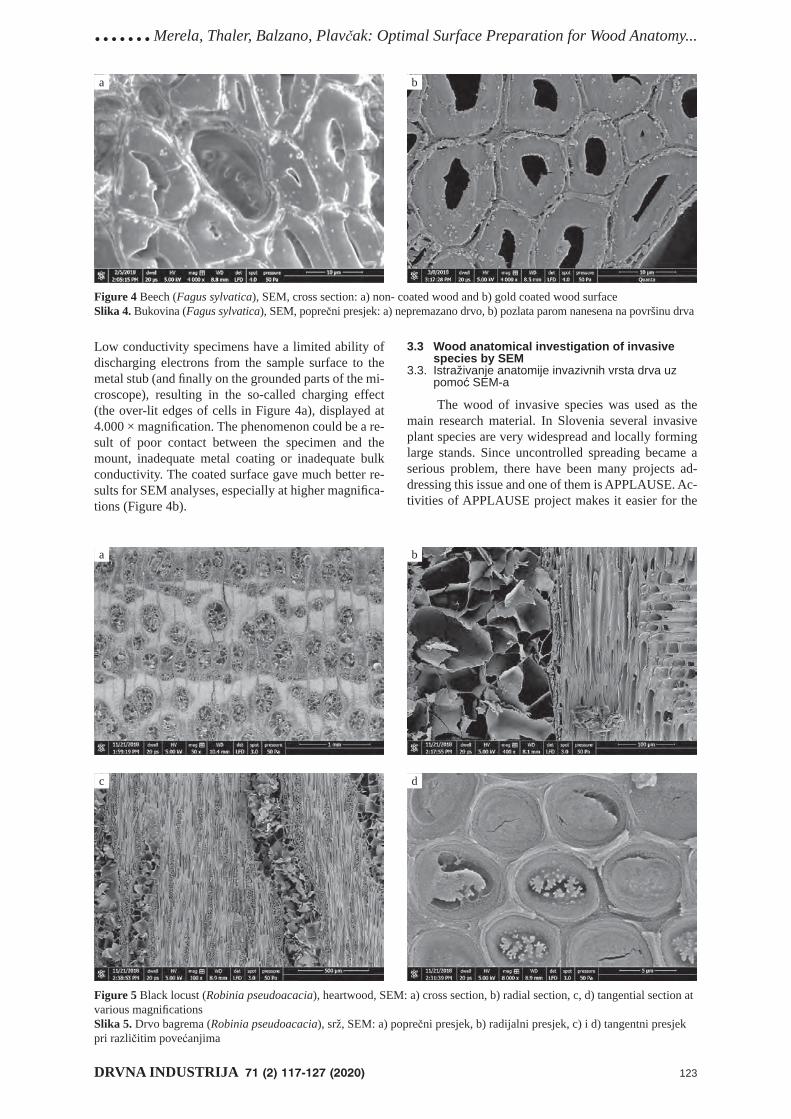
Low conductivity specimens have a limited ability of discharging electrons from the sample surface to the metal stub (and fi nally on the grounded parts of the mi-croscope), resulting in the so-called charging effect (the over-lit edges of cells in Figure 4a), displayed at 4.000 × magnifi cation. The phenomenon could be a re-sult of poor contact between the specimen and the mount, inadequate metal coating or inadequate bulk conductivity. The coated surface gave much better re-sults for SEM analyses, especially at higher magnifi ca-tions (Figure 4b).
3.3 Wood anatomical investigation of invasive species by SEM
3.3. Istraživanje anatomije invazivnih vrsta drva uz pomoć SEM-a
The wood of invasive species was used as the main research material. In Slovenia several invasive plant species are very widespread and locally forming large stands. Since uncontrolled spreading became a serious problem, there have been many projects ad-dressing this issue and one of them is APPLAUSE. Ac-tivities of APPLAUSE project makes it easier for the
a b
Figure 4 Beech (Fagus sylvatica), SEM, cross section: a) non- coated wood and b) gold coated wood surfaceSlika 4. Bukovina (Fagus sylvatica), SEM, poprečni presjek: a) nepremazano drvo, b) pozlata parom nanesena na površinu drva
a b
c d
Figure 5 Black locust (Robinia pseudoacacia), heartwood, SEM: a) cross section, b) radial section, c, d) tangential section at various magnifi cationsSlika 5. Drvo bagrema (Robinia pseudoacacia), srž, SEM: a) poprečni presjek, b) radijalni presjek, c) i d) tangentni presjek pri različitim povećanjima
Merela, Thaler, Balzano, Plavčak: Optimal Surface Preparation for Wood Anatomy... .......
124 DRVNA INDUSTRIJA 71 (2) 117-127 (2020)
citizens to recognize invasive wood plant species and then remove and process them into useful products. Sev-enteen invasive wood species were identifi ed and their properties were analyzed to fi nd potential innovative so-lutions for their use. Wood anatomy research knowledge is necessary when characterizing wood properties.
One of the fastest spreading non-native invasive tree species is black locust (Robinia pseudoacacia), which has distinct growth rings with a ring-porous structure (Figure 5a). Earlywood as well as latewood vessels are abundantly fi lled with tyloses (Figure 5a-c). On SEM images, we can observe how dense and com-plex the structure is built from tyloses along the vessel elements. Chemical components present in the cell walls of black locust wood are crucial for its durability; tyloses present a strong barrier that obstructs the spread of fungal hyphae through the vessels. High resolution SEM images at 8000 × magnifi cation also show ves-tured pits in vessel elements (Figure 5d), not often ob-served in Robinia pseudoacacia.
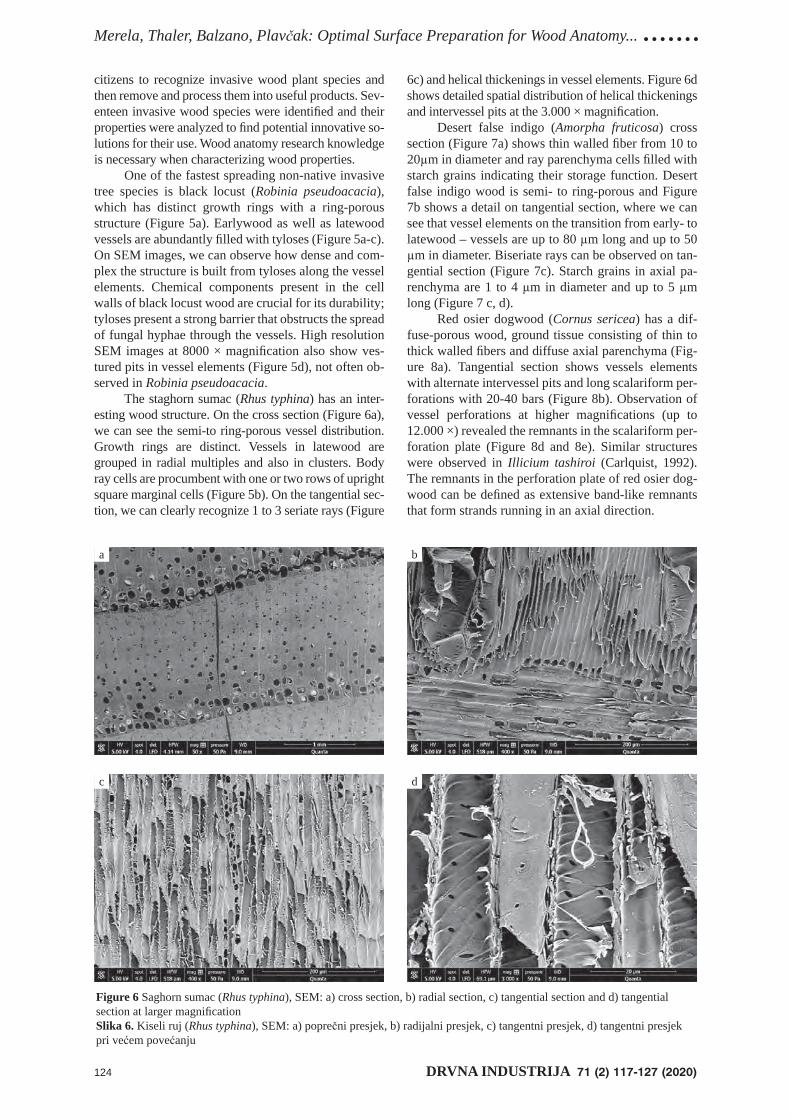
The staghorn sumac (Rhus typhina) has an inter-esting wood structure. On the cross section (Figure 6a), we can see the semi-to ring-porous vessel distribution. Growth rings are distinct. Vessels in latewood are grouped in radial multiples and also in clusters. Body ray cells are procumbent with one or two rows of upright square marginal cells (Figure 5b). On the tangential sec-tion, we can clearly recognize 1 to 3 seriate rays (Figure
Figure 6 Saghorn sumac (Rhus typhina), SEM: a) cross section, b) radial section, c) tangential section and d) tangential section at larger magnifi cationSlika 6. Kiseli ruj (Rhus typhina), SEM: a) poprečni presjek, b) radijalni presjek, c) tangentni presjek, d) tangentni presjek pri većem povećanju
6c) and helical thickenings in vessel elements. Figure 6d shows detailed spatial distribution of helical thickenings and intervessel pits at the 3.000 × magnifi cation.
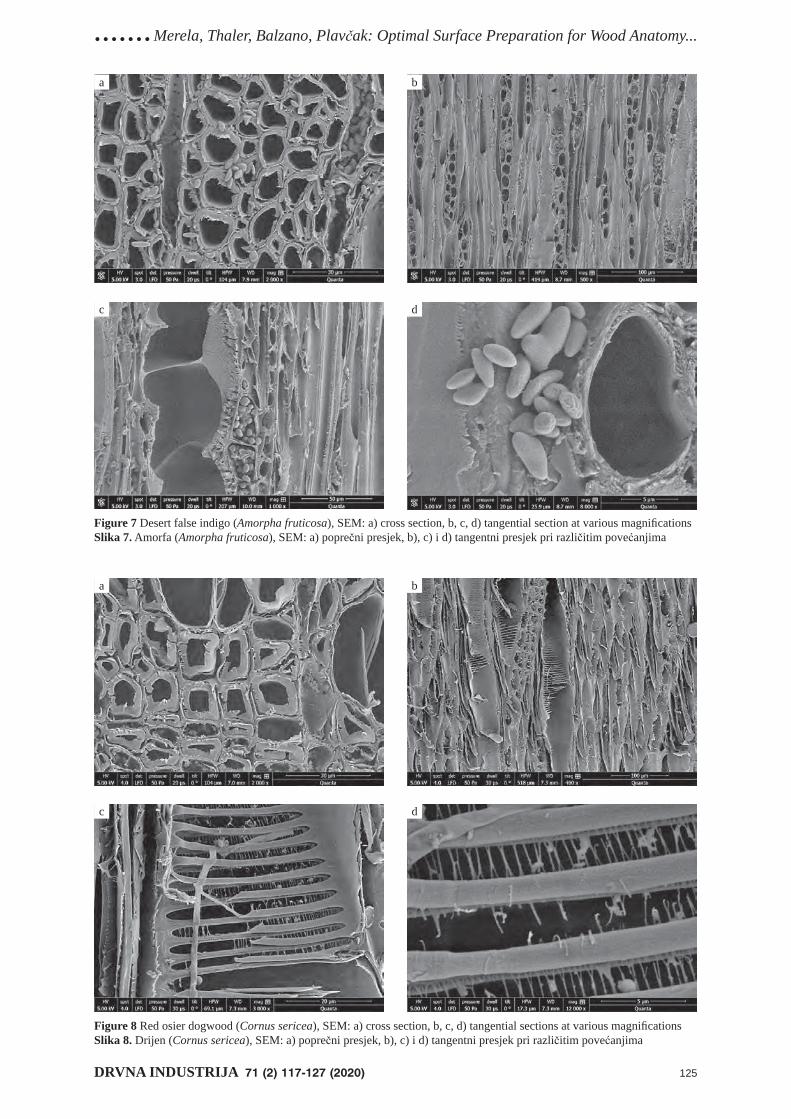
Desert false indigo (Amorpha fruticosa) cross section (Figure 7a) shows thin walled fi ber from 10 to 20μm in diameter and ray parenchyma cells fi lled with starch grains indicating their storage function. Desert false indigo wood is semi- to ring-porous and Figure 7b shows a detail on tangential section, where we can see that vessel elements on the transition from early- to latewood – vessels are up to 80 μm long and up to 50 μm in diameter. Biseriate rays can be observed on tan-gential section (Figure 7c). Starch grains in axial pa-renchyma are 1 to 4 μm in diameter and up to 5 μm long (Figure 7 c, d).
Red osier dogwood (Cornus sericea) has a dif-fuse-porous wood, ground tissue consisting of thin to thick walled fi bers and diffuse axial parenchyma (Fig-ure 8a). Tangential section shows vessels elements with alternate intervessel pits and long scalariform per-forations with 20-40 bars (Figure 8b). Observation of vessel perforations at higher magnifi cations (up to 12.000 ×) revealed the remnants in the scalariform per-foration plate (Figure 8d and 8e). Similar structures were observed in Illicium tashiroi (Carlquist, 1992). The remnants in the perforation plate of red osier dog-wood can be defi ned as extensive band-like remnants that form strands running in an axial direction.
a b
c d
.......Merela, Thaler, Balzano, Plavčak: Optimal Surface Preparation for Wood Anatomy...
DRVNA INDUSTRIJA 71 (2) 117-127 (2020) 125
a b
c d
Figure 7 Desert false indigo (Amorpha fruticosa), SEM: a) cross section, b, c, d) tangential section at various magnifi cationsSlika 7. Amorfa (Amorpha fruticosa), SEM: a) poprečni presjek, b), c) i d) tangentni presjek pri različitim povećanjima
Figure 8 Red osier dogwood (Cornus sericea), SEM: a) cross section, b, c, d) tangential sections at various magnifi cationsSlika 8. Drijen (Cornus sericea), SEM: a) poprečni presjek, b), c) i d) tangentni presjek pri različitim povećanjima
a b
c d
Merela, Thaler, Balzano, Plavčak: Optimal Surface Preparation for Wood Anatomy... .......
126 DRVNA INDUSTRIJA 71 (2) 117-127 (2020)
4 CONCLUSIONS4. ZAKLJUČAK
We optimized a method for the preparation of wooden specimens for SEM analysis. Since the meth-od is fast and technically less demanding, it allows ob-servation of a larger sample series on daily basis.
The best results were obtained by cutting a frozen surface using a sliding microtome with a low-profi le replaceable blade followed by gold coating. However, the optimal results (considering everything from time consumption to price) were obtained by a pre-mois-tened surface cut on a sliding microtome with a low-profi le replaceable blade followed by gold coating. We were able to prepare samples of selected invasive alien wood species for detailed SEM analyses. The devel-oped method enabled us to observe details that can be detected only at high magnifi cations. High resolution images at high magnifi cations (up to 12.000 ×) prove that the proposed technique works for advanced wood anatomy investigations. We displayed complex struc-tures of tyloses and vestured pits in vessels of Robinia pseudoacacia, spatial distribution of helical thicken-ings in Rhus typhina, starch grains in Amorpha fruti-cosa and scalariform perforations with rarely observed band-like remnants in Cornus sericea.
The technique is now used on a daily basis for SEM analyses at the Department of Wood Science and Technology of Biotechnical Faculty in Ljubljana.
Acknowledgements – ZahvalaResearch was done within the project APPLAUSE
(UIA02-228) co-fi nanced by the European Regional De-velopment Fund through the Urban Innovative Actions Initiative (www.ljubljana.si/en/applause/). The work was additionally supported by the Program P4-0015, co-fi nanced by the Slovenian Research Agency. The au-thors thank Luka Krže, Jože Planinšič, and Janez Novak for their immense help with the sample preparation and with the results analysis.
5 REFERENCES5. LITERATURA
1. Anfodillo, T.; Sigalotti, G. B.; Tomasi, M.; Semenzato, P.; Valentini, R., 1993: Applications of a thermal imaging technique in the study of the ascent of sap in woody spe-cies. Plant, Cell & Environment, 16 (8): 997-1001. https://doi.org/10.1111/j.1365-3040.1993.tb00524.x.
2. Ashworth, E. N.; Stirm, V. E.; Volenec, J. J., 1993: Sea-sonal variations in soluble sugars and starch within woody stems of Cornus sericea L. Tree Physiology, 13 (4): 379-388. https://doi.org/10.1093/treephys/13.4.379.
3. Atack, D.; Smith, K. C. A., 1956: The scanning electron microscope. A new tool in fi ber technology. Pulp and pa-per magazine of Canada (Convention issue), 57: 245-251.
4. Balzano, A.; Čufar, K.; Battipaglia, G.; Merela, M.; Pris-lan, P.; Aronne, G.; De Micco, V., 2018: Xylogenesis re-veals the genesis and ecological signal of IADFs in Pinus pinea L. and Arbutus unedo L. Annals of botany, 121 (6): 1231-1242. https://doi.org/10.1093/aob/mcy008.
5. Balzano, A.; De Micco, V.; Merela, M.; Čufar, K., 2019: Tree-rings in Mediterranean pines-can we describe them to calendar years? Les, 68 (1): 5-14.
6. Baradit, E.; Aedo, R.; Correa, J., 2005: Knots detection in wood using microwaves. Wood Science and Technology, 40 (2): 118-123.
https://doi.org/10.1007/s00226-005-0027-8.7. Boero, F.; Fedeli, A.; Lanini, M.; Maffongelli, M.; Mon-
leone, R.; Pastorino, M.; Randazzo, A.; Salvadè, A.; Sansalone, A., 2018: Microwave Tomography for the In-spection of Wood Materials: Imaging System and Ex-perimental Results. IEEE Transactions on Microwave Theory and Techniques, 66 (7): 3497-3510.
https://doi.org/10.1109/TMTT.2018.2804905.8. Bucur, V., 2003: Non-destructive Characterization and
Imaging of Wood. Heidelberg, Springer, 354 p.9. Busse, G., 2001: Lock in thermography. V: Nondestruc-
tive Testing Handbook, vol. 3. Infreared and Thermal Testing. Maldague, X. (ur.). Columbus, American Soci-ety for Nondestructive Testing: 318-327.
10. Carlquist, S., 1982: The use of ethylenediamine in soft-ening hard plant structures for paraffi n sectioning. Stain technology, 57 (5): 311-317.
11. Carlquist, S., 1992: Pit Membrane Remnants in Perfora-tion Plates of Primitive Dicotyledons and Their Signifi -cance. American Journal of Botany, 79: 660-672.
12. Chen, Z.; Gabbitas, B.; Hunt, D., 2005: A thermal imaging technique for studying crack development in wood under torsional loading. Journal of Materials Science, 40 (8): 1929-1935. https://doi.org/10.1007/s10853-005-1213-7.
13. Collett, B. M., 2007: Scanning electron microscopy: A review and report of research in wood science. Wood and Fiber Science, 2 (2): 113-133.
14. Craig, R. B., 2013: Visualizing wood anatomy in three dimensions with high-resolution X-ray micro-tomogra-phy (μCT) – a review – IAWA, 34 (4): 408-424.
https://doi.org/10.1163/22941932-00000033.15. Exley, R. R.; Meylan, B. A.; Butterfi eld, B. G., 1977: A
technique for obtaining clean cut surfaces on wood sam-ples prepared for the scanning electron microscope. Jour-nal of Microscopy, 110 (1): 75-78.
16. Findlay, G. W. D.; Levy, J. F., 1969: Scanning electron microscopy as an aid to the study of wood anatomy and decay. Journal of the Institute of Wood Science, 5 (5): 57-63.
17. Goldstein, J. I.; Newbury, D. E.; Michael, J. R.; Ritchie, N. W.; Scott, J. H. J.; Joy, D. C., 2017: Scanning electron microscopy and X-ray microanalysis. Springer, 550 p.
18. Hanks, S.; Fairbrothers, D. E., 1970: Effects of prepara-tion technique on pollen prepared for SEM observations. Taxon, 19 (6): 879-886.
19. Hans son, L.; Lundgren, N.; Antti, A. L.; Hagman, O., 2005: Micro wave penetration in wood using imaging sensor. Measurement, 38 (1): 15-20.
https://doi.org/10.1016/j.measurement.2005.03.007.20. Jans en, S.; Kitin, P.; De Pauw, H.; Idris, M.; Beeckman,
H.; Smets, E., 1998: Preparation of wood specimens for transmitted light microscopy and scanning electron mi-croscopy. Belgian Journal of Botany, 131 (1): 41-49.
21. Jans en, S.; Piesschaert, F.; Smets, E., 2000: Wood anato-my of Elaeagnaceae, with comments on vestured pits, helical thickenings, and systematic relationships. Ameri-can Journal of Botany, 87 (1): 20-28.
22. Jansen, S.; Pletsers, A.; Sano, Y., 2008: The effect of preparation techniques on SEM-imaging of pit mem-branes. IAWA Journal, 29 (2): 161-178.
23. Koss ah, R.; Zhang, H.; Chen W., 2011: Antimicrobial and antioxidant activities of Chinese sumac (Rhus typhi-na L.) fruit extract. Food Control, 22 (1): 128-132. https://doi.org/10.1016/j.foodcont.2010.06.002.
.......Merela, Thaler, Balzano, Plavčak: Optimal Surface Preparation for Wood Anatomy...
DRVNA INDUSTRIJA 71 (2) 117-127 (2020) 127
24. Mayo, S. C.; Chen, F.; Evans, R., 2010: Micron-scale 3D imaging of wood and plant microstructure using high-resolution X-ray phase-contrast micro tomography. Jour-nal of Structural Biology, 171: 182-188.
https://doi.org/10.1016/j.jsb.2010.04.001.25. Merela, M.; Oven, P.; Serša, I.; Mikac, U.; 2009a: A sin-
gle point NMR method for an instantaneous determina-tion of the moisture content of wood. Holzforschung, 63 (3): 348-351. https://doi.org/10.1515/HF.2009.050.
26. Merela, M.; Pelicon P.; Vavpetič, P.; Regvar, M.; Vogel-Mikuš, K.; Serša, I.; Poličnik, H.; Pokorny, B.; Levanič, T.; Oven, P., 2009b: Application of micro-PIXE, MRI and light microscopy for research in wood science and dendroecology. Nuclear Instruments and Methods in Physics Research Section B: Beam Interactions with Ma-terials and Atoms, 267 (12): 2157-2162.
https://doi.org/10.1016/j.nimb.2009.03.062.27. Merela, M.; Sepe, A.; Oven, P.; Serša, I., 2005: Three-
dimensional in vivo magnetic resonance microscopy of beech (Fagus sylvatica L.) wood. Magma, 18 (4): 171-174.
28. Meyl an, B. A.; Butterfi eld, B. G., 1978a: Three-dimen-sional structure of wood. A scanning electron microscope study. Syracuse University Press.
29. Meylan, B. A.; Butterfi eld, B. G., 1978b: Helical orienta-tion of the microfi brils in tracheids, fi ber and vessels. Wood Science and Technology, 12 (3): 219-222.
30. Naga i, S.; Ohtani, J.; Fukazawa, K.; Wu, J., 1994: SEM observations on perforated ray cells. IAWA Journal, 15 (3): 293-300.
31. Niemz, P.; Kucera, L. J.; Flisch, A.; Blaser, E., 1997: An-wendung der Computer tomographie an Holz (Comput-erized tomography of wood). Holz als Roh- und Werkst-off, 55 (2): 279-280.
32. Novak, J., 2018: Priprava površin lesa za slikanje z vrstičnim elektronskim mikroskopom (Surface prepara-tion of wooden samples for scanning electron micro-scopy), M. Sc. Thesis, Ljubljana.
33. Orwa, C.; Mutua, A.; Kindt, R.; Jamnadass R.; Anthony, S., 2009: Agroforestree Database: a tree reference and selection guide version 4.0. http://www.worldagrofor-estry.org/output/agroforestree-database (Accessed Jun 10, 2018).
34. Oven, P.; Merela, M.; Mikac, U.; Serša, I., 2011: Appli-cation of 3D magnetic resonance microscopy to the anat-omy of woody tissues. IAWA Journal, 32 (4): 401-414.
35. Oven, P.; Merela, M.; Mikac, U.; Serša, I., 2008: 3D magnetic resonance microscopy of a wounded beech branch. Holzforschung, 62 (3): 322-328.
36. Pastorino, M.; Salvade, A.; Monleone, R.; Bartesaghi, T.; Bozza, G.; Randazzo, A., 2007: Detection of defects in woods labs by using a microwave imaging technique. In: 2007 IEEE Instrumentation & Measurement Technology Conference IMTC 2007: pp. 1-6.
https://doi.org/10.1109/IMTC.2007.379332.
37. Prislan, P.; Merela, M.; Zupančič, M.; Krže, L.; Čufar, K., 2009: Use of selected light microscopy techniques to investigate wood and bark. Les, 61 (5): 222-229.
38. Resch, A.; Blaschke, R., 1968: Ueber die Anwendung des Raster-Elektronen mikroskopes in der Holzanatomie. Planta (Berl.), 78 (1): 85-88.
39. Rossi, S.; Anfodillo, T.; Menardi, R., 2006: Trephor: A new tool for sampling microcores from tree stems, IAWA Journal, 27 (1): 89-97.
https://doi.org/10.1163/22941932-90000139.40. Salvade, A.; Pastorino, M.; Monleone, R.; Randazzo, A.;
Bartesaghi, T.; Bozza, G.; Poretti, S., 2008: Microwave imaging of foreign bodies inside wood trunks. In: 2008 IEEE International Workshop on Imaging Systems and Techniques, pp. 88-93. doi:10.1109/IST.2008.4659947.
41. Sanderson, J. B., 1994: Biological Microtechnique, Mi-croscopy Handbook No. 28, Royal Microscopical Soci-ety Handbook Series. Bios Scientifi c Publishers, pp. 240.
42. Thomas, R. J., 2007: The ultrastructure of southern pine bordered pit membranes as revealed by specialized dry-ing techniques. Wood and Fiber Science, 1 (2): 110-123.
43. Thomas, R. J.; Nicholas, D. D., 1966: Pit membrane structure in loblolly pine as infl uenced by solvent ex-change drying. Forest Products Journal, 16 (3): 53-56.
44. Wagner, F. G.; Taylor, F. W.; Ladd, D. S.; McMillin, C. W.; Roder, F. L., 1989: Ultrafast CT scanning of an oak log for internal defects. Forest Products Journal, 39 (11/12): 62-64.
45. Wang, E. T.; Van Berkum, X.; Sui, H.; Beyene, D.; Chen, W. X.; Martinez-Romero, E., 1999: Diversity of rhizobia associated with Amorpha fruticosa isolated from Chinese soils and description of Mesorhizobium amorphae sp. nov. International Journal of Systematic Bacteriology, 49 (1): 51-65. https://doi.org/10.1099/00207713-49-1-51.
46. Zhou, W., Apkarian, R., Wang, Z. L. & Joy, D., 2006: Fundamentals of scanning electron microscopy (SEM). In Scanning microscopy for nanotechnology. Springer, New York, pp. 1-40.
47. Žlahtič Zupanc, M.; Mikac, U.; Serša, I.; Merela, M.; Humar, M., 2017: Distribution and penetration of tung oil in wood studied by magnetic resonance microscopy. Industrial Crops and Products, 96: 149-157.
https://doi.org/10.1016/j.indcrop.2016.11.049.
Corresponding address:
Assoc. Prof. MAKS MERELA, PhD
University of LjubljanaBiotechnical FacultyDepartment of Wood Science and TechnologyJamnikarjeva 101, 1000 Ljubljana, SLOVENIAe-mail: [email protected]
..... Žigon, Dahle, Petrič, Pavlič: Enhanced Abrasion Resistance of Coated Particleboard...
DRVNA INDUSTRIJA 71 (2) 129-137 (2020) 129
Jure Žigon, Sebastian Dahle, Mar ko Petrič, Matjaž Pavlič1
Enhanced Abrasion Resistance of Coated Particleboard Pre-Treated with Atmospheric PlasmaPojačana otpornost na abraziju premazanih iverica prethodno obrađenih atmosferskom plazmom
Original scientifi c paper • Izvorni znanstveni radReceived – prispjelo: 20. 10. 2019.Accepted – prihvaćeno: 28. 4. 2020.UDK: 630*812.733; 630*863.21https://doi.org/10.5552/drvind.2020.1960
ABSTRACT • This study aims to investigate the infl uence of atmospheric plasma treatment on the abrasion resist-ance of particleboards, as an example of a wood-based material, coated with a waterborne fi nish. The treatment of the substrate, prior to coating application, using a fl oating-electrode dielectric barrier discharge (FE-DBD) plasma, resulted in an enhanced abrasion resistance of the coated particleboards in comparison to the untreated ones during the abrasion test with a duration of 200 revolutions. This fi nding was related to lower contact angles of water and coating after treatment with plasma and greater hardness of the coating on the treated substrates. The micrographs of the sample cross sections recorded with scanning electron microscope showed differences in the amounts of remained coating on the abraded areas. Investigation with attenuated total refl ection Fourier transform infrared spectroscopy revealed that treatment of the substrate with plasma did not affect the chemical composition nor the curing and structure of the later applied coating. Further studies should be performed to de-termine the resistance properties of such surface systems to other impacts.
Keywords: particleboard; plasma; coating; abrasion
SAŽETAK • Cilj ovog rada bio je istražiti utjecaj atmosferske plazme na otpornost iverica na abraziju, kao primjer materijala na bazi drva premazanoga vodenim premazom. Tijekom ispitivanja abrazije u trajanju od 200 ciklusa obrada iverica uz pomoć plazme (FE-DBD) prije nanošenja premaza rezultirala je poboljšanom otporno-šću premazanih iverica na abraziju u usporedbi s neobrađenom ivericom. Rezultat istraživanja povezan je s nižim kontaktnim kutom vode i premaznog materijala nakon obrade iverica plazmom i s većom tvrdoćom premaza na podlozi obrađenoj plazmom. Mikrografi je presjeka uzorka dobivene pretražnim elektronskim mikroskopom poka-zale su razlike u količini preostalog premaza na površinama ispitanima na otpornost na habanje. Ispitivanje infra-crvenom spektroskopijom uz prigušenu totalnu refl eksiju pokazalo je da obrada podloge plazmom nije utjecala na kemijski sastav ni na otvrdnjavanje i strukturu kasnije nanesenog premaza. Potrebno je provesti daljnja ispitivanja kako bi se dodatno utvrdila otpornost takvih površinskih sustava.
Ključne riječi: iverica; plazma; premaz; abrazija
1 Authors are PhD candidate, assistant professor, professor and teaching assistant at University of Ljubljana, Biotechnical Faculty, Department of Wood Science and Technology, Ljubljana, Slovenia.
© 2020 by the author(s).Licensee Faculty of Forestry, University of Zagreb.
This article is an open access article distributedunder the terms and conditions of the
Creative Commons Attribution (CC BY 4.0) license.
Žigon, Dahle, Petrič, Pavlič: Enhanced Abrasion Resistance of Coated Particleboard... .....
130 DRVNA INDUSTRIJA 71 (2) 129-137 (2020)
1 INTRODUCTION1. UVOD
Surfaces of wood and wood-based products in interior and exterior applications are exposed to a num-ber of physical and mechanical stresses. Protection or resistance of the wooden structure against physical and chemical infl uences can be obtained by surface treat-ment, which depends on selected coating and the type of substrate (Keskin and Tekin, 2011; Veigel et al., 2014). Protection and durability of the material are im-portant with regard to economy and manufacturing technique. Chemical and anatomical structure of wood, as well as its properties such as density, surface roughness and colour, may affect the effect of the coat-ing. In indoor applications, the mechanical coating properties are of a prime importance, especially those like surface hardness, deformability as well as resist-ance to impact, friction, scratch and abrasion (Brischke et al., 2019). Mechanical properties of a coating strongly depend on the binder type and the fi lm thick-ness (Keskin and Tekin, 2011). Nowadays, different nanoparticles are added to the coating formulations to enhance their resistance to physical, chemical and me-chanical impacts (Cristea et al., 2011).
Particleboard is a wood-based panel consisting of wood or other lignocellulosic particles of various sizes, manufactured by bonding them together with a syn-thetic resin or binder under heat and pressure. Particle-board is used widely in the manufacture of domestic, institutional and offi ce furniture, stair treads, cabinetry, counter tops, speakers, core for doors, signs, displays, shelving, table tops, subfl ooring in constructions and other industrial product application due to the smooth surface, uniform density and thickness, dimensional stability, strength, machining ability, and screw-hold-ing capacity (Bardak et al., 2011). Usually, the boards have to be overlaid (by veneers, laminates, impregnat-ed papers, foils) or coated (application of liquid fi nish-ing materials with various fi nishing techniques) to meet the specifi c requirements of their fi nal use. In the case of painted or overlaid boards, irregularities in the substrate, or the differences in thickness of the coating fi lm, may have a negative impact on the adhesion of paints and overlays and hence on the quality of the fi -nal product. Uniform and fl at panels provide an excel-lent surface for the application of coating materials, like paint, print, or varnish substances. Together form-ing a surface system, the performance of the coated panels is dependent on the quality of wood based pan-el, the type of the coating material, and a good compat-ibility between both (Nemli et al., 2005; Rolleri and Roffael, 2010; Bardak et al., 2011). As an example of the latter, a rough surface gives paints several possi-bilities to penetrate and create strong joins, but on the other hand, by very high roughness, an excessive vol-ume of paint necessary to give surfaces a smooth ap-pearance is expected (Rolleri and Roffael, 2010). Now-adays, waterborne coatings are increasingly used due to the reduced impact on the user and environment. Besides the appearance, one of the requirements of
coatings for interior fl ooring is the ability to withstand mechanical loads like wear, erosion and abrasion (Scrinzi et al., 2011; Sell and Feist, 1986).
Various methods upgrade the appearance and features of coated wooden materials, extending their lifetime and increasing their value (Nemli and Hiziro-glu, 2009). Improved scratch and abrasion resistance can be induced by the use of additives such as inor-ganic fi llers and nanoparticles (SiO2, Al2O3, carbon-ates, silicates and sulfates of various metals) with high hardness (Bauer et al., 2006; Veigel et al., 2014). Fur-thermore, the abrasion resistance depends on the adhe-sive used for the panel production (Bardak et al., 2011).
In applications of coatings for interior, besides proper protection properties and a suitable appearance, good resistance to impact and abrasion are expected (Rossi et al., 2009; Keskin and Tekin, 2011). Concern-ing load bearing applications, the resistance of the ma-terial used to abrasion becomes the decisive mechani-cal property (Welzbacher et al., 2009). Surface quality of wood composites such as particleboard is an impor-tant physical property infl uencing different processes, including their fi nishing (Istek et al., 2010). There are various methods and devices to simulate the abrasion conditions of the components, and fi nally measure and determine the resistance of wooden materials to abra-sion according to weight loss or wear through the coat-ing after a defi ned time of wearing. The most useable method for the determination of abrasion resistance of various surface systems is the Taber Abraser test (Ros-si et al., 2005; Bauer et al., 2006; Rossi et al., 2009; Aytin et al., 2015).
Electrical gas discharges, more commonly known as plasmas (Žigon et al., 2018; Altgen et al., 2019), can be used to enhance the interaction of wood and wood-based materials surfaces with applied coatings and other liquids. These plasmas can be generated in air at atmospheric pressure, presenting a cost effi cient and clean technology. The effects caused by such a treat-ment of the substrate, via physical and chemical reac-tions, contribute to enhanced wettability, penetration, adhesion of the applied polymer and fi nal properties of the formed surface system (Liston et al., 1993; Wolk-enhauer et al., 2008; Wolkenhauer et al., 2009; Wolf and Sparavigna, 2010; Altgen et al., 2015; De Cademar-tori et al., 2016; Perisse et al., 2017; Reinprecht et al., 2018). Generally, the basic concept for increasing the surface free energy by plasma treatment (PT) is either breaking polar bonds and leaving polar end groups, or adding polar groups to the surface (Ko et al., 2018). A combination of mechanical abrasion followed by PT enhances the bonding quality (Moghadamzadeh et al., 2011), but this is highly dependent on the type of plas-ma reactor and treatment conditions. By some plasma pre-treatments, the microstructure of treated wooden material can be altered. Coating penetration increases after exposure of the substrate to plasma. The solvent-borne as well as waterborne polyurethane coating showed deeper penetration on PT wood than on the un-treated one. The ability of PT to improve coating per-formance on wood depends on the coating type and the
..... Žigon, Dahle, Petrič, Pavlič: Enhanced Abrasion Resistance of Coated Particleboard...
DRVNA INDUSTRIJA 71 (2) 129-137 (2020) 131
effects of the treatment on the surface microstructure of wood (Haase et al., 2019).
Pendulum hardness test is one of the most widely used methods for determining the coating hardness. The measured value of hardness greatly depends on the thickness of the coating; it gradually decreases with the increasing coating thickness (Sönmez et al., 2011; Ma et al., 2013; Gurleyen et al., 2017).
Based on the cited literature and our previous re-search work, the aim of the present study was to inves-tigate whether the treatment of wood-based materials surfaces with atmospheric plasma infl uences the abra-sion resistance of a coating. For this purpose, a parti-cleboard substrate with homogenous structure and a waterborne coating were selected as research materi-als. The treatment of the substrate with plasma, prior to coating application, was performed using a fl oating-electrode dielectric barrier discharge device (FE-DBD, Žigon et al., 2019). We hypothesize that PT that in-creases adhesion and penetration depth of waterborne coating into wood-based materials, further leads to im-proved resistance of surface system to abrasion. De-tailed interactions between untreated or PT substrate and coating were investigated by the measurement of water and coating droplets contact angle (CA). Besides the determination of abrasion resistance, measure-ments of coated surface hardness were performed, while the appearance of coated samples cross sections was studied with scanning electron microscope. In or-der to detect possible infl uence of PT on curing of the coating fi lm, attenuated total refl ection Fourier trans-form infrared spectroscopy was used.
2 MATERIALS AND METHODS2. MATERIJALI I METODE
2.1 Particleboard as a substrate2.1. Iverica kao podloga
As a substrate, samples of a particleboard with dimensions of (100 × 100 × 3) mm3 were selected. Be-fore future processing, the samples were conditioned in a chamber with a temperature of 20 °C and relative hu-midity of 65 % for three weeks. After conditioning, the substrate density of 857 kg/m3 was determined gravi-metrically.
2.2 Plasma treatment of substrates surfaces and formation of coating systems
2.2. Obrada površine podloge plazmom i formiranje sustava premaza
The surface of each individual sample was treat-ed with FE-DBD non-thermal plasma in air at atmos-
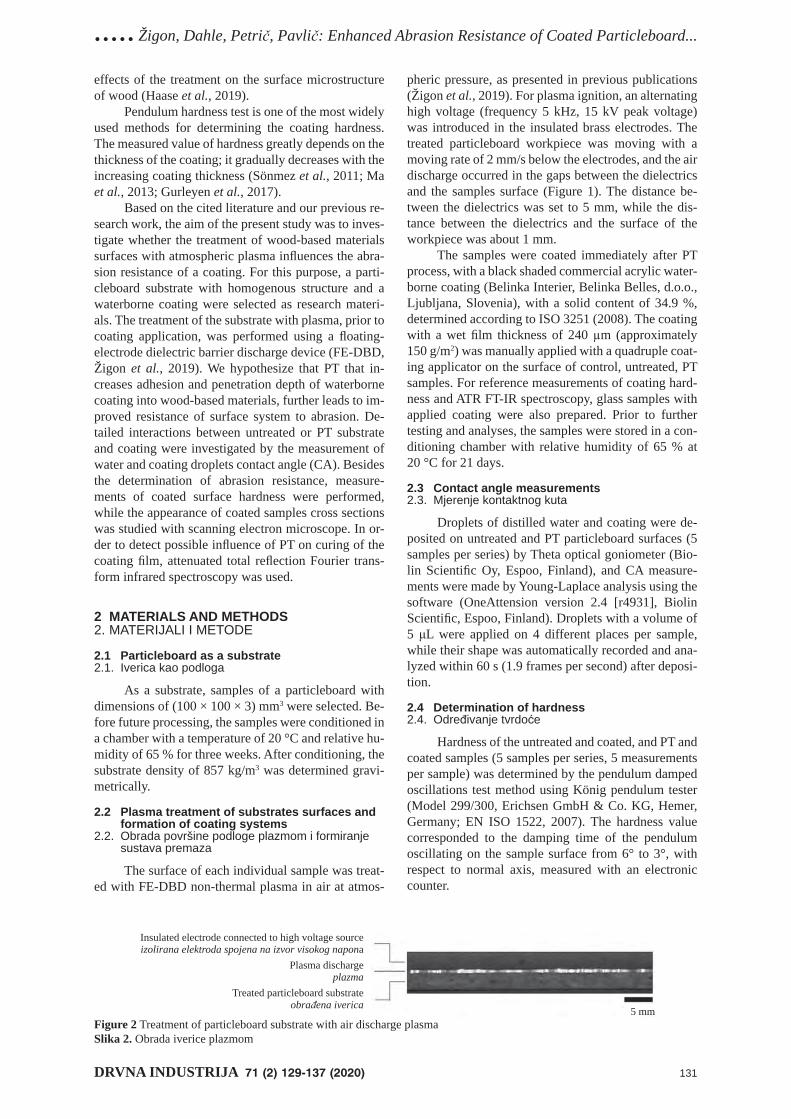
pheric pressure, as presented in previous publications (Žigon et al., 2019). For plasma ignition, an alternating high voltage (frequency 5 kHz, 15 kV peak voltage) was introduced in the insulated brass electrodes. The treated particleboard workpiece was moving with a moving rate of 2 mm/s below the electrodes, and the air discharge occurred in the gaps between the dielectrics and the samples surface (Figure 1). The distance be-tween the dielectrics was set to 5 mm, while the dis-tance between the dielectrics and the surface of the workpiece was about 1 mm.
The samples were coated immediately after PT process, with a black shaded commercial acrylic water-borne coating (Belinka Interier, Belinka Belles, d.o.o., Ljubljana, Slovenia), with a solid content of 34.9 %, determined according to ISO 3251 (2008). The coating with a wet fi lm thickness of 240 μm (approximately 150 g/m2) was manually applied with a quadruple coat-ing applicator on the surface of control, untreated, PT samples. For reference measurements of coating hard-ness and ATR FT-IR spectroscopy, glass samples with applied coating were also prepared. Prior to further testing and analyses, the samples were stored in a con-ditioning chamber with relative humidity of 65 % at 20 °C for 21 days.
2.3 Contact angle measurements2.3. Mjerenje kontaktnog kuta
Droplets of distilled water and coating were de-posited on untreated and PT particleboard surfaces (5 samples per series) by Theta optical goniometer (Bio-lin Scientifi c Oy, Espoo, Finland), and CA measure-ments were made by Young-Laplace analysis using the software (OneAttension version 2.4 [r4931], Biolin Scientifi c, Espoo, Finland). Droplets with a volume of 5 μL were applied on 4 different places per sample, while their shape was automatically recorded and ana-lyzed within 60 s (1.9 frames per second) after deposi-tion.
2.4 Determination of hardness2.4. Određivanje tvrdoće
Hardness of the untreated and coated, and PT and coated samples (5 samples per series, 5 measurements per sample) was determined by the pendulum damped oscillations test method using König pendulum tester (Model 299/300, Erichsen GmbH & Co. KG, Hemer, Germany; EN ISO 1522, 2007). The hardness value corresponded to the damping time of the pendulum oscillating on the sample surface from 6° to 3°, with respect to normal axis, measured with an electronic counter.
Insulated electrode connected to high voltage sourceizolirana elektroda spojena na izvor visokog napona
Plasma dischargeplazma
Treated particleboard substrateobrađena iverica 5 mm
Figure 2 Treatment of particleboard substrate with air discharge plasmaSlika 2. Obrada iverice plazmom
Žigon, Dahle, Petrič, Pavlič: Enhanced Abrasion Resistance of Coated Particleboard... .....
132 DRVNA INDUSTRIJA 71 (2) 129-137 (2020)
2.5 Abrasion resistance tests2.5. Ispitivanje otpornosti na abraziju
The abrasion resistance tests were performed ac-cording to the Taber Abraser method (EN 438-2, 2016) on 10 samples per series. After weighing, the speci-mens were mounted into the rotary platform abrasion tester (Model 503, Erichsen GmbH & Co. KG, Hemer, Germany) and abraded with rotating rubber wheels covered with sanding paper S-42 and loaded with 500 g each. The abrasion process was stopped after 10, 25, and after every further 25 revolutions up to fi nal 200 revolutions. After each stop, the samples were weighted and scanned. A fresh sanding paper was used with every sample. A mass loss of the sample was de-termined according to the following equation:
(1)
Δm – samples mass loss due to abrasion (g, %)m0– samples mass, before abrasion (g)m1– samples mass, after abrasion (g)
The scans of the samples, taken during the abra-sion test, were analyzed by measuring the percentage of the abraded area with the Fiji software (ImageJ 1.46d, Bethesda, Maryland, USA) by grey value set to 80 (ranging from 0 - total white to 255 - total black) (Schindelin et al., 2012; Altgen et al., 2019).
2.6 Scanning electron microscopy (SEM) investigations
2.6. Istraživanje pretražnim elektronskim mikroskopom (SEM)
The cross sections of the untreated and PT sam-ples in the region of abrasion were analyzed with SEM FEI Quanta 250 (FEI, Hillsboro, Oregon, USA). Be-fore the start of observation, the surfaces were evened by microtome. Possible differences in the microstruc-ture between untreated and PT substrates were ana-lyzed with a large fi eld (LFD) and circular backscat-tered (CBD) detector. The dry fi lm thickness of the coating and its penetration depth were measured on 20 spots of the cross sections as well. The micrographs were taken at 100× and 500× magnifi cation in a low vacuum (50 Pa), the electron source voltage of 10.0 kV, at a working distance of 10 mm, and the spot size of 3.0. During the capture of the image, the time of the beam transition through the sample was 45 μs.
2.7 Attenuated total refl ection Fourier transform infrared (ATR FT-IR) spectroscopy
2.7. Pojačana infracrvena spektroskopija uz prigušenu totalnu refl eksiju (ATR FT-IR)
ATR FT-IR spectroscopic measurements of the dry coating fi lm on glass, untreated and PT particle-board were performed using a Perkin Elmer Spectrum Two spectrometer (PerkinElmer Inc., Waltham, Mas-sachusetts, USA), with a LiTaO3 detector in the absorb-ance mode. The spectra were measured on 5 different spots (16 scans per spot) of the coated samples, at a wavelength range from 600 cm−1 to 4000 cm−1 and at a resolution of 0.5 cm−1. For later comparison, ATR FT-IR spectra were also recorded on coated glass samples.
3 RESULTS AND DISCUSSION3. REZULTATI I RASPRAVA
3.1 Contact angles of liquids on untreated and PT substrates
3.1. Kontaktni kutovi tekućina na neobrađenim podlogama i podlogama obrađenim plazmom
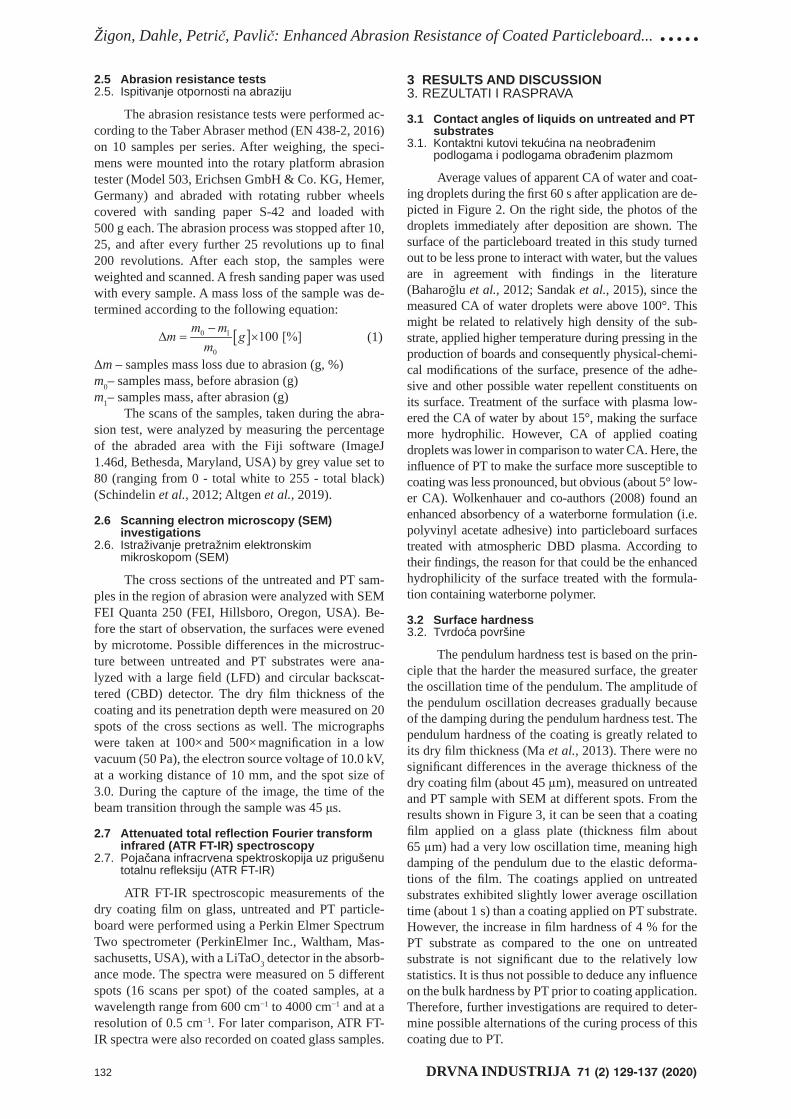
Average values of apparent CA of water and coat-ing droplets during the fi rst 60 s after application are de-picted in Figure 2. On the right side, the photos of the droplets immediately after deposition are shown. The surface of the particleboard treated in this study turned out to be less prone to interact with water, but the values are in agreement with fi ndings in the literature (Baharoğlu et al., 2012; Sandak et al., 2015), since the measured CA of water droplets were above 100°. This might be related to relatively high density of the sub-strate, applied higher temperature during pressing in the production of boards and consequently physical-chemi-cal modifi cations of the surface, presence of the adhe-sive and other possible water repellent constituents on its surface. Treatment of the surface with plasma low-ered the CA of water by about 15°, making the surface more hydrophilic. However, CA of applied coating droplets was lower in comparison to water CA. Here, the infl uence of PT to make the surface more susceptible to coating was less pronounced, but obvious (about 5° low-er CA). Wolkenhauer and co-authors (2008) found an enhanced absorbency of a waterborne formulation (i.e. polyvinyl acetate adhesive) into particleboard surfaces treated with atmospheric DBD plasma. According to their fi ndings, the reason for that could be the enhanced hydrophilicity of the surface treated with the formula-tion containing waterborne polymer.
3.2 Surface hardness3.2. Tvrdoća površine
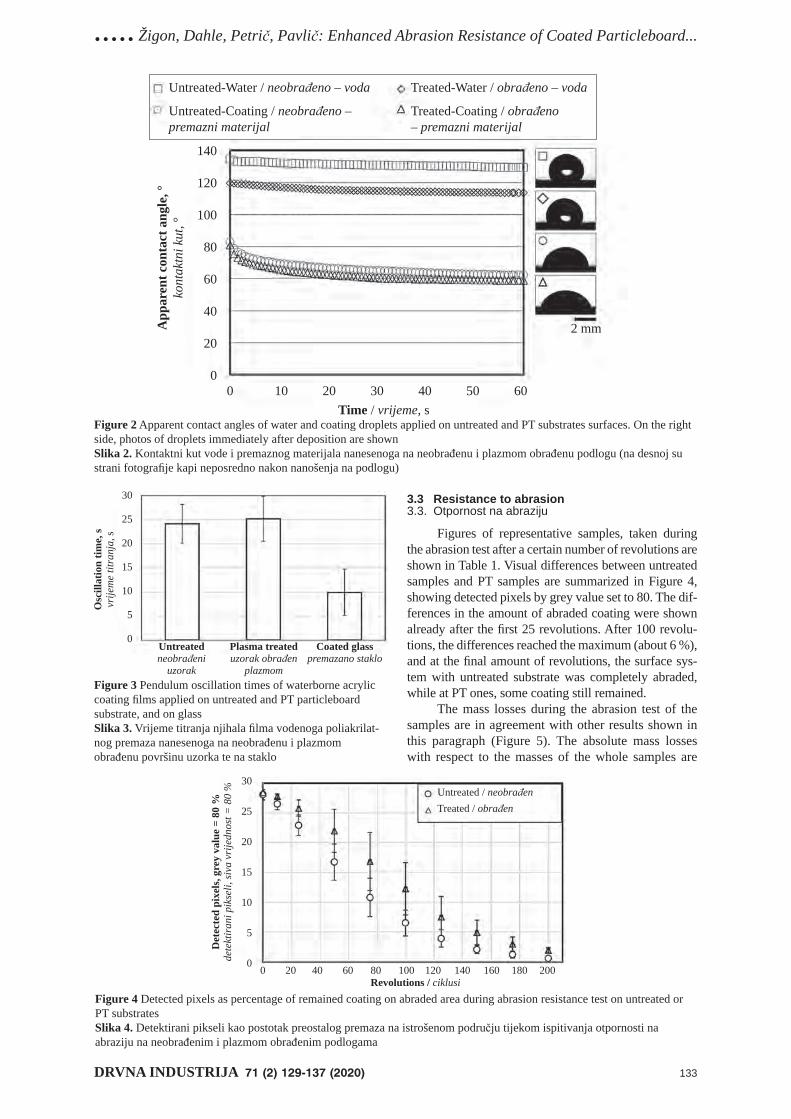
The pendulum hardness test is based on the prin-ciple that the harder the measured surface, the greater the oscillation time of the pendulum. The amplitude of the pendulum oscillation decreases gradually because of the damping during the pendulum hardness test. The pendulum hardness of the coating is greatly related to its dry fi lm thickness (Ma et al., 2013). There were no signifi cant differences in the average thickness of the dry coating fi lm (about 45 μm), measured on untreated and PT sample with SEM at different spots. From the results shown in Figure 3, it can be seen that a coating fi lm applied on a glass plate (thickness fi lm about 65 μm) had a very low oscillation time, meaning high damping of the pendulum due to the elastic deforma-tions of the fi lm. The coatings applied on untreated substrates exhibited slightly lower average oscillation time (about 1 s) than a coating applied on PT substrate. However, the increase in fi lm hardness of 4 % for the PT substrate as compared to the one on untreated substrate is not signifi cant due to the relatively low statistics. It is thus not possible to deduce any infl uence on the bulk hardness by PT prior to coating application. Therefore, further investigations are required to deter-mine possible alternations of the curing process of this coating due to PT.
..... Žigon, Dahle, Petrič, Pavlič: Enhanced Abrasion Resistance of Coated Particleboard...
DRVNA INDUSTRIJA 71 (2) 129-137 (2020) 133
3.3 Resistance to abrasion3.3. Otpornost na abraziju
Figures of representative samples, taken during the abrasion test after a certain number of revolutions are shown in Table 1. Visual differences between untreated samples and PT samples are summarized in Figure 4, showing detected pixels by grey value set to 80. The dif-ferences in the amount of abraded coating were shown already after the fi rst 25 revolutions. After 100 revolu-tions, the differences reached the maximum (about 6 %), and at the fi nal amount of revolutions, the surface sys-tem with untreated substrate was completely abraded, while at PT ones, some coating still remained.
The mass losses during the abrasion test of the samples are in agreement with other results shown in this paragraph (Figure 5). The absolute mass losses with respect to the masses of the whole samples are
Figure 2 Apparent contact angles of water and coating droplets applied on untreated and PT substrates surfaces. On the right side, photos of droplets immediately after deposition are shownSlika 2. Kontaktni kut vode i premaznog materijala nanesenoga na neobrađenu i plazmom obrađenu podlogu (na desnoj su strani fotografi je kapi neposredno nakon nanošenja na podlogu)
Untreatedneobrađeni
uzorak
Plasma treateduzorak obrađen
plazmom
Coated glasspremazano staklo
Osc
illat
ion
time,
svr
ijem
e tit
ranj
a, s
30
25
20
15
10
5
0
Figure 3 Pendulum oscillation times of waterborne acrylic coating fi lms applied on untreated and PT particleboard substrate, and on glassSlika 3. Vrijeme titranja njihala fi lma vodenoga poliakrilat-nog premaza nanesenoga na neobrađenu i plazmom obrađenu površinu uzorka te na staklo
Revolutions / ciklusi
Det
ecte
d pi
xels
, gre
y va
lue
= 80
%de
tekt
iran
i pik
seli,
siva
vri
jedn
ost =
80
% Untreated / neobrađenTreated / obrađen
30
25
20
15
10
5
00 20 40 60 80 100 120 140 160 180 200
Figure 4 Detected pixels as percentage of remained coating on abraded area during abrasion resistance test on untreated or PT substratesSlika 4. Detektirani pikseli kao postotak preostalog premaza na istrošenom području tijekom ispitivanja otpornosti na abraziju na neobrađenim i plazmom obrađenim podlogama
App
aren
t con
tact
ang
le, °
kont
aktn
i kut
, °
Time / vrijeme, s
140
120
100
80
60
40
20
00 10 20 30 40 50 60
2 mm
Treated-Coating / obrađeno – premazni materijal
Untreated-Water / neobrađeno – voda
Untreated-Coating / neobrađeno – premazni materijal
Treated-Water / obrađeno – voda
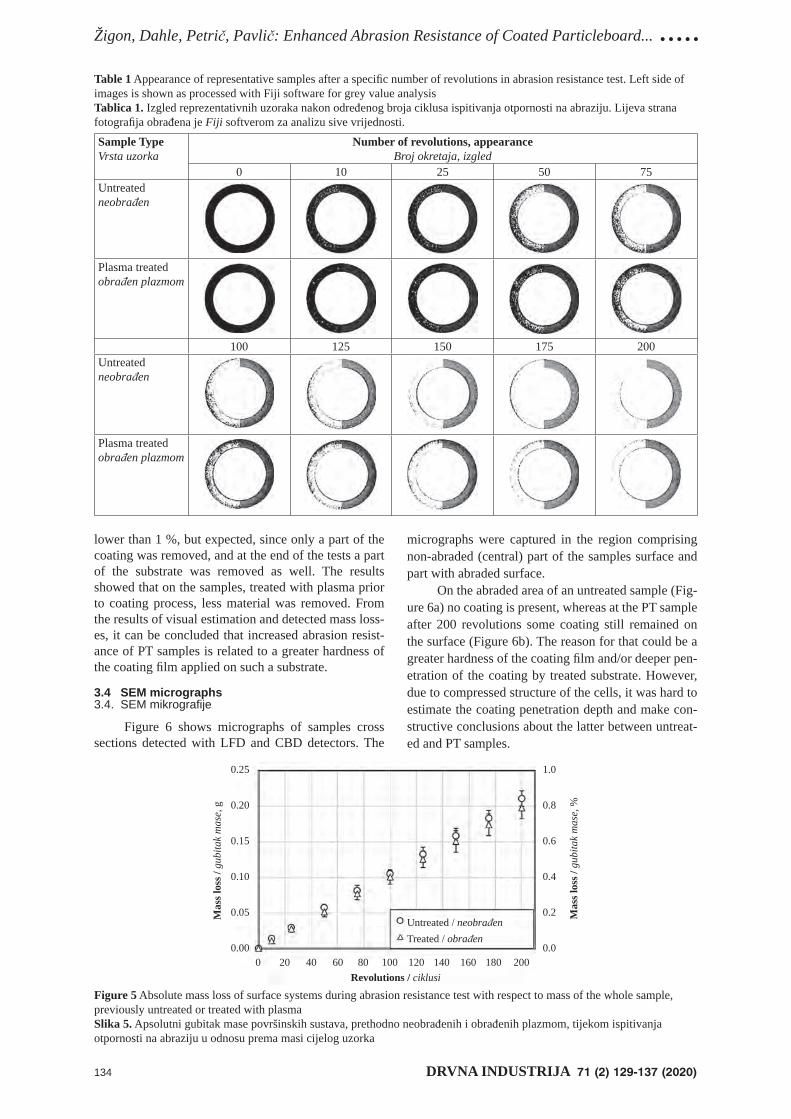
Žigon, Dahle, Petrič, Pavlič: Enhanced Abrasion Resistance of Coated Particleboard... .....
134 DRVNA INDUSTRIJA 71 (2) 129-137 (2020)
lower than 1 %, but expected, since only a part of the coating was removed, and at the end of the tests a part of the substrate was removed as well. The results showed that on the samples, treated with plasma prior to coating process, less material was removed. From the results of visual estimation and detected mass loss-es, it can be concluded that increased abrasion resist-ance of PT samples is related to a greater hardness of the coating fi lm applied on such a substrate.
3.4 SEM micrographs3.4. SEM mikrografi je
Figure 6 shows micrographs of samples cross sections detected with LFD and CBD detectors. The
Table 1 Appearance of representative samples after a specifi c number of revolutions in abrasion resistance test. Left side of images is shown as processed with Fiji software for grey value analysisTablica 1. Izgled reprezentativnih uzoraka nakon određenog broja ciklusa ispitivanja otpornosti na abraziju. Lijeva strana fotografi ja obrađena je Fiji softverom za analizu sive vrijednosti.
Sample TypeVrsta uzorka
Number of revolutions, appearanceBroj okretaja, izgled
0 10 25 50 75Untreatedneobrađen
Plasma treated obrađen plazmom
100 125 150 175 200Untreatedneobrađen
Plasma treated obrađen plazmom
Mas
s los
s / g
ubita
k m
ase,
%
Mas
s los
s / g
ubita
k m
ase,
g
Revolutions / ciklusi
Untreated / neobrađenTreated / obrađen
0 20 40 60 80 100 120 140 160 180 200
0.25
0.20
0.15
0.10
0.05
0.00
1.0
0.8
0.6
0.4
0.2
0.0
Figure 5 Absolute mass loss of surface systems during abrasion resistance test with respect to mass of the whole sample, previously untreated or treated with plasmaSlika 5. Apsolutni gubitak mase površinskih sustava, prethodno neobrađenih i obrađenih plazmom, tijekom ispitivanja otpornosti na abraziju u odnosu prema masi cijelog uzorka
micrographs were captured in the region comprising non-abraded (central) part of the samples surface and part with abraded surface.
On the abraded area of an untreated sample (Fig-ure 6a) no coating is present, whereas at the PT sample after 200 revolutions some coating still remained on the surface (Figure 6b). The reason for that could be a greater hardness of the coating fi lm and/or deeper pen-etration of the coating by treated substrate. However, due to compressed structure of the cells, it was hard to estimate the coating penetration depth and make con-structive conclusions about the latter between untreat-ed and PT samples.
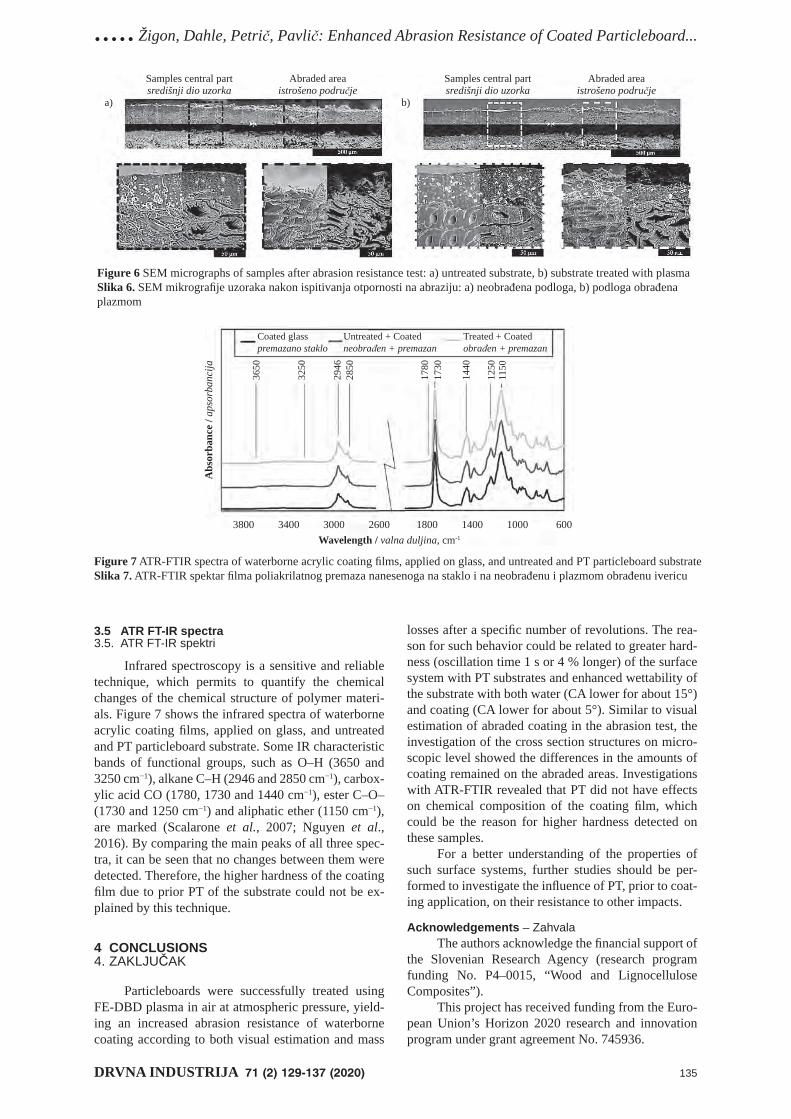
..... Žigon, Dahle, Petrič, Pavlič: Enhanced Abrasion Resistance of Coated Particleboard...
DRVNA INDUSTRIJA 71 (2) 129-137 (2020) 135
3.5 ATR FT-IR spectra3.5. ATR FT-IR spektri
Infrared spectroscopy is a sensitive and reliable technique, which permits to quantify the chemical changes of the chemical structure of polymer materi-als. Figure 7 shows the infrared spectra of waterborne acrylic coating fi lms, applied on glass, and untreated and PT particleboard substrate. Some IR characteristic bands of functional groups, such as O–H (3650 and 3250 cm−1), alkane C–H (2946 and 2850 cm−1), carbox-ylic acid CO (1780, 1730 and 1440 cm−1), ester C–O– (1730 and 1250 cm−1) and aliphatic ether (1150 cm−1), are marked (Scalarone et al., 2007; Nguyen et al., 2016). By comparing the main peaks of all three spec-tra, it can be seen that no changes between them were detected. Therefore, the higher hardness of the coating fi lm due to prior PT of the substrate could not be ex-plained by this technique.
4 CONCLUSIONS4. ZAKLJUČAK
Particleboards were successfully treated using FE-DBD plasma in air at atmospheric pressure, yield-ing an increased abrasion resistance of waterborne coating according to both visual estimation and mass
Samples central partsredišnji dio uzorka
Abraded areaistrošeno područje
Samples central partsredišnji dio uzorka
Abraded areaistrošeno područje
a) b)
Figure 6 SEM micrographs of samples after abrasion resistance test: a) untreated substrate, b) substrate treated with plasmaSlika 6. SEM mikrografi je uzoraka nakon ispitivanja otpornosti na abraziju: a) neobrađena podloga, b) podloga obrađena plazmom
Abs
orba
nce
/ aps
orba
ncija
Wavelength / valna duljina, cm-1
Coated glasspremazano staklo
Untreated + Coatedneobrađen + premazan
Treated + Coatedobrađen + premazan
3800 3400 3000 2600 1800 1400 1000 600
3650
3250
2946
2850
1780
1730
1250
1440
1150
losses after a specifi c number of revolutions. The rea-son for such behavior could be related to greater hard-ness (oscillation time 1 s or 4 % longer) of the surface system with PT substrates and enhanced wettability of the substrate with both water (CA lower for about 15°) and coating (CA lower for about 5°). Similar to visual estimation of abraded coating in the abrasion test, the investigation of the cross section structures on micro-scopic level showed the differences in the amounts of coating remained on the abraded areas. Investigations with ATR-FTIR revealed that PT did not have effects on chemical composition of the coating fi lm, which could be the reason for higher hardness detected on these samples.
For a better understanding of the properties of such surface systems, further studies should be per-formed to investigate the infl uence of PT, prior to coat-ing application, on their resistance to other impacts.
Acknowledgements – ZahvalaThe authors acknowledge the fi nancial support of
the Slovenian Research Agency (research program funding No. P4–0015, “Wood and Lignocellulose Composites”).
This project has received funding from the Euro-pean Union’s Horizon 2020 research and innovation program under grant agreement No. 745936.
Figure 7 ATR-FTIR spectra of waterborne acrylic coating fi lms, applied on glass, and untreated and PT particleboard substrateSlika 7. ATR-FTIR spektar fi lma poliakrilatnog premaza nanesenoga na staklo i na neobrađenu i plazmom obrađenu ivericu
Žigon, Dahle, Petrič, Pavlič: Enhanced Abrasion Resistance of Coated Particleboard... .....
136 DRVNA INDUSTRIJA 71 (2) 129-137 (2020)
5 REFERENCES5. LITERATURA
1. Altgen, D.; Bellmann, M.; Wascher, R.; Viöl, W.; Mai, C., 2015: Enhancing mechanical properties of particle-boards using plasma treated wood particles. European Journal of Wood and Wood Products, 73: 219-223. https://doi.org/10.1007/s00107-015-0879-z.
2. Altgen, D.; Grigsby, W.; Altgen, M.; Rautkari, L.; Mai, C., 2019: Analyzing the UF resin distribution in particle-boards by confocal laser microscopy. Composites, Part A, 125: 105529.
https://doi.org/10.1016/j.compositesa.2019.105529.3. Aytin, A.; Korkut, S.; As, N.; Ünsal, Ö.; Gündüz, G.,
2015: Effect of Heat Treatment of Wild Cherry Wood on Abrasion Resistance and Withdrawal Capacity of Screws. Drvna industrija, 66 (4): 297-303.
https://doi.org/10.5552/drind.2015.1440.4. Baharoğlu, M.; Nemli, G.; Sarı, B.; Bardak, S.; Ayrılmış,
N., 2012: The infl uence of moisture content of raw mate-rial on the physical and mechanical properties, surface roughness, wettability, and formaldehyde emission of particleboard composite. Composites, Part B, 43 (5): 2448-2451.
https://doi.org/10.1016/j.compositesb.2011.10.020.5. Bardak, S.; Sarı, B.; Nemli, G.; Kırcı, H.; Baharoğlu, M.,
2011: The effect of décor paper properties and adhesive type on some properties of particleboard. International Journal of Adhesion and Adhesives, 31: 412-415.
https://doi.org/10.1016/j.ijadhadh.2011.02.008.6. Bauer, F.; Flyunt, R.; Czihal, K.; Buchmeiser, R. M.;
Langguth, H.; Mehnert, R., 2006: Nano/micro particle hybrid composites for scratch and abrasion resistant polyacrylate coatings. Macromolecular Materials and Engineering, 291: 493-498.
https://doi.org/10.1002/mame.200600034.7. Brischke, C.; Ziegeler, N.; Bollmus, S., 2019: Abrasion
resistance of thermally and chemically modifi ed timber. Drvna idustrija, 70 (1): 71-76.
https://doi.org/10.5552/drvind.2019.1813.8. Cristea, M. V.; Riedl, B.; Blanchet, P., 2011: Effect of
addition of nanosized UV absorbers on the physico-me-chanical and thermal properties of an exterior waterborne stain for wood. Progress in Organic Coatings, 72: 755-762. https://doi.org/10.1016/j.porgcoat.2011.08.007.
9. De Cademartori, P. H. G.; De Carvalho, A. R.; Maran-goni, P. R. D.; Berton, M. A. C.; Blanchet, P.; De Muniz, G. I. B.; Magalhães, W. L. E., 2016: Adhesion perfor-mance and fi lm formation of acrylic emulsion coating on medium density fi breboard treated with Ar plasma. Inter-national Journal of Adhesion and Adhesives, 70: 322-328. https://doi.org/10.1016/j.ijadhadh.2016.08.002.
10. Gurleyen, L.; Ayata, U.; Esteves, B.; Cakicier, N., 2017: Effects of heat treatment on the adhesion Strength, pen-dulum hardness, surface roughness, color and glossiness of scots pine laminated parquet with two different types of UV varnish application. Maderas. Ciencia y tecnología 19 (2): 213-224.
https://doi.org/10.4067/s0718-221x2017005000019.11. Haase, G. J.; Leung, H. L.; Evans, D. P., 2019: Plasma
pre-treatments to improve the weather resistance of poly-urethane coating on black spruce wood. Coatings, 9 (1). https://doi.org/10.3390/coatings9010008.
12. Istek, A.; Aydemir, D.; Aksu, S., 2010: The effect of dé-cor paper and resin type on the physical, mechanical, and surface quality properties of particleboards coated with impregnated décor papers. BioResources, 5 (2): 1074-1083.
13. Keskin, H.; Tekin, A., 2011: Abrasion resistances of cel-lulosic, synthetic, polyurethane, waterborne and acid-hardening varnishes used woods. Construction and Building Materials, 25: 638-643.
https://doi.org/10.1016/j.conbuildmat.2010.07.028.14. Ko, C.-L.; Kuo, Y.-L.; Lee W.-J.; Sheng, H.-J.; Guo, J.-
Y., 2018: The enhanced abrasion resistance of an anti-fi ngerprint coating on chrome-plated brass substrate by integrating sputtering and atmospheric pressure plasma jet technologies. Applied Surface Science, 448: 88-94. https://doi.org/10.1016/j.apsusc.2018.04.075.
15. Liston, E. M.; Martinu, L.; Wertheimer, M. R., 1993: Plasma surface modifi cation of polymers for improved adhesion: a critical review. Journal of Adhesion Science and Technology, 7 (10): 1091-1127.
16. Ma, X.; Qiao, Z.; Huang, Z.; Jing, X., 2013: The depen-dence of pendulum hardness on the thickness of acrylic coating. Journal of Coatings Technology and Research, 10 (3) 433-439.
https://doi.org/10.1007/s11998-013-9477-3.17. Moghadamzadeh, H.; Rahimi, H.; Asadollahzadeh, M.;
Hemmati, R. A., 2011: Surface treatment of wood poly-mer composites for adhesive bonding. International Jour-nal of Adhesion and Adhesives, 31: 816-821.
18. Nemli, G.; Örs, Y.; Kalaycıoğlu, H., 2005: The choosing of suitable decorative surface coating material types for interior end use applications of particleboard. Construc-tion and Building Materials, 19: 307-312. https://doi.org/10.1016/j.conbuildmat.2004.07.015.
19. Nemli, G.; Hiziroglu, S., 2009: Effect of press parame-ters on scratch and abrasion resistance of overlaid parti-cleboard panels. Journal of Composite Materials, 43 (13): 1413-1420.
https://doi.org/10.1177/0021998308103416.20. Nguyen, T. V.; Nguyen-Tri, P.; Nguyen, T. D.; El Aidani,
R.; Trinh, V. T.; Decker, C., 2016: Accelerated degrada-tion of water borne acrylic nanocomposites used in out-door protective coatings. Polymer Degradation and Sta-bility, 128: 65-76.
https://doi.org/10.1016/j.polymdegradstab.2016.03.002.21. Perisse, F.; Menecier, S.; Duffour, E.; Vacher, D.; Moni-
er, G.; Destrebecq, J.-F.; Czarniak, P.; Górski, J.; Wilkowski, J., 2017: MDF treatment with a Dielectric Barrier Discharge (DBD) torch. International Journal of Adhesion and Adhesives, 79: 18-22.
https://doi.org/10.1016/j.ijadhadh.2017.09.006.22. Reinprecht, L.; Tiňo, R.; Šomšák, M., 2018: Adhesion of
coatings to plasma modifi ed wood at accelerated weath-ering. In: European Conference on Wood Modifi cation 2018 (ECWM9), Creemers, J.; Houben, T.; Tjeerdsma, B.; Militz, H.; Junge, B.; Gootjes, J. Arnhem (eds.), The Netherlands (On-line Proceedings), 205-209.
23. Rolleri, A.; Roffael, E., 2010: Infl uence of the surface roughness of particleboards and their performance to-wards coating. Maderas ciencia y tecnologia, 12 (2): 143-148. https://doi.org/10.4067/s0718-221x2010000200009.
24. Rossi, S.; Defl orian, F.; Fontanari, L.; Cambruzzi, A.; Bonora, P. L., 2005: Electrochemical measurements to evaluate the damage due to abrasion on organic protec-tive system. Progress in Organic Coatings, 52: 288-297. https://doi.org/10.1016/j.porgcoat.2004.09.005.
25. Rossi, S.; Defl orian, F.; Scrinzi, E., 2009: Comparison of different abrasion mechanisms on aesthetic properties of organic coatings. Wear, 267: 1574-1580.
https://doi.org/10.1016/j.wear.2009.06.021.26. Sandak, J.; Sandak, A.; Hiziroglu, S.; Bosak, S., 2015:
Surface characterization of particleboard panels manu-
..... Žigon, Dahle, Petrič, Pavlič: Enhanced Abrasion Resistance of Coated Particleboard...
DRVNA INDUSTRIJA 71 (2) 129-137 (2020) 137
factured from eastern redcedar using a multi-sensor ap-proach. International Panel Products Symposium, At Llandudno, North Wales, UK: 27-37.
27. Scalarone, D.; Lazzari, M.; Castelvetro, V.; Chiantore, O., 2007: Surface monitoring of surfactant phase separa-tion and stability in waterborne acrylic coatings. Chemis-try of Materials, 19: 6107-6113.
https://doi.org/10.1021/cm0714077.28. Schindelin, J.; Arganda-Carreras, I.; Frise, E.; Kaynig,
V.; Longair, M.; Pietzsch, T.; Preibisch, S.; Rueden, C.; Saalfeld, S.; Schmid, B.; Tinevez, J.-Y.; White, J. D.; Hartenstein, V.; Eliceiri, K.; Tomancak, P.; Cardona, A., 2012: Fiji – an Open Source platform for biological im-age analysis. Nat. Methods 9(7): 676-682.
29. Scrinzi, E.; Rossi, S.; Defl orian, F.; Zanella, C., 2011: Evaluation of aesthetic durability of waterborne polyure-thane coatings applied on wood for interior applications. Progress in Organic Coatings, 72: 81-87.
https://doi.org/10.1016/j.porgcoat.2011.03.013.30. Sell, J.; Feist, W. C., 1986: Role of density in the erosion
of wood during weathering. For. Prod. J., 36 (3): 57-60.31. Sönmez, A.; Budakçı, M.; Pelit, H., 2011: The effect of
the moisture content of wood on the layer performance of water-borne varnishes. BioResources, 6 (3), 3166-3178.
32. Veigel, S.; Grüll, G.; Pinkl, S.; Obersriebnig, M.; Müller, U.; Gindl-Altmutter, W., 2014: Improving the mechani-cal resistance of waterborne wood coatings by adding cellulose nanofi bers. Reactive and Functional Polymers, 85: 214-220.
https://doi.org/10.1016/j.reactfunctpolym.2014.07.020.33. Welzbacher, C.; Brischke, C.; Rapp, A.; Koch, S.; Hofer,
S., 2009: Performance of thermally modifi ed timber (TMT) in outdoor application – durability, abrasion and optical appearance. Drvna industrija, 60 (2): 75-82.
34. Wolf, R.; Sparavigna, A. C., 2010: Role of plasma sur-face treatments on wetting and adhesion. Engineering, 2: 397-402. https://doi.org/10.4236/eng.2010.26052.
35. Wolkenhauer, A.; Militz, H.; Viöl, W., 2008: Increased PVA-glue adhesion on particle board and fi bre board by plasma treatment. Holz als Roh- und Werkstoff, 66: 143-145. https://doi.org/10.1007/s00107-007-0217-1.
36. Wolkenhauer, A.; Avramidis, G.; Hauswald, E.; Loose, S.; Viöl, W.; Militz, H., 2009: Investigations on the dry-ing behaviour of adhesives on plasma-treated wood ma-terials. Wood Research, 54 (1): 59-66.
37. Žigon, J.; Petrič, M.; Dahle, S., 2018: Dielectric barrier discharge (DBD) plasma pretreatment of lignocellulosic materials in air at atmospheric pressure for their improved wettability: a literature review. Holzforschung, 72 (11): 979-991. https://doi.org/10.1515/hf-2017-0207.
38. Žigon, J.; Petrič, M.; Dahle, S., 2019: Artifi cially aged spruce and beech wood surfaces reactivated using FE-DBD atmospheric plasma. Holzforschung, 73 (12): 1069-1081. https://doi.org/10.1515/hf-2019-0005.
39. ***EN 438-2, 2016: High-pressure decorative laminates (HPL) – Sheets based on thermosetting resins (usually called laminates), Part 2: Determination of properties.
40. ***EN ISO 1522, 2007: Paints and varnishes – Pendu-lum damping test.
41. ***ISO 3251, 2008: Paints, varnishes and plastics – De-termination of non-volatile-matter content.
Corresponding address:
JURE ŽIGON
University of LjubljanaBiotechnical FacultyDepartment of Wood Science and TechnologyJamnikarjeva 101, 1000 Ljubljana, SLOVENIAe-mail: [email protected]
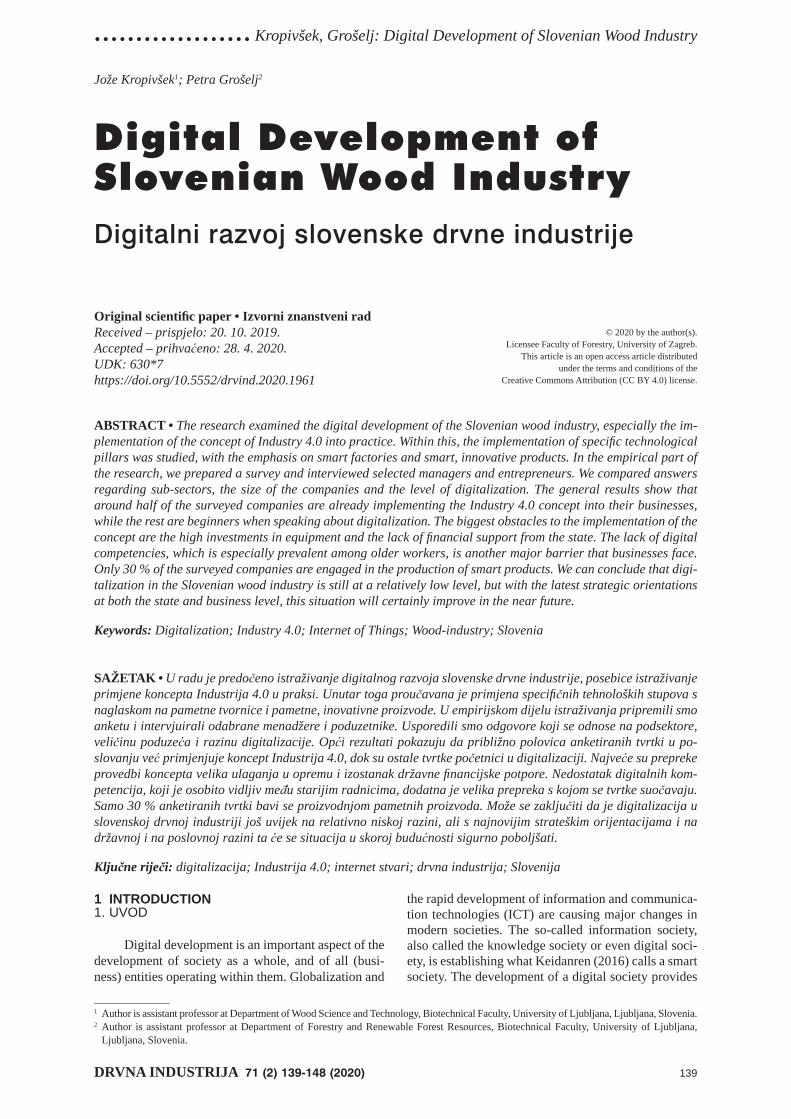
................... Kropivšek, Grošelj: Digital Development of Slovenian Wood Industry
DRVNA INDUSTRIJA 71 (2) 139-148 (2020) 139
Jože Kropivšek1; Petra Grošelj2
Digital Development of Slovenian Wood IndustryDigitalni razvoj slovenske drvne industrije
Original scientifi c paper • Izvorni znanstveni radReceived – prispjelo: 20. 10. 2019.Accepted – prihvaćeno: 28. 4. 2020.UDK: 630*7 https://doi.org/10.5552/drvind.2020.1961
ABSTRACT • The research examined the digital development of the Slovenian wood industry, especially the im-plementation of the concept of Industry 4.0 into practice. Within this, the implementation of specifi c technological pillars was studied, with the emphasis on smart factories and smart, innovative products. In the empirical part of the research, we prepared a survey and interviewed selected managers and entrepreneurs. We compared answers regarding sub-sectors, the size of the companies and the level of digitalization. The general results show that around half of the surveyed companies are already implementing the Industry 4.0 concept into their businesses, while the rest are beginners when speaking about digitalization. The biggest obstacles to the implementation of the concept are the high investments in equipment and the lack of fi nancial support from the state. The lack of digital competencies, which is especially prevalent among older workers, is another major barrier that businesses face. Only 30 % of the surveyed companies are engaged in the production of smart products. We can conclude that digi-talization in the Slovenian wood industry is still at a relatively low level, but with the latest strategic orientations at both the state and business level, this situation will certainly improve in the near future.
Keywords: Digitalization; Industry 4.0; Internet of Things; Wood-industry; Slovenia
SAŽETAK • U radu je predočeno istraživanje digitalnog razvoja slovenske drvne industrije, posebice istraživanje primjene koncepta Industrija 4.0 u praksi. Unutar toga proučavana je primjena specifi čnih tehnoloških stupova s naglaskom na pametne tvornice i pametne, inovativne proizvode. U empirijskom dijelu istraživanja pripremili smo anketu i intervjuirali odabrane menadžere i poduzetnike. Usporedili smo odgovore koji se odnose na podsektore, veličinu poduzeća i razinu digitalizacije. Opći rezultati pokazuju da približno polovica anketiranih tvrtki u po-slovanju već primjenjuje koncept Industrija 4.0, dok su ostale tvrtke početnici u digitalizaciji. Najveće su prepreke provedbi koncepta velika ulaganja u opremu i izostanak državne fi nancijske potpore. Nedostatak digitalnih kom-petencija, koji je osobito vidljiv među starijim radnicima, dodatna je velika prepreka s kojom se tvrtke suočavaju. Samo 30 % anketiranih tvrtki bavi se proizvodnjom pametnih proizvoda. Može se zaključiti da je digitalizacija u slovenskoj drvnoj industriji još uvijek na relativno niskoj razini, ali s najnovijim strateškim orijentacijama i na državnoj i na poslovnoj razini ta će se situacija u skoroj budućnosti sigurno poboljšati.
Ključne riječi: digitalizacija; Industrija 4.0; internet stvari; drvna industrija; Slovenija
1 Author is assistant professor at Department of Wood Science and Technology, Biotechnical Faculty, University of Ljubljana, Ljubljana, Slovenia.2 Author is assistant professor at Department of Forestry and Renewable Forest Resources, Biotechnical Faculty, University of Ljubljana,
Ljubljana, Slovenia.
© 2020 by the author(s).Licensee Faculty of Forestry, University of Zagreb.
This article is an open access article distributedunder the terms and conditions of the
Creative Commons Attribution (CC BY 4.0) license.
1 INTRODUCTION1. UVOD
Digital development is an important aspect of the development of society as a whole, and of all (busi-ness) entities operating within them. Globalization and
the rapid development of information and communica-tion technologies (ICT) are causing major changes in modern societies. The so-called information society, also called the knowledge society or even digital soci-ety, is establishing what Keidanren (2016) calls a smart society. The development of a digital society provides
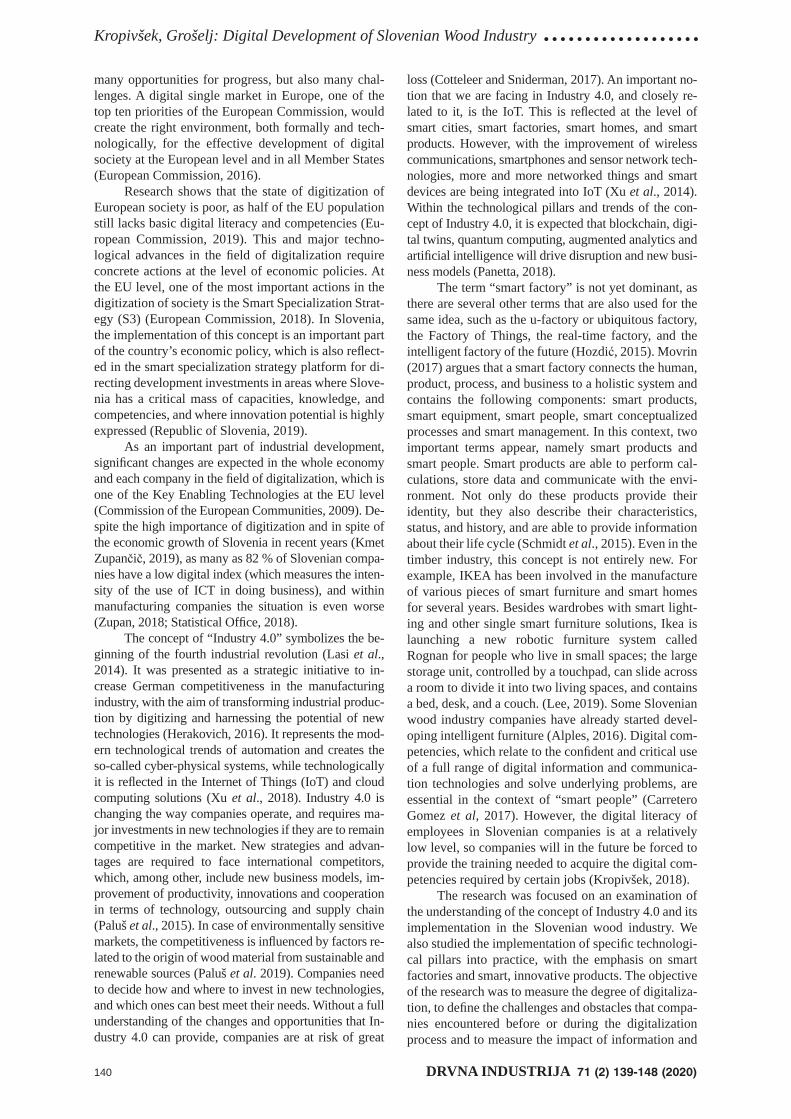
Kropivšek, Grošelj: Digital Development of Slovenian Wood Industry ...................
140 DRVNA INDUSTRIJA 71 (2) 139-148 (2020)
many opportunities for progress, but also many chal-lenges. A digital single market in Europe, one of the top ten priorities of the European Commission, would create the right environment, both formally and tech-nologically, for the effective development of digital society at the European level and in all Member States (European Commission, 2016).
Research shows that the state of digitization of European society is poor, as half of the EU population still lacks basic digital literacy and competencies (Eu-ropean Commission, 2019). This and major techno-logical advances in the fi eld of digitalization require concrete actions at the level of economic policies. At the EU level, one of the most important actions in the digitization of society is the Smart Specialization Strat-egy (S3) (European Commission, 2018). In Slovenia, the implementation of this concept is an important part of the country’s economic policy, which is also refl ect-ed in the smart specialization strategy platform for di-recting development investments in areas where Slove-nia has a critical mass of capacities, knowledge, and competencies, and where innovation potential is highly expressed (Republic of Slovenia, 2019).
As an important part of industrial development, signifi cant changes are expected in the whole economy and each company in the fi eld of digitalization, which is one of the Key Enabling Technologies at the EU level (Commission of the European Communities, 2009). De-spite the high importance of digitization and in spite of the economic growth of Slovenia in recent years (Kmet Zupančič, 2019), as many as 82 % of Slovenian compa-nies have a low digital index (which measures the inten-sity of the use of ICT in doing business), and within manufacturing companies the situation is even worse (Zupan, 2018; Statistical Offi ce, 2018).
The concept of “Industry 4.0” symbolizes the be-ginning of the fourth industrial revolution (Lasi et al., 2014). It was presented as a strategic initiative to in-crease German competitiveness in the manufacturing industry, with the aim of transforming industrial produc-tion by digitizing and harnessing the potential of new technologies (Herakovich, 2016). It represents the mod-ern technological trends of automation and creates the so-called cyber-physical systems, while technologically it is refl ected in the Internet of Things (IoT) and cloud computing solutions (Xu et al., 2018). Industry 4.0 is changing the way companies operate, and requires ma-jor investments in new technologies if they are to remain competitive in the market. New strategies and advan-tages are required to face international competitors, which, among other, include new business models, im-provement of productivity, innovations and cooperation in terms of technology, outsourcing and supply chain (Paluš et al., 2015). In case of environmentally sensitive markets, the competitiveness is infl uenced by factors re-lated to the origin of wood material from sustainable and renewable sources (Paluš et al. 2019). Companies need to decide how and where to invest in new technologies, and which ones can best meet their needs. Without a full understanding of the changes and opportunities that In-dustry 4.0 can provide, companies are at risk of great
loss (Cotteleer and Sniderman, 2017). An important no-tion that we are facing in Industry 4.0, and closely re-lated to it, is the IoT. This is refl ected at the level of smart cities, smart factories, smart homes, and smart products. However, with the improvement of wireless communications, smartphones and sensor network tech-nologies, more and more networked things and smart devices are being integrated into IoT (Xu et al., 2014). Within the technological pillars and trends of the con-cept of Industry 4.0, it is expected that blockchain, digi-tal twins, quantum computing, augmented analytics and artifi cial intelligence will drive disruption and new busi-ness models (Panetta, 2018).
The term “smart factory” is not yet dominant, as there are several other terms that are also used for the same idea, such as the u-factory or ubiquitous factory, the Factory of Things, the real-time factory, and the intelligent factory of the future (Hozdić, 2015). Movrin (2017) argues that a smart factory connects the human, product, process, and business to a holistic system and contains the following components: smart products, smart equipment, smart people, smart conceptualized processes and smart management. In this context, two important terms appear, namely smart products and smart people. Smart products are able to perform cal-culations, store data and communicate with the envi-ronment. Not only do these products provide their identity, but they also describe their characteristics, status, and history, and are able to provide information about their life cycle (Schmidt et al., 2015). Even in the timber industry, this concept is not entirely new. For example, IKEA has been involved in the manufacture of various pieces of smart furniture and smart homes for several years. Besides wardrobes with smart light-ing and other single smart furniture solutions, Ikea is launching a new robotic furniture system called Rognan for people who live in small spaces; the large storage unit, controlled by a touchpad, can slide across a room to divide it into two living spaces, and contains a bed, desk, and a couch. (Lee, 2019). Some Slovenian wood industry companies have already started devel-oping intelligent furniture (Alples, 2016). Digital com-petencies, which relate to the confi dent and critical use of a full range of digital information and communica-tion technologies and solve underlying problems, are essential in the context of “smart people” (Carretero Gomez et al, 2017). However, the digital literacy of employees in Slovenian companies is at a relatively low level, so companies will in the future be forced to provide the training needed to acquire the digital com-petencies required by certain jobs (Kropivšek, 2018).
The research was focused on an examination of the understanding of the concept of Industry 4.0 and its implementation in the Slovenian wood industry. We also studied the implementation of specifi c technologi-cal pillars into practice, with the emphasis on smart factories and smart, innovative products. The objective of the research was to measure the degree of digitaliza-tion, to defi ne the challenges and obstacles that compa-nies encountered before or during the digitalization process and to measure the impact of information and
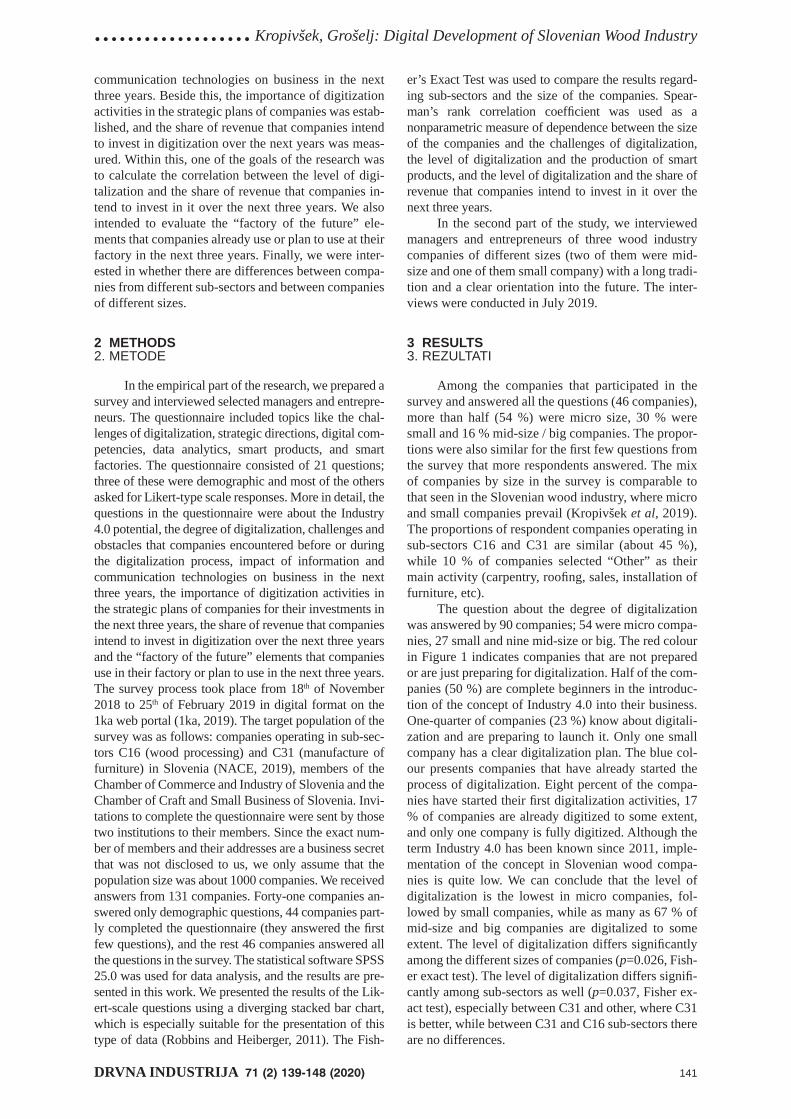
................... Kropivšek, Grošelj: Digital Development of Slovenian Wood Industry
DRVNA INDUSTRIJA 71 (2) 139-148 (2020) 141
communication technologies on business in the next three years. Beside this, the importance of digitization activities in the strategic plans of companies was estab-lished, and the share of revenue that companies intend to invest in digitization over the next years was meas-ured. Within this, one of the goals of the research was to calculate the correlation between the level of digi-talization and the share of revenue that companies in-tend to invest in it over the next three years. We also intended to evaluate the “factory of the future” ele-ments that companies already use or plan to use at their factory in the next three years. Finally, we were inter-ested in whether there are differences between compa-nies from different sub-sectors and between companies of different sizes.
2 METHODS2. METODE
In the empirical part of the research, we prepared a survey and interviewed selected managers and entrepre-neurs. The questionnaire included topics like the chal-lenges of digitalization, strategic directions, digital com-petencies, data analytics, smart products, and smart factories. The questionnaire consisted of 21 questions; three of these were demographic and most of the others asked for Likert-type scale responses. More in detail, the questions in the questionnaire were about the Industry 4.0 potential, the degree of digitalization, challenges and obstacles that companies encountered before or during the digitalization process, impact of information and communication technologies on business in the next three years, the importance of digitization activities in the strategic plans of companies for their investments in the next three years, the share of revenue that companies intend to invest in digitization over the next three years and the “factory of the future” elements that companies use in their factory or plan to use in the next three years. The survey process took place from 18th of November 2018 to 25th of February 2019 in digital format on the 1ka web portal (1ka, 2019). The target population of the survey was as follows: companies operating in sub-sec-tors C16 (wood processing) and C31 (manufacture of furniture) in Slovenia (NACE, 2019), members of the Chamber of Commerce and Industry of Slovenia and the Chamber of Craft and Small Business of Slovenia. Invi-tations to complete the questionnaire were sent by those two institutions to their members. Since the exact num-ber of members and their addresses are a business secret that was not disclosed to us, we only assume that the population size was about 1000 companies. We received answers from 131 companies. Forty-one companies an-swered only demographic questions, 44 companies part-ly completed the questionnaire (they answered the fi rst few questions), and the rest 46 companies answered all the questions in the survey. The statistical software SPSS 25.0 was used for data analysis, and the results are pre-sented in this work. We presented the results of the Lik-ert-scale questions using a diverging stacked bar chart, which is especially suitable for the presentation of this type of data (Robbins and Heiberger, 2011). The Fish-
er’s Exact Test was used to compare the results regard-ing sub-sectors and the size of the companies. Spear-man’s rank correlation coeffi cient was used as a nonparametric measure of dependence between the size of the companies and the challenges of digitalization, the level of digitalization and the production of smart products, and the level of digitalization and the share of revenue that companies intend to invest in it over the next three years.
In the second part of the study, we interviewed managers and entrepreneurs of three wood industry companies of different sizes (two of them were mid-size and one of them small company) with a long tradi-tion and a clear orientation into the future. The inter-views were conducted in July 2019.
3 RESULTS3. REZULTATI
Among the companies that participated in the survey and answered all the questions (46 companies), more than half (54 %) were micro size, 30 % were small and 16 % mid-size / big companies. The propor-tions were also similar for the fi rst few questions from the survey that more respondents answered. The mix of companies by size in the survey is comparable to that seen in the Slovenian wood industry, where micro and small companies prevail (Kropivšek et al, 2019). The proportions of respondent companies operating in sub-sectors C16 and C31 are similar (about 45 %), while 10 % of companies selected “Other” as their main activity (carpentry, roofi ng, sales, installation of furniture, etc).
The question about the degree of digitalization was answered by 90 companies; 54 were micro compa-nies, 27 small and nine mid-size or big. The red colour in Figure 1 indicates companies that are not prepared or are just preparing for digitalization. Half of the com-panies (50 %) are complete beginners in the introduc-tion of the concept of Industry 4.0 into their business. One-quarter of companies (23 %) know about digitali-zation and are preparing to launch it. Only one small company has a clear digitalization plan. The blue col-our presents companies that have already started the process of digitalization. Eight percent of the compa-nies have started their fi rst digitalization activities, 17 % of companies are already digitized to some extent, and only one company is fully digitized. Although the term Industry 4.0 has been known since 2011, imple-mentation of the concept in Slovenian wood compa-nies is quite low. We can conclude that the level of digitalization is the lowest in micro companies, fol-lowed by small companies, while as many as 67 % of mid-size and big companies are digitalized to some extent. The level of digitalization differs signifi cantly among the different sizes of companies (p=0.026, Fish-er exact test). The level of digitalization differs signifi -cantly among sub-sectors as well (p=0.037, Fisher ex-act test), especially between C31 and other, where C31 is better, while between C31 and C16 sub-sectors there are no differences.
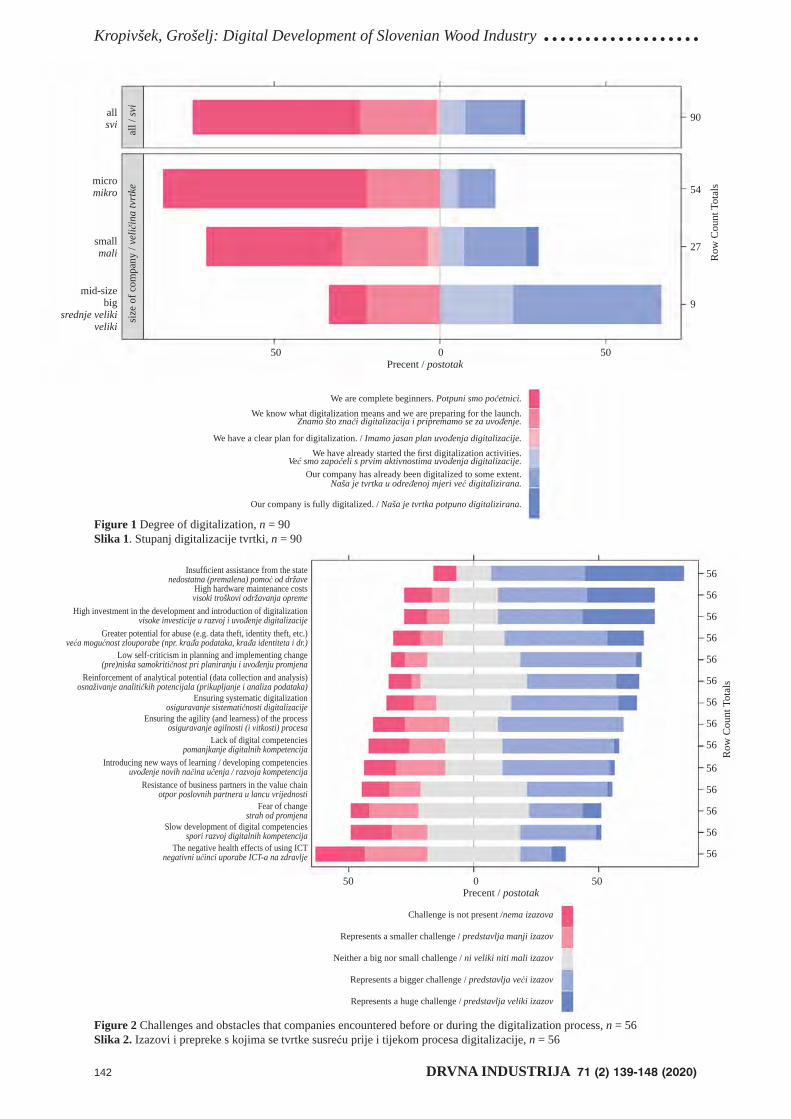
Kropivšek, Grošelj: Digital Development of Slovenian Wood Industry ...................
142 DRVNA INDUSTRIJA 71 (2) 139-148 (2020)
Figure 1 Degree of digitalization, n = 90Slika 1. Stupanj digitalizacije tvrtki, n = 90
Figure 2 Challenges and obstacles that companies encountered before or during the digitalization process, n = 56Slika 2. Izazovi i prepreke s kojima se tvrtke susreću prije i tijekom procesa digitalizacije, n = 56
mid-size big
srednje veliki veliki
We are complete beginners. Potpuni smo početnici.We know what digitalization means and we are preparing for the launch.
Znamo što znači digitalizacija i pripremamo se za uvođenje.
We have a clear plan for digitalization. / Imamo jasan plan uvođenja digitalizacije.We have already started the fi rst digitalization activities.
Već smo započeli s prvim aktivnostima uvođenja digitalizacije.Our company has already been digitalized to some extent.
Naša je tvrtka u određenoj mjeri već digitalizirana.
Our company is fully digitalized. / Naša je tvrtka potpuno digitalizirana.
Row
Cou
nt T
otal
s
allsvi
micromikro
smallmali
all /
svi
size
of c
ompa
ny /
velič
ina
tvrt
ke
Precent / postotak
90
54
27
9
50 0 50
56
56
56
56
56
56
56
56
56
56
56
56
56
56
50 0 50
Row
Cou
nt T
otal
s
Precent / postotak
Insuffi cient assistance from the statenedostatna (premalena) pomoć od države
High hardware maintenance costsvisoki troškovi održavanja opreme
High investment in the development and introduction of digitalizationvisoke investicije u razvoj i uvođenje digitalizacije
Greater potential for abuse (e.g. data theft, identity theft, etc.)veća mogućnost zlouporabe (npr. krađa podataka, krađa identiteta i dr.)
Low self-criticism in planning and implementing change(pre)niska samokritičnost pri planiranju i uvođenju promjena
Reinforcement of analytical potential (data collection and analysis)osnaživanje analitičkih potencijala (prikupljanje i analiza podataka)
Ensuring systematic digitalizationosiguravanje sistematičnosti digitalizacije
Ensuring the agility (and learness) of the processosiguravanje agilnosti (i vitkosti) procesa
Lack of digital competenciespomanjkanje digitalnih kompetencija
Introducing new ways of learning / developing competenciesuvođenje novih načina učenja / razvoja kompetencija
Resistance of business partners in the value chainotpor poslovnih partnera u lancu vrijednosti
Fear of changestrah od promjena
Slow development of digital competenciesspori razvoj digitalnih kompetencija
The negative health effects of using ICTnegativni učinci uporabe ICT-a na zdravlje
Challenge is not present /nema izazova
Represents a smaller challenge / predstavlja manji izazov
Neither a big nor small challenge / ni veliki niti mali izazov
Represents a bigger challenge / predstavlja veći izazov
Represents a huge challenge / predstavlja veliki izazov
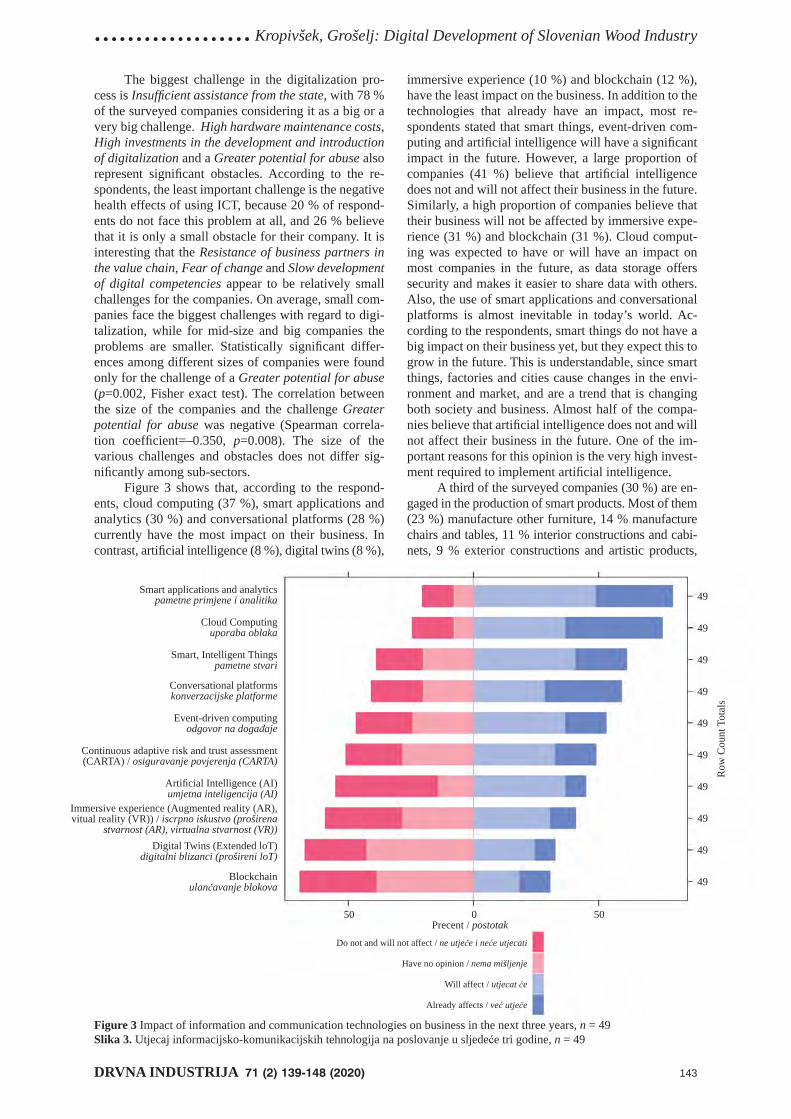
................... Kropivšek, Grošelj: Digital Development of Slovenian Wood Industry
DRVNA INDUSTRIJA 71 (2) 139-148 (2020) 143
The biggest challenge in the digitalization pro-cess is Insuffi cient assistance from the state, with 78 % of the surveyed companies considering it as a big or a very big challenge. High hardware maintenance costs, High investments in the development and introduction of digitalization and a Greater potential for abuse also represent signifi cant obstacles. According to the re-spondents, the least important challenge is the negative health effects of using ICT, because 20 % of respond-ents do not face this problem at all, and 26 % believe that it is only a small obstacle for their company. It is interesting that the Resistance of business partners in the value chain, Fear of change and Slow development of digital competencies appear to be relatively small challenges for the companies. On average, small com-panies face the biggest challenges with regard to digi-talization, while for mid-size and big companies the problems are smaller. Statistically signifi cant differ-ences among different sizes of companies were found only for the challenge of a Greater potential for abuse (p=0.002, Fisher exact test). The correlation between the size of the companies and the challenge Greater potential for abuse was negative (Spearman correla-tion coeffi cient=–0.350, p=0.008). The size of the various challenges and obstacles does not differ sig-nifi cantly among sub-sectors.
Figure 3 shows that, according to the respond-ents, cloud computing (37 %), smart applications and analytics (30 %) and conversational platforms (28 %) currently have the most impact on their business. In contrast, artifi cial intelligence (8 %), digital twins (8 %),
immersive experience (10 %) and blockchain (12 %), have the least impact on the business. In addition to the technologies that already have an impact, most re-spondents stated that smart things, event-driven com-puting and artifi cial intelligence will have a signifi cant impact in the future. However, a large proportion of companies (41 %) believe that artifi cial intelligence does not and will not affect their business in the future. Similarly, a high proportion of companies believe that their business will not be affected by immersive expe-rience (31 %) and blockchain (31 %). Cloud comput-ing was expected to have or will have an impact on most companies in the future, as data storage offers security and makes it easier to share data with others. Also, the use of smart applications and conversational platforms is almost inevitable in today’s world. Ac-cording to the respondents, smart things do not have a big impact on their business yet, but they expect this to grow in the future. This is understandable, since smart things, factories and cities cause changes in the envi-ronment and market, and are a trend that is changing both society and business. Almost half of the compa-nies believe that artifi cial intelligence does not and will not affect their business in the future. One of the im-portant reasons for this opinion is the very high invest-ment required to implement artifi cial intelligence.
A third of the surveyed companies (30 %) are en-gaged in the production of smart products. Most of them (23 %) manufacture other furniture, 14 % manufacture chairs and tables, 11 % interior constructions and cabi-nets, 9 % exterior constructions and artistic products,
Figure 3 Impact of information and communication technologies on business in the next three years, n = 49Slika 3. Utjecaj informacijsko-komunikacijskih tehnologija na poslovanje u sljedeće tri godine, n = 49
49
49
49
49
49
49
49
49
49
49
50 0 50
Row
Cou
nt T
otal
s
Precent / postotak
Smart applications and analyticspametne primjene i analitika
Cloud Computinguporaba oblaka
Smart, Intelligent Thingspametne stvari
Conversational platformskonverzacijske platforme
Event-driven computingodgovor na događaje
Continuous adaptive risk and trust assessment (CARTA) / osiguravanje povjerenja (CARTA)
Artifi cial Intelligence (AI)umjetna inteligencija (AI)
Immersive experience (Augmented reality (AR), vitual reality (VR)) / iscrpno iskustvo (proširena
stvarnost (AR), virtualna stvarnost (VR))Digital Twins (Extended loT)
digitalni blizanci (prošireni loT)
Blockchainulančavanje blokova
Do not and will not affect / ne utječe i neće utjecati
Have no opinion / nema mišljenje
Will affect / utjecat će
Already affects / već utječe
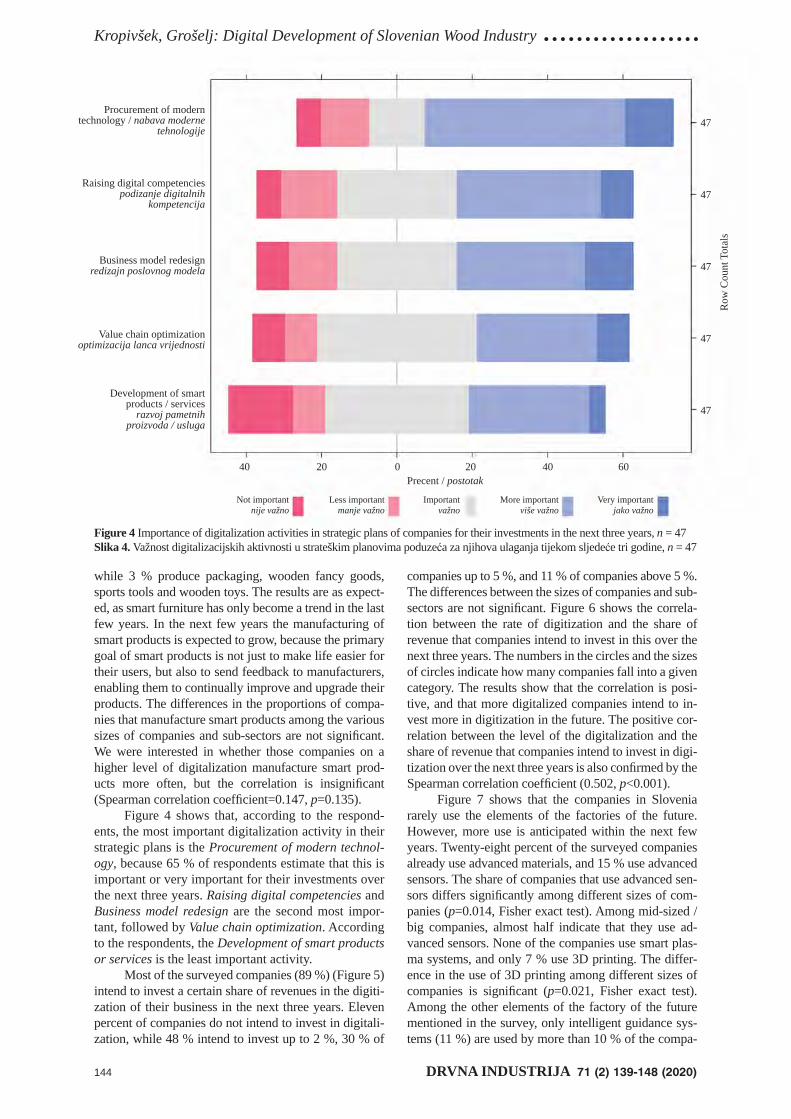
Kropivšek, Grošelj: Digital Development of Slovenian Wood Industry ...................
144 DRVNA INDUSTRIJA 71 (2) 139-148 (2020)
while 3 % produce packaging, wooden fancy goods, sports tools and wooden toys. The results are as expect-ed, as smart furniture has only become a trend in the last few years. In the next few years the manufacturing of smart products is expected to grow, because the primary goal of smart products is not just to make life easier for their users, but also to send feedback to manufacturers, enabling them to continually improve and upgrade their products. The differences in the proportions of compa-nies that manufacture smart products among the various sizes of companies and sub-sectors are not signifi cant. We were interested in whether those companies on a higher level of digitalization manufacture smart prod-ucts more often, but the correlation is insignifi cant (Spearman correlation coeffi cient=0.147, p=0.135).
Figure 4 shows that, according to the respond-ents, the most important digitalization activity in their strategic plans is the Procurement of modern technol-ogy, because 65 % of respondents estimate that this is important or very important for their investments over the next three years. Raising digital competencies and Business model redesign are the second most impor-tant, followed by Value chain optimization. According to the respondents, the Development of smart products or services is the least important activity.
Most of the surveyed companies (89 %) (Figure 5) intend to invest a certain share of revenues in the digiti-zation of their business in the next three years. Eleven percent of companies do not intend to invest in digitali-zation, while 48 % intend to invest up to 2 %, 30 % of
companies up to 5 %, and 11 % of companies above 5 %. The differences between the sizes of companies and sub-sectors are not signifi cant. Figure 6 shows the correla-tion between the rate of digitization and the share of revenue that companies intend to invest in this over the next three years. The numbers in the circles and the sizes of circles indicate how many companies fall into a given category. The results show that the correlation is posi-tive, and that more digitalized companies intend to in-vest more in digitization in the future. The positive cor-relation between the level of the digitalization and the share of revenue that companies intend to invest in digi-tization over the next three years is also confi rmed by the Spearman correlation coeffi cient (0.502, p<0.001).
Figure 7 shows that the companies in Slovenia rarely use the elements of the factories of the future. However, more use is anticipated within the next few years. Twenty-eight percent of the surveyed companies already use advanced materials, and 15 % use advanced sensors. The share of companies that use advanced sen-sors differs signifi cantly among different sizes of com-panies (p=0.014, Fisher exact test). Among mid-sized / big companies, almost half indicate that they use ad-vanced sensors. None of the companies use smart plas-ma systems, and only 7 % use 3D printing. The differ-ence in the use of 3D printing among different sizes of companies is signifi cant (p=0.021, Fisher exact test). Among the other elements of the factory of the future mentioned in the survey, only intelligent guidance sys-tems (11 %) are used by more than 10 % of the compa-
Figure 4 Importance of digitalization activities in strategic plans of companies for their investments in the next three years, n = 47Slika 4. Važnost digitalizacijskih aktivnosti u strateškim planovima poduzeća za njihova ulaganja tijekom sljedeće tri godine, n = 47
Procurement of modern technology / nabava moderne
tehnologije
Raising digital competenciespodizanje digitalnih
kompetencija
Business model redesignredizajn poslovnog modela
Value chain optimizationoptimizacija lanca vrijednosti
Development of smart products / services
razvoj pametnih proizvoda / usluga
Not importantnije važno
Less importantmanje važno
Importantvažno
More importantviše važno
Very importantjako važno
40 20 0 20 40 60
47
47
47
47
47
Row
Cou
nt T
otal
s
Precent / postotak
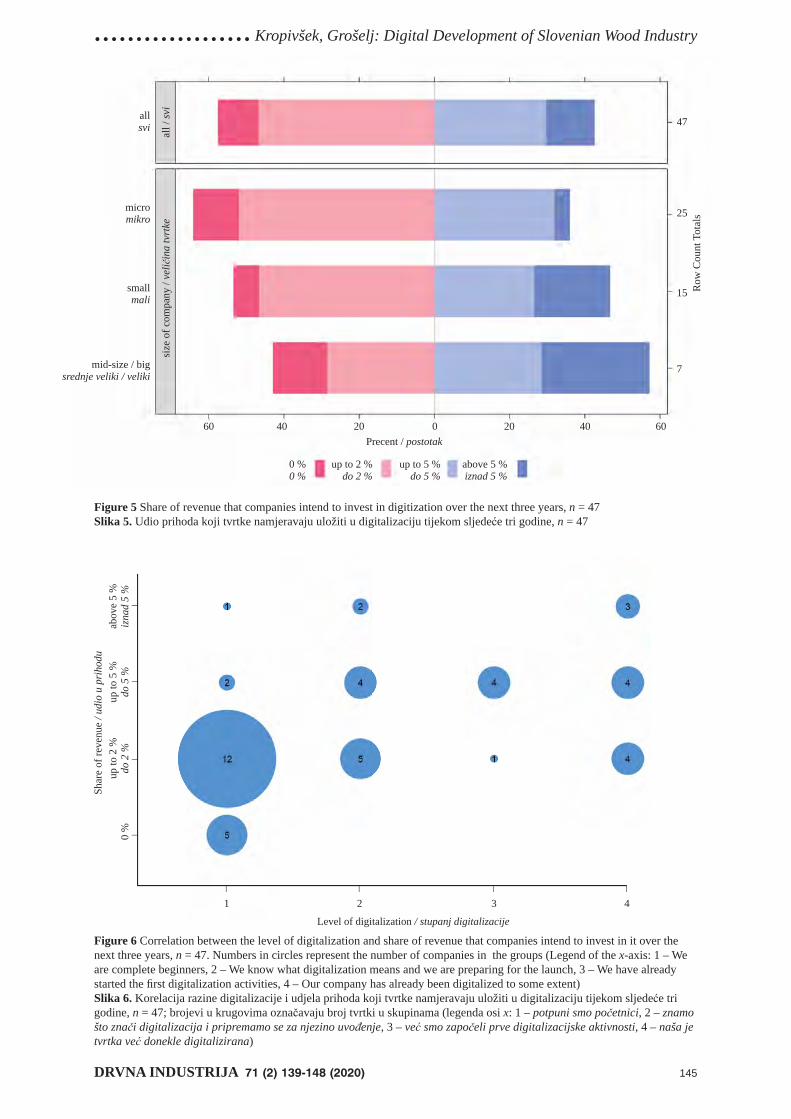
................... Kropivšek, Grošelj: Digital Development of Slovenian Wood Industry
DRVNA INDUSTRIJA 71 (2) 139-148 (2020) 145
Figure 5 Share of revenue that companies intend to invest in digitization over the next three years, n = 47Slika 5. Udio prihoda koji tvrtke namjeravaju uložiti u digitalizaciju tijekom sljedeće tri godine, n = 47
Figure 6 Correlation between the level of digitalization and share of revenue that companies intend to invest in it over the next three years, n = 47. Numbers in circles represent the number of companies in the groups (Legend of the x-axis: 1 – We are complete beginners, 2 – We know what digitalization means and we are preparing for the launch, 3 – We have already started the fi rst digitalization activities, 4 – Our company has already been digitalized to some extent)Slika 6. Korelacija razine digitalizacije i udjela prihoda koji tvrtke namjeravaju uložiti u digitalizaciju tijekom sljedeće tri godine, n = 47; brojevi u krugovima označavaju broj tvrtki u skupinama (legenda osi x: 1 – potpuni smo početnici, 2 – znamo što znači digitalizacija i pripremamo se za njezino uvođenje, 3 – već smo započeli prve digitalizacijske aktivnosti, 4 – naša je tvrtka već donekle digitalizirana)
47
25
15
7
Row
Cou
nt T
otal
s
60 40 20 0 20 40 60Precent / postotak
allsvi
micromikro
smallmali
mid-size / bigsrednje veliki / veliki
0 %0 %
up to 2 %do 2 %
up to 5 %do 5 %
above 5 %iznad 5 %
all /
svi
size
of c
ompa
ny /
velič
ina
tvrt
ke
Shar
e of
reve
nue
/ udi
o u
prih
odu
abov
e 5
%
izna
d 5
%up
to 2
%
do 2
%0
%
Level of digitalization / stupanj digitalizacije
1 2 3 4
up to
5 %
do
5 %
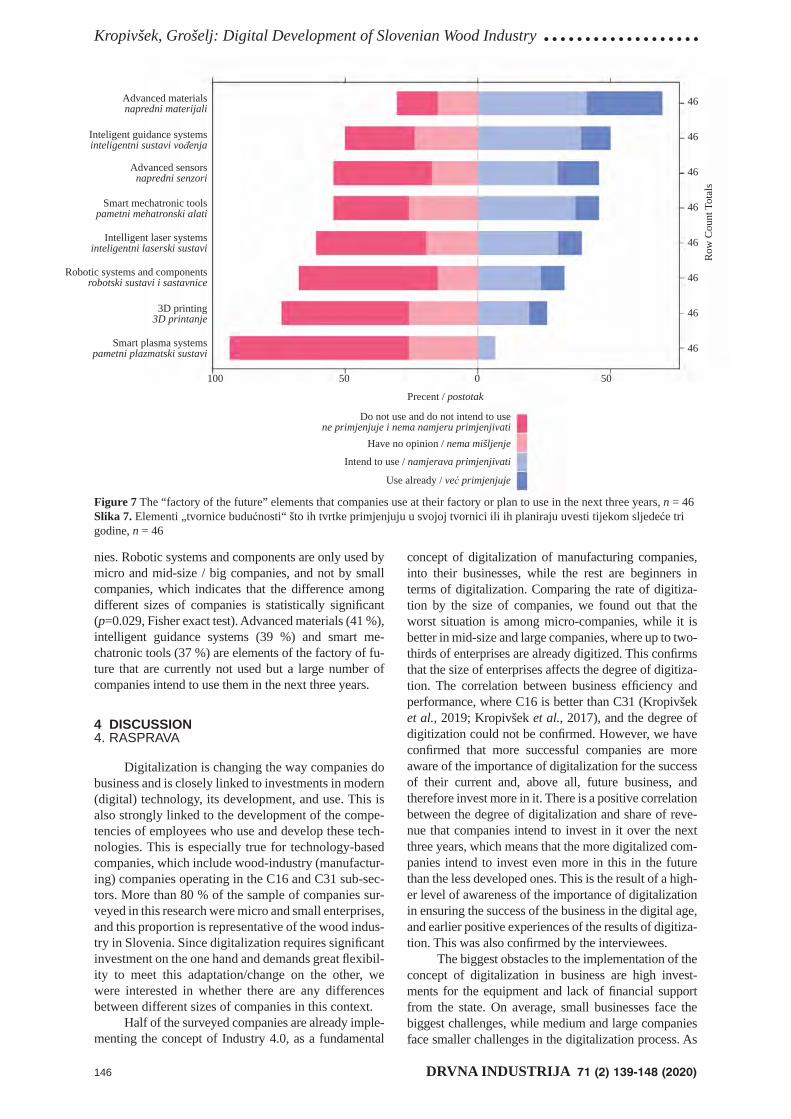
Kropivšek, Grošelj: Digital Development of Slovenian Wood Industry ...................
146 DRVNA INDUSTRIJA 71 (2) 139-148 (2020)
nies. Robotic systems and components are only used by micro and mid-size / big companies, and not by small companies, which indicates that the difference among different sizes of companies is statistically signifi cant (p=0.029, Fisher exact test). Advanced materials (41 %), intelligent guidance systems (39 %) and smart me-chatronic tools (37 %) are elements of the factory of fu-ture that are currently not used but a large number of companies intend to use them in the next three years.
4 DISCUSSION4. RASPRAVA
Digitalization is changing the way companies do business and is closely linked to investments in modern (digital) technology, its development, and use. This is also strongly linked to the development of the compe-tencies of employees who use and develop these tech-nologies. This is especially true for technology-based companies, which include wood-industry (manufactur-ing) companies operating in the C16 and C31 sub-sec-tors. More than 80 % of the sample of companies sur-veyed in this research were micro and small enterprises, and this proportion is representative of the wood indus-try in Slovenia. Since digitalization requires signifi cant investment on the one hand and demands great fl exibil-ity to meet this adaptation/change on the other, we were interested in whether there are any differences between different sizes of companies in this context.
Half of the surveyed companies are already imple-menting the concept of Industry 4.0, as a fundamental
concept of digitalization of manufacturing companies, into their businesses, while the rest are beginners in terms of digitalization. Comparing the rate of digitiza-tion by the size of companies, we found out that the worst situation is among micro-companies, while it is better in mid-size and large companies, where up to two-thirds of enterprises are already digitized. This confi rms that the size of enterprises affects the degree of digitiza-tion. The correlation between business effi ciency and performance, where C16 is better than C31 (Kropivšek et al., 2019; Kropivšek et al., 2017), and the degree of digitization could not be confi rmed. However, we have confi rmed that more successful companies are more aware of the importance of digitalization for the success of their current and, above all, future business, and therefore invest more in it. There is a positive correlation between the degree of digitalization and share of reve-nue that companies intend to invest in it over the next three years, which means that the more digitalized com-panies intend to invest even more in this in the future than the less developed ones. This is the result of a high-er level of awareness of the importance of digitalization in ensuring the success of the business in the digital age, and earlier positive experiences of the results of digitiza-tion. This was also confi rmed by the interviewees.
The biggest obstacles to the implementation of the concept of digitalization in business are high invest-ments for the equipment and lack of fi nancial support from the state. On average, small businesses face the biggest challenges, while medium and large companies face smaller challenges in the digitalization process. As
Figure 7 The “factory of the future” elements that companies use at their factory or plan to use in the next three years, n = 46Slika 7. Elementi „tvornice budućnosti“ što ih tvrtke primjenjuju u svojoj tvornici ili ih planiraju uvesti tijekom sljedeće tri godine, n = 46
Advanced materialsnapredni materijali
Inteligent guidance systemsinteligentni sustavi vođenja
Advanced sensorsnapredni senzori
Smart mechatronic toolspametni mehatronski alati
Intelligent laser systemsinteligentni laserski sustavi
Robotic systems and componentsrobotski sustavi i sastavnice
3D printing3D printanje
Smart plasma systemspametni plazmatski sustavi
Do not use and do not intend to usene primjenjuje i nema namjeru primjenjivati
Have no opinion / nema mišljenje
Intend to use / namjerava primjenjivati
Use already / već primjenjuje
Row
Cou
nt T
otal
s
100 50 0 50
Precent / postotak
46
46
46
46
46
46
46
46
................... Kropivšek, Grošelj: Digital Development of Slovenian Wood Industry
DRVNA INDUSTRIJA 71 (2) 139-148 (2020) 147
expected, for smaller companies the amount of any in-vestment and high maintenance costs are far more im-portant than for larger ones, but, on the other hand, it is surprising that practically all challenges related to peo-ple (resistance to change, lack of competencies, etc.) are seen as less problematic. There were no signifi cant dif-ferences in this regard among companies of different sizes. One of the major challenges is the lack of digital competencies among older workers, which was espe-cially highlighted in the interviews. This, as well as an awareness that new knowledge and digital competencies will be necessary for the further development of compa-nies, led the surveyed companies to see as very impor-tant an increase in digital competencies of employees in the strategic plans of companies for their investments in the next three years. This is especially true for medium-sized and large companies, which have a greater propor-tion of older employees, and these are more aware of the importance of digitalization to business success. While implementing the concept of Industry 4.0, the surveyed companies ranked as the most important the following digital competencies (from the DigComp model (Car-retero Gomez et al., 2017)): information literacy, under-standing and ensuring digital security, and communica-tion/collaboration using modern ICT. These fi ndings are in line with the fundamental guidelines for the develop-ment of an information society in Europe (European Commission, 2016).
For the surveyed companies, investing in mod-ern, digital technology and developing digitalized business models, in addition to raising digital compe-tencies, represent the most important activities in their strategic investment plans. In the context of investing in ICT, companies evaluate as the most important in-vesting in cloud computing and conversation plat-forms, smart app and smart things development, as they are seen as already infl uencing, or soon will infl u-ence, the operation of the companies in the near future. In particular, this refers to investing in smart things (IoT), which does not yet have a major impact on the operations of the surveyed companies but is becoming increasingly important globally. Companies expect the IoT to have a major impact on their business perfor-mance in the future, notably the development of smart products and the implementation of (more) elements of a smart factory into their operations. We found that only about a third of the surveyed companies are cur-rently engaged in the development and manufacture of smart products, which is rather low considering their importance. The more digitalized companies are mak-ing smart products more often, but the correlation is insignifi cant. We also looked at the implementation of smart factory elements, which are applied (on average) in less than 15 % of the surveyed companies. Within the elements of smart factories, advanced materials and sensor technologies stand out in particular. Among other elements of the factory of the future, only intel-ligent management systems are used by more than 10 % of companies. Advanced materials, intelligent guid-ance systems, and smart mechatronic tools are also ele-ments that are planned to be used by a large number of
surveyed companies over the next three years, but are not currently in use.
As part of the Smart Specialization Strategy pro-jects that have been ongoing in Slovenia and Europe since 2015 (STA, 2015), companies see the greatest po-tential in creating international connections and globali-zation, followed by improving (digital) competencies, developing new (smart) materials and products, and en-couraging investment in technology, including digital infrastructure. In all these elements, companies see great potential. Considering the number of projects carried out under the Smart Specialization Strategy of Slovenia and strategic research and innovation partnerships (SRIP) (Republic of Slovenia, 2019), within which many wood industry companies are active members, most of such potential has already been realized, or is still in the pro-cess of becoming so. One of the most successful priority areas and partnerships within this strategy is the “smart building and home with timber chain”, where compa-nies have developed many new systems, materials, and products; progress has also been made in the fi eld of wood science (SRIP, 2019).
5 CONCLUSION5. ZAKLJUČAK
The results of this study show that digitalization in the Slovenian wood industry is still at a relatively low level, but there are signifi cant differences between com-panies. The size of a company is a factor that greatly in-fl uences the degree of digitalization, and the related fi rm plans for the near future. Awareness of the importance of digitalization and past experience of digitalization appear to be the most important reasons for further development of such technology and approaches within a company. It is also of particular importance to provide a digital infra-structure and implement the modern elements of a smart factory, develop smart products and raise employees’ digital competencies. The latter is extremely important in terms of the effi cient use of modern technologies and fur-ther development of companies in this fi eld. For further development, the preparation of a digital strategy is a key document at both the national level (Republic of Slove-nia, 2016) and at the level of companies, where the as-sistance of the state is very important. To this end, in 2019, companies are eligible to (co)-fi nance the prepara-tion of digital strategies through vouchers (Digital Inno-vation Hub Slovenia, 2019), which eliminates one of the major obstacles that companies have highlighted in the research. With a clearly outlined strategy and its imple-mentation, the situation with regard to the digitalization of wood-industry companies will also improve. In further research, it would be highly welcome to investigate in more detail the preparation of digital strategies in wood companies, and above all to compare their implementa-tion with companies in other sectors.
Acknowledgements – ZahvalaThe authors acknowledge the fi nancial support
from the Slovenian Research Agency (research core funding No. P4-0015 and P4-0059).
Kropivšek, Grošelj: Digital Development of Slovenian Wood Industry ...................
148 DRVNA INDUSTRIJA 71 (2) 139-148 (2020)
6 REFERENCES6. LITERATURA
1. Carretero Gomez, S.; Vuorikari, R.; Punie, Y., 2017: Dig-Comp 2.1: The Digital Competence Framework for Citi-zens with eight profi ciency levels and examples of use. Publications Offi ce of the European Union. DOI: http://dx.doi.org/10.2760/38842.
2. Cotteleer, M.; Sniderman, B., 2017: Forces of change: Industry 4.0. Deloitte Insights.
https://www2.deloitte.com/insights/us/en/focus/indus-try-4-0/overview.html?nc=1#what is-industry-4 [25.6.2019)].
3. Herakovič, N., 2016: Nekateri tehnološki izzivi Indus-trije 4.0. Ventil, 22 (1): 10-16.
4. Hozdić, E., 2015: Smart factory for industry 4.0: A re-view. International Journal of Modern Manufacturing Technologies, 7 (1): 31.
5. Keidanren, 2016: Toward realization of the new econo-my and society. http://www.keidanren.or.jp/en/poli-cy/2016/029_outline.pdf. [20.9.2019].
6. Kmet Zupančič, R., 2019: Development Report 2019. The Institute of Macroeconomic Analysis and Development of the Republic of Slovenia IMAD, Ljubljana. http://www.umar.gov.si/en/slovenias-development/ [10.10.2019].
7. Kropivšek, J.; Milavec, I.; Likar, B., 2017: Analiza po-slovanja slovenske lesne panoge. Les/Wood, 66 (2): 47-56. https://doi.org/10.26614/les-wood.2017.v66n02a05.
8. Kropivšek, J., 2018: Konceptualni model digitalizacije izobraževanja: Primer visokošolskega izobraževanja v lesarstvu v Sloveniji. Les/Wood, 67 (2): 63-74.
https://doi.org/10.26614/les-wood.2018.v67n02a06. 9. Kropivšek, J.; Perić, I.; Pirc Barčić, A.; Grošelj, P.; Mo-
tik, D.; Jošt, M., 2019: A Comparative Evaluation of Op-erational Effi ciency of Wood Industry Using Data Envel-opment Analysis and Malmquist Productivity Index: the Cases of Slovenia and Croatia. Drvna industrija, 70 (3): 287-298. https://doi.org/10.5552/drvind.2019.1937.
10. Lasi, H.; Fettke, P.; Kemper, H. G.; Feld, T.; Hoffmann, M., 2014: Industry 4.0. Business & Information Systems Engineering, 6: 239-242.
https://doi.org/10.1007/s12599-014-0334-4. 11. Lee, D., 2019: Ikea is introducing robotic furniture for
people who live in small spaces. https://www.theverge.com/2019/6/4/18652178/ikea-rog-
nan-robot-murphy-bed-furniture-ori-living-democratic-design-days [5. 8. 2019].
12. Movrin, P., 2017: Pametna tovarna na ključ za globalni trg. glas gospodarstva, november 2017, p. 45.
13. Panetta, K., 2018: Gartner Top 10 Strategic Technology Trends for 2019. Gartner. https://www.gartner.com/smar-terwithgartner/gartner-top-10-strategic-technology--trends-for-2019/ [21.9.2019].
14. Paluš, H.; Parobek, J.; Liker, B., 2015: Trade Perfor-mance and Competitiveness of the Slovak Wood Pro-cessing Industry within the Visegrad Group Countries. Drvna industrija, 66 (3): 195-203.
https://doi.org/10.5552/drind.2015.1431.15. Paluš, H.; Parobek, J.; Dzian, M.; Šimo-Svrček, S.; Kra-
hulcová, M., 2019: How companies in the wood supply chain perceive the forest certifi cation. Acta Facultatis Xylologiae Zvolen, 61(1): 155-165.
https://doi.org/10.17423/afx.2019.61.1.15.16. Robbins, N. B.; Heiberger, R. M., 2011: Plotting Likert
and other rating scales. In: Proceedings of the 2011 Joint Statistical Meeting, pp. 1058-1066.
17. Schmidt, R., Möhring, M.; Härting, R.-C.; Reichstein, C.; Neumaier, P.; Jozinović, P., 2015: Industry 4.0 – Po-tentials for Creating Smart Products: Empirical Research results. Business Information Systems, 18th International Conference, BIS 2015, Poznań, Poland, pp. 16-27.
18. Zupan, G., 2018: Digitalni indeks slovenskih podjetij. Uporabna Informatika, 4: 11. https://uporabna-informati-ka.si/index.php/ui/article/view/5. [20.9.2019].
19. Xu, L. D., He, W.; Li, S., 2014: Internet of Things in In-dustries: A Survey. IEEE Transactions on Industrial In-formatics, 10/4: pp. 2233-2243.
20. Xu, L. D.; Xu, E.; Li, L., 2018: Industry 4.0: state of the art and future trends. International Journal of Production Research, 56 (8): 1-22.
21. *** 1ka, 2019: Integrated support for survey process. https://www.1ka.si/d/sl [26.3.2019].
22. *** Alples, 2016: Alples partner v projektu “Akustično pametno pohištvo”. https://www.alples.si/sl/stories/rc31-partner-v-projektu-pametno-akusticno-pohistvo/ [27.7.2019].
23. *** Commission of the European Communities, 2019: Key Enabling Technologies. https://ec.europa.eu/growth/industry/policy/key-enabling-technologies_en [20.9.2019.
24. *** Digital innovation hub Slovenia, 2019: Digitalna strategija. https://dihslovenia.si/smernice/digitalne-strate-gije/ [10.10.2019].
25. *** European Commission, 2016: The European Union ex-plained: A digital single market in Europe - Bringing down barriers to unlock online opportunities. https://publications.europa.eu/en/publication-detail/-/publication/01368318-4e3d-11e6-89bd-01aa75ed71a1/language-en [20.9.2019].
26. *** European Commission, 2018: Smart specialization platform. http://s3platform.jrc.ec.europa.eu/ [20.9.2019].
27. *** European Commission, 2019: The Digital Economy and Society Index (DESI). URL: https://ec.europa.eu/digital-single-market/en/desi [23.9. 2019].
28. *** Republic of Slovenia, 2016: Digitalna Slovenija 2020 – Strategija razvoja informacijske družbe do leta 2020. https://www.gov.si/assets/ministrstva/MJU/DI/7df0f756bc/Strategija-razvoja-ID.pdf [10.10.2019].
29. *** Republic of Slovenia, 2019: Izvajanje Slovenske strategije pametne specializacije. https://www.gov.si/zbirke/projekti-in-programi/izvajanje-slovenske-strate-gije-pametne-specializacije/ [10.9.2019].
30. *** SRIP, 2019: Pametne stavbe in dom z lesno verigo. https://www.teces.si/sl/srip-psidl/fokusna-podrocja-srip#Les [12.10.2019].
31. ***STA, 2015: Smart Specialisation Strategy Adopted. http://www.sloveniatimes.com/smart-specialisation-strategy-adopted [15.10.2019].
32. *** Statistical Offi ce, Republic of Slovenia, 2018: The rate of digitization of enterprises with at least 10 persons employed in 2018. https://www.stat.si/StatWeb/en/News/Index/7812 [14.10.2019].
Corresponding address:
Assist. Prof. JOŽE KROPIVŠEK, PhD
University of Ljubljana, Biotechnical FacultyDepartment of Wood Science and Technology Ljubljana, SLOVENIA e-mail: [email protected]
..... Jošt, Kaputa, Nosáľová, Pirc Barčić, Perić, Oblak:Changes in Customer Preferences...
DRVNA INDUSTRIJA 71 (2) 149-156 (2020) 149
Matej Jošt1, Vladislav Kaputa2, Martina Nosáľová2, Andreja Pirc Barčić3, Ivana Perić3, Leon Oblak1
Changes in Customer Preferences for Furniture in SloveniaPromjene sklonosti kupaca namještaja u Sloveniji
Original scientifi c paper • Izvorni znanstveni radReceived – prispjelo: 20. 10. 2019.Accepted – prihvaćeno: 28. 4. 2020.UDK: 630*72https://d oi.org/10.5552/drvind.2020.1967
ABSTRACT • In the last decade, the Slovenian furniture industry market has experienced a number of changes, especially with the arrival of new retailers on the market. The situation is such that furniture manufacturers and retailers are still trying to determine the best ways to adjust to new customer demands. A well known thing is that customer satisfaction is the key component for the success of the business. In order for companies to be more suc-cessful, it is important to get better insight into customers’needs and wants. In line with this, the purpose of this study, which compare the surveys conducted in 2010 and 2019, was to observe and analyse changes in the pref-erences of customers for furniture: materials, attributes, and styles when deciding on new furniture in Slovenia. The results of this research showed that customers’ preferences for furniture materials have changed in the last decade. Similarly, the factors that infl uence their purchase decisions when buying interior and exterior furniture have changed as well. It was found that wood was widely preferred as a furniture material among the respondents in both years studied.
Keywords: wooden furniture; customer preferences; survey; Slovenian market
SAŽETAK • U posljednjem desetljeću slovensko je tržište namještaja doživjelo mnoge promjene, posebice ula-skom stranih trgovaca. Stoga proizvođači namještaja i trgovci i dalje pokušavaju odrediti najbolje načine prila-godbe novim zahtjevima kupaca. Općenito je poznato da je zadovoljstvo kupaca ključna komponenta za uspjeh poslovanja. Kako bi tvrtke bile uspješne, važno je imati što bolji uvid u potrebe i želje kupaca. U skladu s tim, cilj ovog istraživanja, koje uspoređuju ankete provedene 2010. i 2019., bila je usporedba i analiza promjena sklonosti kupaca pri odabiru i kupnji namještaja, i to u smislu materijala, svojstava i stila. Rezultati provedenog istraživanja pokazali su da su se sklonosti ispitanika u odabiru materijala namještaja u posljednjem desetljeću promijenile. Osim toga, promijenili su se i činitelji koji utječu na njihove odluke pri kupnji namještaja za vanjsku ili unutarnju upotrebu. Ispitivanja su pokazala da je drvo 2010. bio vrlo poželjan materijal za izradu namještaj, a to je i danas.
Ključne riječi: namještaj od drva; sklonosti kupaca; anketa; slovensko tržište
1 Authors are senior assistant professors at University of Ljubljana, Biotechnical Faculty, Department of Wood Science and Technology, Lju-bljana, Republic of Slovenia.
2 Authors are assistant professors at Technical University in Zvolen, Faculty of Wood Sciences and Technology, Department of Marketing, Trade and World Forestry, Zvolen, Republic of Slovakia.
3 Authors are assistant professor and postdoctoral researcher at University of Zagreb, Faculty of Forestry, Wood Technology Department, Za-greb, Republic of Croatia.
© 2020 by the author(s).Licensee Faculty of Forestry, University of Zagreb.
This article is an open access article distributedunder the terms and conditions of the
Creative Commons Attribution (CC BY 4.0) license.
Jošt, Kaputa, Nosáľová, Pirc Barčić, Perić, Oblak:Changes in Customer Preferences... .....
150 DRVNA INDUSTRIJA 71 (2) 149-156 (2020)
buying furniture. They found that, roughly 50 % of con-sumers’ product choice is driven by price, 20 % by prod-uct customisation, 20 % by delivery time, and 10 % by the time needed to customise the product. Ponder (2013) compared and determined the extent to which attitudes and behaviour towards home furniture have changed over a fi ve-year period. In Finland, Pakarinen and Asi-kainen (2001) examined the use of wood as a material for furniture, aiming to highlight the important attributes that consumers consider when selecting a piece of furni-ture. Based on their results, quality and design were ranked as the most important attributes. Troian (2011) defi ned the factors that infl uence consumers’ choice of a product and analysed the furniture preferences in Italy and in different cultural environments. She concluded that, despite the fact of high-speed globalization, con-sumers from different geographical zones do vary their behaviour in the different cultural contexts. This could create a barrier to rapid entry in foreign markets. Thus, furniture manufacturers have to deal with a deeper un-derstanding of local cultures and their infl uence upon purchase behaviour.
Other studies have measured consumer attitudes towards eco-labelled forest products (Forsyth et al., 1999; Ozanne and Smith, 1996; Ozanne and Vlosky, 1997; Vlosky et al., 1999). Generally, these studies found that consumers hold favourable attitudes to cer-tifi ed products, and would like to purchase them. They are willing to pay more and they prefer certifi ed to un-certifi ed forest products. However, for most respond-ents, product attributes other than eco-labelling are more important when forming preferences (for exam-ple, price). Research done by Teisl (2003) found that consumer demand and willingness to pay for certifi ed products are contingent on the information provided on an ecolabel. Consumers prefer ecolabels with detailed information about the environmental benefi ts associat-ed with eco-labelled products.
The issue of the consumer preferences for furni-ture was also the subject of several studies in Slovakia and Croatia (Kaputa and Supin, 2010; Kaputa, 2013; Kaputa et al., 2018). In addition, several authors (Oblak and Jost, 2011; Palus et al., 2014; Palus and Mat’ova, 2009) have dealt with the awareness of end-users about the labels used by forest certifi cation schemes, which allow to track the origin of wood. Sev-eral conclusions can be drawn from these earlier stud-ies: the most relevant purchase decision factors are quality, price and design of furniture. The most pre-ferred is modern style furniture. The decision to buy a certain piece of furniture most frequently arises in a store, followed by when using a catalogue or the inter-net, and is mostly based on a compromise between the man and woman in a household (Kaputa and Supin, 2010). Over 40 % of respondents are aware of the ex-istence of labelled products, either spontaneously or when prompted, but only 5 % of them understand the exact or approximate meaning of the labels. Most of consumers, who are aware of labels and also read them, are between the ages of 41-60 and represent either mid-dle or higher income classes (Palus et al., 2014).
1 INTRODUCTION1. UVOD
The benefi ts derived from wood are the key fac-tors in the competition between wood and non-wood products. A wood product is composed of various at-tributes, and the consumers’ choice is guided by their quality. With regard to the product, the main challenge is to get consumers’ attention, catch their preferences and buying habits. The aim of this study was thus to better understand consumer preferences and buying habits with regard to furniture and to observe the changes in the preferences of Slovenian costumers.
An important body of literature focuses on con-sumer preferences in furniture markets and the competi-tion between wood and non-wood products. The typical characteristics consumers assign to wood materials have been studied by several researchers (Pakarinen and Asi-kainen, 2001; Bowe and Bumgardner, 2004; Scholz and Decker, 2007; Kaputa et al., 2018). Attempts have also been made to map how the properties of wood are re-lated to preferences (Nyrud et al., 2008). The effects of background and profession on preferences have also been investigated (Marchal and Mothe, 1994; Roos and Nyrud, 2008). However, a study of how wood as a mate-rial is perceived and characterised in relation to alterna-tive wood-based materials, such as panels and wood-based composites, remains to be conducted. Jonsson et al. (2008) identifi ed the attributes and associations that people use to describe different types of wood materials, and explored how they relate to preferences.
The wood used for furniture production has a strong impact on consumer’s preferences for the prod-uct as a whole. Costa et al. (2011) confi rmed that the quality levels of wood product attributes are endoge-nous variables, and depend on the level of information a consumer has in the buying decision process. Ac-cording to Scholz and Decker (2007), the wood species used in manufacturing not only affects the material ap-pearance, but also the preferences for seemingly unre-lated attributes, like style and design. An Sheng Lee (2010) found that the features of furniture product de-signs and consumer satisfaction have positive correla-tions in a Taiwanese sample. The feature of functional design mostly infl uences consumers’ satisfaction when making decisions to buy furniture products. Bumgard-ner et al. (2007) evaluated consumer preferences for six domestic wood species. Similar research by Nich-ols and Bumgardner (2007) evaluated how age, gender and income infl uence consumer preferences for the species used in household furniture products, and they found that age and income were statistically signifi cant in this context (with a stronger effect of age), while gender was not signifi cant.
Numerous studies have measured consumer atti-tudes toward wooden furniture. Buehlmann and Shuler (2009) analysed the development and opportunities in the US furniture market. Later on, Buehlmann cooper-ated with Lihra and Graf (2012) and they measured, via a choice-based conjoint analysis, the value that US con-sumers assign to the availability of customisation when
..... Jošt, Kaputa, Nosáľová, Pirc Barčić, Perić, Oblak:Changes in Customer Preferences...
DRVNA INDUSTRIJA 71 (2) 149-156 (2020) 151
The null hypothesis was stated to test the statisti-cal signifi cance of differences in preferences between the two surveys (at a 95 % confi dence interval). A non-parametric Mann-Whitney U test for two independent samples was employed, since the test of normality re-vealed that the data were not normally distributed.
3 RESULTS AND DISCUSSION3. REZULTATI I RASPRAVA
3.1 Demographic analyses of samples3.1. Demografska analiza uzoraka
First, the signifi cance of differences between the samples of the two surveyed years was analysed. There are no statistically signifi cant differences in frequen-cies (Pearson’s chi-square test at α = 0.05 signifi cance level) between the respondents from the two years in terms of gender. On other hand, there are signifi cant differences between the samples of respondents re-garding the frequencies of achieved education (χ2 = 58.670; p < 0.05) as well as between the frequencies of the compared age categories (χ2 = 25.613; p < 0.05). Both samples contain a high share of respondents of a young age – between 18 and 30 years old (over 40 % in 2010 and over 33 % in 2019). In 2019, the sample was composed of respondents with a higher share of older age categories and with a higher level of education, where fewer had fi nished high school and more com-pleted bachelor’s and postgraduate degrees.
3.2 Consumer preferences regarding furniture material
3.2. Sklonosti kupaca u smislu odabira materijala za namještaj
As shown in T able 1, the consumer preferences regarding the material for interior furniture did not change in the scope of the observed years, except for furniture made of plastic. On the other hand, compared preferences for exterior furniture were only similar in case of furniture made of glass. All the other prefer-ences for the exterior furniture material were signifi -cantly different at α = 0.05 signifi cance level between the observed years.
The marginal answers are clear from Figure 1, which introduces especially high shares of the ‘defi -nitely’ positive attitudes towards interior furniture made of solid wood (reaching almost 60 % of respond-ents in both years) and high shares of the ‘defi nitely’ negative attitudes towards interior furniture made of plastic (ranging from around 33 % in 2010 up to 46 % in 2019).
Overall, the most preferred material for interior furniture was solid wood, as stated by 74 % of the re-spondents in 2010 and 81 % in 2019 (Figure 1). The second option is wood composite, followed by a com-bination of materials, glass, metal and fi nally plastic. The biggest fall in preferences (and statistically signifi -cant: Mann-Whitney U = 15424.0, p = 0.001) between 2010 and 2019 was observed in case of plastic. This fact could be related to an anti-plastic cam paign in the EU and worldwide (Barrett, 2019).
2 MATERIALS AND METHODS2. MATERIJALI I METODE
The questionnaire was developed based on previ-ous research results and using the existing literature. The fi rst survey, held in November 2010, was imple-mented during the furniture fair Ambient in Ljubljana. There were 300 surveyed respondents and the results have not been published. The second survey was done in April 2019 using a web platform (www.1ka.si). There were 128 valid fi lled-in questionnaires, out of 218 clicks on the page where the survey was published. A link to the electronic version of the questionnaire was distributed by students and researchers using so-cial networks and e-mail addresses. Thus, a non-prob-ability snowball sampling method was used to spread the questionnaire. Nonprobability sampling, used to cover as many respondents as possible, could also be called purposive sampling, as Dillon et al. (1990) stat-ed, because certain segments of the target population were intentionally overrepresented in the sample (such as age categories – any respondents under 18 years old).
The questionnaire consisted of two parts, where the fi rst part dealt with demographic characteristics such as gender, achieved education level (primary school, high school, and university), and the age cate-gories.
The questions in the second part were concerned with a decision-making process when purchasing fur-niture, and specifi c consumer preferences for:- material: solid wood, wood composites, plastic, met-
al, glass, and combination of materials (requested for both – interior and exterior furniture)
- furniture attributes (price, manufacturing quality, de-sign, environmental attributes, country of origin, war-ranty, colour, brand, and safety), and
- furniture styles (rustic, modern, futuristic, and retro). The respondents answered using a Likert-type
scale, based on the observation in Churchill (1979) that no single item is likely to provide a perfect representa-tion of the general idea. The scales revealed the level of agreement with various statements: 1 (defi nitely no), 2 (somewhat no), 3 (neither yes nor no/indifferent), 4 (somewhat yes), and 5 (defi nitely yes). For interpreta-tion purposes of the frequency analysis results, we combined the answers “Defi nitely Yes” and “Some-what Yes” into one indicating a positive attitude to-wards a certain kind of material. The same approach was applied in case of the answers “Defi nite ly No” and “Somewhat No”, which indicated a negative attitude. The indifferent attitude stayed as it was.
The statistical software SPSS PASW Statistics 18 and STATISTICA 12 for MS Windows were used for the data analyses, as well as Microsoft Excel. First, fre-quency analysis and cross-tabulation were used to de-termine the basic relationships among the answers. Pearson’s chi-squared test of independence (at an α = 0.05 signifi cance level) was used to assess the signifi -cance of the frequency differences among the demo-graphic characteristics.
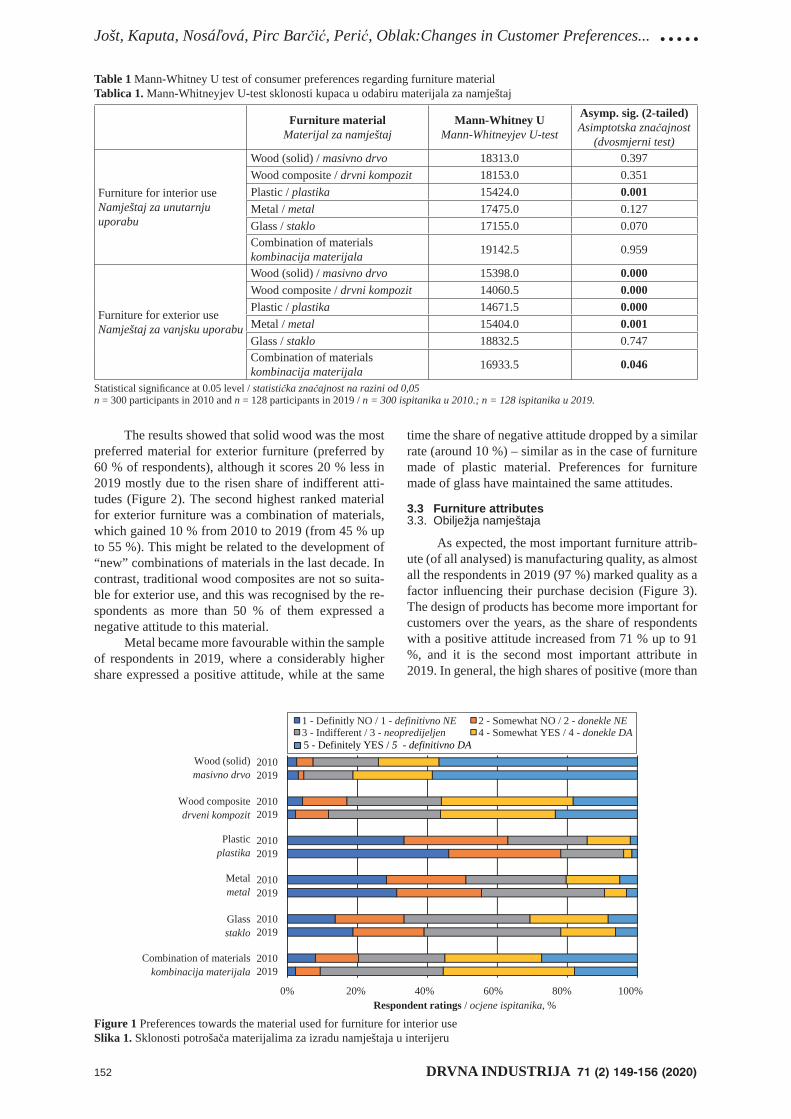
Jošt, Kaputa, Nosáľová, Pirc Barčić, Perić, Oblak:Changes in Customer Preferences... .....
152 DRVNA INDUSTRIJA 71 (2) 149-156 (2020)
The results showed that solid wood was the most preferred material for exterior furniture (preferred by 60 % of respondents), although it scores 20 % less in 2019 mostly due to the risen share of indifferent atti-tudes (Figure 2). The second highest ranked material for exterior furniture was a combination of materials, which gained 10 % from 2010 to 2019 (from 45 % up to 55 %). This might be related to the development of “new” combinations of materials in the last decade. In contrast, traditional wood composites are not so suita-ble for exterior use, and this was recognised by the re-spondents as more than 50 % of them expressed a negative attitude to this material.
Metal became more favourable within the sample of respondents in 2019, where a considerably higher share expressed a positive attitude, while at the same
time the share of negative attitude dropped by a similar rate (around 10 %) – similar as in the case of furniture made of plastic material. Preferences for furniture made of glass have maintained the same attitudes.
3.3 Furniture attributes3.3. Obilježja namještaja
As expected, the most important furniture attrib-ute (of all analysed) is manufacturing quality, as almost all the respondents in 2019 (97 %) marked quality as a factor infl uencing their purchase decision (Figure 3). The design of products has become more important for customers over the years, as the share of respondents with a positive attitude increased from 71 % up to 91 %, and it is the second most important attribute in 2019. In general, the high shares of positive (more than
Table 1 Mann-Whitney U test of consumer preferences regarding furniture materialTablica 1. Mann-Whitneyjev U-test sklonosti kupaca u odabiru materijala za namještaj
Furniture materialMaterijal za namještaj
Mann-Whitney UMann-Whitneyjev U-test
Asymp. sig. (2-tailed)Asimptotska značajnost
(dvosmjerni test)
Furniture for interior useNamještaj za unutarnju uporabu
Wood (solid) / masivno drvo 18313.0 0.397Wood composite / drvni kompozit 18153.0 0.351Plastic / plastika 15424.0 0.001Metal / metal 17475.0 0.127Glass / staklo 17155.0 0.070Combination of materialskombinacija materijala 19142.5 0.959
Furniture for exterior useNamještaj za vanjsku uporabu
Wood (solid) / masivno drvo 15398.0 0.000Wood composite / drvni kompozit 14060.5 0.000Plastic / plastika 14671.5 0.000Metal / metal 15404.0 0.001Glass / staklo 18832.5 0.747Combination of materialskombinacija materijala 16933.5 0.046
Statistical signifi cance at 0.05 level / statistička značajnost na razini od 0,05n = 300 participants in 2010 and n = 128 participants in 2019 / n = 300 ispitanika u 2010.; n = 128 ispitanika u 2019.
0% 20% 40% 60% 80% 100%
20192010
20192010
20192010
20192010
20192010
20192010
Respondent ratings / ocjene ispitanika, %
1 - Definitly NO / 1 - definitivno NE 2 - Somewhat NO / 2 - donekle NE3 - Indifferent / 3 - neopredijeljen 4 - Somewhat YES / 4 - donekle DA
Wood (solid)masivno drvo
Wood compositedrveni kompozit
Plasticplastika
Metalmetal
Glassstaklo
Combination of materialskombinacija materijala
5 - Definitely YES / 5 - definitivno DA
Figure 1 Preferences towards the material used for furniture for interior useSlika 1. Sklonosti potrošača materijalima za izradu namještaja u interijeru
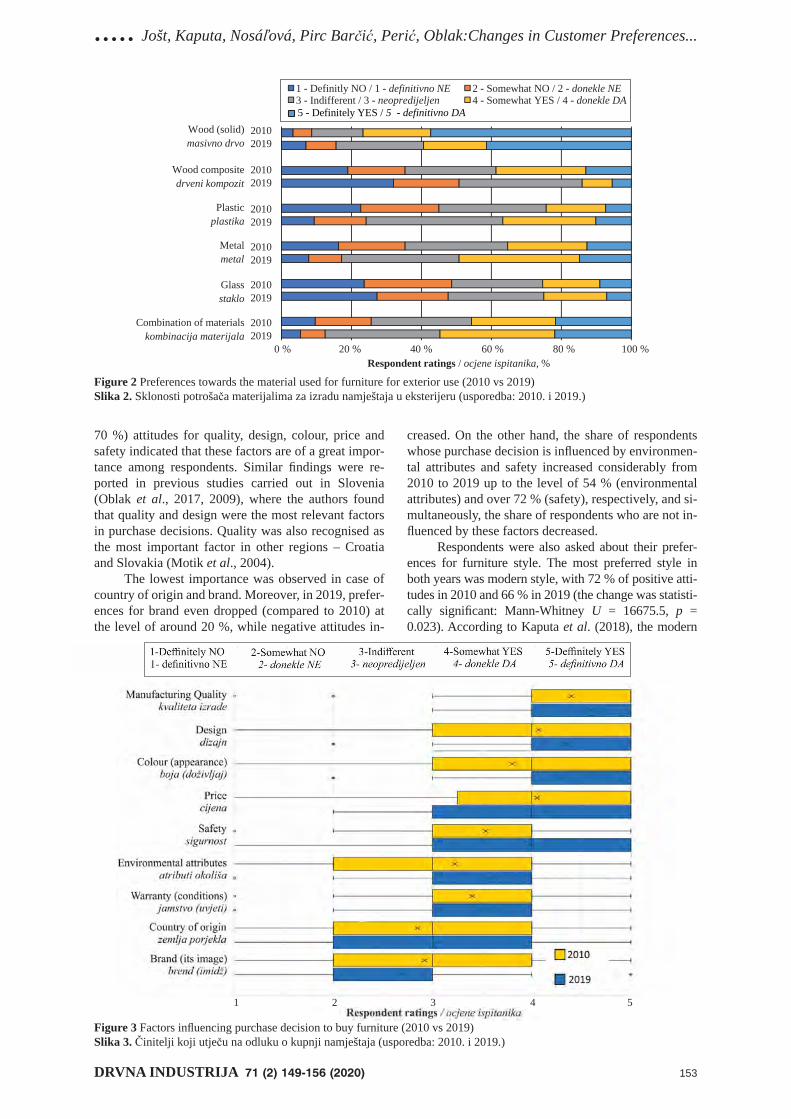
..... Jošt, Kaputa, Nosáľová, Pirc Barčić, Perić, Oblak:Changes in Customer Preferences...
DRVNA INDUSTRIJA 71 (2) 149-156 (2020) 153
70 %) attitudes for quality, design, colour, price and safety indicated that these factors are of a great impor-tance among respondents. Similar fi ndings were re-ported in previous studies carried out in Slovenia (Oblak et al., 2017, 2009), where the authors found that quality and design were the most relevant factors in purchase decisions. Quality was also recognised as the most important factor in other regions – Croatia and Slovakia (Motik et al., 2004).
The lowest importance was observed in case of country of origin and brand. Moreover, in 2019, prefer-ences for brand even dropped (compared to 2010) at the level of around 20 %, while negative attitudes in-
creased. On the other hand, the share of respondents whose purchase decision is infl uenced by environmen-tal attributes and safety increased considerably from 2010 to 2019 up to the level of 54 % (environmental attributes) and over 72 % (safety), respectively, and si-multaneously, the share of respondents who are not in-fl uenced by these factors decreased.
Respondents were also asked about their prefer-ences for furniture style. The most preferred style in both years was modern style, with 72 % of positive atti-tudes in 2010 and 66 % in 2019 (the change was statisti-cally signifi cant: Mann-Whitney U = 16675.5, p = 0.023). According to Kaputa et al. (2018), the modern
0 % 20 % 40 % 60 % 80 % 100 %20192010
20192010
20192010
20192010
20192010
20192010
Respondent ratings / ocjene ispitanika, %
Wood (solid)masivno drvo
Wood compositedrveni kompozit
Plasticplastika
Metalmetal
Glassstaklo
Combination of materialskombinacija materijala
1 - Definitly NO / 1 - definitivno NE 2 - Somewhat NO / 2 - donekle NE3 - Indifferent / 3 - neopredijeljen 4 - Somewhat YES / 4 - donekle DA5 - Definitely YES / 5 - definitivno DA
Figure 2 Preferences towards the material used for furniture for exterior use (2010 vs 2019)Slika 2. Sklonosti potrošača materijalima za izradu namještaja u eksterijeru (usporedba: 2010. i 2019.)
Figure 3 Factors infl uencing purchase decision to buy furniture (2010 vs 2019)Slika 3. Činitelji koji utječu na odluku o kupnji namještaja (usporedba: 2010. i 2019.)
1 2 3 4 5
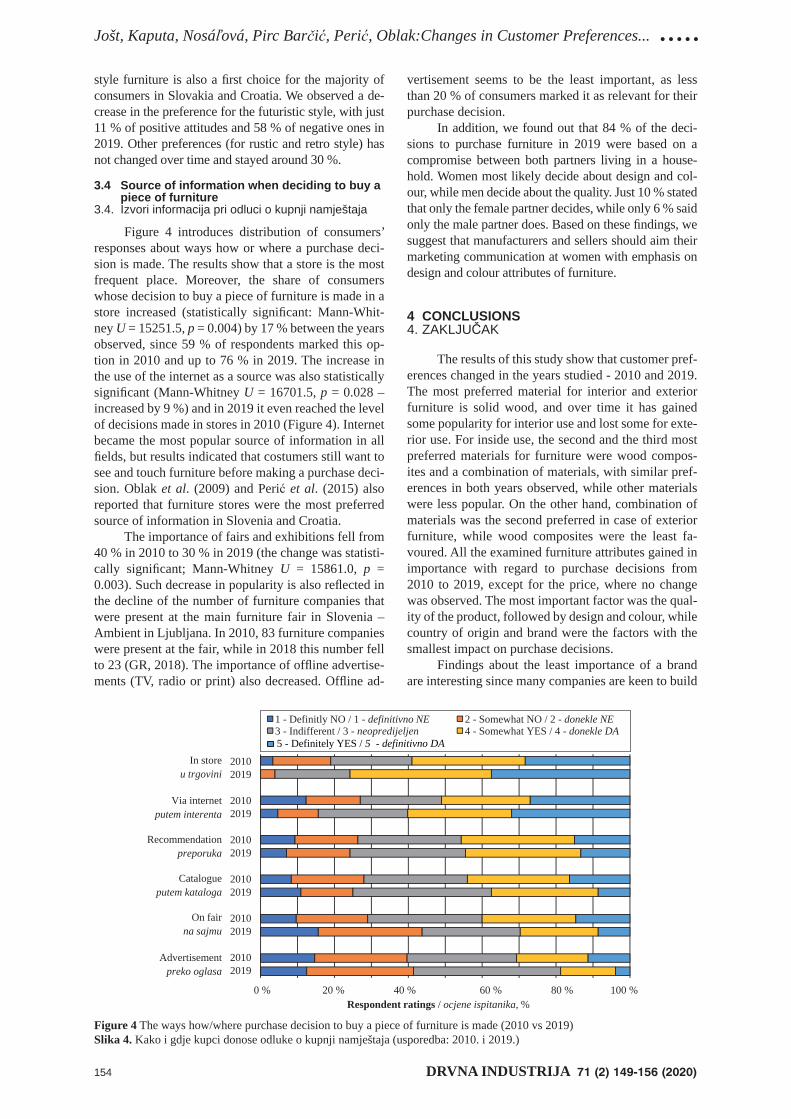
Jošt, Kaputa, Nosáľová, Pirc Barčić, Perić, Oblak:Changes in Customer Preferences... .....
154 DRVNA INDUSTRIJA 71 (2) 149-156 (2020)
0 % 20 % 40 % 60 % 80 % 100 %
20192010
20192010
20192010
20192010
20192010
20192010
Respondent ratings / ocjene ispitanika, %
In storeu trgovini
Via internetputem interenta
Recommendationpreporuka
Catalogueputem kataloga
On fairna sajmu
Advertisementpreko oglasa
1 - Definitly NO / 1 - definitivno NE 2 - Somewhat NO / 2 - donekle NE3 - Indifferent / 3 - neopredijeljen 4 - Somewhat YES / 4 - donekle DA5 - Definitely YES / 5 - definitivno DA
style furniture is also a fi rst choice for the majority of consumers in Slovakia and Croatia. We observed a de-crease in the preference for the futuristic style, with just 11 % of positive attitudes and 58 % of negative ones in 2019. Other preferences (for rustic and retro style) has not changed over time and stayed around 30 %.
3.4 Source of information when deciding to buy a piece of furniture
3.4. Izvori informacija pri odluci o kupnji namještaja
Figure 4 introduces distribution of consumers’ responses about ways how or where a purchase deci-sion is made. The results show that a store is the most frequent place. Moreover, the share of consumers whose decision to buy a piece of furniture is made in a store increased (statistically signifi cant: Mann-Whit-ney U = 15251.5, p = 0.004) by 17 % between the years observed, since 59 % of respondents marked this op-tion in 2010 and up to 76 % in 2019. The increase in the use of the internet as a source was also statistically signifi cant (Mann-Whitney U = 16701.5, p = 0.028 – increased by 9 %) and in 2019 it even reached the level of decisions made in stores in 2010 (Figure 4). Internet became the most popular source of information in all fi elds, but results indicated that costumers still want to see and touch furniture before making a purchase deci-sion. Oblak et al. (2009) and Perić et al. (2015) also reported that furniture stores were the most preferred source of information in Slovenia and Croatia.
The importance of fairs and exhibitions fell from 40 % in 2010 to 30 % in 2019 (the change was statisti-cally signifi cant; Mann-Whitney U = 15861.0, p = 0.003). Such decrease in popularity is also refl ected in the decline of the number of furniture companies that were present at the main furniture fair in Slovenia – Ambient in Ljubljana. In 2010, 83 furniture companies were present at the fair, while in 2018 this number fell to 23 (GR, 2018). The importance of offl ine advertise-ments (TV, radio or print) also decreased. Offl ine ad-
Figure 4 The ways how/where purchase decision to buy a piece of furniture is made (2010 vs 2019)Slika 4. Kako i gdje kupci donose odluke o kupnji namještaja (usporedba: 2010. i 2019.)
vertisement seems to be the least important, as less than 20 % of consumers marked it as relevant for their purchase decision.
In addition, we found out that 84 % of the deci-sions to purchase furniture in 2019 were based on a compromise between both partners living in a house-hold. Women most likely decide about design and col-our, while men decide about the quality. Just 10 % stated that only the female partner decides, while only 6 % said only the male partner does. Based on these fi ndings, we suggest that manufacturers and sellers should aim their marketing communication at women with emphasis on design and colour attributes of furniture.
4 CONCLUSIONS4. ZAKLJUČAK
The results of this study show that customer pref-erences changed in the years studied - 2010 and 2019. The most preferred material for interior and exterior furniture is solid wood, and over time it has gained some popularity for interior use and lost some for exte-rior use. For inside use, the second and the third most preferred materials for furniture were wood compos-ites and a combination of materials, with similar pref-erences in both years observed, while other materials were less popular. On the other hand, co mbination of materials was the second preferred in case of exterior furniture, while wood composites were the least fa-voured. All the examined furniture attributes gained in importance with regard to purchase decisions from 2010 to 2019, except for the price, where no change was observed. The most important factor was the qual-ity of the product, followed by design and colour, while country of origin and brand were the factors with the smallest impact on purchase decisions.
Findings about the least importance of a brand are interesting since many companies are keen to build
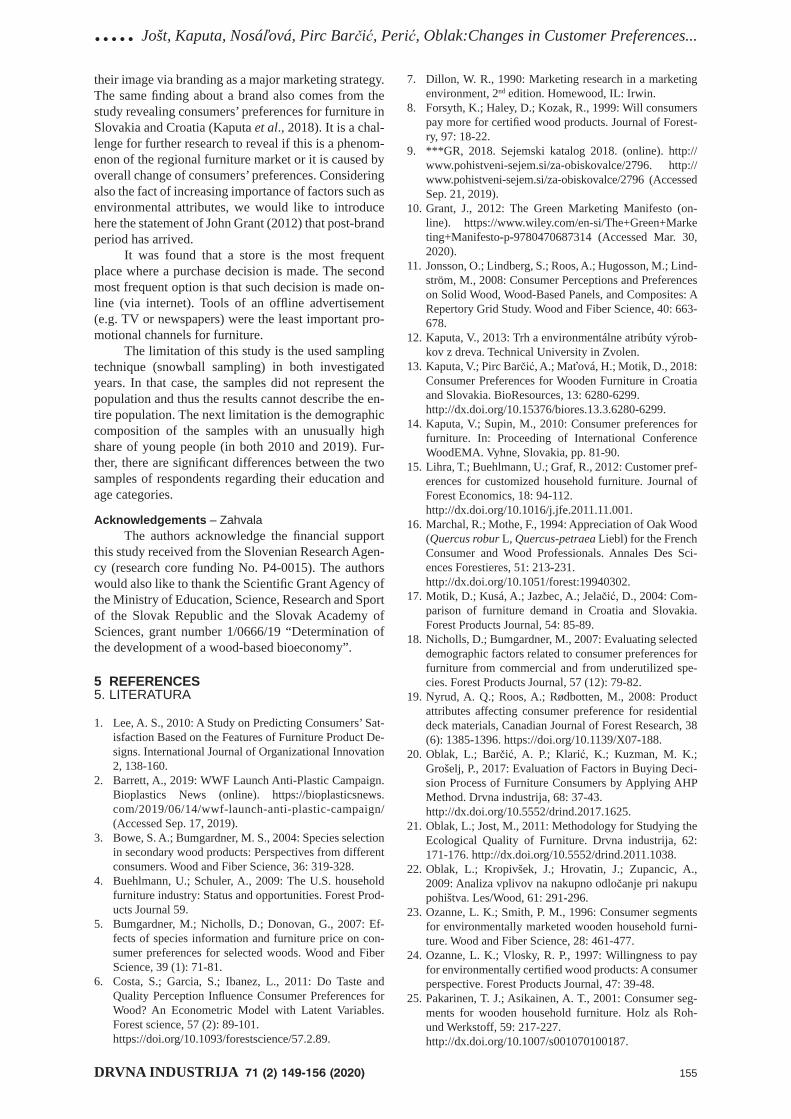
..... Jošt, Kaputa, Nosáľová, Pirc Barčić, Perić, Oblak:Changes in Customer Preferences...
DRVNA INDUSTRIJA 71 (2) 149-156 (2020) 155
their image via branding as a major marketing strategy. The same fi nding about a brand also comes from the study revealing consumers’ preferences for furniture in Slovakia and Croatia (Kaputa et al., 2018). It is a chal-lenge for further research to reveal if this is a phenom-enon of the regional furniture market or it is caused by overall change of consumers’ preferences. Considering also the fact of increasing importance of factors such as environmental attributes, we would like to introduce here the statement of John Grant (2012) that post-brand period has arrived.
It was found that a store is the most frequent place where a purchase decision is made. The second most frequent option is that such decision is made on-line (via internet). Tools of an offl ine advertisement (e.g. TV or newspapers) were the least important pro-motional channels for furniture.
The limitation of this study is the used sampling technique (snowball sampling) in both investigated years. In that case, the samples did not represent the population and thus the results cannot describe the en-tire population. The next limitation is the demographic composition of the samples with an unusually high share of young people (in both 2010 and 2019). Fur-ther, there are signifi cant differences between the two samples of respondents regarding their education and age categories.
Acknowledgements – ZahvalaThe authors acknowledge the fi nancial support
this study received from the Slovenian Research Agen-cy (research core funding No. P4-0015). The authors would also like to thank the Scientifi c Grant Agency of the Ministry of Education, Science, Research and Sport of the Slovak Republic and the Slovak Academy of Sciences, grant number 1/0666/19 “Determination of the development of a wood-based bioeconomy”.
5 REFERENCES5. LITERATURA
1. Lee, A. S., 2010: A Study on Predicting Consumers’ Sat-isfaction Based on the Features of Furniture Product De-signs. International Journal of Organizational Innovation 2, 138-160.
2. Barrett, A., 2019: WWF Launch Anti-Plastic Campaign. Bioplastics News (online). https://bioplasticsnews.com/2019/06/14/wwf-launch-anti-plastic-campaign/ (Accessed Sep. 17, 2019).
3. Bowe, S. A.; Bumgardner, M. S., 2004: Species selection in secondary wood products: Perspectives from different consumers. Wood and Fiber Science, 36: 319-328.
4. Buehlmann, U.; Schuler, A., 2009: The U.S. household furniture industry: Status and opportunities. Forest Prod-ucts Journal 59.
5. Bumgardner, M.; Nicholls, D.; Donovan, G., 2007: Ef-fects of species information and furniture price on con-sumer preferences for selected woods. Wood and Fiber Science, 39 (1): 71-81.
6. Costa, S.; Garcia, S.; Ibanez, L., 2011: Do Taste and Quality Perception Infl uence Consumer Preferences for Wood? An Econometric Model with Latent Variables. Forest science, 57 (2): 89-101.
https://doi.org/10.1093/forestscience/57.2.89.
7. Dillon, W. R., 1990: Marketing research in a marketing environment, 2nd edition. Homewood, IL: Irwin.
8. Forsyth, K.; Haley, D.; Kozak, R., 1999: Will consumers pay more for certifi ed wood products. Journal of Forest-ry, 97: 18-22.
9. ***GR, 2018. Sejemski katalog 2018. (online). http://www.pohistveni-sejem.si/za-obiskovalce/2796. http://www.pohistveni-sejem.si/za-obiskovalce/2796 (Accessed Sep. 21, 2019).
10. Grant, J., 2012: The Green Marketing Manifesto (on-line). https://www.wiley.com/en-si/The+Green+Marketing+Manifesto-p-9780470687314 (Accessed Mar. 30, 2020).
11. Jonsson, O.; Lindberg, S.; Roos, A.; Hugosson, M.; Lind-ström, M., 2008: Consumer Perceptions and Preferences on Solid Wood, Wood-Based Panels, and Composites: A Repertory Grid Study. Wood and Fiber Science, 40: 663-678.
12. Kaputa, V., 2013: Trh a environmentálne atribúty výrob-kov z dreva. Technical University in Zvolen.
13. Kaputa, V.; Pirc Barčić, A.; Maťová, H.; Motik, D., 2018: Consumer Preferences for Wooden Furniture in Croatia and Slovakia. BioResources, 13: 6280-6299.
http://dx.doi.org/10.15376/biores.13.3.6280-6299.14. Kaputa, V.; Supin, M., 2010: Consumer preferences for
furniture. In: Proceeding of International Conference WoodEMA. Vyhne, Slovakia, pp. 81-90.
15. Lihra, T.; Buehlmann, U.; Graf, R., 2012: Customer pref-erences for customized household furniture. Journal of Forest Economics, 18: 94-112.
http://dx.doi.org/10.1016/j.jfe.2011.11.001.16. Marchal, R.; Mothe, F., 1994: Appreciation of Oak Wood
(Quercus robur L, Quercus-petraea Liebl) for the French Consumer and Wood Professionals. Annales Des Sci-ences Forestieres, 51: 213-231.
http://dx.doi.org/10.1051/forest:19940302.17. Motik, D.; Kusá, A.; Jazbec, A.; Jelačić, D., 2004: Com-
parison of furniture demand in Croatia and Slovakia. Forest Products Journal, 54: 85-89.
18. Nicholls, D.; Bumgardner, M., 2007: Evaluating selected demographic factors related to consumer preferences for furniture from commercial and from underutilized spe-cies. Forest Products Journal, 57 (12): 79-82.
19. Nyrud, A. Q.; Roos, A.; Rødbotten, M., 2008: Product attributes affecting consumer preference for residential deck materials, Canadian Journal of Forest Research, 38 (6): 1385-1396. https://doi.org/10.1139/X07-188.
20. Oblak, L.; Barčić, A. P.; Klarić, K.; Kuzman, M. K.; Grošelj, P., 2017: Evaluation of Factors in Buying Deci-sion Process of Furniture Consumers by Applying AHP Method. Drvna industrija, 68: 37-43.
http://dx.doi.org/10.5552/drind.2017.1625.21. Oblak, L.; Jost, M., 2011: Methodology for Studying the
Ecological Quality of Furniture. Drvna industrija, 62: 171-176. http://dx.doi.org/10.5552/drind.2011.1038.
22. Oblak, L.; Kropivšek, J.; Hrovatin, J.; Zupancic, A., 2009: Analiza vplivov na nakupno odločanje pri nakupu pohištva. Les/Wood, 61: 291-296.
23. Ozanne, L. K.; Smith, P. M., 1996: Consumer segments for environmentally marketed wooden household furni-ture. Wood and Fiber Science, 28: 461-477.
24. Ozanne, L. K.; Vlosky, R. P., 1997: Willingness to pay for environmentally certifi ed wood products: A consumer perspective. Forest Products Journal, 47: 39-48.
25. Pakarinen, T. J.; Asikainen, A. T., 2001: Consumer seg-ments for wooden household furniture. Holz als Roh- und Werkstoff, 59: 217-227.
http://dx.doi.org/10.1007/s001070100187.
Jošt, Kaputa, Nosáľová, Pirc Barčić, Perić, Oblak:Changes in Customer Preferences... .....
156 DRVNA INDUSTRIJA 71 (2) 149-156 (2020)
26. Palus, H.; Mat’ova, H., 2009: End-user awareness of en-vironmentally appropriate wood products in Slovakia. In: Proceeding of International Conference WoodEMA, University of Zagreb, Faculty of Forestry, Šibenik, Croa-tia, pp. 111-116.
27. Palus, H.; Parobek, J.; Kaputa, V., 2014: The role of forest certifi cation in the european timber regulation. In: Pro-ceedings of Scientifi c Papers, Position and Role of the For-est Based Sector in the Green Economy, pp. 111-117.
28. Perić, I.; Grladinović, T.; Greger, K.; Kropivšek, J., 2015: Sources of Competitiveness for Furniture Manufacturing Firms: A Review of Literature and Research Issues. In: Proceeding of International conference on wood science and technology, University of Zagreb, Faculty of Forest-ry, Zagreb, Croatia, pp. 179-185.
29. Ponder, N., 2013: Consumer Attitudes and Buying Be-havior for Home Furniture. Mississippi State University: College of Business (online). http://www.ffi .msstate.edu/pdf/consumer_attitudes.pdf (Accessed Sep. 21, 2019).
30. Roos, A.; Nyrud, A. Q., 2008: Preferences for pressure-treated wooden deck materials. Wood and Fiber Science, 40: 436-447.
31. Scholz, S. W.; Decker, R., 2007: Measuring the impact of wood species on consumer preferences for wooden furni-
ture by means of the Analytic Hierarchy Process. Forest Products Journal, 57: 23-28.
32. Teisl, M., 2003: Eco-labeled forest products: Are con-sumers not listening, or are producers not communicat-ing? Orono: University of Maine, Department of Re-source Economics and Policy.
33. Troian, D., 2011: The consumer perception of design. Case study furniture sector. Trento: University of Trento.
34. Vlosky, R. P.; Ozanne, L. K.; Fontenot, R. J., 1999: A conceptual model of US consumer willingness-to-pay for environmentally certifi ed wood products. Journal of Consumer Marketing, 16: 122-136.
http://dx.doi.org/10.1108/07363769910260498.
Corresponding address:
MATEJ JOŠT, PhD
University of Ljubljana, Biotechnical FacultyDepartment of Wood Science and TechnologyJamnikarjeva 1011000 Ljubljana, SLOVENIAe-mail: [email protected]
....Savov, Antov: Engineering the Properties of Eco-Friendly Medium Density Fibreboards...
DRVNA INDUSTRIJA 71 (2) 157-162 (2020) 157
Viktor Savov1, Petar Antov1
Engineering the Properties of Eco-Friendly Medium Density Fibreboards Bonded with Lignosulfonate AdhesiveDizajniranje svojstava ekološki prihvatljivih ploča vlaknatica srednje gustoće proizvedenih uporabom lignosulfonatnog ljepila
Original scientifi c paper • Izvorni znanstveni radReceived – prispjelo: 20. 10. 2019.Accepted – prihvaćeno: 28. 4. 2020.UDK: 630*812.22; 630.812.23; 630*812.71; 630*863.312https://doi.org/10.55 52/drvind.2020.1968
ABSTRACT • Free formaldehyde emissions from wood-based panels, especially in indoor applications, pose serious risks to human health at certain concentrations. Prolonged exposure to formaldehyde can cause adverse health effects including eye, nose and throat irritation, other respiratory symptoms and cancer. As a consequence, new formaldehyde emission limits for composite wood products were established in Europe, USA and Japan. This, together with the stricter environmental legislation are the main driving factors for shifting the scientifi c and industrial interest from the traditional formaldehyde-based synthetic resins to the new bio-based adhesives for production of eco-friendly wood-based panels. The lignin-based products are one of the most prospective ecologi-cal alternatives to the traditional formaldehyde resins. The main interest in lignin is due to its phenolic structure with several favourable properties for the formulation of wood adhesives such as high hydrophobicity and low polydispersity.The present article is aimed at studying the possibilities for using lignosulfonate as an adhesive for the production of eco-friendly MDF. Regression models describing the impact of lignosulfonate concentration and hot pressing temperature on the exploitation properties of MDF panels were developed. The individual and combined impact of both factors was analysed in order to determine the optimal exploitation properties of the panels.
Keywords: eco-friendly MDF; lignosulfonate; physical and mechanical properties; bio-based adhesives; wood-based panels
SAŽETAK • Emisija slobodnog formaldehida iz ploča na bazi drva, posebice primijenjenih u unutarnjim prosto-rima, u određenim je koncentracijama ozbiljan rizik za zdravlje ljudi. Dulja izloženost formaldehidu može uzroko-vati znatne zdravstvene probleme, uključujući iritaciju očiju, nosa i grla, druge respiratorne simptome i rak. Stoga su u Europi, SAD-u i Japanu određene nove granice emisije formaldehida za kompozitne proizvode od drva. To je, zajedno sa strožim zakonodavstvom o okolišu, bio glavni poticaj za prebacivanje znanstvenoga i industrijskog fokusa s tradicionalnih sintetičkih smola temeljenih na formaldehidu na nova prirodna ljepila za proizvodnju ekološki prihvatljivih ploča na bazi drva. Proizvodi na bazi lignina jedna su od najperspektivnijih ekoloških alter-
1 Authors are associate professors at University of Forestry, Faculty of Forest Industry, Department of Mechanical Wood Technology, Sofi a, Bulgaria.
© 2020 by the author(s).Licensee Faculty of Forestry, University of Zagreb.
This article is an open access article distributedunder the terms and conditions of the
Creative Commons Attribution (CC BY 4.0) license.
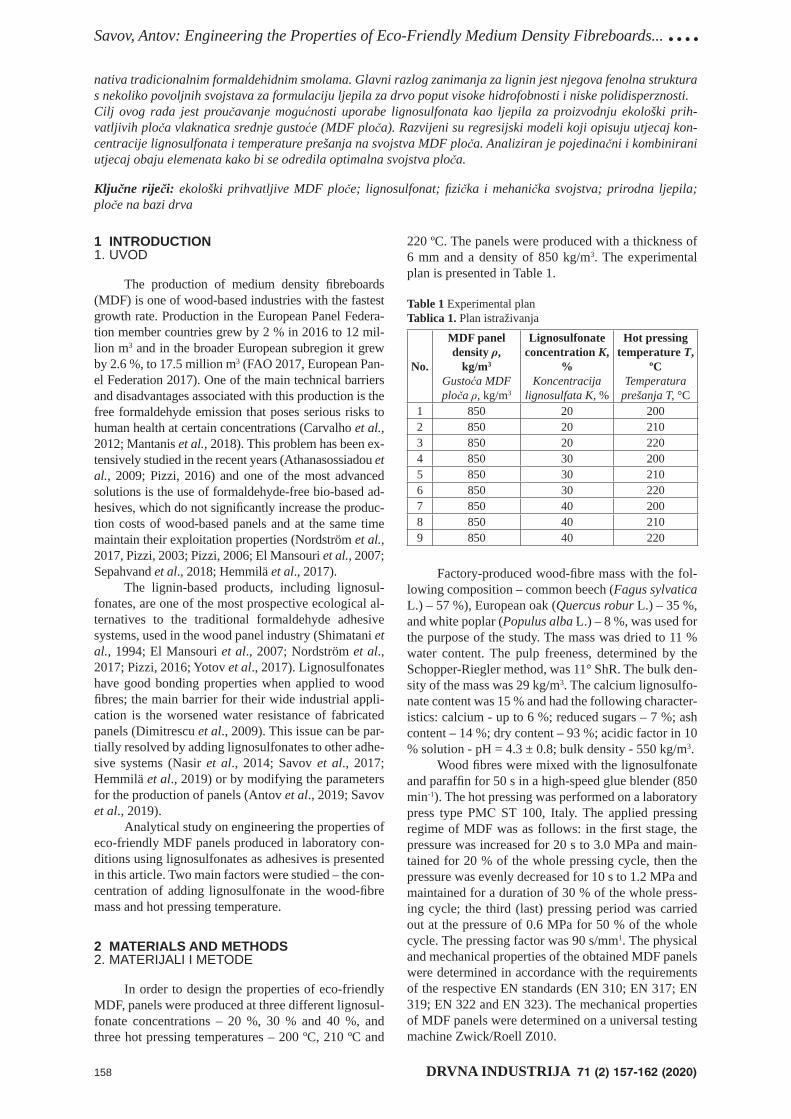
Savov, Antov: Engineering the Properties of Eco-Friendly Medium Density Fibreboards... ....
158 DRVNA INDUSTRIJA 71 (2) 157-162 (2020)
nativa tradicionalnim formaldehidnim smolama. Glavni razlog zanimanja za lignin jest njegova fenolna struktura s nekoliko povoljnih svojstava za formulaciju ljepila za drvo poput visoke hidrofobnosti i niske polidisperznosti.Cilj ovog rada jest proučavanje mogućnosti uporabe lignosulfonata kao ljepila za proizvodnju ekološki prih-vatljivih ploča vlaknatica srednje gustoće (MDF ploča). Razvijeni su regresijski modeli koji opisuju utjecaj kon-centracije lignosulfonata i temperature prešanja na svojstva MDF ploča. Analiziran je pojedinačni i kombinirani utjecaj obaju elemenata kako bi se odredila optimalna svojstva ploča.
Ključne riječi: ekološki prihvatljive MDF ploče; lignosulfonat; fi zička i mehanička svojstva; prirodna ljepila; ploče na bazi drva
220 ºC. The panels were produced with a thickness of 6 mm and a density of 850 kg/m3. The experimental plan is presented in Table 1.
Table 1 Experimental planTablica 1. Plan istraživanja
No.
MDF panel density ρ,
kg/m3
Gustoća MDF ploča ρ, kg/m3
Lignosulfonate concentration K,
%Koncentracija
lignosulfata K, %
Hot pressing temperature T,
ºCTemperatura
prešanja T, °C1 850 20 2002 850 20 2103 850 20 2204 850 30 2005 850 30 2106 850 30 2207 850 40 2008 850 40 2109 850 40 220
Factory-produced wood-fi bre mass with the fol-lowing composition – common beech (Fagus sylvatica L.) – 57 %), European oak (Quercus robur L.) – 35 %, and white poplar (Populus alba L.) – 8 %, was used for the purpose of the study. The mass was dried to 11 % water content. The pulp freeness, determined by the Schopper-Riegler method, was 11° ShR. The bulk den-sity of the mass was 29 kg/m3. The calcium lignosulfo-nate content was 15 % and had the following character-istics: calcium - up to 6 %; reduced sugars – 7 %; ash content – 14 %; dry content – 93 %; acidic factor in 10 % solution - pH = 4.3 ± 0.8; bulk density - 550 kg/m3.
Wood fi bres were mixed with the lignosulfonate and paraffi n for 50 s in a high-speed glue blender (850 min-1). The hot pressing was performed on a laboratory press type РМС SТ 100, Italy. The applied pressing regime of MDF was as follows: in the fi rst stage, the pressure was increased for 20 s to 3.0 MPa and main-tained for 20 % of the whole pressing cycle, then the pressure was evenly decreased for 10 s to 1.2 MPa and maintained for a duration of 30 % of the whole press-ing cycle; the third (last) pressing period was carried out at the pressure of 0.6 MPa for 50 % of the whole cycle. The pressing factor was 90 s/mm1. The physical and mechanical properties of the obtained MDF panels were determined in accordance with the requirements of the respective EN standards (EN 310; EN 317; EN 319; EN 322 and EN 323). The mechanical properties of MDF panels were determined on a universal testing machine Zwick/Roell Z010.
1 INTRODUCTION1. UVOD
The production of medium density fi breboards (MDF) is one of wood-based industries with the fastest growth rate. Production in the European Panel Federa-tion member countries grew by 2 % in 2016 to 12 mil-lion m3 and in the broader European subregion it grew by 2.6 %, to 17.5 million m3 (FAO 2017, European Pan-el Federation 2017). One of the main technical barriers and disadvantages associated with this production is the free formaldehyde emission that poses serious risks to human health at certain concentrations (Carvalho et al., 2012; Mantanis et al., 2018). This problem has been ex-tensively studied in the recent years (Athanasossiadou et al., 2009; Pizzi, 2016) and one of the most advanced solutions is the use of formaldehyde-free bio-based ad-hesives, which do not signifi cantly increase the produc-tion costs of wood-based panels and at the same time maintain their exploitation properties (Nordström et al., 2017, Pizzi, 2003; Pizzi, 2006; El Mansouri et al., 2007; Sepahvand et al., 2018; Hemmilä et al., 2017).
The lignin-based products, including lignosul-fonates, are one of the most prospective ecological al-ternatives to the traditional formaldehyde adhesive systems, used in the wood panel industry (Shimatani et al., 1994; El Mansouri et al., 2007; Nordström et al., 2017; Pizzi, 2016; Yotov et al., 2017). Lignosulfonates have good bonding properties when applied to wood fi bres; the main barrier for their wide industrial appli-cation is the worsened water resistance of fabricated panels (Dimitrescu et al., 2009). This issue can be par-tially resolved by adding lignosulfonates to other adhe-sive systems (Nasir et al., 2014; Savov et al., 2017; Hemmilä et al., 2019) or by modifying the parameters for the production of panels (Antov et al., 2019; Savov et al., 2019).
Analytical study on engineering the properties of eco-friendly MDF panels produced in laboratory con-ditions using lignosulfonates as adhesives is presented in this article. Two main factors were studied – the con-centration of adding lignosulfonate in the wood-fi bre mass and hot pressing temperature.
2 MATERIALS AND METHODS2. MATERIJALI I METODE
In order to design the properties of eco-friendly MDF, panels were produced at three different lignosul-fonate concentrations – 20 %, 30 % and 40 %, and three hot pressing temperatures – 200 ºC, 210 ºC and
....Savov, Antov: Engineering the Properties of Eco-Friendly Medium Density Fibreboards...
DRVNA INDUSTRIJA 71 (2) 157-162 (2020) 159
On this basis the following regression equation in a coded form was derived:
(1)
where is the predicted value of the respective MDF output parameter, X1 is the lignosulfonate concentra-tion in a coded form and X2 is the hot pressing tempera-ture in a coded form.
A standard methodology was used to determine the adequacy of the model by calculating the Fisher criterion and comparing it with the table values. Vari-
ance relation was calculated, where is the
residual variance and is the variance of random dis-turbance determined on the basis of the variance under the null experiment (at 30 % lignosulfonate concentra-tion and 210 ºC hot pressing temperature). The testing was carried out on 8 test samples for each parameter and variational and statistical processing of the results was made to test the adequacy of the model, encoded by the following formula:
(2)
where is the natural meaning of the factor, is the variation interval and is the variation interval me-dian.
The accuracy of the applied model was deter-mined by the multiple correlation coeffi cient.
3 RESULTS AND DISCUSSION3. REZULTATI I RASPRAVA
The summarised results of the exploitation prop-erties of the laboratory produced MDF panels at differ-ent lignosulfonate concentrations and hot pressing temperature are presented in Table 2.
Data about the tests in the null experiment are presented in Table 3.
All derived equations correspond to the critical value F (0.005; 3; 7) = 4.35, and the values for the re-spective models are: for the water absorption – 2.37; for the swelling in thickness – 3.17; for the bending strength – 3.85; for the modulus of elasticity in bending – 3.02; and for the internal bond strength – 4.21.
The coded form of the regression equation for the water absorption of MDF panels is:
, % (3)
where X1 is the lignosulfonate concentration and X2 is the hot pressing temperature in coded form. The equa-tion is characterised by the coeffi cient of determination R2 = 0.96.
From Eq. 3, it can be concluded that the effect of lignosulfonate concentration was signifi cantly stronger in the studied range. The impact of the factor at the variation range from 20 to 40 % was about 2.6 greater than the effect of hot pressing temperature within the
Table 2 Results of physical and mechanical properties of eco-friendly MDF panelsTablica 2. Rezultati ispitivanja fi zičkih i mehaničkih svojstava ekološki prihvatljivih MDF ploča
PanelNo.Broj ploče
Density ρ, kg/m3
Gustoća ρ, kg/m3
Water absorption
А, %Upijanje vode A,
%
Swelling in thickness
Gt, %Bubrenje Gt, %
Bending strength fm, N/mm2
Čvrstoća na savijanje fm, N/mm2
Modulus ofelasticity in
bending Em, N/mm2
Modul elastičnosti pri savijanju Em, N/mm2
Internal bond strength ft, N/mm2
Čvrstoća na raslojavanje ft,
N/mm2
1. 855±7 74.8±2.7 24.1±1.0 22.75±0.4 2894±97 0.62±0.0052. 841±9 64.8±1.9 23.0±0.6 20.89±0.7 2655±130 0.66±0.0253. 831±8 62.5±1.8 22.0±0.7 24.79±0.6 3308±130 0.68±0.0264. 849±5 58.3±1.7 21.8±0.8 32.08±0.4 3734±115 0.70±0.0095. 847±7 57.8±2.3 19.8±0.6 30.54±1.0 3853±188 0.71±0.0266. 856±8 55.5±2.4 19.5±0.5 30.58±1.1 3956±129 0.71±0.0297. 842±8 56.5±2.7 20.8±1.0 30.33±1.3 3676±85 0,74±0.0158. 854±5 53.7±2.5 19.6±0.4 32.08±0.8 3440±92 0,72±0.0119. 854±5 53.4±1.9 18.5±0.8 26.61±0.8 3613±96 0,64±0.027
Table 3 Initial panel property valuesTablica 3. Početne vrijednosti svojstava ploče
Sample No.Broj uzorka
PropertiesSvojstva
1 2 3 4 5 6 7 8
Water absorption A, % / upijanje vode A, % 55.67 47.48 60.45 57.22 53.11 43.51 55.24 54.78Swelling in thickness Gt, % / bubrenje Gt, % 19.93 14.77 16.48 17.07 20.69 18.28 20.58 20.38Bending strength fm, N/mm2
čvrstoća na savijanje fm, N/mm2 24.5 28.2 26.1 26.8 28.2 22.1 28.4 28.60
Modulus of elasticity Em, N/mm2
modul elastičnosti pri savijanju Em, N/mm2 3650 3550 3390 3680 3560 3150 3940 3980
Internal bond strength ft, N/mm2
čvrstoća na raslojavanje ft, N/mm2 0.828 0.679 0.615 0.674 0.677 0.699 0.811 0.737
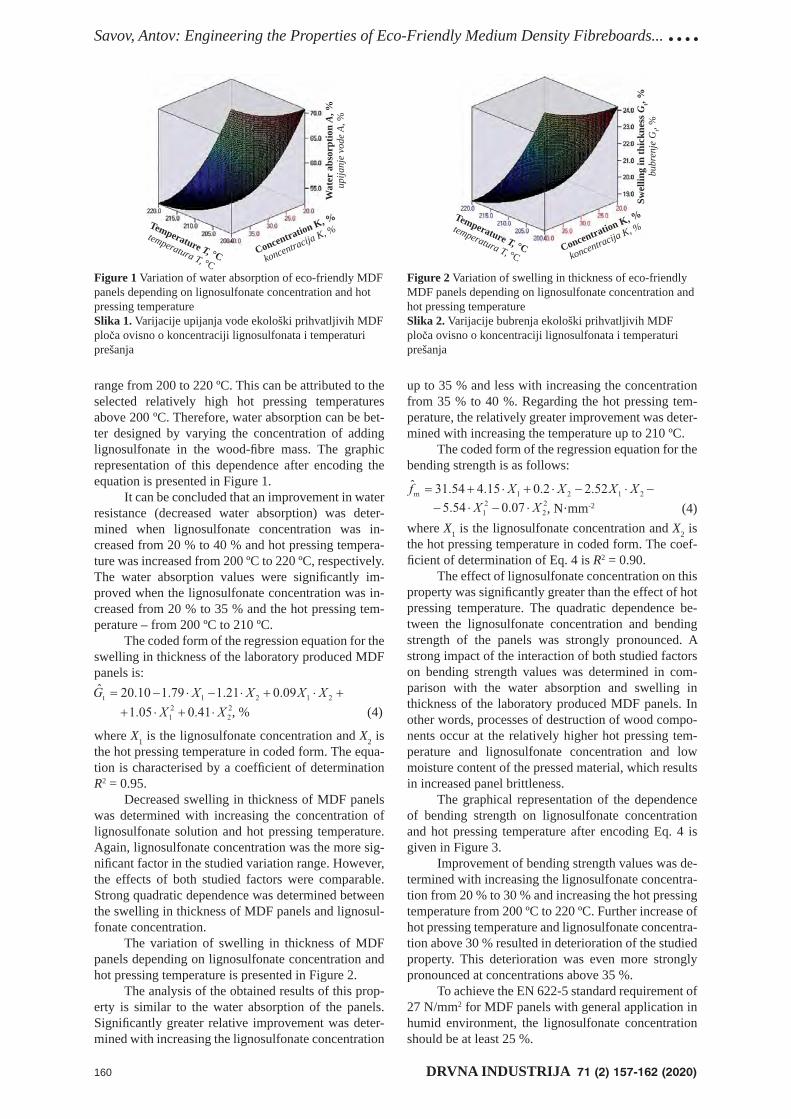
Savov, Antov: Engineering the Properties of Eco-Friendly Medium Density Fibreboards... ....
160 DRVNA INDUSTRIJA 71 (2) 157-162 (2020)
range from 200 to 220 ºC. This can be attributed to the selected relatively high hot pressing temperatures above 200 ºC. Therefore, water absorption can be bet-ter designed by varying the concentration of adding lignosulfonate in the wood-fi bre mass. The graphic representation of this dependence after encoding the equation is presented in Figure 1.
It can be concluded that an improvement in water resistance (decreased water absorption) was deter-mined when lignosulfonate concentration was in-creased from 20 % to 40 % and hot pressing tempera-ture was increased from 200 ºC to 220 ºC, respectively. The water absorption values were signifi cantly im-proved when the lignosulfonate concentration was in-creased from 20 % to 35 % and the hot pressing tem-perature – from 200 ºC to 210 ºC.
The coded form of the regression equation for the swelling in thickness of the laboratory produced MDF panels is:
, % (4)
where X1 is the lignosulfonate concentration and X2 is the hot pressing temperature in coded form. The equa-tion is characterised by a coeffi cient of determination R2 = 0.95.
Decreased swelling in thickness of MDF panels was determined with increasing the concentration of lignosulfonate solution and hot pressing temperature. Again, lignosulfonate concentration was the more sig-nifi cant factor in the studied variation range. However, the effects of both studied factors were comparable. Strong quadratic dependence was determined between the swelling in thickness of MDF panels and lignosul-fonate concentration.
The variation of swelling in thickness of MDF panels depending on lignosulfonate concentration and hot pressing temperature is presented in Figure 2.
The analysis of the obtained results of this prop-erty is similar to the water absorption of the panels. Signifi cantly greater relative improvement was deter-mined with increasing the lignosulfonate concentration
up to 35 % and less with increasing the concentration from 35 % to 40 %. Regarding the hot pressing tem-perature, the relatively greater improvement was deter-mined with increasing the temperature up to 210 ºC.
The coded form of the regression equation for the bending strength is as follows:
, N·mm-2 (4)where X1 is the lignosulfonate concentration and X2 is the hot pressing temperature in coded form. The coef-fi cient of determination of Eq. 4 is R2 = 0.90.
The effect of lignosulfonate concentration on this property was signifi cantly greater than the effect of hot pressing temperature. The quadratic dependence be-tween the lignosulfonate concentration and bending strength of the panels was strongly pronounced. A strong impact of the interaction of both studied factors on bending strength values was determined in com-parison with the water absorption and swelling in thickness of the laboratory produced MDF panels. In other words, processes of destruction of wood compo-nents occur at the relatively higher hot pressing tem-perature and lignosulfonate concentration and low moisture content of the pressed material, which results in increased panel brittleness.
The graphical representation of the dependence of bending strength on lignosulfonate concentration and hot pressing temperature after encoding Eq. 4 is given in Figure 3.
Improvement of bending strength values was de-termined with increasing the lignosulfonate concentra-tion from 20 % to 30 % and increasing the hot pressing temperature from 200 ºC to 220 ºC. Further increase of hot pressing temperature and lignosulfonate concentra-tion above 30 % resulted in deterioration of the studied property. This deterioration was even more strongly pronounced at concentrations above 35 %.
To achieve the EN 622-5 standard requirement of 27 N/mm2 for MDF panels with general application in humid environment, the lignosulfonate concentration should be at least 25 %.
Figure 1 Variation of water absorption of eco-friendly MDF panels depending on lignosulfonate concentration and hot pressing temperatureSlika 1. Varijacije upijanja vode ekološki prihvatljivih MDF ploča ovisno o koncentraciji lignosulfonata i temperaturi prešanja
Wat
er a
bsor
ptio
n A
, %up
ijanj
e vo
de A
, %
Concentration K, %
koncentracija K, %Temperature T, °C
temperatura T, °CConcentration K, %
koncentracija K, %Temperature T, °C
temperatura T, °C
Swel
ling
in th
ickn
ess G
t, %
bubr
enje
Gt,
%
Figure 2 Variation of swelling in thickness of eco-friendly MDF panels depending on lignosulfonate concentration and hot pressing temperatureSlika 2. Varijacije bubrenja ekološki prihvatljivih MDF ploča ovisno o koncentraciji lignosulfonata i temperaturi prešanja
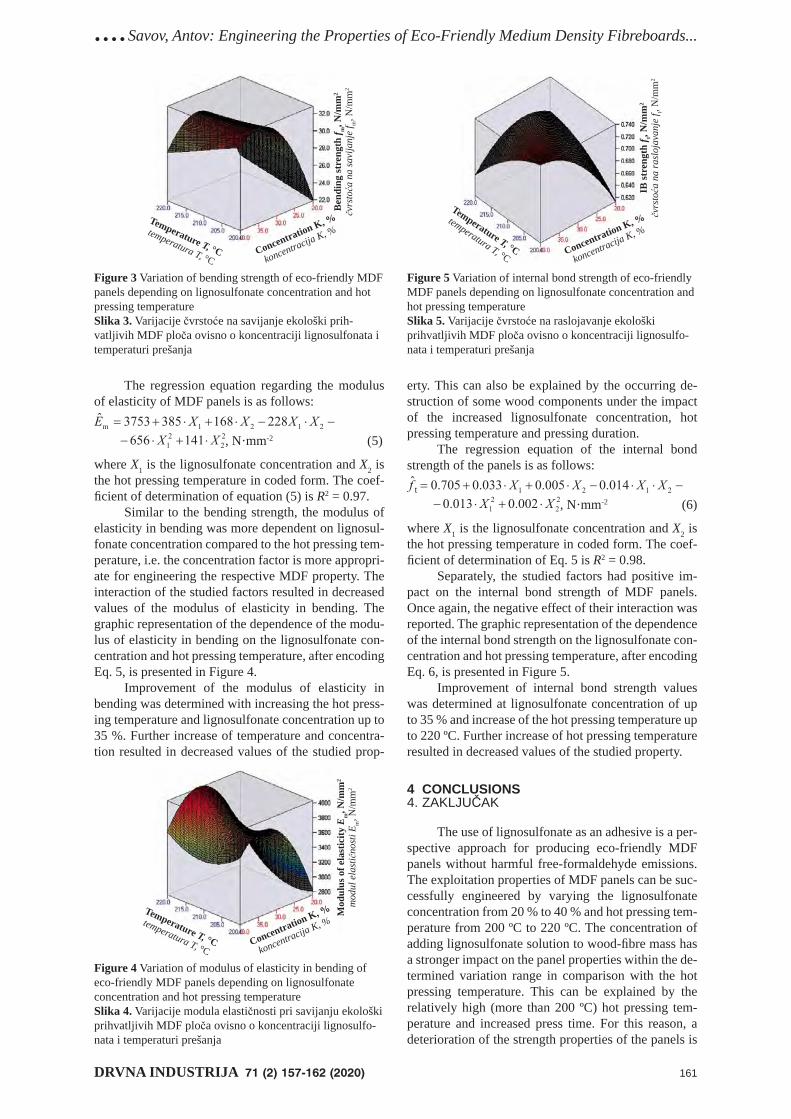
....Savov, Antov: Engineering the Properties of Eco-Friendly Medium Density Fibreboards...
DRVNA INDUSTRIJA 71 (2) 157-162 (2020) 161
The regression equation regarding the modulus of elasticity of MDF panels is as follows:
, N·mm-2 (5)
where X1 is the lignosulfonate concentration and X2 is the hot pressing temperature in coded form. The coef-fi cient of determination of equation (5) is R2 = 0.97.
Similar to the bending strength, the modulus of elasticity in bending was more dependent on lignosul-fonate concentration compared to the hot pressing tem-perature, i.e. the concentration factor is more appropri-ate for engineering the respective MDF property. The interaction of the studied factors resulted in decreased values of the modulus of elasticity in bending. The graphic representation of the dependence of the modu-lus of elasticity in bending on the lignosulfonate con-centration and hot pressing temperature, after encoding Eq. 5, is presented in Figure 4.
Improvement of the modulus of elasticity in bending was determined with increasing the hot press-ing temperature and lignosulfonate concentration up to 35 %. Further increase of temperature and concentra-tion resulted in decreased values of the studied prop-
erty. This can also be explained by the occurring de-struction of some wood components under the impact of the increased lignosulfonate concentration, hot pressing temperature and pressing duration.
The regression equation of the internal bond strength of the panels is as follows:
, N·mm-2 (6)
where X1 is the lignosulfonate concentration and X2 is the hot pressing temperature in coded form. The coef-fi cient of determination of Eq. 5 is R2 = 0.98.
Separately, the studied factors had positive im-pact on the internal bond strength of MDF panels. Once again, the negative effect of their interaction was reported. The graphic representation of the dependence of the internal bond strength on the lignosulfonate con-centration and hot pressing temperature, after encoding Eq. 6, is presented in Figure 5.
Improvement of internal bond strength values was determined at lignosulfonate concentration of up to 35 % and increase of the hot pressing temperature up to 220 ºC. Further increase of hot pressing temperature resulted in decreased values of the studied property.
4 CONCLUSIONS4. ZAKLJUČAK
The use of lignosulfonate as an adhesive is a per-spective approach for producing eco-friendly MDF panels without harmful free-formaldehyde emissions. The exploitation properties of MDF panels can be suc-cessfully engineered by varying the lignosulfonate concentration from 20 % to 40 % and hot pressing tem-perature from 200 ºC to 220 ºC. The concentration of adding lignosulfonate solution to wood-fi bre mass has a stronger impact on the panel properties within the de-termined variation range in comparison with the hot pressing temperature. This can be explained by the relatively high (more than 200 ºC) hot pressing tem-perature and increased press time. For this reason, a deterioration of the strength properties of the panels is
Ben
ding
stre
ngth
f m, N
/mm
2
čvrs
toća
na
savi
janj
e f m
, N/m
m2
Concentration K, %
koncentracija K, %Temperature T, °C
temperatura T, °C
Figure 3 Variation of bending strength of eco-friendly MDF panels depending on lignosulfonate concentration and hot pressing temperatureSlika 3. Varijacije čvrstoće na savijanje ekološki prih-vatljivih MDF ploča ovisno o koncentraciji lignosulfonata i temperaturi prešanja
Concentration K, %
koncentracija K, %Temperature T, °C
temperatura T, °C
Mod
ulus
of e
last
icity
Em, N
/mm
2
mod
ul e
last
ično
sti E
m, N
/mm
2
Figure 4 Variation of modulus of elasticity in bending of eco-friendly MDF panels depending on lignosulfonate concentration and hot pressing temperatureSlika 4. Varijacije modula elastičnosti pri savijanju ekološki prihvatljivih MDF ploča ovisno o koncentraciji lignosulfo-nata i temperaturi prešanja
Figure 5 Variation of internal bond strength of eco-friendly MDF panels depending on lignosulfonate concentration and hot pressing temperatureSlika 5. Varijacije čvrstoće na raslojavanje ekološki prihvatljivih MDF ploča ovisno o koncentraciji lignosulfo-nata i temperaturi prešanja
IB st
reng
th f t,
N/m
m2
čvrs
toća
na
rasl
ojav
anje
f t, N
/mm
2
Concentration K, %
koncentracija K, %
Temperature T, °C
temperatura T, °C
Savov, Antov: Engineering the Properties of Eco-Friendly Medium Density Fibreboards... ....
162 DRVNA INDUSTRIJA 71 (2) 157-162 (2020)
observed with increasing the hot pressing temperature at lignosulfonate concentrations above 35 %. Decreas-ing the concentration below 30 % is not justifi ed since this does not lead to additional utilisation of the ligno-sulfonate hydroxyl groups but requires increasing the hot pressing temperatures.
Despite the signifi cant positive results achieved in the production of lignosulfonate-based MDF panels, there are some considerable drawbacks that should be noted, e.g. the diffi culties in activating lignosulfonates and their binding to wood fi bres, as well as the required substantial increase of pressing temperature and ex-tended pressing time. The latter outlines the future trends of extensive research in the fi eld of MDF pro-duction on the basis of lignosulfonate adhesives.
Acknowledgements – ZahvalaThis research was supported by the project No.
НИС-Б-1002/03.2019 ‘Exploitation Properties and Possibilities for Utilization of Eco-friendly Bio-com-posite Materials’, implemented at the University of Forestry, Sofi a, Bulgaria.
5 REFERENCES5. LITERATURA
1. Antov, P.; Valchev, I.; Savov, V., 2019: Experimental and Statistical Modeling of the Exploitation Properties of Eco-friendly MDF through Variation of Lignosulfonate Con-centration and Hot Pressing Temperature. In: Proceedings of the 2nd International Congress of Biorefi nery of Ligno-cellulosic Materials (IWBLCM2019), pp. 104-109.
2. Athanassiadou, E.; Tsiantzi, S.; Markessini, C., 2009: Producing Panels with Formaldehyde Emission at Wood Levels. European Network of Bioadhesion Expertise (ENBA), pp.16.
3. Carvalho, L.; Magalhães F.; Ferra, J., 2012: Formalde-hyde Emissions from Wood-Based Panels – Testing Methods and Industrial Perspectives. In Chemistry, Ap-plications and Role in Polymerization. Cheng, C.; Lin, L. (eds.). Nova Science Publishers, Inc: Hauppauge, NY.
4. Dumitrescu, L.; Manciulea, I.; Patachia, S.; Perniu, D., 2009: Wood Adhesives Based on Lignocellulosic Materi-als. Annals of DAAAM for 2009 & Proceedings of the 20th International DAAAM, Vienna, Austria, pp. 289-290.
5. El Mansouri, N. E.; Pizzi, A.; Salvado, J., 2007: Lignin-based wood panel adhesives without formaldehyde. Holz als Roh- und Werkstoff, 65: 65-70.
https://doi.org/10.1007/s00107-006-0130-z.6. Hemmilä, V.; Adamopoulos, S.; Karlsson, O.; Kumar, A.,
2017: Development of sustainable bio-adhesives for en-gineered wood panels – a review. RSC Advances, 7 (61): 38604-38630.
7. Hemmilä, H.; Adamopolus, St.; Hosseinpourpia, R.; Ahmed, Sh. A., 2019: Ammonium Lignosulfonate Adhe-sives for Particleboards with pMDI and Furfuryl Alcohol as Crosslinkers. Polymers, 11: 1633.
https://doi.org/10.3390/polym11101633.8. Mantanis, G. I.; Athanassiadou, E. T.; Barbu, M. C.;
Wijnendaele, K., 2018: Adhesive systems used in the Eu-ropean particleboard, MDF and OSB industries. Wood Material Science & Engineering, 13 (2): 104-116.
https://doi.org/10.1080/17480272.2017.1396622.9. Nasir, M.; Gupta, A.; Beg, M.; Chua, G. K.; Kumar, A.,
2014: Physical and mechanical properties of Medium
Density Fiberboard using soy-lignin adhesives. Journal of Tropical Forest Science, 1: 41-49.
10. Nordström, E.; Demircan, D.; Fogelström, L.; Khabbaz, F.; Malmström, E., 2017: Green binders for wood adhe-sives. Interhopen Books, pp. 71.
https://doi.org/10.5772/intechopen.72072.11. Pizzi, A., 2003: Wood Adhesives Chemistry and Tech-
nology. Marcel Dekker, Inc., New York.12. Pizzi, A., 2016: Wood products and green chemistry. An-
nals of Forest Science, 73: 185-203. https://doi.org/10.1007/s13595-014-0448-3.13. Pizzi, A., 2006: Recent developments in eco-effi cient bio-
based adhesives for wood bonding: opportunities and is-sues. Journal of Adhesion Science and Technology, 20 (8): 829-846. https://doi.org/10.1163/156856106777638635.
14. Savov, V.; Mihajlova, J., 2017: Infl uence of the content of lignosulfonate on physical properties of medium density fi berboard. International Conference Wood Science and En-gineering in the Third Millennium – ICWSE, pp. 348-352.
15. Savov, V.; Valchev, I.; Antov, P., 2019: Processing factors for production of eco-friendly medium density fi bre-boards based on lignosulfonate adhesives. In: Proceed-ings of the 2nd International Congress of Biorefi nery of Lignocellulosic Materials, pp. 165-169.
16. Sepahvand, S.; Doosthosseini, K.; Pirayesh, H.; Maryan, B. K., 2018: Supplementation of Natural Tannins as an Al-ternative to Formaldehyde in Urea and Melamine Formal-dehyde Resins used in MDF Production. Drvna industrija, 69 (3): 215-221. https://doi.org/10.5552/drind.2018.1726.
17. Shimatani, K.; Sono, Y.; Sasaya, T., 1994: Preparation of moderate-temperature setting adhesives from softwood kraft lignin, part 2. Effect of some factors on strength properties and characteristics of lignin-based adhesives. Holzforschung, 48: 337-342.
https://doi.org/10.1515/hfsg.1994.48.4.337.18. Yotov, N.; Valchev, I.; Petrin, St.; Savov, V., 2017: Ligno-
sulphonate and waste technical hydrolysis lignin as adhe-sives for eco-friendly fi berboard. Bulgarian Chemical Communications, 49: 92-97.
19. ***EN 310, 1999: Wood-based panels – Determination of modulus of elasticity in bending and of bending strength.
20. ***EN 316, 2009: Wood fi bre boards – Defi nition, clas-sifi cation and symbols.
21. ***EN 317, 1998: Particleboards and fi breboards – De-termination of swelling in thickness after immersion in water.
22. ***EN 322, 1998: Wood-based panels – Determination of moisture content.
23. ***EN 323, 2001: Wood-based panels – Determination of density.
24. ***EN 622-5, 2010: Fibreboards – Specifi cations, part 5: Requirements for dry process boards.
25. ***European Panel Federation, 2017: Annual report 2016/2017, www.europanels.org (Accessed April 10, 2019).
26. ***Forest products statistics, 2017, http://www.fao.org/forestry/statistics (Accessed April 10, 2019).
Corresponding address:
Assoc. Prof. PETAR ANTOV, PhD
University of ForestryFaculty of Forest IndustryDepartment of Mechanical Wood Technology10 Kliment Ohridski Blvd., 1797 Sofi a, BULGARIAe-mail: [email protected]
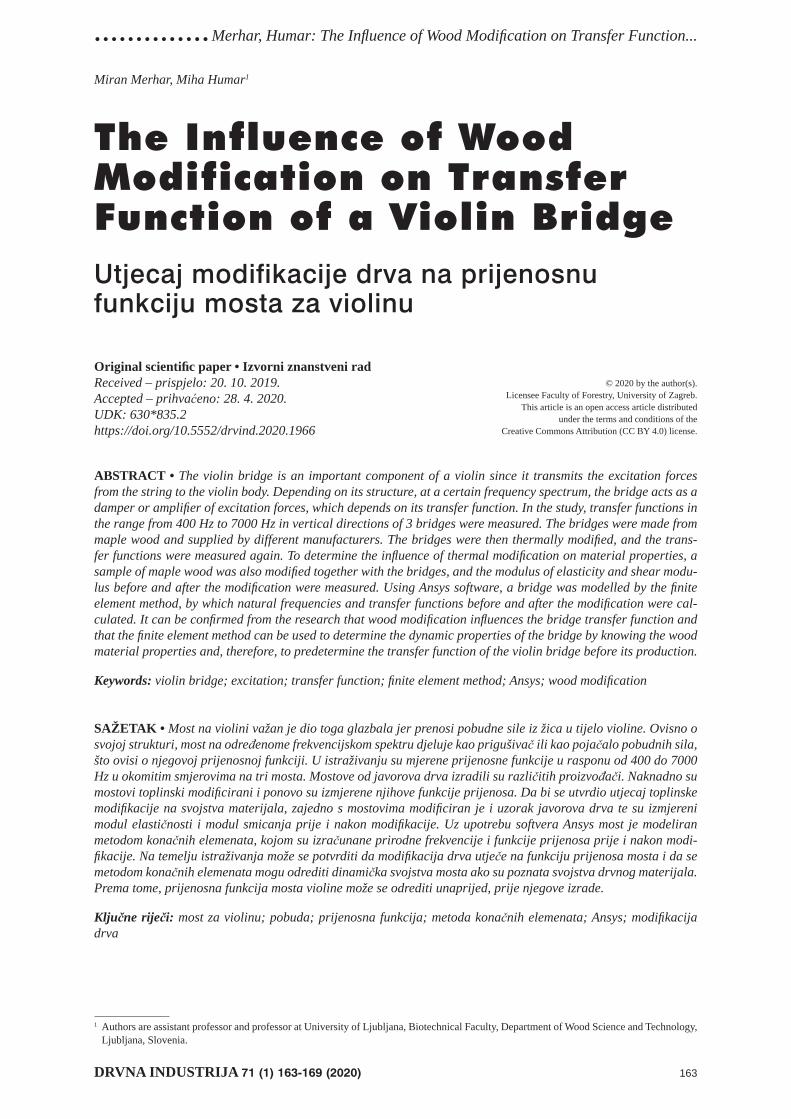
..............Merhar, Humar: The Infl uence of Wood Modifi cation on Transfer Function...
DRVNA INDUSTRIJA 71 (1) 163-169 (2020) 163
Miran Merhar, Miha Humar1
The Influence of Wood Modification on Transfer Function of a Violin BridgeUtjecaj modifikacije drva na prijenosnu funkciju mosta za violinu
Original scientifi c paper • Izvorni znanstveni radReceived – prispjelo: 20. 10. 2019.Accepted – prihvaćeno: 28. 4. 2020.UDK: 630*835.2https://doi .org/10.5552/drvind.2020.1966
ABSTRACT • The violin bridge is an important component of a violin since it transmits the excitation forces from the string to the violin body. Depending on its structure, at a certain frequency spectrum, the bridge acts as a damper or amplifi er of excitation forces, which depends on its transfer function. In the study, transfer functions in the range from 400 Hz to 7000 Hz in vertical directions of 3 bridges were measured. The bridges were made from maple wood and supplied by different manufacturers. The bridges were then thermally modifi ed, and the trans-fer functions were measured again. To determine the infl uence of thermal modifi cation on material properties, a sample of maple wood was also modifi ed together with the bridges, and the modulus of elasticity and shear modu-lus before and after the modifi cation were measured. Using Ansys software, a bridge was modelled by the fi nite element method, by which natural frequencies and transfer functions before and after the modifi cation were cal-culated. It can be confi rmed from the research that wood modifi cation infl uences the bridge transfer function and that the fi nite element method can be used to determine the dynamic properties of the bridge by knowing the wood material properties and, therefore, to predetermine the transfer function of the violin bridge before its production.
Keywords: violin bridge; excitation; transfer function; fi nite element method; Ansys; wood modifi cation
SAŽETAK • Most na violini važan je dio toga glazbala jer prenosi pobudne sile iz žica u tijelo violine. Ovisno o svojoj strukturi, most na određenome frekvencijskom spektru djeluje kao prigušivač ili kao pojačalo pobudnih sila, što ovisi o njegovoj prijenosnoj funkciji. U istraživanju su mjerene prijenosne funkcije u rasponu od 400 do 7000 Hz u okomitim smjerovima na tri mosta. Mostove od javorova drva izradili su različitih proizvođači. Naknadno su mostovi toplinski modifi cirani i ponovo su izmjerene njihove funkcije prijenosa. Da bi se utvrdio utjecaj toplinske modifi kacije na svojstva materijala, zajedno s mostovima modifi ciran je i uzorak javorova drva te su izmjereni modul elastičnosti i modul smicanja prije i nakon modifi kacije. Uz upotrebu softvera Ansys most je modeliran metodom konačnih elemenata, kojom su izračunane prirodne frekvencije i funkcije prijenosa prije i nakon modi-fi kacije. Na temelju istraživanja može se potvrditi da modifi kacija drva utječe na funkciju prijenosa mosta i da se metodom konačnih elemenata mogu odrediti dinamička svojstva mosta ako su poznata svojstva drvnog materijala. Prema tome, prijenosna funkcija mosta violine može se odrediti unaprijed, prije njegove izrade.
Ključne riječi: most za violinu; pobuda; prijenosna funkcija; metoda konačnih elemenata; Ansys; modifi kacija drva
1 Authors are assistant professor and professor at University of Ljubljana, Biotechnical Faculty, Department of Wood Science and Technology, Ljubljana, Slovenia.
© 2020 by the author(s).Licensee Faculty of Forestry, University of Zagreb.
This article is an open access article distributedunder the terms and conditions of the
Creative Commons Attribution (CC BY 4.0) license.
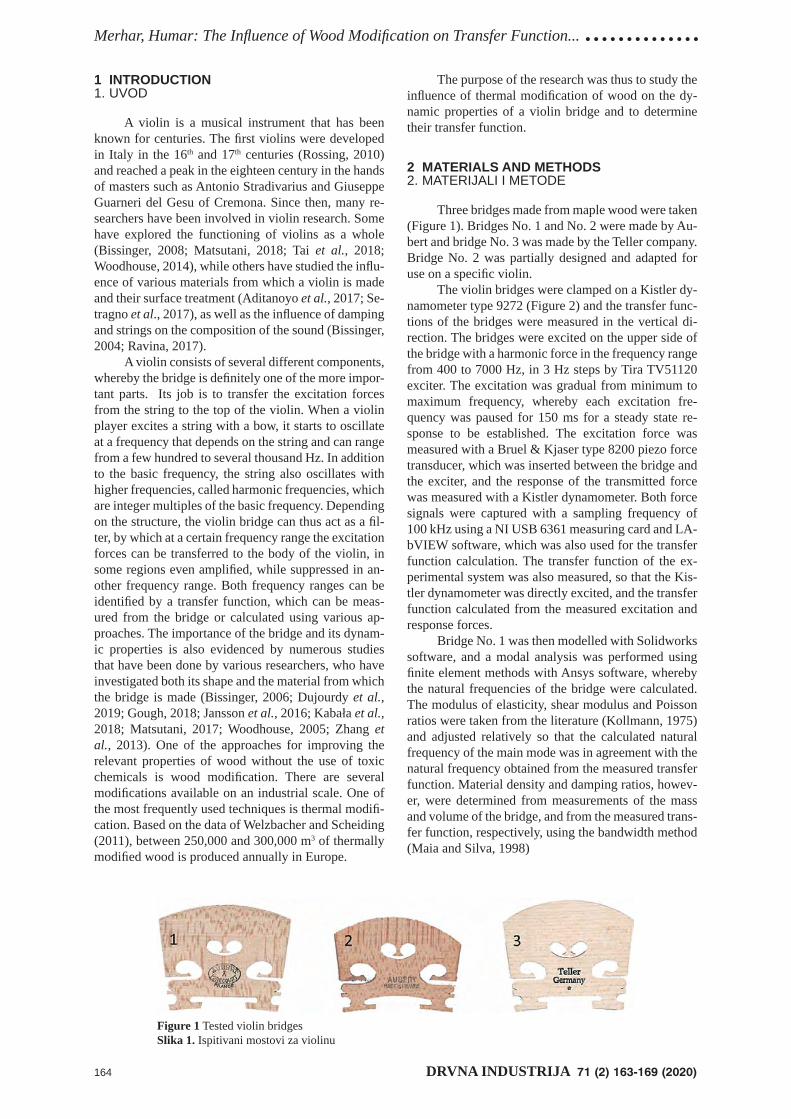
Merhar, Humar: The Infl uence of Wood Modifi cation on Transfer Function... ..............
164 DRVNA INDUSTRIJA 71 (2) 163-169 (2020)
The purpose of the research was thus to study the infl uence of thermal modifi cation of wood on the dy-namic properties of a violin bridge and to determine their transfer function.
2 MATERIALS AND METHODS2. MATERIJALI I METODE
Three bridges made from maple wood were taken (Figure 1). Bridges No. 1 and No. 2 were made by Au-bert and bridge No. 3 was made by the Teller company. Bridge No. 2 was partially designed and adapted for use on a specifi c violin.
The violin bridges were clamped on a Kistler dy-namometer type 9272 (Figure 2) and the transfer func-tions of the bridges were measured in the vertical di-rection. The bridges were excited on the upper side of the bridge with a harmonic force in the frequency range from 400 to 7000 Hz, in 3 Hz steps by Tira TV51120 exciter. The excitation was gradual from minimum to maximum frequency, whereby each excitation fre-quency was paused for 150 ms for a steady state re-sponse to be established. The excitation force was measured with a Bruel & Kjaser type 8200 piezo force transducer, which was inserted between the bridge and the exciter, and the response of the transmitted force was measured with a Kistler dynamometer. Both force signals were captured with a sampling frequency of 100 kHz using a NI USB 6361 measuring card and LA-bVIEW software, which was also used for the transfer function calculation. The transfer function of the ex-perimental system was also measured, so that the Kis-tler dynamometer was directly excited, and the transfer function calculated from the measured excitation and response forces.
Bridge No. 1 was then modelled with Solidworks software, and a modal analysis was performed using fi nite element methods with Ansys software, whereby the natural frequencies of the bridge were calculated. The modulus of elasticity, shear modulus and Poisson ratios were taken from the literature (Kollmann, 1975) and adjusted relatively so that the calculated natural frequency of the main mode was in agreement with the natural frequency obtained from the measured transfer function. Material density and damping ratios, howev-er, were determined from measurements of the mass and volume of the bridge, and from the measured trans-fer function, respectively, using the bandwidth method (Maia and Silva, 1998)
1 INTRODUCTION1. UVOD
A violin is a musical instrument that has been known for centuries. The fi rst violins were developed in Italy in the 16th and 17th centuries (Rossing, 2010) and reached a peak in the eighteen century in the hands of masters such as Antonio Stradivarius and Giuseppe Guarneri del Gesu of Cremona. Since then, many re-searchers have been involved in violin research. Some have explored the functioning of violins as a whole (Bissinger, 2008; Matsutani, 2018; Tai et al., 2018; Woodhouse, 2014), while others have studied the infl u-ence of various materials from which a violin is made and their surface treatment (Aditanoyo et al., 2017; Se-tragno et al., 2017), as well as the infl uence of damping and strings on the composition of the sound (Bissinger, 2004; Ravina, 2017).
A violin consists of several different components, whereby the bridge is defi nitely one of the more impor-tant parts. Its job is to transfer the excitation forces from the string to the top of the violin. When a violin player excites a string with a bow, it starts to oscillate at a frequency that depends on the string and can range from a few hundred to several thousand Hz. In addition to the basic frequency, the string also oscillates with higher frequencies, called harmonic frequencies, which are integer multiples of the basic frequency. Depending on the structure, the violin bridge can thus act as a fi l-ter, by which at a certain frequency range the excitation forces can be transferred to the body of the violin, in some regions even amplifi ed, while suppressed in an-other frequency range. Both frequency ranges can be identifi ed by a transfer function, which can be meas-ured from the bridge or calculated using various ap-proaches. The importance of the bridge and its dynam-ic properties is also evidenced by numerous studies that have been done by various researchers, who have investigated both its shape and the material from which the bridge is made (Bissinger, 2006; Dujourdy et al., 2019; Gough, 2018; Jansson et al., 2016; Kabała et al., 2018; Matsutani, 2017; Woodhouse, 2005; Zhang et al., 2013). One of the approaches for improving the relevant properties of wood without the use of toxic chemicals is wood modifi cation. There are several modifi cations available on an industrial scale. One of the most frequently used techniques is thermal modifi -cation. Based on the data of Welzbacher and Scheiding (2011), between 250,000 and 300,000 m3 of thermally modifi ed wood is produced annually in Europe.
Figure 1 Tested violin bridgesSlika 1. Ispitivani mostovi za violinu
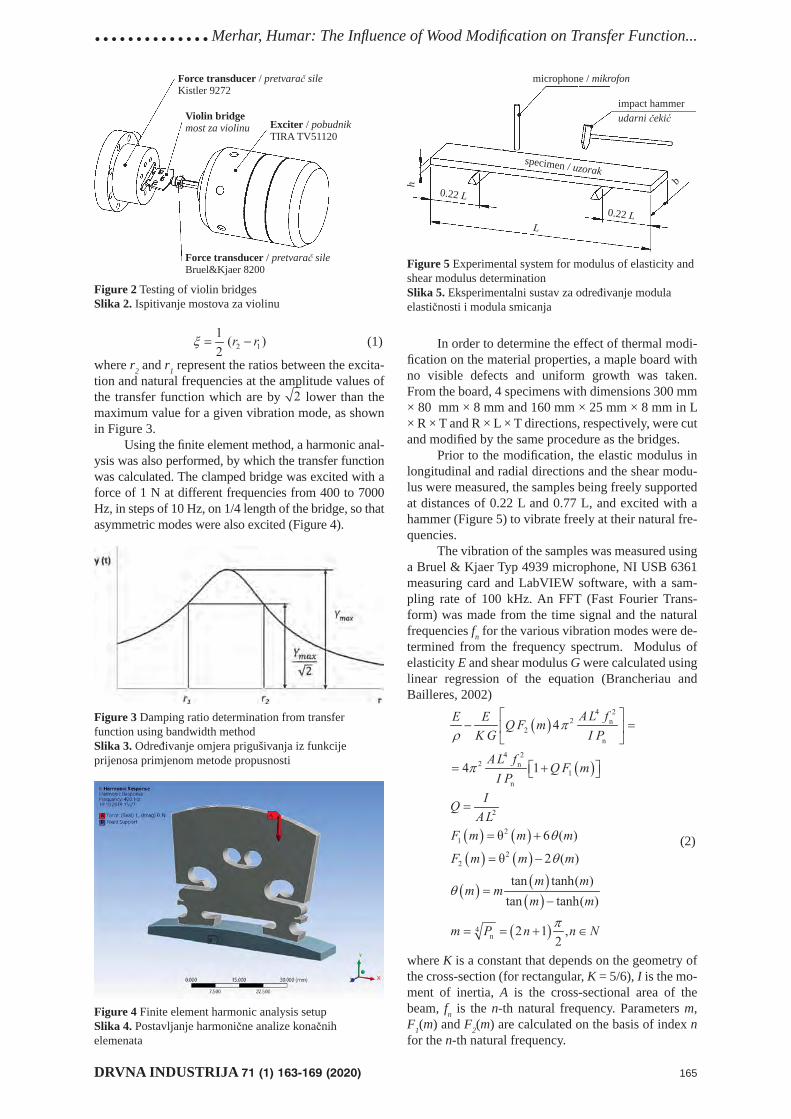
..............Merhar, Humar: The Infl uence of Wood Modifi cation on Transfer Function...
DRVNA INDUSTRIJA 71 (1) 163-169 (2020) 165
(1)
where r2 and r1 represent the ratios between the excita-tion and natural frequencies at the amplitude values of the transfer function which are by lower than the maximum value for a given vibration mode, as shown in Figure 3.
Using the fi nite element method, a harmonic anal-ysis was also performed, by which the transfer function was calculated. The clamped bridge was excited with a force of 1 N at different frequencies from 400 to 7000 Hz, in steps of 10 Hz, on 1/4 length of the bridge, so that asymmetric modes were also excited (Figure 4).
In order to determine the effect of thermal modi-fi cation on the material properties, a maple board with no visible defects and uniform growth was taken. From the board, 4 specimens with dimensions 300 mm × 80 mm × 8 mm and 160 mm × 25 mm × 8 mm in L × R × T and R × L × T directions, respectively, were cut and modifi ed by the same procedure as the bridges.
Prior to the modifi cation, the elastic modulus in longitudinal and radial directions and the shear modu-lus were measured, the samples being freely supported at distances of 0.22 L and 0.77 L, and excited with a hammer (Figure 5) to vibrate freely at their natural fre-quencies.
The vibration of the samples was measured using a Bruel & Kjaer Typ 4939 microphone, NI USB 6361 measuring card and LabVIEW software, with a sam-pling rate of 100 kHz. An FFT (Fast Fourier Trans-form) was made from the time signal and the natural frequencies fn for the various vibration modes were de-termined from the frequency spectrum. Modulus of elasticity E and shear modulus G were calculated using linear regression of the equation (Brancheriau and Bailleres, 2002)
(2)
where K is a constant that depends on the geometry of the cross-section (for rectangular, K = 5/6), I is the mo-ment of inertia, A is the cross-sectional area of the beam, fn is the n-th natural frequency. Parameters m, F1(m) and F2(m) are calculated on the basis of index n for the n-th natural frequency.
Figure 2 Testing of violin bridgesSlika 2. Ispitivanje mostova za violinu
Exciter / pobudnikTIRA TV51120
Force transducer / pretvarač sileKistler 9272
Violin bridgemost za violinu
Force transducer / pretvarač sileBruel&Kjaer 8200
Figure 3 Damping ratio determination from transfer function using bandwidth methodSlika 3. Određivanje omjera prigušivanja iz funkcije prijenosa primjenom metode propusnosti
Figure 4 Finite element harmonic analysis setupSlika 4. Postavljanje harmonične analize konačnih elemenata
Figure 5 Experimental system for modulus of elasticity and shear modulus determinationSlika 5. Eksperimentalni sustav za određivanje modula elastičnosti i modula smicanja
microphone / mikrofon
impact hammerudarni čekić
specimen / uzorak
0.22 L0.22 L
L
bh
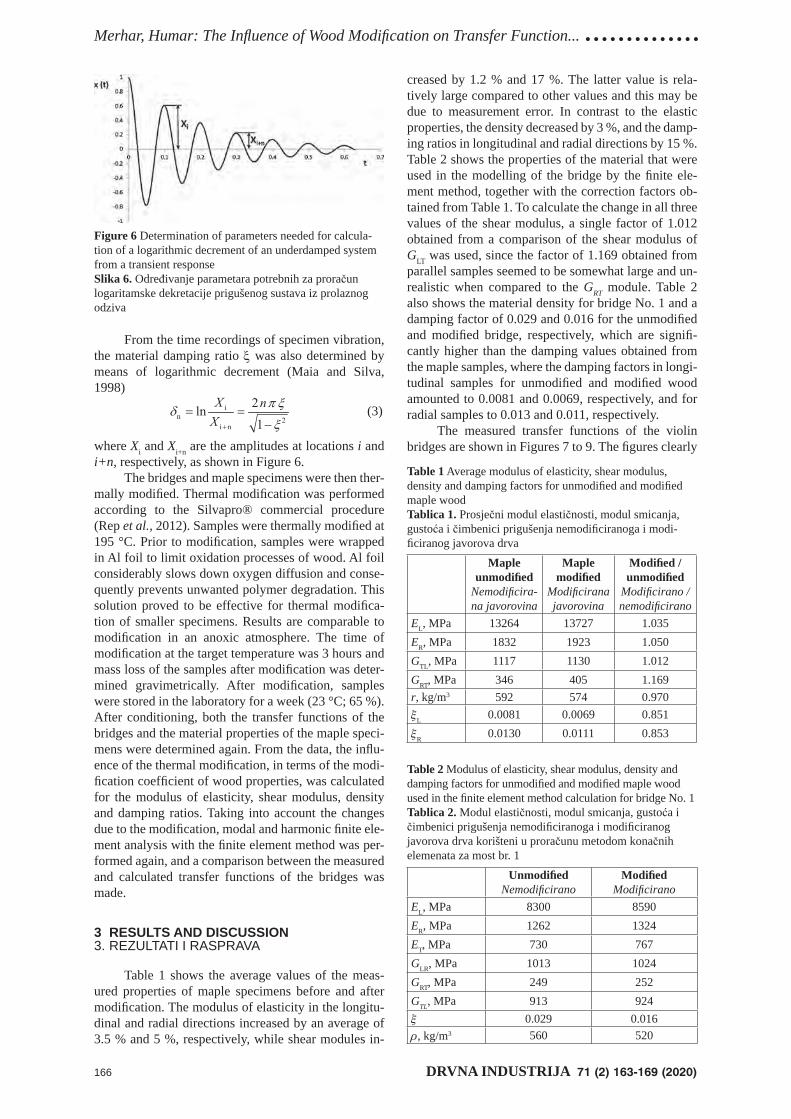
Merhar, Humar: The Infl uence of Wood Modifi cation on Transfer Function... ..............
166 DRVNA INDUSTRIJA 71 (2) 163-169 (2020)
creased by 1.2 % and 17 %. The latter value is rela-tively large compared to other values and this may be due to measurement error. In contrast to the elastic properties, the density decreased by 3 %, and the damp-ing ratios in longitudinal and radial directions by 15 %. Table 2 shows the properties of the material that were used in the modelling of the bridge by the fi nite ele-ment method, together with the correction factors ob-tained from Table 1. To calculate the change in all three values of the shear modulus, a single factor of 1.012 obtained from a comparison of the shear modulus of GLT was used, since the factor of 1.169 obtained from parallel samples seemed to be somewhat large and un-realistic when compared to the GRT module. Table 2 also shows the material density for bridge No. 1 and a damping factor of 0.029 and 0.016 for the unmodifi ed and modifi ed bridge, respectively, which are signifi -cantly higher than the damping values obtained from the maple samples, where the damping factors in longi-tudinal samples for unmodifi ed and modifi ed wood amounted to 0.0081 and 0.0069, respectively, and for radial samples to 0.013 and 0.011, respectively.
The measured transfer functions of the violin bridges are shown in Figures 7 to 9. The fi gures clearly
From the time recordings of specimen vibration, the material damping ratio was also determined by means of logarithmic decrement (Maia and Silva, 1998)
(3)
where Xi and Xi+n are the amplitudes at locations i and i+n, respectively, as shown in Figure 6.
The bridges and maple specimens were then ther-mally modifi ed. Thermal modifi cation was performed according to the Silvapro® commercial procedure (Rep et al., 2012). Samples were thermally modifi ed at 195 °C. Prior to modifi cation, samples were wrapped in Al foil to limit oxidation processes of wood. Al foil considerably slows down oxygen diffusion and conse-quently prevents unwanted polymer degradation. This solution proved to be effective for thermal modifi ca-tion of smaller specimens. Results are comparable to modifi cation in an anoxic atmosphere. The time of modifi cation at the target temperature was 3 hours and mass loss of the samples after modifi cation was deter-mined gravimetrically. After modifi cation, samples were stored in the laboratory for a week (23 °C; 65 %). After conditioning, both the transfer functions of the bridges and the material properties of the maple speci-mens were determined again. From the data, the infl u-ence of the thermal modifi cation, in terms of the modi-fi cation coeffi cient of wood properties, was calculated for the modulus of elasticity, shear modulus, density and damping ratios. Taking into account the changes due to the modifi cation, modal and harmonic fi nite ele-ment analysis with the fi nite element method was per-formed again, and a comparison between the measured and calculated transfer functions of the bridges was made.
3 RESULTS AND DISCUSSION3. REZULTATI I RASPRAVA
Table 1 shows the average values of the meas-ured properties of maple specimens before and after modifi cation. The modulus of elasticity in the longitu-dinal and radial directions increased by an average of 3.5 % and 5 %, respectively, while shear modules in-
Figure 6 Determination of parameters needed for calcula-tion of a logarithmic decrement of an underdamped system from a transient responseSlika 6. Određivanje parametara potrebnih za proračun logaritamske dekretacije prigušenog sustava iz prolaznog odziva
Table 1 Average modulus of elasticity, shear modulus, density and damping factors for unmodifi ed and modifi ed maple woodTablica 1. Prosječni modul elastičnosti, modul smicanja, gustoća i čimbenici prigušenja nemodifi ciranoga i modi-fi ciranog javorova drva
Maple unmodifi ed
Nemodifi cira-na javorovina
Maple modifi ed
Modifi cirana javorovina
Modifi ed / unmodifi ed
Modifi cirano / nemodifi cirano
EL, MPa 13264 13727 1.035ER, MPa 1832 1923 1.050GTL, MPa 1117 1130 1.012GRT, MPa 346 405 1.169r, kg/m3 592 574 0.970ξL 0.0081 0.0069 0.851ξR 0.0130 0.0111 0.853
Table 2 Modulus of elasticity, shear modulus, density and damping factors for unmodifi ed and modifi ed maple wood used in the fi nite element method calculation for bridge No. 1Tablica 2. Modul elastičnosti, modul smicanja, gustoća i čimbenici prigušenja nemodifi ciranoga i modifi ciranog javorova drva korišteni u proračunu metodom konačnih elemenata za most br. 1
Unmodifi edNemodifi cirano
Modifi edModifi cirano
EL, MPa 8300 8590ER, MPa 1262 1324ET, MPa 730 767GLR, MPa 1013 1024GRT, MPa 249 252GTL, MPa 913 924ξ 0.029 0.016ρ, kg/m3 560 520
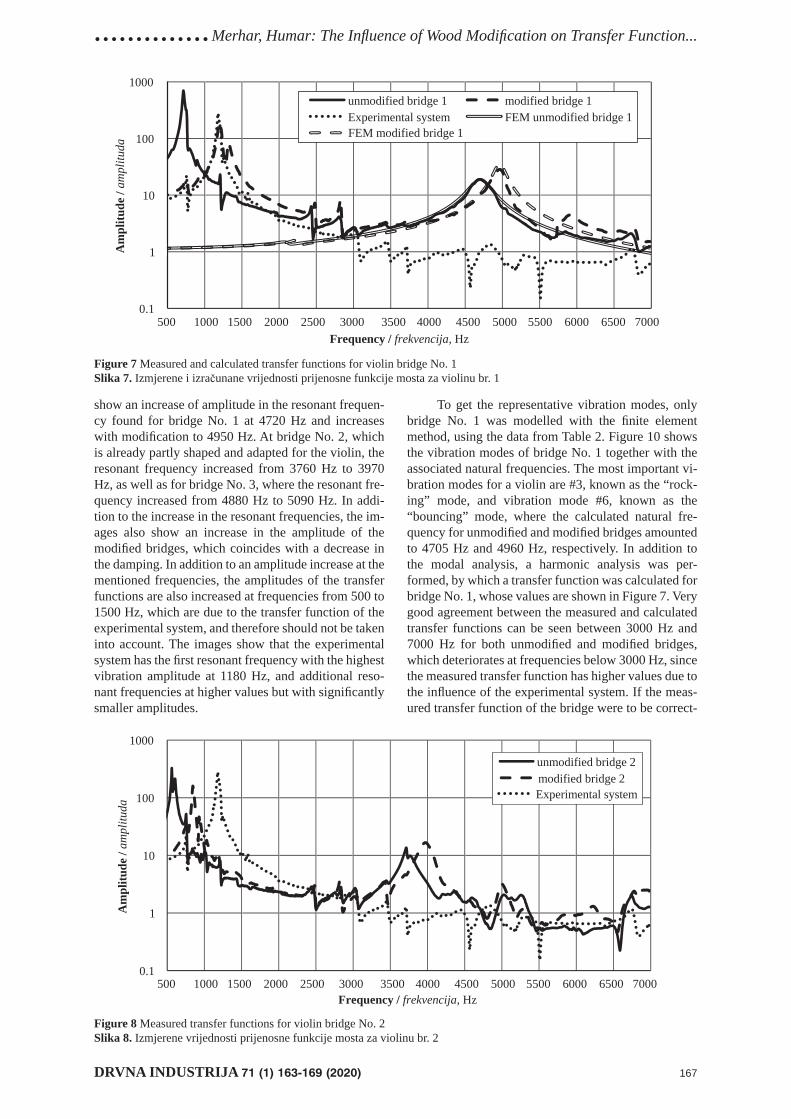
..............Merhar, Humar: The Infl uence of Wood Modifi cation on Transfer Function...
DRVNA INDUSTRIJA 71 (1) 163-169 (2020) 167
show an increase of amplitude in the resonant frequen-cy found for bridge No. 1 at 4720 Hz and increases with modifi cation to 4950 Hz. At bridge No. 2, which is already partly shaped and adapted for the violin, the resonant frequency increased from 3760 Hz to 3970 Hz, as well as for bridge No. 3, where the resonant fre-quency increased from 4880 Hz to 5090 Hz. In addi-tion to the increase in the resonant frequencies, the im-ages also show an increase in the amplitude of the modifi ed bridges, which coincides with a decrease in the damping. In addition to an amplitude increase at the mentioned frequencies, the amplitudes of the transfer functions are also increased at frequencies from 500 to 1500 Hz, which are due to the transfer function of the experimental system, and therefore should not be taken into account. The images show that the experimental system has the fi rst resonant frequency with the highest vibration amplitude at 1180 Hz, and additional reso-nant frequencies at higher values but with signifi cantly smaller amplitudes.
To get the representative vibration modes, only bridge No. 1 was modelled with the fi nite element method, using the data from Table 2. Figure 10 shows the vibration modes of bridge No. 1 together with the associated natural frequencies. The most important vi-bration modes for a violin are #3, known as the “rock-ing” mode, and vibration mode #6, known as the “bouncing” mode, where the calculated natural fre-quency for unmodifi ed and modifi ed bridges amounted to 4705 Hz and 4960 Hz, respectively. In addition to the modal analysis, a harmonic analysis was per-formed, by which a transfer function was calculated for bridge No. 1, whose values are shown in Figure 7. Very good agreement between the measured and calculated transfer functions can be seen between 3000 Hz and 7000 Hz for both unmodifi ed and modifi ed bridges, which deteriorates at frequencies below 3000 Hz, since the measured transfer function has higher values due to the infl uence of the experimental system. If the meas-ured transfer function of the bridge were to be correct-
0.1
1
10
100
1000
500 1000 1500 2000 2500 3000 3500 4000 4500 5000 5500 6000 6500 7000
Am
plitu
de /
ampl
ituda
Frequency / frekvencija, Hz
unmodified bridge 1 modified bridge 1Experimental system FEM unmodified bridge 1FEM modified bridge 1
0.1
1
10
100
1000
500 1000 1500 2000 2500 3000 3500 4000 4500 5000 5500 6000 6500 7000
unmodified bridge 2modified bridge 2Experimental system
Frequency / frekvencija, Hz
Am
plitu
de /
ampl
ituda
Figure 7 Measured and calculated transfer functions for violin bridge No. 1Slika 7. Izmjerene i izračunane vrijednosti prijenosne funkcije mosta za violinu br. 1
Figure 8 Measured transfer functions for violin bridge No. 2Slika 8. Izmjerene vrijednosti prijenosne funkcije mosta za violinu br. 2
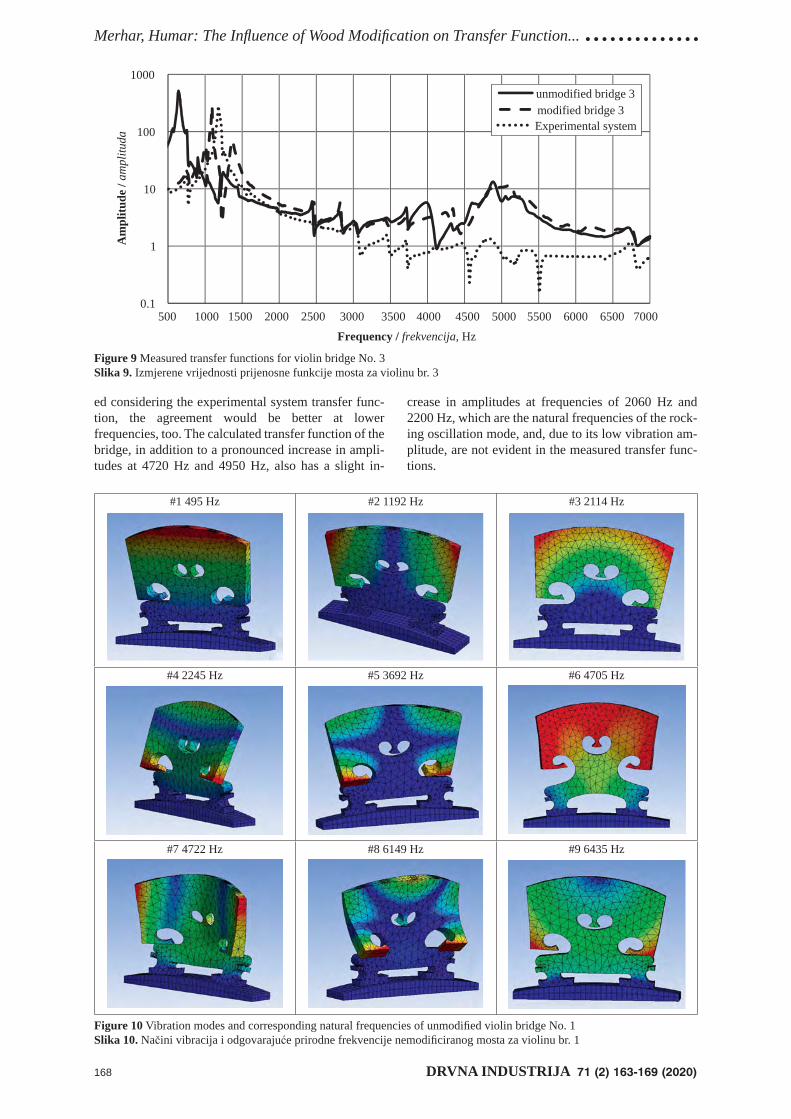
Merhar, Humar: The Infl uence of Wood Modifi cation on Transfer Function... ..............
168 DRVNA INDUSTRIJA 71 (2) 163-169 (2020)
ed considering the experimental system transfer func-tion, the agreement would be better at lower frequencies, too. The calculated transfer function of the bridge, in addition to a pronounced increase in ampli-tudes at 4720 Hz and 4950 Hz, also has a slight in-
crease in amplitudes at frequencies of 2060 Hz and 2200 Hz, which are the natural frequencies of the rock-ing oscillation mode, and, due to its low vibration am-plitude, are not evident in the measured transfer func-tions.
0.1
1
10
100
1000
500 1000 1500 2000 2500 3000 3500 4000 4500 5000 5500 6000 6500 7000
unmodified bridge 3modified bridge 3Experimental system
Frequency / frekvencija, Hz
Am
plitu
de /
ampl
ituda
Figure 9 Measured transfer functions for violin bridge No. 3Slika 9. Izmjerene vrijednosti prijenosne funkcije mosta za violinu br. 3
#1 495 Hz #2 1192 Hz #3 2114 Hz
#4 2245 Hz #5 3692 Hz #6 4705 Hz
#7 4722 Hz #8 6149 Hz #9 6435 Hz
Figure 10 Vibration modes and corresponding natural frequencies of unmodifi ed violin bridge No. 1Slika 10. Načini vibracija i odgovarajuće prirodne frekvencije nemodifi ciranog mosta za violinu br. 1
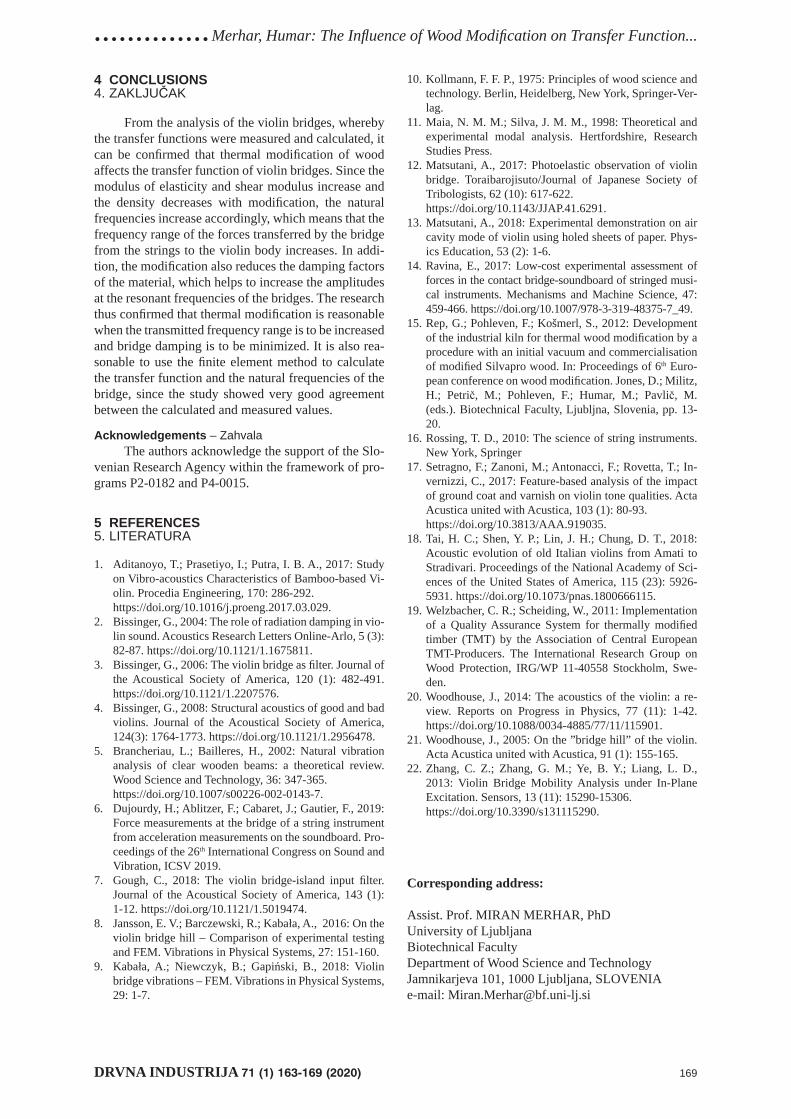
..............Merhar, Humar: The Infl uence of Wood Modifi cation on Transfer Function...
DRVNA INDUSTRIJA 71 (1) 163-169 (2020) 169
4 CONCLUSIONS4. ZAKLJUČAK
From the analysis of the violin bridges, whereby the transfer functions were measured and calculated, it can be confi rmed that thermal modifi cation of wood affects the transfer function of violin bridges. Since the modulus of elasticity and shear modulus increase and the density decreases with modifi cation, the natural frequencies increase accordingly, which means that the frequency range of the forces transferred by the bridge from the strings to the violin body increases. In addi-tion, the modifi cation also reduces the damping factors of the material, which helps to increase the amplitudes at the resonant frequencies of the bridges. The research thus confi rmed that thermal modifi cation is reasonable when the transmitted frequency range is to be increased and bridge damping is to be minimized. It is also rea-sonable to use the fi nite element method to calculate the transfer function and the natural frequencies of the bridge, since the study showed very good agreement between the calculated and measured values.
Acknowledgements – ZahvalaThe authors acknowledge the support of the Slo-
venian Research Agency within the framework of pro-grams P2-0182 and P4-0015.
5 REFERENCES5. LITERATURA
1. Aditanoyo, T.; Prasetiyo, I.; Putra, I. B. A., 2017: Study on Vibro-acoustics Characteristics of Bamboo-based Vi-olin. Procedia Engineering, 170: 286-292.
https://doi.org/10.1016/j.proeng.2017.03.029.2. Bissinger, G., 2004: The role of radiation damping in vio-
lin sound. Acoustics Research Letters Online-Arlo, 5 (3): 82-87. https://doi.org/10.1121/1.1675811.
3. Bissinger, G., 2006: The violin bridge as fi lter. Journal of the Acoustical Society of America, 120 (1): 482-491. https://doi.org/10.1121/1.2207576.
4. Bissinger, G., 2008: Structural acoustics of good and bad violins. Journal of the Acoustical Society of America, 124(3): 1764-1773. https://doi.org/10.1121/1.2956478.
5. Brancheriau, L.; Bailleres, H., 2002: Natural vibration analysis of clear wooden beams: a theoretical review. Wood Science and Technology, 36: 347-365.
https://doi.org/10.1007/s00226-002-0143-7.6. Dujourdy, H.; Ablitzer, F.; Cabaret, J.; Gautier, F., 2019:
Force measurements at the bridge of a string instrument from acceleration measurements on the soundboard. Pro-ceedings of the 26th International Congress on Sound and Vibration, ICSV 2019.
7. Gough, C., 2018: The violin bridge-island input fi lter. Journal of the Acoustical Society of America, 143 (1): 1-12. https://doi.org/10.1121/1.5019474.
8. Jansson, E. V.; Barczewski, R.; Kabała, A., 2016: On the violin bridge hill – Comparison of experimental testing and FEM. Vibrations in Physical Systems, 27: 151-160.
9. Kabała, A.; Niewczyk, B.; Gapiński, B., 2018: Violin bridge vibrations – FEM. Vibrations in Physical Systems, 29: 1-7.
10. Kollmann, F. F. P., 1975: Principles of wood science and technology. Berlin, Heidelberg, New York, Springer-Ver-lag.
11. Maia, N. M. M.; Silva, J. M. M., 1998: Theoretical and experimental modal analysis. Hertfordshire, Research Studies Press.
12. Matsutani, A., 2017: Photoelastic observation of violin bridge. Toraibarojisuto/Journal of Japanese Society of Tribologists, 62 (10): 617-622.
https://doi.org/10.1143/JJAP.41.6291.13. Matsutani, A., 2018: Experimental demonstration on air
cavity mode of violin using holed sheets of paper. Phys-ics Education, 53 (2): 1-6.
14. Ravina, E., 2017: Low-cost experimental assessment of forces in the contact bridge-soundboard of stringed musi-cal instruments. Mechanisms and Machine Science, 47: 459-466. https://doi.org/10.1007/978-3-319-48375-7_49.
15. Rep, G.; Pohleven, F.; Košmerl, S., 2012: Development of the industrial kiln for thermal wood modifi cation by a procedure with an initial vacuum and commercialisation of modifi ed Silvapro wood. In: Proceedings of 6th Euro-pean conference on wood modifi cation. Jones, D.; Militz, H.; Petrič, M.; Pohleven, F.; Humar, M.; Pavlič, M. (eds.). Biotechnical Faculty, Ljubljna, Slovenia, pp. 13-20.
16. Rossing, T. D., 2010: The science of string instruments. New York, Springer
17. Setragno, F.; Zanoni, M.; Antonacci, F.; Rovetta, T.; In-vernizzi, C., 2017: Feature-based analysis of the impact of ground coat and varnish on violin tone qualities. Acta Acustica united with Acustica, 103 (1): 80-93.
https://doi.org/10.3813/AAA.919035.18. Tai, H. C.; Shen, Y. P.; Lin, J. H.; Chung, D. T., 2018:
Acoustic evolution of old Italian violins from Amati to Stradivari. Proceedings of the National Academy of Sci-ences of the United States of America, 115 (23): 5926-5931. https://doi.org/10.1073/pnas.1800666115.
19. Welzbacher, C. R.; Scheiding, W., 2011: Implementation of a Quality Assurance System for thermally modifi ed timber (TMT) by the Association of Central European TMT-Producers. The International Research Group on Wood Protection, IRG/WP 11-40558 Stockholm, Swe-den.
20. Woodhouse, J., 2014: The acoustics of the violin: a re-view. Reports on Progress in Physics, 77 (11): 1-42. https://doi.org/10.1088/0034-4885/77/11/115901.
21. Woodhouse, J., 2005: On the ”bridge hill” of the violin. Acta Acustica united with Acustica, 91 (1): 155-165.
22. Zhang, C. Z.; Zhang, G. M.; Ye, B. Y.; Liang, L. D., 2013: Violin Bridge Mobility Analysis under In-Plane Excitation. Sensors, 13 (11): 15290-15306.
https://doi.org/10.3390/s131115290.
Corresponding address:
Assist. Prof. MIRAN MERHAR, PhDUniversity of LjubljanaBiotechnical FacultyDepartment of Wood Science and TechnologyJamnikarjeva 101, 1000 Ljubljana, SLOVENIAe-mail: [email protected]
......Straže, Klarić, Budrović, Pervan: Characterisation and Modelling of Drying Kinetics...
DRVNA INDUSTRIJA 71 (2) 171-177 (2020) 171
Aleš Straže1, Miljenko Klarić2, Zlatko Budrović2, Stjepan Pervan2
Characterisation and Modelling of Drying Kinetics of Thin Ash and Oak Wood Lamellas Dried with Infrared Radiation and Hot AirKarakterizacija i modeliranje kinetike sušenja tankih lamela drva jasena i hrasta infracrvenim zračenjem i vrućim zrakom
Original scientifi c paper • Izvorni znanstveni radReceived – prispjelo: 20. 10. 2019.Accepted – prihvaćeno: 28. 4. 2020.UDK: 630*847.2; 630*847.3; 630*847.7 https://doi.org/10.5552/drvind.2020.1965
ABSTRACT • Infrared and hot air drying characteristics of thin ash (Fraxinus excelsior L.) and oak (Quercus robur L.) wood lamellas were experimentally determined using an infrared and hot air laboratory device. Drying curves of 2 mm thick lamellas were established in the temperature range between 60 °C and 90 °C, and fi tted by Fick’s diffusion model. Drying effi ciency, drying rate and effective diffusivity have been estimated and compared between the used drying techniques. Moisture ratio exponentially decayed with duration of the process at all used temperatures. Effective diffusivity was greater in ash than oak wood, and it was not signifi cantly infl uenced by the drying technique. The increased bound water diffusivity with increased drying temperature that caused shortening of the drying process was confi rmed in both wood species. Similar activation energy was determined with both wood species, lower when the IR drying technique was used.
Key words: wood drying kinetics; hot air drying; infrared drying; moisture diffusion
SAŽETAK • Obilježja infracrvenog sušenja i sušenja vrućim zrakom tankih lamela drva jasena (Fraxinus excelsi-or L.) i drva hrasta (Quercus robur L.) utvrđene su eksperimentalno uz pomoć laboratorijskih uređaja za infracr-veno sušenje i sušenje vrućim zrakom. Krivulje sušenja lamela debljine 2 mm utvrđene su u rasponu temperatura između 60 i 90 °C te su prilagođene Fickovu difuzijskome modelu. Učinkovitost i brzina sušenja te efektivna difu-znost procijenjene su i uspoređene unutar primijenjenih tehnika sušenja. Omjer sadržaja vode eksponencijalno se smanjuje s trajanjem procesa pri svim temperaturama primijenjenima u eksperimentu. Efektivna je difuznost drva jasena bila veća nego drva hrasta, a tehnike sušenja nisu znatnije utjecale na nju. Za obje vrste drva potvrđena je veća difuznost vezane vode s povećanjem temperature sušenja, što je uzrokovalo skraćenje procesa sušenja. Slična je energija aktivacije utvrđena za obje vrste drva, a niža je zabilježena pri IC tehnikama sušenja.
Ključne riječi: kinetika sušenja drva; sušenje vrućim zrakom; infracrveno sušenje; difuzija vlage
1 Author is associated professor at University of Ljubljana, Biotechnical Faculty, Department of Wood Science and Technology, Ljubljana, Republic of Slovenia.
2 Authors are assistant professor, PhD student and professor at University of Zagreb, Faculty of Forestry, Department of Wood Technology, Zagreb, Republic of Croatia.
© 2020 by the author(s).Licensee Faculty of Forestry, University of Zagreb.
This article is an open access article distributedunder the terms and conditions of the
Creative Commons Attribution (CC BY 4.0) license.
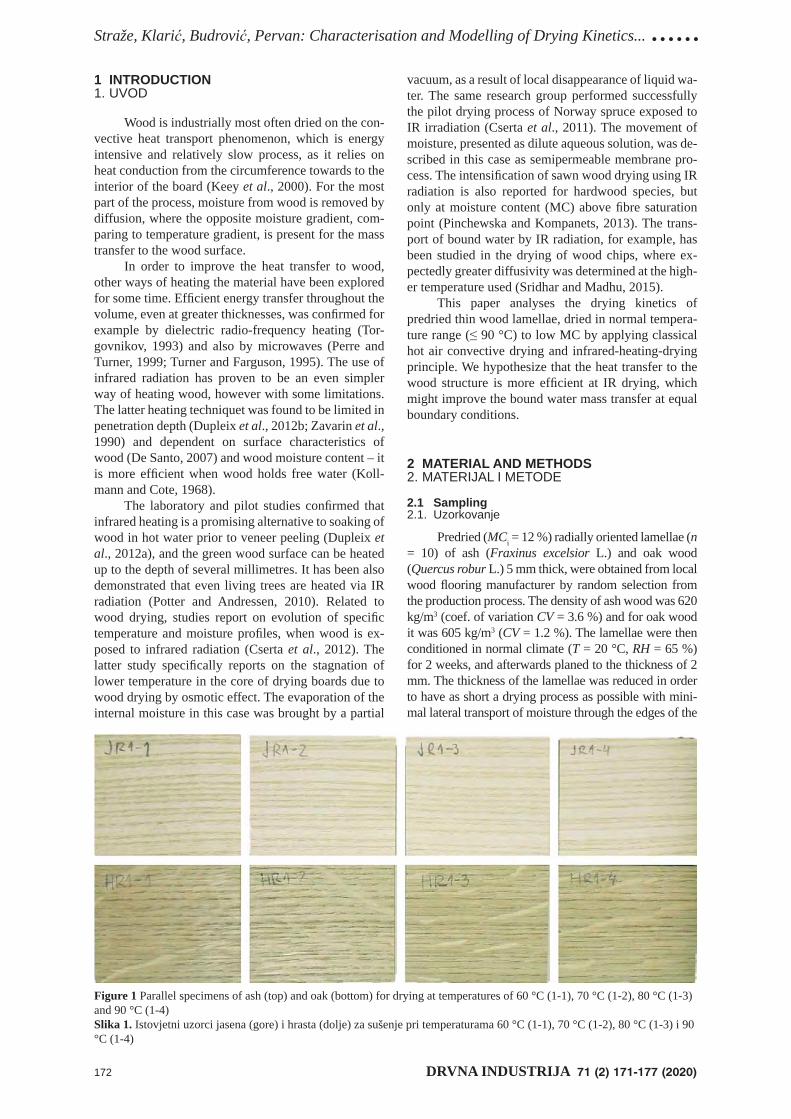
Straže, Klarić, Budrović, Pervan: Characterisation and Modelling of Drying Kinetics... ......
172 DRVNA INDUSTRIJA 71 (2) 171-177 (2020)
vacuum, as a result of local disappearance of liquid wa-ter. The same research group performed successfully the pilot drying process of Norway spruce exposed to IR irradiation (Cserta et al., 2011). The movement of moisture, presented as dilute aqueous solution, was de-scribed in this case as semipermeable membrane pro-cess. The intensifi cation of sawn wood drying using IR radiation is also reported for hardwood species, but only at moisture content (MC) above fi bre saturation point (Pinchewska and Kompanets, 2013). The trans-port of bound water by IR radiation, for example, has been studied in the drying of wood chips, where ex-pectedly greater diffusivity was determined at the high-er temperature used (Sridhar and Madhu, 2015).
This paper analyses the drying kinetics of predried thin wood lamellae, dried in normal tempera-ture range (≤ 90 °C) to low MC by applying classical hot air convective drying and infrared-heating-drying principle. We hypothesize that the heat transfer to the wood structure is more effi cient at IR drying, which might improve the bound water mass transfer at equal boundary conditions.
2 MATERIAL AND METHODS2. MATERIJAL I METODE
2.1 Sampling2.1. Uzorkovanje
Predried (MCi = 12 %) radially oriented lamellae (n = 10) of ash (Fraxinus excelsior L.) and oak wood (Quercus robur L.) 5 mm thick, were obtained from local wood fl ooring manufacturer by random selection from the production process. The density of ash wood was 620 kg/m3 (coef. of variation CV = 3.6 %) and for oak wood it was 605 kg/m3 (CV = 1.2 %). The lamellae were then conditioned in normal climate (T = 20 °C, RH = 65 %) for 2 weeks, and afterwards planed to the thickness of 2 mm. The thickness of the lamellae was reduced in order to have as short a drying process as possible with mini-mal lateral transport of moisture through the edges of the
1 INTRODUCTION1. UVOD
Wood is industrially most often dried on the con-vective heat transport phenomenon, which is energy intensive and relatively slow process, as it relies on heat conduction from the circumference towards to the interior of the board (Keey et al., 2000). For the most part of the process, moisture from wood is removed by diffusion, where the opposite moisture gradient, com-paring to temperature gradient, is present for the mass transfer to the wood surface.
In order to improve the heat transfer to wood, other ways of heating the material have been explored for some time. Effi cient energy transfer throughout the volume, even at greater thicknesses, was confi rmed for example by dielectric radio-frequency heating (Tor-govnikov, 1993) and also by microwaves (Perre and Turner, 1999; Turner and Farguson, 1995). The use of infrared radiation has proven to be an even simpler way of heating wood, however with some limitations. The latter heating techniquet was found to be limited in penetration depth (Dupleix et al., 2012b; Zavarin et al., 1990) and dependent on surface characteristics of wood (De Santo, 2007) and wood moisture content – it is more effi cient when wood holds free water (Koll-mann and Cote, 1968).
The laboratory and pilot studies confi rmed that infrared heating is a promising alternative to soaking of wood in hot water prior to veneer peeling (Dupleix et al., 2012a), and the green wood surface can be heated up to the depth of several millimetres. It has been also demonstrated that even living trees are heated via IR radiation (Potter and Andressen, 2010). Related to wood drying, studies report on evolution of specifi c temperature and moisture profi les, when wood is ex-posed to infrared radiation (Cserta et al., 2012). The latter study specifi cally reports on the stagnation of lower temperature in the core of drying boards due to wood drying by osmotic effect. The evaporation of the internal moisture in this case was brought by a partial
Figure 1 Parallel specimens of ash (top) and oak (bottom) for drying at temperatures of 60 °C (1-1), 70 °C (1-2), 80 °C (1-3) and 90 °C (1-4)Slika 1. Istovjetni uzorci jasena (gore) i hrasta (dolje) za sušenje pri temperaturama 60 °C (1-1), 70 °C (1-2), 80 °C (1-3) i 90 °C (1-4)
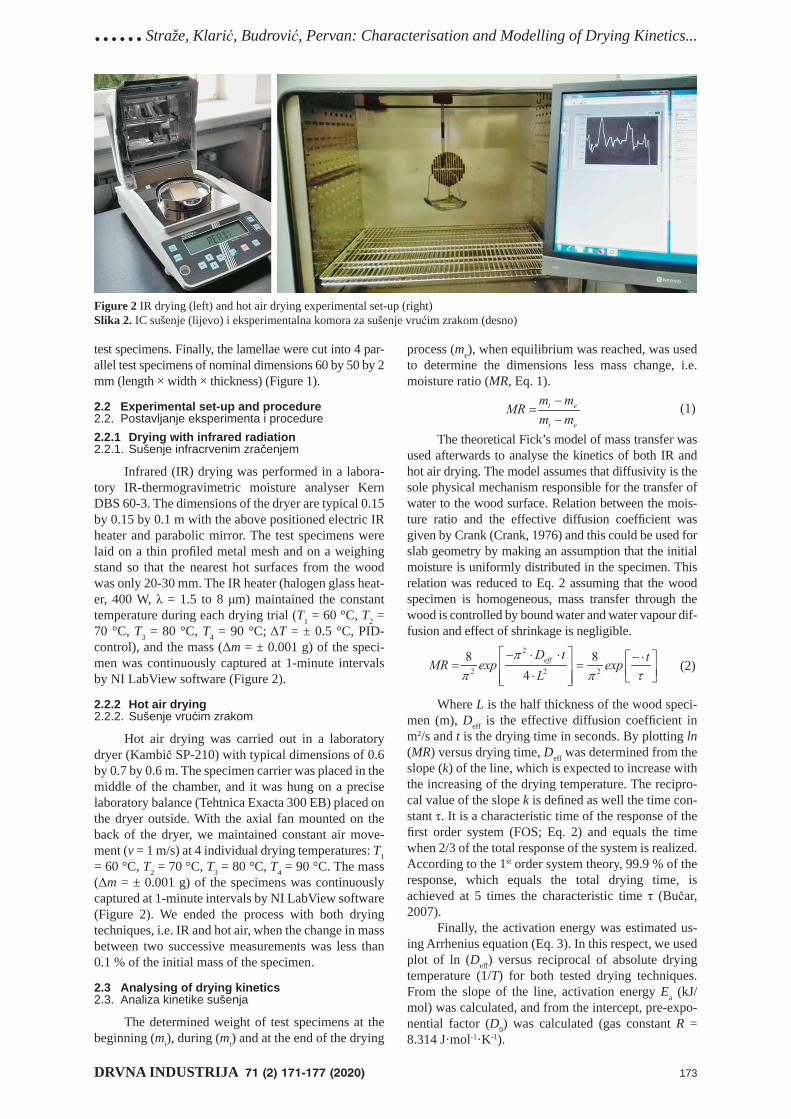
......Straže, Klarić, Budrović, Pervan: Characterisation and Modelling of Drying Kinetics...
DRVNA INDUSTRIJA 71 (2) 171-177 (2020) 173
process (me), when equilibrium was reached, was used to determine the dimensions less mass change, i.e. moisture ratio (MR, Eq. 1).
(1)
The theoretical Fick’s model of mass transfer was used afterwards to analyse the kinetics of both IR and hot air drying. The model assumes that diffusivity is the sole physical mechanism responsible for the transfer of water to the wood surface. Relation between the mois-ture ratio and the effective diffusion coeffi cient was given by Crank (Crank, 1976) and this could be used for slab geometry by making an assumption that the initial moisture is uniformly distributed in the specimen. This relation was reduced to Eq. 2 assuming that the wood specimen is homogeneous, mass transfer through the wood is controlled by bound water and water vapour dif-fusion and effect of shrinkage is negligible.
(2)
Where L is the half thickness of the wood speci-men (m), Deff is the effective diffusion coeffi cient in m2/s and t is the drying time in seconds. By plotting ln (MR) versus drying time, Deff was determined from the slope (k) of the line, which is expected to increase with the increasing of the drying temperature. The recipro-cal value of the slope k is defi ned as well the time con-stant τ. It is a characteristic time of the response of the fi rst order system (FOS; Eq. 2) and equals the time when 2/3 of the total response of the system is realized. According to the 1st order system theory, 99.9 % of the response, which equals the total drying time, is achieved at 5 times the characteristic time τ (Bučar, 2007).
Finally, the activation energy was estimated us-ing Arrhenius equation (Eq. 3). In this respect, we used plot of ln (Deff) versus reciprocal of absolute drying temperature (1/T) for both tested drying techniques. From the slope of the line, activation energy Ea (kJ/mol) was calculated, and from the intercept, pre-expo-nential factor (D0) was calculated (gas constant R = 8.314 J·mol-1·K-1).
test specimens. Finally, the lamellae were cut into 4 par-allel test specimens of nominal dimensions 60 by 50 by 2 mm (length × width × thickness) (Figure 1).
2.2 Experimental set-up and procedure2.2. Postavljanje eksperimenta i procedure2.2.1 Drying with infrared radiation2.2.1. Sušenje infracrvenim zračenjem
Infrared (IR) drying was performed in a labora-tory IR-thermogravimetric moisture analyser Kern DBS 60-3. The dimensions of the dryer are typical 0.15 by 0.15 by 0.1 m with the above positioned electric IR heater and parabolic mirror. The test specimens were laid on a thin profi led metal mesh and on a weighing stand so that the nearest hot surfaces from the wood was only 20-30 mm. The IR heater (halogen glass heat-er, 400 W, λ = 1.5 to 8 μm) maintained the constant temperature during each drying trial (T1 = 60 °C, T2 = 70 °C, T3 = 80 °C, T4 = 90 °C; ΔT = ± 0.5 °C, PID-control), and the mass (Δm = ± 0.001 g) of the speci-men was continuously captured at 1-minute intervals by NI LabView software (Figure 2).
2.2.2 Hot air drying2.2.2. Sušenje vrućim zrakom
Hot air drying was carried out in a laboratory dryer (Kambič SP-210) with typical dimensions of 0.6 by 0.7 by 0.6 m. The specimen carrier was placed in the middle of the chamber, and it was hung on a precise laboratory balance (Tehtnica Exacta 300 EB) placed on the dryer outside. With the axial fan mounted on the back of the dryer, we maintained constant air move-ment (v = 1 m/s) at 4 individual drying temperatures: T1 = 60 °C, T2 = 70 °C, T3 = 80 °C, T4 = 90 °C. The mass (Δm = ± 0.001 g) of the specimens was continuously captured at 1-minute intervals by NI LabView software (Figure 2). We ended the process with both drying techniques, i.e. IR and hot air, when the change in mass between two successive measurements was less than 0.1 % of the initial mass of the specimen.
2.3 Analysing of drying kinetics2.3. Analiza kinetike sušenja
The determined weight of test specimens at the beginning (mi), during (mt) and at the end of the drying
Figure 2 IR drying (left) and hot air drying experimental set-up (right)Slika 2. IC sušenje (lijevo) i eksperimentalna komora za sušenje vrućim zrakom (desno)

Straže, Klarić, Budrović, Pervan: Characterisation and Modelling of Drying Kinetics... ......
174 DRVNA INDUSTRIJA 71 (2) 171-177 (2020)
were inhibited. Eighteen measurements were conduct-ed for each wood species.
3 RESULTS AND DISCUSSION3. REZULTATI I RASPRAVA
3.1 Drying kinetics3.1. Kinetika sušenja
Fick’s law of diffusion described well drying ki-netics of ash and oak with both used techniques in the studied temperature range (0.83 ≤ R2 ≤ 0.96).
In the case of IR drying, the fastest process ex-pectedly took place at the highest used temperature (90 °C) and was 2 times faster in ash than in oak (τash = 7.3 min, τoak = 14.7 min). Lowering of drying temperature signifi cantly decreased the drying rate of both wood species tested. The slowest response was achieved with IR drying at 60 °C, where the calculated (Eq. 2) char-acteristic drying time was 28.7 min for ash, and 49.0 min for oak. As different drying temperatures were used, mean fi nal – equilibrium wood moisture content (MCe) also varied from 1.1 % at 60 °C to 0.1 % at 90 °C (Figure 3).
The hot air drying of ash went about as fast as or slightly slower than infrared drying of this wood spe-cies. The lowest characteristic time was determined for drying at 90 °C (τ90 = 8.6 min), lower for drying at 80 °C (τ80 = 12.4 min) and 70 °C (τ70 = 23.5 min), and the lowest for drying at 60 °C (τ60 = 32.1 min) (Figure 4). Hot air drying of oak was even slightly faster (Δτ =
(3)
2.4 Determination of IR transmittance and IR absorbance
2.4. Određivanje IC transmisije i IC apsorbancije
The penetration depth of IR radiation into the wood structure was checked using a FTIR spectro-scope (Perkin Elmer Spectrum One). For this purpose, we made microtome slices in the radial-longitudinal plane of the wood on the sliding microtome (Leica SM2010R) of the two species studied. Transmission FTIR spectra were recorded on microtomic slices 10 to 100 microns thick (ΔL = 10 μm). We transformed transmission spectra into absorbance spectra and cal-culated mean IR transmittance / IR absorbance in the range from 4000 to 400 cm-1 (2.5 to 25 μm).
2.5 Determination of IR-emissivity2.5. Određivanje IC emisivnosti
A polyvinyl chloride material (3M) with known emissivity in the spectral range 7.5-13 μm (LWIR) was applied to the surface of all specimens. Thermograms were recorded with FLIR I60 thermographic camera at 50 °C, and emissivity of wood in LWIR spectral range was determined with FLIR software. The measurement parameters were as follows: air temperature 21 °C, air relative humidity 52 %, refl ected apparent temperature 20.9 °C, distance of objects surface from the lens was 120 mm, angle of measurement in relation to the object normal was 15°, and airfl ow and dotted refl ections
Figure 3 Kinetics of infrared drying of ash (left) and oak wood (right) at temperature between 60 °C and 90 °C (× 60 °C, Δ 70 °C, □ 80 °C, ○ 90 °C).Slika 3. Kinetika infracrvenog sušenja jasena (lijevo) i hrasta (desno) pri temperaturama između 60 i 90 °C (× 60 °C, Δ 70 °C, □ 80 °C, ○ 90 °C).
Figure 4 Kinetics of hot air drying of ash (left) and oak wood (right) at temperature between 60 °C and 90 °C (× 60 °C, Δ 70 °C, □ 80 °C, ○ 90 °C)Slika 4. Kinetika sušenja vrućim zrakom jasena (lijevo) i hrasta (desno) pri temperaturama između 60 i 90 °C (× 60 °C, Δ 70 °C, □ 80 °C, ○ 90 °C)
MC
/ sa
drža
j vod
e, %
Time / vrijeme, min
MC
/ sa
drža
j vod
e, %
Time / vrijeme, min
MC
/ sa
drža
j vod
e, %
Time / vrijeme, min
MC
/ sa
drža
j vod
e, %
Time / vrijeme, min
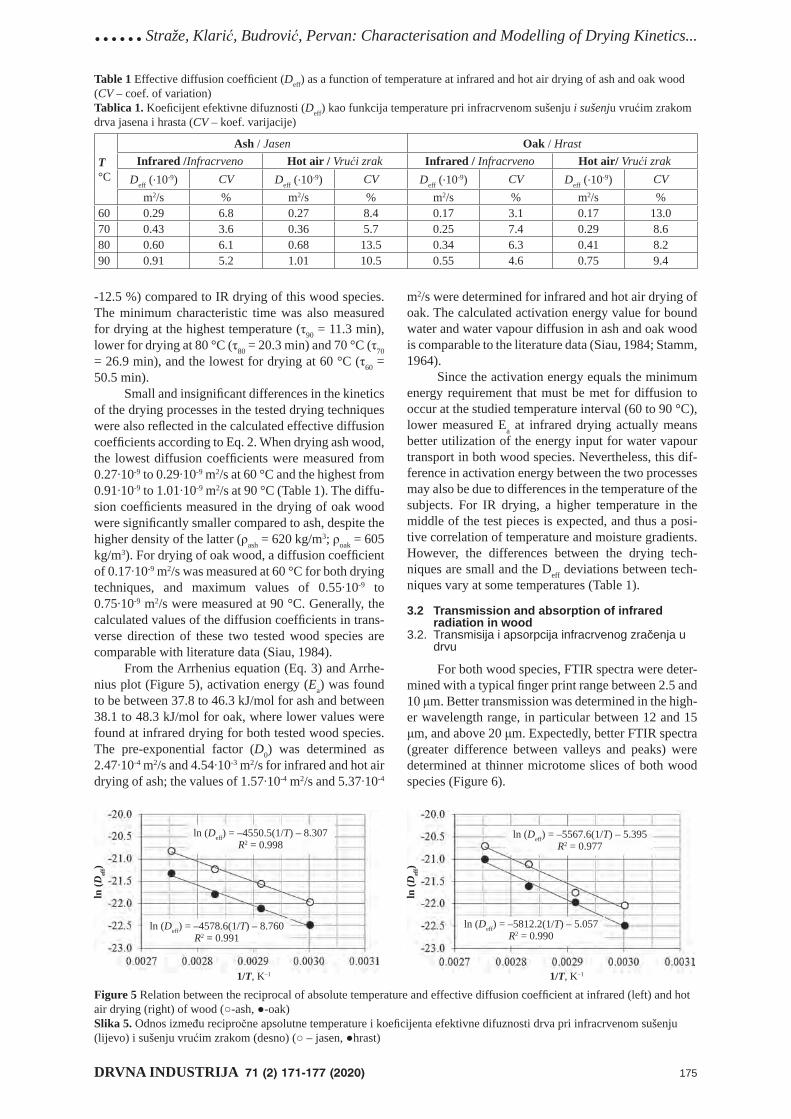
......Straže, Klarić, Budrović, Pervan: Characterisation and Modelling of Drying Kinetics...
DRVNA INDUSTRIJA 71 (2) 171-177 (2020) 175
-12.5 %) compared to IR drying of this wood species. The minimum characteristic time was also measured for drying at the highest temperature (τ90 = 11.3 min), lower for drying at 80 °C (τ80 = 20.3 min) and 70 °C (τ70 = 26.9 min), and the lowest for drying at 60 °C (τ60 = 50.5 min).
Small and insignifi cant differences in the kinetics of the drying processes in the tested drying techniques were also refl ected in the calculated effective diffusion coeffi cients according to Eq. 2. When drying ash wood, the lowest diffusion coeffi cients were measured from 0.27∙10-9 to 0.29∙10-9 m2/s at 60 °C and the highest from 0.91∙10-9 to 1.01∙10-9 m2/s at 90 °C (Table 1). The diffu-sion coeffi cients measured in the drying of oak wood were signifi cantly smaller compared to ash, despite the higher density of the latter (ρash = 620 kg/m3; ρoak = 605 kg/m3). For drying of oak wood, a diffusion coeffi cient of 0.17∙10-9 m2/s was measured at 60 °C for both drying techniques, and maximum values of 0.55∙10-9 to 0.75∙10-9 m2/s were measured at 90 °C. Generally, the calculated values of the diffusion coeffi cients in trans-verse direction of these two tested wood species are comparable with literature data (Siau, 1984).
From the Arrhenius equation (Eq. 3) and Arrhe-nius plot (Figure 5), activation energy (Ea) was found to be between 37.8 to 46.3 kJ/mol for ash and between 38.1 to 48.3 kJ/mol for oak, where lower values were found at infrared drying for both tested wood species. The pre-exponential factor (D0) was determined as 2.47∙10-4 m2/s and 4.54∙10-3 m2/s for infrared and hot air drying of ash; the values of 1.57∙10-4 m2/s and 5.37∙10-4
m2/s were determined for infrared and hot air drying of oak. The calculated activation energy value for bound water and water vapour diffusion in ash and oak wood is comparable to the literature data (Siau, 1984; Stamm, 1964).
Since the activation energy equals the minimum energy requirement that must be met for diffusion to occur at the studied temperature interval (60 to 90 °C), lower measured Ea at infrared drying actually means better utilization of the energy input for water vapour transport in both wood species. Nevertheless, this dif-ference in activation energy between the two processes may also be due to differences in the temperature of the subjects. For IR drying, a higher temperature in the middle of the test pieces is expected, and thus a posi-tive correlation of temperature and moisture gradients. However, the differences between the drying tech-niques are small and the Deff deviations between tech-niques vary at some temperatures (Table 1).
3.2 Transmission and absorption of infrared radiation in wood
3.2. Transmisija i apsorpcija infracrvenog zračenja u drvu
For both wood species, FTIR spectra were deter-mined with a typical fi nger print range between 2.5 and 10 μm. Better transmission was determined in the high-er wavelength range, in particular between 12 and 15 μm, and above 20 μm. Expectedly, better FTIR spectra (greater difference between valleys and peaks) were determined at thinner microtome slices of both wood species (Figure 6).
Table 1 Effective diffusion coeffi cient (Deff) as a function of temperature at infrared and hot air drying of ash and oak wood (CV – coef. of variation)Tablica 1. Koefi cijent efektivne difuznosti (Deff) kao funkcija temperature pri infracrvenom sušenju i sušenju vrućim zrakom drva jasena i hrasta (CV – koef. varijacije)
T°C
Ash / Jasen Oak / HrastInfrared /Infracrveno Hot air / Vrući zrak Infrared / Infracrveno Hot air/ Vrući zrak
Deff (·10-9) CV Deff (·10-9) CV Deff (·10-9) CV Deff (·10-9) CVm2/s % m2/s % m2/s % m2/s %
60 0.29 6.8 0.27 8.4 0.17 3.1 0.17 13.070 0.43 3.6 0.36 5.7 0.25 7.4 0.29 8.680 0.60 6.1 0.68 13.5 0.34 6.3 0.41 8.290 0.91 5.2 1.01 10.5 0.55 4.6 0.75 9.4
Figure 5 Relation between the reciprocal of absolute temperature and effective diffusion coeffi cient at infrared (left) and hot air drying (right) of wood (○-ash, ●-oak)Slika 5. Odnos između recipročne apsolutne temperature i koefi cijenta efektivne difuznosti drva pri infracrvenom sušenju (lijevo) i sušenju vrućim zrakom (desno) (○ – jasen, ●hrast)
ln (D
eff)
1/T, K–1
ln (Deff) = –4550.5(1/T) – 8.307R2 = 0.998
ln (Deff) = –4578.6(1/T) – 8.760R2 = 0.991
ln (D
eff)
1/T, K–1
ln (Deff) = –5567.6(1/T) – 5.395R2 = 0.977
ln (Deff) = –5812.2(1/T) – 5.057R2 = 0.990
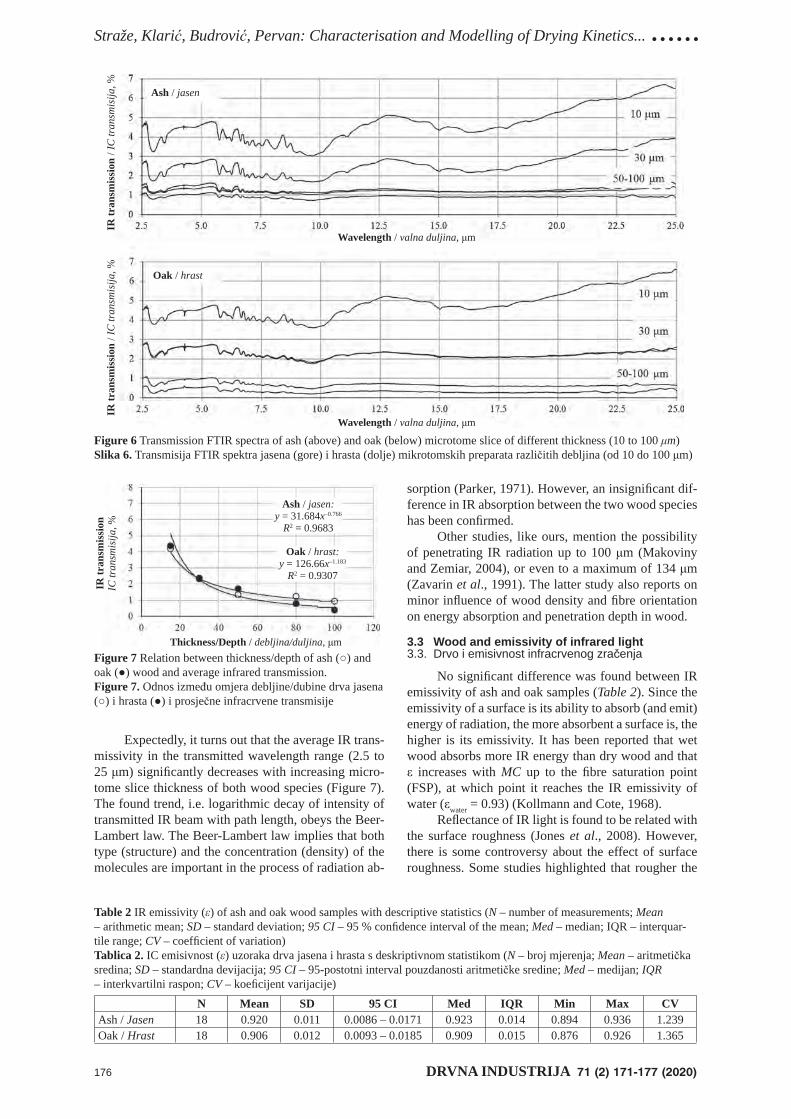
Straže, Klarić, Budrović, Pervan: Characterisation and Modelling of Drying Kinetics... ......
176 DRVNA INDUSTRIJA 71 (2) 171-177 (2020)
Expectedly, it turns out that the average IR trans-missivity in the transmitted wavelength range (2.5 to 25 μm) signifi cantly decreases with increasing micro-tome slice thickness of both wood species (Figure 7). The found trend, i.e. logarithmic decay of intensity of transmitted IR beam with path length, obeys the Beer-Lambert law. The Beer-Lambert law implies that both type (structure) and the concentration (density) of the molecules are important in the process of radiation ab-
sorption (Parker, 1971). However, an insignifi cant dif-ference in IR absorption between the two wood species has been confi rmed.
Other studies, like ours, mention the possibility of penetrating IR radiation up to 100 μm (Makoviny and Zemiar, 2004), or even to a maximum of 134 μm (Zavarin et al., 1991). The latter study also reports on minor infl uence of wood density and fi bre orientation on energy absorption and penetration depth in wood.
3.3 Wood and emissivity of infrared light3.3. Drvo i emisivnost infracrvenog zračenja
No signifi cant difference was found between IR emissivity of ash and oak samples (Table 2). Since the emissivity of a surface is its ability to absorb (and emit) energy of radiation, the more absorbent a surface is, the higher is its emissivity. It has been reported that wet wood absorbs more IR energy than dry wood and that ε increases with MC up to the fi bre saturation point (FSP), at which point it reaches the IR emissivity of water (εwater = 0.93) (Kollmann and Cote, 1968).
Refl ectance of IR light is found to be related with the surface roughness (Jones et al., 2008). However, there is some controversy about the effect of surface roughness. Some studies highlighted that rougher the
Figure 6 Transmission FTIR spectra of ash (above) and oak (below) microtome slice of different thickness (10 to 100 μm)Slika 6. Transmisija FTIR spektra jasena (gore) i hrasta (dolje) mikrotomskih preparata različitih debljina (od 10 do 100 μm)
Figure 7 Relation between thickness/depth of ash (○) and oak (●) wood and average infrared transmission.Figure 7. Odnos između omjera debljine/dubine drva jasena (○) i hrasta (●) i prosječne infracrvene transmisije
Table 2 IR emissivity (ε) of ash and oak wood samples with descriptive statistics (N – number of measurements; Mean – arithmetic mean; SD – standard deviation; 95 CI – 95 % confi dence interval of the mean; Med – median; IQR – interquar-tile range; CV – coeffi cient of variation)Tablica 2. IC emisivnost (ε) uzoraka drva jasena i hrasta s deskriptivnom statistikom (N – broj mjerenja; Mean – aritmetička sredina; SD – standardna devijacija; 95 CI – 95-postotni interval pouzdanosti aritmetičke sredine; Med – medijan; IQR – interkvartilni raspon; CV – koefi cijent varijacije)
N Mean SD 95 CI Med IQR Min Max CVAsh / Jasen 18 0.920 0.011 0.0086 – 0.0171 0.923 0.014 0.894 0.936 1.239Oak / Hrast 18 0.906 0.012 0.0093 – 0.0185 0.909 0.015 0.876 0.926 1.365
IR tr
ansm
issi
on /
IC tr
ansm
isija
, %Ash / jasen
Wavelength / valna duljina, μm
IR tr
ansm
issi
on /
IC tr
ansm
isija
, % Oak / hrast
Wavelength / valna duljina, μm
IR tr
ansm
issi
on
IC tr
ansm
isija
, %
Thickness/Depth / debljina/duljina, μm
Ash / jasen:y = 31.684x–0.766
R2 = 0.9683
Oak / hrast:y = 126.66x–1.183
R2 = 0.9307
......Straže, Klarić, Budrović, Pervan: Characterisation and Modelling of Drying Kinetics...
DRVNA INDUSTRIJA 71 (2) 171-177 (2020) 177
wood surface, the greater the refl ection and less the IR absorption due to increased light scattering (Bennett and Porteus, 1961; De Santo, 2007). The opposite was also found (Zavarin et al., 1990; 1991). It was also re-ported that the effect of surface roughness on absor-bance differs according to the wavelength (Tsuchikawa et al., 1996).
4 CONCLUSIONS4. ZAKLJUČCI
1. Fick’s law of diffusion describes well the ki-netics of infrared and hot air drying of ash and oak la-mellas between 60 °C and 90 °C. The calculated diffu-sion coeffi cient increased with used temperature and obeyed the Arrhenius law.
2. The diffusion of bound water and water va-pour, despite greater wood density, was found to be better in ash than in oak wood, which improves the drying kinetics.
3. The use of infrared radiation did not affect signifi cantly the drying kinetics in low wood MC range. Calculated transport coeffi cients of ash and oak wood, when compared to conventional hot air drying of tested species, were similar. Slightly lower activa-tion energy for transport of bound water in wood was found at IR drying.
4. The average IR transmittance wavelength range (2.5 to 25 μm) signifi cantly decreases with in-creasing wood thickness, obeying the Beer-Lambert law. IR radiation reaches ash- and oak wood depth of approx. 100 μm.
Acknowledgements – ZahvalaWe wish to thank technical assistants, Hrvoje
Kos for the preparation of drying specimens, and Luka Krže for the preparation of FTIR-microtome samples of wood. Research program No. P4-0015 was co-fi -nanced by the Slovenian Research Agency of the Re-public of Slovenia from the state budget.
5 REFERENCES5. LITERATURA
1. Bennett, H. E. J.; Porteus, J. O., 1961: Relation between surface roughness and specular refl ection at normal inci-dence. Journal of Optical Society of America, 51: 123.
2. Bučar, B., 2007: Internal and external moisture transport resistance during non-stationary adsorption of moisture into wood. Zbornik gozdarstva in lesarstva, 84: 17-21.
3. Crank, J., 1976: The Mathematics of Diffusion, vol 2, Oxford University Press, Oxford.
4. Cserta, E.; Hegedus, G.; Nemeth, R., 2011: Dryng pro-cess in Norway spruce wood exposed to infrared radia-tion. BioResources, 6 (4): 4181-4189.
5. Cserta, E.; Hegedus, G.; Nemeth, R., 2012: Evolution of temperature and moisture profi les of wood exposed to infrared radiation. BioResources, 7 (4): 5304-5311.
6. De Santo, J. A., 2007: Overview of rough surface scattering. Light Scattering and Nanoscale Surface Roughness. Nano-structure Science and Technology, Springer, New York.
7. Dupleix, A.; Ahmedou, S. A. O.; Bleron, L.; Rossi, F.; Hughes, M., 2012a: Rational production of veneer by IR-
heating of green wood during peeling. Holzforschung, 67: 53-58.
8. Dupleix, A.; De Sousa Meneses, D. M. H. R. M., 2012b: Mid infrared absorption properties of green wood. Wood Science and Technology, 47 (6): 1231-1241.
9. Jones, P. D.; Schimleck, L. R.; Daniels, R. F.; Clark, A.; Purnell, R. C., 2008: Comparison of Pinus taeda L. whole-tree wood property calibration using diffuse refl ectance near infrared spectra obtained using a variety of sampling options. Wood Science and Technology, 42 (5): 358-400.
10. Keey, R. B.; Langrish, T. A. G.; Walker, J. C. F., 2000: Kiln-drying of lumber. Springer, Hedelberg.
11. Kollmann, F.; Cote, W. A., 1968: Principles of Wood Sci-ence and Technology: Solid Wood, vol 1. Springer-Ver-lag, Berlin.
12. Makoviny, L.; Zemiar, J., 2004: Heating of wood surface layers by infrared and microwave radiation. Wood Re-search, 49 (4): 33-40.
13. Parker, F. S., 1971: Quantitative Analysis. In: Parker F. S. (ed.), Application of Infrared Spectroscopy in Biochem-istry, Biology and Medicine. Springer, Boston, pp. 80-83.
14. Perre, P.; Turner, I. W., 1999: The use of numerical simu-lation as a cognitive tool for studying the microwave dry-ing of softwood in an over-sized waveguide. Wood Sci-ence and Technology, 33: 445-464.
15. Pinchewska, O.; Kompanets, S., 2013: Hardwood drying intensifi cation. Annals of Warsaw University of Life Sci-ences, 84: 32-35.
16. Potter, B. E.; Andressen, J. A., 2010: A fi nite-difference model of temperatures and heat fl ow within a tree stem. Revue Canadienne de Recherche Forestiere, 32: 548-555.
17. Siau, J. F., 1984: Transport processes in wood. Springer-Verlag, Berlin.
18. Sridhar, D.; Madhu, G. M., 2015: Drying Kinetics and Mathematical Modeling of Casuarina Equisetifolia Wood Chips at Various Temperatures. Periodica Polytechnica Chemical Engineering, 59 (4): 288-295.
19. Stamm, A. J., 1964: Wood and cellulose science. Ronald Press, New York.
20. Torgovnikov, G., 1993: Dielectric Properties of Wood and Wood-based Materials. Springer Series in Wood Sci-ence. Springer, Haidelberg.
21. Tsuchikawa, S.; Hayashi, K.; Tsutsumi, S., 1996: Nonde-structive measurement of the subsurface structure of bio-logical material having cellular structure by using near-infrared spectroscopy. Applied Spectroscopy, 50 (9): 1117-1124.
22. Turner, I. W.; Farguson, W. J., 1995: A study of the pow-er density distribution generated during combined micro-wave and convective drying of softwood. Drying Tech-nology, 13: 1411-1430.
23. Zavarin, E.; Cool, L. G.; Jones, S. G., 1990: Analysis of solid wood surfaces by Diffuse Refl ectance Infrared Fou-rier-Transform (DRIFT) spectroscopy. Journal of Chem-istry Technology, 10 (4): 495-513.
24. Zavarin, E.; Cool, L. G.; Jones, S. G., 1991: Analysis of solid wood surfaces by internal-refl ection fourier-trans-form infrared-spectroscopy. Journal of Wood Chemistry and Technology, 11 (1): 41-56.
Corresponding address:
Assoc. Prof. ALEŠ STRAŽE, PhD
University of LjubljanaBiotechnical FacultyDepartment of Wood Science and TechnologyJamnikarjeva 101, 1000 Ljubljana, SLOVENIAe-mail: [email protected]
..Sedlar, Šefc, Drvodelić, Jambreković, Kučinić, Ištok: Physical Properties of Juvenile Wood...
DRVNA INDUSTRIJA 71 (2) 179-184 (2020) 179
1 Authors are assistant professor, associate professor, assistant and senior assistant at University of Zagreb, Institute of Wood Science, Faculty of Forestry, Zagreb, Croatia.
2 Author is assistant professor at University of Zagreb, Institute of Ecology and Silviculture, Faculty of Forestry, Zagreb, Croatia.3 Author is student at University of Zagreb, Faculty of Forestry, Zagreb, Croatia.
Tomislav Sedlar1, Bogoslav Šefc1, Damir Drvodelić2, Branimir Jambreković1, Marko Kučinić3, Iva Ištok1
Physical Properties of Juvenile Wood of Two Paulownia HybridsFizička svojstva juvenilnog drva dvaju hibrida paulovnije
Original scientifi c paper • Izvorni znanstveni radReceived – prispjelo: 20. 10. 2019.Accepted – prihvaćeno: 28. 4. 2020.UDK: 630*812.23; 630*812.31; 630*815.321https:// doi.org/10.5552/drvind.2020.1964
ABSTRACT • There is a growing trend in the world of planting fast growing species (rotations 5 to 10 years). Their primary purpose is the production of wood fi bers and biomass, but they certainly represent the potential in making solid wood products as well. One of the fast-growing species is Paulownia sp., a species of extremely fast growing wood. Plantation breeding of Paulownia sp. in Croatia is increasing, although there is a little knowledge about the technical properties of Paulownia wood and its end use is questionable. This paper presents preliminary results of some physical properties of juvenile wood of two Paulownia hybrids planted in the area near the town of Glina in the Republic of Croatia. One hybrid is 9501 ((Paulownia fortunei × Paulownia elongata) × (Paulownia fortunei × Paulownia tomentosa)) and the other hybrid is Shan Tong (Paulownia fortunei × Paulownia tomen-tosa). The aim of this study was to investigate physical properties of juvenile wood of two Paulownia hybrids from one site in Croatia, to determine differences in physical properties of wood between two hybrids and to evaluate the correlation between density and shrinkages of each hybrid. Signifi cant differences in oven dry density, basic density and density at maximum MC, between the two hybrids were determined. There is no statistically signifi cant difference in longitudinal, radial, tangential and volumetric shrinkages between the two hybrids.
Keywords: hybrid 9501; hybrid Shan Tong; juvenile wood; Paulownia wood; physical properties
SAŽETAK • U današnje je vrijeme zamjetan sve češći trend sadnje brzorastućih vrsta drveća (ophodnje od 5 do 10 godina). Te su vrste primarno namijenjene proizvodnji drvnih vlakana i biomase, ali svakako je vidljiv i njihov potencijal u proizvodima od cjelovitog drva. Jedna od brzorastućih vrsta je Paulownia sp., koju odlikuje izrazito brz rast. Iako se malo zna o tehničkim svojstvima drva paulovnije, a njegova je krajnja upotreba upitna, u Hrvatskoj je u porastu plantažni uzgoj paulovnije. U ovom su radu prikazani preliminarni rezultati istraživanja nekih fi zičkih svojstava juvenilnog drva hibrida paulovnije s lokaliteta u blizini grada Gline u Hrvatskoj. Prvi je hibrid 9501 ((Pau-lownia fortunei × Paulownia elongata) × (Paulownia fortunei × Paulownia tomentosa)), a drugi Shan Tong (Pau-lownia fortunei × Paulownia tomentosa). Cilj rada bio je istražiti fi zička svojstva juvenilnog drva hibrida paulovnije s lokaliteta u Hrvatskoj, utvrditi razlike u fi zičkim svojstvima drva tih hibrida te odrediti međusobni odnos gustoće i utezanja unutar hibrida. Utvrđene su značajne razlike u gustoći drva u apsolutno suhom stanju, u nominalnoj gustoći i gustoći pri maksimalnom sadržaju vode između tih dvaju hibrida. Među hibridima nisu utvrđene statistički značajne razlike u longitudinalnome, radijalnome, tangentnome ni volumnom utezanju.
Ključne riječi: hibrid 9501; hibrid Shan Tong; juvenilno drvo; drvo paulovnije; fi zička svojstva
© 2020 by the author(s).Licensee Faculty of Forestry, University of Zagreb.
This article is an open access article distributedunder the terms and conditions of the
Creative Commons Attribution (CC BY 4.0) license.
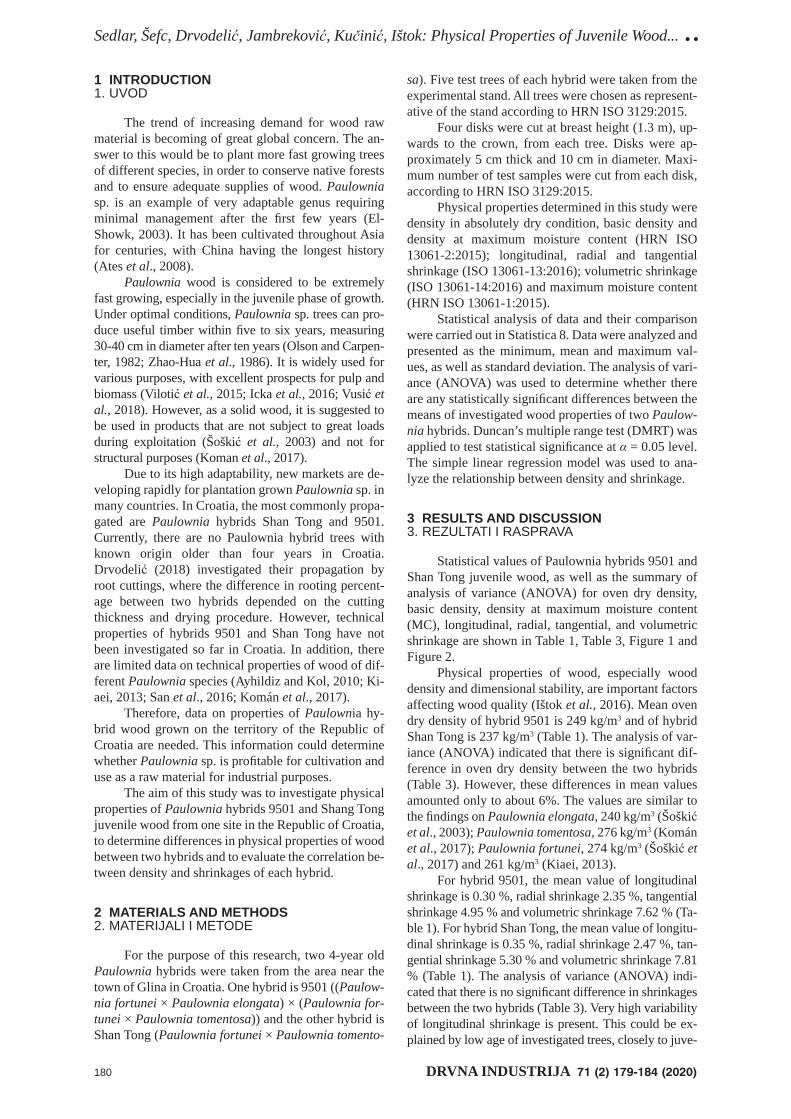
Sedlar, Šefc, Drvodelić, Jambreković, Kučinić, Ištok: Physical Properties of Juvenile Wood... ..
180 DRVNA INDUSTRIJA 71 (2) 179-184 (2020)
1 INTRODUCTION1. UVOD
The trend of increasing demand for wood raw material is becoming of great global concern. The an-swer to this would be to plant more fast growing trees of different species, in order to conserve native forests and to ensure adequate supplies of wood. Paulownia sp. is an example of very adaptable genus requiring minimal management after the fi rst few years (El-Showk, 2003). It has been cultivated throughout Asia for centuries, with China having the longest history (Ates et al., 2008).
Paulownia wood is considered to be extremely fast growing, especially in the juvenile phase of growth. Under optimal conditions, Paulownia sp. trees can pro-duce useful timber within fi ve to six years, measuring 30-40 cm in diameter after ten years (Olson and Carpen-ter, 1982; Zhao-Hua et al., 1986). It is widely used for various purposes, with excellent prospects for pulp and biomass (Vilotić et al., 2015; Icka et al., 2016; Vusić et al., 2018). However, as a solid wood, it is suggested to be used in products that are not subject to great loads during exploitation (Šoškić et al., 2003) and not for structural purposes (Koman et al., 2017).
Due to its high adaptability, new markets are de-veloping rapidly for plantation grown Paulownia sp. in many countries. In Croatia, the most commonly propa-gated are Paulownia hybrids Shan Tong and 9501. Currently, there are no Paulownia hybrid trees with known origin older than four years in Croatia. Drvodelić (2018) investigated their propagation by root cuttings, where the difference in rooting percent-age between two hybrids depended on the cutting thickness and drying procedure. However, technical properties of hybrids 9501 and Shan Tong have not been investigated so far in Croatia. In addition, there are limited data on technical properties of wood of dif-ferent Paulownia species (Ayhildiz and Kol, 2010; Ki-aei, 2013; San et al., 2016; Komán et al., 2017).
Therefore, data on properties of Paulownia hy-brid wood grown on the territory of the Republic of Croatia are needed. This information could determine whether Paulownia sp. is profi table for cultivation and use as a raw material for industrial purposes.
The aim of this study was to investigate physical properties of Paulownia hybrids 9501 and Shang Tong juvenile wood from one site in the Republic of Croatia, to determine differences in physical properties of wood between two hybrids and to evaluate the correlation be-tween density and shrinkages of each hybrid.
2 MATERIALS AND METHODS2. MATERIJALI I METODE
For the purpose of this research, two 4-year old Paulownia hybrids were taken from the area near the town of Glina in Croatia. One hybrid is 9501 ((Paulow-nia fortunei × Paulownia elongata) × (Paulownia for-tunei × Paulownia tomentosa)) and the other hybrid is Shan Tong (Paulownia fortunei × Paulownia tomento-
sa). Five test trees of each hybrid were taken from the experimental stand. All trees were chosen as represent-ative of the stand according to HRN ISO 3129:2015.
Four disks were cut at breast height (1.3 m), up-wards to the crown, from each tree. Disks were ap-proximately 5 cm thick and 10 cm in diameter. Maxi-mum number of test samples were cut from each disk, according to HRN ISO 3129:2015.
Physical properties determined in this study were density in absolutely dry condition, basic density and density at maximum moisture content (HRN ISO 13061-2:2015); longitudinal, radial and tangential shrinkage (ISO 13061-13:2016); volumetric shrinkage (ISO 13061-14:2016) and maximum moisture content (HRN ISO 13061-1:2015).
Statistical analysis of data and their comparison were carried out in Statistica 8. Data were analyzed and presented as the minimum, mean and maximum val-ues, as well as standard deviation. The analysis of vari-ance (ANOVA) was used to determine whether there are any statistically signifi cant differences between the means of investigated wood properties of two Paulow-nia hybrids. Duncan’s multiple range test (DMRT) was applied to test statistical signifi cance at α = 0.05 level. The simple linear regression model was used to ana-lyze the relationship between density and shrinkage.
3 RESULTS AND DISCUSSION3. REZULTATI I RASPRAVA
Statistical values of Paulownia hybrids 9501 and Shan Tong juvenile wood, as well as the summary of analysis of variance (ANOVA) for oven dry density, basic density, density at maximum moisture content (MC), longitudinal, radial, tangential, and volumetric shrinkage are shown in Table 1, Table 3, Figure 1 and Figure 2.
Physical properties of wood, especially wood density and dimensional stability, are important factors affecting wood quality (Ištok et al., 2016). Mean oven dry density of hybrid 9501 is 249 kg/m3 and of hybrid Shan Tong is 237 kg/m3 (Table 1). The analysis of var-iance (ANOVA) indicated that there is signifi cant dif-ference in oven dry density between the two hybrids (Table 3). However, these differences in mean values amounted only to about 6%. The values are similar to the fi ndings on Paulownia elongata, 240 kg/m3 (Šoškić et al., 2003); Paulownia tomentosa, 276 kg/m3 (Komán et al., 2017); Paulownia fortunei, 274 kg/m3 (Šoškić et al., 2017) and 261 kg/m3 (Kiaei, 2013).
For hybrid 9501, the mean value of longitudinal shrinkage is 0.30 %, radial shrinkage 2.35 %, tangential shrinkage 4.95 % and volumetric shrinkage 7.62 % (Ta-ble 1). For hybrid Shan Tong, the mean value of longitu-dinal shrinkage is 0.35 %, radial shrinkage 2.47 %, tan-gential shrinkage 5.30 % and volumetric shrinkage 7.81 % (Table 1). The analysis of variance (ANOVA) indi-cated that there is no signifi cant difference in shrinkages between the two hybrids (Table 3). Very high variability of longitudinal shrinkage is present. This could be ex-plained by low age of investigated trees, closely to juve-
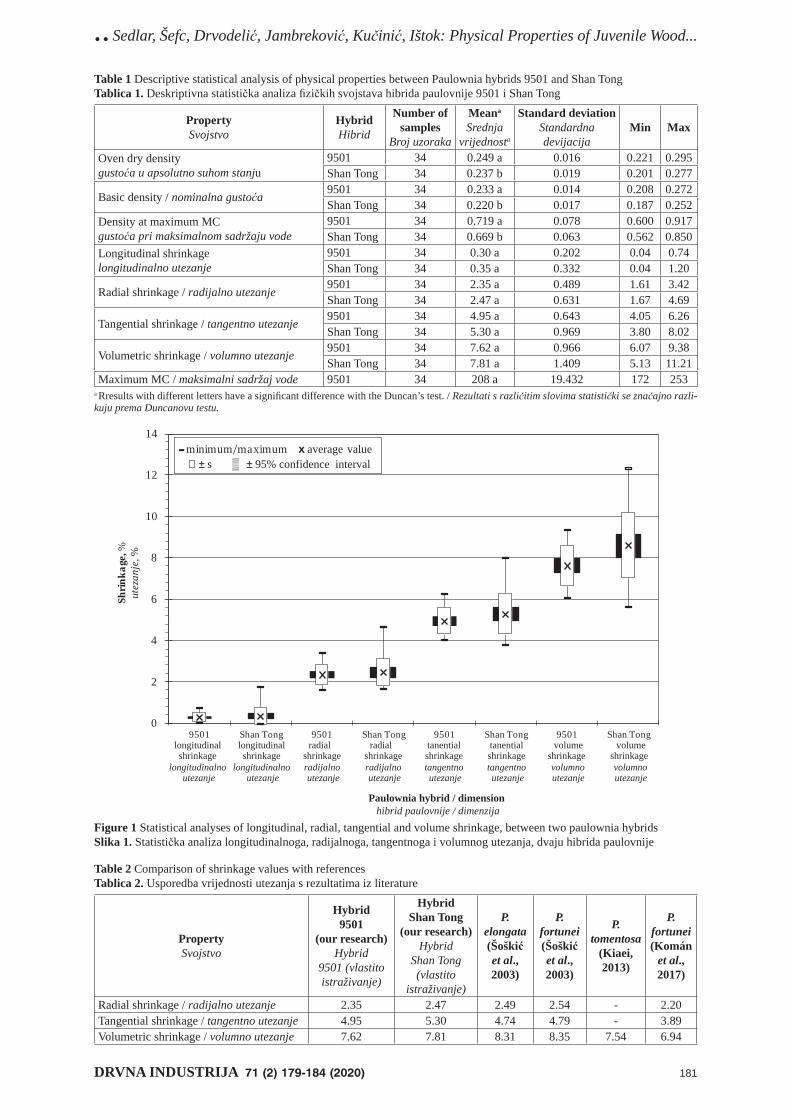
..Sedlar, Šefc, Drvodelić, Jambreković, Kučinić, Ištok: Physical Properties of Juvenile Wood...
DRVNA INDUSTRIJA 71 (2) 179-184 (2020) 181
Table 1 Descriptive statistical analysis of physical properties between Paulownia hybrids 9501 and Shan TongTablica 1. Deskriptivna statistička analiza fi zičkih svojstava hibrida paulovnije 9501 i Shan Tong
PropertySvojstvo
HybridHibrid
Number of samples
Broj uzoraka
Meana
Srednja vrijednosta
Standard deviationStandardna devijacija
Min Max
Oven dry densitygustoća u apsolutno suhom stanju
9501 34 0.249 a 0.016 0.221 0.295Shan Tong 34 0.237 b 0.019 0.201 0.277
Basic density / nominalna gustoća9501 34 0.233 a 0.014 0.208 0.272Shan Tong 34 0.220 b 0.017 0.187 0.252
Density at maximum MCgustoća pri maksimalnom sadržaju vode
9501 34 0.719 a 0.078 0.600 0.917Shan Tong 34 0.669 b 0.063 0.562 0.850
Longitudinal shrinkagelongitudinalno utezanje
9501 34 0.30 a 0.202 0.04 0.74Shan Tong 34 0.35 a 0.332 0.04 1.20
Radial shrinkage / radijalno utezanje9501 34 2.35 a 0.489 1.61 3.42Shan Tong 34 2.47 a 0.631 1.67 4.69
Tangential shrinkage / tangentno utezanje9501 34 4.95 a 0.643 4.05 6.26Shan Tong 34 5.30 a 0.969 3.80 8.02
Volumetric shrinkage / volumno utezanje9501 34 7.62 a 0.966 6.07 9.38Shan Tong 34 7.81 a 1.409 5.13 11.21
Maximum MC / maksimalni sadržaj vode 9501 34 208 a 19.432 172 253a Rresults with different letters have a signifi cant difference with the Duncan’s test. / Rezultati s različitim slovima statistički se značajno razli-kuju prema Duncanovu testu.
Table 2 Comparison of shrinkage values with referencesTablica 2. Usporedba vrijednosti utezanja s rezultatima iz literature
PropertySvojstvo
Hybrid9501
(our research)Hybrid
9501 (vlastito istraživanje)
HybridShan Tong
(our research)Hybrid
Shan Tong (vlastito
istraživanje)
P. elongata (Šoškić et al., 2003)
P. fortunei (Šoškić et al., 2003)
P. tomentosa
(Kiaei, 2013)
P. fortunei (Komán
et al., 2017)
Radial shrinkage / radijalno utezanje 2.35 2.47 2.49 2.54 - 2.20Tangential shrinkage / tangentno utezanje 4.95 5.30 4.74 4.79 - 3.89Volumetric shrinkage / volumno utezanje 7.62 7.81 8.31 8.35 7.54 6.94
Figure 1 Statistical analyses of longitudinal, radial, tangential and volume shrinkage, between two paulownia hybridsSlika 1. Statistička analiza longitudinalnoga, radijalnoga, tangentnoga i volumnog utezanja, dvaju hibrida paulovnije
0
2
4
6
8
10
12
14
9501 longitudinal shrinkage
longitudinalno utezanje
Shan Tong longitudinal shrinkage
longitudinalno utezanje
9501 radial
shrinkage radijalno utezanje
Shan Tong radial
shrinkage radijalno utezanje
9501 tanential shrinkage tangentno utezanje
Shan Tong tanential shrinkage tangentno utezanje
9501 volume
shrinkage volumno utezanje
Shan Tong volume
shrinkage volumno utezanje
Paulownia hybrid / dimension hibrid paulovnije / dimenzija
Shrin
kage
, %ut
ezan
je, %
- minimum/maximum x average value± s ± 95% confidence interval
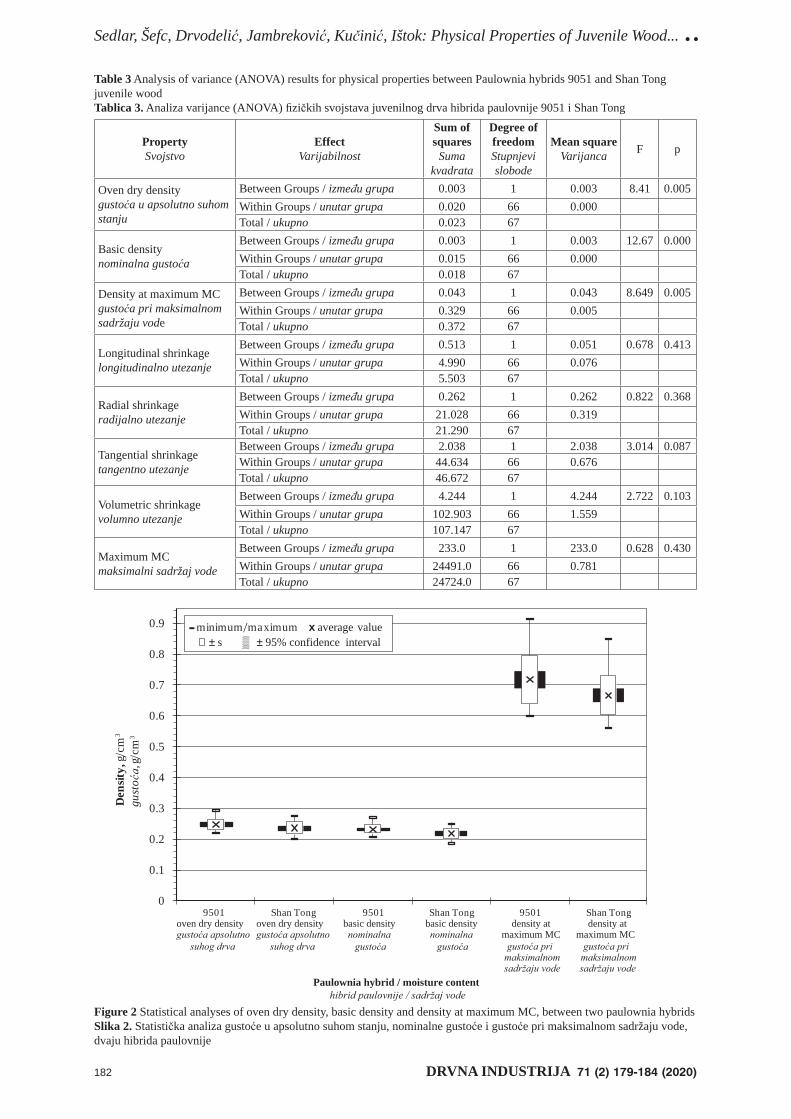
Sedlar, Šefc, Drvodelić, Jambreković, Kučinić, Ištok: Physical Properties of Juvenile Wood... ..
182 DRVNA INDUSTRIJA 71 (2) 179-184 (2020)
Table 3 Analysis of variance (ANOVA) results for physical properties between Paulownia hybrids 9051 and Shan Tong juvenile woodTablica 3. Analiza varijance (ANOVA) fi zičkih svojstava juvenilnog drva hibrida paulovnije 9051 i Shan Tong
PropertySvojstvo
EffectVarijabilnost
Sum of squares
Suma kvadrata
Degree of freedomStupnjevi slobode
Mean squareVarijanca F p
Oven dry densitygustoća u apsolutno suhom stanju
Between Groups / između grupa 0.003 1 0.003 8.41 0.005Within Groups / unutar grupa 0.020 66 0.000Total / ukupno 0.023 67
Basic densitynominalna gustoća
Between Groups / između grupa 0.003 1 0.003 12.67 0.000Within Groups / unutar grupa 0.015 66 0.000Total / ukupno 0.018 67
Density at maximum MCgustoća pri maksimalnom sadržaju vode
Between Groups / između grupa 0.043 1 0.043 8.649 0.005Within Groups / unutar grupa 0.329 66 0.005Total / ukupno 0.372 67
Longitudinal shrinkagelongitudinalno utezanje
Between Groups / između grupa 0.513 1 0.051 0.678 0.413Within Groups / unutar grupa 4.990 66 0.076Total / ukupno 5.503 67
Radial shrinkageradijalno utezanje
Between Groups / između grupa 0.262 1 0.262 0.822 0.368Within Groups / unutar grupa 21.028 66 0.319Total / ukupno 21.290 67
Tangential shrinkagetangentno utezanje
Between Groups / između grupa 2.038 1 2.038 3.014 0.087Within Groups / unutar grupa 44.634 66 0.676Total / ukupno 46.672 67
Volumetric shrinkagevolumno utezanje
Between Groups / između grupa 4.244 1 4.244 2.722 0.103Within Groups / unutar grupa 102.903 66 1.559Total / ukupno 107.147 67
Maximum MCmaksimalni sadržaj vode
Between Groups / između grupa 233.0 1 233.0 0.628 0.430Within Groups / unutar grupa 24491.0 66 0.781Total / ukupno 24724.0 67
Figure 2 Statistical analyses of oven dry density, basic density and density at maximum MC, between two paulownia hybridsSlika 2. Statistička analiza gustoće u apsolutno suhom stanju, nominalne gustoće i gustoće pri maksimalnom sadržaju vode, dvaju hibrida paulovnije
0
0.1
0.2
0.3
0.4
0.5
0.6
0.7
0.8
0.9
9501 oven dry density
Shan Tong oven dry density
9501 basic density
Shan Tong basic density
9501 density at
maximum MC
Shan Tong density at
maximum MC
Den
sity,
g/c
m3
gust
o, g
/cm
3
Paulownia hybrid / moisture content
- minimum/maximum x average value± s ± 95% confidence interval
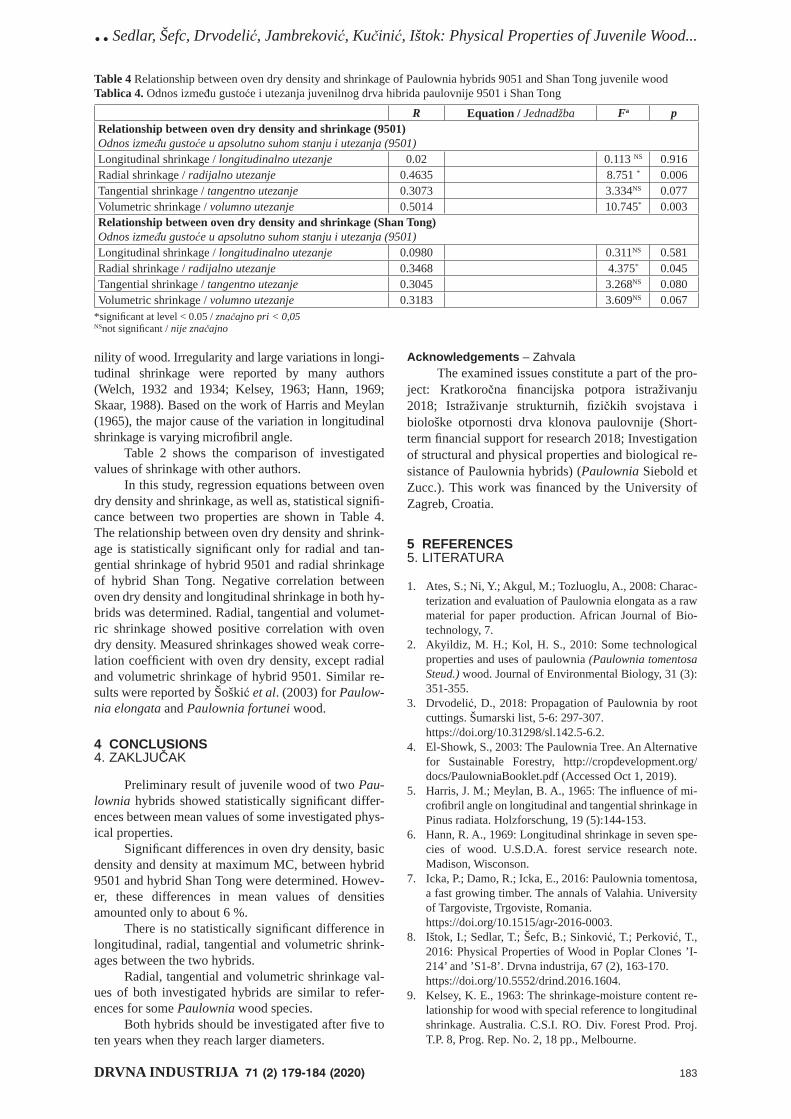
..Sedlar, Šefc, Drvodelić, Jambreković, Kučinić, Ištok: Physical Properties of Juvenile Wood...
DRVNA INDUSTRIJA 71 (2) 179-184 (2020) 183
nility of wood. Irregularity and large variations in longi-tudinal shrinkage were reported by many authors (Welch, 1932 and 1934; Kelsey, 1963; Hann, 1969; Skaar, 1988). Based on the work of Harris and Meylan (1965), the major cause of the variation in longitudinal shrinkage is varying microfi bril angle.
Table 2 shows the comparison of investigated values of shrinkage with other authors.
In this study, regression equations between oven dry density and shrinkage, as well as, statistical signifi -cance between two properties are shown in Table 4. The relationship between oven dry density and shrink-age is statistically signifi cant only for radial and tan-gential shrinkage of hybrid 9501 and radial shrinkage of hybrid Shan Tong. Negative correlation between oven dry density and longitudinal shrinkage in both hy-brids was determined. Radial, tangential and volumet-ric shrinkage showed positive correlation w ith oven dry density. Measured shrinkages showed weak corre-lation coeffi cient with oven dry density, except radial and volumetric shrinkage of hybrid 9501. Similar re-sults were reported by Šoškić et al. (2003) for Paulow-nia elongata and Paulownia fortunei wood.
4 CONCLUSIONS4. ZAKLJUČAK
Preliminary result of juvenile wood of two Pau-lownia hybrids showed statistically signifi cant differ-ences between mean values of some investigated phys-ical properties.
Signifi cant differences in oven dry density, basic density and density at maximum MC, between hybrid 9501 and hybrid Shan Tong were determined. Howev-er, these differences in mean values of densities amounted only to about 6 %.
There is no statistically signifi cant difference in longitudinal, radial, tangential and volumetric shrink-ages between the two hybrids.
Radial, tangential and volumetric shrinkage val-ues of both investigated hybrids are similar to refer-ences for some Paulownia wood species.
Both hybrids should be investigated after fi ve to ten years when they reach larger diameters.
Acknowledgements – ZahvalaThe examined issues constitute a part of the pro-
ject: Kratkoročna fi nancijska potpora istraživanju 2018; Istraživanje strukturnih, fi zičkih svojstava i biološke otpornosti drva klonova paulovnije (Short-term fi nancial support for research 2018; Investigation of structural and physical properties and biological re-sistance of Paulownia hybrids) (Paulownia Siebold et Zucc.). This work was fi nanced by the University of Zagreb, Croatia.
5 REFERENCES5. LITERATURA
1. Ates, S.; Ni, Y.; Akgul, M.; Tozluoglu, A., 2008: Charac-terization and evaluation of Paulownia elongata as a raw material for paper production. African Journal of Bio-technology, 7.
2. Akyildiz, M. H.; Kol, H. S., 2010: Some technological properties and uses of paulownia (Paulownia tomentosa Steud.) wood. Journal of Environmental Biology, 31 (3): 351-355.
3. Drvodelić, D., 2018: Propagation of Paulownia by root cuttings. Šumarski list, 5-6: 297-307.
https://doi.org/10.31298/sl.142.5-6.2.4. El-Showk, S., 2003: The Paulownia Tree. An Alternative
for Sustainable Forestry, http://cropdevelopment.org/docs/PaulowniaBooklet.pdf (Accessed Oct 1, 2019).
5. Harris, J. M.; Meylan, B. A., 1965: The infl uence of mi-crofi bril angle on longitudinal and tangential shrinkage in Pinus radiata. Holzforschung, 19 (5):144-153.
6. Hann, R. A., 1969: Longitudinal shrinkage in seven spe-cies of wood. U.S.D.A. forest service research note. Madison, Wisconson.
7. Icka, P.; Damo, R.; Icka, E., 2016: Paulownia tomentosa, a fast growing timber. The annals of Valahia. University of Targoviste, Trgoviste, Romania.
https://doi.org/10.1515/agr-2016-0003.8. Ištok, I.; Sedlar, T.; Šefc, B.; Sinković, T.; Perković, T.,
2016: Physical Properties of Wood in Poplar Clones ’I-214’ and ’S1-8’. Drvna industrija, 67 (2), 163-170.
https://doi.org/10.5552/drind.2016.1604.9. Kelsey, K. E., 1963: The shrinkage-moisture content re-
lationship for wood with special reference to longitudinal shrinkage. Australia. C.S.I. RO. Div. Forest Prod. Proj. T.P. 8, Prog. Rep. No. 2, 18 pp., Melbourne.
Table 4 Relationship between oven dry density and shrinkage of Paulownia hybrids 9051 and Shan Tong juvenile woodTablica 4. Odnos između gustoće i utezanja juvenilnog drva hibrida paulovnije 9501 i Shan Tong
pFaEquation / JednadžbaRRelationship between oven dry density and shrinkage (9501)Odnos između gustoće u apsolutno suhom stanju i utezanja (9501)
0.9160.113 NS0.02Longitudinal shrinkage / longitudinalno utezanje0.0068.751 *0.4635Radial shrinkage / radijalno utezanje0.0773.334NS0.3073Tangential shrinkage / tangentno utezanje0.00310.745*0.5014Volumetric shrinkage / volumno utezanje
Relationship between oven dry density and shrinkage (Shan Tong)Odnos između gustoće u apsolutno suhom stanju i utezanja (9501)
0.5810.311NS0.0980Longitudinal shrinkage / longitudinalno utezanje0.0454.375*0.3468Radial shrinkage / radijalno utezanje0.0803.268NS0.3045Tangential shrinkage / tangentno utezanje0.0673.609NS0.3183Volumetric shrinkage / volumno utezanje
*signifi cant at level < 0.05 / značajno pri < 0,05NSnot signifi cant / nije značajno
Sedlar, Šefc, Drvodelić, Jambreković, Kučinić, Ištok: Physical Properties of Juvenile Wood... ..
184 DRVNA INDUSTRIJA 71 (2) 179-184 (2020)
10. Kiaei, M., 2013: Technological properties of Iranian cul-tivated paulownia wood (Paulownia fortunei). Cellulose Chemistry and Technology, 47 (9-10): 735-743.
11. Komán, S.; Feher, S.; Vityi, A., 2017: Physical and me-chanical properties of Paulownia tomentosa wood plant-ed in Hungaria. Wood Research, 62 (2): 335-340.
12. Olson, J.; Carpenter, S. B., 1982: Specifi c gravity, fi ber length and extractive content of young paulownia. Wood and Fiber Science, 17 (4): 428-438.
13. San, H. P.; Long, L. K.; Zhang, C. Z.; Hui, T. C.; Seng, W. Y.; Lin, F. S.; Hun, A. T.; Fong, W. K., 2016: Ana-tomical Features, Fiber Morphological, Physical and Me-chanical Properties of Three Years Old New Hybrid Pau-lownia: Green Paulownia. Research Journal of Forestry, 10: 30-35. https://doi.org/10.3923/rjf.2016.30.35.
14. Skaar, C., 1988: Wood-water relations. In: T. E. Timell (ed.), Springer Series in Wood Science. Springer-Verlag, Berlin, Heidelberg.
15. Šoškić, B.; Lovrić, A.; Vukovojac, B., 2003: The re-search of some physical properties of wood Paulownia elongata and Paulownia fortuneii. Glasnik Šumarskog fakulteta, Beograd, 87, pp. 211-221.
16. Welch, M. B., 1932: The longitudinal variation of timber during seasoning. Journal and proceedings of the Royal SOC. New South Wales, 66: 492-497.
17. Welch, M. B., 1934: The longitudinal variation of timber during seasoning. Journal and proceedings of the Royal SOC. New South Wales, 68: 249-254.
18. Vilotić, D.; Popović, J.; Mitrović, S.; Šijačić-Nikolić, M.; Ocokoljić, M.; Novović, J.; Veselinović, M., 2015: Di-mensions of Mechanical Fibres in Paulownia elongata S. Y. Hu Wood from Different Habitats. Drvna industrija, 66 (3): 229-234. https://doi.org/10.5552/drind.2015.1365.
19. Vusić, D.; Migalić, M.; Zečić, Ž.; Trkmić, M.; Bešlić, A.; Drvodelić, D., 2018: Fuel properties of Paulownia bio-mass. Proceedings of Natural resources, green technolo-
gy and sustainable development. Zagreb, Croatia, 5-8 6. 2018, pp. 126-130.
20. Zhao-Hua, Z.; Ching-Ju, C.; Xin-Yu, L.; Yao Gao, X., 1986: Paulownia in China: Cultivation and Utilization. Asian Network for Biological Sciences and International Development Research Centre, Beijing, China.
21. *** HRN ISO 3129, 2015: Drvo – Metode uzorkovanja i opći zahtjevi za ispitivanje fi zikalnih i mehaničkih svo-jstava na manjim uzorcima masivnog drva
22. *** HRN ISO 13061-1, 2015: Fizikalna i mehanička svojstva drva – Metode ispitivanja za manje uzorke ma-sivnog drva, 1. dio: Određivanje sadržaja vode za provođenje ispitivanja fi zikalnih i mehaničkih svojstava.
23. *** HRN ISO 13061-2, 2015: Fizikalna i mehanička svojstva drva – Metode ispitivanja za manje uzorke ma-sivnog drva, 2. dio: Određivanje gustoće za provođenje ispitivanja fi zikalnih i mehaničkih svojstava.
24. *** ISO 13061-13, 2016: Physical and mechanical prop-erties of wood – Test methods for small clear wood spec-imens, Part 13: Determination of radial and tangential shrinkage.
25. *** ISO 13061-14, 2016: Physical and mechanical prop-erties of wood – Test methods for small clear wood spec-imens, Part 14: Determination of volumetric shrinkage.
Corresponding address:
Assoc. Prof. BOGOSLAV ŠEFC, PhD
University of ZagrebFaculty of ForestrySvetošimunska 25, 10000 Zagreb, CROATIAe-mail: [email protected]
DRVNA INDUSTRIJA 71 (2) 185-192 (2020) 185
.............Bekhta, Bekhta: Thermal Degradation of Bonding Strength of Aspen Plywood
Pavlo Bekhta1, Nataliya Bekhta2
Thermal Degradation of Bonding Strength of Aspen PlywoodToplinska degradacija čvrstoće lijepljenja ploče od uslojenog drva jasike
Original scientifi c paper • Izvorni znanstveni radReceived – prispjelo: 20. 10. 2019.Accepted – prihvaćeno: 28. 4. 2020.UDK: 630*832.282https://doi.org /10.5552/drvind.2020.1969
ABSTRACT • The objective of this research was to study the effect of exposure time on the bonding strength of aspen plywood at elevated temperatures. The plywood samples were manufactured under laboratory conditions using two types of adhesive: urea-formaldehyde (UF) and phenol-formaldehyde (PF). The plywood samples were tested after exposure to three different temperatures (150 °C, 200 °C and 250 °C) and three exposure time levels (1, 2 and 3 hours) at each temperature. Additionally, a set of control samples was tested at room temperature. The quality of bonding was assessed by shear strength test in compliance with the requirements of the standard EN 314-1. The mass and density losses as well as colour changes of the plywood samples were also determined. The fi ndings of this study indicated that exposure of plywood panels to elevated temperature caused signifi cant deg-radation of their bonding strength. PF plywood samples lost 63.2 % of their initial strength after 3 h of exposure at 250 °C, while UF samples lost 65.9 % of their initial strength already after 3 h of exposure at the temperature of 200 °C. Statistical regression-based models were also developed for predicting the loss of plywood bonding strength as functions of mass and density losses and total colour difference. As the mass/density losses or total colour difference of panels increased, the losses in bonding strength increased too.
Keywords: plywood; heat treatment; bonding strength; mass loss; density loss; colour change
SAŽETAK • Cilj ovog istraživanja bio je ispitati utjecaj vremena izlaganja toplini na čvrstoću lijepljenja ploča od uslojenog drva jasike. Uzorci ploča od uslojenog drva proizvedeni su u laboratorijskim uvjetima uporabom dvije vrste ljepila: urea-formaldehidnog (UF) i fenol-formaldehidnog (PF) ljepila. Uzorci ploča od uslojenog drva ispi-tani su nakon izlaganja različitim temperaturama (150 °C, 200 °C i 250 °C) tijekom različitog vremena izlaganja (1, 2 i 3 sata). Usto, skupina kontrolnih uzoraka ispitana je pri sobnoj temperaturi. Kvaliteta lijepljenja ocijenjena je testom smične čvrstoće u skladu sa zahtjevima norme EN 314-1. Također, određeni su gubitci mase i smanjenje gustoće, kao i promjena boje uzoraka ploča od uslojenog drva. Rezultati ove studije pokazali su da izlaganje ploča od uslojenog drva povišenoj temperaturi uzrokuje znatno smanjenje njihove čvrstoće lijepljenja. Uzorci ploča od uslojenog drva zalijepljeni PF ljepilom izgubili su 63,2 % svoje početne čvrstoće nakon tri sata izlaganja na 250 °C, dok su uzorci ploča od uslojenog drva zalijepljeni UF ljepilom izgubili 65,9 % početne čvrstoće već nakon tri sata izloženosti temperaturi 200 °C. Nadalje, razvijeni su statistički regresijski modeli za predviđanje gubitka čvrstoće lijepljenja ploča od uslojenog drva kao funkcije gubitka mase, smanjenja gustoće i ukupne razlike u boji. Kako se povećavao gubitak mase, smanjivala gustoća ili povećavala ukupna razlika u boji ploča, tako su se pove-ćavali i gubitci čvrstoće lijepljenja.
Ključne riječi: ploča od uslojenog drva; toplinsko tretiranje; čvrstoća lijepljenja; gubitak mase; smanjenje gustoće; promjena boje
1 Author is professor at Department of Wood-Based Composites, Cellulose and Paper, Ukrainian National Forestry University, Lviv, Ukraine.2 Author is senior lecturer at Department of Design, Ukrainian National Forestry University, Lviv, Ukraine.
© 2020 by the author(s).Licensee Faculty of Forestry, University of Zagreb.
This article is an open access article distributedunder the terms and conditions of the
Creative Commons Attribution (CC BY 4.0) license.
186 DRVNA INDUSTRIJA 71 (2) 185-192 (2020)
Bekhta, Bekhta: Thermal Degradation of Bonding Strength of Aspen Plywood .............1 INTRODUCTION1. UVOD
Global plywood production and consumption are increasing (FAO 2018). Plywood is widely used in various industries, in particular in construction. Due to its high physical and mechanical properties, plywood is used in construction side by side with solid wood. In Ukraine, birch and alder are used mainly for plywood production while aspen is much less used. One of the reasons for the lack of use of aspen in the production of plywood is the lack of information on the behaviour of such plywood when exposed to high temperatures. The increasing use of plywood in construction requires knowledge of the behaviour of plywood in different environmental conditions. In particular, structural members made using plywood can be subjected to high temperatures. Therefore, knowledge of the properties of plywood under high temperature is extremely im-portant.
The performance of solid wood or wood-based composites, such as particleboard, fl akeboard, wafer-board, and oriented strandboard (OSB) at or after expo-sure to elevated temperatures has been well studied (Suchsland and Enlow 1968; Hsu et al., 1989; Zhang et al., 1997; Bekhta et al., 2003; Ohlmeyer and Lukowsky 2004; Del Menezzi and Tomaselli 2006, Bekhta and Marutzky 2007; Okino et al., 2007). These studies gen-erally reported that the post heat treatment improved di-mensional stability and enhanced durability and fungal resistance of materials, while decreasing the mechanical properties of the composites. The performance of ply-wood panels at or after exposure to elevated tempera-tures is less studied. Some authors (Sinha et al., 2011b; Zhou et al., 2012; Lunguleasa et al., 2018) found that the bending strength of plywood panels decreased with the increase of the heat treatment temperature and exposure time. Sinha et al., (2011a) also proposed regression models to predict the loss of plywood strength as a func-tion of temperature and duration of heat treatment. Can-dan et al., (2012) showed that (a) increasing the severity of thermal treatment of plywood panels resulted in smoother surfaces; (b) the wettability properties of the treated panels were lower than those of the untreated panels; (c) the treated panels exhibited more hydropho-bic characteristics for outdoor application.
Shear strength is one of the main parameters of plywood panels by which their quality of bonding is evaluated. An extensive literature search did not reveal any information about the effects of elevated tempera-tures on adhesive bonding performance of interior as-pen plywood. The objective of this research was to in-vestigate the effects of heat-treatment on the adhesive bonding strength of the plywood panels made using different types of adhesive.
2 MATERIALS AND METHODS2. MATERIJALI I METODE
In this study, an aspen (Populus tremula L.) rotaty cut wood veneer was used. The thickness of the
veneer was 1.5 mm, and the moisture content of veneer sheets was 6-8 %.
The plywood panels had been bonded using com-mercial urea-formaldehyde (UF) KFC-0.1-MYY and phenol formaldehyde (PF) Vatex-244 resins. We chose UF and PF resins because these adhesives are most commonly used for the manufacture of plywood (UF is interior-type resin, while PF is a more heat-resistant, exterior-type resin). UF and PF adhesives had the fol-lowing parameters, respectively: solid content 66 % and 46 %, dynamic viscosity 379.3 and 213.7 MPa·s, gel time 55 s (at 100 °C) and 120 s (at 150 °C), free formaldehyde content not more than 0.15 and 0.1 %, hydrogen ion concentration (pH) 8.6 and 12. UF adhe-sive solution used in the manufacturing was composed of 100 parts of UF resin by weight, 15 parts of wheat fl our by weight, and 4 parts of 15 % concentrated NH4Cl by weight. The PF resin was used for plywood panel manufacturing without any fi ller or additive.
Plywood panels of 300 mm × 300 mm were made in an electrically heated hydraulic laboratory press. The specifi c pressing pressure of 1.8 MPa and temper-ature of 130 °C were used, and 6 min pressing time (during the last 30 s of the press cycle the pressure was continuously reduced to 0 MPa). In this study, we ap-plied the same pressing temperature of 130 °C, as well as the same pressing modes to both adhesives, only to be able to compare the properties of UF and PF ply-wood panels made under the same conditions, knowing that the same pressing modes for these two adhesives may affect, to some extent, the fi nal properties of the panels. The adhesive spreads were 120 and 130 g/m2 based on wet mass for UF and PF adhesive, respec-tively. The adhesive was applied onto one side of every uneven ply. The plies were assembled perpendicularly to each other (veneer sheets were laid up tight/loose) to form plywood of fi ve plies. Adhesive was applied on the veneer surface with a hand roller spreader. After pressing, the plywood panels were subjected to condi-tioning for 5 days, after which all panels were cut to extract test samples according to the standard require-ments. Three plywood panels were made for each ex-perimental condition and control.
The heat treatment of the test samples was per-formed in a laboratory temperature controlled venti-lated oven SNOL 67/350 (AB “Utenos Elektrotechni-ka”, Lithuania) with ±1 °C sensitivity under atmospheric pressure. All samples were heat treated at a temperature of 150 °C, 200 °C and 250 °C during 1, 2 and 3 hours at each temperature in the presence of air. Once the samples were taken out of the oven, they were cooled to room temperature before testing. There-after, the dimensions and weights of the plywood sam-ples were measured to calculate the density of the ply-wood panels according to the standard EN 323:1993. Moreover, after heat treatment and cooling, the mass and density losses were determined and colour param-eters were estimated. Then, bonding strength test was carried out according to the relevant standard (EN 314-1:2003). The bonding strength was determined by ad-hesive layer near the middle of the sample, i.e. at the
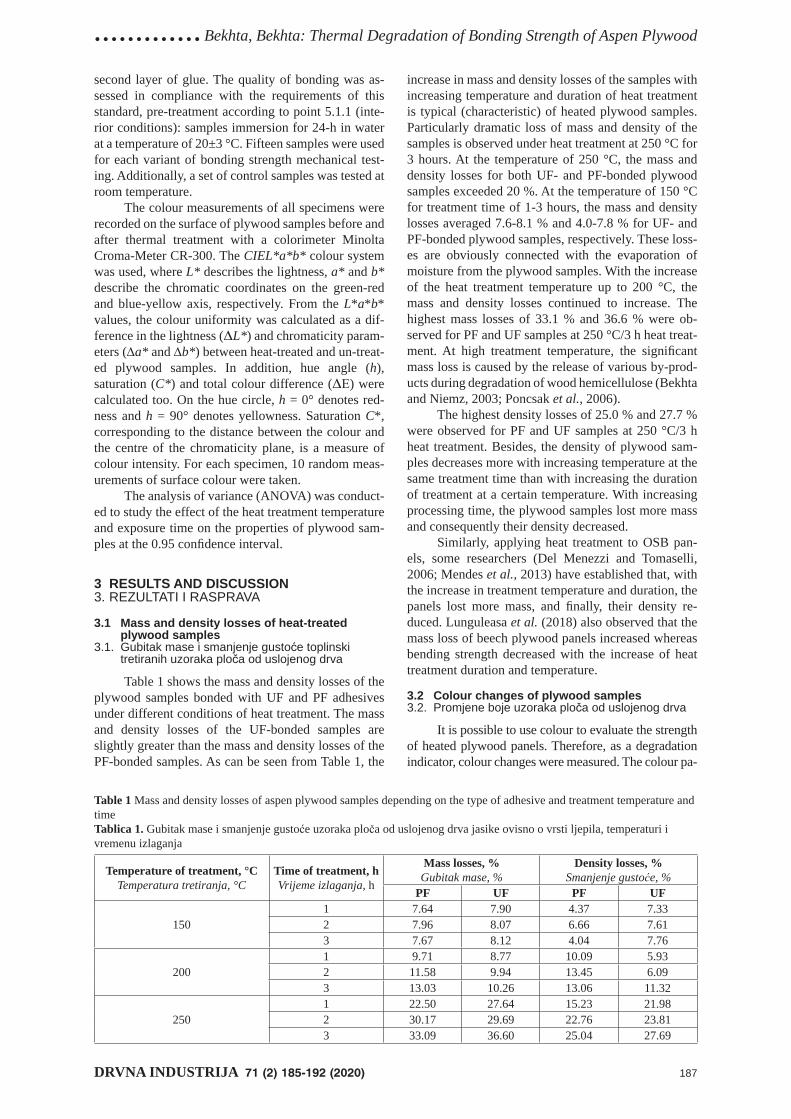
DRVNA INDUSTRIJA 71 (2) 185-192 (2020) 187
.............Bekhta, Bekhta: Thermal Degradation of Bonding Strength of Aspen Plywood
second layer of glue. The quality of bonding was as-sessed in compliance with the requirements of this standard, pre-treatment according to point 5.1.1 (inte-rior conditions): samples immersion for 24-h in water at a temperature of 20±3 °C. Fifteen samples were used for each variant of bonding strength mechanical test-ing. Additionally, a set of control samples was tested at room temperature.
The colour measurements of all specimens were recorded on the surface of plywood samples before and after thermal treatment with a colorimeter Minolta Croma-Meter CR-300. The CIEL*a*b* colour system was used, where L* describes the lightness, a* and b* describe the chromatic coordinates on the green-red and blue-yellow axis, respectively. From the L*a*b* values, the colour uniformity was calculated as a dif-ference in the lightness (ΔL*) and chromaticity param-eters (a* and b*) between heat-treated and un-treat-ed plywood samples. In addition, hue angle (h), saturation (C*) and total colour difference (ΔЕ) were calculated too. On the hue circle, h = 0° denotes red-ness and h = 90° denotes yellowness. Saturation C*, corresponding to the distance between the colour and the centre of the chromaticity plane, is a measure of colour intensity. For each specimen, 10 random meas-urements of surface colour were taken.
The analysis of variance (ANOVA) was conduct-ed to study the effect of the heat treatment temperature and exposure time on the properties of plywood sam-ples at the 0.95 confi dence interval.
3 RESULTS AND DISCUSSION3. REZULTATI I RASPRAVA
3.1 Mass and density losses of heat-treated plywood samples
3.1. Gubitak mase i smanjenje gustoće toplinski tretiranih uzoraka ploča od uslojenog drva
Table 1 shows the mass and density losses of the plywood samples bonded with UF and PF adhesives under different conditions of heat treatment. The mass and density losses of the UF-bonded samples are slightly greater than the mass and density losses of the PF-bonded samples. As can be seen from Table 1, the
increase in mass and density losses of the samples with increasing temperature and duration of heat treatment is typical (characteristic) of heated plywood samples. Particularly dramatic loss of mass and density of the samples is observed under heat treatment at 250 °C for 3 hours. At the temperature of 250 °C, the mass and density losses for both UF- and PF-bonded plywood samples exceeded 20 %. At the temperature of 150 °C for treatment time of 1-3 hours, the mass and density losses averaged 7.6-8.1 % and 4.0-7.8 % for UF- and PF-bonded plywood samples, respectively. These loss-es are obviously connected with the evaporation of moisture from the plywood samples. With the increase of the heat treatment temperature up to 200 °C, the mass and density losses continued to increase. The highest mass losses of 33.1 % and 36.6 % were ob-served for PF and UF samples at 250 °C/3 h heat treat-ment. At high treatment temperature, the signifi cant mass loss is caused by the release of various by-prod-ucts during degradation of wood hemicellulose (Bekhta and Niemz, 2003; Poncsak et al., 2006).
The highest density losses of 25.0 % and 27.7 % were observed for PF and UF samples at 250 °C/3 h heat treatment. Besides, the density of plywood sam-ples decreases more with increasing temperature at the same treatment time than with increasing the duration of treatment at a certain temperature. With increasing processing time, the plywood samples lost more mass and consequently their density decreased.
Similarly, applying heat treatment to OSB pan-els, some researchers (Del Menezzi and Tomaselli, 2006; Mendes et al., 2013) have established that, with the increase in treatment temperature and duration, the panels lost more mass, and fi nally, their density re-duced. Lunguleasa et al. (2018) also observed that the mass loss of beech plywood panels increased whereas bending strength decreased with the increase of heat treatment duration and temperature.
3.2 Colour changes of plywood samples3.2. Promjene boje uzoraka ploča od uslojenog drva
It is possible to use colour to evaluate the strength of heated plywood panels. Therefore, as a degradation indicator, colour changes were measured. The colour pa-
Table 1 Mass and density losses of aspen plywood samples depending on the type of adhesive and treatment temperature and timeTablica 1. Gubitak mase i smanjenje gustoće uzoraka ploča od uslojenog drva jasike ovisno o vrsti ljepila, temperaturi i vremenu izlaganja
Temperature of treatment, °CTemperatura tretiranja, °C
Time of treatment, hVrijeme izlaganja, h
Mass losses, %Gubitak mase, %
Density losses, %Smanjenje gustoće, %
PF UF PF UF
1501 7.64 7.90 4.37 7.332 7.96 8.07 6.66 7.613 7.67 8.12 4.04 7.76
2001 9.71 8.77 10.09 5.932 11.58 9.94 13.45 6.093 13.03 10.26 13.06 11.32
2501 22.50 27.64 15.23 21.982 30.17 29.69 22.76 23.813 33.09 36.60 25.04 27.69
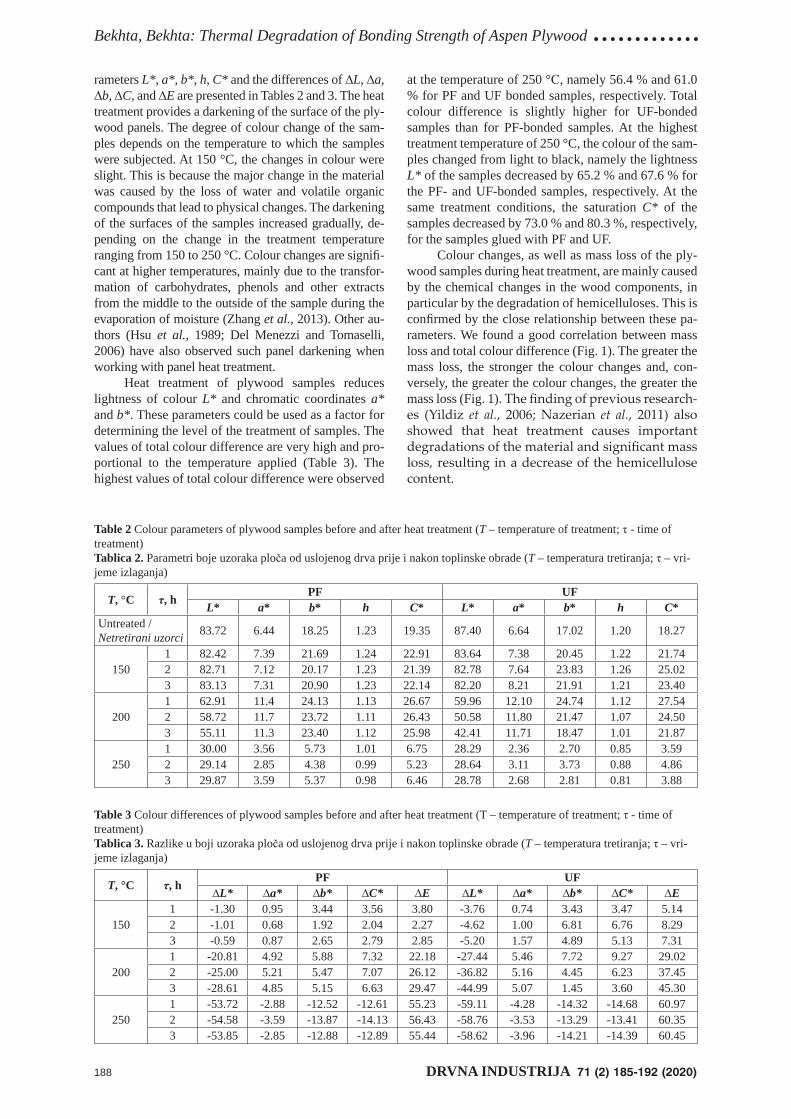
188 DRVNA INDUSTRIJA 71 (2) 185-192 (2020)
Bekhta, Bekhta: Thermal Degradation of Bonding Strength of Aspen Plywood .............rameters L*, a*, b*, h, C* and the differences of ∆L, ∆a, ∆b, ∆C, and ∆E are presented in Tables 2 and 3. The heat treatment provides a darkening of the surface of the ply-wood panels. The degree of colour change of the sam-ples depends on the temperature to which the samples were subjected. At 150 °C, the changes in colour were slight. This is because the major change in the material was caused by the loss of water and volatile organic compounds that lead to physical changes. The darkening of the surfaces of the samples increased gradually, de-pending on the change in the treatment temperature ranging from 150 to 250 °C. Colour changes are signifi -cant at higher temperatures, mainly due to the transfor-mation of carbohydrates, phenols and other extracts from the middle to the outside of the sample during the evaporation of moisture (Zhang et al., 2013). Other au-thors (Hsu et al., 1989; Del Menezzi and Tomaselli, 2006) have also observed such panel darkening when working with panel heat treatment.
Heat treatment of plywood samples reduces lightness of colour L* and chromatic coordinates a* and b*. These parameters could be used as a factor for determining the level of the treatment of samples. The values of total colour difference are very high and pro-portional to the temperature applied (Table 3). The highest values of total colour difference were observed
at the temperature of 250 °С, namely 56.4 % and 61.0 % for PF and UF bonded samples, respectively. Total colour difference is slightly higher for UF-bonded samples than for PF-bonded samples. At the highest treatment temperature of 250 °C, the colour of the sam-ples changed from light to black, namely the lightness L* of the samples decreased by 65.2 % and 67.6 % for the PF- and UF-bonded samples, respectively. At the same treatment conditions, the saturation C* of the samples decreased by 73.0 % and 80.3 %, respectively, for the samples glued with PF and UF.
Colour changes, as well as mass loss of the ply-wood samples during heat treatment, are mainly caused by the chemical changes in the wood components, in particular by the degradation of hemicelluloses. This is confi rmed by the close relationship between these pa-rameters. We found a good correlation between mass loss and total colour difference (Fig. 1). The greater the mass loss, the stronger the colour changes and, con-versely, the greater the colour changes, the greater the mass loss (Fig. 1). The fi nding of previous research-es (Yildiz et al., 2006; Nazerian et al., 2011) also showed that heat treatment causes important degradations of the material and signifi cant mass loss, resulting in a decrease of the hemicellulose content.
Table 2 Colour parameters of plywood samples before and after heat treatment (T – temperature of treatment; τ - time of treatment)Tablica 2. Parametri boje uzoraka ploča od uslojenog drva prije i nakon toplinske obrade (T – temperatura tretiranja; τ – vri-jeme izlaganja)
T, °C τ, h PF UFL* a* b* h C* L* a* b* h C*
Untreated / Netretirani uzorci 83.72 6.44 18.25 1.23 19.35 87.40 6.64 17.02 1.20 18.27
1501 82.42 7.39 21.69 1.24 22.91 83.64 7.38 20.45 1.22 21.742 82.71 7.12 20.17 1.23 21.39 82.78 7.64 23.83 1.26 25.023 83.13 7.31 20.90 1.23 22.14 82.20 8.21 21.91 1.21 23.40
2001 62.91 11.4 24.13 1.13 26.67 59.96 12.10 24.74 1.12 27.542 58.72 11.7 23.72 1.11 26.43 50.58 11.80 21.47 1.07 24.503 55.11 11.3 23.40 1.12 25.98 42.41 11.71 18.47 1.01 21.87
2501 30.00 3.56 5.73 1.01 6.75 28.29 2.36 2.70 0.85 3.592 29.14 2.85 4.38 0.99 5.23 28.64 3.11 3.73 0.88 4.863 29.87 3.59 5.37 0.98 6.46 28.78 2.68 2.81 0.81 3.88
Table 3 Colour differences of plywood samples before and after heat treatment (T – temperature of treatment; τ - time of treatment)Tablica 3. Razlike u boji uzoraka ploča od uslojenog drva prije i nakon toplinske obrade (T – temperatura tretiranja; τ – vri-jeme izlaganja)
T, °C τ, h PF UF∆L* ∆a* ∆b* ∆C* ∆E ∆L* ∆a* ∆b* ∆C* ∆E
1501 -1.30 0.95 3.44 3.56 3.80 -3.76 0.74 3.43 3.47 5.142 -1.01 0.68 1.92 2.04 2.27 -4.62 1.00 6.81 6.76 8.293 -0.59 0.87 2.65 2.79 2.85 -5.20 1.57 4.89 5.13 7.31
2001 -20.81 4.92 5.88 7.32 22.18 -27.44 5.46 7.72 9.27 29.022 -25.00 5.21 5.47 7.07 26.12 -36.82 5.16 4.45 6.23 37.453 -28.61 4.85 5.15 6.63 29.47 -44.99 5.07 1.45 3.60 45.30
2501 -53.72 -2.88 -12.52 -12.61 55.23 -59.11 -4.28 -14.32 -14.68 60.972 -54.58 -3.59 -13.87 -14.13 56.43 -58.76 -3.53 -13.29 -13.41 60.353 -53.85 -2.85 -12.88 -12.89 55.44 -58.62 -3.96 -14.21 -14.39 60.45
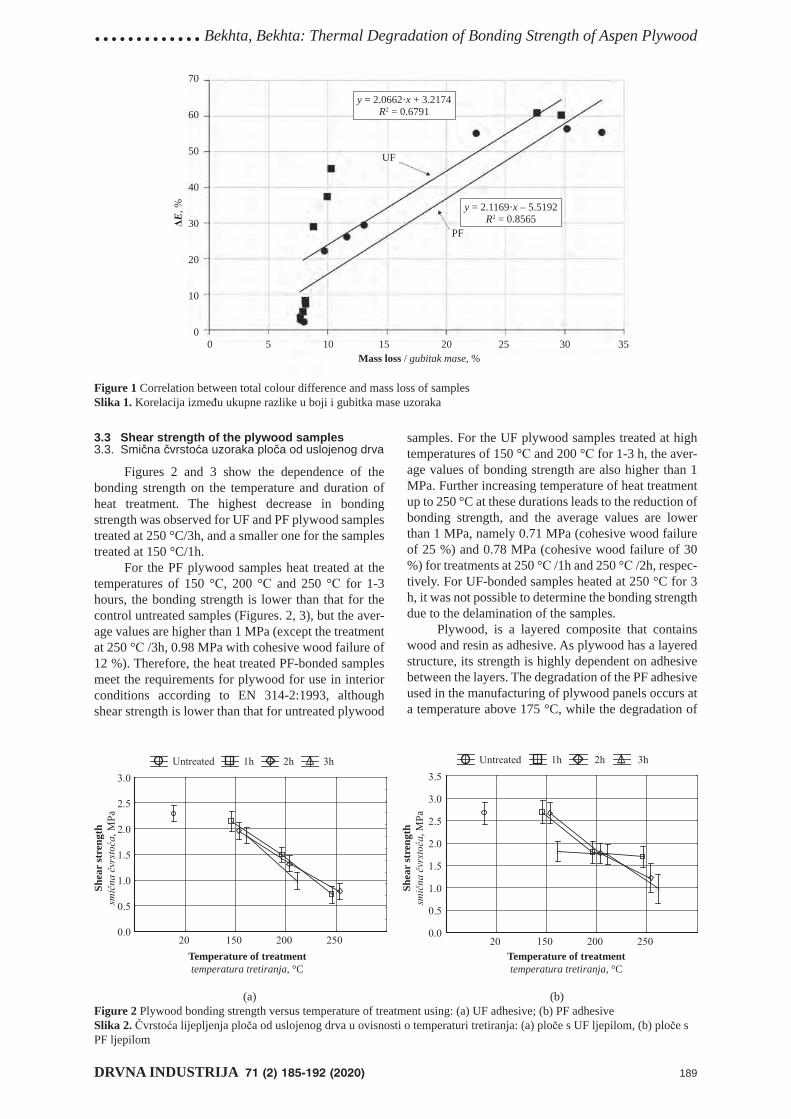
DRVNA INDUSTRIJA 71 (2) 185-192 (2020) 189
.............Bekhta, Bekhta: Thermal Degradation of Bonding Strength of Aspen Plywood
3.3 Shear strength of the plywood samples3.3. Smična čvrstoća uzoraka ploča od uslojenog drva
Figures 2 and 3 show the dependence of the bonding strength on the temperature and duration of heat treatment. The highest decrease in bonding strength was observed for UF and PF plywood samples treated at 250 °C/3h, and a smaller one for the samples treated at 150 °C/1h.
For the PF plywood samples heat treated at the temperatures of 150 °С, 200 °С and 250 °С for 1-3 hours, the bonding strength is lower than that for the control untreated samples (Figures. 2, 3), but the aver-age values are higher than 1 MPa (except the treatment at 250 °С /3h, 0.98 MPa with cohesive wood failure of 12 %). Therefore, the heat treated PF-bonded samples meet the requirements for plywood for use in interior conditions according to EN 314-2:1993, although shear strength is lower than that for untreated plywood
samples. For the UF plywood samples treated at high temperatures of 150 °С and 200 °С for 1-3 h, the aver-age values of bonding strength are also higher than 1 MPa. Further increasing temperature of heat treatment up to 250 °C at these durations leads to the reduction of bonding strength, and the average values are lower than 1 MPa, namely 0.71 MPa (cohesive wood failure of 25 %) and 0.78 MPa (cohesive wood failure of 30 %) for treatments at 250 °С /1h and 250 °С /2h, respec-tively. For UF-bonded samples heated at 250 °C for 3 h, it was not possible to determine the bonding strength due to the delamination of the samples.
Plywood, is a layered composite that contains wood and resin as adhesive. As plywood has a layered structure, its strength is highly dependent on adhesive between the layers. The degradation of the PF adhesive used in the manufacturing of plywood panels occurs at a temperature above 175 °C, while the degradation of
Figure 1 Correlation between total colour difference and mass loss of samplesSlika 1. Korelacija između ukupne razlike u boji i gubitka mase uzoraka
(a) (b)Figure 2 Plywood bonding strength versus temperature of treatment using: (a) UF adhesive; (b) PF adhesiveSlika 2. Čvrstoća lijepljenja ploča od uslojenog drva u ovisnosti o temperaturi tretiranja: (a) ploče s UF ljepilom, (b) ploče s PF ljepilom
Temperature of treatmenttemperatura tretiranja, °C
Temperature of treatmenttemperatura tretiranja, °C
Shea
r st
reng
th , MPa
Shea
r st
reng
th , MPa
70
60
50
40
30
20
10
00 5 10 15 20 25 30 35
Mass loss / gubitak mase, %
ΔE, %
UF
PF
y = 2.0662·x + 3.2174R2 = 0.6791
y = 2.1169·x – 5.5192R2 = 0.8565
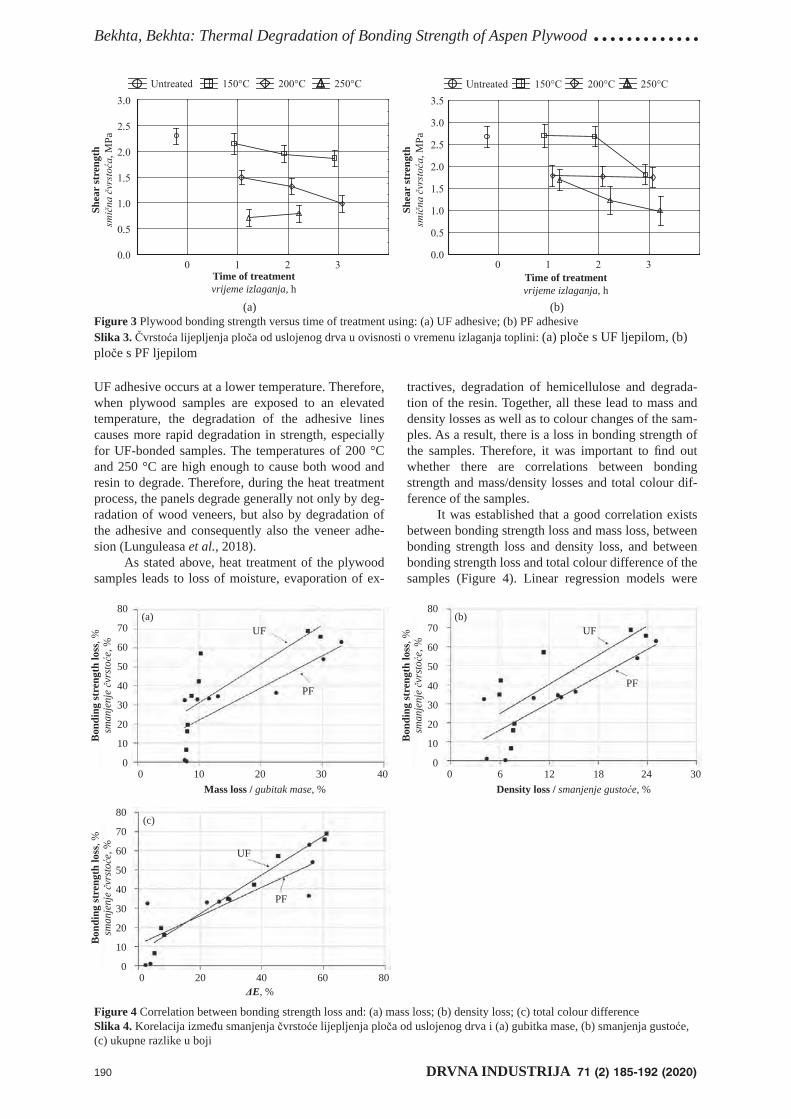
190 DRVNA INDUSTRIJA 71 (2) 185-192 (2020)
Bekhta, Bekhta: Thermal Degradation of Bonding Strength of Aspen Plywood .............
UF adhesive occurs at a lower temperature. Therefore, when plywood samples are exposed to an elevated temperature, the degradation of the adhesive lines causes more rapid degradation in strength, especially for UF-bonded samples. The temperatures of 200 °C and 250 °C are high enough to cause both wood and resin to degrade. Therefore, during the heat treatment process, the panels degrade generally not only by deg-radation of wood veneers, but also by degradation of the adhesive and consequently also the veneer adhe-sion (Lunguleasa et al., 2018).
As stated above, heat treatment of the plywood samples leads to loss of moisture, evaporation of ex-
tractives, degradation of hemicellulose and degrada-tion of the resin. Together, all these lead to mass and density losses as well as to colour changes of the sam-ples. As a result, there is a loss in bonding strength of the samples. Therefore, it was important to fi nd out whether there are correlations between bonding strength and mass/density losses and total colour dif-ference of the samples.
It was established that a good correlation exists between bonding strength loss and mass loss, between bonding strength loss and density loss, and between bonding strength loss and total colour difference of the samples (Figure 4). Linear regression models were
Time of treatmentvrijeme izlaganja, h
Shea
r st
reng
th , MPa
Shea
r st
reng
th , MPa
Time of treatmentvrijeme izlaganja, h
(a) (b)Figure 3 Plywood bonding strength versus time of treatment using: (a) UF adhesive; (b) PF adhesiveSlika 3. Čvrstoća lijepljenja ploča od uslojenog drva u ovisnosti o vremenu izlaganja toplini: (a) ploče s UF ljepilom, (b) ploče s PF ljepilom
Figure 4 Correlation between bonding strength loss and: (a) mass loss; (b) density loss; (c) total colour differenceSlika 4. Korelacija između smanjenja čvrstoće lijepljenja ploča od uslojenog drva i (a) gubitka mase, (b) smanjenja gustoće, (c) ukupne razlike u boji
80
70
60
50
40
30
20
10
00 10 20 30 40
Mass loss / gubitak mase, %
UF
PF
Bon
ding
stre
ngth
loss
, %sm
anje
nje čv
rstoće
, %
(a)
80
70
60
50
40
30
20
10
00 20 40 60 80
ΔE, %
UF
PF
(c)
80
70
60
50
40
30
20
10
00 6 12 18 24 30
UF
PF
(b)
Density loss / smanjenje gustoće, %
Bon
ding
stre
ngth
loss
, %sm
anje
nje čv
rstoće
, %
Bon
ding
stre
ngth
loss
, %sm
anje
nje čv
rstoće
, %
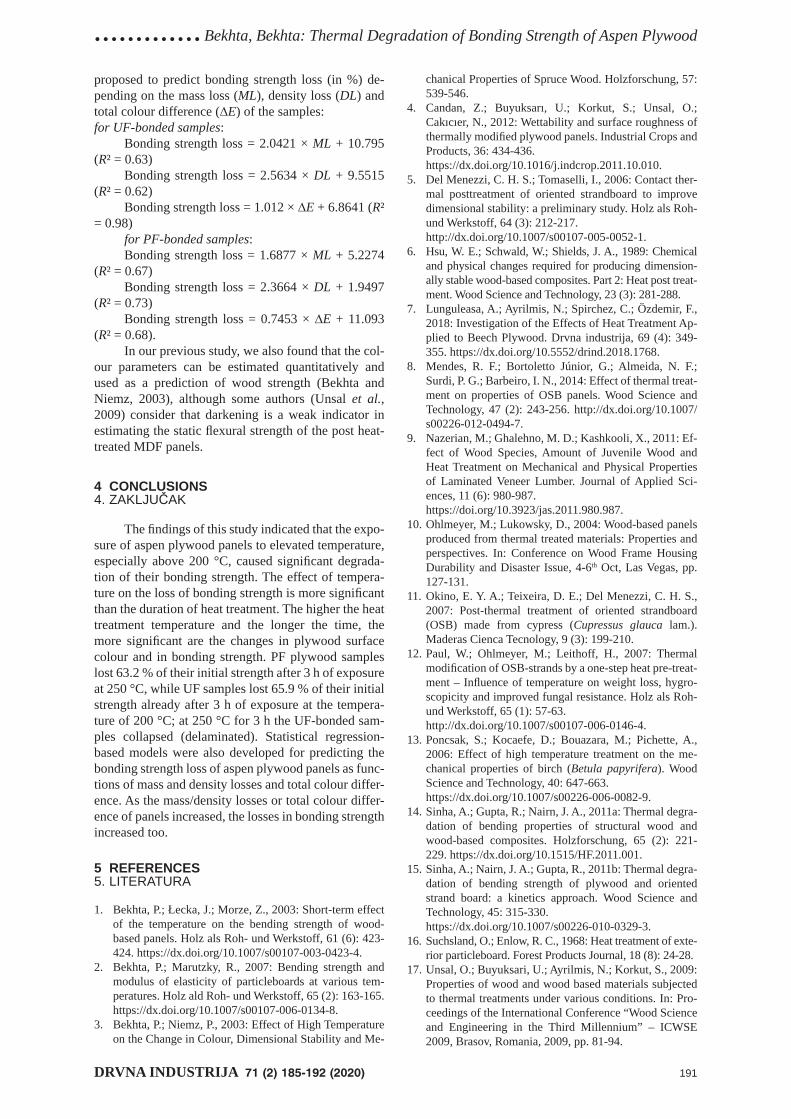
DRVNA INDUSTRIJA 71 (2) 185-192 (2020) 191
.............Bekhta, Bekhta: Thermal Degradation of Bonding Strength of Aspen Plywood
proposed to predict bonding strength loss (in %) de-pending on the mass loss (ML), density loss (DL) and total colour difference (∆E) of the samples:for UF-bonded samples:
Bonding strength loss = 2.0421 × ML + 10.795 (R² = 0.63)
Bonding strength loss = 2.5634 × DL + 9.5515 (R² = 0.62)
Bonding strength loss = 1.012 × ∆E + 6.8641 (R² = 0.98)
for PF-bonded samples:Bonding strength loss = 1.6877 × ML + 5.2274
(R² = 0.67)Bonding strength loss = 2.3664 × DL + 1.9497
(R² = 0.73)Bonding strength loss = 0.7453 × ∆E + 11.093
(R² = 0.68).In our previous study, we also found that the col-
our parameters can be estimated quantitatively and used as a prediction of wood strength (Bekhta and Niemz, 2003), although some authors (Unsal et al., 2009) consider that darkening is a weak indicator in estimating the static fl exural strength of the post heat-treated MDF panels.
4 CONCLUSIONS4. ZAKLJUČAK
The fi ndings of this study indicated that the expo-sure of aspen plywood panels to elevated temperature, especially above 200 °C, caused signifi cant degrada-tion of their bonding strength. The effect of tempera-ture on the loss of bonding strength is more signifi cant than the duration of heat treatment. The higher the heat treatment temperature and the longer the time, the more signifi cant are the changes in plywood surface colour and in bonding strength. PF plywood samples lost 63.2 % of their initial strength after 3 h of exposure at 250 °C, while UF samples lost 65.9 % of their initial strength already after 3 h of exposure at the tempera-ture of 200 °C; at 250 °C for 3 h the UF-bonded sam-ples collapsed (delaminated). Statistical regression-based models were also developed for predicting the bonding strength loss of aspen plywood panels as func-tions of mass and density losses and total colour differ-ence. As the mass/density losses or total colour differ-ence of panels increased, the losses in bonding strength increased too.
5 REFERENCES5. LITERATURA
1. Bekhta, P.; Łecka, J.; Morze, Z., 2003: Short-term effect of the temperature on the bending strength of wood-based panels. Holz als Roh- und Werkstoff, 61 (6): 423-424. https://dx.doi.org/10.1007/s00107-003-0423-4.
2. Bekhta, P.; Marutzky, R., 2007: Bending strength and modulus of elasticity of particleboards at various tem-peratures. Holz ald Roh- und Werkstoff, 65 (2): 163-165. https://dx.doi.org/10.1007/s00107-006-0134-8.
3. Bekhta, P.; Niemz, P., 2003: Effect of High Temperature on the Change in Colour, Dimensional Stability and Me-
chanical Properties of Spruce Wood. Holzforschung, 57: 539-546.
4. Candan, Z.; Buyuksarı, U.; Korkut, S.; Unsal, O.; Cakıcıer, N., 2012: Wettability and surface roughness of thermally modifi ed plywood panels. Industrial Crops and Products, 36: 434-436.
https://dx.doi.org/10.1016/j.indcrop.2011.10.010.5. Del Menezzi, C. H. S.; Tomaselli, I., 2006: Contact ther-
mal posttreatment of oriented strandboard to improve dimensional stability: a preliminary study. Holz als Roh- und Werkstoff, 64 (3): 212-217.
http://dx.doi.org/10.1007/s00107-005-0052-1.6. Hsu, W. E.; Schwald, W.; Shields, J. A., 1989: Chemical
and physical changes required for producing dimension-ally stable wood-based composites. Part 2: Heat post treat-ment. Wood Science and Technology, 23 (3): 281-288.
7. Lunguleasa, A.; Ayrilmis, N.; Spirchez, C.; Özdemir, F., 2018: Investigation of the Effects of Heat Treatment Ap-plied to Beech Plywood. Drvna industrija, 69 (4): 349-355. https://dx.doi.org/10.5552/drind.2018.1768.
8. Mendes, R. F.; Bortoletto Júnior, G.; Almeida, N. F.; Surdi, P. G.; Barbeiro, I. N., 2014: Effect of thermal treat-ment on properties of OSB panels. Wood Science and Technology, 47 (2): 243-256. http://dx.doi.org/10.1007/s00226-012-0494-7.
9. Nazerian, M.; Ghalehno, M. D.; Kashkooli, X., 2011: Ef-fect of Wood Species, Amount of Juvenile Wood and Heat Treatment on Mechanical and Physical Properties of Laminated Veneer Lumber. Journal of Applied Sci-ences, 11 (6): 980-987.
https://doi.org/10.3923/jas.2011.980.987.10. Ohlmeyer, M.; Lukowsky, D., 2004: Wood-based panels
produced from thermal treated materials: Properties and perspectives. In: Conference on Wood Frame Housing Durability and Disaster Issue, 4-6th Oct, Las Vegas, pp. 127-131.
11. Okino, E. Y. A.; Teixeira, D. E.; Del Menezzi, C. H. S., 2007: Post-thermal treatment of oriented strandboard (OSB) made from cypress (Cupressus glauca lam.). Maderas Cienca Tecnology, 9 (3): 199-210.
12. Paul, W.; Ohlmeyer, M.; Leithoff, H., 2007: Thermal modifi cation of OSB-strands by a one-step heat pre-treat-ment – Infl uence of temperature on weight loss, hygro-scopicity and improved fungal resistance. Holz als Roh- und Werkstoff, 65 (1): 57-63.
http://dx.doi.org/10.1007/s00107-006-0146-4.13. Poncsak, S.; Kocaefe, D.; Bouazara, M.; Pichette, A.,
2006: Effect of high temperature treatment on the me-chanical properties of birch (Betula papyrifera). Wood Science and Technology, 40: 647-663.
https://dx.doi.org/10.1007/s00226-006-0082-9.14. Sinha, A.; Gupta, R.; Nairn, J. A., 2011a: Thermal degra-
dation of bending properties of structural wood and wood-based composites. Holzforschung, 65 (2): 221-229. https://dx.doi.org/10.1515/HF.2011.001.
15. Sinha, A.; Nairn, J. A.; Gupta, R., 2011b: Thermal degra-dation of bending strength of plywood and oriented strand board: a kinetics approach. Wood Science and Technology, 45: 315-330.
https://dx.doi.org/10.1007/s00226-010-0329-3.16. Suchsland, O.; Enlow, R. C., 1968: Heat treatment of exte-
rior particleboard. Forest Products Journal, 18 (8): 24-28.17. Unsal, O.; Buyuksari, U.; Ayrilmis, N.; Korkut, S., 2009:
Properties of wood and wood based materials subjected to thermal treatments under various conditions. In: Pro-ceedings of the International Conference “Wood Science and Engineering in the Third Millennium” – ICWSE 2009, Brasov, Romania, 2009, pp. 81-94.
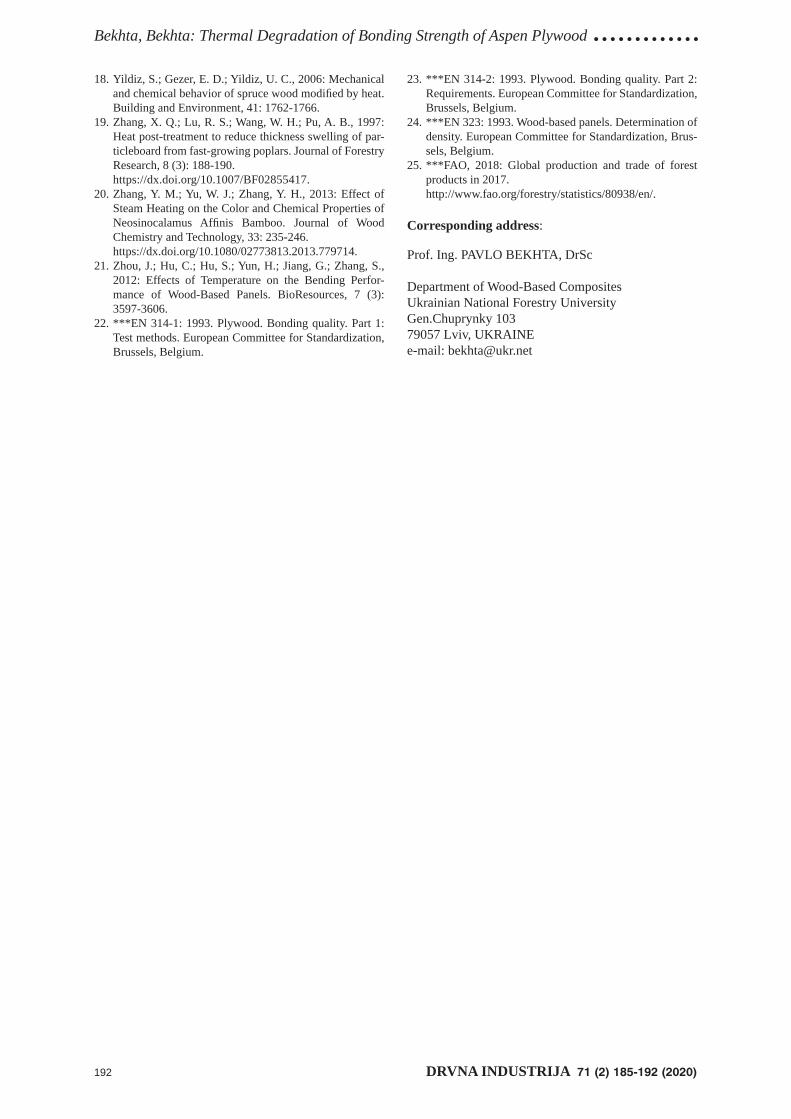
192 DRVNA INDUSTRIJA 71 (2) 185-192 (2020)
Bekhta, Bekhta: Thermal Degradation of Bonding Strength of Aspen Plywood .............18. Yildiz, S.; Gezer, E. D.; Yildiz, U. C., 2006: Mechanical
and chemical behavior of spruce wood modifi ed by heat. Building and Environment, 41: 1762-1766.
19. Zhang, X. Q.; Lu, R. S.; Wang, W. H.; Pu, A. B., 1997: Heat post-treatment to reduce thickness swelling of par-ticleboard from fast-growing poplars. Journal of Forestry Research, 8 (3): 188-190.
https://dx.doi.org/10.1007/BF02855417.20. Zhang, Y. M.; Yu, W. J.; Zhang, Y. H., 2013: Effect of
Steam Heating on the Color and Chemical Properties of Neosinocalamus Affi nis Bamboo. Journal of Wood Chemistry and Technology, 33: 235-246.
https://dx.doi.org/10.1080/02773813.2013.779714.21. Zhou, J.; Hu, C.; Hu, S.; Yun, H.; Jiang, G.; Zhang, S.,
2012: Effects of Temperature on the Bending Perfor-mance of Wood-Based Panels. BioResources, 7 (3): 3597-3606.
22. ***EN 314-1: 1993. Plywood. Bonding quality. Part 1: Test methods. European Committee for Standardization, Brussels, Belgium.
23. ***EN 314-2: 1993. Plywood. Bonding quality. Part 2: Requirements. European Committee for Standardization, Brussels, Belgium.
24. ***EN 323: 1993. Wood-based panels. Determination of density. European Committee for Standardization, Brus-sels, Belgium.
25. ***FAO, 2018: Global production and trade of forest products in 2017.
http://www.fao.org/forestry/statistics/80938/en/.
Corresponding address:
Prof. Ing. PAVLO BEKHTA, DrSc
Department of Wood-Based CompositesUkrainian National Forestry UniversityGen.Chuprynky 10379057 Lviv, UKRAINEe-mail: [email protected]

..... Sandak, Orlowski, Sandak, Chuchala, Taube: On-Line Measurement of Wood Surface...
DRVNA INDUSTRIJA 71 (2) 193-200 (2020) 193
Jakub Sandak1,2, Kazimierz A. Orlowski3, Anna Sandak1,4, Daniel Chuchala3, Piotr Taube5
On-Line Measurement of Wood Surface SmoothnessOnline mjerenje glatkoće površine drva
Original scientifi c paper • Izvorni znanstveni radReceived – prispjelo: 20. 10. 2019.Accepted – prihvaćeno: 28. 4. 2020.UDK: 630*823.121https://doi.org/10.5552/drvind.2020.1970
ABSTRACT • The latest progress in the fi eld of optics and microelectronics resulted in the development of new generation vision systems capable of scanning surface topography with very high sampling frequencies. The blue color of illuminating light as well as novel systems for controlling ultra-thin laser line thickness allows the mea-surement of the porous surface of wood with a triangulation method. Three alternative sensors were tested here in order to verify their suitability for the determination of surface topography in the industrial environment. The scanning head was installed at the exit zone of the four-side profi ling moulder and was set to scrutinize the wood surface shape line-by-line, immediately after profi ling. The sensor was also tested for automatic detection of sur-face defects appearing on the elements after sanding, wetting and painting with various fi nishing products. The set of pilot test results is presented, together with an original algorithm for real-time surface defects detection.
Keywords: wood surface smoothness; triangulation scanner; surface defects; in-line
SAŽETAK • Najnoviji napredak u području optike i mikroelektronike rezultirao je novom generacijom skenera koji mogu skenirati topografi ju površine vrlo visokom frekvencijom uzorkovanja. Svjetlost plave boje, kao i novi sustav za kontrolu vrlo tanke laserske zrake omogućuju mjerenje porozne površine drva metodom triangulacije. Testirana su tri alternativna senzora kako bi se potvrdila njihova prikladnost za određivanje topografi je površine u industrijskim uvjetima. Glava za skeniranje postavljena je na izlazu četverostranoga profi lnoga glodala kako bi se odmah nakon profi liranja pomno linijski skenirala površina drva. Senzor je također testiran za automatsko ot-krivanje površinskih grešaka na elementima nakon brušenja, vlaženja i premazivanja različitim premaznim materi-jalima. Predstavljen je set rezultata pilot-ispitivanja, zajedno s originalnim algoritmom za otkrivanje površinskih grešaka u realnom vremenu.
Ključne riječi: glatkoća površine drva; triangularni skener; površinske greške; linijsko skeniranje
1Authors are researchers at InnoRenew CoE, Isola, Slovenia.2Author is researcher at University of Primorska, Andrej Marušič Institute, Koper, Slovenia.3Authors are researchers at Gdansk University of Technology, Faculty of Mechanical Engineering, Department of Manufacturing Engineering
and Automation, Gdansk, Poland. 4Author is researcher at University of Primorska, Faculty of Mathematics, Natural Sciences and Information Technologies, Koper, Slovenia. 5Author is researcher at SylvaDrewno Sp z o.o., Wiele, Poland.
© 2020 by the author(s).Licensee Faculty of Forestry, University of Zagreb.
This article is an open access article distributedunder the terms and conditions of the
Creative Commons Attribution (CC BY 4.0) license.
1 INTRODUCTION1. UVOD
Surface smoothness of products manufactured from wood is a critical property highly affecting prod-uct quality, its value and in-service life performance (Sandak, 2005). In a majority of cases, the surface of wood is an effect of the material allowance removed with a sharp cutting edge. The magnitude of roughness
depends on several factors, where material properties, machining process kinematics, cutting tool conditions and machining imperfections are dominant (Škaljić et al., 2009; Sofuoğlu, 2015). The ability for monitoring surface quality at the early stage of the production pro-cess was always a desire of process engineers (Nasir and Cool, 2018). Several methods were proposed for that purpose, but none of these were widely accepted by the wood industries. The superior methodology for
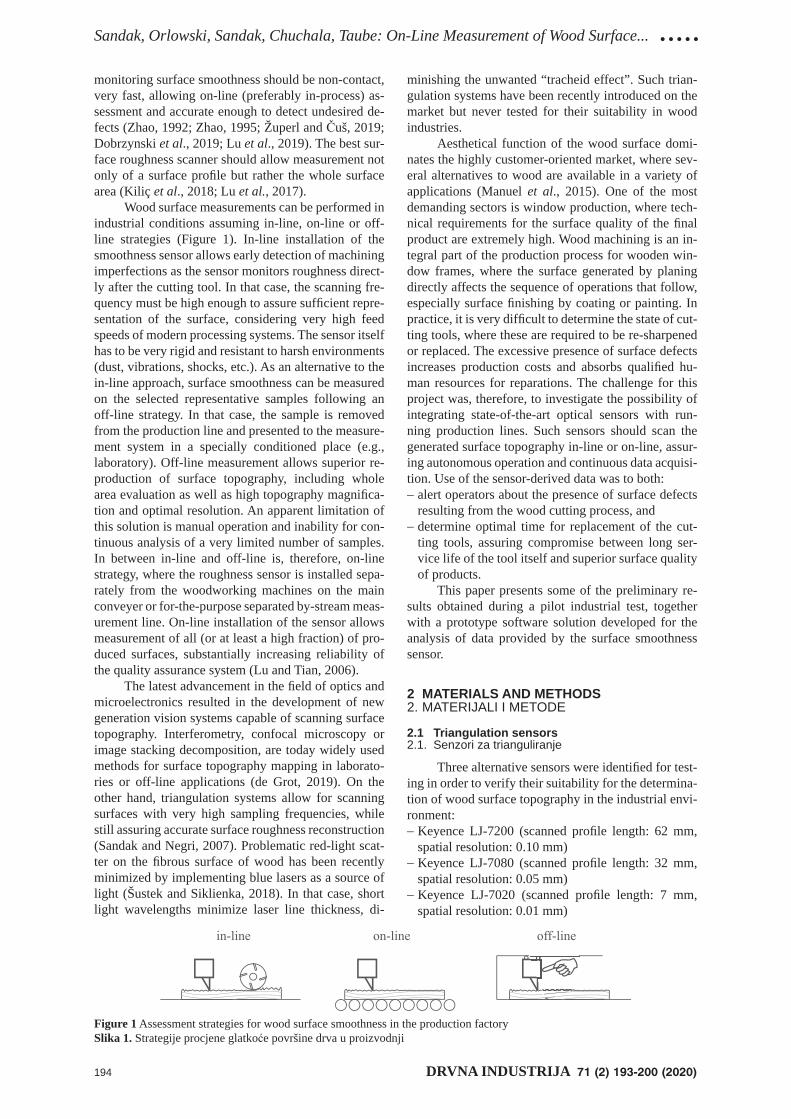
Sandak, Orlowski, Sandak, Chuchala, Taube: On-Line Measurement of Wood Surface... .....
194 DRVNA INDUSTRIJA 71 (2) 193-200 (2020)
monitoring surface smoothness should be non-contact, very fast, allowing on-line (preferably in-process) as-sessment and accurate enough to detect undesired de-fects (Zhao, 1992; Zhao, 1995; Župerl and Čuš, 2019; Dobrzynski et al., 2019; Lu et al., 2019). The best sur-face roughness scanner should allow measurement not only of a surface profi le but rather the whole surface area (Kiliç et al., 2018; Lu et al., 2017).
Wood surface measurements can be performed in industrial conditions assuming in-line, on-line or off-line strategies (Figure 1). In-line installation of the smoothness sensor allows early detection of machining imperfections as the sensor monitors roughness direct-ly after the cutting tool. In that case, the scanning fre-quency must be high enough to assure suffi cient repre-sentation of the surface, considering very high feed speeds of modern processing systems. The sensor itself has to be very rigid and resistant to harsh environments (dust, vibrations, shocks, etc.). As an alternative to the in-line approach, surface smoothness can be measured on the selected representative samples following an off-line strategy. In that case, the sample is removed from the production line and presented to the measure-ment system in a specially conditioned place (e.g., laboratory). Off-line measurement allows superior re-production of surface topography, including whole area evaluation as well as high topography magnifi ca-tion and optimal resolution. An apparent limitation of this solution is manual operation and inability for con-tinuous analysis of a very limited number of samples. In between in-line and off-line is, therefore, on-line strategy, where the roughness sensor is installed sepa-rately from the woodworking machines on the main conveyer or for-the-purpose separated by-stream meas-urement line. On-line installation of the sensor allows measurement of all (or at least a high fraction) of pro-duced surfaces, substantially increasing reliability of the quality assurance system (Lu and Tian, 2006).
The latest advancement in the fi eld of optics and microelectronics resulted in the development of new generation vision systems capable of scanning surface topography. Interferometry, confocal microscopy or image stacking decomposition, are today widely used methods for surface topography mapping in laborato-ries or off-line applications (de Grot, 2019). On the other hand, triangulation systems allow for scanning surfaces with very high sampling frequencies, while still assuring accurate surface roughness reconstruction (Sandak and Negri, 2007). Problematic red-light scat-ter on the fi brous surface of wood has been recently minimized by implementing blue lasers as a source of light (Šustek and Siklienka, 2018). In that case, short light wavelengths minimize laser line thickness, di-
minishing the unwanted “tracheid effect”. Such trian-gulation systems have been recently introduced on the market but never tested for their suitability in wood industries.
Aesthetical function of the wood surface domi-nates the highly customer-oriented market, where sev-eral alternatives to wood are available in a variety of applications (Manuel et al., 2015). One of the most demanding sectors is window production, where tech-nical requirements for the surface quality of the fi nal product are extremely high. Wood machining is an in-tegral part of the production process for wooden win-dow frames, where the surface generated by planing directly affects the sequence of operations that follow, especially surface fi nishing by coating or painting. In practice, it is very diffi cult to determine the state of cut-ting tools, where these are required to be re-sharpened or replaced. The excessive presence of surface defects increases production costs and absorbs qualifi ed hu-man resources for reparations. The challenge for this project was, therefore, to investigate the possibility of integrating state-of-the-art optical sensors with run-ning production lines. Such sensors should scan the generated surface topography in-line or on-line, assur-ing autonomous operation and continuous data acquisi-tion. Use of the sensor-derived data was to both: alert operators about the presence of surface defects
resulting from the wood cutting process, anddetermine optimal time for replacement of the cut-
ting tools, assuring compromise between long ser-vice life of the tool itself and superior surface quality of products.
This paper presents some of the preliminary re-sults obtained during a pilot industrial test, together with a prototype software solution developed for the analysis of data provided by the surface smoothness sensor.
2 MATERIALS AND METHODS2. MATERIJALI I METODE
2.1 Triangulation sensors2.1. Senzori za trianguliranje
Three alternative sensors were identifi ed for test-ing in order to verify their suitability for the determina-tion of wood surface topography in the industrial envi-ronment:Keyence LJ-7200 (scanned profi le length: 62 mm,
spatial resolution: 0.10 mm)Keyence LJ-7080 (scanned profi le length: 32 mm,
spatial resolution: 0.05 mm)Keyence LJ-7020 (scanned profi le length: 7 mm,
spatial resolution: 0.01 mm)
Figure 1 Assessment strategies for wood surface smoothness in the production factorySlika 1. Strategije procjene glatkoće površine drva u proizvodnji
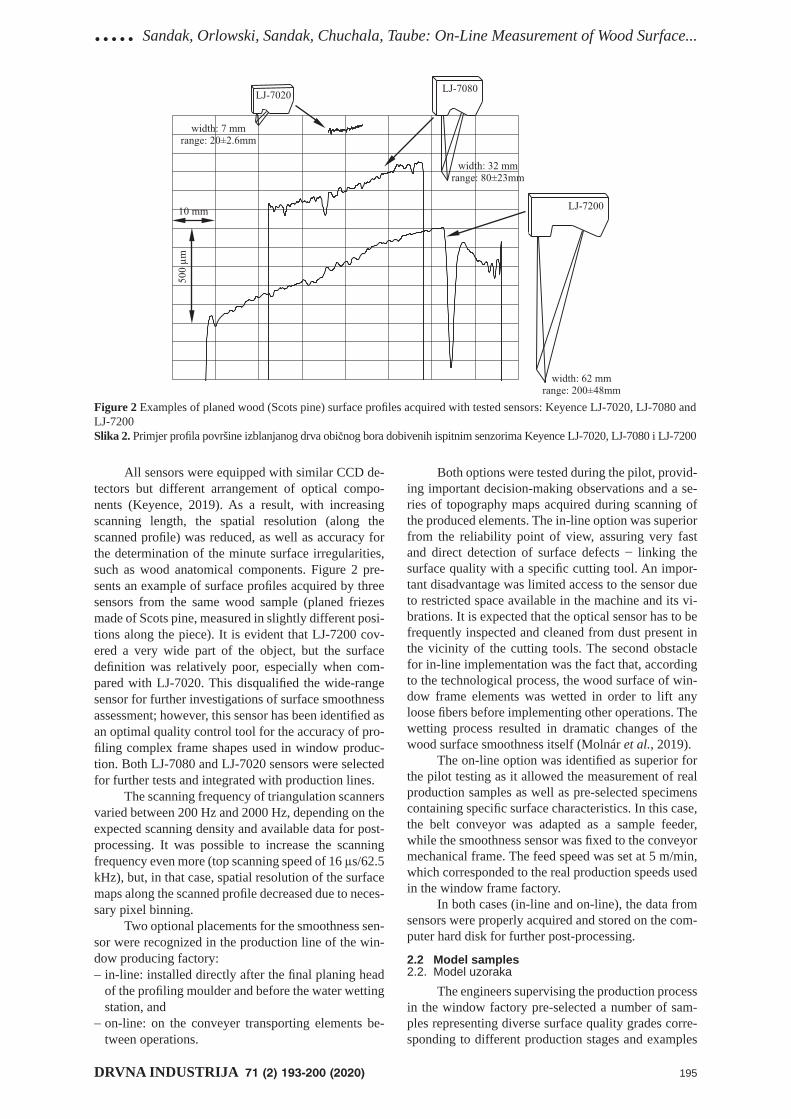
..... Sandak, Orlowski, Sandak, Chuchala, Taube: On-Line Measurement of Wood Surface...
DRVNA INDUSTRIJA 71 (2) 193-200 (2020) 195
All sensors were equipped with similar CCD de-tectors but different arrangement of optical compo-nents (Keyence, 2019). As a result, with increasing scanning length, the spatial resolution (along the scanned profi le) was reduced, as well as accuracy for the determination of the minute surface irregularities, such as wood anatomical components. Figure 2 pre-sents an example of surface profi les acquired by three sensors from the same wood sample (planed friezes made of Scots pine, measured in slightly different posi-tions along the piece). It is evident that LJ-7200 cov-ered a very wide part of the object, but the surface defi nition was relatively poor, especially when com-pared with LJ-7020. This disqualifi ed the wide-range sensor for further investigations of surface smoothness assessment; however, this sensor has been identifi ed as an optimal quality control tool for the accuracy of pro-fi ling complex frame shapes used in window produc-tion. Both LJ-7080 and LJ-7020 sensors were selected for further tests and integrated with production lines.
The scanning frequency of triangulation scanners varied between 200 Hz and 2000 Hz, depending on the expected scanning density and available data for post-processin g. It was possible to increase the scanning frequency even more (top scanning speed of 16 μs/62.5 kHz), but, in that case, spatial resolution of the surface maps along the scanned profi le decreased due to neces-sary pixel binning.
Two optional placements for the smoothness sen-sor were recognized in the production line of the win-dow producing factory: in-line: installed directly after the fi nal planing head
of the profi ling moulder and before the water wetting station, and
on-line: on the conveyer transporting elements be-tween operations.
Both options were tested during the pilot, provid-ing important decision-making observations and a se-ries of topography maps acquired during scanning of the produced elements. The in-line option was superior from the reliability point of view, assuring very fast and direct detection of surface defects − linking the surface quality with a specifi c cutting t ool. An impor-tant disadvantage was limited access to the sensor due to restricted space available in the machine and its vi-brations. It is expected that the optical sensor has to be frequently inspected and cleaned from dust present in the vicinity of the cutting tools. The second obstacle for in-line implementation was the fact that, according to the technological process, the wood surface of win-dow frame elements was wetted in order to lift any loose fi bers before implementing other operations. The wetting process resulted in dramatic changes of the wood surface smoothness itself (Molnár et al., 2019).
The on-line option was identifi ed as superior for the pilot testing as it allowed the measurement of real production samples as well as pre-selected specimens containing specifi c surface characteristics. In this case, the belt conveyor was adapted as a sample feeder, while the smoothness sensor was fi xed to the conveyor mechanical frame. The feed speed was set at 5 m/min, which corresponded to the real production speeds used in the window frame factory.
In both cases (in-line and on-line), the data from sensors were properly acquired and stored on the com-puter hard disk for further post-processing.
2.2 Model samples2.2. Model uzoraka
The engineers supervising the production process in the window factory pre-selected a number of sam-ples representing diverse surface quality grades corre-sponding to different production stages and examples
Figure 2 Examples of planed wood (Scots pine) surface profi les acquired with tested sensor s: Keyence LJ-7020, LJ-7080 and LJ-7200Slika 2. Primjer profi la površine izblanjanog drva običnog bora dobivenih ispitnim senzorima Keyence LJ-7020, LJ-7080 i LJ-7200
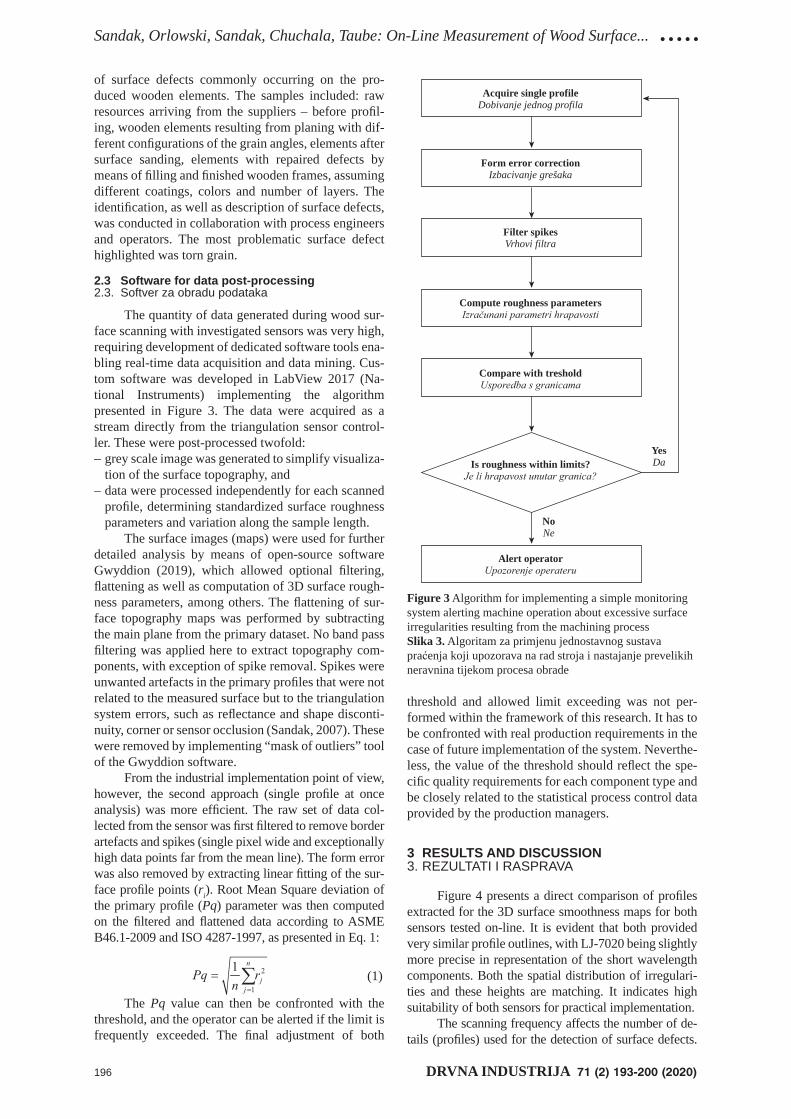
Sandak, Orlowski, Sandak, Chuchala, Taube: On-Line Measurement of Wood Surface... .....
196 DRVNA INDUSTRIJA 71 (2) 193-200 (2020)
of surface defects commonly occurring on the pro-duced wooden elements. The samples included: raw resources arriving from the suppliers – before profi l-ing, wooden elements resulting from planing with dif-ferent confi gurations of the grain angles, elements after surface sanding, elements with repaired defects by means of fi lling and fi nished wooden frames, assuming different coatings, colors and number of layers. The identifi cation, as well as description of surface defects, was conducted in collaboration with process engineers and operators. The most problematic surface defect highlighted was torn grain.
2.3 Software for data post-processing2.3. Softver za obradu podataka
The quantity of data generated during wood sur-face scanning with investigated sensors was very high, requiring development of dedicated software tools ena-bling real-time data acquisition and data mining. Cus-tom software was developed in LabView 2017 (Na-tional Instruments) implementing the algorithm presented in Figure 3. The data were acquired as a stream directly from the triangulation sensor control-ler. These were post-processed twofold:grey scale image was generated to simplify visualiza-
tion of the surface topography, anddata were processed independently for each scanned
profi le, determining standardized surface roughness parameters and variation along the sample length.
The surface images (maps) were used for further detailed analysis by means of open-source software Gwyddion (2019), which allowed optional fi ltering, fl attening as well as computation of 3D surface rough-ness parameters, among others. The fl attening of sur-face topography maps was performed by subtracting the main plane from the primary dataset. No band pass fi ltering was applied here to extract topography com-ponents, with exception of spike removal. Spikes were unwanted artefacts in the primary profi les that were not related to the measured surface but to the triangulation system errors, such as refl ectance and shape disconti-nuity, corner or sensor occlusion (Sandak, 2007). These were removed by implementing “mask of outliers” tool of the Gwyddion software.
From the industrial implementation point of view, however, the second approach (single profi le at once analysis) was more effi cient. The raw set of data col-lected from the sensor was fi rst fi ltered to remove border artefacts and spikes (single pixel wide and exceptionally high data points far from the mean line). The form error was also removed by extracting linear fi tting of the sur-face profi le points (ri). Root Mean Square deviation of the primary profi le (Pq) parameter was then computed on the fi ltered and fl attened data according to ASME B46.1-2009 and ISO 4287-1997, as presented in Eq. 1:
(1)
The Pq value can then be confronted with the threshold, and the operator can be alerted if the limit is frequently exceeded. The fi nal adjustment of both
threshold and allowed limit exceeding was not per-formed within the framework of this research. It has to be confronted with real production requirements in the case of future implementation of the system. Neverthe-less, the value of the threshold should refl ect the spe-cifi c quality requirements for each component type and be closely related to the statistical process control data provided by the production managers.
3 RESULTS AND DISCUSSION3. REZULTATI I RASPRAVA
Figure 4 presents a direct comparison of profi les extracted for the 3D surface smoothness maps for both sensors tested on-line. It is evident that both provided very similar profi le outlines, with LJ-7020 being slightly more precise in representation of the short wavelength components. Both the spatial distribution of irregulari-ties and these heights are matching. It indicates high suitability of both sensors for practical implementation.
The scanning frequency affects the number of de-tails (profi les) used for the detection of surface defects.
Acquire single profileDobivanje jednog profila
Form error correctionIzbacivanje grešaka
Filter spikesVrhovi filtra
Compute roughness parameters
Compare with treshold
Is roughness within limits?
Alert operator
YesDa
NoNe
Figure 3 Algorithm for implementing a simple monitoring system alerting machine operation about excessive surface irregularities resulting from the machining processSlika 3. Algoritam za primjenu jednostavnog sustava praćenja koji upozorava na rad stroja i nastajanje prevelikih neravnina tijekom procesa obrade
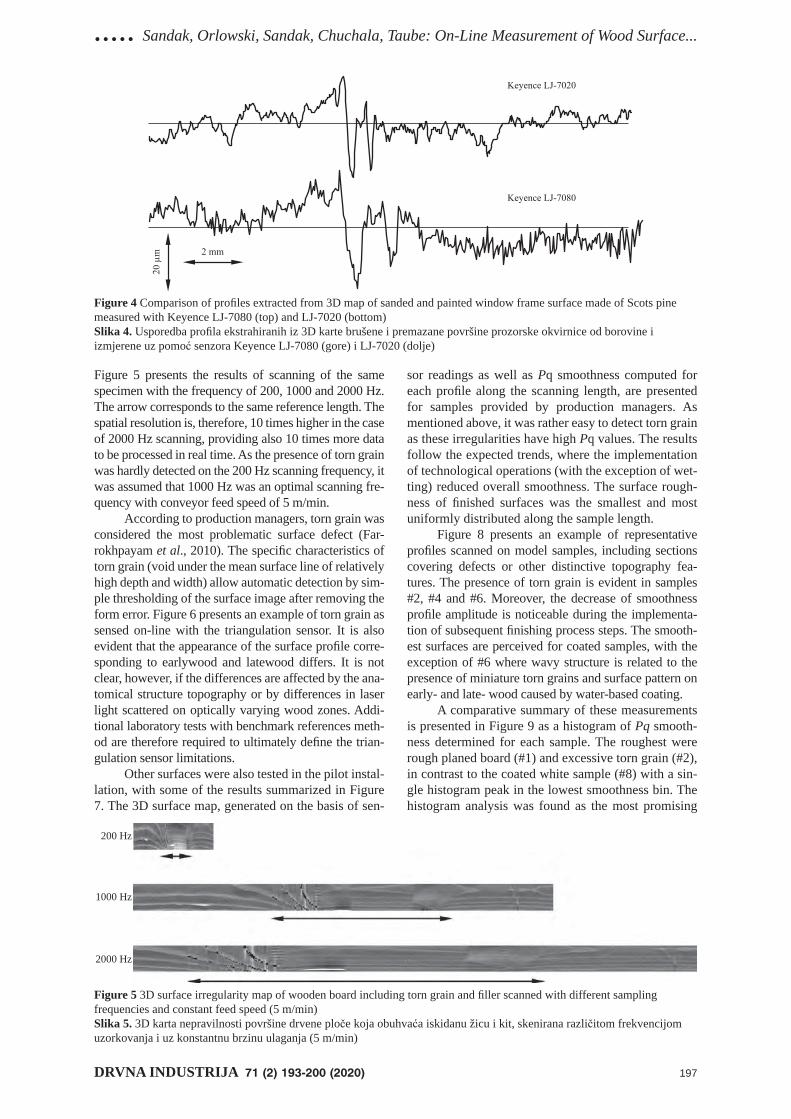
..... Sandak, Orlowski, Sandak, Chuchala, Taube: On-Line Measurement of Wood Surface...
DRVNA INDUSTRIJA 71 (2) 193-200 (2020) 197
Figure 5 presents the results of scanning of the same specimen with the frequency of 200, 1000 and 2000 Hz. The arrow corresponds to the same reference length. The spatial resolution is, therefore, 10 times higher in the case of 2000 Hz scanning, providing also 10 times more data to be processed in real time. As the presence of torn grain was hardly detected on the 200 Hz scanning frequency, it was assumed that 1000 Hz was an optimal scanning fre-quency with conveyor feed speed of 5 m/min.
According to production managers, torn grain was considered the most problematic surface defect (Far-rokhpayam et al., 2010). The specifi c characteristics of torn grain (void under the mean surface line of relatively high depth and width) allow automatic detection by sim-ple thresholding of the surface image af ter removing the form error. Figure 6 presents an example of torn grain as sensed on-line with the triangulation sensor. It is also evident that the appearance of the surface profi le corre-sponding to earlywood and latewood differs. It is not clear, however, if the differences are affected by the ana-tomical structure topography or by differences in laser light scattered on optically varying wood zones. Addi-tional laboratory tests with benchmark references meth-od are therefore required to ultimately defi ne the trian-gulation sensor limitations.
Other surfaces were also tested in the pilot instal-lation, with some of the results summarized in Figure 7. The 3D surface map, generated on the basis of sen-
sor readings as well as Pq smoothness computed for each profi le along the scanning length, are presented for samples provided by production managers. As mentioned above, it was rather easy to detect torn grain as these irregularities have high Pq values. The results follow the expected trends, where the implementation of technological operations (with the exception of wet-ting) reduced overall smoothness. The surface rough-ness of fi nished surfaces was the smallest and most uniformly distributed along the sample length.
Figure 8 presents an example of representative profi les scanned on model samples, including sections covering defects or other distinctive topography fea-tures. The presence of torn grain is evident in samples #2, #4 and #6. Moreover, the decrease of smoothness profi le amplitude is noticeable during the implementa-tion of subsequent fi nishing process steps. The smooth-est surfaces are perceived for coated samples, with the exception of #6 where wavy structure is related to the presence of miniature torn grains and surface pattern on early- and late- wood caused by water-based coating.
A comparative summary of these measurements is presented in Figure 9 as a histogram of Pq smooth-ness determined for each sample. The roughest were rough planed board (#1) and excessive torn grain (#2), in contrast to the coated white sample (#8) with a sin-gle histogram peak in the lowest smoothness bin. The histogram analysis was found as the most promising
Figure 4 Comparison of profi les extracted from 3D map of sanded and painted window frame surface made of Scots pine measured with Keyence LJ-7080 (top) and LJ-7020 (bottom)Slika 4. Usporedba profi la ekstrahiranih iz 3D karte brušene i premazane površine prozorske okvirnice od borovine i izmjerene uz pomoć senzora Keyence LJ-7080 (gore) i LJ-7020 (dolje)
Figure 5 3D surface irregularity map of wooden board including torn grain and fi ller scanned with different sampling frequencies and constant feed speed (5 m/min)Slika 5. 3D karta nepravilnosti površine drvene ploče koja obuhvaća iskidanu žicu i kit, skenirana različitom frekvencijom uzorkovanja i uz konstantnu brzinu ulaganja (5 m/min)
200 Hz
1000 Hz
2000 Hz
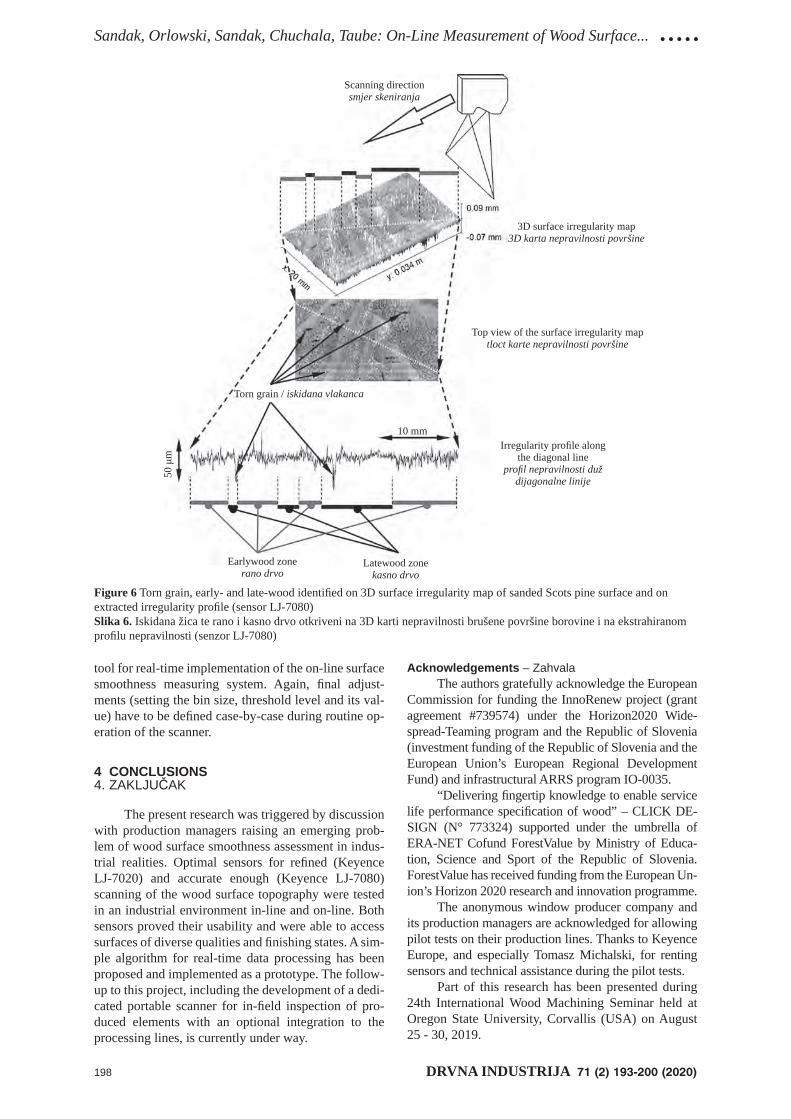
Sandak, Orlowski, Sandak, Chuchala, Taube: On-Line Measurement of Wood Surface... .....
198 DRVNA INDUSTRIJA 71 (2) 193-200 (2020)
tool for real-time implementation of the on-line surface smoothness measuring system. Again, fi nal adjust-ments (setting the bin size, threshold level and its val-ue) have to be defi ned case-by-case during routine op-eration of the scanner.
4 CONCLUSIONS4. ZAKLJUČAK
The present research was triggered by discussion with production managers raising an emerging prob-lem of wood surface smoothness assessment in indus-trial realities. Optimal sensors for refi ned (Keyence LJ-7020) and accurate enough (Keyence LJ-7080) scanning of the wood surface topography were tested in an industrial environment in-line and on-line. Both sensors proved their usability and were able to access surfaces of diverse qualities and fi nishing states. A sim-ple algorithm for real-time data processing has been proposed and implemented as a prototype. The follow-up to this project, including the development of a dedi-cated portable scanner for in-fi eld inspection of pro-duced elements with an optional integration to the processing lines, is currently under way.
Acknowledgements – ZahvalaThe authors gratefully acknowledge the European
Commission for funding the InnoRenew project (grant agreement #739574) under the Horizon2020 Wide-spread-Teaming program and the Republic of Slovenia (investment funding of the Republic of Slovenia and the European Union’s European Regional Development Fund) and infrastructural ARRS program IO-0035.
“Delivering fi ngertip knowledge to enable service life performance specifi cation of wood” – CLICK DE-SIGN (N° 773324) supported under the umbrella of ERA-NET Cofund ForestValue by Ministry of Educa-tion, Science and Sport of the Republic of Slovenia. ForestValue has received funding from the European Un-ion’s Horizon 2020 research and innovation programme.
The anonymous window producer company and its production managers are acknowledged for allowing pilot tests on their production lines. Thanks to Keyence Europe, and especially Tomasz Michalski, for renting sensors and technical assistance during the pilot tests.
Part of this research has been presented during 24th International Wood Machining Seminar held at Oregon State University, Corvallis (USA) on August 25 - 30, 2019.
Figure 6 Torn grain, early- and late-wood identifi ed on 3D surface irregularity map of sanded Scots pine surface and on extracted irregularity profi le (sensor LJ-7080)Slika 6. Iskidana žica te rano i kasno drvo otkriveni na 3D karti nepravilnosti brušene površine borovine i na ekstrahiranom profi lu nepravilnosti (senzor LJ-7080)
Scanning directionsmjer skeniranja
3D surface irregularity map3D karta nepravilnosti površine
Top view of the surface irregularity maptloct karte nepravilnosti površine
Irregularity profi le along the diagonal line
profi l nepravilnosti duž dijagonalne linije
Earlywood zonerano drvo
Latewood zonekasno drvo
Torn grain / iskidana vlakanca
50 μ
m
10 mm
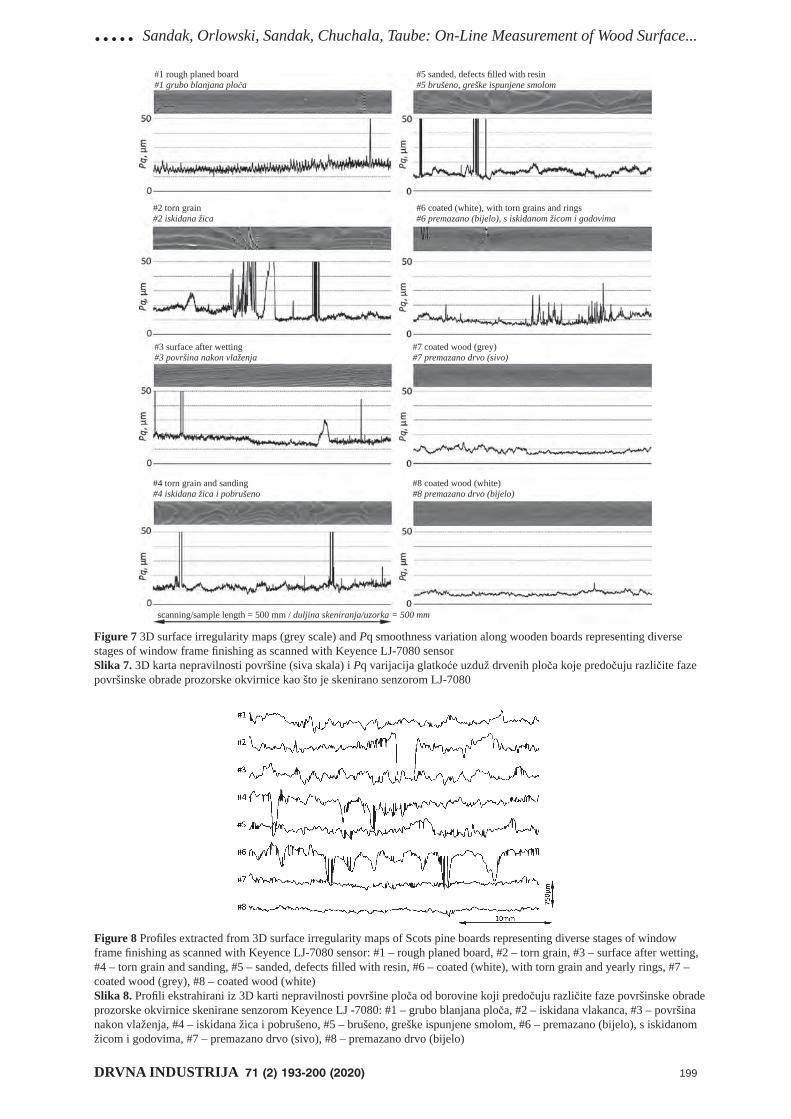
..... Sandak, Orlowski, Sandak, Chuchala, Taube: On-Line Measurement of Wood Surface...
DRVNA INDUSTRIJA 71 (2) 193-200 (2020) 199
scanning/sample length = 500 mm / duljina skeniranja/uzorka = 500 mm
#1 rough planed board#1 grubo blanjana ploča
#5 sanded, defects fi lled with resin#5 brušeno, greške ispunjene smolom
#2 torn grain#2 iskidana žica
#6 coated (white), with torn grains and rings#6 premazano (bijelo), s iskidanom žicom i godovima
#3 surface after wetting#3 površina nakon vlaženja
#7 coated wood (grey)#7 premazano drvo (sivo)
#4 torn grain and sanding#4 iskidana žica i pobrušeno
#8 coated wood (white)#8 premazano drvo (bijelo)
Figure 7 3D surface irregularity maps (grey scale) and Pq smoothness variation along wooden boards representing diverse stages of window frame fi nishing as scanned with Keyence LJ-7080 sensorSlika 7. 3D karta nepravilnosti površine (siva skala) i Pq varijacija glatkoće uzduž drvenih ploča koje predočuju različite faze površinske obrade prozorske okvirnice kao što je skenirano senzorom LJ-7080
Figure 8 Profi les extracted from 3D surface irregularity maps of Scots pine boards representing diverse stages of window frame fi nishing as scanned with Keyence LJ-7080 sensor: #1 – rough planed board, #2 – torn grain, #3 – surface after wetting, #4 – torn grain and sanding, #5 – sanded, defects fi lled with resin, #6 – coated (white), with torn grain and yearly rings, #7 – coated wood (grey), #8 – coated wood (white)Slika 8. Profi li ekstrahirani iz 3D karti nepravilnosti površine ploča od borovine koji predočuju različite faze površinske obrade prozorske okvirnice skenirane senzorom Keyence LJ -7080: #1 – grubo blanjana ploča, #2 – iskidana vlakanca, #3 – površina nakon vlaženja, #4 – iskidana žica i pobrušeno, #5 – brušeno, greške ispunjene smolom, #6 – premazano (bijelo), s iskidanom žicom i godovima, #7 – premazano drvo (sivo), #8 – premazano drvo (bijelo)
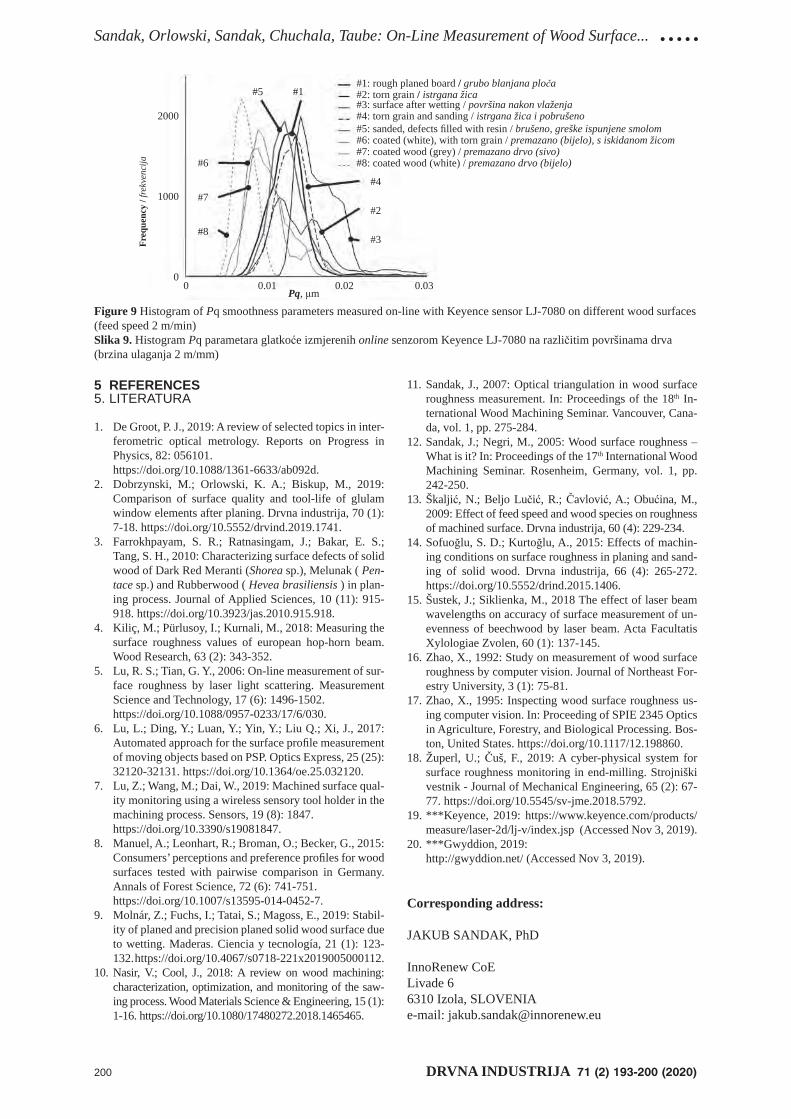
Sandak, Orlowski, Sandak, Chuchala, Taube: On-Line Measurement of Wood Surface... .....
200 DRVNA INDUSTRIJA 71 (2) 193-200 (2020)
5 REFERENCES5. LITERATURA
1. De Groot, P. J., 2019: A review of selected topics in inter-ferometric optical metrology. Reports on Progress in Physics, 82: 056101.
https://doi.org/10.1088/1361-6633/ab092d.2. Dobrzynski, M.; Orlowski, K. A.; Biskup, M., 2019:
Comparison of surface quality and tool-life of glulam window elements after planing. Drvna industrija, 70 (1): 7-18. https://doi.org/10.5552/drvind.2019.1741.
3. Farrokhpayam, S. R.; Ratnasingam, J.; Bakar, E. S.; Tang, S. H., 2010: Characterizing surface defects of solid wood of Dark Red Meranti (Shorea sp.), Melunak ( Pen-tace sp.) and Rubberwood ( Hevea brasiliensis ) in plan-ing process. Journal of Applied Sciences, 10 (11): 915-918. https://doi.org/10.3923/jas.2010.915.918.
4. Kiliç, M.; Pürlusoy, I.; Kurnali, M., 2018: Measuring the surface roughness values of european hop-horn beam. Wood Research, 63 (2): 343-352.
5. Lu, R. S.; Tian, G. Y., 2006: On-line measurement of sur-face roughness by laser light scattering. Measurement Science and Technology, 17 (6): 1496-1502.
https://doi.org/10.1088/0957-0233/17/6/030.6. Lu, L.; Ding, Y.; Luan, Y.; Yin, Y.; Liu Q.; Xi, J., 2017:
Automated approach for the surface profi le measurement of moving objects based on PSP. Optics Express, 25 (25): 32120-32131. https://doi.org/10.1364/oe.25.032120.
7. Lu, Z.; Wang, M.; Dai, W., 2019: Machined surface qual-ity monitoring using a wireless sensory tool holder in the machining process. Sensors, 19 (8): 1847.
https://doi.org/10.3390/s19081847.8. Manuel, A.; Leonhart, R.; Broman, O.; Becker, G., 2015:
Consumers’ perceptions and preference profi les for wood surfaces tested with pairwise comparison in Germany. Annals of Forest Science, 72 (6): 741-751.
https://doi.org/10.1007/s13595-014-0452-7.9. Molnár, Z.; Fuchs, I.; Tatai, S.; Magoss, E., 2019: Stabil-
ity of planed and precision planed solid wood surface due to wetting. Maderas. Ciencia y tecnología, 21 (1): 123-132. https://doi.org/10.4067/s0718-221x2019005000112.
10. Nasir, V.; Cool, J., 2018: A review on wood machining: characterization, optimization, and monitoring of the saw-ing process. Wood Materials Science & Engineering, 15 (1): 1-16. https://doi.org/10.1080/17480272.2018.1465465.
11. Sandak, J., 2007: Optical triangulation in wood surface roughness measurement. In: Proceedings of the 18th In-ternational Wood Machining Seminar. Vancouver, Cana-da, vol. 1, pp. 275-284.
12. Sandak, J.; Negri, M., 2005: Wood surface roughness – What is it? In: Proceedings of the 17th International Wood Machining Seminar. Rosenheim, Germany, vol. 1, pp. 242-250.
13. Š kaljić, N.; Beljo Lučić, R.; Čavlović, A.; Obućina, M., 2009: Effect of feed speed and wood species on roughness of machined surface. Drvna industrija, 60 (4): 229-234.
14. Sofuoğlu, S. D.; Kurtoğlu, A., 2015: Effects of machin-ing conditions on surface roughness in planing and sand-ing of solid wood. Drvna industrija, 66 (4): 265-272. https://doi.org/10.5552/drind.2015.1406.
15. Šustek, J.; Siklienka, M., 2018 The effect of laser beam wavelengths on accuracy of surface measurement of un-evenness of beechwood by laser beam. Acta Facultatis Xylologiae Zvolen, 60 (1): 137-145.
16. Zhao, X., 1992: Study on measurement of wood surface roughness by computer vision. Journal of Northeast For-estry University, 3 (1): 75-81.
17. Zhao, X., 1995: Inspecting wood surface roughness us-ing computer vision. In: Proceeding of SPIE 2345 Optics in Agriculture, Forestry, and Biological Processing. Bos-ton, United States. https://doi.org/10.1117/12.198860.
18. Župerl, U.; Čuš, F., 2019: A cyber-physical system for surface roughness monitoring in end-milling. Strojniški vestnik - Journal of Mechanical Engineering, 65 (2): 67-77. https://doi.org/10.5545/sv-jme.2018.5792.
19. ***Keyence, 2019: https://www.keyence.com/products/measure/laser-2d/lj-v/index.jsp (Accessed Nov 3, 2019).
20. ***Gwyddion, 2019: http://gwyddion.net/ (Accessed Nov 3, 2019).
Corresponding address:
JAKUB SANDAK, PhD
InnoRenew CoELivade 66310 Izola, SLOVENIAe-mail: [email protected]
Figure 9 Histogram of Pq smoothness parameters measured on-line with Keyence sensor LJ-7080 on different wood surfaces (feed speed 2 m/min)Slika 9. Histogram Pq parametara glatkoće izmjerenih online senzorom Keyence LJ-7080 na različitim površinama drva (brzina ulaganja 2 m/mm)
#1: rough planed board / grubo blanjana ploča #2: torn grain / istrgana žica#3: surface after wetting / površina nakon vlaženja#4: torn grain and sanding / istrgana žica i pobrušeno#5: sanded, defects fi lled with resin / brušeno, greške ispunjene smolom#6: coated (white), with torn grain / premazano (bijelo), s iskidanom žicom#7: coated wood (grey) / premazano drvo (sivo)#8: coated wood (white) / premazano drvo (bijelo)
Freq
uenc
y / f
rekv
enci
ja
2000
1000
0
#5 #1
#6
#7
#8
#4
#2
#3
0 0.01 0.02 0.03Pq, μm
...Pavlič, Petrič: Comparison of Visual and Instrumental Assessment of Colour Differences...
DRVNA INDUSTRIJA 71 (2) 201-207 (2020) 201
Matjaž Pavlič, Marko Petrič1
Comparison of Visual and Instrumental Assessment of Colour Differences on Finished Wooden SurfacesUsporedba vizualne procjene i izmjerene promjene boje površinski obrađenog drva
Preliminary paper • Prethodno priopćenje Received – prispjelo: 20. 10. 2019.Accepted – prihvaćeno: 28. 4. 2020.UDK: 630*829 https://doi.org/10.5552/drvind.2020.1954
ABSTRACT • Staining of wood with various substances and processes is an important part of surface fi nishing of wood. Colour differences as a result of staining and of exposure of coloured wood during its utilisation are usually evaluated by instrumental measurements. However, the measurement results can show something else compared to what our naked eye can see. Due to inhomogeneity of wood, this discrepancy can be even greater in the case of fi nished surfaces. The aim of our research was to evaluate distinctions between visual perception and numeri-cally determined colour differences on differently fi nished wooden surfaces, to get information at which starting point the colour difference becomes visible, and to establish whether it is related to the nature of the surface. We established that the visual assessment is infl uenced by many factors and that there is a correlation between visual and instrumental assessments. The colour difference ΔE* of 0.5 should be considered as a value when it starts to become visible, and at the value of 2.0, observers already considered the colour difference as a different colour. It was stated that we have some tolerance in perceiving the colour change. This tolerance is more expressed in the case of transparent coating systems.
Keywords: coating; colour; gloss; instrumental measurement; visual perception
SAŽETAK • Premazivanje drva različitim sredstvima i primjenom različitih postupaka važan su dio površinske obrade drva. Promjene boje kao rezultat premazivanja i izlaganja obojenog drva tijekom njegove uporabe obično se mjere uređajima. Međutim, izmjereni rezultati pokazuju nešto sasvim drugo od onoga što se vidi ljudskim okom. Kad je riječ o površinskoj obradi drva, razlike između izmjerenih rezultata i onoga što se vidi ljudskim okom mogu se povećati zbog nehomogenosti drva. Cilj istraživanja bio je procijeniti razlike između vizualne procjene i izmje-rene promjene boje na površinski obrađenom drvu primjenom različitih tehnika kako bi se utvrdila vrijednost pri kojoj je promjena boje vidljiva te kako bi se utvrdilo ovisi li ona o vrsti površine. Ustanovili smo da na vizualnu procjenu promjene boje utječe velik broj čimbenika i da postoji veza između vizualne procjene i izmjerenih vrijed-nosti promjene boje. Promjena boje ΔE* od 0,5 vrijednost je pri kojoj promjena boje postaje vidljiva, a promjenu boje od 2 promatrači vide kao različitu boju. Uočeno je da postoji određena tolerancija u percepciji promjene boje, koja je veća pri procjeni promjene boje prozirnih sustava premaza.
Ključne riječi: premaz; boja; sjaj; mjerenje promjene boje; vizualna procjena
1 Authors are teaching assistant and full professor at University of Ljubljana, Biotechnical Faculty, Department of Wood Science and Techno-logy, Ljubljana, Slovenia.
© 2020 by the author(s).Licensee Faculty of Forestry, University of Zagreb.
This article is an open access article distributedunder the terms and conditions of the
Creative Commons Attribution (CC BY 4.0) license.
Pavlič, Petrič: Comparison of Visual and Instrumental Assessment of Colour Differences... ...
202 DRVNA INDUSTRIJA 71 (2) 201-207 (2020)
1 INTRODUCTION1. UVOD
Wood as a natural material has many advantages compared to other materials. Among them, visual properties are most often the reason for selecting wood for a desired product. There are huge differences in the appearance of wood between different tree species and even among wood of the same species. The decorative appearance of timbers is due to the texture, or to the fi gure, or to the colour of the material and, in many instances, due to combinations of these (Dinwoodie, 2000). Such variability in wood appearance gives end-less possibilities for its use. However, at the same time and for the same reason, this could also be a disadvan-tage that needs to be overcome. Sometimes it is hard to achieve the same appearance between different sur-faces or different pieces of a wooden product, espe-cially if it is not produced in a small series. Further-more, wood surfaces of furniture or some other product are coated for protection or to give them the fi nal look. The appearance of the fi nished wooden surfaces than depends on the wood used as a substrate, on the materi-als applied on it and on various other parameters, such as, for instance, an application rate.
In spite of the fact that colour variations are quite frequent and expected in the case of wooden furniture or other wooden products, customers do have certain tolerance limits above which the colour differences are no longer tolerated. Colour vision is an illusion created by the interactions of billions of neurons in our brain. There is no colour in the external world; it is created by neural programs and projected onto the outer world we see. It is intimately linked to the perception of form, where colour facilitates detecting the borders of ob-jects (Gouras, 2013). From this, we can conclude that colour vision and perception of colour differences are unique to every individual. This suggests that colour evaluation can only be objective by the use of equip-ment that numerically measures the colour according to a certain colour space system. The most commonly used system for measuring the colour, including the one of wood, is CIELAB colour space (Golob and Golob, 2000). There are many studies on using this co-lour system for the evaluation of colour stability of coated or non-coated wood due to natural or artifi cial weathering (Vardanyan et al., 2015), and even more, for the determination of wood colour changes after various treatments (modifi cation or drying) (Nemeth et al., 2013; Sikora et al., 2018) or due to fungal attack (Reinprecht and Hulla, 2015).
However, up to our best knowledge, there are only few reports on the relation between visual and in-strumental assessment of the colour of wood, as de-scribed in the next paragraph (Liu and Furuno, 2002; Buchelt and Wagenführ, 2012; Defoirdt et al., 2012; Hauptman et al., 2012; Bianconi et al., 2013), and there are some more reports about this topic with applications on other materials. For instance, the correlation of per-ceived colour difference and the measured and mathe-matically calculated difference with the focus on print-
ing industry was elaborated by Mokrzycki and Tatol (2011). The correlation of the instrumental colour dif-ferences with visual assessment is extremely important in automotive coatings (Kirchner and Ravi, 2014; Gó-mez et al., 2016), in dental medicine (Pecho et al., 2016; Pecho et al., 2016a), in food industry (Pagliarini and Rastelli, 1994; O’Sullivan et al., 2003), in textile industry (Bae et al., 2015), in the production of colour tints (Khimchenko and Eksperiandova, 2014), etc.
There have been only few investigations in the fi eld of wood science and technology dealing with the relation of visual and instrumental assessment of co-lour. Liu and Furuno (2002) characterised colour varia-tions of the surfaces of fi fteen wood species by fractal dimension of the triangular prism surface area method. They came to the conclusion that, for colour matching of wood parts, fractal dimension quantitatively fur-nishes essential information of colour variation in local and overall features. Buchelt and Wagenführ (2012) measured the natural colour of six precious woods. They established that, within one wood species with equal surfaces, there are colour differences (ΔE*) with a magnitude of 1 to 2 and concluded that the grading of ΔE* as a difference that is barely perceptible should be higher than 2. They came to this conclusion by the comparison of established colour differences within one species and colour difference values obtained by visual evaluation performed by Bieske (acc. to Buchelt and Wagenfür (2012)). Defoirdt et al. (2012) assessed the colour of oak wood for the production of parquet. They compared visual assessment and spectrophotom-eter measurements and established that their colour grading methodology is in good correlation with visual assessment and therefore can be adapted to particular automated grading purposes. Bianconi et al. (2013) also analysed coloured-based sorting through different colour descriptors of hardwood parquet slabs into lots of similar visual appearance, but they did not do any comparison to visual assessment. Hauptman and co-authors (2012) correlated the visual perception of the oak wood colour of 20 observers with two different colour difference equations, CIELAB from DIN 6174:200712 and CIEDE2000 (CIE, 2001) equation. They established that CIELAB equation showed gen-erally an overestimation of the colour change (ΔE*).
Taking into account relatively low number of in-vestigations of the relationship between visual percep-tion of colour and colour difference and instrumental assessment of colour in the case of wood, the aim of our research was to additionally elucidate this ques-tion. The aim was also to get information at which starting point the colour difference in terms of the CIELAB ΔE* value becomes visible and to establish whether this is somehow related to the nature of the fi nished wooden surface. The colour is a psychophysi-cal quantity, acting as an impression during the stimu-lation of our visual system (Mokrzycki and Tatol, 2011). The dependence on many external factors and individual human characteristics has a signifi cant infl u-ence on the perception and comparison of colour expe-riences (Mokrzycki and Tatol, 2011). We are aware that
...Pavlič, Petrič: Comparison of Visual and Instrumental Assessment of Colour Differences...
DRVNA INDUSTRIJA 71 (2) 201-207 (2020) 203
the perception of colour differences is infl uenced by many factors and that the effect of each individual fac-tor could be quantifi ed, but such a study would be by far above our intentions to just additionally elucidate this issue in the fi eld of wood surface fi nishing. Further on, it is also accepted that the effect of texture on co-lour appearance is important (Kirchner and Ravi, 2014; Bae et al., 2015), but again, it was decided that using the texture model would exceed the purpose of this in-vestigation.
2 MATERIALS AND METHODS2. MATERIJALI I METODE
For the assessment of colour differences, we used 12 pairs of differently fi nished wooden surfaces. The pairs of surfaces differed by the type of substrate (type of wood or composite), the intention of the use of sur-face (interior / exterior), the coating system properties (colour, hiding power, build, gloss) and the texture of the surface. The pairs of samples, intended for the inte-rior, were prepared in a way that one sample was cut to two smaller, equally large specimens. The pairs of samples for the exterior were not prepared by cutting one specimen into two pieces, as in the case of the sam-ples for the interior. Instead, in the pairs of samples for the exterior, there were two pieces of the same sub-strate, each treated with a surface fi nish of a different manufacturer, but of a very similar colour and gloss.
One sample of each comparative pair was stored in a dark space in which there were constant climatic conditions with the temperature of (23 ± 2) °C and relative air humidity of (50 ± 5) %, while the second sample was irradiated with UV light (Osram ULTRA VITALUX 300 W) to increase the colour differences between samples in a single pair, for 1, 6 and 8 days or until most of the observers detected more than the ob-vious colour differences between the comparable sam-ples in the pair. This was considered as a different col-our. However, the purpose of UV irradiation was not to study its effects on colour or colour change. It was used just as a tool for changing the colour difference be-tween comparative pairs of samples. The colour was measured and colour differences were calculated be-fore each visual assessment. The values were not known to the observers.
2.1 Gloss measurements2.1. Mjerenje sjaja
To additionally describe the observed surface systems and to see any possible effects of gloss on vis-ual perception of the colour, we measured specular gloss (X-Rite AcuGloss TRI) by the method described in EN ISO 2813 (2015), and did a classifi cation based on specular refl ectance values when tested at 60° by the following categories according to EN 927-1 (2013):a) matt: refl ectance up to 10,b) satin: refl ectance greater than 10 and up to 35,c) semi gloss: refl ectance greater than 35 and up to 60,d) gloss: refl ectance greater than 60 and up to 80,e) high gloss: refl ectance greater than 80.
2.2 Colour measurements2.2. Mjerenje boje
The surface colour difference of samples in a pair was evaluated based on the CIELAB colour coordi-nates (EN ISO 11664-4:2011). A colour measuring in-strument (spectrophotometer X-Rite SP 62) was used to record the colour index with diffuse/8° sphere opti-cal geometry, fi xed 14 mm aperture, specular compo-nent included, illuminant D65 and a 10° standard ob-server. The colour parameters of each surface were measured at ten positions and the mean value was re-corded. The total colour difference (ΔE*) was used to assess the colour difference between the samples in the pair and was calculated as follows:
ΔL* = ΔL*1 – ΔL*0 (1)
Δa* = Δa*1 – Δa*0 (2)
Δb* = Δb*1 – Δb*0 (3)
ΔE* = (ΔL*2 + Δa*2 + Δb*2)1/2 (4)
where ΔE* represents the total colour difference, L* is the lightness and darkness of colour, a* is the redness and greenness of colour, b* is the yellowness and blue-ness of colour, and ΔL*, Δa*, and Δb* are the differ-ences of the compared (1) and reference sample kept in the dark (0) of L*, a*, and b*, respectively.
2.3 Visual assessment of colour differences2.3. Vizualna procjena promjene boje
Visual assessment of colour differences was done by comparison of 12 pairs under the same light (indoor light, combination of daylight at sunny conditions at 13.00 and laboratory Philips fl uorescent light bulbs TL-D 36 W with cool white colour designation and temperature of 4100 K) and background conditions, made by 24 students of Wood Science (University of Ljubljana, Biotechnical Faculty), all male and from 22 to 23 years. The perceived colour differences were not statistically evaluated, like for instance by Bae and co-authors (2015). This was decided because of the rela-tively low number of observers and especially because the structure of the group of observers did not refl ect the structure of general population in terms of age and gender. For each assessment, the observers were asked to mark on the survey sheet if they see the colour dif-ference between the comparative samples or not (None). Furthermore, if their answer was yes, than they were asked to state if in their opinion this colour change could still be inside tolerance limits (Acceptable) or not (Not acceptable), or if they considered the assessed colour difference more than obvious so that the com-parative samples could not in any case be considered as the samples of the same colour (Different colour).
3 RESULTS AND DISCUSSION3. REZULTATI I RASPRAVA
All results of visual and instrumental assess-ments of colour differences on 12 pairs of different fi n-
Pavlič, Petrič: Comparison of Visual and Instrumental Assessment of Colour Differences... ...
204 DRVNA INDUSTRIJA 71 (2) 201-207 (2020)
ished wooden surfaces are presented in Table 1. Instru-mentally determined differences between paired samples are presented as total colour difference values ΔE* and differences of each individual colour coordi-nate (ΔL*, Δa* and Δb*). Visual assessment of colour differences is presented with the level of acceptance for each grade separately. The grade with the highest percent of selection from 24 evaluators among all grades is marked with a grey cell.
In the case of the fi rst pair (1), we can see that despite a rather high colour difference measured at the end of the comparison (ΔE* = 0.83), the majority of the observers (81.8 %) did not see the difference between these two compared samples. However, it is interesting that in case of the similar pair 2 (same fi nish but differ-ent substrate), the observers saw the difference already at quite low measured colour difference (ΔE* = 0.54). The samples of the fi rst pair (pair 1) were fi nished with “open pores” due to large vessels of mahogany wood, while the surfaces of the fi nished samples with spruce wood as a substrate (pair 2) were smooth. From this, we can conclude that surface roughness can blur our ability to detect colour differences. Of course, we must also have in mind that different colour of the substrate underneath the semi-transparent coating fi lm somehow also contributes to different colour of the whole surface system and induces a colour change. It is also interest-ing that the observers, in the case of another similar pair, pair 3 (same substrate, but different, opaque stain), saw the colour difference (80.9 %), evaluated as not acceptable, already at the measured value of ΔE* = 0.56. It seems that visibility of the substrate somehow softens our criteria for visual assessment. The toler-ance of the observer’s vision for the colour difference was even higher in the case of systems without the coating fi lm. The colour difference between black wal-nut wood samples treated with linseed oil (pair 11) was considered as high (different colour) at a measured ΔE* value of 7.98 and in the case of untreated spruce samples (pair 12, ) at the measured ΔE* value of 12.60. If the substrate is coated with a transparent coating sys-tem, then the situation is reversed (pairs 5, 6 and 7). In the case of pair 5, the observers saw the colour differ-ence that was not acceptable at the measured ΔE* val-ue of 1.17, while in the systems also with transparent coatings but stained substrate such perception occurred at much higher values (pair 6 – ΔE* = 2.95; pair 7 – ΔE* = 3.16). Pair 9 was the only high gloss opaque surface system. The observers mostly did not see the colour difference even in the case of the highest mea-sured ΔE* value of 0.41. However, these results show a trend which indicates that this perception could easily happen at ΔE* value around 0.5, which for example is the maximum value of the colour difference according to IKEA specifi cation (Tokarski and Nussbaum, 2014). Regarding the pair of samples with the satin decorative foil (pair 10), even in the case of the highest measured ΔE* values of 2.28 or 2.80, the observers considered them as the samples with a similar colour with accept-able colour difference (with 63.6 % and 54.5 % of agreement). This pair was the only pair with a decora-
tive foil and, maybe in the case of foils, the observers are subconsciously more tolerant since they consider such surfaces as low cost ones.
The results showed (Table 1) that the observers were very susceptible to detecting the colour differ-ences. The minimum value of the measured colour dif-ference at which most observers detected the colour difference was quite low (ΔE* = 0.45; pair 8), but it is interesting that the value at which the observers con-sidered the colour difference as no longer acceptable was quite close to this one (ΔE* = 0.58; pair 3). The minimum value of the measured colour difference at which the observers considered the samples to have a different colour was 2.03 (pair 4). All these values (ac-ceptable and not acceptable colour differences) are quite lower than the ones reported by Buchelt and Wa-genfür (2012), who established that the grading ΔE* = 2 is barely perceptible for visual perception of colour of precious woods (non-treated ones). However, they are closer to the values of evaluation of colour differ-ences (ΔE*) obtained by Bieske (cited in Buchelt and Wagenfür, 2012):- up to 0.5: no to nearly no colour difference- 0.5 – 1.0: difference can be perceptible for the prac-
ticed eye- 1.0 – 2.0: observable colour difference that is barely
seen- 2.0 – 4.0: perceived colour difference that is certainly
seen- 4.0 – 5.0: signifi cant colour difference that is seldom
accepted- above 5.0: the difference is evaluated as another co-
lourBieske has worked out a valuation of the percep-
tion of light and body colours, where differences of light and body colours were evaluated by a number of subjects of different age groups.
Gómez et al. (2016) also examined the correla-tion between visual and instrumental assessment of co-lour differences in automotive coatings determined by the colour difference formula AUDI2000 (specifi c for this sector) (Pecho et al., 2016). They revealed that an acceptable correlation exists. Hauptman and co-au-thors (2012) and Pecho and co-authors (2016a) used CIELAB and CIEDE2000 colour difference formulas for colour and colour differences. They both concluded that CIELAB is not the best metrics to calculate colour differences and that CIEDE2000 equation is generally better in predicting colour differences. In our investi-gation, we did not use the CIEDE2000 (EN ISO 11664-6, 2016) or AUDI2000 formula (Gómez et al., 2016), but nevertheless we also found a good correlation be-tween CIELAB colour difference formula and visual perception. Generally, if the measured colour differ-ence (ΔE*) increased or decreased, the ability of visual perception of colour difference changed in the same way. The only signifi cant exception was in case of pair 1, where the measured colour difference (ΔE*) in-creased due to UV irradiation but the observers saw less colour difference between these two paired sam-ples. We cannot explain why this happened. Even if we
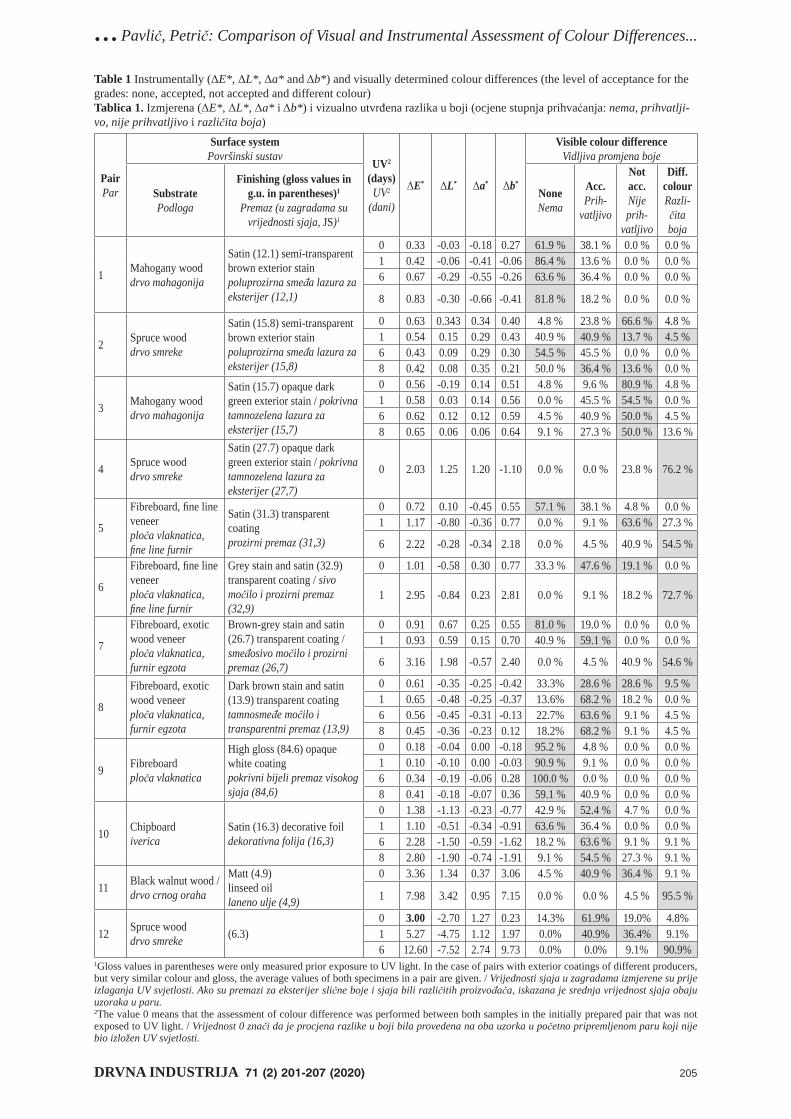
...Pavlič, Petrič: Comparison of Visual and Instrumental Assessment of Colour Differences...
DRVNA INDUSTRIJA 71 (2) 201-207 (2020) 205
Table 1 Instrumentally (ΔE*, ΔL*, Δa* and Δb*) and visually determined colour differences (the level of acceptance for the grades: none, accepted, not accepted and different colour)Tablica 1. Izmjerena (ΔE*, ΔL*, Δa* i Δb*) i vizualno utvrđena razlika u boji (ocjene stupnja prihvaćanja: nema, prihvatlji-vo, nije prihvatljivo i različita boja)
PairPar
Surface systemPovršinski sustav UV2
(days)UV2
(dani)
ΔE* ΔL* Δa* Δb*
Visible colour differenceVidljiva promjena boje
SubstratePodloga
Finishing (gloss values in g.u. in parentheses)1
Premaz (u zagradama su vrijednosti sjaja, JS)1
NoneNema
Acc.Prih-
vatljivo
Not acc.Nijeprih-
vatljivo
Diff. colourRazli-čita boja
1 Mahogany wooddrvo mahagonija
Satin (12.1) semi-transparent brown exterior stain poluprozirna smeđa lazura za eksterijer (12,1)
0 0.33 -0.03 -0.18 0.27 61.9 % 38.1 % 0.0 % 0.0 %1 0.42 -0.06 -0.41 -0.06 86.4 % 13.6 % 0.0 % 0.0 %6 0.67 -0.29 -0.55 -0.26 63.6 % 36.4 % 0.0 % 0.0 %
8 0.83 -0.30 -0.66 -0.41 81.8 % 18.2 % 0.0 % 0.0 %
2 Spruce wooddrvo smreke
Satin (15.8) semi-transparent brown exterior stainpoluprozirna smeđa lazura za eksterijer (15,8)
0 0.63 0.343 0.34 0.40 4.8 % 23.8 % 66.6 % 4.8 %1 0.54 0.15 0.29 0.43 40.9 % 40.9 % 13.7 % 4.5 %6 0.43 0.09 0.29 0.30 54.5 % 45.5 % 0.0 % 0.0 %8 0.42 0.08 0.35 0.21 50.0 % 36.4 % 13.6 % 0.0 %
3 Mahogany wooddrvo mahagonija
Satin (15.7) opaque dark green exterior stain / pokrivna tamnozelena lazura za eksterijer (15,7)
0 0.56 -0.19 0.14 0.51 4.8 % 9.6 % 80.9 % 4.8 %1 0.58 0.03 0.14 0.56 0.0 % 45.5 % 54.5 % 0.0 %6 0.62 0.12 0.12 0.59 4.5 % 40.9 % 50.0 % 4.5 %8 0.65 0.06 0.06 0.64 9.1 % 27.3 % 50.0 % 13.6 %
4 Spruce wooddrvo smreke
Satin (27.7) opaque dark green exterior stain / pokrivna tamnozelena lazura za eksterijer (27,7)
0 2.03 1.25 1.20 -1.10 0.0 % 0.0 % 23.8 % 76.2 %
5
Fibreboard, fi ne line veneerploča vlaknatica, fi ne line furnir
Satin (31.3) transparent coatingprozirni premaz (31,3)
0 0.72 0.10 -0.45 0.55 57.1 % 38.1 % 4.8 % 0.0 %1 1.17 -0.80 -0.36 0.77 0.0 % 9.1 % 63.6 % 27.3 %
6 2.22 -0.28 -0.34 2.18 0.0 % 4.5 % 40.9 % 54.5 %
6
Fibreboard, fi ne line veneerploča vlaknatica, fi ne line furnir
Grey stain and satin (32.9) transparent coating / sivo močilo i prozirni premaz (32,9)
0 1.01 -0.58 0.30 0.77 33.3 % 47.6 % 19.1 % 0.0 %
1 2.95 -0.84 0.23 2.81 0.0 % 9.1 % 18.2 % 72.7 %
7
Fibreboard, exotic wood veneerploča vlaknatica, furnir egzota
Brown-grey stain and satin (26.7) transparent coating / smeđosivo močilo i prozirni premaz (26,7)
0 0.91 0.67 0.25 0.55 81.0 % 19.0 % 0.0 % 0.0 %1 0.93 0.59 0.15 0.70 40.9 % 59.1 % 0.0 % 0.0 %
6 3.16 1.98 -0.57 2.40 0.0 % 4.5 % 40.9 % 54.6 %
8
Fibreboard, exotic wood veneerploča vlaknatica, furnir egzota
Dark brown stain and satin (13.9) transparent coatingtamnosmeđe močilo i transparentni premaz (13,9)
0 0.61 -0.35 -0.25 -0.42 33.3% 28.6 % 28.6 % 9.5 %1 0.65 -0.48 -0.25 -0.37 13.6% 68.2 % 18.2 % 0.0 %6 0.56 -0.45 -0.31 -0.13 22.7% 63.6 % 9.1 % 4.5 %8 0.45 -0.36 -0.23 0.12 18.2% 68.2 % 9.1 % 4.5 %
9 Fibreboardploča vlaknatica
High gloss (84.6) opaque white coatingpokrivni bijeli premaz visokog sjaja (84,6)
0 0.18 -0.04 0.00 -0.18 95.2 % 4.8 % 0.0 % 0.0 %1 0.10 -0.10 0.00 -0.03 90.9 % 9.1 % 0.0 % 0.0 %6 0.34 -0.19 -0.06 0.28 100.0 % 0.0 % 0.0 % 0.0 %8 0.41 -0.18 -0.07 0.36 59.1 % 40.9 % 0.0 % 0.0 %
10 Chipboardiverica
Satin (16.3) decorative foildekorativna folija (16,3)
0 1.38 -1.13 -0.23 -0.77 42.9 % 52.4 % 4.7 % 0.0 %1 1.10 -0.51 -0.34 -0.91 63.6 % 36.4 % 0.0 % 0.0 %6 2.28 -1.50 -0.59 -1.62 18.2 % 63.6 % 9.1 % 9.1 %8 2.80 -1.90 -0.74 -1.91 9.1 % 54.5 % 27.3 % 9.1 %
11 Black walnut wood / drvo crnog oraha
Matt (4.9) linseed oillaneno ulje (4,9)
0 3.36 1.34 0.37 3.06 4.5 % 40.9 % 36.4 % 9.1 %
1 7.98 3.42 0.95 7.15 0.0 % 0.0 % 4.5 % 95.5 %
12 Spruce wooddrvo smreke (6.3)
0 3.00 -2.70 1.27 0.23 14.3% 61.9% 19.0% 4.8%1 5.27 -4.75 1.12 1.97 0.0% 40.9% 36.4% 9.1%6 12.60 -7.52 2.74 9.73 0.0% 0.0% 9.1% 90.9%
1Gloss values in parentheses were only measured prior exposure to UV light. In the case of pairs with exterior coatings of different producers, but very similar colour and gloss, the average values of both specimens in a pair are given. / Vrijednosti sjaja u zagradama izmjerene su prije izlaganja UV svjetlosti. Ako su premazi za eksterijer slične boje i sjaja bili različitih proizvođača, iskazana je srednja vrijednost sjaja obaju uzoraka u paru.2The value 0 means that the assessment of colour difference was performed between both samples in the initially prepared pair that was not exposed to UV light. / Vrijednost 0 znači da je procjena razlike u boji bila provedena na oba uzorka u početno pripremljenom paru koji nije bio izložen UV svjetlosti.
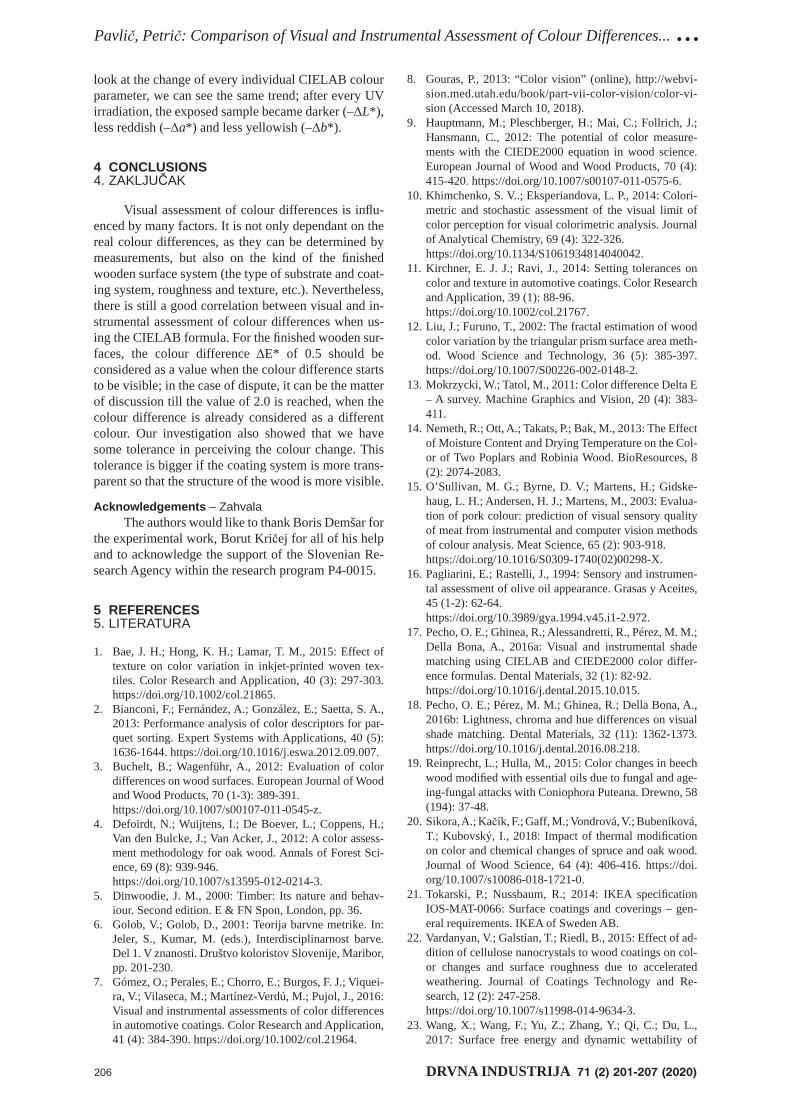
Pavlič, Petrič: Comparison of Visual and Instrumental Assessment of Colour Differences... ...
206 DRVNA INDUSTRIJA 71 (2) 201-207 (2020)
look at the change of every individual CIELAB colour parameter, we can see the same trend; after every UV irradiation, the exposed sample became darker (–ΔL*), less reddish (–Δa*) and less yellowish (–Δb*).
4 CONCLUSIONS4. ZAKLJUČAK
Visual assessment of colour differences is infl u-enced by many factors. It is not only dependant on the real colour differences, as they can be determined by measurements, but also on the kind of the fi nished wooden surface system (the type of substrate and coat-ing system, roughness and texture, etc.). Nevertheless, there is still a good correlation between visual and in-strumental assessment of colour differences when us-ing the CIELAB formula. For the fi nished wooden sur-faces, the colour difference ΔE* of 0.5 should be considered as a value when the colour difference starts to be visible; in the case of dispute, it can be the matter of discussion till the value of 2.0 is reached, when the colour difference is already considered as a different colour. Our investigation also showed that we have some tolerance in perceiving the colour change. This tolerance is bigger if the coating system is more trans-parent so that the structure of the wood is more visible.
Acknowledgements – ZahvalaThe authors would like to thank Boris Demšar for
the experimental work, Borut Kričej for all of his help and to acknowledge the support of the Slovenian Re-search Agency within the research program P4-0015.
5 REFERENCES5. LITERATURA
1. Bae, J. H.; Hong, K. H.; Lamar, T. M., 2015: Effect of texture on color variation in inkjet-printed woven tex-tiles. Color Research and Application, 40 (3): 297-303. https://doi.org/10.1002/col.21865.
2. Bianconi, F.; Fernández, A.; González, E.; Saetta, S. A., 2013: Performance analysis of color descriptors for par-quet sorting. Expert Systems with Applications, 40 (5): 1636-1644. https://doi.org/10.1016/j.eswa.2012.09.007.
3. Buchelt, B.; Wagenführ, A., 2012: Evaluation of color differences on wood surfaces. European Journal of Wood and Wood Products, 70 (1-3): 389-391.
https://doi.org/10.1007/s00107-011-0545-z.4. Defoirdt, N.; Wuijtens, I.; De Boever, L.; Coppens, H.;
Van den Bulcke, J.; Van Acker, J., 2012: A color assess-ment methodology for oak wood. Annals of Forest Sci-ence, 69 (8): 939-946.
https://doi.org/10.1007/s13595-012-0214-3.5. Dinwoodie, J. M., 2000: Timber: Its nature and behav-
iour. Second edition. E & FN Spon, London, pp. 36.6. Golob, V.; Golob, D., 2001: Teorija barvne metrike. In:
Jeler, S., Kumar, M. (eds.), Interdisciplinarnost barve. Del 1. V znanosti. Društvo koloristov Slovenije, Maribor, pp. 201-230.
7. Gómez, O.; Perales, E.; Chorro, E.; Burgos, F. J.; Viquei-ra, V.; Vilaseca, M.; Martínez-Verdú, M.; Pujol, J., 2016: Visual and instrumental assessments of color differences in automotive coatings. Color Research and Application, 41 (4): 384-390. https://doi.org/10.1002/col.21964.
8. Gouras, P., 2013: “Color vision” (online), http://webvi-sion.med.utah.edu/book/part-vii-color-vision/color-vi-sion (Accessed March 10, 2018).
9. Hauptmann, M.; Pleschberger, H.; Mai, C.; Follrich, J.; Hansmann, C., 2012: The potential of color measure-ments with the CIEDE2000 equation in wood science. European Journal of Wood and Wood Products, 70 (4): 415-420. https://doi.org/10.1007/s00107-011-0575-6.
10. Khimchenko, S. V..; Eksperiandova, L. P., 2014: Colori-metric and stochastic assessment of the visual limit of color perception for visual colorimetric analysis. Journal of Analytical Chemistry, 69 (4): 322-326.
https://doi.org/10.1134/S1061934814040042.11. Kirchner, E. J. J.; Ravi, J., 2014: Setting tolerances on
color and texture in automotive coatings. Color Research and Application, 39 (1): 88-96.
https://doi.org/10.1002/col.21767.12. Liu, J.; Furuno, T., 2002: The fractal estimation of wood
color variation by the triangular prism surface area meth-od. Wood Science and Technology, 36 (5): 385-397. https://doi.org/10.1007/S00226-002-0148-2.
13. Mokrzycki, W.; Tatol, M., 2011: Color difference Delta E – A survey. Machine Graphics and Vision, 20 (4): 383-411.
14. Nemeth, R.; Ott, A.; Takats, P.; Bak, M., 2013: The Effect of Moisture Content and Drying Temperature on the Col-or of Two Poplars and Robinia Wood. BioResources, 8 (2): 2074-2083.
15. O’Sullivan, M. G.; Byrne, D. V.; Martens, H.; Gidske-haug, L. H.; Andersen, H. J.; Martens, M., 2003: Evalua-tion of pork colour: prediction of visual sensory quality of meat from instrumental and computer vision methods of colour analysis. Meat Science, 65 (2): 903-918.
https://doi.org/10.1016/S0309-1740(02)00298-X.16. Pagliarini, E.; Rastelli, J., 1994: Sensory and instrumen-
tal assessment of olive oil appearance. Grasas y Aceites, 45 (1-2): 62-64.
https://doi.org/10.3989/gya.1994.v45.i1-2.972.17. Pecho, O. E.; Ghinea, R.; Alessandretti, R., Pérez, M. M.;
Della Bona, A., 2016a: Visual and instrumental shade matching using CIELAB and CIEDE2000 color differ-ence formulas. Dental Materials, 32 (1): 82-92.
https://doi.org/10.1016/j.dental.2015.10.015.18. Pecho, O. E.; Pérez, M. M.; Ghinea, R.; Della Bona, A.,
2016b: Lightness, chroma and hue differences on visual shade matching. Dental Materials, 32 (11): 1362-1373. https://doi.org/10.1016/j.dental.2016.08.218.
19. Reinprecht, L.; Hulla, M., 2015: Color changes in beech wood modifi ed with essential oils due to fungal and age-ing-fungal attacks with Coniophora Puteana. Drewno, 58 (194): 37-48.
20. Sikora, A.; Kačík, F.; Gaff, M.; Vondrová, V.; Bubeníková, T.; Kubovský, I., 2018: Impact of thermal modifi cation on color and chemical changes of spruce and oak wood. Journal of Wood Science, 64 (4): 406-416. https://doi.org/10.1007/s10086-018-1721-0.
21. Tokarski, P.; Nussbaum, R.; 2014: IKEA specifi cation IOS-MAT-0066: Surface coatings and coverings – gen-eral requirements. IKEA of Sweden AB.
22. Vardanyan, V.; Galstian, T.; Riedl, B., 2015: Effect of ad-dition of cellulose nanocrystals to wood coatings on col-or changes and surface roughness due to accelerated weathering. Journal of Coatings Technology and Re-search, 12 (2): 247-258.
https://doi.org/10.1007/s11998-014-9634-3.23. Wang, X.; Wang, F.; Yu, Z.; Zhang, Y.; Qi, C.; Du, L.,
2017: Surface free energy and dynamic wettability of
...Pavlič, Petrič: Comparison of Visual and Instrumental Assessment of Colour Differences...
DRVNA INDUSTRIJA 71 (2) 201-207 (2020) 207
wood simultaneously treated with acidic dye and fl ame retardant. Journal of Wood Science, 63 (3): 271-280. https://doi.org/10.1007/s10086-017-1621-8.
24. ***DIN 6174, 2007: Farbmetrische Bestimmung von Farbmaßzahlen und Farbabständen im angenähert glei-chförmigen CIELAB-Farbenraum. Colorimetric evalua-tion of color coordinates and color differences according to the approximately uniform CIELAB color space (withdrawn).
25. *** CIE, 2001: Technical Report – Improvement to in-dustrial color difference evaluation. CIE Publ. 142. Cen-tral Bureau of the CIE, Vienna.
26. ***EN 927-1, 2013: Paints and varnishes – Coating ma-terials and coating systems for exterior wood. Part 1: Classifi cation and selection.
27. ***EN ISO 11664-4, 2011: Colorimetry. Part 4: CIE 1976 L*a*b* Color space (ISO 11664-4:2008).
28. ***EN ISO 11664-6, 2016: Colorimetry. Part 6: CIE-DE2000 Color-difference formula (ISO/CIE 11664-6:2014).
29. ***EN ISO 2813, 2015: Paints and varnishes – Determi-nation of gloss value at 20 degrees, 60 degrees and 85 degrees (ISO 2813:2014).
Corresponding address:
Prof. MARKO PETRIČ, PhD
University of LjubljanaBiotechnical FacultyDepartment of Wood Science and TechnologyJamnikarjeva 101, 1000 Ljubljana, SLOVENIAe-mail: [email protected]

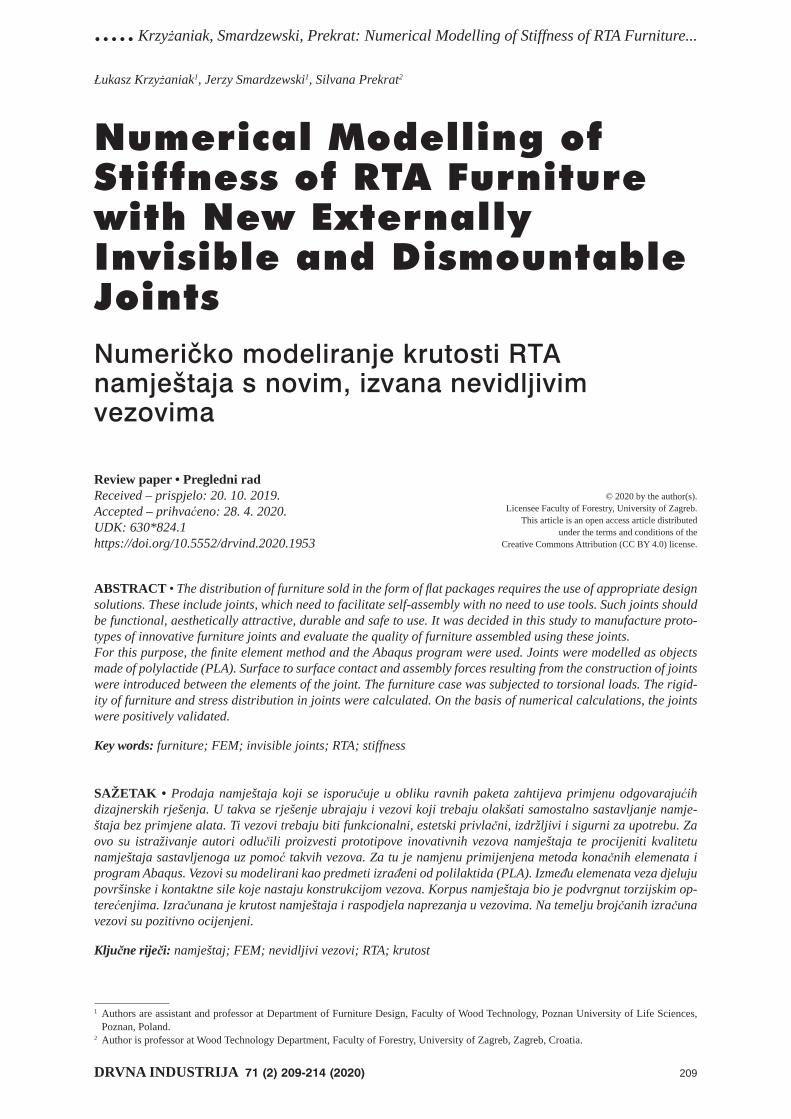
.....Krzyżaniak, Smardzewski, Prekrat: Numerical Modelling of Stiffness of RTA Furniture...
DRVNA INDUSTRIJA 71 (2) 209-214 (2020) 209
Łukasz Krzyżaniak1, Jerzy Smardzewski1, Silvana Prekrat2
Numerical Modelling of Stiffness of RTA Furniture with New Externally Invisible and Dismountable JointsNumeričko modeliranje krutosti RTA namještaja s novim, izvana nevidljivim vezovima
R eview paper • Pregledni radReceived – prispjelo: 20. 10. 2019.Accepted – prihvaćeno: 28. 4. 2020.UDK: 630*824.1https://doi.org/10.5552/drvind.2020.1953
ABSTRACT • The distribution of furniture sold in the form of fl at packages requires the use of appropriate design solutions. These include joints, which need to facilitate self-assembly with no need to use tools. Such joints should be functional, aesthetically attractive, durable and safe to use. It was decided in this study to manufacture proto-types of innovative furniture joints and evaluate the quality of furniture assembled using these joints. For this purpose, the fi nite element method and the Abaqus program were used. Joints were modelled as objects made of polylactide (PLA). Surface to surface contact and assembly forces resulting from the construction of joints were introduced between the elements of the joint. The furniture case was subjected to torsional loads. The rigid-ity of furniture and stress distribution in joints were calculated. On the basis of numerical calculations, the joints were positively validated.
Key words: furniture; FEM; invisible joints; RTA; stiffness
SAŽETAK • Prodaja namještaja koji se isporučuje u obliku ravnih paketa zahtijeva primjenu odgovarajućih dizajnerskih rješenja. U takva se rješenje ubrajaju i vezovi koji trebaju olakšati samostalno sastavljanje namje-štaja bez primjene alata. Ti vezovi trebaju biti funkcionalni, estetski privlačni, izdržljivi i sigurni za upotrebu. Za ovo su istraživanje autori odlučili proizvesti prototipove inovativnih vezova namještaja te procijeniti kvalitetu namještaja sastavljenoga uz pomoć takvih vezova. Za tu je namjenu primijenjena metoda konačnih elemenata i program Abaqus. Vezovi su modelirani kao predmeti izrađeni od polilaktida (PLA). Između elemenata veza djeluju površinske i kontaktne sile koje nastaju konstrukcijom vezova. Korpus namještaja bio je podvrgnut torzijskim op-terećenjima. Izračunana je krutost namještaja i raspodjela naprezanja u vezovima. Na temelju brojčanih izračuna vezovi su pozitivno ocijenjeni.
Ključne riječi: namještaj; FEM; nevidljivi vezovi; RTA; krutost
© 2020 by the author(s).Licensee Faculty of Forestry, University of Zagreb.
This article is an open access article distributedunder the terms and conditions of the
Creative Commons Attribution (CC BY 4.0) license.
1 Authors are assistant and professor at Department of Furniture Design, Faculty of Wood Technology, Poznan University of Life Sciences, Poznan, Poland.
2 Author is professor at Wood Technology Department, Faculty of Forestry, University of Zagreb, Zagreb, Croatia.
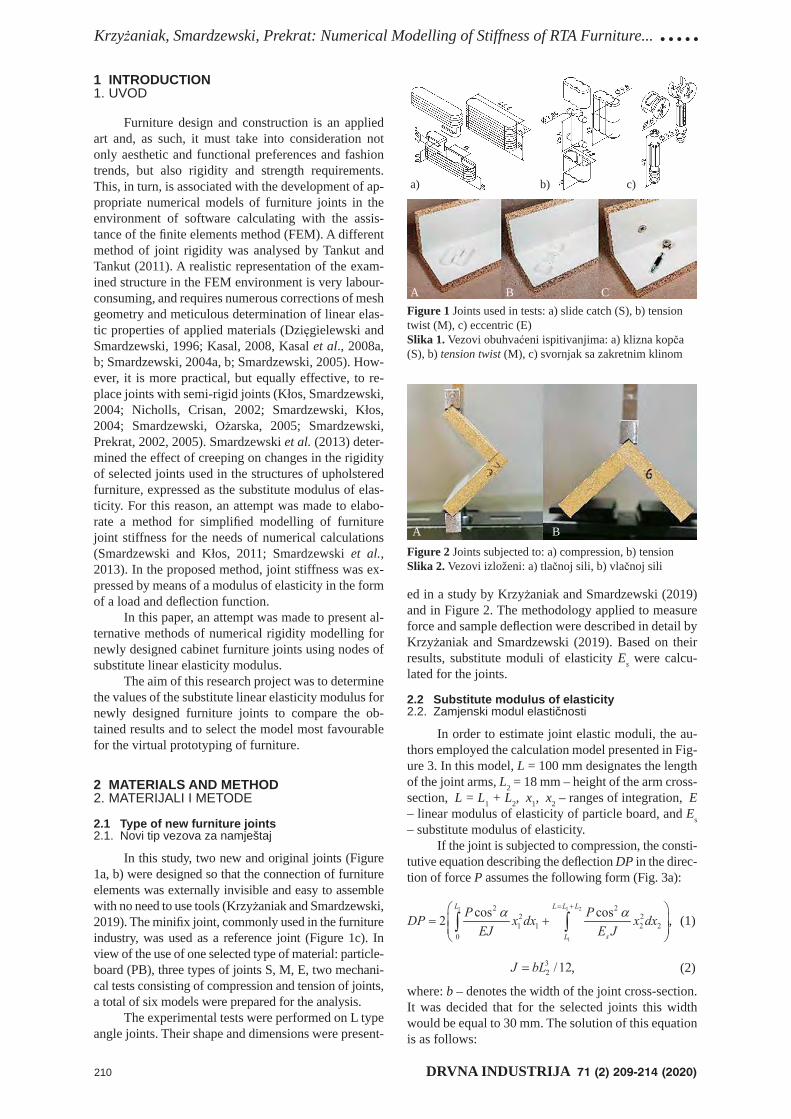
Krzyżaniak, Smardzewski, Prekrat: Numerical Modelling of Stiffness of RTA Furniture... .....
210 DRVNA INDUSTRIJA 71 (2) 209-214 (2020)
1 INTRODUCTION1. UVOD
Furniture design and construction is an applied art and, as such, it must take into consideration not only aesthetic and functional preferences and fashion trends, but also rigidity and strength requirements. This, in turn, is associated with the development of ap-propriate numerical models of furniture joints in the environment of software calculating with the assis-tance of the fi nite elements method (FEM). A different method of joint rigidity was analysed by Tankut and Tankut (2011). A realistic representation of the exam-ined structure in the FEM environment is very labour-consuming, and requires numerous corrections of mesh geometry and meticulous determination of linear elas-tic properties of applied materials (Dzięgielewski and Smardzewski, 1996; Kasal, 2008, Kasal et al., 2008a, b; Smardzewski, 2004a, b; Smardzewski, 2005). How-ever, it is more practical, but equally effective, to re-place joints with semi-rigid joints (Kłos, Smardzewski, 2004; Nicholls, Crisan, 2002; Smardzewski, Kłos, 2004; Smardzewski, Ożarska, 2005; Smardzewski, Prekrat, 2002, 2005). Smardzewski et al. (2013) deter-mined the effect of creeping on changes in the rigidity of selected joints used in the structures of upholstered furniture, expressed as the substitute modulus of elas-ticity. For this reason, an attempt was made to elabo-rate a method for simplifi ed modelling of furniture joint stiffness for the needs of numerical calculations (Smardzewski and Kłos, 2011; Smardzewski et al., 2013). In the proposed method, joint stiffness was ex-pressed by means of a modulus of elasticity in the form of a load and defl ection function.
In this paper, an attempt was made to present al-ternative methods of numerical rigidity modelling for newly designed cabinet furniture joints using nodes of substitute linear elasticity modulus.
The aim of this research project was to determine the values of the substitute linear elasticity modulus for newly designed furniture joints to compare the ob-tained results and to select the model most favourable for the virtual prototyping of furniture.
2 MATERIALS AND METHOD2. MATERIJALI I METODE
2.1 Type of new furniture joints2.1. Novi tip vezova za namještaj
In this study, two new and original joints (Figure 1a, b) were designed so that the connection of furniture elements was externally invisible and easy to assemble with no need to use tools (Krzyżaniak and Smardzewski, 2019). The minifi x joint, commonly used in the furniture industry, was used as a reference joint (Figure 1c). In view of the use of one selected type of material: particle-board (PB), three types of joints S, M, E, two mechani-cal tests consisting of compression and tension of joints, a total of six models were prepared for the analysis.
The experimental tests were performed on L type angle joints. Their shape and dimensions were present-
ed in a study by Krzyżaniak and Smardzewski (2019) and in Figure 2. The methodology applied to measure force and sample defl ection were described in detail by Krzyżaniak and Smardzewski (2019). Based on their results, substitute moduli of elasticity Es were calcu-lated for the joints.
2.2 Substitute modulus of elasticity2.2. Zamjenski modul elastičnosti
In order to estimate joint elastic moduli, the au-thors employed the calculation model presented in Fig-ure 3. In this model, L = 100 mm designates the length of the joint arms, L2 = 18 mm – height of the arm cross-section, L = L1 + L2, x1, x2 – ranges of integration, E – linear modulus of elasticity of particle board, and Es – substitute modulus of elasticity.
If the joint is subjected to compression, the consti-tutive equation describing the defl ection DP in the direc-tion of force P assumes the following form (Fig. 3a):
, (1)
, (2)
where: b – denotes the width of the joint cross-section. It was decided that for the selected joints this width would be equal to 30 mm. The solution of this equation is as follows:
Figure 1 Joints used in tests: a) slide catch (S), b) tension twist (M), c) eccentric (E)Slika 1. Vezovi obuhvaćeni ispitivanjima: a) klizna kopča (S), b) tension twist (M), c) svornjak sa zakretnim klinom
Figure 2 Joints subjected to: a) compression, b) tensionSlika 2. Vezovi izloženi: a) tlačnoj sili, b) vlačnoj sili
A B C
a) b) c)
A B
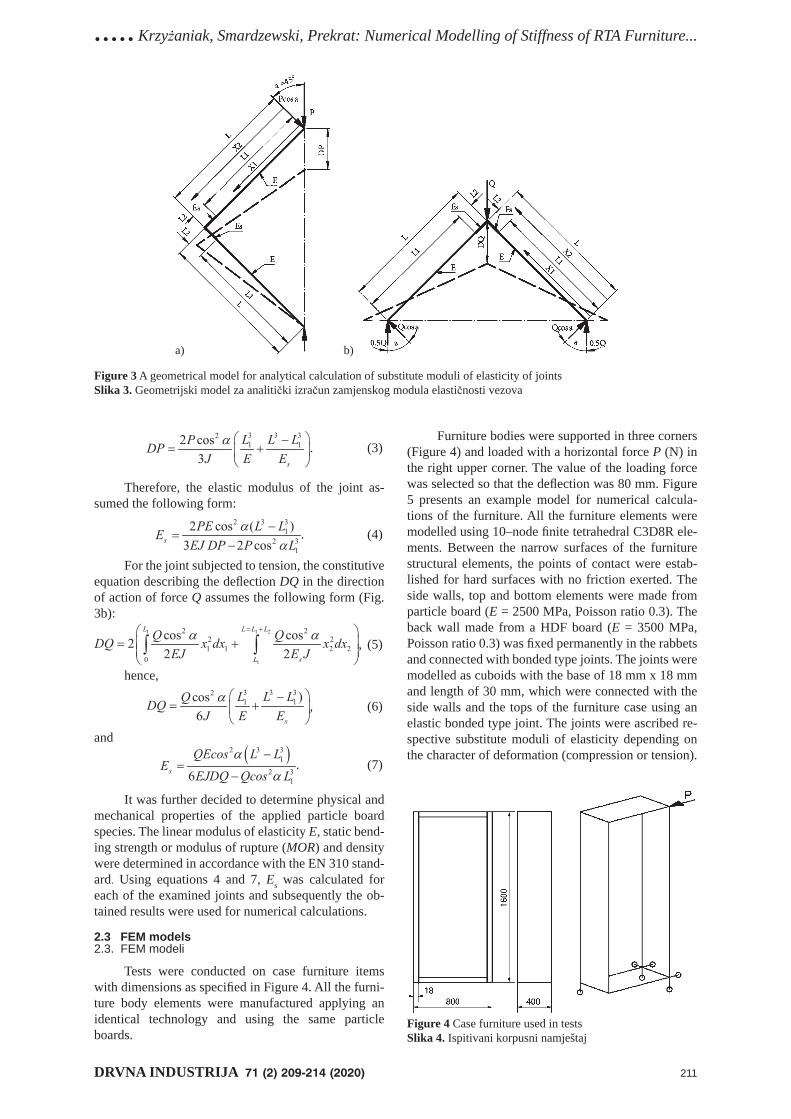
.....Krzyżaniak, Smardzewski, Prekrat: Numerical Modelling of Stiffness of RTA Furniture...
DRVNA INDUSTRIJA 71 (2) 209-214 (2020) 211
. (3)
Therefore, the elastic modulus of the joint as-sumed the following form:
. (4)
For the joint subjected to tension, the constitutive equation describing the defl ection DQ in the direction of action of force Q assumes the following form (Fig. 3b):
, (5)
hence,
, (6)
and
. (7)
It was further decided to determine physical and mechanical properties of the applied particle board species. The linear modulus of elasticity E, static bend-ing strength or modulus of rupture (MOR) and density were determined in accordance with the EN 310 stand-ard. Using equations 4 and 7, Es was calculated for each of the examined joints and subsequently the ob-tained results were used for numerical calculations.
2.3 FEM models2.3. FEM modeli
Tests were conducted on case furniture items with dimensions as specifi ed in Figure 4. All the furni-ture body elements were manufactured applying an identical technology and using the same particle boards.
Furniture bodies were supported in three corners (Figure 4) and loaded with a horizontal force P (N) in the right upper corner. The value of the loading force was selected so that the defl ection was 80 mm. Figure 5 presents an example model for numerical calcula-tions of the furniture. All the furniture elements were modelled using 10–node fi nite tetrahedral C3D8R ele-ments. Between the narrow surfaces of the furniture structural elements, the points of contact were estab-lished for hard surfaces with no friction exerted. The side walls, top and bottom elements were made from particle board (E = 2500 MPa, Poisson ratio 0.3). The back wall made from a HDF board (E = 3500 MPa, Poisson ratio 0.3) was fi xed permanently in the rabbets and connected with bonded type joints. The joints were modelled as cuboids with the base of 18 mm x 18 mm and length of 30 mm, which were connected with the side walls and the tops of the furniture case using an elastic bonded type joint. The joints were ascribed re-spective substitute moduli of elasticity depending on the character of deformation (compression or tension).
Figure 3 A geometrical model for analytical calculation of substitute moduli of elasticity of jointsSlika 3. Geometrijski model za analitički izračun zamjenskog modula elastičnosti vezova
Figure 4 Case furniture used in testsSlika 4. Ispitivani korpusni namještaj
a) b)
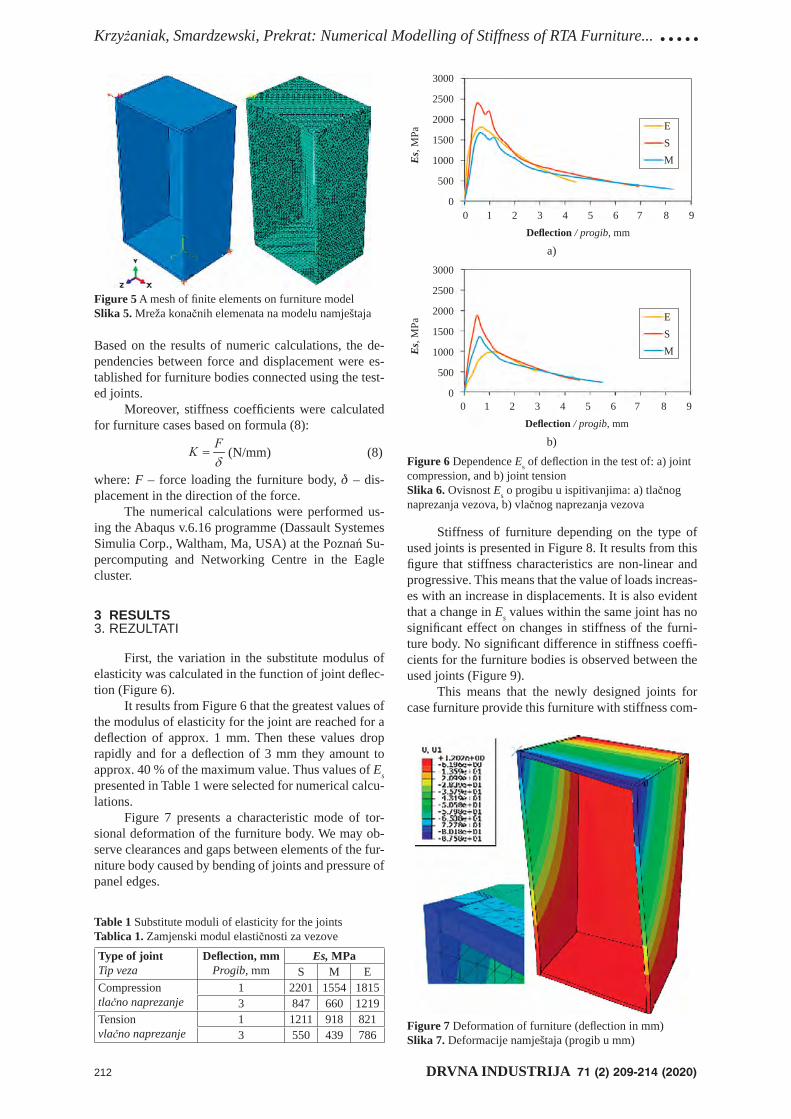
Krzyżaniak, Smardzewski, Prekrat: Numerical Modelling of Stiffness of RTA Furniture... .....
212 DRVNA INDUSTRIJA 71 (2) 209-214 (2020)
Based on the results of numeric calculations, the de-pendencies between force and displacement were es-tablished for furniture bodies connected using the test-ed joints.
Moreover, stiffness coeffi cients were calculated for furniture cases based on formula (8):
(N/mm) (8)
where: F – force loading the furniture body, δ – dis-placement in the direction of the force.
The numerical calculations were performed us-ing the Abaqus v.6.16 programme (Dassault Systemes Simulia Corp., Waltham, Ma, USA) at the Poznań Su-percomputing and Networking Centre in the Eagle cluster.
3 RESULTS3. REZULTATI
First, the variation in the substitute modulus of elasticity was calculated in the function of joint defl ec-tion (Figure 6).
It results from Figure 6 that the greatest values of the modulus of elasticity for the joint are reached for a defl ection of approx. 1 mm. Then these values drop rapidly and for a defl ection of 3 mm they amount to approx. 40 % of the maximum value. Thus values of Es presented in Table 1 were selected for numerical calcu-lations.
Figure 7 presents a characteristic mode of tor-sional deformation of the furniture body. We may ob-serve clearances and gaps between elements of the fur-niture body caused by bending of joints and pressure of panel edges.
Stiffness of furniture depending on the type of used joints is presented in Figure 8. It results from this fi gure that stiffness characteristics are non-linear and progressive. This means that the value of loads increas-es with an increase in displacements. It is also evident that a change in Es values within the same joint has no signifi cant effect on changes in stiffness of the furni-ture body. No signifi cant difference in stiffness coeffi -cients for the furniture bodies is observed between the used joints (Figure 9).
This means that the newly designed joints for case furniture provide this furniture with stiffness com-
Figure 5 A mesh of fi nite elements on furniture modelSlika 5. Mreža konačnih elemenata na modelu namještaja
Figure 6 Dependence Es of defl ection in the test of: a) joint compression, and b) joint tensionSlika 6. Ovisnost Es o progibu u ispitivanjima: a) tlačnog naprezanja vezova, b) vlačnog naprezanja vezova
a)
b)
Table 1 Substitute moduli of elasticity for the jointsTablica 1. Zamjenski modul elastičnosti za vezove
Type of jointTip veza
Defl ection, mmProgib, mm
Es, MPaS M E
Compressiontlačno naprezanje
1 2201 1554 18153 847 660 1219
Tensionvlačno naprezanje
1 1211 918 8213 550 439 786
Figure 7 Deformation of furniture (defl ection in mm)Slika 7. Deformacije namještaja (progib u mm)
Defl ection / progib, mm
Defl ection / progib, mm
3000
2500
2000
1500
1000
500
0
3000
2500
2000
1500
1000
500
0
0 1 2 3 4 5 6 7 8 9
Es,
MPa
Es,
MPa
ESM
ESM
0 1 2 3 4 5 6 7 8 9
.....Krzyżaniak, Smardzewski, Prekrat: Numerical Modelling of Stiffness of RTA Furniture...
DRVNA INDUSTRIJA 71 (2) 209-214 (2020) 213
parable to that which may be obtained using traditional eccentric joints (E).
4 CONCLUSIONS4. ZAKLJUČCI
Results obtained based on numerical calculations and their analysis gave grounds for the following con-clusions and remarks:1. The greatest values of the substitute moduli of elas-ticity are recorded for the slide catch joint. Rigidity of these joints is very close to the rigidity of eccentric joints. For this reason, we can recommend this connec-tion as a good substitute to eccentric connections. 2. The tension twist joints also ensure very good me-chanical properties of case furniture. So, it can also be used in furniture industry.3. Generally, no signifi cant difference was shown be-tween stiffness of case furniture items with traditional eccentric joints and stiffness of furniture items with newly designed joints. This is due to the fact that each of the connections generates internal montage forces. These forces guarantee high rigidity of the case furni-ture.4. Relationship between force and displacement of fur-niture are non-linear. This is due to the interaction of internal montage forces in the connectors and the in-crease of the contact surface between the elements. It was described in detail in the work by Krzyżaniak and Smardzewski (2019).
5 REFERENCES5. LITERATURA
1. Dzięgielewski, S.; Smardzewski, J., 1996: Moduł sprężystości połączeń a sztywność mebli skrzyniowych – analiza numeryczna [Modulus of elasticity of joints and stiffness of case furniture - a numerical analysis]. Materi-als of the 8th scientifi c session “Research for furniture industry”. Wydawnictwo Akademii Rolniczej im. A. Cieszkowskiego w Poznaniu. Poznań, pp. 23-48.
2. Kasal, A., 2008: Effect of the number of screws and screw size on moment capacity of furniture corner joints in case construction. Forest Prod. J., 58 (6): 36-44.
3. Kasal, A.; Zhang, J.; Yuksel, M.; Erdil, Y. Z., 2008a: Ef-fects of screw sizes on load bearing capacity and stiffness of fi ve-sided furniture cases constructed of particleboard and medium density fi berboard. Forest Prod. J., 58 (10): 25-32.
4. Kasal, A.; Erdil, Y. Z.; Zhang, J.; Efe, H.; Avci, E., 2008b: Estimation equations for moment resistances of L-type screw corner joints in case goods furniture. Forest Prod. J., 58 (9): 21-27.
5. Kłos, R.; Smardzewski, J., 2004: Wielokryterialna opty-malizacja mebli skrzyniowych metodą algorytmów ge-netycznych [Multiple criterion optimisation of case fur-niture using the genetic algorithm method]. Roczniki Akademii Rolniczej w Poznaniu, 39: 5-14.
6. Krzyżaniak, Ł.; Smardzewski, J., 2019: Strength and stiffness of new designed externally invisible and de-mountable joints for furniture cases. Engineering Struc-tures, 199, 2019, 109674.
https://doi.org/10.1016/j.engstruct.2019.109674.
Figure 8 Stiffness of furniture with different joints: eccentric (E), slide catch (S), tension twist (M) (blue: for defl ection 1 mm, orange: for defl ection 3 mm)Slika 8. Krutost namještaja pri različitim vezovima: sa svornjakom sa zakretnim klinom (E), s kliznom kopčom (S), s tension twist vezom (M) (plavo: za progib 1 mm, narančasto: za progib 3 mm)
Defl ection / progib, mm
2500
2000
1500
1000
500
00 20 40 60 80
2500
2000
1500
1000
500
00 20 40 60 80
Loa
d / o
pter
ećen
je, N
2500
2000
1500
1000
500
00 20 40 60 80
Figure 9 Stiffness coeffi cient of cabinet furnitureSlika 9. Koefi cijent krutosti korpusnog namještaja
Defl ection / progib, mm
Loa
d / o
pter
ećen
je, N
Loa
d / o
pter
ećen
je, N
E
S
M
Type of joint / vrsta veza
E S M
24.0
23.8
23.6
23.4
23.2
23.0
22.8
22.6
22.4
22.2
K, N
/mm
23.8
23.2
22.8
Defl ection / progib, mm
Krzyżaniak, Smardzewski, Prekrat: Numerical Modelling of Stiffness of RTA Furniture... .....
214 DRVNA INDUSTRIJA 71 (2) 209-214 (2020)
7. Nicholls, T.; Crisan, R., 2002: Study of the stress-strain state in corner joints and box-type furniture using Finite Elements Analysis (FEA). Holz als Roh- und Werkstoff, 60: 66-71. https://doi.org/10.1007/s00107-001-0262-0.
8. Smardzewski, J., 2004a: Modeling of semi-rigid joints of the confi rmate type. Annals of Warsaw Agricultural Uni-versity, Forest and Wood Technology 55: 486-490.
9. Smardzewski, J., 2004b: Modelowanie półsztywnych węzłów konstrukcyjnych mebli [Modelling of semi-rigid structural nodes of furniture]. Monograph B. Branowski, P. Pohl (eds.). Wydawnictwo AR w Poznaniu 139-170, pp. 218-221.
10. Smardzewski, J., 2005: Nieliniowe modele połączeń zac-zepowych [Non-linear models of catch joints]. Poliopty-malizacja i komputerowe wspomaganie projektowania. Wydawnictwo Uczelniane Politechniki Koszalińskiej. Mielno, pp. 184-192.
11. Smardzewski, J.; Kłos, R., 2004: Możliwości poliopty-malizacji mebli skrzyniowych z wykorzystaniem metody gradientowej [Potential for polyoptimisation of case fur-niture using the gradient method]. Przemysł Drzewny, 4 (LV): 32-35.
12. Smardzewski, J.; Kłos, R.; Fabisiak, B., 2013: Determi-nation of the impact of creeping of furniture joints on their rigidity. Turkish J. Agric. For. 37: 802-811.
https://doi:10.3906/tar-1206-8.13. Smardzewski, J.; Kłos, R., 2011: Modeling of joint sub-
stitutive rigidity of board elements. Annals of Warsaw
University of Life Sciences – SGGW Forestry and Wood Technology 2011, 73: 7-15.
14. Smardzewski, J.; Ożarska, B., 2005: Rigidity of cabinet furniture with semi-rigid joints of the confi rmat type. Electronic Journal of Polish Agricultural Universities Wood Technology, 8 (2), 32.
15. Smardzewski, J.; Prekrat, S., 2002: Stress distribution in disconnected furniture joints. Electronic Journal of Pol-ish Agricultural Universities, Wood Technology, 5 (2).
16. Smardzewski, J.; Prekrat, S., 2005: Nonlinear strength model of an eccentric joint mandrel. Drvna industrija, 55 (2): 59-67.
17. Tankut, A. N.; Tankut, N., 2005: The effects of joint forms (shape) and dimensions on the strengths of mortise and tenon joints. Turkish J. Agric. For. 29: 493-498.
Corresponding address:
ŁUKASZ KRZYŻANIAK
Department of Furniture DesignFaculty of Wood TechnologyPoznan University of Life SciencesPoznan, POLAND e-mail: [email protected]
........................................................ Uz sliku s naslovnice
DRVNA INDUSTRIJA 71 (2) 215-216 (2020) 215
NAZIVI I PODRUČJE RASPROSTRANJENOSTI
Brachystegia cynometroides Harms vrsta je drva iz porodice Fabaceae (Leguminosae), potporodice Ca-esalpinioideae. Na tržištu se pojavljuje zajedno s vrsta-ma B. eurycoma Harms i B. leonensis Burtt Davy & Hutch. pod nazivima Naga (Njemačka, Francuska), okwen (Velika Britanija, Nigerija), méblo (Obala Bje-lokosti), mendou (Gabon), tebako (Liberija), bodgei (Siera Leone). Stabla Brachystegia cynometroides Harms nalazimo u zapadnoj Africi. Pretežito rastu u kišnim šumama istočne Nigerije i zapadnog Kameru-na. Vrste istoga roda mogu se pronaći u Liberiji, Obali Bjelokosti i Siera Leoneu.
STABLO
Stablo doseže visinu do 25 m. Čisto deblo dugo je 12 do 18 m, a prsni mu je promjer od 0,7 do 1,2 (1,5) m. Debla su valjkastog oblika. Kora mladih stabala je glatka i žućkasta. Na starijim stablima kora je gruba i ljuskasta, crvenonarančaste boje.
DRVO
Makroskopska obilježja
Bjeljika je bjelkasta do svjetlosmeđa, a široka je 6 – 15 cm. Srž drva je boje bakra do crvenkastosmeđa. Tekstura drva je dekorativna, često sa svijetlim ili ta-mnim prugama, katkad nepravilne žice. Drvo je rastre-sito porozno. Vidljiva je granica goda s graničnim ak-sijalnim parenhimom. Pore drva i drvni traci povećalom su dobro vidljivi.
Mikroskopska obilježja
Drvo je rastresito porozno. Traheje su pojedinač-ne, rjeđe su u malim skupinama i kratkim radijalnim nizovima. Promjer traheja je 85...177...288 mikrometa-ra, a gustoća im je 2...4...7 na 1 mm2 poprečnog presje-ka. Volumni udio traheja iznosi oko 10 %. Traheje ra-noga drva u srži ispunjene su tilama.
Aksijalni je parenhim apotrahealno granični i pa-ratrahealno vrpčast. Volumni udio aksijalnog parenhi-ma iznosi oko 20 %. Staničje drvnih trakova je homo-geno do slabo heterogeno, katno raspoređeno.
Drvni traci visoki su 100...310...530 mikrometara (do 20 stanica), a široki su 14...24...34 mikrometara. Gustoća drvnih trakova je 5...8 na 1 mm tangentnog
Brachystegia cynometroides Harms
presjeka. Njihov volumni udio iznosi oko 13 %. Drvna su vlakanca libriformska. Dugačka su 310...560...1115 mikrometara. Debljina staničnih stijenki vlakanca iznosi 1,9...3,0...3,9 mikrometara, a promjeri njihovih lumena su 10,4...16,0...22,1 mikrometara. Volumni udio vlakanca je oko 57 %.
Fizička svojstva
Gustoća apsolutno suhog drva, ρo oko 600 kg/m3
Gustoća prosušenog drva, ρ12-15 530...640...730 kg/m3
Gustoća sirovog drva, ρs 900...1000 kg/m3
Radijalno utezanje, βr 4,2...5,4 % Tangentno utezanje, βt 6,5...7,9 %Volumno utezanje, βv 11,9...13,5 %
Mehanička svojstva
Čvrstoća na tlak 43...55...64 MPaČvrstoća na savijanje 100...125...150 MPaTvrdoća (prema Brinellu), paralelno s vlakancima 30...34...40 MPaTvrdoća (prema Brinellu), okomito na vlakanca 16...20 MPaModul elastičnosti 9,1...12,0 GPa
TEHNOLOŠKA SVOJSTVA
Obradivost
Drvo se dobro pili, lijepi, blanja i brusi. Katkad je zbog nepravilne žice teško postići glatku površinu. Pri čavlanju i vijčanju može doći do raspucavanja površi-ne drva. Preporučuje se drvo predbušiti.
Sušenje
Drvo se dobro suši. Kako se zbog slabe permea-bilnosti drva u procesu sušenja ne bi pojavila skorjelost ili nastao kolaps drva, preporučuje se polagano suše-nje. Sklonost promjeni oblika i raspucavanju malena je.
Trajnost i zaštita
Prema normi HRN 350-2, 2005, srž drva Brachystegia cynometroides Harms slabo je otporna na gljive uzročnice truleži (razred otpornosti 3) i osjetljiva je na napad termita (razred otpornosti M). Srž je slabo permeabilna (razred 3). Po trajnosti pripada razredu 2 i
Uz sliku s naslovnice ........................................................
216 DRVNA INDUSTRIJA 71 (2) 215-216 (2020)
stoga se može upotrebljavati u interijeru. Za upotrebu na otvorenim prostorima drvo je potrebno prethodno zaštiti.
Uporaba
Drvo se upotrebljava za izradu stolarije, furnira i furnirskih ploča te dijelova namještaja.
Sirovina
Drvo se isporučuje u obliku trupaca i piljenica.
Napomena
Drvo je zbog sličnosti boje moguće zamijeniti s ostalim vrstama istog roda. Furnir drva nage može se rabiti kao zamjena za drvo sapelija (Entadrophragma cylindricum) i makorea (Tieghemella spp), a masivno drvo kao zamjena za drvo s ipa (Entadrophragma uti-le). Brachystegia cynometroides Harms za sada nije na popisu ugroženih vrsta međunarodne organizacije CI-TES, niti na popisu međunarodne organizacije IUCN. Drvo sličnih svojstava imaju i ove vrste: Brachystegia
eurycoma Harms, B. leonensis Burtt Davy & Hutch., B. nigerica Hoyle & A. P. D. Jones, B. laurentii (De Wild.) Hoyle, B. spiiciformis Benth., Entandropragma cylindricum Sprague, Monopetalanthus heitzii Pelegr., Tetraberlinia bifoliata (Harms) Hauman.
LITERATURA
1. Gérard, J.; Guibal, D.; Paradi, S.; Cerre, J. C., 2017: Tro-pical Timbers Atlas, Technological characteristics and uses. Éditions Quae RD 10,78026 Versailles Cedex.
2. Wagenführ, R.; Scheiber, C., 2006: HOLZATLAS. VEB Fachbuchverlag, Leipzig, pp. 540-542.
3. ***HRN EN 350-2, 2005: Trajnost drva i proizvoda na osnovi drva – Prirodna trajnost masivnog drva, 2. dio.
4. https://tropix.cirad.fr/FichiersComplementaires/EN/Africa/NAGA.pdf (preuzeto 25. travnja 2020.).
5. http://www.wood-database.com/wood-articles/restric-ted-and-endangered-wood-species/ (preuzeto 25. travnja 2020.).
6. https://www.lesserknowntimberspecies.com/species/naga (preuzeto 25. travnja 2020.).
prof. dr. sc. Jelena Trajkovićizv. prof. dr. sc. Bogoslav Šefc
Knjiga koja može svim ljubiteljima drvne struke biti koristan izvor informacija o izgledu, osnovnim strukturnim obilježjima te o izič-kim, mehaničkim i tehnološkim svojstvima 97 vrsta drva…
… od 1995. do 2019. izašlo je sto-tinu brojeva časopisa Drvna in-dustrija i sve su naslovnice obu-hvaćene u ovoj knjizi. Uz svaku naslovnicu, odnosno uz svaku vr-stu drva s naslovnice u knjizi se na desnoj strani nalazi pripadaju-ći tekst o nazivima i području ra-sprostranjenosti navedene vrste te o svojstvima tog drva kao mate-rijala. Stručno nazivlje usuglašeno je s Pojmovnikom hrvatskoga drv-notehnološkog nazivlja, odnosno s bazom STRUNA (http://stru-na.ihjj.hr/browse/?pid=45). Na kraju svakog teksta navedeni su autori, a sva korištena literatura objavljena je u poglavlju Litera-tura. Slika drva na lijevoj stranici knjige istovjetna je pripadajućoj naslovnici, osim u nekoliko slu-čajeva, kada su radi bolje kvalite-te izrađene nove slike. U naslovu teksta o pojedinoj vrsti drva uz komercijalni je hrvatski naziv na-pisan i važeći znanstveni naziv. Znanstveni nazivi usklađeni su s najnovijim znanstvenim spozna-jama, odnosno navedeni su prema Međunarodnom indeksu naziva biljaka (IPNI), u skladu s Međuna-rodnim kodeksom nomenklature algi, gljiva i biljaka iz 2018.
NARUDŽBENICANaslov / Title:Vrste drva s naslovnica časopisa Drvna industrija (1950-2019)Wood Species from the Covers of the Drvna industrija Journal (1950-2019)(in Croa an)
Urednici / Editors: Vlatka Jirouš Rajković i Bogoslav ŠefcAutori tekstova o vrstama drva: Radovan Despot, Božidar Petrić,Bogoslav Šefc, Jelena Trajković
ISBN: 978-953-292-063-5Izdavači / Publisher: Šumarski fakultet Sveučilišta u Zagrebu
Cijena / Price: Hrvatska / Croa a: 300,00 HRK (13 % PDV nije uključen, poštarina je uključena) EU / elsewhere: 70,00 EUR (postage included) Popust / discount: 10 % za/for 5-10 komada/pcs. 15 % za 11 i više ko mada/for 11 and more pcs. za studente/učenike - Hrvatska: 150,00 kn (13 % PDV nije uključen, osobno na ŠF)
Naručujem _____ primjerak(a) knjige “Vrste drva s naslovnica časopisa Drvna industrija (1950-2019)”, urednika Vlatke Jirouš Rajković i Bogoslava Šefca.
Načini plaćanja:- uplata na žiro-račun broj: IBAN: HR0923600001101340148, model: HR00, poziv na broj: 30203,
svrha: Zbirka naslovnica DI- EU / elsewhere: Bank: Zagrebačka banka, SWIFT: ZABA HR2X, proforma invoice no… - predračun
Isporuka knjige po upla / Delivery of the book upon payment:- poštom / by mail- osobno na Šumarskom fakultetu Sveučilišta u Zagrebu
Zavod za namještaj i drvne proizvode (+385 1 2352 454, gđa. Cvetan)- studen preuzimaju osobno
PODACI O NARUČITELJU:
Ime i prezime/tvrtka: OIB:Name/company: VAT:
Adresa:Address:
Tel: Fax: e-mail:
Potvrdu o plaćanju i ispunjenu narudžbenicu pošaljite e-mailom na adresu: e-mail: [email protected]Šumarski fakultet Sveučilišta u ZagrebuZavod za namještaj i drvne proizvodeSvetošimunska 25, p.p. 422, 10 000 ZagrebTel: +385 1 2352 454; Fax: +385 1 2352 531
SVEUČILIŠTE U ZAGREBU / UNIVERSITY OF ZAGREBŠUMARSKI FAKULTET / FACULTY OF FORESTRYSvetošimunska 25, 10000 Zagreb, Hrvatska / Croatia IBAN: HR0923600001101340148tel: 00385 1 2352 454 e-mail: [email protected] OIB / VAT ID: HR07699719217
PRETPLATNI LIST / SUBSCRIPTION SHEET
Izašao je broj 1 časopisa Drvna industrija, volumen 71 (2020. godina). Pozivamo Vas da obnovite svoju pretplatu ili se pretplatite na časopis, te na taj način pomognete njegovo izlaženje. Cijena sva četiri broja jednog godišta (volumena) je 300,00 HRK bez PDV-a u Hrvatskoj, odnosno 55 EUR u inozemstvu. Ukoliko ste suglasni s uvjetima pretplate za jedno godište časopisa, molimo Vas da popunite obrazac za pretplatu i pošaljete ga na našu poštansku ili elektroničku adresu.Issue 1, Volume 71 (2020) of the Drvna industrija Journal is published. We invite you to renew your subscription or subscribe to a journal to support it. The price of all four issues of one year (volume) is 300 HRK in Croatia, or 55 EUR, without VAT, in EU or elsewhere. If you agree to the subscription terms for one volume, please complete the subscription form and send it to our postal or e-mail address.
Predsjednik Izdavačkog savjeta Glavna i odgovorna urednicačasopisa Drvna industrija časopisa Drvna industrijaPresident of Publishing Council Editor-In-Chief
prof. dr. sc. Ivica Grbac prof. dr. sc. Ružica Beljo Lučić
PRETPLATA NA ČASOPISSUBSCRIPTION TO JOURNAL
Pretplaćujemo se na časopis Drvna industrija u količini od ___ godišnje pretplate (jedan volumen ima četiri broja).Cijena jednog godišta (volumena) iznosi 300 HRK, bez PDV-a. Pretplata obuhvaća sve brojeve jednog godišta.We subscribe to the Drvna industrija Journal in amount of ___ annual subscription(s) (one volume has four issues).Price of one volume (year) is 55 EUR, without VAT. The subscription covers all numbers of one volume.
Hrvatska: EU / World: HR0923600001101340148 Bank: Zagrebačka banka s naznakom “Za časopis Drvna industrija" IBAN: HR0923600001101340148 poziv na broj: 3-02-03 Swift: ZABA HR 2X
Osoba / Name: ______________________________________ e-mail: ___________________________
Tvrtka, ustanova / Company, institution: __________________________________________________________
OIB / VAT ID: _________________________________________ Telefon / Phone: ___________________
Adresa / Address: ______________________________________ Pošta. broj: _______________________(ulica / street) Postal code:
Grad / City: ______________________________________ Regija / Region: ___________________________
Država / Country: _________________________________

13th International Scientifi c Conference WoodEMA 2020 &
31st International Scientfi c Conference ICWST 2020
SUSTAINABILITY OF FOREST-BASED INDUSTRIES IN THE GLOBAL ECONOMY
Vinkovci, Croatia, September 28th- 30th 2020
At the end of September 2020, in the period from 28th to 30th, in Vinkovci, Croatia, two international scientifi c conferences will be held together in the same venue. Under the joined organization of three partners, International Association for Economics and Manage-ment in Wood Processing and Furniture Manufacturing WoodEMA, i.a., University of Zagreb, Faculty of Forestry and Competence Centre Ltd. Vinkovci, 13th International Scientifi c Con-ference WoodEMA 2020 and 31st International Scientfi c Conference ICWST 2020 will host many internationally recognized scientists and researchers from all over Europe who will present their recent research results under the common main title SUSTAINABILITY OF FOREST-BASED INDUSTRIES IN THE GLOBAL ECONOMY.
Presentations will cover different aspects of sustainability of forestry, wood process-ing and furniture manufacturing under wide range of topics such as: production manage-ment, production and business economics, marketing, human resource management, qual-ity assurance and quality management, innovativeness, information systems, renewable energy from wooden biomass, properties of wood and wood based materials, wood modifi -cations, wood processing technology, wood products, furniture and interior design.
Also, along with the simultaneous conferences, several important scientifi c projects conducted by Competence Centre Ltd., Faculty of Forestry and wood processing compa-nies in the area, funded by European Union will be presented and discussed.
Rich social program along with the conferences, including some visits and surprise trip in the Eastern Slavonija region of Croatia is planned for all the participants.
We expect your participation on this event.
Na Šumarskom fakultetu Sveučilišta u Zagrebu u tijeku je provedba projekta Internacio-
nalizacija Šumarskog fakulteta „kod kuće“ (InterSumfak). Projekt je sufi nanciran u okviru Pozi-
va Internacionalizacija visokog obrazovanja iz Europskoga socijalnog fonda (ESF), Operativno-
ga programa Učinkoviti ljudski potencijali 2014. – 2020. Ukupna vrijednost projekta iznosi
1.437.118,85 kuna. Nositelj je projekta Šumarski fakultet, a u svojstvu partnera sudjeluje i
Prirodoslovno-matematički fakultet Sveučilišta u Zagrebu, Biološki odsjek. Projekt je započeo
u listopadu 2018. godine, a trajat će do listopada 2021. godine.
Kako bi prevladali nedostatak studijskih programa na stranom jeziku, članovi projektnog
tima s voditeljicom doc. dr. sc. Martinom Temunović na čelu, rade na povećanju broja predme-
ta diplomskih studija Šumarskog fakulteta koji se izvode na engleskom jeziku. Projekt će una-
prijediti uvjete dolazne mobilnosti studenata, ali će i domaćim studentima omogućiti upis
predmeta na engleskom jeziku u međunarodnom okruženju, što predstavlja dobru pripremu za
njihovo sudjelovanje u programima međunarodne mobilnosti. Upis predmeta na engleskom
jeziku važan je i za studente Šumarskog fakulteta koji nisu u mogućnosti sudjelovati u progra-
mima međunarodne razmjene jer im se omogućuje razvoj transverzalnih vještina i jezičnih
kompetencija na „domaćem“ terenu, što ih čini konkurentnijima na tržištu rada.
Razvoj i izvedba predmeta na engleskom jeziku „kod kuće“ izravno doprinose jačanju
osobnih kompetencija te jezičnih vještina nastavnog osoblja uključenog u projekt. Time se
olakšava umrežavanje nastavnika s inozemnim visokim učilištima i njihove međunarodne
istraživačke aktivnosti te im se pruža prilika da ojačaju međunarodnu suradnju. Sve to doprino-
si boljoj međunarodnoj kompetitivnosti nastavnika te cjelokupnom ugledu i znanstvenoj izvr-
snosti Šumarskog fakulteta.
Glavna aktivnost projekta je razvoj i izvedba pet predmeta na engleskom jeziku na di-
plomskim studijima Šumarskog fakulteta. Za potrebe izvedbe nastave izradit će se i tiskati in-
terne skripte te jedan sveučilišni udžbenik na engleskom jeziku. Kako bi osigurali odgovarajuću
razinu jezičnih kompetencija, nastavnici i nenastavno osoblje, koji sudjeluju u projektu, pristu-
paju međunarodno priznatim ispitima ili pohađaju semestralne tečajeve engleskog jezika. Pro-
jektom je predviđen i angažman četiri gostujuća predavača iz zemlje i inozemstva. Upisi pred-
meta na diplomskim studijima Drvnotehnološkog odsjeka započeli su u akademskoj godini
2019./2020., dok će upisi predmeta na diplomskim studijima Šumarskog odsjeka započeti u
akademskoj godini 2020./2021.
Povećan broj predmeta na engleskom jeziku i usavršene jezične kompetencije te iskustva
nastavnika u izvođenju nastave na engleskom jeziku, predstavljaju prvi korak prema ponudi
cjelokupnih studijskih programa na stranim jezicima, što je jedan od strateških ciljeva Šumar-
skog fakulteta.
Više o projektu na internetskoj stranici Šumarskog fakulteta: h ps://www.sumfak.unizg.hr/hr/znanstveni-rad-i-medjunarodna-suradnja/
projek /internacionalizacija-sumarskog-fakulteta-kod-kuce/
Internacionalizacija [umarskog fakulteta „kod ku}e“
Na Šumarskom fakultetu Sveučilišta u Zagrebu u tijeku je provedba projekta Razvoj i provedba stručne prak-se na studijima Šumarskog fakulteta. Projekt je sufi nanciran u okviru poziva Razvoj, unapređenje i provedba struč-ne prakse u visokom obrazovanju Europskoga socijalnog fonda (ESF), Operativnoga programa Učinkoviti ljudski potencijali 2014. – 2020.
Ukupna vrijednost projekta iznosi 3.902.617,14 kuna. Uz Šumarski fakultet koji je nositelj projekta, u svojstvu partnera sudjeluju i Hrvatska komora inženjera šumarstva i drvne tehnologije, Drvni klaster Slavonski hrast te Centar kompetencija d.o.o. za istraživanje i razvoj. Projekt je započeo u ožujku 2020. godine, a trajat će do ožujka 2023. godine.
Svrha je projekta pružanje podrške studentima Šumarskog fakulteta u povećanju zapošljivosti unapređenjem i provedbom stručne prakse koja će im omogućiti stjecanje potrebnih praktičnih vještina. U projekt je uključeno 404 studenta Šumarskog fakulteta, koji će dobiti priliku da tijekom studija steknu praktične vještine i prvo radno iskustvo sudjelovanjem u aktivnostima koje se temelje na rješavanju stvarnih problema u sektoru. Studenti šumar-stva i drvne tehnologije sudjelovat će u aktivnostima mentoriranoga praktičnog rada na Fakultetu, zajedničkoj vi-šednevnoj terenskoj nastavi u drvoprerađivačkim tvrtkama i parkovima prirode te individualnoj praksi u tvrtkama u trajanju od mjesec dana. Na taj će način studenti steći dodatne vještine za uspješniji izlazak na tržište rada. Nada-lje, na Fakultetu će se uspostaviti Centar za stručnu praksu i razvoj karijera sa svrhom pomaganja studentima u pronalaženju i organizaciji prakse te usmjeravanju prema tržištu rada u skladu s njihovim afi nitetima, mogućnosti-ma i kompetencijama. Projekt će omogućiti i opremanje računalne učionice i radionice za stručnu praksu za stu-dente Drvnotehnološkog odsjeka. Uz postojeći suvremeni 5-osni CNC stroj te 3D skener i printer, studenti će od sada imati priliku koristiti i laserski uređaj za graviranje i rezanje. Stručnom edukacijom nastavnika u suradnji sa sektorskim tvrtkama i mentorima iz realnog sektora ostvarit će se povezivanje visokog obrazovanja i tržišta rada, što je iznimno važno u edukaciji budućih stručnjaka iz područja šumarstva, urbanog šumarstva i drvne tehnologi-je. Usto, provedbom projekta izravno se doprinosi ciljevima prioriteta iz područja obrazovanja budući da je cilj projekta unaprijediti kvalitetu sustava obrazovanja te poboljšati njegovu učinkovitost i usklađenost s potrebama tržišta rada.
CILJEVI PROJEKTA1. Pr užiti podršku studentima Šumarskog fakulteta u povećanju zapošljivosti unapređenjem i proved-
bom stručne prakse za 404 studenta, koja će im omogućiti stjecanje potrebnih praktičnih vještina.2. Uspostaviti Centar za stručnu praksu na Šumarskom fakultetu.3. Ojačati kompetencije 55 nastavnika u suradnji s partnerima iz sektora: Hrvatskom komorom inže-
njera šumarstva i drvne tehnologije, Centrom kompetencija d.o.o. za istraživanje i razvoj i Drvnim klasterom Slavonski hrast.
Očekivani rezultati projekta predstavljaju značajne i važne korake u povećanju zapošljivosti studenata Šumar-skog fakulteta na tržištu rada, a što je jedan od važnih strateških ciljeva Šumarskog fakulteta.
Voditeljica projekta je doc. dr. sc. Andreja Pirc Barčić.
RAZVOJ I PROVEDBA STRUČNE PRAKSE NA STUDIJIMA
ŠUMARSKOG FAKULTETA
Više o projektu može se pronaći na web stranici projekta: h ps://www.sumfak.unizg.hr/hr/znanstveni-rad-i-medjunarodna-suradnja/projek /razvoj-i-provedba-strucne-prakse-na-studijima-sumarskog-fakulteta-eu-projekt-up.03.1.1.04.0089/
Upute autorima Opće odredbeČasopis Drvna industrija objavljuje znanstvene radove (izvorne znanstvene radove, pregledne radove, prethodna priopćenja), stručne radove, izlaganja sa savjetovanja, stručne obavijesti, bibliografske radove, preglede te ostale priloge s područja biologije, kemije, fi zike i tehnologije drva, pulpe i papira te drvnih proizvoda, uključujući i proizvodnu, upravljačku i tržišnu problematiku u drvnoj industriji.Predaja rukopisa podrazumijeva uvjet da rad nije već predan negdje drugdje radi objavljivanja ili da nije već objavljen (osim sažetka, dije-lova objavljenih predavanja ili magistarskih radova odnosno disertaci-ja, što mora biti navedeno u napomeni) te da su objavljivanje odobrili svi suautori (ako rad ima više autora) i ovlaštene osobe ustanove u ko-joj je istraživanje provedeno. Cjelokupni sadržaj Drvne industrije do-stupan je za skidanje s interneta, tiskanje, daljnju distribuciju, čitanje i ponovno korištenje bez ograničenja sve dok se naznače autor(i) i origi-nalni izvor prema Creative Commons Attribution 4.0 International Li-cense (CC BY). Autor(i) zadržavaju izdavačka prava bez ograničenja.Znanstveni i stručni radovi objavljuju se na hrvatskome, uz sažetak na engleskome, ili se pak rad objavljuje na engleskome, sa sažetkom na hrvatskom jeziku. Naslov, podnaslovi i svi važni rezultati trebaju biti na-pisani dvojezično. Ostali se članci uglavnom objavljuju na hrvatskome. Uredništvo osigurava inozemnim autorima prijevod na hrvatski. Znan-stveni i stručni radovi podliježu temeljitoj recenziji najmanje dvaju re-cenzenata. Izbor recenzenata i odluku o klasifi kaciji i prihvaćanju članka (prema preporukama recenzenata) donosi Urednički odbor.Svi prilozi podvrgavaju se jezičnoj obradi. Urednici će od autora zah tijevati da tekst prilagode preporukama recenzenata i lektora, te zadržavaju i pravo da predlože skraćivanje ili poboljšanje teksta. Autori su potpuno odgovorni za svoje priloge. Podrazumijeva se da je autor pribavio dozvolu za objavljivanje dijelova teksta što su već negdje objavljeni te da objavljivanje članka ne ugrožava prava pojedinca ili pravne osobe. Radovi moraju izvještavati o istinitim znanstvenim ili tehničkim postignućima. Autori su odgovorni za ter-minološku i metrološku usklađenost svojih priloga. Radovi se šalju elektroničkom poštom na adresu:[email protected] ili [email protected]
UputePredani radovi smiju sadržavati najviše 15 jednostrano pisanih A4 listova s dvostrukim proredom (30 redaka na stranici), uključujući i tablice, slike te popis literature, dodatke i ostale priloge. Dulje je članke preporučljivo podijeliti na dva ili više nastavaka. Tekst treba biti u doc formatu, u potpunosti napisan fontom Times New Roman (tekst, grafi koni i slike), normalnim stilom, bez dodatnog uređenja teksta.Prva stranica poslanog rada treba sadržavati puni naslov, ime(na) i prezime(na) autora, podatke o zaposlenju autora (ustanova, grad i država) te sažetak s ključnim riječima (duljina sažetka približno 1/2 stranice A4).Posljednja stranica treba sadržavati titule, zanimanje, zvanje i adre-su (svakog) autora, s naznakom osobe s kojom će Uredništvo biti u vezi.Znanstveni i stručni radovi moraju biti sažeti i precizni. Osnovna poglavlja trebaju biti označena odgovarajućim podnaslovima. Na-pomene se ispisuju na dnu pripadajuće stranice, a obrojčavaju se susljedno. One koje se odnose na naslov označuju se zvjezdicom, a ostale uzdignutim arapskim brojkama. Napomene koje se odnose na tablice pišu se ispod tablica, a označavaju se uzdignutim malim pisanim slovima, abecednim redom.Latinska imena trebaju biti pisana kosim slovima (italicom), a ako je cijeli tekst pisan kosim slovima, latinska imena trebaju biti pod-crtana.U uvodu treba defi nirati problem i, koliko je moguće, predočiti gra-nice postojećih spoznaja, tako da se čitateljima koji se ne bave po-dručjem o kojemu je riječ omogući razumijevanje ciljeva rada.Materijal i metode trebaju biti što preciznije opisane da omoguće drugim znanstvenicima ponavljanje pokusa. Glavni eksperimentalni podaci trebaju biti dvojezično navedeni.Rezultati trebaju obuhvatiti samo materijal koji se izravno odnosi na predmet. Obvezatna je primjena metričkog sustava. Preporučuje se upotreba SI jedinica. Rjeđe rabljene fi zikalne vrijednosti, simboli i jedinice trebaju biti objašnjeni pri njihovu prvom spominjanju u tek-stu. Za pisanje formula valja se koristiti Equation Editorom (progra-mom za pisanje formula u MS Wordu). Jedinice se pišu normalnim (uspravnim) slovima, a fi zikalni simboli i faktori kosima (italicom).
Formule se susljedno obrojčavaju arapskim brojkama u zagradama, npr. (1) na kraju retka.Broj slika mora biti ograničen samo na one koje su prijeko potrebne za objašnjenje teksta. Isti podaci ne smiju biti navedeni i u tablici i na slici. Slike i tablice trebaju biti zasebno obrojčane, arapskim broj-kama, a u tekstu se na njih upućuje jasnim naznakama (“tablica 1” ili “slika 1”). Naslovi, zaglavlja, legende i sav ostali tekst u slikama i tablicama treba biti napisan hrvatskim i engleskim jezikom. Slike je potrebno rasporediti na odgovarajuća mjesta u tekstu, trebaju biti izrađene u rezoluciji 600 dpi, crno-bijele (objavljivanje slika u ko-loru moguće je na zahtjev autora i uz posebno plaćanje), formata jpg ili tiff, potpune i jasno razumljive bez pozivanja na tekst priloga.Svi grafi koni i tablice izrađuju se kao crno-bijeli prilozi (osim na zahtjev, uz plaćanje). Tablice i grafi koni trebaju biti na svojim mje-stima u tekstu te originalnog formata u kojemu su izrađeni radi nak-nadnog ubacivanja hrvatskog prijevoda. Ako ne postoji mogućnost za to, potrebno je poslati originalne dokumente u formatu u kojemu su napravljeni (excel ili statistica format).Naslovi slika i crteža ne pišu se velikim tiskanim slovima. Crteži i grafi koni trebaju odgovarati stilu časopisa (fontovima i izgledu). Slova i brojke moraju biti dovoljno veliki da budu lako čitljivi na-kon smanjenja širine slike ili tablice. Fotomikrografi je moraju imati naznaku uvećanja, poželjno u mikrometrima. Uvećanje može biti do-datno naznačeno na kraju naslova slike, npr. “uvećanje 7500 : l”.Diskusija i zaključak mogu, ako autori žele, biti spojeni u jedan odje-ljak. U tom tekstu treba objasniti rezultate s obzirom na problem postavljen u uvodu i u odnosu prema odgovarajućim zapažanjima autora ili drugih istraživača. Valja izbjegavati ponavljanje podataka već iznesenih u odjeljku Rezultati. Mogu se razmotriti naznake za daljnja istraživanja ili primjenu. Ako su rezultati i diskusija spojeni u isti odjeljak, zaključke je nužno napisati izdvojeno. Zahvale se navo-de na kraju rukopisa. Odgovarajuću literaturu treba citirati u tekstu, i to prema harvardskom sustavu (ime – godina), npr. (Bađun, 1965). Nadalje, bibliografi ja mora biti navedena na kraju teksta, i to abe-cednim redom prezimena autora, s naslovima i potpunim navodima bibliografskih referenci. Popis literature mora biti selektivan, a svaka referenca na kraju mora imati naveden DOI broj, ako ga posjeduje (http://www.doi.org) (provjeriti na http://www.crossref.org).
Primjeri navođenja literature Članci u časopisima: Prezime autora, inicijal(i) osobnog imena, go-dina: Naslov. Naziv časopisa, godište (ev. broj): stranice (od – do). Doi broj.PrimjerKärki, T., 2001: Variation of wood density and shrinkage in Europe-an aspen (Populus tremula). Holz als Roh- und Werkstoff, 59: 79-84. http://dx.doi.org/10.1007/s001070050479.Knjige: Prezime autora, inicijal(i) osobnog imena, godina: Naslov. (ev. izdavač/editor): izdanje (ev. svezak). Mjesto izdanja, izdavač (ev. stranice od – do).PrimjeriKrpan, J., 1970: Tehnologija furnira i ploča. Drugo izdanje. Zagreb, Tehnička knjiga.Wilson, J. W.; Wellwood, R. W., 1965: Intra-increment chemical pro-perties of certain western Canadian coniferous species. U: W. A.Cote, Jr. (Ed.): Cellular Ultrastructure of Woody Plants. Syracuse, N.Y., Syracuse Univ. Press, pp. 551- 559.Ostale publikacije (brošure, studije itd.)Müller, D., 1977: Beitrag zür Klassifi zierung asiatischer Baumarten. Mitteilung der Bundesforschungsanstalt für Forstund Holzvvirt sc-haft Hamburg, Nr. 98. Hamburg: M. Wiederbusch.Web stranice***1997: “Guide to Punctuation” (online), University of Sussex, www.informatics.sussex.ac.uk/department/docs/punctuation/node 00.html. First published 1997 (pristupljeno 27. siječnja 2010).
Autoru se prije konačnog tiska šalje pdf rada. Rad je potrebno pažlji-vo pročitati, ispraviti te vratiti Uredništvu s listom ispravaka te s formularom za prijenos autorskih prava na izdavača. Ispravci su ograničeni samo na tiskarske pogreške: dodaci ili znatnije promjene u radu naplaćuju se. Autori znanstvenih i stručnih radova besplatno dobivaju po jedan primjerak časopisa. Autoru svakog priloga također se dostavlja besplatan primjerak časopisa.
Dodatne informacije o načinu pisanja znanstvenih radova mogu se naći na web adresi:www.ease.org.uk/publications/author-guidelines
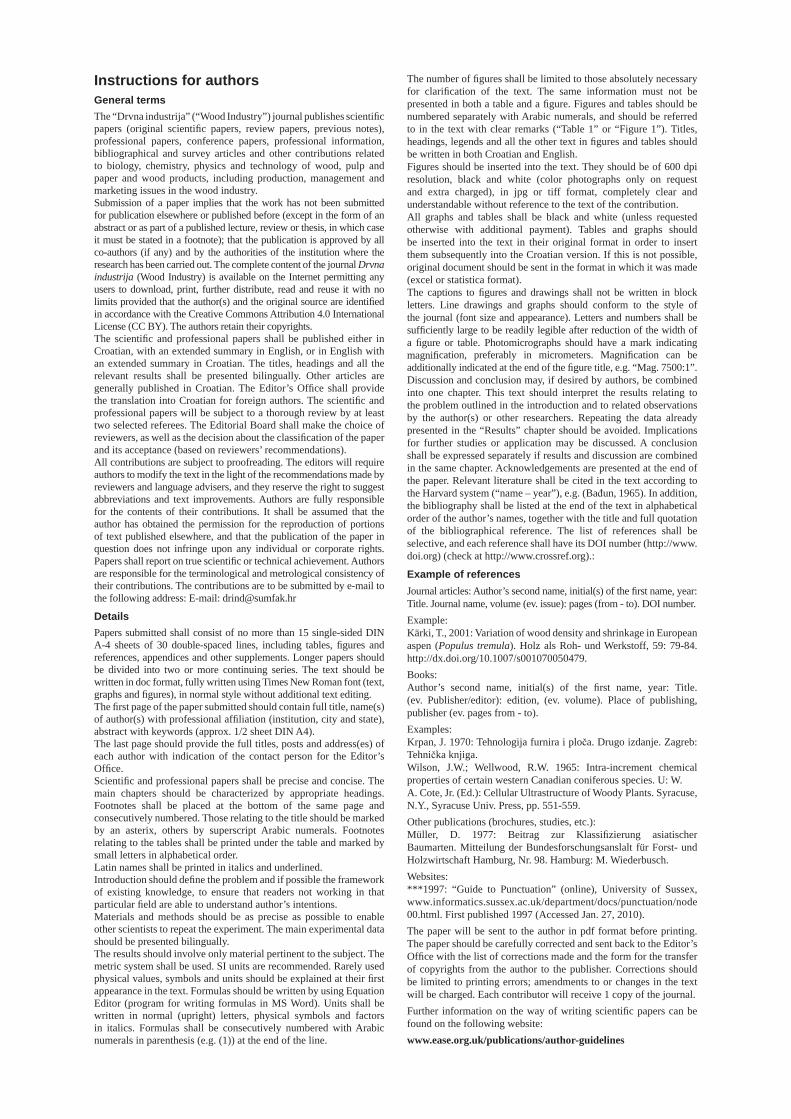
Instructions for authorsGeneral termsThe “Drvna industrija” (“Wood Industry”) journal publishes scientifi c papers (original scientifi c papers, review papers, previous notes), professional papers, conference papers, professional information, bibliographical and survey articles and other contributions related to biology, chemistry, physics and technology of wood, pulp and paper and wood products, including production, management and marketing issues in the wood industry.Submission of a paper implies that the work has not been submitted for publication elsewhere or published before (except in the form of an abstract or as part of a published lecture, review or thesis, in which case it must be stated in a footnote); that the publication is approved by all co-authors (if any) and by the authorities of the institution where the research has been carried out. The complete content of the journal Drvna industrija (Wood Industry) is available on the Internet permitting any users to download, print, further distribute, read and reuse it with no limits provided that the author(s) and the original source are identifi ed in accordance with the Creative Commons Attribution 4.0 International License (CC BY). The authors retain their copyrights. The scientifi c and professional papers shall be published either in Croatian, with an extended summary in English, or in English with an extended summary in Croatian. The titles, headings and all the relevant results shall be presented bilingually. Other articles are generally published in Croatian. The Editor’s Offi ce shall provide the translation into Croatian for foreign authors. The scientifi c and professional papers will be subject to a thorough review by at least two selected referees. The Editorial Board shall make the choice of reviewers, as well as the decision about the classifi cation of the paper and its acceptance (based on reviewers’ recommendations).All contributions are subject to proofreading. The editors will require authors to modify the text in the light of the recommendations made by reviewers and language advisers, and they reserve the right to suggest abbreviations and text improvements. Authors are fully responsible for the contents of their contributions. It shall be assumed that the author has obtained the permission for the reproduction of portions of text published elsewhere, and that the publication of the paper in question does not infringe upon any individual or corporate rights. Papers shall report on true scientifi c or technical achievement. Authors are responsible for the terminological and metrological consistency of their contributions. The contributions are to be submitted by e-mail to the following address: E-mail: [email protected]
DetailsPapers submitted shall consist of no more than 15 single-sided DIN A-4 sheets of 30 double-spaced lines, including tables, fi gures and references, appendices and other supplements. Longer papers should be divided into two or more continuing series. The text should be written in doc format, fully written using Times New Roman font (text, graphs and fi gures), in normal style without additional text editing. The fi rst page of the paper submitted should contain full title, name(s) of author(s) with professional affi liation (institution, city and state), abstract with keywords (approx. 1/2 sheet DIN A4).The last page should provide the full titles, posts and address(es) of each author with indication of the contact person for the Editor’s Offi ce.Scientifi c and professional papers shall be precise and concise. The main chapters should be characterized by appropriate headings. Footnotes shall be placed at the bottom of the same page and consecutively numbered. Those relating to the title should be marked by an asterix, others by superscript Arabic numerals. Footnotes relating to the tables shall be printed under the table and marked by small letters in alphabetical order. Latin names shall be printed in italics and underlined.Introduction should defi ne the problem and if possible the framework of existing knowledge, to ensure that readers not working in that particular fi eld are able to understand author’s intentions.Materials and methods should be as precise as possible to enable other scientists to repeat the experiment. The main experimental data should be presented bilingually.The results should involve only material pertinent to the subject. The metric system shall be used. SI units are recommended. Rarely used physical values, symbols and units should be explained at their fi rst appearance in the text. Formulas should be written by using Equation Editor (program for writing formulas in MS Word). Units shall be written in normal (upright) letters, physical symbols and factors in italics. Formulas shall be consecutively numbered with Arabic numerals in parenthesis (e.g. (1)) at the end of the line.
The number of fi gures shall be limited to those absolutely necessary for clarifi cation of the text. The same information must not be presented in both a table and a fi gure. Figures and tables should be numbered separately with Arabic numerals, and should be referred to in the text with clear remarks (“Table 1” or “Figure 1”). Titles, headings, legends and all the other text in fi gures and tables should be written in both Croatian and English.Figures should be inserted into the text. They should be of 600 dpi resolution, black and white (color photographs only on request and extra charged), in jpg or tiff format, completely clear and understandable without reference to the text of the contribution. All graphs and tables shall be black and white (unless requested otherwise with additional payment). Tables and graphs should be inserted into the text in their original format in order to insert them subsequently into the Croatian version. If this is not possible, original document should be sent in the format in which it was made (excel or statistica format).The captions to fi gures and drawings shall not be written in block letters. Line drawings and graphs should conform to the style of the journal (font size and appearance). Letters and numbers shall be suffi ciently large to be readily legible after reduction of the width of a fi gure or table. Photomicrographs should have a mark indicating magnifi cation, preferably in micrometers. Magnifi cation can be additionally indicated at the end of the fi gure title, e.g. “Mag. 7500:1”.Discussion and conclusion may, if desired by authors, be combined into one chapter. This text should interpret the results relating to the problem outlined in the introduction and to related observations by the author(s) or other researchers. Repeating the data already presented in the “Results” chapter should be avoided. Implications for further studies or application may be discussed. A conclusion shall be expressed separately if results and discussion are combined in the same chapter. Acknowledgements are presented at the end of the paper. Relevant literature shall be cited in the text according to the Harvard system (“name – year”), e.g. (Bađun, 1965). In addition, the bibliography shall be listed at the end of the text in alphabetical order of the author’s names, together with the title and full quotation of the bibliographical reference. The list of references shall be selective, and each reference shall have its DOI number (http://www.doi.org) (check at http://www.crossref.org).:
Example of referencesJournal articles: Author’s second name, initial(s) of the fi rst name, year: Title. Journal name, volume (ev. issue): pages (from - to). DOI number.Example:Kärki, T., 2001: Variation of wood density and shrinkage in European aspen (Populus tremula). Holz als Roh- und Werkstoff, 59: 79-84. http://dx.doi.org/10.1007/s001070050479.Books: Author’s second name, initial(s) of the fi rst name, year: Title. (ev. Publisher/editor): edition, (ev. volume). Place of publishing, publisher (ev. pages from - to). Examples:Krpan, J. 1970: Tehnologija furnira i ploča. Drugo izdanje. Zagreb: Tehnička knjiga.Wilson, J.W.; Wellwood, R.W. 1965: Intra-increment chemical properties of certain western Canadian coniferous species. U: W. A. Cote, Jr. (Ed.): Cellular Ultrastructure of Woody Plants. Syracuse, N.Y., Syracuse Univ. Press, pp. 551-559.Other publications (brochures, studies, etc.):Müller, D. 1977: Beitrag zur Klassifi zierung asiatischer Baumarten. Mitteilung der Bundesforschungsanslalt für Forst- und Holzwirtschaft Hamburg, Nr. 98. Hamburg: M. Wiederbusch.Websites:***1997: “Guide to Punctuation” (online), University of Sussex, www.informatics.sussex.ac.uk/department/docs/punctuation/node 00.html. First published 1997 (Accessed Jan. 27, 2010).The paper will be sent to the author in pdf format before printing. The paper should be carefully corrected and sent back to the Editor’s Offi ce with the list of corrections made and the form for the transfer of copyrights from the author to the publisher. Corrections should be limited to printing errors; amendments to or changes in the text will be charged. Each contributor will receive 1 copy of the journal. Further information on the way of writing scientifi c papers can be found on the following website:www.ease.org.uk/publications/author-guidelines