Embed Size (px)
Citation preview
VITICULTURE SITE SUITABILTY
NAME: AJAYI OLUWADAMILARE O. NUMBER: 2141139 FLINDERS UNIVERSITY TOPIC: GEOG 8702
Abstract The wine industry is very important to the country’s economy (Australia) and the Barossa Valley, been the largest wine producing district in Australia is a major part accounting for over 75% of this. With the recent advance in remote sensing, there has been steady interest in its potential application for vineyard mapping among others. The combination of remote sensing (RS) and criteria modelling gives a capable spatial decision help system that offers the chance to productively create these suitability land maps. Undoubtedly, RS is a capable device for examining spatial information and establishing a procedure for decision making. In this report, the multi-criteria modelling for the expansion of viticulture in the Barossa valley are been examined through the use of RS to locate areas potentially suitable for the expansion of viticulture and Geographical information science (GIS) to create a suitability map. This RS analysis can help in a wide range to determine the potentially suitable locations for expansion of viticulture in the area.
1

Image Analysis in Remote Sensing Practical 4 Reports: Identification of potentially suitable areas for the expansion of viticulture in the Barossa Valley environs using Criteria Modelling
TABLE OF CONTENTS
1.0 Introduction…………………………………………………………………………………….3
2.0 Methods…………………………………………………………………………………………3
3.0 Results………………………………………………………………………………………….14
4.0 Discussions…………………………………………………………………………………….14
5.0 Summary……………………………………………………………………………………….15
6.0 References……………………………………………………………………………….……..15
7.0 Appendices……………………………………………………………………………………..17
2
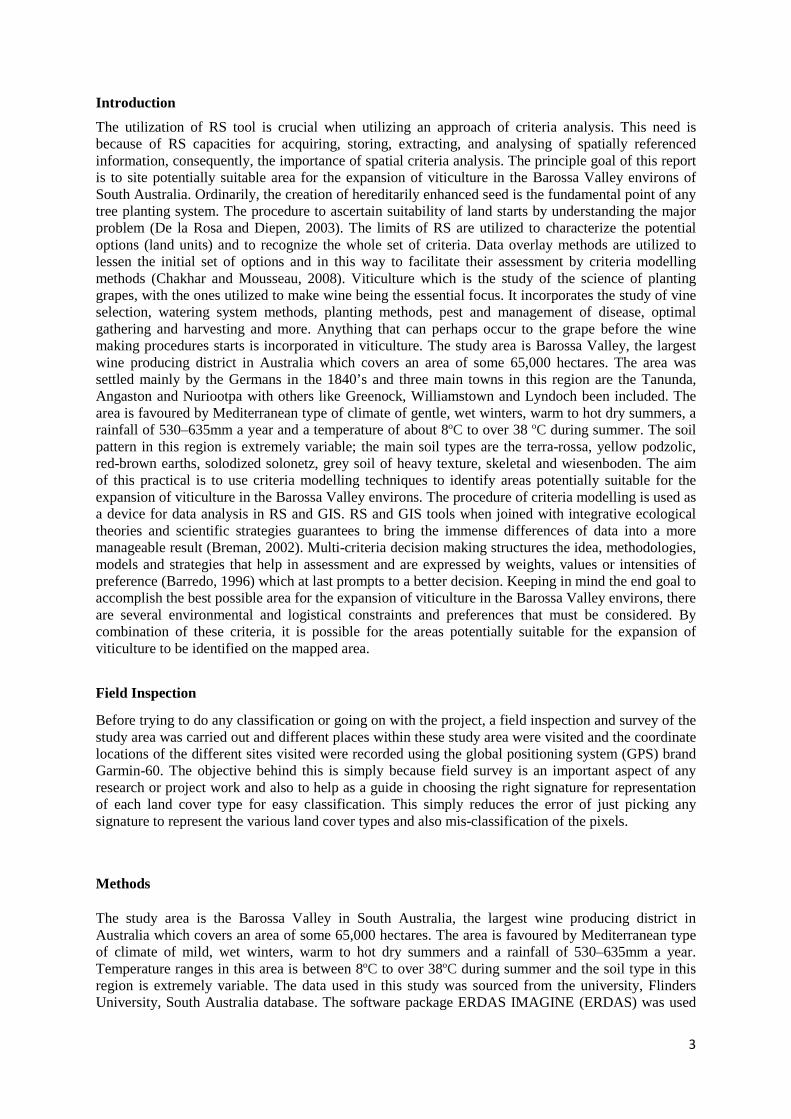
Introduction The utilization of RS tool is crucial when utilizing an approach of criteria analysis. This need is because of RS capacities for acquiring, storing, extracting, and analysing of spatially referenced information, consequently, the importance of spatial criteria analysis. The principle goal of this report is to site potentially suitable area for the expansion of viticulture in the Barossa Valley environs of South Australia. Ordinarily, the creation of hereditarily enhanced seed is the fundamental point of any tree planting system. The procedure to ascertain suitability of land starts by understanding the major problem (De la Rosa and Diepen, 2003). The limits of RS are utilized to characterize the potential options (land units) and to recognize the whole set of criteria. Data overlay methods are utilized to lessen the initial set of options and in this way to facilitate their assessment by criteria modelling methods (Chakhar and Mousseau, 2008). Viticulture which is the study of the science of planting grapes, with the ones utilized to make wine being the essential focus. It incorporates the study of vine selection, watering system methods, planting methods, pest and management of disease, optimal gathering and harvesting and more. Anything that can perhaps occur to the grape before the wine making procedures starts is incorporated in viticulture. The study area is Barossa Valley, the largest wine producing district in Australia which covers an area of some 65,000 hectares. The area was settled mainly by the Germans in the 1840’s and three main towns in this region are the Tanunda, Angaston and Nuriootpa with others like Greenock, Williamstown and Lyndoch been included. The area is favoured by Mediterranean type of climate of gentle, wet winters, warm to hot dry summers, a rainfall of 530–635mm a year and a temperature of about 8ºC to over 38 ºC during summer. The soil pattern in this region is extremely variable; the main soil types are the terra-rossa, yellow podzolic, red-brown earths, solodized solonetz, grey soil of heavy texture, skeletal and wiesenboden. The aim of this practical is to use criteria modelling techniques to identify areas potentially suitable for the expansion of viticulture in the Barossa Valley environs. The procedure of criteria modelling is used as a device for data analysis in RS and GIS. RS and GIS tools when joined with integrative ecological theories and scientific strategies guarantees to bring the immense differences of data into a more manageable result (Breman, 2002). Multi-criteria decision making structures the idea, methodologies, models and strategies that help in assessment and are expressed by weights, values or intensities of preference (Barredo, 1996) which at last prompts to a better decision. Keeping in mind the end goal to accomplish the best possible area for the expansion of viticulture in the Barossa Valley environs, there are several environmental and logistical constraints and preferences that must be considered. By combination of these criteria, it is possible for the areas potentially suitable for the expansion of viticulture to be identified on the mapped area.
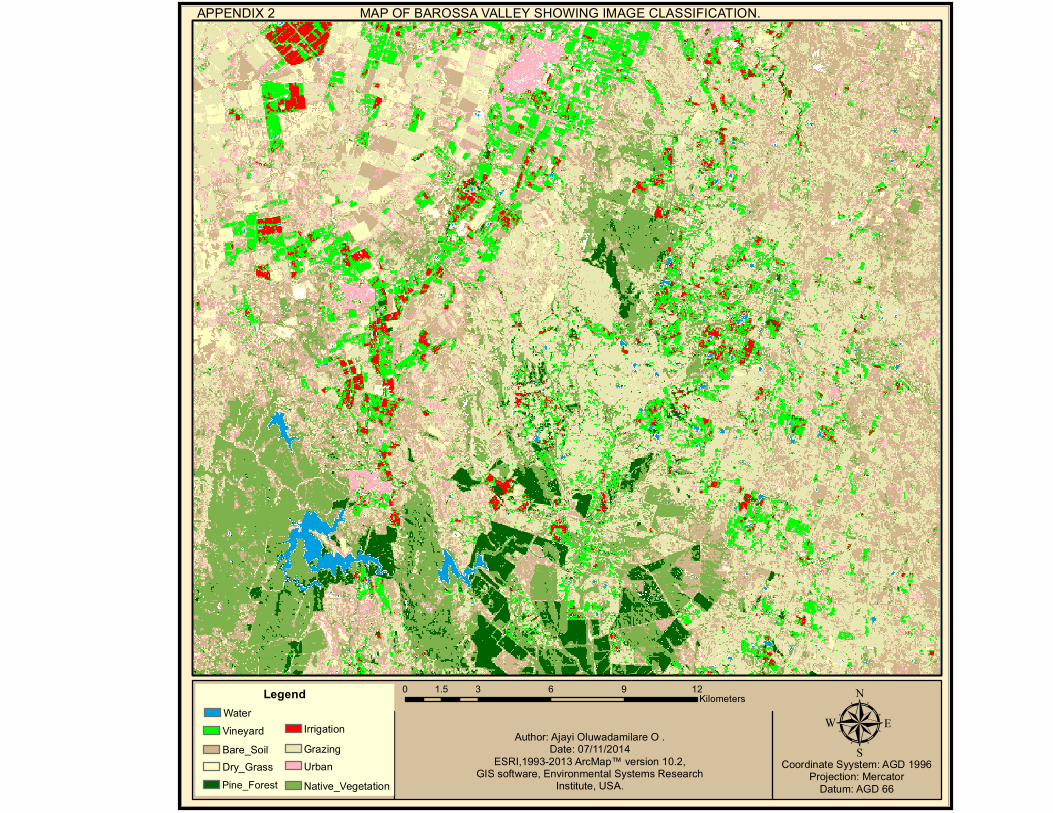
Field Inspection
Before trying to do any classification or going on with the project, a field inspection and survey of the study area was carried out and different places within these study area were visited and the coordinate locations of the different sites visited were recorded using the global positioning system (GPS) brand Garmin-60. The objective behind this is simply because field survey is an important aspect of any research or project work and also to help as a guide in choosing the right signature for representation of each land cover type for easy classification. This simply reduces the error of just picking any signature to represent the various land cover types and also mis-classification of the pixels.
Methods
The study area is the Barossa Valley in South Australia, the largest wine producing district in Australia which covers an area of some 65,000 hectares. The area is favoured by Mediterranean type of climate of mild, wet winters, warm to hot dry summers and a rainfall of 530–635mm a year. Temperature ranges in this area is between 8ºC to over 38ºC during summer and the soil type in this region is extremely variable. The data used in this study was sourced from the university, Flinders University, South Australia database. The software package ERDAS IMAGINE (ERDAS) was used
3
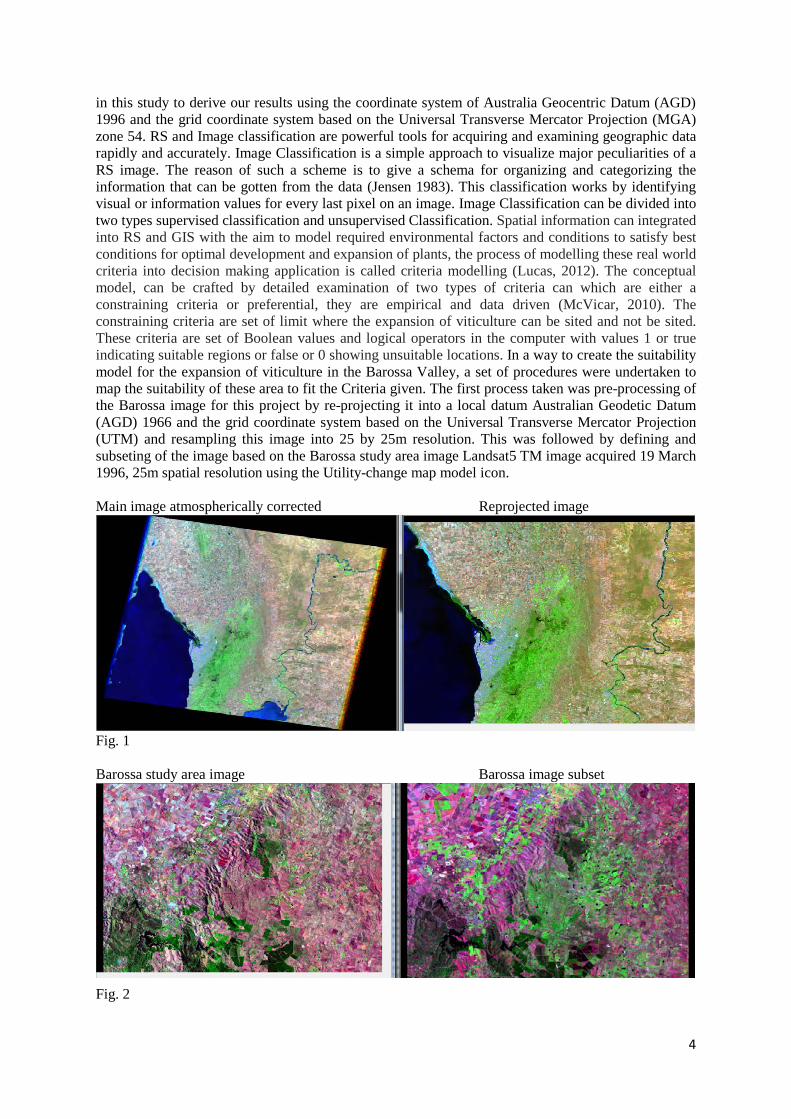
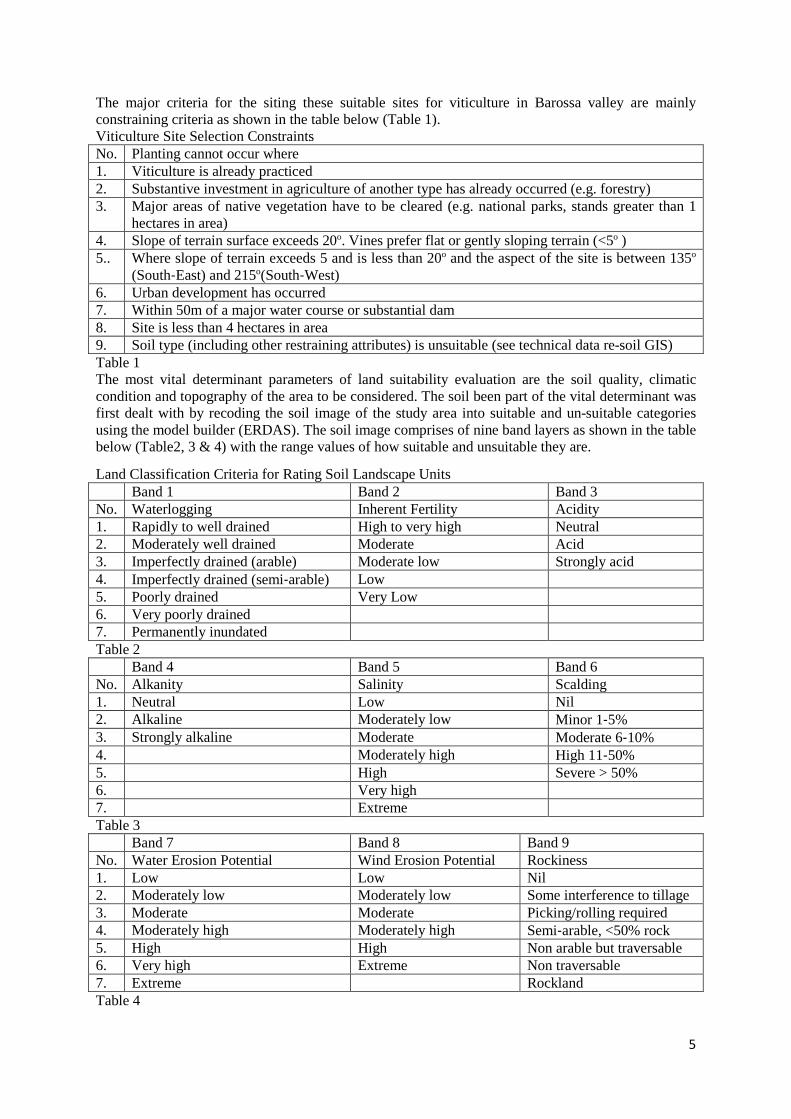
in this study to derive our results using the coordinate system of Australia Geocentric Datum (AGD) 1996 and the grid coordinate system based on the Universal Transverse Mercator Projection (MGA) zone 54. RS and Image classification are powerful tools for acquiring and examining geographic data rapidly and accurately. Image Classification is a simple approach to visualize major peculiarities of a RS image. The reason of such a scheme is to give a schema for organizing and categorizing the information that can be gotten from the data (Jensen 1983). This classification works by identifying visual or information values for every last pixel on an image. Image Classification can be divided into two types supervised classification and unsupervised Classification. Spatial information can integrated into RS and GIS with the aim to model required environmental factors and conditions to satisfy best conditions for optimal development and expansion of plants, the process of modelling these real world criteria into decision making application is called criteria modelling (Lucas, 2012). The conceptual model, can be crafted by detailed examination of two types of criteria can which are either a constraining criteria or preferential, they are empirical and data driven (McVicar, 2010). The constraining criteria are set of limit where the expansion of viticulture can be sited and not be sited. These criteria are set of Boolean values and logical operators in the computer with values 1 or true indicating suitable regions or false or 0 showing unsuitable locations. In a way to create the suitability model for the expansion of viticulture in the Barossa Valley, a set of procedures were undertaken to map the suitability of these area to fit the Criteria given. The first process taken was pre-processing of the Barossa image for this project by re-projecting it into a local datum Australian Geodetic Datum (AGD) 1966 and the grid coordinate system based on the Universal Transverse Mercator Projection (UTM) and resampling this image into 25 by 25m resolution. This was followed by defining and subseting of the image based on the Barossa study area image Landsat5 TM image acquired 19 March 1996, 25m spatial resolution using the Utility-change map model icon. Main image atmospherically corrected Reprojected image
Fig. 1 Barossa study area image Barossa image subset
Fig. 2
4
The major criteria for the siting these suitable sites for viticulture in Barossa valley are mainly constraining criteria as shown in the table below (Table 1). Viticulture Site Selection Constraints No. Planting cannot occur where 1. Viticulture is already practiced 2. Substantive investment in agriculture of another type has already occurred (e.g. forestry) 3. Major areas of native vegetation have to be cleared (e.g. national parks, stands greater than 1
hectares in area) 4. Slope of terrain surface exceeds 20º. Vines prefer flat or gently sloping terrain (<5º ) 5.. Where slope of terrain exceeds 5 and is less than 20º and the aspect of the site is between 135º
(South‐East) and 215º(South‐West) 6. Urban development has occurred 7. Within 50m of a major water course or substantial dam 8. Site is less than 4 hectares in area 9. Soil type (including other restraining attributes) is unsuitable (see technical data re-soil GIS) Table 1 The most vital determinant parameters of land suitability evaluation are the soil quality, climatic condition and topography of the area to be considered. The soil been part of the vital determinant was first dealt with by recoding the soil image of the study area into suitable and un-suitable categories using the model builder (ERDAS). The soil image comprises of nine band layers as shown in the table below (Table2, 3 & 4) with the range values of how suitable and unsuitable they are.
Land Classification Criteria for Rating Soil Landscape Units Band 1 Band 2 Band 3 No. Waterlogging Inherent Fertility Acidity 1. Rapidly to well drained High to very high Neutral 2. Moderately well drained Moderate Acid 3. Imperfectly drained (arable) Moderate low Strongly acid 4. Imperfectly drained (semi‐arable) Low 5. Poorly drained Very Low 6. Very poorly drained 7. Permanently inundated Table 2 Band 4 Band 5 Band 6 No. Alkanity Salinity Scalding 1. Neutral Low Nil 2. Alkaline Moderately low Minor 1‐5% 3. Strongly alkaline Moderate Moderate 6‐10% 4. Moderately high High 11‐50% 5. High Severe > 50% 6. Very high 7. Extreme Table 3 Band 7 Band 8 Band 9 No. Water Erosion Potential Wind Erosion Potential Rockiness 1. Low Low Nil 2. Moderately low Moderately low Some interference to tillage 3. Moderate Moderate Picking/rolling required 4. Moderately high Moderately high Semi‐arable, <50% rock 5. High High Non arable but traversable 6. Very high Extreme Non traversable 7. Extreme Rockland Table 4
5
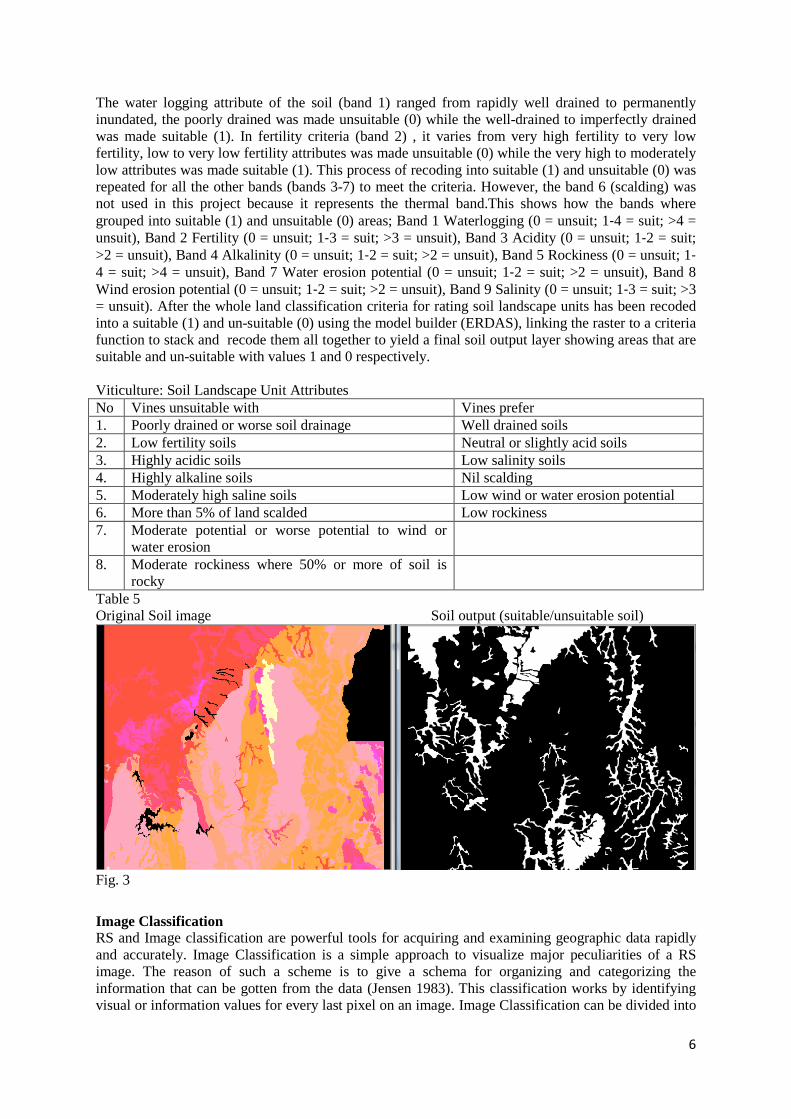
The water logging attribute of the soil (band 1) ranged from rapidly well drained to permanently inundated, the poorly drained was made unsuitable (0) while the well-drained to imperfectly drained was made suitable (1). In fertility criteria (band 2) , it varies from very high fertility to very low fertility, low to very low fertility attributes was made unsuitable (0) while the very high to moderately low attributes was made suitable (1). This process of recoding into suitable (1) and unsuitable (0) was repeated for all the other bands (bands 3-7) to meet the criteria. However, the band 6 (scalding) was not used in this project because it represents the thermal band.This shows how the bands where grouped into suitable (1) and unsuitable (0) areas; Band 1 Waterlogging (0 = unsuit; 1‐4 = suit; >4 = unsuit), Band 2 Fertility (0 = unsuit; 1‐3 = suit; >3 = unsuit), Band 3 Acidity (0 = unsuit; 1‐2 = suit; >2 = unsuit), Band 4 Alkalinity (0 = unsuit; 1‐2 = suit; >2 = unsuit), Band 5 Rockiness (0 = unsuit; 1‐4 = suit; >4 = unsuit), Band 7 Water erosion potential (0 = unsuit; 1‐2 = suit; >2 = unsuit), Band 8 Wind erosion potential (0 = unsuit; 1‐2 = suit; >2 = unsuit), Band 9 Salinity (0 = unsuit; 1‐3 = suit; >3 = unsuit). After the whole land classification criteria for rating soil landscape units has been recoded into a suitable (1) and un-suitable (0) using the model builder (ERDAS), linking the raster to a criteria function to stack and recode them all together to yield a final soil output layer showing areas that are suitable and un-suitable with values 1 and 0 respectively. Viticulture: Soil Landscape Unit Attributes No Vines unsuitable with Vines prefer 1. Poorly drained or worse soil drainage Well drained soils 2. Low fertility soils Neutral or slightly acid soils 3. Highly acidic soils Low salinity soils 4. Highly alkaline soils Nil scalding 5. Moderately high saline soils Low wind or water erosion potential 6. More than 5% of land scalded Low rockiness 7. Moderate potential or worse potential to wind or
water erosion
8. Moderate rockiness where 50% or more of soil is rocky
Table 5 Original Soil image Soil output (suitable/unsuitable soil)
Fig. 3
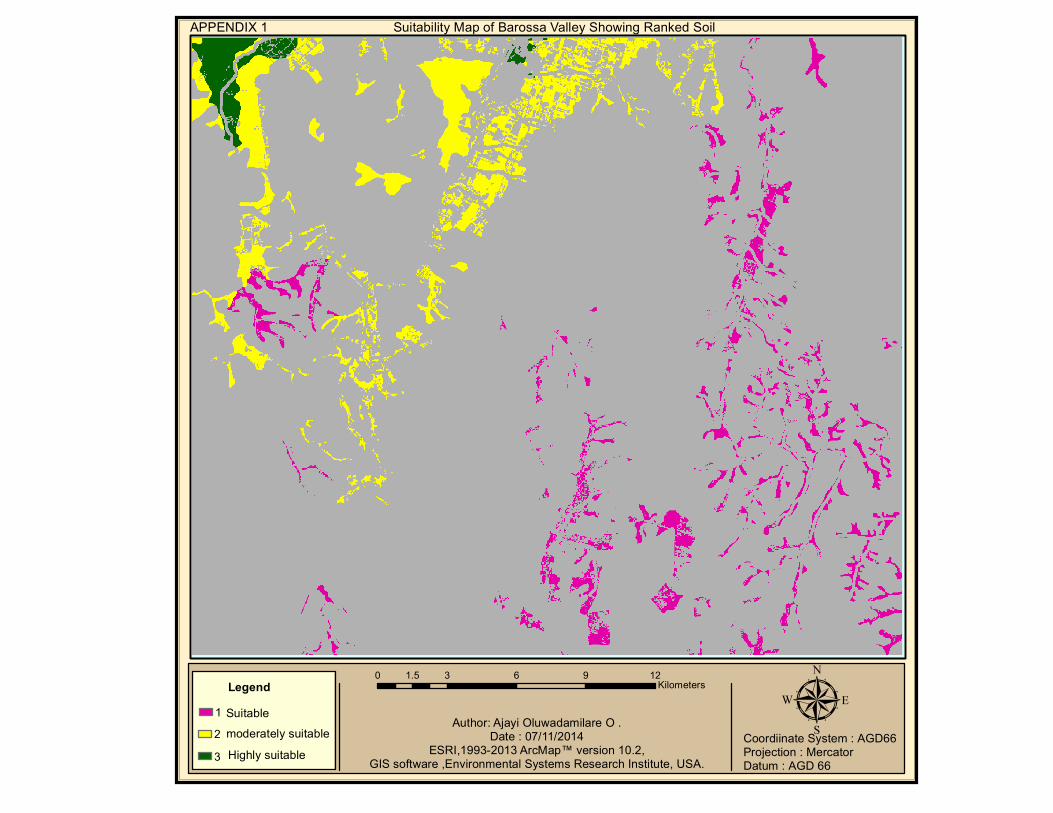
Image Classification RS and Image classification are powerful tools for acquiring and examining geographic data rapidly and accurately. Image Classification is a simple approach to visualize major peculiarities of a RS image. The reason of such a scheme is to give a schema for organizing and categorizing the information that can be gotten from the data (Jensen 1983). This classification works by identifying visual or information values for every last pixel on an image. Image Classification can be divided into
6
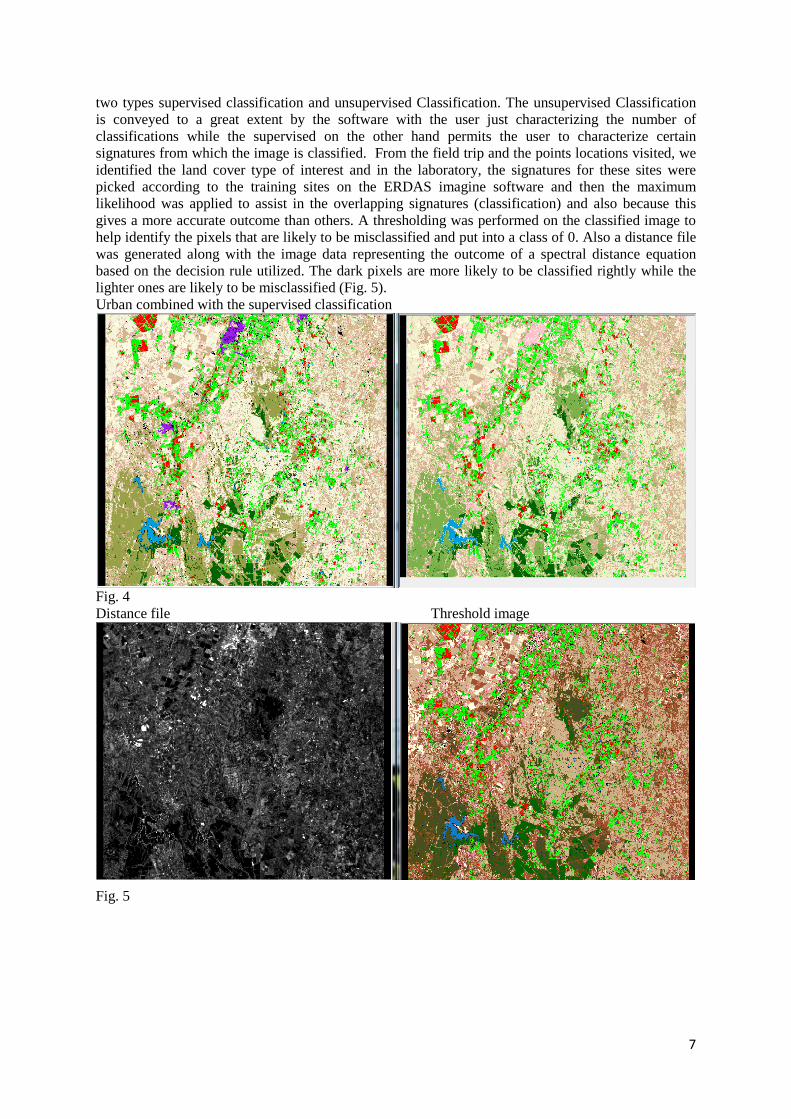
two types supervised classification and unsupervised Classification. The unsupervised Classification is conveyed to a great extent by the software with the user just characterizing the number of classifications while the supervised on the other hand permits the user to characterize certain signatures from which the image is classified. From the field trip and the points locations visited, we identified the land cover type of interest and in the laboratory, the signatures for these sites were picked according to the training sites on the ERDAS imagine software and then the maximum likelihood was applied to assist in the overlapping signatures (classification) and also because this gives a more accurate outcome than others. A thresholding was performed on the classified image to help identify the pixels that are likely to be misclassified and put into a class of 0. Also a distance file was generated along with the image data representing the outcome of a spectral distance equation based on the decision rule utilized. The dark pixels are more likely to be classified rightly while the lighter ones are likely to be misclassified (Fig. 5). Urban combined with the supervised classification
Fig. 4 Distance file Threshold image
Fig. 5
7
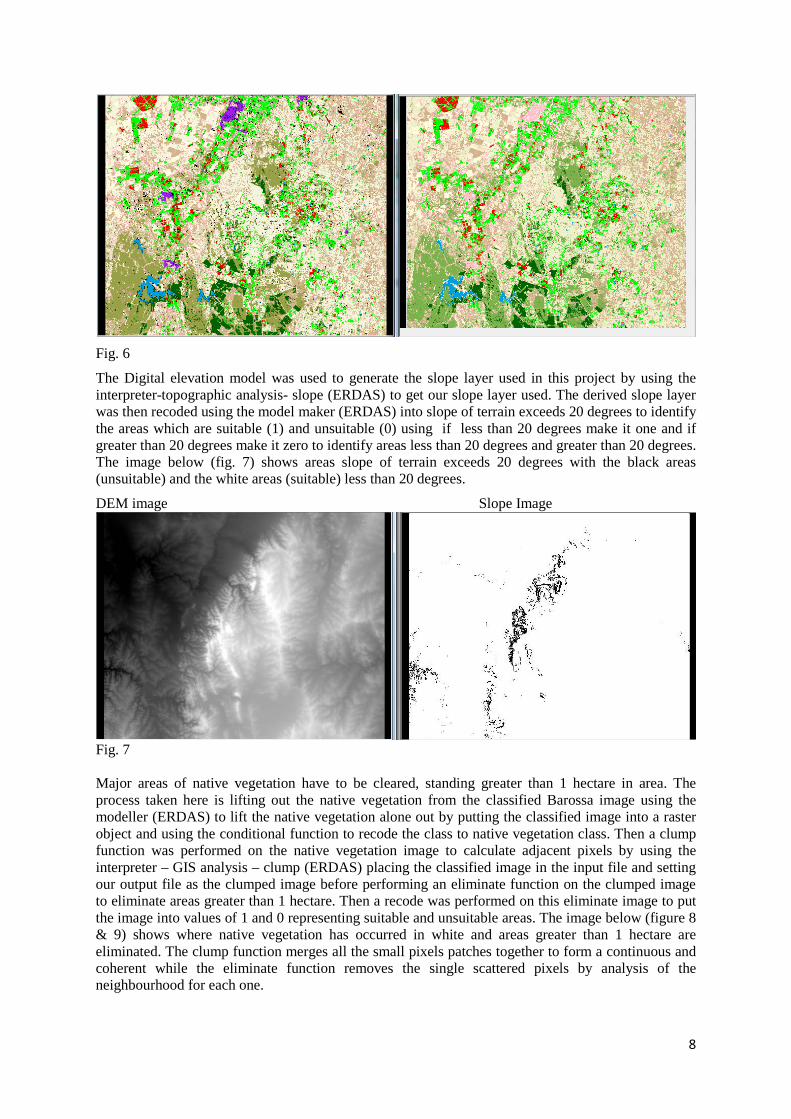
Fig. 6
The Digital elevation model was used to generate the slope layer used in this project by using the interpreter-topographic analysis- slope (ERDAS) to get our slope layer used. The derived slope layer was then recoded using the model maker (ERDAS) into slope of terrain exceeds 20 degrees to identify the areas which are suitable (1) and unsuitable (0) using if less than 20 degrees make it one and if greater than 20 degrees make it zero to identify areas less than 20 degrees and greater than 20 degrees. The image below (fig. 7) shows areas slope of terrain exceeds 20 degrees with the black areas (unsuitable) and the white areas (suitable) less than 20 degrees.
DEM image Slope Image
Fig. 7 Major areas of native vegetation have to be cleared, standing greater than 1 hectare in area. The process taken here is lifting out the native vegetation from the classified Barossa image using the modeller (ERDAS) to lift the native vegetation alone out by putting the classified image into a raster object and using the conditional function to recode the class to native vegetation class. Then a clump function was performed on the native vegetation image to calculate adjacent pixels by using the interpreter – GIS analysis – clump (ERDAS) placing the classified image in the input file and setting our output file as the clumped image before performing an eliminate function on the clumped image to eliminate areas greater than 1 hectare. Then a recode was performed on this eliminate image to put the image into values of 1 and 0 representing suitable and unsuitable areas. The image below (figure 8 & 9) shows where native vegetation has occurred in white and areas greater than 1 hectare are eliminated. The clump function merges all the small pixels patches together to form a continuous and coherent while the eliminate function removes the single scattered pixels by analysis of the neighbourhood for each one.
8
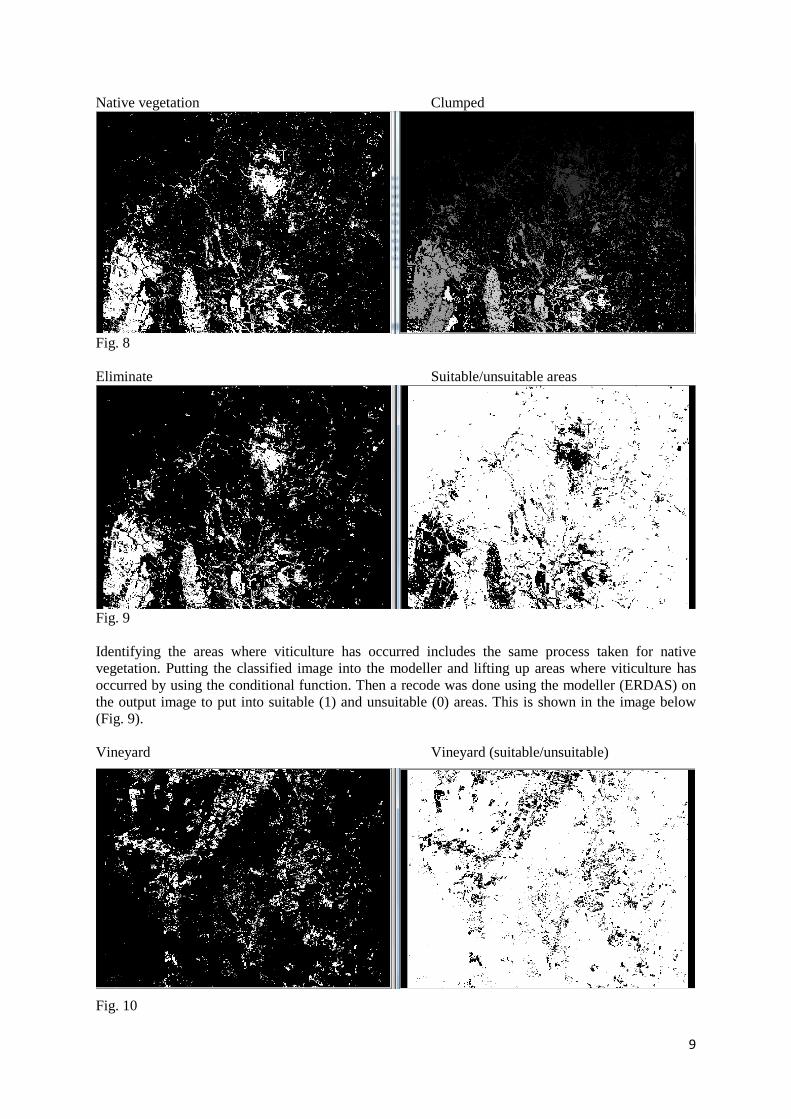
Native vegetation Clumped
Fig. 8 Eliminate Suitable/unsuitable areas
Fig. 9 Identifying the areas where viticulture has occurred includes the same process taken for native vegetation. Putting the classified image into the modeller and lifting up areas where viticulture has occurred by using the conditional function. Then a recode was done using the modeller (ERDAS) on the output image to put into suitable (1) and unsuitable (0) areas. This is shown in the image below (Fig. 9). Vineyard Vineyard (suitable/unsuitable)
Fig. 10
9
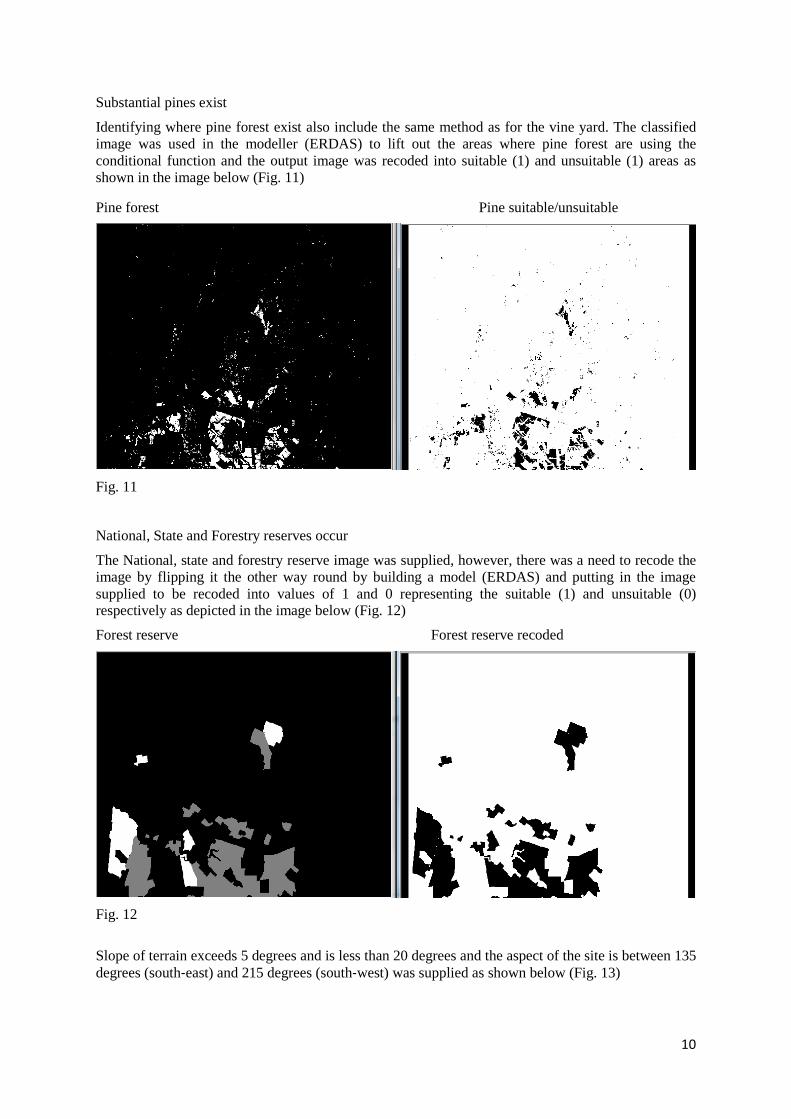
Substantial pines exist
Identifying where pine forest exist also include the same method as for the vine yard. The classified image was used in the modeller (ERDAS) to lift out the areas where pine forest are using the conditional function and the output image was recoded into suitable (1) and unsuitable (1) areas as shown in the image below (Fig. 11)
Pine forest Pine suitable/unsuitable
Fig. 11
National, State and Forestry reserves occur
The National, state and forestry reserve image was supplied, however, there was a need to recode the image by flipping it the other way round by building a model (ERDAS) and putting in the image supplied to be recoded into values of 1 and 0 representing the suitable (1) and unsuitable (0) respectively as depicted in the image below (Fig. 12)
Forest reserve Forest reserve recoded
Fig. 12
Slope of terrain exceeds 5 degrees and is less than 20 degrees and the aspect of the site is between 135 degrees (south‐east) and 215 degrees (south‐west) was supplied as shown below (Fig. 13)
10
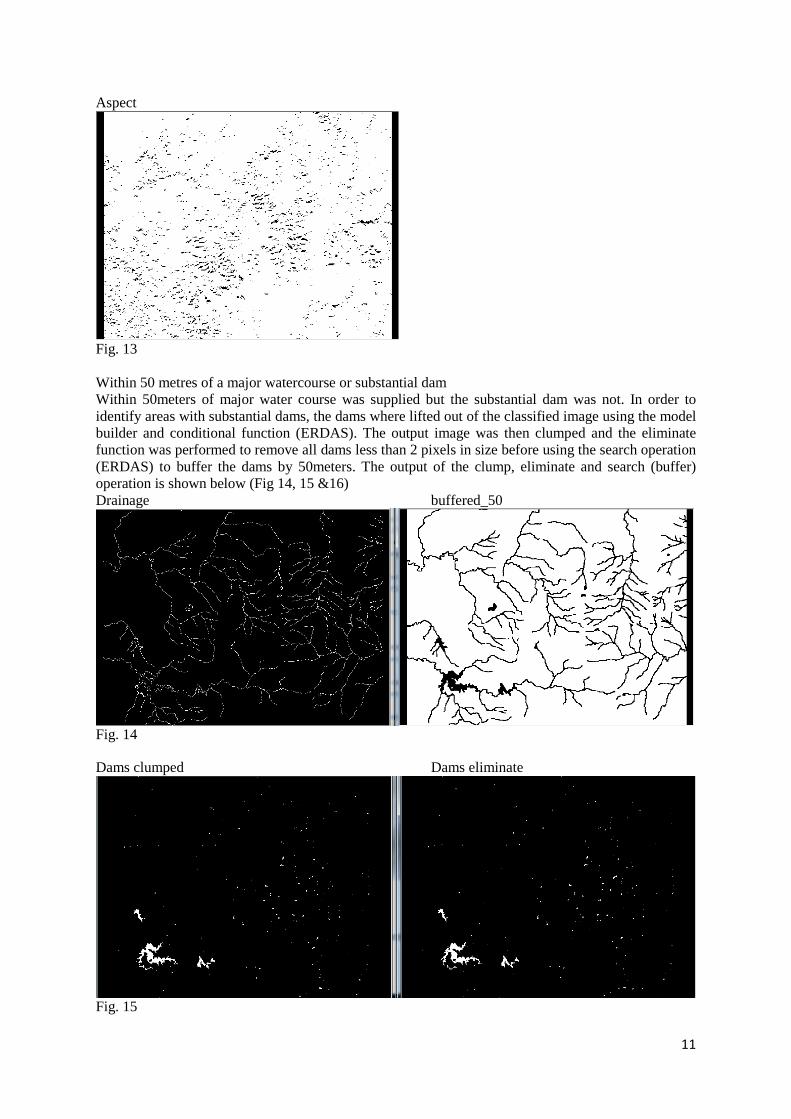
Aspect
Fig. 13 Within 50 metres of a major watercourse or substantial dam Within 50meters of major water course was supplied but the substantial dam was not. In order to identify areas with substantial dams, the dams where lifted out of the classified image using the model builder and conditional function (ERDAS). The output image was then clumped and the eliminate function was performed to remove all dams less than 2 pixels in size before using the search operation (ERDAS) to buffer the dams by 50meters. The output of the clump, eliminate and search (buffer) operation is shown below (Fig 14, 15 &16) Drainage buffered_50
Fig. 14
Dams clumped Dams eliminate
Fig. 15
11
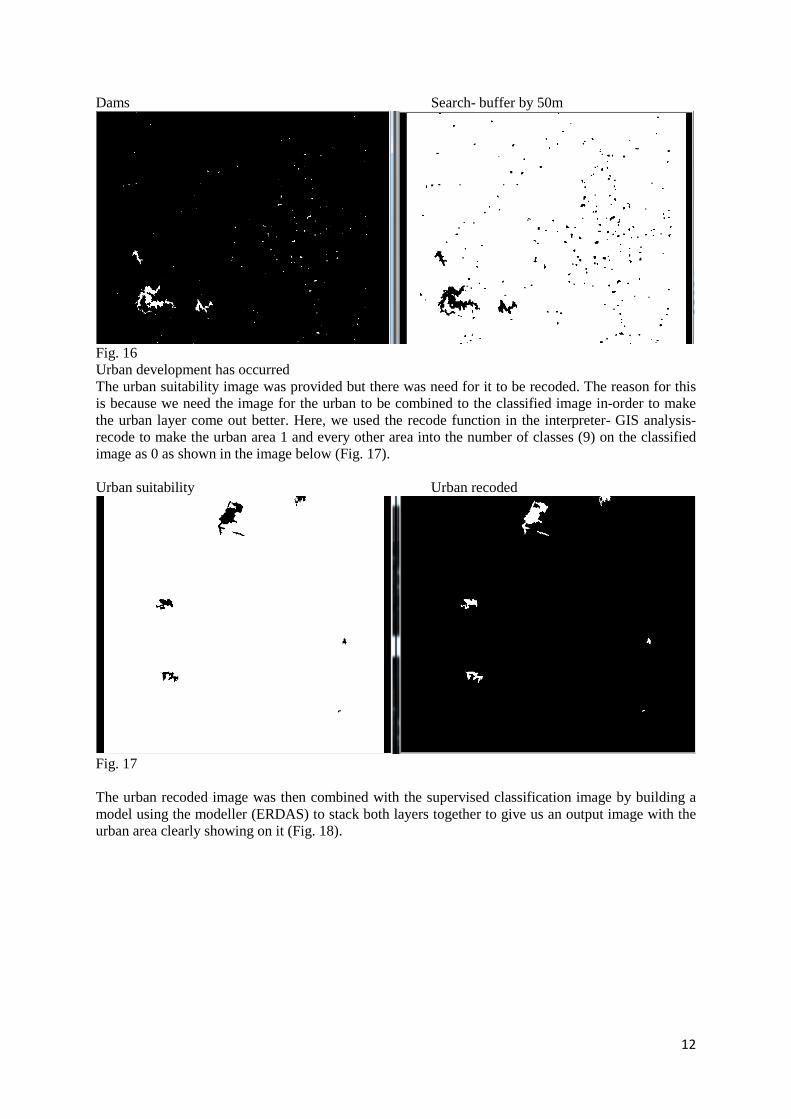
Dams Search- buffer by 50m
Fig. 16 Urban development has occurred The urban suitability image was provided but there was need for it to be recoded. The reason for this is because we need the image for the urban to be combined to the classified image in-order to make the urban layer come out better. Here, we used the recode function in the interpreter- GIS analysis- recode to make the urban area 1 and every other area into the number of classes (9) on the classified image as 0 as shown in the image below (Fig. 17). Urban suitability Urban recoded
Fig. 17 The urban recoded image was then combined with the supervised classification image by building a model using the modeller (ERDAS) to stack both layers together to give us an output image with the urban area clearly showing on it (Fig. 18).
12
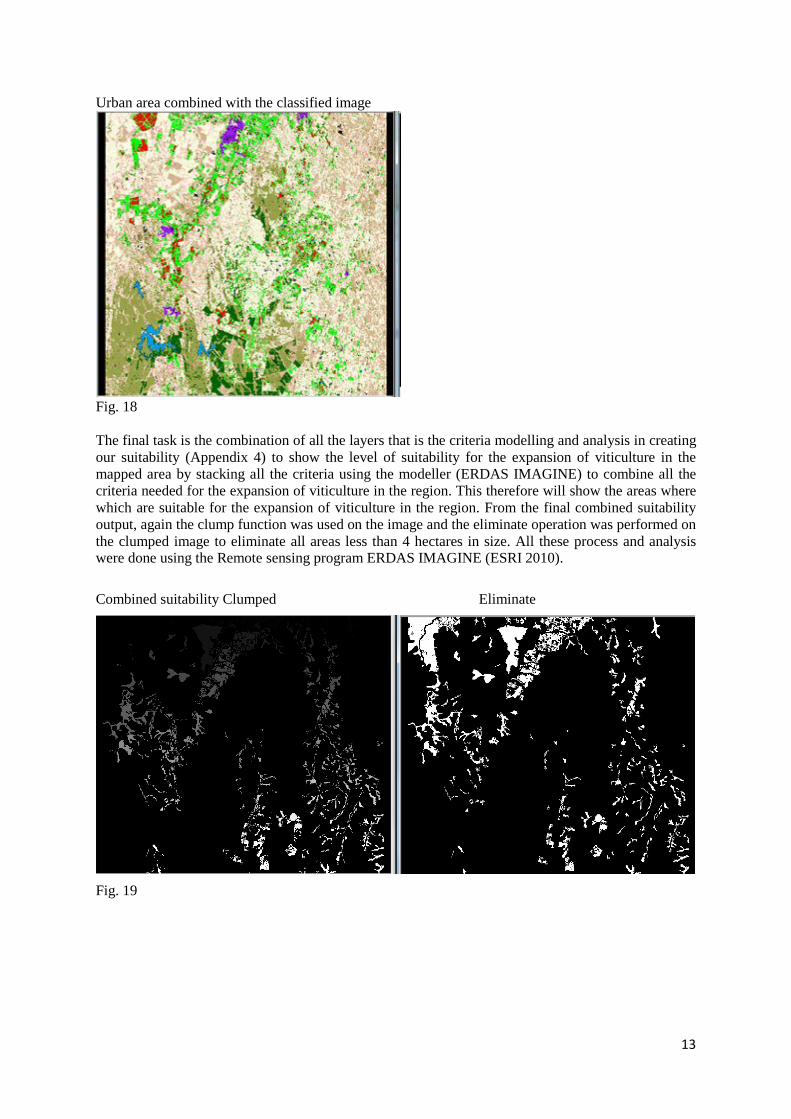
Urban area combined with the classified image
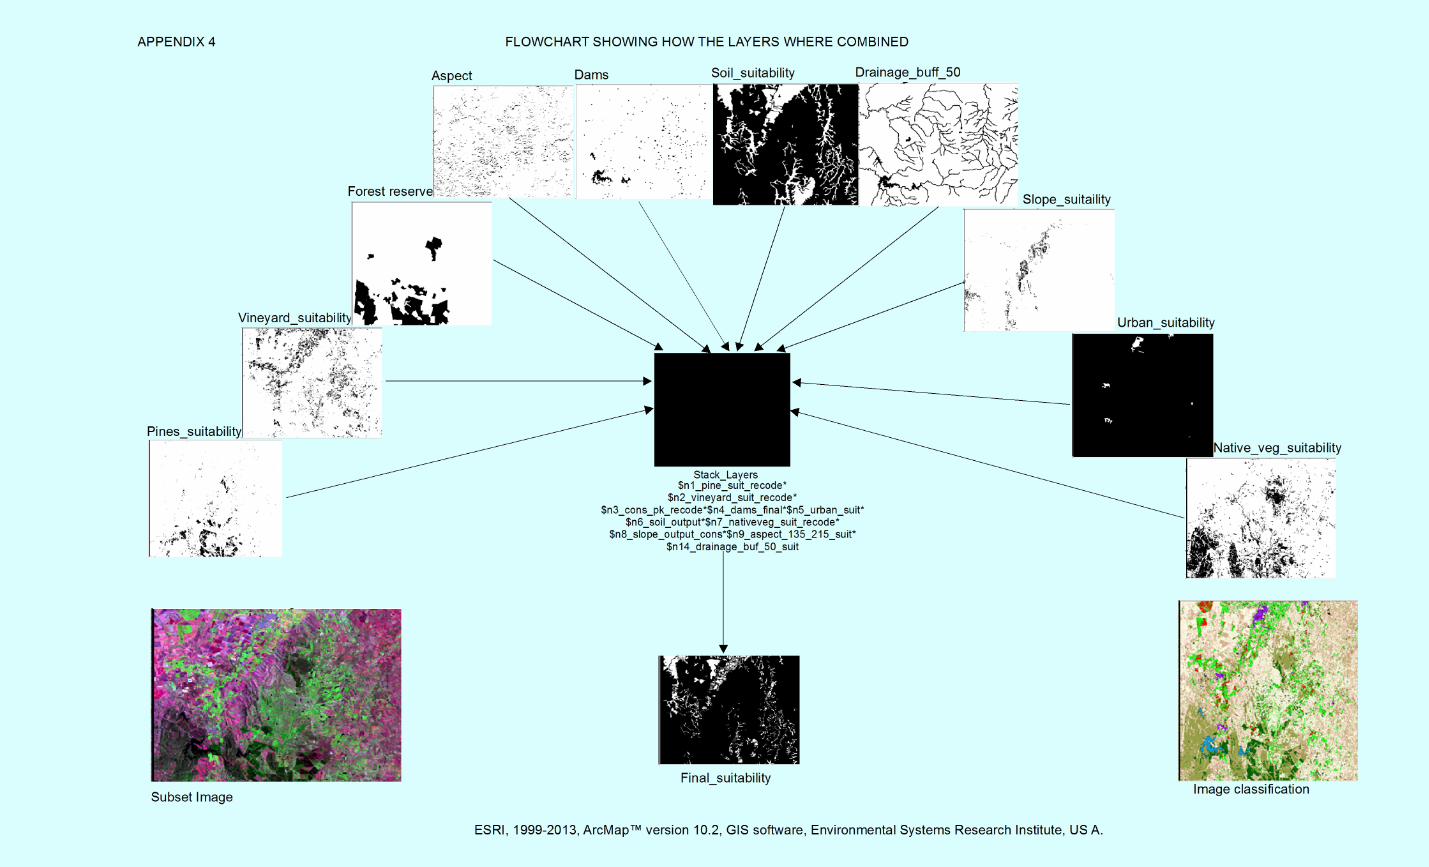
Fig. 18 The final task is the combination of all the layers that is the criteria modelling and analysis in creating our suitability (Appendix 4) to show the level of suitability for the expansion of viticulture in the mapped area by stacking all the criteria using the modeller (ERDAS IMAGINE) to combine all the criteria needed for the expansion of viticulture in the region. This therefore will show the areas where which are suitable for the expansion of viticulture in the region. From the final combined suitability output, again the clump function was used on the image and the eliminate operation was performed on the clumped image to eliminate all areas less than 4 hectares in size. All these process and analysis were done using the Remote sensing program ERDAS IMAGINE (ESRI 2010).
Combined suitability Clumped Eliminate
Fig. 19
13
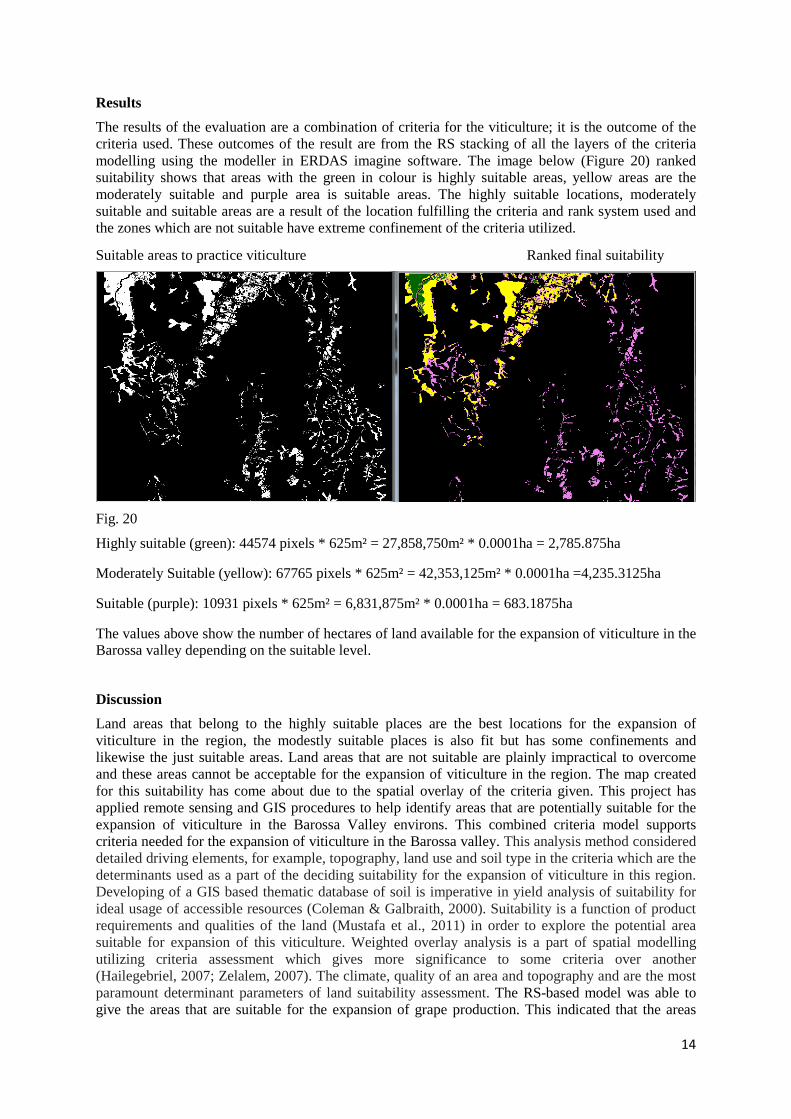
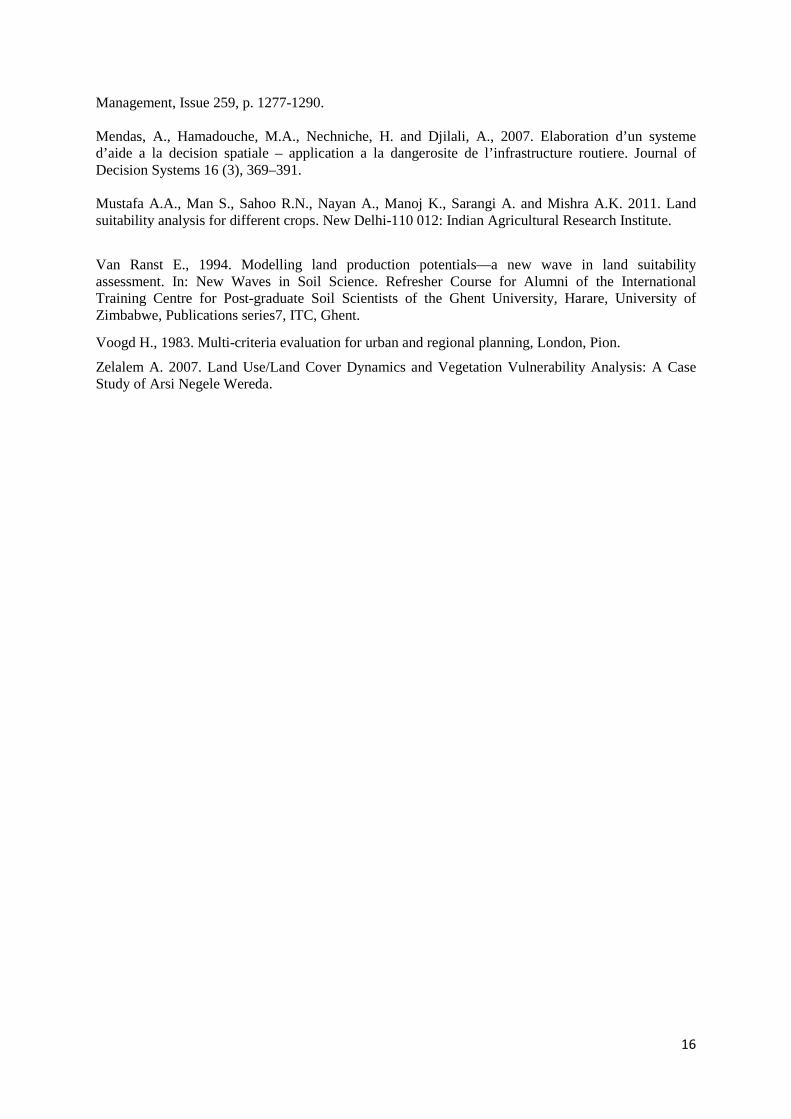
Results The results of the evaluation are a combination of criteria for the viticulture; it is the outcome of the criteria used. These outcomes of the result are from the RS stacking of all the layers of the criteria modelling using the modeller in ERDAS imagine software. The image below (Figure 20) ranked suitability shows that areas with the green in colour is highly suitable areas, yellow areas are the moderately suitable and purple area is suitable areas. The highly suitable locations, moderately suitable and suitable areas are a result of the location fulfilling the criteria and rank system used and the zones which are not suitable have extreme confinement of the criteria utilized.
Suitable areas to practice viticulture Ranked final suitability
Fig. 20
Highly suitable (green): 44574 pixels * 625m² = 27,858,750m² * 0.0001ha = 2,785.875ha
Moderately Suitable (yellow): 67765 pixels * 625m² = 42,353,125m² * 0.0001ha =4,235.3125ha
Suitable (purple): 10931 pixels * 625m² = 6,831,875m² * 0.0001ha = 683.1875ha
The values above show the number of hectares of land available for the expansion of viticulture in the Barossa valley depending on the suitable level.
Discussion Land areas that belong to the highly suitable places are the best locations for the expansion of viticulture in the region, the modestly suitable places is also fit but has some confinements and likewise the just suitable areas. Land areas that are not suitable are plainly impractical to overcome and these areas cannot be acceptable for the expansion of viticulture in the region. The map created for this suitability has come about due to the spatial overlay of the criteria given. This project has applied remote sensing and GIS procedures to help identify areas that are potentially suitable for the expansion of viticulture in the Barossa Valley environs. This combined criteria model supports criteria needed for the expansion of viticulture in the Barossa valley. This analysis method considered detailed driving elements, for example, topography, land use and soil type in the criteria which are the determinants used as a part of the deciding suitability for the expansion of viticulture in this region. Developing of a GIS based thematic database of soil is imperative in yield analysis of suitability for ideal usage of accessible resources (Coleman & Galbraith, 2000). Suitability is a function of product requirements and qualities of the land (Mustafa et al., 2011) in order to explore the potential area suitable for expansion of this viticulture. Weighted overlay analysis is a part of spatial modelling utilizing criteria assessment which gives more significance to some criteria over another (Hailegebriel, 2007; Zelalem, 2007). The climate, quality of an area and topography and are the most paramount determinant parameters of land suitability assessment. The RS-based model was able to give the areas that are suitable for the expansion of grape production. This indicated that the areas
14
suitable are acceptable in the case where all the criteria were met. Nine constraints were identified and taken into account using GIS and remote sensing procedures to enable site selections. Results were arrived at by calculating each ranked areas in hectares and using maps (Appendix 1) to show areas where viticulture can be practiced. Most of the highly suitable areas are located in the northern and northwest part of the study area.
Summary This report has discussed the suitable criteria for locating the expansion of viticulture in the Barossa Valley region and also the various techniques and procedures used to extract and analyse the decision for the mapped area. The potentially suitable locations are a result of the area fulfilling the criteria and zones which are not suitable have extreme confinement of the criteria utilized. This report has however, discussed the suitable criteria for locating the expansion of viticulture in the region and also the various techniques and procedures used to extract and analyse the decision for the area. The obtained results from this study affirm that remote sensing and multi-criteria assessment methods proved to be effective tools for the identification of suitable areas for the expansion of viticulture.
Reference Chakhar, S. and Mousseau, V., 2008. Multicriteria spatial decision support systems. In: Shekhar, S., Xiong, H. (Eds.), Encyclopedia of Geographical Information Science, vol. 6. Springer, pp. 753–758. Coleman A.L. & Galbraith J.M. 2000. Using GIS as an Agricultural Land Use Planning Tool. Bulletin No. 2, Department of Crop and Soil Environmental Science, Virginia Tech., Blacksburg, Virginia. ERDAS Inc., 1999. ERDAS field guide, Fifth Edition, Revised and Expanded. ERDAS, Inc. Atlanta, GA.
De la Rosa and Diepen V., 2003. Qualitative and quantitative land evaluation. In: Verhey, W. (Ed.), Land Use and Land Cover, Encyclopedia in Life Support System (EOLESS-UNESCO). Eolss, Oxford.
FAO, 1989. Evaluation des Terres pour l’Agriculture Irriguee: Directives, Bulletin Pedologique de la FAO, Rome. Grunwald S., 2009. Multi-criteria characterization of recent digital soil mapping and modelling approaches. Geoderma, Issue 152, p. 195-207.
Hailegebriel S. 2007. Irrigation Potential Evaluation and Crop Suitability Analysis using GIS and Remote Sensing Technique in Beles sub Basin, Beneshangul Gumez region. Jensen, John R., et al. 1983. “Urban/Suburban Land Use Analysis.” Chapter 30 in Manual of Remote Sensing, edited by Robert N. Colwell. Falls Church, Virginia: American Society of Photogrammetry.
Jones C. 1997. Geographical Information Systems and Computer Cartography.
Lucas C., 2012. Multi-criteria modelling and clustering of spatial information. International Journal of Geographical Information Science, 26 (10).
Lillesand T.M. & Keifer R. W. (1994) Remote Sensing and Image Interpretation, 3rd edition.
Mather, P. 1999. Computer Processing of Remotely-Sensed Images: An Introduction, 2nd edition.
Malczewski J. 1999. GIS and Multi-criteria Decision Analysis. Wiley, New York, USA.
McVicar T. R. 2010. Parsimoniously modelling perennial vegetation suitability. Forest Ecology and
15
Management, Issue 259, p. 1277-1290. Mendas, A., Hamadouche, M.A., Nechniche, H. and Djilali, A., 2007. Elaboration d’un systeme d’aide a la decision spatiale – application a la dangerosite de l’infrastructure routiere. Journal of Decision Systems 16 (3), 369–391. Mustafa A.A., Man S., Sahoo R.N., Nayan A., Manoj K., Sarangi A. and Mishra A.K. 2011. Land suitability analysis for different crops. New Delhi-110 012: Indian Agricultural Research Institute.
Van Ranst E., 1994. Modelling land production potentials—a new wave in land suitability assessment. In: New Waves in Soil Science. Refresher Course for Alumni of the International Training Centre for Post-graduate Soil Scientists of the Ghent University, Harare, University of Zimbabwe, Publications series7, ITC, Ghent.
Voogd H., 1983. Multi-criteria evaluation for urban and regional planning, London, Pion.
Zelalem A. 2007. Land Use/Land Cover Dynamics and Vegetation Vulnerability Analysis: A Case Study of Arsi Negele Wereda.
16
Coordiin ate System : AGD66Projection : MercatorDatum : AGD 66
µ
APPENDIX 1 Suitability Map of Barossa V alley Show in g Ran k ed Soil
Author: Ajayi Oluw adam ilare O .Date : 07/11/2014
ESRI,1993-2013 ArcMap™ version 10.2,GIS softw are ,En viron m en tal System s Research In stitute, USA.
0 3 6 9 121.5Kilom etersLegend
123
Suitablem oderately suitableHighly suitable
LegendWate rVine yard
Native _Ve g e tationDry_GrassPine _Fore st
Irrig ationBare _S oil Grazing
Urbanµ
0 3 6 9 121.5Kilom e te rs
Coordinate S yyste m : AGD 1996Proje ction: Me rcator
Datu m : AGD 66
APPENDIX 2 MAP OF BAROS S A VALLEY S HOWING IMAGE CLAS S IFICATION.
Au th or: Ajayi Olu wadam ilare O .Date : 07/11/2014
ES RI,1993-2013 ArcMap™ ve rsion 10.2,GIS software , Environm e ntal S yste m s Re se arch
Institu te , US A.
!!!
!
!
!
!
!!
!
!
Legend! S ites visited
Conservation parkRoads
0 2.5 5 7.5 101.25Kilom eters
µAuth or: Ajayi Oluw adam ilare O .
Date : 07/11/2014ES RI,1993-2013 ArcMap™ version 10.2,
GIS softw are ,Environm ental S ystem s Research Institute, US A.
µCoordiinate S ystem : AGD66Projection : MercatorDatum : AGD 66
APPENDIX 3 MAP OF BAROS S A VALLEY S HOWING THE ROADS AND S ITES VIS ITED