Embed Size (px)
Citation preview
water
Article
Hydro-Energy Suitability of Rivers Regarding TheirHydrological and Hydrogeological Characteristics
Željko Kos 1, Bojan Ðurin 1,* , Dragana Dogancic 2 and Nikola Kranjcic 2
�����������������
Citation: Kos, Ž.; Ðurin, B.;
Dogancic, D.; Kranjcic, N.
Hydro-Energy Suitability of Rivers
Regarding Their Hydrological and
Hydrogeological Characteristics.
Water 2021, 13, 1777. https://
doi.org/10.3390/w13131777
Academic Editors: Jean-Luc Probst,
Richard C. Smardon and
Jianzhong Lu
Received: 31 May 2021
Accepted: 25 June 2021
Published: 27 June 2021
Publisher’s Note: MDPI stays neutral
with regard to jurisdictional claims in
published maps and institutional affil-
iations.
Copyright: © 2021 by the authors.
Licensee MDPI, Basel, Switzerland.
This article is an open access article
distributed under the terms and
conditions of the Creative Commons
Attribution (CC BY) license (https://
creativecommons.org/licenses/by/
4.0/).
1 Department of Civil Engineering, University North, 42000 Varaždin, Croatia; [email protected] Faculty of Geotechnical Engineering, University of Zagreb, 42000 Varaždin, Croatia;
[email protected] (D.D.); [email protected] (N.K.)* Correspondence: [email protected]; Tel.: +385-98-974-9716
Abstract: The production of electric energy from rivers by using mini, as well as micro hydroelectricpower plants, is a very promising solution, especially in rural and isolated areas. Numerous water-ways in Croatia and their hydrological and hydrogeological diversity present an opportunity, butalso a challenge, for the construction of hydroelectric power plants. Due to the complexity of thewater courses’ hydrology, as well as hydrogeological characteristics, it is very hard to determine anappropriate flow pattern (amount), which will be used as an input value for the sizing of hydroelectricpower plants. Such analysis will be provided for real case studies in Croatia with special regard topresent geological media—media with intergranular porosity (Bednja River), karst media (GornjaDobra River), and flysch media (Mirna River). Considering different geological media increases thepossibility of using the presented methodology on other locations in Croatia, as well in the world.It has been shown that the analyzed rivers definitely have potential for electric energy production,regarding the potential and kinetic river energy. The presented analysis is scientifically original, butalso shows the procedure for the determination of the hydro-energy potential of the rivers, as wellas for the sizing on the hydropower plants. Hydrology and hydrogeology analyses rounds out theusual hydro-energy analysis, which is in most cases based on basic statistical parameter analysis.
Keywords: water; energy; hydropower plant; river; flow
1. Introduction
Energy consumption is rapidly growing from year to year and the public and decisionmakers have realized the importance of switching to clean and renewable energy sources.Renewable power is thriving, as innovations reduce costs and for the first time the promiseof a clean energy future looks achievable. Nowadays, hydropower plants, including small-scale hydropower plants, produce a respectable part of the energy deemed as renewable.One cannot overlook both mini (from 100 to 500 kW) and micro (5 to 100 kW) hydropowerplants which fit perfectly into the group of renewable energy sources. Unlike large-scalehydropower plants, mini and micro hydropower plants, if carefully planned and managed,tend to cause no environmental damage and can be considered perfectly safe for theenvironment. The small hydropower market (up to hydropower plants of a maximumpower equal to 10 MW) was estimated to be USD 2.6 billion in 2019, and according toprojections it will reach USD 3 billion by 2024 [1]. Although the technology used for theproduction of electric energy in hydropower plants is already well known and established,nevertheless there is always a need for technological improvements and the changes inthe sizing methodology, especially in the operational work of mini and micro hydropowerplants. In accordance with the worldwide call to “act locally-think globally”, small-scalehydropower plants provide clean and available electric energy, especially in isolated andremote areas, where water streams are available.
Additionally, micro and mini hydropower plants are nature-friendly, cheaper incomparison to large hydro power plants, and can be installed at almost any water course.
Water 2021, 13, 1777. https://doi.org/10.3390/w13131777 https://www.mdpi.com/journal/water
Water 2021, 13, 1777 2 of 17
Large hydropower plants can cause significant disturbances in fish migratory routes. Thisproblem can be addressed by the construction of fish passages and fish-friendly turbinedesign. Fish passages are hydraulic structures that allow the upstream and downstreammigration of fish when a dam impedes their migration. In order to overcome the limitationsof fish passages, recent R&D efforts have focused on the development of fish-friendlyturbines for relatively higher head hydro stations [2].
Small rivers and water coursers, with their changeable velocities and torrential char-acteristics, can pose a challenge when planning for an installation of mini or micro hy-dropower plants. The research of such issues has an important role in improvement ofthe efficiency of micro and mini hydropower plants. Appropriate understanding of allcharacteristics of the water courses, as well as a good anticipation of all possible situationsand problems that may arise as a result of different climatic conditions in the system, arekey prerequisites for successful design and high efficiency of small hydropower plants.Key input parameters for sizing of micro and mini hydropower plants (as an assumed sizeof the flows in analyzed rivers) will be provided with research and analysis of hydrologicaland hydrogeological properties of the rivers. One of the basic parameters for the estimationof hydropower potential of rivers is daily average flow. In light of that, thorough analysisof the time series of average daily flows of water course will be carried out, not just as amentioned input parameter, but also for further elaboration of the project. Other key infor-mation for reliable analysis and sizing of the hydropower plant model is hydrogeologicalcharacterization of the medium underlying the riverbed.
The main purpose of the presented research is to provide insight into the potential forthe production of electric energy from the torrential rivers. The potential energy and kineticenergy of the river will be analyzed not only from the usual energy aspect (calculation of thepower), but also from the hydrology and hydrogeology aspects. Hydrology analysis showswhen the smallest and/or biggest flows/velocity can be expected, while hydrogeologyanalysis gives insight about the losses of the water, which could occur when passingthrough different media.
2. Literature Review
There are many approaches for defining hydro-energy potential of the water courses,nevertheless the size and regime of the rivers, as well as insight into the potential and/orkinetic arrangement of the turbines are always considered as key factors. Santos et al. [2]used numerical modeling, i.e., computation fluid dynamics for the prediction of the flowsand velocities in the Amazon River. Additionally, the authors used real measurementsfor validation. The research presented in [3] was based on the usage of GIS in the modelwhich takes into the account variables that are decision-making criteria, all in the formof an open-source tool. The methodology for determining of the river energy potentialpresented in [3] has been employed by the SWAT (Soil and Water Assessment Tool) model,satellite data and GIS tools.
It is well-known fact that (in general) more complicated and longer time modeling andfield measurement gives more reliable insight for the future projects of hydropower plants,regardless of their size. Field measurements require financial resources for the equipmentand measurement procedures.
There are even simple methods for the hydro energy site analysis, like the procedureexplained in [4], where analysis of the obtained values is made in the form of a comparisonof the existing methods, with a quality description of the each one. In the same manner,the impact of climate change on electric energy production was provided in “Dynamicsof Electricity Production against the Backdrop of Climate Change: A Case Study of Hy-dropower Plants in Poland” using a case study of Polish rivers. Analysis was based on theregression of the air temperature and precipitation during the time, with the statistical flowanalysis, all with respect to the potential energy hydropower plants. Researchers in [5]described the three most common procedures for the prediction of the hydropower, whichconvert the discharge and height quantities into the hydropower amount. Additionally,
Water 2021, 13, 1777 3 of 17
they invented a fourth method (the Energy Tree Model), which is an improvement of theexisting three methods, i.e., of their limitations. Their methodology is based on a decisiontree, with the more completely and detailed inputs of not only the river subbasin areas andheights, but also all the tributaries.
Kinetic turbine analysis, provided in [6] was based on the calculation, but also a realmeasurement of the average velocity for the many locations in the world, with respectto the different types of turbines. Although the review was done in real conditions, afurther hydrological and hydrogeological analysis will give a new aspect of the analysis.Another proof that kinetic hydro energy is a promising solution for a production of electricenergy can be found in a high-quality review in [7]. Besides the presentation of thepossibility and a data review for using of kinetic energy in Canadian rivers, the report showssizing methodologies for kinetic turbines. Particularly, they are divided as “Estimationof Flow Duration Curves at Ungauged Basins”, “Regional Estimation Methods”, and“Determination of Homogeneous Regions”.
Although all the presented methods provide thorough insight into hydropower poten-tial and give detailed descriptions and nomenclature, it is a “first-hand” approach. It couldbe concluded that there is a need for broader projection and analysis. This is a motivationfor the presentation of a new methodology for the analysis of a hydro-energy potentialof the rivers, which will not entail complex modeling and/or calculation, or unreliable orsimplified procedures which will give useless results.
3. Methodology
The presented procedure for defining the hydro-energy potential of the rivers consistsof two parts. The first part is the rescaled adjusted partial sums (RAPS) method, whilethe second part is hydrogeological analysis of the analyzed location, in order to obtain thecomprehensive view of the topic.
RAPS is a well-known method based on a visual determination of a subseries fromoriginal (given) series of data. By using the average value and standard deviations of theobserved time series, RAPS values provide insight into the parts, where occurrence of thetrends, data grouping, fluctuations, and similar appearances happen during the time:
RAPSk =k
∑t=1
Yt − YSy
(1)
where Yt is the value of the analyzed member (parameter) of the analyzed time series, Y isan average value of the analyzed time series, Sy is the standard deviation of the consideredtime series; n is a number of members of the analyzed time series, and k = 1, 2,..., [8]. Theplot of the RAPS shows a reasonable visualization of the analyzed data trend, which cannotbe seen in the usual time series plots [9]. Visual presentation of the RAPSk values points tothe existence of regularities in the fluctuations of the analyzed parameters (Yt) [10]. Theprocess of determining a new subseries is based on the visual determination, i.e., lookingfor the highest “peak”, or for the lowest “valley” on the RAPS diagram.
The RAPS method was mostly used for hydrological analysis of the river flow [6], butit also has a wide range of applications in all research areas. For example, in analysis ofthe precipitation [11], water temperatures [12], rising sea water levels [13], meteorologicalparameters for the purpose of irrigation [14] and clay excavation, as well as for wastewaterquality analysis [10].
Regarding the size and flow of the river, as well as the selected type of installationwhere turbines use potential energy of the water, the power of the hydropower plant PHP,Pcan be calculated as [15]:
PHP,P = ρ ∗ g ∗ QHP ∗ ∆H ∗ ηHP (2)
Water 2021, 13, 1777 4 of 17
where ρ is water density (1000 kg/m3), g is acceleration of the gravity (9.81 m/s2), QHP isadopted flow rate (m3/s), ∆H is the difference in hydraulic head within analyzed watercourse segment (m), while ηHP is the efficiency of the hydropower plant.
Additionally, the power of the hydropower plant PHP,K, where turbines use kineticenergy of the water, can be calculated as [15]:
PHP,K = ξ∗ρ
2∗ v3 ∗ Ar (3)
where ξ is the hydro powerplant efficiency, v is adopted velocity of the water moving,while Ar is the frontal (or swept) area of the device (m2) [15].
Water depth will be calculated with respect of the lowest point of the river bottom.Due to sedimentation and erosion, the bottom of the riverbed changes over time, so it isdifficult to accurately determine the depth, but at this level of research, obtained valuesmeet the requirements of the calculations. Steps of the depths, i.e., partitions for thecalculation of power of turbines will be 0.5, 1, and 2.5 m.
After the calculation/presentation of the hydrological and energy parameters, the laststep is a detailed hydrogeological analysis in order to fulfill and round out the analysis ofthe hydro-energy potential of the analyzed locations.
4. Case Study
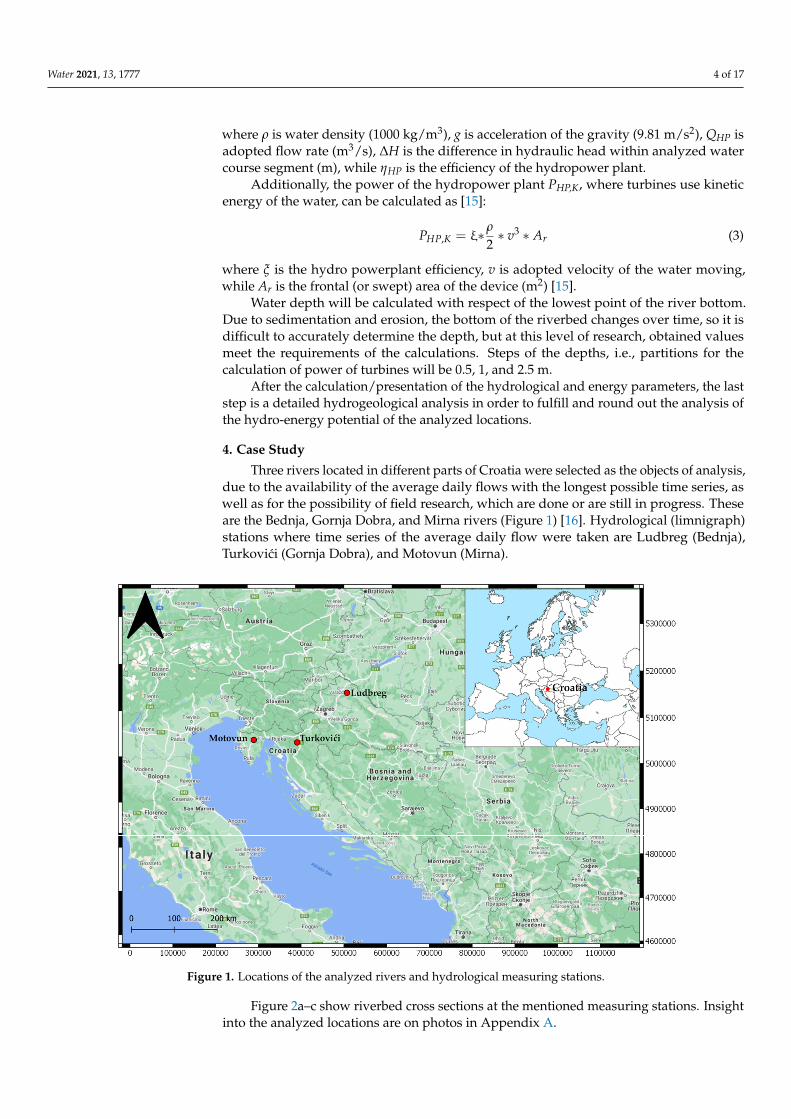
Three rivers located in different parts of Croatia were selected as the objects of analysis,due to the availability of the average daily flows with the longest possible time series, aswell as for the possibility of field research, which are done or are still in progress. Theseare the Bednja, Gornja Dobra, and Mirna rivers (Figure 1) [16]. Hydrological (limnigraph)stations where time series of the average daily flow were taken are Ludbreg (Bednja),Turkovici (Gornja Dobra), and Motovun (Mirna).
Water 2021, 13, 1777 4 of 19
𝑃 , 𝜌 ∗ 𝑔 ∗ 𝑄 ∗ ∆𝐻 ∗ 𝜂 (2)
where ρ is water density (1000 kg/m3), g is acceleration of the gravity (9.81 m/s2), QHP is adopted flow rate (m3/s), ΔH is the difference in hydraulic head within analyzed water course segment (m), while ηHP is the efficiency of the hydropower plant.
Additionally, the power of the hydropower plant PHP,K, where turbines use kinetic energy of the water, can be calculated as [15]: 𝑃 , ξ ∗ 𝜌2 ∗ 𝑣 ∗ 𝐴 (3)
where ξ is the hydro powerplant efficiency, v is adopted velocity of the water moving, while Ar is the frontal (or swept) area of the device (m2) [15].
Water depth will be calculated with respect of the lowest point of the river bottom. Due to sedimentation and erosion, the bottom of the riverbed changes over time, so it is difficult to accurately determine the depth, but at this level of research, obtained values meet the requirements of the calculations. Steps of the depths, i.e., partitions for the cal-culation of power of turbines will be 0.5, 1, and 2.5 m.
After the calculation/presentation of the hydrological and energy parameters, the last step is a detailed hydrogeological analysis in order to fulfill and round out the analysis of the hydro-energy potential of the analyzed locations.
4. Case Study Three rivers located in different parts of Croatia were selected as the objects of anal-
ysis, due to the availability of the average daily flows with the longest possible time series, as well as for the possibility of field research, which are done or are still in progress. These are the Bednja, Gornja Dobra, and Mirna rivers (Figure 1) [16]. Hydrological (limnigraph) stations where time series of the average daily flow were taken are Ludbreg (Bednja), Turkovići (Gornja Dobra), and Motovun (Mirna).
Figure 1. Locations of the analyzed rivers and hydrological measuring stations. Figure 1. Locations of the analyzed rivers and hydrological measuring stations.
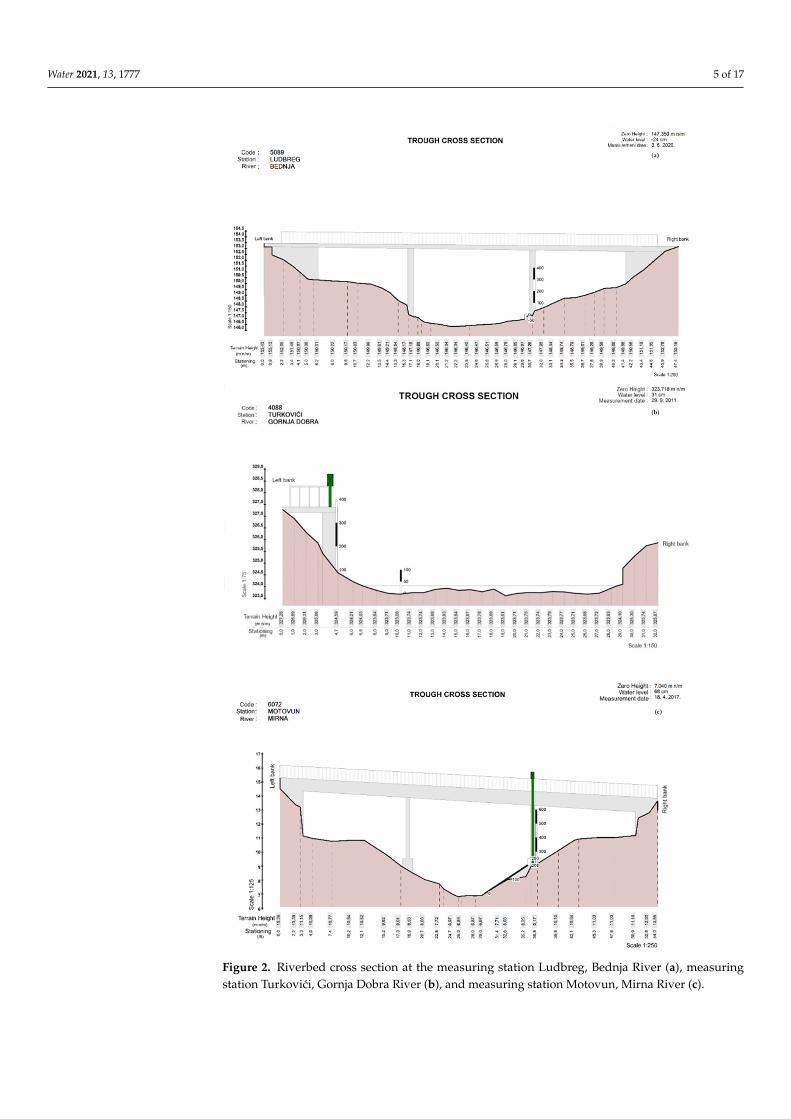
Figure 2a–c show riverbed cross sections at the mentioned measuring stations. Insightinto the analyzed locations are on photos in Appendix A.
Water 2021, 13, 1777 5 of 17
Water 2021, 13, 1777 5 of 19
Figure 2a–c show riverbed cross sections at the mentioned measuring stations. In-sight into the analyzed locations are on photos in Appendix A.
Figure 2. Riverbed cross section at the measuring station Ludbreg, Bednja River (a), measuring sta-tion Turkovići, Gornja Dobra River (b), and measuring station Motovun, Mirna River (c). Figure 2. Riverbed cross section at the measuring station Ludbreg, Bednja River (a), measuringstation Turkovici, Gornja Dobra River (b), and measuring station Motovun, Mirna River (c).
Water 2021, 13, 1777 6 of 17
5. Results
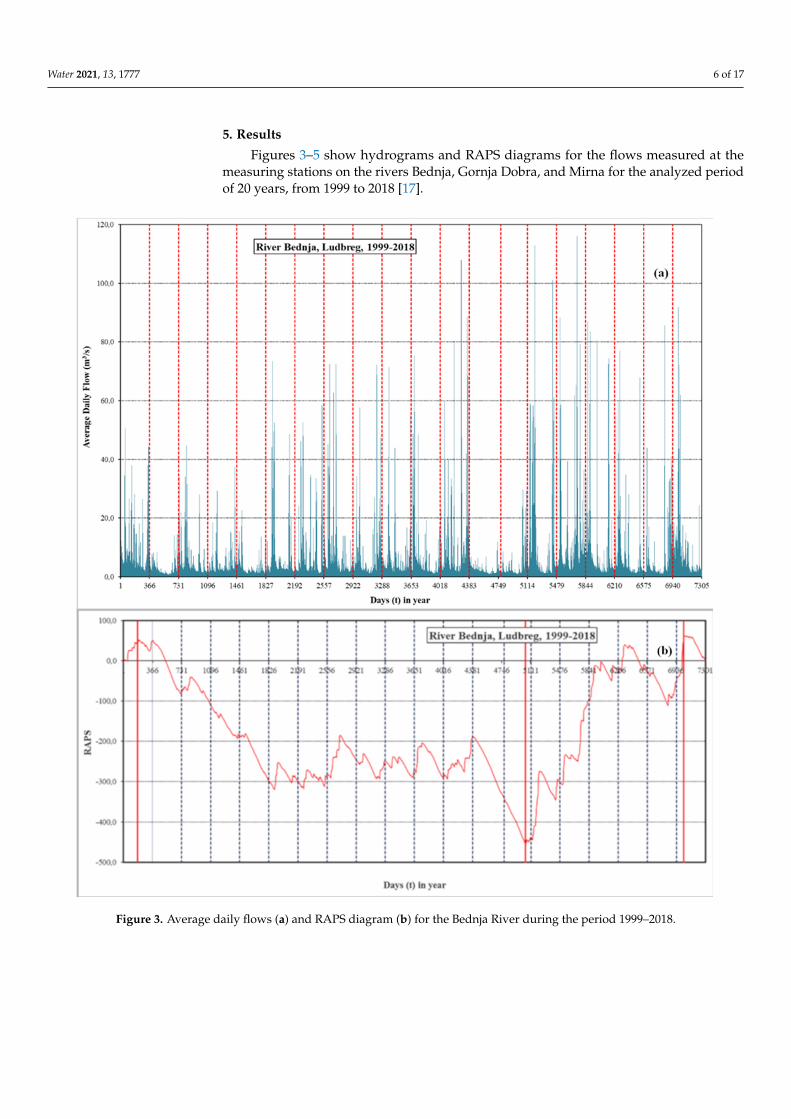
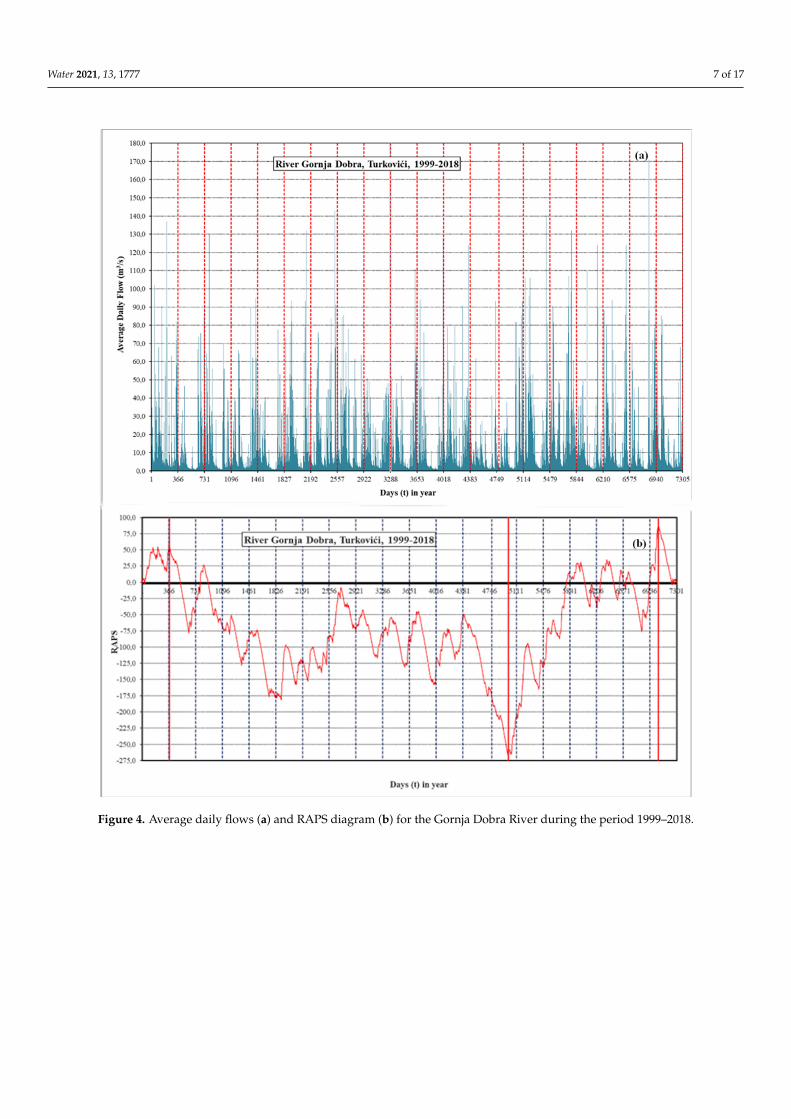
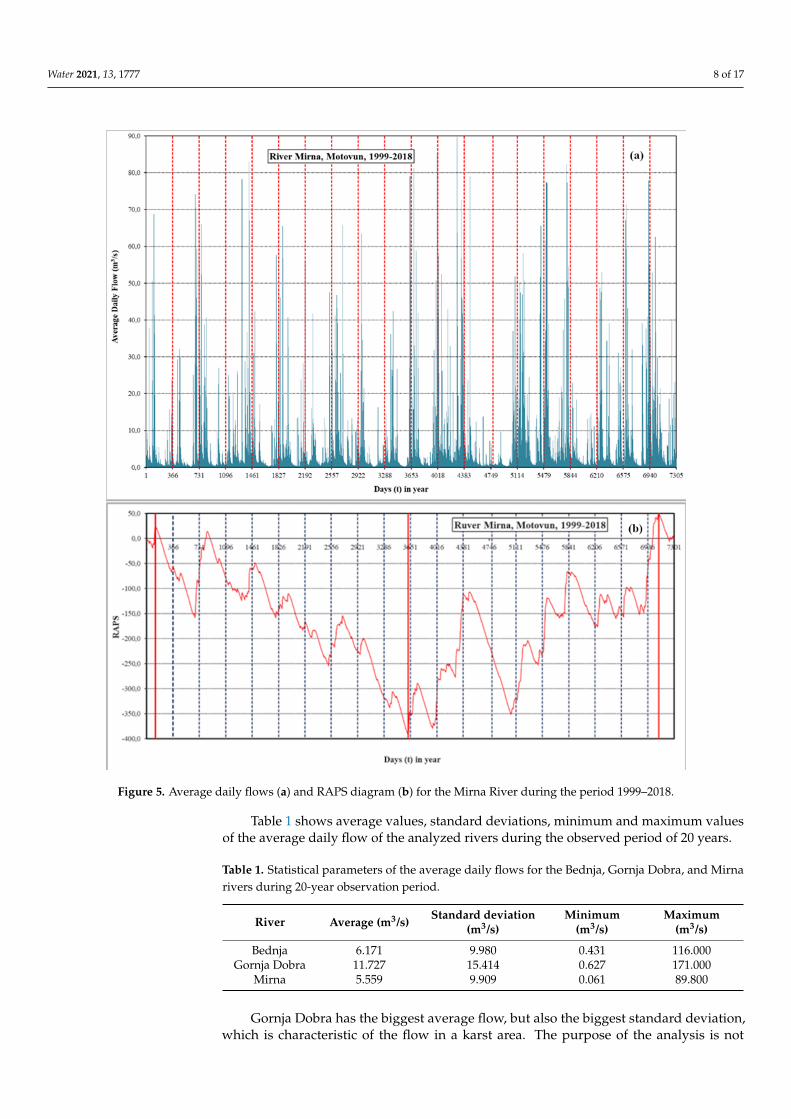
Figures 3–5 show hydrograms and RAPS diagrams for the flows measured at themeasuring stations on the rivers Bednja, Gornja Dobra, and Mirna for the analyzed periodof 20 years, from 1999 to 2018 [17].
Water 2021, 13, 1777 7 of 19
Figure 3. Average daily flows (a) and RAPS diagram (b) for the Bednja River during the period 1999–2018.
The Bednja River shows torrential characteristics, as well as the Gornja Dobra River and Mirna. This is defined by frequent changes of smallest and the biggest values.
Figure 3. Average daily flows (a) and RAPS diagram (b) for the Bednja River during the period 1999–2018.
Water 2021, 13, 1777 7 of 17Water 2021, 13, 1777 8 of 19
Figure 4. Average daily flows (a) and RAPS diagram (b) for the Gornja Dobra River during the period 1999–2018. Figure 4. Average daily flows (a) and RAPS diagram (b) for the Gornja Dobra River during the period 1999–2018.
Water 2021, 13, 1777 8 of 17Water 2021, 13, 1777 9 of 19
Figure 5. Average daily flows (a) and RAPS diagram (b) for the Mirna River during the period 1999–2018.
A common attribute of the Bednja and Mirna Rivers are drought periods from the years 2011 and 2012 (time periods from 4500 until 5000 days). Such observation was not perceived for the Gornja Dobra, which can be explained by the karst characteristics of the media.
Hydropower Potential for the Bednja, Gornja Dobra, and Mirna Rivers Power of the turbines which use potential energy of water is calculated by using
Equation (1). In this calculation, the value of the water depth is a function of a bulkhead of particular height H. Adopted potential turbine efficiency is equal to 80%, while for the kinetic turbine it is 30% with regards to [18,19] and experienced recommendations. Be-tween the lowest and the highest water depth, calculation steps are 1.0 m in order to obtain better insight into the changes of the turbine powers with the increasing height of the bulkhead H. Input river flows were selected with accordance to the analysis of the hy-
Figure 5. Average daily flows (a) and RAPS diagram (b) for the Mirna River during the period 1999–2018.
Table 1 shows average values, standard deviations, minimum and maximum valuesof the average daily flow of the analyzed rivers during the observed period of 20 years.
Table 1. Statistical parameters of the average daily flows for the Bednja, Gornja Dobra, and Mirnarivers during 20-year observation period.
River Average (m3/s)Standard deviation
(m3/s)Minimum
(m3/s)Maximum
(m3/s)
Bednja 6.171 9.980 0.431 116.000Gornja Dobra 11.727 15.414 0.627 171.000
Mirna 5.559 9.909 0.061 89.800
Gornja Dobra has the biggest average flow, but also the biggest standard deviation,which is characteristic of the flow in a karst area. The purpose of the analysis is not
Water 2021, 13, 1777 9 of 17
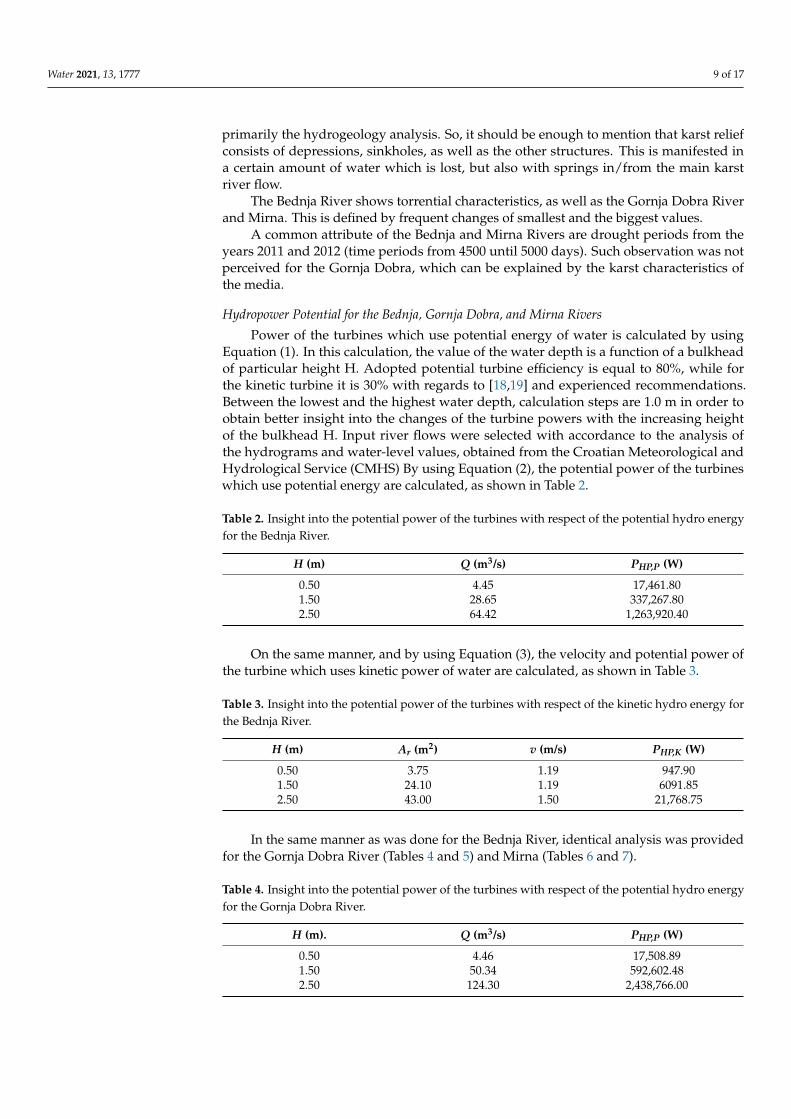
primarily the hydrogeology analysis. So, it should be enough to mention that karst reliefconsists of depressions, sinkholes, as well as the other structures. This is manifested ina certain amount of water which is lost, but also with springs in/from the main karstriver flow.
The Bednja River shows torrential characteristics, as well as the Gornja Dobra Riverand Mirna. This is defined by frequent changes of smallest and the biggest values.
A common attribute of the Bednja and Mirna Rivers are drought periods from theyears 2011 and 2012 (time periods from 4500 until 5000 days). Such observation was notperceived for the Gornja Dobra, which can be explained by the karst characteristics ofthe media.
Hydropower Potential for the Bednja, Gornja Dobra, and Mirna Rivers
Power of the turbines which use potential energy of water is calculated by usingEquation (1). In this calculation, the value of the water depth is a function of a bulkheadof particular height H. Adopted potential turbine efficiency is equal to 80%, while forthe kinetic turbine it is 30% with regards to [18,19] and experienced recommendations.Between the lowest and the highest water depth, calculation steps are 1.0 m in order toobtain better insight into the changes of the turbine powers with the increasing heightof the bulkhead H. Input river flows were selected with accordance to the analysis ofthe hydrograms and water-level values, obtained from the Croatian Meteorological andHydrological Service (CMHS) By using Equation (2), the potential power of the turbineswhich use potential energy are calculated, as shown in Table 2.
Table 2. Insight into the potential power of the turbines with respect of the potential hydro energyfor the Bednja River.
H (m) Q (m3/s) PHP,P (W)
0.50 4.45 17,461.801.50 28.65 337,267.802.50 64.42 1,263,920.40
On the same manner, and by using Equation (3), the velocity and potential power ofthe turbine which uses kinetic power of water are calculated, as shown in Table 3.
Table 3. Insight into the potential power of the turbines with respect of the kinetic hydro energy forthe Bednja River.
H (m) Ar (m2) v (m/s) PHP,K (W)
0.50 3.75 1.19 947.901.50 24.10 1.19 6091.852.50 43.00 1.50 21,768.75
In the same manner as was done for the Bednja River, identical analysis was providedfor the Gornja Dobra River (Tables 4 and 5) and Mirna (Tables 6 and 7).
Table 4. Insight into the potential power of the turbines with respect of the potential hydro energyfor the Gornja Dobra River.
H (m). Q (m3/s) PHP,P (W)
0.50 4.46 17,508.891.50 50.34 592,602.482.50 124.30 2,438,766.00
Water 2021, 13, 1777 10 of 17
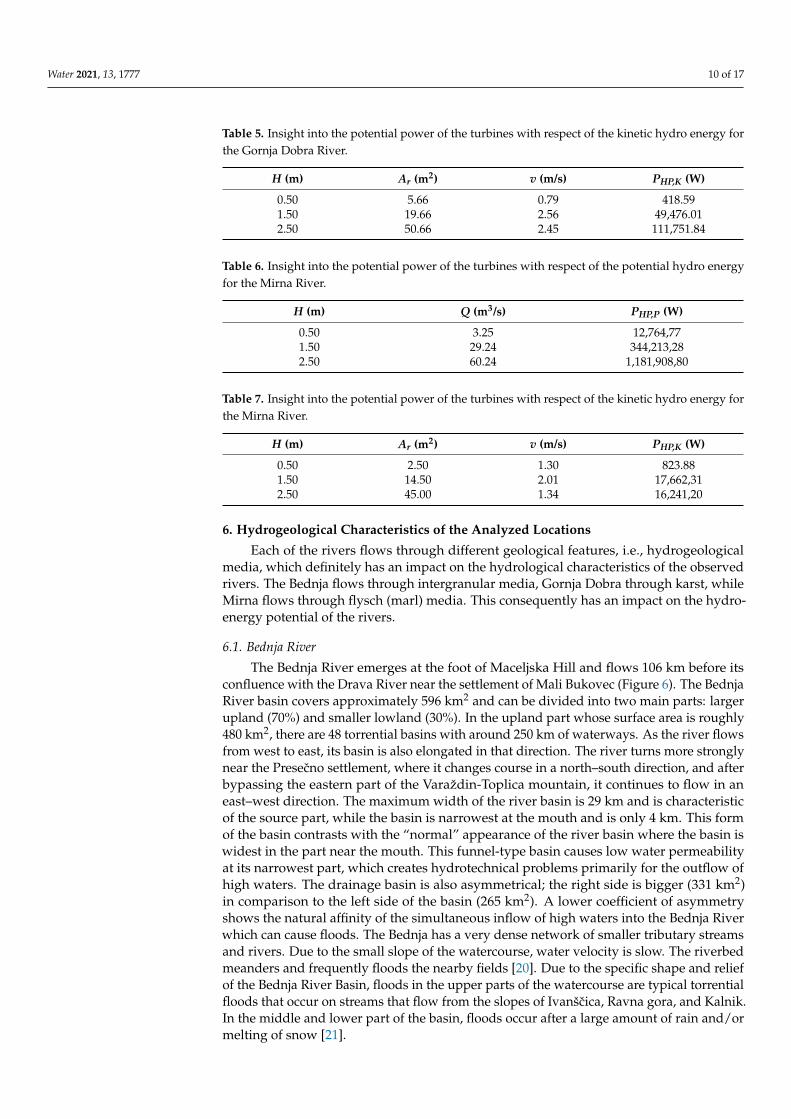
Table 5. Insight into the potential power of the turbines with respect of the kinetic hydro energy forthe Gornja Dobra River.
H (m) Ar (m2) v (m/s) PHP,K (W)
0.50 5.66 0.79 418.591.50 19.66 2.56 49,476.012.50 50.66 2.45 111,751.84
Table 6. Insight into the potential power of the turbines with respect of the potential hydro energyfor the Mirna River.
H (m) Q (m3/s) PHP,P (W)
0.50 3.25 12,764,771.50 29.24 344,213,282.50 60.24 1,181,908,80
Table 7. Insight into the potential power of the turbines with respect of the kinetic hydro energy forthe Mirna River.
H (m) Ar (m2) v (m/s) PHP,K (W)
0.50 2.50 1.30 823.881.50 14.50 2.01 17,662,312.50 45.00 1.34 16,241,20
6. Hydrogeological Characteristics of the Analyzed Locations
Each of the rivers flows through different geological features, i.e., hydrogeologicalmedia, which definitely has an impact on the hydrological characteristics of the observedrivers. The Bednja flows through intergranular media, Gornja Dobra through karst, whileMirna flows through flysch (marl) media. This consequently has an impact on the hydro-energy potential of the rivers.
6.1. Bednja River
The Bednja River emerges at the foot of Maceljska Hill and flows 106 km before itsconfluence with the Drava River near the settlement of Mali Bukovec (Figure 6). The BednjaRiver basin covers approximately 596 km2 and can be divided into two main parts: largerupland (70%) and smaller lowland (30%). In the upland part whose surface area is roughly480 km2, there are 48 torrential basins with around 250 km of waterways. As the river flowsfrom west to east, its basin is also elongated in that direction. The river turns more stronglynear the Presecno settlement, where it changes course in a north–south direction, and afterbypassing the eastern part of the Varaždin-Toplica mountain, it continues to flow in aneast–west direction. The maximum width of the river basin is 29 km and is characteristicof the source part, while the basin is narrowest at the mouth and is only 4 km. This formof the basin contrasts with the “normal” appearance of the river basin where the basin iswidest in the part near the mouth. This funnel-type basin causes low water permeabilityat its narrowest part, which creates hydrotechnical problems primarily for the outflow ofhigh waters. The drainage basin is also asymmetrical; the right side is bigger (331 km2)in comparison to the left side of the basin (265 km2). A lower coefficient of asymmetryshows the natural affinity of the simultaneous inflow of high waters into the Bednja Riverwhich can cause floods. The Bednja has a very dense network of smaller tributary streamsand rivers. Due to the small slope of the watercourse, water velocity is slow. The riverbedmeanders and frequently floods the nearby fields [20]. Due to the specific shape and reliefof the Bednja River Basin, floods in the upper parts of the watercourse are typical torrentialfloods that occur on streams that flow from the slopes of Ivanšcica, Ravna gora, and Kalnik.In the middle and lower part of the basin, floods occur after a large amount of rain and/ormelting of snow [21].
Water 2021, 13, 1777 11 of 17
Water 2021, 13, 1777 11 of 19
2.50 45.00 1.34 16,241,20
6. Hydrogeological Characteristics of the Analyzed Locations Each of the rivers flows through different geological features, i.e., hydrogeological
media, which definitely has an impact on the hydrological characteristics of the observed rivers. The Bednja flows through intergranular media, Gornja Dobra through karst, while Mirna flows through flysch (marl) media. This consequently has an impact on the hydro-energy potential of the rivers.
6.1. Bednja River The Bednja River emerges at the foot of Maceljska Hill and flows 106 km before its
confluence with the Drava River near the settlement of Mali Bukovec (Figure 6). The Bed-nja River basin covers approximately 596 km² and can be divided into two main parts: larger upland (70%) and smaller lowland (30%). In the upland part whose surface area is roughly 480 km², there are 48 torrential basins with around 250 km of waterways. As the river flows from west to east, its basin is also elongated in that direction. The river turns more strongly near the Presečno settlement, where it changes course in a north–south di-rection, and after bypassing the eastern part of the Varaždin-Toplica mountain, it contin-ues to flow in an east–west direction. The maximum width of the river basin is 29 km and is characteristic of the source part, while the basin is narrowest at the mouth and is only 4 km. This form of the basin contrasts with the “normal” appearance of the river basin where the basin is widest in the part near the mouth. This funnel-type basin causes low water permeability at its narrowest part, which creates hydrotechnical problems primarily for the outflow of high waters. The drainage basin is also asymmetrical; the right side is bigger (331 km2) in comparison to the left side of the basin (265 km2). A lower coefficient of asymmetry shows the natural affinity of the simultaneous inflow of high waters into the Bednja River which can cause floods. The Bednja has a very dense network of smaller tributary streams and rivers. Due to the small slope of the watercourse, water velocity is slow. The riverbed meanders and frequently floods the nearby fields [20]. Due to the spe-cific shape and relief of the Bednja River Basin, floods in the upper parts of the water-course are typical torrential floods that occur on streams that flow from the slopes of Ivanščica, Ravna gora, and Kalnik. In the middle and lower part of the basin, floods occur after a large amount of rain and/or melting of snow [21].
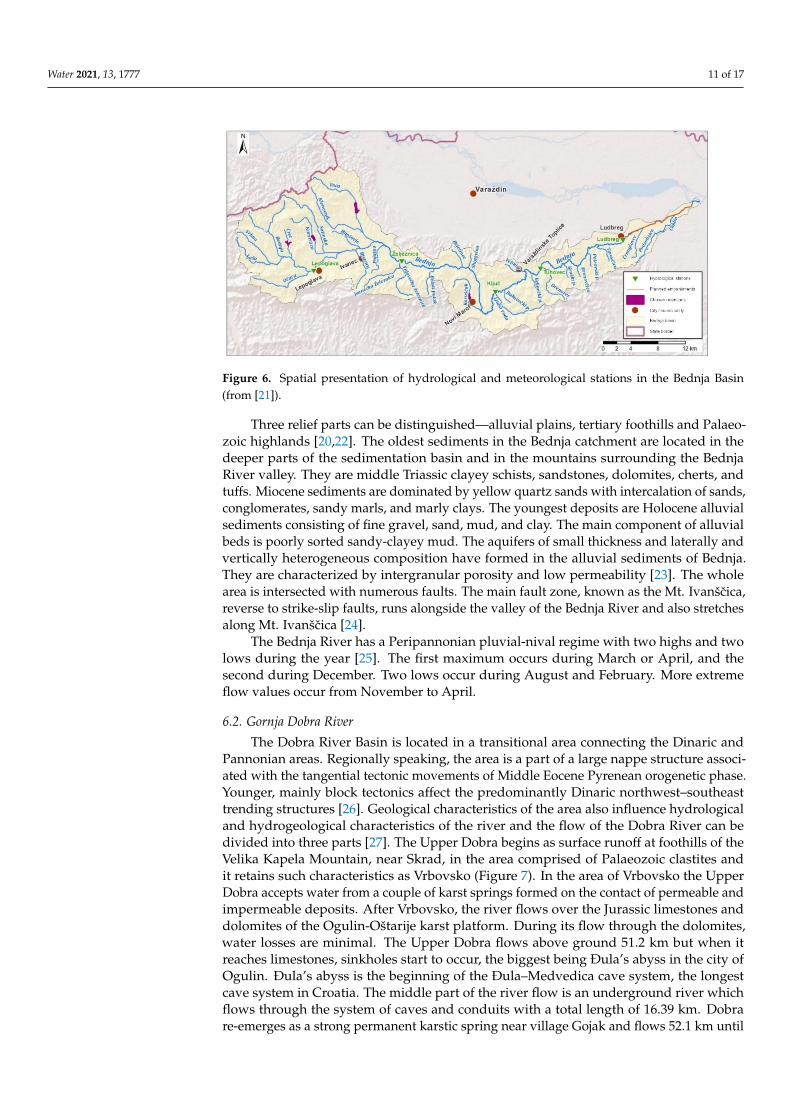
Figure 6. Spatial presentation of hydrological and meteorological stations in the Bednja Basin (from [21]).
Three relief parts can be distinguished—alluvial plains, tertiary foothills and Palaeo-zoic highlands [20,22]. The oldest sediments in the Bednja catchment are located in the deeper parts of the sedimentation basin and in the mountains surrounding the Bednja
Figure 6. Spatial presentation of hydrological and meteorological stations in the Bednja Basin(from [21]).
Three relief parts can be distinguished—alluvial plains, tertiary foothills and Palaeo-zoic highlands [20,22]. The oldest sediments in the Bednja catchment are located in thedeeper parts of the sedimentation basin and in the mountains surrounding the BednjaRiver valley. They are middle Triassic clayey schists, sandstones, dolomites, cherts, andtuffs. Miocene sediments are dominated by yellow quartz sands with intercalation of sands,conglomerates, sandy marls, and marly clays. The youngest deposits are Holocene alluvialsediments consisting of fine gravel, sand, mud, and clay. The main component of alluvialbeds is poorly sorted sandy-clayey mud. The aquifers of small thickness and laterally andvertically heterogeneous composition have formed in the alluvial sediments of Bednja.They are characterized by intergranular porosity and low permeability [23]. The wholearea is intersected with numerous faults. The main fault zone, known as the Mt. Ivanšcica,reverse to strike-slip faults, runs alongside the valley of the Bednja River and also stretchesalong Mt. Ivanšcica [24].
The Bednja River has a Peripannonian pluvial-nival regime with two highs and twolows during the year [25]. The first maximum occurs during March or April, and thesecond during December. Two lows occur during August and February. More extremeflow values occur from November to April.
6.2. Gornja Dobra River
The Dobra River Basin is located in a transitional area connecting the Dinaric andPannonian areas. Regionally speaking, the area is a part of a large nappe structure associ-ated with the tangential tectonic movements of Middle Eocene Pyrenean orogenetic phase.Younger, mainly block tectonics affect the predominantly Dinaric northwest–southeasttrending structures [26]. Geological characteristics of the area also influence hydrologicaland hydrogeological characteristics of the river and the flow of the Dobra River can bedivided into three parts [27]. The Upper Dobra begins as surface runoff at foothills of theVelika Kapela Mountain, near Skrad, in the area comprised of Palaeozoic clastites andit retains such characteristics as Vrbovsko (Figure 7). In the area of Vrbovsko the UpperDobra accepts water from a couple of karst springs formed on the contact of permeable andimpermeable deposits. After Vrbovsko, the river flows over the Jurassic limestones anddolomites of the Ogulin-Oštarije karst platform. During its flow through the dolomites,water losses are minimal. The Upper Dobra flows above ground 51.2 km but when itreaches limestones, sinkholes start to occur, the biggest being Ðula’s abyss in the city ofOgulin. Ðula’s abyss is the beginning of the Ðula–Medvedica cave system, the longestcave system in Croatia. The middle part of the river flow is an underground river whichflows through the system of caves and conduits with a total length of 16.39 km. Dobrare-emerges as a strong permanent karstic spring near village Gojak and flows 52.1 km until
Water 2021, 13, 1777 12 of 17
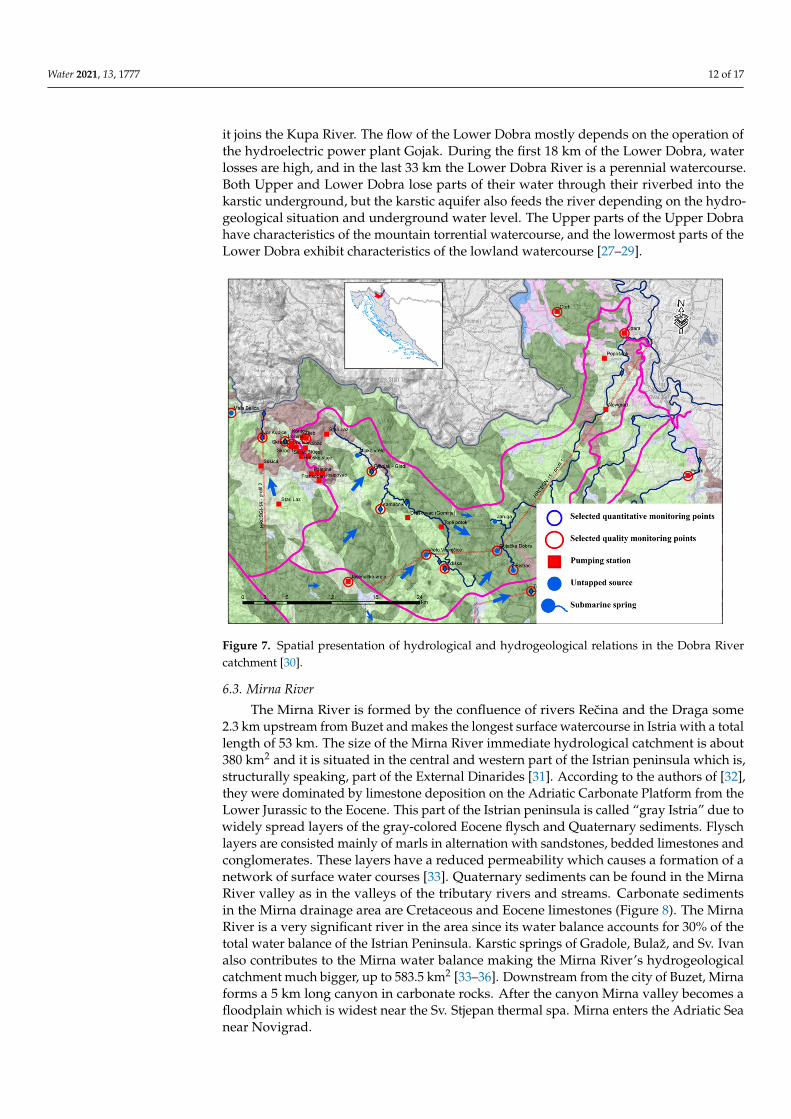
it joins the Kupa River. The flow of the Lower Dobra mostly depends on the operation ofthe hydroelectric power plant Gojak. During the first 18 km of the Lower Dobra, waterlosses are high, and in the last 33 km the Lower Dobra River is a perennial watercourse.Both Upper and Lower Dobra lose parts of their water through their riverbed into thekarstic underground, but the karstic aquifer also feeds the river depending on the hydro-geological situation and underground water level. The Upper parts of the Upper Dobrahave characteristics of the mountain torrential watercourse, and the lowermost parts of theLower Dobra exhibit characteristics of the lowland watercourse [27–29].
Water 2021, 13, 1777 13 of 19
Figure 7. Spatial presentation of hydrological and hydrogeological relations in the Dobra River catchment [30].
6.3. Mirna River The Mirna River is formed by the confluence of rivers Rečina and the Draga some 2.3
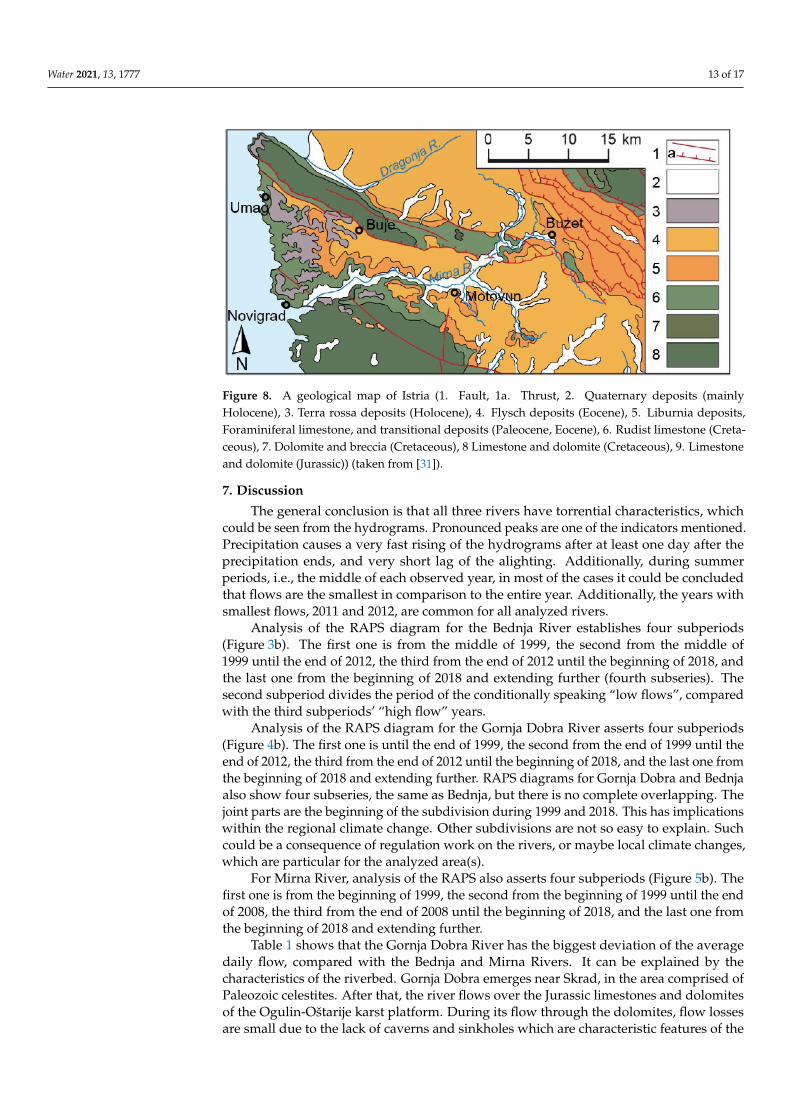
km upstream from Buzet and makes the longest surface watercourse in Istria with a total length of 53 km. The size of the Mirna River immediate hydrological catchment is about 380 km² and it is situated in the central and western part of the Istrian peninsula which is, structurally speaking, part of the External Dinarides [31]. According to the authors of [32], they were dominated by limestone deposition on the Adriatic Carbonate Platform from the Lower Jurassic to the Eocene. This part of the Istrian peninsula is called “gray Istria” due to widely spread layers of the gray-colored Eocene flysch and Quaternary sediments. Flysch layers are consisted mainly of marls in alternation with sandstones, bedded lime-stones and conglomerates. These layers have a reduced permeability which causes a for-mation of a network of surface water courses [33]. Quaternary sediments can be found in the Mirna River valley as in the valleys of the tributary rivers and streams. Carbonate sediments in the Mirna drainage area are Cretaceous and Eocene limestones (Figure 8). The Mirna River is a very significant river in the area since its water balance accounts for 30% of the total water balance of the Istrian Peninsula. Karstic springs of Gradole, Bulaž, and Sv. Ivan also contributes to the Mirna water balance making the Mirna River’s hydro-geological catchment much bigger, up to 583.5 km2 [33–36]. Downstream from the city of Buzet, Mirna forms a 5 km long canyon in carbonate rocks. After the canyon Mirna valley becomes a floodplain which is widest near the Sv. Stjepan thermal spa. Mirna enters the Adriatic Sea near Novigrad.
Figure 7. Spatial presentation of hydrological and hydrogeological relations in the Dobra Rivercatchment [30].
6.3. Mirna River
The Mirna River is formed by the confluence of rivers Recina and the Draga some2.3 km upstream from Buzet and makes the longest surface watercourse in Istria with a totallength of 53 km. The size of the Mirna River immediate hydrological catchment is about380 km2 and it is situated in the central and western part of the Istrian peninsula which is,structurally speaking, part of the External Dinarides [31]. According to the authors of [32],they were dominated by limestone deposition on the Adriatic Carbonate Platform from theLower Jurassic to the Eocene. This part of the Istrian peninsula is called “gray Istria” due towidely spread layers of the gray-colored Eocene flysch and Quaternary sediments. Flyschlayers are consisted mainly of marls in alternation with sandstones, bedded limestones andconglomerates. These layers have a reduced permeability which causes a formation of anetwork of surface water courses [33]. Quaternary sediments can be found in the MirnaRiver valley as in the valleys of the tributary rivers and streams. Carbonate sedimentsin the Mirna drainage area are Cretaceous and Eocene limestones (Figure 8). The MirnaRiver is a very significant river in the area since its water balance accounts for 30% of thetotal water balance of the Istrian Peninsula. Karstic springs of Gradole, Bulaž, and Sv. Ivanalso contributes to the Mirna water balance making the Mirna River’s hydrogeologicalcatchment much bigger, up to 583.5 km2 [33–36]. Downstream from the city of Buzet, Mirnaforms a 5 km long canyon in carbonate rocks. After the canyon Mirna valley becomes afloodplain which is widest near the Sv. Stjepan thermal spa. Mirna enters the Adriatic Seanear Novigrad.
Water 2021, 13, 1777 13 of 17Water 2021, 13, 1777 14 of 19
Figure 8. A geological map of Istria (1. Fault, 1a. Thrust, 2. Quaternary deposits (mainly Holocene), 3. Terra rossa deposits (Holocene), 4. Flysch deposits (Eocene), 5. Liburnia deposits, Foraminiferal limestone, and transitional deposits (Paleocene, Eocene), 6. Rudist limestone (Cretaceous), 7. Dolo-mite and breccia (Cretaceous), 8 Limestone and dolomite (Cretaceous), 9. Limestone and dolomite (Jurassic)) (taken from [31]).
7. Discussion The general conclusion is that all three rivers have torrential characteristics, which
could be seen from the hydrograms. Pronounced peaks are one of the indicators men-tioned. Precipitation causes a very fast rising of the hydrograms after at least one day after the precipitation ends, and very short lag of the alighting. Additionally, during summer periods, i.e., the middle of each observed year, in most of the cases it could be concluded that flows are the smallest in comparison to the entire year. Additionally, the years with smallest flows, 2011 and 2012, are common for all analyzed rivers.
Analysis of the RAPS diagram for the Bednja River establishes four subperiods (Fig-ure 3b). The first one is from the middle of 1999, the second from the middle of 1999 until the end of 2012, the third from the end of 2012 until the beginning of 2018, and the last one from the beginning of 2018 and extending further (fourth subseries). The second sub-period divides the period of the conditionally speaking “low flows”, compared with the third subperiods’ “high flow” years.
Analysis of the RAPS diagram for the Gornja Dobra River asserts four subperiods (Figure 4b). The first one is until the end of 1999, the second from the end of 1999 until the end of 2012, the third from the end of 2012 until the beginning of 2018, and the last one from the beginning of 2018 and extending further. RAPS diagrams for Gornja Dobra and Bednja also show four subseries, the same as Bednja, but there is no complete overlapping. The joint parts are the beginning of the subdivision during 1999 and 2018. This has impli-cations within the regional climate change. Other subdivisions are not so easy to explain. Such could be a consequence of regulation work on the rivers, or maybe local climate changes, which are particular for the analyzed area(s).
For Mirna River, analysis of the RAPS also asserts four subperiods (Figure 5b). The first one is from the beginning of 1999, the second from the beginning of 1999 until the end of 2008, the third from the end of 2008 until the beginning of 2018, and the last one from the beginning of 2018 and extending further.
Table 1 shows that the Gornja Dobra River has the biggest deviation of the average daily flow, compared with the Bednja and Mirna Rivers. It can be explained by the char-acteristics of the riverbed. Gornja Dobra emerges near Skrad, in the area comprised of Paleozoic celestites. After that, the river flows over the Jurassic limestones and dolomites of the Ogulin-Oštarije karst platform. During its flow through the dolomites, flow losses are small due to the lack of caverns and sinkholes which are characteristic features of the
Figure 8. A geological map of Istria (1. Fault, 1a. Thrust, 2. Quaternary deposits (mainlyHolocene), 3. Terra rossa deposits (Holocene), 4. Flysch deposits (Eocene), 5. Liburnia deposits,Foraminiferal limestone, and transitional deposits (Paleocene, Eocene), 6. Rudist limestone (Creta-ceous), 7. Dolomite and breccia (Cretaceous), 8 Limestone and dolomite (Cretaceous), 9. Limestoneand dolomite (Jurassic)) (taken from [31]).
7. Discussion
The general conclusion is that all three rivers have torrential characteristics, whichcould be seen from the hydrograms. Pronounced peaks are one of the indicators mentioned.Precipitation causes a very fast rising of the hydrograms after at least one day after theprecipitation ends, and very short lag of the alighting. Additionally, during summerperiods, i.e., the middle of each observed year, in most of the cases it could be concludedthat flows are the smallest in comparison to the entire year. Additionally, the years withsmallest flows, 2011 and 2012, are common for all analyzed rivers.
Analysis of the RAPS diagram for the Bednja River establishes four subperiods(Figure 3b). The first one is from the middle of 1999, the second from the middle of1999 until the end of 2012, the third from the end of 2012 until the beginning of 2018, andthe last one from the beginning of 2018 and extending further (fourth subseries). Thesecond subperiod divides the period of the conditionally speaking “low flows”, comparedwith the third subperiods’ “high flow” years.
Analysis of the RAPS diagram for the Gornja Dobra River asserts four subperiods(Figure 4b). The first one is until the end of 1999, the second from the end of 1999 until theend of 2012, the third from the end of 2012 until the beginning of 2018, and the last one fromthe beginning of 2018 and extending further. RAPS diagrams for Gornja Dobra and Bednjaalso show four subseries, the same as Bednja, but there is no complete overlapping. Thejoint parts are the beginning of the subdivision during 1999 and 2018. This has implicationswithin the regional climate change. Other subdivisions are not so easy to explain. Suchcould be a consequence of regulation work on the rivers, or maybe local climate changes,which are particular for the analyzed area(s).
For Mirna River, analysis of the RAPS also asserts four subperiods (Figure 5b). Thefirst one is from the beginning of 1999, the second from the beginning of 1999 until the endof 2008, the third from the end of 2008 until the beginning of 2018, and the last one fromthe beginning of 2018 and extending further.
Table 1 shows that the Gornja Dobra River has the biggest deviation of the averagedaily flow, compared with the Bednja and Mirna Rivers. It can be explained by thecharacteristics of the riverbed. Gornja Dobra emerges near Skrad, in the area comprised ofPaleozoic celestites. After that, the river flows over the Jurassic limestones and dolomitesof the Ogulin-Oštarije karst platform. During its flow through the dolomites, flow lossesare small due to the lack of caverns and sinkholes which are characteristic features of the
Water 2021, 13, 1777 14 of 17
limestones [28]. Dolomites are mostly impermeable, and, in the karst, they represent abarrier to the passage of water.
From the hydrotechnical aspect, it can be seen that, a bigger height of the bulkheadgives bigger power to the turbine. However, due to installation of a barrier, any increase inwater level could cause a downstream slowdown. Such slowdowns can be negligible butcan also cause overflow. A possible combination for increasing the power of turbines is theplacement of turbines and bulkheads in a series, at a certain distance from each other.
From Tables 2, 4 and 6, it can be seen that the calculated power for the usage of poten-tial hydro energy is relatively similar for all three observed locations. Such is explainedby the fact that bulk provides accumulation of the water, where different geometricalproperties do not come to the fore. Regarding the kinetic potential of the hydro energy,rivers which are in intergranular media (Bednja) have smaller average velocities, comparedwith the rivers in karst (Gornja Dobra) and flysch media (Mirna).
Globally, it can be concluded that in karst and flysch media number of the deposits inthe rivers is smaller, compared to the deposits in the rivers in intergranular media. In otherwords, deposited particles in the Bednja River can have negative effects on river velocity.
8. Conclusions
The presented original methodology for the analysis of hydropower plant potential oftorrential rivers was applied on a real case study of the three rivers in Croatia, each withdifferent hydrological and hydrogeological properties. All analyzed rivers have potentialfor the building of small hydropower plants. Due to the low velocities, calculated powersare small compared to turbines which use the potential energy of the water. It must beemphasized that not all the cross-section areas of the river can be used for operational workof the kinetic turbines, but for this conceptual elaboration such insight is satisfactory.
In a similar way to turbines that use potential energy of the water, an increase of thepower of turbines can be achieved by placing the turbines and bulkheads in a series andin parallel, at a certain distance from each other. Since there is no deceleration of water,the kinetic turbines have advantage over turbines that use the potential energy of water.Additionally, the environmental impact of the kinetic turbines is negligible, because there isno need for building the bulk construction, as well as for the large foundations, comparedwith the turbines which use potential energy. A demerit of the kinetic turbines is that thespeed of the watercourse must be as high as possible.
Regarding hydro-energy potential, such analysis indicates that in case of occurrenceof the subseries within original time series of the flow, attention should be focused on theseparts of the analyzed time periods. Specifically, in analyzed cases, periods from 2018 areinteresting because there are present irregularities, which affect average daily flow series.Calculation of the flow required for sizing of the hydropower plants should be focused onthose values in such subseries. This surely depends on the duration of the available timeseries (10, 20, or longer), because RAPS calculation will not show the same division of thegiven time series. That is the object of a further analysis, which will not be presented inthis paper due to the purpose and length of the paper.
Detailed analysis, i.e., an extension of the research in the first step will include analysisof the other measuring stations on the analyzed rivers and establishing of the functionalconnections between flows measured on several measuring stations. Next steps are fieldmeasurement and prospecting of potential locations where installation of the hydropowerplants is possible, and where data does not exist, collecting data with regards to thehydrogeological properties.
Author Contributions: B.Ð. and Ž.K. conceived and designed the experiments; B.Ð. and Ž.K. per-formed the experiments; D.D., N.K., and B.Ð. analyzed the data; D.D. and N.K. contributed analysistools; B.Ð., Ž.K., and D.D. wrote the paper. All authors have read and agreed to the published versionof the manuscript.
Water 2021, 13, 1777 15 of 17
Funding: This research, as well as APC costs are covered from the support project for the scientificresearch from the University North, Koprivnica, Croatia.
Data Availability Statement: Used data are available with the request from the corresponding authors.
Conflicts of Interest: The authors declare no conflict of interest.
Appendix A
Water 2021, 13, 1777 16 of 19
Author Contributions: B.Đ. and Ž.K. conceived and designed the experiments; B.Đ. and Ž.K. per-formed the experiments; D.D., N.K., and B.Đ. analyzed the data; D.D. and N.K. contributed analysis tools; B.Đ., Ž.K., and D.D. wrote the paper. All authors have read and agreed to the published ver-sion of the manuscript.
Funding: This research, as well as APC costs are covered from the support project for the scientific research from the University North, Koprivnica, Croatia.
Data Availability Statement: Used data are available with the request from the corresponding au-thors.
Conflicts of Interest: The authors declare no conflict of interest.
Appendix A
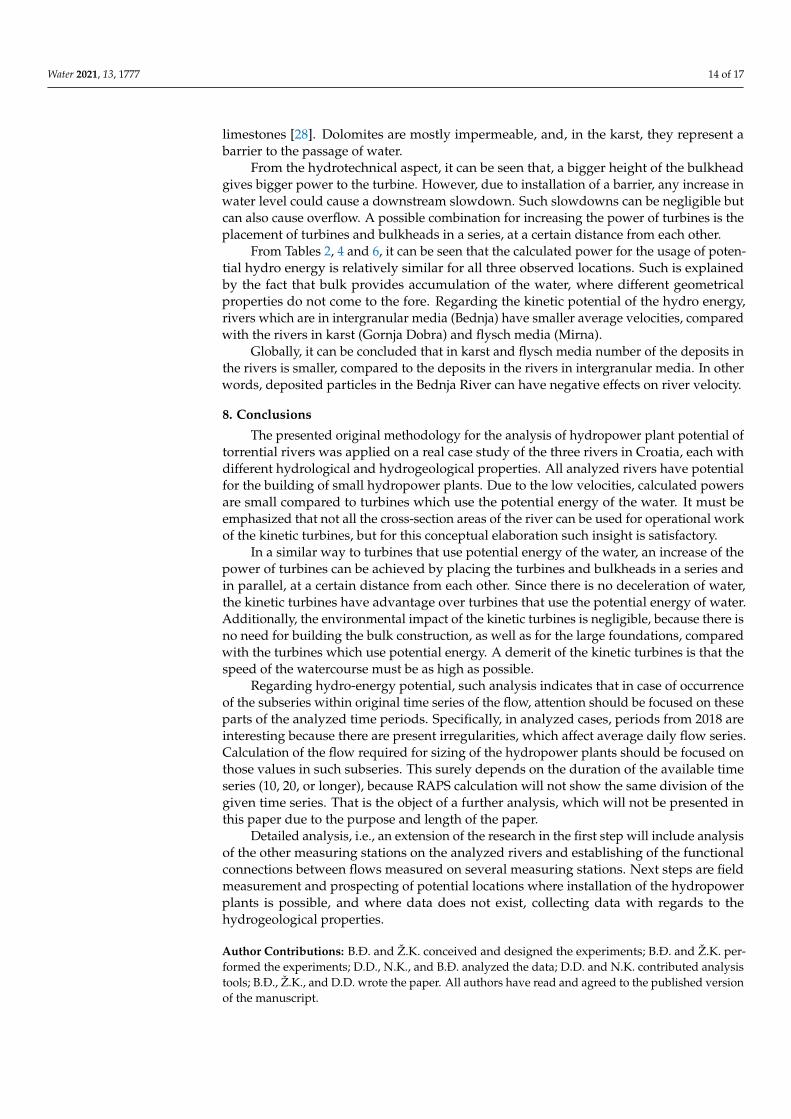
Figure A1. View at the location of the measuring station Ludbreg on the Bednja River. Figure A1. View at the location of the measuring station Ludbreg on the Bednja River.
Water 2021, 13, 1777 17 of 19
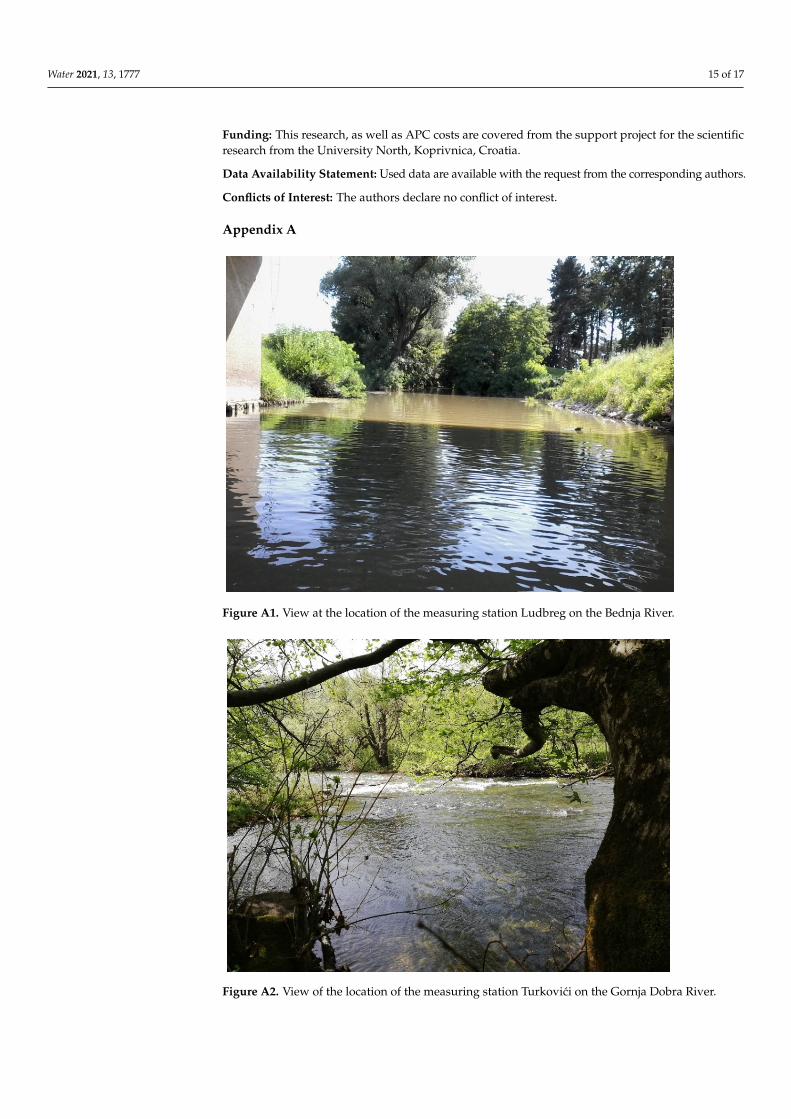
Figure A2. View of the location of the measuring station Turkovići on the Gornja Dobra River.
Figure A3. View at the location of the measuring station Motovun on the Mirna River.
Figure A2. View of the location of the measuring station Turkovici on the Gornja Dobra River.
Water 2021, 13, 1777 16 of 17
Water 2021, 13, 1777 17 of 19
Figure A2. View of the location of the measuring station Turkovići on the Gornja Dobra River.
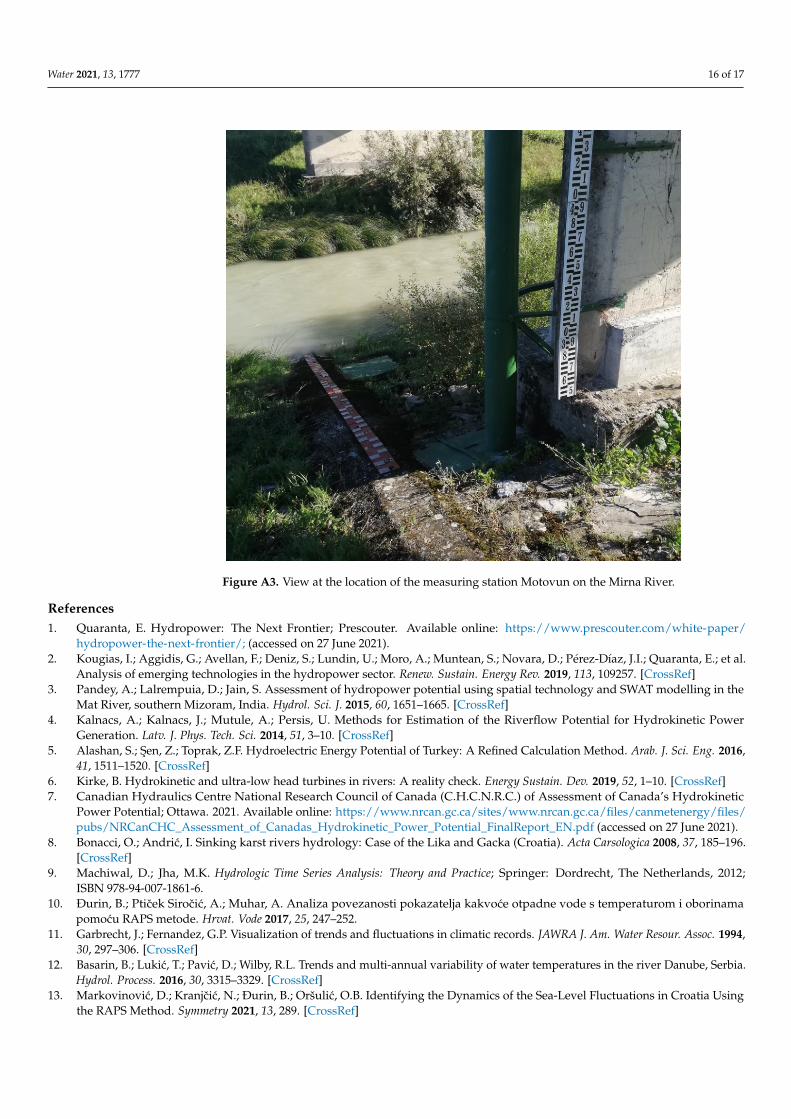
Figure A3. View at the location of the measuring station Motovun on the Mirna River.
Figure A3. View at the location of the measuring station Motovun on the Mirna River.
References1. Quaranta, E. Hydropower: The Next Frontier; Prescouter. Available online: https://www.prescouter.com/white-paper/
hydropower-the-next-frontier/; (accessed on 27 June 2021).2. Kougias, I.; Aggidis, G.; Avellan, F.; Deniz, S.; Lundin, U.; Moro, A.; Muntean, S.; Novara, D.; Pérez-Díaz, J.I.; Quaranta, E.; et al.
Analysis of emerging technologies in the hydropower sector. Renew. Sustain. Energy Rev. 2019, 113, 109257. [CrossRef]3. Pandey, A.; Lalrempuia, D.; Jain, S. Assessment of hydropower potential using spatial technology and SWAT modelling in the
Mat River, southern Mizoram, India. Hydrol. Sci. J. 2015, 60, 1651–1665. [CrossRef]4. Kalnacs, A.; Kalnacs, J.; Mutule, A.; Persis, U. Methods for Estimation of the Riverflow Potential for Hydrokinetic Power
Generation. Latv. J. Phys. Tech. Sci. 2014, 51, 3–10. [CrossRef]5. Alashan, S.; Sen, Z.; Toprak, Z.F. Hydroelectric Energy Potential of Turkey: A Refined Calculation Method. Arab. J. Sci. Eng. 2016,
41, 1511–1520. [CrossRef]6. Kirke, B. Hydrokinetic and ultra-low head turbines in rivers: A reality check. Energy Sustain. Dev. 2019, 52, 1–10. [CrossRef]7. Canadian Hydraulics Centre National Research Council of Canada (C.H.C.N.R.C.) of Assessment of Canada’s Hydrokinetic
Power Potential; Ottawa. 2021. Available online: https://www.nrcan.gc.ca/sites/www.nrcan.gc.ca/files/canmetenergy/files/pubs/NRCanCHC_Assessment_of_Canadas_Hydrokinetic_Power_Potential_FinalReport_EN.pdf (accessed on 27 June 2021).
8. Bonacci, O.; Andric, I. Sinking karst rivers hydrology: Case of the Lika and Gacka (Croatia). Acta Carsologica 2008, 37, 185–196.[CrossRef]
9. Machiwal, D.; Jha, M.K. Hydrologic Time Series Analysis: Theory and Practice; Springer: Dordrecht, The Netherlands, 2012;ISBN 978-94-007-1861-6.
10. Ðurin, B.; Pticek Sirocic, A.; Muhar, A. Analiza povezanosti pokazatelja kakvoce otpadne vode s temperaturom i oborinamapomocu RAPS metode. Hrvat. Vode 2017, 25, 247–252.
11. Garbrecht, J.; Fernandez, G.P. Visualization of trends and fluctuations in climatic records. JAWRA J. Am. Water Resour. Assoc. 1994,30, 297–306. [CrossRef]
12. Basarin, B.; Lukic, T.; Pavic, D.; Wilby, R.L. Trends and multi-annual variability of water temperatures in the river Danube, Serbia.Hydrol. Process. 2016, 30, 3315–3329. [CrossRef]
13. Markovinovic, D.; Kranjcic, N.; Ðurin, B.; Oršulic, O.B. Identifying the Dynamics of the Sea-Level Fluctuations in Croatia Usingthe RAPS Method. Symmetry 2021, 13, 289. [CrossRef]
Water 2021, 13, 1777 17 of 17
14. Težak, D.; Soldo, B.; Ðurin, B.; Kranjcic, N. Impact of Seasonal Changes of Precipitation and Air Temperature on Clay Excavation.Sustainability 2019, 11, 6368. [CrossRef]
15. Jacobson, P.T.; Ravens, T.M.; Cunningham, K.W.; Scott, G. Assessment and Mapping of the Riverine Hydrokinetic Resource in theContinental United States; Electric Power Research Institute (EPRI): Palo Alto, CA, USA, 2012. [CrossRef]
16. Google Maps. Available online: https://www.google.com/maps/@44.5756781,17.4269796,7.79z (accessed on 30 May 2021).17. (CMHS), C.M. and H.S. Daily Flow for Ludbreg, Turkovici and Motovun from 1999 till 2018. Available online: https://www.
meteo.hr/index_en.php (accessed on 27 June 2021).18. Olesen, M.R.; Bech, C.R. Grundfos Pump Handbook; GRUNDFOS Management A/S: Bjerringbro, Denmark, 2004.19. Kirke, B. Hydrokinetic turbines for moderate sized rivers. Energy Sustain. Dev. 2020, 58, 182–195. [CrossRef] [PubMed]20. Pocakal, M. Hydrographical elements of Bednja’s river-basin. Geogr. Glas. 1982, 44, 85–92.21. Studija Utjecaja na Okoliš za EU Projekt Zaštite od Poplava na Slivu Bednje—Netehnicki sažetak; 2018. Available online:
www.bednja.hr/media/1598.pdf (accessed on 27 June 2021).22. Survey, C.G. Rudarsko-geološka studija Varaždinske županije; Croatian Geological Survery: Zagreb, Croatia, 2016.23. Markovic, T.; Larva, O.; Brkic, Ž.; Dolic, M.; Kuhta, M. Stanje Podzemnih Voda na Vodnom Podrucju Rijeke Dunav s Obzirom
na Prirodan Sadržaj Metala i Njihov Antropogeni Utjecaj; 2015. Available online: https://www.voda.hr/sites/default/files/dokumenti/stanje_podzemnih_voda_na_vodnom_porucju_rijeke_dunav_s_obzirom_na_prirodni_sadrzaj_metala_i_njihov_antropogeni_utjecaj_2015.pdf (accessed on 27 June 2021).
24. Stanko, D.; Markušic, S.; Gazdek, M.; Sankovic, V.; Slukan, I.; Ivancic, I. Assessment of the Seismic Site Amplification in the Cityof Ivanec (NW Part of Croatia) Using the Microtremor HVSR Method and Equivalent-linear Site Response Analysis. Geosciences2019, 9, 312. [CrossRef]
25. Canjevac, I. Tipologija protocnih režima rijeka u Hrvatskoj. Hrvat. Geogr. Glas. 2013, 75, 23–42. [CrossRef]26. Kuhta, M.; Novosel, A. Hydrogeology and Cave Explorations of the Lost River Dobra: A Case Study of Underground Flow in the
Dinaric Karst. In Proceedings of the 13th International Congress of Speleology, 4th Speleological Congress of Latin America andCaribbean, 26th Brazilian Congress of Speleology, Brasilia, Brazil, 15–22 July 2001.
27. Pavlic, K.; Jakobovic, D. High flows from gornja dobra basin. Rud.-Geološko-Naft. Zb. 2018, 33, 45–52. [CrossRef]28. Bonacci, O.; Andric, I. Hidrološka analiza krške rijeke Dobre. Hrvat. Vode 2010, 18, 127–138.29. Bonacci, O. Karst hydrogeology/hydrology of dinaric chain and isles. Environ. Earth Sci. 2015, 74, 37–55. [CrossRef]30. Biondic, R.; Rubinic, J.; Biondic, B.; Meaški, H.; Radišic, M. Definiranje Trendova i Ocjena Stanja Podzemnih Voda na Podrucju Krša u
Hrvatskoj; University of Zagreb, Faculty of Geotechnical Engineering: Zagreb, Croatia, 2016. Available online: https://www.voda.hr/sites/default/files/dokumenti/ocjena_stanja_i_rizika_podzemnih_voda_na_krskom_podrucju_u_rh_varazdin_2009.pdf (ac-cessed on 27 June 2021).
31. Felja, I.; Fontana, A.; Furlani, S.; Bajraktarevic, Z.; Paradžik, A.; Topalovic, E.; Rossato, S.; Cosovic, V.; Juracic, M. Environmentalchanges in the lower Mirna River valley (Istria, Croatia) during the Middle and Late Holocene. Geol. Croat. 2015, 68, 209–224.[CrossRef]
32. Velic, I.; Vlahovic, I.; Maticec, D. Depositional sequences and Palaeography of the Adriatic Carbonate Platform. Mem. Della Soc.Geol. Ital. 2002, 57, 141–151.
33. Kneževic, R. Water flow conditions and Stream flow regime in the catchment area of the Mirna river. Hrvat. Geogr. Glas. 2003, 65,81–98. [CrossRef]
34. Matkovic, B.; Travica, T.; Ožanic, N.; Blaževic, L. Available Water Quantity in the Mirna River for Irrigation Needs in Istria.In Proceedings of the International Conference “Balwois 2012”, Ohrid, Macedonia, 28 May–2 June 2012.
35. Benac, C.; Rubinic, J.; Ružic, I.; Radišic, M. Geomorfološka evolucija rijecnih dolina i ušca na istarskom poluotoku. Hrvat. Vode2017, 25, 71–80.
36. Karleuša, B.; Rubinic, J.; Radišic, M.; Krvavica, N. Analysis of Climate Change Impact on Water Supply in Northern Istria(Croatia). Teh. Vjesn. 2018, 25, 366–374. [CrossRef]


