Embed Size (px)
Citation preview
Vietnam Rice Report – November 2014
Page 1 of 31
Project
Vietnam Agricultural Report Research
November 2014 Rice Market Review and Analysis
Research duration: from 1st October to 8th November 2014.
Reported by: Ho Cao Viet (PhD)
Submission of draft report for review: 7th November 2014.
Submission of full report: 8th November 2014.
Vietnam Rice Report – November 2014
Page 2 of 31
Table of Contents
1. Introduction ..................................................................................... 4
2. Hot topics of November 2014 ............................................................. 4
3. Weather condition and its impacts to rice production ............................. 8
3.1 Weather forecasting on November 2014 .............................................. 8
3.2 Impacts of weather to agriculture ..................................................... 10
4. Situation of rice production-consumption in Vietnam and global market . 10
4.1 Progress stages, crop conditions ...................................................... 10
4.2 Demands in domestic, exportation & importation ............................... 15
4.3 Domestic prices and Market trends ................................................... 22
4.4 Export prices and Market trends ....................................................... 24
4.5 Analysis, Opinion, and Prediction ...................................................... 26
4.6 Other related news ......................................................................... 27

Vietnam Rice Report – November 2014
Page 3 of 31
List of tables
Table 1. Forecast of temperature and precipitation on November 2014 in Vietnam .................. 9
Table 2. Sowing and harvesting area of Mua crop in the North provinces (up to 15th October,
2014) .......................................................................................................................... 12
Table 3. Rice sowing and harvesting area in AW & Mua crop by region (up to 15th October 2014)
.................................................................................................................................. 13
Table 4. Sowing area of AW, Mua rice crop in the South provinces (up to 15th October 2014) . 14
Table 5. Weekly rice exportation (Mar, 2014 to 2nd week of October 2014) .......................... 17
Table 6. Monthly rice exportation (Jan, 2013 to September, 2014) ..................................... 18
Table 7. Rice exportation by import country in September, 2014. ....................................... 19
Table 8. Fluctuation of rice price in the MRD market (Aug to 30th Oct 2014) ......................... 23
Table 9. Rice prices quote of Vietnam, Thailand in the world market (1st week of October to 4th
November, 2014) ......................................................................................................... 25
List of figures
Figure 1 Vietnam rice export during 1st to 16th October 2014 ................................................ 5
Figure 2. Average rice wholesale prices in Vietnam, January to October. 2014 ........................ 7
Figure 5. Forecast of precipitation mean on October, 2014 ................................................... 8
Figure 5. Forecast of temperature mean on October, 2014 ................................................... 8
Figure 6. Vietnam – Exported price of rice in first 10 months of 2014 (from January to 16th
October) ...................................................................................................................... 15
Figure 7. Target markets of Vietnam rice by quantity in first 9 months of 2014. ................... 20
Figure 8. Target markets of Vietnam rice by value in first 9 months of 2014. ....................... 20
Figure 9. Exported price of Vietnam rice by continent/region in first 9 months of 2014. ......... 21
Figure 10. Percentage of Vietnam rice exported to Asia market in first 9 months 2014 .......... 21
Figure 11. Percentage of rice quantity imported by Asia countries’ market in September 2014 22
Figure 12. Fluctuation of rice price in domestic by grade from March to October 2014 ........... 22
Figure 13. Comparison of long-grain paddy price in domestic during March to 30th of October
2014. .......................................................................................................................... 23

Vietnam Rice Report – November 2014
Page 4 of 31
1. Introduction
The database and information used in report were collected since October
2014 from different official sources as well as direct contacts to experts who
involved to rice sector and rice farmers in MRD.
Information is updated and bearing the major events and topics of rice
production and consumption in Vietnam in referring to the global market as
well as the critical analysis of authors and rice specialists.
2. Hot topics of November 2014
Vietnam exported around 4.927 million tons of rice during 1st January to 16th
October 2014, down about 14% from about 5.76 million tons of rice
exported during January - October, 2013 (According to data of VFA).
Average rice export price so far in this year stands at about $433 per ton
(FOB), up about $3 per ton from same time last year.
Until middle of October 2014, Vietnam exported around 139,213 thousand
tons of rice, down about 74% from around 537,066 tons rice exported in full
month of October 2013, and down about 75% from around 545,362 tons
rice exported in full month of September 2014. Average export prices in
September stands at about $458 per ton, up about 5% per ton from a year
ago, and up about 4% per ton from a month ago (According VFA and
Oryza.com) (Figure 1).
FAO forecasts Vietnam's 2014 rice exports to increase to around 6.5 million
tons, down about 2% from around 6.65 million tons exported in 2013 due to
increased competition from Thailand, India and Pakistan.
FAO also forecasts Vietnam's 2014 total paddy production at a record 44.5
million tons (around 27.8 million tons, basis milled), slightly down compared
to last year's 43.86 million tons (around 27.4 million tons, basis milled). The
increase is attributed to higher than expected output from the 2013-14 WS
rice crop due to convenient weather conditions and adequate supplies of

Vietnam Rice Report – November 2014
Page 5 of 31
irrigation water during dry season. However, the harvesting season of SA
rice crop decline slightly from last year due to a small contraction in planted
area following government's efforts to shift paddy area to other cash crops
such as maize and soybeans, in order to avoid the paddy over-production
and prevent downward pressure on prices. Besides that, the other source of
rice information - USDA estimates Vietnam to produce around 28 million
tons of rice, basis milled (around 45 million tons, basis paddy) and export
around 6.7 million tons in 2014.
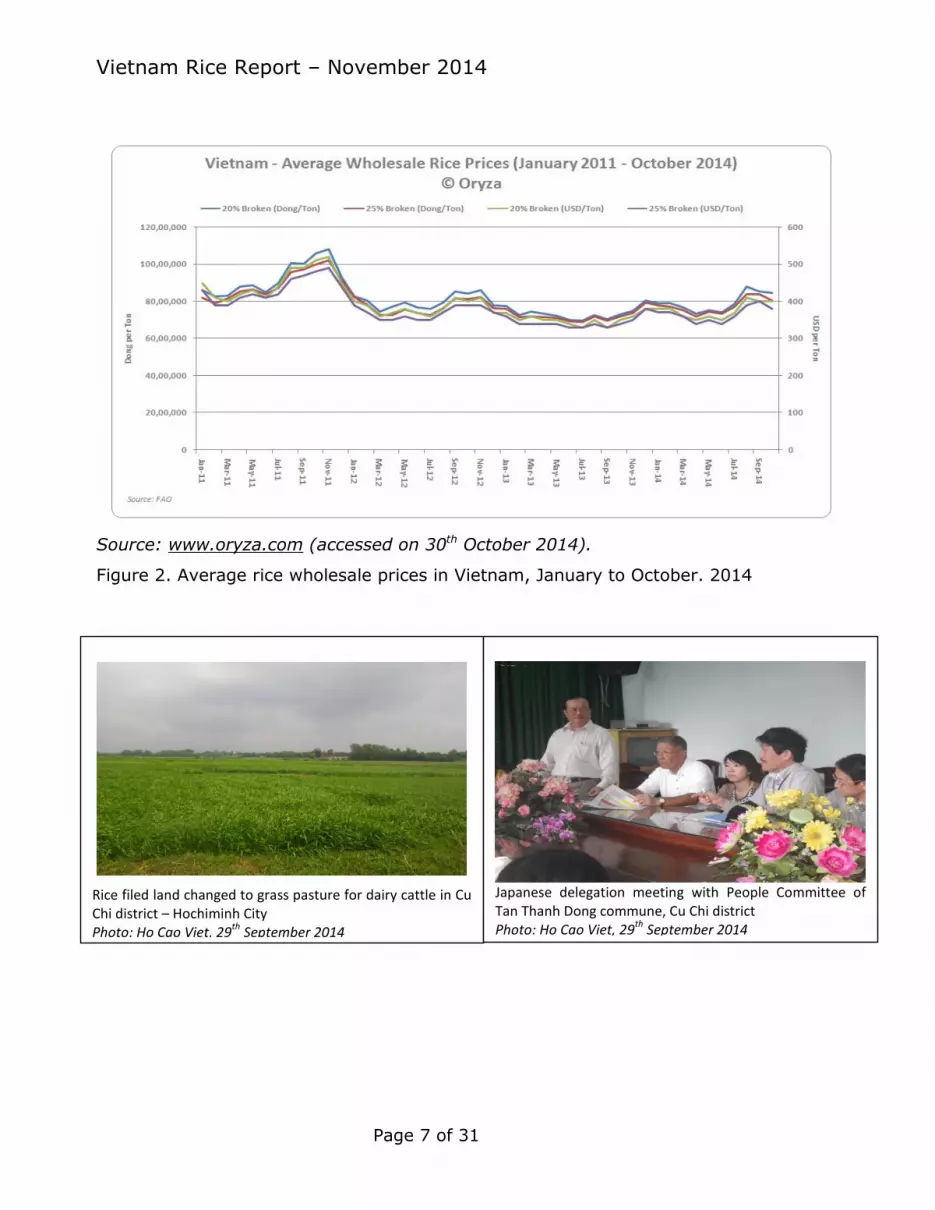
The wholesale rice prices of rice in Vietnam continued to decline in October
2014 for the second consecutive month after increasing for three
consecutive months since June 2014 due to strong import demand,
particularly from China. Average wholesale price of 25% broken white rice
reached around VND 8.05 million (around $380) per ton in October 2014,
down about 4% from around VND 8.39 million (around $400) per ton in
September 2014, but up about 12% from around VND 7.19 million (around
$340) per ton in October 2013 (According to www.oryza.com) (Figure 2).
Figure 1 Vietnam rice export during 1st to 16th October 2014

Vietnam Rice Report – November 2014
Page 6 of 31
According to the local news, rice experts in Vietnam have urged farmers to
move away from producing and exporting low-and-medium grade rice and
focus on high grade rice production and exports. In fact, in nearly two
decades ago, Vietnam rice farmers have increased the productivity of paddy
rice as well as the exports volume of low-and-medium grade. In the
present, the low-grade rice accounts for over 40% of Vietnam's rice export
volume. In term of long-term competition, this is a not good outcome for
Vietnamese rice sector.
All rice experts in Vietnam stated that, in recent years, other countries in
Asia such as India, Myanmar and Cambodia have also increased supplies of
low-and-medium grade rice in the international market and Vietnam has
been facing a rivalry competition from these rice competitors and producers.
As a result, the Vietnamese rice enterprises have reduced selling price of rice
in the world market and they pay low profits to rice farmers. Meanwhile, the
costs of production have increased in recent years.
Experts in Vietnam Center for Economic and Policy Research (VEPR) stated
in a recent workshop that Vietnamese government regulations have also
been barring farmers from producing and exporting certain varieties of rice,
which could earn good profits to them. An agronomist added that the
government should frame new regulations to encourage farmers to grow
niche varieties of rice and export high quality rice. It should lay stress on
improving brand, quality, diversity and prices of Vietnam’s rice (According to
local news).
Vietnam Rice Report – November 2014
Page 7 of 31
Source: www.oryza.com (accessed on 30th October 2014).
Figure 2. Average rice wholesale prices in Vietnam, January to October. 2014
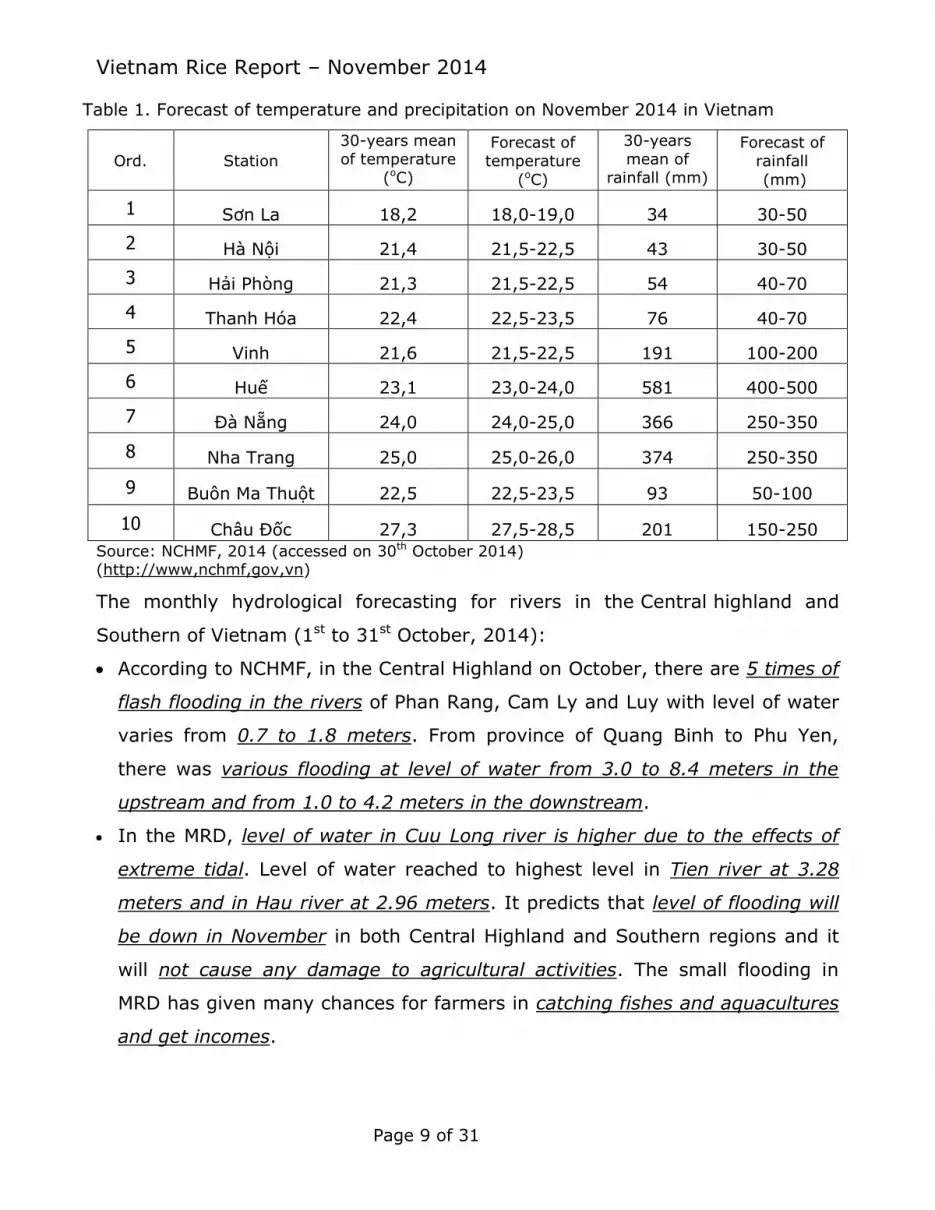
Rice filed land changed to grass pasture for dairy cattle in Cu Chi district – Hochiminh City Photo: Ho Cao Viet, 29
th September 2014
Japanese delegation meeting with People Committee of Tan Thanh Dong commune, Cu Chi district Photo: Ho Cao Viet, 29
th September 2014

Vietnam Rice Report – November 2014
Page 8 of 31
3. Weather condition and its impacts to rice production
3.1 Weather forecasting on November 2014
North:
The average rainfall is approximately above level of the mean of rainfall in 30
previous years from 20-50%. Especially, in Northern delta region the average
rainfall at the same level of 30 previous year from -20% to 20%. The average
temperature is approximately above the mean of temperature in 30 previous
years from 0.5 to 1.0oC (NCHMF, October 2014).
Central coastal:
In the Central Northern provinces, average temperature at above level of
previous year varies from 0.5 to 1.0oC. The rainfall is at below level of same
period of 30 previous years, varies from 10% to 40%. (NCHMF, October 2014).
Highland and South:
Average temperature at above level of previous year varies from 0.5 to 1.0oC.
Average rainfall is approximately at below level of previous year, varies from
10% to 40% higher than same period last year. Particularly, in the West
Southern region, the rainfall varies from -20% to 20% compared to previous
years. (NCHMF, October 2014).
Figure 4. Forecast of temperature mean on
October, 2014
Figure 3. Forecast of precipitation mean on
October, 2014
Vietnam Rice Report – November 2014
Page 9 of 31
Table 1. Forecast of temperature and precipitation on November 2014 in Vietnam
Ord. Station
30-years mean
of temperature
(oC)
Forecast of
temperature
(oC)
30-years
mean of
rainfall (mm)
Forecast of
rainfall
(mm)
1 Sơn La 18,2 18,0-19,0 34 30-50
2 Hà Nội 21,4 21,5-22,5 43 30-50
3 Hải Phòng 21,3 21,5-22,5 54 40-70
4 Thanh Hóa 22,4 22,5-23,5 76 40-70
5 Vinh 21,6 21,5-22,5 191 100-200
6 Huế 23,1 23,0-24,0 581 400-500
7 Đà Nẵng 24,0 24,0-25,0 366 250-350
8 Nha Trang 25,0 25,0-26,0 374 250-350
9 Buôn Ma Thuột 22,5 22,5-23,5 93 50-100
10 Châu Đốc 27,3 27,5-28,5 201 150-250
Source: NCHMF, 2014 (accessed on 30th October 2014) (http://www,nchmf,gov,vn)
The monthly hydrological forecasting for rivers in the Central highland and
Southern of Vietnam (1st to 31st October, 2014):
According to NCHMF, in the Central Highland on October, there are 5 times of
flash flooding in the rivers of Phan Rang, Cam Ly and Luy with level of water
varies from 0.7 to 1.8 meters. From province of Quang Binh to Phu Yen,
there was various flooding at level of water from 3.0 to 8.4 meters in the
upstream and from 1.0 to 4.2 meters in the downstream.
In the MRD, level of water in Cuu Long river is higher due to the effects of
extreme tidal. Level of water reached to highest level in Tien river at 3.28
meters and in Hau river at 2.96 meters. It predicts that level of flooding will
be down in November in both Central Highland and Southern regions and it
will not cause any damage to agricultural activities. The small flooding in
MRD has given many chances for farmers in catching fishes and aquacultures
and get incomes.
Vietnam Rice Report – November 2014
Page 10 of 31
3.2 Impacts of weather to agriculture
In October 2014, the weather does not cause damage to agriculture and it is
very favorable for diversify the fishing activities, particularly in MRD region.
The flash flooding occurs in some provinces of the Central Highland region at
higher level of water varies from 0,7 to 1.8 meters but it does not cause any
extremely damage as prediction because farmers has prepared the dikes and
good management for rice fields (NCHFM, 2014).
Further, since October to the end of November, flash flooding still continue
to occur in overall the country and cold weather will occur in some region of
in the North, therefore it may damage to the agriculture activities and
weather will be extremely difficulties to predict in the same time this year.
Therefore, the farmers in the Northern mountainous and Coastal Centre
region should follow up the weather prediction as well as preparation for
extreme climate change in order to mitigate the losses and negative impacts
(According to prediction of NCHFM, 2014).
4. Situation of rice production-consumption in Vietnam and
global market
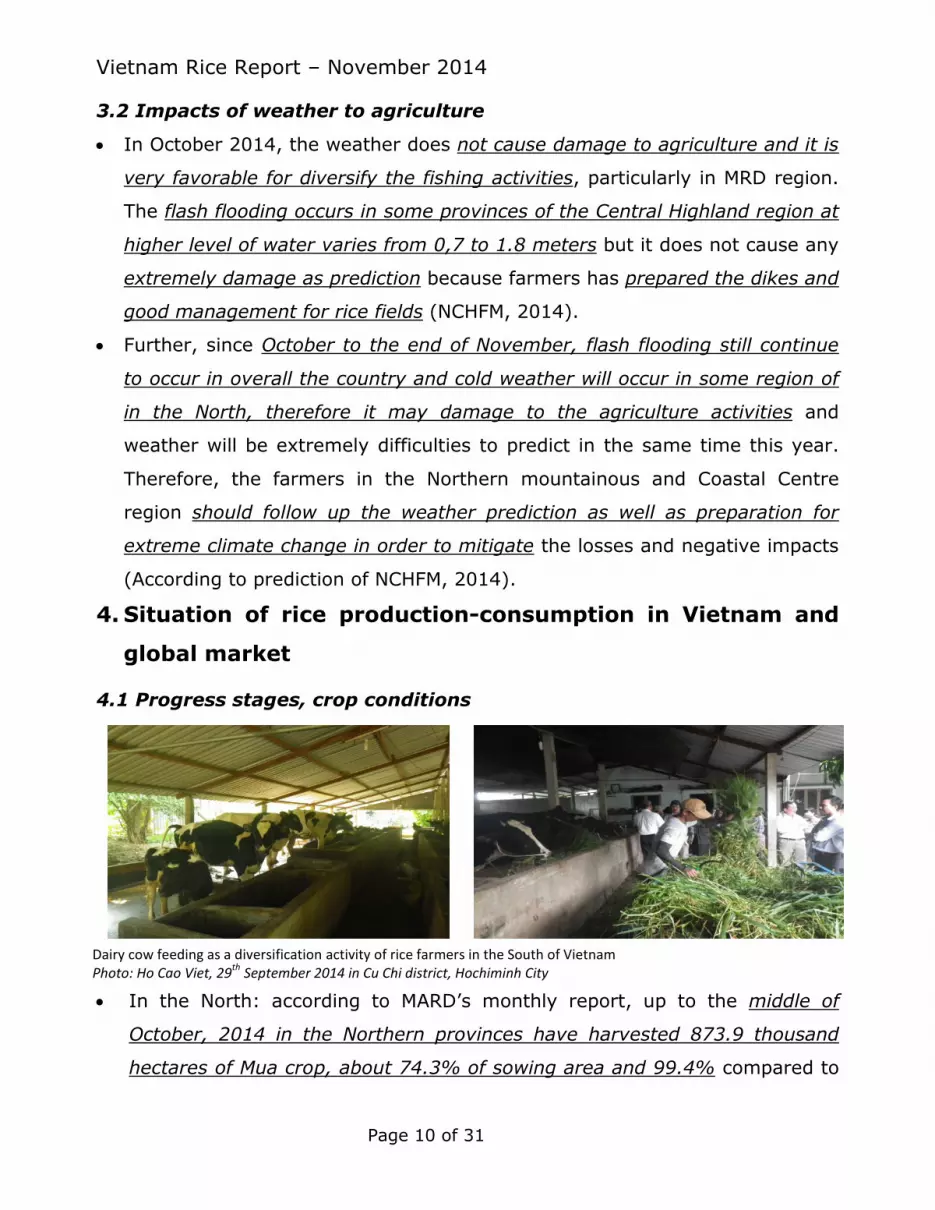
4.1 Progress stages, crop conditions
In the North: according to MARD’s monthly report, up to the middle of
October, 2014 in the Northern provinces have harvested 873.9 thousand
hectares of Mua crop, about 74.3% of sowing area and 99.4% compared to
Dairy cow feeding as a diversification activity of rice farmers in the South of Vietnam Photo: Ho Cao Viet, 29
th September 2014 in Cu Chi district, Hochiminh City
Vietnam Rice Report – November 2014
Page 11 of 31
the same time of previous year. Particularly, in the RRD, 485.3 thousand
hectares of Mua rice crop was harvested and it occupied about 86.1% of
sowing area and higher than 2% compared to last year. Generally, the
harvesting season of Mua crop is relatively convenience and given a good
condition for sowing next rice crop of AW. Many provinces have finished
harvesting the Mua crop such as provinces of Vinh Phuc, Ha Nam, Hung
Yen, Ninh Binh, Thai Binh and Ha Noi (Table 2 & 3).
In the South: according to MARD’s data, until to 15th of October 2014, the
harvesting rice area of SA 2014 has completed in this month, but harvested
area was down 13 thousand hectares. However, the total productivity of this
crop increased by 143 thousand tons due to the yield was higher 100 kgs
per hectare compared to previous SA crop. It estimated about 11.2 million
tons of paddy rice in this crops. The low-efficicient rice area of SA crop has
been switched to other cash crops. According to preliminary assessment,
the maize crop generates higher benefit than rice crop in SA (Table 3 & 4).
In the AW rice crop: the sowing area is stable on October 2014 at around
660 thousand hectares, down about 30 thousand hectares at 96%
compared to previous AW crop. The price of paddy in harvesting time is up
about 10% at level of VND 4,800 to 5,000 per kg (Table 3).
In the Mua rice crop: sowing area of Mua crop till to the middle of October
was 612.3 thousand hectares, 85.6% compared to the same time last year.
In which, in MRD about 243 thousand hectares, about 73.5% of previous
year (Table 3).

Vietnam Rice Report – November 2014
Page 12 of 31
Table 2. Sowing and harvesting area of Mua crop in the North provinces (up to
15th October, 2014)
Region/Provinces Sowing area in Mua crop
(hectare)
Harvesting area of Mua crop
(hectare)
North 1,176,690 873,988
RRD 563,958 485,310
Ha Noi 101,950 90,000
Hai Phong 39,448 24,140
Vinh Phuc 27,750 27,750
Bac Ninh 36,432 32,074
Hai Duong 61,954 49,638
Hung Yen 39,399 39,044
Ha Nam 34,200 34,200
Nam Dinh 78,862 60,170
Thai Binh 82,239 79,203
Ninh Binh 38,618 36,700
Quang Ninh 25,938 12,386
Mountainous region 435,628 276,196
Ha Giang 26,893 26,893
Cao Bang 26,833 -
Tuyen Quang 25,428 25,426
Yen Bai 21,043 21,018
Thai Nguyen 42,064 32,117
Phu Tho 33,306 32,203
Bac Giang 59,235 46,715
Lai Chau 23,802 19,533
Dien Bien 39,000 12,069
Son La 45,000 5,782
Hoa Binh 23,947 23,500
North Central 177,196 112,482
Thanh Hoa 134,602 100,681
Nghe An 38,287 10,000
Ha Tinh 1,694 1,602
Quang Binh 500 199
Quang Tri 2,113 -
Thua Thien Hue - -
Source: MARD, October 2014.

Vietnam Rice Report – November 2014
Page 13 of 31
Table 3. Rice sowing and harvesting area in AW & Mua crop by region (up to 15th
October 2014)
Region Area to 15 October
2013 (1,000 ha)
Area to 15 October
2014 (1,000 ha)
Compared
2013/14 (%)
Harvesting Mua crop
North 879,1 873,9 99.4
RRD 475,4 485,3 102.0
NCC 126,3 112,5 89.1
Sowing AW and Mua crop
AW crop in MRD 690,5 664,1 96.2
Mua crop
South 715,2 612,3 85.6
MRD 330,3 242,8 73.5
Source: MARD, October 2014.
Rice straw storage for dairy cattle in Cu Chi district, Hochiminh City Photo: Ho Cao Viet, 29
thSeptember 2014
Maize and rice straw fermented as an important supplement feed for dairy cattle Photo: Ho Cao Viet, 29
th September 2014
Vietnam Rice Report – November 2014
Page 14 of 31
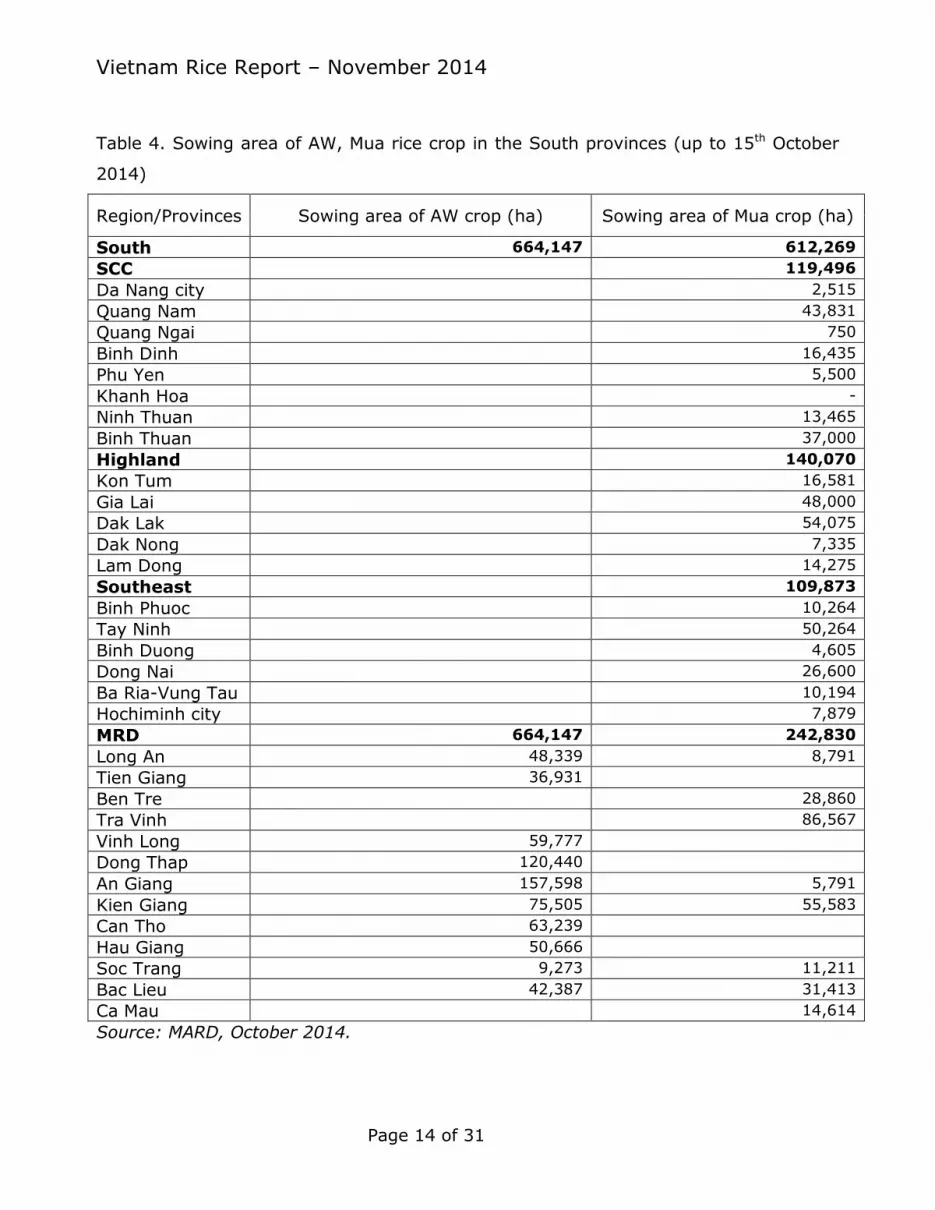
Table 4. Sowing area of AW, Mua rice crop in the South provinces (up to 15th October
2014)
Region/Provinces Sowing area of AW crop (ha) Sowing area of Mua crop (ha)
South 664,147 612,269
SCC 119,496
Da Nang city 2,515
Quang Nam 43,831
Quang Ngai 750
Binh Dinh 16,435
Phu Yen 5,500
Khanh Hoa -
Ninh Thuan 13,465
Binh Thuan 37,000
Highland 140,070
Kon Tum 16,581
Gia Lai 48,000
Dak Lak 54,075
Dak Nong 7,335
Lam Dong 14,275
Southeast 109,873
Binh Phuoc 10,264
Tay Ninh 50,264
Binh Duong 4,605
Dong Nai 26,600
Ba Ria-Vung Tau 10,194
Hochiminh city 7,879
MRD 664,147 242,830
Long An 48,339 8,791
Tien Giang 36,931
Ben Tre 28,860
Tra Vinh 86,567
Vinh Long 59,777
Dong Thap 120,440
An Giang 157,598 5,791
Kien Giang 75,505 55,583
Can Tho 63,239
Hau Giang 50,666
Soc Trang 9,273 11,211
Bac Lieu 42,387 31,413
Ca Mau 14,614
Source: MARD, October 2014.
Vietnam Rice Report – November 2014
Page 15 of 31
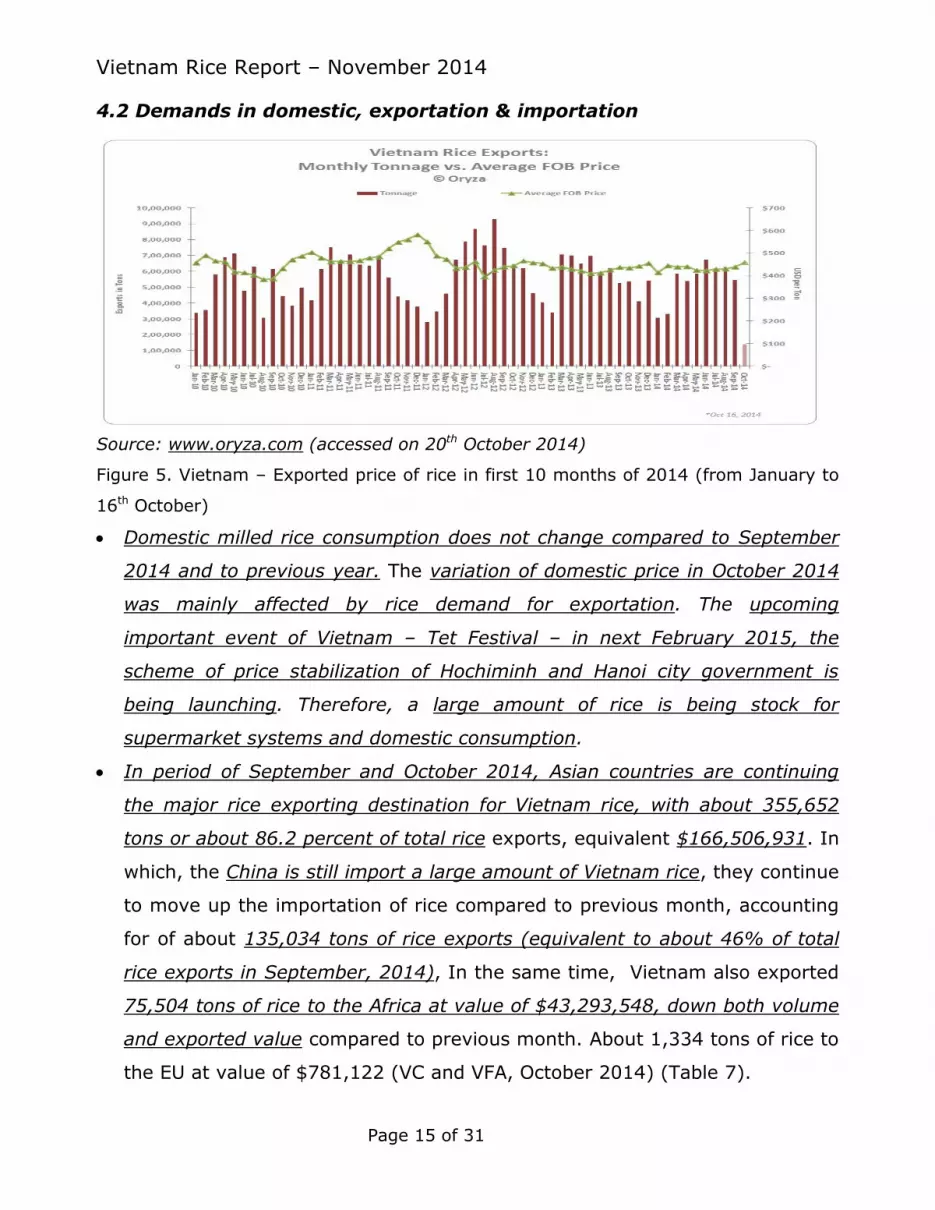
4.2 Demands in domestic, exportation & importation
Source: www.oryza.com (accessed on 20th October 2014)
Figure 5. Vietnam – Exported price of rice in first 10 months of 2014 (from January to
16th October)
Domestic milled rice consumption does not change compared to September
2014 and to previous year. The variation of domestic price in October 2014
was mainly affected by rice demand for exportation. The upcoming
important event of Vietnam – Tet Festival – in next February 2015, the
scheme of price stabilization of Hochiminh and Hanoi city government is
being launching. Therefore, a large amount of rice is being stock for
supermarket systems and domestic consumption.
In period of September and October 2014, Asian countries are continuing
the major rice exporting destination for Vietnam rice, with about 355,652
tons or about 86.2 percent of total rice exports, equivalent $166,506,931. In
which, the China is still import a large amount of Vietnam rice, they continue
to move up the importation of rice compared to previous month, accounting
for of about 135,034 tons of rice exports (equivalent to about 46% of total
rice exports in September, 2014), In the same time, Vietnam also exported
75,504 tons of rice to the Africa at value of $43,293,548, down both volume
and exported value compared to previous month. About 1,334 tons of rice to
the EU at value of $781,122 (VC and VFA, October 2014) (Table 7).

Vietnam Rice Report – November 2014
Page 16 of 31
In the first 9 months of 2014, Vietnam exported about 5,014 thousand tons
of rice, down 5.4% compared to same period last year at value of $2,283
million down about 2.0% (Table 6). Under the context of global market,
Thailand is coming back to medium quality rice segment, Vietnam rice
enterprises are trying to speed up the rice exportation to different segments
of rice market. However, the exportation situation does not improved
significantly in September 2014. In the end of September 2014, Vietnam
decreased the quantity of exported rice at 518,963 tons at value of
$243,361,048 compared to previous month, down about 21.7% in volume
and 19.4% in value. However, in the fisrt second weeks of October, Vietnam
exported 334,502 tons of rice at value of $158,325 and exported volume of
rice so far was 5,326,125 at value of $2,440,822 thousand (Table 6).
Technician meet and discuss with rice farmers for technical support n Cu Chi district, Hochiminh City Photo: Ho Cao Viet, 29
th September 2014
Japanese expert discussed with farmers in a PRA survey Photo: Ho Cao Viet, 29
th September 2014
Vietnam Rice Report – November 2014
Page 17 of 31
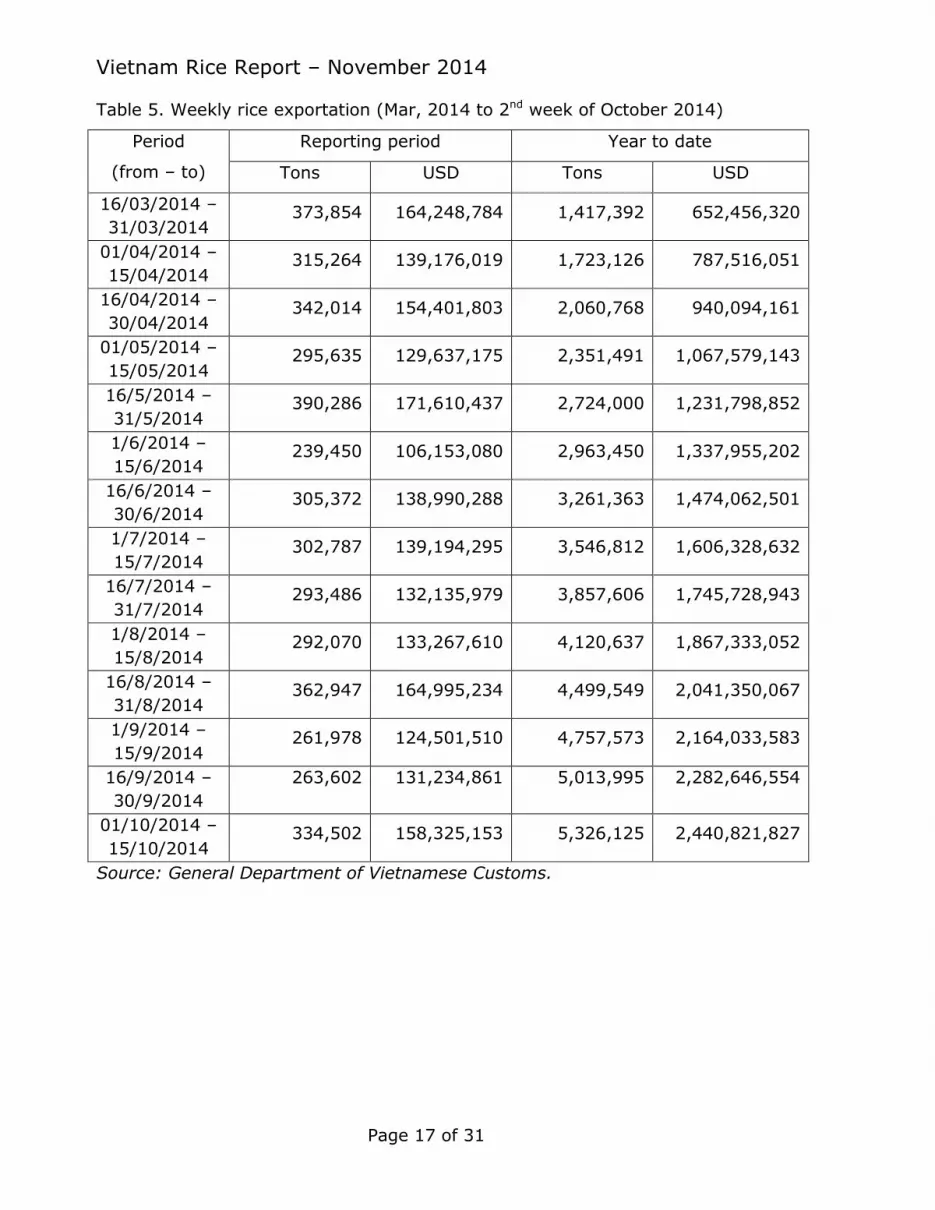
Table 5. Weekly rice exportation (Mar, 2014 to 2nd week of October 2014)
Period
(from – to)
Reporting period Year to date
Tons USD Tons USD
16/03/2014 –
31/03/2014 373,854 164,248,784 1,417,392 652,456,320
01/04/2014 –
15/04/2014 315,264 139,176,019 1,723,126 787,516,051
16/04/2014 –
30/04/2014 342,014 154,401,803 2,060,768 940,094,161
01/05/2014 –
15/05/2014 295,635 129,637,175 2,351,491 1,067,579,143
16/5/2014 –
31/5/2014 390,286 171,610,437 2,724,000 1,231,798,852
1/6/2014 –
15/6/2014 239,450 106,153,080 2,963,450 1,337,955,202
16/6/2014 –
30/6/2014 305,372 138,990,288 3,261,363 1,474,062,501
1/7/2014 –
15/7/2014 302,787 139,194,295 3,546,812 1,606,328,632
16/7/2014 –
31/7/2014 293,486 132,135,979 3,857,606 1,745,728,943
1/8/2014 –
15/8/2014 292,070 133,267,610 4,120,637 1,867,333,052
16/8/2014 –
31/8/2014 362,947 164,995,234 4,499,549 2,041,350,067
1/9/2014 –
15/9/2014 261,978 124,501,510 4,757,573 2,164,033,583
16/9/2014 –
30/9/2014
263,602 131,234,861 5,013,995 2,282,646,554
01/10/2014 –
15/10/2014 334,502 158,325,153 5,326,125 2,440,821,827
Source: General Department of Vietnamese Customs.
Vietnam Rice Report – November 2014
Page 18 of 31
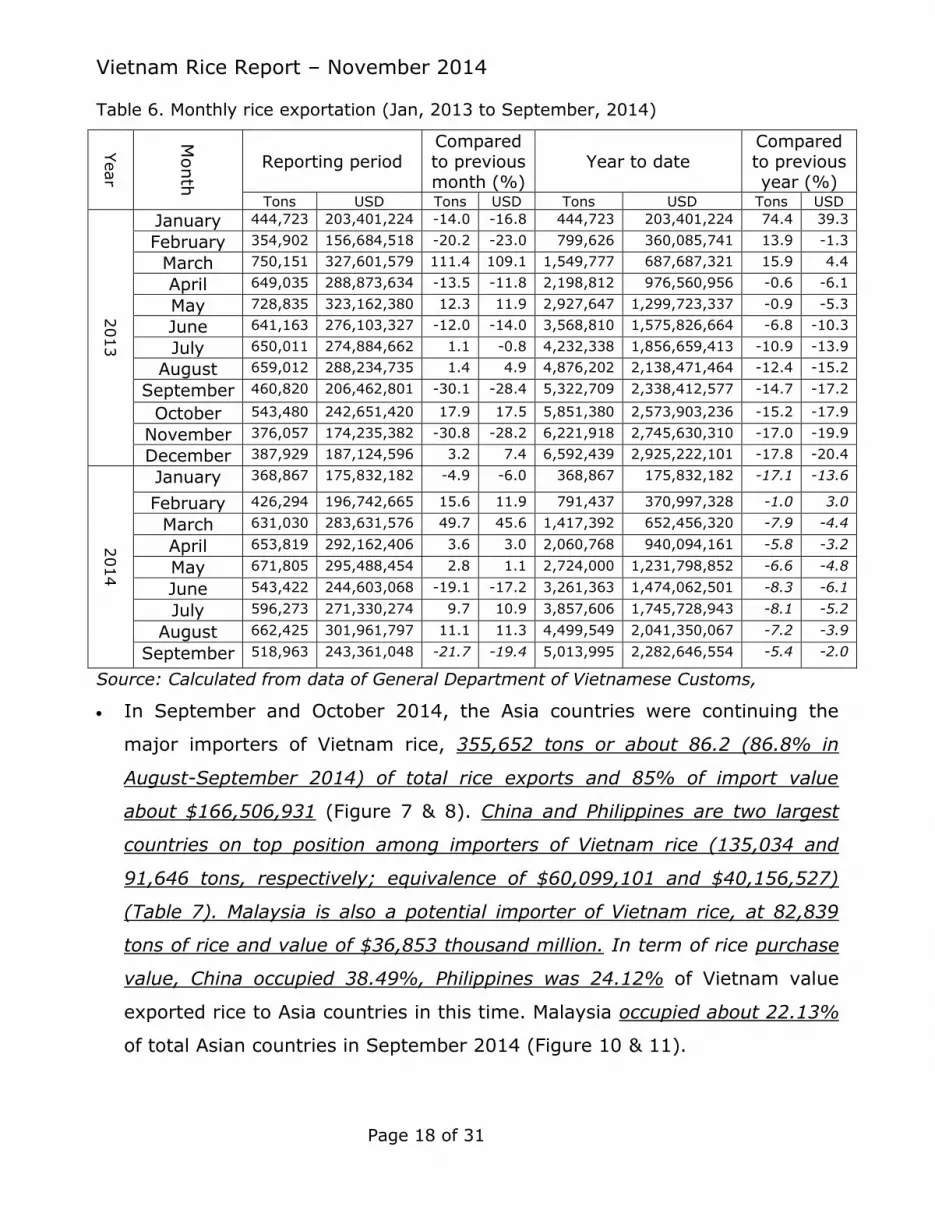
Table 6. Monthly rice exportation (Jan, 2013 to September, 2014)
Year
Month
Reporting period Compared to previous month (%)
Year to date Compared to previous year (%)
Tons USD Tons USD Tons USD Tons USD
2013
January 444,723 203,401,224 -14.0 -16.8 444,723 203,401,224 74.4 39.3
February 354,902 156,684,518 -20.2 -23.0 799,626 360,085,741 13.9 -1.3
March 750,151 327,601,579 111.4 109.1 1,549,777 687,687,321 15.9 4.4
April 649,035 288,873,634 -13.5 -11.8 2,198,812 976,560,956 -0.6 -6.1
May 728,835 323,162,380 12.3 11.9 2,927,647 1,299,723,337 -0.9 -5.3
June 641,163 276,103,327 -12.0 -14.0 3,568,810 1,575,826,664 -6.8 -10.3
July 650,011 274,884,662 1.1 -0.8 4,232,338 1,856,659,413 -10.9 -13.9
August 659,012 288,234,735 1.4 4.9 4,876,202 2,138,471,464 -12.4 -15.2
September 460,820 206,462,801 -30.1 -28.4 5,322,709 2,338,412,577 -14.7 -17.2
October 543,480 242,651,420 17.9 17.5 5,851,380 2,573,903,236 -15.2 -17.9
November 376,057 174,235,382 -30.8 -28.2 6,221,918 2,745,630,310 -17.0 -19.9
December 387,929 187,124,596 3.2 7.4 6,592,439 2,925,222,101 -17.8 -20.4
2014
January 368,867 175,832,182 -4.9 -6.0 368,867 175,832,182 -17.1 -13.6
February 426,294 196,742,665 15.6 11.9 791,437 370,997,328 -1.0 3.0
March 631,030 283,631,576 49.7 45.6 1,417,392 652,456,320 -7.9 -4.4
April 653,819 292,162,406 3.6 3.0 2,060,768 940,094,161 -5.8 -3.2
May 671,805 295,488,454 2.8 1.1 2,724,000 1,231,798,852 -6.6 -4.8
June 543,422 244,603,068 -19.1 -17.2 3,261,363 1,474,062,501 -8.3 -6.1
July 596,273 271,330,274 9.7 10.9 3,857,606 1,745,728,943 -8.1 -5.2
August 662,425 301,961,797 11.1 11.3 4,499,549 2,041,350,067 -7.2 -3.9
September 518,963 243,361,048 -21.7 -19.4 5,013,995 2,282,646,554 -5.4 -2.0
Source: Calculated from data of General Department of Vietnamese Customs,
In September and October 2014, the Asia countries were continuing the
major importers of Vietnam rice, 355,652 tons or about 86.2 (86.8% in
August-September 2014) of total rice exports and 85% of import value
about $166,506,931 (Figure 7 & 8). China and Philippines are two largest
countries on top position among importers of Vietnam rice (135,034 and
91,646 tons, respectively; equivalence of $60,099,101 and $40,156,527)
(Table 7). Malaysia is also a potential importer of Vietnam rice, at 82,839
tons of rice and value of $36,853 thousand million. In term of rice purchase
value, China occupied 38.49%, Philippines was 24.12% of Vietnam value
exported rice to Asia countries in this time. Malaysia occupied about 22.13%
of total Asian countries in September 2014 (Figure 10 & 11).

Vietnam Rice Report – November 2014
Page 19 of 31
Table 7. Rice exportation by import country in September, 2014.
Country/continent
Reporting period (September,
2014)
Year to date
(1st Jan, to 30th September, 2014)
Tons USD Tons USD
Africa 75,504 43,293,548 500,952 247,449,842
Algeria 5,924 2,533,820 31,349 13,515,014
Angola 876 554,311 11,295 5,667,825
Ivory Coast 27,969 16,465,878 139,701 67,712,592
Ghana 36,614 21,938,583 242,333 131,584,200
South Africa 4,121 1,800,956 33,216 13,922,228
Senegal 43,058 15,047,983
EU 1,334 781,122 31,201 15,810,411
Poland 100 60,200 623 366,231
Belgium 675 336,641 9,247 4,629,632
Bulgaria - - - -
Netherland 415 233,427 5,011 2,583,258
France 83 55,889 2,157 1,268,083
Spain 144 109,165 1,871 1,188,708
Turkey 0 0 2,849 1,560,019
Ukraine 100 46,000 9,443 4,214,480
Asia 355,652 166,506,931 3,674,183 1,655,700,996
Brunei 1,380 766,900 10,693 5,974,368
Taiwan 2,119 1,184,438 27,902 16,082,653
East Timor 250 141,881 76,025 29,267,299
Hong Kong 13,801 8,037,204 116,439 68,650,503
Indonesia 12,475 6,265,690 88,385 40,950,681
Malaysia 82,839 36,853,154 356,199 161,407,890
Philippines 91,646 40,156,527 1,129,371 503,649,058
Singapore 12,712 6,642,883 151,038 72,713,205
China 135,034 64,099,101 1,693,683 741,378,838
Australia 1,008 682,393 5,587 3,869,046
United Arab
Emirates
2,638 1,676,760 18,861 11,757,455
United States 3,311 2,131,339 30,658 19,707,500
Russian Federation 0 0 23,375 10,258,959
Source: Calculated from data of General Department of Vietnamese Customs, September 2014.

Vietnam Rice Report – November 2014
Page 20 of 31
Note: Calculated by quantity of exported rice (ton).
Source: generated from data of General Department of Vietnamese Customs,
Figure 6. Target markets of Vietnam rice by quantity in first 9 months of 2014.
Note: Calculated by value of exportation (USD). Source: generated from data of General Department of Vietnamese Customs.
Figure 7. Target markets of Vietnam rice by value in first 9 months of 2014.
Vietnam Rice Report – November 2014
Page 21 of 31
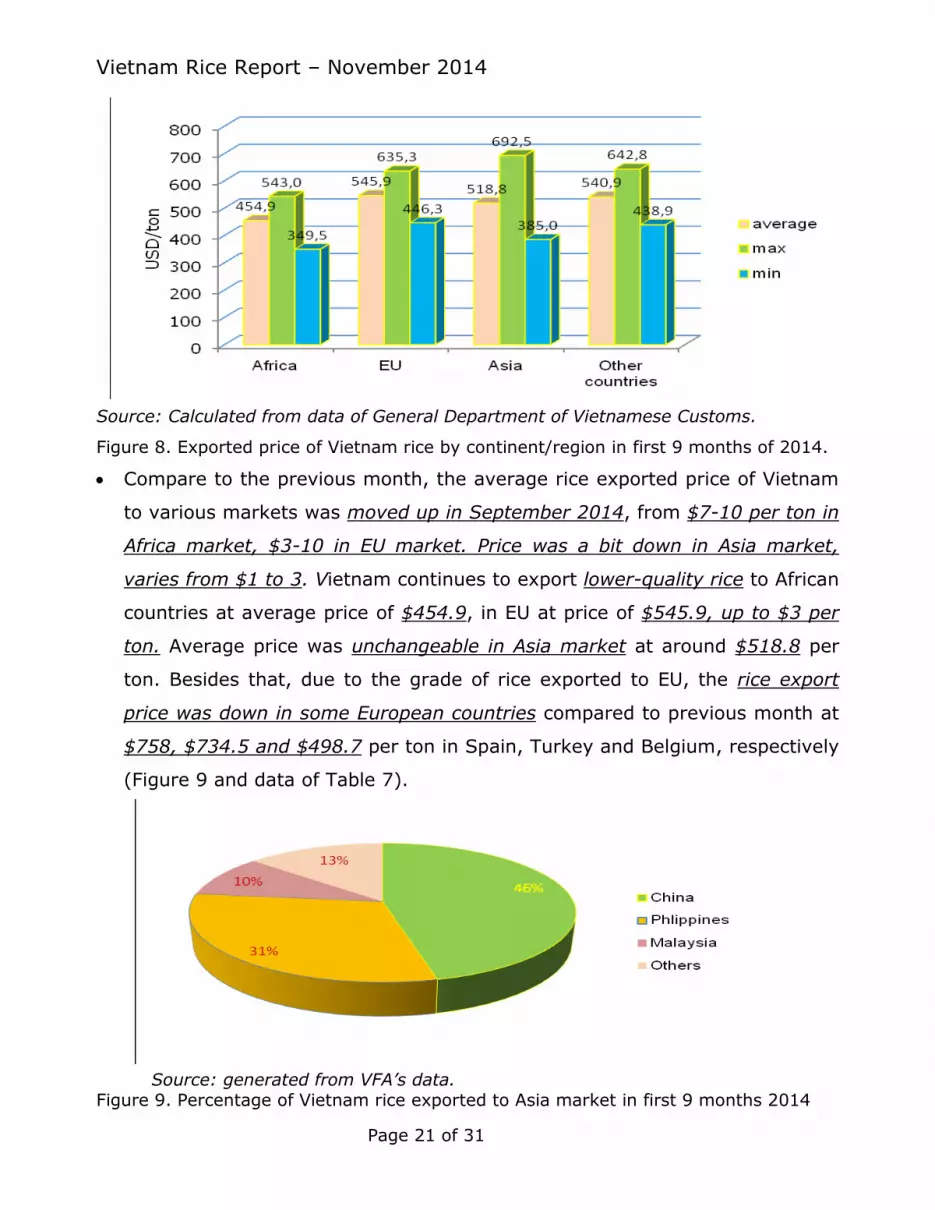
Source: Calculated from data of General Department of Vietnamese Customs.
Figure 8. Exported price of Vietnam rice by continent/region in first 9 months of 2014.
Compare to the previous month, the average rice exported price of Vietnam
to various markets was moved up in September 2014, from $7-10 per ton in
Africa market, $3-10 in EU market. Price was a bit down in Asia market,
varies from $1 to 3. Vietnam continues to export lower-quality rice to African
countries at average price of $454.9, in EU at price of $545.9, up to $3 per
ton. Average price was unchangeable in Asia market at around $518.8 per
ton. Besides that, due to the grade of rice exported to EU, the rice export
price was down in some European countries compared to previous month at
$758, $734.5 and $498.7 per ton in Spain, Turkey and Belgium, respectively
(Figure 9 and data of Table 7).
Source: generated from VFA’s data. Figure 9. Percentage of Vietnam rice exported to Asia market in first 9 months 2014

Vietnam Rice Report – November 2014
Page 22 of 31
Source: generated from VFA’s data.
Figure 10. Percentage of rice quantity imported by Asia countries’ market in September 2014
4.3 Domestic prices and Market trends
Note: Price delivered at port no bagged. Source: generated from VFA’s data.
Figure 11. Fluctuation of rice price in domestic by grade from March to October 2014
The general trend of domestic price (delivered at port without package at
standard of 5%, 15%, 25% broken) in October 2014 was move down
slightly compared to September then retored in the end of October because
of the peak harvesting season in MRD, at around VND 8,000 to 9,000 per kg
(Figure 12 and Table 8). Selling price at farm-gate varies around VND 5,600
to 5,950 per kg (dry paddy) depending on quality of paddy rice (long grain
or ordinary rice), at stable price in compared to September. The price raw
rice for processing (grade 5% and 25% broken) tends to move up in the end
Vietnam Rice Report – November 2014
Page 23 of 31
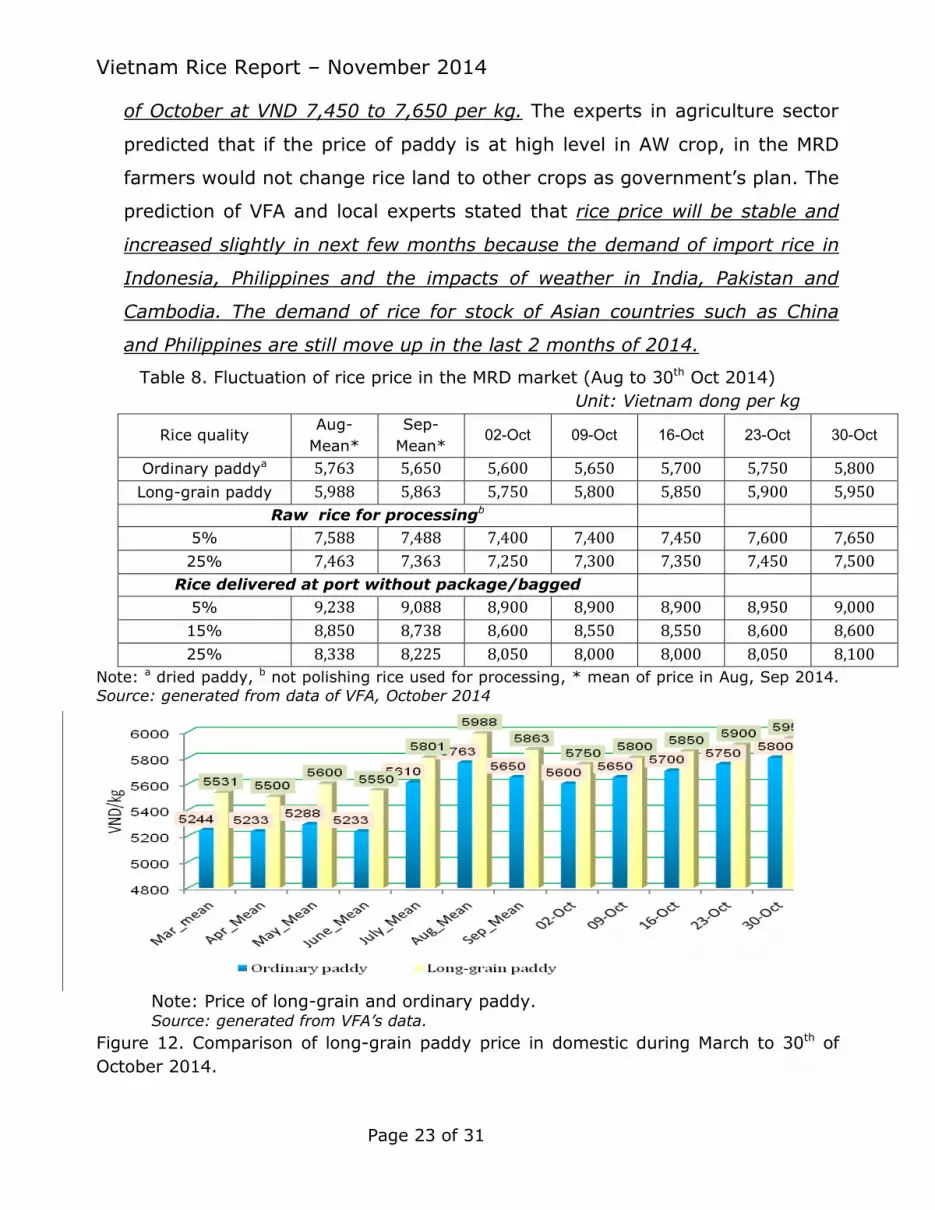
of October at VND 7,450 to 7,650 per kg. The experts in agriculture sector
predicted that if the price of paddy is at high level in AW crop, in the MRD
farmers would not change rice land to other crops as government’s plan. The
prediction of VFA and local experts stated that rice price will be stable and
increased slightly in next few months because the demand of import rice in
Indonesia, Philippines and the impacts of weather in India, Pakistan and
Cambodia. The demand of rice for stock of Asian countries such as China
and Philippines are still move up in the last 2 months of 2014.
Table 8. Fluctuation of rice price in the MRD market (Aug to 30th Oct 2014)
Unit: Vietnam dong per kg
Rice quality Aug-
Mean*
Sep-
Mean* 02-Oct 09-Oct 16-Oct 23-Oct 30-Oct
Ordinary paddya 5,763 5,650 5,600 5,650 5,700 5,750 5,800
Long-grain paddy 5,988 5,863 5,750 5,800 5,850 5,900 5,950
Raw rice for processingb
5% 7,588 7,488 7,400 7,400 7,450 7,600 7,650
25% 7,463 7,363 7,250 7,300 7,350 7,450 7,500
Rice delivered at port without package/bagged
5% 9,238 9,088 8,900 8,900 8,900 8,950 9,000
15% 8,850 8,738 8,600 8,550 8,550 8,600 8,600
25% 8,338 8,225 8,050 8,000 8,000 8,050 8,100
Note: a dried paddy, b not polishing rice used for processing, * mean of price in Aug, Sep 2014.
Source: generated from data of VFA, October 2014
Note: Price of long-grain and ordinary paddy. Source: generated from VFA’s data.
Figure 12. Comparison of long-grain paddy price in domestic during March to 30th of
October 2014.
Vietnam Rice Report – November 2014
Page 24 of 31
The trend of very high fluctuation of domestic price of various grades,
particularly the long-grain paddy during 8 months from March to October
2014. In October 2014, the prices of good-quality dry paddy are at average
VND 5,750–5,950 per kg, a bit up VND 100-250 per kg compared to
previous month. In general, price of rice has slightly moved up in the end of
October after down trend in the beginning of this month. The average rice
price of long-grain grade in August was at VND 5,988 and VND 5,863 per kg
in September 2014 in domestic market (Figure 13).
In October 2014, the trend of domestic consumption quite similarly the
previous month. The domestic consumption level of is quite stable in term of
quantity and price. The selling price of polishing or husked rice in local and
city markets does not change much in this month, the market force of rice is
slowly, some stock are being for Tet festivals, and there are many promotion
and marketing activities the markets of Ho Chi Minh, Ha Noi, Hai Phong, Da
Nang cities.
In the rural areas, the market price of poultry and pig continues to move up
since the previous month. Farmers increase the amount of animal husbandry
to prepare for Vietnamese festival in February 2015. Therefore, the tend to
use paddy rice as a supplement feed for animals increases slightly in this
month and predict to move up in next coming months.
4.4 Export prices and Market trends
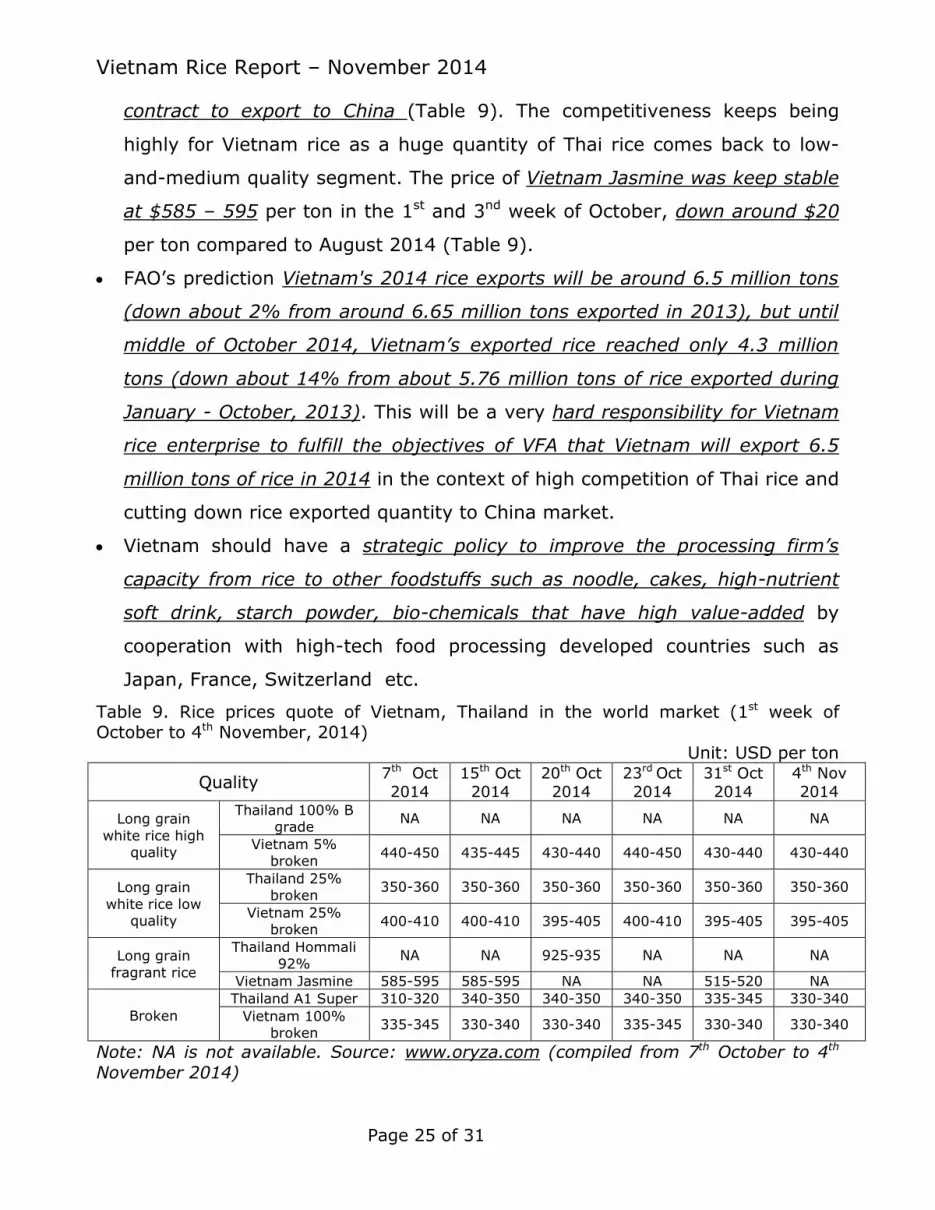
Generally, in October 2014, Vietnam enterprises have strengthen their
exportation by different marketing activities. As a consequence, the rice
price quoted by Vietnam is continuing at higher than Thailand for all quality
grade (According to VFA). Generally, the most of Vietnam rice price quote
had down in October 2014 at about $5 to $20 per ton, lower than previous
month, particularly long-grain white rice low quality 25% broken rice price
moved down from $5 to 20 per ton, but still higher than Thai rice at the
same quality due to Thai had quote very competitive price and gained the
Vietnam Rice Report – November 2014
Page 25 of 31
contract to export to China (Table 9). The competitiveness keeps being
highly for Vietnam rice as a huge quantity of Thai rice comes back to low-
and-medium quality segment. The price of Vietnam Jasmine was keep stable
at $585 – 595 per ton in the 1st and 3nd week of October, down around $20
per ton compared to August 2014 (Table 9).
FAO’s prediction Vietnam's 2014 rice exports will be around 6.5 million tons
(down about 2% from around 6.65 million tons exported in 2013), but until
middle of October 2014, Vietnam’s exported rice reached only 4.3 million
tons (down about 14% from about 5.76 million tons of rice exported during
January - October, 2013). This will be a very hard responsibility for Vietnam
rice enterprise to fulfill the objectives of VFA that Vietnam will export 6.5
million tons of rice in 2014 in the context of high competition of Thai rice and
cutting down rice exported quantity to China market.
Vietnam should have a strategic policy to improve the processing firm’s
capacity from rice to other foodstuffs such as noodle, cakes, high-nutrient
soft drink, starch powder, bio-chemicals that have high value-added by
cooperation with high-tech food processing developed countries such as
Japan, France, Switzerland etc.
Table 9. Rice prices quote of Vietnam, Thailand in the world market (1st week of October to 4th November, 2014)
Unit: USD per ton
Quality 7th Oct
2014
15th Oct
2014
20th Oct
2014
23rd Oct
2014
31st Oct
2014
4th Nov
2014
Long grain
white rice high quality
Thailand 100% B grade
NA NA NA NA NA NA
Vietnam 5% broken
440-450 435-445 430-440 440-450 430-440 430-440
Long grain
white rice low quality
Thailand 25%
broken 350-360 350-360 350-360 350-360 350-360 350-360
Vietnam 25% broken
400-410 400-410 395-405 400-410 395-405 395-405
Long grain
fragrant rice
Thailand Hommali 92%
NA NA 925-935 NA NA NA
Vietnam Jasmine 585-595 585-595 NA NA 515-520 NA
Broken
Thailand A1 Super 310-320 340-350 340-350 340-350 335-345 330-340
Vietnam 100% broken
335-345 330-340 330-340 335-345 330-340 330-340
Note: NA is not available. Source: www.oryza.com (compiled from 7th October to 4th
November 2014)
Vietnam Rice Report – November 2014
Page 26 of 31
4.5 Analysis, Opinion, and Prediction
Vietnam rice exportation keep going well in October 2014 even a little bit
down compared to previous month in both of exported value and quantity of
rice. Because of rivalry competitors of Vietnam – Thailand – has coming back
and competes in low-medium-grade segment that Vietnamese rice
enterprise dominate in recent years. However, the Vietnamese exporters still
have many opportunities and diversified segment of markets not only in Asia
but also in European Union, and African market such as Spain, Turkey,
Ukraine, Belgium, Indonesia, Malaysia, Philippines, Singapore, Taiwan, Hong
Kong, Senegal, Ghana, The exported price of Vietnam rice is highly
competition with other rice exporters in Asia, particularly Thailand because
Vietnam rice quality and delivery conditions have improved in recent
months.
The quantity of rice export to China has been reduced in October and
Vietnamese enterprises negotiated with Chinese in high quoted price in
official contract. Besides that, Vietnamese exporters are searching for other
markets in order to diversify market and find out potential rice importers.
This is a good market signal for Vietnam rice sectors, to avoid the
dependence on Chinese market.
Thai rice exporters has returned to the global rice market after stabilization
of political crisis in last few months and expected to export around 11 million
tons of rice in 2014 and they always quoted at lower price than Vietnam rice
in recent months to get high competition in term of price in the
segmentation of low-and-medium quality that Vietnam rice has dominated
this year and previous years. A new launched strategy of Vietnamese
government for reducing low-efficiency rice land, improving rice quality by
the way to enhance capacity of processing and on-field management, to
reduce the costs of production, and focus on cultivation of high-quality rice
varieties are favorable strategy in this context.
Vietnam Rice Report – November 2014
Page 27 of 31
4.6 Other related news
Thailand’s Commerce Minister told local sources that the government will
take certain measures to stabilize the price of Thai Hom Mali rice at around
15,000-16,000 baht (around $461-$492) per ton. The prescribed rate called
the “median rate” will be announced after approval from the National Rice
Policy Committee. The Minister noted that millers and exporters should buy
Hom Mali rice from farmers at the “median rate” and farmers are also
educated about the “median rate” so that they don't end up selling at a loss
because the duration of the “median price” will depend on global prices. The
government is encouraging farmers to store their harvest to delay sales to
control downward pressure on prices by providing low-interest loans.
Farmers are also encouraged to work closely with exporters to increase Hom
Mali rice exports to markets such as China, Africa and the ASEAN. The
government estimates the Thai Hom Mali rice production at about 6 million
tons this year (Source: http://www.oryza.com/print/20700#sthash.jbXF29tb.dpuf).
Thailand's Commerce Ministry is reportedly negotiating with the
governments of Malaysia, Indonesia, Philippines as well as African and
Middle East countries to secure G2G deals to sell an additional 900,000 to
one million tons of rice this year. The Ministry has already shipped over
700,000 tons of rice under G2G contracts to China, Indonesia and the
Philippines. Thai government is particularly keen on signing a new one
million ton G2G deal with China. Currently, the Deputy Prime Minister is in
Beijing to persuade China to sign a new deal. The government is also likely
to use the Asia-Pacific Economic Cooperation Summit forum in Beijing to
discuss with China about the new deals. The Prime Minister has expressed
confidence that Thailand would export over 11 million tons of rice this year.
According to data from the Thai Rice Exporters Association (TREA), Thailand
exported around 6.6 million tons of rice in the first eight months (January -
August) of 2014, up about 59% from around 4.14 million tons exported
during the same period in 2013 (Source: http://www.oryza.com).
Vietnam Rice Report – November 2014
Page 28 of 31
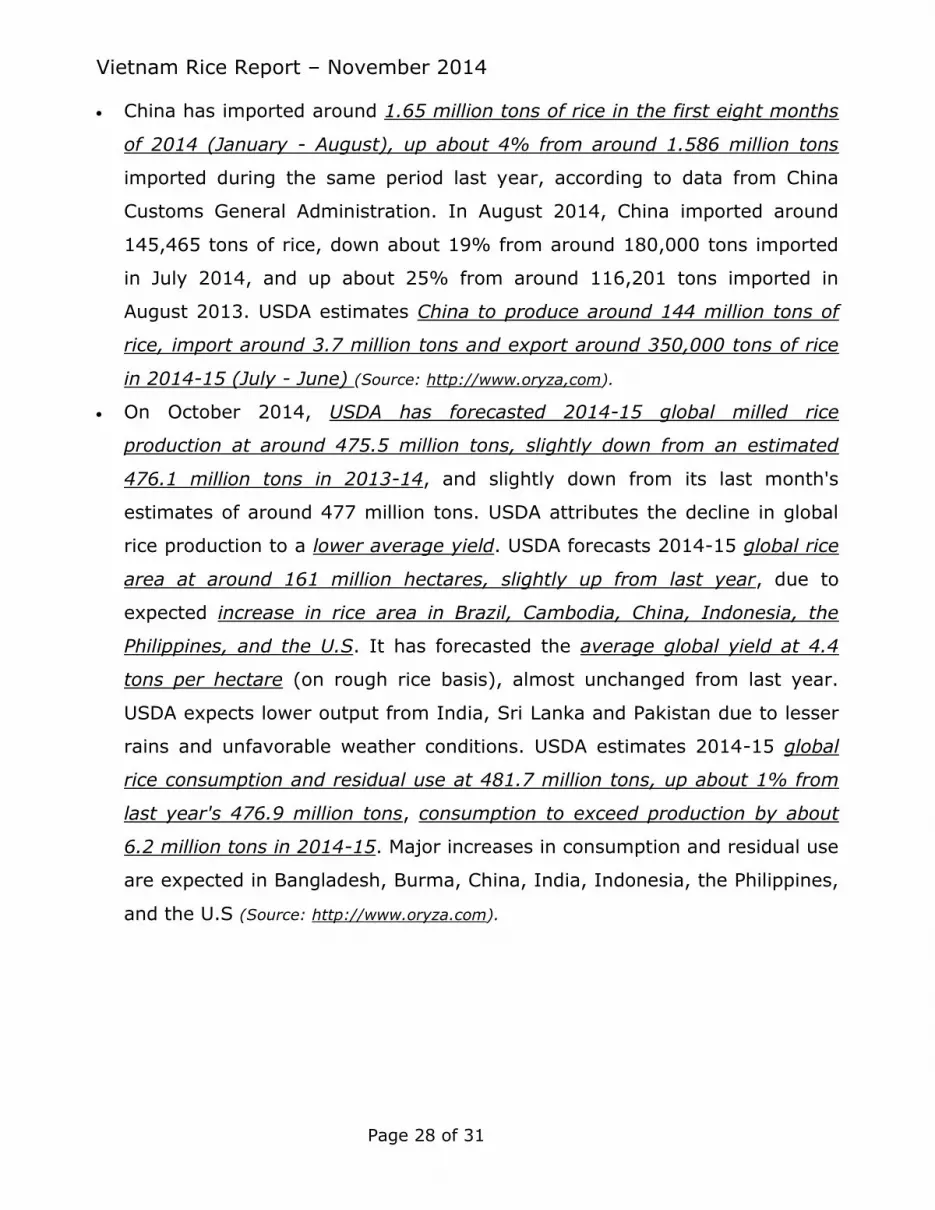
China has imported around 1.65 million tons of rice in the first eight months
of 2014 (January - August), up about 4% from around 1.586 million tons
imported during the same period last year, according to data from China
Customs General Administration. In August 2014, China imported around
145,465 tons of rice, down about 19% from around 180,000 tons imported
in July 2014, and up about 25% from around 116,201 tons imported in
August 2013. USDA estimates China to produce around 144 million tons of
rice, import around 3.7 million tons and export around 350,000 tons of rice
in 2014-15 (July - June) (Source: http://www.oryza,com).
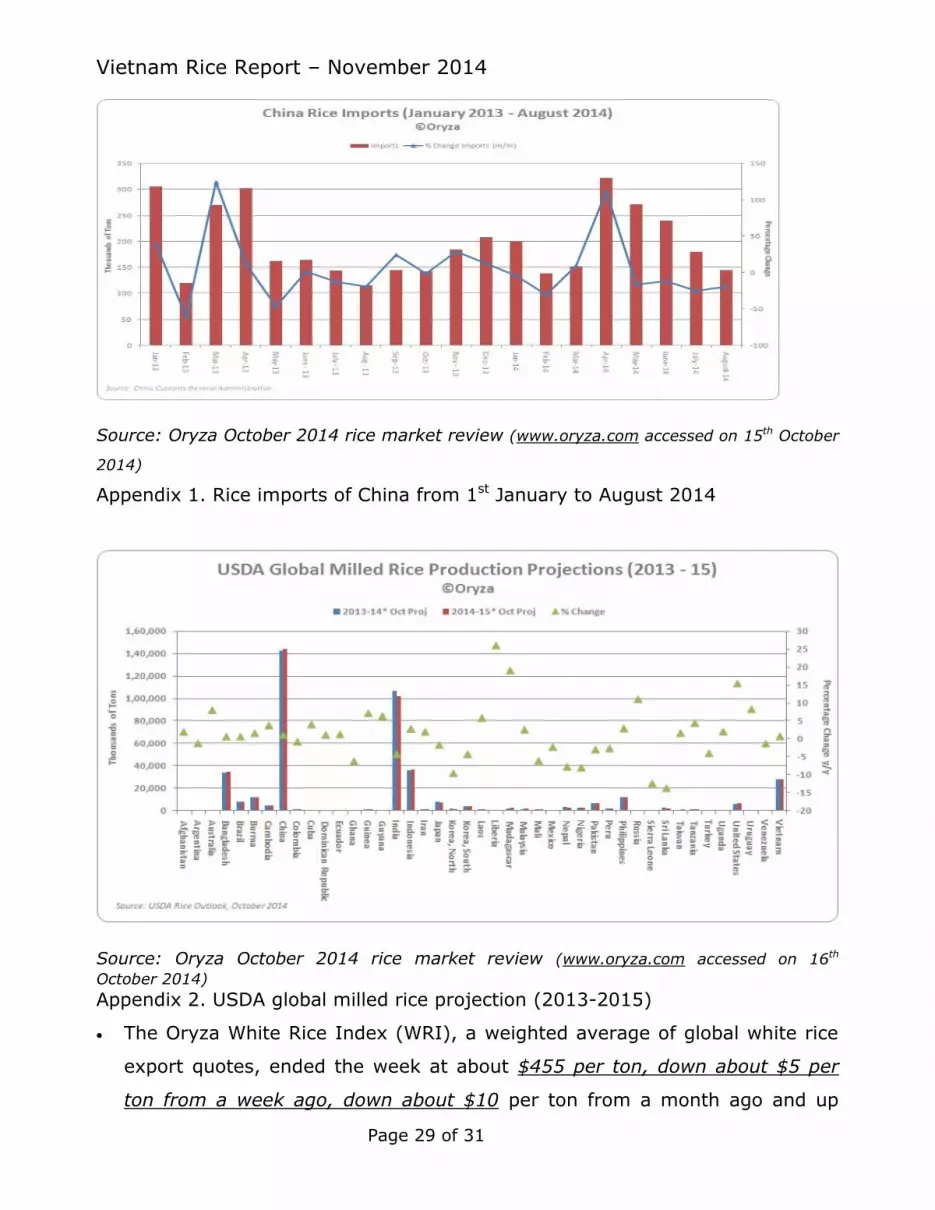
On October 2014, USDA has forecasted 2014-15 global milled rice
production at around 475.5 million tons, slightly down from an estimated
476.1 million tons in 2013-14, and slightly down from its last month's
estimates of around 477 million tons. USDA attributes the decline in global
rice production to a lower average yield. USDA forecasts 2014-15 global rice
area at around 161 million hectares, slightly up from last year, due to
expected increase in rice area in Brazil, Cambodia, China, Indonesia, the
Philippines, and the U.S. It has forecasted the average global yield at 4.4
tons per hectare (on rough rice basis), almost unchanged from last year.
USDA expects lower output from India, Sri Lanka and Pakistan due to lesser
rains and unfavorable weather conditions. USDA estimates 2014-15 global
rice consumption and residual use at 481.7 million tons, up about 1% from
last year's 476.9 million tons, consumption to exceed production by about
6.2 million tons in 2014-15. Major increases in consumption and residual use
are expected in Bangladesh, Burma, China, India, Indonesia, the Philippines,
and the U.S (Source: http://www.oryza.com).
Vietnam Rice Report – November 2014
Page 29 of 31
Source: Oryza October 2014 rice market review (www.oryza.com accessed on 15th October
2014)
Appendix 1. Rice imports of China from 1st January to August 2014
Source: Oryza October 2014 rice market review (www.oryza.com accessed on 16th
October 2014)
Appendix 2. USDA global milled rice projection (2013-2015)
The Oryza White Rice Index (WRI), a weighted average of global white rice
export quotes, ended the week at about $455 per ton, down about $5 per
ton from a week ago, down about $10 per ton from a month ago and up
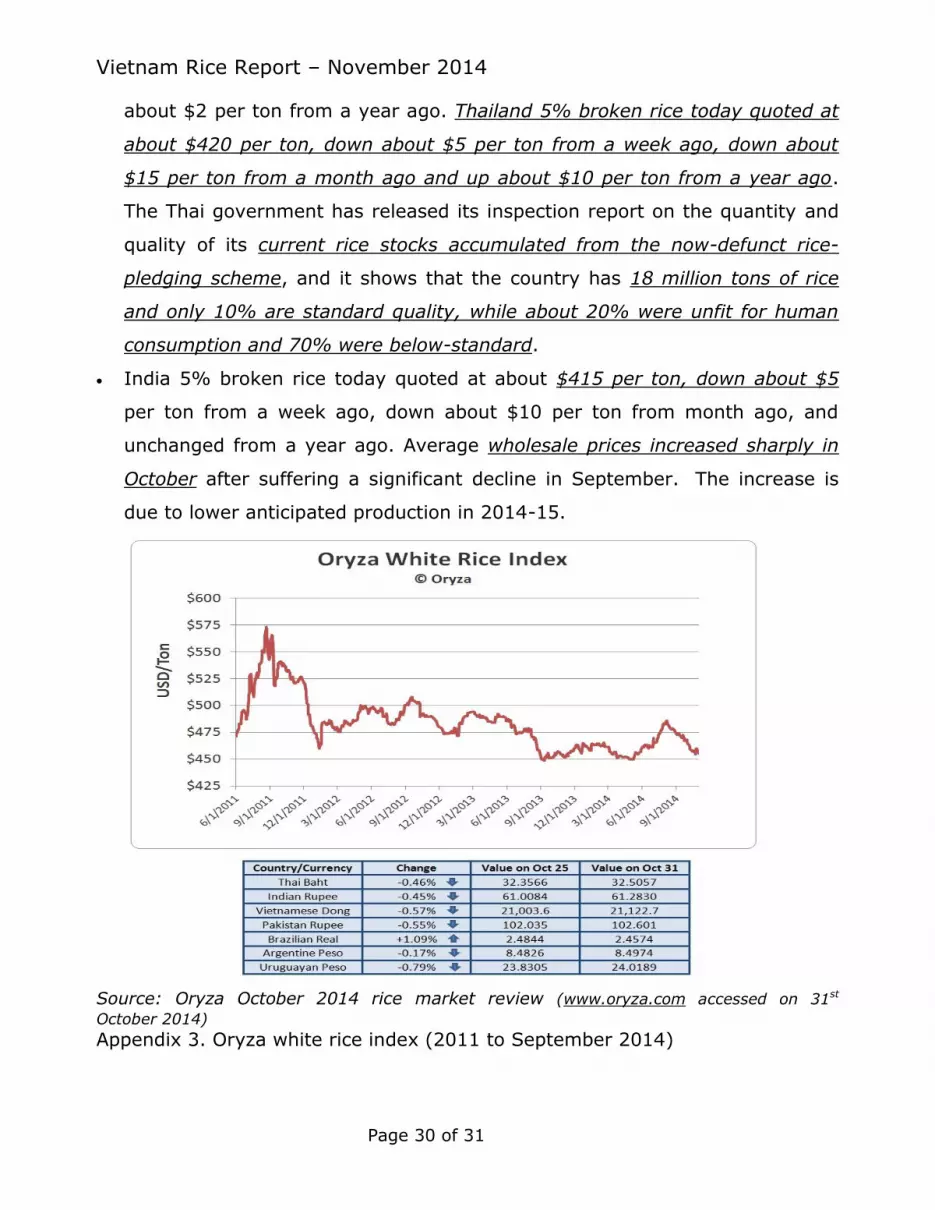
Vietnam Rice Report – November 2014
Page 30 of 31
about $2 per ton from a year ago. Thailand 5% broken rice today quoted at
about $420 per ton, down about $5 per ton from a week ago, down about
$15 per ton from a month ago and up about $10 per ton from a year ago.
The Thai government has released its inspection report on the quantity and
quality of its current rice stocks accumulated from the now-defunct rice-
pledging scheme, and it shows that the country has 18 million tons of rice
and only 10% are standard quality, while about 20% were unfit for human
consumption and 70% were below-standard.
India 5% broken rice today quoted at about $415 per ton, down about $5
per ton from a week ago, down about $10 per ton from month ago, and
unchanged from a year ago. Average wholesale prices increased sharply in
October after suffering a significant decline in September. The increase is
due to lower anticipated production in 2014-15.
Source: Oryza October 2014 rice market review (www.oryza.com accessed on 31st
October 2014)
Appendix 3. Oryza white rice index (2011 to September 2014)
Vietnam Rice Report – November 2014
Page 31 of 31
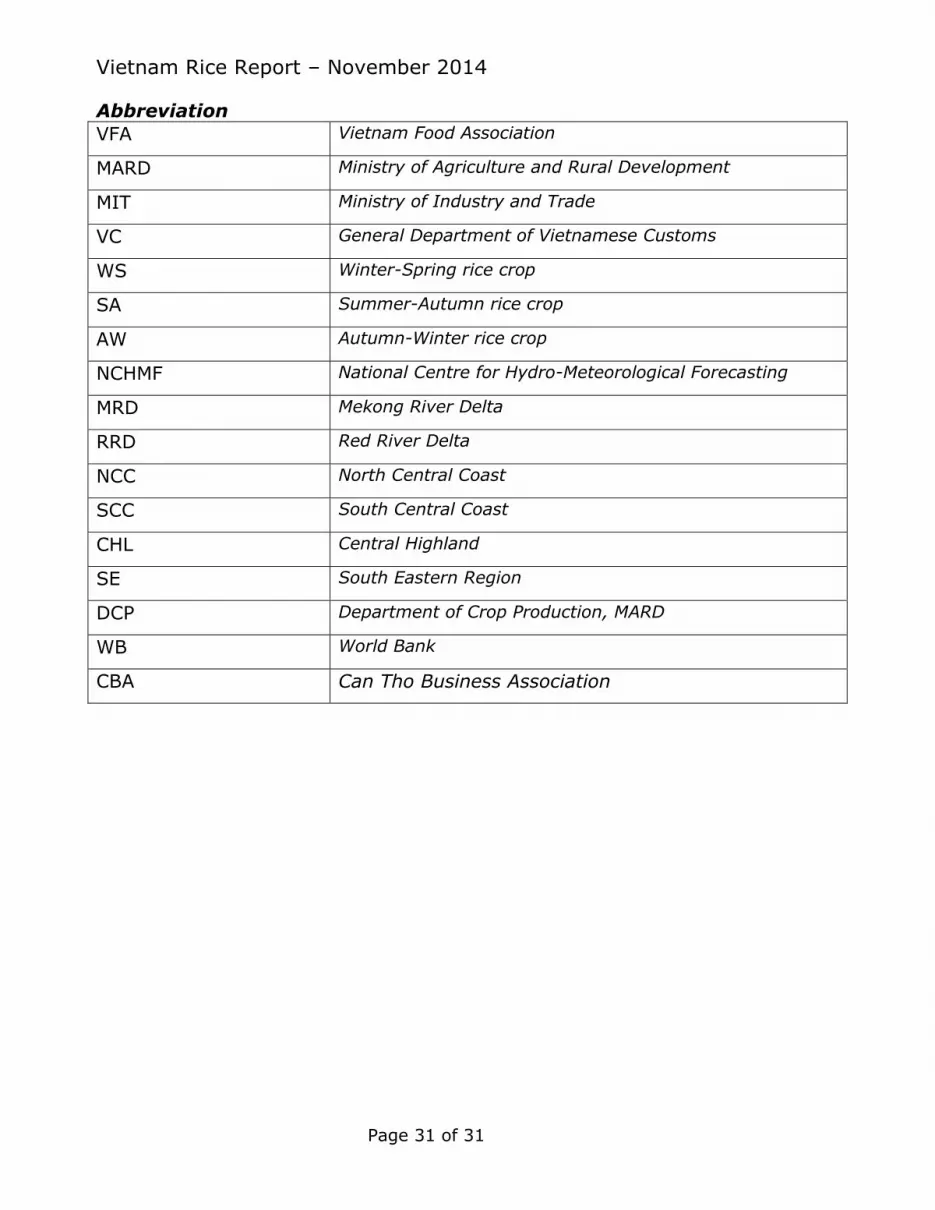
Abbreviation
VFA Vietnam Food Association
MARD Ministry of Agriculture and Rural Development
MIT Ministry of Industry and Trade
VC General Department of Vietnamese Customs
WS Winter-Spring rice crop
SA Summer-Autumn rice crop
AW Autumn-Winter rice crop
NCHMF National Centre for Hydro-Meteorological Forecasting
MRD Mekong River Delta
RRD Red River Delta
NCC North Central Coast
SCC South Central Coast
CHL Central Highland
SE South Eastern Region
DCP Department of Crop Production, MARD
WB World Bank
CBA Can Tho Business Association


