Embed Size (px)
Citation preview

ISSN 1327-8231
Working Paper No. 171
Economic Growth and Transition in Vietnam and China and its Consequences for their
Agricultural Sectors: Policy and Agricultural Adjustment Issues
by
Clem Tisdell
September 2010
ECONOMICS, ECOLOGY AND THE ENVIRONMENT
THE UNIVERSITY OF QUEENSLAND

ISSN 1327-8231 WORKING PAPERS ON
ECONOMICS, ECOLOGY AND THE ENVIRONMENT
Working Paper No. 171
Economic Growth and Transition in Vietnam and China and its Consequences for their Agricultural
Sectors: Policy and Agricultural Adjustment Issues*
by
Clem Tisdell†
September 2010
© All rights reserved
* Forthcoming in the Regional Development Studies Journal Vol 13 † School of Economics, The University of Queensland, St. Lucia Campus, Brisbane QLD 4072,
Australia Email: [email protected]

WORKING PAPERS IN THE SERIES, Economics, Ecology and the Environment are published by the School of Economics, University of Queensland, 4072, Australia, as follow up to the Australian Centre for International Agricultural Research Project 40 of which Professor Clem Tisdell was the Project Leader. Views expressed in these working papers are those of their authors and not necessarily of any of the organisations associated with the Project. They should not be reproduced in whole or in part without the written permission of the Project Leader. It is planned to publish contributions to this series over the next few years. Research for ACIAR project 40, Economic Impact and Rural Adjustments to Nature Conservation (Biodiversity) Programmes: A Case Study of Xishuangbanna Dai Autonomous Prefecture, Yunnan, China was sponsored by the Australian Centre for International Agricultural Research (ACIAR), GPO Box 1571, Canberra, ACT, 2601, Australia. The research for ACIAR project 40 has led in part, to the research being carried out in this current series. For more information write to Emeritus Professor Clem Tisdell, School of Economics, University of Queensland, St. Lucia Campus, Brisbane 4072, Australia.

Economic Growth and Transition in Vietnam and China and its Consequences
for their Agricultural Sectors: Policy and Agricultural Adjustment Issues
ABSTRACT
Secondary data are used to discuss and compare the consequences for agriculture of
economic growth and transition in Vietnam and China. It is found that China and
Vietnam have experienced similar adjustments in their agricultural sectors and face at
this time, similar agricultural policy problems. China began its economic reforms in
1979 and Vietnam followed in 1986. Since then both countries have experienced rapid
economic growth, falling poverty rates and significant rises in per capita income. At
the same time, substantial restructuring of their economies has occurred, a feature of
which has been a decline in the relative contribution of agriculture to total
employment and output. These changes are outlined. Significant changes have also
occurred within the agricultural sectors of China and Vietnam and these are reviewed.
In both countries, the livestock sector has grown in relative importance. Households
are the main contributors to agricultural production but their individual holdings of
land are small by Western standards and households keeping livestock mostly only
hold a few head. Given the exit of farmers from agriculture, pressures are mounting
for increasing the size of agricultural units. This exit can add to economic efficiency
and growth. Policies to facilitate movements from farm to non-farm employment are
discussed and analysed. Property rights and the marketability of agricultural land can
facilitate such movements and contribute to economic efficiency. In recent times,
China and Vietnam have extended property rights in agricultural land and have
increased its marketability. These measures are outlined. With further economic
development and transition, it is predicted that these rights and the marketability of
agricultural land will be further extended. However, if previous practice is followed,
those policy changes are likely to be gradual.
Keywords: Agricultural development, Asia, China, economic transition, farm
employment, land reforms, land rights, livestock, non-farm employment, structural
change.
JEL Classification: O25, O5, P32, Q1
1

Economic Growth and Transition in Vietnam and China and its Consequences
for their Agricultural Sectors: Policy and Agricultural Adjustment Issues
1. Introduction
Since the commencement of market-related reforms in Vietnam and China and their
subsequent high rates of economic growth which have been sustained for a long
period, significant changes have occurred in their agricultural sectors both in their size
relative to the other economic sectors and within these sectors themselves, for
example, in the composition of agricultural production. Most of these changes have
been as a result of the growth of these economies. Economic growth has altered the
sectoral demand for labour (the demand for labour in secondary and tertiary industries
has expanded relative to that in agriculture) and rising incomes have changed the
composition of commodities demanded by consumers. Secondary data are used in this
article to examine and compare these changes in Vietnam and China. Both China and
Vietnam began their economic reforms in agriculture and then later, extended the
reform processes to the other sectors of their economies. Therefore, although
agricultural reform was the prime mover of their reform process, subsequently,
agriculture’s economic future was largely determined by the economic development
of the secondary and tertiary sectors of these economies, as this article illustrates.
The successful and continuing growth of secondary and tertiary industries in Vietnam
and China has resulted in higher incomes and lower poverty rates in urban areas than
in rural areas and provided a strong economic incentive for rural-to-urban migration.
However, there are still some impediments to this migration and policies to address
these constraints are suggested. Furthermore, pressures have developed for greater
economic adjustment in agriculture itself. This could be facilitated by greater use of
market mechanism such as could be achieved by fostering greater rights in private
property in agricultural land and by making it easier to market agricultural land. These
aspects are discussed.
It is useful to examine and compare the development of the agricultural sectors of
Vietnam and China because both initially had central planning systems and
2

collectivized agriculture. Furthermore, both have adopted a similar pattern of
economic reforms, even though market reforms started later in Vietnam than in China.
Therefore, it is reasonable to believe that their patterns of agricultural development
would be similar and that they would also experience similar agricultural policy
problems. Nevertheless, there are some differences in their reform processes. For
example, rural manufacturing development, until recently, received less emphasis in
Vietnam than in China where the establishment of town-and-village enterprises was
an integral part of China’s economic reform and development process.
While the main focus in this article is on Vietnam, its relevant economic experiences
and policies are compared with those of China. After providing some background on
market reforms in Vietnam and China, this article outlines important comparative
features of Vietnam and China paying particular attention to the attributes of their
agricultural sector. Information is provided on their economic growth rates and on
poverty rates and the average level of per capita income in urban areas compared to
rural areas. Lower poverty rates and higher income levels in urban areas than rural
areas have been drivers for rural-to-urban migration and for the exit of farmers from
agriculture to fill jobs in manufacturing and the service industries, located mainly in
urban areas. Consequently, as shown, agriculture’s share in national output and
employment has fallen. Nevertheless, as discussed, poverty and income inequalities
persist between urban and rural areas because of impediments to the movement of
labour from agriculture to urban areas.
Also important changes have occurred within agriculture itself. There is evidence that
some increase in specialization in agricultural production has been brought about by
freer international trade but there are constraints on this specialization as indicated by
pig production in Vietnam. Secondly, livestock production has increased in relative
size as a component of agricultural production. This has happened because rising per
capita incomes in both China and Vietnam have increased the demand for livestock
products relative to that for other agricultural commodities. This is because of the
higher income elasticity of demand for livestock products than for most other
agricultural products. Both Vietnam and China have been unable to meet their
increased demand for livestock products from their own resource – they have had to
increase their imports of food for livestock and some livestock products.
3

Most farms in China and Vietnam are small compared to those in the West and are
less specialized in production. Some policy-makers in Vietnam and China believe that
if their farms were larger in size and more specialized in production that they would
have greater ability to expand agricultural supplies. However, as discussed, continuing
impediments to rural-to-urban migration and to the exit of labour from agriculture,
plus restricted private property rights in agricultural land and difficulties in marketing
agricultural land, limit the development of large-sized more specialized farms. Policy-
makers in China and Vietnam are aware of these issues and as is considered in this
article, are implementing reforms to address them.
2. Market Reforms
Agricultural reform and development have played a pivotal role in the economic
growth and evolution of transitional economies in Asia. China’s economic reforms
began, for example, in 1979 with agriculture and its rural sector. The household
responsibility system was introduced to replace the collective system of agricultural
production and gradually farmers were given greater freedom to respond to market
signals in making their decisions about agricultural production (Tisdell, 1993, Ch. 9;
1995, Ch. 9). At the same time, the development of town-and-village enterprises was
encouraged. These reforms in China’s rural sector were a precursor to economic
reforms in the remainder of its economy (Tisdell, 2009b).
Vietnam adopted a similar market reform policy to China’s earlier policy. In 1986,
Vietnam adopted its economic reform policy, Doi Moi, a renovation policy. It moved
quickly to implement this economic reform policy. This policy involved the
decollectivization of agriculture, the allocation of land to rural households, and
emphasis on market systems as means for resource allocation. It is claimed that the
commencement of Doi Moi “was followed by a series of reforms that effectively
ended the system of resource allocation through central planning by 1989” (Son et al.,
2006, p.2).
Vietnam did not begin its market reforms until almost two decades after China did.
The delay by Vietnam in undertaking its reforms was probably influenced by its long
period of involvement in war (the country was not reunified until 1975). Vietnam had
4

a close political connection with the former USSR for several decades prior to its Doi
Moi. By 1986, it would have become clear in Vietnam that the communist system of
the former USSR was no longer stable, and by that time, China’s economic reform
had yielded visible economic results. Therefore, China’s policy of gradual economic
reforms must have seemed a worthwhile policy for Vietnam to emulate.
Both China and Vietnam rejected the ‘big-bang’ approach to economic reforms and
opted instead for a more gradual approach to institutional change. According to Lin
(2009, p.19), “China and Vietnam did not follow the transitional approach advocated
by the prevailing social thought of the 1980s and 1990s”. The Washington consensus
summed up this thought and favoured a rapid transition to a comprehensive free
market system. Russia attempted to follow this ‘big-bang’ approach but in doing so,
suffered severe economic disruption for a considerable time.
Although China and Vietnam have made extensive market reforms and have achieved
high rates of economic growth in recent decades, free markets have not yet been fully
established in agriculture. This is mainly due to the limited property rights of
landholders in their land. This land issue is growing in importance as these economies
continue to restructure and the number and percentage of persons engaged in
agriculture declines. In this altering situation, small-sized agricultural holdings tend to
become less economic, and the need to restructure agriculture and increase the sizes
of land holdings become more pressing. Land reforms have been undertaken both in
China and Vietnam to adjust to this changing situation but further reform will be
required as the economic growth of these countries continues.
3. Comparative Economic Features of Vietnam and of China, especially in
Relation to their Agriculture and their Rural Sectors. Intersectoral Change
and Rural-to-Urban Migration Highlighted
There are both similarities and differences between the economies of China and
Vietnam. China’s economy is much larger than that of Vietnam. In 2008, for example,
China’s population was 1,326 million compared to 86 million for Vietnam. In 2007,
GDP per capita based on purchasing power parity was USD5370 for China and USD
2550 for Vietnam (General Statistical Office of Vietnam, 2009, pp. 689-690). From
5

these figures, it can be seen that the size of China’s market is more than 30 times that
of Vietnam’s market.
Both countries have recorded substantial and sustained economic growth in recent
decades. However, since 1979, China’s growth rate of GDP has consistently exceeded
that of Vietnam (Maddison, 2006, and more recent sources). In the period 2000-2007,
China’s annual growth rate of GDP varied between 10 and 11.9 per cent and that of
Vietnam ranged from 7.34 to 8.46 per cent. These high growth rates have been
accompanied by falling rates of rural poverty in China and in Vietnam (General
Statistical Office of Vietnam, 2009, pp. 618-619; Huang et al., 2006, Fig. 1; Son et al.,
2006, Figure 2).
Both in China and in Vietnam, rural poverty rates are higher than urban poverty rates
and on average, urban incomes per capita exceed those in rural areas to a considerable
extent. This has provided a strong economic incentive for rural-to-urban migration
and for labour to exit the agricultural sectors of these economies. Regional disparities
in poverty rates and in levels of per capita incomes are also marked in both countries.
In China, average income levels per capita are lower and poverty rates are higher in
provinces in the west compared to those in the east. Significant regional differences in
income levels and in poverty rates also occur in Vietnam (General Statistical Office of
Vietnam, 2009).
Table 1 shows the ratio of the average level of urban income per capita to the average
level of rural income per capita in Vietnam. This ratio is in excess of two but is slowly
falling. Considerable income inequality exists between regions and provinces in
Vietnam. The highest level of income per capita occurs in the South East region
(where Ho Chi Minh City is located), followed by the Red River Delta (where Hanoi
is located) and then in the Mekong Delta, which is also relatively close to Ho Chi
Minh City. The lowest levels of per capita income on average occur in the Northern
Midlands and Mountain regions. The average level of income in the region of
Vietnam with the highest level of per capita income compared to that with the lowest
level of per capita income also exceeds two but is declining (see Table 1). Therefore,
on average, both rural and urban income inequality and regional income inequality are
falling.
6

Table 1: The ratio of the level of average per capita income to average rural per capita income for Vietnam in the period 1996-2006 and also the ratio of per capita income in the region with the highest per capita income compared to the region with the lowest level of per capita income
Year Ratio of urban income
levels compared to rural income levels
Ratio of incomes in the region with highest income levels compared to that with the
region with the lowest income levels
1996 2.30 2.87 2002 2.26 2.81 2004 2.16 2.73 2006 2.09 2.59
Source: Based on General Statistics Office (2009, Table 294)
Table 2 provides data on poverty rates in Vietnam based on the poverty lines adopted
by the Government of Vietnam. Although Vietnam’s poverty rates are higher than
those in China, they have declined considerably since 1998 and are now well below
the poverty rates prevailing in most of South Asia. As is usual in developing countries,
the poverty rate in Vietnam in urban areas is below that in rural areas. The general
trend has been for poverty rates to decline both in urban and in rural areas in Vietnam.
Nevertheless, in some regions and provinces, poverty rates are very high. They are
highest in the Northern midlands and mountain areas of Vietnam followed by the
Central Highlands, and then the North Central area and Central Coast area. They are
lowest in the South East and in the Red River Delta. Regions having higher average
levels of per capita income tend to have lower poverty rates in Vietnam. In the
Northern Midlands and mountain areas, the poverty rate in 2007 in Dien Bien
province was 56.8 per cent and it exceeded 40 per cent in the provinces of Phu Tho
and in Cao Bang.
7

Table 2: Poverty rates for the whole of Vietnam, urban and rural areas and by region in the period 1998-2008 based on the poverty lines used by the Government Statistical Office of Vietnam
Place 1998 2002 2004(a) 2006 2007 2008(b)
Whole Country 37.4 28.9 18.1 15.5 14.8 13.5 Urban 9.0 6.6 8.6 7.7 7.4 6.7 Rural 44.9 35.6 21.2 18.0 17.7 16.2 By Region Red River Delta 30.7 21.5 12.7 10.0 9.5 8.4 Northern Midlands and Mountain areas
64.5
47.9
29.4
27.5
26.5
25.9
North Central and Central Coast area
42.5
35.7
25.3
22.2
21.4
19.8
Central Highlands 52.4 51.8 29.2 24.0 23.0 21.0 South East 7.6 8.2 4.6 3.1 3.0 2.3 Mekong River Delta 36.9 23.4 15.3 13.0 12.4 11.1
(a) From 2004 onwards a higher poverty line is used for urban residents than for rural residents. Compared to previous procedures this tended to decrease recorded levels of rural poverty and increase levels of recorded urban poverty.
(b) Preliminary estimates. Source: Extracted from General Statistics Office (2009, Tables 305 and 306)
The market transition of Vietnam and of China has been accompanied by considerable
change in the structure of their economies. This is a consequence of their economic
growth and the greater role given to the price mechanism as a means for allocating
their resources. As pointed out by Colin Clark (1957), the relative size of the
agricultural (primary) sector declines with economic growth and the comparative size
of the secondary (manufacturing) and tertiary (service) sectors increases. This largely
reflects changing demand patterns as per capita incomes rise. However, a significant
part of the growth in the service sector is driven by the demand for services (such as
transport services, exchange services, insurance financing) to facilitate the operation
of markets. The operations of markets are not costless and these services help to
reduce market transaction costs.
A normal consequence of economic growth and development is the shift in population
from rural to urban areas. Both China and Vietnam have experienced such a shift in
recent times. In 2008, 43.1 per cent of China’s population was located in urban areas
and 28 per cent of Vietnam’s population was urbanised. The difference in the degree
of urbanisation reflects the fact that Vietnam commenced its economic reforms at a
later stage than China. Furthermore, Vietnamese incomes are lower than those in
8

China, and China has a larger market (giving it greater scope for economies of scale
in tertiary and secondary industry) compared to Vietnam, all of which helps explain
why China is more urbanised than Vietnam. Nevertheless, urbanisation is proceeding
at a rapid pace in Vietnam. In 1995, 79.3 per cent of Vietnam’s population lived in
rural areas but by 2008 this had fallen to 72 per cent. More significantly, the
comparative growth rate of Vietnam’s urban population is increasingly outstripping
the growth rate of Vietnam’s rural population (see General Statistical Office of
Vietnam, 2009, p.39). In 2008, the estimated growth rate of Vietnam’s urban
population was 3.57 per cent and only 0.33 per cent for its rural population. These
figures reflect the high rates of rural to urban migration in Vietnam. Given current
trends in these growth rates, it seems likely that the size of Vietnam’s rural population
will soon begin to decline as Vietnam continues its economic development.
Employment in agriculture has already started to decline in Vietnam as has the share
of agriculture in its GDP.
In 2000, agriculture and forestry employed 23.492 million persons in Vietnam but by
2008 this had fallen to 21.950 million persons (General Statistical Office of Vietnam,
2009, p.51). Consequently, agricultural employment decreased from 62.5 per cent of
Vietnam’s employed population in 2000 to 48.9 per cent in 2008. In the same period,
employment in manufacturing rose from 3.55 million to 6.306 million to account for
about 13.5 per cent of Vietnam’s employment in 2008.
As a percentage of Vietnam’s GDP, the contribution of industry and construction rose
from 36.73 per cent in 2000 to 39.73 per cent in 2008, the contribution of the service
sector remained relatively steady: it was 38.74 per cent in 2000 and 38.17 per cent in
2008. There was a decline in the contribution of agriculture, forestry and fisheries to
GDP in the same period from 24.53 per cent to 22.10 per cent (General Statistical
Office of Vietnam, 2009, p.72). Despite the fall in the number of those employed in
agriculture, the gross output of agriculture (at constant 1994 prices) increased
throughout the period 2000-2008. It rose over the whole period by approximately 40
per cent. Nevertheless, it exhibited a slower rate of growth than Vietnam’s GDP at
constant 1994 prices. Vietnam’s GDP increased by almost 80 per cent in the same
period.
9

An unusual feature of Vietnam’s structural change has been a decline (since 1995) in
the contribution of its service sector to its GDP. In 1995, it accounted for 44.08 per
cent of its GDP but by 2008 this had declined to 38.7 per cent. This is contrary to the
usual development pattern. On the other hand, the trend in the contributions to GDP
agriculture, forestry and fishing, and in manufacturing and construction to GDP is as
is normally expected: the former declined from 27.18 per cent to 22.10 per cent and
the latter rose from 28.76 per cent to 39.73 per cent in the period 1995-2008.
The proportion of China’s employed population engaged in agriculture has continued
to decline with its economic development and so too has the relative contribution of
agriculture to China’s GDP. Whereas in 1978, agriculture accounted for 28.1 per cent
of China’s GDP by 2006, this had fallen to 11.8 per cent and in the same period, the
percentage of the employed population engaged in farming in China declined from
70.5 per cent to 42.6 per cent (Ministry of Agriculture of China, 2009a, p.1). The
percentage of the workforce engaged in farming in China is lower than in Vietnam.
Nevertheless, both China and Vietnam now have less than half of their workforce
engaged in farming. However, the relative contribution of Vietnam’s agriculture,
fishing and forestry sector to its GDP is almost twice that in China. Consequently,
Vietnam is more heavily dependent on agriculture than China for its economic output.
An interesting feature of China’s rural development is the high proportion of
employed persons engaged in non-farming activities in rural areas. This proportion
rose substantially after China began its economic reforms, presumably because of
China’s promotion of town-and-village enterprises. Rural non-farm employment as a
percentage of rural employment increased quite rapidly from 1980 onwards and by
2005, had reached 42.6 per cent (Ministry of Agriculture of China, 2009a, p.2).
Vietnam appears to have had less development of rural non-farm employment and
slower establishment of rural non-farm enterprises compared to China.
Most employment in Vietnam occurs in non-state businesses. These accounted for
87.20 per cent of employment in 2008. Households are the largest source of
employment. They accounted for 78.37 per cent of employment in 2008. Their share
however, is declining, as is employment by collectives. On the other hand, the share
of employment by private (non-household) Vietnamese businesses is rising strongly,
10

as is that of the sector dependent on foreign investment. Similar trends can be
observed in the ownership of agricultural enterprises to those observed for enterprises
in Vietnam’s economy as a whole (General Statistical Office of Vietnam, 2009). In
China, as in Vietnam, households are the main source of agricultural output.
4. The Restructuring of Agriculture – The Growing Contribution of Livestock
Production and Impacts of Freer International Trade
Not only has the structure of the economies of Vietnam and China altered
considerably with their economic reforms and growth but so also has the composition
of their agricultural production. A prominent feature has been the increase in the
relative importance of livestock production as a component of total agricultural
production. This change has been in response to rising domestic demand for livestock
products, mainly as a result of rising levels of per capita income. The demand for
livestock products is positively related to income levels and as incomes rise, some
substitution of livestock products for non-livestock products occurs. Other factors that
have contributed to the growing demand for livestock products are rising populations
and most likely, greater urbanisation. Increased urbanisation has probably been
conducive to a change in tastes in favour of greater consumption of livestock products,
particularly in China.
The altering structure of China’s agricultural sector is evident from Table 3. The
general pattern has been for the relative contribution of crops to its agricultural
production to decline and for the contribution of livestock products to rise strongly.
Table 3 also indicates that the share of forestry in total agricultural production has
remained fairly stationary in China’s reform period and the share of fisheries (which
includes aquaculture) after rising is now either stationary or declining slightly. The
Ministry of Agriculture of China (2009b) has announced that China’s aim is to
increase the relative contribution of its livestock industry to its total agricultural
production (livestock plus crop production) so that it accounts for 50% of this total.
11

Table 3: Percentage composition of China’s agricultural production by type of produce, 1970-2004
Type of Production 1970 1980 1990 2000 2004 Crops 82 76 65 56 51 Livestock 14 18 26 30 35 Fishery 2 2 5 11 10 Forestry 2 4 4 4 4 Livestock ÷ Crops and Livestock 14.6 19.4 28.6 34.9 40.7
Source: Based on Huang et al. (2006, Table 4)
A similar trend is evident in the composition of Vietnam’s agricultural production, as
can be seen by comparing the last line of Table 3 with Table 4. The relative
contribution of China’s livestock production to its total agricultural production is
much larger than that of Vietnam. This is partly a reflection of the fact that per capita
income in China is much higher than in Vietnam and that China began its market
reforms well before Vietnam did. Furthermore, it is conceivable that Vietnam has land
and climatic endowments that give it a comparative economic advantage in crop
production rather than in livestock production.
Table 4: Percentage composition of Vietnam’s Gross Agricultural Output 1995-2008
Type of Production 1995 2000 2005 2007 2008 (Prelim) Crops 78.1 78.2 73.5 73.9 71.5 Livestock 18.9 19.3 24.7 24.4 27.0 Service 3.0 2.5 1.8 1.7 1.5 100.0 100.0 100.0 100.0 100.0
Source: Based on General Statistics Office (2009, Table 90)
Both China and Vietnam have been unable to meet their increased demand for
livestock products solely by using their own resources. The expansion of their
livestock industries has depended to a large extent on the import of coarse grains and
soybeans to add to their supply of livestock food. In addition, there has been increased
import of some livestock products.
Huang et al. (2006) argue that in recent times, China has increasingly specialized in
agricultural production in which it has a comparative international economic
advantage. Huang et al. (2006, Figure 4) claim this on the basis that China’s positive
12

balance of international trade in labour-intensive agricultural goods has increased
since 1984 whereas it has become more negative in relation to land-intensive
agricultural goods. They expect this pattern of trade to continue until at least 2020
(Huang et al., 2006, Figure 7). China’s imports of course grains, oilseed, sugar, milk,
beef and mutton, fibre and wheat are expected to increase. China is predicted to be
self-sufficient in rice, horticulture, pork and poultry, fresh and processed foods and to
have some scope for increasing its exports of these items.
A similar study does not appear to be available for Vietnam but it appears that as
Vietnam’s economy has become more open, its international trade in agricultural
products also increasingly reflects its relative abundance of labour and its relative
shortage of land. Major agricultural imports of Vietnam include food for livestock
(such as course grains), wheat and wheaten flour, dairy products, edible oils and
cotton. Vietnam has a very high level of imports of fertilizer. Its main agricultural
exports are coffee, rice, rubber, cashew nuts, tea and fresh or processed vegetables
and fruit, all of which appear to be relatively labour-intensive products. It is a large
exporter of fish products, most of which is produced by means of aquaculture.
Vietnam has very limited imports of red meat mainly because of the strong preference
of the Vietnamese consumer for fresh meat purchased from traditional market outlets
(Lapar et al., 2009). Such imported meat must of necessity be chilled, frozen or
processed. This gives considerable natural protection to Vietnamese meat producers
(Tisdell et al., 2010). This is particularly important for the survival of Vietnam’s pig
industry because its cost of production is high by international standards. Because
pork is a favoured meat in diets of Vietnam, the price of pork is of widespread
concern to Vietnamese consumers.
Son et al. (2006, Table 13) report that Vietnam has a comparative international
economic advantage in the production of cashew nuts, coffee, rice and tea but a
substantial cost disadvantage in pork production. The authors consider the long-term
export potential of Vietnam to be high for rice, coffee, cashew nuts and pepper, to be
medium for tea and for fruit and vegetables, and to be low for pork (Son et al., 2006,
Table 14). Given the apparent economic disadvantage of Vietnam in pork production,
one might have expected substantial imports of pork to Vietnam. This has not
13

occurred so far due to the preferences of Vietnamese for fresh pork, the slow growth
of supermarkets in Vietnam (Maruyama and Trung, 2007) and the resistance of
Vietnamese to purchasing fresh food from supermarkets. It is however, not clear that
this situation will be maintained in the long-term because the habits and tastes of the
Vietnamese could alter with economic growth, urbanisation and modernisation.
Furthermore, constraints on the domestic supply of pork could increase the price of
pork so much that Vietnamese are increasingly forced to search for substitutes, such
as imported pork.
In the period 1996-2006, Vietnam’s domestic supply of pork rose from 14.76 kgs per
capita to 29.77 kgs per capita but its annual rate of increase tapered off in 2006
(Tisdell, 2009b). In 2005, pig numbers in Vietnam peaked at 27.4 million head and
since then have declined. The number of pigs in 2006 was 26.9 million, in 2007 it was
26.6 million and for 2008 the preliminary estimate was 26.7 million (General
Statistical Office of Vietnam, 2009, p.289). Therefore, Vietnam’s stock of pigs now
appears to be approximately stationary. In this situation, yields will need to rise if the
volume of local pork supplies is to continue to increase.
Both increased yields and rising pig numbers expanded Vietnam’s production of pork
in the period 1996-2006. Growing pig numbers were the major contribution to this
growth in the early part of the period and increased yield was the prime contributor to
increasing levels of pork production in the latter part of this period (Tisdell, 2009b).
The expansion in the volume of Vietnam’s pork production was facilitated by an
increase in its import of pig food which in turn reflected the greater openness of
Vietnam’s economy to international trade. Both the rising number of pigs and their
changing genetic composition in Vietnam have increased Vietnam’s demand for
imports of pig food. In the 1990’s policies were adopted in Vietnam to import exotic
breeds of pigs to Vietnam to raise pig yields. Exotic large white pigs (often crossed in
Vietnam with the local Mong Cai breed) have proven to be popular and now most of
Vietnam’s pig stock has a substantial infusion of exotic genetic material. To produce
high yields, these genetically improved pigs need better quality food than that for
local breeds of pigs and much of this pig food has to be imported. Because substantial
diffusion of exotic pig genes has already occurred within Vietnam’s pig population,
the scope for further genetic improvement to increase pig yields in Vietnam may be
14

limited. It seems that growing demand for pork is starting to outpace supply in
Vietnam. This is reflected in the substantial rise in the price index for livestock
products (particularly prices received for domesticated animals, such as pigs) as can
be seen from Table 5. Also cattle and buffalo numbers have declined recently in
Vietnam (General Statistical Office of Vietnam, 2009, p.289).
Table 5: Producer’s price index of livestock products and for domesticated animals (excluding poultry) for Vietnam 1995-2008
Year Livestock products Domesticated animals 1995 100.0 100.0 2000 113.0 110.5 2004 132.6 141.2 2005 133.2 145.6 2006 130.6 140.6 2007 152.0 161.1 2008 243.0 274.5
Source: Based on General Statistics Office (2009, Table 218)
The Vietnamese Government is aware that domestic supplies of livestock products
(given present institutional arrangements) are unlikely to expand as fast as the
domestic demand for these products. This has led it to adopt a policy favouring
greater production of these products by private (registered) enterprises rather than
households in the expectation that these private enterprises will be able to achieve
economies of scale and be more responsive than households in expanding supplies to
meet the growing demand for livestock products (for further discussion see Tisdell,
2009c). Nevertheless, households still account for the supply of the bulk of Vietnam’s
agricultural output and most of its livestock-related production.
The individual holdings of households of agricultural land are small and most
agricultural households have few livestock. As argued below, with the growth of the
economies of China and of Vietnam, pressures are likely to mount for larger-sized
agricultural holdings, for the extension of property rights in agricultural land, and for
the marketing and transfer of agricultural land to become less restricted and easier to
accomplish.
15

5. The Size of Agricultural Units, Non-Farm Employment and Land Rights
The most recent agricultural census for Vietnam was conducted in 2006 and the
results have been reported by the General Statistics Office (2007). At the time of the
2006 census, 99.2 per cent of agricultural units were household units. The number of
co-operative and registered business enterprises operating in agriculture were quite
small. While the former are declining in number, the latter are increasing.
Agricultural landholdings in Vietnam are very small by Western standards. The last
agricultural census revealed that 68.76 per cent of agricultural households had less
than a half hectare of land and that 94.22 per cent had less than two hectares of land.
In China, the average land holding of agricultural households is just under half a
hectare and is also small. In 2008, it was 0.483 hectare and in 2003, 0.463 hectare
(Wu, 2009, p.503). Thus, the average size of holdings of agricultural land by
households seems to be increasing slowly following China’s land reforms in 2003
which gave holders of agricultural land assured tenure of their land for 30 years.
However, a period of 5 years is too short to detect accurately the trend in the size of
land holdings.
Furthermore, households in Vietnam holding livestock operated on a very small scale
according to its 2006 agricultural census. The majority (80.11 per cent) of agricultural
households had chickens, most (65 per cent) kept pigs, and 27.8 per cent possessed
cattle. About two-thirds of households with chickens had fewer than 20 head. Over
half of households keeping pigs (56.78 per cent) only had one or two pigs and a
further 27.8 per cent had 3-5 pigs. The fact that only 2 per cent of Vietnam’s
agricultural households keeping pigs had more than 20 pigs further underlines the
point that small-scale pig production is the current norm in Vietnam. Vietnam has a
comparatively small stock of cattle. Seventy per cent of agricultural households
having cattle in Vietnam only possess one or two head. Furthermore, large herds of
cattle are rare: only about one per cent of rural households having cattle have more
than ten head.
16

5.1 Non-farm employment of those currently engaged in agriculture
With economic growth, the normal pattern of development is for both the proportion
and the absolute numbers of persons engaged in agriculture to decline. This is usually
accompanied by increasing farm sizes and the adoption of more capital-intensive
methods in agriculture as well as greater specialization in production by farms
(Skolrud et al., 2009). With the economic growth of China and Vietnam, agricultural
development in China and Vietnam can be expected to exhibit this pattern if Western
development experience is a useful guide.
For example, in relation to Vietnam’s pig production, it is estimated that between the
agricultural census of 2001 and 2006 that just under one million householders
discontinued pig production. At the same time, the average number of pigs kept by
those households continuing with the husbandry of pigs rose, even though the scale of
production of most pig producers remained small.
Secondary statistics on trends in the average size of land holdings are difficult to
obtain. However, with the general restructuring of economies in transition (such as
those of China and Vietnam) increasing pressures can be expected for farm
amalgamation and for increasing the size of farming units. For this and other reasons,
one would expect a tendency for the number of agricultural farms to decline
nationally. Government policies can help facilitate the movement of farmers to non-
farm employment thereby adding to the efficiency of resource allocation. For example,
consideration can be given to policies that help reduce the transaction costs of
individuals and families when shifting from farming to non-farm employment.
Other things being held constant, the gap between the incomes of farmers and non-
farmers is likely to remain high if the transaction costs incurred by farmers in
switching from farm to non-farm employment are high. These costs include the cost
of shifting house (in some cases), extra transport costs, uncertainty and the extent of
sunk costs, such as the irrecoverable value of investment in farms possessed by
households should they be relinquished. These costs are likely to be lower for younger
family members than for older ones. These transaction costs are usually lower if non-
farm employment is available in the vicinity of the farmer’s current location. A factor
that appears to have contributed significantly to the high level of non-farm rural
17

employment in China has been the development of town-and-village enterprises. This
development in China made it easier for farmers to switch from farm to non-farm
employment because they did not have to leave their locality to do so. Vietnam is now
undertaking the regional decentralisation of its industrial development, presumably
for similar reasons (see Kirk and Tuan, 2009). In fact, Table 84 of the Statistical
Yearbook of Vietnam (General Statistical Office of Vietnam, 2009) indicates that
since 2000, there has been, a rapid increase in the number of non-farm individual
businesses in provinces where farming is the predominate economic activity with a
significant rise in non-farm employment in rural areas.
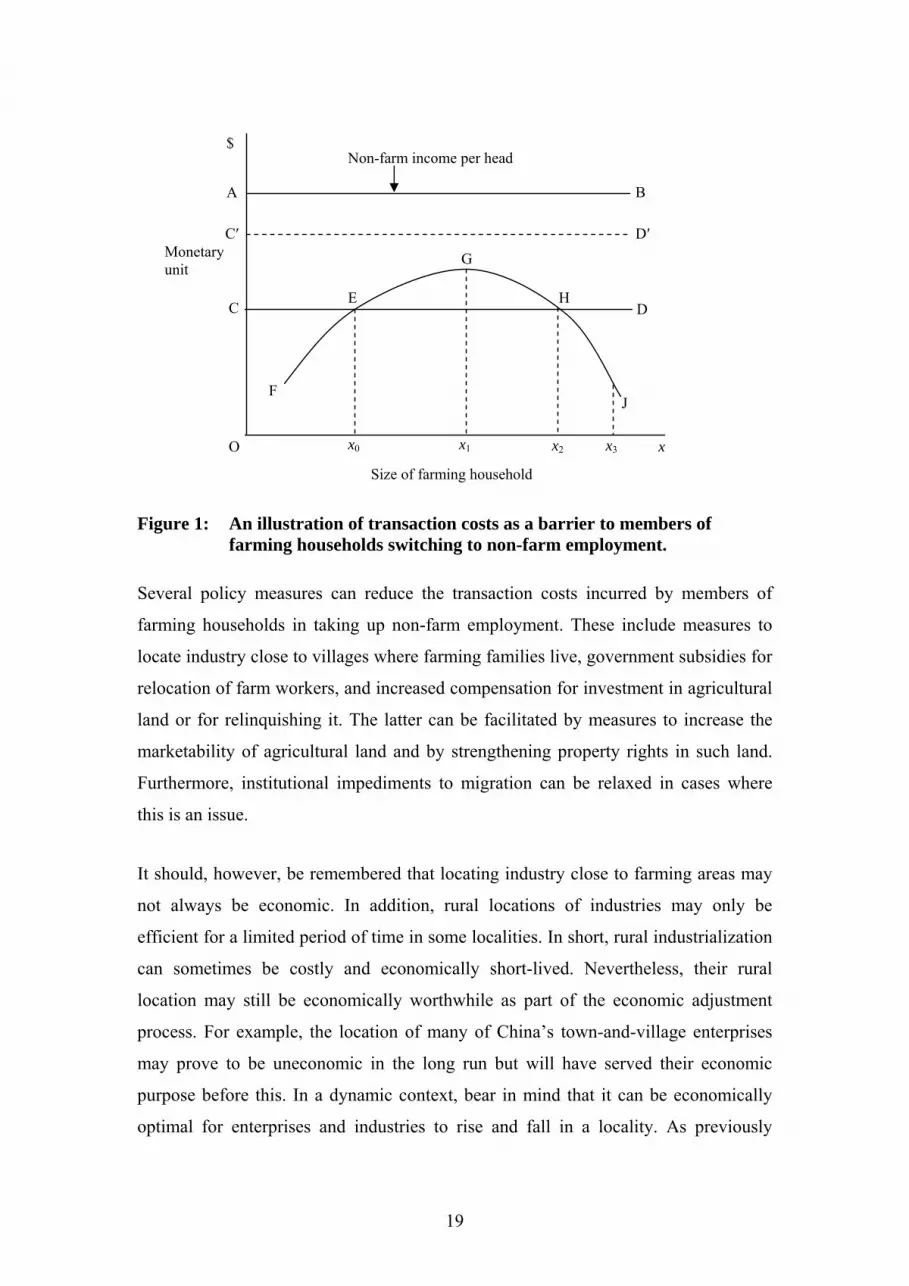
This issue is illustrated in Figure 1. There AB represents the level of income that each
member of a household can obtain by taking up non-farm employment. However, in
order to do this, transaction costs per family member of CA are incurred. The curve
FGJ represents the income per head that family numbers can obtain by remaining in
farming. If the family size of this household is initially x3, x3 − x2 members of the
household will have an economic incentive to take up non-farm employment.
However, because of transaction costs, the remaining household members will have
no economic incentive to accept non-farm employment and their income per head will
remain below that in the non-farm sector. On the other hand, if the transaction costs
involved in taking up non-farm employment can be sufficiently reduced, then all
members of this farming household would find it worthwhile to accept non-farm
employment. This would happen, for example, if the relevant transaction costs were
reduced from AC to AC′.
18
$
A
C′
C
B
D′
D
G
E H
F J
O
Non-farm income per head
x0 x1 x2 x x3
Size of farming household
Monetary unit
Figure 1: An illustration of transaction costs as a barrier to members of
farming households switching to non-farm employment.
Several policy measures can reduce the transaction costs incurred by members of
farming households in taking up non-farm employment. These include measures to
locate industry close to villages where farming families live, government subsidies for
relocation of farm workers, and increased compensation for investment in agricultural
land or for relinquishing it. The latter can be facilitated by measures to increase the
marketability of agricultural land and by strengthening property rights in such land.
Furthermore, institutional impediments to migration can be relaxed in cases where
this is an issue.
It should, however, be remembered that locating industry close to farming areas may
not always be economic. In addition, rural locations of industries may only be
efficient for a limited period of time in some localities. In short, rural industrialization
can sometimes be costly and economically short-lived. Nevertheless, their rural
location may still be economically worthwhile as part of the economic adjustment
process. For example, the location of many of China’s town-and-village enterprises
may prove to be uneconomic in the long run but will have served their economic
purpose before this. In a dynamic context, bear in mind that it can be economically
optimal for enterprises and industries to rise and fall in a locality. As previously
19

mentioned, Vietnam is placing greater emphasis on the placement of industries in
rural areas as part of its economic adjustment strategy.
5.2 Property rights in agricultural land and increased marketability of land.
The nature of property rights has a significant impact on productivity and economic
growth (Posner, 1981; Tisdell, 2009d, Ch.4). Since beginning their economic reforms,
both China and Vietnam have extended the property rights of agricultural households
in their land. The length of tenure of the possession of agricultural land has been
defined and greater possibilities now exist for transferring the possession of land than
in the past. In China, local government bodies are interfering less and less in land
transfers, and this is also happening in parts of Vietnam. Some regional variation
occurs in the extent to which local government bodies interfere in land transfers.
Nevertheless, legal transfers of agricultural land are restricted mostly to members of
the local community and tenure is still only guaranteed for a limited duration. These
factors can reduce returns on long-term investment in agriculture by households.
Furthermore, restrictions on transfers of land reduce its suitability as collateral for
agricultural loans thereby dampening agricultural investment.
Table 6 provides a brief chronology of agricultural land reforms in China and
Vietnam from 1993 onwards. It can be seen that the process of these reforms has been
gradual and always have favoured extended property rights in land and its enhanced
marketability. China’s approach has been initially to issue ‘advisories’ to local
government bodies (communes) to extend land rights and later to follow these up by
legal requirements. While restrictions on the specific purposes for which agricultural
land can be used have been significantly relaxed in China and in Vietnam, the general
purpose is still restricted (for example, whether land is to be used for annual crops,
perennial crops, or aquaculture) as are the persons to whom it can be legally
transferred.
20
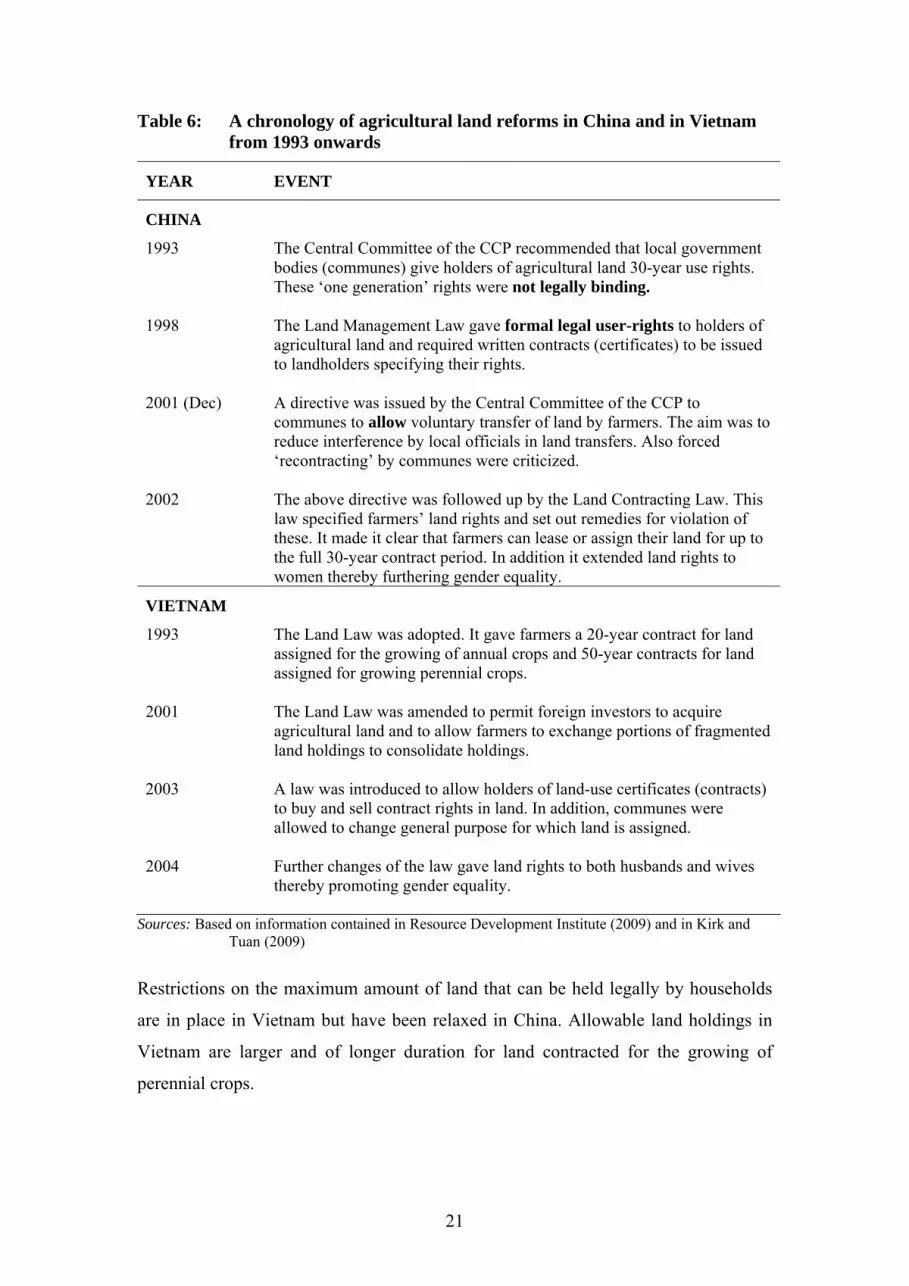
Table 6: A chronology of agricultural land reforms in China and in Vietnam from 1993 onwards
YEAR EVENT
CHINA
1993 The Central Committee of the CCP recommended that local government bodies (communes) give holders of agricultural land 30-year use rights. These ‘one generation’ rights were not legally binding.
1998 The Land Management Law gave formal legal user-rights to holders of agricultural land and required written contracts (certificates) to be issued to landholders specifying their rights.
2001 (Dec) A directive was issued by the Central Committee of the CCP to communes to allow voluntary transfer of land by farmers. The aim was to reduce interference by local officials in land transfers. Also forced ‘recontracting’ by communes were criticized.
2002 The above directive was followed up by the Land Contracting Law. This law specified farmers’ land rights and set out remedies for violation of these. It made it clear that farmers can lease or assign their land for up to the full 30-year contract period. In addition it extended land rights to women thereby furthering gender equality.
VIETNAM
1993 The Land Law was adopted. It gave farmers a 20-year contract for land assigned for the growing of annual crops and 50-year contracts for land assigned for growing perennial crops.
2001 The Land Law was amended to permit foreign investors to acquire agricultural land and to allow farmers to exchange portions of fragmented land holdings to consolidate holdings.
2003 A law was introduced to allow holders of land-use certificates (contracts) to buy and sell contract rights in land. In addition, communes were allowed to change general purpose for which land is assigned.
2004 Further changes of the law gave land rights to both husbands and wives thereby promoting gender equality.
Sources: Based on information contained in Resource Development Institute (2009) and in Kirk and Tuan (2009)
Restrictions on the maximum amount of land that can be held legally by households
are in place in Vietnam but have been relaxed in China. Allowable land holdings in
Vietnam are larger and of longer duration for land contracted for the growing of
perennial crops.
21

Politically, the distribution of land possessed by households has been a sensitive issue
for the communist governments of China and of Vietnam. When they came to power,
the distribution of ownership of land was very uneven. Their earlier land policies
stressed equality in the distribution of agricultural land to households. Today,
however, income inequality in China and Vietnam does not arise so much from
inequality in the possession of agricultural land but from other sources. Furthermore,
agricultural employment has gone from being the dominant means of employment in
China and Vietnam to no longer being so important. Less than half the workforce
engages in agriculture and this proportion continues to fall in both countries.
Politically, this probably means that the distribution of ownership of agricultural land
is no longer so important a political issue as it used to be.
In these circumstances, and given the changing structures of their economies, further
extensions of property rights in agricultural land and in its marketability can be
anticipated in China and Vietnam. As the numbers employed in agriculture continue
to decline with economic development, more agricultural land should become
available for exchange. The development of mechanisms facilitating this exchange
should encourage shifts from farm to non-farm employment. Such shifts seem
desirable as economic development occurs for economic efficiency reasons.
6. Concluding Comments
As a result of their economic reforms and economic growth, the structure of the
economies of China and of Vietnam have altered greatly in recent decades and in a
similar manner to that predicted by economic theory although the relative size of
Vietnam’s service sector is growing by less than predicted by this theory. However,
agriculture’s relative contribution to total employment and to GDP has declined
substantially in both countries. Furthermore, the composition of agricultural
production has altered greatly. In particular, the relative contribution of livestock
production in relation to total agricultural production has increased significantly in
both countries but more so in China than in Vietnam. The difference is partly a
reflection of higher per capita incomes in China than in Vietnam.
22

In the case of China, there is specific evidence that since starting its economic reforms,
it has increased its degree of specialization in labour-intensive agriculture and reduced
that in land-intensive agriculture. Its international trade in agricultural commodities
increasingly reflects China’s comparative economic advantage in agricultural
production. There is less explicit evidence of this in Vietnam’s case but this pattern
also appears to have emerged there. However, Vietnam’s pork production remains an
anomaly. Although Vietnam has a comparative economic disadvantage in pork
production, little pork is imported by Vietnam because Vietnamese consumers have a
strong preference for fresh pork purchased from traditional markets.
Farmers in China and in Vietnam hold little land by comparison to Western farmers,
and those who keep livestock usually only have a few head of these. The Vietnamese
Government is concerned that growth in Vietnam’s domestic supply of some
important livestock products, such as pork, will fail to keep pace with the growth in
domestic demand for these, thereby pushing prices of these products. It, therefore, is
encouraging for registered business enterprises to expand their livestock production
and is providing some financial incentives for them to do so. Although household
production of livestock is economic in the current stage of Vietnam’s development,
households have limited ability to expand their current levels of livestock production
(Tisdell, 2009c).
Changing economic opportunities have resulted in many Chinese and Vietnamese
farmers leaving agriculture and taking up non-farm employment despite costs
involved in their changing of occupation. In transitional economies, measures to
reduce the transaction costs involved in changing from farm to non-farm employment
can add to economic productivity and economic growth. Some possible policies for
reducing these transaction costs were outlined.
With reduced employment in agriculture, the importance of extending property rights
in land and of increasing its marketability has grown. Greater marketability of
agricultural land can be expected to facilitate capital investment in agriculture and
reduce the sunk costs of those farmers who possess agricultural land and who want to
exit agriculture to take up non-farm employment. These measures should facilitate the
continuing restructuring of agriculture. This restructuring becomes increasingly
23

necessary as the whole economy grows and alters its general economic structure.
Politically, policies for increasing the marketability of land are likely to become more
acceptable as the numbers of persons employed in agriculture decline and other
sources of income inequality increase in relative importance. Both in China and in
Vietnam, the long-term tendency is to extend property rights in agricultural land and
to increase its marketability. This process appears to have advanced somewhat further
in China than in Vietnam, which probably reflects the fact that China commenced
earlier than Vietnam on its economic reforms and transition. In both countries,
agricultural land reforms are being implemented gradually rather than abruptly.
7. Acknowledgements
The author is involved in a livestock research project, “Adjustment of Vietnam Pig
Producers to Changing Market Conditions” funded by the Australian Centre for
Agricultural Research (ACIAR). This paper has benefited to some extent from this
support. Also thanks are due to Professor Xufu Zhao of Wuhan University of Science
and Technology for supplying sources of some Chinese statistics and Dr Nguyen Do
Anh Tuan of the Center for Agricultural Policy of Vietnam for making available to
me a copy of his jointly authored paper on land-tenure policy reforms in Vietnam. The
paper has also benefited from discussions with Dr. Ma. Lucy Lapar, the ILRI
Representative in Vietnam and from the comments by reviewers for this journal. The
usual caveat applies.
8. References
Clark, C.W. (1957). The Conditions of Economic Progress, 3rd Edn., Macmillan, London.
General Statistical Office of Vietnam. (2007). Results of the 2006 Rural, Agricultural
and Fisheries Census,. Statistical Publishing House, Hanoi. General Statistical Office of Vietnam (2009). Statistical Yearbook of Vietnam 2008,
Statistical Publishing House, Hanoi. Huang, J., Yang, J. and Rozelle, S. (2006). China's rapid economic growth and its
implications for agriculture and food security in China and the rest of the world. Rapid Growth of Selected Asian Economies: Lessons and Implications
24
for Food Security China and India, Regional Office for Asia and the Pacific, Food and Agricultural Organization of the United Nations, Bangkok.
Kirk, M. and Tuan, N.D.O. (2009). Land-based policy reforms: Decollectivization and
the Doi Moi system in Vietnam. 00927 IFPRI Discussion Paper, International Food and Policy Research Institute, Washington DC.
Lapar, M.L.A., Toan, N.N., Que, N.N., Jabbar, M., Tisdell, C.A. and Staal, S. (2009).
Market outlet choices in the context of changing demand for fresh meat: Implications for smallholder inclusion in pork supply chain in Vietnam. Paper presented at the 27th Conference of the International Association of Agricultural Economists, held at Beijing, 16-22 August, 2009.
Lin, J.Y. (2009). Economic Development and Transition: Thought, Strategy and
Viability, Cambridge University Press, Cambridge, UK. Maddison, A. (2006). The World Economy, Organization for Economic Cooperation
and Development, Paris. Maruyama, M. and Trung, L.V. (2007). Supermarkets in Vietnam: Opportunities and
obstacles. Asian Economic Journal, 23, 19-46. Ministry of Agriculture of China. (2009a). Status of agriculture in national economy.
Agriculture Overview. Website of Ministry of Agriculture of The People's Republic of China. 24th January. Accessed 31 March, 2010
Ministry of Agriculture of China. (2009b). Agriculture in China. Website of Ministry
of Agriculture of The People's Republic of China. Accessed 31 March, 2010 Posner, R.A. (1981). The Economics of Justice, Harvard University Press, Cambridge,
MA, and London, UK. Resource Development Institute. (2009). Securing land rights for the world's front in
China. Accessed 1 April, 2010, from html://www.rediland.org/OURWORK/ourworkChina.html
Skolrud, T.D., O'Donoghue, E.O., Shumway, C.R. and Melhim, A. (2009).
Identifying growth and diversification relationships in Washington agriculture. Choices: The Magazine of Food, Farm and Resource Issues, 24(1), 45-48.
Son, D.K., Que, N.N., Dieu, P.Q., Trang, T.T.T. and Beresford, M. (2006). Policy
reform and the transformation of Vietnamese agriculture. Rapid Growth of Selected Asian Economics. Lessons and Implications for Agriculture and Food Security Republic of Korea, Thailand and Vietnam, Regional Office for Asia and the Pacific, Food and Agricultural Organization of the United Nations, Bangkok.
Tisdell, C.A. (1993). Economic Development in the Context of China, Macmillan,
London.
25
Tisdell, C.A. (1995). Zhong Guo De Jing Ji Fa Zhan Chinese Development Press, Beijing. [Economic Development in the Context of China Translated by Yang Ruilong].
Tisdell, C.A. (2009b). Trends in Vietnam's pork supply and structural features of its
Pig Sector. The Open Area Studies Journal, 2, 52-71. Tisdell, C.A. (2009c). The survival of small-scale agricultural producers in Asia
particularly Vietnam: General issues illustrated by Vietnam's agricultural sector, especially its pig production. Economic Theory, Applications and Issues, Working Paper No. 56. School of Economics, The University of Queensland, Brisbane, 4072, Australia.
Tisdell, C.A. (2009d). Resource and Environmental Economics: Modern Issues and
Applications, World Scientific, Singapore, New Jersey, London. Tisdell, C.A., Lapar, M.L.A., Staal, S. and Que, N.N. (2010). Natural protection from
competition in the livestock industry: Analysis, examples and Vietnam's pork market as a case. In T. H. Lee (Ed.), Agricultural Economics: New Research, Nova Science, New York.
Wu, Zhigong (2009). Change in farmland transferring in rural China since 2003. In
China Rural Report 2008 of the Research Center for the Rural Economy, Chinese Financial and Economic Press, Beijing. [In Chinese]
26

PREVIOUS WORKING PAPERS IN THE SERIES ECONOMICS, ECOLOGY AND ENVIRONMENT
For a list of working papers 1-100 in this series, visit the following website: http://www.uq.edu.au/economics/PDF/staff/Clem_Tisdell_WorkingPapers.pdf or see lists in papers 101 on. 101. Knowledge and Willingness to Pay for the Conservation of Wildlife Species:
Experimental Results Evaluating Australian Tropical Species, by Clem Tisdell and Clevo Wilson, May 2004.
102. Antarctic Tourists, Wildlife and the Environment: Attractions and Reactions to Antarctica, by Clem Tisdell, May 2004.
103. Birds in an Australian Rainforest: Their Attraction for Visitors and Visitors’ Ecological Impacts, by Clem Tisdell and Clevo Wilson, May 2004.
104. Nature-Based Tourism and the Valuation of its Environmental Resources: Economic and Other Aspects by Clem Tisdell, May 2004.
105. Glow Worms as a Tourist Attraction in Springbrook National Park: Visitor Attitudes and Economic Issues, by Clem Tisdell, Clevo Wilson and David Merritt, July 2004.
106. Australian Tropical Reptile Species: Ecological Status, Public Valuation and Attitudes to their Conservation and Commercial Use, by Clem Tisdell, Clevo Wilson and Hemanath Swarna Nantha, August 2004.
107. Information and Wildlife Valuation: Experiments and Policy, by Clem Tisdell and Clevo Wilson, August 2004.
108. What are the Economic Prospects of Developing Aquaculture in Queensland to Supply the Low Price White Fillet Market? Lessons from the US Channel Catfish Industry, by Thorbjorn Lyster and Clem Tisdell, October 2004.
109. Comparative Public Support for Conserving Reptile Species is High: Australian Evidence and its Implications, by Clem Tisdell, Clevo Wilson and Hemanath Swarna Nantha, October 2004.
110. Dependence of public support for survival of wildlife species on their likeability by Clem Tisdell, Clevo Wilson and Hemanath Swarna Nantha, October 2004.
111. Dynamic Processes in Contingent Valuation: A Case Study Involving the Mahogany Glider by Clem Tisdell, Clevo Wilson and Hemanath Swarna Nantha, November 2004.
112. Economics, Wildlife Tourism and Conservation: Three Case Studies by Clem Tisdell and Clevo Wilson, November 2004.
113. What Role Does Knowledge of Wildlife Play in Providing Support for Species’ Conservation by Clevo Wilson and Clem Tisdell, December 2004.
114. Public Support for Sustainable Commercial Harvesting of Wildlife: An Australian Case Study by Clem Tisdell, Clevo Wilson and Hemanath Swarna Nantha, December 2004.
115. Endangerment and Likeability of Wildlife Species: How Important are they for Proposed Payments for Conservation by Clem Tisdell, Hemanath Swarna Nantha and Clevo Wilson, December 2004.
116. How Knowledge Affects Payment to Conserve and Endangered Bird by Clevo Wilson and Clem Tisdell, February 2005.
117. Public Choice of Species for the Ark: Phylogenetic Similarity and Preferred Wildlife Species for Survival by Clem Tisdell, Clevo Wilson and Hemanath Swarna Nantha, March 2005.
118. Economic Incentives for Global Conservation of Wildlife: New International Policy Directions by Clem Tisdell, March 2005.
119. Resource Entitlements of Indigenous Minorities, Their Poverty and Conservation of Nature: Status of Australian Aborigines, Comparisons with India’s Tribals, Theory and Changing Policies Globally by Clem Tisdell, March 2005.
27

120. Elephants and Polity in Ancient India as Exemplified by Kautilya’s Arthasastra (Science of Polity) by Clem Tisdell, March 2005.
121. Sustainable Agriculture by Clem Tisdell, April 2005. 122. Dynamic Processes in the Contingent Valuation of an Endangered Mammal Species
by Clem Tisdell, Clevo Wilson and Hemanath Swarna Nantha, April 2005. 123. Knowledge about a Species’ Conservation Status and Funding for its Preservation:
Analysis by Clem Tisdell, June 2005. 124. Public Valuation of and Attitudes towards the Conservation and Use of the Hawksbill
Turtle: An Australian Case Study by Clem Tisdell, Hemanath Swarna Nantha and Clevo Wilson, June 2005.
125. Comparison of Funding and Demand for the Conservation of the Charismatic Koala with those for the Critically Endangered Wombat Lasiorhinus krefftii by Clem Tisdell and Hemanath Swarna Nantha, June 2005.
126. Management, Conservation and Farming of Saltwater Crocodiles: An Australian Case Study of Sustainable Commercial Use by Clem Tisdell and Hemanath Swarna Nantha, August 2005.
127. Public Attitudes to the Use of Wildlife by Aboriginal Australians: Marketing of Wildlife and its Conservation by Clem Tisdell and Hemanath Swarna Nantha, August 2005.
128. Linking Policies for Biodiversity Conservation with Advances in Behavioral Economics by Clem Tisdell, August 2005.
129. Knowledge about a Species’ Conservation Status and Funding for its Preservation: Analysis by Clem Tisdell, August 2005.
130. A Report on the Management of Saltwater Crocodiles (Crocodylus porosus) in the Northern Territory: Results of a Survey of Pastoralists by Clem Tisdell, Clevo Wilson and Hemanath Swarna Nantha, September 2005.
131. Crocodile Farms and Management of Saltwater Crocodiles in Northern Territory: Results of a Survey of NT Crocodile Farmers Plus Analysis of Secondary Information by Clem Tisdell, September 2005.
132. The Environment and the Selection of Aquaculture Species and Systems: An Economic Analysis by Clem Tisdell, October 2005.
133. The History and Value of the Elephant in Sri Lankan Society by Ranjith Bandara and Clem Tisdell, November 2005.
134. Economics of Controlling Livestock Diseases: Basic Theory by Clem Tisdell, November 2006.
135. Poverty, Political Failure and the Use of Open Access Resources in Developing Countries by Clem Tisdell, November 2006.
136. Global Property Rights in Genetic Resources: An Economic Assessment by Clem Tisdell, November 2006.
137. Notes on the Economics of Fish Biodiversity: Linkages between Aquaculture and Fisheries by Clem Tisdell, November 2006.
138. Conservation of the Proboscis Monkey and the Orangutan in Borneo: Comparative Issues and Economic Considerations by Clem Tisdell and Hemanath Swarna Nantha, March 2007.
139. Economic Change and Environmental Issues: Policy Reforms and Concerns in Australian Agriculture, by Clem Tisdell, April 2007.
140. Institutional Economics and the Behaviour of Conservation Organizations: Implications for Biodiversity Conservation by Clem Tisdell, March 2007
141. Poverty, Policy Reforms for Resource-use and Economic Efficiency: Neglected Issues by Clem Tisdell, May 2007.
142. The State of the Environment and the Availability of Natural Resources by Clem Tisdell, May 2007.
143. Economics of Pearl Oyster Culture by Clem Tisdell and Bernard Poirine, July 2007. 144. The Economic Importance of Wildlife Conservation on the Otago Peninsula – 20
Years on by Clem Tisdell, November, 2007.
28

145. Valuing the Otago Peninsula: The Economic Benefits of Conservation by Clem Tisdell, November 2007.
146. Policy Choices about Agricultural Externalities and Sustainability: Diverse Approaches, Options and Issues by Clem Tisdell, November, 2007.
147. Global Warming and the Future of Pacific Island Countries by Clem Tisdell, November 2007.
148. Complex Policy Choices about Agricultural Externalities: Efficiency, Equity and Acceptability by Clem Tisdell, June 2008.
149. Wildlife Conservation and the Value of New Zealand’s Otago Peninsula: Economic Impacts and Other Considerations by Clem Tisdell, June 2008.
150. Global Property Rights in Genetic Resources: Do They Involve Sound Economics? Will They Conserve Nature and Biodiversity? By Clem Tisdell, August 2008.
151. Supply-side Policies to Conserve Biodiversity and Save the Orangutan from Oil Palm Expansion: An Economic Assessment. By Clem Tisdell and Hemanath Swarna Nantha, September, 2008.
152. The Orangutan-Oil Palm Conflict: Economic Constraints and Opportunities for Conservation by Hemanath Swarna Nantha and Clem Tisdell, October 2008.
153. Economics, Ecology and the Development and Use of GMOs: General Considerations and Biosafety Issues by Clem Tisdell, October 2008.
154. Agricultural Sustainability and the Introduction of Genetically Modified Organisms (GMOs) by Clem Tisdell, February, 2009.
155. Notes on Biodiversity Conservation, The Rate of Interest and Discounting by Clem Tisdell, April, 2009.
156. Is Posner’s Principle of Justice an Adequate Basis for Environmental Law? by Clem Tisdell, June 2009.
157. The Sustainability of Cotton Production in China and Australia: Comparative Economic and Environmental Issues By Xufu Zhao and Clem Tisdell, June 2009.
158. The Precautionary Principle Revisited: Its Interpretations and their Conservation Consequences by Clem Tisdell, September, 2009.
159. The Production of Biofuels: Welfare and Environmental Consequence for Asia by Clem Tisdell, September, 2009.
160. Environmental Governance, Globalisation and Economic Performance by Clem Tisdell, November 2009.
161. Managing Forests for Sustainable Economic Development: Optimal Use and Conservation of Forests by Clem Tisdell, February 2010.
162. Comparative Costs and Conservation Policies for the Survival of the Orangutan and Other Species: Includes an Example by Clem Tisdell and Hemanath Swarna Nantha, May 2010.
163. Notes on the Economics of Control of Wildlife Pests by Clem Tisdell, May 2010 164. Are tourists rational? Destination decisions and other results from a survey of visitors
to a North Queensland natural site – Jourama Falls by Clem Tisdell, June 2010. 165. Conservation Value by Clem Tisdell, June 2010. 166. The Influence of Public Attitudes on Policies for Conserving Reptiles by Clem Tisdell,
July 2010. 167. Core Issues in the Economics of Biodiversity Conservation by Clem Tisdell, July
2010. 168. The Survival of a Forest-Dependent Species and the Economics of Intensity of
Logging: A Note by Clem Tisdell, August 2010. 169. A Case Study of an NGOs Ecotourism Efforts: Findings Based on a Survey of
Visitors to its Tropical Nature Reserve by Clem Tisdell, August, 2010. 170. Sharing Nature’s Wealth through Wildlife Tourism: Its Economic, Sustainability and
Conservation Benefits by Clem Tisdell, August, 2010
29


