Embed Size (px)
Citation preview
1530-437X (c) 2021 IEEE. Personal use is permitted, but republication/redistribution requires IEEE permission. See http://www.ieee.org/publications_standards/publications/rights/index.html for more information.
This article has been accepted for publication in a future issue of this journal, but has not been fully edited. Content may change prior to final publication. Citation information: DOI 10.1109/JSEN.2021.3134895, IEEE SensorsJournal
IEEE SENSORS JOURNAL, VOL. XX, NO. XX, XXXX 2017 1
Using RF Transmissions from IoT Devices forOccupancy Detection and Activity RecognitionWenda Li, Member, IEEE , Shelly Vishwakarma, Member, IEEE , Chong Tang, Student Member, IEEE ,
Karl Woodbridge, Member, IEEE , R. J. Piechocki, Member, IEEE , Kevin Chetty Member, IEEE
sparse WiFi signal for occupancy detection
IoT device connects in WiFi network
strong RFEH signal for activity recognition
RFEH technique provides wireless energy
sparse WiFi signal for occupancy detection
IoT device connects in WiFi network
strong RFEH signal for activity recognition
RFEH technique provides wireless energy
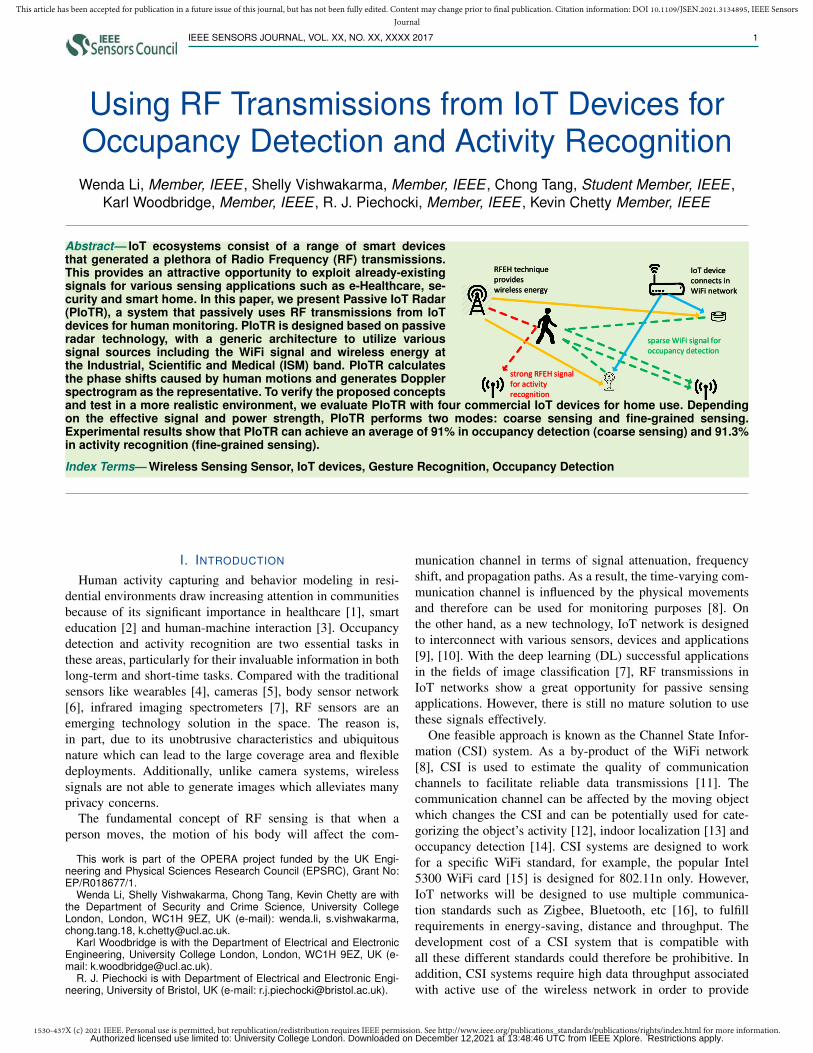
Abstract— IoT ecosystems consist of a range of smart devicesthat generated a plethora of Radio Frequency (RF) transmissions.This provides an attractive opportunity to exploit already-existingsignals for various sensing applications such as e-Healthcare, se-curity and smart home. In this paper, we present Passive IoT Radar(PIoTR), a system that passively uses RF transmissions from IoTdevices for human monitoring. PIoTR is designed based on passiveradar technology, with a generic architecture to utilize varioussignal sources including the WiFi signal and wireless energy atthe Industrial, Scientific and Medical (ISM) band. PIoTR calculatesthe phase shifts caused by human motions and generates Dopplerspectrogram as the representative. To verify the proposed conceptsand test in a more realistic environment, we evaluate PIoTR with four commercial IoT devices for home use. Dependingon the effective signal and power strength, PIoTR performs two modes: coarse sensing and fine-grained sensing.Experimental results show that PIoTR can achieve an average of 91% in occupancy detection (coarse sensing) and 91.3%in activity recognition (fine-grained sensing).
Index Terms— Wireless Sensing Sensor, IoT devices, Gesture Recognition, Occupancy Detection
I. INTRODUCTION
Human activity capturing and behavior modeling in resi-dential environments draw increasing attention in communitiesbecause of its significant importance in healthcare [1], smarteducation [2] and human-machine interaction [3]. Occupancydetection and activity recognition are two essential tasks inthese areas, particularly for their invaluable information in bothlong-term and short-time tasks. Compared with the traditionalsensors like wearables [4], cameras [5], body sensor network[6], infrared imaging spectrometers [7], RF sensors are anemerging technology solution in the space. The reason is,in part, due to its unobtrusive characteristics and ubiquitousnature which can lead to the large coverage area and flexibledeployments. Additionally, unlike camera systems, wirelesssignals are not able to generate images which alleviates manyprivacy concerns.
The fundamental concept of RF sensing is that when aperson moves, the motion of his body will affect the com-
This work is part of the OPERA project funded by the UK Engi-neering and Physical Sciences Research Council (EPSRC), Grant No:EP/R018677/1.
Wenda Li, Shelly Vishwakarma, Chong Tang, Kevin Chetty are withthe Department of Security and Crime Science, University CollegeLondon, London, WC1H 9EZ, UK (e-mail): wenda.li, s.vishwakarma,chong.tang.18, [email protected].
Karl Woodbridge is with the Department of Electrical and ElectronicEngineering, University College London, London, WC1H 9EZ, UK (e-mail: [email protected]).
R. J. Piechocki is with Department of Electrical and Electronic Engi-neering, University of Bristol, UK (e-mail: [email protected]).
munication channel in terms of signal attenuation, frequencyshift, and propagation paths. As a result, the time-varying com-munication channel is influenced by the physical movementsand therefore can be used for monitoring purposes [8]. Onthe other hand, as a new technology, IoT network is designedto interconnect with various sensors, devices and applications[9], [10]. With the deep learning (DL) successful applicationsin the fields of image classification [7], RF transmissions inIoT networks show a great opportunity for passive sensingapplications. However, there is still no mature solution to usethese signals effectively.
One feasible approach is known as the Channel State Infor-mation (CSI) system. As a by-product of the WiFi network[8], CSI is used to estimate the quality of communicationchannels to facilitate reliable data transmissions [11]. Thecommunication channel can be affected by the moving objectwhich changes the CSI and can be potentially used for cate-gorizing the object’s activity [12], indoor localization [13] andoccupancy detection [14]. CSI systems are designed to workfor a specific WiFi standard, for example, the popular Intel5300 WiFi card [15] is designed for 802.11n only. However,IoT networks will be designed to use multiple communica-tion standards such as Zigbee, Bluetooth, etc [16], to fulfillrequirements in energy-saving, distance and throughput. Thedevelopment cost of a CSI system that is compatible withall these different standards could therefore be prohibitive. Inaddition, CSI systems require high data throughput associatedwith active use of the wireless network in order to provide
Authorized licensed use limited to: University College London. Downloaded on December 12,2021 at 13:48:46 UTC from IEEE Xplore. Restrictions apply.

1530-437X (c) 2021 IEEE. Personal use is permitted, but republication/redistribution requires IEEE permission. See http://www.ieee.org/publications_standards/publications/rights/index.html for more information.
This article has been accepted for publication in a future issue of this journal, but has not been fully edited. Content may change prior to final publication. Citation information: DOI 10.1109/JSEN.2021.3134895, IEEE SensorsJournal
2 IEEE SENSORS JOURNAL, VOL. XX, NO. XX, XXXX 2017
sufficient sensing performance [12], [17] which will not onlyinterrupt the communication channel in IoT network but alsodrain more power from IoT devices [10].
On the other hand, Passive Radar (PR) systems also offera number of advantages for sensing within an IoT network.PR systems do not transmit any signal but instead, use thethird party signal source as an illuminator of opportunity.It has a long history in airborne detection and maritimesurveillance [18] which exploits existing FM radio, televisionand DVB-T signals. These PR systems typically make use ofrelative narrowband signals for detecting large targets at longdistances. Passive WiFi Radar (PWR) research has attractedlots of attention in recent years owing to the increased de-mand in near-field sensing applications. In work [19], authorsdemonstrate the feasibility of tracking drones, whilst work [20]counts the pedestrians in urban traffic scenarios. PWR systemshave also been used in human presence detection [21] andactivity recognition [22]. However, these PWR systems cannotbe directly applied to IoT networks as the mechanisms ofsignal broadcast from IoT devices are rather different from thatof a WiFi router. Also, variations in bandwidth, signal strengthand data rate can significantly affect the sensing performanceof PR systems.
The overview of purposed wireless sensing in IoT environ-ment is demonstrated in the Figure in abstract. The physi-cal configurations for PIoTR involve several pairs of WiFi-enabled IoT devices to be deployed in different places. Thesedevices can be powered by Radio Frequency Energy Har-vesting (RFEH) technique which deliveries energy wirelesslyfor sensors with a battery-less design. In such circumstances,PIoTR is designed with two modes to fully make use ofRF signals from IoT devices. Firstly, coarse sensing modeuses the sparse WiFi signal for occupancy detection/room-level localization. To improve the sensitivity and increasethe coverage area, multiple IoT devices are considered. Infine-grained sensing mode, the strong RFEH signal has beencaptured for high accuracy activity recognition not only inLine-of-Sight (LoS) but also in Through-The-Wall (TTW).PIoTR draws on classical PR techniques and adapts for IoTdevices with different configurations depending on the signalstrength, number of sources, etc.
Comparing to previous works [17], [22]–[24], the followingcontributions are made by this paper:
• Different from the above works on RF sensing, we usethe uncontrolled transmission signals from commercialIoT devices as the source. This is more challenging thanthose specifically modified transmitters.
• Multiple IoT devices have been tested including AmazonAlexa, Google Nest Cam, and a RFEH transmitter. Basedon the communication mechanism of these devices signalprocessing methods optimized for different frame rateswere selected.
• The performance of PIoTR is supported by several ex-periments with acceptable results. PIoTR achieves 91%accuracy in room occupancy detection with sparse IoTsignal and more than 99% with a continuous signal.The average accuracy in activity recognition also reaches91.3%.
The rest of this article is organized as follows. Section IIintroduces the IoT devices that used in this paper; SectionIII presents the signal processing and system implementation;Section IV presents the experimental results; discussions andconclusions are in Section V and VI.
II. RELATED WORKS
In this section, RF sensing techniques that have been appliedto IoT devices are discussed, including the CSI system whichworks with WiFi systems, and PR systems which can workwith multiple signal sources.
A. Channel State Information System
At the physical layer of wireless communications, CSI isuseful information for environmental perception. It measuresthe changes in wireless signal due to the static and dynamicobjects in terms of time, frequency and spatial domain. Thedifferent application requires specific signal processing andclassification/estimation algorithms.
Device-free activity recognition is one of the applicationsby CSI systems. An early work [25] uses Short-Time FourierTransform (STFT) to convert the CSI measurement intoDoppler spectrogram. It works at a high frame rate at 2500Hzand achieves 89% accuracy. However, this system only workson a pre-defined path and a pre-defined walking direction.Thus training is required for every new environment.
Another work [26] demonstrates a CSI system that containsthree receiving channels at different angles and runs at a framerate of 1,500Hz. The system claims a recognition accuracyof 96% and quantifies the relationship between CSI variationand human movement speed to eliminate the effect of theenvironment.
Fall detection is another important field for smart health.Work [27] develops a CSI system that is able to automaticallydetect falls from other activities. It calculates the powerprofile in time-frequency domain by exploiting the phase andamplitude changes in CSI measurements. This system worksat a frame rate of 100Hz, however its performance is affectedby the environment and user-antenna location.
CSI-based Breathing detection has been shown in [28], witha low frame rate of 20Hz. This system exams the user’slocation and body orientation based on the Fresnel model in anellipse shape. However, its monitoring area is limited withinthe middle area between the transmitter and receiver.
More recently, a WiFi-enabled IoT system [29] was de-signed for occupant activity sensing. This system collectsfine-grained CSI measurements and uploads them to a cloudserver for processing. The system shows an accuracy of96.8% in occupancy detection and 90% for six-class activityrecognition. However, the system is built based on two WiFirouters with a frame rate of 500Hz which can not representthe actual situation of IoT network.
As discussed above, CSI system is a by-product of WiFinetwork. Theoretically, it should work with the IoT devicesthat communicate via WiFi networks. However, it would bewith a high cost to design a network card that is compatible
Authorized licensed use limited to: University College London. Downloaded on December 12,2021 at 13:48:46 UTC from IEEE Xplore. Restrictions apply.
1530-437X (c) 2021 IEEE. Personal use is permitted, but republication/redistribution requires IEEE permission. See http://www.ieee.org/publications_standards/publications/rights/index.html for more information.
This article has been accepted for publication in a future issue of this journal, but has not been fully edited. Content may change prior to final publication. Citation information: DOI 10.1109/JSEN.2021.3134895, IEEE SensorsJournal
AUTHOR et al.: PREPARATION OF PAPERS FOR IEEE TRANSACTIONS AND JOURNALS (FEBRUARY 2021) 3
with all the major WiFi standards, also those non-WiFi net-works. In addition, CSI system normally requires a high framerate for sufficient detection [25], [26], which are around 1000-2500Hz. This frame rate is very high and conflicts with someIoT devices which have a limited battery or energy-efficientdesign.
B. Passive Radar System
PR systems, with different mechanisms as CSI systems,have also been widely used for short-range RF sensing. Thefundamental principle of PR system is to use the signal from athird-party transmitter and measure the time/phase differencebetween the signal arriving directly at the transmitter andthe signal arriving via reflection from the object of interest.Different from CSI system, PR system does not have theacknowledgment about the preamble signal. It calculates therange (bistatic distance) and Doppler (bistatic velocity) infor-mation.
An early work utilizes WiFi transmissions with PR isdescribed in [30]. It presents the feasibility detect a person ata stand-off distance (12m) with a WiFi router under Through-The-Wall (TTW) scenario. However, the system needs a chan-nel which directly attached to the WiFi router for perfect signalreconstruction.
Recently, PR system based on SDR platforms becomesmore popular due to their flexibility in deployment and fastdevelopment. Work [31] presents a prototype base on the SDRplatform with real-time ability by using a pipeline designfor multi-core processing. The system has shown severalpreliminary results such as TTW activity recognition andfinger gesture recognition. It is based on a classical passiveradar configuration and assumes that the reference channel isstable, which may to ideal in real-world.
Our previous work [24] has demonstrated the possibility touse PR system for multiple detection purposes. The systemcan perform vital sign detection and activity recognition byadjusting the Doppler resolution. This is achieved by extractingthe micro-Doppler as the representative for the chest motionand from torso and limbs. However, the system still requiresa high frame rate for sufficient detection.
On the other hand, signals from Bluetooth Low Energy(BLE), in unlicensed 2.4Ghz frequency band, have also beenstudied for indoor localization. System [32] uses a finger-printing technique to passive track the personnel’s locationdepending on the variation in Received Signal Strength (RSS).50Hz of BLE beacon signal was set with a total of 19BLE transmitters to cover an area of 750m2. This systemconfiguration is similar to an IoT network which includesmultiple signal sources. However, the fingerprinting techniquejust like RSS data is highly sensitive to the surroundingenvironment and requires a considerable calibration processwhen the background is changed.
Note that, above works have made some changes to theWiFi/BLE AP to enable a high frame/beacon rate. Also, works[24], [30], [31] attached an antenna to the WiFi router whichassumes the transmitted signal can be perfectly reconstructed.However, such configurations are hard to apply in real-world
WiFi beacon
AlexaGoogle
camGoogle Cam
WiFi beacon
AlexaGoogle
camGoogle Cam
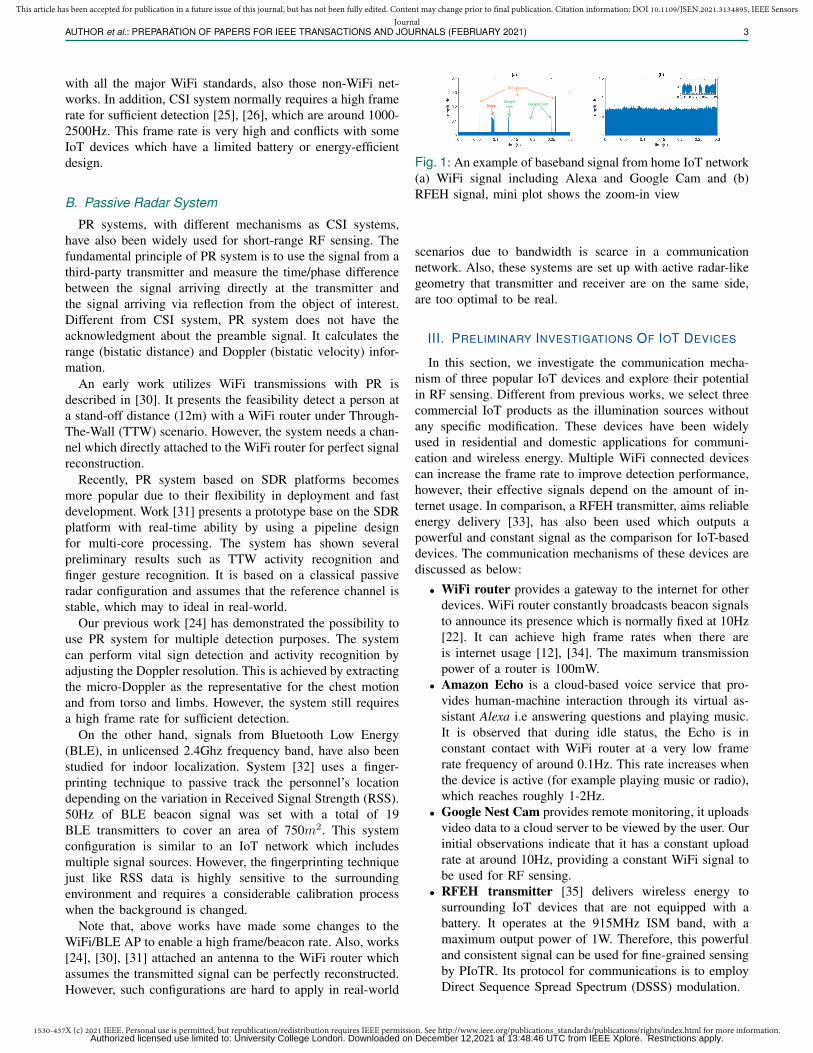
Fig. 1: An example of baseband signal from home IoT network(a) WiFi signal including Alexa and Google Cam and (b)RFEH signal, mini plot shows the zoom-in view
scenarios due to bandwidth is scarce in a communicationnetwork. Also, these systems are set up with active radar-likegeometry that transmitter and receiver are on the same side,are too optimal to be real.
III. PRELIMINARY INVESTIGATIONS OF IOT DEVICES
In this section, we investigate the communication mecha-nism of three popular IoT devices and explore their potentialin RF sensing. Different from previous works, we select threecommercial IoT products as the illumination sources withoutany specific modification. These devices have been widelyused in residential and domestic applications for communi-cation and wireless energy. Multiple WiFi connected devicescan increase the frame rate to improve detection performance,however, their effective signals depend on the amount of in-ternet usage. In comparison, a RFEH transmitter, aims reliableenergy delivery [33], has also been used which outputs apowerful and constant signal as the comparison for IoT-baseddevices. The communication mechanisms of these devices arediscussed as below:
• WiFi router provides a gateway to the internet for otherdevices. WiFi router constantly broadcasts beacon signalsto announce its presence which is normally fixed at 10Hz[22]. It can achieve high frame rates when there areis internet usage [12], [34]. The maximum transmissionpower of a router is 100mW.
• Amazon Echo is a cloud-based voice service that pro-vides human-machine interaction through its virtual as-sistant Alexa i.e answering questions and playing music.It is observed that during idle status, the Echo is inconstant contact with WiFi router at a very low framerate frequency of around 0.1Hz. This rate increases whenthe device is active (for example playing music or radio),which reaches roughly 1-2Hz.
• Google Nest Cam provides remote monitoring, it uploadsvideo data to a cloud server to be viewed by the user. Ourinitial observations indicate that it has a constant uploadrate at around 10Hz, providing a constant WiFi signal tobe used for RF sensing.
• RFEH transmitter [35] delivers wireless energy tosurrounding IoT devices that are not equipped with abattery. It operates at the 915MHz ISM band, with amaximum output power of 1W. Therefore, this powerfuland consistent signal can be used for fine-grained sensingby PIoTR. Its protocol for communications is to employDirect Sequence Spread Spectrum (DSSS) modulation.
Authorized licensed use limited to: University College London. Downloaded on December 12,2021 at 13:48:46 UTC from IEEE Xplore. Restrictions apply.
1530-437X (c) 2021 IEEE. Personal use is permitted, but republication/redistribution requires IEEE permission. See http://www.ieee.org/publications_standards/publications/rights/index.html for more information.
This article has been accepted for publication in a future issue of this journal, but has not been fully edited. Content may change prior to final publication. Citation information: DOI 10.1109/JSEN.2021.3134895, IEEE SensorsJournal
4 IEEE SENSORS JOURNAL, VOL. XX, NO. XX, XXXX 2017
Channel 1 Channel 2
IoT network EH transmitter
Coarse SensingFine-grained
Sensing
Function Select
Doppler Strength
Doppler Spectrogram
Denoise & Smooth
Real-time processing with LabVIEW Coarse Sensing
Occupancy Detection
SDR platform
Feature extraction
Classifier
Activity Recognition
Fine-grained Sensing
Classifier
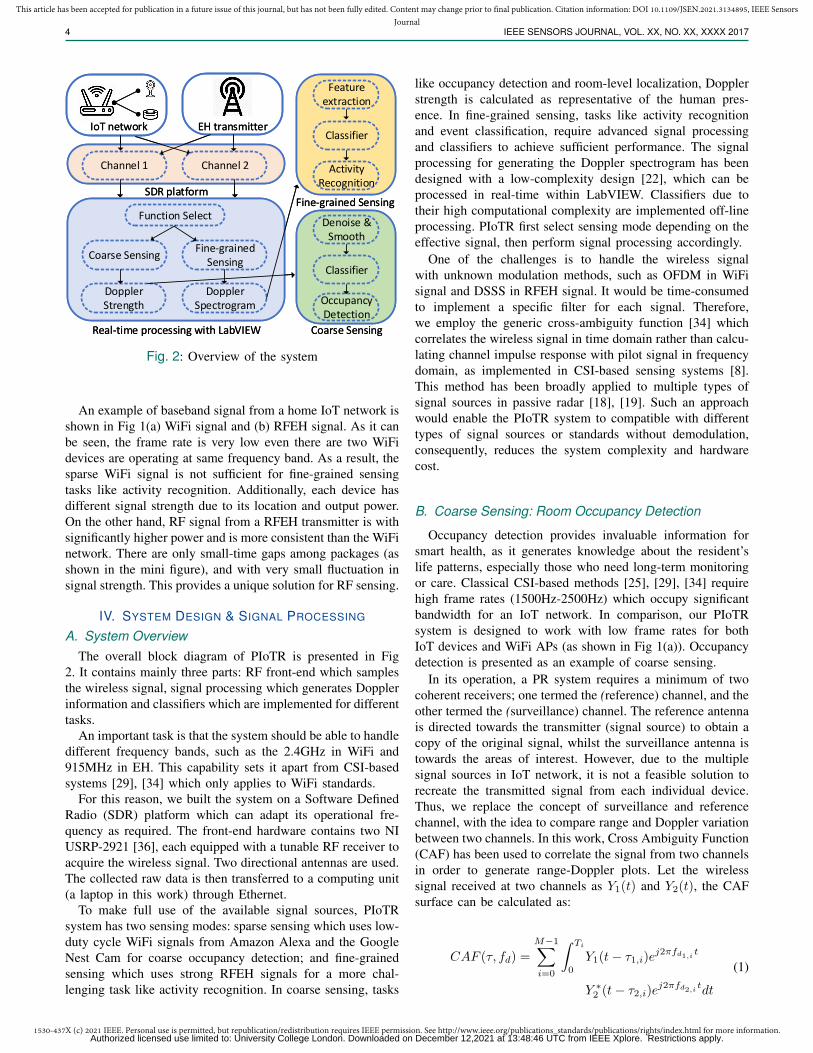
Fig. 2: Overview of the system
An example of baseband signal from a home IoT network isshown in Fig 1(a) WiFi signal and (b) RFEH signal. As it canbe seen, the frame rate is very low even there are two WiFidevices are operating at same frequency band. As a result, thesparse WiFi signal is not sufficient for fine-grained sensingtasks like activity recognition. Additionally, each device hasdifferent signal strength due to its location and output power.On the other hand, RF signal from a RFEH transmitter is withsignificantly higher power and is more consistent than the WiFinetwork. There are only small-time gaps among packages (asshown in the mini figure), and with very small fluctuation insignal strength. This provides a unique solution for RF sensing.
IV. SYSTEM DESIGN & SIGNAL PROCESSING
A. System OverviewThe overall block diagram of PIoTR is presented in Fig
2. It contains mainly three parts: RF front-end which samplesthe wireless signal, signal processing which generates Dopplerinformation and classifiers which are implemented for differenttasks.
An important task is that the system should be able to handledifferent frequency bands, such as the 2.4GHz in WiFi and915MHz in EH. This capability sets it apart from CSI-basedsystems [29], [34] which only applies to WiFi standards.
For this reason, we built the system on a Software DefinedRadio (SDR) platform which can adapt its operational fre-quency as required. The front-end hardware contains two NIUSRP-2921 [36], each equipped with a tunable RF receiver toacquire the wireless signal. Two directional antennas are used.The collected raw data is then transferred to a computing unit(a laptop in this work) through Ethernet.
To make full use of the available signal sources, PIoTRsystem has two sensing modes: sparse sensing which uses low-duty cycle WiFi signals from Amazon Alexa and the GoogleNest Cam for coarse occupancy detection; and fine-grainedsensing which uses strong RFEH signals for a more chal-lenging task like activity recognition. In coarse sensing, tasks
like occupancy detection and room-level localization, Dopplerstrength is calculated as representative of the human pres-ence. In fine-grained sensing, tasks like activity recognitionand event classification, require advanced signal processingand classifiers to achieve sufficient performance. The signalprocessing for generating the Doppler spectrogram has beendesigned with a low-complexity design [22], which can beprocessed in real-time within LabVIEW. Classifiers due totheir high computational complexity are implemented off-lineprocessing. PIoTR first select sensing mode depending on theeffective signal, then perform signal processing accordingly.
One of the challenges is to handle the wireless signalwith unknown modulation methods, such as OFDM in WiFisignal and DSSS in RFEH signal. It would be time-consumedto implement a specific filter for each signal. Therefore,we employ the generic cross-ambiguity function [34] whichcorrelates the wireless signal in time domain rather than calcu-lating channel impulse response with pilot signal in frequencydomain, as implemented in CSI-based sensing systems [8].This method has been broadly applied to multiple types ofsignal sources in passive radar [18], [19]. Such an approachwould enable the PIoTR system to compatible with differenttypes of signal sources or standards without demodulation,consequently, reduces the system complexity and hardwarecost.
B. Coarse Sensing: Room Occupancy Detection
Occupancy detection provides invaluable information forsmart health, as it generates knowledge about the resident’slife patterns, especially those who need long-term monitoringor care. Classical CSI-based methods [25], [29], [34] requirehigh frame rates (1500Hz-2500Hz) which occupy significantbandwidth for an IoT network. In comparison, our PIoTRsystem is designed to work with low frame rates for bothIoT devices and WiFi APs (as shown in Fig 1(a)). Occupancydetection is presented as an example of coarse sensing.
In its operation, a PR system requires a minimum of twocoherent receivers; one termed the (reference) channel, and theother termed the (surveillance) channel. The reference antennais directed towards the transmitter (signal source) to obtain acopy of the original signal, whilst the surveillance antenna istowards the areas of interest. However, due to the multiplesignal sources in IoT network, it is not a feasible solution torecreate the transmitted signal from each individual device.Thus, we replace the concept of surveillance and referencechannel, with the idea to compare range and Doppler variationbetween two channels. In this work, Cross Ambiguity Function(CAF) has been used to correlate the signal from two channelsin order to generate range-Doppler plots. Let the wirelesssignal received at two channels as Y1(t) and Y2(t), the CAFsurface can be calculated as:
CAF (τ, fd) =M−1∑i=0
∫ Ti
0
Y1(t− τ1,i)ej2πfd1,i t
Y ∗2 (t− τ2,i)e
j2πfd2,i tdt
(1)
Authorized licensed use limited to: University College London. Downloaded on December 12,2021 at 13:48:46 UTC from IEEE Xplore. Restrictions apply.
1530-437X (c) 2021 IEEE. Personal use is permitted, but republication/redistribution requires IEEE permission. See http://www.ieee.org/publications_standards/publications/rights/index.html for more information.
This article has been accepted for publication in a future issue of this journal, but has not been fully edited. Content may change prior to final publication. Citation information: DOI 10.1109/JSEN.2021.3134895, IEEE SensorsJournal
AUTHOR et al.: PREPARATION OF PAPERS FOR IEEE TRANSACTIONS AND JOURNALS (FEBRUARY 2021) 5
0 0.5 1 1.5 2
time(min)
100
200
300
400
500
600
Dopple
r str
ength
(a)
0 0.5 1 1.5 2
time(min)
100
200
300
400
500
600
Dopple
r str
ength
(b)
Fig. 3: Comparison of (a) raw and (b) denoised Dopplerstrength
0 5 10 15
time(min)
100
150
200
250
300
350
Dopple
r str
ength
(a)
0 5 10 15
time(min)
100
150
200
250
300
350
Dopple
r str
ength
(b)
0 5 10 15
time(min)
100
150
200
250
300
350
Dopple
r str
ength
(c)
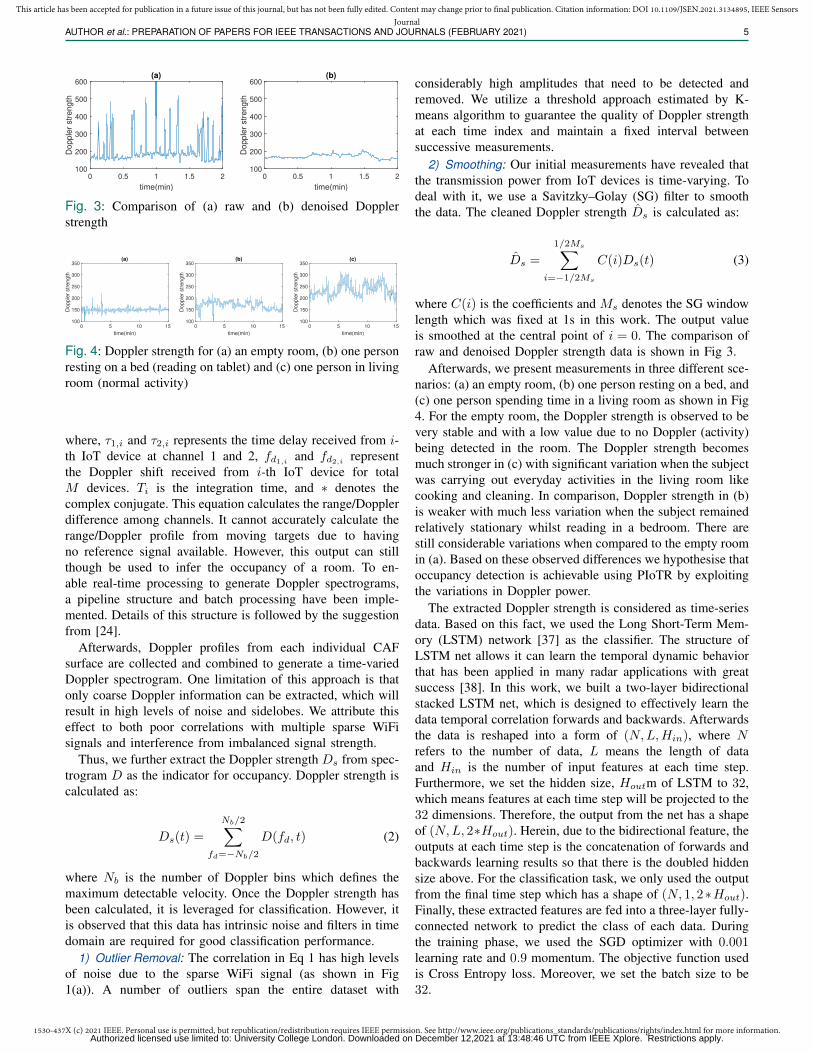
Fig. 4: Doppler strength for (a) an empty room, (b) one personresting on a bed (reading on tablet) and (c) one person in livingroom (normal activity)
where, τ1,i and τ2,i represents the time delay received from i-th IoT device at channel 1 and 2, fd1,i and fd2,i representthe Doppler shift received from i-th IoT device for totalM devices. Ti is the integration time, and ∗ denotes thecomplex conjugate. This equation calculates the range/Dopplerdifference among channels. It cannot accurately calculate therange/Doppler profile from moving targets due to havingno reference signal available. However, this output can stillthough be used to infer the occupancy of a room. To en-able real-time processing to generate Doppler spectrograms,a pipeline structure and batch processing have been imple-mented. Details of this structure is followed by the suggestionfrom [24].
Afterwards, Doppler profiles from each individual CAFsurface are collected and combined to generate a time-variedDoppler spectrogram. One limitation of this approach is thatonly coarse Doppler information can be extracted, which willresult in high levels of noise and sidelobes. We attribute thiseffect to both poor correlations with multiple sparse WiFisignals and interference from imbalanced signal strength.
Thus, we further extract the Doppler strength Ds from spec-trogram D as the indicator for occupancy. Doppler strength iscalculated as:
Ds(t) =
Nb/2∑fd=−Nb/2
D(fd, t) (2)
where Nb is the number of Doppler bins which defines themaximum detectable velocity. Once the Doppler strength hasbeen calculated, it is leveraged for classification. However, itis observed that this data has intrinsic noise and filters in timedomain are required for good classification performance.
1) Outlier Removal: The correlation in Eq 1 has high levelsof noise due to the sparse WiFi signal (as shown in Fig1(a)). A number of outliers span the entire dataset with
considerably high amplitudes that need to be detected andremoved. We utilize a threshold approach estimated by K-means algorithm to guarantee the quality of Doppler strengthat each time index and maintain a fixed interval betweensuccessive measurements.
2) Smoothing: Our initial measurements have revealed thatthe transmission power from IoT devices is time-varying. Todeal with it, we use a Savitzky–Golay (SG) filter to smooththe data. The cleaned Doppler strength Ds is calculated as:
Ds =
1/2Ms∑i=−1/2Ms
C(i)Ds(t) (3)
where C(i) is the coefficients and Ms denotes the SG windowlength which was fixed at 1s in this work. The output valueis smoothed at the central point of i = 0. The comparison ofraw and denoised Doppler strength data is shown in Fig 3.
Afterwards, we present measurements in three different sce-narios: (a) an empty room, (b) one person resting on a bed, and(c) one person spending time in a living room as shown in Fig4. For the empty room, the Doppler strength is observed to bevery stable and with a low value due to no Doppler (activity)being detected in the room. The Doppler strength becomesmuch stronger in (c) with significant variation when the subjectwas carrying out everyday activities in the living room likecooking and cleaning. In comparison, Doppler strength in (b)is weaker with much less variation when the subject remainedrelatively stationary whilst reading in a bedroom. There arestill considerable variations when compared to the empty roomin (a). Based on these observed differences we hypothesise thatoccupancy detection is achievable using PIoTR by exploitingthe variations in Doppler power.
The extracted Doppler strength is considered as time-seriesdata. Based on this fact, we used the Long Short-Term Mem-ory (LSTM) network [37] as the classifier. The structure ofLSTM net allows it can learn the temporal dynamic behaviorthat has been applied in many radar applications with greatsuccess [38]. In this work, we built a two-layer bidirectionalstacked LSTM net, which is designed to effectively learn thedata temporal correlation forwards and backwards. Afterwardsthe data is reshaped into a form of (N,L,Hin), where Nrefers to the number of data, L means the length of dataand Hin is the number of input features at each time step.Furthermore, we set the hidden size, Houtm of LSTM to 32,which means features at each time step will be projected to the32 dimensions. Therefore, the output from the net has a shapeof (N,L, 2∗Hout). Herein, due to the bidirectional feature, theoutputs at each time step is the concatenation of forwards andbackwards learning results so that there is the doubled hiddensize above. For the classification task, we only used the outputfrom the final time step which has a shape of (N, 1, 2∗Hout).Finally, these extracted features are fed into a three-layer fully-connected network to predict the class of each data. Duringthe training phase, we used the SGD optimizer with 0.001learning rate and 0.9 momentum. The objective function usedis Cross Entropy loss. Moreover, we set the batch size to be32.
Authorized licensed use limited to: University College London. Downloaded on December 12,2021 at 13:48:46 UTC from IEEE Xplore. Restrictions apply.
1530-437X (c) 2021 IEEE. Personal use is permitted, but republication/redistribution requires IEEE permission. See http://www.ieee.org/publications_standards/publications/rights/index.html for more information.
This article has been accepted for publication in a future issue of this journal, but has not been fully edited. Content may change prior to final publication. Citation information: DOI 10.1109/JSEN.2021.3134895, IEEE SensorsJournal
6 IEEE SENSORS JOURNAL, VOL. XX, NO. XX, XXXX 2017
C. Fine-Grained Sensing: Activity RecognitionHuman activity recognition is an important topic in human-
machine interface for a wide range of applications such asremote detection and behavior analysis. As discussed above,human activity can be captured by wireless signals and char-acterized by time-domain features. The powerful RFEH signalis naturally compatible with this topic.
Different from WiFi network, RFEH transmitter is consid-ered a single source in fine-grained sensing. Therefore, thetransmitted signal is needed as a reference to extract relativetime delay and Doppler shift from the reflected signal. Forthis reason, the concept of surveillance and reference channelis adopted for fine-grained sensing, where surveillance channelcollects the reflected signal from personnel and referencechannel records the original transmitted RFEH signal. Let thesignal from surveillance channel as Ssur(t) and from referencechannel as Sref (t), the CAF can be calculated as:
CAF (τ, fd) =
∫ Ti
0
Ssur(t)S∗ref (t− τ)ej2πfdtdt (4)
where CAF (τ, fd) is a 2D surface contains range τ andDoppler fd information.
The surveillance channel receives reflected signal whichcontains Doppler shifted target echoes as well as contributionsfrom surrounding clutter. Thermal noise in the receiver isalso present. The expression for surveillance channel can beexpressed as:
Ssur(t) = Sdsi(t) + Sclutter(t) + Star(t) + n(t) (5)
where Sdsi represents the direct signal interference, Sclutterrepresents the reflected signal from static clutter, Star rep-resents the signal from dynamic objects and thermal noiseis n(t). Eq 4 may break down if the power from Sdsi ismuch stronger than the Star. This is a common case in realenvironment where the direct signal is stronger than reflectedsignal. As a result, the desired Doppler pulse from dynamicobjects may be buried by the Doppler pulse due to directsignal. For this reason, it is necessary to remove this unwanteddirect signal from the CAF surface.
In this work, the CLEAN algorithm introduced by [20] hasbeen adopted. It uses a similar approach to the CAF processingbut only correlates the signal from reference channel. Thisgenerates a self-CAF surface that contains the Doppler pulsecreated by the direct signal. By suppressing the self-CAFsurface from Eq 4, the buried Doppler pulse is revealed.Let CAF k(τ , fd) represents the cleaned CAF surface at kthiteration, it can be written as:
CAF k(τ , fd) = CAF k−1(τ, fd) − αkCAFself (τ − Tk, fd)(6)
where αk is the maximum absolute value of CAF k(τ, fd),Tk is the phase shift factor and refers to αk. The phaseof CAF k(τ , fd) is shifted through a multiplication with acomplex phasor ej∆φ, where ∆φ is the phase differencebetween CAF k(τ , fd) and Doppler pulse along zero bins.
(a)
0 2 4 6
time(s)
-50
0
50
Do
pp
ler(
Hz)
-20
-15
-10
-5
0(b)
0 2 4 6
time(s)
-50
0
50
Do
pp
ler(
Hz)
-30
-20
-10
0(c)
0 2 4 6
time(s)
-50
0
50
Do
pp
ler(
Hz)
-25
-20
-15
-10
-5
0
(d)
0 2 4 6
time(s)
-50
0
50
Do
pp
ler(
Hz)
-30
-20
-10
0(e)
0 2 4 6
time(s)
-50
0
50
Do
pp
ler(
Hz)
-35
-30
-25
-20
-15
-10
-5(f)
0 2 4 6
time(s)
-50
0
50
Do
pp
ler(
Hz)
-40
-30
-20
-10
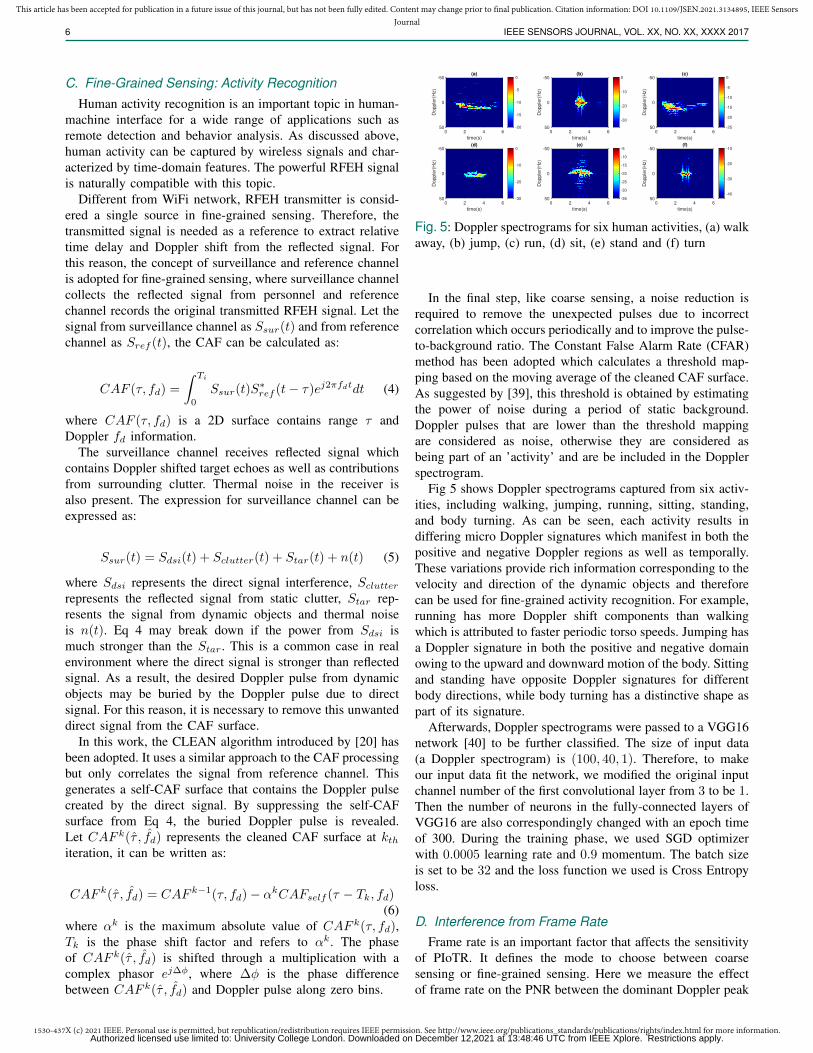
Fig. 5: Doppler spectrograms for six human activities, (a) walkaway, (b) jump, (c) run, (d) sit, (e) stand and (f) turn
In the final step, like coarse sensing, a noise reduction isrequired to remove the unexpected pulses due to incorrectcorrelation which occurs periodically and to improve the pulse-to-background ratio. The Constant False Alarm Rate (CFAR)method has been adopted which calculates a threshold map-ping based on the moving average of the cleaned CAF surface.As suggested by [39], this threshold is obtained by estimatingthe power of noise during a period of static background.Doppler pulses that are lower than the threshold mappingare considered as noise, otherwise they are considered asbeing part of an ’activity’ and are be included in the Dopplerspectrogram.
Fig 5 shows Doppler spectrograms captured from six activ-ities, including walking, jumping, running, sitting, standing,and body turning. As can be seen, each activity results indiffering micro Doppler signatures which manifest in both thepositive and negative Doppler regions as well as temporally.These variations provide rich information corresponding to thevelocity and direction of the dynamic objects and thereforecan be used for fine-grained activity recognition. For example,running has more Doppler shift components than walkingwhich is attributed to faster periodic torso speeds. Jumping hasa Doppler signature in both the positive and negative domainowing to the upward and downward motion of the body. Sittingand standing have opposite Doppler signatures for differentbody directions, while body turning has a distinctive shape aspart of its signature.
Afterwards, Doppler spectrograms were passed to a VGG16network [40] to be further classified. The size of input data(a Doppler spectrogram) is (100, 40, 1). Therefore, to makeour input data fit the network, we modified the original inputchannel number of the first convolutional layer from 3 to be 1.Then the number of neurons in the fully-connected layers ofVGG16 are also correspondingly changed with an epoch timeof 300. During the training phase, we used SGD optimizerwith 0.0005 learning rate and 0.9 momentum. The batch sizeis set to be 32 and the loss function we used is Cross Entropyloss.
D. Interference from Frame RateFrame rate is an important factor that affects the sensitivity
of PIoTR. It defines the mode to choose between coarsesensing or fine-grained sensing. Here we measure the effectof frame rate on the PNR between the dominant Doppler peak
Authorized licensed use limited to: University College London. Downloaded on December 12,2021 at 13:48:46 UTC from IEEE Xplore. Restrictions apply.
1530-437X (c) 2021 IEEE. Personal use is permitted, but republication/redistribution requires IEEE permission. See http://www.ieee.org/publications_standards/publications/rights/index.html for more information.
This article has been accepted for publication in a future issue of this journal, but has not been fully edited. Content may change prior to final publication. Citation information: DOI 10.1109/JSEN.2021.3134895, IEEE SensorsJournal
AUTHOR et al.: PREPARATION OF PAPERS FOR IEEE TRANSACTIONS AND JOURNALS (FEBRUARY 2021) 7
WiFi idle times
WiFi + IoT Devices
EH transmitter
WiFi idle times
WiFi + IoT Devices
EH transmitter
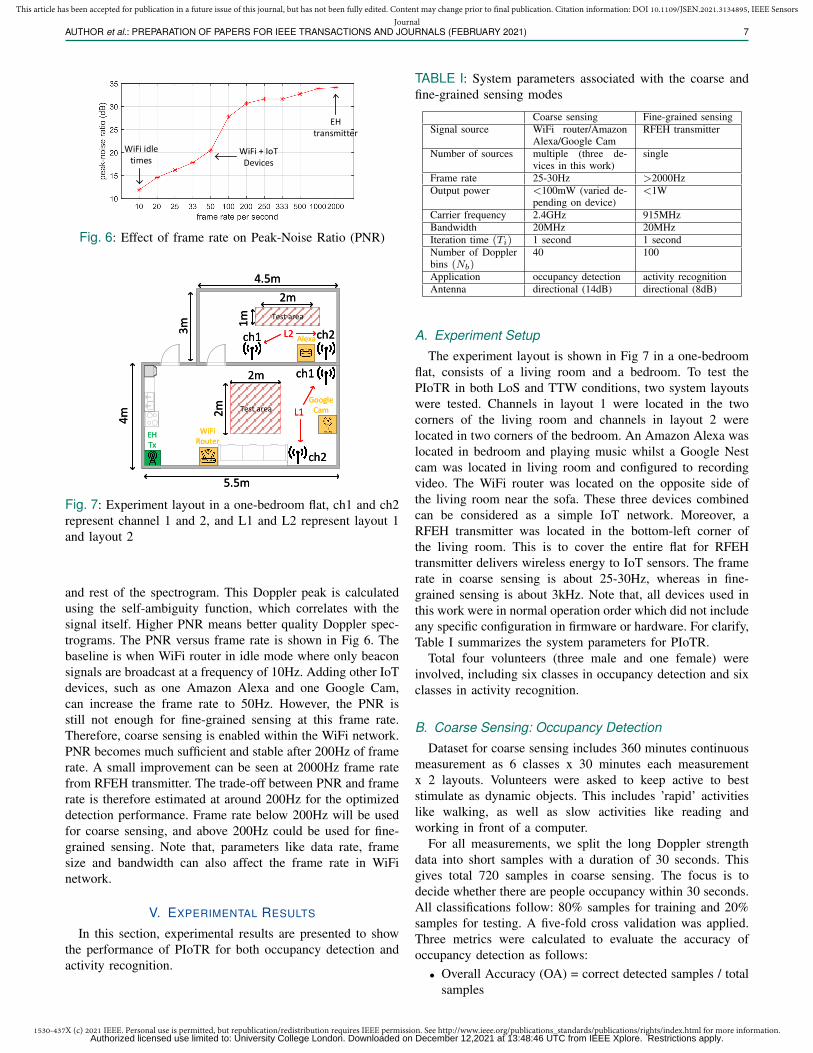
Fig. 6: Effect of frame rate on Peak-Noise Ratio (PNR)
ch1
ch2
4m
5.5m
4.5m
3m
WiFi Router
Google Cam
Alexach1 ch2
EHTx
L1
L2
Test area
Test area
2m
2m
2m
1m
ch1
ch2
4m
5.5m
4.5m
3m
WiFi Router
Google Cam
Alexach1 ch2
EHTx
L1
L2
Test area
Test area
2m
2m
2m
1m
Fig. 7: Experiment layout in a one-bedroom flat, ch1 and ch2represent channel 1 and 2, and L1 and L2 represent layout 1and layout 2
and rest of the spectrogram. This Doppler peak is calculatedusing the self-ambiguity function, which correlates with thesignal itself. Higher PNR means better quality Doppler spec-trograms. The PNR versus frame rate is shown in Fig 6. Thebaseline is when WiFi router in idle mode where only beaconsignals are broadcast at a frequency of 10Hz. Adding other IoTdevices, such as one Amazon Alexa and one Google Cam,can increase the frame rate to 50Hz. However, the PNR isstill not enough for fine-grained sensing at this frame rate.Therefore, coarse sensing is enabled within the WiFi network.PNR becomes much sufficient and stable after 200Hz of framerate. A small improvement can be seen at 2000Hz frame ratefrom RFEH transmitter. The trade-off between PNR and framerate is therefore estimated at around 200Hz for the optimizeddetection performance. Frame rate below 200Hz will be usedfor coarse sensing, and above 200Hz could be used for fine-grained sensing. Note that, parameters like data rate, framesize and bandwidth can also affect the frame rate in WiFinetwork.
V. EXPERIMENTAL RESULTS
In this section, experimental results are presented to showthe performance of PIoTR for both occupancy detection andactivity recognition.
TABLE I: System parameters associated with the coarse andfine-grained sensing modes
Coarse sensing Fine-grained sensingSignal source WiFi router/Amazon
Alexa/Google CamRFEH transmitter
Number of sources multiple (three de-vices in this work)
single
Frame rate 25-30Hz >2000HzOutput power <100mW (varied de-
pending on device)<1W
Carrier frequency 2.4GHz 915MHzBandwidth 20MHz 20MHzIteration time (Ti) 1 second 1 secondNumber of Dopplerbins (Nb)
40 100
Application occupancy detection activity recognitionAntenna directional (14dB) directional (8dB)
A. Experiment SetupThe experiment layout is shown in Fig 7 in a one-bedroom
flat, consists of a living room and a bedroom. To test thePIoTR in both LoS and TTW conditions, two system layoutswere tested. Channels in layout 1 were located in the twocorners of the living room and channels in layout 2 werelocated in two corners of the bedroom. An Amazon Alexa waslocated in bedroom and playing music whilst a Google Nestcam was located in living room and configured to recordingvideo. The WiFi router was located on the opposite side ofthe living room near the sofa. These three devices combinedcan be considered as a simple IoT network. Moreover, aRFEH transmitter was located in the bottom-left corner ofthe living room. This is to cover the entire flat for RFEHtransmitter delivers wireless energy to IoT sensors. The framerate in coarse sensing is about 25-30Hz, whereas in fine-grained sensing is about 3kHz. Note that, all devices used inthis work were in normal operation order which did not includeany specific configuration in firmware or hardware. For clarify,Table I summarizes the system parameters for PIoTR.
Total four volunteers (three male and one female) wereinvolved, including six classes in occupancy detection and sixclasses in activity recognition.
B. Coarse Sensing: Occupancy DetectionDataset for coarse sensing includes 360 minutes continuous
measurement as 6 classes x 30 minutes each measurementx 2 layouts. Volunteers were asked to keep active to beststimulate as dynamic objects. This includes ’rapid’ activitieslike walking, as well as slow activities like reading andworking in front of a computer.
For all measurements, we split the long Doppler strengthdata into short samples with a duration of 30 seconds. Thisgives total 720 samples in coarse sensing. The focus is todecide whether there are people occupancy within 30 seconds.All classifications follow: 80% samples for training and 20%samples for testing. A five-fold cross validation was applied.Three metrics were calculated to evaluate the accuracy ofoccupancy detection as follows:
• Overall Accuracy (OA) = correct detected samples / totalsamples
Authorized licensed use limited to: University College London. Downloaded on December 12,2021 at 13:48:46 UTC from IEEE Xplore. Restrictions apply.
1530-437X (c) 2021 IEEE. Personal use is permitted, but republication/redistribution requires IEEE permission. See http://www.ieee.org/publications_standards/publications/rights/index.html for more information.
This article has been accepted for publication in a future issue of this journal, but has not been fully edited. Content may change prior to final publication. Citation information: DOI 10.1109/JSEN.2021.3134895, IEEE SensorsJournal
8 IEEE SENSORS JOURNAL, VOL. XX, NO. XX, XXXX 2017
80%
0%
0%
18.2%
8.3%
7.7%
0%
80%
0%
0%
8.3%
0%
0%
13.3%
54.5%
0%
0%
0%
0%
0%
36.4%
72.7%
0%
0%
0%
6.7%
0%
0%
83.4%
0%
20%
0%
9.1%
9.1%
0%
92.3%
1 2 3 4 5 6
1
2
3
4
5
6
0
0.1
0.2
0.3
0.4
0.5
0.6
0.7
0.8
0.9
1
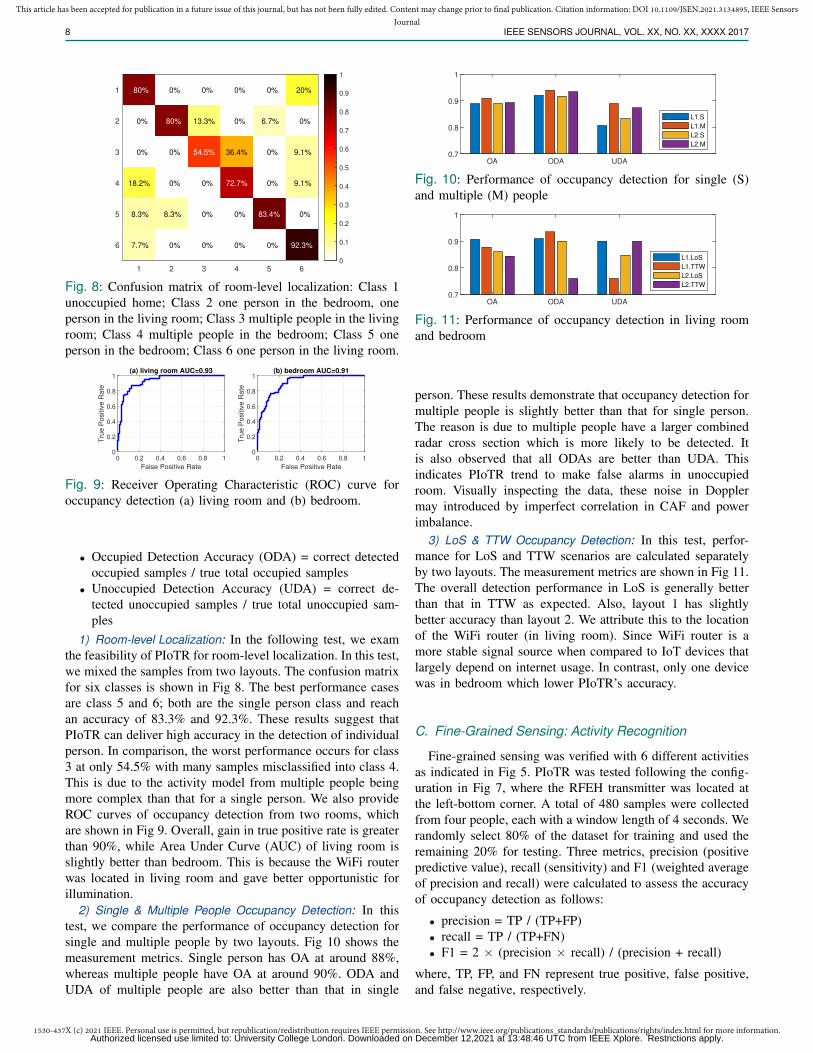
Fig. 8: Confusion matrix of room-level localization: Class 1unoccupied home; Class 2 one person in the bedroom, oneperson in the living room; Class 3 multiple people in the livingroom; Class 4 multiple people in the bedroom; Class 5 oneperson in the bedroom; Class 6 one person in the living room.
0 0.2 0.4 0.6 0.8 1
False Positive Rate
0
0.2
0.4
0.6
0.8
1
Tru
e P
ositiv
e R
ate
(a) living room AUC=0.93
0 0.2 0.4 0.6 0.8 1
False Positive Rate
0
0.2
0.4
0.6
0.8
1
Tru
e P
ositiv
e R
ate
(b) bedroom AUC=0.91
Fig. 9: Receiver Operating Characteristic (ROC) curve foroccupancy detection (a) living room and (b) bedroom.
• Occupied Detection Accuracy (ODA) = correct detectedoccupied samples / true total occupied samples
• Unoccupied Detection Accuracy (UDA) = correct de-tected unoccupied samples / true total unoccupied sam-ples
1) Room-level Localization: In the following test, we examthe feasibility of PIoTR for room-level localization. In this test,we mixed the samples from two layouts. The confusion matrixfor six classes is shown in Fig 8. The best performance casesare class 5 and 6; both are the single person class and reachan accuracy of 83.3% and 92.3%. These results suggest thatPIoTR can deliver high accuracy in the detection of individualperson. In comparison, the worst performance occurs for class3 at only 54.5% with many samples misclassified into class 4.This is due to the activity model from multiple people beingmore complex than that for a single person. We also provideROC curves of occupancy detection from two rooms, whichare shown in Fig 9. Overall, gain in true positive rate is greaterthan 90%, while Area Under Curve (AUC) of living room isslightly better than bedroom. This is because the WiFi routerwas located in living room and gave better opportunistic forillumination.
2) Single & Multiple People Occupancy Detection: In thistest, we compare the performance of occupancy detection forsingle and multiple people by two layouts. Fig 10 shows themeasurement metrics. Single person has OA at around 88%,whereas multiple people have OA at around 90%. ODA andUDA of multiple people are also better than that in single
OA ODA UDA0.7
0.8
0.9
1
L1.S
L1.M
L2.S
L2.M
Fig. 10: Performance of occupancy detection for single (S)and multiple (M) people
OA ODA UDA0.7
0.8
0.9
1
L1.LoS
L1.TTW
L2.LoS
L2.TTW
Fig. 11: Performance of occupancy detection in living roomand bedroom
person. These results demonstrate that occupancy detection formultiple people is slightly better than that for single person.The reason is due to multiple people have a larger combinedradar cross section which is more likely to be detected. Itis also observed that all ODAs are better than UDA. Thisindicates PIoTR trend to make false alarms in unoccupiedroom. Visually inspecting the data, these noise in Dopplermay introduced by imperfect correlation in CAF and powerimbalance.
3) LoS & TTW Occupancy Detection: In this test, perfor-mance for LoS and TTW scenarios are calculated separatelyby two layouts. The measurement metrics are shown in Fig 11.The overall detection performance in LoS is generally betterthan that in TTW as expected. Also, layout 1 has slightlybetter accuracy than layout 2. We attribute this to the locationof the WiFi router (in living room). Since WiFi router is amore stable signal source when compared to IoT devices thatlargely depend on internet usage. In contrast, only one devicewas in bedroom which lower PIoTR’s accuracy.
C. Fine-Grained Sensing: Activity Recognition
Fine-grained sensing was verified with 6 different activitiesas indicated in Fig 5. PIoTR was tested following the config-uration in Fig 7, where the RFEH transmitter was located atthe left-bottom corner. A total of 480 samples were collectedfrom four people, each with a window length of 4 seconds. Werandomly select 80% of the dataset for training and used theremaining 20% for testing. Three metrics, precision (positivepredictive value), recall (sensitivity) and F1 (weighted averageof precision and recall) were calculated to assess the accuracyof occupancy detection as follows:
• precision = TP / (TP+FP)• recall = TP / (TP+FN)• F1 = 2 × (precision × recall) / (precision + recall)
where, TP, FP, and FN represent true positive, false positive,and false negative, respectively.
Authorized licensed use limited to: University College London. Downloaded on December 12,2021 at 13:48:46 UTC from IEEE Xplore. Restrictions apply.

1530-437X (c) 2021 IEEE. Personal use is permitted, but republication/redistribution requires IEEE permission. See http://www.ieee.org/publications_standards/publications/rights/index.html for more information.
This article has been accepted for publication in a future issue of this journal, but has not been fully edited. Content may change prior to final publication. Citation information: DOI 10.1109/JSEN.2021.3134895, IEEE SensorsJournal
AUTHOR et al.: PREPARATION OF PAPERS FOR IEEE TRANSACTIONS AND JOURNALS (FEBRUARY 2021) 9
97.2%
0%
3.1%
0%
0.3%
0.8%
0%
97.2%
0.3%
1.1%
0.8%
1.8%
0%
0%
93.3%
0.6%
0%
0%
2.8%
0%
2.8%
91.4%
3.1%
7.8%
0%
0%
0.5%
2.2%
87.5%
8.5%
0%
2.8%
0%
4.7%
8.3%
81.1%
walk jump run sit stand turn
walk
jump
run
sit
stand
turn
0
0.1
0.2
0.3
0.4
0.5
0.6
0.7
0.8
0.9
1
Fig. 12: Confusion matrix of activity recognition
0 0.5 1
False Positive Rate
0
0.5
1
Tru
e P
ositiv
e R
ate
(a) walk AUC=0.98
0 0.5 1
False Positive Rate
0
0.5
1
Tru
e P
ositiv
e R
ate
(b) jump AUC=0.99
0 0.5 1
False Positive Rate
0
0.5
1
Tru
e P
ositiv
e R
ate
(c) run AUC=0.97
0 0.5 1
False Positive Rate
0
0.5
1
Tru
e P
ositiv
e R
ate
(d) sit AUC=0.99
0 0.5 1
False Positive Rate
0
0.5
1
Tru
e P
ositiv
e R
ate
(e) stand AUC=0.97
0 0.5 1
False Positive Rate
0
0.5
1
Tru
e P
ositiv
e R
ate
(f) turn AUC=0.92
Fig. 13: ROC curves for each activities.
1) Overall Recognition Accuracy: Fig 12 presents the confu-sion matrix of activity recognition showing an overall accuracyof 91.3%. As the figure shows, the best performing activitiesare walking and jumping, which both reach 97% accuracy.This is due to their relative unique Doppler signatures that areeasier to distinguish by the classifier. The running, sitting andstanding activities all achieved an accuracy around 90%. Theworst performing activity was the body turning, which gavejust over 80% accuracy. There are several misclassificationsamongst the sitting, standing, and turning activities. The reasonis believed due to their similar activity duration and weakDoppler signature. For example, walking and running bothhave higher velocity than the rest which makes them very easyto distinguish. In comparison, sitting, standing and turninghave much weaker and shorter Doppler signatures as shown inFig 6. ROC curves for each activity are shown in Fig 13. Dueto higher accuracy, most AUC values in activity recognition areabove 0.97 with exception of turn which is 0.92. The resultsare consistent with our analysis on Fig 12.
2) Recognition Accuracy in LoS and TTW: In this test, sam-ples from the LoS and TTW are trained and tested separately.The overall values of the precision, recall and F1 results areshown in Fig 15. As expected, LoS has better accuracy thanTTW in both layouts, with the highest values in precision,recall and F1. Benefited from the high transmit power from theRFEH device, there is only a slightly downgraded performanceunder TTW condition. TTW in layout 1 has the worst perfor-mance, this is because the RFEH signal penetrated the walltwice (outward and reflection), which had been significantlyattenuated.
precision recall F10.8
0.85
0.9
0.95
1
L1.LoS
L1.TTW
L2.LoS
L2.TTW
Fig. 14: Precision, Recall, and F1 results for activity recogni-tion in living room and bedroom
precision recall F10.6
0.7
0.8
0.9
person one
person two
person three
person four
Fig. 15: Precision, Recall, and F1 results for inter-personrecognition
TABLE II: Performance Comparison in different Locations
Testing lo-cation
LoS in liv-ing room
TTW inbedroom
LoS in alab
TTW in anindividualroom
Distance totransmitter
5m 8m 6m 6m
Dataset size 240 240 180 220Precision 96.2% 86.8% 94.7% 84.3%Recall 96.9% 86.3% 93.5% 82.1%F1 96.6% 86.4% 94.1% 83.2%
3) Recognition Accuracy of Inter-Person: Here, we evalu-ate recognition accuracy between people by testing samplesfrom one volunteer and training samples from the other twovolunteers. This test is more realistic as in many scenarios,the classifier does not have a sample from unknown subjectsand has to rely on the pre-trained classifier. The classificationresults are shown in Fig 15. As the figure shows, classificationperformance is similar for all four people at around 80%.This downgrade in accuracy is due to the differences inDoppler signature between training and testing volunteers.Nevertheless, the system can still deliver good accuracy torecognize activities from a new user base on the previoustraining from known samples.
4) Recognition Accuracy in Different Locations: Finally, wefurther verified the performance of PIoTR in different loca-tions including: a LoS scenario in a lab (7m×6m) and aTTW scenario in an individual room (4.3m×4.6m). The sameactivities were carried out in both experiments and a RFEHtransmitter was used as the signal source. The classificationprocess for each dataset was same as described above. Table IIpresents the details of two experiments and their classificationresults, together with that information from Fig 14. In general,LoS gives better performance than the TTW as the resultof a stronger direct signal. Classification accuracy in LoScan achieve more than 92%, while in TTW can achievearound 83%. Additionally, these results demonstrate PIoTRcan deliver stable performance in different scenarios.
Authorized licensed use limited to: University College London. Downloaded on December 12,2021 at 13:48:46 UTC from IEEE Xplore. Restrictions apply.
1530-437X (c) 2021 IEEE. Personal use is permitted, but republication/redistribution requires IEEE permission. See http://www.ieee.org/publications_standards/publications/rights/index.html for more information.
This article has been accepted for publication in a future issue of this journal, but has not been fully edited. Content may change prior to final publication. Citation information: DOI 10.1109/JSEN.2021.3134895, IEEE SensorsJournal
10 IEEE SENSORS JOURNAL, VOL. XX, NO. XX, XXXX 2017
(a)
0 5 10 15 20 25 30
time(s)
-50
0
50
Dopple
r(H
z)
(b)
0 5 10 15 20 25 30
time(s)
-50
0
50
Dopple
r(H
z)
0 5 10 15 20 25 30
time(s)
100
200
300
400
500
Dopple
r str
ength
(c)
0 5 10 15 20 25 30
time(s)
100
200
300
400
500
Dopple
r str
ength
(d)
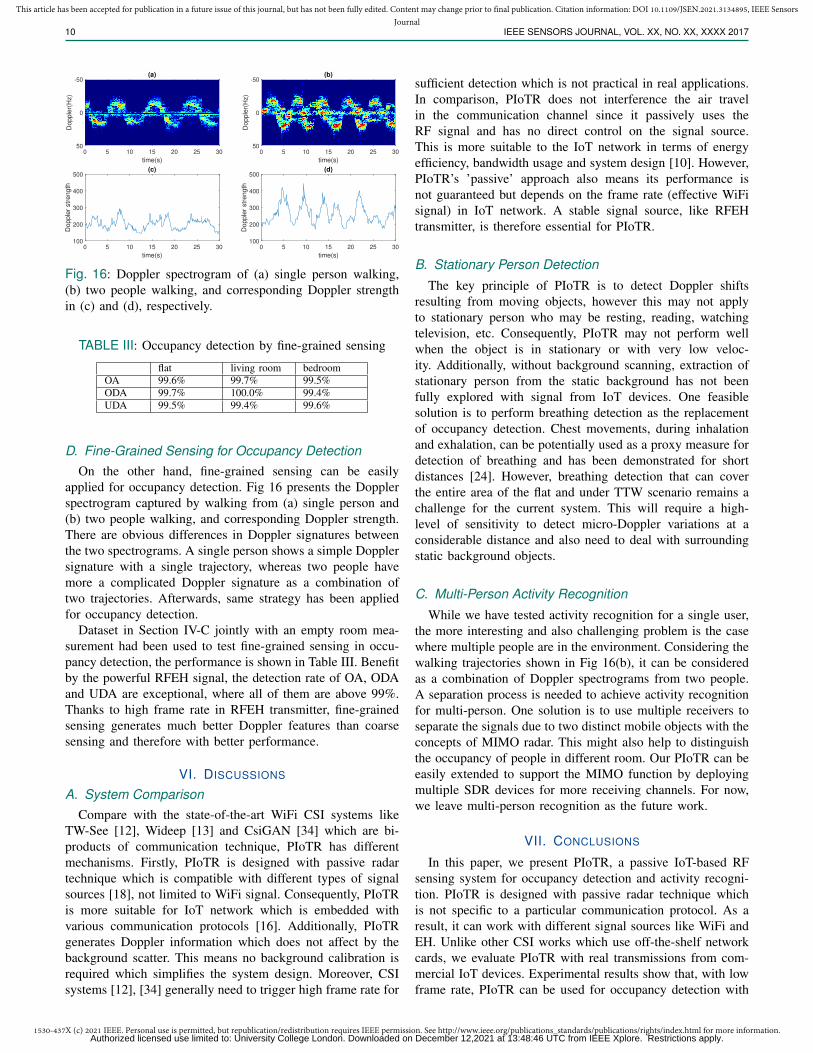
Fig. 16: Doppler spectrogram of (a) single person walking,(b) two people walking, and corresponding Doppler strengthin (c) and (d), respectively.
TABLE III: Occupancy detection by fine-grained sensing
flat living room bedroomOA 99.6% 99.7% 99.5%ODA 99.7% 100.0% 99.4%UDA 99.5% 99.4% 99.6%
D. Fine-Grained Sensing for Occupancy DetectionOn the other hand, fine-grained sensing can be easily
applied for occupancy detection. Fig 16 presents the Dopplerspectrogram captured by walking from (a) single person and(b) two people walking, and corresponding Doppler strength.There are obvious differences in Doppler signatures betweenthe two spectrograms. A single person shows a simple Dopplersignature with a single trajectory, whereas two people havemore a complicated Doppler signature as a combination oftwo trajectories. Afterwards, same strategy has been appliedfor occupancy detection.
Dataset in Section IV-C jointly with an empty room mea-surement had been used to test fine-grained sensing in occu-pancy detection, the performance is shown in Table III. Benefitby the powerful RFEH signal, the detection rate of OA, ODAand UDA are exceptional, where all of them are above 99%.Thanks to high frame rate in RFEH transmitter, fine-grainedsensing generates much better Doppler features than coarsesensing and therefore with better performance.
VI. DISCUSSIONS
A. System ComparisonCompare with the state-of-the-art WiFi CSI systems like
TW-See [12], Wideep [13] and CsiGAN [34] which are bi-products of communication technique, PIoTR has differentmechanisms. Firstly, PIoTR is designed with passive radartechnique which is compatible with different types of signalsources [18], not limited to WiFi signal. Consequently, PIoTRis more suitable for IoT network which is embedded withvarious communication protocols [16]. Additionally, PIoTRgenerates Doppler information which does not affect by thebackground scatter. This means no background calibration isrequired which simplifies the system design. Moreover, CSIsystems [12], [34] generally need to trigger high frame rate for
sufficient detection which is not practical in real applications.In comparison, PIoTR does not interference the air travelin the communication channel since it passively uses theRF signal and has no direct control on the signal source.This is more suitable to the IoT network in terms of energyefficiency, bandwidth usage and system design [10]. However,PIoTR’s ’passive’ approach also means its performance isnot guaranteed but depends on the frame rate (effective WiFisignal) in IoT network. A stable signal source, like RFEHtransmitter, is therefore essential for PIoTR.
B. Stationary Person Detection
The key principle of PIoTR is to detect Doppler shiftsresulting from moving objects, however this may not applyto stationary person who may be resting, reading, watchingtelevision, etc. Consequently, PIoTR may not perform wellwhen the object is in stationary or with very low veloc-ity. Additionally, without background scanning, extraction ofstationary person from the static background has not beenfully explored with signal from IoT devices. One feasiblesolution is to perform breathing detection as the replacementof occupancy detection. Chest movements, during inhalationand exhalation, can be potentially used as a proxy measure fordetection of breathing and has been demonstrated for shortdistances [24]. However, breathing detection that can coverthe entire area of the flat and under TTW scenario remains achallenge for the current system. This will require a high-level of sensitivity to detect micro-Doppler variations at aconsiderable distance and also need to deal with surroundingstatic background objects.
C. Multi-Person Activity Recognition
While we have tested activity recognition for a single user,the more interesting and also challenging problem is the casewhere multiple people are in the environment. Considering thewalking trajectories shown in Fig 16(b), it can be consideredas a combination of Doppler spectrograms from two people.A separation process is needed to achieve activity recognitionfor multi-person. One solution is to use multiple receivers toseparate the signals due to two distinct mobile objects with theconcepts of MIMO radar. This might also help to distinguishthe occupancy of people in different room. Our PIoTR can beeasily extended to support the MIMO function by deployingmultiple SDR devices for more receiving channels. For now,we leave multi-person recognition as the future work.
VII. CONCLUSIONS
In this paper, we present PIoTR, a passive IoT-based RFsensing system for occupancy detection and activity recogni-tion. PIoTR is designed with passive radar technique whichis not specific to a particular communication protocol. As aresult, it can work with different signal sources like WiFi andEH. Unlike other CSI works which use off-the-shelf networkcards, we evaluate PIoTR with real transmissions from com-mercial IoT devices. Experimental results show that, with lowframe rate, PIoTR can be used for occupancy detection with
Authorized licensed use limited to: University College London. Downloaded on December 12,2021 at 13:48:46 UTC from IEEE Xplore. Restrictions apply.
1530-437X (c) 2021 IEEE. Personal use is permitted, but republication/redistribution requires IEEE permission. See http://www.ieee.org/publications_standards/publications/rights/index.html for more information.
This article has been accepted for publication in a future issue of this journal, but has not been fully edited. Content may change prior to final publication. Citation information: DOI 10.1109/JSEN.2021.3134895, IEEE SensorsJournal
AUTHOR et al.: PREPARATION OF PAPERS FOR IEEE TRANSACTIONS AND JOURNALS (FEBRUARY 2021) 11
an average accuracy of 90%. Whilst, with a high frame rate,PIoTR can achieve 91.3% accuracy in activity recognition andmore than 99% in occupancy detection.
Potential works include the study of the feasibility of othershort-range signal sources like NFC, Bluetooth. They could beused for near-field sensing like finger gesture and vital signdetection. Also, studies on extended topics like multi-personrecognition, distinguishing animals and humans and controlof computational complexity are essential to further deployPIoTR as a practical system.
REFERENCES
[1] X. Zhou, W. Liang, I. Kevin, K. Wang, H. Wang, L. T. Yang, andQ. Jin, “Deep-learning-enhanced human activity recognition for internetof healthcare things,” IEEE Internet of Things Journal, vol. 7, no. 7, pp.6429–6438, 2020.
[2] T. Liu, J. Wang, B. Yang, and X. Wang, “Ngdnet: Nonuniform gaussian-label distribution learning for infrared head pose estimation and on-taskbehavior understanding in the classroom,” Neurocomputing, vol. 436,pp. 210–220, 2021.
[3] M. Nardo, D. Forino, and T. Murino, “The evolution of man–machineinteraction: The role of human in industry 4.0 paradigm,” Production &Manufacturing Research, vol. 8, no. 1, pp. 20–34, 2020.
[4] L. Chen and C. D. Nugent, “Sensor-based activity recognition review,”in Human Activity Recognition and Behaviour Analysis. Springer, 2019,pp. 23–47.
[5] D. R. Beddiar, B. Nini, M. Sabokrou, and A. Hadid, “Vision-based hu-man activity recognition: a survey,” Multimedia Tools and Applications,vol. 79, no. 41, pp. 30 509–30 555, 2020.
[6] M. Muzammal, R. Talat, A. H. Sodhro, and S. Pirbhulal, “A multi-sensor data fusion enabled ensemble approach for medical data frombody sensor networks,” Information Fusion, vol. 53, pp. 155–164, 2020.
[7] T. Liu, J. Wang, B. Yang, and X. Wang, “Ngdnet: Nonuniform gaussian-label distribution learning for infrared head pose estimation and on-taskbehavior understanding in the classroom,” Neurocomputing, vol. 436,pp. 210–220, 2021.
[8] Y. Ma, G. Zhou, and S. Wang, “Wifi sensing with channel stateinformation: A survey,” ACM Computing Surveys (CSUR), vol. 52, no. 3,p. 46, 2019.
[9] L. Chettri and R. Bera, “A comprehensive survey on internet of things(iot) toward 5g wireless systems,” IEEE Internet of Things Journal,vol. 7, no. 1, pp. 16–32, 2019.
[10] A. H. Sodhro, S. Pirbhulal, A. K. Sangaiah, S. Lohano, G. H. Sodhro,and Z. Luo, “5g-based transmission power control mechanism in fogcomputing for internet of things devices,” Sustainability, vol. 10, no. 4,p. 1258, 2018.
[11] R. v. Nee and R. Prasad, OFDM for wireless multimedia communica-tions. Artech House, Inc., 2000.
[12] X. Wu, Z. Chu, P. Yang, C. Xiang, X. Zheng, and W. Huang, “Tw-see: Human activity recognition through the wall with commodity wi-fidevices,” IEEE Transactions on Vehicular Technology, vol. 68, no. 1,pp. 306–319, 2018.
[13] M. Abbas, M. Elhamshary, H. Rizk, M. Torki, and M. Youssef, “Wideep:Wifi-based accurate and robust indoor localization system using deeplearning,” in 2019 IEEE International Conference on Pervasive Com-puting and Communications (PerCom. IEEE, 2019, pp. 1–10.
[14] H. Zou, Y. Zhou, J. Yang, and C. J. Spanos, “Device-free occupancydetection and crowd counting in smart buildings with wifi-enabled iot,”Energy and Buildings, vol. 174, pp. 309–322, 2018.
[15] “Linux 802.11n CSI tool,” https://dhalperi.github.io/linux-80211n-csitool/, (Accessed on 05/11/2020).
[16] S. Al-Sarawi, M. Anbar, K. Alieyan, and M. Alzubaidi, “Internetof things (iot) communication protocols,” in 2017 8th Internationalconference on information technology (ICIT). IEEE, 2017, pp. 685–690.
[17] F. Wang, J. Feng, Y. Zhao, X. Zhang, S. Zhang, and J. Han, “Jointactivity recognition and indoor localization with wifi fingerprints,” IEEEAccess, vol. 7, pp. 80 058–80 068, 2019.
[18] H. Kuschel, D. Cristallini, and K. E. Olsen, “Tutorial: Passive radartutorial,” IEEE Aerospace and Electronic Systems Magazine, vol. 34,no. 2, pp. 2–19, 2019.
[19] O. Cabrera, C. Bongioanni, F. Filippini, O. Sarabakha, F. Colone, andP. Lombardo, “Detecting drones and human beings with dvb-s based cotspassive radar for short-range surveillance,” in 2020 IEEE InternationalRadar Conference (RADAR). IEEE, 2020, pp. 37–42.
[20] A. Guillen-Perez and M. D. C. Banos, “A wifi-based method to countand locate pedestrians in urban traffic scenarios,” in 2018 14th Interna-tional Conference on Wireless and Mobile Computing, Networking andCommunications (WiMob). IEEE, 2018, pp. 123–130.
[21] W. Li, B. Tan, and R. J. Piechocki, “Wifi-based passive sensing systemfor human presence and activity event classification,” IET WirelessSensor Systems, vol. 8, no. 6, pp. 276–283, 2018.
[22] W. Li, R. J. Piechocki, K. Woodbridge, and K. Chetty, “Physicalactivity sensing via stand-alone wifi device,” in 2019 IEEE GlobalCommunications Conference (GLOBECOM). IEEE, 2019, pp. 1–6.
[23] J. Zhang, F. Wu, B. Wei, Q. Zhang, H. Huang, S. W. Shah, and J. Cheng,“Data augmentation and dense-lstm for human activity recognition usingwifi signal,” IEEE Internet of Things Journal, vol. 8, no. 6, pp. 4628–4641, 2020.
[24] W. Li, B. Tan, and R. Piechocki, “Passive radar for opportunisticmonitoring in e-health applications,” IEEE journal of translationalengineering in health and medicine, vol. 6, pp. 1–10, 2018.
[25] W. Wang, A. X. Liu, and M. Shahzad, “Gait recognition using wifisignals,” in Proceedings of the 2016 ACM International Joint Conferenceon Pervasive and Ubiquitous Computing. ACM, 2016, pp. 363–373.
[26] W. Wang, A. X. Liu, M. Shahzad, K. Ling, and S. Lu, “Device-free human activity recognition using commercial wifi devices,” IEEEJournal on Selected Areas in Communications, vol. 35, no. 5, pp. 1118–1131, 2017.
[27] H. Wang, D. Zhang, Y. Wang, J. Ma, Y. Wang, and S. Li, “Rt-fall:A real-time and contactless fall detection system with commodity wifidevices,” IEEE Transactions on Mobile Computing, vol. 16, no. 2, pp.511–526, 2016.
[28] H. Wang, D. Zhang, J. Ma, Y. Wang, Y. Wang, D. Wu, T. Gu, andB. Xie, “Human respiration detection with commodity wifi devices:do user location and body orientation matter?” in Proceedings of the2016 ACM International Joint Conference on Pervasive and UbiquitousComputing. ACM, 2016, pp. 25–36.
[29] J. Yang, H. Zou, H. Jiang, and L. Xie, “Device-free occupant activitysensing using wifi-enabled iot devices for smart homes,” IEEE Internetof Things Journal, vol. 5, no. 5, pp. 3991–4002, 2018.
[30] K. Chetty, G. E. Smith, and K. Woodbridge, “Through-the-wall sensingof personnel using passive bistatic wifi radar at standoff distances,” IEEETransactions on Geoscience and Remote Sensing, vol. 50, no. 4, pp.1218–1226, 2011.
[31] B. Tan, K. Woodbridge, and K. Chetty, “A real-time high resolutionpassive wifi doppler-radar and its applications,” in 2014 InternationalRadar Conference. IEEE, 2014, pp. 1–6.
[32] R. Faragher and R. Harle, “Location fingerprinting with bluetooth lowenergy beacons,” IEEE journal on Selected Areas in Communications,vol. 33, no. 11, pp. 2418–2428, 2015.
[33] M. Min, L. Xiao, Y. Chen, P. Cheng, D. Wu, and W. Zhuang, “Learning-based computation offloading for iot devices with energy harvesting,”IEEE Transactions on Vehicular Technology, vol. 68, no. 2, pp. 1930–1941, 2019.
[34] Y. He, Y. Chen, Y. Hu, and B. Zeng, “Wifi vision: Sensing, recognition,and detection with commodity mimo-ofdm wifi,” IEEE Internet ofThings Journal, vol. 7, no. 9, pp. 8296–8317, 2020.
[35] Powercast energy harvesing transmitter. [Online]. Available:http://www.powercastco.com/products/powercaster-transmitter
[36] Ni usrp 2921. [Online]. Available:http://sine.ni.com/nips/cds/view/p/lang/en/nid/212995
[37] K. Greff, R. K. Srivastava, J. Koutnık, B. R. Steunebrink, and J. Schmid-huber, “Lstm: A search space odyssey,” IEEE transactions on neuralnetworks and learning systems, vol. 28, no. 10, pp. 2222–2232, 2016.
[38] Z. Zeng, M. G. Amin, and T. Shan, “Arm motion classification usingtime-series analysis of the spectrogram frequency envelopes,” RemoteSensing, vol. 12, no. 3, p. 454, 2020.
[39] J. J. Lehtomaki, J. Vartiainen, M. Juntti, and H. Saarnisaari, “Cfaroutlier detection with forward methods,” IEEE Transactions on SignalProcessing, vol. 55, no. 9, pp. 4702–4706, 2007.
[40] K. Simonyan and A. Zisserman, “Very deep convolutional networks forlarge-scale image recognition,” arXiv preprint arXiv:1409.1556, 2014.
Authorized licensed use limited to: University College London. Downloaded on December 12,2021 at 13:48:46 UTC from IEEE Xplore. Restrictions apply.


