Embed Size (px)
Citation preview
UNIVERSITY OF SURREY
DOCTORATE IN CLINICAL PSYCHOLOGY
CONVERSION COURSE
KAREN LONG BSC., MSC., C. PSYCHOL

ProQuest Number: 27606661
All rights reserved
INFORMATION TO ALL USERS The quality of this reproduction is dependent upon the quality of the copy submitted.
In the unlikely event that the author did not send a com p le te manuscript and there are missing pages, these will be noted. Also, if material had to be removed,
a note will indicate the deletion.
uestProQuest 27606661
Published by ProQuest LLO (2019). Copyright of the Dissertation is held by the Author.
All rights reserved.This work is protected against unauthorized copying under Title 17, United States C ode
Microform Edition © ProQuest LLO.
ProQuest LLO.789 East Eisenhower Parkway
P.Q. Box 1346 Ann Arbor, Ml 48106- 1346
DOCTORATE IN CLINICAL PSYCHOLOGY CONVERSION COURSE
CONTENTS OF PORTFOLIO
SECTION 1: INTRODUCTION PAGE NO.
1.1 Personal Study Plan................................................. 1
SECTION 2: ACADEMIC DOSSIER
2.1 The Psychological Profile of Neurofibromatosis
Type 1 : A Review of the Literature.......................... 13
2.2 Assessment and Diagnosis of Major Depressive
Disorder in Adults with a Learning Disability: A
Review of the Literature........................................... 36
SECTION 3: CLINICAL DOSSIER
3.1 A Group for Adults with a Learning Disability on
Keeping Safe in the Local Community. Report of
Group Design, Development and Evaluation 70
SECTION 4: RESEARCH DOSSIER
4.1 The Life Experiences of Adults with a Learning
Disability: A Comparison Between Objective and
Subjective Measures................................................. 208
4.2 The Self-Concept, Perception of Disability and
Aspirations of People with Mild Learning
Disabilities. Research Previously Submitted for
Msc in 1992......... 427

SECTION ONE
INTRODUCTION

1.1
PERSONAL STUDY PLAN
PERSONAL STUDY PLAN
CONTENTS
1. AIMS AND OBJECTIVES
2. CLINICAL DOSSIER
2.1 Summary of Post Qualification Courses Attended
2.2 Programme of Service Delivery
3. ACADEMIC DOSSIER
3.1 The Psychological Profile of Neurofibromatosis Type 1: A Review
of the Literature
3.2 Assessment and Diagnosis of Major Depressive Disorder in Adults
with a Learning Disability: A Review of the Literature
4. RESEARCH DOSSIER
4.1 The Life Experiences of Adults with a Mild Learning Disability: A
Comparison Between Objective and Subjective Measures
4.1.1 Focus
4.1.2 Hypotheses
4.1.3 Methodology
4.1.3.1 Participant Characteristics
4.2.3.2 Quality of Life Measurement
4.1.3 Data Analysis and Interpretation
4.2 The Self-Concept, Perception of Disability and Aspirations of
People with Mild Learning Disabilities
PERSONAL STUDY PLAN
NAME: Karen Amanda Long
DATE OF REGISTRATION: 1 April 1995
DATE OF COMPLETION: 30 November 1997
REGISTRATION NUMBER: 3417255
1. AIMS AND OBJECTIVES
In undertaking the PsychD conversion course my aim is to contribute substantially to
my own personal and professional development by creating a portfolio of work
covering topics of personal interest and those which will enhance the psychological
services offered within the learning disability speciality.
Areas selected for further study include those which will highlight both the core skills
used by clinical psychologists as well as those which demonstrate some of the
additional challenges of working with people with a learning disability.
In compiling the portfolio an important aim has been to demonstrate integration of
theoretical and empirical knowledge to clinical practice using both generic and more
specialist skills.
A further aim is to consolidate critical analytical skills as well as to improve
knowledge of data analysis techniques. For this reason the research includes
qualitative data analysis in addition to the more familiar and traditional quantitative
statistical procedures used in previous research projects undertaken throughout my
training and clinical practice.
2. CLINICAL DOSSIER
Since gaining my MSc in Clinical Psychology in 1992, 1 have been working as a
Clinical Psychologist with a Community NHS Trust, providing a service for adults
with a learning disability.
I gained chartered status in 1993. In 1994 I took on the additional responsibility of
managing a specialist assessment and treatment day service for adults with a learning
disability and additional health care needs (e.g. challenging behaviour, autism, family,
emotional and behavioural problems or superimposed mental illness).
The list below provides a summary of all continuing development courses I have
undertaken since qualification.
2.1 Summary of Post Qualification Courses Attended
1993
Sexual Abuse of Clients with a Learning Disability. A Study Day for Clinical
Psychologists. (RESPOND)
G.P. Fundholding. Is it the Wild Card in the Community Care Act? (MENA)
B.I.L.D. Annual Conference
Psychological Assessment of Patients with a Limited Ability to Understand (Royal
Hospital of Neurodisability)
1994
Challenging Behaviours: How to Wrestle with the Problem and Win (Clements and
Howlin)
Working with Adults at Risk of Suicide. How to Assess the Danger (Milton)
Working with Adults with Autism or Asperger’s Syndrome (Howlin)
Incorporating Psychological Theory into Training (University of Surrey)
Creative Interventions in Family Therapy. Stories, Metaphors, Rituals and Beyond
(Pettle and Avigad)
1995
Autism Conference - Moving into Adulthood (Holmes and Howlin)
The Quality Roadshow (Trust Quality Department)
Working in Multidisciplinary Teams. The Way Forward (Brotchie and Grey)
Workshop for New and Inexperienced Supervisors (University of Surrey)
PsychD Conversion Course Induction Day (University of Surrey)
Statistics and Research Methodology (University of Surrey)
Update on Psychotropic Medication (De Vere)
Coping with a Major Incident (MacDonald)
1996
People with a Learning Disability Who Offend (Dodd and Webb)
Crisis Management (South West Thames Learning Disability Special Interest Group)
1997
Qualitative Statistics. One Day Data Analysis Workshop (University of Surrey - Laws
and Twigger-Ross)
Using SPSS. One Day Data Analysis Workshop (University of Surrey - Laws and
Twigger-Ross)
Neurofibromatosis Society Annual Conference (Sheffield Children’s Hospital)
2.2 Programme of Service Design and Delivery
The programme of service design and delivery to be submitted as part of the PsychD
conversion course is summarised below.
Keeping Safe Group for Adults with a Learning Disability
Supervisors: Dr Liz Campbell
Dr Lorraine Nanke
The service design and delivery project will evaluate a Keeping Safe Group for adults
with a learning disability. The group will be designed to provide participants with
information on keeping safe in the local community and escaping from potentially
dangerous situations. The effectiveness of the group structure and format as a
teaching aid will be evaluated during the three pilot Keeping Safe Groups using a pre-
, post-, and follow-up measure specifically designed for the purpose of group and
individual participant evaluation.
Keeping Safe Groups are important as many people with a learning disability are
exercising greater freedom to use local community facilities independently. This
greater community presence brings with it increased risks from dangerous strangers.
People with a learning disability may not possess, or be able to use successfully, the
skills, self-confidence and assertion required to ensure that they make themselves as
safe as possible.
3. ACADEMIC DOSSIER
The two critical reviews to be submitted as part of the PsychD Conversion Course are
introduced below.
3.1 The Psychological Profile of Neurofibromatosis Type 1: A Review of the
Literature
Supervisors: Dr Liz Campbell
Dr Glynis Laws
Neurofibromatosis Type 1, also called von Reklinghausen's disease, is a common
autosomal dominant disorder. It is of particular interest to clinical psychologists
because of its associated psychological features, including; specific learning
difficulties and learning disability, behavioural, emotional and psychiatric
disturbance. Despite its frequent occurrence. Neurofibromatosis Type 1 is still a
relatively poorly understood and complex condition which is difficult to diagnose.
The methodological strengths and shortcomings of the studies on the relationship
between Neurofibromatosis Type 1 and a range of psychological sequelae will be
discussed. Possible causal factors and recurrent themes in the research literature will
be identified.
3.2 Assessment and Diagnosis of Major Depressive Disorder in Adults with a
Learning Disability: A Review of the Literature
Supervisors: Dr Liz Campbell
Dr Glynis Laws
The last 10 years have been marked by considerable research into the assessment of
psychopathology in people with a learning disability. However, much of this research
has been of a preliminary nature and requires further study. Despite continued
attempts to investigate the development, consistency and stability of emotions
experienced by people with a learning disability, there still remains a significant lack
of detailed understanding surrounding these areas. People with a learning disability
exhibit the full range of psychiatric disturbance found in the non-disabled population.
As such, depression among people with a learning disability is an important disorder,
which, if not identified, is likely to go untreated.
Depression is an important topic for study because it may have a greater impact on
adaptive and interpersonal functioning in learning disabled people due to the
following factors:
• A continued lack of recognition by professionals of depression in people with
a learning disability
• A lack of self-referral of people with a learning disability who may not possess
awareness of the nature of their distress and the knowledge that there are
treatment services available
• People with a learning disability may have reduced coping strategies and
social skills to protect against the effects of stress and depression
• People with a learning disability may have a greater propensity for feelings of
helplessness and increased feelings of failure.
This critical review will examine the main directions of research into the assessment
and diagnosis of depression in people with a learning disability and will aim to
highlight the strengths and shortcomings of the approaches used. The most reliable
8
and diagnostically useful techniques for exploring depression in this client group will
be discussed.
4. RESEARCH DOSSIER
The research project to be completed as part of the Doctorate in Clinical Psychology
Conversion Course is entitled:
4.1 The Life Experiences of Adults with a Learning Disability: A Comparison
Between Objective and Subjective Measures
Supervisor: Dr Glynis Laws
Defining Quality of Life is problematic and there is still considerable debate about
whether Quality of Life measures should rely mainly on objective indicators (e.g. the
number of personal contacts a person has) or on subjective indicators such as
satisfaction with housing or the individual's appraisal of his/her social relationships.
Some research has suggested that interactional models which explore the fit between
an individual's values and aspirations and environmental situations provide a better
basis for examining Quality of Life than measures with an emphasis on subjective or
objective factors alone (Rapley and Beyer, 1996).
Quality of life is an important concept for adults with a learning disability because;
• Policy planners have tended to use its measurement as a measure of the
effectiveness of their policies, especially of service policy
• People with a learning disability have the right to the same life experiences
and opportunities as their non-disabled peers
• Quality of life is a challenge to researchers due to its vague construction and
consequent methodological problems
Changes in Quality of Life following a move from hospital to community placement
for adults with a learning disability have recently become the focus of considerable
research (Dagnan, Trout, Jones and McEvoy, 1996; Emerson, Beasley, Offord and
Mansell, 1992; Mansell and Beasley, 1990). Much of this research has concluded that
increased engagement in activity and reduced levels of challenging behaviour or other
disruptive behaviours are not consistently improved when the substantial
environmental enrichment facilitated by community placement is achieved.
Community placements are not necessarily environmentally or socially enriched.
4.1.1 Focus
The proposed study aims to explore the Quality of Life of adults with a mild to
moderate learning disability living in the community in several ways. Firstly,
objective measurement of Quality of Life variables is to be carried out. This data is to
be supplemented by and compared to the subjective perceptions of Quality of Life
reported by the participants themselves. Variables affecting the differences between
objective and subjective reports will be analysed.
4.1.2 Hypotheses
It is hypothesised that:
• The definition and model of QOL utilised in the study will indicate that QOL
is a concept which may be applied meaningfully to adults with a learning
disability. It will be possible to refine the QOL concept definition and model
further following this research.
• QOL will differ between participants and will be related to current living
situation (living with family, living in group home and independent living).
10
• Objective QOL will be positively related to higher levels of daily/community
living skills, social contacts, material comforts and community participation.
These factors may not be related to subjective reports.
• Qualitative analysis of the data collected during the semi-structured interview
will provide insight into the thoughts, wishes and aspirations of people with a
learning disability living in the community.
4.1.3 Methodology
Participants with a mild to moderate learning disability and good receptive and
expressive verbal communication skills will be identified from multidisciplinary team
notes. The research proposal will be presented to the local Health Authority Research
Ethics committee for approval.
Information about the study will be circulated to prime carers and participants.
Prime carers and participants will be given the opportunity to refuse to participate at
this stage.
Participants will be interviewed and will be asked for both verbal and written consent.
Written consent will be carried out in the presence of an independent witness. The
purpose of the study will be explained, option to withdraw at any stage emphasised
and summary information promised after the study has been completed.
Confidentiality of responses will be stressed to all participants.
4.1.3.1 Participant Characteristics
The following characteristics will be obtained from the case notes and assessment
administration where necessary:
• Severity of Learning Disability (IQ)
• Age
• Gender
11
Family characteristics
Current living situation
Past residential history
Presence of any psychiatric diagnoses and pharmacological treatment
Receptive language skills
Expressive language skills
Level of social functioning
Multidisciplinary community team involvement
4.2.3.2 Quality of Life Measurement
The objective measurement of Quality of Life will be assessed via two separate
methods:
• Life Experiences Checklist (Ager, 1990)
An identified prime carer or other professional who knows the participant well
will be interviewed using the Life Experiences Checklist.
• Daily Diary
A diary will be kept by the participants with support from carers and will
include data on all visitors received by the participant, all trips made from the
home as well as information on the trip destination, duration, type of transport
used and company on the trip. The diary will be kept for a 14 day period.
The subjective measurement of Quality of Life will consist of a semi-structured
interview with all participants. All interviews will be audiotaped. The interview will
be designed by the author for the purpose of the current study.
4.1.4 Data Analysis and Interpretation
Data analysis will be carried out using both quantitative statistical procedures and
qualitative methods. The following comparisons will be among the analyses:
• Differences between subjective and objective measures of Quality of Life
12
• Relationship between participant characteristics (e.g. gender, age, type of
residential placement) and Quality of Life scores
• Relationship between the participant profiles on the two objective Quality Of
Life measures
• Grounded theory analysis (Glaser and Strauss, 1967) of the interview reports
of Quality of Life.
Finally, the results of the study will be discussed in relation to previous research.
Topics for further exploration will be highlighted.
4.2 The Self-Concept, Perception of Disability and Aspirations of People with
Mild Learning Disabilities
This research dissertation (part of the Clinical Psychology MSc., 1992) will be re
submitted.

SECTION TWO
ACADEMIC DOSSIER
2.1
THE PSYCHOLOGICAL PROFILE OF
NEUROFIBROMATOSIS TYPE 1: A REVIEW OF THE
LITERATURE
13
THE PSYCHOLOGICAL PROFILE OF NEUROFIBROMATOSIS TYPE 1; A
REVIEW OF THE LITERATURE
CONTENTS
1. INTRODUCTION
1.1 Symptoms and Diagnosis of Neurofibromatosis Type 1
2. PSYCHOLOGICAL SEQUELAE OF NEUROFIBROMATOSIS
TYPEl
2.1 Learning Disability (Mental Handicap) and Specific Learning
Difficulties
2.2 Behavioural Problems Associated with Neurofibromatosis Type 1
2.3 Psychiatric Disturbance
3. SUMMARY AND CONCLUSION
4. REFERENCES
14
THE PSYCHOLOGICAL PROFILE OF NEUROFIBROMATOSIS
TYPE 1; A REVIEW OF THE LITERATURE
1. INTRODUCTION
Neurofibromatosis Type 1 (NFl), also called von Recklinghausen's disease, is a
common autosomal dominant disorder. It is of particular interest to Clinical
Psychologists because of its associated psychological features, including specific
learning difficulties and learning disability (previously termed mental handicap),
behavioural, emotional and psychiatric disturbance. Despite its frequent occurrence,
NFl is still a relatively poorly understood and complex condition which is difficult to
diagnose. The present report aims to review the literature on the psychological profile
of people with NFl. Firstly, the disorder is briefly summarised, then the psychological
sequelae are discussed and areas requiring further research are highlighted.
Pollack and Pender (1992) stated that they have found reports of clients with
neurofibromatosis as early as the eighteenth century, although later (1882), when the
German pathologist Friedrich Daniel von Recklinghausen made detailed descriptions
of the condition, the longstanding association with his name was prompted.
Two distinct forms of the disease are now recognised and several more have been
suggested. Neurofibromatosis Type 2 is characterised by tumours of the eighth cranial
nerve as well as other intracranial and spinal neoplasms. Neurofibromatosis Type 1 is
summarised below and is the subject of the current review. Riccardi (1985, reference
no. 22) stated that although the disorder has been described for over one hundred
years, there has been comparatively little research, especially into the psychological
elements of the condition.
1.1 Symptoms and Diagnosis of Neurofibromatosis Type 1
NFl is the most common neurocutaneous disorder, it has variable penetrance and
usually presents in childhood. NFl has an incidence of one in 3,000 live births, 50%
15
of cases are familial and 50% are sporadic and due to new mutations (Spaepen,
Borghgraef and Fryn, 1992). The genetic locus of the disorder has been isolated to the
proximal arm of chromosome 17. NFl is characterised by abnormal skin
pigmentation and multiple tumours within the central and peripheral nervous systems.
Many organs can be affected and diagnosis is based upon the presence of two or more
of the following:
• Six or more cafe-au-lait macules, the greatest diameter of which is more than
five millimetres in prepubertal clients and 15 millimetres in postpubertal
clients. These are brown spots of hyperpigmentation with well defined
borders. They are present from birth.
• Two or more neurofibromas of any type or one plexiform neurofibroma. These
are benign tumours arising from either the large or small nerve fibres.
• Freckling in the anxillary or inguinal region.
• Optic glioma.
• Two or more Lisch nodules. These are lesions of the iris that have no
repercussions on vision.
• A distinctive osseous lesion such as sphenoid dysphasia or pseudoarthrosis.
• A first degree relative with NFl according to the preceding criteria.
North (1993) stated that diagnosis can be made with certainty in 94% of sufferers by
the age of six years, however Spaepen et al. (1992) stated that in early childhood,
diagnosis is often difficult, especially in the absence of a positive family history.
Pollack and Pender (1992) clarify this discrepancy by their statement that diagnosis in
childhood is routine among families with NFl, but as approximately 50% of cases
represent new mutations, the recognition of an index case in a family requires
detailed knowledge of the diagnostic criteria and salient features of the disease. NFl
has a wide range of severity, even within the same family, and over 50% of people
with the disorder are only mildly affected (North, 1993). The features of NFl are very
variable and usually progressive.
The Lisch nodules are thought to be unique to NFl and optic gliomas account for
most of the central nervous system tumours. There is a 10% risk of malignancy.
16
however, this rarely occurs in childhood. Pollack and Pender (1992) stated that
neurological deterioration and malignancy may occur in people with NFl.
The neurological manifestations of NFl include the following:
Learning disability (previously termed mental handicap)
Specific learning difficulties
Seizures
Macrocephaly which is occasionally associated with hydrocephalus
Speech abnormalities (hypemasality, hoarseness, articulation errors, voice
control difficulties).
As with the dermatological symptoms, the neurological sequelae can vary widely
within the same family. The symptom of macrocephaly, whether it is associated or
not with an even mild developmental delay, should highlight a possible diagnosis of
NFl (Spaepen et al., 1992). Seizure disorders are present in 5 to 10% of cases and
macrocephaly in 25%. Spaepen et al. (1992) go on to state that headaches and
seizures in people with NFl should be treated in the same way as in the general
population, however, a new or sudden onset or exacerbation of these symptoms
should prompt a brain-imaging study to exclude neoplasm. One of the main problems
in the management of NFl is that, because the disease complications are so varied,
patients may present to many different specialists during their life. It seems that NFl
is therefore probably best managed in a multidisciplinary clinic.
2. PSYCHOLOGICAL SEQUELAE OF NFl
Only the associated features of learning disability (mental handicap), specific learning
difficulties, behavioural, emotional and psychiatric disturbances will be discussed in
the current literature review.
17
2.1 Learning Disability (Mental Handicap) and Specific Learning Difficulties
Throughout this literature review the term Teaming disability’ will be used in
preference to ‘mental handicap’. Learning disability should be differentiated from
specific learning difficulties. A person with a learning disability has significantly
below average (>2 standard deviations below the mean) intellectual functioning
accompanied by significant impairment of adaptive functioning (American
Psychiatric Association, 1994, pp39). Learning difficulty, however, refers to;
“... the intellectual development of those whose intelligence was judged to be within
the normal range [who] appeared to fall short of average [in specific domainsf
(Samuelsson and Axelsson, 1981, pp70).
The research literature indicates a considerable range of incidence of learning
disability in children and adults with NPl and figures vary between two to 40%
(Dunn, 1987; Riccardi and Eichner, 1986; Eliason, 1986). This seems in part to
reflect differences in the criteria used to diagnose a learning disability and the
blurring between specific learning difficulties and a learning disability. It is partly for
this reason that the two classes of problem are discussed together in this literature
review. Eliason (1988) stated that early studies of NFl reported a high frequency of
learning disability and psychiatric disturbance. These studies suggested that 25 to
40% of individuals with NFl were learning disabled. More recent reports have
probably included less severely affected people due to the better attention paid to the
disorder in its milder forms, and the availability of more precise measures of
intelligence. The broader range of people assessed is also important in explaining the
lower frequency of learning disability (8%) noted by Riccardi and Eichner (1986).
Pollack and Pender (1992) stated that 5% of people with NFl in his study were
learning disabled and 30 to 50% had specific learning difficulties. Spaepen et al.
(1992) supported these findings and found a similar incidence of specific learning
difficulties and learning disability. The increased incidence of learning disability in
the NFl population when compared to the general population has important
implications for both parent and individual counselling and service provision during
the first few years of life, and throughout childhood and adulthood. These issues have
18
not been addressed widely in the literature as much of the research has focused upon
clarification of diagnostic clinical features.
Samuelsson and Axelsson (1981, pp70) reported that the association of learning
disability and specific learning difficulties with NFl suggested that the disorder may
give rise to a ^weakening in the intellectual capacity". However, the mechanism for
this weakening was not elaborated upon. Spaepen et al. (1992) carried out a study to
investigate whether there was a specific neuropsychological profile in children with
NFl and whether this profile could aid the diagnostic process. This was a very small
study comprising only 19 participants with NFl aged between five and 15 years. The
participants with NFl were compared to a control sample. Spaepen et al. found that
three of the 19 participants had a learning disability as assessed by the Wechsler
Intelligence Scale for Children, Revised Version (WISC-R). The mean IQ of the
entire sample was 87.5. When NFl was associated with a learning disability, only a
mild learning disability was present. Samuelsson and Axelsson's study (1981) also
found that of those participants with NFl who had an intellectual level within the
normal range, the verbal IQ score was significantly higher than the performance IQ
score (p<.001). This verbal-performance discrepancy was not present in the learning
disabled participants.
Analysis of the WISC-R subtest scores indicated that the participants performed best
on tests of comprehension, vocabulary and similarities. The lowest performance was
found on tests of block design, object assembly and coding. These results suggested
that the participants experienced difficulties with visual-perceptual organisation,
attention, memory and fine motor abilities. Spaepen et al. (1992) concluded that these
results suggested that children with NFl, irrespective of their general level of
intellectual fimctioning, were predetermined to present specific learning difficulties,
especially in the areas of visual-perceptual organisation, attention and auditory
discrimination and synthesis. Sadly, this study did not elaborate on the possible
reasons for these specific difficulties. The results are important for psychologists and
educationalists working with children with NFl, as specialised instructional methods
may be required in order to support them in school and to maximise their academic
19
performance. Additionally, techniques to minimise the effects of these difficulties
may be useful, particularly for adult sufferers. However, this study was very small and
caution must be exercised when interpreting these results.
North (1993) carried out a larger study of 200 pre-school and school age participants
with NFl. Developmental delay or school performance problems were reported in
45% of cases. In 3.5% of these cases significant intellectual delay was documented on
psychometric assessment measures. These levels were consistent with the most
commonly cited incidence levels of learning disability and learning difficulties in this
client group. Specific learning difficulties, especially Attention Deficit/Hyperactivity
Disorder, decreased visual motor co-ordination and language deficits were stated to
persist throughout the individual's life, although it is difficult to establish how the
author was able to make such statements as he did not carry out a longitudinal study,
or include adults with NFl in his research.
Eiiason (1988) carried out a much smaller study of 32 children with NFl and school
learning problems, but compared this sample to a matched sample of students with
learning difficulties without a known genetic or medical cause. All the participants
were individually administered a neuropsychological test battery including measures
of language, memory, visual-perceptual skills and behaviour. The NFl group had
significantly lower performance IQ scores. These results lend support to those of
Samuelsson and Axelsson (1981) and North (1993). The participants were also found
to differ from the matched controls in the frequency of WISC-R verbal-performance
IQ discrepancies and on specific measures of visual perceptual functioning. The
measures of visual perception were found to be the best predictors of group
membership and accurately classified 96% of the group without NFl and 63% of the
NFl group. NFl group performance also differed on the tests of reading achievement,
Eiiason concluded that the results suggested that the children with learning
difficulties and NFl were more likely to display non-verbal learning problems that
affected written language and organisational skills. The children without NFl were
more likely to present with verbal language or memory problems that primarily
20
affected reading. Additionally, the NFl group was suggested to subsume three further
distinct subgroups. These are listed below and represented those people with:
• A learning disability
• Mixed language and non-verbal dysfunctions (overlapping considerably with
other children with learning difficulties in the general population)
• A non-verbal disability (visual-perceptual deficits or more subtle
organisational difficulties)
Eiiason (1988) suggested that the pattern of learning problems associated with NFl
represented a distinct form (or forms) of learning difficulty. However, there were
methodological problems with this study as the matched control group comprised
individuals who were selected as they all had a prior diagnosis of learning difficulties
and probably represented a heterogeneous sample of children with a variety of
cognitive disabilities. From these results, it seems impossible to conclude whether the
learning problems associated with NFl did, in fact, represent a truly unique form of
learning disability or whether they formed part of a larger subtype of learning
difficulty found in the general population. Further research is needed to compare
children with NFl to matched samples of children with similar cognitive patterns (i.e.
visual-perceptual deficits). The results of Eliason’s study are, nevertheless, important
because non-verbal types of learning difficulty tend to be less readily recognised in
school as forms of impairment. They tend to have less effect on academic
achievement but have considerable behavioural components which may be more
striking than the cognitive deficits. Two behavioural features of visual-perceptual
difficulties are impulsivity and social imperception. The Eiiason study showed that
the children with NFl did demonstrate these additional symptoms, both of which may
lead to referral for behavioural management, medication or counselling rather than
for consideration of interventions aimed at addressing the learning difficulties
directly.
An age related phenomenon has also been noted (Riccardi and Eichner, 1986), as the
rate of learning problems has been reported to be highest (17%) in the infant-toddler
group, and reducing through the pre-school years (11%), to later childhood and
21
adolescence (7%). The rate of learning disability in adults was reported by Riccardi
and Eichner (1986) to be only 3%. The reason for this difference in IQ distribution is
stiU unclear. It may be related to the nature of the intelligence tests given at different
ages and the greater emphasis on perceptual motor skills at younger ages.
Additionally, the results may indicate that some children are labelled as learning
disabled at a young age and may remain within special educational placements with
only minimal re-evaluation. These results may also reflect the fact that the
psychological and behavioural symptoms of a visual-perceptual disorder, speech
difficulties and cosmetic disfiguration may all mistakenly lead to the general
impression of lower intellectual functioning. Although Riccardi and Eichner (1986)
did not include the following reason in their study, it is also possible that the
difference occurred as a result of diagnosis of less severely affected individuals later
in life and as such did not represent a true reduction in the incidence of learning
problems in NFl with age. This suggestion seems plausible because many of the
distinguishing features of NFl tend to become more pronounced during
adolescence/early adulthood (e.g. cafe-au-lait macules, freckling, neurofibromas) and
may lead to late presentation to services and hence to late diagnosis. This is
particularly likely in index cases.
The need for longitudinal studies is emphasised. Eiiason (1988) suggested that, as
children with NFl and central nervous system involvement had lower levels of
intellectual functioning than those without central nervous system involvement, the
reduced intellectual functioning may also be due to the effects of tumours or
treatment factors such as surgical intervention, cranial irradiation or anti-convulsant
medication. Few studies distinguish between participants with and without such
additional NFl complications (e.g. studies by Dunn, 1987; Samuelsson et al., 1981
and North, 1993).
Eiiason also found that children with NFl displayed only mild attentional, short term
memoiy problems and impulsivity. These results were in contrast to parental reports
of extreme impulsivity in other situations. Eiiason suggested that the children
responded well to a highly structured environment, such as the testing situation, but
22
had greater difficulty with impulse control in less structured environments (e.g. at
home). These results have important implications for treatment, and suggest that
children with NFl and learning difficulties, impulsivity and memoiy problems
respond best to external control mechanisms and a consistent structure, with
additional help aimed at improving internal control strategies (e.g. cognitive
behavioural techniques).
Further evidence of neurological problems in NFl and intellectual difficulties is
provided by the results of a small study (N=27) carried out by Wadsby, Lindhammer
and Eeg-Olofsson (1989). They found that seizures and motor disturbances were
present in 37%, learning disability was present in 11%, reading and writing problems
in 41%, lower than average school performance in 47%, and behavioural disturbances
in 28% of participants. However, this study involved a very small sample and there
was a large participant age range (2.5 years to 15 years). The Griffiths Mental
Development Scale was used to assess those over six years only. The different
intellectual tests utilised may have focused on different areas of cognitive functioning
and therefore the results of Wadsby et al.'s study should be interpreted with caution.
Additionally, Wadsby et al.’s use of percentages in this study is misleading with such
a small sample size. However, the incidence of difficulties in reading and writing in
the general population varies between only 10 and 20% (Malmquist, 1971, pp46). The
41% of children with reading and writing difficulties in Wadsby et al.'s study was
considerably higher than this expected level. Wadsby et al. (1989) stated that 59% of
their sample received additional specialised support at school compared to only 24%
of the general population receiving this kind of support. The questionnaire used to
assess behavioural difficulties was designed specifically for the purposes of this study
and unfortunately detailed information on the assessment tool was not provided. The
reliability and validity of this measure is not known.
Schorry, Stowens, Crawford, Stowens and Dignan (1989) stated that the research
literature may underestimate the incidence of specific learning difficulties and
learning disability in people with NFl. In Schorry et al.'s study of 78 people with NFl
and a mean age of 8.7 years (age range; infancy to 30 years), 6% had a learning
23
disability (mental handicap), and 36% had unspecified school learning difficulties. In
this study only 22 participants agreed to formal intellectual testing, thus, the levels of
intellectual fimctioning may have represented a biased sample of people with NFl.
Interestingly, Schorry et al.'s paper does not include information on why so few
people agreed to formal testing. They did suggest that those performing or coping
better at school or work may have been more likely to decline psychological testing.
His reasons for making this suggestion are unclear as the reverse may also be
possible.
Dunn and Roos (1989) carried out a study to investigate the cause of the learning
difficulties, learning disability and in-coordination in people with NFl. Their study
involved 31 children and young adults aged between six and 20 years. A common
finding in children with NFl are areas of increased signal on T-2 weighted magnetic
resonance imaging (Duffher, Cohen, Seidel and Shucard, 1989). Dunn and Roos
hypothesised that these areas of increased activity were associated with the learning
problems and motor incoordination in people with NFl. A theory which was initially
suggested considerably earlier by Rosman and Pearce (1967).
Dunn and Roos' study consisted of 31 participants with NFl and the aim was to study
the relationship between specific learning difficulties, in-coordination and areas of
increased signal using magnetic resonance imaging techniques. No relationship was
found, suggesting that the areas of increased signal had no association with learning
difficulties or incoordination. However, although the authors used the usual definition
of learning disability (IQ<70), their definition of specific learning difficulties relied
on school performance. Participants were stated to have a learning difficulty if their
school performance was one or two grades below that expected on the basis of their
IQ. This is a fairly arbitrary definition, with several methodological problems (e.g. the
many reasons for a child’s below expected achievement, the lack of definition of the
nature of their poor performance and learning difficulty). Additionally, the
determination of delayed gross or fine motor skills and/or ‘excessive’ clumsiness
relied on the assessment by the neurologist involved in the study, did not involve the
24
administration of a single assessment schedule and was not carried out ‘blind’.
Therefore, the rigour and reliability of this study is questionable.
Co-ordination problems are also described in the literature (Riccardi, 1985, reference
number 21; Aron, 1984; Dunn and Roos, 1989). Rates ranged from 27 to 41% of
samples. Bauer and Tubs (1988) carried out a single case study of monozygotic twins
with NFl, both of whom were found to have learning difficulties, poor fine and gross
motor skills including co-ordination problems. Unfortunately, they did not state how
the co-ordination was measured.
Coleman and Riccardi (1992) studied 92 children with NFl (age range six years to
16.9 years) to find out how they functioned in terms of learning and cognitive
performance. However, this study was particularly interesting as its emphasis was
also on how the children were perceived to be fimctioning in school by their parents
and teachers. The authors found that the children with NFl did score significantly
lower than expected on tests of intelligence and achievement, and had a higher
incidence of learning disability than the general population. Coleman and Riccardi
then studied 22 of their original sample to explore the behaviours and attitudes of the
children, their parents and teachers. The results of this investigation indicated that the
parents and teachers differed significantly in their ratings of the children's behaviour.
Parents rated their child's behaviour as significantly worse than the teachers (p<.001).
The mothers rated the behaviour problems in direct proportion to the child's
disfigurement, but inversely to the severity of the disorder. Thus, they were more
likely to rate a child as having a behaviour problem if they were disfigured, but were
less likely to rate a child with other serious medical complications as having a
behaviour problem. Teachers' behaviour ratings were unrelated to disfigurement and
severity of symptoms.
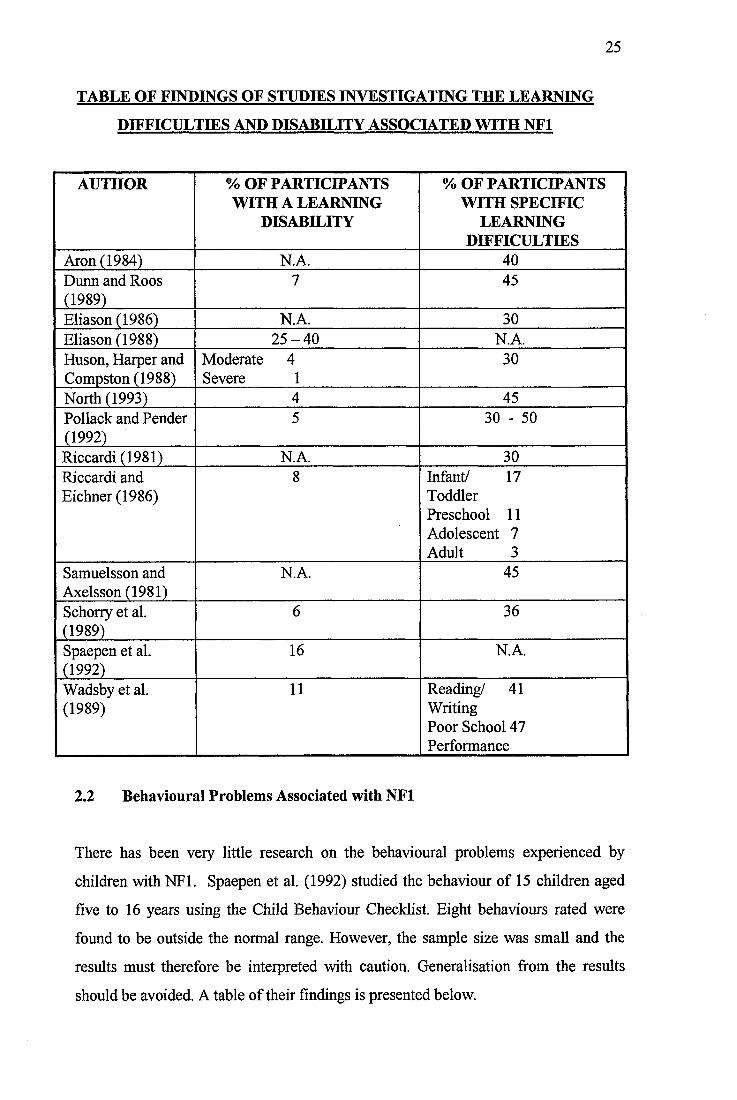
The results of studies carried out to investigate the learning problems experienced by
people with NFl are summarised below. Studies not discussed in detail are also
included for reference.
25
TABLE OF FINDINGS OF STUDIES INVESTIGATING THE LEARNING
DIFFICULTIES AND DISABILITY ASSOCIATED WITH NFl
AUTHOR % OF PARTICIPANTS WITH A LEARNING
DISABILITY
% OF PARTICIPANTS WITH SPECIFIC
LEARNING DIFFICULTIES
Aron (1984) N.A. 40Dunn and Roos (1989)
7 45
Eiiason (1986) N.A. 30Eiiason (1988) 2 5 -4 0 N.A.Huson, Harper and Compston (1988)
Moderate 4 Severe 1
30
North (1993) 4 45Pollack and Pender (1992)
5 30 - 50
Riccardi (1981) N.A. 30Riccardi and Eichner (1986)
8 Infant/ 17 Toddler Preschool 11 Adolescent 7 Adult 3
Samuelsson and Axelsson (1981)
N.A. 45
Schorry et al. (1989)
6 36
Spaepen et al. (1992)
16 N.A.
Wadsby et al. (1989)
11 Reading/ 41 Writing Poor School 47 Performance
2.2 Behavioural Problems Associated with NFl
There has been very little research on the behavioural problems experienced by
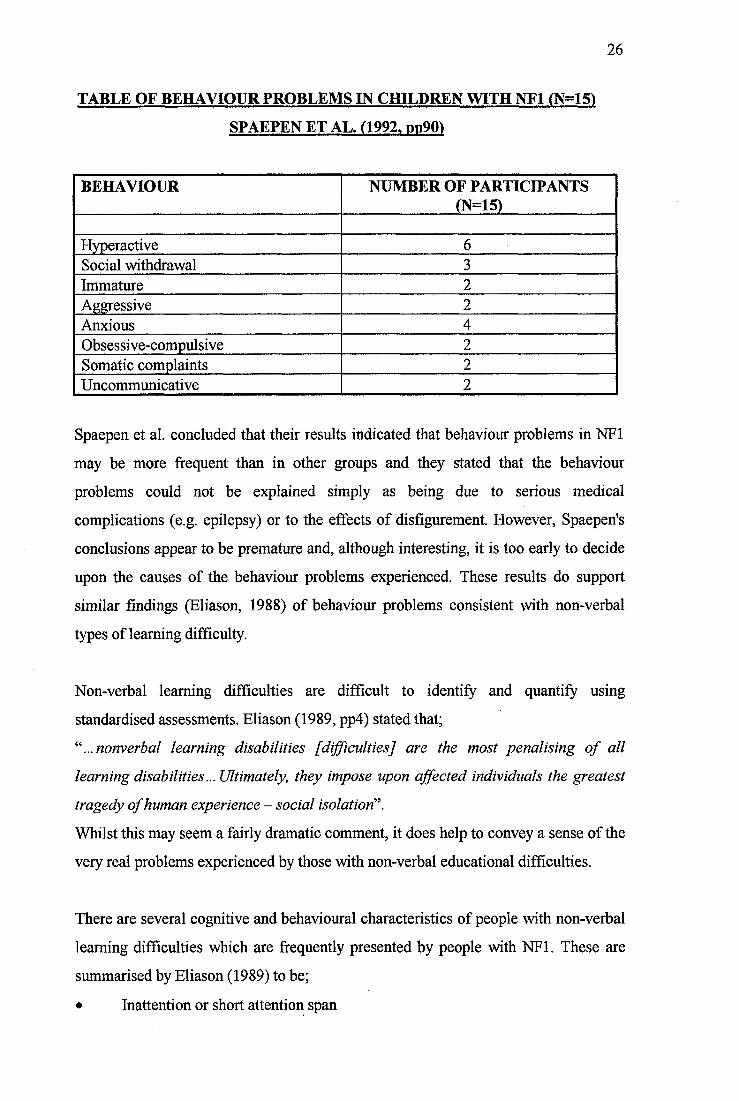
children with NFl. Spaepen et al. (1992) studied the behaviour of 15 children aged
five to 16 years using the Child Behaviour Checklist. Eight behaviours rated were
found to be outside the normal range. However, the sample size was small and the
results must therefore be interpreted with caution. Generalisation from the results
should be avoided. A table of their findings is presented below.
26
TABLE OF BEHAVIOUR PROBLEMS IN CHILDREN WITH NFl (N=15)
SPAEPEN ET AL. (1992. dd90)
BEHAVIOUR NUMBER OF PARTICIPANTS (N=15)
Hyperactive 6Social withdrawal 3Immature 2Aggressive 2Anxious 4Obsessive-compulsive 2Somatic complaints 2Uncommunicative 2
Spaepen et a l concluded that their results indicated that behaviour problems in NFl
may be more frequent than in other groups and they stated that the behaviour
problems could not be explained simply as being due to serious medical
complications (e.g. epilepsy) or to the effects of disfigurement. However, Spaepen's
conclusions appear to be premature and, although interesting, it is too early to decide
upon the causes of the behaviour problems experienced. These results do support
similar findings (Eiiason, 1988) of behaviour problems consistent with non-verbal
types of learning difficulty.
Non-verbal learning difficulties are difficult to identify and quantify using
standardised assessments. Eiiason (1989, pp4) stated that;
nonverbal learning disabilities [difficulties] are the most penalising of all
learning disabilities... Ultimately, they impose upon affected individuals the greatest
tragedy of human experience - social isolation‘\
Whilst this may seem a fairly dramatic comment, it does help to convey a sense of the
very real problems experienced by those with non-verbal educational difficulties.
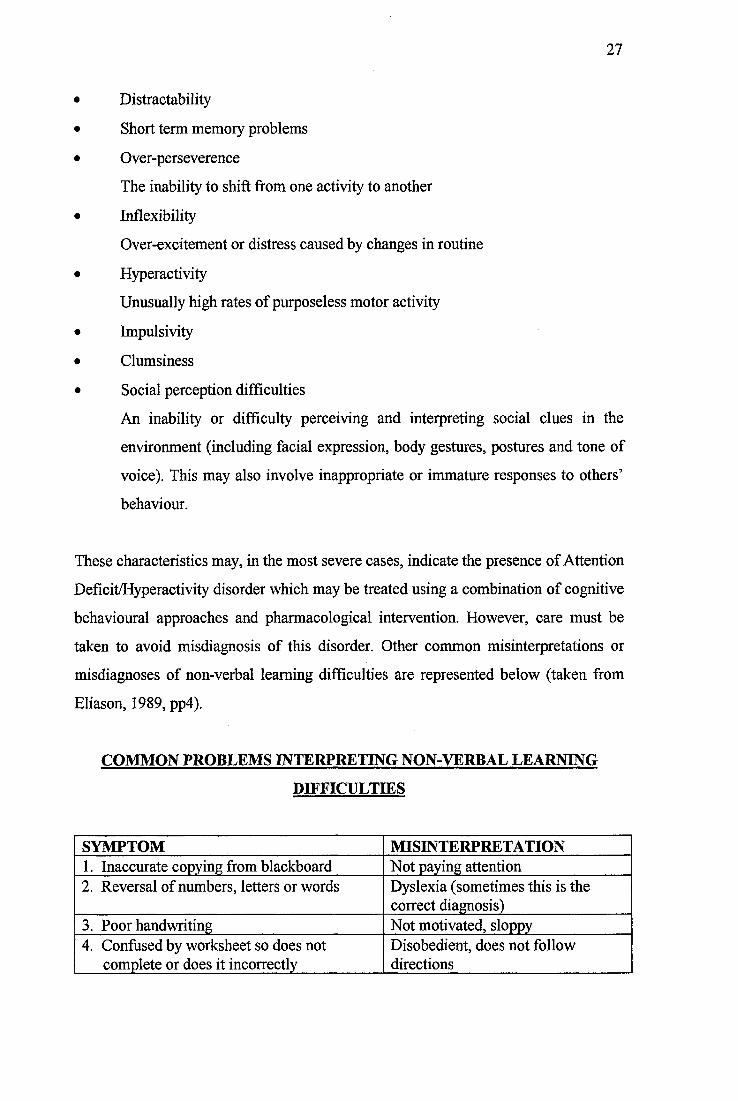
There are several cognitive and behavioural characteristics of people with non-verbal
learning difficulties which are frequently presented by people with NFl. These are
summarised by Eiiason (1989) to be;
• Inattention or short attention span
27
• Distractability
• Short term memory problems
• Over-perseverence
The inability to shift from one activity to another
• Inflexibility
Over-excitement or distress caused by changes in routine
• Hyperactivity
Unusually high rates of purposeless motor activity
• Impulsivity
• Clumsiness
• Social perception difficulties
An inability or difficulty perceiving and interpreting social clues in the
environment (including facial expression, body gestures, postures and tone of
voice). This may also involve inappropriate or immature responses to others’
behaviour.
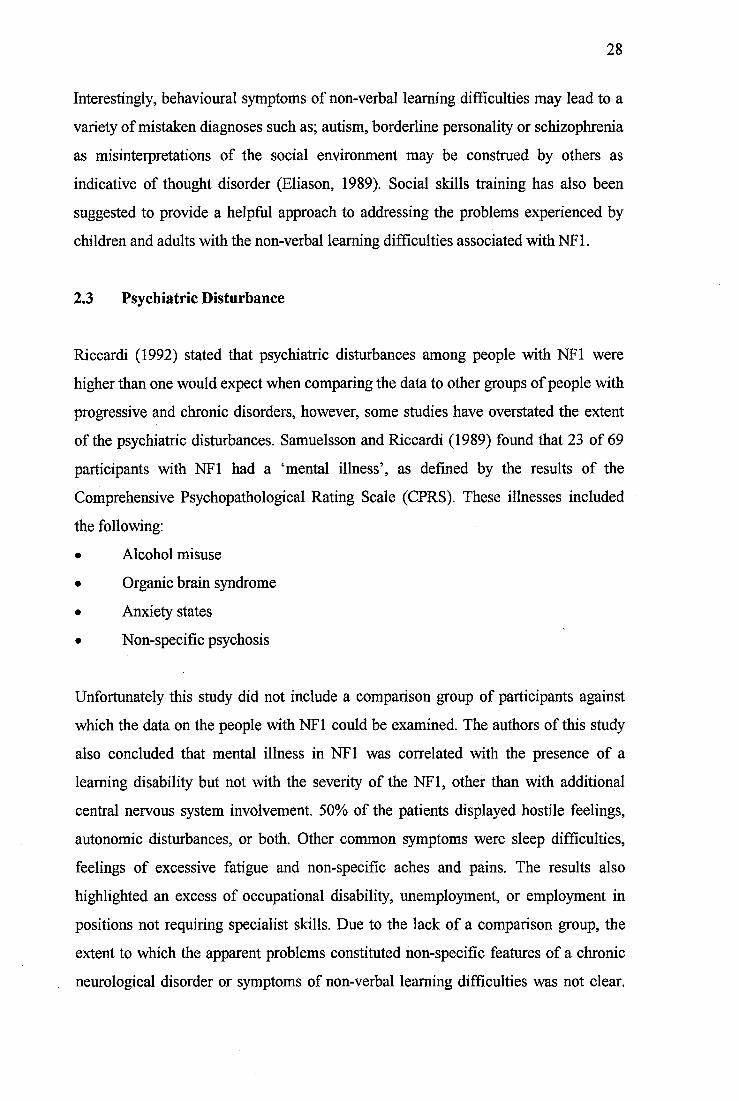
These characteristics may, in the most severe cases, indicate the presence of Attention
Deficit/Hyperactivity disorder which may be treated using a combination of cognitive
behavioural approaches and pharmacological intervention. However, care must be
taken to avoid misdiagnosis of this disorder. Other common misinterpretations or
misdiagnoses of non-verbal learning difficulties are represented below (taken from
Eiiason, 1989, pp4).
COMMON PROBLEMS INTERPRETING NON-VERBAL LEARNING
DIFFICULTIES
SYMPTOM MISINTERPRETATION1. Inaccurate copying from blackboard Not paying attention2. Reversal of numbers, letters or words Dyslexia (sometimes this is the
correct diagnosis)3. Poor handwriting Not motivated, sloppy4. Confused by worksheet so does not
complete or does it incorrectlyDisobedient, does not follow directions
28
Interestingly, behavioural symptoms of non-verbal learning difficulties may lead to a
variety of mistaken diagnoses such as; autism, borderline personality or schizophrenia
as misinterpretations of the social environment may be construed by others as
indicative of thought disorder (Eiiason, 1989). Social skills training has also been
suggested to provide a helpful approach to addressing the problems experienced by
children and adults with the non-verbal learning difficulties associated with NFl.
2,3 Psychiatric Disturbance
Riccardi (1992) stated that psychiatric disturbances among people with NFl were
higher than one would expect when comparing the data to other groups of people with
progressive and chronic disorders, however, some studies have overstated the extent
of the psychiatric disturbances. Samuelsson and Riccardi (1989) found that 23 of 69
participants with NFl had a ‘mental illness’, as defined by the results of the
Comprehensive Psychopathological Rating Scale (GPRS). These illnesses included
the following:
• Alcohol misuse
• Organic brain syndrome
• Anxiety states
• Non-specific psychosis
Unfortunately this study did not include a comparison group of participants against
which the data on the people with NFl could be examined. The authors of this study
also concluded that mental illness in NFl was correlated with the presence of a
learning disability but not with the severity of the NFl, other than with additional
central nervous system involvement. 50% of the patients displayed hostile feelings,
autonomic disturbances, or both. Other common symptoms were sleep difficulties,
feelings of excessive fatigue and non-specific aches and pains. The results also
highlighted an excess of occupational disability, unemployment, or employment in
positions not requiring specialist skills. Due to the lack of a comparison group, the
extent to which the apparent problems constituted non-specific features of a chronic
neurological disorder or symptoms of non-verbal learning difficulties was not clear.
29
Further research is needed to explore the existence of a causal mechanism.
Comparison with other genetically inherited conditions of the central and peripheral
nervous system should be carried out to investigate whether psychiatric disturbance is
significantly more common, or of a different quality, in NFl.
Recurrent themes in the literature on the link between NFl and mental illness are
anxiety and depression (Riccardi, 1987). Riccardi (1992, ppl96) stated that in his
study of 238 participants with NFl, there were no instances of psychosis or organic
brain syndrome and only one case of alcohol dependency. A large, but unfortunately
unspecified number of participants with NFl showed symptoms of anxiety,
depression or both. Riccardi stated that the number of dually affected participants was
unspecified as it was not possible to know whether the symptoms were truly
pathogenic, as opposed to an ordinary, expected response to stress factors. He
commented that:
"...such symptoms were suggestive of a neurosis or personality disorder in as many as
ten percent of patients at or beyond adolescence, and referrals were made to a
psychologist or psychiatrist for about 20 percent of patients with NF-J in this age
sub-group".
In the same study, Riccardi found that psychosocial immaturity, displayed by
excessive passivity and poor social performance was present in participants from all
socio-economic groups and in all levels of NFl severity. People with NFl may be
acutely aware of some degree of intolerance by society (Rappaport, Levine,
Aufseesen and Incerto, 1983). Thus, even people with no apparent psychopathology
may acknowledge a substantial degree of psychosocial distress.
Mouridsen, Andersen, Sorensen, Rich and Isager (1992) carried out a study to
investigate the co-occurrence of NFl and autism. This study was very large, involving
341 children over a 25 year period. Mouridsen found that only one participant (0.3%)
displayed concomitant autistic features. This figure was reported to be no higher than
would be expected by chance. However, the research in this area is conflicting as
several authors have reported a co-occurrence figure significantly greater than this
30
(Gillberg and Forsell, 1984; Gaffiiey and Tsai, 1987; Szatmari, Bremmer and Nagy,
1989). Figures reported in these studies range from four to 15% of people suffering
from NFl and autism. The co-occurrence of NFl and autism has been repeatedly
hypothesised as both disorders are associated with brain dysfunction and a learning
disability. The reason for the diverse research findings may be due to the failure to
use strict diagnostic criteria for NFl and autism, ascertainment bias and the lack of
adequately matched samples. However, the size and longitudinal design of the
Mourisden et al. study suggest that it may be regarded as providing the most reliable
information.
3. SUMMARY AND CONCLUSION
To conclude, NFl is a common autosomal disorder associated with significant
learning problems, behavioural, emotional and psychiatric disturbances. Some of the
more serious methodological shortcomings in the studies on the relationship between
NFl and learning problems (i.e. learning disability, specific learning difficulties,
impulsivity, social imperception and incoordination) are that the authors have tended
not to deal adequately with the issues of clinical heterogeneity, ascertainment bias
and have not fully evaluated the study participants (e.g. Pollack and Pender, 1992;
Spaepen et al., 1992 and Eiiason, 1988). However, the research does suggest that NFl
is associated with learning problems, especially a non-verbal disability (visual
perceptual deficits or subtle organisational difficulties). It remains unclear whether
these learning problems are a unique form of learning difficulty or part of a larger
subtype of learning difficulty found in the general population. The incidence of NFl
and associated learning difficulties cited in the literature ranges from 30 to 50%. The
incidence of a concomitant learning disability is generally reported to be much lower
(less than 6%). There may also be an age related phenomenon, with the highest rate of
learning problems in the infant-toddler group, reducing through childhood. This may
reflect different subpopulations, the effects of different testing strategies or other non
specific influences. The research remains unclear. These findings have important
implications for screening procedures and educational strategies so that children with
subtle learning problems are identified early and well structured teaching situations
31
are provided. Further research should be carried out to explore further the exact
nature of the learning problems experienced by children with NFl. Of particular
importance is detailed examination of the nature of the short term memory problems
experienced.
Riccardi (1985, pp3) provided a helpful summary to the study of learning problems in
people with NFl. He preferred to use the more general concept of school
performance problems^ rather than more specific terms such as dyslexia or attention
deficit disorder. Other elements of NFl (e.g. cosmetic disfigurement and psychosocial
burden) may contribute to the severity and impact of the intellectual disability.
There does appear to be some evidence that NFl is associated with behaviour
problems and emotional or psychiatric disturbances, especially anxiety and
depression. Literature in these areas is sparse at present. It is important to note that
any difficulties in psychological, emotional and social performance could have three
possible causes. The first of these concerns factors that are superimposed as a result
of the person having a progressive, chronic, poorly understood disease, regardless of
the features of the disease (Beiter, Ingersoll, Ganser and Orr, 1991). The second
involves factors that are responses to the person's specific NFl features such as
cosmetic disfiguration and short stature. These difficulties may result from the
responses of the person him/herself to the disorder, the responses of others, or a
combination of the two. Finally, the NFl mutation may directly contribute to the
psychological, emotional or social performance difficulties. The current state of the
research into the psychological correlates of NFl does not allow a very precise
differentiation of the three possible causal factors. Further research is required to
explore the relationship between NFl and behavioural, emotional or psychiatric
problems as well as to clarify the nature of the learning problems. The support, advice
and management of NFl should be based upon the findings of this research.
32
4. REFERENCES
1. American Psychiatrie Association (1994). Diagnostic and Statistical Manual
of Mental Disorders (Fourth Edition), pp39-46. Washington D C.: American
Psychiatric Association.
2. Aron, A.M. (1984). Learning Disabilities in Children with Neurofibromatosis.
The Neurofibromatosis Association. Fact Sheet 5.
3. Bauer, M., & Lubs, M.L. (1988). Variable Expressivity of
Neurofibromatosis, 1, 32 -329.
4. Beiter, M., Ingersoll, G., Ganser, J., & Orr, D R. (1991). Relationships of
Somatic Symptoms to Behavioural and Emotional Risk in Young Adolescents.
Journal of Pediatrics, 118,473-478.
5. Coleman, M., & Riccardi, V.M. (1992). In; Riccardi, V.M. (1992).
Neurofibromatosis. Phenotype, Natural History and Pathogenesis. Second
Edition, pp354-355. John Hopkins University Press.
6. Duffner, P.K., Cohen, M E., Seidel, E.G., & Shucard, D.W. (1989). The
Significance of MRI Abnormalities in Children with Neurofibromatosis.
Neurology, 39, 373-377.
7. Dunn, D.W. (1987). Neurofibromatosis in Childhood. Current Problems in
Pediatrics, 17,445-497.
8. Dunn, D.W., & Roos, K.L. (1989). Magnetic Resonance Imaging. Evaluation
of Learning Difficulties and Incoordination in Neurofibromatosis.
Neurofibromatosis, 2,1-5.
33
9. Eiiason, M.J. (1986). Neurofibromatosis. Implications for Learning and
Behaviour. Journal of Developmental Behavioural Pediatrics, 7,175-179.
10. Eiiason, M.J. (1988). Neuropsychological Patterns; Neurofibromatosis
Compared to Developmental Learning Disorders. Neurofibromatosis, 1, 17-
25.
11. Eiiason, M.J. (1989). Achieving Inspite Of...Nonverbal Learning Disability
and Neurofibromatosis. The Neurofibromatosis Association. Fact Sheet 5B.
Kingston, UK.
12. Gaffney, G. & Tsai, L.Y. (1987). Magnetic Resonance Imaging of High
Level Autism. Journal of Autism and Developmental Disorders, 17,433 438.
13. Gillberg, C., & Forsell, C. (1984). Childhood Psychosis and
Neurofibromatosis - More than a Coincidence. Journal of Autism and
Developmental Disorders, 14,1-8.
14. Huson, S.M., Harper, P.S. & Compston, D.A.S. (1988). Von
Recklinghausen Neurofibromatosis: A Clinical and Population Study in South
East Wales. Brain, 111, 1355-1381.
15. Malmquist, E. (1971). Reading and Writing Difficulties in Children, pp46-63.
Lund, Gleerups.
16. Mouridsen, S.E., Andersen, L.B., Sorensen, S.A., Rich, B., & Isager, T.
(1992). Neurofibromatosis in Infantile Autism and other types of Childhood
Psychosis. Acta Paedopsychiatrics, 55,15-18.
17. North, K. (1993). Neurofibromatosis Type 1: Review of the First 200 Patients
in an Australian Clinic. Journal of Child Neurology, 8,395-402.
34
18. Pollack, C.V., & Pender, E.S. (1992). Recognising an Index Case of Type 1
Neurofibromatosis. American Family Physician, 45,623-628.
19. Rappaport, L., Levine, M.D., Aufseesen, C., & Incerto, R.A. (1983).
Children's Descriptions of the Developmental Dysfunctions. American Journal
of the Disordered Child, 137, 369-442.
20. Riccardi, V.M. (1981). Von Recklinghausen Neurofibromatosis. The New
England Journal of Medicine, 305 (27), 1617-1627.
21. Riccardi, V.M. (1985). Neurofibromatosis as a Model for Investigating
Hereditary vs. Environmental Factors in Learning Disabilities. In: Arima, M.,
Suzuki, Y., and Yabuuchi, H. (Eds.), pp211-222. The Developing Brain and its
Disorders. S. Karger Press.
22. Riccardi, V.M. (1985). Synopsis of Lecture given to Neurofibromatosis
Association Members. The Neurofibromatosis Association, U.K. Fact Sheet 6.
23. Riccardi, V.M. (1987). Neurofibromatosis. Neurological Clinician, 5, 337-
349.
24. Riccardi, V.M. (1992). Neurofibromatosis. Phenotype, Natural History and
Pathogenesis. Second Edition, ppl95-212. John Hopkins University Press.
25. Riccardi, V.M., & Eichner, J.E. (1986). Neurofibromatosis. Phenotype,
Natural History and Pathogenesis. First Edition, pp207-231. John Hopkins
University Press.
26. Rosman, N.P., & Pearce, J. (1967). The Brain in Multiple Neurofibromatosis
(Von Recklinghausen's Disease): A Suggested Neuropathological Basis for the
Associated Mental Defect. Brain, 90, 829-840.
35
27. Samuelsson, B., & Axelsson (1981). Neurofibromatosis. A Clinical and
Genetic Study of 96 Cases in Gothenburg, Sweden. Acta Dermatovener
(Stockholm) Suppl., 95, 76-71.
28. Samuelsson, B., & Riccardi, V.M. (1989). Neurofibromatosis in Gothenburg,
Sweden, IE. Psychiatric and Social Aspects. Neurofibromatosis, 2, 84-106.
29. Schorry, E.K., Stowens, A.H., Crawford, P.A., Stowens, W.R. & Dignan,
P.St.J. (1989). Summary of Patient Data from a Multidisciplinary
Neurofibromatosis Clinic. Neurofibromatosis, 2,129-134.
30. Spaepen, A., Borghgraef, M., and Fryn, J.P. (1992). Von Recklinghausen -
Neurofibromatosis: A Study of the Psychological Profile. Birth defects:
Original Article Series, 218 (1), 85-91.
31. Szatmari, P., Bremmer, R., & Nagy, J. (1989). Asperger's Syndrome: A
Review of Clinical Features. Canadian Journal of Psychiatry, 34, 554-560.
32. Wadsby, M., Lindhammer, H. & Eeg-Olofsson, O. (1989).
Neurofibromatosis in Childhood: Neuropsychological Aspects.
Neurofibromatosis, 2,251-260.
2.2
ASSESSMENT AND DIAGNOSIS OF MAJOR DEPRESSIVE
DISORDER IN ADULTS WITH A LEARNING DISABILITY:
A REVIEW OF THE LITERATURE
36
ASSESSMENT AND DIAGNOSIS OF MAJOR DEPRESSIVE DISORDER IN
ADULTS WITH A LEARNING DISABILITY: A REVIEW OF THE
LITERATURE
CONTENTS
1. INTRODUCTION
2. DEPRESSION IN THE GENERAL POPULATION
3. DEPRESSION IN ADULTS WITH A LEARNING DISABILITY
3.1 Assessment and Diagnosis
3.1.1 Self Report Questionnaires
3.1.2 Informant-Rating Measures
3.1.3 Clinical Interviews
3.1.4 Behavioural Observations
3.1.5 Laboratory Results
4. SUMMARY AND CONCLUSION
4.1 Suggested Assessment Stages
5. REFERENCES
37
ASSESSMENT AND DIAGNOSIS OF MAJOR DEPRESSIVE DISORDER IN
ADULTS WITH A LEARNING DISABILITY : A REVIEW OF THE
LITERATURE
1. INTRODUCTION
The thoughts and feelings of adults with a learning disability have received
considerable attention over the past two decades of research. Seminal papers within
the learning disability speciality include; an investigation into the thoughts and
feelings of clients within a psychotherapeutic context (Bailey, Matthews and Leckie,
1986), the assessment of depressed thoughts and feelings (Kazdin, Matson and
Senatore, 1983), and the assessment and treatment of anxiety (Lindsay, Baty, Mitchie
and Richardson, 1989). Despite continued attempts to investigate the nature,
development, consistency and stability of emotions experienced by adults with a
learning disability, there still remains a significant lack of detailed understanding of
these areas.
The present review aims to provide a detailed survey and critical analysis of research
carried out into the assessment and diagnosis of major depressive disorder in adults
with a learning disability and to highlight possible future directions of research.
Firstly, the presentation of major depressive disorder in the general population is
summarised, then the importance of, and problems associated with, the assessment
and diagnosis of depression in adults with a learning disability is discussed, followed
by a review of the research efforts carried out to clarify this disorder in people with a
learning disability using direct observational techniques, self-monitoring and
informant rating scales, clinical interviews and laboratory measures. Finally, the most
promising results are highlighted and directions for future research suggested.
38
2. DEPRESSION IN THE GENERAL POPULATION
Depression was initially defined in its most severe form by Emil Kraepelin (1913),
who later described, not only depressive features, but also manic states. More recent
research has separated the more subtle forms of depression. The Diagnostic and
Statistical Manual of Mental Disorders (Fourth Edition, 1994, pp317; DSM IV) is
used by psychiatrists and other health professionals to guide the identification of
psychiatric problems among the general population. It defines major depressive
disorder as a;
"...mooddisorder characterised by one or more depressive episodes accompanied by
at least four additional symptoms of depression".
It goes on to describe a major depressive episode as a period of at least two weeks
during which there is either depressed mood or the loss of interest or pleasure in
almost all activities (anhedonia). In order to meet the diagnostic criteria, the person
must also have at least four additional symptoms from the following list:
• Changes in weight or appetite, sleep and psychomotor activity
The appetite of people suffering from a major depressive episode is
usually reduced, or there may be a craving for specific foods (e.g.
sweets or carbohydrates). These changes in appetite may result in
considerable loss or gain in weight. The most common sleep disturbance
associated with a major depressive episode is insomnia. Psychomotor changes
include agitation (inability to sit still, pacing, hand-wringing, pulling or
rubbing of the skin, clothing or other objects) or retardation (slowed
speech, thinking, body movements, increased pauses before answering, very
quiet or infrequent speech, lack of inflection or muteness).
• Decreased energy, tiredness and fatigue
• Feelings of worthlessness or guilt
39
There may be unrealistic evaluations of self-worth or guilty preoccupations
and ruminations over minor past events. This may reach delusional
proportions.
• Difficulty thinking, concentrating or making decisions
• Recurrent thoughts of death, suicidal ideation, plans or attempts
The frequency, intensity and lethality of these thoughts or actions can be very
varied.
The symptoms experienced during a major depressive episode must be new or have
significantly worsened when compared to the person's previous presentation. The
symptoms must also be present for most of the day, almost every day for at least two
consecutive weeks and the episode must be accompanied by distress or impairment in
social, occupational or other areas of every day functioning (Frances and Hall, 1991).
Features associated with a major depressive disorder include :
Tearfulness
Irritability
Obsessive rumination
Anxiety and phobias
Excessive worry about physical health, complaints of pain and increased use
of medical services
Panic attacks
Difficulty in intimate relationships and social interactions
Sexual dysfunction and marital problems
Attempted or completed suicide (15% of people suffering from major
depressive disorder commit suicide)
Academic problems
Alcohol and substance misuse
As DSM IV summarises, major depressive disorder is twice as common in adolescent
and adult women than in men. Rates of the disorder are highest in the 25 to 44 year
40
old age range. The lifetime risk for major depressive disorder ranges from 10% to
25% for women and 5% to 12% for men. Cultural factors can influence the
experience and communication of depression, but the core symptoms remain
unchanged. The disorder is, however, 1.5 to three times more common among first
degree biological relatives of people with the illness than among the general
population.
Some people will have isolated episodes of depression separated by many years
without symptoms, some will have clusters of episodes and others will have
increasingly frequent episodes as they grow older (Beck, 1967).
Neurotransmitters implicated in the pathophysiology of major depressive disorders
include: noradrenaline, serotonin, acetylcholine, dopamine and gamma-aminobutyric
acid (Coppen, 1974; Rosenblatt and Chanley, 1974; Rimon, Mandell, Puhakka and
Vanalainen, 1974; Durell, 1974).
It is important to be able to differentiate a diagnosis of major depressive disorder
from the following (DSM IV):
Mood disorder due to a general medical condition
Substance induced mood disorder
Dementia
Manic episodes with irritable mood
Mixed episodes
Attention Deficit/Hyperactivity Disorder
Adjustment disorder with depressed mood
Bereavement response
Periods of sadness
Dysthymic disorder
Schizoaffective disorder
41
3. DEPRESSION IN ADULTS WITH A LEARNING DISABILITY
The assessment and diagnosis of depression in adults with a learning disability is of
considerable importance because people with a learning disability exhibit the full
range of psychiatric disturbance found in the non-disabled population (Corbett, 1985).
It has also been reported by Matson, Dettling and Senatore (1980) and Edelstein and
Glenwick (1997) that the incidence of psychopathology among people with a learning
disability is proportionally higher than for the non-learning disabled population. If
these researchers are correct, it follows that there is likely to be a high, if not higher,
rate of depression in this population than amongst the general population. Reiss
(1990) assessed a sample of learning disabled adults and found a co-occurrence of
mental illness in 39% of the participants, however, only 11.7% had been previously
diagnosed, suggesting that mental illness is under diagnosed in this population.
Hurd (1888) was the first person to describe depressive phenomenology, including
suicidal behaviour, in people with a learning disability. It was not until the 1960's that
systematic research and examination of depression in people with a learning disability
was carried out (Berman, 1967 and Gardner, 1967). Much of this early research
focused on bipolar disorders, possibly because of the greater severity of
symptomatology, the associated psychosis, and the readily observable mood swings
that are associated with these disorders. These differences may be more easily
determined than unipolar depression. More recently, investigators have begun to
concentrate on depression, which tends to be more difficult to detect, given the
difficulty that many individuals with a learning disability have in communicating their
thoughts and feelings.
The dual diagnosis of a learning disability and mental illness is a widely used
concept, although Reynolds and Baker (1988) have noted the reticence on the part of
some professionals to consider their coexistence. Depression in people with a learning
disability can seriously interfere with daily functioning and reduce the person's level
of competence and community adjustment. With the increased emphasis on small
community rather than institutional placements for adults with a learning disability.
42
appropriate and sensitive assessment and diagnostic procedures for depression in this
client group are particularly important. Jacobson and Schwartz (1983) reported that
affective problems were more frequent in people with a learning disability whose
continued community placement was at risk than in those who were not at risk of
losing their placement. This suggested, either that clients suffering from depression
were more at risk of placement breakdown, that they became depressed due to
problems associated with placement breakdown, or as seems more likely, a
combination of both factors may be involved, depending upon individual client
related factors.
Reynolds and Baker (1988) also stated that people with a learning disability and
depression may be at greater risk of more severe pathology and maladjustment.
Their depression may have a greater impact on adaptive and interpersonal functioning
compared to depressed non-learning disabled people, because of the following
factors:
• A continued lack of recognition by professionals of depression in people with
a learning disability
• A lack of self-referral of people with a learning disability who may not
possess awareness of the nature of their distress and the knowledge that
there are treatment services available
• People with a learning disability may have reduced coping strategies and
social skills which offer some protection against the effects of stress on
depression (Matson et al., 1980)
• People with a learning disability may have a greater propensity for feelings of
helplessness and increased experiences of failure.
Additionally, adults with a learning disability may be more likely to experience risk
factors such as stigmatisation (Reiss and Benson, 1985), "transition shock' associated
with resettlement from institutions to the community (Coffman and Harris, 1980) and
a lack of social support. Community living may highlight the realisation that fully
independent adult life is unlikely to be achieved. This may be enhanced by labelling,
rejection, infantilisation and restricted opportunities (Reiss and Benson, 1984).
43
Rutter, Tizard, Yule, Graham and Whitmore (1976) carried out a study on the Isle of
Wight and found that the rate of psychopathology in learning disabled children was
four to five times that of their non-learning disabled peers.
All these factors indicate that depression in people with a learning disability is an
extremely important area of study and detailed knowledge of its assessment and
treatment is required by those psychologists and other professionals involved in their
lives.
3.1 Assessment and Diagnosis
Differential diagnosis of depression is a difficult task, however, with learning
disabled adults, assessment issues are made even more complex. The assessment and
diagnosis of depression in this population presents a number of challenges. As can be
seen from the literature discussed below, a considerable amount of inference and
interpretation is necessary when looking at the features of depression in people with a
learning disability. Other difficulties may arise from the fact that residential care
staff may not have adequate skills to be able to detect the symptoms of depression in
clients.
It is important to be able to assess depression in adults with a learning disability in
order to provide appropriate interventions and to aid ongoing evaluation of therapy.
Accurate diagnosis of the disorder is important in order to organise clinical material,
communicate effectively between different professional groups, predict the clinical
course of the illness and identify appropriate treatment strategies. Two diagnostic
issues of particular importance with learning disabled adults are developmental
factors and diagnostic overshadowing.
The intellectual and developmental level of a person with a learning disability may
influence the type of symptoms displayed and so the presentation of depression may
vary widely from the mildly learning disabled to the more severely affected (Edelstein
and Glenwick, 1997). The nature of this variation is discussed further later (Sovner
44
and Hurley, 1983; Pawlarcyzk and Beckwith, 1987). Matson (1983) stated that people
labelled as learning disabled, regardless of their actual level of intellectual
functioning, are more likely to have a greater number of problem behaviours
attributed to their learning disability than to emotional disturbance (diagnostic
overshadowing). Reiss and Szyszko (1983) also noted this phenomenon within
clinical psychology and other health related disciplines. They found that amount of
clinical experience did not reduce diagnostic overshadowing. Thus, problems of
depression may be lost under the banner of behavioural disturbance and go untreated
(Lund, 1985).
There are a number of other factors important to the assessment of depression in
people with a learning disability. Acquiescence (the tendency to submit socially
desirable answers) is a well known source of invalidity in testing (Cronbach, 1946).
A number of response biases may significantly reduce the validity of self-report
depression questionnaires and interviews (e.g. in the Beck Depression Inventory;
Beck, Ward, Mendelson, Mock and Brbaugh, 1961 and in the Hamilton Rating Scale
for Depression; Hamilton, 1960). The potential sources of invalidity include; faking
good or bad, naysaying and content irrelevant responding (e.g. alternating choices,
choosing the middle alternative or random responding)
The literature on the assessment and diagnosis of major depressive disorders in adults
with a learning disability describes a variety of procedures including; direct
observational techniques, self-monitoring scales, rating scales, checklists, clinical
interviews (client and informant based), and laboratory measures. Also, considerable
research has been carried out to ascertain whether the criteria identified in the
Diagnostic and Statistical Manual of Mental Disorders (Third Edition, Third Edition
Revised and Fourth Edition) can be meaningfully applied to the study of the diagnosis
of depression in adults with a learning disability. The development of instruments to
assess depression in people with a learning disability can be characterised by two
main strategies. Some authors have used instruments developed initially for use with
non-learning disabled people, often with some modification of item wording or
response format. Instruments used in this way include the following:
45
Beck Depression Inventory (BDI; Beck et a l, 1961)
Hamilton Rating Scale for Depression (Hamilton, 1960)
Zung Self-Rating Depression Inventory (Zung, 1965)
Reynolds Adolescent Depression Scale (RADS; Reynolds, 1987)
Child Depression Inventory (GDI) (Kovacs, 1985)
Other authors have developed depression scales based upon DSM 111 criteria such as
the Self-Report Depression Questionnaire (SRDQ; Reynolds and Baker, 1988).
Sovner and Hurley (1983) studied 25 published reports of affective illness (depression
and mania) in people with a learning disability. They used the Diagnostic and
Statistical Manual of Mental Disorders (Third Edition) to assess the validity of the
diagnoses. People with a learning disability were shown to demonstrate the full
range of affective disorders. Although they found that intellectual and social
impairment could affect clinical presentation, these factors did not affect the
development of affective symptomatology per se. Sovner and Hurley (1983) found
that diagnosis of a mood disorder could be made across all levels of learning
disability. For the mildly to moderately intellectually impaired clients, a diagnosis
could be made with standard criteria used in the general population. However, for the
severely to profoundly learning disabled people a diagnosis should rely more on
changes in behaviour and vegetative functioning as well as taking into account a
family history of affective illness. This had considerable implications for the process
of assessment of depression in the learning disabled population and suggested that
different assessment protocols should be used depending upon the degree of learning
disability and the expressive and receptive language skills displayed by the client.
However, it is important not to dismiss the importance of an individual's internal
experience of altered mood and perception of the mood merely because they are
unable to articulate these feelings. More creative, individualised assessment
techniques should be devised to take these difficulties into account.
Pawlarcyzk and Beckwith (1987) studied the usefulness of the diagnostic criteria
outlined within the Diagnostic and Statistical Manual of Mental Disorders (Third
Edition) for people with a dual diagnosis of a learning disability and a major
46
depressive disorder. In their review of the literature (16 studies), they found that none
of the studies included disturbances in concentration or a diminished ability to think
as symptoms of severe depression in people with a learning disability. These results
seemed to indicate, either that disturbances in concentration and fatigue were not
symptoms of depression in this client group, or more probably, they may have
reflected diagnostic overshadowing. Symptoms of poor concentration and the reduced
ability to think may tend to be regarded as general characteristics of people with a
learning disability and therefore of little diagnostic significance. Also, larger
alterations in concentration and thought processing may need to be present in order to
be identified by carers or professionals involved. More research is needed to identify
whether these symptoms are displayed by depressed people with a learning disability.
Direct observational techniques or manipulation of environmental features (e.g.
analogue conditions) may be required. The difficulty of assessing subtle changes in
concentration and thought processes will be compounded by the fact that the clients
may not be able to describe changes in these factors or to identify previous levels
against which a comparison may be made.
Pawlarcyzk and Beckwith (1987) also found that, although thoughts of death or
suicide were cited in four studies, suicide attempts were only reported in one study.
According to Reid (1972), preoccupation with death or suicide attempts did not
appear to be characteristic of people with a more severe learning disability. The
reasons for this were probably fairly straightforward in that they reflected the highly
controlled environments within which people with a learning disability tend to live.
These environments will provide access to few means for committing suicide. More
severely intellectually impaired people may also be less aware of ways to attempt
suicide, or they may be further restricted by additional physical or sensory disabilities.
Psychomotor disturbances (agitation or retardation) have been commonly cited as
symptoms of depression in several studies (Pawlarcyzk and Beckwith, 1987; Hurley
and Sovner, 1979; Heaton-Ward, 1977). Overactive behaviour (e.g. pacing and foot
stamping) as well as slowed or absent responses during conversation were also easily
observable and cited as being associated with depressive episodes. Loss of interest in
47
activities has also been frequently noted, as have feelings of worthlessness (Reid,
1972; Reid, 1980; Hurley and Sovner, 1979; Matson, 1982). Dysphoric mood tended
to be inferred from sad facial expression or frequent crying and was the most
commonly cited diagnostic criterion of depression (Matson, 1982; Hurley and Sovner,
1979; Reid, 1976). Therefore, a sad expression would appear to be a primary
symptom of depression in learning disabled people, as it is in their non-learning
disabled counterparts. Sleep disturbances and weight gain were identified in 12
studies reviewed by Pawlarcyzk and Beckwith (1987), however, the severity of these
symptoms was rarely recorded. Psychotic features were present in seven studies.
These results lend support to the fact that the most easily or readily discernible
features of depression are behavioural alterations which have an obvious impact on
daily functioning.
Unfortunately, most of these studies have focused primarily on people with a mild
learning disability and there has been little research into the assessment and diagnosis
of depression in adults with a more severe learning disability. Research is more
straightforward with less disabled clients with good verbal skills as they are more
likely to be able to describe feelings of worthlessness and dysphoric mood.
Pawlarcyzk and Beckwith (1987) concluded that criteria contained in the Diagnostic
and Statistical Manual of Mental Disorders can probably be applied usefully and
appropriately to depressed learning disabled people, especially those with mild to
moderate intellectual impairments. However, when clients are more severely
intellectually impaired there tends to be greater reliance upon behavioural
observations (e.g. weight, sleep and psychomotor changes), although few studies
have specified the amount or degree of behavioural change, which makes
identification of severity of symptoms and study comparison difficult.
Meins (1995) carried out a study involving 32 adults with a learning disability and a
major depressive disorder. The participants were examined for the prevalence of
typical and atypical depressive symptoms using the Children's Depression Inventory
(Kovacs, 1985). Meins' results supported those of Pawlarcyzk and Beckwith (1987) as
he found that participants with mild learning disabilities could be readily assessed
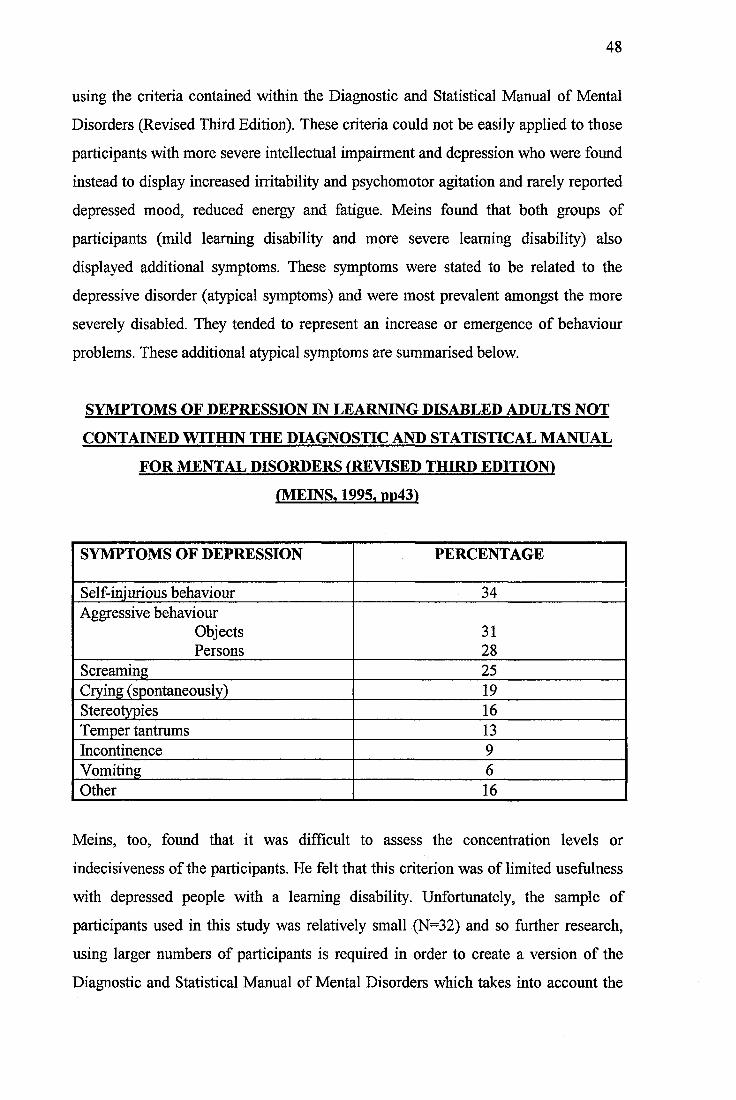
48
using the criteria contained within the Diagnostic and Statistical Manual of Mental
Disorders (Revised Third Edition). These criteria could not be easily applied to those
participants with more severe intellectual impairment and depression who were found
instead to display increased irritability and psychomotor agitation and rarely reported
depressed mood, reduced energy and fatigue. Meins found that both groups of
participants (mild learning disability and more severe learning disability) also
displayed additional symptoms. These symptoms were stated to be related to the
depressive disorder (atypical symptoms) and were most prevalent amongst the more
severely disabled. They tended to represent an increase or emergence of behaviour
problems. These additional atypical symptoms are summarised below.
SYMPTOMS OF DEPRESSION IN LEARNING DISABLED ADULTS NOT
CONTAINED WITHIN THE DIAGNOSTIC AND STATISTICAL MANUAL
FOR MENTAL DISORDERS (REVISED THIRD EDITION!
(MEINS. 1995. PP43I
SYMPTOMS OF DEPRESSION PERCENTAGE
Self-injurious behaviour 34Aggressive behaviour
Objects 31Persons 28
Screaming 25Crying (spontaneously) 19Stereotypies 16Temper tantrums 13Incontinence 9Vomiting 6Other 16
Meins, too, found that it was difficult to assess the concentration levels or
indecisiveness of the participants. He felt that this criterion was of limited usefulness
with depressed people with a learning disability. Unfortunately, the sample of
participants used in this study was relatively small (N=32) and so further research,
using larger numbers of participants is required in order to create a version of the
Diagnostic and Statistical Manual of Mental Disorders which takes into account the
49
specific needs of people with a learning disability and their depressive
psychopathology.
Matson (1983) described several target behaviours which have been used to evaluate
depression in people with a learning disability. The target behaviours were identified
using observer ratings of frequencies of the behaviours during a specified period of
time (directly or retrospectively via audio or videotape). These recordings were then
used to assess severity of symptomatology. Behaviours rated by Matson included:
The number of words spoken
Somatic complaints
Irritability
Grooming
Negative self-statements
Flat affect
Eye contact
Speech latency
However, this methodology did not allow for comparison of changes in behaviour
over time (i.e. pre- and post- onset of depression) which probably reflects as
important a dimension as the behavioural clusters themselves.
The following sections (3.1.1 to 3.1.5) review the different assessment procedures
which have been used to study the assessment and diagnosis of depression in people
with a learning disability.
3.1.1 Self-Report Questionnaires
The principal methods used to assess depression in the general population are self-
report questionnaires and clinical interviews. Both these procedures rely heavily on
expressive and receptive language skills. Many investigators have used self-report
measures with people vdth a learning disability, although few seem to have
adequately considered the psychometric characteristics of these measures. Reynolds
50
and Miller (1985) stated that self-report depression questionnaires, even if presented
orally, are of limited usefulness with all but the most mildly learning disabled.
Reynolds and Baker (1988) stated that although self-report questionnaires are among
the most popular evaluation procedures for the assessment of depression in people
without a learning disability, most self-report depression questionnaires are too
complex for use with people with a learning disability, even with oral presentation.
The reliability and validity of traditional self-report measures for depression is
questionable when they are applied to the learning disabled population. Very little
normative data exists for this client group. A number of investigators have used the
Beck Depression Inventory, usually in a modified form. Kazdin et al. (1983) reported
a correlation of only .24 between the Beck Depression Inventory and a structured
clinical interview (The Hamilton Depression Rating Scale, Hamilton, 1960). This is
compared to a mean correlation of .73 in the general population (Beck and Steer,
1987). The Hamilton Depression Rating Scale assesses the severity of depressive
symptomatology and has been widely used in psychiatric research. This provides little
support for the validity and reliability of the Beck Depression Inventory when
administered to people with a learning disability.
The Reynolds Adolescent Depression Scale (Reynolds, 1987) was developed for use
with adolescents without a learning disability and consists of 30 items rated using a
four point likert response format. Reynolds and Miller (1985) used a verbal
presentation of this scale to assess depression in a sample of adolescents with a
learning disability. They found that the learning disabled adolescents reported
statistically significant higher levels of depressive symptomatology than those who
were not learning disabled. Unfortunately, this study did not explore correlations
between the scale and clinical interviews with learning disabled participants.
The Self-Rating Depression Scale (SRDS; Zung, 1965) is another widely used scale
for assessing depression in the general population which has been adapted for use
with people with a learning disability (Benson, Reiss, Smith and Laman, 1985,
51
Kazdin et al., 1983, Prout and Schaefer, 1985). Reiss and Benson (1985) carried out a
study on the reliability of the SRDS when used with people with a learning disability.
Repeated assessment between four to 10 weeks after initial assessment showed a
moderate level of reliability (correlation of .61). They did not report on the validity of
the scale. As the SRDS consists of a likert scale with four points (a little of the time,
some of the time, a good part of the time and most of the time) its usefulness is
probably restricted to the more mildly learning disabled clients v^th good receptive
language skills.
Reynolds and Baker (1988) used the Self-Report Depression Questionnaire (SRDQ;
Reynolds and Miller, 1985), to assess the severity of depressive symptomatology
reported by 89 people ’with a learning disability. The SRDQ was presented orally to
participants, all of whom were living in community based settings. Reynolds and
Baker (1988) found that the SRDQ had an internal consistency reliability coefficient
of .90 and an 11 week test-retest reliability of .63. Criterion-related validity was
demonstrated by a high degree of relationship between the SRDQ and clinical
interview using the Hamilton Depression Rating Scale.
This study mainly involved participants with a mild to moderate learning disability,
and so contained little information about the assessment of depression in people with
more severe intellectual impairment. It also involved a relatively small number of
participants and further research to confirm Reynolds and Baker’s findings is needed.
Self-report measures of depression are heavily dependent upon the cognitive ability of
the respondents and are therefore of less benefit when assessing the depressive
symptomatology of more severely intellectually impaired people. Reynolds and Baker
suggested that the principal use of the SRDQ was the identification of individuals
with significant depressive symptomatology with whom further evaluation would be
suggested. It was not intended to be a diagnostic tool.
Lindsay, Mitchie, Baty, Smith and Miller (1994) carried out a study to investigate the
stability of emotions in people with a learning disability. They used the Zung
Depression Inventory and the Zung Self-Rating Anxiety Scale (Zung, 1965 and 1971)
52
as well as the General Health Questionnaire (Goldberg, 1978) and the Eysenck-
Withers Personality Inventory (Eysenck and Withers, 1965). The results of this study
showed that there was significant convergent validity in the participants’ assessments
of emotional experiences and feelings, indicating that the self-report of people with a
learning disability is as reliable as that of other sections of the community. They also
found high correlations between measures of anxiety and depression.
3.1.2 Informant-Rating Measures
Informant-rating measures of depression have been developed for use with people
with a learning disability. Laman and Reiss (1987) reported an internal consistency of
.90 for a combined measure consisting of the Depression Subscale of the
Psychopathology Instrument and the lllinois-Chicago Informant Rating Scale.
Informant rating scales may show promise for the assessment of depression in people
with a more severe learning disability, although the validity of these measures for the
evaluation of internalised disorders such as depression still needs to be evaluated.
Meins (1993, pp305) carried out a large study (N=798) to investigate the usefulness of
the informant version of the Children’s Depression Inventory (Kovacs, 1985). Factor
analysis revealed three readily interpretable factors accounting for 36.3 % of the total
variance and which covered the salient aspects of depression. These were:
• Factor 1. Depressive image / Ideation
"All bad things are my fault"
• Factor 2. Anhedonism / Unsociability
"She does not want to be with people at all"
• Factor 3. Depressive mood / Somatic disturbance
"She is sad all the time"
This study also found a positive correlation between depression and behaviour
problems.
Benavidez and Matson (1993) studied the performance of learning disabled and non-
learning disabled adolescents on self-report and informant versions of three childhood
53
depression measures (Children's Depression Inventory; Kovacs, 1985; Bellevue Index
of Depression and the Reynolds Child Depression Scale). They found that each of the
measures was an effective assessment schedule for depression in learning disabled
adolescents (12 to 17 years). All measures were significantly correlated. However,
this study did not explore the construct validity of the three scales and more research
on this is needed before further conclusions can be drawn.
Recently, Meins (1996) carried out a pilot study to develop a Comprehensive
Psychopathological Rating Scale (CPRS) depression subscale (Mental Retardation
Depression Scale - MRDS) suitable for use with all adults with a learning disability
despite their degree of impairment. One of the strengths of the study was that the
sample size was comparatively large (total N = 92, of which 51 had a depressive
disorder and 41 had other psychiatric disorders). The CPRS had been applied to
adults with a learning disability previously (Gostason, 1985) and was reported to
show high inter-rater reliability in the general population (Kuny, Maurer, Dittrich and
Woggan, 1982).
Meins developed a nine item depression subscale (MRDS) comprising the following
items:
Inner tension
Inability to feel
Lassitude
Reduced sleep
Apparent sadness
Hostility
Withdrawal
Agitation
Muscular tension
The scale was found to separate those adults with and without a major depressive
disorder. It was also shown to constitute two distinct factors. The first was described
as an agitated-irritable syndrome which particularly covered symptoms strongly
54
associated with degree of learning disability. Meins stated that the agitated-irritable
symptoms represented unspecific psychopathology to a large extent. This supported
previous observations that depressive disorders, particularly in people with a severe
learning disability were partly characterised by symptoms such as aggression or self-
injurious behaviours (Pawlarcyzk and Beckwith, 1987; Meins, 1995). The second
factor was described as a retarded-depressive syndrome. The promising results found
by Meins (1996) using the MRDS await further replication but represent a significant
new development.
Paclawskyj, Matson, Bamburg and Baglio (1997) have carried out a study of the
Diagnostic Assessment for the Severely handicapped (DASH-II; Matson, Gardner,
Coe and Sovner, 1991). This assessment schedule was derived from the DSM
classification system and contains 13 subscales, all of which focus on emotional and
behavioural disturbance, and one of which is formulated to assess specific depressive
symptomatology. Further research is needed to clarify the usefulness of this
instrument, however, it may be of importance in the assessment of more severely
learning disabled people. The researchers suggested that it may be particularly helpful
as a screening device to highlight individuals who require further assessment for
possible mood disorders,
3.1.3 Clinical Interviews
Clinical interviews are another widely used method for assessing depression. They
allow the interviewer to determine the severity of an individual's symptoms as well as
whether the symptom is specific to an underlying depression or based on another
cause. Interviews often include observational items, such as those used to determine
psychomotor retardation or agitation. These symptoms are not easily evaluated with
self-report questionnaires. There are several versions of the Hamilton Clinical
Interview, although the most commonly used version consists of 17 items that are
scored on the basis of severity. Reynolds and Miller (1985) used a language modified
version of the Hamilton with people with mild to moderate intellectual impairments.
55
They found a high degree of internal consistency and inter-rater reliability as shown
in Section 4.
3.1.4 Behavioural Observation
Bemey and Jones (1988) stated that there tends to be a greater emphasis on irritability
and on changes in behaviour (e.g. changes in sleep pattern), somatic symptoms and on
the loss of developmental skills (e.g. continence) in major depressive disorder in
people with a learning disability. The initial presentation of depression in this client
group can be misleading if the overall pattern of the illness and genetic history of the
client are not taken into account. Additionally, the presence of hallucinations (9 out of
21 cases described by Reid, 1972) can lead to the mistaken diagnosis of
schizophrenia. Lowiy and Sovner (1992) reported on two case studies of severe
behaviour problems associated with rapid cycling bipolar mood disorder in adults
with a learning disability. They found that severe behaviour problems were features
of an affective illness in a participant with a profound learning disability.
Additionally, self-injurious behaviour was only associated with the depressed phase of
the bipolar illness and may therefore be an important feature to include in the
assessment and diagnosis of the disorder.
Research into laboratory findings, culture, age and gender differences in presentation,
incidence, differential diagnosis and causal factors of major depressive disorder in
adults with a learning disability is sparse. Chariot, Douchette and Mezzacappa (1993)
carried out a study of affective symptoms in two groups of learning disabled
participants. Group one comprised those with a prior diagnosis of a mood disorder
and group two comprised those with other psychiatric disorders. Informants reported
retrospectively on the presence or absence of criteria for a major depressive disorder
and mania ( Diagnostic and Statistical Manual of Mental Disorders, Revised Third
Edition). They found that 13 % of group one did not meet the criteria for depression
or mania, however 20% of group two did meet the criteria. These findings supported
the view that mood disorders are under diagnosed in the learning disabled population.
This study was interesting in that 74% of the participants had a severe to profound
56
level of intellectual impairment. Of the 13% who did not meet the criteria for
depression or mania in group one, most of these participants were more profoundly
learning disabled. Aggression was also found to be a frequent symptom.
3.1.5 Laboratory Results
Evidence has accumulated to suggest a disturbance of the hypothalamic-pituitary-
adrenal axis in depressive illness. Many depressed non-learning disabled people do
not suppress cortisol production following administration of a synthetic
glucocorticoid, and the Dexamethasone Suppression Test (DST) has been proposed
for the diagnosis of depression. Sireling (1986) carried out very small study (N=12) to
assess the usefulness of the DST in assessing major depressive disorder in people with
a learning disability. Only one of the depressed participants failed to suppress cortisol
production, suggesting that the DST may have little to offer in the differential
diagnosis of depression of people with a learning disability. Although not mentioned
by Sireling, it was also possible that the participants diagnosed as depressed were not
actually depressed and had been misdiagnosed. Additionally, the applicability of the
DST is limited as it cannot be used when patients have temporal lobe epilepsy,
hepatic enzyme induction by phenytoin and barbiturates and high doses of
benzodiazepines. Further research in this area is required.
4. SUMMARY AND CONCLUSION
To summarise, the last 10 years have been marked by considerable research into the
development of assessments of psychopathology in people with a learning disability.
However, much of this research has been of a preliminary nature and requires further
development. Depression among people with a learning disability is a valid disorder,
which, if not identified, is likely to go untreated. A number of investigators have
utilised self-report depression measures designed for the general population (e.g.
Reiss and Benson, 1985; Reynolds and Baker, 1988; Lindsay et a l, 1994).
Unfortunately the psychometric data on these measures has often not been adequate
and little normative data exists. As depression is the most common psychological
57
problem for which patients are seen at mental health clinics, the need exists for a
reliable and valid measure of depression designed specifically for people with a
learning disability. Considerably more basic and applied research must be carried out
before we can begin to understand the dynamics of depression in people with a
learning disability.
The studies of the assessment of depression in adults with a learning disability cited
in the current literature review have highlighted several problems including the
following:
• The under-reporting of the reliability of diagnosis and classification
• The use of classification schemes developed with non-disabled populations
transferred without substantial modification and vdthout further empirical
development
• Difficulties encountered by clients with poor expressive language skills when
describing internal states and experiences
• Substantial use of third party reports
• Inability of clients to maintain accurate records
• The difficulty of differentiating psychiatric signs and symptoms from other
unusual behaviour or traits, especially from other difficult or disruptive
behaviour which may not be associated with psychiatric disturbance.
The psychometric properties of several measures of depression in people with a
learning disability have been highlighted by Sturmey, Reed and Corbett (1991,
ppl48). The table overleaf has been adapted from Sturmey's paper and summarises
the data collected.
58
There has generally been insufficient attention paid to aspects of reliability. Only
one of the studies reviewed reported inter-rater reliability (Reynolds and Miller,
1985). Internal consistencies of depression scales can be seen to be acceptable
(median reported by Sturmey et al., 1991, ppl48 = 0.75, range 0.54 - 0.93). Validity
coefficients were generally poor with most values under 0.5. The only reported
values greater than 0.6 were between the SRDQ and the Hamilton (Reynolds and
Baker, 1988), the Childhood Depression Inventory and the Childhood Behaviours
Inventory (Matson, Barrett and Helsel, 1988).
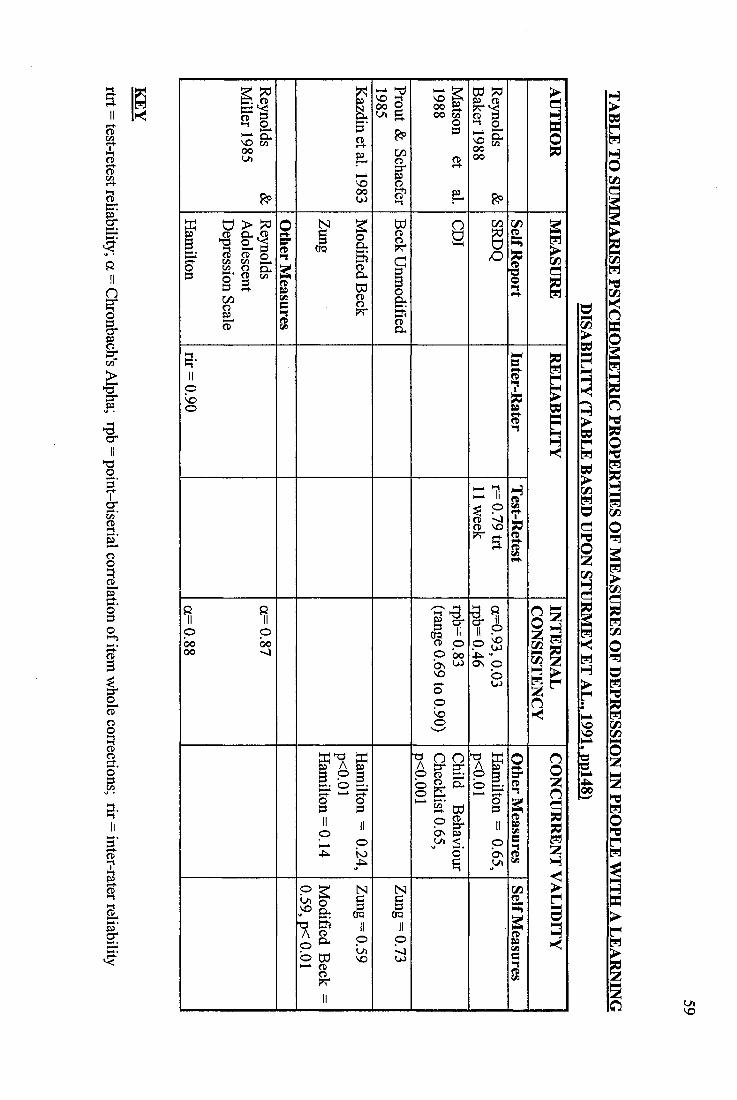
O '
sIIn
II
Î#I
II%
IÎI3 -
Ii
Ifz g00V)
pp
I 0
1§c / 3iCD
Ifg &
o0000
00'«J
Ia
I IDdI
gI b B.
Ln)0
oo
01ddI
0
1Ln\ o
h-*.VO 500 o u. g.ppc/3
Î
fI Ioy
i lsCD
P
8
I fCD pp b o os w \ o
ooloo
IPa dd
i f “ I'
d d ^If00
pp
II
1« ? H
llO n O
S
1O n(V,
f
crg
I
I
!III
n
Ic/3i
LANO
60
4.1 Suggested Assessment Stages
Most people with a learning disability can be assessed according to the usual
criteria for depression (e.g. Diagnostic and Statistical Manual for Mental
Disorders). The diagnostic methods should, however, be adapted to the degree
of learning disability of each individual and their receptive and expressive
language skills. When assessing clients with a learning disability for
depression, and especially those with a more severe level of intellectual
impairment, additional atypical features of depression must be taken into account
(e.g. self-injuiy and aggression, incontinence etc. Meins, 1995). Factors such as
concentration level and indecisiveness may be of more limited usefulness with this
client group. Recent research has suggested that the DASH-II instrument (Matson et
al., 1991) may be a helpful screening device in this population, it is certainly worthy
of further study.
Mood disturbances in adults with a learning disability should include, not only
depressed mood and sadness, but also irritable mood, which the Diagnostic and
Statistical Manual of Mental Disorders generally restricts for children and
adolescents.
If assessment of depressed mood is hampered by the severity of the learning
disability, at least three Diagnostic and Statistical Manual of Mental Disorder
criteria should be fulfilled, one of which must be mood disturbance or loss of
interest. In addition there must be at least one or two obvious further symptoms
which coincide with the depressive syndrome (Meins, 1995).
It is also helpful to focus on aggressive and self-injurious behaviour,
stereotypic behaviours, screaming and spontaneous crying. Other less frequent
symptoms should not be overlooked or excluded.
The assessment techniques which may be most effective with this client group
include:
61
• Direct observation in the natural setting. Data can be recorded in terms of
frequency, intensity and duration
• Direct observation in analogue settings
• Self-monitoring
• Rating scales, checklists and interviews. These may either be client
or respondent based
Singh, Sood, Sonenklar and Ellis (1991) outlined a useful assessment and diagnosis
sequence, which is summarised below:
• The level of a client’s intellectual and verbal functioning is determined
• Screening for depression is carried out (e.g. using the Psychopathology
Instrument for Mentally Retarded Adults; Matson, 1988).
• Clinical interview takes place (e.g. using the Hamilton Rating
Scale, Hamilton, 1960).
• Rating scales and checklists are used to obtain additional information on the
presence or absence of depression.
• Direct behavioural observations, experimental analysis and laboratory
measures may be carried out if further information is required or if the
client has a more severe degree of learning disability.
In conclusion, the research on major depressive disorder in adults with a learning
disability and the development of assessment batteries designed to evaluate the varied
symptoms of depression in this client group strongly suggest that a multicomponent
approach is necessary. This is particularly important when the client has a severe to
profound disability. It is important to detect depression early so that appropriate
treatment interventions may be provided. Depression is an important disorder which
is difficult to detect in people with a learning disability who tend to be less able to
communicate their distress and symptomatology.
62
5. REFERENCES
1. American Psychiatrie Association (1994). Diagnostic and Statistical Manual
of Mental Disorders (Fourth Edition), pp317-345. American Psychiatric
Association: Washington D C., USA.
2. Bailey, R., Matthews, F., & Leckie, C. (1986). Feeling - The Way Ahead in
Mental Handicap, 14,65-67.
3. Benavidez, D.A., & Matson, J.L. (1993). Assessment of Depression in
Mentally Retarded Adolescents. Research in Developmental Disabilities, 14,
179-188.
4. Beck, A T. (1967). Depression. Causes and Treatment. University of
Pennsylvania Press, Philadelphia, USA.
5. Beck, A T., & Steer, R.A. (1987). Beck Depression Inventory Manual. The
Psychological Association, Harcourt Brace Jovanovich, Inc.
6. Beck, A.T., Ward, C.H., Mendelson, M., Mock, J.& Erbaugh, J. (1961).
An Inventory for Measuring Depression. Archives of General Psychiatry, 4,
561-571.
7. Benson, B.A., Reiss, S., Smith, D C., & Laman, D.S. (1985). Psychosocial
Correlates of Depression in Mentally Retarded Adults: II. Poor Social Skills.
American Journal Of Mental Deficiency, 89, 657-659.
8. Berman, M L (1967). Mental Retardation and Depression. Mental
Retardation, 5,19-21.
63
9. Berney, T.P., & Jones, P.M. (1988). Manic Depressive Disorder in Mental
Handicap. Australia and New Zealand Journal of Development Disabilities,
14 (3 & 4), 219-225.
10. Coffman, T.L., & Harris, M.C. (1980). Transition Shock and Adjustment
of Mentally Retarded Persons. Mental Retardation, 18,3-70.
11. Coppen, A. (1974). Serotonin in the Affective Disorders. In: Kline, N. (Ed.).
Factors in Depression, pp33-44. Raven Press, New York, NY, USA.
12. Corbett, J.A. (1985). Mental Retardation : Psychiatric Aspects. In; Rutter,
M., & Hersov, L. (Eds.). Child Psychiatry - Modem Approaches, pp, 661 -
668. Blackwell: Oxford, UK.
13. Chariot, L.R., Douchette, A C., & Mezzacappa, E. (1993). Affective
Symptoms of Institutionalized Adults Avith Mental Retardation. American
Journal on Mental Retardation, 98 (3), 408-416.
14. Cronbach, L.J. (1946). Response Sets and Test Validity. Educational and
Psychological Measurement, 6,475-494.
15. Durell, J. (1974). Sodium and Potassium Metabolism. Lithium Salts and
Affective Disorders. In: Kline, N. (Ed.). Factors in Depression, pp67-96.
Raven Press, New York, NY, USA.
16. Edelstein, T.M., & Glenwick, D.S. (1997). Referral Reasons for
Psychological Services for Adults with Mental Retardation. Research in
Developmental Disabilities, 18(1), 45-59.
17. Eysenck, H., & Withers, A. (1965). Eysenck - Withers Personality
Inventory. Hodder and Stoughton, London, UK.
64
18. Frances, A., & Hall, W. (1991). Work in Progress on the DSM-IV Mood
Disorders. In; Feighner, J.P., & Boyer, W.F. (Eds.). Diagnosis of Depression.
Perspectives in Psychiatry, Volume 2, pp49-64. John Wiley & Sons, New
York, NY, USA.
19. Gardner, W.L (1967). Occurrence of Severe Depressive Reactions in the
Mentally Retarded. American Journal of Psychiatry, 124,386-388.
20. Goldberg, D. (1978). General Health Questionnaire. N.F.E.R.-Nelson
Publishing Company Ltd., London, UK.
21. Gostason, R. (1985). Psychiatric Illness Among The Mentally Retarded.
Acta. Psychiatrica Scandinavica Suppl. 318.
22. Hamilton, M. (1960). A Rating Scale for Depression. Journal of Neurology,
Neurosurgery and Psychiatry, 23, 56-62.
23. Heaton-Ward, A. (1977). Psychosis in Mental Handicap. British Journal
of Psychiatiy, 130, 525-533.
24. Hurd, H.M. (1888). Imbecility and Insanity. Journal of Insanity, 45, 263-
371.
25. Hurley, A.D., & Sovner, R, (1979). Anorexia and Mental Retardation: A
Case Report. Journal of Clinical Psychiatry, 40,480-482.
26. Jacobson, J.W., & Schwartz, A.A. (1983). Personal and Service
Characteristics Affecting Group Home Placement Success: A Prospective
Analysis. Mental Retardation, 21,1-7.
65
27. Kazdin, A.E., Matson, J.L., & Senatore, V. (1983). Assessment of
Depression in Mentally Retarded Adults. American Journal of Psychiatry,
140,1040-1043.
28. Kovacs, M. (1985). The Children's Depression Inventory (C.D.I).
Psychopharmacology Bulletin, 21,995-998.
29. Kraepelin, E. (1913). Manic-Depressive Insanity and Paranoia. In: Barclay,
R.M. (Bd.). Textbook of Psychiatry, pp309-348. Livingstone, Edinburgh, UK.
30. Kuny, S., Maurer, M., Dittrich, A., & Woggan, B. (1982). Interrater -
Réhabilitât der Deutschprachigen Version der Comprehensive
Psychpathological Rating Scale (CPRS). International Pharmacopsychiatry,
17, 354-69.
31. Laman, D.S., & Reiss, S. (1987). Social Skills Deficiencies Associated with
Depressed Mood in Mentally Retarded Adults. American Journal of Mental
Deficiency, 92,224-229.
32. Lindsay, W .R, Baty, F.J., Mitchie, A.M., & Richardson, I. (1989). A
Comparison of Anxiety Treatment with Adults who have Moderate and Severe
Mental Retardation. Research in Developmental Disabilities, 10,129-140.
33. Lindsay, W.R., Mitchie, A. M., Baty, F.J., Smith, A.H.W., & Miller, S.
(1994). The Consistency of Reports about Feeling and Emotions from People
with Intellectual Disability. Journal of Intellectual Disability Research, 38,
61-66.
34. Lowry, M.A., & Sovner, R. (1992). Severe Behaviour Problems Associated
with Rapid Cycling Bipolar Disorder in Two Adults with Profound Mental
Retardation. Journal of Intellectual Disability Research, 36,269-281.
66
35. Lund, J. (1985). The Prevalence of Psychiatric Morbidity in Mentally
Handicapped Adults. Acta Psychiatrica Scandinavica, 72, 563-570.
36. Matson, J.L. (1982). The Treatment of Behavioural Characteristics of
Depression in the Mentally Retarded. Behaviour Therapy, 13,209-218.
37. Matson, J.L. (1983). Depression in Mentally Retarded Persons: Research
Findings and Future Directions. Australia and New Zealand Journal of
Developmental Disabilities, 9 (4), 185-190.
38. Matson, J.L. (1988). The PIMRA Manual. International Diagnostic Systems:
Orland Park, IL, USA.
39. Matson, J.L., Barrett, R.P., & Helsel, W.J. (1988). Depression in Mentally
Retarded Children. American Journal of Mental Deficiency, 9, 39-46.
40. Matson, J.L., Dettling, J., & Senatore, V. (1980). Treating Depression of a
Mentally Retarded Adult. British Journal of Mental Subnormalily, 16, 86-88.
41. Matson, J.L., Gardner, W.L, Coe, D.A., & Sovner, R. (1991). A Scale for
Evaluating Emotional Disorders in Severely and Profoundly Mentally
Retarded Persons. British Journal of Psychiatry, 159,404-409.
42. Matson, J.L., Kazdin, A.E., & Esveldt-Dawson, K. (1980). Training
Interpersonal Skills Amongst Mentally Retarded and Socially Dysfunctional
Children. Behaviour Research and Therapy, 18,419-427.
43. Meins, W. (1993). Assessment of Depression in Mentally Retarded Adults:
Reliability and Validity of the Children's Depression Inventory (C.D.I).
Research in Developmental Disabilities, 14,299-312.
67
44. Meins, W. (1995). Symptoms of Major Depression in Mentally Retarded
Adults. Journal of Intellectual Disability Research, 39 (1), 4 -45.
45. Meins, W. (1996). A New Depression Scale Designed for Use with Adults
with Mental Retardation. Journal of Intellectual Disability Research, 40 (3),
222-226.
46. Paclawskyj, T.R., Matson, J.L., Bamburg, J.W., & Baglio, C.S. (1997). A
Comparison of the Diagnostic Assessment for the Severely Handicapped-H
(DASH-n) and the Aberrant Behaviour Checklist (ABC). Research in
Developmental Disabilities, 18(4), 289-298.
47. Pawlarcyzk, D., & Beckwith, B.E. (1987). Depressive Symptoms Displayed
by Persons with Mental Retardation: A Review. Mental Retardation, 25 (6),
325-330.
48. Prout, H.T., & Schaefer, B.M. (1985). Self-Reports of Depression by
Community based Mildly Mentally Retarded Adults. American Journal of
Mental Deficiency, 90,220-222.
49. Reid, A.H. (1972). Psychosis in Adult Mental Defectives: I: Manic-
Depressive Psychosis. British Journal of Psychiatry, 120,205-212.
50. Reid, A.H. (1976). Psychiatric Disturbances in the Mentally Handicapped.
Proceedings of the Royal Society of Medicine, 69, 509-512.
51. Reid, A.H. (1980). Psychiatric Disorders in Mentally Handicapped Children:
A Clinical and Follow-up Study. Journal of Mental Deficiency Research, 24,
287-298.
68
52. Reiss, S. (1990). Prevalence of Dual Diagnosis in Community-Based
Programs in the Chicago Metropolitan Area. American Journal on Mental
Retardation, 94, 578-585.
53. Reiss, S., & Benson, B.A. (1985). Psychosocial Correlates of Depression in
Mentally Retarded Adults: I. Minimal Support and Stigmatization. American
Journal of Mental Deficiency, 89,331-337.
54. Reiss, S., & Szyszko, J. (1983). Diagnostic Overshadowing and Professional
Experience with Mentally Retarded Persons. American Journal of Mental
Deficiency, 87,396-402.
55. Reynolds, W.M. (1987). Reynolds Adolescent Depression Scale:
Professional Manual. Psychological Assessment Resources: Odessa, FL, USA.
56. Reynolds, W.M., & Baker, J.A. (1988). Assessment of Depression in
Persons with Mental Retardation. American Journal on Mental Retardation,
93 (1), 93-103.
57. Reynolds, W.M., & Miller, K.L. (1985). Depression and Learned
Helplessness in Mentally Retarded and Non-Mentally Retarded Adolescents:
An Initial Investigation. Applied Research in Mental Retardation, 6,295-306.
58. Rimon, R., Mandell, A.J., Puhakka, P., & Vanalainen, E. (1974).
Adrenergic Blockades and Cholinergic Response in Human Cerbrospinal
Fluid. In: Kline, N. (Ed.). Factors in Depression, pp61-66. Raven Press, New
York, NY, USA.
59. Rosenblatt, S., & Chandley, J.D. (1974). Changes in Norepinephrine
Metabolism in Depressed Subjects Undergoing Tricyclic Drug Therapy. In:
Kline, N. (Ed.). Factors in Depression, pp45-60. Raven Press, New York, NY,
USA.
69
60. Rutter, M., Tizard, J., Yule, W., Graham, P., & Whitmore, K. (1976).
Isle of Wight Studies 1964 - 1974. Psychological Medicine, 6, 313-332.
61. Singh, N.N., Sood, A., Sonenklar, N., & Ellis, C.R. (1991). Assessment and
Diagnosis of Mental Illness in Persons with Mental Retardation. Methods
and Measures. Behaviour Modification, 15 (3), 419-443.
62. Sireling, L. (1986). Depression in Mentally Handicapped Patients:
Diagnostic and Neuroendocrine Evaluation. British Journal of Psychiatry,
149, 274-278.
63. Sovner, R., & Hurley, A.D. (1983). Do the Mentally Retarded Suffer from
Affective Illness ? Archives of General Psychiatry, 40,61-67.
64. Sturmey, P., Reed, J., & Corbett, J. (1991). Psychometric Assessments of
Psychiatric Disorders in People with Learning Difficulties (Mental Handicap):
A Review of Measures. Psychological Medicine, 21,143-155.
65. Zung, W.W.K. (1965). A Self-Rating Depression Scale. Archives of
General Psychiatry, 12,63-70.
66. Zung, W.W.K. (1971). Depression in the Normal Adult Population.
Psychosomatics, 12,164-167.

SECTION THREE
CLINICAL DOSSIER
3.1
A GROUP FOR ADULTS WITH A LEARNING DISABILITY
ON KEEPING SAFE IN THE LOCAL COMMUNITY
REPORT OF GROUP DESIGN, DEVELOPMENT AND
EVALUATION
70
A GROUP FOR ADULTS WITH A LEARNING DISABILITY ON KEEPING
SAFE IN THE LOCAL COMMUNITY
REPORT OF GROUP DESIGN. DEVELOPMENT AND EVALUATION
CONTENTS
1. FOCUS OF PROGRAMME OF SERVICE DESIGN AND DELIVERY
2. INTRODUCTION AND BACKGROUND INFORMATION
2.1 Case Study A
2.2 Case Study B
2.3 Case Study C
2.4 Case Study D
2.5 Case Study B
2.6 Information Obtained During Additional Research
2.7 Work with Children on Keeping Safe
2.8 Police Information
2.9 Crimes Committed Against People with a Learning Disability
2.10 Sexual Offences
3. KEEPING SAFE GROUP AIMS
71
4. PILOT GROUPS TO EVALUATE THE KEEPING SAFE PACK
4.1 Participants
5.2.1 Group 1
5:2.2 Group 2
5.2.3 Group 3
4.2 Procedure
4.3 Measures
5. RESULTS
5.1 Descriptive Statistics
5.1.1 Total Sample
5.1.2 By Gender
5.1.3 By Group
5.2 Gender Differences
5.3 Group Differences
5.4 Test of Knowledge Score Differences
6. DISCUSSION OF RESULTS
7. KEEPING SAFE GROUP FACILITATION PACK
8. SUMMARY AND CONCLUSIONS
9. REFERENCES

72
APPENDICES
APPENDIX ONE; Test of Knowledge Scores for all Participants
APPENDIX TWO: Revised Test of Knowledge
APPENDIX THREE: Keeping Safe Pack (excluding session materials)
73
TABLES
Table One; Experience of Threatening or Bullying Behaviour from Others
Table Two: Participant Characteristics
Table Three: Areas of Knowledge Assessed by the Test
Table Four: Keeping Safe Pilot Group Format (15 Sessions)
Table Five: Mean Age and IQ Scores for Total Sample (N=l 8)
Table Six: Median Test of Knowledge Scores for Total Sample (N=18)
Table Seven: Mean Age and IQ Scores for Men and Women
Table Eight: Median Test of Knowledge Scores for Men and Women
Table Nine: Mean Age and IQ Scores for Groups One, Two and Three
Table Ten: Median Test of Knowledge Scores for Groups One, Two and Three
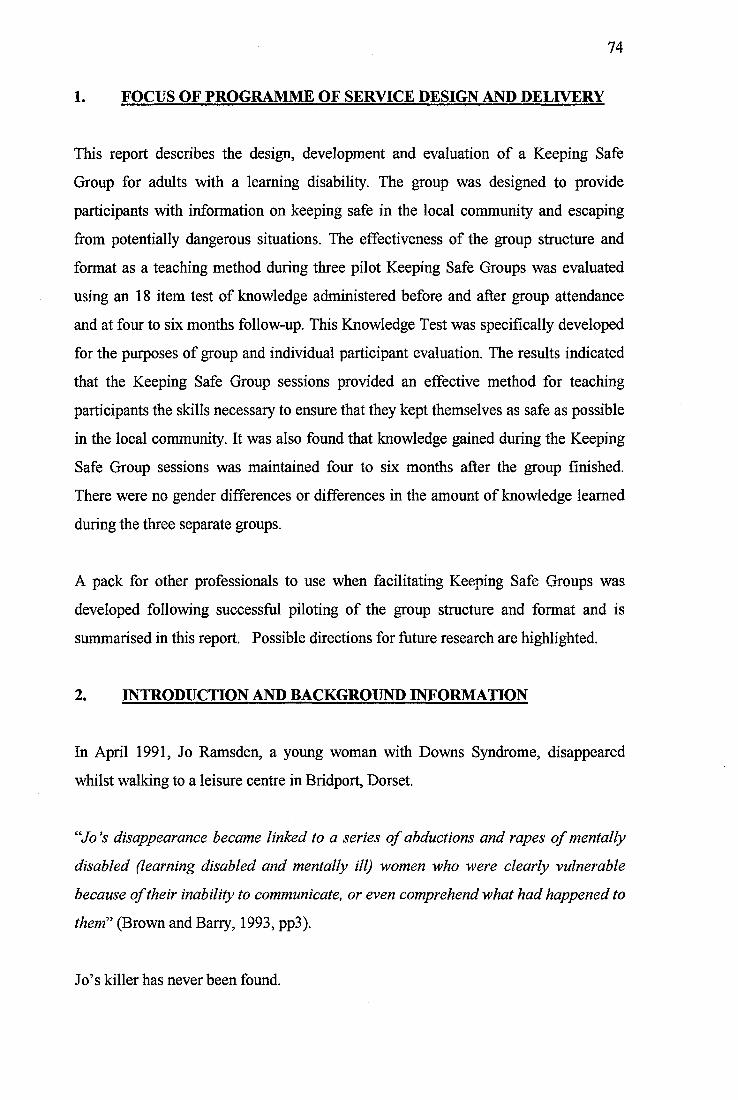
74
1. FOCUS OF PROGRAMME OF SERVICE DESIGN AND DELIVERY
This report describes the design, development and evaluation of a Keeping Safe
Group for adults with a learning disability. The group was designed to provide
participants with information on keeping safe in the local community and escaping
from potentially dangerous situations. The effectiveness of the group structure and
format as a teaching method during three pilot Keeping Safe Groups was evaluated
using an 18 item test of knowledge administered before and after group attendance
and at four to six months follow-up. This Knowledge Test was specifically developed
for the purposes of group and individual participant evaluation. The results indicated
that the Keeping Safe Group sessions provided an effective method for teaching
participants the skills necessary to ensure that they kept themselves as safe as possible
in the local community. It was also found that knowledge gained during the Keeping
Safe Group sessions was maintained four to six months after the group finished.
There were no gender differences or differences in the amount of knowledge learned
during the three separate groups.
A pack for other professionals to use when facilitating Keeping Safe Groups was
developed following successful piloting of the group structure and format and is
summarised in this report. Possible directions for future research are highlighted.
2. INTRODUCTION AND BACKGROUND INFORMATION
In April 1991, Jo Ramsden, a young woman with Downs Syndrome, disappeared
whilst walking to a leisure centre in Bridport, Dorset.
“To’s disappearance became linked to a series of abductions and rapes of mentally
disabled (learning disabled and mentally ill) women who were clearly vulnerable
because of their inability to communicate, or even comprehend what had happened to
them'' (Brown and Barry, 1993, pp3).
Jo’s killer has never been found.
75
Many people with a learning disability are exercising greater freedom to use local
community facilities independently. This greater community presence brings with it
increased risks from dangerous strangers. People with a learning disability may not
possess, or be able to use successfully the skills, self-confidence and assertion
required to ensure that they make themselves as safe as possible and escape from
dangerous situations should they occur. Jo Ramsden’s murder brought into sharp
focus the importance of teaching these personal safety skills to adults with a learning
disability. Surprisingly, there has been very little research carried out into personal
safety strategies for adults with a learning disability, whilst considerable attention has
been paid to developing educative packages for children to equip them with the skills
needed to be able to identify dangerous situations and learn how to cope with these
situations (Elliott, Kidscape, 1984).
After reviewing the literature, contacting several primary schools and liaising with the
local police force, it was concluded that satisfactory, relevant and age appropriate
teaching programmes could not be found. It was decided to design, pilot and evaluate
a programme aimed specifically at adults with a learning disability, named the
Keeping Safe Group. The current report describes the process of design, deliveiy and
evaluation of this group.
It was also decided that the development and evaluation of the Keeping Safe Pack for
adults with a learning disability was important following several incidents involving
clients living within the suburban NHS Trust catchment area. The following case
vignettes describe incidents or behaviour patterns leading to the referral of several
clients to the clinical psychology service for adults with learning disabilities during
1994, 1995 and 1996. All clients presented below were subsequently included in one
of the three pilot Keeping Safe Groups.
2.1 Case Study A
A female client, aged 46 years at the time of the referral, lived in a large social
services residential placement. She enjoyed walking alone beside a local river during
76
the day or early evening. She was a very sociable and quite isolated woman whose
main motivation for walking beside the river was to speak to the people she met and
to talk to dog owners about their pets. This client was thought to be very vulnerable
and was reluctant to modify her behaviour depending upon the time of day. She was
reported to have little understanding of the differences between strangers,
acquaintances and friends and tended to greet all those she met very warmly and to
enquire about their names, family and lives in some detail.
2.2 Case Study B
Another female client, aged 47 years at the time of referral, lived in the same social
services residential placement as the previous client. She enjoyed going to local pubs
with her friends and was known to frequently accept drinks from strangers or
acquaintances in pubs. Of even more concern to residential care staff was the fact that
she had also accepted a lift from a stranger on several occasions and was reported to
believe that she was safe with strangers or acquaintances she met in the local pub
because it was somewhere she visited often and because she knew the bar staff.
2.3 Case Study C
A male client, aged 46 years at the time of referral, who lived on his own and worked
part-time with support. He was fairly isolated and tended to welcome all visitors into
his home. He was unaware of the need to check visitor identification. This client was
also reported to view everyone whose name he knew as his friend. This confusion had
frequently led him to discuss inappropriate topics with people he really knew very
little.
2.4 Case Study D
A female client, aged 29 years at the time of referral to the Keeping Safe Group, also
lived independently, although she received considerable support from her family. This
client enjoyed cycling or walking around her local neighbourhood. She tended not to
77
modify her behaviour depending upon the time of day and was reported to be unaware
of the risks of walking alone, especially at night. This client was also very sociable
and wanted to make friends with everyone she met. She too had difficulty modifying
the topic of her conversation depending upon the person she was speaking to.
2.5 Case Study E
Another female client, aged 34 years at the time of referral, tended to overgeneralise
her concerns about going out into the local community. Despite being very able, she
was extremely reluctant to go out on her own, or in a group, without staff. This client
was reported to perceive threat and danger even in relatively safe situations. She was
unable to identify when her fears started, and felt that she had always been afraid. She
also attributed some of her fears to seeing distressing and frightening reports on the
television and to not knowing what to do in an emergency.
Two further clients known to the clinical psychology service for adults with a learning
disability had also been ‘mugged’ when out alone and had since become
understandably very fearful of going out into the local community either escorted or
alone.
2.6 Information Obtained During Additional Research
The research project entitled; The Life Experiences of Adults with a Learning
Disability: A Comparison Between Objective and Subjective Measures, submitted as
part of this PsychD portfolio (Portfolio Section 4.1) involved an audiotaped, semi
structured interview with 20 adults with a learning disability, none of whom were
involved in the Keeping Safe Groups. Part of the interview procedure involved asking
the participants about any incidents of bullying they had experienced, or any
experiences of being verbally or physically threatened or abused by members of their
local community or peer group.
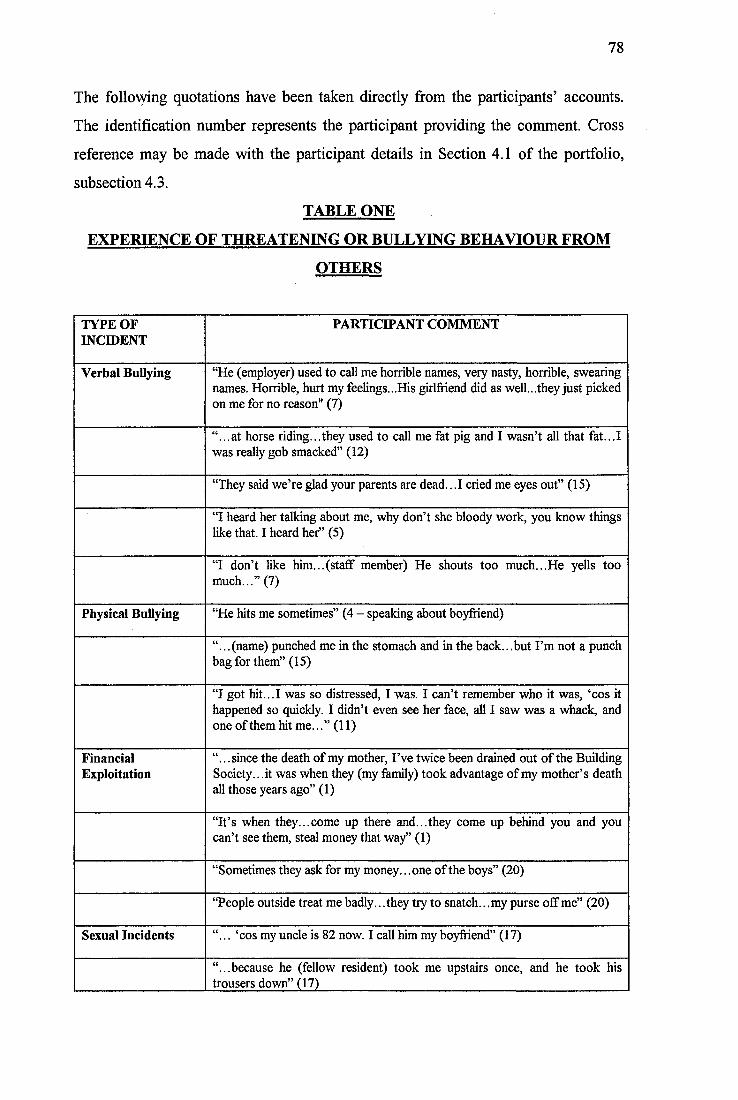
78
The following quotations have been taken directly from the participants’ accounts.
The identification number represents the participant providing the comment. Cross
reference may be made with the participant details in Section 4.1 of the portfolio,
subsection 4.3.
TABLE ONE
EXPERIENCE OF THREATENING OR BULLYING BEHAVIOUR FROM
OTHERS
TYPE OF INCIDENT
PARTICIPANT COMMENT
Verbal Bullying “He (employer) used to call me horrible names, veiy nasty, horrible, swearing names. Horrible, hurt my feelings...His girlfriend did as well...they just picked on me for no reason" (7)
“...at horse riding...they used to call me fat pig and I wasn’t all that fat...I was really gob smacked” (12)
“They said we’re glad your parents are dead...I cried me eyes out” (15)
“I heard her talking about me, why don’t she bloody work, you know things like that. I heard her” (5)
“I don’t like him...(staff member) He shouts too much...He yells too much...” (7)
Physical Bullying “He hits me sometimes” (4 - speaking about boyfriend)
“...(name) punched me in the stomach and in the back.. .but I’m not a punch bag for them” (15)
“I got hit...I was so distressed, I was. I can’t remember who it was, ‘cos it happened so quickly. I didn’t even see her face, all I saw was a whack, and one of them hit me...” (11)
FinancialExploitation
“.. .since the death of my mother. I’ve twice been drained out of the Building Society. ..it was when they (my family) took advantage of my mother’s death all those years ago” (1)
“It’s when they...come up there and...they come up behind you and you can’t see them, steal money that way” (1)
“Sometimes they ask for my money.. .one of the boys” (20)
“People outside treat me badly.. .they try to snatch. ..my purse off me” (20)
Sexual Incidents “... ‘cos my uncle is 82 now. I call him my boyfriend” (17)
“...because he (fellow resident) took me upstairs once, and he took his trousers down” (17)
79
The case study examples, together with the additional individual comments from
adults with a learning disability, highlighted the fact that several people had
experienced a variety of unpleasant, frightening and, in some cases, seemingly
abusive incidents. Interestingly, but perhaps not surprisingly, none of the participants
had reported the incidents to the police and, in some cases, stated that they had not
told their families or carers. Additionally, the case studies indicated that individuals
with a learning disability may place themselves at risk by failing to take precautions
when in the community, by failing to modify their behaviour in different settings, or
by failing to report or to seek help when bullied, exploited or abused.
2.7 Work with Children on Keeping Safe
Kidscape is a campaign for children's safety and was founded in 1984 by Michele
Elliott to enable children to learn about personal safety. Kidscape involves liaison
with the police, teachers and parents. Issues covered during Kidscape courses and in
their literature include practical ways for children to cope with bullies, getting lost,
approaches by strangers or by known adults who may try to abuse them. The charity
provides teaching programmes, books for parents and children, videos, information
leaflets and posters. Kidscape developed the Keepsafe Code which aimed to teach
children;
To be safe
To say no
To cope with bullies
To tell
Not to keep secrets
To yell
To run away and get away
Not to talk to strangers
To have a code word or sign agreed with the child’s parents that will be a
signal in an emergency that the child can trust what they are being told.
80
Although useful, much of the information supplied, and work carried out by
Kidscape, was not relevant to adults with a learning disability and the teaching
materials could not be used due to the age inappropriateness of much of its content.
2.8 Police Information
The Metropolitan police have produced several information leaflets including the
following;
• A Guide to Protecting your Home against Crime
• A Streetwise Guide to Going Places
Safety on the street, trains, tubes, buses, coaches, taxis and on your own
• Who’s There? Be on Guard against Bogus Callers.
Again, whilst helpful, these leaflets were less useful for people with poor literacy
skills. Much of the information contained in the leaflets was found to be of limited
value to people living in group homes, or with the fairly restricted lifestyle of some
adults with a learning disability. The information was quite difficult for clients to
understand and provided limited scope to discuss issues raised or to practise and
consolidate skills learned.
2.9 Crimes Committed against People with a Learning Disability
The review of the literature revealed little information on the incidence of different
types of crimes against people with a learning disability, however, two important
studies have been carried out.
Wilson and Brewer (1992) demonstrated that people with a learning disability have a
significantly greater risk of ^criminal victimization' than those without a learning
disability and of a similar age. This study revealed that overall people with a learning
disability were twice as likely to be the victims of assault, sexual assault, robbery and
thefl (crimes against the person) and one and a half times as likely to be the victims of
breaking and entering and household property theft (property crimes). Those who
81
lived in more highly supervised and supported environments (the more severely
learning disabled) had significantly lower rates of property crimes committed against
them, but the rates of crimes against the person were significantly higher in this
group. Wilson and Brewer suggested that these results reflected the greater
environmental and property protection provided within residential organisations.
Several theories of criminal victimisation risk factors have been suggested. Those in
specific societal groups may be more at risk (poorer people, those living in urban
areas, homeless people and young males; Laub, 1990). However, this did not seem to
provide the full explanation as attention has now turned to the victim and aspects of
his/her behaviour which impact on the likelihood of a crime being committed against
him/her. Sparks (1982, pp7-12) highlighted six mechanisms to describe this
elationship;
Precipitation. The individual provokes the perpetrator in some way (e.g. by
word or action)
Facilitation. The behaviour of the victim expedites the crime
Vulnerability. Aspects of the individual’s behaviour or personal attributes (e.g.
friendliness or trust) place them at greater risk
Opportunity. The victim fails to recognise a risk situation
Attractiveness. The victim is particularly attractive to the perpetrator for some
reason
• Impunity. The victim’s behaviour ensures that the perpetrator is unlikely to be
prosecuted.
These six factors were thought to be inter-related. People with a learning disability
were stated to experience increased risk along the six dimensions due to their poor
social and intellectual functioning (Wilson, Seaman and Nettlebeck, 1990).
Wilson et al. (1990) carried out a study to explore whether the heightened risk of
criminal exploitation was due, at least in part, to the behavioural characteristics of
learning disabled people. They compared those with a learning disability who had and
had not been the victim of crime (total N=40). They controlled for IQ, age, and
adaptive behaviour functioning, and administered a verbal questionnaire (Test of
82
Interpersonal Competence and Personal Vulnerability; TICPV) developed by the
authors for the purpose of the study. As the authors had hypothesised, they found
poorer interpersonal competence among those who had been the victims of crime than
those who had not. These results suggested that the victims had difficulty deciding on
the appropriate action to take in specific interpersonal situations. Of the 20
participants who had been the victim of a crime 13 had experienced a personal crime,
five a property crime and two both categories of crime.
These studies have suggested that it is important to teach adults with a learning
disability how to recognise situations within which they are more at risk and to leam
simple behaviours or rules to follow when out to minimise risk. These teaching
sessions should be carried out both because of the increased risk of criminal
exploitation of people with a learning disability as a population group and the greater
risk for those who have poorer interpersonal competence and difficulty identifying
appropriate behaviour. The current pilot Keeping Safe Groups targeted those who
were reported to have acted dangerously or unwisely before and those who had
previously been the victim of a crime (mugging). Additionally, Kempton and Gochros
(1986) stated that people with a learning disability were more likely to be trusting of
strangers than those without a learning disability and may be unable to discriminate
appropriate from inappropriate behaviour, were more likely to comply with the
requests of others, more unlikely to be able to defend themselves and less likely to
report any crime.
Walmsley (1989, pp5) described the vulnerability of people with a learning disability
in terms of their increased dependence upon others and their increased acquiescence;
^ With that comes the need to behave in an accommodating way, so people with
mental handicaps (learning disability) tend to 'obey' rather than challenge their care
givers. They tend also to have less choice and frequently have not been educated to
believe that they have control over what happens to them".
83
2.10 Sexual Offences
Women with a learning disability are more at risk of sexual abuse than their non
disabled counterparts (Kempton and Gochros, 1986). Brown, Stein and Turk (1995)
carried out a large study of the UK incidence of sexual abuse of adults with a learning
disability. This study took the form of a two year retrospective study and was a
follow-up to a similar study carried out by Brown and Turk (1994). The results, which
indicated clearly the risks to people with a learning disability are summarised briefly
below.
Brown et al. found that perpetrators came from four main groups (staff and
volunteers, family members, trusted adults within the community and other people
with a learning disability). It is clearly important that people with a learning disability
have the skills to ensure that they are able to protect themselves from assault by all of
these groups. Among the trusted community members were family friends,
neighbours and tradesmen. 96% of perpetrators were male, 81% known to the
victims, 13% with minimal contact and 2% were unknown to their victims.
52% of those abused were women and 48% men. The mean age of the victim was 29
years and 51% of victims were aged between 20 and 30 years of age. Thus, it is
important to target teaching to people under this age, probably by ensuring that
Keeping Safe strategies are taught in schools to children with a learning disability,
using a modified version of the Kidscape Keepsafe Code (Elliott, 1984). However, the
needs of older people with a learning disability who are unlikely to have received this
information in schools must not be forgotten. In approximately 50% of cases the
sexual abuse was of long standing duration rather than a single assault.
The severity of the victim’s learning disability was also important as 61% of cases
had a moderate to severe learning disability and 60% had additional problems such as
challenging behaviour (38%), communication problems (31%), or sensory disabilities
(15%). The type of residential placement of the victim was found to be broadly
representative of the general housing pattern of people with a learning disability
84
living in the community (27% social services placement, 31% health authority and
42% private and voluntary agencies).
57% of the abuse occurred in the victim’s own home, 14% in the day placement, 8 %
in the perpetrator’s home and 21% occurred in public places.
The results of this survey indicated that there were;
"... strong parallels between the sexual abuse of adults with a learning disability and
that of children, although the legal and service context is very different" (Brown et
al., 1995, pp21).
Another important finding was that, whilst the survey provided evidence to support
the provision of Keeping Safe strategies in schools for children with a learning
disability and service wide strategies to protect these vulnerable people from assault
by those they knew, there were also veiy real dangers from those the clients knew
very little, or not at all, in the community. With learning disabled people exercising
greater freedom to participate as community members there may be significant areas
of the individuals life which cannot be protected or safeguarded by the service or
organisations which provide day, residential and health care sen/ices to this client
group. Everyone needs to exercise simple strategies to maximise safety when in the
community, adults and children with a learning disability are no exception.
Brown et al. (1995) also found that in only 14% of cases of assault or abuse the
perpetrator was prosecuted or disciplined. None of the research participants who
provided first hand accounts of incidents they had encountered in the current author’s
research had reported these to the police and many had not told family members or
trusted staff (section 2.6).
2.10 Group Work with People with a Learning Disability
Firth and Firth (1982, ppl38) stated that;
"... it is increasingly realised that it is not sufficient to teach mentally handicapped
(learning disabled) people how to wash and dress themselves, and how to cook and
85
clean, in order to help them be as independent as possible and accepted by the rest of
society...
Considerable work with people with a learning disability is now being carried out
within a group structure. As the Keeping Safe Pack reviewed in the current report
used a group format, some discussion of group work with people with a learning
disability is warranted.
A group is;
"... not Just a place, an arena in which help is providedfor one individual, for another
individual, and another, and another, whether simultaneously or one at a time.
Rather a group is a vehicle which collectively moves the individuals concerned".
(Bell, 1995, pp22).
Group work with people with a learning disability has included social skills training
(Lindsay, 1986; Muir, 1989), long term psychotherapy for interpersonal and sexual
relationships (McGoveran, 1990), advocacy (Bell, 1995) and group classroom
sessions with children with all degrees of learning disability (Chia, 1995; Benz and
Todd, 1990).
In 1990, Walmsley carried out a small study of the role of group work in research
with people with a learning disability (N=5). He used a group structure to explore the
meaning of ‘adulthood’. Walmsley suggested the following stages in group work with
people with a learning disability;
• To discuss with the participants ways in which the findings can be shared
more widely by inviting people to a meeting, in writing, or by collaboration of
findings.
• To video the group discussions, which presents the possibility of playing back
excerpts to assist people in identifying the group processes and to give them
the opportunity to correct interpretation either as individuals or in groups.
• To build into the group sessions the opportunity for people to present to one
another what they have themselves discovered, and achieved, through taking
part in such research.
86
All of these stages have been built into the Keeping Safe Group structure.
Salmon and Abell (1996) used the techniques of dramatherapy and role-play in group
work with people with a learning disability. He emphasised their importance as they
encouraged participation by all group members and facilitated the development of
self-expression. Brudenell (1987) also reported that through development of role-play,
games and improvisation, new and old encounters were experienced and rehearsed,
and lessons learned.
Salmon and Abell’s study used these techniques to set up a group for people with a
learning disability who were experiencing change in their lives (e.g. a move from an
institutional to a community setting) to share experiences. This group represented a
departure from the usual behavioural or social skills training groups typically used
with this client group (Matson, 1984). They excluded participants who were likely to
disrupt the group on a regular basis (e.g. those who had challenging behaviour) and
those who had communication difficulties of such a degree that they were likely to
make participation difficult. The most valuable aspects of this group were reported by
the authors to be the role-play exercises and the opportunities for socialising. The
role-play required the ability to ‘pretend’ and to use imagination. The use of these
techniques was believed to allow those who were able, to think in the abstract and to
problem solve, whilst still allowing those who functioned on a more concrete level to
participate. Thus, participation by all members was facilitated, despite their differing
abilities. This study involved moderately learning disabled adults.
Although, the majority of the participants in the Salmon and Abell study were more
disabled than the participants of the Keeping Safe Groups, the emphasis on role-play,
immediate feedback and group discussion, including sharing of experiences, was felt
to be important and formed a significant part of the Keeping Safe Group session
formats devised.
Salmon and Abell also provided comments on how to facilitate and develop self-
expression and new learning within a group framework, these are summarised below;
87
• Use language likely to be understood by all and avoid the use of abstract
concepts
• When role-playing situations, the pretence must be made obvious and all
group members ‘de-roled’ thoroughly
• Role-playing should be restricted to the acting out of situations with members
acting as themselves
• When role-playing ‘emotionally charged’ situations, these roles should be
taken by the group facilitators.
Again, all these factors have been included in the Keeping Safe Group structure.
Bell (1995, pp22) also supported the use of groups as he stated that;
'Groups give a sense of belonging and 'being in the same boat' which can be
reassuring for group members".
Other advantages of group work have been reported to be the fact that participants
may be taught to function more appropriately in less restrictive environments (Fink
and Sandall, 1980). Groups also allow for more appropriate interactions with peers
(Alberto, Jobes, Sizemore and Doran, 1980) and participants may leam additional
information from observing other members of the group (observational learning).
Group work is also an effective way of using limited resources and allows more
people to receive input. It may also provide a means of training inexperienced
therapists (McGoveran, 1990). Groups tend to encourage the sharing of experiences,
exploration and exchange of ideas, enhancement of communication and enables
participants to achieve change themselves (Tann, 1981; Cole, 1989).
It is, however, important to emphasise a note of caution at this stage. Firstly, it is
important that the group should usually comprise roughly equal numbers of men and
women unless the subject matter and group orientation dictate single sex membership
(Sines and Moore, 1986). Secondly, the efficacy of group work is only recently being
consistently established. Recent research seems to indicate that, at least in a
classroom situation, group work is as effective as one to one teaching (Benz and
88
Todd, 1990). However, for groups with adults, although many advantages of group
situations have been suggested, little work has been carried out to assess its
effectiveness when compared to other treatment conditions. Group work has also
rarely been used with more severely disabled participants (Chia, 1995) and the
current service development did not represent a departure from this trend.
Finally, generalisability and maintenance effects have also been poorly documented
(Castles and Glass, 1986). In this respect, the current Keeping Safe Group pilot study
aimed to provide some generalisability and maintenance data.
3. KEEPING SAFE GROUP AIMS
Following the referral to the clinical psychology service of a number of clients with a
similar profile of difficulty in the local community, indicating poor knowledge about
how to ensure personal safety and to assess any risks that may occur, it was decided to
address the referral problems on a broader scale rather than working individually with
each client. It was hypothesised that the clients may benefit from discussion with,
and learning from, their peers. Questioning of local multidisciplinary communit}
teams for adults with a learning disability, as well as contact with local residential and
day placements, resulted in the referral of a total of 22 people within a short period of
time (September 1994 to December 1996) whom it was felt, would all benefit from
learning more about personal safety issues. 18 of these individuals were subsequently
included in the pilot Keeping Safe Groups.
It was also believed that the adaptation, development, evaluation and standardisation
of a group to teach adults with a learning disability how to keep themselves safe in the
local community would be a valuable addition to the assessment, treatment and
intervention programmes offered by the clinical psychology service.
The aim of the Keeping Safe Group was not to solely focus upon sexual assault by
either a known or an unknown person or upon the steps people with a learning
disability should take to minimise the risk of being the victim of a crime. There are
89
already several group and staff facilitation/information packs that adequately cover
these topics (e.g. Sex and Staff Training, McCarthy, M., & Thompson, D C.; Sexual
Abuse of Adults with Learning Disabilities, Stein, J., & Brown, H.; ‘Need To Know
Series’ - Towards Safer Commissioning, Brown, H.; - Towards Better Interviewing,
Brown, H., Egan-Sage, E., Barry, G., & McKay, C.; - Towards Better Safeguards,
Brown, H., Brammer, A., Craft, A., & McKay, C.; Cracking Crime, Gyde, K., Henry,
L., & Williams, C.; No Means No, Walsall Women’s Group). The group was intended
instead to focus on the broader area of personal safety awareness, especially as it
pertained to accessing local community facilities. It was also hoped that issues taught
during the Keeping Safe Group would be expanded upon as appropriate for each
individual during group follow-up. It was not intended that the Keeping Safe Group
would function as a replacement for the vital work around helping people with a
learning disability ensure that they are safe from exploitation or abuse by those known
to them. Instead, the Keeping Safe Group was seen as an additional, important
supplement to the range and variety of self-protection and enabling services offered to
people with a learning disability.
By the end of the group it was intended that each group participant would know that
s/he should do the following:
• Ignore and walk away from people who tease or talk inappropriately to
him/her
• Refuse to go anywhere with someone s/he does not know
• Refuse to get into a car with someone s/he does not know
• Refuse offers of gifts and goods from someone s/he does not know
• Follow simple procedures to avoid putting him/herself at risk, such as:
- sticking to main roads
- sticking to well lit areas
- sticking to busy areas
- sticking to familiar routes
- walking briskly
- keeping money, keys and bags out of sight
• Refuse to go into a stranger's house

90
• Refuse to let strangers into the house without checking
• Follow simple procedures if s/he does find him/herself in a dangerous
situation, such as:
- go to nearest police station
- enter nearest shop
- approach a group of people
- make a lot of noise to attract attention
• Know that s/he does not have to keep secrets if it makes him/her feel
uncomfortable
• Know that certain parts of his/her body and other people's bodies are private
• Know that s/he can and should say ‘no’ if anyone touches him/her
inappropriately.
These aims were selected to cover the majority of risks faced by learning disabled
adults when accessing the local community and to cover many of the simple, every
day precautions that should be taken by all community members. The areas covered
also included those highlighted by staff and professionals involved with the
participants as of particular concern.
4. PILOT GROUPS TO EVALUATE THE KEEPING SAFE PACK
4,1 Participants
There were three groups of participants. 18 participants were included in the three
pilot groups, six in each group. Four further participants were referred but excluded
from the group for the following reasons:
• One participant refused to participate and stated that she was fully aware of
the potential hazards of independent community participation.
• Two participants did not possess adequate expressive and receptive verbal
communication skills to benefit from, and participate fully in, the group.
Neither of these clients used community facilities independently and so would
91
not have the opportunity to practise the techniques and skills learned during
the Keeping Safe Group in ‘real life’ situations.
• One participant was receiving long-term psychotherapy for past sexual abuse.
It was felt that Keeping Safe Group attendance may interfere with this
treatment. The participant's details were kept on file so that, at a more suitable
time. Keeping Safe Group participation may be offered.
Table Two (below) provides details of the Keeping Safe Pilot Group Participant
Characteristics.
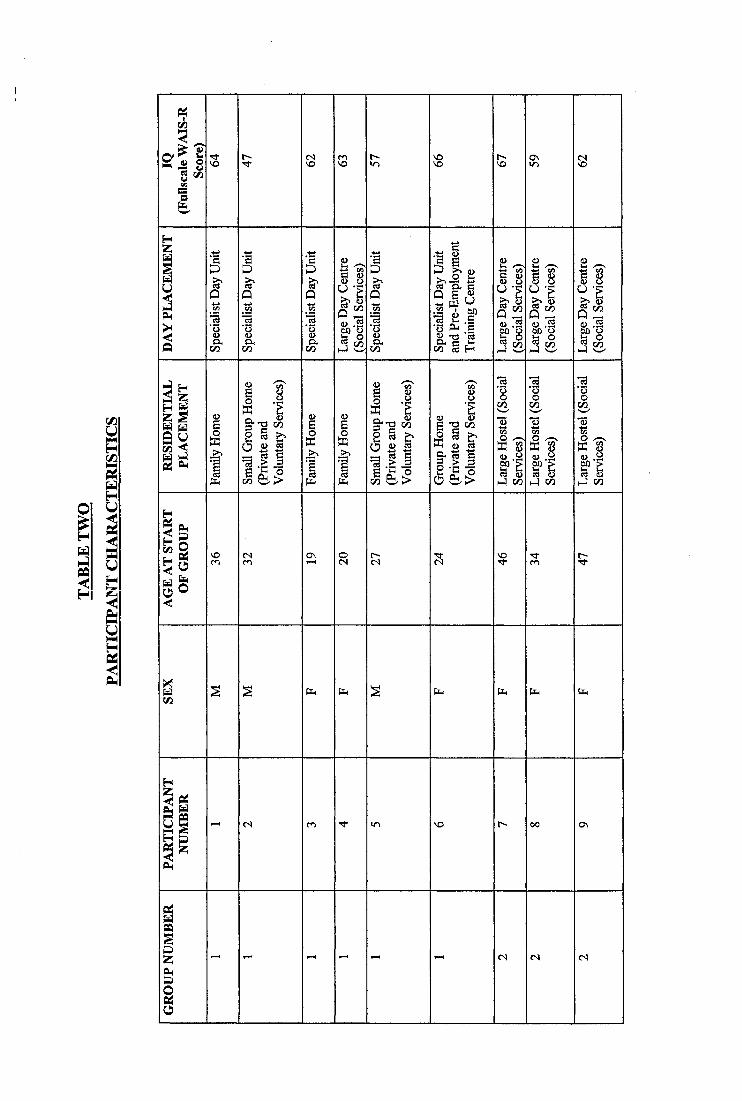
IVi
O'a «jI
Iw t^ -9
<uCOffi g ^Ü B 1
PL, I I I
I I
3I
I
I
o\
§ 8 Ü -5
I 'SCO
sI
Î
■g
l i
IIIÎÎÎ
I111 liÜ
PL,
VO
§ 8 U 'Sl lI I
I sI I
I-) CO
! l
us13 ■?I I
H-I CO
g
S |
III
ffi
I
PL,
ON
(S
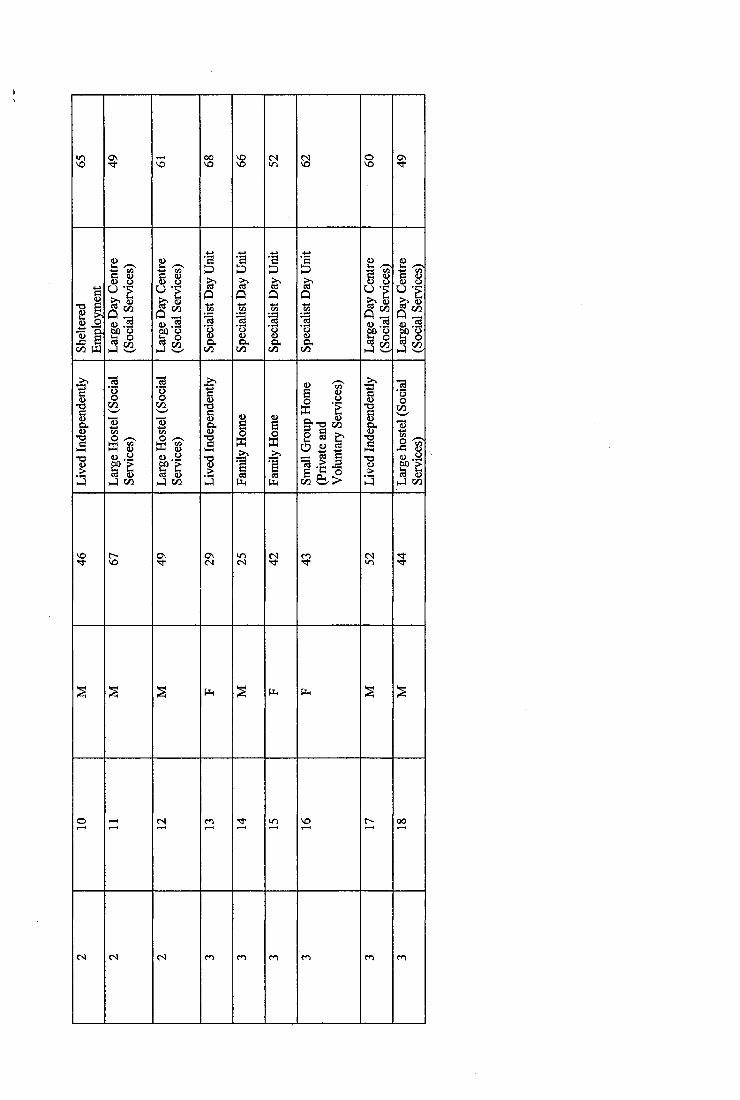
vS
§ g
II î l
vo
l î B
I
1 I
3I
I Ico5 ^
11
5|HII
I
IsI3 i"II
h4 c o
<s (S
II.I Ico
Ifî
I>>
IÇ )
I 3œ E
§ ■ ■g(L>
G O
aC Ü
e d a
1 1 1
II
Æ <ulf5 (Si J co
Ph P4
(S VO
94
All participants met the following criteria for inclusion;
• A mild to moderate learning disability (IQ between 40 to 70, American
Psychiatric Association, 1994)
• The opportunity to travel independently in the local community and to use
community facilities independently
• In addition some, but not all participants, had displayed behaviour which was
felt by others to place him/her at risk of exploitation or misinterpretation by
others.
• Possession of good verbal communication skills so that they would be able to
comprehend and contribute positively to the group.
• Absence of any challenging behaviours which might regularly impact on the
group running.
4.1.1 Group 1
Comprised six participants (3 men, 3 women) aged 19 to 36 years (mean age 26.;04
years, standard deviation 6;09, range 17;00). All had a mild to moderate degree of
learning disability (mean IQ 59.84, maximum 66.00, minimum 47.00, standard
deviation 6.97). They lived in the family home or in small community based
residential facilities. The participants attended a specialist day service for adults with
a learning disability and additional psychiatric, emotional or behavioural difficulties
or mainstream day services for adults with a learning disability.
4.1.2 Group 2
Comprised six participants (3 men, 3 women) aged 34 to 67 years (mean age 48;02
years, standard deviation 10;08, range 33). All had a mild to moderate degree of
learning disability (mean IQ 60.50, maximum 67.00, minimum 49.00, standard
deviation 6.32). Five participants lived in a large hostel for adults with a learning
disability and one lived independently in the community. The participants in this
group either attended mainstream day services for adults with a learning disability or
were employed within a supported work placement.
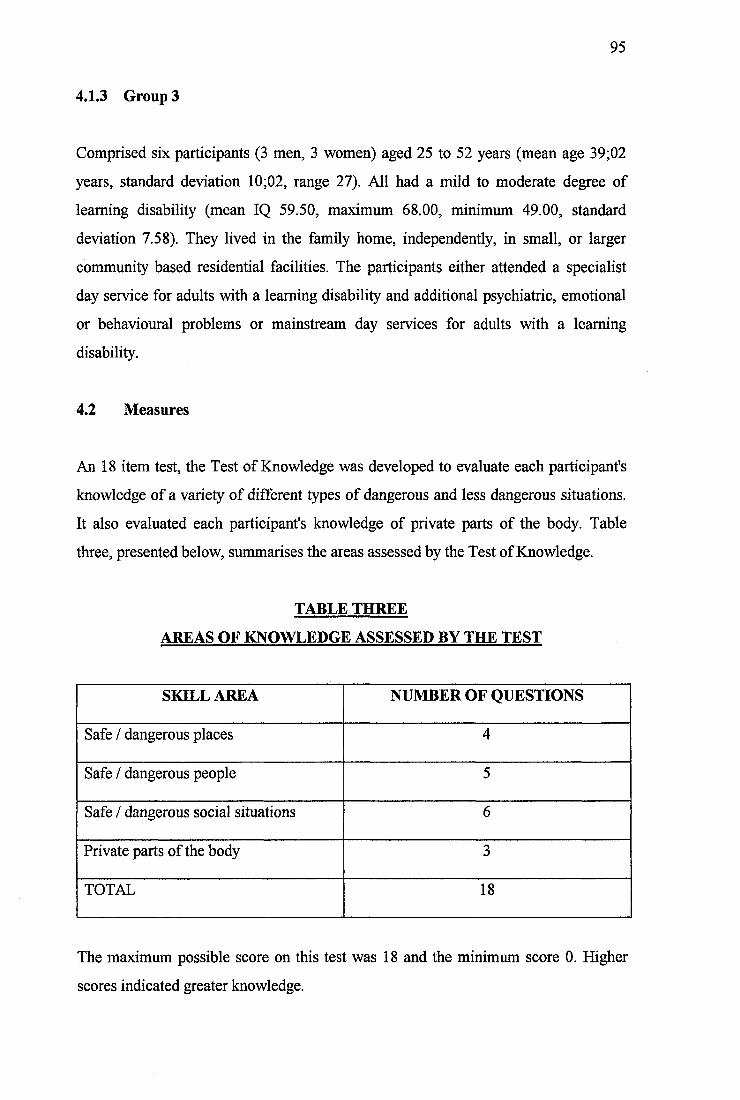
95
4.1.3 Group 3
Comprised six participants (3 men, 3 women) aged 25 to 52 years (mean age 39;02
years, standard deviation 10;02, range 27). All had a mild to moderate degree of
learning disability (mean IQ 59.50, maximum 68.00, minimum 49.00, standard
deviation 7.58). They lived in the family home, independently, in small, or larger
community based residential facilities. The participants either attended a specialist
day service for adults with a learning disability and additional psychiatric, emotional
or behavioural problems or mainstream day services for adults with a learning
disability.
4.2 Measures
An 18 item test, the Test of Knowledge was developed to evaluate each participant's
knowledge of a variety of different types of dangerous and less dangerous situations.
It also evaluated each participant's knowledge of private parts of the body. Table
three, presented below, summarises the areas assessed by the Test of Knowledge.
TABLE THREE
AREAS OF KNOWLEDGE ASSESSED BY THE TEST
SIOLLAREA NUMBER OF QUESTIONS
Safe / dangerous places 4
Safe / dangerous people 5
Safe / dangerous social situations 6
Private parts of the body 3
TOTAL 18
The maximum possible score on this test was 18 and the minimum score 0. Higher
scores indicated greater knowledge.
96
4.3 Procedure
Participants referred to the Keeping Safe Group were visited by the report author and
the purpose of the group was explained to them. Participants were asked to consider
whether they would like to join the Keeping Safe Group. One week later they were
contacted again and asked whether they had decided to attend the group. One
participant withdrew at this stage as she did not wish to join the group.
The intellectual functioning of five participants was assessed (participants number
seven, eight, nine, 10, and 11) as either examination of case notes indicated that their
intellectual fimctioning had not previously been carried out, or they had not been
assessed for at least 10 years. All other participants had been assessed using the
Wechsler Adult Intelligence Scale - Revised Edition (WAIS-R, Wechsler, 1981) less
than five years prior to the start of the group.
A learning disability is diagnosed on the basis of the presence of significantly below
average (>2 standard deviations below the mean) intellectual functioning
accompanied by significant impairment of adaptive functioning (American
Psychiatric Association, 1994, pp39). The adaptive functioning of the participants was
not assessed as all participants were well known to one of two local community
multidisciplinary teams for adults with a learning disability and had been educated
within specialist school provision. Their diagnosis of was not under dispute, however,
the severity of their learning disability was important to establish group differences
and to explore the effectiveness of the Keeping Safe Group and the Test of
Knowledge administered.
In order to pilot the Keeping Safe Group format, three groups were carried out.
Participants in each group met weekly over 15 weeks. Each session lasted one hour.
Prior to the three pilot groups described in this service development report, a smaller
group was held for 4 participants who met weekly over five weeks. The results of this
group are not reported as it was found that five sessions were not sufficient to cover
the set topics in detail or to consolidate learning. This general group structure did.
97
however, form the foundation for the development of the expanded Keeping Safe
Pilot Groups.
Each group session covered set topics including:
• Who one can and cannot trust
• Differentiation of friends, relatives, strangers, staff and acquaintances
• Identification of situations where people are more at risk
• Identification of actions to take if anyone is trying to persuade the participant
to do something that s/he should not, or would not, like to do
• Identification of the kinds of touches the participant feels comfortable with
and from whom
• Identification of actions to take if anyone is tiying to touch the participant in a
way s/he does not like.
Each week a topic was discussed using games, role-play, photographs, video
feedback, personal experiences and drawings to promote learning. The exact content
of each session was flexible to allow for the specific needs, experiences and concerns
of the participants.
All groups were facilitated by the report author. Group 1 was also facilitated by two
special needs instructors. Group 2 by a social worker and a psychologist in clinical
training and Group 3 by a special needs instructor and a psychologist in clinical
training. All groups were of equal size, with three men and three women in each.
Table Four (below) summarises the format and content of the 15 Keeping Safe Group
sessions.
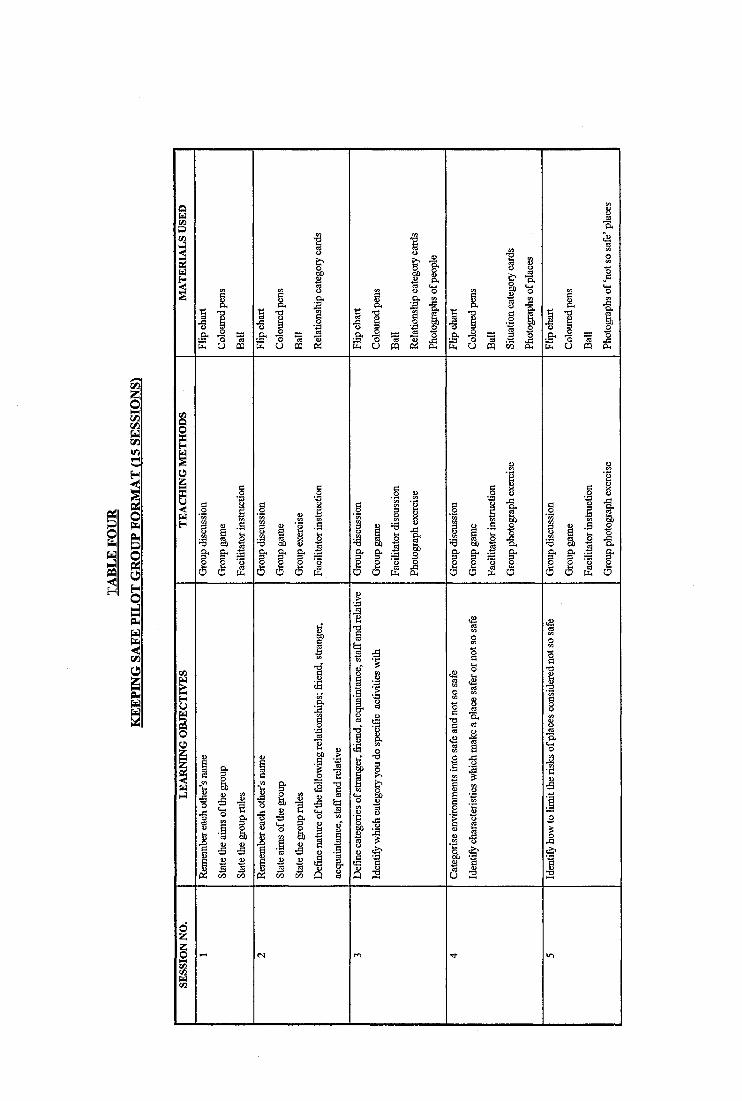
I1 /5
II
PQ
IÎ6 o
a
sail
-g 11 feb1•s ê &‘o8 1 J1 J feb2 g'cs rS 2§ a ëPi 1 1 a
II
m a a
1 I^ -a
c j m o 5 CQ
.2 «
2 - S•-e •â
i*6 6
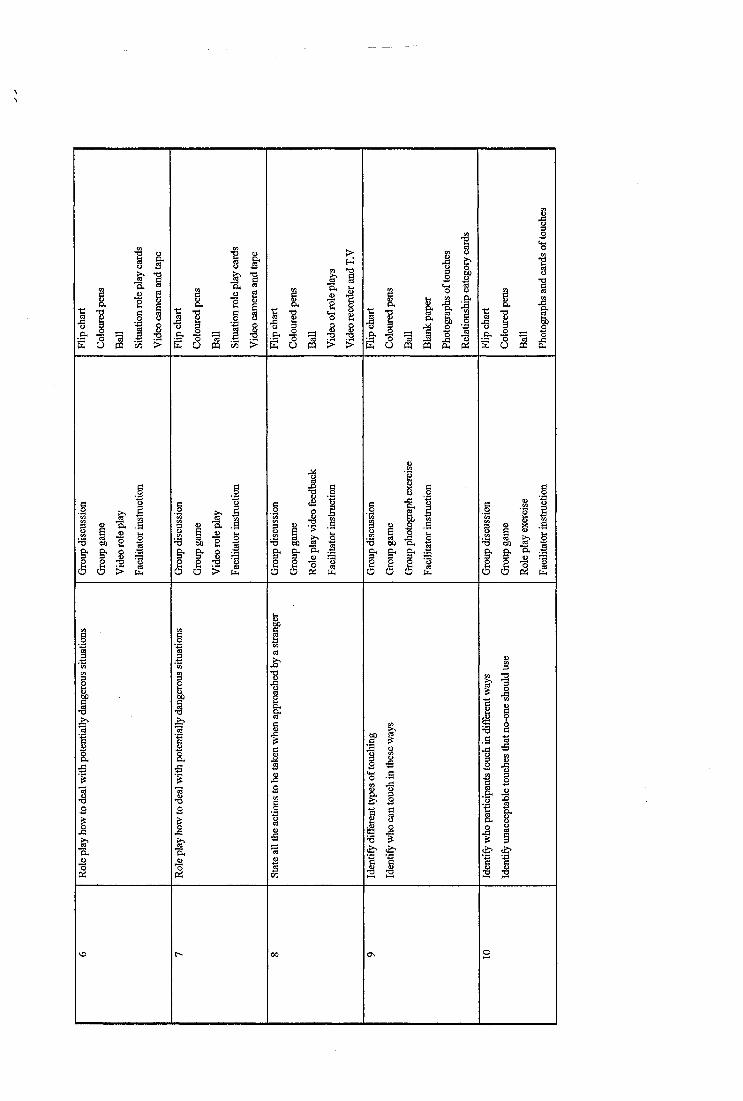
IIo _
PQ
tIIi !
ot o U PQ PQ
■S
Pi i l 1
1 1
. a-•B
4 1
I I cS a (§
. 22X go . 2
s I 10 g 1 . a
M 9 te’-3 W) ’E .
11 1 1a a a
I’B
IPi
t
{ ,
I t! î
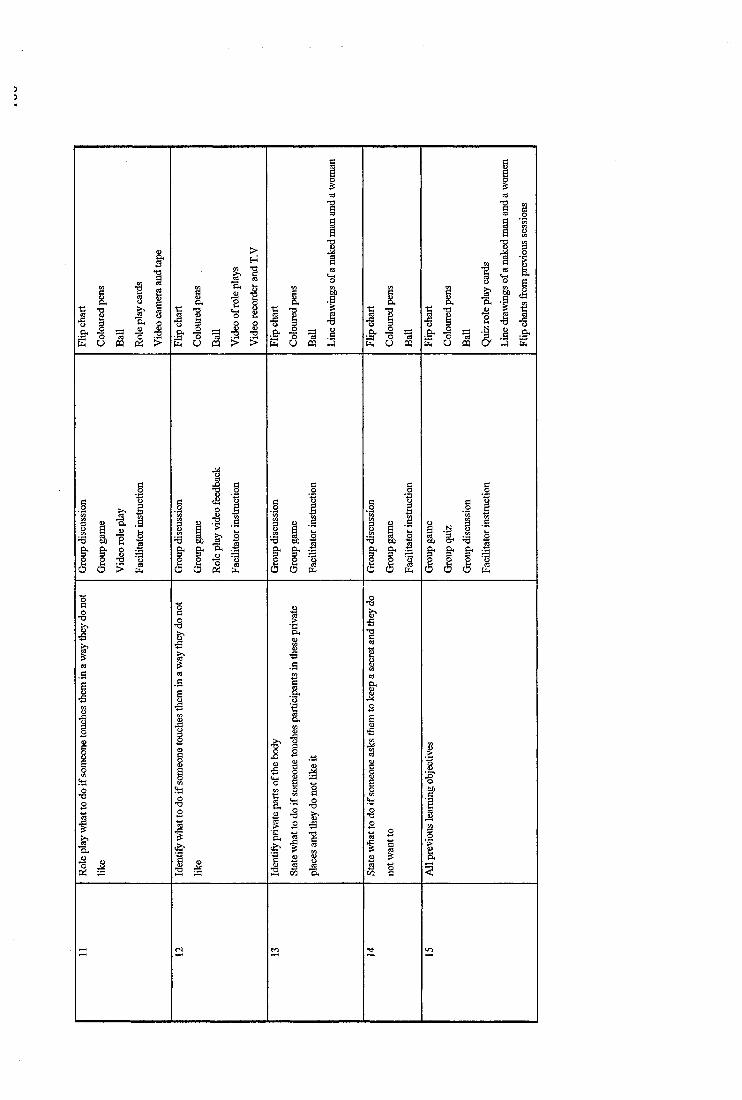
II .c3 m
s'1t i
1
1O h . 2
e O PQ
II kE O PQ U PQ
% 60
IÎI ^ & .1* B"
I I12 . a
a a pii a a Pl4 a a
iB. a
1
ÎÎ{ iI I I Ï
T)
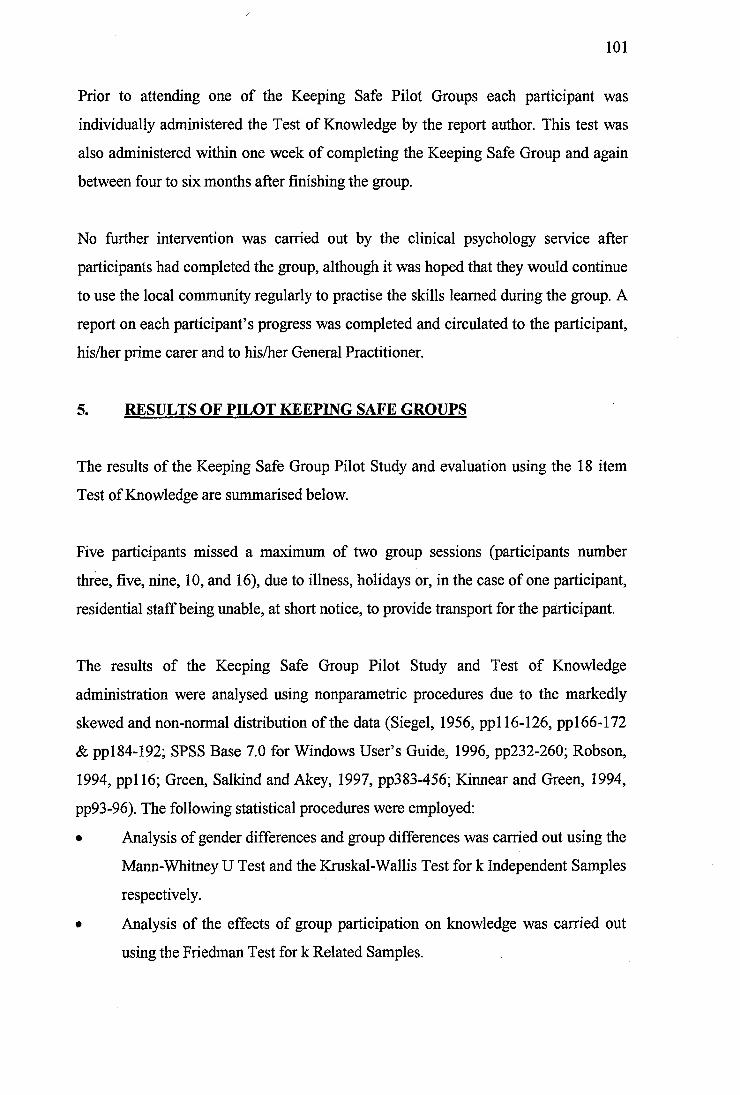
101
Prior to attending one of the Keeping Safe Pilot Groups each participant was
individually administered the Test of Knowledge by the report author. This test was
also administered within one week of completing the Keeping Safe Group and again
between four to six months after finishing the group.
No further intervention was carried out by the clinical psychology service after
participants had completed the group, although it was hoped that they would continue
to use the local community regularly to practise the skills learned during the group. A
report on each participant’s progress was completed and circulated to the participant,
his/her prime carer and to his/her General Practitioner.
5. RESULTS OF PILOT KEEPING SAFE GROUPS
The results of the Keeping Safe Group Pilot Study and evaluation using the 18 item
Test of Knowledge are summarised below.
Five participants missed a maximum of two group sessions (participants number
three, five, nine, 10, and 16), due to illness, holidays or, in the case of one participant,
residential staff being unable, at short notice, to provide transport for the participant.
The results of the Keeping Safe Group Pilot Study and Test of Knowledge
administration were analysed using nonparametric procedures due to the markedly
skewed and non-normal distribution of the data (Siegel, 1956, ppl 16-126, ppl66-172
& ppl84-192; SPSS Base 7.0 for Windows User’s Guide, 1996, pp232-260; Robson,
1994, ppl 16; Green, Salkind and Akey, 1997, pp383-456; Kinnear and Green, 1994,
pp93-96). The following statistical procedures were employed:
• Analysis of gender differences and group differences was carried out using the
Mann-Whitney U Test and the Kruskal-Wallis Test for k Independent Samples
respectively.
• Analysis of the effects of group participation on knowledge was carried out
using the Friedman Test for k Related Samples.
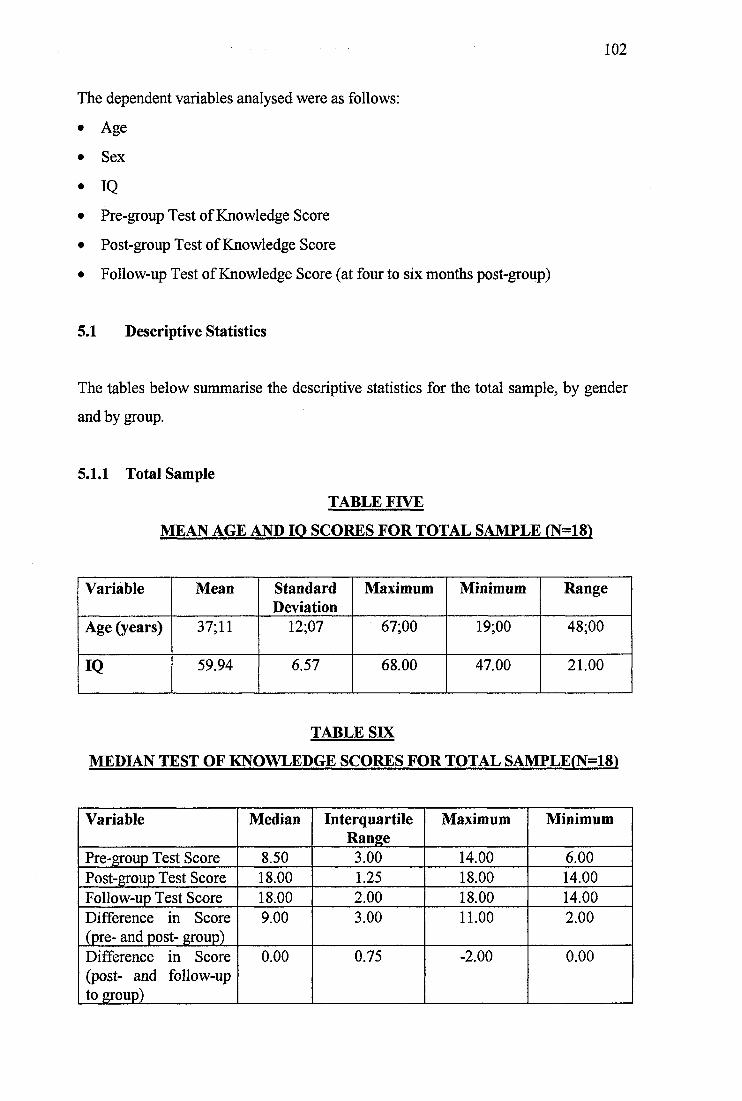
102
The dependent variables analysed were as follows:
• Age
• Sex
• IQ• Pre-group Test of Knowledge Score
• Post-group Test of Knowledge Score
• Follow-up Test of Knowledge Score (at four to six months post-group)
5.1 Descriptive Statistics
The tables below summarise the descriptive statistics for the total sample, by gender
and by group.
5.1.1 Total Sample
TABLE FIVE
MEAN AGE AND IQ SCORES FOR TOTAL SAMPLE rN=18)
Variable Mean StandardDeviation
Maximum Minimum Range
Age (years) 37; 11 12;07 67;00 19;00 48;00
IQ 59.94 6.57 68.00 47.00 21.00
TABLE SIX
MEDIAN TEST OF KNOWLEDGE SCORES FOR TOTAL SAMPLE(N=181
Variable Median InterquartileRange
Maximum Minimum
Pre-group Test Score 8.50 3.00 14.00 6.00Post-group Test Score 18.00 1.25 18.00 14.00Follow-up Test Score 18.00 2.00 18.00 14.00Difference in Score (pre- and post- group)
9.00 3.00 11.00 2.00
Difference in Score (post- and follow-up to group)
0.00 0.75 -2.00 0.00
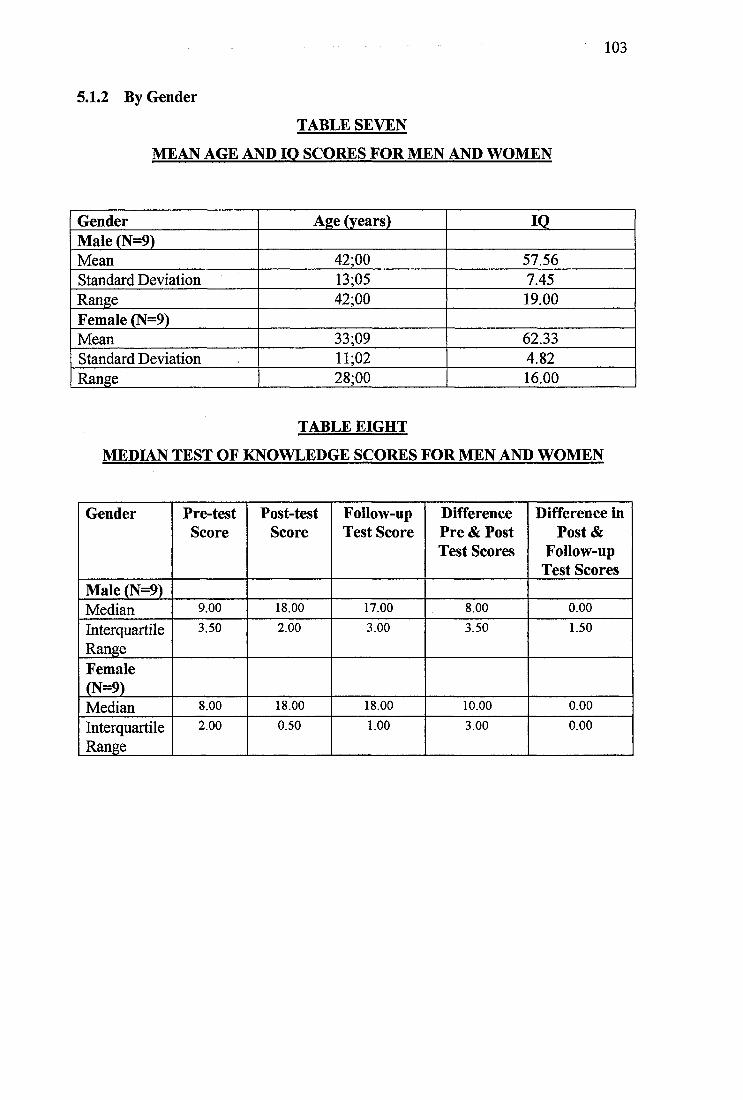
5.1.2 By Gender
TABLE SEVEN
MEAN AGE AND IQ SCORES FOR MEN AND WOMEN
103
Gender Age (years) 10Male (N=9)Mean 42;00 57.56Standard Deviation 13;05 7.45Range 42;00 19.00Female (N=9)Mean 33;09 62.33Standard Deviation 11;02 4.82Range 28;00 16.00
TABLE EIGHT
MEDIAN TEST OF KNOWLEDGE SCORES FOR MEN AND WOMEN
Gender Pre-testScore
Post-testScore
Follow-up Test Score
Difference Pre & Post Test Scores
Difference in Post &
Follow-up Test Scores
Male (N=9)Median 9.00 18.00 17.00 8.00 0.00
InterquartileRange
3.50 2.00 3.00 3.50 1.50
Female(N=9)Median 8.00 18.00 18.00 10.00 0.00
InterquartileRange
2.00 0.50 1.00 3.00 0.00
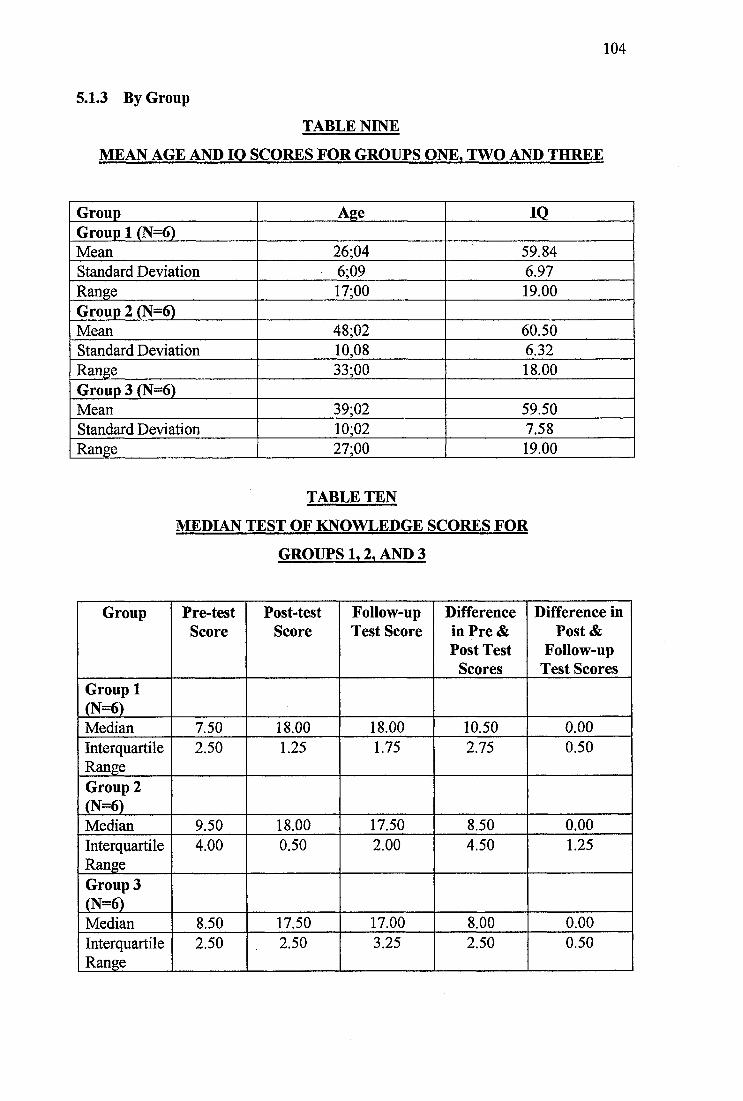
104
5.1,3 By Group
TABLE NINE
MEAN AGE AND IQ SCORES FOR GROUPS ONE. TWO AND THREE
Group Age 10Group 1 (N=6)Mean 26;04 59.84Standard Deviation 6;09 6.97Range 17;00 19.00Group 2 (N=6)Mean 48;02 60.50Standard Deviation 10,08 6.32Range 33;00 18.00Group 3 (N=6)Mean 39;02 59.50Standard Deviation 10;02 7.58Range 27;00 19.00
TABLE TEN
MEDIAN TEST OF KNOWLEDGE SCORES FOR
GROUPS 1.2. AND 3
Group Pre-testScore
Post-testScore
Follow-up Test Score
Difference in Pre & Post Test
Scores
Difference in Post &
Follow-up Test Scores
Group 1 (N=6)Median 7.50 18.00 18.00 10.50 0.00InterquartileRange
2.50 1.25 1.75 2.75 0.50
Group 2 (N=6)Median 9.50 18.00 17.50 8.50 0.00InterquartileRange
4.00 0.50 2.00 4.50 1.25
Group 3 (N=6)Median 8.50 17.50 17.00 8.00 0.00InterquartileRange
2.50 . 2.50 3.25 2.50 0.50
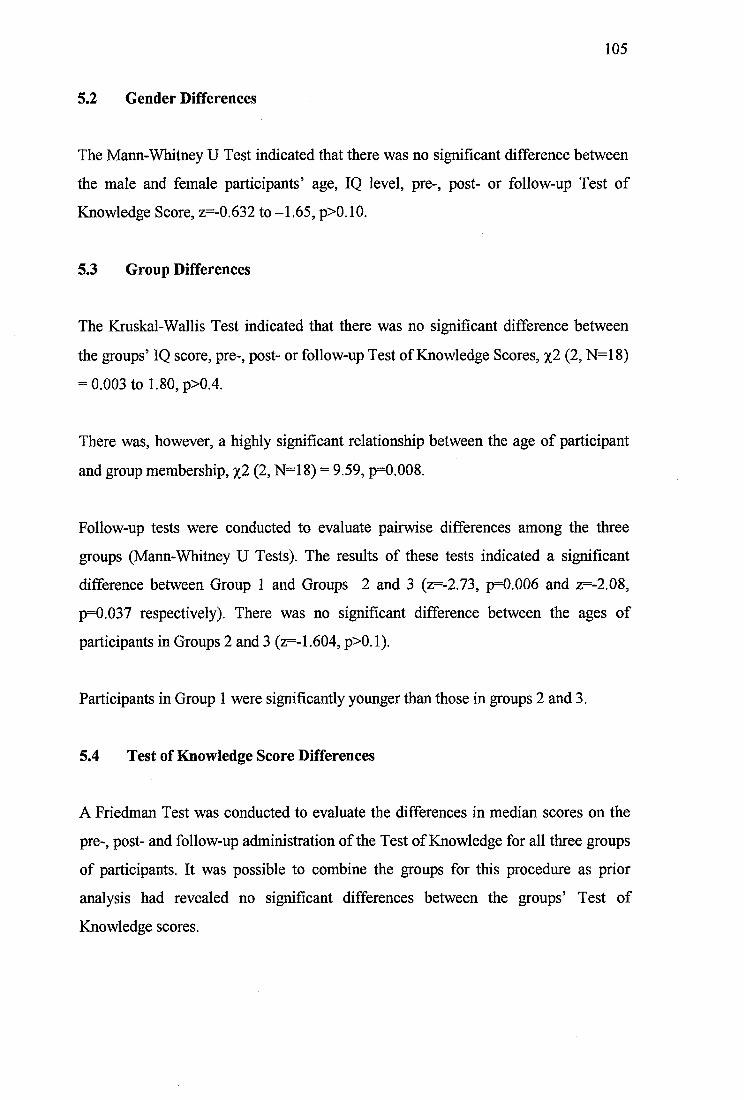
105
5.2 Gender Differences
The Mann-Whitney U Test indicated that there was no significant difference between
the male and female participants’ age, IQ level, pre-, post- or follow-up Test of
Knowledge Score, z=-0.632 to -1.65, p>0.10.
5.3 Group Differences
The Kruskal-Wallis Test indicated that there was no significant difference between
the groups’ IQ score, pre-, post- or follow-up Test of Knowledge Scores, %2 (2, N=18)
= 0.003 to 1.80, p>0.4.
There was, however, a highly significant relationship between the age of participant
and group membership, %2 (2, N=18) = 9.59, p=0.008.
Follow-up tests were conducted to evaluate pairwise differences among the three
groups (Mann-Whitney U Tests). The results of these tests indicated a significant
difference between Group 1 and Groups 2 and 3 (z=-2.73, p=0.006 and z=-2.08,
p=0.037 respectively). There was no significant difference between the ages of
participants in Groups 2 and 3 (z=-1.604, p>0.1).
Participants in Group 1 were significantly younger than those in groups 2 and 3.
5.4 Test of Knowledge Score Differences
A Friedman Test was conducted to evaluate the differences in median scores on the
pre-, post- and follow-up administration of the Test of Knowledge for all three groups
of participants. It was possible to combine the groups for this procedure as prior
analysis had revealed no significant differences between the groups’ Test of
Knowledge scores.
106
The Friedman Test produced a significant result, indicating a very strong difference
between the Test of Knowledge Scores, %2 (2, N=18) = 34,07, p<0.001. The
Kendall’s W Coefficient of Concordance of 0.95 indicated a very strong difference
between the three administrations of the test.
Follow-up pairwise comparisons were conducted using the Wilcoxon Test. The
median Test of Knowledge Scores at post-test and follow-up assessment were
significantly greater than the pre-test scores, z=-3.74, p<0.001 in both instances. The
difference between post- and follow-up Test of Knowledge Scores was not significant
at the p< 0.05 level (z=-1.89, p=0.059).
6. DISCUSSION OF RESULTS OF PILOT KEEPING SAFE GROUPS
The results of the analysis of the three Keeping Safe Pilot Groups indicated that there
were no significant differences in the participants’ performance as measured by the
18 item Test of Knowledge. The three pilot groups differed with one respect. Group 1
participants were significantly younger than those in Groups 2 and 3. However, this
difference in median age between the groups did not lead to a difference in group
performance, as measured by the Test of Knowledge. The group was equally effective
for younger and older participants.
The significant factor which was shown to affect Test of Knowledge Score was group
attendance. Prior to group attendance the Test of Knowledge median score for all
three groups of participants was 8.50 and after group attendance the median score
rose to 18.00, at the ceiling of the test. The median difference between score at pre-
and post-test administration was 9.00 points.
These results indicated that the three pilot groups did significantly increase the
participants’ knowledge of how to keep themselves safe in the local community, as
measured by the Test of Knowledge.
107
Additionally, there was no significant difference between participant scores on the
Test of Knowledge administered within one week of completing the group (post-test)
and at four to six months later (follow-up test). However, a note of caution should be
raised at this point as, although the difference was not significant at the p< 0.05 level,
it was approaching significance (z=-1.89, p=0.059). The range of score change
between the two test administrations was 2 points (0.00 to -2.00).
Thus, participants’ knowledge recall from attending the Keeping Safe Groups was
poorer at four to six months after the group with no additional intervention carried out
between group termination and reassessment. These results were interesting as they
suggested that ‘refresher’ sessions may be helpful every four to six months to remind
the participants of the skills learned during the Keeping Safe Group. It would be a
relatively simple matter to include follow-up sessions within the group structure or to
provide other involved professionals, residential or day centre staff with information
on how to help the participants to retain their skills by running their own ‘refresher’
sessions, probably in the form of a quiz.
It was not known to what extent participants of the pilot groups were able to
consolidate their learning by practising their skills in vivo.
The high attendance figures for each of the three Keeping Safe Pilot Groups and
anecdotal participant feedback indicated that the groups were popular and enjoyable.
The most positively rated aspects of the groups seemed to be the role play exercises,
games, quiz and the use of the video. The participants particularly enjoyed seeing
themselves on television.
The Keeping Safe Group piloted was seen to equip participants with basic knowledge
of personal safety skills necessary for community living. However, despite the
encouraging results, caution must be exercised when interpreting the findings of this
pilot study. Firstly, the study included relatively few participants (N=18). Appendix
One shows that, even before attending the Keeping Safe Group sessions, the scores of
several participants were in the mid range of test performance. At this level the Test
108
of Knowledge may not be sensitive to changes in participant performance.
Additionally, the majority of the group participants were at, or approaching, the test
ceiling after the group and at follow-up. As the Test of Knowledge was designed by
the author initially as an informal way of evaluating the Keeping Safe Group, neither
its reliability nor validity has been established.
As the Keeping Safe Group sessions required the participants to have good verbal
skills and all participants in the pilot study had a mild to moderate degree of learning
disability, the group format devised may not be widely applicable to the spectrum of
people with a learning disability. However, more disabled individuals are unlikely to
be able to access the local community independently and it may be possible to
individually tailor the group structure, format and teaching methods to meet the needs
of less able participants. It seemed justifiable to target the group of people with mild
to moderate learning disabilities as they tend to have greater opportunity to use
community facilities independently and are therefore in more need of basic skills in
this area.
The current pilot study did not demonstrate whether the skills learned during the
group generalised to ‘real life’ situations. However, informal information collated
suggested that participants were using the skills learned in the group during the course
of their every day life. The case vignettes presented earlier provided some evidence
of longer term, sustained changes in behaviour four to six months following group
attendance.
6.1 Case Study A
Following the group. Case A decided not to walk by the river alone at night and either
asked another participant of the Keeping Safe Group who lived with her in a Social
Services residential placement, or a staff member to accompany her during the
evening. She also decided to learn a variety of local walks so that she could select
one appropriate for the time of day or weather conditions. This client also began to
109
carry a personal alarm with her. These changes in behaviour were still reported six
months after group attendance.
6.2 Case Study B
Case B decided not to accept drinks from strangers or offers of lifts home. She usually
decided to walk home from the pub with her friends, or, if she wished to stay longer,
she used a local ‘all female’ taxi cab service to take her home. She did not walk
alone. This client also carried a ten pence piece for the phone and a phone card with
her at all times and kept personal details and the number of the cab company in her
purse. Case B also decided to carry a personal alarm with her. Once again these
changes in behaviour were maintained six months following group attendance.
6.3 Case Study C
Case C kept an aide memoir pinned to the back of his front door to remind him to ask
for the identification of any strangers who visited his house. At his request, the local
social services department attached a chain to his front door for added security. He
also started to attend local clubs more frequently and visited people he met through
the Keeping Safe Group. Once again these changes in behaviour were maintained six
months following group attendance.
6.4 Case Study D
Case D also kept an aide memoir attached to her front door to remind her to ask for
the identification of any strangers who visited her house. She only cycled during the
day and asked her family to help her to learn a variety of relatively safe walks in her
local neighbourhood. She began to cany personal information and a phone card in her
purse as well as the telephone numbers of members of her family whom she could
call in an emergency. She did not, however, wish to carry a personal alarm with her.
These changes in behaviour were maintained at follow-up four months after attending
the group.
110
6.5 Case Study E
Case E gradually began to overcome her fears about going out alone in the local
community. Residential care staff showed her the location of several local shops. She
gradually went out, initially in a group without staff support and eventually she began
to make small trips out alone. Other members of the Keeping Safe Group helped her
by encouraging her to go on at least one outing with them each week during the
course of the group. She also carried personal information in her purse as well as
change for the phone, a phone card and a personal alarm. She learned how to use a
card phone. These improvements were continued at follow-up, five months following
the group. Anecdotal reports from staff working with this client noted the significant
improvement in her quality of life.
7. KEEPING SAFE GROUP FACILITATION PACK
As the Keeping Safe Group Pilot study was so successful and demonstrated sustained
improvement in participant knowledge and behaviour, it was decided to develop and
market a Keeping Safe Group Pack for facilitating groups for adults with a learning
disability on keeping safe in the community, including a revised Test of Knowledge.
The Test of Knowledge was extended and improved to increase the maximum
possible score to 35. The revised Test of Knowledge included an option to record
verbatim responses to specific questions, as a simple ‘yes/no’ format scoring
procedure was thought to be too superficial to adequately cover the complex topics
assessed. Details of the expanded Test of Knowledge are provided in Appendix Two.
A copy of the Keeping Safe Pack developed is provided in Appendix Three.
It was decided that a Keeping Safe Group facilitation pack would be useful as
participants may receive more support to consolidate their knowledge of how to keep
safe in the community if their carers or other professionals working with them on a
daily or frequent basis were involved in coordinating and facilitating the groups.
Skills learned in the group may be less likely to be reinforced and generalised if the
I l l
group is run by a clinical psychologist who will be unable to remain involved for an
extended period of time after completion of the group. For this reason the Keeping
Safe Pack was designed to be run by anyone with knowledge of the needs of people
with a learning disability and experience of group facilitation.
8. SUMMARY AND CONCLUSION
It is important that adults with a learning disability who use the community
independently receive training in simple procedures to ensure that they keep
themselves as safe as possible. This is seen as a vital addition to work carried out to
enable the client group to protect themselves from abuse and exploitation from those
known to them. Whilst the research indicates that people with a learning disability are
more likely to be abused by those known to them, increased community presence has
brought with it additional increased risks from ‘dangerous strangers’. These risks and
simple self-protection procedures are widely taught to children, but are often
overlooked when the individual is an adult.
The Keeping Safe Group structure piloted in the current service development and
evaluation project has been shown to be a highly successful way of teaching self
protection skills to adults with a mild to moderate learning disability.
Further research to establish the reliability and validity of the Test of Knowledge
should be carried out using a larger sample of participants. The use of the Keeping
Safe Group Pack in a modified form with more severely learning disabled participants
should also be carried out.
As the extent to which the skills learned during the course of the group generalised to
‘real life’ situations has not been studied, this should also be considered. The use of a
‘stooge’ to test the participants’ ability to use the skills in their everyday lives was
considered during the current project, but dismissed for ethical reasons.
112
9. REFERENCES
1. Alberto, P., Jobes, N., Sizemore, A., & Doran, D. (1980). A Comparison of
Individual and Group Instruction Across response Tasks. Journal of the
Association for the Severely Handicapped, 5,285-293.
2. American Psychiatric Association (1994). Diagnostic and Statistical Manual
of Mental Disorders (fourth edition), pp39-46. Washington DC: American
Psychiatric Association.
3. Bell, W. (1995). Groupwork in Action. Advocacy, 22-23.
4. Benz, M R., & Todd, A.W. (1990). Group Versus Individual Instruction for
Teaching Daily Living Skills to Students with Severe Handicaps. Australia and
New Zealand Journal of Developmental Disabilities, 16 (2), 81-95.
5. Brown, H., & Barry, G. (1993). Perfect Victims: Taking Advantage. Police
Review (May), 22-24.
6. Brown, H., Stein, J., & Turk, V. (1995). The Sexual Abuse of Adults with
Learning Disabilities: Report of A Second Two-year Incidence Survey. Mental
Handicap Research, 8(1), 3-23.
7. Brown, H., & Turk, V. (1994). Sexual Abuse in Adulthood: Ongoing Risks
for People with Learning Disabilities. Child Abuse Review, 3,26-35.
8. Brudenell, P. (1978). Dramatherapy with People with a Mental Handicap. In:
Jennings, S. (Ed.). Dramatherapy - Theory and Practice for Teachers and
Clinicians, 1, pp83-208. Routledge, London, UK.
113
9. Castles, E., & Glass, C.R. (1986). Training in Social and Interpersonal
Problem-solving Skills for Mildly and Moderately Mentally Retarded Adults.
American Journal of Mental Deficiency, 91,35-42.
10. Chia, S.W. (1995). Evaluating Groups in Learning Disabilities. Nursing
Standard, 10 (9), 25-27.
11. Cole, A. (1989). Groupwork with People with People who have Mental
Handicaps - An Approach Marred by Scepticism? Mental Handicap, 17, 115-
118.
12. Fink, W.T., & Sandall, S.R. (1980). A Comparison of One-to-One and Small
Group Instructional Strategies with Developmentally Disabled Preschoolers.
Mental retardation, 18,34-35.
13. Firth, M., & Firth, H. (1982). Improving the Interpersonal Skills of Mentally
handicapped People. Mental Handicap, 10 (4), 138-140.
14. Green, S.B., Salkind, N.J., & Akey, M.T. (1997). Using SPSS For Windows:
Analyzing and Understanding Data, pp3 83-456. Prentice Hall, Upper Saddle
River, New Jersey, USA.
15. Kempton, W., & Gochros, J. (1986). The Developmentally Disabled. In;
Gochros, H., & Fischer, J. (Eds.). Helping the Sexually Oppressed, pp56-95.
Prentice Hall, Englewood Cliffs, NJ, USA.
16. Kinnear, P R., & Gray, C.D. (1994). SPSS For Windows Made Simple,
pp93-96. Psychology Press Publishers (Erlbaum), East Sussex, UK.
17. Laub, J. (1990). Patterns of criminal Victimisation in the United States. In;
Lurigio, A., Skogan, W., & Davis, R. (Eds.). Victims of Crime: Problems,
114
Policies and Programs, pp329-450. Sage Publications, Newbury Park, CA,
USA.
18. Lindsay, W.R. (1986). Cognitive changes After Social Skills training with
Young Mildly mentally handicapped Adults. Journal of Mental Deficiency
Research, 30, 81-88.
19. Matson, J.L. (1984). Psychotherapy with Persons who are Mentally Retarded.
Mental Retardation, 22 (4), 170-175.
20. McGoveran, P. (1990). The Personal Development Programme, Mental
Handicap, 18,163-166.
21. Muir, A. (1989). Social Skills Training Helps Clients Face Society. Speech
Therapy in Practice, 5 (4), 8-10.
22. Robson, C. (1994). Experiment, Design and Statistics in Psychology. New
Edition, ppl 16. Penguin Books, Middlesex, UK.
23. Salmon, G., & Abell, S. (1996). Group Therapy for Adults with a Learning
Disability: Use of Active Techniques. Psychiatric Bulletin, 20,221-223.
24. Siegel, S. (1956). Nonparametric Statistics for the Behavioral Sciences,
ppl 16-126, ppl66-172, & ppl84-192. McGraw-Hill, Ltd., London, UK.
25. Sines, D., & Moore, K. (1986). The Magic Shop. Nursing Times, 82 (11), 50-
52.
26. Sparks, R. (1982). Research on Victims of Crime, pp7-12. U.S. Government
Printing Office, Washington, DC, USA.
115
27. SPSS Base 7.0 for Windows User’s Guide. (1996, pp232-260). SPSS Inc.
Chicago, Illinois, USA.
28. Tann, S. (1981). Grouping and Group Work. In: Simon, B., & Willocks, J.
(Eds.). Research and Practice in the Primary Classroom, ppl 11-146.
Routledge and Kegan Paul, London, UK.
29. Walmsley, S. (1989). The Need for Safeguards. In; Brown, H., & Craft, A.
(Eds.). Thinking the Unthinkable: Papers on Sexual Abuse and Adults with
Learning Difficulties, pp5-16. FPA Educational Unit, London, UK.
30. Walmsley, J. (1990). The Role of Group Work in research with People with
Learning Difficulties. Group Work, 3(1), 49-64.
31. Wechsler, D. (1981). Weschler Adult Intelligence Scale-Revised Edition.
Manual. Psychological Corporation, New York, USA.
32. Wilson, €., & Brewer, N. (1992). The Incidence of Criminal Victimisation of
Individuals with an Intellectual Disability. Australian Psychologist, 27, 114-
117.
33. Wilson, €., Seaman, L., & Nettelbeck, T. (1990). Vulnerability to Criminal
Exploitation: Influence of Interpersonal Competence Difference among People
with Mental Retardation. Journal of Intellectual Disability Research, 40 (1), 8-
16.
RESOURCES
1. Brown, H. Towards Better Commissioning. ‘Need to Know’ Series. Manual
about the Sexual Abuse of Adults with Learning Disabilities. Pavilion
Publishing, Brighton, UK.
116
2. Brown, H., Brammer, A., Craft, A., & McKay, C. Towards Better
Safeguards. ‘Need to Know’ Series. Manual about the Sexual Abuse of Adults
with Learning Disabilities. Pavilion Publishing, Brighton UK.
3. Brown, H., Egan-Sage, E., Barry, G., & McKay, C. Towards Better
Interviewing. ‘Need to Know’ Series. Manual about the Sexual Abuse of
Adults with Learning Disabilities. Pavilion Publishing, Brighton, UK.
4. Elliott, M. (1984). Kidscape. 152, Buckingham Palace Road, London, UK,
SWl 9TR.
5. Gyde, K., Henry, L., & Williams, C. Cracking Crime. A Crime Prevention
Learning Pack for People with Learning Difficulties. Pavilion Publishing,
Brighton, UK.
6. McCarthy, M., & Thompson, D. Sex and Staff Training. Sexuality, Sexual
Abuse and Safer Sex. Pavilion Publishing, Brighton, UK.
7. Metropolitan Police Leaflets.
Crime Protection Advice. Who’s There ? Be on Guard Against Bogus Callers.
Streetwise Guide to : Going Places.
How Secure is Your Home ?
How to Sting Burglars. A Guide To Protecting Your Home Against Crime.
8. Stein, J., & Brown, H. Sexual Abuse of Adults with Learning Disabilities.
The Quiz Pack. Pavilion Publishing, Brighton, UK.
9. Walsall Women’s Group. No Means No. A Pack Produced by Women with
Learning Difficulties for Women with Learning Difficulties. Pavilion
Publishing, Brighton, UK.
118
APPENDIX ONE
TEST OF KNOWLEDGE SCORES FOR ALL PARTICIPANTS
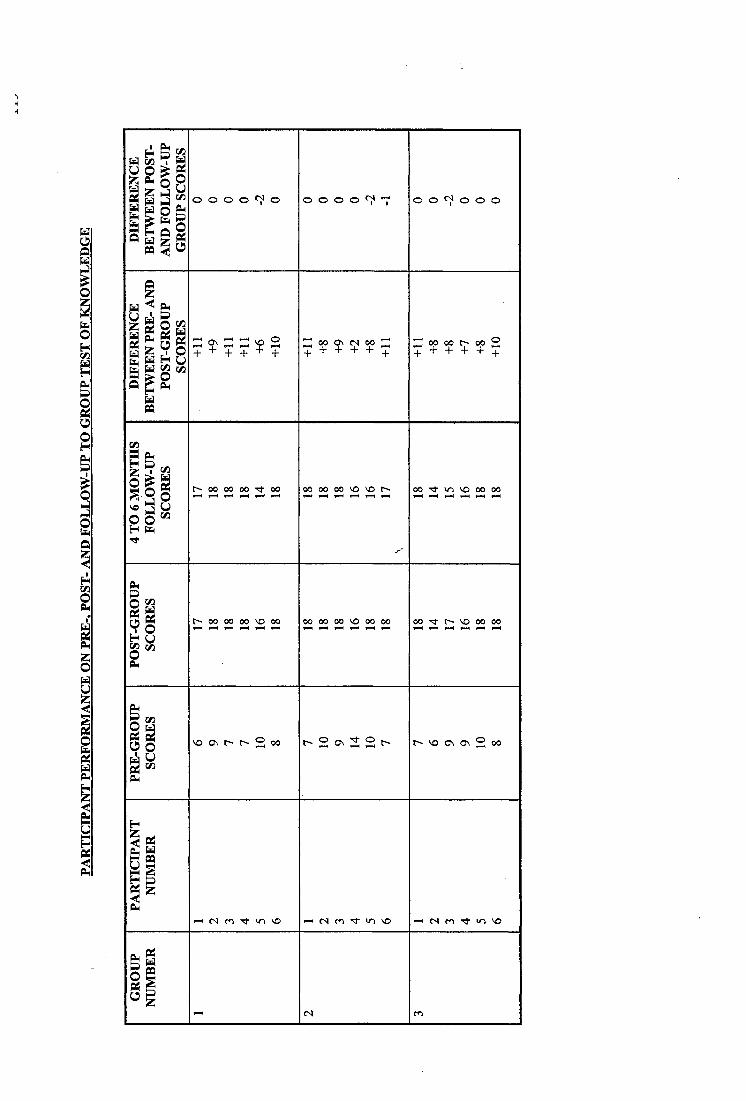
i lmo o o o o o o o o T 0 0 ^ ^ 0 0 0
| l ps|2gz ^ Z Z ^ 2+ + + + + + + + + ? + q : + + + ^ + 5
1 0 0 M O O T f ^ 00 00 00 v o v oF—4 f —4 f H f-H f— 4 r-M 0 0 ^ « n v o 0 0 0 0^ —4 f—4 V—4 ^ -4
i l 0 0 0 0 0 0 v o 0 0 0 0 0 0 0 0 v o 0 0 0 0 0 0 'S f V O 0 0 0 0
IIO og-P m
\ o G \ r ~ 2 (X ) t - 2 G \ 3 2 t - \ o o \ o \ 2
IIgr H ( S | m T f - I T ) »— 1 e s m » o v o '—1 e s f o ^ «T ) v op|§1
e s m

120
APPENDIX TWO
REVISED TEST OF KNOWLEDGE

KEEPING SAFE PACK
CONTENTS
KEEPING SAFE KNOWLEDGE TEST
15 TEST PHOTOGRAPHS

KEEPING SAFE KNOWLEDGE TEST
CONTENTS:
Instructions
Keeping Safe Knowledge Test Questionnaire
15 pictures with accompanying text
1 drawing of male body
1 drawing of female body
-Score-sheer- -----
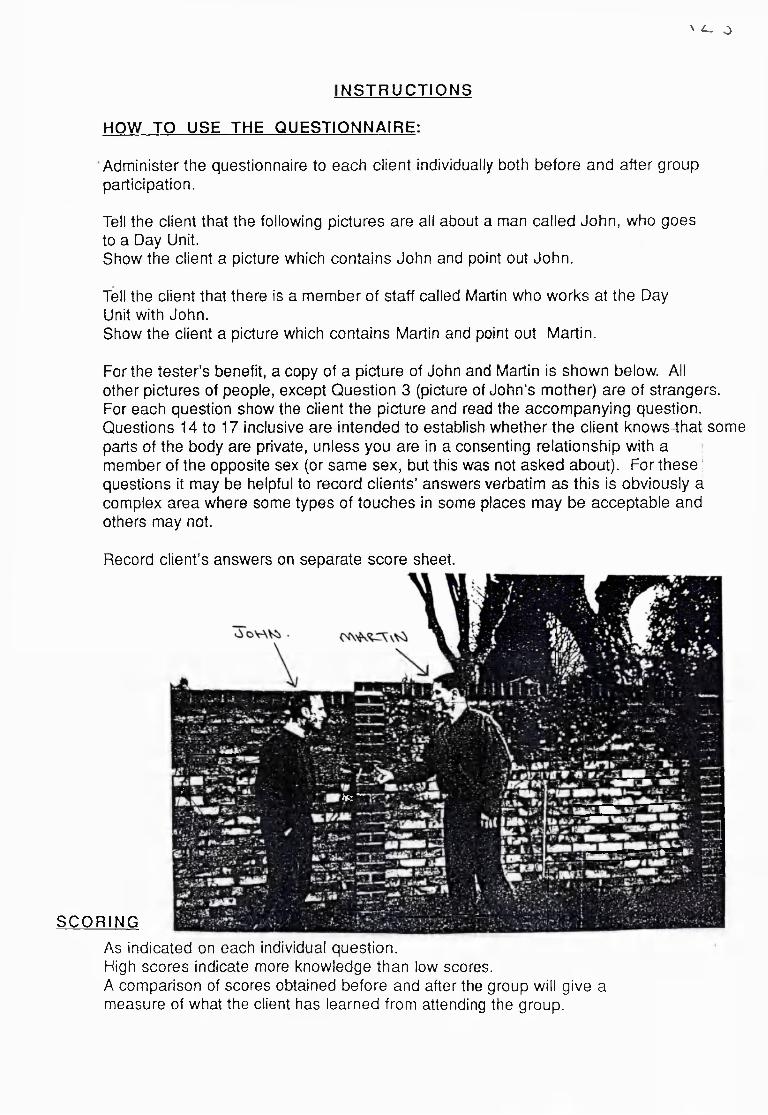
\ ^ o
NSTRUCTIONS
HOW TO USE THE QUESTIONNAIRE:
Administer the questionnaire to each client individually both before and after group participation.
Tell the client that the following pictures are all about a man called John, who goes to a Day Unit.Show the client a picture which contains John and point out John.
Tell the client that there is a member of staff called Martin who works at the Day Unit with John.Show the client a picture which contains Martin and point out Martin.
For the tester’s benefit, a copy of a picture of John and Martin is shown below. All other pictures of people, except Question 3 (picture of John’s mother) are of strangers.For each question show the client the picture and read the accompanying question. Questions 14 to 17 inclusive are intended to establish whether the client knows tbat some parts of the body are private, unless you are in a consenting relationship with a member of the opposite sex (or same sex, but this was not asked about). For these ! questions it may be helpful to record clients’ answers verbatim as this is obviously a complex area where some types of touches in some places may be acceptable and others may not.
Record client’s answers on separate score sheet.
SCORING
i f : —V V
As indicated on each individual question.High scores indicate more knowledge than low scores.A comparison of scores obtained before and after the group will give a measure of what the client has learned from attending the group.
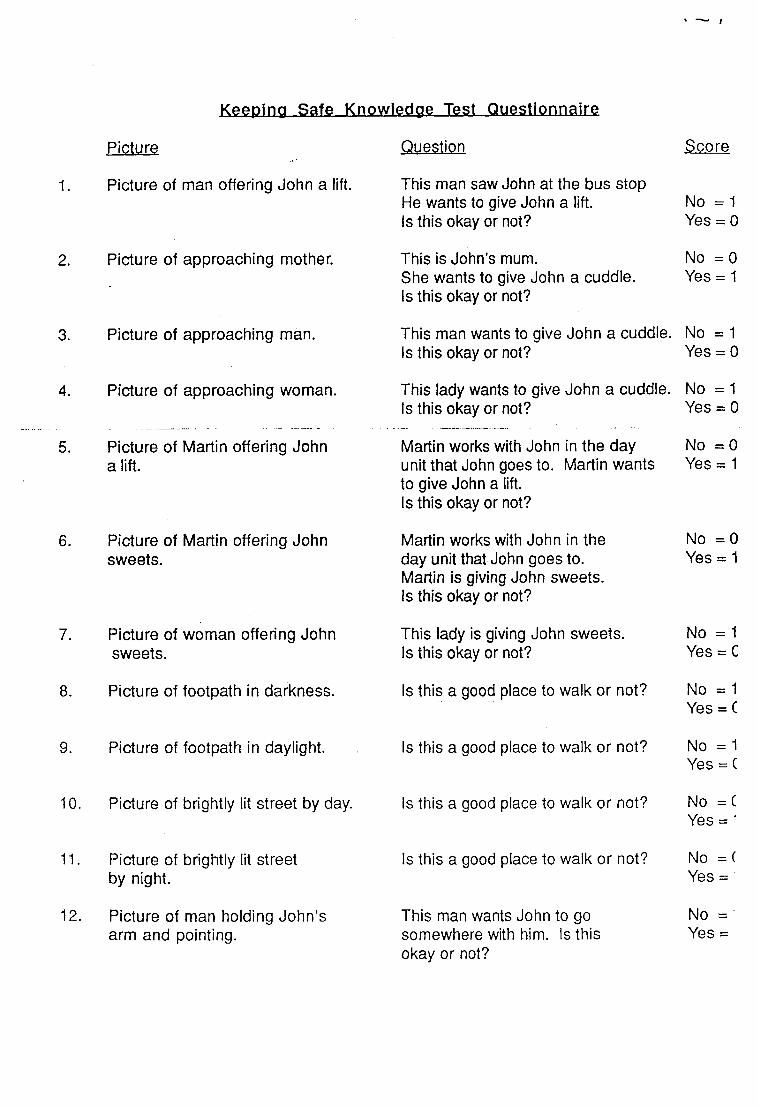
Picture
1. Picture of man offering John a lift.
2. Picture of approaching mother.
3. Picture of approaching man.
4. Picture of approaching woman.
Picture of Martin offering John a lift.
6. Picture of Martin offering John sweets.
7. Picture of woman offering John sweets.
8. Picture of footpath in darkness.
9. Picture of footpath in daylight.
10. Picture of brightly lit street by day.
11. Picture of brightly lit street by night.
12. Picture of man holding John’s arm and pointing.
Keeping Safe Knowledge Test Questionnaire
Question
This man saw John at the bus stop He wants to give John a lift.Is this okay or not?
This is John’s mum.She wants to give John a cuddle.Is this okay or not?
This man wants to give John a cuddle. Is this okay or not?
This lady wants to give John a cuddle. Is this okay or not?
Martin works with John in the day unit that John goes to. Martin wants to give John a lift.Is this okay or not?
Martin works with John in the day unit that John goes to.Martin is giving John sweets.Is this okay or not?
This lady is giving John sweets.Is this okay or not?
Is this a good place to walk or not?
Score
No = 1 Yes = 0
No = 0 Yes = 1
No = 1 Yes = 0
No = 1 Yes = 0
No = 0 Yes = 1
No = 0 Yes = 1
No = 1 Yes = C
No = 1 Yes = C
Is this a good place to walk or not? No =1Yes = C
Is this a good place to walk or not? No = CYes = ■
Is this a good place to walk or not?
This man wants John to go somewhere with him. Is this okay or not?
No = ( Yes =
No = Yes =
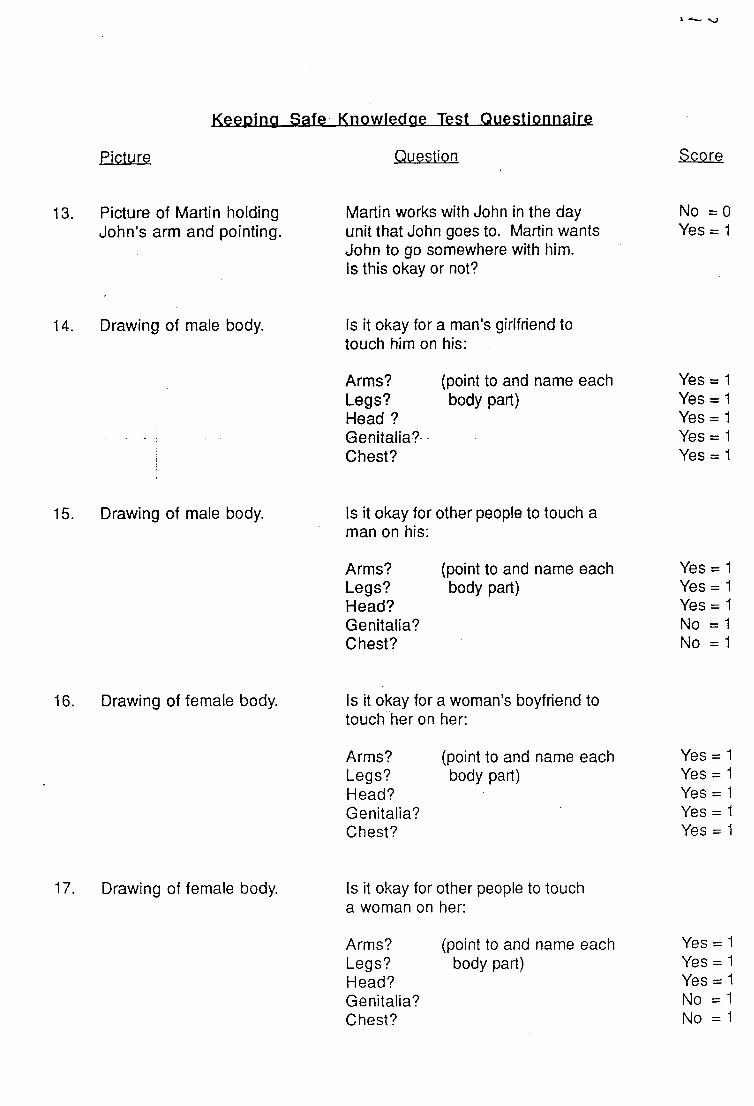
Picture
Keeping Safe Knowledge Test QuesliQnnaim
Question -Score
13. Picture of Martin holding John’s arm and pointing.
Martin works with John in the day unit that John goes to. Martin wants John to go somewhere with him.Is this okay or not?
No =0 Yes = 1
14. Drawing of male body. Is it okay for a man’s girlfriend to touch him on his:
Arms? Legs? Head ? Genitalia? Chest?
(point to and name each body part)
Yes = 1 Yes = 1 Yes = 1 Yes = 1 Yes = 1
15. Drawing of male body. Is it okay for other people to touch a man on his:
Arms?Legs?Head?Genitalia?Chest?
(point to and name each body part)
Yes = 1 Yes = 1 Yes = 1 No = 1 No = 1
16. Drawing of female body. Is it okay for a woman’s boyfriend to touch her on her:
Arms?Legs?Head?Genitalia?Chest?
(point to and name each body part)
YesYesYesYesYes
17. Drawing of female body. Is it okay for other people to touch a woman on her:
Arms?Legs?Head?Genitalia?Chest?
(point to and name each body part)
YesYesYesNoNo

Picture
Keeping Safe Knowledge Test Questionnaire
Question
18. Picture of man inviting John into his house.
This man wants John to go into his house.Is this okay or not?
S co re
No = 1 Yes = 0
19. Picture of Martin inviting John into his house.
Martin works with John in the day unit that John goes to, Martin wants John to go into his house.Is this okay or not?
No = 0 Yes = 1
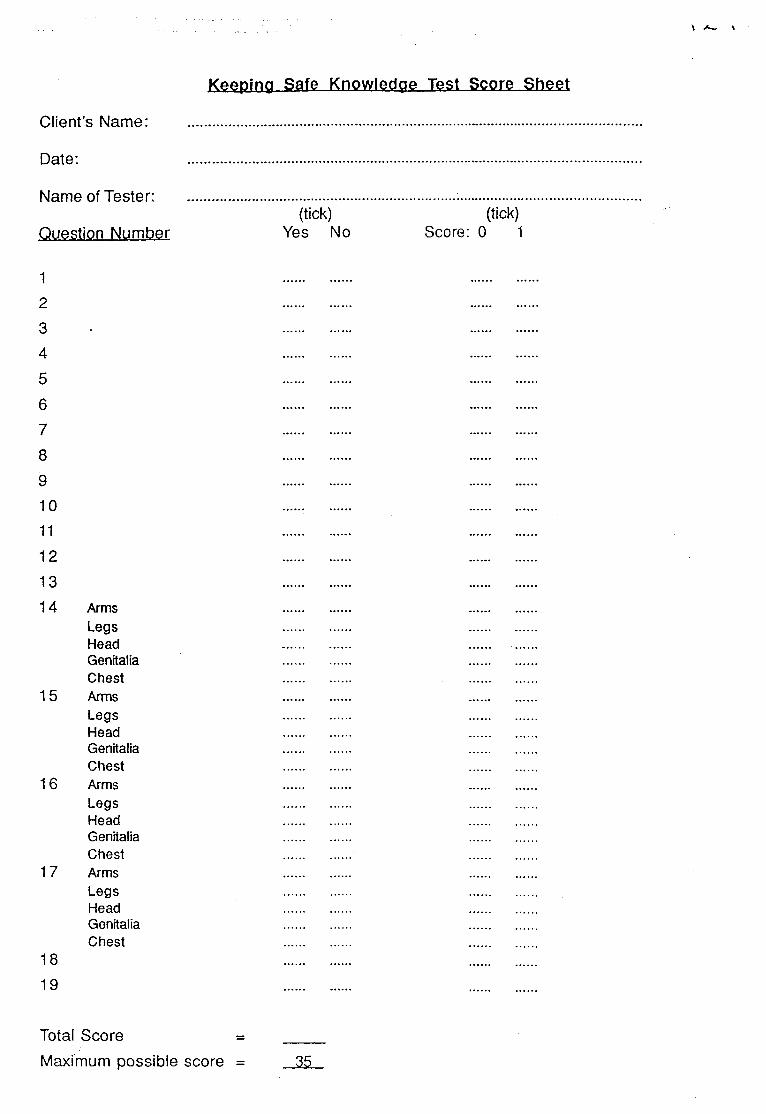
Keeping Safe_KnQwledae Test Si?flre_Shee,t
Client’s Name:
Date:
Name of Tester:
Question Number(tick)
Yes No(tick)
Score: 0 1
12345678910 11 121314
15
16
17
ArmsLegsHeadGenitaliaChestArmsLegsHeadGenitaliaChestArmsLegsHeadGenitaliaChestArmsLegsHeadGenitaliaChest
1819
Total ScoreMaximum possible score = 3 5 .
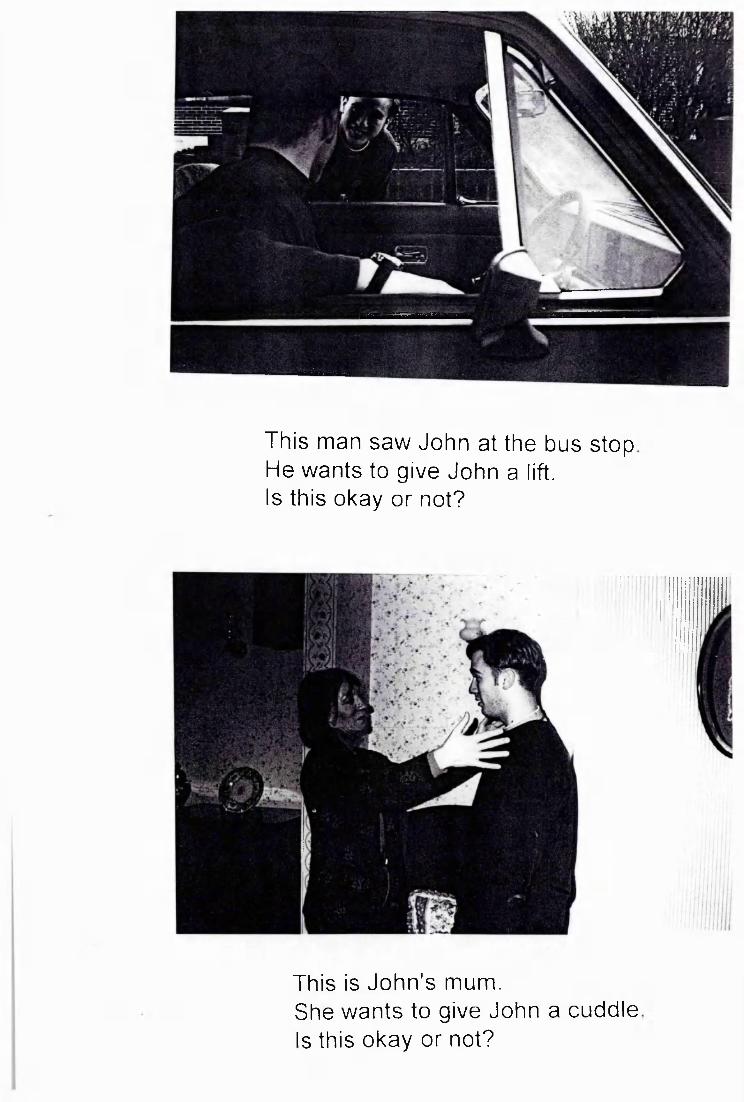
This man saw John at the bus stop He wants to give John a lift, is this okay or not?
This is John's mum.She wants to give John a cuddleIs this okay or not?

K
This man wants to give John a cuddle Is this okay or not?
, Tt!
This lady wants to give John a cuddle.Is this okay or not?

Martin works with John in the day unit that John goes to. Martin wants to give John a litf.Is this okay or not?
■ Î^; ! WW-
, I ‘ i I'.* ■ ,.iisi - k' . '
- m m
Martin works with John in the day unitthat John goes to. Martin is giving Johnsweets.

This lady is giving John sweets Is this okay or not?
Is this a good place to walk or not?

» ?K'-'" A
s this a good place to walk or not?
Is this a good place to walk or not?
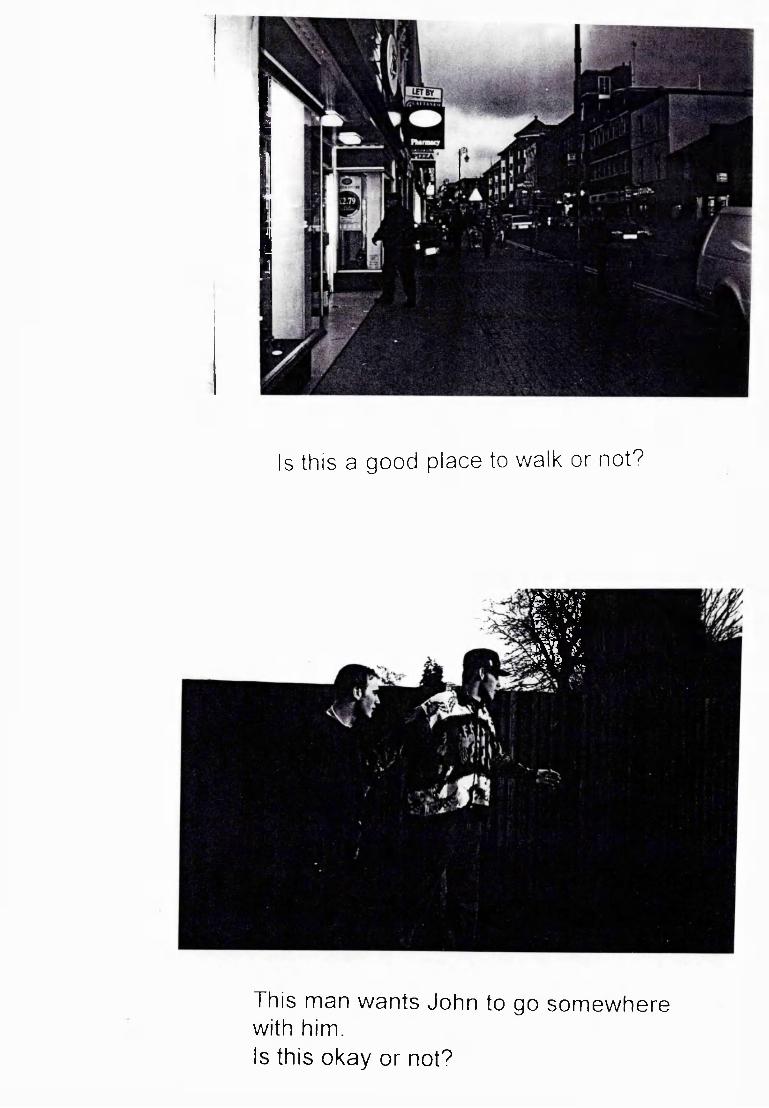
Is this a good place to walk or not?
i
This man wants John to go somewhere with him.Is this okay or not?

MARSTC^ AVENUECHtSSINGTON
Martin works with John in the day unit that John goes to. Martin wants John to go somewhere with him.Is this okay or not?
m
This man wants John to go into his houseIs this okay or not?

Martin works with John in the day unit that John goes to. Martin wants John to go into his house.Is this okay or not?

136
APPENDIX THREE
KEEPING SAFE PACK
KEEPING SAFE PACK
A Resource pack for facilitating groups for people
with learning disabilities on keeping safe in the
community.
Copyright to;
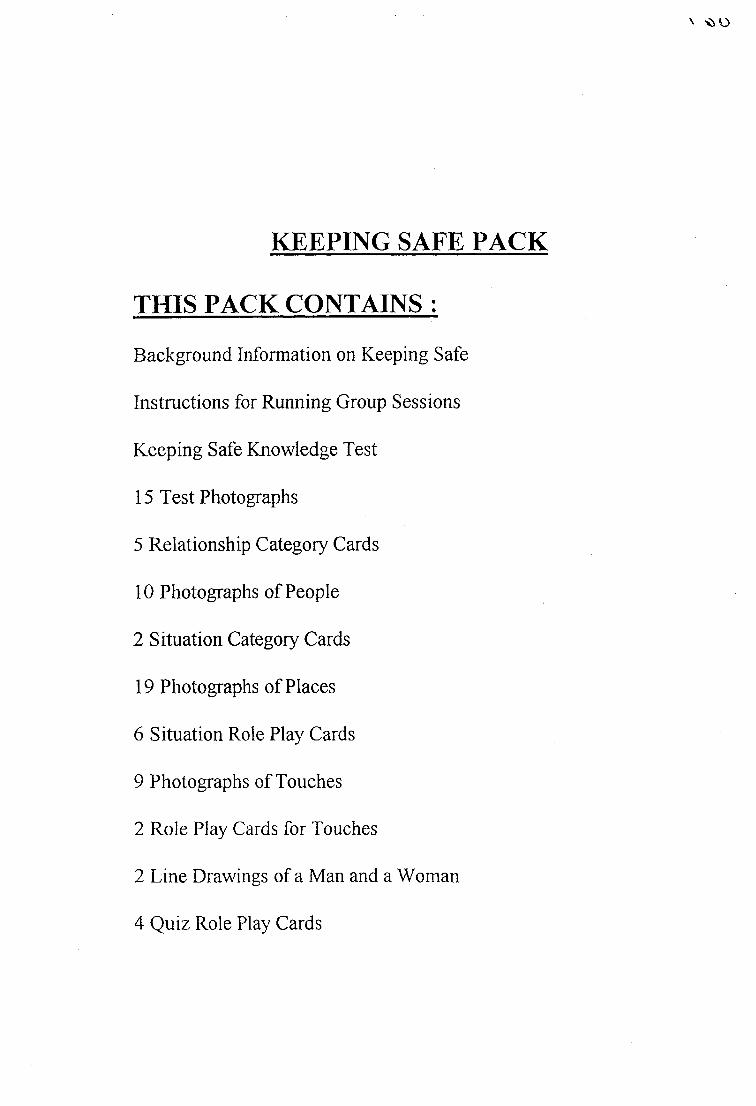
KEEPING SAFE PACK
THIS PACK CONTAINS ;
Background Information on Keeping Safe
Instructions for Running Group Sessions
Keeping Safe Knowledge Test
15 Test Photographs
5 Relationship Category Cards
10 Photographs of People
2 Situation Category Cards
19 Photographs of Places
6 Situation Role Play Cards
9 Photographs of Touches
2 Role Play Cards for Touches
2 Line Drawings of a Man and a Woman
4 Quiz Role Play Cards
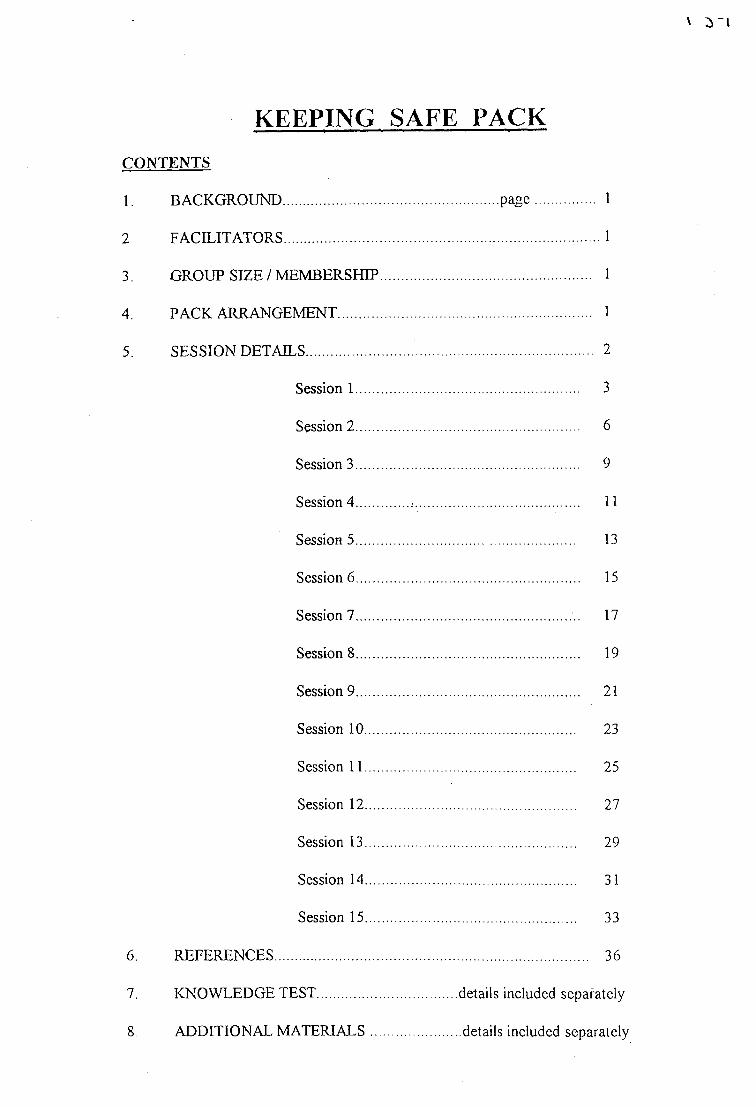
\
KEEPING SAFE PACKCONTENTS
1. BACKGROUND...................................................... page............... 1
2 FACILITATORS.................................................................................1
3. GROUP SIZE / MEMBERSHIP..................................................... 1
4. PACK ARRANGEMENT................................................................ 1
5. SESSION DETAILS ........................... ............................... 2
Session 1........................... ............................ 3
Session 2....................................................... 6
Session 3....................................................... 9
Session 4 .............. 11
Session 5...................... 13
Session 6............................................. 15
Session 7..................................................... 17
Session 8........................................................ 19
Session 9........................................................ 21
Session 10.................................................... 23
Session 11.................................................... 25
Session 12.................................................... 27
Session 13.................. 29
Session 14.................................................... 31
Session 15.................................................... 33
6. REFERENCES................................................................................ 36
7. KNOWLEDGE TEST details included separately
8. ADDITIONAL MATERIALS........................ details included separately
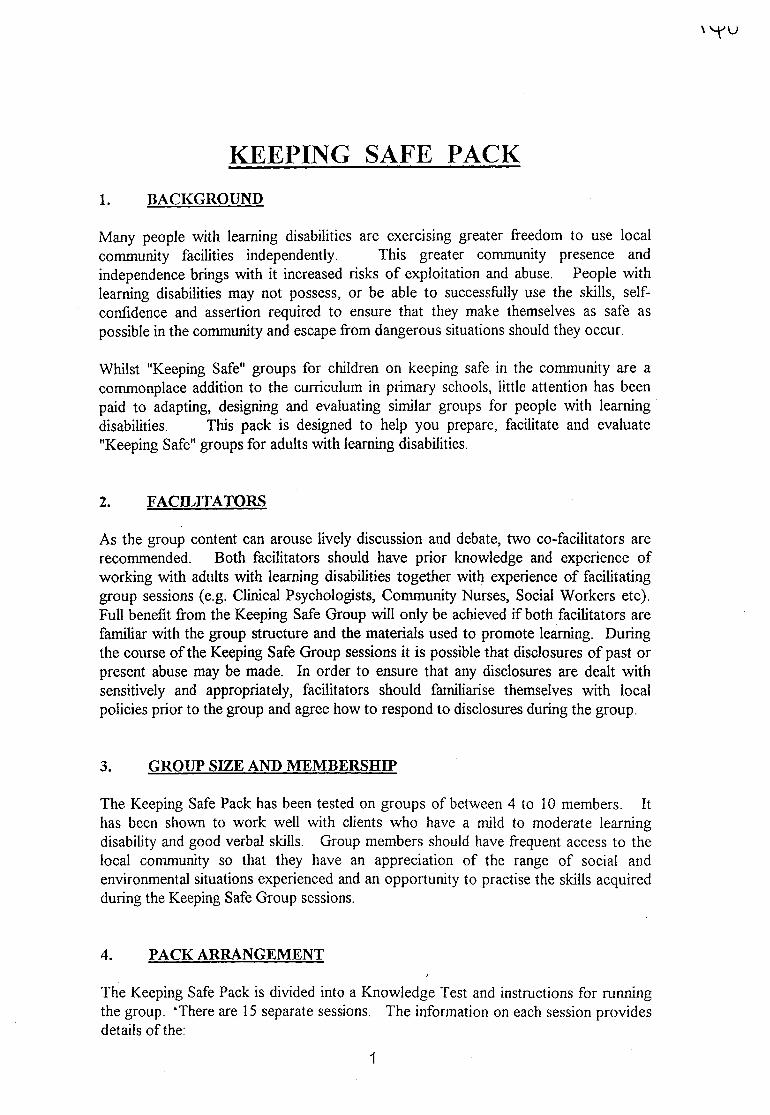
KEEPING SAFE PACK1. BACKGROUND
Many people with learning disabilities are exercising greater freedom to use local community facilities independently. This greater community presence and independence brings with it increased risks of exploitation and abuse. People with learning disabilities may not possess, or be able to successfully use the skills, self- confidence and assertion required to ensure that they make themselves as safe as possible in the community and escape from dangerous situations should they occur.
Whilst "Keeping Safe" groups for children on keeping safe in the community are a commonplace addition to the curriculum in primary schools, little attention has been paid to adapting, designing and evaluating similar groups for people with learning disabilities. This pack is designed to help you prepare, facilitate and evaluate "Keeping Safe" groups for adults with learning disabilities.
2. FACILITATORS
As the group content can arouse lively discussion and debate, two co-facilitators are recommended. Both facilitators should have prior knowledge and experience of working with adults with learning disabilities together with experience of facilitating group sessions (e.g. Clinical Psychologists, Community Nurses, Social Workers etc). Full benefit from the Keeping Safe Group will only be achieved if both facilitators are familiar with the group structure and the materials used to promote learning. During the course of the Keeping Safe Group sessions it is possible that disclosures of past or present abuse may be made. In order to ensure that any disclosures are dealt with sensitively and appropriately, facilitators should familiarise themselves with local policies prior to the group and agree how to respond to disclosures during the group.
3. GROUP SIZE AND MEMBERSHIP
The Keeping Safe Pack has been tested on groups of between 4 to 10 members. It has been shown to work well with clients who have a mild to moderate learning disability and good verbal skills. Group members should have frequent access to the local community so that they have an appreciation of the range of social and environmental situations experienced and an opportunity to practise the skills acquired during the Keeping Safe Group sessions.
4. PACK ARRANGEMENT
The Keeping Safe Pack is divided into a Knowledge Test and instructions for running the group. ‘There are 15 separate sessions. The information on each session provides details of the:
1

KEEPING SAFE PACK
CONTENTS
Session Details 1 to 15
References
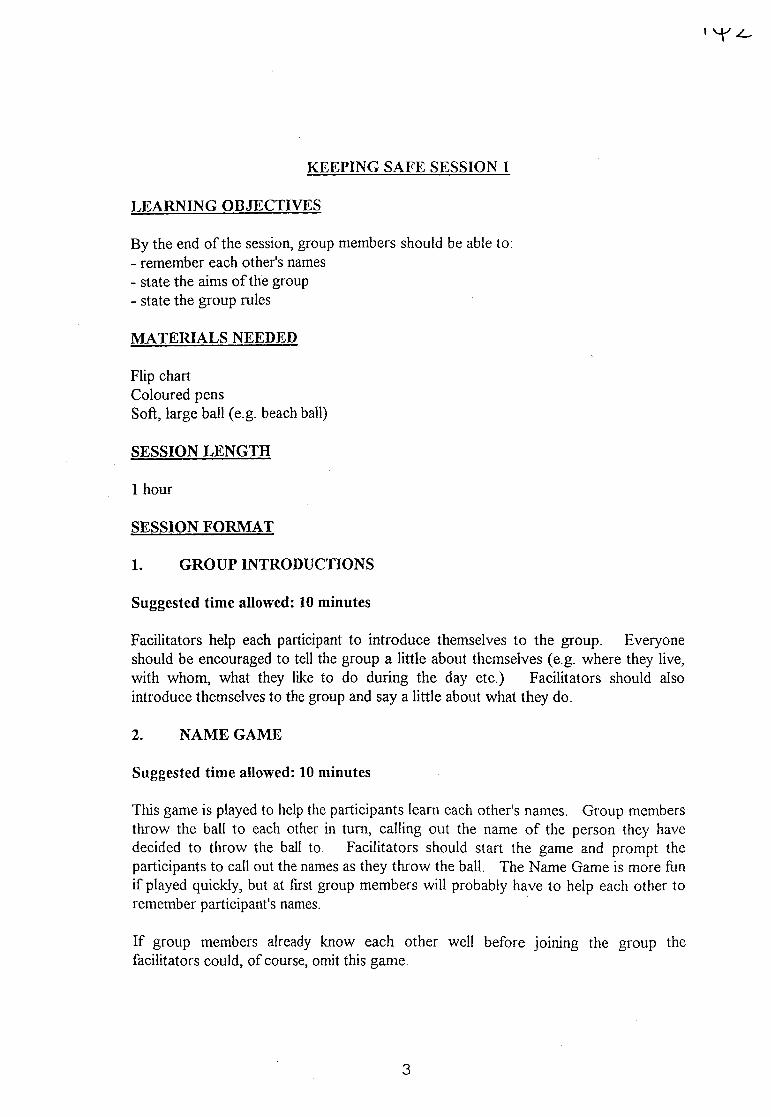
KEEPING SAFE SESSION I
LEARNING OBJECTIVES
By the end of the session, group members should be able to;- remember each other's names- state the aims of the group- state the group rules
MATERIALS NEEDED
Flip chart Coloured pensSoft, large ball (e.g. beach ball)
SESSION LENGTH
1 hour
SESSION FORMAT
1. GROUP INTRODUCTIONS
Suggested time allowed: 10 minutes
Facilitators help each participant to introduce themselves to the group. Everyone should be encouraged to tell the group a little about themselves (e.g. where they live, with whom, what they like to do during the day etc.) Facilitators should also introduce themselves to the group and say a little about what they do.
2. NAME GAME
Suggested time allowed: 10 minutes
This game is played to help the participants learn each other's names. Group members throw the ball to each other in turn, calling out the name of the person they have decided to throw the ball to. Facilitators should start the game and prompt the participants to call out the names as they throw the ball. The Name Game is more fun if played quickly, but at first group members will probably have to help each other to remember participant's names.
If group members already know each other well before joining the group the facilitators could, of course, omit this game.
Mr o
3. AIMS OF THE GROUP
Suggested time allowed: 15 minutes
Facilitators should introduce the aims of the group to the participants. It is often helpful at this point to remind everyone of the group name. Remember to talk about the importance of everyone learning how to make themselves safe when out (i.e. not just people with learning disabilities) and that it is important to feel confident in order to avoid any dangerous situations. The purpose of the group is not to frighten everyone so much that they do not go out at all !
It is often helpful for the facilitators to briefly outline some personal examples of times when they have found themselves in a potentially dangerous or frightening situation (e.g. being teased in a bus queue, bullied in a pub, a stranger offering a lift home etc.) Ask members of the group whether anything like this has ever happened to them. This should open up a general discussion and the group aims can then be channelled to the specific needs of the group.
Recap on the group aims after this discussion.
The aims of the Keeping Safe Group are that the participants should learn to:- ignore and walk away from people who tease / talk inappropriately to them- refuse to go anywhere with someone they do not know- refuse to get into a car with someone they do not know- refuse offers of presents, goods etc. from strangers- follow simple procedures to avoid putting themselves at risk- refuse to go into a stranger's house- refuse to let strangers into the house without checking- follow simple procedures if they do find themselves in a dangerous situation- know that they do not have to keep secrets if it makes them feel uncomfortable- know that certain parts of their body and other people's bodies are private. That they can say "no" if anyone wants to touch their private parts or wants them to touch their private parts.
At this point it is a good idea to tell everyone a little about the teaching methods youwill be using and ask the group which method they have found most helpful in the past(e.g. photos, drama, discussion, video etc.)
4. GROUP RULES
Suggested time allowed: 15 minutes
Facilitators should introduce the topic of rules to the participants. It is sometimes helpful to tell the participants that groups often decide to have rules so that everyone enjoys the group and feels able to talk freely. One of the facilitators should write each rule agreed on the flip chart. It may also be helpful to draw a picture to represent each rule for clients who have difficulty reading. Briefly discuss each rule suggested. Some of the most commonly suggested rules include:
- no smoking- only one person to talk at a time- no-one to laugh at or tease anyone else in the group- no swearing- no shouting- everyone to turn up on time for the group
There may, of course, be different rules the group decides to adopt.
The facilitators should help the group to discuss what should happen if a participant breaks a rule (e.g. other participants or facilitators should bring it to the person's attention).
Remember to keep the flip chart sheets created each session so that they may be stuck to the wall as required in subsequent sessions.
\
KEEPING SAFE SESSION 2
LEARNING OBJECTIVES
By the end of the session, group members should be able to.- remember each other's names- state the aims of the group- state the group rules- define the nature of the following relationships; stranger, friend, acquaintance,
staff and relative
MATERIALS NEEDED
Flip chart Coloured pens BallRelationship category cards (5 cards)Blu Tak
Before the group, stick the group rules from last session on the wall.
SESSION LENGTH
1 hour
SESSION FORMAT
1. NAME GAME
Suggested time allowed: 10 minutes
See session 1 for ftirther details.Aim to play the game faster this week.
2. RECAP ON LAST SESSION
Suggested time allowed: 15 minutes
Facilitators should open a general discussion about what the group members remember from last week's session. It is important to recap on the aims of the group and the group rules (displayed on the wall).
3. RELATIONSHIP CATEGORIES
Suggested time allowed: 35 minutes
For this exercise the facilitators need to use the relationship category cards.
6

Stick the category cards onto the flip chart sheets so that the participants can see them clearly. Take each category in turn and ask the participants to read the printed word and call out what they think it means (e.g. what is a friend 'i' etc.) One of the facilitators should write down the suggested definitions. This exercise should prompt a general discussion about the relationship categories.
If the participants are unable to start the exercise, it may be helpful to encourage them to think about someone they know who is a friend, staff or family member and to decide what it is about this person that places them in the category.
Suggested definitions may include the following factors;
FRIEND
- someone you know well and like- someone you do things with- you know lots about this person and their family
STRANGER
- anyone you do not know- you do not know this person's name- someone you have never met before
ACQUAINTANCE
- someone you know slightly- you know very little about this person- someone you have met occasionally- you may or may not know this person's name
STAFF
- people who work with you at your home or day unit- you know their names
RELATIVE
- a member of your family
It is helpful to use the general discussion to talk about any mistaken beliefs the participants have about strangers. Some of the commonly held beliefs include the following;- all strangers are men- strangers are homeless- strangers look dirty and smelly- strangers do not have nice pets
7

At the end of the discussion recap on each definition, paying particular attention to the categories of stranger and acquaintance.
Before the participants leave the group, ask them to bring photographs of their families, friends and staff next week.
It is a good idea to tell the families and staff of those attending the group that you need photographs, so that they can remind the participants and can help them to take photographs if necessary
8
o
KEEPING SAFE SESSION 3
LEARNING OBJECTIVES
By the end of the session, group members should be able to;- define the categories of stranger, friend, acquaintance, staff and relative- identify which category you do activities with
MATERIALS NEEDED
Flip chart Coloured pens BallRelationship category cards (5 cards)Photographs of people (10 photographs) and participants' photographs Blu Tak
Before the group, stick the group rules and the relationship category flip chart sheets on the wall.
SESSION LENGTH
1 hour
SESSION FORMAT
1. NAME GAME
Suggested time allowed: 10 minutes
See session 1 for further details.Aim to play the game faster this week.If the facilitators are confident that the participants know each other's names and the group members do not want to play the game, you should omit the Name Game. Usually the participants are happy to play and the game acts as a good "ice-breaker,"
If the game is too easy, participants should be encouraged to both name the person and describe something this person is wearing as they throw the ball (e.g. Karen in the blue jumper).

\ 'T \
2. RECAP ON LAST SESSION
Suggested time allowed: 15 minutes
Facilitators should open a discussion about what the participants remember from last week's session. It is important to concentrate on the definition of stranger. Use the definitions stuck to the wall to guide the discussion.
3. PHOTOGRAPH ARRANGEMENT
Suggested time allowed: 35 minutes
Facilitators should use the photographs provided, together with the photographs the participants have brought to the group for this exercise. The photographs provided consist of pictures of people the participants are likely to encounter in the local community (e.g. policeman, gas worker etc.)
Spread the photographs of people in the middle of the group. Ask each participant in turn to select a photograph, show it to the other group members and stick it under thecorrect heading (e.g. a photograph of a keyworker should go under the staff heading).Help each participant to read the photograph label if appropriate. Continue until all the photographs have been allocated to a category. Briefly discuss each photograph in turn as there may be some debate about the correct category.
Once the photographs have been arranged and an agreement has been reached on each, use some of the photographs to identify activities you do with each category of person (e.g. go shopping with keyworkers). One facilitator should write down the activities suggested for each category on the flip chart. A general discussion should follow leading to identification of situations in which you can trust members of each category of person (e.g should you trust your post-man if he meets you in a pub and offers you a lift home?)
At the end of the group remember to return the photographs to the group members so that they can take them home.
10

KEEPING SAFE SESSION 4
LEARNING OBJECTIVES
By the end of the session, group members should be able to:- categorise environments into safe and not so safe- identify characteristics which make a place safer or not so safe
MATERIALS NEEDED
Flip chart Coloured pens BallSituation category cards (2 cards)Photographs of places (19 photographs)Blu Tak
Before the group, stick the group rules and the relationship category flip chart sheets on the wall.
SESSION LENGTH
1 hour
SESSION FORMAT
1, NAME GAME
Suggested time allowed: 10 minutes
See sessions 1 and 3 for further details.Aim to play the game faster.The Name Game should be omitted if participants are able to remember each other's names and do not want to play
2. RECAP ON LAST SESSION
Suggested time allowed: 15 minutes
Facilitators should open a general discussion about what the participants remember from last week's session. Use the relationship category flip chart sheets to guide the discussion.
11

3. PHOTOGRAPH ARRANGEMENT
Suggested time allowed: 35 minutes
For this exercise, the facilitators need to use the situation category cards.Pin the category cards onto flip chart sheets so that the participants can see them clearly.
Spread all the photographs of places in the middle of the group. Ask each participant to select a photograph and to stick it under the correct heading (e.g. a day unit activity room is safe). Help each participant to read the photograph label if appropriate. Continue until all the photographs have been allocated to a category. Briefly discuss each photograph in turn as there may be some debate about the correct category for the photograph.
Once the photographs have been arranged and an agreement has been reached on each, use the photographs to identify what makes a place safer or not so safe. One facilitator should write the characteristics on the flip chart (e.g. not so safe - dark, not many people etc.)
A general discussion should lead to identification of places to avoid if group members are alone. Local areas of safety and places to avoid may be suggested.
During this discussion, participants may talk about their own experiences when in the local community. Use these examples to encourage the group to think about personal safety issues.
At the end of the group, collect the photographs and keep them separated into two groups. You will use the photographs categorised as not so safe next week.
12

\ lb - c
KEEPING SAFE SESSION 5
LEARNING OBJECTIVES
By the end of the session, group members should be able to;- identify how to limit the risk of places considered not so safe
MATERIALS NEEDED
Flip chart Coloured pens BallPhotographs of not so safe places (approximate number 7, exact photographs will vary depending upon discussion last session)Blu Tak
Before the group, stick the group rules, the relationship category flip charts and the situation category flip charts on the wall
SESSION LENGTH
1 hour
SESSION FORMAT
1. NAME GAME
Suggested time allowed: 10 minutes
See sessions 1 and 3 for further details.Aim to play the game faster.Omit this game if the participants do not want to play.
2. RECAP ON LAST SESSION
Suggested time allowed: 10 minutes
Facilitators should open a discussion about what the participants remember from last week's session. Use the situation category flip charts to guide the discussion about what makes a place safe or not so safe.
3. RISK LIMITATION
Suggested time allowed: 40 minutes
For this task, use only the photographs identified as not so safe.
13
\ o o
One photograph should be selected in turn and shown to the group. For each photograph the group should discuss how to limit the risk of each situation (e.g. avoid specific areas always when it is dark, only visit specific areas in a group).One facilitator should write the group comments onto a flip chart.
At the end of this discussion, recap on all the ways of reducing risk.
During this discussion, participants should be encouraged to talk about their own experiences and to identify how they could have reduced any risks or dangers in the situations described.
If you plan to use a video camera during the next session to record the role play exercises, discuss this with the group and ask the participants to think about whether they would like to video the session. Remember to reassure them that no-one outside the group will see the video and that the tape will be erased after the group has finished.
14

' o v
KEEPING SAFE SESSION 6
LEARNING OBJECTIVES
By the end of the session, group members should be able to:- role play how to deal with potentially dangerous situations
MATERIALS NEEDED
Flip chart Coloured pens BallSituation role play cards (6 cards labelled 's' on reverse)Blu Tak
A video camera to record the role plays is also helpful.
Before the group, stick the group rules, relationship category flip charts, the situation category flip charts and the risk limitation flip charts from session 5 on the wall.
SESSION LENGTH
1 hour
SESSION FORMAT
1. NAME GAME
Suggested time allowed: 10 minutes
See sessions 1 and 3 for further details.Omit if no longer relevant.
2. RECAP ON LAST SESSION
Suggested time allowed: 10 minutes
Facilitators should open a general discussion about what the participants remember from last week's session. Use the risk limitation flip charts created last week to guide the discussion.
15
3, ROLE PLAY
Suggested time allowed: 40 minutes
Role play three situations only this week (i.e. use three cards), you will finish the role playing next week.
If you are using the video, remember to obtain the permission of group members and to reassure them that no-one outside the group will see the tape. It is helpful to set up the video camera before the session so that you need only to turn it on to record the role play.
Often, participants are initially shy about role playing scenarios. It is sometimes a good idea for both facilitators to role play and video the first situation.
For each role play, one facilitator should play the part of the stranger. Ask for volunteers from the group to play the other part. The other facilitator should lead the group discussion. Participants who volunteer for the role play should select a card. Help the participant to read aloud the scenario on the card to the group. A general discussion about what the participant could do to ensure his / her safety should follow.
Once an appropriate course of action has been agreed, the participant and facilitator should role play the situation. Only correct and safe responses should be acted out.
It may be necessary to role play the situation two or three times so that a really good response is shown. Between each role play, group feedback should be obtained.
Try to ensure that everyone who wants to role play has an opportunity to do so during sessions 6 and 7. Shy group members should be helped to participate so that everyone has an opportunity to role play the scenarios during the two sessions.
Although there will be many different ways of dealing with the situations discussed, in general the participants should always be encouraged to follow the rule; "say no, go and tell someone".
16
KEEPING SAFE SESSION 7
LEARNING OBJECTIVES
By the end of the session, group members should be able to;- role play how to deal with potentially dangerous situations
MATERIALS NEEDED
Flip chart Coloured pens BallSituation role play cards (6 cards labelled 's' on reverse)Video camera (if available)Blu Tak
Before the group, stick the group rules, relationship category flip charts and situation category flip charts on the wall.
SESSION LENGTH
1 hour
SESSION FORMAT
1. NAME GAME
Suggested time allowed: 10 minutes
See sessions 1 and 3 for further details.Omit if no longer relevant.
2. RECAP ON LAST SESSION
Suggested time allowed: 10 minutes
Facilitators should open a general discussion about what the participants remember from last week's session.
3. ROLE PLAY
Suggested time allowed: 40 minutes
Role play the final three scenarios (i.e. use the final three cards) during this session.
Follow the guidelines for session 6.
17

\ o
At the end of the group, remind the participants that they will be able to watch the video next session.After sessions 6 and 7, the facilitators should play the video in order to identify good examples of what to do in a potentially dangerous situation. These selections will be used next session.
18
KEEPING SAFE SESSION 8
IF A VIDEO CAMERA HAS NOT BEEN USED, THIS SESSION SHOULD BE OMITTED.
LEARNING OBJECTIVES
By the end of the session, group members should be able to:- state all the actions to be taken when approached by a stranger
MATERIALS NEEDED
Flip chart Coloured pens BallVideo of role plays Video recorder and T V.Blu Tak
Before the group, stick the group rules, relationship category and situation category flip charts on the wall.
SESSION LENGTH
1 hour
SESSION FORMAT
1. NAME GAME
Suggested time allowed: 10 minutes
See sessions 1 and 3 for further details.Omit if no longer relevant.
2. RECAP ON LAST SESSION
Suggested time allowed: 10 minutes
Facilitators should open a general discussion about what the participants remember from last week's session
19
3. ROLE PLAY VIDEO FEEDBACK
Suggested time allowed: 40 minutes
Facilitators should play previously selected sequences from the role play scenarios to the group.
A general group discussion should follow each video sequence to identify why the participant's response was good and whether there was anything s/he could have done to make the response even better. Remember to help the group focus upon nonverbal communication (e.g. facial expression, tone of voice) as well as what the participant actually said.
This discussion should be summarised and the general rule, "say no, go and tell someone" should be introduced as a good way of dealing with any situation you are uncomfortable with.
As the next sessions focus on types of touching, rather than dangerous people and places, the facilitators should end session 8 by asking the group whether there is anything they would like the facilitators to clarify. It is a good idea to tell the group that the next session will cover very different topics so that the participants' interest is maintained.
20

\ D V J
KEEPING SAFE SESSION 9
LEARNING OBJECTIVES
By the end of the session, group members should be able to:- identify different types of touching- identify who can touch in these ways
MATERIALS NEEDED
Flip chart Coloured pens BallSmall blank cards or pieces of paper Photographs of touches (9 photographs)Relationship category cards (5 cards)Blu Tak
Before the group, stick the group rules on the wall.
SESSION LENGTH
1 hour
SESSION FORMAT
1. NAME GAME
Suggested time allowed: 10 minutes
See sessions 1 and 3 for further details.Omit if no longer relevant.
2. RECAP ON LAST SESSION
Suggested time allowed: 10 minutes
Facilitators should open a general discussion about what the participants remember from last week's session. Reinforce the rule; "say no, go and tell someone".
End the discussion by telling the participants that new topics will be discussed over the next five sessions.
3. IDENTIFICATION OF TYPES OF TOUCHES
Suggested time allowed: 20 minutes
21

\ D \
Introduce the topic of touching to the group. Ask the group members to list as many different types of touches as they can think of The photographs of types of touches provided in this pack are as follows;- a kiss- shaking hands- a kick- holding hands- a push- arms around someone's shoulders- a hug- a punch- putting a hand on someone's kneeThere may be many more types of touches the participants list separately.
One facilitator should write the touches suggested onto separate cards or pieces of paper and place them in the middle of the group. A flip chart sheet listing the different types of touches should also be created.
It may be necessary to ask the participants to clarify or demonstrate some of the types of touches so that everyone understands the touch being described. When an exhaustive list has been compiled, add the photographs of touches to the pile of cards in the middle of the group.
4. PEOPLE AND TOUCHES
Suggested time allowed: 20 minutes
Facilitators should use the photographs and the cards of touches for this exercise.
Stick the relationship category cards onto separate flip chart sheets. Ask each participant in turn to select a photograph or a card and to stick it under the appropriate category heading. It is sometimes helpful to ask the participant to think about and describe the last time they were touched in the way depicted on their card / photograph and to think about who touched them in this way. Help each participant to read the card if appropriate.
AThere will be some types of touches that one should not accept from anyone (e.g. punches, slaps) and these cards / photographs should be handed to one of the facilitators.
Continue until all the cards have been allocated to one group or identified as unacceptable touches. Briefly discuss each touch as there may be some debate about the correct category for the touch. It is likely that some of the touches can be carried out by more than one group of people. If this is the case, the group should discuss the touch and the participant who selected it may decide where it should be placed.
Remember to keep the photographs of touches and the additional touches listed, these will be used next session.
99

KEEPING SAFE SESSION 10
LEARNING OBJECTIVES
By the end of the session, group members should be able to:- identify who they touch in different ways- identify unacceptable touches that no-one should use
MATERIALS NEEDED
Flip chart Coloured pens BallPhotographs and cards of touches (9 photographs)Blu Tak
Before the group, stick the group rules and the flip chart sheet of touches on the wall.
LENGTH OF SESSION
1 hour
SESSION FORMAT
1. NAME GAME
Suggested time allowed: 10 minutes
See sessions 1 and 3 for further details.Omit if no longer relevant.
2. RECAP ON LAST SESSION
Suggested time allowed: 10 minutes
Fâyilitators should open a general discussion about what the participants remember from the last session.
3. WHO WE TOUCH
Suggested time allowed: 20 minutes
One facilitator should read through all the types of touches identified during the previous session.
Spread the photographs of touches and the additional touches listed in the middle of the group. Ask each participant in turn to select one of the photographs or cards and tell the group who they touch in this way. For each type of touch there may be more
23
\ C) 7b
than one group of people involved. The facilitators should remind the group of the relationship categories during this exercise. Discuss each type of touch briefly in turn as there may be some debate about who the participants can touch in this way.
The cards / photographs with unacceptable touches on them should be used to discuss the fact that there are some types of touches no-one should use.
The facilitators should help the participants to think about what they could do if someone touches them in a way they do not like. It is important to reinforce the rule; "say no, go and tell someone".
4. SAYING NO
Suggested time allowed: 10 minutes
Facilitators should lead an exercise to practise saying no. Either individually, or in a group, participants should practise saying no in a loud and confident manner. Feedback should be given to each participant about how serious and firm they looked whilst saying no. It may be helpful to encourage the participants by asking them to say no to humorous questions (e.g. Can I have your shoes ?) This exercise will be repeated each week.
5. WHO WE CAN TELL
Suggested time allowed: 10 minutes
Once all the group members are clear that there are some types of unacceptable touches and that they can say no if they feel uncomfortable with any touch, the facilitators should help each participant to identify who they could tell if someone touehes them in a way they do not like. Typically the lists created include the following people:- group facilitators- residential / day service keyworkers- other trusted staff / managers- families
It is important for everyone in the group to identify a few people they could tell. One facilitator should write the list of people generated on to a flip chart sheet.
At the end of this session, tell the participants that you will be using the video again next week (if appropriate) for more role play. This often helps to maintain participant motivation.
24

KEEPING SAFE SESSION 11
LEARNING OBJECTIVES
By the end of the session, group members should be able to;- role play what to do if someone touches them in a way they do not like
MATERIALS NEEDED
Flip chart Coloured pensRole play cards for touches (2 cards labelled't' on reverse)Video camera (if available)Blu Tak
Before the group, stick the group rules, flip chart sheets of touches and the list of trusted people generated last session on the wall.
SESSION LENGTH
1 hour
SESSION FORMAT
1. NAME GAME
Suggested time allowed: 10 minutes
See sessions 1 and 3 for further details.Omit if no longer relevant.
2. RECAP ON LAST SESSION
Suggested time allowed: 10 minutes
Facilitators should open a general discussion about what the participants remember from last week's session. Reinforce the rule; "say no, go and tell someone".
3. ROLE PLAY
Suggested time allowed: 30 minutes
Use the two role play cards. It is helpful to set up the video camera before the session so that you need only to turn it on to record the role play. If the clients are reluctant to join in with the role play, the facilitators could act out one of the scenarios for the group.
25
Select the first card and read the situation aloud to the group. Lead a groupdiscussion about how the participant should respond to each situation.Once an agreement has been reached, the correct response should be acted out to the entire group. Only safe and correct responses should be acted out.It may be necessary to role play the situation two or three times so that a really goodresponse is shown. Between each role play, group feedback should be obtained.
After the role play exercise, remind the participants that they will be able to watch the video next session (if appropriate).
4. SAYING NO
Suggested time allowed: 10 minutes
Facilitators should lead an exercise to practise saying no.
See session 10 for further details.
After session 11, the facilitators should play the video in order to identify good examples of what to do when someone touches you in a way you do not like. These selections will be used next session.
O R

\ V3U
KEEPING SAFE SESSION 12
IF A VIDEO CAMERA HAS NOT BEEN USED, THIS SESSION SHOULD BE OMITTED.
LEARNING OBJECTIVES
By the end of the session, group members should be able to;- identify what to do if someone touches them in a way they do not like
MATERIALS NEEDED
Flip chart Coloured pens BallVideo of role plays Video recorder and T V.Blu Tak
Before the group, stick the group rules, flip chart sheet of touches and list o f trusted people on the wall.
SESSION LENGTH
1 hour
SESSION FORMAT
1. NAME GAME
Suggested time allowed: 10 minutes
See sessions 1 and 3 for further details.Omit if no longer relevant.
2. RECAP ON LAST SESSION
Suggested time allowed: 10 minutes
Facilitators should open a general discussion about what the participants remember from last week's session. Reinforce the rule; "say no, go and tell someone".
97
V VJ
3. ROLE PLAY VIDEO FEEDBACK
Suggested time allowed: 30 minutes
Facilitators should play the previously selected sequences from the role play scenarios to the group.
A general group discussion should follow each video sequence to identify why the participant's response was good and whether there was anything s/he could have done to make the response even better. Remember to help the group focus upon nonverbal communication (e.g. facial expression, tone o f voice) as well as what the participant actually said.
This discussion should be summarised and the general rule; " say no, go and tell someone" should be introduced as a good way of dealing with any situation you are uncomfortable with.
4. SAYEVG NO
Suggested time allowed; 10 minutes
Facilitators should lead an exercise to practise saying no.
See session 10 for further details.
28
KEEPING SAFE SESSION 13
LEARNING OBJECTIVES
By the end of the session, group members should be able to;- identify private parts of the body- state what to do if someone touches them in these private places and they do not like
it
MATERIALS NEEDED
Flip chart Coloured pens BallLine drawings of a man and a woman Blu tak
Before the group, stick the group rules, flip chart sheets o f touches and list o f trusted people on the wall.
SESSION LENGTH
1 hour
SESSION FORMAT
1. NAME GAME
Suggested time allowed: 10 minutes
See sessions 1 and 3 for further details.Omit if no longer relevant.
2. RECAP ON LAST SESSION
Suggested time allowed: 10 minutes
Facilitators should open a discussion about what the participants remember from last week's session. Reinforce the rule; "say no, go and tell someone".
O Q
\ u 'V
3. PRIVATE PARTS OF THE BODY
Suggested tim e allowed: 30 minutes
Pin the 2 line drawings on the wall so that all the participants can see them clearly.
One facilitator should point to each part o f the body in turn on both the male and female outlines. For each part of the body the facihtator should ask the group to name the body part and identify whether it is alright to be touched here. The other facilitator should write the participants' responses on a flip chart. The parts o f the body to be pointed to in random order on both the male and female body include:- arms- legs- head- chest- genitalia
Briefly discuss each part o f the body in turn as it may be alright for certain people to touch in private places but not others ( e.g. boy or girlfriend). The important point to emphasise is that if the participant does not want to be touched anywhere by anyone, they should say no.
4. SAYING NO
Suggested tim e allowed: 10 minutes
Facilitators should lead an exercise to practise saying no.
See session 10 for further details.
30

V -TW
KEEPING SAFE SESSION 14
LEARNING OBJECTIVES
By the end o f the session, group members should be able to;- state what to do if someone asks them to keep a secret and they do not want to
MATERIALS NEEDED
Flip chart Coloured pens BallBlu Tak
Before the group, stick the group rules and the flip chart sheets o f parts o f the body / touches (created last session) on the wall.
SESSION LENGTH
1 hour
SESSION FORMAT
1. NAME GAME
Suggested time allowed; 10 minutes
See sessions 1 and 3 for further details.Omit if no longer relevant.
2, RECAP ON LAST SESSION
Suggested time allowed: 10 minutes
Facilitators should open a general discussion about what the participants remember from last week's session. Reinforce the rule; "say no, go and tell someone".
:31
3. SECRETS
Suggested time allowed: 30 minutes
Facilitators should introduce the topic of secrets to the group. The aim of this exercise is for participants to be able to tell the difference between "good" and "bad" secrets. One facilitator should lead the discussion while the other writes the participants' comments onto a flip chart sheet.
The participants should be asked to think about and call out what they think a secret is. Typically the definition of a secret includes the following factors:- privacy- something someone tells you- something you must not tell anyone else- may involve a surprise for someone- may be whispered
It is a good idea at this point to help the participants to think about the last time someone asked them to keep a secr^. Participants should be encouraged to tell the group about their secret. Facilitators could also tell the group about personal examples of secrets (e.g. a surprise birthday party for a relative etc.)
At this point, the difference between "good" and "bad" secrets should be introduced, facilitators should clearly establish the idea that if participants feel worried or upset by a secret, they do not have to keep it private. The rule; "say no, go and tell someone" should be reinforced. A general discussion about "good" and "bad" secrets should follow. "Bad" secrets should include the following aspects:- hurt or upset to another person- any form of threat if the secret is broken- dangerous or illegal behaviour- unacceptable touching
4. SAYING NO
Suggested time allowed: 10 minutes
Facilitators should lead an exercise to practise saying no.
See session 10 for further details.
At the end of this session, remind the participants that the group will end after the last session next week.
32
KEEPING SAFE SESSION 15
LEARNING OBJECTIVES
By the end of the final session, group members should be able to:- define the categories of stranger, friend, acquaintance, staff and relative- identify which category of people to do activities with- categorise environments into safe and not so safe areas- identify characteristics which make a place safer or not so safe- identify how to limit the risks of places considered not so safe- identify how to deal with potentially dangerous situations- state all the actions to be taken when approached by a stranger- identify different types of touching- identify who can touch the participants in the ways listed- identify what to do if someone touches them in a way they do not like- identify private parts of the body- state what to do if somone touches them on a private part and they do not like it- state what to do if someone asks them to keep a secret and they do not want to
MATERIALS NEEDED
Flip chart Coloured pens BallRole play cards for situations (4 cards labelled "Q" on reverse)Line drawings of male and female body Flip chart sheets from previous sessions Blu Tak
Before the group stick the group rules on the wall. Do not stick any o f the flip chart sheets created during the previous 14 sessions on the wall as session 15 includes a quiz.
SESSION LENGTH
1 hour
SESSION FORMAT
1. NAME GAME
Suggested time allowed: 10 minutes
See sessions 1 and 3 for further details.Omit if no longer relevant.
33
2. QUIZ
Suggested time allowed: 40 minutes
The aim of the quiz is to briefly recap on the skills learned during the previous 14 sessions. The exact nature and content o f the quiz will vary depending upon the needs o f the group members. The questions listed below are meant only as a guide to ensure that every session is briefly summarised. Answers may be given individually, as a group, verbally or written, depending upon the participants' own preferences.
SUGGESTED QUESTIONS
Relationships
- what is a friend ?- name a friend of yours and something you do with them ?- what is an acquaintance ?- do you have any acquaintances and can you think of something you might do with
them ?- what is a staff member ?- can you name a staff member and something you do with them ?- what is a relative ?- name a relative of yours and something you do with them ?- what is a stranger ?- is there anything you do with strangers?
Situations
- name all the things that make a place safer and not so safe?- can you think of an example of a safe place and somewhere that is not so safe
Role play
- 4 further role play cards (labelled "Q" on reverse) are included so that the facilitators can ask participants what they should do in potentially dangerous situations ?
- what should you do if approached by a stranger?
34

T ouches
- name all the different types o f touching you can think o f and give an example of someone who touches you in these ways 'i’
- what are the private parts o f the body ? (participants may use the line drawings of male and female bodies ?
- what should you do if someone touches you in a way you do not like
Secrets
- what is a secret ?- name a good secret and a bad secret 'i’- what should you do if someone asks you to keep a secret and you do not want to 'i'
After each question, the participants should be given feedback and any general comments or disagreements addressed. The flip charts from the 14 previous sessions should be used as necessary to prompt the participants’ memory and to elaborate on any points raised.
3. ENDING
Suggested time allowed: 10 minutes
As this is the final group session, it is important to find out whether the participants have any queries or concerns about topics covered during the 14 previous sessions. Facilitators need to clarify any issues raised.
Obtain feedback from the participants about how'much they have benefitted from attending the group, whether they enjoyed it and what changes they would like to have made to the session content and format. Reinforce how well they have concentrated and learned.
Remind the participants that you will be seeing them all individually once more to complete the Keeping Safe Knowledge Test End the session by thanking the participants for attending and say "goodbye" Encourage the participants to say "goodbye" to each other if they will not be meeting again
35
REFERENCES
Walsall Women's Group Safety video (1994) Pavilion Publishing
Kidscape Registered Charity. Campaign for Children's Safety 1 52 Buckingham Palace Road, London S W I W 9TR
Practical ways to Crack Crime (leaflet). Home Office, Crack Crime, PC Box 999, Sudbury, Suffolk, CO 10 6FS

' >o
KEEPING SAFE PACK
CONTENTS
5 RELATIONSHIP CATEGORY CARDS (for sessions 2, 3, 9)
10 PHOTOGRAPHS OF PEOPLE (for session 3)
o
( f )LU>
UJû :LL
<LUÙ l

\ —r
CO1 1 1Ü
<
<oo<
LLLL<

( f )0 :LUCD<0 :
( f )

a shop worker
ag
a firefighter
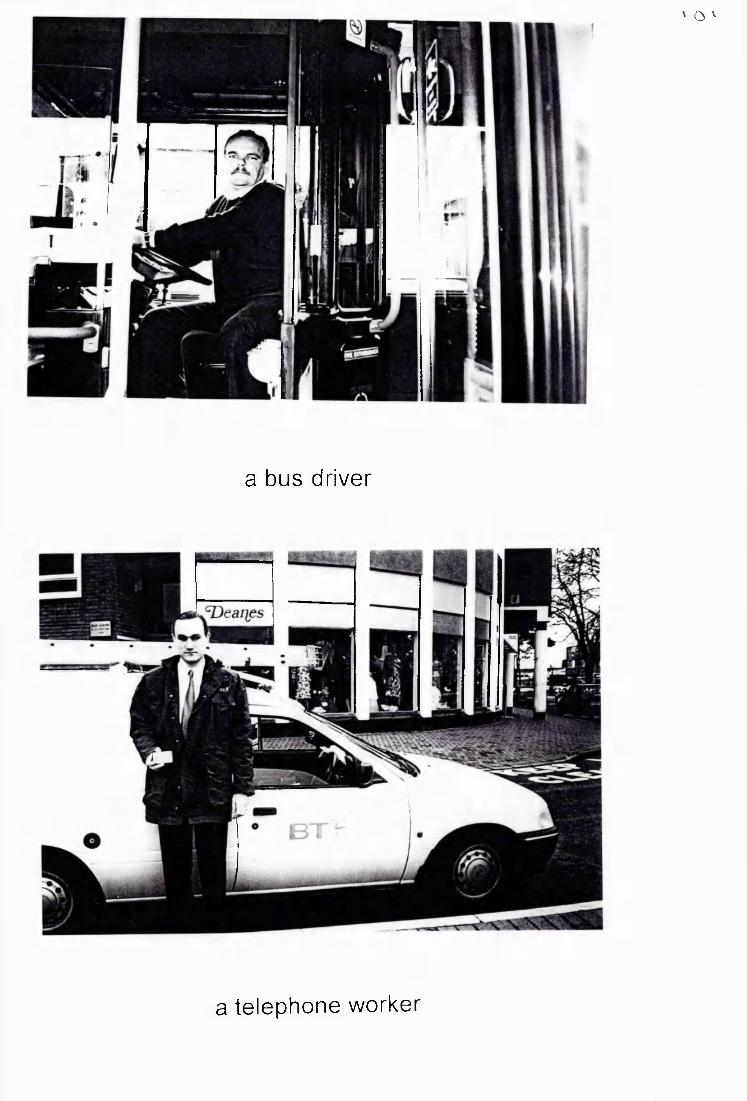
' o '
a bus driver
a telephone worker

\ % -L
a milkman
LL_L_ 1.-1L. L_!
a postman
\ IS
a policeman
miTF?
._ c.-:,.âiüfc
BntishGasS o u t h E a s t e r n
a gas worker
fAM BU LANCER
I xmjcm
an ambulance person
a taxi driver

\ o o
KEEPING SAFE PACK
CONTENTS
2 SITUATION CATEGORY CARDS (for session 4)
19 PHOTOGRAPHS OF PLACES (for sessions 4, 5)
6 SITUATION ROLE PLAY CARDS (for sessions 6, 7)

\
( f )LUO<CLLULL<( f )
LULL< ( f ) if) LUo g( f ) <
OCL

\ o
a day unit dining room
a home
a day unit activity room
. ÉV
a hostel

n i
\ ô \
a cinema
a pub

WALTON UBRARY
'-'////-'' / / / / / ! / f n ■ I j \ \ \ \ \ v\\'\^\v^^\\^^^
^ ^ 'S - 7 . r' .?--.,..-'- , L ..... .."'S^r'ïïSrÿ
a library
T.
a country lane

m m
an alleyway
a street with houses

\ - \
a shopping centre
V.
i
a park
a shop
a busy street

J.L^LLvi.LVL-lL'V-'
j&i I iiim#
MacDonalds
a minibus

\ \ u
8 '.'.'in:,
5!^?^SS8yP<B ieM B W ieiM
a leisure centre
^ # # ^ 1g ^ .
a station

I
public toilets
H—
o3O
3O
s->e s
(D O SZ ^ o - w w p
l'il(/) "^ ü)
— ^ (D 0 CD COTi 0) o
£0
i sO ^ Q. Cü
00Z3O
JZo if)5 g i0 12 5S~ 0 0
8 E E . o o
< 0 o
CDL_ O0 "O0CL
0 [cC "O3 CO
EO LeCL2 r3 00 e0E
oO-
o 3 0o O 0L_ > _C0Oc
00
03
SUms_ 0 0H—»0 "O e «+—'
C< 0 c
i _oo"O Ui.
0 O*L_
s z 0c •+—'oL _ a O
*4— oL _ 0 oZ3O s z 0
o -CZ
O Eo
0 3 00 O s zE >. oo 0 oo
“c0E
2 £
>.X30 _0 00_0) "0 0
00 "O 0e C 0h- 0 e
E
§ . 5 %^ (ü CD
m O3 w ^ o ro 0
"O
H ' I0O
-OC -Eo
00
0 _0 -c:
g0 : ^ O :c: O
ill0 o< E 2
' U
o"U
3O> 4
23o
(SJ Z
oL_O
_0 C"
2 8 -
o m0 E 0 o' U— 0 ^
“O O)
i lg §<C V)
O■ o
3O>
■D3O$05
SZ
cm E8 2 2 (D
I I .^ 0 0
g l |: = (0
h: C: ':= g 0 3 ^> , TO 03
8 1 2 E > (DQ) W
I I I
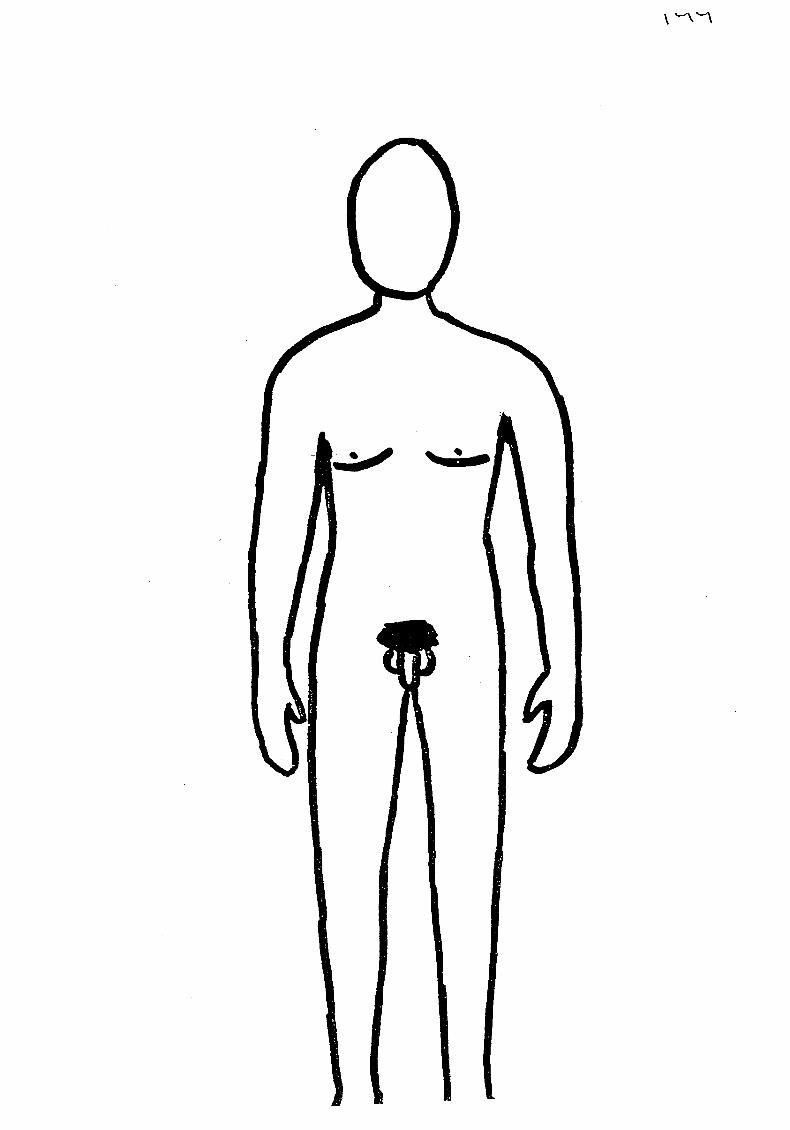
\
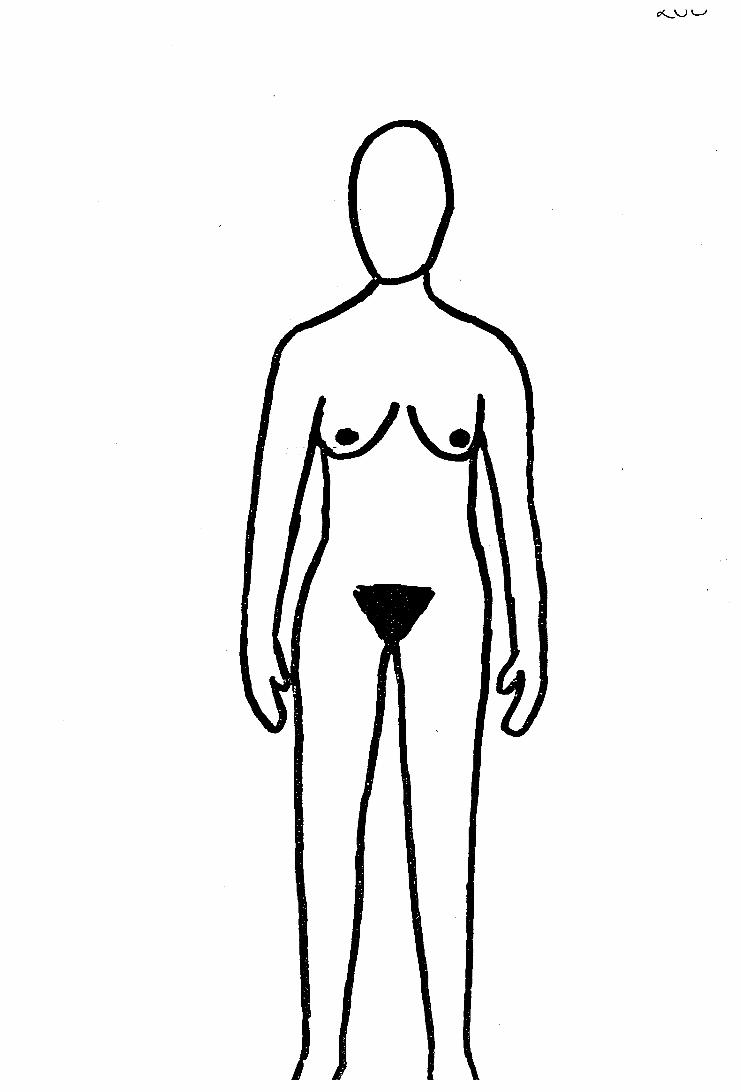
< _ o \
3% r
1 ^
-T
: f
4 ^m
% '%.
, ' f i
Y'
*k,
w».-'ÏN &
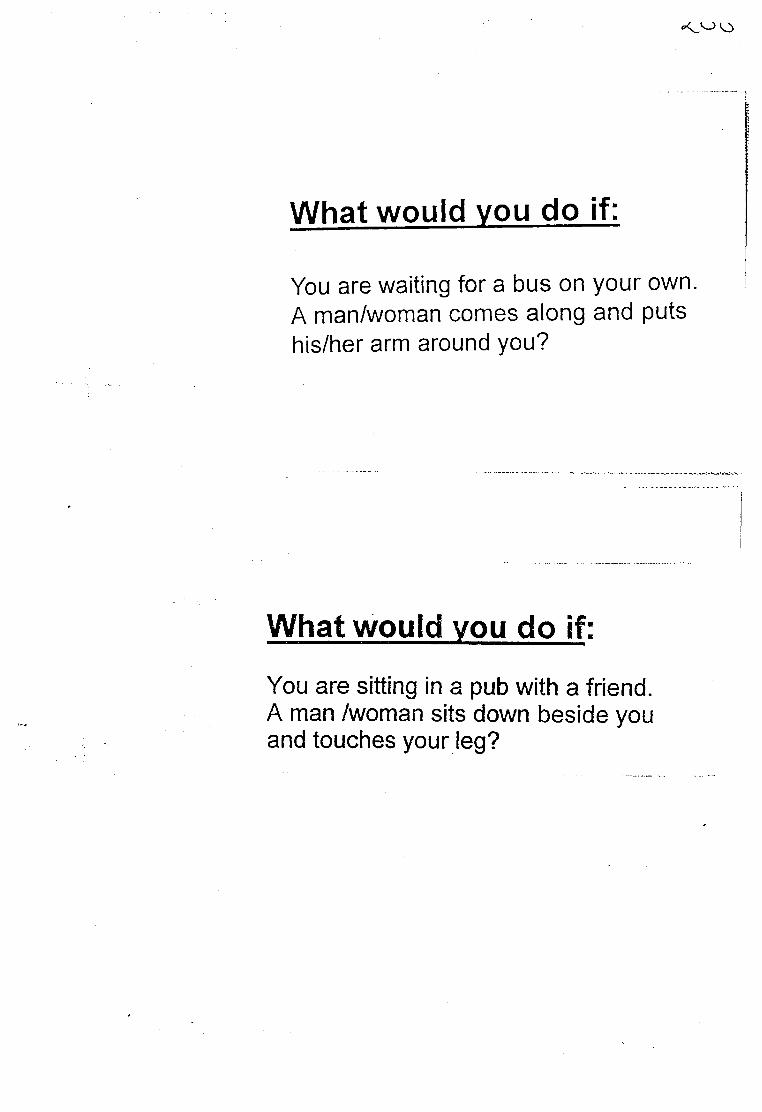
What would you do if:
You are waiting for a bus on your own A man/woman comes along and puts his/her arm around you?
What would you do if:
You are sitting in a pub with a friend. A man /woman sits down beside you and touches your leg?
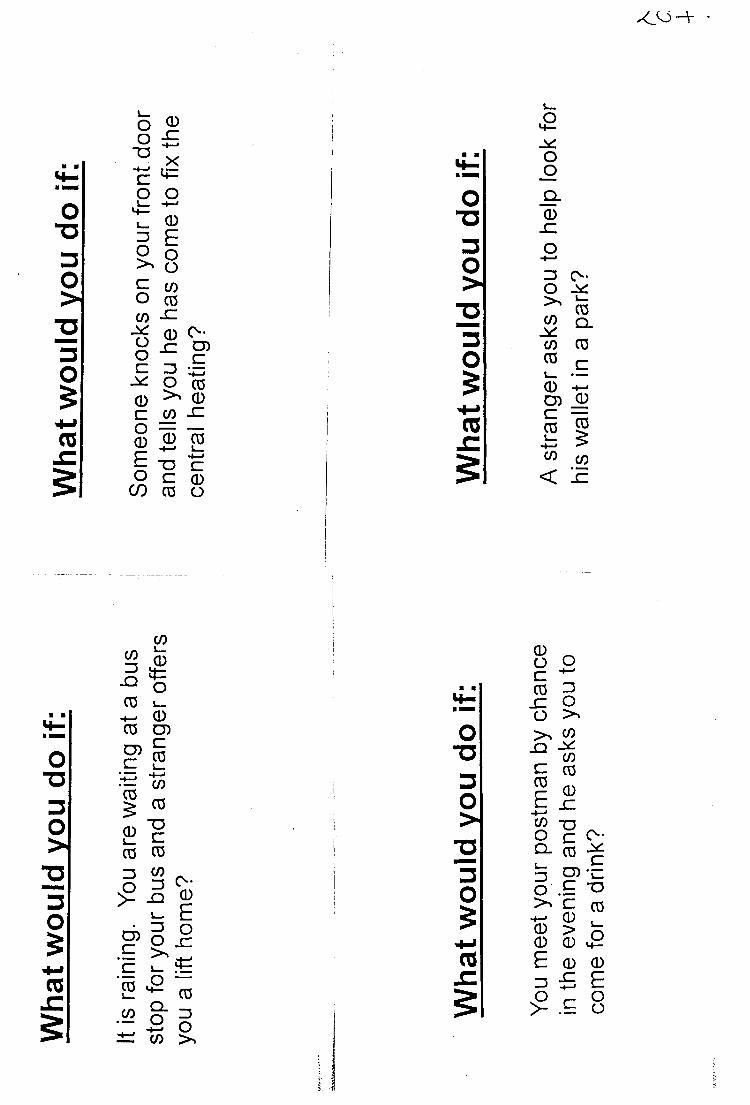
xL<o
OT 3
3O>
3O
(TSJZ
O■D3O>
■O3O
ro.c
L_O CDo e
"O X-4—»c l4=o O
i_ CD3 EO ooC coo coco e
0) o -oo e D )
Cc 3o **♦—»
coCD CDC co eo _ _CD CD coL_E "3 Co C CD
(/) CO O
(/)3
X icocoO)
co50)L_co
1 ^ L_ • “3
p o . 5c V- coL_CO
co
Io&_CDD )CcoH—'coco
"Occoco3 C-
CDE o_C
_ cg
■2 rôt sW > ,
O■D3O>4
3O
(TSSI
OT J
3O>4
■O3O
(Qs:
ooD .0)x:o -+—>=3
1 1CO CO 03 cL _ ----CDD ) ^
m 5co<
coLe
CDO OC «4— '
co 3e Oo>> (0
JDC
cocoCOE CD
SZCO TDo Co_ CO3 O)O c
"c- 4— » CDCD >CD CDE (D3 SZ
>4 — '
c
c -cL_"Oco
(DEoo
SECTION FOUR
RESEARCH DOSSIER
4.1
THE LHTE EXPERIENCES OF ADULTS WITH A LEARNING
DISABILITY: A COMPARISON BETWEEN OBJECTIVE
AND SUBJECTIVE MEASURES
208
THE LIFE EXPERIENCES OF ADULTS WITH A LEARNING DISABILITY:
A COMPARISON BETWEEN OBJECTIVE AND SUBJECTIVE MEASURES
CONTENTS
1. ABSTRACT
2. INTRODUCTION
2.1 Definition of Quality of Life (QOL)
2.2 Theoretical Perspectives
2.3 Research on the QOL of People with a Learning Disability
2.3.1 QOL and Deinstitutionalisation
2.3.2 The Relationship between Residential Placement and QOL
2.3.3 Subjective Reports of QOL
2.3.4 Comparative Studies of QOL
2.4 Assessment of QOL
2.5 Interview Techniques with People with a Learning Disability
2.6 Current Study
2.6.1 Qualitative Research Techniques
2.6.1.1 Grounded Theory
3. METHOD
3.1 Participants
209
3.2 Consent Procedure
3.3 Measures
3.3.1 Intellectual Functioning
3.3.2 Adaptive Behaviour
3.3.3 Verbal Language Skills
3.3.4 Objective Measures of QOL
3.3.5 Subjective Measure of QOL
3.3.6 Subjective Rating Scale
3.4 Procedure
3.5 Data Analysis
3.5.1 Qualitative Data Analysis
3.5.2 Quantitative Data Analysis
4. FINDINGS OF QUALITATIVE DATA ANALYSIS
4.1 Subjective QOL Core Category
4.2 Subjective QOL Model
4.3 Life Domains and Subsidiary Categories
4.3.1 Social Domain and Subsidiaiy Categories
4.3.1.1 Relationships
4.3.1.2 Belonging
4.3.2 Health and Disability Domain and Subsidiary Categories
4.3.2.1 Impact of Disability
4.3.2.2 Additional Health Problems
4.3.3 Community Living Domain and Subsidiary Categories
4.3.3.1 Financial Security
4.3.3.2 Daytime Activity
210
4.3.3.3 Home
4.3.4 Opportunity Domain and Subsidiary Categories
4.3.4.1 Opportunity for Progression and Development through
the Life Cycle
4.3.3.2 Opportunity for Self-Direction
4.4 Domain Relationships and Category Summation
5. RESULTS OF QUANTITATIVE DATA ANALYSIS
6. DISCUSSION OF RESULTS
6.1 Quantitative Data Analysis
6.1.1 Descriptive Statistics
6.1.2 Informant Measures of QOL
6.1.3 Participant Measures of Life Quality
6.1.4 Interview Data
6.2 General Discussion
7. SUMMARY AND CONCLUSIONS
8. DIRECTIONS FOR FUTURE RESEARCH
9. REFERENCES
211
APPENDICES
Appendix 1 : Consent Procedure
Information Circulated to Participants, Families, Carers and other
Involved Professionals
Appendix 2; Health Authority Ethics Committee Consent Letter
Appendix 3: Participant Characteristics (Tables A and B)
Appendix 4: The Life Experiences Checklist
Appendix 5: Daily Diary Sheet
Appendix 6: Semi-Structured Interview Format
Appendix 7: Participant Number Eight Semi-Structured Interview Transcript
Appendix 8: Subjective Rating Scale with Instructions for Use
Appendix 9: List of Data Collated Using the Daily Diary
Appendix 10: Type of Hobbies Engaged in by the Participants
Appendix 11 : Participant Aspirations
212
TABLES
Table 1: Mean Age, IQ, BPVS and ABS-RC:2 Expressive Language Scores for
Total Sample (N=20)
Table 2; Mean Age, IQ, BPVS and ABS-RC:2 Expressive Language Scores for
Men and Women
Table 3: Mean Age, IQ, BPVS and ABS-RC:2 Expressive Language Scores for
Groups 1,2, and 3
Table 4: Median ABS-RC:2 and LEG Scores for Total Sample
Table 5: Median ABS-RC:2 and LEC Scores for Men and Women
Table 6: Median ABS-RC:2 and LEC Scores for Groups 1,2, and 3
Table 7: Median Daily Diary Scores (Categories Providing Group or Gender
Discrepancy Only) for Total Sample
Table 8; Percentage Agreement for the Two Independent Raters on the SRS
Table 9: Median SRS Scores for Total Sample, by Gender and by Residential
Placement Grouping
Table 10; Summary of Interview Findings Showing Differences between
Residential Placement Groups
Tables A, B : Participant Characteristics (Appendix 3)
213
DIAGRAMS
Diagram 1: Model of QOL for People with a Disability (Parmenter, 1988)
Diagram 2: Grounded Theory Data Analysis Process
Diagram 3: Grounded Theory Approach (Pidgeon and Henwood, 1996)
Diagram 4: Subjective QOL Theoretical Model “Perceptions of Current and Future
Life Context (QOL)”
Diagram 5: QOL Model, Incorporating Objective and Subjective Dimensions
214
1. ABSTRACT
The current study was designed to explore and compare the objective and subjective
Quality of Life of adults with a mild to moderate learning disability receiving input
from a suburban multidisciplinary community team comprising both health care and
social services personnel.
20 participants were involved in the study and formed three groups based upon their
current residential placement.
There were no significant differences between male and female participants’ age, IQ,
British Picture Vocabulary Scale (BPVS) or Adaptive Behaviour Schedule (ABS-
RC:2) Expressive Language Scores. Neither were there group differences between the
participants’ IQ, BPVS or ABS-RC:2 Expressive Language Scores. Participants living
with their family were, however, significantly younger than those living in the group
homes.
In order to explore differences between male and female participants and those living
in each residential placement, two objective measures of QOL were administered to
an informant who knew the participant well (prime carer or involved professional).
These were; the Adaptive Behaviour Schedule (ABS-RC:2) and the Life Experiences
Checklist (LEC). The results demonstrated that there was no significant difference
between male and female participants’ scores on either of these measures, indicating
an equal objective QOL rating for men and women. Several residential group
differences did emerge and these are discussed.
The final objective measure of QOL administered to the participants consisted of a
Daily Diary kept over a 14 day period. The diaries were kept by the participants with
help from carers as necessary. Several significant differences in the diary records
emerged between the groups and between male and female participants. The
differences in the daily diary records are discussed.
215
In order to obtain information on the participants’ subjective perceptions of their life
quality, a semi-structured interview was developed for the purpose of the current
study. Items included in the interview schedule were selected following a review of
the literature. The interviews were audiotaped and transcribed to allow qualitative
analysis using the grounded theory technique (Henwood and Pidgeon, 1995). A
theoretical model of subjective QOL, termed; ‘Perceptions of Current and Future Life
Context (QOL)’ was developed.
The objective and subjective approaches to the study of QOL of adults with a learning
disability are discussed. Consideration of the objective aspects of an individual’s life,
enhanced with exploration within the ‘Perceptions of Current and Future Life Context
(QOL)’ model seemed to provide the most comprehensive picture of QOL and
provided support for the interactional models of QOL. Appropriate literature and
future directions for research are highlighted.
216
2. INTRODUCTION
The current research explores the relationship between objective measures of Quality
of Life (QOL) and the subjective reports of life experiences and satisfaction of a
group of adults with a mild to moderate learning disability living in the community in
a variety of residential, social and employment settings. Definitions of QOL and
theoretical perspectives are summarised, followed by a review of the research into the
QOL of adults with a learning disability. Issues to be considered when carrying out
research and, in particular, semi-structured interviews, with this client group are
examined. Finally, the stages of development, hypotheses and data analysis
techniques used in the current study are summarised.
2.1 Definition of QOL
In 1948 the World Health Organisation defined health as;
“ûf state of complete physical, mental and social well-being and not merely the
absence of disease‘s (pp34).
This definition prompted interest and research into many aspects of health, including
QOL. However, defining QOL is problematic. Many different definitions of QOL
have been proposed by different authors, representing their own individual
orientations.
One definition of QOL stated that it was the discrepancy between an individual’s
achieved, and their unmet needs or wishes. Thus, the greater the gap between these
two, the poorer the individual’s QOL (MacFarlane, Norman, Streiner, Roy and Scott,
1980). Other authors have emphasised the concepts of autonomy and power. The
degree to which individuals increase personal control of their environment is
important, rather than absolute baseline levels (Brown, Bayer and MacFarlane, 1988).
Other researchers have stressed the changing nature of QOL. Compensations are
made over a lifetime as individuals have different wishes and perceptions of personal
fulfilment at different lifetime stages. In a similar way, overall QOL has been seen to
217
relate to improvement over time and to be negatively affected by any deterioration in
skill and performance. This stance may suggest that older adults or those with
physical, learning or sensory disabilities may be expected to have a poorer QOL than
younger, physically fit adults. However, this may not necessarily be true and it is in
explaining this discrepancy that the personal needs and individual perceptions of
change over time become important (Brown, 1988).
Parmenter (1988, pp30), mainly concerned with the QOL of physically disabled
adults, stated that QOL was best described as;
"\,.the degree to which an individual has met his/her needs to create their own
meanings so they can establish and sustain a viable self in the social worlds
Parmenter goes on to develop a useful model of QOL which is reviewed later (Section
2.20.
QOL has also been stated as relating to the people that surround an individual, the
situations within which they live and their future hopes for a continued and
developing life. So, QOL is a complex concept, partly concerned with internal
processes which are not readily measured by traditional analysis techniques favoured
by psychologists. The views an individual has about him/herself, the enjoyment
he/she experiences and the problems he/she faces will all combine to make up QOL
(Brown, 1988).
There is still a debate about whether a definition of QOL should rely mainly on
objective measures, on subjective indicators or on a combination of the two.
Objective measures include factors such as; income, number of friends, hobbies and
so on. Subjective indicators include issues such as satisfaction with housing or the
person’s own appraisal of his/her social relationships. Interactional models describe
the relationship between an individual’s skills, emotional needs and his/her
environmental situation.
Supporting the subjective definition, Taylor and Bogdan (1990) suggested that the
concept of QOL had little meaning other than a person’s feelings and experiences.
218
The important issue for these researchers was how people viewed their lives and not
others’ attributions. Andrews and McKennell (1980) argued that actions
(behaviours), feelings (affect), and values (cognitions) all interacted to determine a
person’s level of well-being or QOL. It was this definition, combined with
Parmenter’s (1988) interactional model of ‘societal influence’, ‘fimctional
behaviour’, and ‘self which was favoured by the current author during the
exploration of the literature on QOL.
Thus, any definition of QOL must reflect the values, aspirations and perceptions of
the individuals it relates to, as well as incorporating behaviours within a range of life
domains and societal variables. Gergen (1988) claimed that different researchers, and
sometimes the same researcher at different times, have used incompatible definitions
and assumptions about QOL.
2.2 Theoretical Perspectives
One of the problems in the literature on the QOL of individual members and groups
within society is that few studies have explicitly used a model of QOL. A number of
theoretical models have been developed (Parmenter, 1992). The emphasis of these
models varies from community adjustment (Halpem, Close and Nelson, 1986), to
programmatic intervention, programme improvement/outcome evaluation and the
assessment of person-environment fit. A common element of these models is that they
stress that QOL must be seen, at least in part, as a subjective experience.
Parmenter (1988) highlighted three main focuses of studies attempting to measure
QOL;
• Social indicators
These may be measured objectively and present a somewhat narrow
perspective
• Measures of life satisfaction
219
This is the individual’s subjective, or perceived, QOL. These measures
include cognition and affective states such as an individual’s aspirations,
values and feelings (McKennell and Andrews, 1983). They also relate to the
patterns of individual personal relationships (Bateson, 1972) and the attitudes,
expectations and behaviours of individuals (Kennedy, Northcott and Kinzel,
1977). In the case of more severely learning disabled individuals, the
philosophy and attitudes of staff who work with the person are of particular
importance and are believed to contribute significantly to QOL.
• Behavioural responses to the environment
This includes responses to factors such as noise, crowding, amount of privacy,
income, home environment etc.
There are several possible ways to develop a working model of QOL. The first is to
measure aspects of service delivery, such as quality of care or environment and to
equate these with QOL. The problem with this definition is that it seems to confuse
the issue still further. Measures of service delivery may be related to an individual’s
QOL but surely cannot be equivalent to it.
The second method is to use the researcher’s own personal definitions of QOL and to
develop a means of measuring them. However, this too provides no further insight
into the problem since it does not address QOL as an unitary concept, but rather as a
term which could have as many definitions as it has researchers. Additionally, it is
extremely difficult, if not impossible, to compare, contrast and utilise different
definitions and models or may leave implicit these guiding theories.
A final method is to explore community studies of QOL and draw up measures based
upon them or to involve members of the local community in the development of
working definitions. Similarly, it is possible to develop consumer feedback methods
which allow assessment of the QOL of people with a learning disability or any other
group of society. Studies have shown that it is possible to involve people with a
220
learning disability in service evaluation (Flynn, 1986; Flynn and Saleem, 1986; and
Atkinson, 1988).
Models differ with respect to which aspects are defined as outcome measures or
indicators of perceived QOL. Flanagan (1978, 1982) and Campbell (1976) stated that
psychological indicators focus on a person's subjective reactions to life, particularly
on psychological well-being and a sense of personal satisfaction and happiness.
Psychological well-being manifests itself in five general dimensions of QOL:
Physical and material well-being
Relations with other people
Social and civic activities
Personal development
Fulfilment and recreation
How a person feels and experiences life is considered to form the core of subjective
evaluation. Rodgers and Converse (1975) made a further distinction between affective
components (happiness) and cognitive components (satisfaction). This distinction was
also recognised by Zautra and Goodhart (1979) and Hall (1976). Zautra and Goodhart
stated that happiness was a short term emotional state whereas satisfaction involved
the evaluation of a situation in contrast to an external standard of comparison. This
model has been termed the Adaptation-Level Model (Zautra and Goodhart, 1979) and
suggested that people can evaluate their experiences by comparing them against a
baseline and with others.
More recently, Zautra and Reich (1983) have proposed a two-factor approach to life
events and perceptions of QOL. They studied the effects of positive and negative life
events on psychiatric distress and concluded that positive life events produced only
positive affective states and negative events influenced only negative states. Negative
events closer to the individual's self-concept and attributed to internal and stable
causes seemed to have more pervasive effects on affective states and reduced self
esteem. The timing of an event was also crucial as a positive event was stated to
reduce distress if it occurred during a time of high life stress.
221
Another model focuses on the measurement of the perceived QOL in relation to time.
Components of the past, the present and the future are taken together and examined
longitudinally. This method can be used to measure change in attitude over time,
making it possible to assess the;
"psychological correlates of social change as experienced by individuals" (Hall,
1976, pp25).
Dalkey, Rourke, Lewis, and Snyder (1972) suggested that time may be broken down
into sequences of life events. These events are categorised into properties or qualities
(such as freedom, sociability, novelty), which are scaled. Major events in a person's
life are therefore rated in terms of behavioural adjustment as well as psychological
growth.
Contrastingly, objective evaluators have proposed a scientific and systematic
approach rather than an intuitive and subjective one. Lippman (1976, pplSl)
suggested that objective models should;
"constitute a set of indicators of societal concern for...(learning disabled)... persons".
These indicators may then be applied to community settings, both locally and cross
culturally. The QOL of learning disabled people would be measured according to the
indicator score of the wider society within which they lived. Lippman developed ten
'criteria of concern ’ (health, education, work, social services, income etc.) which he
postulated would reveal a society's treatment of individuals with a learning disability
or any group of individuals within that society. Interestingly, Lippman did not take
into account the views of learning disabled people when carrying out his research or
when developing the ^criteria of concern \ as he stated they would be the least able to
conceptualise and articulate the complex issues raised. Lippman stated that even if it
was possible to seek the views of the most able people with a learning disability, they
would not be able to represent the views of the learning disabled population as a
whole.
222
The final perspective combines both the objective and subjective approaches. Zautra
(1983, pp282) attempted to construct a model which provided a link between social
resources (objective approach) and psychological well-being (subjective approach).
This method involved analysis of;
"how statements about one's resources that differ in affective and cognitive features
correspond with subjective evaluations of life quality made by a cross-section of
community residents".
Zautra argued that straightforward predictions could be made with respect to the
effects of events and resources on the well-being of the person. He identified three
important social resource measures. The first assessed shortcomings of the
individual's social network. The second identified internal resources, for example;
degree of self-reliance or degree of responsibility felt toward others. The third
measure assessed resources that came from external sources such as help from family
and friends. This study revealed that a positive experience of support coincided with
reports of positive affect. Social network blame was related, however, to negative
affect and psychiatric distress. By showing that positive social indicators correlated
with positive affect and vice versa, Zautra attempted to provide a link between
objective (social resources) and subjective (cognitive-affective components)
dimensions. Whilst this study showed how both subjective and objective components
of QOL may be evaluated and measured it did little to provide an alternative to the
usual dichotomy between objective and subjective viewpoints.
Gergen (1985) also supported the interactive approach and proposed a model of QOL
consisting of four classes of variables: money, time, sentiment and skill. According to
Gergen, the strength of each of these variables lay in its applicability to individuals as
well as to organisations. As Gergen's main focus of study was the process of
maintaining QOL, he perceived the variables as ‘flowing’ in a social organisation.
This fluidity was meant to prevent the dichotomy between subjective and the
objective approaches.
223
However, in order for this model to be useful, the individual must be in a position to
participate in a variety of settings. Participation entails that individuals have sufficient
resources to ensure reciprocal relationships. Those who lack the resources to achieve
this, as many people with a learning disability do, will find themselves in an
inescapable situation. Parmenter (1988) recognised this situation and contended that
the person with a disability must cope with the negative aspects of their personal
condition as well as with their negative socially assigned identity. He showed how
difference/deviance from the socially accepted norm did not allow people with a
learning disability to establish a viable social position (by a process of ‘symbolic
interactionism ’). In order to counteract this situation, Parmenter favoured a model
comprising a ^rational marriage ’ between objective and subjective indicators. This
model consisted of three components; self, functional behaviour and societal
influences.
Parmenter highlighted the process of interaction within and between these
components, as well as between their sub-components. As the components related to
the individual as well as to society, they were stated to form a ‘symbolic
interactionist/ecological modeV. As with Gergen's negotiating framework, in the
interactionist model, the demarcation between the individual and the society
remained distinct. Parmenter (1988, pp29) highlighted this fact when he stated that:
"What becomes paramount is how that person (with a learning disability) grows and
develops as an autonomous individual, with an opportunity to achieve his/her hopes
and aspirations".
The strength of this model is probably its emphasis on how well the person with a
disability perceives him- or herself within a community.
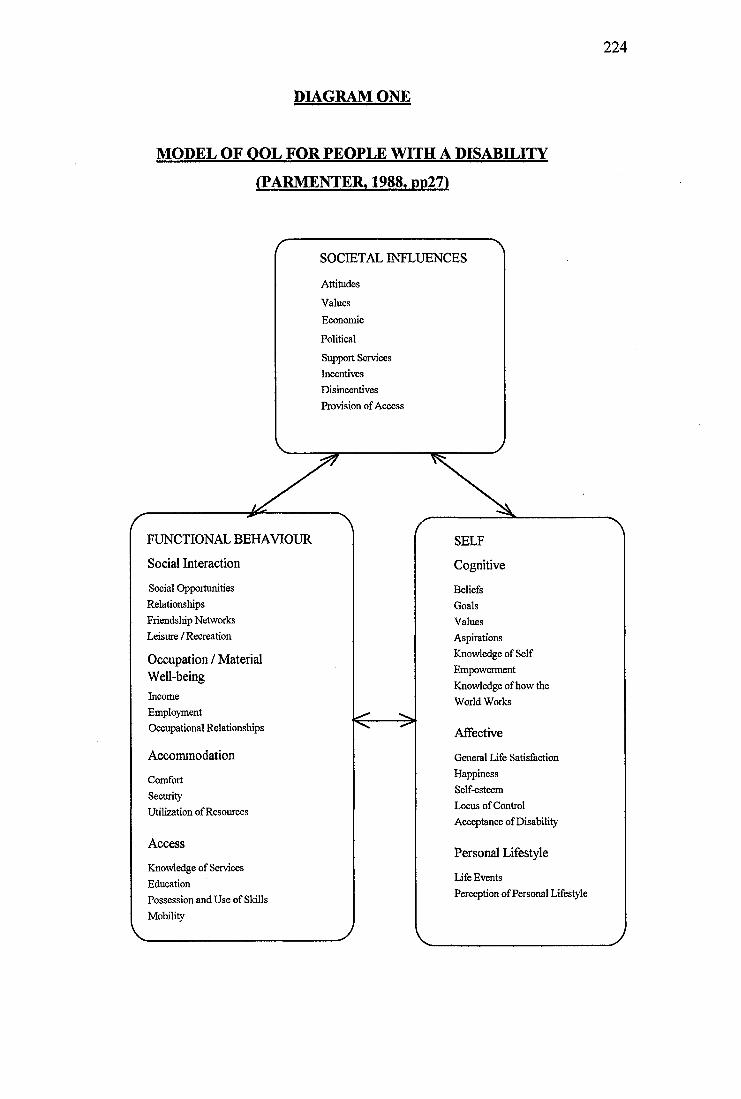
224
DIAGRAM ONE
MODEL OF OOL FOR PEOPLE WITH A DISABILITY
(PARMENTER. 1988. pp27)
SOCIETAL INFLUENCES
Attitudes
Values
Economic
Political
Support Services Incentives Disincentives Provision of Access
FUNCTIONAL BEHAVIOUR
Social Interaction
Social Opportunities Relationships Friendship Networks Leisure / Recreation
Occupation / Material Well-beingIncomeEmploymentOccupational Relationships
Accommodation
ComfortSecurityUtilization of Resources
Access
Knowledge of Services EducationPossession and Use of Skills Mobility
SELF
Cognitive
BeliefsGoalsValuesAspirationsKnowledge of SelfEmpowermentKnowledge of how theWorld Works
Affective
General Life Satisfaction Happiness Self-esteem Locus of Control Acceptance of Disability
Personal Lifestyle
Life EventsPerception of Personal Lifestyle
225
Blimden (1988) contributed to the development of a more global concept of QOL by
defining it along four interacting dimensions: physical, cognitive, material and social
well-being.
Physical well-being encompassed both good health, fitness and presence or absence
of disability. Material well-being involved the possession of an adequate income,
home environment and means of transport. Social and cognitive well-being were
considerably more difficult to define. Blunden defined social well-being as the extent
to which an individual was able to enter into rewarding social relationships with
others. Social well-being involved aspects of the social environment first identified as
important by O'Brien (1987) and included:
• Community Presence.
The basic ability of an individual to live his/her life in the company of other
individuals.
• Choice.
The ability to make small, everyday decisions such as what to do, wear and
eat, as well as important decisions such as where to live or with whom to live.
• Competence.
The ability to perform basic skills in areas such as mobility, daily living and
communication.
• Respect and Value.
The literature on devaluation (Wolfensberger, 1972) illustrated how groups of
people perceived as different from the rest of society may become stigmatised
and treated as inferior.
The result of a high degree of social well-being was stated to be that the person
entered a series of valued relationships with others, had a network of friends and
family as well as colleagues and acquaintances and enjoyed a mutually rewarding set
of interactions with these people.
226
Cognitive well-being focused on satisfaction with life and a positive life ‘story \ It is
assumed in much of the literature that the absolute determinant of an individual’s
QOL will depend upon whether the individual expresses satisfaction and happiness
with his/her life. One way of exploring this is to examine the individual’s
interpretation or ‘story’. The assumption is that the cognitive aspects of well-being
are the real dependent variables. If the physical, material and social aspects of an
individual’s life are satisfactory then s/he will express a high degree of satisfaction.
This assumption may be flawed. It is quite possible to see how one may have access
to physical, material and social resources and yet still report little happiness or
satisfaction with life. Thus, whilst there is a degree of correlation between cognitive
aspects of well-being and the other aspects of QOL, it seems by no means clear that a
simple relationship exists.
Zautra and Goodhart (1979) provided a good example of an approach used to
subjectively analyse QOL. They used major events in a person’s life as a base to
develop four models (epidemiology, life crisis, competency and adaptation). The
epidemiology model drew attention to factors in people's lives which may lead to
mental disorder. Life crisis focused on major life experiences. Psychological
deterioration or growth was determined according to whether the crisis was resolved
successfully or unsuccessfully. The competency model viewed QOL as arising from
experiences of self-mastery, efficacy and competency. The final model, adaptation,
suggested that people evaluated their experiences by comparing them against a
standard or baseline consisting of their own previous experiences and of comparison
made with others. The authors proposed a positive mental health model based on two
complementary sets of needs; learning to adjust to life experiences and developing
and sustaining life-satisfaction. They stated that fulfilment of adjustment and life
satisfaction needs led to enhancement of QOL. Dossa (1989) stated theoretical
models have so far fallen short of developing a holistic framework where the
dichotomy between the subject and the object is minimised.
Ill
2.3 Research on QOL of People with a Learning Disability
QOL is an important concept with people with a learning disability for various
reasons:
• Policy planners have wanted to use it as a measure of the effectiveness of
their policies, especially as a measure of the quality of services.
• Professionals attempting to enhance QOL of people with a learning disability
have used the concept as a tool for understanding and discussing these issues
with both disabled and non disabled populations.
People with a learning disability have the same rights to an enriched QOL as
the non-disabled population. Means of measuring this are essential to
safeguard against exploitation and to measure service and client progress.
QOL is a challenge to researchers because of its complex construction and
consequent methodological problems.
Much of the clinical work of learning disability community teams is directed
at improving the adaptive functioning and life satisfaction of clients
(MacKenzie and Langa, 1994).
The QOL of people with a learning disability has been measured and evaluated with
reference to daily life, social interactions, quality of services, access to resources, and,
very occasionally, to the perceptions, views and experiences of the participants
themselves (Dossa, 1989).
In 1989, Schalock, Keith, Hoffman and Karan (pp25) stated that the concept of QOL
would:
"...replace deinstitutionalization, normalisation and community adjustment as the
issues of the 1990s".
228
Early research into the QOL of learning disabled people tended to make assumptions
about this client group. It was expected that QOL was in some way affected by the
person’s disability and that the provision of services would generally contribute to an
enhancement in QOL (Blunden, 1988). However, much of this early research left the
term QOL undefined, either varying according to the research author’s personal
preferences and biases, or limited to a single component assumed to contribute to
QOL (e.g. engagement, physical surroundings, involvement in community based
activities). As mentioned previously, QOL is a complex concept which is often ill
defined in the literature (Brown, 1988). However, it can be readily interpreted as an
extension of the philosophy of normalisation (Niqe, 1976; Social Role Valorisation,
Wolfensberger and Glenn, 1978) and has pertinence both to national guidelines on
standards of service, living conditions and to service evaluation or individual
programme planning (Bonano, Gibbs and Twardzicki, 1982). The philosophy of
normalisation (social role valorisation) involves;
"...the use of means which are valued in our society in order to develop and support
personal behaviour, experiences and characteristics which are likewise valued"
(O'Brien and Tyne, 1981, ppl3).
Schalock (1989) stated that recent interest in QOL of community placed people with a
learning disability was due to:
• The demonstration that social environments have considerable impact on an
individual's way of life (Edgerton, 1990)
• The fact that complex programmes require complex outcome measures
• The re-emergence of the holistic health perspective
• The concern of many people about how others find satisfaction and life quality
in a rapidly changing world
Porterfield, Blunden and Blewitt (1980) carried out a study of the use of engagement
as a measure of QOL. Levels of engagement featured highly in the early studies of
QOL. This measured the extent to which an individual was able to interact
constructively with their environment and was hypothesised to provide a measure of
social well-being. Many of the early studies into the QOL of people with a learning
229
disability were also interested in evaluating changes in the organisational aspects of
day and residential services. Porterfield et al. concluded that it was possible to
enhance the QOL of learning disabled people by facilitating changes in the way staff
were organised and interacted with their clients.
In 1980, an important and long term evaluative programme was started called New
Ideas for the care of Mentally Retarded people in Ordinary Dwellings (NIMROD;
Mathieson and Blunden, 1980). This was a pilot, comprehensive, community based
service in Cardiff, Wales which was triggered by the 1971 White paper ‘Better
Services for the Mentally Handicapped^. This paper emphasised care in the
community and the provision of a wide range of support services. At the time the
evaluation was started, client competence, as reflected by increase in skill levels, was
considered to be the major QOL outcome to be measured. Clients' use of community
facilities and contact with friends and relatives and their physical well-being were
also examined (Humphreys, Lowe and Blunden, 1983).
This research outlined how evaluation of services could contribute to the promotion
of QOL for learning disabled people. By measuring and providing feedback on
aspects of people's well-being, research could influence both the design of new
services and the way in which they developed over time, hopefully making them more
responsive to the QOL needs of their users (Blunden, 1988) .
2.3.1 QOL and Deinstitutionalisation
QOL and the resettlement of people with a learning disability from long stay
institutions has been a major focus of research. Evans, Todd, Blunden, Porterfield
and Ager (1987) carried out a short term study designed to measure the impact of
moving on the life style of adults with a learning disability. This study involved the
use of a diary system to gather information as well as observational data to chart
changes in people's location, activity and contact before and after the move. Once
again this study focused primarily on aspects of social well-being. The Adaptive
Behaviour Scale Part One (Nihira, Foster, Shellhaas and Leland 1974) has been
230
frequently used throughout the literature to assess whether an improved QOL is found
following a move from institutional to community placements. In this research,
adaptive behaviour represented the dependent QOL variable. Overall studies have
tended to show gains following a move from hospital to the community (Felce,
DeKock and Repp, 1986; Lowe, Felce and Orlowska, 1993; Roy, Abdalla, Smee,
Fullon, Simon, Blincoe, Hayes, Shaw and Marsh, 1994).
Felce and Perry (1995) carried out a study, also using the Adaptive Behaviour Scale
(Nihira et al., 1974), to assess adaptive behaviour gains in ordinary housing
placements for adults with a learning disability. The residents of staffed houses were
assessed at the beginning, middle and end of a two year period. Changes in the
Adaptive Behaviour Scale were calculated to ascertain whether the residents
experienced continued development, and hence an assumed continued improvement
in QOL, following resettlement from institutional to community placements.
Although some participants changed little and some lost skills, generally, Felce and
Perry interpreted their results as reflecting an enhanced QOL following resettlement.
Most participants' levels of adaptive behaviour were found to increase over time. This
finding was particularly evident among the most severely disabled clients.
Similar studies were carried out by Emerson, Beasley, Offord and Mansell (1992) and
Mansell and Beasley (1990), who presented data from an evaluation of a move from a
hospital to a community setting. These studies found that when clients moved from
hospital there was an increase in staff time and facilities available to them in the
home. More attention was given to those with severe challenging behaviour and a
learning disability. Despite the increase in activity and interaction for some clients,
these results still highlighted surprisingly low levels of interaction. Although a very
small scale study, the results showed that engagement in activity and levels of
challenging behaviour were not consistently improved when substantial
environmental enrichment was achieved. Several factors have been identified as
mediating such results, including the staff performance in ensuring available
opportunities are taken up and that structured intervention packages are carried out
(Emerson et al., 1992; Felce, 1993).
231
Dagnan, Trout, Jones and McEvoy (1996) explored the changes in behaviour/QOL of
four men with a learning disability and challenging behaviour transferred from
hospital to a community placement. The model of QOL used in this study was derived
from the normalisation perspective with an emphasis upon activity and integration.
The measures used included the Compass (Multiperspective Evaluation of Quality in
Home Life) developed by Gragg and Look (1992) and daily records of activity. The
authors found that following the move, many more unsegregated facilities were used
and there was a substantial increase in the amount of time residents were engaged in
communication and activities. The authors concluded that the QOL of the four
participants had improved following the move from hospital, especially in the areas of
activity, choice and dignity.
Hewson and Walker (1992) reported on an evaluation which was designed
specifically to influence development of a residential service for adults with a
learning disability. They found that overall the mean level of client engagement
across the residential placements studied was 49.69% of all observations. These
results represented a considerable improvement evidenced by Mansell and Beasley
(1990). However, the engagement levels of certain individual residents remained
unacceptably low. Additionally, the variation in engagement levels across placements
showed that, whilst some placements had demonstrated that substantial levels of
engagement were achievable, others showed little or no improvement on the levels of
engagement shown previously in institutional settings (Cullen, Burton, Watts and
Thomas 1983; Rawlings, 1985).
These levels of staff interaction (mean 21.4%) were encouraging as they compared
favourably with findings from other community settings (Felce, DeKock and Repp,
1986). More detailed analysis of interactions showed that approximately 80% of staff
contact with residents was neutral (i.e. neither facilitating positive activities nor
discouraging negative behaviour). Similarly, in half of the placements, staff spent less
than 10% of all observations directly assisting residents in positive activities. Some
individual residents who required little staff contact also showed very low levels of
engagement and significant levels of disturbed behaviour.
232
Furthermore, most residents had insufficient time and opportunity to establish links
with their community, led extremely restricted lives and tended to spend very little
time in their own homes with people other than staff and other residents. For most
clients, visitors were usually relatives. Similar findings have been obtained in
previous studies (Bratt and Johnson, 1988).
A more refined study was carried out by Dagnan, Howard and Drewett (1994). This
study explored the QOL of adults with a learning disability who moved firom an
institutional to a community placement compared with matched controls who
remained within the institutional settings. This research formed part of a sequence of
studies carried out to explore aspects of change in the participants following
resettlement. The authors used a time-budget diary completed over a seven day period
to record each occasion that the participant left his/her home, the other people
accompanying him/her on each trip, the mode of transport used and the destination of
each outing. The diary was completed prior to leaving the hospital and again at least
12 months after the move. Dagnan et al. found that there was a strong correlation
between the number of trips made from the hospital and the number of trips made at
follow-up in both groups of participants (i.e. if the participants made many trips prior
to discharge from hospital they made many trips 12 months after discharge; the
matched controls who made many trips at time point one continued to make many
trips at time point two). Moving from hospital had no significant effect on the number
of trips made, however it did have an effect on the nature of the trips. After leaving
hospital many more trips were classified as maintenance trips, that is, trips necessary
for the continued functioning of the home (e.g. shopping trips etc.). Additionally,
those who moved made more trips to unsegregated facilities (i.e. those not
specifically for adults with a learning disability), made fewer trips alone and more
trips with other residents and staff members. One strength of the Dagnan et al. study
was the time-budget diary system used, which allowed recording of details which
have not usually been available from retrospective interviews (Robinson, 1985).
Entries in the diaries were, however, made by staff. The diary system is used in the
current study.
233
In 1995, Dagnan, Look, Ruddick and Jones presented a further longitudinal study of
the QOL experiences of residents of community-based homes after leaving hospital
(N=36), using a measure of QOL called Living in a Supervised Home: A
Questionnaire on QOL (Cragg and Harrison, 1986) repeated before and after leaving
the hospital. They found a significant increase in QOL following the move across all
subscales. The study also showed that residents generally lived no closer to
community facilities. Following the move there was an increase in the use of facilities
and contact with non-disabled people. Additionally, there were several changes in
staff behaviour following the move hypothesised to enhance the residents' QOL. Staff
tended to eat with the residents and had greater expectations of positive changes in
resident behaviour and skills. However, the results of this study were largely
consistent with previous studies which showed that social interactions for people with
a learning disability in the community were largely limited to those with fellow
residents, staff and family members (McConkey, Naughton and Nugent, 1983; Allen,
1989). Generally, studies have tended to show little change in the frequency of
activity following the move from hospital to community based care if baseline
activity is accounted for (Dagnan et al., 1994).
Emerson (1985, pp282) stated;
"All too often community services conspire to re-enact the very same institutional
processes of ensuring the physical and social isolation and stigmatization of
handicapped persons".
However, studies solely relying upon objective measures of client behaviour and
activities, or changes in these over time, utilise a very narrow and simplistic definition
of QOL. It is highly debatable whether the aspects of participants’ lives measured in
these studies such as interaction, engagement, outing type and frequency really do
fully encompass QOL. The subjective reports of people with a learning disability are
further discussed in Section 2.3.4
234
2.3.2 The Relationship Between Residential Placement and QOL
In studies of the QOL experienced by adults with a learning disability, it is important
to be able to identify characteristics of homes that are associated with positive
outcomes. In 1994, Dagnan and Drewett carried out a study on the effect of home size
on the activity of adults with a learning disability who had moved from a hospital to a
community setting. Previous studies of the effect of home size had suggested that this
variable was important in determining staff-client contacts, friendship formation and
levels of aggressive behaviour (Balia, 1976; Baroff, 1980; Landesman-Dwyer, Stein
and Sackett, 1978). DeKock, Saxby, Thomas and Felce (1988) found considerable
differences in the number of trips made from the home between people with learning
disabilities living in larger hostels and those living in small group homes. Dagnan and
Drewetfs study involved people with a learning disability leaving hospital. The
number of activities that participants engaged in outside the home during one week
was recorded using a diaiy. Home size, degree of learning disability and number of
trips made prior to the move were correlated with the number of trips made after
moving. The authors concluded that the process of selection of participants for
particular houses took into account overall degree of disability and general level of
mobility. Thus, more able people and more mobile people were selected into smaller
houses.
However, Reiter and Bendov (1996, pp97) have noted that;
"...Little research was done, however, to compare the QOL, as perceived by the young
adults themselves, who either remained at home or left to live independently in group
homes. "
Their study aimed to tackle some of these issues and concluded that;
"...it is no longer to be taken for granted that living independently or in group homes
in the community is, by definition, better than living at home with one's parents".
Ordinary housing has been widely accepted as a necessary prerequisite for the pursuit
of a good QOL for people with a learning disability. Felce (1993, pp49) stated;
235
"...ordinary housing establishes a life for people with disabilities...familiar to us all,
and [has] stood the test of time for the majority of the population."
However, Emerson and Hatton's (1994) comprehensive review of the literature (UK),
concluded that, for many people, community based services may not be
distinguishable from institutional services. Actual participation in ordinary
community life is not guaranteed by living in an ordinary house. Participation is
instead dependent upon opportunities being identified, created and taken up by the
service users and staff teams.
In order to investigate whether community residential placement size was related to
the QOL of people with a learning disability, Landesman-Dwyer, Sackett and
Kleinman (1980) carried out a study of the daily behaviour of adults with a learning
disability and staff members. Staff behaviour was found to be broadly similar across
placement size. However, participant behaviour differed markedly across placement
setting. In larger facilities residents engaged in more social behaviour, particularly
with peers and were more likely to have more friendships than those in the smaller
facilities. The results of this study seemed to refute the notion that small community
placements, by their very nature, provided clients with a better QOL. Other important
variables needed to be taken into account. However, caution must be exercised when
interpreting the results of this study as the definition and indices of QOL used were
somewhat narrow (i.e. they involved the behavioural characteristics of the participant
only).
Schalock and Lilley (1986) carried out a study of the QOL of people with a learning
disability placed in independent housing and competitive employment. Their results
indicated that those clients who had retained their living and work placements and
those who were living independently and working part-time had the highest QOL
compared to those who were living in mental health facilities or living with their
parents.
Donegan and Potts (1988, pp21) studied the QOL of people with a learning disability
236
living alone, using the Quality of Life Questionnaire developed by Cragg and
Harrison (1986) and subsequently refined in 1992 (Cragg and Look; Compass
Multidisciplinary Evaluation of Quality in Home Life). An additional questionnaire
designed for the study to assess frequency and type of social contact was also used.
They commented;
"The inescapable conclusion of the present study is that most of the participants live
on the fringes of society. They rarely appear in society except as single individuals
shopping, walking or catching buses. Although they live on their own....the majority
do not take part in many community activities....".
This view was echoed by McConkey, Naughton and Nugent (1983) who found that
the three main groups of people with whom the participants in their study interacted
included; local shopkeepers, bus conductors and chemists. Other local community
contacts were rare.
Another interesting finding in Emerson and Hatton’s (1994) review was that very few
studies had attempted to gather information about the views of the service users about
the services they received or to measure their perceived QOL. Judgements about the
QOL of the participants were inferred from the objective data gathered. The literature
review presented above would also support these findings.
2.3.3 Subjective Reports of QOL
In 1981, Landesman-Dwyer recommended to the President's Committee on Mental
Retardation (USA) that QOL variables needed to be assessed from the personal
viewpoint of the individual him/herself.
Rapley and Beyer (1996) carried out a small scale study to assess the extent to which
objective measures of service quality were enhanced by the addition of a subjective
QOL measure. They used the QOL Questionnaire (Schalock and Keith, 1993) to add a
subjective dimension to their study of the level of participants' engagement in
domestic activity, staff contacts and participation in the local community. This study
investigated whether housing networks offered support to enable participants to be
237
involved in domestic activity, the life of their local community, how participants
perceived their QOL and the contribution that the direct assessment of QOL made to
the objective measures. Sadly, this study confirmed the emerging picture that more
able clients, who were less reliant on the staff to help make and sustain friendships
and a range of social activities, participated in a greater range of regular activities.
Those with higher levels of dependency were more reliant on staff and yet had a less
active social and recreational life outside the house. Domestic activity ranged from
low to non-existent, in the context of a strong correlation between staff behaviour
(contact with residents) and the absence of problem behaviour.
Friendships were generally scarce, contact with the local community was sparse and
all service users participated in segregated activities that were specially organised for
people with a learning disability. The measurement of subjective QOL did add
another interesting dimension to this study. The data illustrated the central role the
participant's social life had in determining key dimensions of QOL. The extent to
which people had and met friends was correlated with higher QOL Questionnaire
scores. The process of gathering the QOL questionnaire information, by interview
with service users, and the subsequent provision of this data as feedback to service
staff and management, was reported by staff be valuable in terms of developing more
areas for further work with clients.
Rosen and Buchard (1990) attempted to explore the views of people with a learning
disability about their QOL. They used semi-structured interviews and concluded that
non-staff friends of people with a learning disability tended to be almost exclusively
other people with a learning disability. However, there was no perceived difference in
the supportiveness or satisfaction with their social network. These findings were
despite considerable lack of social integration on the part of the participants.
2.3.4 Comparative Studies of QOL
In 1988, Stanley and Roy carried out a study comparing the lifestyle and QOL of
adults with a learning disability and a group of non-disabled adults. Despite living in a
238
pleasant environment, having access to community facilities and being looked after
by caring staff, people with a learning disability may have unmet needs which they
find difficult to express and fulfil. This study established norms of relevance,
frequency and satisfaction of items felt to be of importance to the general population.
They found that personal dissatisfaction and the actual QOL for people living in
group homes was comparable to the community at large. Stanley and Roy (1988,
pp208) advocated the view that;
"...the development and adoption of measurable subjective and objective standards
would offer better services to people with mental handicaps (learning disability) and
their families".
The authors proposed a method of social validation whereby the QOL of people with
a learning disability (subjective dimension) could be measured comparatively in the
context of the local community (the objective dimension). In an attempt to measure
the QOL of people with a learning disability, the authors compared life domains of
three groups of participants; the local community, the hospital from which the target
group of people with a learning disability were discharged and the target group of
adults with a learning disability living in the community. Each life domain was
evaluated by obtaining scores for each of the groups in relation to their ‘actual quality
of life" and ‘ideal quality of life". The actual and ideal scores for all three groups
showed significant differences between the groups. The authors hypothesised that
these differences were observable only when both subjective and objective forms of
data were collected. Edgerton (1990) and Stanley and Roy (1988) have shown that
people with a learning disability are far from being integrated into the local
community and that many of them have taken to passive recreational pursuits, such as
watching television, as they do not have access to activities and socially valued
relationships.
Hughes, McAuslane and Schur (1996) carried out a study to compare the QOL with
the unemployed and retired populations. This study involved the use of the Life
Experiences Checklist (Ager, 1990). The authors found that when compared to the
two social reference groups, the adults with a learning disability had an enhanced
239
QOL in the areas of home, leisure, opportunities and freedom but not in the area of
relationships.
2.4 Measurement and Assessment of QOL
Assessing the QOL of adults with a learning disability has several methodological
problems. Firstly, it is a complex concept which may have varying definitions, several
of which may be difficult to operationalise or measure. Unfortunately, the study of
the QOL of people with a learning disability is hampered by the existence of a wide
array of instruments, many of which have not achieved either psychometric adequacy
or a high degree of familiarity in the UK (Rapley and Lobley, 1995). Secondly, the
procedures used to collect this data have ranged from yes/no questions, either-or
questions, open-ended questions to direct observations. These variations are
especially troublesome when interviewing people with a learning disability, as
discussed below (Section 2.5; Sigelman, Budd, Spanhel and Schoenrock, 1981).
There are only a small number of QOL measures which have been specifically
designed to measure the QOL of people with a learning disability. Some measure
satisfaction with various aspects of services (Heal and Chadsey-Rusch, 1985,
Schalock, Keith and Hoffman, 1990) and others measure the degree to which services
comply with ideological standards, such as normalisation (Wolfensberger and Glenn,
1978).
Dossa (1989) highlighted the three usual perspectives applied to the study of QOL
(subjective, objective and a combination of the two). Each of these areas have
developed their own evaluation measures. As measurement of QOL must relate to
both objective and subjective criteria and include aspects of external behaviour,
personal perception and descriptors of the environment, it must be multidimensional
across life domains. Increasing use has been made of questionnaire driven interview
schedules in an effort to find out clients’ opinions in their own words (Antaki and
Rapley, 1996).
Schalock (1989) described the three perspectives of QOL measurement. Social
240
indicators generally refer to external environmentally based conditions such as health,
social welfare, friendships, standards of living, education, public safety, housing,
neighbourhood and leisure. Such indicators are appropriate for measuring collective
QOL, however, they are insufficient to measure either an individual's perceived QOL
or outcomes from resettlement programmes. Psychological indicators are used in an
attempt to quantify a person's QOL by assessing subjective reactions to life
experiences. Recent attempts to measure these subjective evaluations have centred on
psychological well-being or personal satisfaction/happiness. The psychological well
being approach comes primarily from the work of Flanagan (1978). Measures of
personal satisfaction explore the extent to which people have positive feelings and
attitudes about various aspects of their lives. The underlying assumption of this
approach is that the greater one's satisfaction with his or her resources, the greater will
be the feelings of life satisfaction, well-being, personal competence and control over
one's life (Andrews and Withey, 1976; Blair, 1977; Campbell, Converse and Rodgers,
1976; Heal and Chadsey-Rusch, 1985; Hoffman, 1980). The third perspective is the
goodness of fit/social policy approach which proposes that QOL is an important
criterion for social policies. A number of researchers (Land and Spilerman, 1975; Lui,
1976; and Milbrath, 1979) have recommended that QOL studies be used to identify
unmet needs in different populations and that the results be used to influence resource
allocation decisions. For example, a model proposed by Murrell and Norris (1983)
defined QOL as the criterion for establishing the goodness-of-fit between the human
unit and its environment. The better the fit, the higher the QOL of that individual.
However, it is important to note that these measures could be used to promote the
lives of learning disabled people or to justify less than optimal opportunities for
independence, that is, an individual may have a ‘good fit’ with either a good or a poor
environment.
Schalock (1989) developed a QOL Index as a method for assessing an individual's
QOL. It contains 28 criterion referenced items reflecting three aspects of a person's
QOL (environmental control, social interaction and community utilisation). Each of
the items is rated on a three point likert type scale. The QOL Index is represented as
the sum of these items. However, one shortcoming of this scale is that it has unknown
241
validity as the author has assumed these factors are necessary and equivalent to a high
QOL.
The Adaptive Behaviour Schedule Part One (Nihira et al., 1974) has frequently been
used to assess changes in QOL at two time points. It covers 10 domains of adaptive
behaviour. Higher QOL is hypothesised to relate to greater adaptive, and fewer
maladaptive, behaviours. However, this schedule was not designed specifically to
measure QOL and is very unlikely to fully address this complex concept.
Another commonly used instrument is the QOL Questionnaire (developed in the USA
by Schalock and Keith, 1993). This questionnaire investigates four areas of a person’s
life; personal satisfaction, sense of competency/productivity, empowerment/
independence and social belonging/community integration. It is generally presented
in the form of a structured interview. The total QOL score is the sum of the four
factors. Studies conducted in the UK suggested that the QOL Questionnaire was
psychometrically adequate when employed in the British context and that the factor
structure was robust and cross culturally comparable. Some concern has been raised,
however, about the inter-rater reliability of informant response of the QOL
Questionnaire (Rapley and Beyer, 1996; Rapley and Lobley, 1995). The authors
reported inter-rater reliability coefficients of between 0.66 and 0.83 for sub-scale and
total QOL Questionnaire scores using this procedure.
The Life Experiences Checklist (Ager, 1990) is a measure designed to allow flexible
administration with a wide range of client groups to assess the activities an individual
participates in (and not subjective well-being). There are 10 items in each of five
domains; home, leisure, relationships, freedom and opportunities. Ager provided
normative data on the range and extent of life experiences enjoyed by the general
population in urban, suburban and rural settings, allowing comparison with the
general population. The Life Experiences Checklist had a test-retest reliability
coefficient for total scores of 0.93. Coefficients for subsection scores ranged from
0.91 to 0.96. Look (1987) found no significant differences between informants'
accounts and those provided by the individuals themselves (reliability coefficient
242
between the two of 0.80). Hughes, McAuslane and Schur (1996) also noted high
internal consistency and found the Life Experiences Checklist to be measuring
variables dependent upon social and economic opportunity.
As the satisfaction of adults with a learning disability with their QOL is an important
outcome measure of deinstitutionalisation. Heal and Chadsey-Rusch (1985)
developed the Lifestyle Satisfaction Scale to assess a person’s satisfaction with their
residence, its community setting and associated services. The Lifestyle Satisfaction
Scale is a refinement of an earlier scale, the Residential Satisfaction Scale, used in a
previous study by Novak, Heal, Pilewski and Laidlaw (1980). Although used on only
a small sample (N=17), Novak et al. reported that the scale produced good test-retest
and inter-rater reliability.
The Compass Multidisciplinary Evaluation of Quality in Home Life (Cragg and Look,
1992) is another British designed assessment tool. This assesses the degree to which
the lives of people with a learning disability living in residential accommodation are
consistent with the principle of normalisation. Thus, it explores whether services
ensure that people with a learning disability maintain and improve a level of activity
and competence, provide access to the community and promote choice and decision
making, meaningful relationships and maintenance of status and respect. The
Compass also includes one additional factor, that of enabling individuality (Blunden,
Evans and Humphreys, 1987). The Compass instrument itself is comprised of three
separate sections: interview with staff and residents, direct observation and the
subjective impressions of the assessor.
In an early questionnaire (Living in a Supervised Home: A Questionnaire on Quality
of Life) Cragg and Harrison (1986), also included both subjective and objective
indicators of QOL, based upon the principle of normalisation. In many ways this
questionnaire formed the pilot for their more refined Compass Assessment. Dagnan et
al. (1994) carried out a factor analysis of this questionnaire and found a two factor
solution; service centred QOL (e.g. community access, education and training, staff
243
behaviour) and resident centred QOL (e.g. physical details, routines and decision
making).
Flanagan (1982) illustrated the possible use of the critical incident technique
(identification of activities and experiences reported by participants as contributing
either positively or negatively to their QOL) in the measurement of QOL in the non
disabled (individuals aged 30, 50 and 70 years of age).
In Flanagan's survey it was found that the five dimensions that were most frequently
described as important for a good QOL in the non-learning disabled population
included health (95 to 98% of participants across age groups), children, understanding
yourself, work and spouse (80% of participants across age groups). The five
dimensions for which they reported that their needs and wants were least well met
were participating in government, active recreation, learning and education, creative
expression and helping others. The five dimensions which correlated most highly with
their reports of overall QOL were material comforts, work, health, active recreation,
and learning and education
As Flanagan's study was carried out with non-learning disabled people, it is possible
that the factors, and their relative importance to an overall QOL measure, will differ
for people with a learning disability. It would be interesting to carry out the critical
incident technique to identify the factors most relevant to this section of the
population. The critical incidents could be used to supplement rather than to replace
the original set of critical incidents gathered.
However, one of the problems with this technique is that a high level of verbal
receptive and expressive skills, as well as good cognitive skills, orientation in time
and abstract thinking are required in order to provide meaningful responses. The
critical incident technique would be impossible to use with all but the most mildly
learning disabled clients and would almost certainly be impossible to use in its
current form.
244
Problems measuring the subjective perceptions of well-being were examined by
Campbell (1977) who acknowledged that the report of an ‘excellent’, ‘good’ or ‘poor’
overall QOL may mean different things to different people. However, he also stated
that it was essential to obtain subjective evaluations concerning an individual's
personal values and the extent to which these needs were being fulfilled.
Kammann, Christie, Irwin and Dixon (1979) illustrated this point. They asked three
groups of students to complete a questionnaire measuring their happiness. One group
were asked to report their happiness as of the last day, the second group reported their
happiness over the past week and the final group over the last month. Two weeks later
the same groups were given the same inventory with the same instructions. The one
day group showed a stability correlation coefficient over the two week period of only
0.25, the one week group 0.57 and the one month group 0.83. Thus, the importance of
obtaining subjective perceptions of well-being using a longer time frame was obvious.
This itself poses problems for the researcher wishing to ascertain the perceptions of
people with a learning disability who may have a different sense and experience of
time. Sigelman, Budd, Winer, Schoenrock and Martin (1982) and Atkinson (1988)
have shown that people with a learning disability find it difficult to recall
chronological and structured events.
2.5 Interview Techniques with People with a Learning Disability
The study of the QOL of people with a learning disability is of more limited value if it
does not include the views of the learning disabled population itself. Researchers have
usually restricted verbal data collection techniques to more verbally able and mildly
learning disabled participants, relying on parents or carers to contribute on behalf of
more severely learning disabled people. There can be little doubt that the ability to
understand and answer questions is related to intelligence (Sigelman, Schoenrock,
Spanhel, Hromas, Winer, Budd and Martin, 1980). Longhurst (1974) explored the
ability of people with a learning disability to code and decode information. He
excluded many severely learning disabled people from his research because they were
too disabled to complete the study tasks. In the more mildly disabled sample who did
245
participate in the study, he found that several characteristics of verbal messages coded
about graphic designs, as well as the comprehensibility of such messages, were
associated with the level of intellectual disability. Sigelman and Werder (1975) also
found a relationship between the ability to respond appropriately to questions and
intelligence. So, it seems likely that both the ability to answer questions and to
convey information accurately are related to intelligence. These facts are important
when designing a research interview with people with a learning disability.
The decision to involve people with a learning disability in the research design, to
actively seek their viewpoints and personal experiences is important because they are
best placed to describe their own social situation, their personal experiences and their
feelings about their lives (Wyngaarden, 1981).
As the present study design includes a direct, semi-structured interview with the
learning disabled participants, it is important to consider difficulties which may arise
when interviewing this client group. The literature on survey research suggests that
obtaining valid information from anyone can be problematic (Bradbum and Sudman,
1979; Sudman and Bradbum, 1974). Gaining valid information from people with a
learning disability, who have difficulty with receptive and expressive communication,
is likely to be even more difficult. The first significant interview effect which must
be considered is acquiescence which was highlighted by Sigelman et al. (1980) and
Rosen, Floor and Zisfein (1974). Acquiescence is an underlying predisposition to
comply or to submit socially desirable answers. It is related to yea-saying', or the
tendency of individuals to respond positively to questions regardless of their content.
Sigelman et al. (1980) carried out a study of institutionalised learning disabled
children, institutionalised learning disabled adults and community placed learning
disabled children as well as their parents and carers. Analyses indicated that the more
intellectually able participants were generally more responsive to questions, more
often in agreement with non-learning disabled informants and less acquiescent on
yes/no questions than were less able participants. Generally they reported extremely
high acquiescence rates in samples of adults with a learning disability derived from
either institutional or community based samples. These results highlighted the danger
246
of relying on yes/no questions as a means of obtaining information from people with a
learning disability as the validity of responses was called into question.
Acquiescence was suggested to function, in part, as a cover for ignorance about how
to respond to individual questions, however it may also serve as an automatic,
immediate response strategy to questions, or as a means of obtaining social approval
when the question is understood, and when the participant wishes to provide the
socially desirable answer (Sigelman, Budd, Spanhel, and Schoenrock 1981).
A further study (Sigelman et al., 1981) compared the use of yes/no and either-or
questions. They found that whilst fewer participants could answer either-or questions,
they tended to prompt more consistent responses with fewer response biases and more
agreement with informants. The use of pictures in conjunction with either-or
questions, although non-significant, tended to increase responsiveness and to
eliminate a bias towards selecting the last of the two options presented. However, not
all questions are easily framed as either-or questions, especially as picture choice
either-or questions. Gerjouy and Winters (1966) also found that institutionalised
adults with a learning disability were highly likely to respond ‘yes’ to yes/no
questions about the relative sizes of geometric figures.
Research interviews also require a very systematic approach to data collection which
maximises the chances of maintaining objectivity whilst achieving valid and reliable
responses. For this reason a less structured interview comprising few or no closed
(yes/no) questions is often the most appropriate tool for obtaining the views of adults
with a learning disability directly. Whilst open-ended questions are preferred on the
grounds of validity, their major disadvantage is that they yield low responsiveness
(Flynn, 1986).
Interviews may range from the totally unstructured to the completely structured,
however, few interviews fall at either end of this continuum. The choice of interview
structure will depend on the research question to be answered. A preliminary pilot of
the interview schedule to be used has been recommended with all types of interview
247
format (Breakwell, 1995). Wyngaarden (1981) recommended that when interviewing
learning disabled people, simply phrased, open-ended questions should be used and
that the interviewer should be allowed to rephrase the questions. This view was also
proposed by Malin (1980, pp ll) who found that it was difficult to obtain exact
answers;
"...partly due to the poor memory of some of the residents and to the problems they
experienced in describing activities and responding to direct questions".
Conroy and Bradley (1985, pp73) found that;
^"...asking questions in several ways, and in several forms, is important. Answers
given to various formats must be compared, and then the presentation of the results
should give weight to the consistent, reliable responses. We believe that the extra
effort required to perform quality interview work with people with mental retardation
[learning disability] is amply justified'.
Taylor and Bogdan (1981), Flynn (1986), Atkinson (1988) and Malin (1980)
highlighted the following important points to follow when interviewing people with a
learning disability:
See the interviewee in their own home
Collection of data should be performed in a manner which is as relaxed,
informal and non-threatening as possible
Communication skills of the sample should be known beforehand
Interviews should be taped to avoid the discomfort and anxiety induced by the
interviewer writing during interview
Questions relating to time and frequency should be avoided
Validity of responses may be ascertained by also interviewing a co-respondent
Interviews should be conducted in private
Verbal interviewing techniques are applicable to adults with a mild or
moderate learning disability only
Interviews should start with easy questions to build up participant confidence
and difficult or upsetting questions should come in the middle or towards the
end
248
• The interviews should be natural with a relaxed conversational style and
minimal formal interview structure.
The ‘Getting to Know You’ approach devised by Brost and Johnson (1982) is another
way of engaging people with a learning disability in the interview procedure. The
researcher invests time in personal contact with the participant and, within the context
of a relationship, allows a full picture of the person to emerge. Formal interview
settings are eliminated. However, this approach, and Edgerton’s (1967) similar
‘naturalistic’ approach, are beyond the scope of small studies and projects where the
research interview becomes the focus of attention. It is in these projects that the
interview techniques and properties become especially important.
Antaki and Rapley (1996) carried out a study of the Quality of Life Questionnaire
(Schalock and Keith, 1993) and concluded that the use of such QOL interviews may
actually distort interviewees' own words by underestimating the degree to which the
questions and answers are changed by subtle dynamics of the interview. The authors
studied the QOL interview and, using conversation (discourse) analysis techniques
(Potter and Wetherell, 1987), demonstrated that the typical administration of the QOL
Questionnaire involved the following distortions:
• Distortions of the questions brought about by the need to paraphrase complex
items, and the inevitable use of pre-questions and response listing
• Distortions of answers brought about by interviewer’s pursuit of legitimate
answers and non-take-up of interviewee’s matters.
Antaki and Rapley concluded that these difficulties made it impossible to draw
conclusions from simple aggregation of recorded responses to this questionnaire and
perhaps to any questionnaire using a fixed-response schedule.
An area for future work highlighted by this research is the difference between QOL
research findings based on the reports of people with a learning disability themselves
and those that have employed informant based ratings or measures.
249
Another general problem to be considered when carrying out research interviews with
any participant sample, but particularly with learning disabled groups, is the danger of
preventing the elaboration of interesting ideas and topics by directive questioning.
Charmaz (1990, ppll67) highlighted this very well in the following example where
researcher bias can significantly affect the responses given to questions:
"'Asking 'How did you decide to have surgery? ' assumes that the respondent decided.
In contrast. How did you come to have surgery? ’ leaves things open. ‘Who was most
helpful to you during the crisis? ’ assumes that others were involved. ‘Tell me what
happened when you had the crisis? ’ allows the researcher to piece events and people
together before asking about helpful participants”.
2.6 Current Study
It is proposed that a significant failing of previous research is the lack of an adequate
theoretical model of QOL based upon sound concept definition. An interactional
model, combining both the objective and subjective components of QOL, provides the
foundation for the current research.
QOL is defined along the dimensions listed below:
• The discrepancy between an individual's achieved and their unmet needs and
desires (MacFarlane et al., 1980)
• Related to the individual's ability to exercise control over his/her environment
and his/her personal autonomy (Brown, Bayer and MacFarlane, 1988)
• A reflection of an individual's personal needs and perceptions; their social
network and the environments within which they live, work and spend their
leisure time (Brown, 1988).
Social indicators alone are considered to provide a very narrow perspective of QOL
and as such, the definition also incorporates the subjective, or perceived, QOL (life
250
satisfaction) of the individual.
The model upon which this definition is based is the ‘symbolic interactionist/
ecological model' first described by Parmenter (1988). This model is preferred as it
incorporates the three components of QOL; societal influence, functional behaviour
and self; factors that have been highlighted in the literature many times but rarely
organised into a coherent and comprehensive model. Parmenter's model was
described more fully in Section 2.2.
The current study explores the QOL of adults with a mild to moderate degree of
learning disability principally because the use of a semi-structured interview
precluded the involvement of participants with a more severe learning disability or
those with difficulties of receptive and expressive verbal communication. This is not
meant to imply that the study of the QOL of more severely learning disabled people is
less important or relevant. As QOL is a poorly understood and often arbitrarily
conceptualised phenomenon it seems prudent to establish reliable and valid
information on those people with a learning disability who are easier to survey, prior
to involving their more disabled peers.
QOL is explored in several ways in the current research. Firstly, objective
measurement of QOL variables is carried out. This data is supplemented by and
compared to the subjective perceptions of QOL reported by the study participants
themselves. The qualitative data analysis carried out in the current study is described
further below (2.6.1). It has already been highlighted that previous research has often
failed to explore the differences between objective measurement and subjective
reports of QOL, or to attempt to examine the perceptions of learning disabled people
directly. A semi-structured interview is used as satisfactory measures of the personal
experiences of QOL could not be found.
The hypotheses of the current study are summarised below:
251
• The definition and model of QOL utilised in the study will indicate that QOL
is a concept which may be applied meaningfully to adults with a learning
disability. It will be possible to refine the QOL concept definition and model
further following this research.
• QOL will differ between participants and will be related to current living
situation (e.g. independent living, living with family, living in a group home).
• Objective QOL will be positively related to higher levels of daily activity,
social contacts, material comforts and community participation. These may be
unrelated to subjective reports.
• Qualitative analysis of the data collected during the semi-structured interview
will provide insight into the thoughts, wishes and aspirations of people with a
learning disability living in the community.
2.6.1 Qualitative Research Techniques
Qualitative research is any type of research which produces findings not arrived at by
means of statistical procedures or other methods of quantification (Strauss and
Corbin, 1990). Thus, it involves a non-mathematical analytical procedure. The
development of qualitative data analysis techniques and their application to
psychological research is a fairly recent occurrence (Woolgar, 1996). There is
currently a strenuous debate within the research field about the advantages and
disadvantages of these techniques over more traditional quantitative data analysis and
the comparative strengths of individual qualitative techniques themselves (e.g.
discourse analysis, Potter and Wetherell, 1987; grounded theory, Henwood and
Pidgeon, 1995). As Woolgar (1996, ppl 1) stated;
“Qualitative methods appear to he regarded as a radical alternative to a dominant
orthodoxy... ”
252
The extent to which pluralism or eclecticism in approach is also permitted is currently
under debate (Richardson, 1996). These debates have led many researchers to be firm
proponents of a particular data analysis technique, sometimes to the exclusion of
others, with the consequent suggestion of its application to a wide variety of settings
(Gill, 1996; Toren, 1996; Gilhooly and Green, 1996). The stance of the current
researcher is not to advocate a single qualitative or quantitative epistemology over
others but rather to find a complementary, useful and academically stringent
qualitative approach to supplement and enrich the quantitative study of the complex
phenomenon of QOL with a sample of participants who are difficult to survey.
One of the important debates within qualitative research concerns the extent to which
interpretation of the data is permissible. Some researchers believe that the data should
not be analysed, but rather that the researchers should collect the data and then use
the information to enable the informants to ‘speak for themselves' (Strauss and
Corbin, 1990). The fundamental aim with this type of research is to provide a true
account which will reflect reality from the participant’s perspective, with little or no
interpretation. It is argued that, in this way, the researcher’s biases will not impinge
on the data. Other researchers are concerned with providing an accurate account of
the data collected, though not necessarily by presenting it in full. Thus, the process of
reduction and selection of material will obviously involve some form of interpretation
and the researcher’s own views of, and comments on, the data often tend to be
included. Yet another group of researchers are concerned with creating theories. This
process of theory generation involves a process of concept formulation and
interpretation in order to provide a theoretical account of the subject being studied. It
is this type of qualitative research which is used in the current study and to which we
turn in the next section.
2.6.1.1 Grounded Theory
In the current study, it was decided to use the qualitative procedure of grounded
theoiy (Glaser and Strauss, 1967), in addition to more traditional quantitative
approaches, to analyse the emergent themes in the participants’ discourse about their
253
lives and to develop a theory of QOL. As this procedure has not, to the author’s
knowledge, previously been used in the study of QOL of adults with a learning
disability some discussion about this technique is warranted.
Glaser and Strauss developed grounded theoiy during their investigations into the care
of terminally ill patients (1965; 1967, pp7) to;
“close the embarrassing gap between theory and empirical research... ”
Glaser and Strauss’ view was that a change of philosophy was required in order to
create more contextually based theories which would ‘work' as well as being of
relevance to those being studied. They selected the term grounded theory to describe
their new approach to highlight the fact that theory must be generated by an iterative
process of continual sampling and analysis of qualitative data collected from
unstructured or semi-structured interviews, observations, case studies, documentation
or other forms of text. Grounded theory emphasises the participants’ individual
accounts of their experience. Allport (1962, pp405) also stated that:
“the uniqueness of an individual's ‘personality' could not be captured by means of
simple scores along abstracted statistical dimensions"
Strauss and Corbin (1990, pp27) described grounded theory as;
“...a qualitative research method that uses a systematic set of procedures to develop
an inductively derived grounded theory about a phenomenon"
As with many forms of qualitative data analysis, the topic is generally approached
without an a priori hypothesis. One difficulty is that the researcher has to investigate a
substantial collection of data which may, at first, appear highly unstructured. The aim
is to analyse and interpret the data by applying codes, abstracting categories and
themes from it to create a coherent account of the topic area. In order to achieve this,
close, systematic and detailed analysis of the data must be carried out. The aim
throughout grounded theory research is to gradually develop concepts which will, in
turn, promote later theory generation. Charmaz (1990, ppl 162) provided a useful
description of grounded theory when she said that:
254
“...the ‘groundedness' of this approach fundamentally results from the researchers’
commitment to analyse what they actually observe in the field or in their data. If they
find recurrent themes or issues in the data, then they need to follow up on them,
which can, and often does, lead grounded theorists in unanticipated directions."
Grounded theory is to be distinguished from content analysis (Weber, 1990), which
has a very different goal to the theory generation of grounded theory as it emphasises
validity and reliability criteria and involves counting the number of times a predefined
set of categories occur. The processes which separate grounded theory from content
analysis and other forms of data analysis are those of constant comparison and
theoretical sampling.
Constant comparison refers to the process of continually filtering and comparing
pieces of data throughout the course of a research project (e.g. data, cases, themes,
categories and contrasting/opposing theories). Theoretical sampling refers to the
active sampling of new cases as the analysis progresses. Theoretical sampling does
not require the researcher to sample new cases where it is believed no further
extension or modification of the emerging theories would be prompted. Sampling is,
therefore, often prompted by theoretical concerns, with new cases being selected for
their ability to extend or develop theories (Pidgeon, 1996). This may include
‘negative case analysis' (Kidder, 1981) in which cases are included specifically
because they do not appear to support emerging themes or theories.
Initially, early researchers (Glaser and Strauss, 1967, pp3) referred to grounded theory
as the process by which theories, themes and concepts are ‘discovered! in the text and
‘capturecT by the researcher. However, this view of the approach seems flawed as, to
use Glaser and Strauss’ own comment;
“the researcher does not approach reality as a tabula rasa"
Thus, participants’ views are not waiting to be seized on by the researcher and neither
will different researchers approach the same text and develop identical theoretical
explanations. The researchers bring with them their own theoretical standpoints and
255
preferences, and without these resources little sense can be made of the text to be
analysed. Due to these problems, Charmaz (1990) and Henwood and Pidgeon (1996,
pp82) have argued for a ‘constructionist revision of grounded theory'. They have
stated that, rather than concepts being discovered or unearthed within the text, there
must be a constant interaction between the researcher and the data in order to
gradually develop and refine the theoretical propositions. Thus, the process is not one
of theoiy ‘discovery’ but of theory ‘generation’. Another problem with grounded
theory research, which additionally could be levelled at many types of analytical
procedures, is that it is only as good as the researcher who is carrying it out. One
frequent problem is that researchers are not able to theorise and conceptualise outside
the confines of the participant report. It is in this way that grounded theory becomes
reduced to a descriptive devise. As Pidgeon stated (1996, pp83);
“The value of grounded theory for psychology will ultimately depend on the ability of
researchers to use it to shed new theoretical light upon interesting and relevant
research questions".
Researchers carrying out grounded theory analysis must display ‘theoretical
sensitivity' (Glaser and Strauss, 1967; Strauss and Corbin, 1990). This refers to the
awareness of the researcher to the subtle meaning of the data, using personal insight,
and understanding/filtering the relevant from the irrelevant. Strauss and Corbin
(1990) stated that it is the researcher’s theoretical sensitivity which allows the
development of a theory which is grounded, conceptually dense and well integrated.
Theoretical sensitivity comes from one’s personal and professional experience as well
as from the process of analysis of the data. In other words;
“Theoretical sensitivity is the ability to recognise what is important in the data and to
give it meaning, It helps to formulate theory that is faithful to the reality of the
phenomenon under study" (Strauss and Corbin, 1990, pp344).
Pidgeon and Henwood (1996) suggested a protocol for carrying out the principal steps
in the application of grounded theory. It is this protocol which is adopted during the
current research. This protocol stresses the importance of full documentation of the
analytical process in order to provide a visible trail of the process for later replication
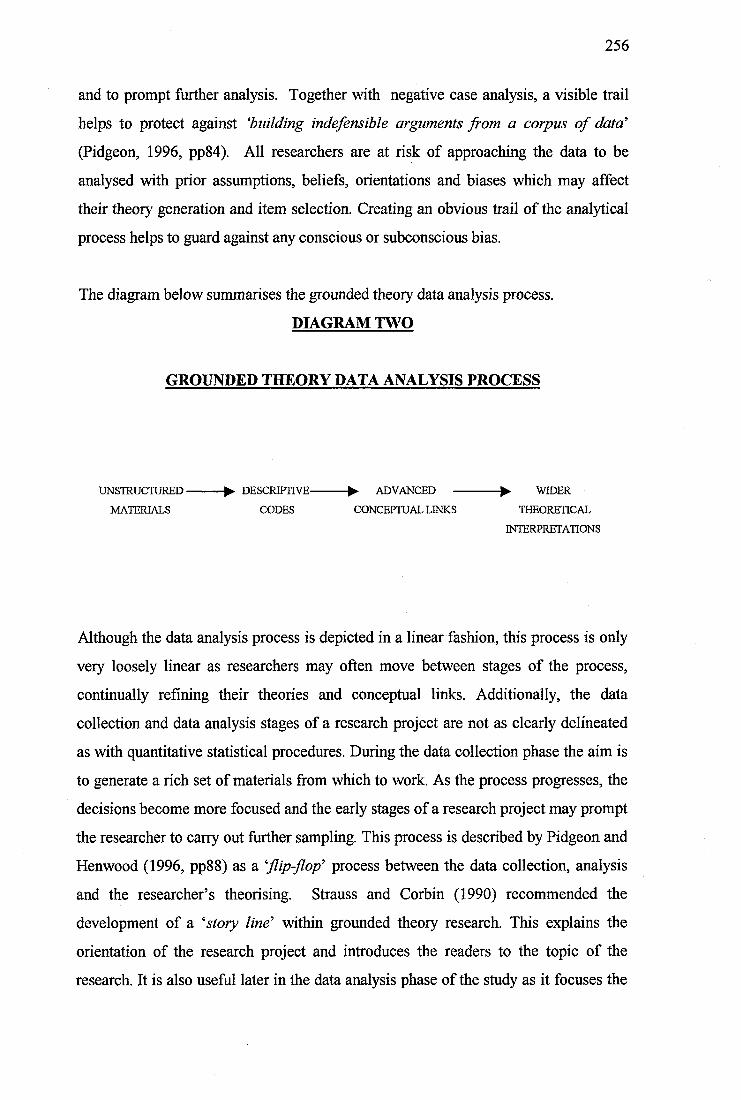
256
and to prompt further analysis. Together with negative case analysis, a visible trail
helps to protect against ‘building indefensible arguments from a corpus of data'
(Pidgeon, 1996, pp84). All researchers are at risk of approaching the data to be
analysed with prior assumptions, beliefs, orientations and biases which may affect
their theory generation and item selection. Creating an obvious trail of the analytical
process helps to guard against any conscious or subconscious bias.
The diagram below summarises the grounded theoiy data analysis process.
DIAGRAM TWO
GROUNDED THEORY DATA ANALYSIS PROCESS
UNSTRUCTURED----------- ^ DESCRIPTIVE----------- ^ ADVANCED -------------- ^ WIDER
MATERIALS CODES CONCEPTUAL LINKS THEORETICAL
INTERPRETATIONS
Although the data analysis process is depicted in a linear fashion, this process is only
very loosely linear as researchers may often move between stages of the process,
continually refining their theories and conceptual links. Additionally, the data
collection and data analysis stages of a research project are not as clearly delineated
as with quantitative statistical procedures. During the data collection phase the aim is
to generate a rich set of materials from which to work. As the process progresses, the
decisions become more focused and the early stages of a research project may prompt
the researcher to cany out further sampling. This process is described by Pidgeon and
Henwood (1996, pp88) as a ‘flip-flop' process between the data collection, analysis
and the researcher’s theorising. Strauss and Corbin (1990) recommended the
development of a ‘story line' within grounded theory research. This explains the
orientation of the research project and introduces the readers to the topic of the
research. It is also useful later in the data analysis phase of the study as it focuses the

257
researcher onto the main research questions and helps to prevent wandering into
tangential areas.
Pidgeon and Henwood (1996, pp88) provided a useful diagram of the grounded
theory approach. This is represented below.
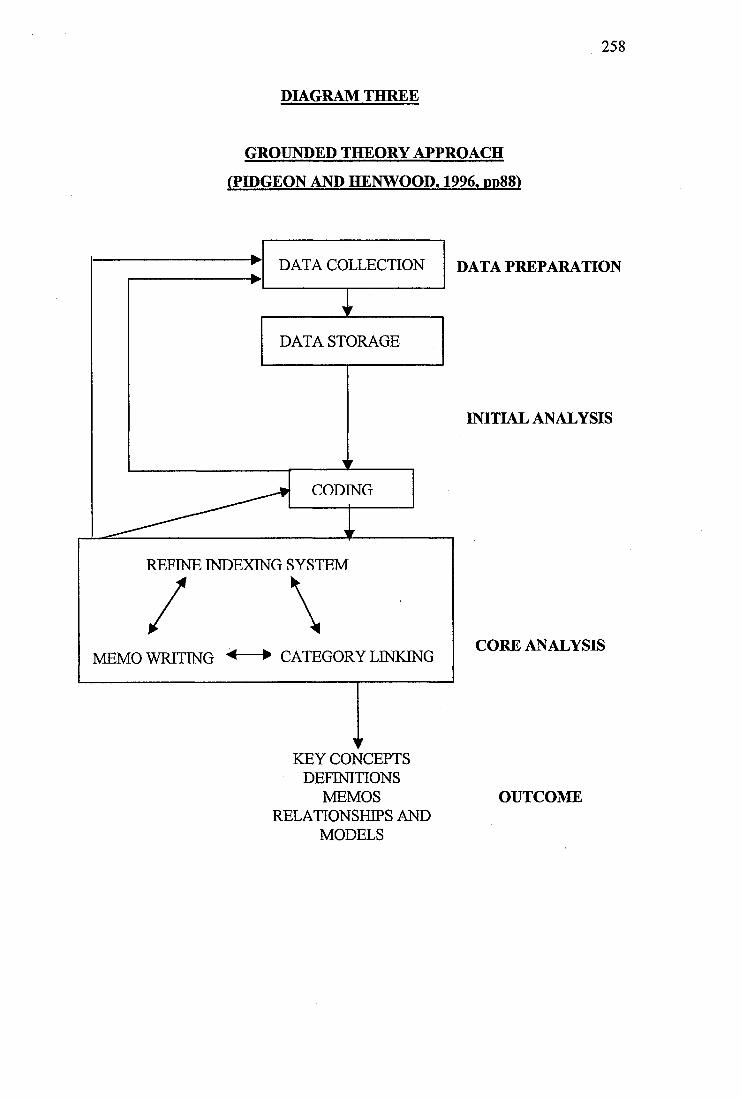
258
DIAGRAM THREE
GROUNDED THEORY APPROACH
(PIDGEON AND HENWOOD. 1996, pp88)
DATA COLLECTION DATA PREPARATION
DATA STORAGE
INITIAL ANALYSIS
CODING
REFINE INDEXING SYSTEM
CORE ANALYSISMEMO WRITING ^-----► CATEGORY LINKING
KEY CONCEPTSDEFINITIONS
MEMOS RELATIONSHIPS AND
MODELS
OUTCOME
259
It is important that category descriptions ‘fit’ the data. Different types of validity
criteria have been used to demonstrate how well theories ‘fit’ the data. One of the
most commonly applied is that of respondent validation. This involves the researcher
in the re-application of the interpretations to explore whether they are recognised by
the respondents themselves, or by other respondents within the same social grouping.
If the respondents agree with the researcher’s interpretations this is seen to give
additional validity to the theories. However, this approach has many problems of its
own, not least of which is the fact that some populations may find this validation
process difficult (e.g. people with a learning disability). Also, the researcher’s
interpretations may be at odds with the respondents views, but this does not
necessarily make the research findings less valid. There will also be situations where
the opinions of the participants cannot be sought for practical or ethical reasons.
Another viewpoint is that concepts specifically relevant to qualitative techniques are
important, such as the existence of a trail of the analytical process, the 'goodness of
fit' of the interpretations and the transferability of research findings (Lincoln and
Guba, 1985, pp41). Strauss and Corbin (1990, pp370) stated that;
be good, grounded theory must meet the criteria of significance, theory
observation, comparability, generalizability, reproducibility, precision, rigor and
verification '.
One common flaw in the data analysis process is the use of too many ‘member’
categories (derived from the specific context of the text) and insufficient ‘researcher’
categories (researcher’s theoretical ideas) to describe the text. Strauss and Corbin
(1990, pp492) described this problem in the following manner;
trouble is that the researcher often fails to see much of what is there because
they come to analytic sessions wearing blinders, composed of assumptions,
experience, and immersion in the literature".
260
3. METHOD
The following section describes the methodology of the current study of comparison
between objective and subjective measures of life experiences of adults with a
learning disability.
3,1 Participants ,
Initially participants were identified to the researcher by professionals involved in
providing health care or social services input to adults with a learning disability living
within the targeted suburban area. This suburban area was covered by two local
community learning disability teams comprising the following professionals: Clinical
Psychologists, Psychiatrists, Speech and Language Therapists, Community Nurses,
Community Support Workers, and Social Workers/Care Managers. In order to
ascertain whether the suggested participants met the inclusion criteria (mild learning
disability with good expressive and receptive language skills), case notes were
examined. As a result of this no participants were excluded from the study at this
stage.
A total of 23 participants meeting the inclusion criteria were contacted and asked
whether they would like to take part in the study. The final number of participants
involved was 20, due to one declining to take part, one completing insufficient
assessments to be included in the final sample group and one experiencing a
significant deterioration in his mental health requiring pharmacological treatment. It
was decided that this participant was too disturbed to be involved further in the study.
Although several participants had additional health care problems (e.g. mental illness,
epilepsy, a degenerative optic nerve), all were reported to be stable at the time of the
study. As a group, they represented a fairly typical cohort of community-based adults
with a learning disability receiving input from a multidisciplinary community support
team within a suburban area.
261
3.2 Consent Procedure
It is particularly important to have very clear and rigorous consent procedures in place
when carrying out research with people with a learning disability. The consent
procedure and materials circulated to the participants, families, carers and other
involved professionals are presented in Appendix One.
Permission to carry out the research study was obtained following presentation of the
project to the local Health Authority Ethics Committee in December 1996. Appendix
Two provides details of the consent obtained.
3.3 Measures
The following measures were completed.
3.3.1 Intellectual Functioning
The diagnostic features of a learning disability are significantly below average (>2
standard deviations below the mean) intellectual functioning accompanied by
significant impairment of adaptive functioning (American Psychiatric Association,
1994, pp39). Two measures were used to assess the severity of each participant’s
learning disability.
In order to assess the degree of intellectual impairment of each participant, data on
their performance on the Wechsler Adult Intelligence Scale - Revised Edition (WAIS-
R; Wechsler, 1981) was collated. Case notes were examined to identify participants
who had not been assessed previously using the WAIS-R. As data on intellectual
functioning was not available for nine participants, the WAIS-R was completed for
these participants (participants number; 1,2,6,7,9,15,16,19,20). The intellectual
functioning of all participants is presented as Fullscale WAIS-R scores in Appendix
Three.
262
3.3.2 Adaptive Behaviour
The second measure used partly to assess the severity of each participant’s learning
disability was the Adaptive Behaviour Scale-Residential and Community: Second
Edition (ABS-RC:2; Nihira, Leland and Lambert 1993).
Impairments in adaptive behaviour have been described by Grossman (1983, pp ll)
as;
' significant limitations in an individual's effectiveness in meeting the standards of
maturation, learning, personal independence, and/or social responsibility that are
expected for his or her age level and cultural group, as determined by clinical
assessment, and usually, standardised scales".
Adaptive behaviour is comprised of a number of coping skills which, when combined,
allow an individual to achieve community integration.
The Adaptive Behaviour Scale has frequently been used as a measure of QOL, usually
by assessing changes in an individual’s performance at two time points, for example;
pre- and post- move from an institutional to a community setting (Felce et al., 1986;
Lowe et al., 1993; Roy et al., 1994; Felce & Perry, 1995). Thus, it follows that the
ABS-RC:2 may be useful in examining the differences between groups of people with
a learning disability in a variety of placement types. This formed the second basis for
the completion of the ABS-RC:2 for each participant.
The results of the ABS-RC:2 can be interpreted in terms of domain scores and factor
scores. Domain scores represent performance in each domain across Parts One and
Two. The factor scores are based on factor analyses of the domains within Parts One
and Two. Three factors have been consistently identified in Part One (Personal Self-
Sufficiency, Community Self-Sufficiency, Personal-Social Responsibility) and two
factors in Part Two (Social Adjustment, Personal Adjustment) (Nihira et al., 1993).
263
The results of the administration of the ABS-RC:2 can be seen in Appendix Three,
represented as Factor Quotient Scores for the three factors in Part One and the two
factors in Part Two.
3.3.3 Verbal Language Skills
In order to assess the participants’ receptive vocabulary for spoken English the British
Picture Vocabulary Scale (BPVS) was administered (Dunn, Dunn, Whetton and
Pintilie, 1982). This assessment, although not specifically designed for use with
learning disabled adults, is widely used in the assessment of language skills of this
client group. It has been designed to cover receptive vocabulary of children/young
adults aged two to 18 years of age.
As the current study involved a semi-structured interview for which good receptive
(and expressive) language skills were required, it was decided to administer the Short
Form of the BP VS as a screening devise. This provided a measure of the participants’
receptive language skills and was also used to highlight differences between
individuals and groups of participants.
The data obtained via the BP VS Short Form is presented for each individual in
Appendix Three. The data is represented as a raw score in each case. The data
collected was not converted into standardised scores as all participants were adults
and the test was designed for people up to the age of 18 years.
In order to provide a measure of the participants’ expressive language skills, the
language development domain (containing the subdomains of expressive, verbal
comprehension and social language development) was administered as part of the
ABS-RC:2. The expressive components of this subdomain were summed to provide
an Expressive Language Score. The results for each participant are provided in
Appendix Three.
264
3.3.4 Objective Measures of QOL
To collect objective data on the participants’ QOL, three measures were used.
The Life Experiences Checklist (LEG: Ager, 1990) was used. This measure is
discussed more fully in Section 2.4. The LEG assesses QOL in five domains (home,
leisure, relationships, freedom, and opportunities), as well as providing an overall
score. Further details of the specific item content of the LEG are provided in
Appendix Four.
This information was supplemented by the completion of a 14 day diary sheet as used
by Dagnan et al. (1994) which included details of participant outings from residential
placement as well as information on those accompanying the participant, the purpose
and duration of the outing and the means of transport used to travel to and from the
participant’s home. It also included information on all visitors received by the
participant, the duration of their visit and whether the visit was pre-planned or a
surprise. The diary was completed by participants with help from their family or
carers as appropriate. Examples of individual daily visitor and outing diary sheets
used are provided in Appendix Five.
The ABS-RG:2 results were also used to provide information on the participants’
QOL.
3.3.5 Subjective Measure
In order to obtain subjective reports of perceived QOL a semi-structured interview
was designed by the researcher for the purposes of this study. This interview was
designed following a review of the literature which did not reveal satisfactory means
of obtaining participant perceptions of his/her life. All items included in the semi
structured interview were based upon those reported by researchers to be important to
the concept of QOL. The areas covered by the semi-structured interview were as
follows:
265
Friends and Family Relationships
Work, Leisure and Recreational Activities
Living Situation
Finances
Choice
Respect and Value
Disability and Health
Happiness and Overall Satisfaction
Aspirations
Details of the semi-structured interview format are provided in Appendix Six.
Authors whose research was related to, or prompted, item inclusion are also detailed
in the semi-structured interview format. The semi-structured interview format was
used to guide the topics to be covered, however, rigid administration was not adopted
and the ordering of questions varied between participants.
3.3.6 Subjective Rating Scale
In order to explore the relationship between the objective measure of QOL (LEG) and
the subjective rating of the semi-structured interview, an independent rater,
unconnected with the current study (Assistant Psychologist) used the Subjective
Rating Scale (SRS - Appendix Eight), designed for the purpose of the study, to score
the semi-structured interview data along 36, five point likert-type scales (score 1 to 5),
maximum score 180. The interview audiotapes and transcripts were used in this
process.
In order to test the reliability of the independent rating, a second co-rater (Second
Assistant Psychologist), also unconnected with the study, rated a random sample of
the participant interviews (N=6), using the same SRS.
Neither of the independent raters knew the participants and both had received
identical instructions prior to using the rating scale.
266
3.4 Procedure
After all participants and their carers had consented to inclusion in the research
project, the following sequence of assessment was carried out:
• Intellectual assessment (WAIS-R) completed if data not available in
participant file. Measurement Obtained: IQ.
• Assessment of receptive verbal language skills carried out (BPVS Short
Form). Measurement Obtained: Receptive Verbal Language Skills.
• Assessment of adaptive behaviour carried out. Respondent (prime carer or
involved professional) interviewed using adaptive behaviour scale (ABS-
RC:2). Measurements Obtained: Level of Adaptive Functioning, Expressive
Verbal Language Skills, QOL Objective Measure 3.
• Respondent (prime carer or involved professional) interviewed using the Life
Experiences Checklist (Appendix Four). Measurement Obtained: QOL
Measure 1.
• Participant interviewed using the QOL semi-structured interview schedule
(Appendix Six). Measurement Obtained: QOL Subjective Measure.
• Participant completion of daily diary of visitors and outings over 14 day period
(Appendix Five). Measurement Obtained: QOL Objective Measure 2.
• Participants and carers given feedback on research findings once all data
collated and analysed.
267
3.5 Data Analysis
3.5.1 Qualitative Data Analysis
The grounded theory qualitative analytical process described in Section 2.6.1.1 was
used to analyse the semi-structured interviews. The aim of this analysis was to
develop a theory of QOL solely from the participants’ perspective. In order to carry
out this procedure, all the semi-structured interviews were transcribed. An example of
a transcribed interview is provided in Appendix Seven. This example is the interview
conducted with participant number eight, with all identification references removed.
A further aim was to compare this subjective theory with objective measures.
Each semi-structured interview lasted between 45 and 90 minutes (mean 69 minutes)
and was completed in one to three sessions depending on the wishes of the
participant. All participants were interviewed in private, either at home or in their day
placements, again at the wish of the participant. One participant wished to have his
friend present during the interview. This was allowed and the friend remained silent
during the interview process (participant number 2).
The grounded theory and model of perceived QOL of adults with a learning disability
developed following analysis of the transcribed interviews is summarised and
discussed fully in Section 4.
3.5.2 Quantitative Data Analysis
In addition to the qualitative analysis, the data listed below was analysed using
quantitative statistical procedures. Group comparisons and gender differences were
explored:
• Age
IQ
• BP VS score
• ABS-RC:2 scores
268
• LEG scores
• Daily diary records of visitors received and outings from home
• Subjective rating scale scores
• Additional psychiatric diagnosis
• Information collated in numerical form from the semi-structured interview
(number of incidents, hobbies, friends and number of aspirations).
Initial exploration of the data revealed a markedly non-normal and skewed
distribution. Non-parametric statistical procedures were therefore employed.
In order to compare the three groups of participants (Group 1- Independent Living;
Group 2- Living with Family; Group 3- Group Home) and to explore gender
differences, the Kruskal-Wallis Test for k Independent Samples and the Mann-
Whitney U Test were used respectively. Only data which could be collated on an
interval scale could be analysed. The sample size was too small to allow nominal data
to be analysed using the crosstabs (%2) procedure as a substantial number of the cell
frequencies were expected to be less than five. This limitation affected only the
analysis of the quantitative information obtained during the semi-structured interview,
however, trends within the data are highlighted.
The percentage agreement between the two raters on the SRS was calculated and the
objective measure of QOL (LEG) and subjective QOL rating of the semi-structured
interview (SRS) were compared using the Spearman Rank Gorrelation (rho)
procedure. This non-parametric bivariate measure of correlation was used as the data
obtained from both measures did not meet the criteria for normal distribution.
4. Findings of Qualitative Data Analysis
The research questions to be answered through grounded theory analysis of the 20
semi-structured interviews were described at the start of the current research project
to be;
269
How do adults with a mild learning disability, living in the community and
receiving input from a multidisciplinary team perceive their QOL.
How do these perceptions develop a theory of QOL which integrates both
objective and subjective accounts?
Early in the current research project a story line (Strauss and Corbin, 1990) was
developed, the final version of which is summarised below.
The main story seemed to he about how adults with a mild learning disability,
living in a variety of placements within the community perceived their lives. All
were coping with their everyday lives, at home, in the community and within day
placement settings, with a variety of support systems and networks in place.
Many of the participants had additional physical or mental health problems with
which to cope. During the process of semi-structured interview with the
participants and transcription of the data, there seemed to he several
fundamental aspects of the individuals’ lives and of their perceptions of their lives
which combined to create a sense of life quality. It was these varying experiences
of people, places, situations, support, opportunities and events, as well as their
impact upon the participants, which were of particular interest to the researcher
in the development of a subjective theory of QOL. Identification of factors
contributing strongly, or combining to illuminate the participants’ perception of
their lives as a whole, seemed to be important, as well as uncovering any
interaction or overlap between these factors. Another area of interest was the
nature of these factors when compared to previous research and to studies
adopting a primarily objective view of QOL (August, 1997).
4.1 Subjective QOL: Core Category
The central phenomenon (core category) to be analysed had previously been
described by the current researcher as QOL, following the labelling trend of many
researchers (for further details refer to Section 2.1). Continued adoption of this term
270
no longer seemed to fit the data or the participants’ accounts of their lives, as it did
little to capture the essence of the subjective concept being studied. The more the
label QOL was imposed as the core category, the more it seemed to imply the need
for a dichotomy between ‘good’ and ‘bad’ QOL. It seemed to require either researcher
or participant rating or quantification in some way. Other terms used throughout the
early stages of the qualitative data analysis to try to capture the core category within
the data were; life satisfaction, nature of life, views on life, aspects of life,
perceptions of life. All these labels were later discarded as they had little more to
commend them and either, once again, prompted the need for a dichotomy or rating
scale, or the need to adopt other’s comments on the lives of the participants. The
difficulty re-labelling the core category was probably, to some extent, due to the
researcher’s immersion in traditional QOL literature at the time of the study and the
fact that the research project involved both a qualitative and a quantitative process of
data analysis. One tension was how to ensure that these two techniques were
complementary to each other and facilitated, rather than impeded, further QOL
research. Eventually the core category was labelled;
Perceptions of Current and Future Life Context (QOL)
This core category encapsulated the fundamental themes which emerged from the
participants’ narratives. It also captured the multifaceted and highly individualised
nature of the views, perceptions and experiences described by the participants, and
highlighted the fact that perceived QOL did not solely relate to the ‘here and now’,
but also encompassed the options and opportunities for future change and
development that were important to the participants. This dynamic or fluid nature of
life perception seemed crucial. The additional QOL marker, although a compromise
between the tensions of the qualitative and quantitative aspects of the research
project, was felt to be important to provide a link between the core category, the
grounded theory generated and the more traditional analytical aspects of the project. It
served to remind the researcher that the fundamental issue was QOL as a whole and
not solely isolated, easier to quantify, aspects of this difficult concept. The core
271
category pulled together all the theory components, and incorporated the subsidiary
subjective QOL categories.
The core category was also evidenced indirectly, or anecdotally, during the semi
structured interview when participants appeared, at times, to make global or
generalised comments about their overall satisfaction with life. Considerable time
was spent deciding whether to include this ‘global rating’ as a subsidiary category, or
whether it should be subsumed under a personality based or affective component of
the participants’ accounts. Several different theoretical models and category labels for
this component were tried (e.g. global rating, overall life satisfaction, internal
emotional component, personality), all of which seemed cumbersome.
Eventually, the most parsimonious model appeared to involve the inclusion of this
factor within the core category ‘Perception of Current and Future Life Context
(QOL)’. In many ways, although personality variables and styles of thinking about life
may well be related to perceived QOL, this factor seemed to fit both the data and the
theoretical model best if it was construed as the true essence of QOL; an overall
summary based on an amalgamation or appraisal of the subsidiary components of
each individual’s life satisfaction (probably carried out at a subconscious level) and
an evaluation of current happiness, satisfaction and contentment, as well as hope for
the future.
Indeed, when questioned, the participants had difficulty clarifying, further developing
or justifying their global statements. This difficulty seemed over and above any
cognitive difficulties present due to their learning disability. Some examples of
generalised individual participant comments included the following:
5-628 “I'm happy all day ”
4-746 “1 'm just fed up with my life completely ”
3-237 ‘7 'm never going to have a good time ” i
9- me, I go from here (day centre) to home, to here again... that's all I do... I
don V think 1 've got a life”
272
In all cases, the location of the quotation in the transcribed texts is indicated by the
prefix number, the first number relates to the participant number (1 to 20) and the
second to the exact line of the text where the quote may be found (1 to 2400).
4.2 Subjective QOL Model
The subjective QOL theoretical model, ‘Perceptions of Current and Future Life
Context (QOL)’, is represented diagrammatically below. This representation forms
the basis of the proposed theory of subjective QOL. Section 6.3 describes how this
theory may be successfully combined with the more traditional objective QOL model.
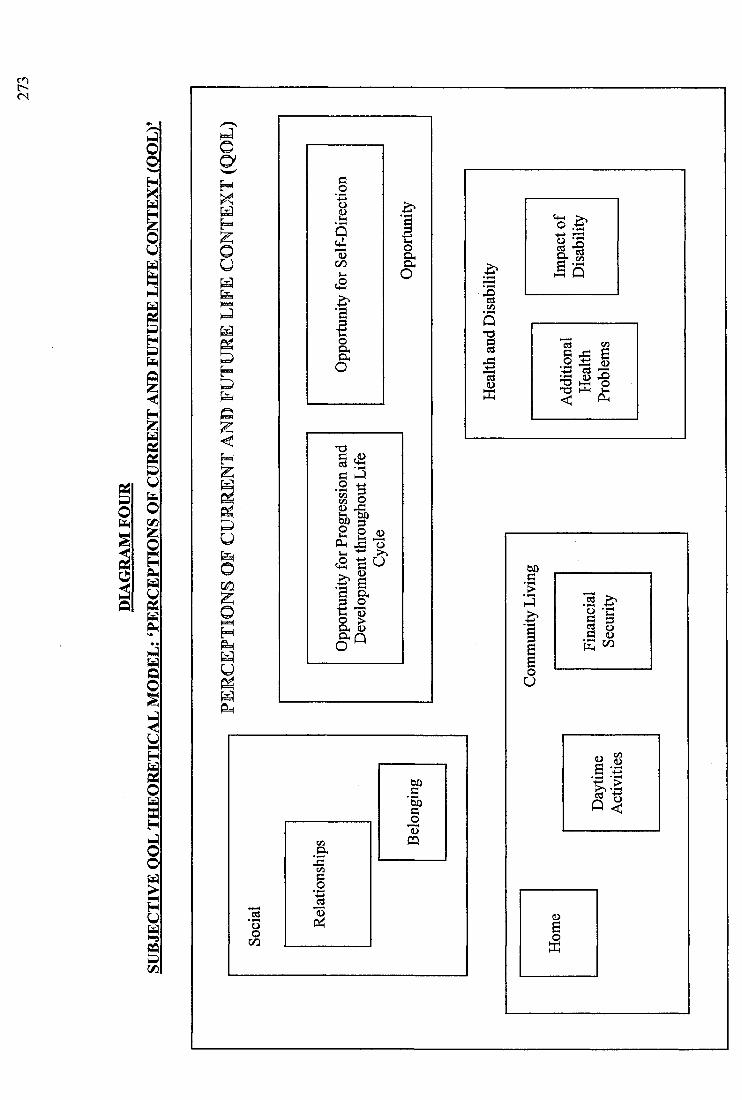
ra
U
Gm
■§5
I
I§
I
<2
I 'Ië ^
IIo
I
1I i l l
K/i
IPQ
oo
SI
I
274
The subjective QOL theory ‘Perceptions of Current and Future Life Context (QOL)’
defined perceived QOL as relating to four areas of the individual’s emotional and
social world. These areas were labelled; social, health and disability, community
living, and opportunity. The nine subsidiary categories of ‘Perceptions of Current and
Future Life Context (QOL)’ were as follows:
Social Domain Relationships
Belonging
Health & Disability Domain Impact of Disability
Additional Health Problems
Community Living Domain Financial Security
Daytime Activities
Home
Opportunity Domain Opportunity for Self-Direction
Opportunity for Progression and Development
throughout the Life Cycle
Taken as a whole, this model of subjective QOL is theorised to present a rich and full
description and process for understanding aspects of an individual’s perceived QOL.
4.3 Life Domains and Subsidiary Categories
In order to illustrate the fundamental features of each subsidiary concept and to
highlight the reason for their subgroupings, the following section presents a summary
of the subsidiary category definitions and provides illustrative examples from the
participant interview transcripts. An identical process of quotation identification is
used as previously.
4.3.1 Social Domain
This domain incorporated the subsidiary categories of Relationships and Belonging.
In essence, this domain was involved with the social world of the individual. It
275
involved the person’s perception of their relationships and the quality of interactions
with those in their immediate and wider family, close and more distant friendship
groupings, as well as within the local community and wider society within which they
lived.
4.3.1.1 Relationships
The Relationships category explored the quality and nature of the individual’s
relationships with others. There seemed to be four main categories of relationships
which were important to the individual; family, friends (including partners), staff and
relationships within the wider community (including acquaintances and neighbours).
Although the number of friends did seem to be of importance, this was not the only
important appraisal individuals made.
14-62 ‘7 would like to have a few more friends"'
10-45 ‘7 think it's important to have friends"
10-115 "Well, at the moment I don Y really do much else to meet friends of my
own age"
10-58 'd normally have problems making new friends of my own age"
Individuals commented that loneliness and isolation were painful feelings, but it
seemed important to have a match between the person’s preference for more or less
friends, or type of friends and the actual number of identified friends and the nature of
these relationships.
9- ‘7 just feel so isolated"
10-208 ‘7 ’d like to feel that I was being loved by someone"
1-677 ‘7 live on my own... very lonely...! have my mates down and that takes
the loneliness off doesn Y it"
Several participants felt that they did not possess enough friends. Those individuals
who had fewer friends demonstrated the tendency to over generalise or over value
other relationships, possibly in an attempt to correct this mismatch (e.g. by naming
276
paid staff or acquaintances as friends, or discussing individuals as though they were
friends but being unable to recall their names, suggesting a less intimate relationship).
11- ^ Not young friends like 26 or 31 (years), but I have got neighbours"
In addition to relationships with friends and peers, the family relationships seemed to
be important in appraising QOL.
11-253 “/ like my dad because he's ever so kind to me"
There also appeared to be a tension between requiring help and support from others
and feeling that this balance was not achieved.
4-244 ‘7 don't seem to get on with my mum...I like her...She won’t let me
grow up"
10-164 “<S/ze (mother) sometimes makes me feel a bit angry inside when she
tells me off for something I haven’t done"
The reciprocal nature of friendships was also perceived to be important, as were
common interests, similar strengths/needs and similar lifestyles. Important aspects of
these relationships were that they needed to be warm and supportive, whilst
respecting the individual as an independent adult.
7-147 "... they (family) shouldn’t interfere in my life"
7-443 ‘7 don’t trust them (family)"
Although the research participants experienced specific relationship tensions, many of
the accounts of insufficient social contact, intrusive, over-protective, absent, or distant
family networks are also relevant to many people without a learning disability.
9- ^ She (mother) feels as though I can’t do nothing without her say-
so... they won’t give me any space...She makes me do things I don’t
want to... I ’ve got to do what she says, when she says"
There were also specific accounts of difficulties within relationships with staff
members, and it is easy to see how tensions may develop in these relationships.
Several comments made by the participants highlighted how disrespectful, intolerant
277
or unsupportive relationships impacted upon QOL in this domain. Again, these issues
may also be relevant to other groups within society.
11-28 ‘7 don’t like some of the staff...they annoy me...they wind me
up... (staff name) annoys me, he winds me up... by shouting at me... and
I do nothing wrong. I do nothing wrong and there he is bellowing at
me"
11 -43 ' He ’s (staff member) rude too... very rude"
19-604 ^ And the staff, the staff do everything for us... they even cook the
meals"
7-179 '"...they (staff) might be listening in (to telephone conversations)...I
don’t trust... (staff name), I don’t like him... he shouts at me... he yells
too much... he just walked away from me. I t’s nothing to do with him is
4.3.1.2 Belonging
This category, related closely to Relationships, involved the extent to which an
individual perceived him/herself, and was perceived by the wider community to be
‘similar to’ or ‘different from’ others within the social group. This concept
encompassed both the internal views of the participants as well as their views on the
attitudes, beliefs and actions of the community within which they lived. The category
of Belonging also incorporated the person’s experience of isolation or integration.
7-663 "(others) take no notice of me at all... (they) don’t know what I ’m like
do they?..they think I ’m a bit thick or stupid"
10-654 "... sometimes (I get) singled out, ‘cos sometimes people have noticed
that I am slightly slow at something... and I can feel a bit confused if I
don’t know at the time why I ’m being singled out"
11-1275 “... ’cos when they see me go in this place they think, oh, she’s to do
with that place... and they don’t talk to me after that"
The individual’s sense of belonging was theorised to relate to the core category in
either a positive or a negative way. A strong sense of belonging, integration and self-
278
/others’ acceptance seemed to relate to more positive perceptions of the individual’s
social world. This category also involved specific accounts of bullying, exploitation
or of being or feeling threatened by members of the immediate social, domestic or
work setting and the local community. These incidents, when they were reported,
seemed to highlight feelings of separateness, victimisation, stigmatisation and
isolation.
I-872 "... it’s when they come up there and... they come up behind you and
you can’t see them, steal money that way"
20-945 "...people outside treat me badly... they try to snatch... my purse off
me"
7-681 "...he (boss) used to call me horrible names...very nasty, horrible,
swearing names... horrible, hurt my feelings... ”
15- "... at horse riding... they used to call me fat pig, and I wasn’t all that
fat... I was really gob smacked"
II-585 "I got hit...I was so distressed, I was...I can’t remember who it was
‘cos it happened so quickly. I didn’t even see her face, all I saw was a
whack, one of them hit me"
11-746 "those youths from that youth club, rather rude to me... they call me
cow and things like that"
4.3.2 Health and Disability Domain and Subsidiary Categories
This domain involved the individual’s appraisal of his/her current health and future
prospects for continued or improved well-being.
11-1295 "I’d like the community to know more about it (learning disability)"
9- "I want them to be like me for a day...then maybe they will
understand"
It contained the two independent subsidiary categories of Impact of Disability and
Additional Health Problems. This domain may have gained prominence within the
participant group studied as all were involved with the local multidisciplinary team
and several experienced significant health related difficulties in addition to their
learning disability.
279
4.3.2.1 Impact of Disability
This category involved the extent to which an individual had achieved an acceptance
of their learning disability either by accepting it as a global concept or by integrating
specific strengths and weaknesses into his/her self-appraisal and self-identity.
12- "...it’s unfortunate it happened to me really... i t’s just one of those
things...you cannot turn back the clock really to when it started...!get
a bit annoyed that I ’ve got it...I know other people’ve got it, but it’s
unfortunate isn ’t it?"
1-1016 not all things (are difficult)... only learning to sort myself... how to
do things"
1-1042 "...it’s trying to get things, to understand... that I have never (been)
taught...! never been taught poetry...! was never very well up on
meetings... but I ’m getting better, but I ’ve still got a long way to go"
20-956 "I suppose I ’m slow at things... money"
12- "I don’t really know money that well... this accident in my head...I’ve
got memory loss...!can’t think very quick"
18- “ ... reading’s one of them... reading disability... I grin and bear it"
2-62 "... half and half Half of me I do, half of me I don’t (think I have a
learning disability)...because I am not very good at maths...English
I ’m OK... Like I ’m not really that brainy"
This category also incorporated the impact on the individual of accepting or rejecting
the learning disability as his/her defining characteristic. More positive perceptions
within this area seemed to be related to an acceptance of the disability on the part of
the individual, and of the wider community within which they functioned, whilst
believing it to be an aspect of the person rather than his/her defining characteristic.
This category may be of particular relevance or importance to those with a mild
learning disability amongst which there is less likely to be an identifiable aetiology,
who may experience increased contact with the local community and non-disabled
280
people. They may compare themselves unfavourably to this social group (Social
Comparison Theory, 1954).
4.3.2.2 Additional Health Problems
This category involved the possession or absence of additional health related
problems which might be either physical, psychological or psychiatric. Not only was
the presence or absence of additional health problems found to be important, but also,
the extent to which the individual perceived that these difficulties impacted
negatively on his/her life and the potential for future change and development. This
category also involved the extent to which the additional health problems were
believed to be well treated, treatable and the opinions of the individual treatments
provided.
Also of relevance were the perceived views and attitudes of those around the
individual to their additional health problems and, probably related to this, how well
they understood their health problems.
20-982 "Well, Dr... (name) thought I was in the mentally ill type, but I ’m
not...I’m going to have a word with her again... "
3-784 "I’ve had fits before... take medicine for them... sometimes it slows me
up"
18- "I know I always binge, but I can’t help it...makes my poor heart
(weak)... and I worry about that... bit frightening"
2-87 "...I had anxiety before, but I ’m managing to get over that now...I
saw... (clinical psychologist) for that and I was on tablets...! was...just
made it through really...! just sit there, if I didn’t panic...! just said
there’s no point in panicking... and work it all out, because it's all in
the mind anyway"
16-812 "My asthma is scary"
8-850 "(my epilepsy makes me)...upset or cross, no not cross, upset... ’cos
see you don’t know where you are"
281
12- "(side effect of medication) ...it's these tablets... they make you sleep ...I
still get the itching and the scratching in my toes"
4.3.3 Community Living Domain and Subsidiary Categories
As all the study participants were living in the community there were specific aspects
of this environment which impacted on their perceived QOL. These aspects of
community and daily living were grouped into the subsidiary categories of; Financial
Security, Daytime Activity and the Home.
4.3.3.1 Financial Security
This category involved the individual’s view of the money available to him/her.
3-158 "1 haven’t got any money at the moment"
3-655 "err, (it) don’t go far"
Absolute amount of money seemed to be less important than the individual’ s opinion
of whether the money was sufficient to cover anticipated expenditures, their
comparison with other friends, family members, local social group and any immediate
or ongoing financial stressors.
18- "...I don’t ask for much"
18- "some of them are going to Spain, but I can’t afford it at the
moment... plane fare’s not cheap"
It was very noticeable that participants demonstrated considerable variability in their
view of their financial situation.
5-512 "I mean, I can cope, I ’ve done it for many years"
1-901 "We ’re not tight, we just can’t afford to lose that sort of money"
19-915 "Not enough (money)... (I’d buy a) car... buy it for daddy... because he
needs a car" (to enable him to see her)
12- "I get quite a lot really...! have to pay my way through"
282
15- "we used to get paid, we used to have £4.35, but its been stopped
by... (Director of Social Services) now... so I don't get it no more... very
upset... it nearly broke my heart"
18- "I wish I got pocket money every day ...I get four, 50p"
4.3.3.2 Daytime Activity
This category involved the extent to which individuals perceived that they were
engaged in a variety of daytime activities. The activities involved participation in
either an employment setting, day centre for people with a learning disability or in
domestic activities.
9- "(the weekly programme)... could be better...could go out
more... educational classes"
18- "... cooking got cancelled five times on the trot"
It seemed to be important that the activities were perceived by the participants to be
varied, interesting, rewarding and stimulating. In addition, the duration of activities or
quantity was also important; too few seemed to be related to reduced feelings of
satisfaction in this area.
11-880 "... that’s why I prefer getting out of the house, because I don’t know
what to do once I ’m in the house"
17-435 "I’d like to be busier...I’d like to do more...I’d like to go to more
clubs"
1-473 "...something that keeps us...helps us to get out, instead of
being... imprisoned in the house all the time"
18- "I’d like it if they could arrange at weekends for me to go to the centre
for a little while... because on Sundays, after I ’ve done my hoovering I
get a little bored"
4.3.3.3 Home
This category involved the individual’s perception of their home. Included in this
category were important factors about the home; who else lived in the house, the
283
perceived standard of housing and facilities, the availability of private places for the
individual to use without interruption and whether the home suited the individual’s
lifestyle, preferences and skills, and offered an appropriate level of carer support and
independence.
19-587 "It’s nice, because it’s got a nice heater in it... it’s got nice chairs...I
like the eating and the staff"
11-977 "no, there’s none (privacy)...he (brother) comes in my bedroom""
7-446 "I need my own space really""
18- "I wish there was another room, a lot quieter... ”
11-702 "I don’t like, err, noisy neighbours... they turn the record player up
really loud""
11-734 "it’s got no shops...All the shops are closing... they’re turning into
restaurants""
14-687 "... it’s a long way from me mum’s""
17-487 "I don’t like it... I don’t like the noise""
15- "...the garden’s lovely, we’ve got a patio and you can play football
and cricket, anything...""
It seemed to be important if there was a perceived ‘mismatch’ between the
individual’s lifestyle and the features of his/her home. This was found to be more
important than the exact type of home environment (e.g. group home, independent or
family home). The presence or absence of routines or attributes which separated the
home from ordinary community housing were also important, as was the feeling that
the home was a safe place within which to relax.
18- "don’t like (the) bars at the window, make it seem like a prison really""
18- "When we’re all standing up in the room...All lining up and one
person’s coming out...I don’t really like the idea"" (speaking about
queuing for food)
12- "it’s nice ...my territory""
12- "I feel safe in there""
284
4.3.4 Opportunity Domain and Subsidiary Categories
This domain was most involved with the future and the participant’s view of his/her
evolving QOL.
5-558 ‘7 haven’t got a life really, not really, I haven’t got no future...I’m
never lucky... ”
4-1153 "It’s like, I know I could do better than that (day centre)"
Opportunity obviously related in many ways to social, relationship and community
living factors, but it was included as a separate domain because of its very generalised
interpretation by the participants. Individuals seemed to frequently make comparisons
between their opportunity and that of others they knew, also between current and
future levels and current or past opportunity.
15- "(I don’t have problems)... not now... I did a long time ago when I had
me anger meetings"
17-364 "... In 5 years time I might get myself a flat... I would like to live on my
own"
4.3.4.1 Opportunity for Progression and Development throughout the Life Cycle
This category involved the individual’s comparison between his/her current life
situation with previous life and the opportunities for future development.
It seemed important that the individual was able to ‘map’ progress in achievements or
towards his/her long term goals.
2-135 "It’s been a worse year in any case... Oh, it’s like, a lot of things I tried
to do that go wrong and it’s mucked up for me and every time I try to
plan something, something goes wrong"
Absolute levels of current life satisfaction seemed to be involved, but were less
important than the perception that there were ‘better things ahead’.
17-263 "Well, I ’d like to get a job really... a proper job...I’d like to work
in... (department store name) or something like that...I hope that
happens one day"
285
15- "I will do one day, when Vm more independent. I ’d like to live in a
group home"
The evidence for appraising the likelihood of future development seemed to be based
upon previous changes and developments throughout the individual’s life and the
participant’s involvement in influencing or directing previous development and
change.
Many individuals were able to identify specific hopes, dreams or wishes for the future
and these were subsumed under the label ‘aspirations’. Initially, this formed a
separate subsidiary category, however, it seemed to provide a much clearer account of
the participants’ perceptions when combined with ‘Opportunities for Progression and
Development throughout the Life Cycle’. This subsidiary category also involved the
participant’s overall view of the future and whether they perceived it to be exciting, a
challenge, frightening, or maybe even irrelevant at the current stage in their life.
11-334 "One of these days... when I get over hearing voices... (but) I ’m afraid
that I might end up in some hospital"
5-564 "I ’m happy that I ’ve got my own flat, that’s all"
14-505 "... a job would suit me... the only thing is I have to wait until I start
reading and get my chemistry. I ’d be thinking about something
electrical"
4.3.4.2 Opportunity for Self-Direction
This category involved the type and amount of choice exercised by an individual
throughout the course of his/her daily life.
11-1205 '"-if I had a choice, I wouldn ’t go (to respite care services) ...I’d like
more choice"
4-1102 "I don’t get much choice... not enough"
It also encompassed the extent to which each individual perceived that s/he had
power, control and direction over his/her life.
10-667 ‘‘/ just felt a little bit dumped in places I didn’t really want to be
dumped into"
286
3-613 "Corne and go as I please. That's the best"
The attributes of independence and autonomy were fundamental to this category. One
of the significant aspects of this category was the presence or absence of any
discrepancy between an individual’s anticipated or hoped for personal choice and
independence, and their actual levels.
7-147 "they (family) shouldn’t interfere in my life"
This discrepancy was obviously more pertinent to those who felt they required high
levels of autonomy and choice, who actually had relatively little opportunity to
exercise personal independence. The category incorporated both relatively small
choices as well as more fundamental decisions about future life directions.
18- "I like the idea, having more choice... to do more cooking for a start,
more cleaning"
8-687 "...(I’d like) me (to) look after money...she (mother) don’t trust me.
No. She knows I spend it just like this" (snapped fingers)
A lack of opportunity for self-direction seemed to relate to feelings of helplessness
and powerlessness.
4-474 "I was nearly gonna go to two places. I was nearly gonna go to keep fit
class, but my mum said they go too fast. I was nearly gonna go to a
place at... (place name) place where you meet people, but mum said,
it’s not your sort of thing, so I didn’t do any of those things"
2-15 "I can’t say nothing about it, can I?...I can’t say, time is slipping by
and we haven’t done it yet... (1 feel) a bit angry really" (regarding
activities being cancelled by others)
12- "i can’t tell... (support worker) what to do, can I?.. She’s got to tell me
what to do...I did that once, then I changed my mind and she got a
bit... cross"
4.4 Domain Relationships and Category Summation
The theoretical model ‘Perceptions of Current and Future Life Context (QOL)’
consists of four domains and nine subcategories which, taken as a whole, are
hypothesised to present a comprehensive account of individual QOL for learning
287
disabled adults. Although, for clarity, the domains and subcategories are represented
as independent aspects of QOL, evidence emerged during participant interviews that
they may be inter-connected and related to each other.
The representation of domains and subcategories as independent constructs was felt
to be the most appropriate theoretical model during the current, preliminary, research
as it was generally possible to make a distinction between life areas based upon an
assessment of the primary focus or theme of an individual’s comment on his/her life.
For example, the comment;
18- "I would like to choose my clothes on my own really... more track
suits... sometimes (staff) choose clothes I don V like"
could have been construed as providing a comment on the individual’s relationship
with residential care staff, however, it was thought to be more appropriately viewed
as providing an insight into the individual’s opportunity for personal choice and
independence. Further research is needed to develop and extend the current model,
incorporating the relationships between the life domains.
A significant area of interaction which emerged during the grounded theory analysis
was between the Social and the Opportunity domains, especially between the
subsidiary categories of Relationships and Opportunity for Self-Direction. Typically,
when describing individual relationships, the participants described and categorised
them as either enabling, facilitating or preventing opportunity for self-direction. This
is illustrated by the comments:
9- "She (mother) feels as though 1 can Y do nothing without her say-so... I
feel as though I've got a hidden wire attached where my mum pulls
it...She makes me do things I don’t want to... I feel like I ’m a remote
control robot"
19- "They (family) need to let go a little bit... even if they give me even the
tiniest bit of leeway... extend the string a little bit as I call it. As long as
they ’re there if I need them, then I would be happy"
288
These findings provided support for Zautra’s (1983) statement that social network
blame was related to reduced QOL or psychiatric distress, whereas a positive
experience of social support increased an individual’s appraisal of his/her satisfaction
or happiness.
The overlap between life domains highlighted one reason for the difficulty previous
researchers have experienced defining and capturing the essence of QOL. It is an
extremely complex construct, which seemed to be most appropriately understood by
assessing an individual’s subjective appraisal of their life situation.
The two domains which demonstrated significant inter-relationship (Social and
Opportunity) were also those which provided the most interesting and important
insight into the participants’ QOL.
The current research indicated a possible hierarchy of domains. It is postulated that
when appraising QOL, an individual carries out, probably subconsciously, a
summation of his/her QOL across life domains. The mechanism by which this
category summation is carried out is not clear, however, at this stage, it is possible to
highlight some preliminary hypotheses based on the participants’ accounts. Further
research should be carried out to explore the individual life domains in greater detail
and to clarify the mechanisms of category summation.
It seemed that the Health and Disability and Community Domains must reach a
specific baseline level for the participant to express some satisfaction with his/her
QOL. This level may vary depending upon participant characteristics, especially
personality variables. As long as this baseline level is reached the, more complex.
Social and Opportunity domains probably achieve more importance and appear to
relate more closely to the participant’s overall expression of QOL. It is these two
important domains which become the fundamental components of expressed or
perceived QOL and seem to lie at the core of this concept.
289
As previous researchers (MacFarlane et al., 1980) have stated, the important factor
seemed to be the presence or absence of a discrepancy between the individual’s
needs, wishes, hopes and their actual lifestyle. The presence of a discrepancy was
hypothesised to lead to a reduction in perceived QOL. It is not clear whether the
reduction in QOL has a linear relationship to the discrepancy between actual and
desired life characteristics. However, this seems likely to represent an overly
simplistic view, as individual personality variables are likely to impinge on this
interaction.
Thus, current exploration of the participant’s perceived QOL suggested, at least with
mildly to moderately learning disabled adults, once baseline levels of Health and
Disability, and Community Living domains have been achieved, QOL is more related
to the Social and Opportunity domains. It seems likely that it is these appraisals an
individual makes about his/her current life and future expectations which provide the
key to understanding QOL.
To an extent, this provides some support for Taylor and Bogdan’s (1990) claim that
QOL has little meaning other than an individual’s thoughts and feelings.
Interestingly, the factors that adults with a mild to moderate learning disability
highlighted as contributing, either positively or negatively, to their QOL seemed
similar to those highlighted by previous authors as pertinent to those without a
learning disability (Flanagan, 1978,1982; Lippman, 1976; Zautra, 1983). The relative
importance of specific subcategories may differ within the learning disabled
population. The potential for distress and reduced levels of satisfaction may be greater
within this population, as they are more likely to be stigmatised, devalued and less
likely to be able to exercise personal control, choice and autonomy.
Many participants described stress and conflict within their relationships with family
members, peers, staff and the wider community. It seemed likely that these factors
played an important role in determining an individual’s perceived QOL. Conflicts
within the subcategories of Relationships, Belonging, Opportunity for Progression and
290
Development throughout the Life Cycle were hypothesised to have an impact on the
individual’s affective state, self-concept and self-esteem as well as feelings of
helplessness, hopelessness, and may be important in determining an individual’s locus
of control (Lefcourt, 1991). Difficulties in these areas may lead to increased risk of
psychological distress and mental health related problems. These results provided
some support for previous researchers’ claims that exercise of personal control and
the concept of autonomy were important for enhanced QOL (Brown et al., 1988).
The way in which the theory of subjective QOL or ‘Perceptions of Current and Future
Life Context (QOL)’ relates to the quantitative analysis and to previous models of
QOL is discussed in Section 6.2.
5. RESULTS OF QUANTITATIVE DATA ANALYSIS
The following section provides a summary of the quantitative analysis of the data. For
clarity, the results are presented separately in four sections.
Firstly (5.1), the descriptive statistics for the total sample are detailed, by gender and
by residential placement (age, IQ, BPVS Score and ABS-RC:2 Expressive Language
Score). Secondly (5.2), the results of the ABS-RC:2 and LHC administration are
summarised, also for the total sample, by gender and residential placement grouping
(LEC Subsection Scores and Total Score, ABS-RC:2 Factor Quotient Scores). The
third section (5.3), details the results of the Daily Diary completion and Semi-
Structured Interview material for the total sample, by gender and residential
placement. Finally (5.4), the results of the comparison between the objective QOL
measure (LEC) and the subjective rating scale (SRS) are summarised.
5.1 Descriptive Statistics
Appendix Three provides a summary of the participant characteristics. Participants
were 20 mildly learning disabled adults of which 9 were men and 11 were women.
They formed three groups of 6 (Group 1- Independent), 7 (Group 2- Family Home),
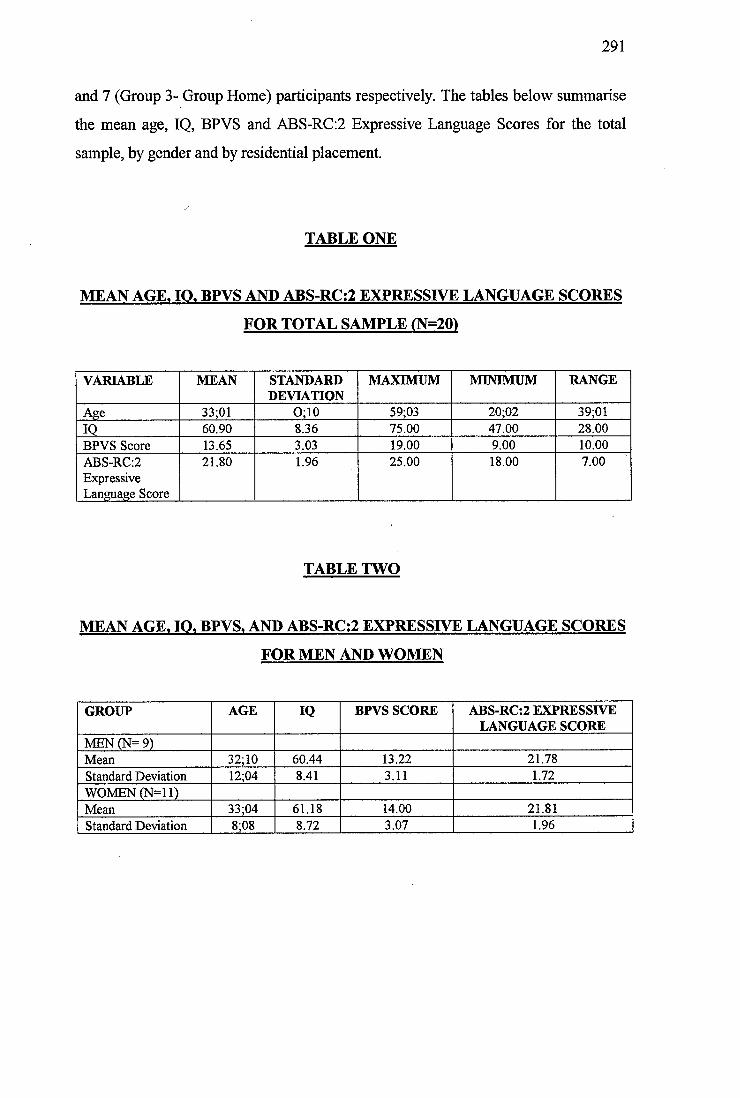
291
and 7 (Group 3- Group Home) participants respectively. The tables below summarise
the mean age, IQ, BPVS and ABS-RC:2 Expressive Language Scores for the total
sample, by gender and by residential placement.
TABLE ONE
MEAN AGE. 10, BPVS AND ABS-RC;2 EXPRESSIVE LANGUAGE SCORES
FOR TOTAL SAMPLE (N=20)
VARIABLE MEAN STANDARDDEVIATION
MAXIMUM MINIMUM RANGE
Age 33;01 O;10 59;03 20;02 39;0110 60.90 8.36 75.00 47.00 28.00BPVS Score 13.65 3.03 19.00 9.00 10.00ABS-RC:2 Expressive Language Score
21.80 1.96 25.00 18.00 7.00
TABLE TWO
MEAN AGE. lO. BPVS. AND ABS-RC;2 EXPRESSIVE LANGUAGE SCORES
FOR MEN AND WOMEN
GROUP AGE IQ BPVS SCORE ABS-RC:2 EXPRESSIVE LANGUAGE SCORE
MEN (N= 9)Mean 32;10 60.44 13.22 21.78Standard Deviation 12;04 8.41 3.11 1.72WOMEN (N = ll)Mean 33;04 61.18 14.00 21.81Standard Deviation 8;08 8.72 3.07 1.96
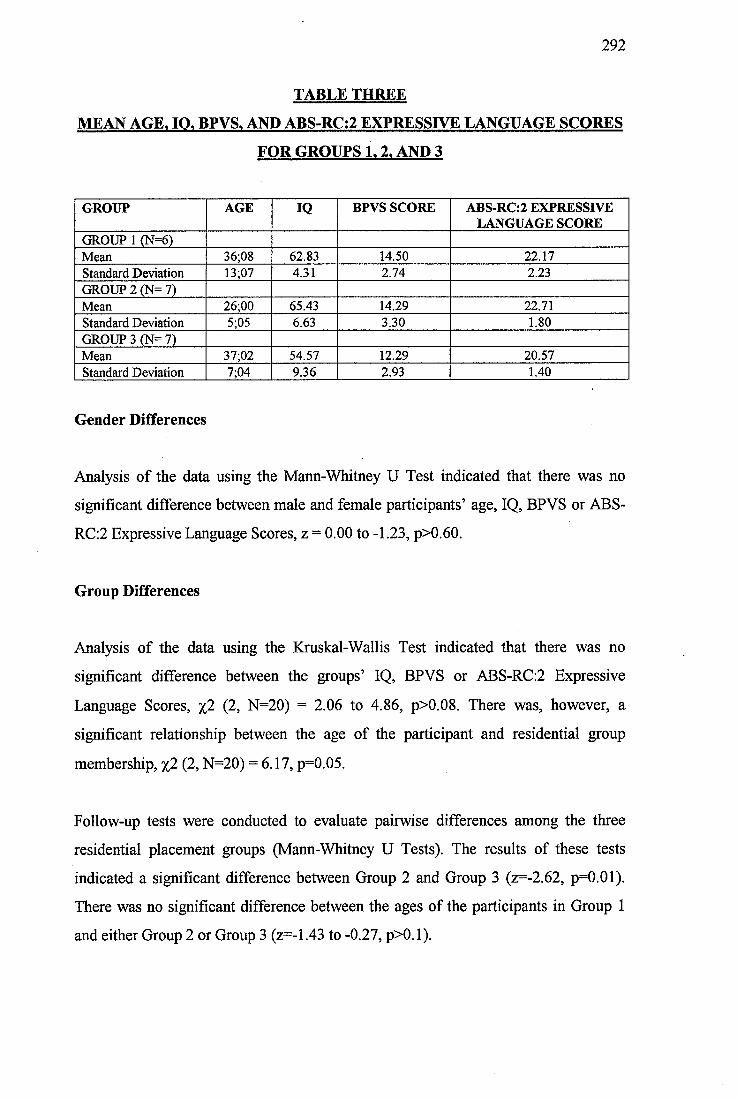
292
TABLE THREE
MEAN AGE. 10, BPVS, AND ABS-RC:2 EXPRESSIVE LANGUAGE SCORES
FOR GROUPS 1,2, AND 3
GROUP AGE IQ BPVS SCORE ABS-RC:2 EXPRESSIVE LANGUAGE SCORE
GROUP 1 (N=6)Mean 36;08 62.83 14.50 22.17Standard Deviation 13;07 4.31 2.74 2.23GROUP 2 (N= 7)Mean 26;00 65.43 14.29 22.71Standard Deviation 5;05 663 3.30 1.80GROUP 3 (N= 7)Mean 31,02 54.57 12.29 20.57Standard Deviation 7;04 9.36 2.93 1.40
Gender Differences
Analysis of the data using the Mann-Whitney U Test indicated that there was no
significant difference between male and female participants’ age, IQ, BPVS or ABS-
RC:2 Expressive Language Scores, z = 0.00 to -1.23, p>0.60.
Group Differences
Analysis of the data using the Kruskal-Wallis Test indicated that there was no
significant difference between the groups’ IQ, BPVS or ABS-RC:2 Expressive
Language Scores, %2 (2, N=20) = 2.06 to 4.86, p>0.08. There was, however, a
significant relationship between the age of the participant and residential group
membership, %2 (2, N=20) = 6.17, p=0.05.
Follow-up tests were conducted to evaluate pairwise differences among the three
residential placement groups (Marm-Whitney U Tests). The results of these tests
indicated a significant difference between Group 2 and Group 3 (z=-2.62, p=0.01).
There was no significant difference between the ages of the participants in Group 1
and either Group 2 or Group 3 (z=-1.43 to -0.27, p>0.1).
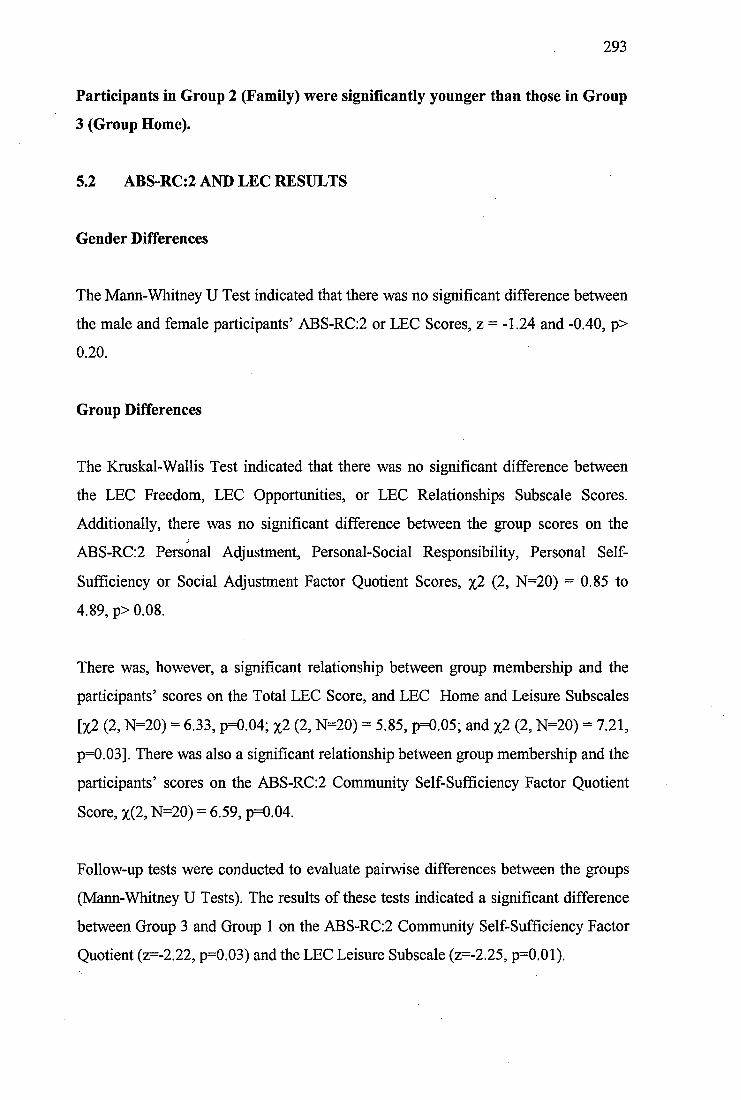
293
Participants in Group 2 (Family) were significantly younger than those in Group
3 (Group Home).
5.2 ABS-RC:2 AND LEC RESULTS
Gender Differences
The Mann-Whitney U Test indicated that there was no significant difference between
the male and female participants’ ABS-RC:2 or LEC Scores, z = -1.24 and -0.40, p>
OJW .
Group Differences
The Kruskal-Wallis Test indicated that there was no significant difference between
the LEC Freedom, LEC Opportunities, or LEC Relationships Subscale Scores.
Additionally, there was no significant difference between the group scores on the
ABS-RC:2 Personal Adjustment, Personal-Social Responsibility, Personal Self-
Sufficiency or Social Adjustment Factor Quotient Scores, %2 (2, N=20) = 0.85 to
4.89, p> 0.08.
There was, however, a significant relationship between group membership and the
participants’ scores on the Total LEC Score, and LEC Home and Leisure Subscales
[%2 (2, N=20) = 6.33, p=0.04; %2 (2, N=20) = 5.85, p=0.05; and %2 (2, N=20) = 7.21,
p=0.03]. There was also a significant relationship between group membership and the
participants’ scores on the ABS-RC:2 Community Self-Sufficiency Factor Quotient
Score, %(2, N=20) = 6.59, p=0.04.
Follow-up tests were conducted to evaluate pairwise differences between the groups
(Marm-Whitney U Tests). The results of these tests indicated a significant difference
between Group 3 and Group 1 on the ABS-RC:2 Community Self-Sufficiency Factor
Quotient (z=-2.22, p=0.03) and the LEC Leisure Subscale (z=-2.25, p=0.01).
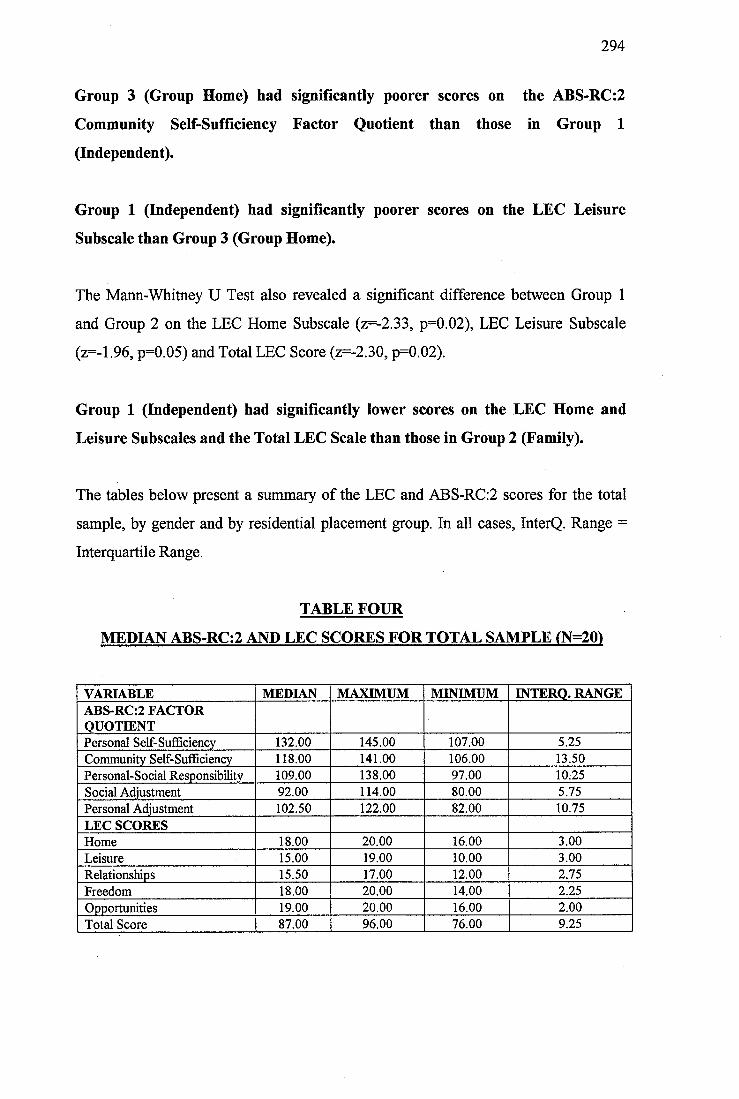
294
Group 3 (Group Home) had significantly poorer scores on the ABS-RC:2
Community Self-Sufficiency Factor Quotient than those in Group 1
(Independent).
Group 1 (Independent) had significantly poorer scores on the LEC Leisure
Subscale than Group 3 (Group Home).
The Mann-Whitney U Test also revealed a significant difference between Group 1
and Group 2 on the LEC Home Subscale (z=-2.33, p=0.02), LEC Leisure Subscale
(z=-1.96, p=0.05) and Total LEC Score (z=-2.30, p=0.02).
Group 1 (Independent) had significantly lower scores on the LEC Home and
Leisure Subscales and the Total LEC Scale than those in Group 2 (Family).
The tables below present a summary of the LEC and ABS-RC;2 scores for the total
sample, by gender and by residential placement group. In all cases, InterQ. Range =
Interquartile Range.
TABLE FOUR
MEDIAN ABS-RC:2 AND LEC SCORES FOR TOTAL SAMPLE (N=20)
VARIABLE MEDIAN MAXIMUM MINIMUM INTERQ. RANGEABS-RC:2 FACTOR QUOTIENTPersonal Self-SuÊBciency 132.00 145.00 107.00 5.25Community Self-Sufficiency 118.00 141.00 106.00 13.50Personal-Social Responsibility 109.00 138.00 97.00 10.25Social Adjustment 92.00 114.00 80.00 5.75Personal Adjustment 102.50 122.00 82.00 10.75LEC SCORESHome 18.00 20.00 16.00 3.00Leisure 15.00 19.00 10.00 3.00Relationships 15.50 17.00 12.00 2.75Freedom 18.00 20.00 14.00 2.25Opportunities 19.00 20.00 16.00 2.00Total Score 87.00 96.00 76.00 9.25
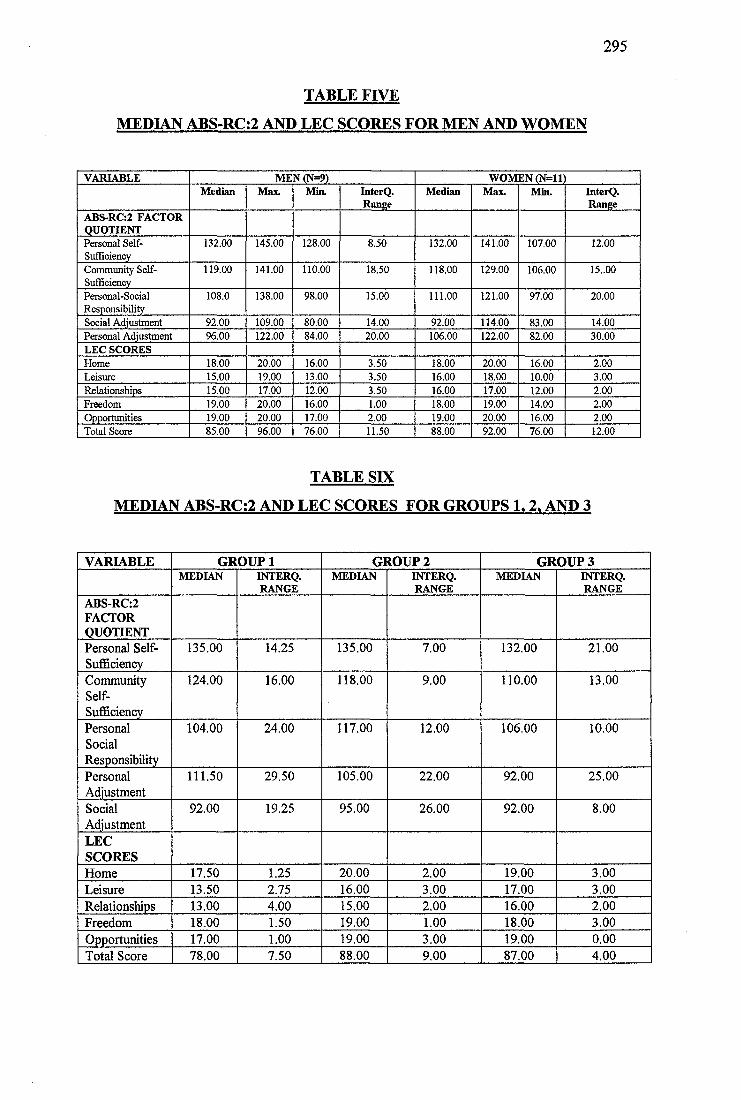
295
TABLE FIVE
MEDIAN ABS-RC:2 AND LEC SCORES FOR MEN AND WOMEN
VARIABLE MEN (N=9) WOMEN (N=ll)Median Max. Min. InterQ.
RangeMedian Max. Min. InterQ.
RangeABS-RC:2 FACTOR QUOTIENTPersonal Self- Sufficiency
132.00 145.00 128.00 8.50 132.00 141.00 107.00 12.00
Community Self- Sufficiency
119.00 141.00 110.00 18.50 118.00 129.00 106.00 15..00
Personal-SocialResponsibility
108.0 138.00 98.00 15.00 111.00 121.00 97.00 20.00
Social Adjustment 92.00 109.00 80.00 14.00 92.00 114.00 83.00 14.00Personal Adjustment 96.00 122.00 84.00 20.00 106.00 122.00 82.00 30.00LEC SCORESHome 18.00 20.00 16.00 3.50 18.00 20.00 16.00 2.00Leisure 15.00 19.00 13.00 3.50 16.00 18.00 10.00 3.00Relationships 15.00 17.00 12.00 3.50 16.00 17.00 12.00 2.00Freedom 19.00 20.00 16.00 1.00 18.00 19.00 14.00 2.00Opportunities 19.00 20.00 17.00 2.00 19.00 20.00 16.00 2.00Total Score 85.00 96.00 76.00 11.50 88.00 92.00 76.00 12.00
TABLE SIX
MEDIAN ABS-RC:2 AND LEC SCORES FOR GROUPS 1,2. AND 3
VARIABLE GROUP 1 GROUP2 GROUPSMEDIAN INTERQ.
RANGEMEDIAN INTERQ.
RANGEMEDIAN INTERQ.
RANGEABS-RC:2FACTORQUOTIENTPersonal Self- Sufficiency
135.00 14.25 135.00 7.00 132.00 21.00
CommunitySelf-Sufficiency
124.00 16.00 118.00 9.00 110.00 13.00
PersonalSocialResponsibility
104.00 24.00 117.00 12.00 106.00 10.00
PersonalAdjustment
111.50 29.50 105.00 22.00 92.00 25.00
SocialAdjustment
92.00 19.25 95.00 26.00 92.00 8.00
LECSCORESHome 17.50 1.25 20.00 2.00 19.00 3.00Leisure 13.50 2.75 16.00 3.00 17.00 3.00Relationships 13.00 4.00 15.00 2.00 16.00 2.00Freedom 18.00 1.50 19.00 1.00 18.00 3.00Opportunities 17.00 1.00 19.00 3.00 19.00 0.00Total Score 78.00 7.50 88.00 9.00 87.00 4.00
:#6
5.3 Daily Diary and Interview Results
Information on the data collected using the 14 day diary is summarised in Section
3.3.4 (Objective Measures of Quality of life) and Appendix Five.
All participants completed the diary, some required help from their prime carers.
Appendix Nine lists the variables collated using the daily diary, only significant
statistical results are summarised below.
Gender Differences
Analysis of the data using the Marm-Whitney U Test indicated that there was a
significant difference between male and female participants’ outings to sports events,
venues or activities, z=-2.24, p=0.03.
Men made significantly more outings to sporting activities than women.
Group Differences
Analysis of the data using the Kruskal-Wallis Test indicated that there was a
significant relationship between group membership and the number of visitors
received, %2 (2, n=20) = 8.13, p=0.02. There was also a significant relationship
between group membership and number of non-disabled visitors received, %2 (2,
N=20) = 12.21, p<0.01. Although there was no relationship between group
membership and the overall number of outings made from the home, there was a
significant relationship between group membership and the type and nature of the
outings. There was a significant relationship between group membership and the
duration of outings, number of planned outings, social outings, trips by bus and by
car, and trips with non-disabled friends only, %2 (2, n=20) = 5.88 to 8.80, p<0.05.
297
Follow-up tests were conducted to evaluate pairwise differences between the three
residential placement groups (Mann-Whitney U Tests). The results of these tests
indicated a significant difference between the number of visitors received by Group 1
and Group 2 and 3, z=-1.98 and -2.57, p<0.05. There was no significant difference
between Groups 2 and 3, z=-1.33, p=0.18. There was a significant difference between
the number of non-disabled visitors received by Group 1 and by Group 2 and 3, z=-
2.25 and -3.00, p<0.02. Additionally, there was a significant difference between
Group 2 and Group 3, z=-2.50, p=0.01.
Group 1 (Independent) received significantly more visitors than both Group 2
(Family) and Group 3 (Group Home). Group 1 (Independent) received
significantly more visits from non-disabled friends than both Groups 2 and 3
(Family and Group Home). Group 2 (Family) received significantly more visits
from non-disabled friends than Group 3 (Group Home).
There was also a significant difference between the duration of trips made by Group 1
and Group 2, z=-2.19, p=0.03; but not between Groups 1 and 3 or by Groups 2 and 3,
z=-1.64 and-1.14, p>0.1.
Group 1 (Independent) made significantly shorter trips than Group 2 (Family).
In terms of the type and nature of trips made, pairwise comparisons using Mann-
Whitney U Tests revealed that there were differences between the number of social
trips and trips by bus made by Group 1 and Group 2, z = -2.25 and -2.71, p<0.02.
Additionally, there was a significant difference between the number of social trips
and trips with a non-disabled friend only made by Group 1 and Group 3, z=-2.22 and
-2.54, p<0.03. Groups 2 and 3 showed a significant difference between the number of
trips made by bus and by car, z=-2.03 and -2.34, p<0.04.
Group 1 (Independent) made significantly more social trips than Groups 2 and 3
(Family and Group Home). Groups 1 and 3 (Independent and Group Home) also
made significantly more trips by bus than Group 2 (Family), whereas Group 2
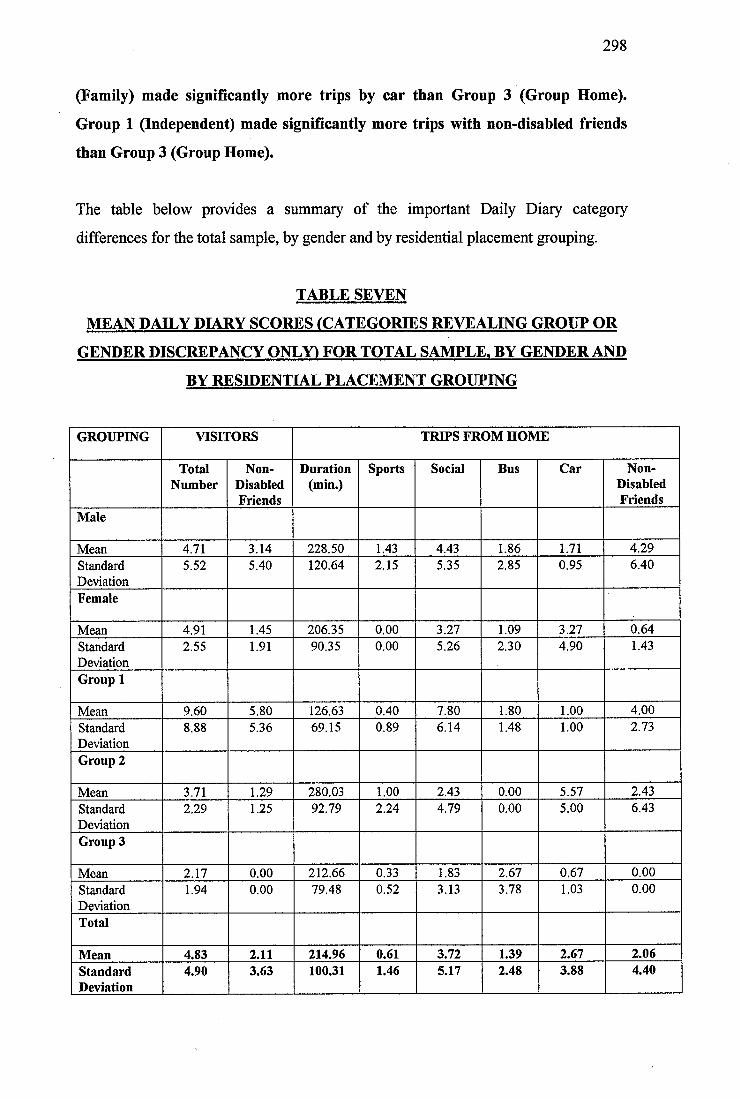
298
(Family) made significantly more trips by car than Group 3 (Group Home).
Group 1 (Independent) made significantly more trips with non-disabled friends
than Group 3 (Group Home).
The table below provides a summary of the important Daily Diary category
differences for the total sample, by gender and by residential placement grouping.
TABLE SEVEN
MEAN DAILY DIARY SCORES (CATEGORIES REVEALING GROUP OR
GENDER DISCREPANCY ONLY) FOR TOTAL SAMPLE. BY GENDER AND
BY RESIDENTIAL PLACEMENT GROUPING
GROUPING VISITORS TRIPS FROM HOME
TotalNumber
Non-DisabledFriends
Duration(min.)
Sports Social Bus Car Non-DisabledFriends
Male
Mean 4.71 3.14 228.50 1.43 4.43 1.86 1.71 4.29StandardDeviation
5.52 5.40 120.64 2.15 5.35 2.85 0.95 6.40
Female
Mean 4.91 1.45 206.35 0.00 3.27 1.09 3.27 0.64StandardDeviation
2.55 1.91 90.35 0.00 5.26 2.30 4.90 1.43
Group 1
Mean 9.60 5.80 126.63 0.40 7.80 1.80 1.00 4.00StandardDeviation
8.88 5.36 69.15 0.89 6.14 1.48 1.00 2.73
Group 2
Mean 3.71 1.29 280.03 1.00 2.43 0.00 5.57 2.43StandardDeviation
2.29 1.25 92.79 2.24 4.79 0.00 5.00 6.43
Group 3
Mean 2.17 0.00 212.66 0.33 1.83 2.67 0.67 0.00StandardDeviation
1.94 0.00 79.48 0.52 3.13 3.78 1.03 0.00
Total
Mean 4.83 2.11 214.96 0.61 3.72 1.39 2.67 2.06StandardDeviation
4.90 3.63 100.31 1.46 5.17 2.48 3.88 4.40
299
Using the semi-structured interview transcripts and audiotapes it was possible to
collate the data on the number of incidents of verbally or physically threatening
behaviour or bullying experienced by the participants, their number of hobbies,
friends and aspirations. This data was analysed using the Mann-Whitney U Test to
explore gender differences and the Kruskal-Wallis Test to explore residential
placement group differences. All tests revealed no significant differences between
either male and female participants or relationship between residential placement
group and scores on these variables, z=-0.17 to -1.24, p>0.2 and %2 (2, N=20) =0.20
to 1.10, p<0.34. It was not possible to analyse the data further due to the small sample
size, however, some trends were noted. These are discussed more fully in the
Discussion, Section 6.1.
5.4 Comparison between Objective QOL Measure (LEC) and Subjective
Rating Scale (SRS)
Independent Rater Reliability
In order to explore the reliability of the scoring procedure using the Subjective Rating
Scale (SRS) to rate each participant’s perceptions of their life, six interview
audiotapes and transcripts were selected at random and analysed by a second
independent rater. The percentage agreement to within one point on the five point
scale ranged from 77.70% to 97.20%. Overall the percentage agreement was 89.81%.
Individual percentage agreement scores are summarised in the table below.
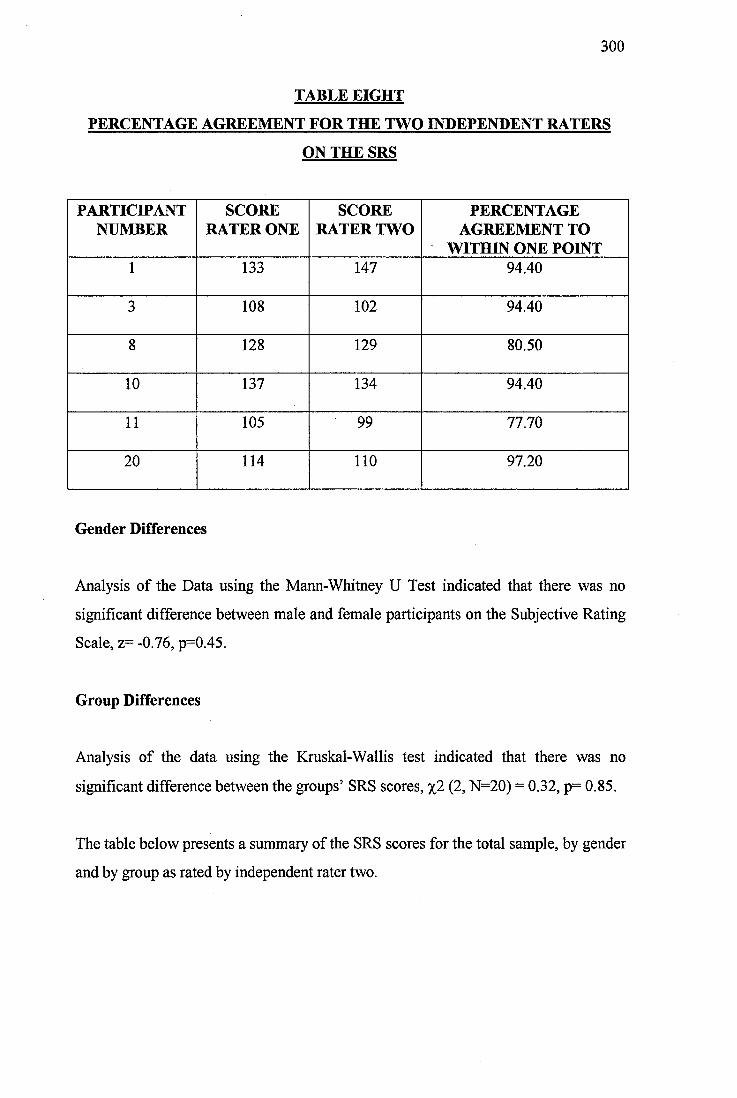
300
TABLE EIGHT
PERCENTAGE AGREEMENT FOR THE TWO INDEPENDENT RATERS
ON THE SRS
PARTICIPANTNUMBER
SCORE RATER ONE
SCORE RATER TWO
PERCENTAGE AGREEMENT TO
WITHIN ONE POINT1 133 147 94.40
3 108 102 94.40
8 128 129 80.50
10 137 134 94.40
11 105 99 77.70
20 114 110 97.20
Gender Differences
Analysis of the Data using the Mann-Whitney U Test indicated that there was no
significant difference between male and female participants on the Subjective Rating
Scale, z= -0.76, p=0.45.
Group Differences
Analysis of the data using the Kruskal-Wallis test indicated that there was no
significant difference between the groups’ SRS scores, %2 (2, N=20) = 0.32, p= 0.85.
The table below presents a summary of the SRS scores for the total sample, by gender
and by group as rated by independent rater two.
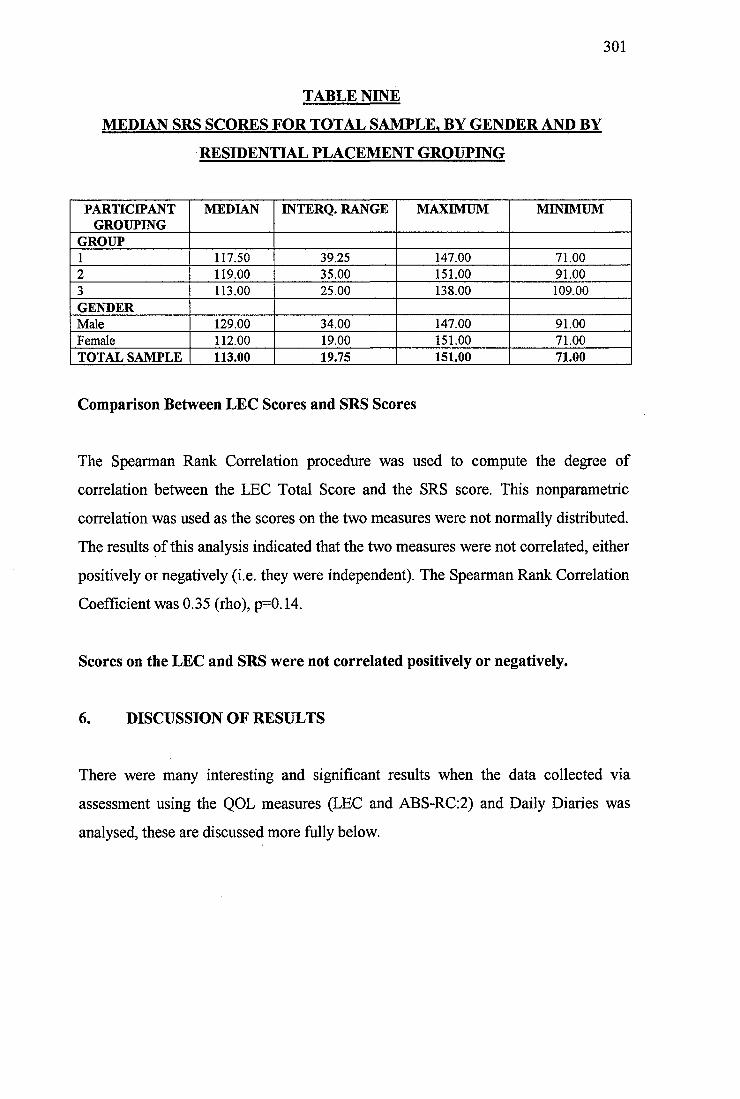
301
TABLE NINE
MEDIAN SRS SCORES FOR TOTAL SAMPLE. BY GENDER AND BY
RESIDENTIAL PLACEMENT GROUPING
PARTICIPANTGROUPING
MEDIAN INTERQ. RANGE MAXIMUM MINIMUM
GROUP1 117.50 39.25 147.00 71.002 119.00 35.00 151.00 91.003 113.00 25.00 138.00 109.00GENDERMale 129.00 34.00 147.00 91.00Female 112.00 19.00 151.00 71.00TOTAL SAMPLE 113.00 19.75 151.00 71.00
Comparison Between LEC Scores and SRS Scores
The Spearman Rank Correlation procedure was used to compute the degree of
correlation between the LEC Total Score and the SRS score. This nonparametric
correlation was used as the scores on the two measures were not normally distributed.
The results of this analysis indicated that the two measures were not correlated, either
positively or negatively (i.e. they were independent). The Spearman Rank Correlation
Coefficient was 0.35 (rho), p=0.14.
Scores on the LEC and SRS were not correlated positively or negatively.
6. DISCUSSION OF RESULTS
There were many interesting and significant results when the data collected via
assessment using the QOL measures (LEC and ABS-RC;2) and Daily Diaries was
analysed, these are discussed more fully below.
302
6.1 Quantitative Data Analysis
6.1.1 Descriptive Statistics
There was no significant difference between the participants’ IQ scores, BPVS or
ABS-RC:2 Expressive Language scores, either by gender or by residential placement.
These results were, in themselves, interesting because one might have expected those
living independently to be more intellectually able than those living either with their
families or in group homes. One reason for the lack of discrepancy between IQ scores
of the three groups could have been the fact that participants were only included in
the study if they had a mild to moderate degree of learning disability. However,
although there are undoubtedly many people with significantly greater intellectual
impairment living within group homes and with their families, this study seemed to
indicate that there are also many within these placements who, at least as far as their
level of cognitive fimctioning is concerned, are no more disabled than those living
independently. Additionally, although participants were selected for inclusion in the
study only if they met the criteria of a mild to moderate learning disability, this
covered a broad range of intellectual functioning (IQ 40 to 70), differences in the
patterns of intellectual functioning were expected to emerge.
As intellectual functioning alone was not related to type of residential placement, it
was expected that possession, or ability to learn the everyday coping skills needed to
live with only minimal help from services, would be involved. However, this did not
seem to be the case. Participants living independently differed from Group 3 (Group
Home) on the Community Self-Sufficiency Factor of the ABS-RC:2 only. This factor
covers items important for an individual’s integration within society and incorporates
areas of skills such as handling money, telling the time, maintaining the home,
personal safety, domestic activities and travel skills. It was not surprising that those
living independently had higher scores on this factor, as they probably had greater
opportunity to practise these skills. However, it was interesting that there were no
other differences between the groups on part one factors. The Personal Self-
Sufficiency and Personal-Social Responsibility factors are also important for
303
community living as they cover skills such as; self-care, work/job performance, self-
direction, responsibility and socialisation. A strong argument cannot be made that
placements were determined on the basis of levels of adaptive functioning.
It was interesting that neither IQ nor general ABS-RC:2 functioning seemed to be
involved in residential placement. Clearly, an assessment process must be operating
to help people with a learning disability decide on the most appropriate placement
within which to live. It is, of course, possible that those participants living within the
group homes did not wish to move to a more independent setting, however, the semi
structured interview revealed that one of the most important and frequently
mentioned aspirations was to move to a less highly supervised placement. Age may
also be a related factor as the participants in Group 2 (Family) were significantly
younger than those living in group homes (Group 3). This finding may be explained
by the fact that many people with a learning disability do not leave the family home
during young adulthood as most non-learning disabled people do. Instead, they tend to
remain within the family for considerably longer periods of time. Those living within
the family home in the current study may have represented a subset of younger people
with a learning disability, who, in later life, may move into more independent
placements. Interestingly, no significant difference was found between the age of
those living independently or with their families.
The ABS-RC:2 also provided an assessment of the participants’ personality and the
presence or absence of any problem social behaviour which may have been involved
in placement decisions, however, once again there were no significant differences
between the three groups of participants on any of the Factor Quotients which probed
these areas (ABS-RC:2 Part Two Factors). So, not only were those living with their
families as intellectually able as those living independently or in group homes, but
they also had, broadly speaking, similar profiles of adaptive functioning necessary for
community living and similar levels of additional problem social behaviour. The
levels of identified maladaptive behaviours were actually very low, which was
probably due to the fact that participants were not included in the study if they
304
possessed high levels of challenging behaviour which would make assessment and
participation in the interview difficult.
Presence or absence of additional psychiatric disturbance did not seem to be involved
in placement setting. Whilst several of the participants did have psychiatric diagnoses,
and were receiving input from a psychiatrist at the time of the study, all were stated to
be well at the time of interview. Obviously factors such as depression could have
markedly affected the participants’ comments during the interview and so it was
necessary to ensure that all participants, when they had a psychiatric illness in
addition to their learning disability, were well maintained on medication and free
from acute symptoms. Due to the small sample size it was not possible to carry out
formal statistical analysis of the effect of psychiatric diagnosis on placement type.
However, strong evidence for a trend for greater psychiatric disturbance in those
living with their parents or in group homes when compared with those living
independently was not seen. Two of the six participants living alone had an additional
psychiatric diagnosis, compared to four out of seven living with their family and three
out of seven living within a group home. In addition, one participant living within a
group home was receiving psychotropic medication (major tranquilliser) but did not
have a psychiatric diagnosis. The reason for this medication was unclear. From
examination of the ABS-RC:2 profile and individual item scoring, this participant did
not appear to have greater levels of behavioural disturbance than the other
participants (participant number 20).
Neither was there strong evidence of greater levels of additional health problems
amongst those living within more supervised settings. Two participants in Group 1
(participants number 3 and 4) had a seizure disorder compared to one in Group 2
(participant number 8) and two in Group 3 (participants number 16 and 19). One
participant in Group 2 had a visual impairment and one had an inner ear (balance)
disturbance. It is possible that the higher levels of additional health problems amongst
those living at home was related to their continued placement within the family.
Further exploration would be required to present a clearer picture. Interestingly,
whilst clinical psychologists, community nurses, psychiatrists and social workers were
305
each involved with many of the participants, none of the participants were receiving
input from a speech and language therapist at the time of the study. These results may
have reflected the referral patterns, with verbally able people with a learning
disability being perceived as, or actually having, fewer communication problems than
more severely disabled clients. Interestingly, one client with a stammer indicated that
he would like input from a speech and language therapist to treat this difficulty
(participant number 7).
As there was little evidence that intellectual and adaptive functioning, additional
psychiatric diagnosis and health care problems were related to placement type, it was
very difficult to make hypotheses about the specific participant factors involved. It
seemed possible that decisions about participant placement were based on other
factors, external to the individual, such as placement availability, philosophy of the
service, or local financial limitations. Further research is clearly needed, as the
sample size of the present study was very small and caution must be exercised when
interpreting these results or generalising the findings. Further research is particularly
important as participants expressed some dissatisfaction with several aspects of their
housing.
The BPVS and expressive components of the language subdomain of the ABS-RC:2
indicated that the participants possessed good levels of both receptive and expressive
verbal communication skills. Participants were approaching the ceiling of both
measures and, as such, the results could not have been used to make reliable
distinctions between individuals. As this was not the purpose of the assessment, this
high performance did not present cause for concern.
6.1.2 Informant Measures of QOL
The study utilised two informant based measures of QOL; the ABS-RC:2 and the
LEC. The ABS-RC:2 was included because of its inclusion in many previous studies
of QOL, especially as a measure of change over time or change following a move
from an institutional placement to a community based facility (Felce et al., 1986;
306
Lowe et al., 1993; Roy et al., 1994). It seemed logical to hypothesize that similar
differences might be evidenced between participants living in the three residential
placements. Clearly, the current study indicated that this hypothesis was flawed. As
discussed previously, except for the Community Self-Sufficiency Factor, no
differences were identified between the three groups of participants. One may
conclude from this that there were no differences between the groups’ QOL, however,
this would be premature. It seemed more likely that the ABS-RC:2 measure was not
sensitive enough to be able to pick up differences between the community based
residential placement groups. Whilst it was able to pick up the large changes which
may occur after a move from a segregated institutional placement into the
community, or the changes within an individual over time, it was not a sensitive
measure of differences between residential groups. Highlighting individual change is,
after all, one of the principle fimctions of the ABS-RC:2.
Another explanation was that the ABS-RC:2, whilst it is important for mapping
individual change and opportunity, is not actually a measure of QOL. The
introduction to the current research project focused on the complexity of defining
QOL and creating a theoretical model to describe it. The ABS-RC:2 describes
behavioural and skill patterns which are essential for an integrated life within the
community but these factors are only one aspect of an individual’s life which may
affect its quality. Support for this argument was provided by the fact that the
Community Self-Sufficiency Factor scores were significantly greater among those
who had the opportunity to learn, practise and consolidate community living skills on
a daily basis. Monitoring the progress of adults with a learning disability and
identifying areas of weakness which require further support to enable the individual to
integrate into the community is important and congruent with the normalisation
principle (Wolfensberger, 1972), however these factors alone cannot be equated to
either a ‘good’ or a ‘bad’ QOL. Caution must also be exercised because, in the current
study, informants provided the information necessary for completion of the ABS-
RC:2. The results reflected the views of the participant’s carer or an involved
professional. They did not reflect the views of the participants themselves. The results
of the current study suggested that QOL research which has focused primarily or
307
solely on adaptive behaviour levels, gains or change represents an incomplete
interpretation and analysis of this complex concept.
The LEC provided a second measure of QOL and the results of this assessment are
interesting. Several differences between the participants emerged. Overall Group 1
(Independent) had a significantly lower Total LEC score than those in Group 2
(Family), indicating a lower QOL as measured by the LEC. Several subdomain
differences were also found. Group 1 (Independent) had significantly poorer scores on
the subdomains of Home and Leisure than those living with their family. These two
subdomains accounted for the generally lower Total LEC score of those living
independently. These results offered some support for Reiter and Bendov’s (1996)
findings that living independently in the community was not necessarily better than
living with one’s family. Further information which emerged during the current study
highlighted that the issue may be more complex than this statement suggested.
Group 1 (Independent) had significantly lower scores on the Leisure subdomain,
indicating that they had the lowest QOL in this area. If the LEC is truly a measure of
QOL, the results suggested that those living with their family had the best QOL, and
those living independently the worst. The Daily Diary results discussed below added
further detail to this profile. In many ways the LEC probably accessed economic and
social advantage or disadvantage, which, whilst important to an enriched QOL,
cannot be equivalent to it. Furthermore, the LEC was completed by an informant and
as such, reflected the views of an outside observer and not the views of the
participants themselves. Those living independently, within local authority housing or
without full-time employment may have had a poorer standard of housing than those
living with their families. Individual items covered by the Housing subdomain
illustrate the limitations of these questions (e.g. my home has more rooms than
people; my home is well decorated; my home has a garden etc.). Many of these
questions highlighted economic advantage and, whilst a certain standard of financial
security is likely to be related to an indication of life quality, QOL is more complex
than this. Those living independently were generally extremely proud of their homes
and these satisfactions may outweigh any economically based shortcomings in the
308
accommodation. Also, the point at which economic stressors impinged on an
individual’s QOL was unclear. In a similar way, the Leisure subdomain probably
reflected economic factors. It includes questions such as; T go to the cinema or
theatre at least once a month’, T go to a café or restaurant for a meal at least once a
month’. This could, in part, have accounted for the lower scores within this
subdomain of those living on their own. Other items within this section such as;
visiting friends or relatives, having a hobby or interest are probably less related to
financial opportunity. In this respect, those living with their family did seem to be
more advantaged than those in the other residential settings.
If the ABS-RC:2 and the LEC do both measure global QOL, they produced
contradictory results. The ABS-RC:2 factor. Community Self-Sufficiency was higher
in people living independently, whilst this group had lower Total LEC scores. It
seems more likely that both measures access factors important to a good QOL but not
conceptually equivalent to it. This is supported by the subjective theoretical model of
QOL developed in Section 4.
Interestingly, data collected during the semi-structured interview revealed no
significant differences between the number of hobbies identified by the participants.
Those living with their family may have been more engaged in leisure activities with
their families and thus, the results reflected the family’s leisure activities rather than
the participant’s interests. It is also possible that, as the LEC was completed by an
informant, these respondents may not have known about the leisure activities of the
participants living independently within the community and so this subdomain may
have been under scored for this group.
It was interesting that there were no significant differences between the groups in
terms of their relationships, freedom and opportunities. All three groups of
participants had some friendships with others. They also had broadly similar patterns
of freedom, choice and control over their lives and opportunity to use community
resources as measured by the LEC. The total score possible within each subdomain of
the LEC was 20. Examination of the results indicated that the median score of the
309
total sample of participants across domains ranged from 15.00 to 19.00, indicating
very high scores, approaching the ceiling of the test. These results suggested that the
participants had a good QOL within these general life domains.
In conclusion, the LEC seemed to be a measure of economic and social advantage
which was important to QOL but did not represent an adequate exploration of the
concept. Hughes et al. (1996) also found that the LEC measured variables dependent
upon social and economic advantage and this added further weight to the claim that
the participants in Group 2 (Family) scored significantly higher on this scale than
those living independently (Group 1) for these reasons. Although some group
differences did emerge, most notably the poorer performance of those living
independently on the subdomains of Leisure and Home, the LEC results did not
present compelling evidence for a difference between the groups in terms of their
QOL. Clearly work is needed to ensure that those living independently have adequate
opportunity to foster leisure interests and that they receive sufficient help, maybe
most importantly financial help, to ensure that their houses are pleasant and
comfortable places within which to live. The LEC is a global measure and is best used
as a screening devise to explore the lifestyle and experiences of people with a
learning disability. One of its strengths is, however, its applicability to a wide range of
societal groups and its emphasis on true community participation and integration. Of
concern was the very poor score of the participants, especially those living within
group homes, in terms of their leisure activities. Attention must be paid to helping
these participants to develop leisure activities within the community and to achieve
full integration rather than nominal involvement by virtue of living within ordinary
housing. Interestingly, the low score on the Leisure subdomain was not supported by
significantly fewer hobbies identified by participants living within their own home
collated during the semi-structured interview (mean number of hobbies, total sample
2.50, range per group 1.90 to 2.90). Additionally, the Daily Diary indicated that, far
from being less occupied, those living alone were receiving more visitors and making
more social trips from the home.
310
The ABS-RC:2 is also important as a screening and assessment device for prioritising
individual areas requiring skills training and practice. The importance of developing
daily living skills to enable the participants to function within the community as equal
members must not be underestimated and the opportunity for each individual to carry
out a range of every day living skills is also central to the philosophy of normalisation
(Wolfensberger, 1972). The use of this schedule as a measure of QOL is less clear.
Measurement of skill and behaviour change over time is important, although caution
must be exercised when interpreting changes as equivalent to either an augmentation
or deterioration in QOL.
6.1.3 Participant Measures of Life Quality
In order to provide information on the participants’ typical daily activities over a two
week period, they each completed a Daily Diary. The diary was completed for longer
than that specified as necessary in earlier studies (Dagnan et al., 1994) and also
differed from previous studies as it was completed whenever possible by the
participants themselves with minimal help from others. Previous researchers have
employed the diaries to record staffrcarer reports of participant activity. Several
interesting results emerged which can be compared to the results of the informant
measures used in the current study.
Firstly, men made significantly more outings to sporting events than women.
Typically these outings were to football matches, to play football or to visit the gym,
in fact women did not make any trips to sporting events during the two week period.
There could be several reasons for this discrepancy, it could be that the women in the
sample did not like sporting activities and so chose not to attend these events. It could
be that they had not experienced sporting activities previously and so did not know
whether they would like them or not, or that others’ perceived that they would not
enjoy them and so did not invite them to attend. Also, the differences between men
and women’s attendance of sporting activities within the general population was not
known by the current author. Further exploration of these gender differences may be
interesting.
311
No further sex differences were found, although there were several differences
between the participants in each residential placement group. Group 1 (Independent)
had significantly more visitors during the two week period than those in Groups 2 and
3 (Family and Group Home). Additionally, of the visitors that they did receive,
significantly more were non-disabled friends. This suggested that people living
independently may be less socially isolated that those living with their families. This
contradicts earlier research (Donegan and Potts, 1988) which suggested that they
remained socially isolated. Also, although those living independently did not have a
higher level of outings in general, they did make more social trips than both Groups 2
and 3, indicating that, not only did they receive visitors regularly into their homes but
they also travelled to see others routinely. This added further support for the argument
against loneliness and social isolation within this group. The fact that significantly
more of their visitors were non-disabled friends also suggested better integration
within the local community. Group 3 had the lowest number of non-disabled visitors,
suggesting that they had the poorest integration of all three groups. However, closer
examination of the diaries indicated that those participants living at home were
coding visits from family friends and rarely visits from people of their own age or
within their peer group. This represented integration within the family context but not
as an autonomous adult within society.
Generally, the number of visitors received and social trips made during this two week
period were quite low for all participants. Thus, there remained a degree of social
isolation, even for those living independently. Considerable input should be targeted
at ensuring those living within all three settings, but especially those living within the
family network or within group homes, have the opportunity to foster friendships with
others and to socialise outside the family or day placement setting.
Interestingly, none of the groups of participants displayed significantly more numbers
of friends when the data collected during the semi-structured interview was analysed
(mean 3.3, range 3.00 to 3.50). Further exploration of the interview material indicated
that those living within the family home and group home setting may have highlighted
either family friends, acquaintances or staff members as friends. Several people also
312
indicated individuals as friends but were unable to recall their names, indicating a less
close relationship. Others mentioned individuals with whom they had lost contact.
The current study also contradicted earlier research findings that those living within
larger residential placements were likely to have more friends than those living within
smaller placements (Landesman-Dwyer et al., 1980). The current study did, however,
seem to support previous researchers’ claims that, for many people with a learning
disability, especially those living within staffed community placements, the majority
of social contact may be limited to family members, other clients and staff members
(Dagnan et al., 1994).
This study did not show that those living alone were making more maintenance trips
from the home (i.e. trips necessary for household running), indicating that those
participants living within the family home and within group homes were participating
equally in shopping trips and visits to the community to carry out regular household
related tasks (e.g. to pay bills or collect money from the bank). As Dagnan et al.
(1994) found a significant increase in maintenance trips for participants leaving
hospital to live in the community, this finding suggested that, whilst there was an
observable difference between participants within community and institutional
settings, there is no difference between the number of maintenance trips made by
participants within differing community residential settings. It is important to
remember that Dagnan et al. asked stafficarers to complete the diaries whereas the
current study asked the participants themselves to complete the diaries. The person
completing the diary may have important implications for the reported activities and
outcomes.
Another reason for this finding may be that the importance of ensuring adults with a
learning disability are regularly involved in activities has been well researched and
written about, especially within the literature on normalisation principles and it is
easier to involve the adults routinely in maintenance activities. Involvement in
shopping trips, for example, does not require much pre-planning or staff/carer time. It
was not clear how many of these trips were carried out alone, however, closer
examination of the diaries indicated that the participants who lived alone were
313
carrying out these activities independently whilst those living with others were more
likely to go out with others. This may also explain the poorer performance of those
living within group homes on the Community Self-Sufficiency Factor of the ABS-
RC:2.
Group 1 (Independent) were making more trips out of the house with their non
disabled friends than those in Group 3 (Group Home) which also supported the theory
that they were more integrated within the community. The lack of difference between
those living alone and those living with their families is probably explained by the
fact that those living in the family home made trips out with their families and with
non-disabled family friends. These results further highlighted the fact that this group
did not have sufficient social contact with their peers, either disabled or non-disabled.
People living with their families also made more trips out into the community than
those living in the group homes, suggesting, as none of the participants could drive,
that they were taken to places by their family. Cattermole, Jahoda and Markova
(1990) highlighted the tendency for families to be over protective and to
underestimate the skills of their disabled members. This may explain the higher rates
of car travel in this group. By contrast, those living independently or within group
homes were more likely to travel by bus than were those living with their family.
Travelling by bus may highlight one aspect of the greater community presence of
these participants.
To summarise, although there were very encouraging aspects of the information
obtained from the Daily Diary records kept by the participants, indicating the greater
community presence and integration of those living alone, several concerns about the
lifestyles of the participants still remained. Participants generally showed fairly low
levels of participation and utilisation of community resources and had relatively low
levels of daily activity. They tended to use segregated community facilities and clubs
and were not in open or sheltered employment. Participants living at home or within
group homes did not possess sufficient opportunity to socialise, either within or
outside the home environment with friends. Those living within group homes, were
not well integrated into their local community. They seemed to be living on the
314
‘fringes of society’ as stated previously by Donegan and Potts (1988) and continued to
be both physically and socially isolated from other members of society (Emerson,
1985).
Many participants recounted an incident of significant physical or verbal bullying
from others and the mean incidence for the total sample was 1.05. These results are
discussed more fully in Section 4. Hewson and Walker (1992) reported that most
residents within community placements studied remained socially isolated and had
insufficient opportunity and support to establish links within their local community.
The current study provides further evidence to support this finding, especially for
those participants living within group homes. As Emerson and Hatton (1994) stated,
living in an ordinary house does not necessarily result in participation in ordinary
community living and those involved in working with adults with a learning disability
have to ensure that opportunities for integration are identified, created, supported and
taken up.
6,1.4 Interview Data
Very little of the interview data collected was coded specifically to allow statistical
analysis, however some findings were easily collated into numeric data. The type of
hobbies engaged in by the participants is presented in Appendix 10. The five most
frequently cited hobbies were; listening to music, knitting and sewing, looking after a
pet and watching films on TV. These are probably all very popular amongst non-
learning disabled members of the community as well, however, they are all activities
which can be carried out alone and highlight how easy it is for people with a learning
disability to become socially isolated. The lack of participation in clubs and group
activities may reflect a lack of financial resources, a lack of opportunity or of help to
facilitate participation (e.g. transport, help to identify suitable activities), a lack of
confidence, or a lack of interest on the part of the participants.
The aspirations identified by the participants are listed in Appendix 11. There was no
difference between the groups in terms of the number of aspirations identified. They
315
clearly indicated that adults with a mild to moderate learning disability aspired to
considerably more than solely living within staffed housing within the community and
attending segregated day services. Most aspirations were identified within the area of
employment and indicated a wish for paid employment. Greater social and activity
opportunities were also commonly cited by the participants, and indicated a wish for
more friends and to participate in a broader range of daily or leisure activities. These
results were in agreement with the reports of previous researchers (Szivos, 1990).
Half (N=10) of the participants wanted to move, usually to a less highly staffed
placement or away from their family, nine wanted to have a job, eight to travel and
seven wanted to get married, although several of these did not have a current partner.
Six participants wanted to do more, or different, activities and four expressed a global
wish to be more independent, although this may have meant different things to each
participant. Interestingly, only three participants expressed the desire to have more
money, indicating either the low aspirations of the participants in this area, or that
they were comfortable with their income. Although most of the aspirations mentioned
by the group participants were realistic, some participants stated that they wanted to
be in a pop group and to travel the world, to teach martial arts to others, to be a
costume designer for the BBC, to become a policeman or to play football for Chelsea.
These aspirations seemed more unrealistic, given the individual’s learning disability
and the fact that they did not have special strengths in the specific areas identified.
They could also be seen as similar to the fantasies and dreams many non-disabled
adolescents have. Participants were not probed further about their aspirations and so it
was not possible to identify whether they thought that they may be able to achieve
these ambitions. It was interesting that the younger participants identified the more
unrealistic fantasies, this may have reflected the developmental stage of the
individuals concerned. MacFarlane et al. (1980) described QOL as the discrepancy
between an individual’s achieved and their unmet needs and desires. It may therefore
be expected that participants with more aspirations, especially those that they were
unlikely to be able to achieve, would indicate higher levels of life dissatisfaction. In
fact, although statistical analysis was not possible due to the small sample size.
316
examination of the qualitative data did reveal some support for this hypothesis.
Further research is needed.
In order to compare the LEG measure of QOL and the participants’ perceptions of
their QOL obtained via interview, the SRS was devised and completed by an
independent rater. The statistical analysis revealed that scores on the LEG were not
correlated to scores on the SRS. This was probably due to several factors. The LEG
and SRS clearly did not assess the same aspect of QOL, as individual participant
scores on one were not related to scores on the other. Thus, high LEG scores
(indicating a ‘good’ QOL) could be related to either high or low scores on the SRS.
Additionally there were no significant differences between the groups, indicating little
difference between the groups’ perceptions of their QOL as measured by the SRS.
These results did not support the view that participants living on their own had a
poorer QOL than those living within their family. They did not perceive their lives to
be any less satisfactory. Exploration of the data collected by the SRS showed greater
variability of scores amongst the participants living independently and within the
family (range 60 to 76) compared to those living within the group homes. This finding
was interesting as it offered some support for the theory of Social Gomparison
(Festinger, 1954) which states that individuals compare themselves to others within
their social grouping or to objective measures (if they exist) in order to make a
judgement about their lives, behaviour, beliefs and attitudes. In the case of QOL,
where few objective measures exist within society, individuals with a learning
disability may compare themselves and their lives to those around them. Aspects of
the current study have indicated that people living within group homes are more
socially isolated and have fewer non-disabled friends for comparison. They may,
therefore, have a more restricted range of individuals against whom to compare
themselves. The greater variability in the perceptions of the other two groups may
reflect the greater range of comparison individuals. The perceived QOL may, to some
extent, reflect those individuals chosen against which to make a comparison.
It was also possible that the SRS scale developed did not measure QOL at all,
however, both previous research and the current qualitative data analysis of the study
317
participants indicated that individual perception of life quality was fundamental to
individuals’ appraisals of their current, and possibly their future, life situation.
Caution must be exercised when interpreting these results as the SRS was completed
by a rater from listening to the audiotaped interview transcripts and, as such, may not
have reflected the individuals’ perceptions of their lives. The instructions given to the
rater were that he should rate the participants comments and not his interpretations of
the participant’s QOL, however, it was probably difficult not to impose one’s own
views of life. Evidence to support the SRS as a measure of the participants’ perceived
QOL was also provided by the broadly similar rating given by the two independent
raters on the randomly selected sample of tapes, and the quite high inter-rater
agreement throughout the five point likert scale.
It was hypothesised that, although the objective, measurable, aspects of an
individual’s life were important to QOL, they were insufficient and must be
supplemented by subjective reports and experiences. The semi-structured interview
and Grounded Theory analysis provided a means of achieving this, however, the SRS
also provided a useful insight into the lives of the participants and their perceptions of
their situation. Further research using the SRS on a wider sample of participants, and
probably with those who are more disabled, would be useful. The reliability and
validity of the SRS was not known, so particular caution must be exercised when
interpreting these results or when drawing conclusions from findings. It may be
possible to create an assessment schedule of subjective QOL using the SRS. Further
research would be needed to study this in greater detail. Clearly, as the LEG and SRS
did not measure the same concept, they either do not measure QOL at all or measured
independent aspects of it.
Although the sample size limited the statistical interpretation of the interview
material, several trends within the participants reports were noted and would each be
valuable areas for further analysis. Not surprisingly there was some evidence that
those living on their own exercised more choice and independence (especially within
the areas of food, looking after their own money and using a bank independently).
318
There also seemed to be a relationship between type of placement and the quality of
comparisons that participants made about their lives and their happiness.
Those living with their family were more likely to rate their lives negatively when
asked a question about how they would compare their lives to others (much better or
worse, slightly better or worse or neither better nor worse). This provided some
observational support for the fact that those who were more integrated (i.e. not living
in a group home) had a wider range of social comparisons and were more likely to
make a negative comparison as explained by the Social Comparison Theory
(Festinger, 1954). Additionally, it further suggested that several of the participants
living with their family needed to separate and to develop more personal autonomy
and independence. Cattermole et al. (1990) also highlighted the fact that the parents
of adults with a learning disability may offer more support and be more protective
towards their sons or daughters than the learning disabled adults wish and that this
may lead to dissatisfaction. Social network blame was also stated by Zautra (1983) to
be related to poorer QOL.
These results failed to explain why those living alone did not perceive their lives more
negatively when compared to others. Maybe they compared themselves to others with
a learning disability and were pleased that they had a house of their own and were
able to manage with little support or maybe their external comparison groups were
not so dissimilar to their own life styles as to warrant negative comparison. This was
further supported by the fact that when asked how happy the participants had been
over the last month (very happy or unhappy, quite happy or unhappy, neither happy
nor unhappy), those participants living on their own were more likely to indicate that
they had been generally happy. Schalock, Harper and Carver (1981, ppl74) assessed
happiness by interviewing learning disabled people who had been residing in the
community for three years. During interviews, the participants reported that they
were;
"proud of their apartments and felt good about doing their own thing but frequently
indicated that they would like more friends".
Schalock et al. concluded that QOL, at least in people with a learning disability, was
319
influenced, not only by skill functioning, but also by the feelings and wishes of the
people themselves. The current study added support for this conclusion.
The failure to differentiate between the groups on the SRS and the higher Total LEC
score of those living with family members contradicted previous research findings
that those adults with a learning disability living independently and working part-time
had higher QOL scores than those who lived with their family and those who lived in
group homes (Schalock and Lilley, 1986). Although it is tempting to draw more
conclusions from these findings, it is important to remember that the sample sizes
were too small to allow for statistical comparison between the groups and the likert
scales were quite hard for the participants to use. Further research in this area would
certainly be very interesting.
Some of these additional interview findings are summarised below.
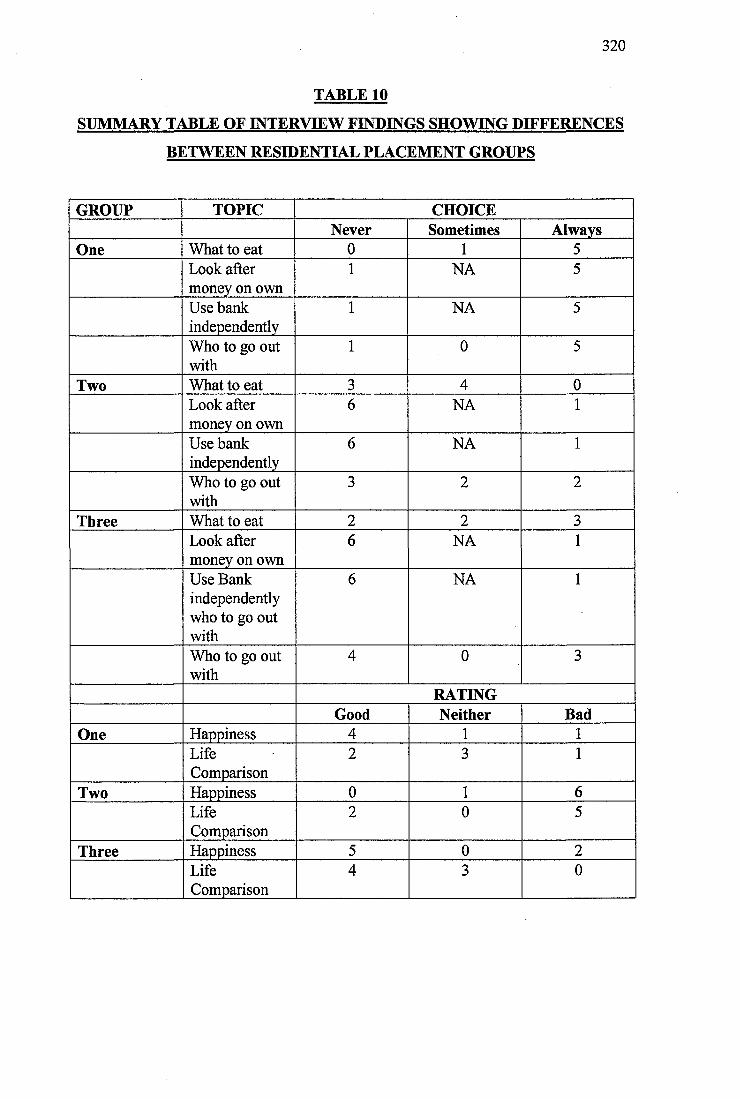
320
TABLE 10
SUMMARY TABLE OF INTERVIEW FINDINGS SHOWING DIFFERENCES
BETWEEN RESIDENTIAL PLACEMENT GROUPS
GROUP TOPIC CHOICENever Sometimes Always
One What to eat 0 1 5Look after money on own
1 NA 5
Use bank independently
1 NA 5
Who to go out with
1 0 5
Two What to eat 3 4 0Look after money on own
6 NA 1
Use bank independently
6 NA 1
Who to go out with
3 2 2
Three What to eat 2 2 3Look after money on own
6 NA 1
Use Bank independently who to go out with
6 NA 1
Who to go out with
4 0 3
RATINGGood Neither Bad
One Happiness 4 1 1LifeComparison
2 3 1
Two Happiness 0 1 6LifeComparison
2 0 5
Three Happiness 5 0 2LifeComparison
4 3 0
321
6.3 General Discussion
The definition of QOL adopted during the current study categorised QOL along four
dimensions and included the discrepancy between an individual’s achieved and their
unmet needs and desires (MacFarlane et al, 1980), as well as the extent of an
individual’s ability to exercise control over his/her environment and his/her personal
autonomy (Brown, Bayer and MacFarlane, 1988). It was also construed that, central
to a model of QOL, were the individual’s personal needs and perceptions, their social
network and the environments within which they lived and worked (Brown, 1988).
An examination of the qualitative and quantitative results of the research project
added additional support for the importance of the factors listed above in determining
an individual’s QOL.
At the start of the research, the hypotheses were that QOL was a model which could
be meaningfully applied to adults with a learning disability and that QOL would differ
between individuals. Both these hypotheses were confirmed. It is not possible to
generalise the results to adults with a more severe learning disability, however, the
results indicated that QOL should be explored further with this client group and that it
was certainly applicable, in the form highlighted above, to adults with a mild to
moderate learning disability.
Further hypotheses which were confirmed during the process of research were that
objective QOL would be related to higher levels of daily activity, greater social
contacts, material comforts and community presence. The Total LEC score was lower
for adults living independently, accounted for by lower subdomain scores in the areas
of Home and Leisure. These results indicated a generally lower QOL of participants
in this group (Group 1), however, when the results of the Daily Diary were analysed
they showed significantly higher rates of activity for Group 1 in several areas, such as,
receiving visitors, especially non-disabled friends and social trips from the house,
indicating a higher QOL in these areas. It seemed important that the life domain
assessed was specified, and it was possible for a participant to have a higher QOL in
322
one area of their life than another, when measured objectively. This highlighted one
weakness of the objective QOL model.
The hypothesis that objective indicators and subjective reports of QOL may be
unrelated to one another was also confirmed. The objective measure (LEC) and
Subjective Rating Scale (SRS) of participants’ QOL in complementary life areas were
unrelated, indicating the independence of these factors. This meant that participants
were able to achieve a high objective rating of QOL and either a high, medium or low
rating on the subjective measure. Caution must be used when interpreting these
results due to the small sample size and the fact that the two rating scales used
different methods to obtain information, (one from an informant and one from the
participant him/her-self using an independent rater). Additionally, the reliability and
validity of the SRS was not known as it was developed by the researcher for the
purpose of the present study. Other researchers, such as Lewis and Ryan (1986) and
Ingelhart and Robier (1986) also observed that there was little relationship between
objective social indicators of the environment and subjective indicators of QOL or
well-being. The results indicated that, although an individual may have good
objective indicators of QOL, they may perceive their life quite differently, suggesting
the importance of internalised subjective factors in this concept.
The final hypothesis was that qualitative analysis of the data using the grounded
theory approach would provide insight into the thoughts, wishes and aspirations of
people with a learning disability living in the community. The summary of the
qualitative data analysis findings illustrated how the theoretical model developed
added to the information on the perceptions of learning disabled adults about their
QOL. Models of QOL of learning disabled people are particularly important because
this social group may not be able to express sophisticated views on their life
experiences due to their learning disability or receptive and expressive language
problems. This is obviously of particular concern for more disabled people. Zapf
(1987) also commented that individuals are often under social pressure to suppress
feelings of dissatisfaction and that expectations usually adjust to individual
circumstances. It was interesting that the participants of the current study were able to
323
express considerable dissatisfaction, especially with the social aspects of their lives.
Perhaps it was important that they were seen in private and were seen over a period of
time to establish rapport with the researcher. Many of the participants did seem to
have quite low expectations of their ability to change their lives and found it difficult
to identify which aspects of their lives they would change. Although anecdotal, these
findings do provide some support for Zapf s comments.
The introduction to the current research project (Section 2) highlighted some of the
more prominent models of QOL within the general literature and the literature
concerned with disabled people. These are worth re-visiting to consider how the
research components and findings of the current study complement these findings.
One strength of the current study was that the model of QOL developed did not treat
QOL as a narrow construct as several previous researchers have tended to (Halpem et
al., 1986; McKennell and Andrews, 1983 and Bateson, 1972). Both Flanagan (1978,
1982) and Campbell (1976) stated that QOL was related to physical and material
well-being, relationships with others, social and civic duties, personal development,
fulfilment and recreation. To a large extent the current research confirmed the
importance of these factors, however, the emphasis placed on each domain probably
differed. Civic duties, which were largely outside the sphere of opportunity for the
participants, assumed a less important role. Flanagan’s model of QOL was derived
from a study of non-learning disabled people using the critical incident technique and,
as was highlighted earlier, would require amendment to be directly applicable to
learning disabled adults. Personal development and fulfilment assumed a central role
within the current model as did objective indicators such as material and physical
well-being. Blunden (1988) also highlighted the importance of physical, material and
social well-being. However, he also indicated that cognitive well-being was
important. The current model of subjective QOL did incorporate the dimensions of
health and disability, but the presence of a learning disability per se seemed not to be
as important as the impact these difficulties had on the environment within which the
individual lived and worked (specific task/skill weaknesses).
324
Parmenter (1992) found that people with a disability also needed to cope with their
disabled identity within a predominantly non-disabled community and with the
resultant stigma associated with this identity. The current study added further support
for this statement. Most participants had experienced some kind of prejudiced,
stigmatising treatment, yet for many this did not seem to impact greatly on their QOL.
There did not seem to be great variability in the accounts of how individuals had
coped with these events and most people seemed to have resolved any issues they
raised. This seemed to indicate that, for most of the participants involved in the
current study, their disabled identity was not causing them distress or difficulty, or
that they were unaware of the difficulty it did cause them.
Cattermole et al. (1990) highlighted five important themes when he interviewed
people with a learning disability about their lives. These were; choice, privacy, social
life, relationships with others and aspirations. Once again the importance of these
factors in the appraisal a learning disabled individual made about his/her life were
generally supported. The need for privacy, although important, was highlighted as an
area of weakness or need in the lives of very few of the research participants. This
indicated that, at least for the current research participants, they were generally
obtaining sufficient access to space and privacy. Some tensions between people with
a learning disability living at home with their families were indicated in Cattermole et
al.'s study. These issues were again highlighted in the current research. This also
supported Zautra’s (1983) claim that social network blame was related to a reduced
QOL. Schalock, Harper and Carver (1981) stated that people with a learning disability
frequently commented that they would like more friends. The results of the current
study supported these findings and indicated that social environments had a
considerable impact on the lives of learning disabled people (Edgerton, 1990). Perry
and Felce (1995) highlighted activity, autonomy and choice, housing quality, personal
development, social and community integration and social interactions. All of these
factors were encompassed within the current research and incorporated as either
objective QOL indicators or within the subjective model. Legault (1992) also
emphasised community activity and echoed previous researchers’ comments about
325
the importance of home life and work. Again these factors were incorporated within
the current model.
As mentioned previously, Taylor and Bogdan (1990) have stated that QOL has little
meaning apart from the perceptions of the individual concerned. Just as it seemed too
simplistic to adopt a purely objective model of QOL, this solely subjective model also
seemed flawed. The quantitative results of the current study indicated that there were
several aspects of the lives of learning disabled people which differed significantly
and that general themes emerged concerning their social isolation and exclusion from
the local community within which they lived. Material/ecomomic aspects of their
lives were also important and could be objectively measured.
The current research suggested that a sophisticated model of QOL should combine
both subjective experience and objective measures. Any definition of QOL must
reflect the values, aspirations and perceptions of the individuals it relates to, as well
as incorporating behaviours within specific life areas. There are probably minimum
standards of acceptability, which, regardless of whether the individual perceives them
to be areas of dissatisfaction, require intervention if they fall below critical levels. As
Perry and Felce have stated (1995, ppl34):
‘'Although QOL is personal, reflecting individual preferences and subjective
interpretation, objective measurement still plays an important role’\
Festinger’s (1954) Social Comparison Theory and Zautra and Goodhart’s (1979)
‘Adaptation Level Model’ which both stated that individuals can evaluate their
experiences by comparing them against a baseline with others, seemed to be
important to the study of QOL. The current study did not focus on the contribution of
positive or negative life events on the individual’s QOL (Zautra and Reich, 1983),
however, several comments were made by individuals suggesting that the impact of
such events should be further investigated.
Another area highlighted by Joyce (1990) and supported by the current research was
that organisations working with people with a learning disability have been more able
326
to develop individual skills, especially in the areas of self-care and domestic skills,
and have been less able to address other important areas such as community presence
and relationships with others.
Parmenter’s (1988) model developed for people with a physical disability, which
incorporated societal influence, functional behaviour and self, was preferred at the
start of the research. This model was extended and developed by Felce in 1997. The
model which is now presented to provide the more comprehensive model of QOL,
incorporates the subjective QOL model, ‘Perceptions of Current and Future Life
Context (QOL)’ within the subjective well-being domain of Felce’s model (1997,
ppl27). This model is outlined below.
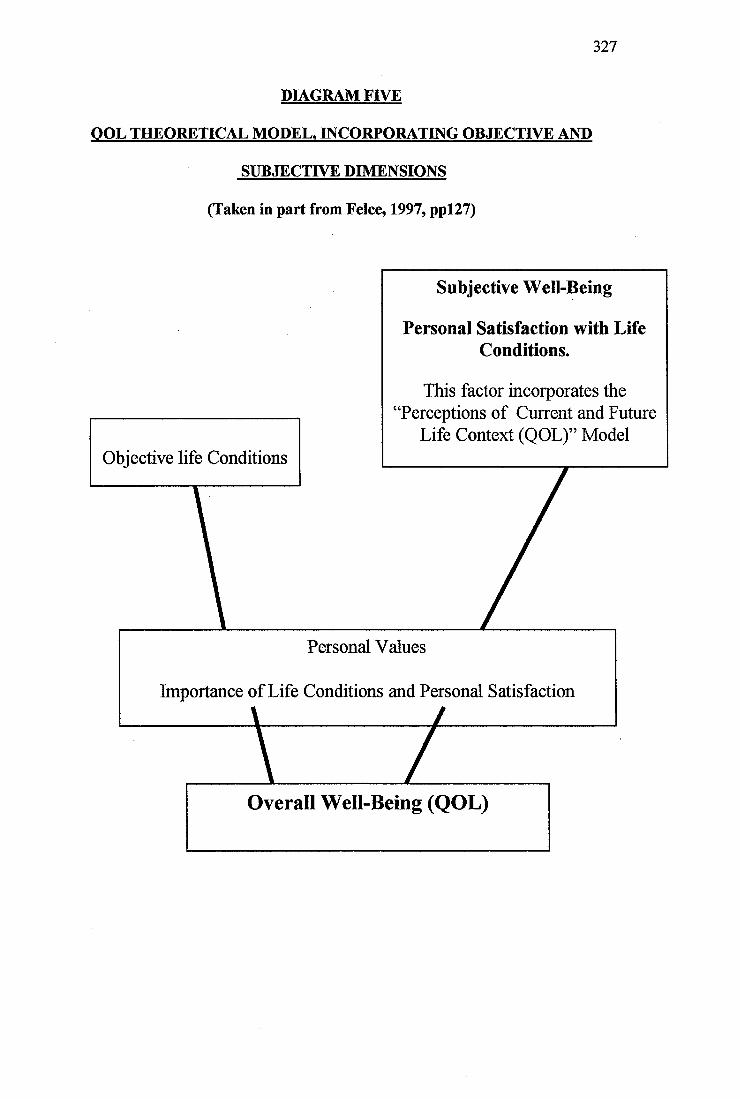
327
DIAGRAM FIVE
QOL THEORETICAL MODEL. INCORPORATING OBJECTIVE AND
SUBJECTIVE DIMENSIONS
(Taken in part from Felce, 1997, ppl27)
Objective life Conditions
Overall Well-Being (QOL)
Importance of Life Conditions and Personal Satisfaction
Personal Values
This factor incorporates the Perceptions of Current and Future
Life Context (QOL)” Model
Personal Satisfaction with Life Conditions.
Subjective Well-Being
328
7. SUMMARY AND CONCLUSIONS
The current study was designed to investigate the QOL of adults with a mild to
moderate learning disability living in the community and receiving input from a
multidisciplinary team comprising health and social services persoimel
In order to present as comprehensive a study of QOL as possible, and to attempt to
encompass major dimensions of this complex construct, both objective and subjective
approaches were utilised.
Several interesting and important features of the lives of people with a learning
disability emerged. Some of these added to the corpus of data already available,
whilst others highlighted contradictory or contrasting findings warranting further
investigation.
QOL is an extremely complex concept, the features of which are not easily
understood within the literature on non-learning disabled members of society.
However, it is clearly a concept which is of relevance to people with a learning
disability, who may have less opportunity and fewer personal resources available to
enable them to highlight shortcomings or dissatisfactions with their lives, or to take
action to remedy any problems. They may also be among the more socially and
economically disadvantaged members of society and active steps may need to be
taken to promote their lives and access to opportunities.
The current research has indicated that QOL cannot solely be equated with objective
measures of aspects of the lives of adults with a learning disability, especially if these
measures are completed by informants.
Objective measures of an individual’s domestic, work/daytime activity, social and
relationship opportunities are clearly important. Measurement of these factors is also
important to ensure that services, professionals and carers working with people with a
learning disability focus their efforts, not only on alleviating and treating
psychological, psychiatric or physical health related problems, but also on improving
329
the opportunities available for people with a learning disability to explore the local
community and to participate in a variety of social and leisure, or civic, activities.
It is clearly not satisfactory for adults with a learning disability to merely observe
their local community from the periphery, as is currently the situation in many cases.
They should be fully integrated and given the necessary help and support to become
valued as equal participants. Objective measures of QOL have potential for adding a
useful dimension to the assessment of adaptive functioning or measurement of change
over time. They can be used to highlight individual difficulties which may impede
integration and participation as well as service shortcomings which fail to support the
individual or to facilitate participation. Indeed, they have provided the most
significant and useful research findings when they have been used in this way.
The current research has shown that, central to one’s QOL, are the individual
perceptions one makes. In order to study these more fully, the grounded theory
approach was used to examine semi-structured interviews carried out with the
learning disabled research participants. As far as the researcher was aware, this
technique has not previously been carried out with learning disabled adults to develop
a theoretical model of their QOL.
The ‘Perceptions of Current and Future Life Context (QOL)’ model which was
developed provided a complementary and conceptually more enriched theory of QOL
than the, somewhat limited, objective measures.
Four interesting subjective domains emerged incorporating nine subdomains; Social
(Relationships and Belonging), Health and Disability (Impact of Disability and
Additional Health Problems), Community Living (Financial Security, Daytime
Activities and Home), Opportunity (Opportunity for Progression and Development
Throughout Life Cycle and Opportunity for Self-Direction). This theoretical model
was of considerable interest as it confirmed the emerging picture of how people with
a learning disability perceived their lives, whilst providing considerable scope for
further analysis, refinement and development of the individual domains, subdomains
330
and inter-relationships between them. As a review of the literature provided the basis
for topics to be covered during the semi-structured interview, one concern was the
extent to which these previously adopted or imposed labels would constrain and
restrict the grounded theory analysis. Strauss and Corbin (1990) highlighted this as a
problem frequently encountered by grounded theory researchers. However, as the
main aim of the current research was to expand and develop new meanings and
perspectives on these previously described categories, this was not felt to be too
troublesome a methodological problem. Additionally, several of the subjective QOL
subsidiary categories, whilst encompassing aspects of the topic areas covered in the
semi-structured interview, were not conceptually equal to them. It was interesting that
several novel and unanticipated category labels were developed as a result of the
grounded theory analysis.
Consideration of the objective, measurable aspects of an individual’s life, enhanced
with exploration within the ‘Perceptions of Current and Future Life Context (QOL)’
model seemed to provide the most comprehensive picture of QOL and provided
support for interactional models of QOL which have stated that both objective
indicators and subjective perceptions are important. One of the objectives of the
current research was to identify a complementary and academically stringent
qualitative approach to supplement the study of QOL. The theoretical model,
developed using grounded theory, seems to have achieved this.
8. DIRECTIONS FOR FURTBOER RESEARCH
The current study highlighted numerous avenues for further research and indicated
several local service implications. These are summarised below.
One of the more important service implications was that the current study highlighted
that factors such as intellectual functioning, adaptive functioning, additional
psychiatric or physical health related problems did not distinguish between those
participants with a mild to moderate learning disability living within more highly
supported placements and those living independently. These findings were of concern
331
as they suggested that more arbitrary factors may be involved in decisions about the
residential placement of adults with this broad range of learning disability. The extent
to which additional factors, unrelated to individual characteristics or areas of personal
strength or weakness, were involved in this decision making process were unclear.
Indeed, the extent to which individual choice was also involved was not known.
Further research should be carried out to establish the factors involved in placement
decisions and to identify whether the issues highlighted within the current study
generalise to other localities.
A study of the individual’s perceptions of the decisions available to him/her regarding
residential placement would also be interesting.
Previous reports highlighting service weaknesses in supporting adults with a learning
disability to maximise their potential and to integrate fully within society were, to
some extent, replicated within the current study. Whilst there were also encouraging
reports of the presence of non-disabled friends in the lives of some participants, most
notably those living independently, the overall picture was one of considerable social
isolation and segregation. Attempts should be made to promote a pattern of stable and
mutually rewarding friendships, not only within the learning disabled community but
also incorporating the wider society. This is unlikely to be achieved whilst adults with
a learning disability attend segregated day time activities, attend segregated social
activities and are not supported to receive visits from friends within the local
community. These social networks were highlighted by the adult participants
themselves as fundamental. The need for staff training in the importance of
facilitating community presence and participation, as well as the provision of both
practical and financial support for the individuals themselves, is highlighted by the
current research. Professionals and carers should prioritise skills teaching on aspects
which would promote safe community integration and participation in a wide variety
of daily living skills.
In particular, the adults with a learning disability involved in the current study would
benefit from input designed to promote the development of social or group related
332
hobbies as well as the individual, but possibly isolating, pattern of hobbies currently
engaged in. In addition, personal, community and service related factors limiting the
individual’s participation and integration within the local community should be
further explored.
Due to the qualitative research component of the current study and the concomitant
difficulty analysing the qualitative data of large sample sizes, the total number of
participants was small. Further research should be carried out to explore the
quantitative aspects of the QOL of individuals with a learning disability and to use
large sample sizes to cany out more detailed comparative studies. Differences
between the subjective perceptions of adults with a learning disability living within
the community and those living within an institutional setting would be interesting to
identify whether the theoretical model proposed during the current research is
applicable to those living within different settings.
Research should be carried out to develop more appropriate measures of the QOL of
adults with a learning disability which integrate both objective and subjective
experiences.
A longitudinal study of the QOL of adults with a learning disability would be
interesting to identify whether, as previous research has suggested (Brown, 1988), the
individual’s perceptions of factors important for an enhanced QOL change over time.
Both the Daily Diary system and the SRS would benefit from further study using
larger participant numbers. The reliability and validity of the SRS has not been
established. It may be usefully developed into an assessment schedule.
Further study, using the Daily Diary system may help to confirm whether those adults
with a learning disability living independently do have more reciprocal friendships
and whether a greater proportion of their friends are non-disabled than the friends of
those living within more supported environments.
333
Aspects of the group home environment and further comparison between group
homes should be carried out in order to elucidate aspects of the social and physical
environment which hinder community participation.
The social networks of those adults with a learning disability living with their families
should be explored. The grounded theory approach might be usefully employed
within this research context to explore the views of adults with a learning disability
living with their families and the views of their family members. Additionally, it
might be interesting to explore the change in perceptions prior to a move from the
family home and after separation from the family.
The relationship between type of residential placement and the comparisons an
individual makes about his/her life would also be another, possibly related, area for
further qualitative research (Social Comparison Theory, Festinger, 1954; Adaptation
Level Model, Zautra and Goodhart, 1979). The current study highlighted a possible
trend for those living with their family to compare their lives less favourably with
others’. This should be further studied.
The trend for adults with a learning disability living independently to rate themselves
as happier compared to those in more highly supported environments is also worthy
of further study.
Those adults with a severe level of learning disability are more difficult to survey,
however, it is important that they are considered for future research and that they are
not excluded from contributing to the research literature because of methodological
problems.
Finally, further research should be targeted towards using the grounded theory
approach to explore the views, experiences and opinions of people with a learning
disability. The theoretical model of subjective QOL highlighted several areas which,
in themselves, would make interesting areas for further qualitative study (domains
and subdomains). There is a need to explore the process of summation and inter-
334
relationship between the QOL domains and subdomains to provide an overall
appraisal of subjective QOL, including the relative importance of each domain on the
core category. It seems likely that further study would be able to elaborate upon the
current theoretical model developed and would provide a greater insight into the lives,
experiences and perceptions of people with a learning disability.
One important note of caution highlighted by Goode (1991, pp3) was that services
needed to ensure that the ‘tyranny of normaV was not replaced with the ‘tyranny of
quality". This referred to the dilution of normalisation principles or their rigid over
application within some service settings. It is important that QOL remains an
individually orientated concept which is not manipulated by services/organisations to
meet their objectives rather than the objectives of the person with a learning
disability.
335
9. REFERENCES
1. Ager, A. (1990). The Life Experiences Checklist Manual. NFER - Nelson
Publishing Company Ltd., Berkshire, UK.
2. Allen, D. (1989). The Effects of Deinstitutionalisation on People with Mental
Handicaps: A Review. Mental Handicap Research, 2(1), 18-37.
3. Allport, G.W. (1962). The General and the Unique in Psychological Science.
Journal of Personality, 30,405-422.
4. American Psychiatric Association (1994). Diagnostic and Statistical Manual
of Mental Disorders (Fourth Edition), pp39-46. American Psychiatric
Association: Washington D C., USA
5. Andrews, F.M., & McKennell, A C. (1980). Measures of Self-Reported
Well-Being: Their Affective, Cognitive and Other Components. Social
Indicators Research, 8,127-155.
6. Antaki, C., & Rapley, M. (1996). Questions and Answers to Psychological
Assessment Schedules: Hidden Troubles in 'Quality of Life' Interviews.
Journal of Intellectual Disability Research, 40(5), 421-437.
7. Andrews, F.M., & Withey, S.B. (1976). Social Indicators of Well-Being:
Americans' Perceptions of Life Quality. Plenum: New York, USA.
8. Atkinson, D. (1988). Research Interviews with People with Mental
Handicaps. Mental Handicap Research, 1(1), 75-90.
9. Balia, D. (1976). Relationship of Institution Size to Quality of Care: A Review
of the Literature. American Journal of Mental Deficiency, 81,117-124.
336
10. Barofî, G.S. (1980). On Size and the Quality of Residential Care: A Second
Look. Mental Retardation, 18,113-117.
11. Bateson, G. (1972). Steps to an Ecology of Mind. Chandler: San Francisco,
USA.
12. Blair, T.H. (1977). Quality of Life, Social Indicators and Criteria of Change.
Professional Psychology, 8,464-473.
13. Blunden, R. (1988). Quality of Life in Persons with Disabilities: Issues in the
Development of Services. In: Brown, R.I. (Ed.). Quality of Life for
Handicapped People, pp37-55. Croom Helm: London, UK.
14. Blunden, R., Evans, G., & Humphreys, S. (1987). Planning with
Individuals: An Outline Guide. The Mental Handicap in Wales Applied
Research Unit: Cardiff, UK.
15. Bonano, R., Gibbs, E.F., & Twardzicki, N. (1982). Quality of Life Index.
Wrenham State School and Children's Hospital, Boston, MA, USA.
16. Bradburn, N.M., & Sudman, S. (1979). Improving Interview Method and
Questionnaire Design. Jossey-Bass: San Francisco, USA.
17. Bratt, A., & Johnson, R. (1988). Changes in Life Style for Young Adults
with Profound Handicaps Following Discharge from Hospital Care into a
‘Second Generation’ Housing Project. Mental Handicap Research 1(1), 49-74.
18. Breakwell, G.M. (1995). Interviewing. In: Breakwell, G.M., Hammond, S., &
Fife-Shaw, C. (Eds.). Research Methods in Psychology, pp230-242. Sage
Publications, London, UK.
337
19. Brost, M., & Johnson, T. (1982). Getting to Know You: One Approach to
Service Assessment and Planning for Individuals with Disabilities. Wisconsin
Coalition for Advocacy: Wisconsin, USA.
20. Brown, H. (1988). Bringing People Back Home: Video Assisted Training
Packages: 1. Designing Services to Meet Individual Needs (with Bailey, R.); 2.
Participation in Everyday Activities (with Brown, V., Toogood, A.); 3.
Working with Families (with Bailey, R.); 4. Teaching New Skills (with
Brown, V., Bell, C.); 5. Understanding and Responding to Difficult Behaviour;
6. Building Social Networks. South East Thames Regional Health Authority:
Bexhill, UK.
21. Brown, R.I., Bayer, M B., & MacFarlane, C. (1988). Quality of Life
amongst Handicapped Adults. In: Brown, R.I. (Ed.). Quality of Life for
Handicapped People, ppl 11-140. Croom Helm: London, UK.
22. Campbell, A. (1976). Subjective Measures of Well-Being. American
Psychologist, 31,117-124.
23. Campbell, A. (1977). Poor Measurement of the Right Things. Paper Read at
the Annual Meeting of the American Statistical Association, Chicago, August.
24. Campbell, A., Converse, P.E., & Rodgers, W.L. (1976). The Quality of
American Life: Perceptions, Evaluation and Satisfaction. Russell Sage: New
York, USA.
25. Cattermole, M., Jaboda, A., & Markova, I. (1990). Quality of Life for
People with Learning Difficulties Moving to Community Homes. Disability,
Handicap and Society, 5 (2), 137-152.
26. Cbarmaz, C. (1990). Discovering Chronic Illness: Using Grounded Theory.
Social Science and Medicine, 30,1161-1172.
338
27. Conroy, J.W., & Bradley, V.J. (1985). The Pennhurst Longitudinal Study; A
Report of Five Years of Research and Analysis. Temple University:
Philadelphia, USA.
28. Cragg, R., & Harrison, J. (1986). Living in a Supervised Home: A
Questionnaire on Quality of Life. West Midlands Campaign for People with a
Mental Handicap: Wolverley, Kidderminster, Worcs, UK.
29. Cragg, R., & Look, R. (1992). Compass: A Multiperspective Evaluation of
Quality in Home Life. R.J. Cragg Publishing: 302 Station Road, Birmingham,
UK.
30. Cullen, C., Burton, M., Watts, S., & Thomas, M. (1983). A Preliminary
Report on the Nature of Interactions in a Mental Handicap Institution.
Behaviour Research and Therapy, 21,579-583.
31. Dagnan, D.J., & Drewett, R.F. (1994). Effect of Home Size on the Activity
of People with a Learning Disability Who Move from Hospital to Community
Based Homes. International Journal of Rehabilitation Research 17,265-267.
32. Dagnan, D., Howard, B., & Drewett, R.F. (1994). A Move from Hospital to
Community-Based Homes for People with Learning Disabilities: Activities
Outside the Home. Journal of Intellectual Disability Research, 38, 567-576.
33. Dagnan, D., Look, R., Ruddick, L., & Jones, J. (1995). Changes in the
Quality of Life of People with Learning Disabilities Who Moved from
Hospital to Live in Community-Based Homes. International Journal of
Rehabilitation Research, 18,115-122.
34. Dagnan, D., Trout, A., Jones, J., & McEvoy, J. (1996). Changes in Quality
of Life Following a Move from Hospital to a Small Community Unit for
339
People with Learning Disabilities and Challenging Behaviour. The British
Journal of Developmental Disabilities, 83,125-135.
35. Dalkey, N.C., Rourke, D.L., Lewis, R., & Snyder, D. (1972). Studies in the
Quality of Life. Heath: Lexington, Massachusetts, USA.
36. DeKock, U., Saxby, H., Thomas, M., & Felce, D. (1988). Community and
Family Contact: An Evaluation of Small Community Homes for Adults with
Severe and Profound Mental Handicaps. Mental Handicap Research, 1, 127-
140.
37. Donegan, €., & Potts, M. (1988). People with a Mental Handicap Living
Alone in the Community: A Pilot Study of their Quality of Life. British
Journal of Mental Subnormality, 34,10-22.
38. Dossa, P.A. (1989). Quality of Life: Individualism or Holism? A Critical
Review of the Literature. International Journal of Rehabilitation Research,
12(2), 121-136.
39. Dunn, L.M., Dunn, L.M., Whetton, €., & Pintilie, D. (1982). British Picture
Vocabulary Scale NFER-Nelson Publishing Company Ltd., Berkshire, UK.
40. Edgerton, R.B. (1990). Quality of Life from a Longitudinal Research
Perspective. In: Schalock, R.L. (Ed.). Quality of Life Perspectives and Issues,
ppl46-160. American Association on Mental Retardation, Washington D.C.,
USA.
41. Emerson, E.B. (1985). Evaluating the Impact of Deinstitutionalization on the
Lives of Mentally Retarded People. American Journal of Mental Deficiency,
90(3), 277-288.
340
42. Emerson, E., Beasley, F., Offord, G., & Mansell, J. (1992). An Evaluation
of Hospital-Based Specialized Staffed Housing for People with Seriously
Challenging Behaviours. Journal of Intellectual Disability Research, 36, 291-
307.
43. Emerson, E., & Hatton, C. (1994). Deinstitutionalisation in the UK: Impact
on Service Users. In: Mansell, J., & Ericsson, K. (Eds.). Proceedings of the
International Conference on the Dissolution of Institutions and the
Development of Community Services, pp29-42. Chapman and Hall: London,
UK.
44. Evans, G., Todd, S., Blunden, R., Porterfield, J., & Ager, A. (1987).
Evaluating the Impact of a Move to Ordinary Housing. British Journal of
Mental Subnormality, 33,10-18.
45. Felce, D. (1993). Ordinary Housing. A Necessary Context for Meeting
Service Philosophy and for Providing an Effective Therapeutic Environment.
In: Jones, R., & Eayrs, C.B. (Eds.). Challenging Behaviour and Intellectual
Disability: A Psychological Perspective, ppl76-190. BILD Publications: Avon,
UK.
46. Felce, D. (1997). Defining and Applying the Concept of Quality of Life.
Journal of Intellectual Disability Research, 4192), 126-135.
47. Felce, D., DeKock, U., & Repp, A. (1986). An Eco-Behavioral Analysis of
Small Community Based Houses and Traditional Large Hospitals for Severely
and Profoundly Mentally Handicapped Adults. Applied Research in Mental
Retardation, 7, 393-408.
48. Felce, D., & Perry, J. (1995). Quality of Life: Its Definition and
Measurement. Research in Developmental Disabilities, 16, 51-74.
341
49. Festinger, L. (1954). A Theory of Social Comparison Processes. Human
Relations, 7,117-140.
50. Flanagan, J.C. (1978). A Research Approach to Improving our Quality of
Life. American Psychologist, 33,138-147.
51. Flanagan, J.C. (1982). Measurement of Quality of Life: Current State of the
Art. Archives of Physical Medical Rehabilitation, 63, 56-59.
52. Flynn, M.C. (1986). Adults who are Mentally Handicapped as Consumers:
Issues and Guidelines for Interviewing. Journal of Mental Deficiency
Research, 30, 369-377.
53. Flynn, M.C., & Saleem, J.K. (1986). Adults who are Mentally Handicapped
and Living with their Parents: Satisfaction and Perceptions Regarding their
Lives and Circumstances. Journal of Mental Deficiency Research, 30, 379-
387.
54. Gergen, K.J. (1985). The Social Constructionist Movement in Modem
Psychology. American Psychologist, 40,266 - 275.
55. Gerjuoy, I.R., & Winters, J.J. (1966). Lateral Preference for Identical
Geometric Forms: II. Retardates. Perception and Psychophysics, 1,104-106.
56. Gill, R. (1996). Discourse Analysis: Practical Implementation. In:
Richardson, J.T.E. (Ed.). Handbook of Qualitative Research and Methods for
Psychology and the Social Sciences, ppl41-158. BPS Books (The British
Psychological Society), Leicester, UK.
57. Gilhooly, K., & Green, C. (1996). Protocol Analysis: Theoretical
Background. In: Richardson, J.T.E. (Ed.). Handbook of Qualitative Research
342
Methods for Psychology and the Social Sciences, pp55-74. BPS Books (The
British Psychological Society), Leicester, UK.
58. Glaser, B.G., & Strauss, A.L. (1965). Awareness of Dying. Aldine: Chicago,
Illinois, USA.
59. Glaser, B.G., & Strauss, A.L. (1967). The Discovery of Grounded Theory:
Strategies for Qualitative Research. Aldine: Chicago, Illinois, USA.
60. Goode, D A. (1991). Quality of Life Research: A Change Agent for Persons
with Disabilities. Paper Presented to the 1991 American Association on
Mental Retardation National Meeting Round Table Program, Washington,
D.C.,USA.
61. Grossman, H. J. (1983). (Ed.). Classification in Mental Retardation.
American Association on Mental Deficiency. Washington, D C.
62. Hall, J. (1976). Subjective Measure of Quality of Life in Britain: 1971 to
1975. Some Developments and Trends, 7,25-33.
63. Halpern, A.S., Close, D.W., & Nelson, D.J. (1986). On My Own: The
Impact of Semi-Independent Living Programs for Adults with Mental
Retardation. Brookes: Baltimore, USA.
64. Heal, L.W., & Chadsey-Rusch, J. (1985). The Lifestyle Satisfaction Scale
(LSS): Assessing Individuals' Satisfaction with Residence, Community Setting
and Associated Services. Applied Research in Mental Retardation, 6, 475-
490.
65. Henwood, K., & Pidgeon, N. (1995). Grounded Theory and Psychological
Research. The Psychologist, 8,115-118.
343
66. Hewson, S., & Walker, J. (1992). The Use of Evaluation in the Development
of a Staffed Residential Service for Adults with Mental Handicap. Mental
Handicap Research, 5(2), 188-203.
67. Hoffman, K. (1980). Quality of Life as Perceived by Persons who were
Classified as Mentally Retarded. University of Nebraska, Lincoln, N.E., USA.
68. Hughes, A., McAuslane, L., & Schur, H. (1996). Comparing Quality of Life
of People with Learning Disabilities and People who are Unemployed or
Retired. British Journal of Learning Disabilities, 24,99-103.
69. Humphreys, S., Lowe, K., & Blunden, R. (1983). The Long Term
Evaluation of Services for Mentally Handicapped People in Cardiff: Research
Methodology. Applied Research Unit, University of Wales, Cardiff, UK.
70. Ingelhart, R., & Robier, J R. (1986). Aspirations Adapt to Situations - But
why are the Belgians much Happier than the French? In: Andrews, F.M. (Ed.).
Research on the Quality of Life, pp88-96. Ann Arbor: Institute of Social
Research, University of Michigan, USA.
71. Joyce, T. (1994). The Effect of Individual and Environmental Characteristics
on Outcomes in Residential Services. Mental Handicap Research, 7(2), 134-
146.
72. Kammann, R., Christie, D., Irwin, R., & Dixon, G. (1979). Properties of an
Inventory to Measure Happiness (and Psychological Health). New Zealand
Psychologist, 8,1-9.
73. Kennedy, L.W., Northcott, H.C., & Kinzel, C. (1977). Quality of Life in
Edmonton: Initial Findings from the 1977 Edmonton Area Study. Edmonton
Area Series Report No. 1. Department of Sociology, University of Alberta,
344
Edmonton.
74. Kidder, L.H. (1981). Qualitative Research and Quasi-Experimental
Frameworks. In: Brewer, M.B., & Collins, B.E. (Eds.). Scientific Inquiry and
the Social Sciences, pp70-140. Jossey-Bass: San Francisco, California, USA.
75. Land, K., & Spilerman, S. (1975). Social Indicator Models. Russell Sage:
New York, USA.
76. Landesman, S. (1986). Quality of Life and Personal Life Satisfaction:
Definition and Measurement Issues. Mental Retardation, 24,141-142.
77. Landesman-Dwyer, S. (1981). Living in the Community. American Journal
of Mental Deficiency, 86,223-234.
78. Landesman-Dwyer, S., Stein, J.G., & Sackett, G.P. (1978). A Behavioral
and Ecological Study of Group Homes. In: Sackett, G.P. (Ed.). Observing
Behavior, Vol I: Theory and Applications in Mental Retardation, pp 349-377.
University Park Press: Baltimore, USA.
79. Landesman-Dwyer, S., Sackett, G.P., & Kleinman, J.S. (1980).
Relationship of Size to Resident and Staff Behaviour in Small Community
Residences. American Journal of Mental Deficiency, 85,6-17.
80. Lefcourt, H.M. (1991). Locus of Control. In: Robinson, J.P., Shaver, P.R., &
Wrightsman, L.S. (Eds.). Measures of Personality, pp310-325 and Social
Psychological Attitudes,. Academic Press: San Diego, CA, USA.
81. Legault, J.R. (1992). A Study of the Relationship of Community Living
Situation to Independence and Satisfaction in the Lives of Mentally Retarded
Adults. Journal of Intellectual Disability Research, 36,129-141.
345
82. Lewis, S., & Ryan, L. (1986). The Quality of Community and the Quality of
Life. Sociological Spectrum, 6, 397-410.
83. Lincoln, Y.S., & Guba, E.G. (1985). Naturalistic Inquiry. Sage: Beverly Hills,
California, USA.
84. Lippman, L. (1976). Indicators of Societal Concern for Mentally Retarded
Persons. Social Indicators Research, 3,181-215.
85. Longhurst, T.M. (1974). Communication in Retarded Adolescents: Sex and
Intelligence Level. American Journal of Mental Deficiency, 78, 607-618.
86. Look, R.J. (1987). The Quality of Life of Mentally Handicapped People:
Assessment of Life Experiences with a Range of Institutional and Community
Settings. University of Birmingham, Birmingham, UK.
87. Lowe, K., Felce, D., & Orlowska, D. (1993). Evaluating Services for People
with Challenging Behaviour. In: Fleming, I., & Stenfert-Kroese, B. (Eds.).
People with a Learning Disability and Severe Challenging Behaviour. New
Developments in Services and Therapy, 46-67. Manchester University Press:
Manchester, UK.
88. Lui, B. (1976). Quality of Life Indicators in U.S. Metropolitan Areas: A
Statistical Analysis. Praeger: New York, USA.
89. MacFarlane, A.H., Norman, G.R., Streiner, D.L., Roy, R., & Scott, D.J.
(1980). A Longitudinal Study of the Influence of the Psychosocial
Environment on Health Status: A Preliminary Report. Journal of Health and
Social Behavior, 21,124-133.
346
90. MacKenzie, D.M., & Langa, A. (1994). Quality of Life Measurement in
Learning Disability: Basic Issues. British Journal of Developmental
Disabilities,72-78.
91. Malin, N. (1980). Group Homes for Mentally Handicapped Adults. E.R.G.
Report No. 9: University of Sheffield, Sheffield, UK.
92. Mansell, J., & Beasley, F. (1990). Severe Mental Handicap and Problem
Behaviour: Evaluating Transfer fi*om Institutions to Community Care. In:
Fraser, W. (Ed.). Key Issues in Mental Retardation Research, pp57-88.
Routledge: London & New York.
93. Mathieson, S., & Blunden, R. (1980). Nimrod is Piloting a Course. Health
and Social Service Journal, 90,122-124.
94. McConkey, R., Naughton, M., & Nugent, U. (1983). Have We Met?
Community Contacts of Adults who are Mentally Handicapped. Mental
Handicap, 11, 57-59.
95. McKennell, A C., & Andrews, F.M. (1983). Components of Perceived Life
Quality. Journal of Community Psychology, 11,98-110.
96. Milbrath, L.W. (1979). Policy Relevant Quality of Life Research. Armais of
the American Academy of Political and Social Science, 444,33-45.
97. Murrell, S.A., & Norris, F.H. (1983). Quality of Life as the Criterion of
Need Assessment and Community Psychology. Journal of Community
Psychology, 11, 88-97.
98. Nihira, K., Foster, R., Shellhaas, M., & Leland, H. (1974). AAMD
Adaptive Behaviour Scale. American Association on Mental Deficiency,
347
Washington D C., USA.
99. Nihira, K., Leland, H., & Lambert, N. (1993). AAMR Adaptive Behaviour
Scale - Residential and Community; Second Edition (ABS-RC:2). American
Association on Mental Retardation. NFER-Nelson Publishing Company Ltd.,
UK.
100. Nirje, B. (1976). The Normalization Principle. In: Kugel, R.B., & Shearer, A.
(Eds.). Changing Patterns in Residential Services for the Mentally Retarded.
President's Committee on Mental Retardation, ppl45-160. Government
Printing Office: Washington D.C., USA.
101. Novak, A.R., Heal, L.W., Pilewski, M B., & Laidlaw, T. (1980).
Independent Apartment Settings for Developmentally Disabled Adults. An
Empirical Analysis. Paper Presented at the Annual Meeting of the American
Association on Mental Deficiency (May). San Francisco, CA., USA.
102. O’Brien, J., & Lyle, C. (1987). Frameworks for Accomplishment.
Responsive Systems Associates: Lithonia, G.A., USA.
103. O’Brien, J., & Tyne, A. (1981). The Principle of Normalisation in Human
Services. CMH, London.
104. Parmenter, T.R. (1988). An Analysis of the Dimensions of Quality of Life
for People with Physical Disabilities. In: Brown, R.I. (Ed.). Quality of Life for
Handicapped People, pp7-36. Croom Helm: London, UK.
105. Parmenter, T.R. (1992). Quality of Life of People with Developmental
Disabilities. International Review of Research in Mental Retardation, 18,247-
287.
348
106. Perry, J., & Felce, D. (1995). Measure for Measure: How do Measures of
Quality of Life Compare? British Journal of Learning Disabilities, 23, 134-
137.
107. Pidgeon, N. (1996). Grounded Theory: Theoretical Background. In:
Richardson, J.T.E. (Ed.). Handbook of Qualitative Research and Methods for
Psychology and the Social Sciences, pp75-85. BPS Books (The British
Psychological Society), Leicester, UK.
108. Pidgeon, N., & Henwood, K. (1996). Grounded Theory: Practical
Implementation. In: Richardson, J.T.E. (Ed.). Handbook of Qualitative
Research and Methods for Psychology and the Social Sciences, pp86-101.
BPS Books (The British Psychological Society), Leicester, UK.
109. Porterfield, J., Blunden, R., & Blewitt, E. (1980). Improving Environments
for Profoundly Handicapped Adults: Using Prompts and Social Attention to
Maintain High Group Engagement. Behaviour Modification, 4,225.
110. Potter, J., & Wetherell, M. (1987). Discourse and Social Psychology:
Beyond Attitudes and Behaviour. Sage: London, UK.
111. Rapley, M., & Beyer, S. (1996). Daily Activity, Community Participation
and Quality of Life in an Ordinary Housing Network. Journal of Applied
Research in Intellectual Disabilities, 9(1), 31-39.
112. Rapley, M., & Lobley, J. (1995). Factor Analysis of the Schalock and Keith
(1993) Quality of Life Questionnaire: A Replication. Mental Handicap
Research, 8(3), 194-202.
113. Rawlings, D. (1985). Behaviour and Skills of Severely Retarded Adults in
Hospitals and Small Residential Homes. British Journal of Psychiatry, 14,
491-506.
349
114. Reiter, S., & Bendov, D. (1996). The Self Concept and Quality of Life of
Two Groups of Learning Disabled Adults Living at Home and in Group
Homes, The British Journal of Developmental Disabilities, 83, 97-111.
115. Richardson, J.T.E. (1996). Introducing Qualitative Research Methods. In;
Richardson, J.T.E. (Ed.). Handbook of Qualitative Research and Methods for
Psychology and the Social Sciences, pp3-10. BPS Books (The British
Psychological Society), Leicester, UK.
116. Robinson, J.P. (1985). The Validity and Reliability of Diaries versus
Alternative Time Use Measures. In: Juster, F.T., & Stafford, F.P. (Eds.).
Time, Goods and Wellbeing, pp 41-50. Institute for Social Research, 91-103.
Ann Arbor, MI., USA.
117. Rodgers, W.L., & Converse, P.E. (1975). Measures of the Perceived Quality
of Life. Social Indicators Research, 2,127-152.
118. Rosen, J.W., & Buchard, S.N. (1990). Community Activities and Social
Support Networks: A Social Comparison of Adults With and Adults Without
Mental Retardation. Education and Training in Mental Retardation (June),
193-204.
119. Rosen, M., Floor, L., & Zisfein, L. (1974). Investigating the Phenomenon of
Acquiescence in the Mentally Handicapped. 1-Theoretical Model, Test
Development and Normative Data. British Journal of Mental Subnormality,
20, 58-68.
120. Roy, M., Abdalla, M., Smee, €., Fullon, C., Simon, F., Blincoe, €., Hayes,
A., Shaw, D., & Marsh, N. (1994). Evaluation of a Community Facility for
People with Learning Disabilities and Behaviour Disorder (Challenging
Behaviour). British Journal of Learning Disabilities, 22,11-17.
350
121. Schalock, R.L. (1989). Person-Environmental Analysis: Short and Long-
Term Perspectives. In: Kieman, W.E., & and Schalock, R.L. (Eds.).
Economics, Industry and Disability: A Look Ahead, ppl05-110. Brookes:
Baltimore, USA.
122. Schalock, R.L., Harper, R.S., & Carver, G. (1981). Independent Living
Placement: Five Years Later. American Journal of Mental Deficiency, 86,
170-177.
123. Schalock, R.L., & Jenson, C.M. (1986). Assessing the Goodness-of-Fit
Between Persons and their Environment. Journal of the Association for
Persons with Severe Handicaps, 11,103-109.
124. Schalock, R.L., & Keith, K.D. (1993). Quality of Life Questionnaire. IDS
Publishing Corporation: Ohio, USA.
125. Schalock, R.L., Keith, K.D., & Hoffman, K. (1990). 1990 Quality of Life
Questionnaire: Standardization Manual. Mid-Nebraska Mental Retardation
Services: Hastings, NE., USA.
126. Schalock, R.L., Keith, K.D., Hoffman, K., & Karan, O.C. (1989). Quality
of Life: Its Measurement and Use. Mental Retardation, 27(1), 25-31.
127. Schalock, R.L., & Lilley, M.A. (1986). Placement from Community-Based
Mental Retardation Programs: How Well do Clients do After 8-10 Years?
American Journal on Mental Deficiency, 90, 669-679.
128. Sigelman, C.K., Budd, E.C., Spanhel, C.L., & Schoenrock, C.J. (1981).
When in Doubt, Say Yes: Acquiescence in Interviews with Mentally Retarded
Persons. Mental Retardation, April, 53-58.
351
129. Sigelman, C.K., Budd, E.C., Winer, J.L., Schoenrock, C.J., & Martin,
P.W. (1982). Evaluating Alternative Techniques of Questioning Mentally
Retarded Persons. American Journal of Mental Deficiency, 86(5), 511-518.
130. Sigelman, C.K., Schoenrock, C.J., Spanhel, C.L., Hromas, S.G., Winer,
J.L., Budd, E.C., & Martin, P.W. (1980). Surveying Mentally Retarded
Persons: Responsiveness and Response Validity in Three Samples. American
Journal of Mental Deficiency, 84,479-486.
131. Sigelman, C.K., & Werder, P.R. (1975). The Communication Skills of the
Mentally Retarded: A New Analysis. Journal of Developmental Disabilities, 1,
16-19.
132. Stanley, B., & Roy, A. (1988). Evaluating the Quality of Life of People with
Mental Handicaps: A Social Validation Study. Mental Handicap Research,
1(2), 197-210.
133. Strauss, A.L., & Corbin, J. (1990). Basics of Qualitative Research: Grounded
Theory Procedures and Techniques. Sage: Newbury Park, California, USA.
134. Sudman, S., & Bradburn, N.M. (1974). Response Effects in Surveys: A
Review and Synthesis. Aldine: Chicago, USA.
135. Szivos, S.E. (1990). Attitudes to Work and their Relationship to Self-Esteem
and Aspirations among Young Adults with a Mild Mental Handicap. The
British Journal of Mental Subnormality, 71 (2), 108-117.
136. Taylor, S.J., & Bogdan, R. (1981). A Qualitative Approach to the Study of
Community Adjustment. In: Bruininks, R.H., Meyers, C.E., Sigford, B.B., &
Lakin, K.C. (Eds.). Deinstitutionalization and Community Adjustment of
Mentally Retarded People. Monograph 4, pp 100-113. American Association
on Mental Deficiency: Washington D.C., USA.
352
137. Taylor, S.J., & Bogdan, R. (1990). Quality of Life and the Individual's
Perspective. In: Schalock, R.L. (Ed.). Quality of Life: Perspectives and
Issues, pp27-40. American Association on Mental Retardation: Washington,
D.C.,USA.
138. Toren, C. (1996). Ethnography: Theoretical Background. In: Richardson,
J.T.E. (Ed.). Handbook of Qualitative Research and Methods for Psychology
and the Social Sciences, ppl02-112. BPS Books (The British Psychological
Society), Leicester, UK.
139. Weber, R.P. (1990). Basic Content Analysis, Second Edition. Sage: Newbury
Park, California, USA.
140. Wechsler, D. (1981). Wechsler Adult Intelligence Scale - Revised Edition.
Manual. Psychological Corporation, New York, USA.
141. Wolfensberger, W. (1972). The Principle of Normalization in Human
Services. Toronto: National Institute on Mental Retardation.
142. Wolfensberger, W., & Glenn, L. (1978). PASS 3 Handbook (Third Edition).
Toronto: National Institute on Mental Retardation, UK.
143. Woolgar, S. (1996). Psychology, Qualitative Methods and the Ideas of
Science. In: Richardson, J.T.E. (Ed.). Handbook of Qualitative Research
Methods for Psychology and the Social Sciences, pp 11-24. BPS Books (The
British Psychological Society), Leicester, UK.
144. World Health Organization (1948). Constitution in Basic Documents. World
Health Organization, Geneva,.
353
145. Wyngaarden, M. (1981). Interviewing Mentally Retarded Persons. Issues
and Strategies. In; Bruininks, R.H., Meyers, C.E., Sigford, E.B., Lakin, K.C.
(Eds.). Deinstitutionalization and Community Adjustment of Mentally
Retarded People. Monograph 4, ppl 14-127. American Association on Mental
Deficiency: Washington DC., USA.
146. Zapf, W. (1987). German Social Report-Living Conditions and Subjective
Well-being, 1978-1984. Social Indicators Research, 19,25-38.
147. Zautra, A.J. (1983). Social Resources and the Quality of Life. American
Journal of Community Psychology, 11,275-290.
148. Zautra, A., & Goodhart, D. (1979). Quality of Life Indicators: A Review of
the Literature. Community Mental Health Review, 4,1-10.
149. Zautra, A.J., & Reich, J.W. (1983). Life Events and Perceptions of Life
Quality: Developments in a Two Factor Approach. Journal of Community
Psychology, 11,121-132.

354
APPENDICES
355
APPENDIX ONE
CONSENT PROCEDURE
INFORMATION SENT TO PARTICIPANTS,FAMILIES, CARERS AND
OTHER INVOLVED PROFESSIONALS
356
CONSENT PROCEDURE
AU clients meeting the criteria for inclusion in the study were sent a brief letter of
information about the study. The families or other carers were also circulated more
detailed information at this stage. The carers and family members were given 10
working days to contact the researcher to inform her of their wish for the participant
not to be contacted about the study. Although, strictly speaking, consent may only be
given by the individual adult participant concerned, it is generally considered good
practice to exclude participants with a learning disability whose family or carers
remain opposed to inclusion. This technique may carry with it separate sampling
biases, however, the practical and ethical problems involved in including a participant
whose family or carers remain opposed to involvement are prohibitive. If this
situation arose, it would be appropriate for the researcher to explain more fully to the
family or carers, the reasons for the study and the participant's wish to be involved. In
fact, no relatives or carers expressed unwillingness for the participants to be involved
in the study.
All families and carers were encouraged to contact the researcher to discuss the study
further and were told that they would obtain feedback on the results of the research
following completion. After 10 working days, the participants were contacted and an
appointment was made by the researcher to see them individually to discuss the
project in more detail. The purpose of the study was explained fully and the
confidentiality of each session was stressed. A standardised consent form was then
signed by the researcher and the client in the presence of an independent witness, who
also signed the form. The independent witness was not connected with the study in
any way and was usually a member of the residential or day care staff team, or other
professional involved in the participant's care. At this point it was highlighted that the
participant could withdraw from the research at any stage. This was also regularly
repeated throughout subsequent interviews with the participant. As interviews with
the participants were audiotaped, verbal recorded consent was also obtained, although
this was not considered sufficient to fulfil the consent requirements of the study.

357
Clients were reassured that they would not be identified to anyone else and that the
audiotapes would be destroyed once the research had been completed.
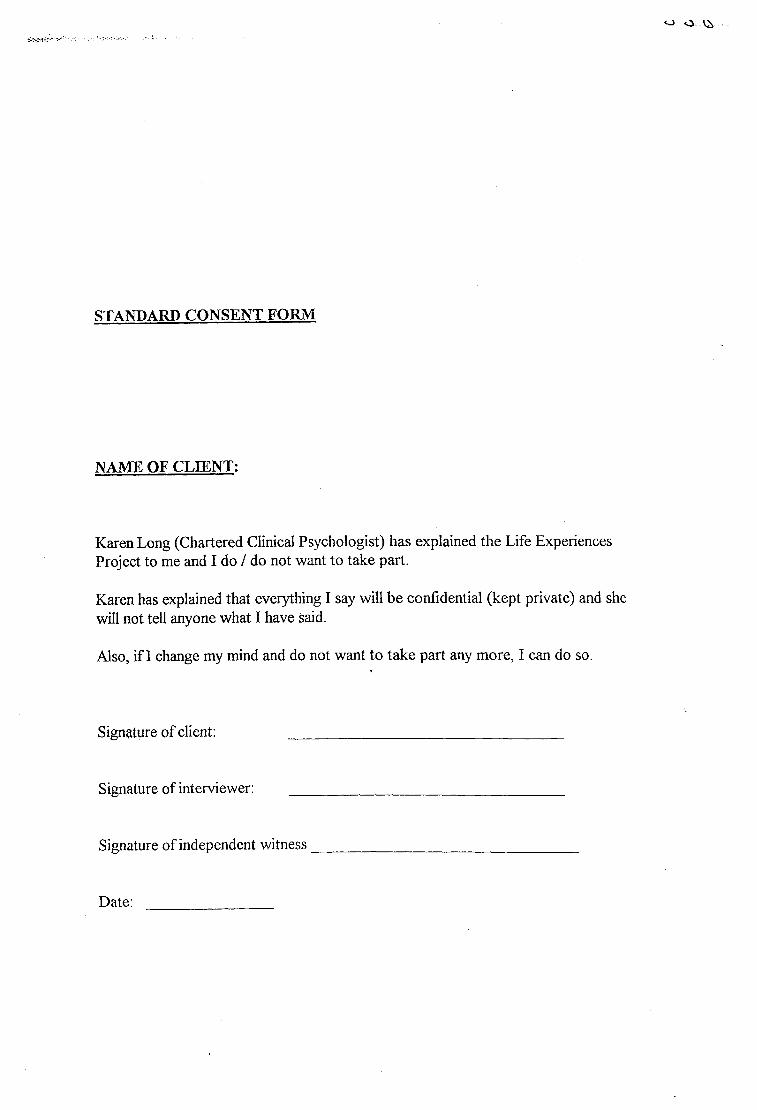
o c
STANDARD CONSENT FORM
NAME OF CLIENT:
Karen Long (Chartered Clinical Psychologist) has explained the Life Experiences Project to me and I do / do not want to take part.
Karen has explained that everything I say will be confidential (kept private) and she will not tell anyone what I have said.
Also, if I change my mind and do not want to take part any more, I can do so.
Signature of client;
Signature of interviewer:
Signature of independent witness
Date:
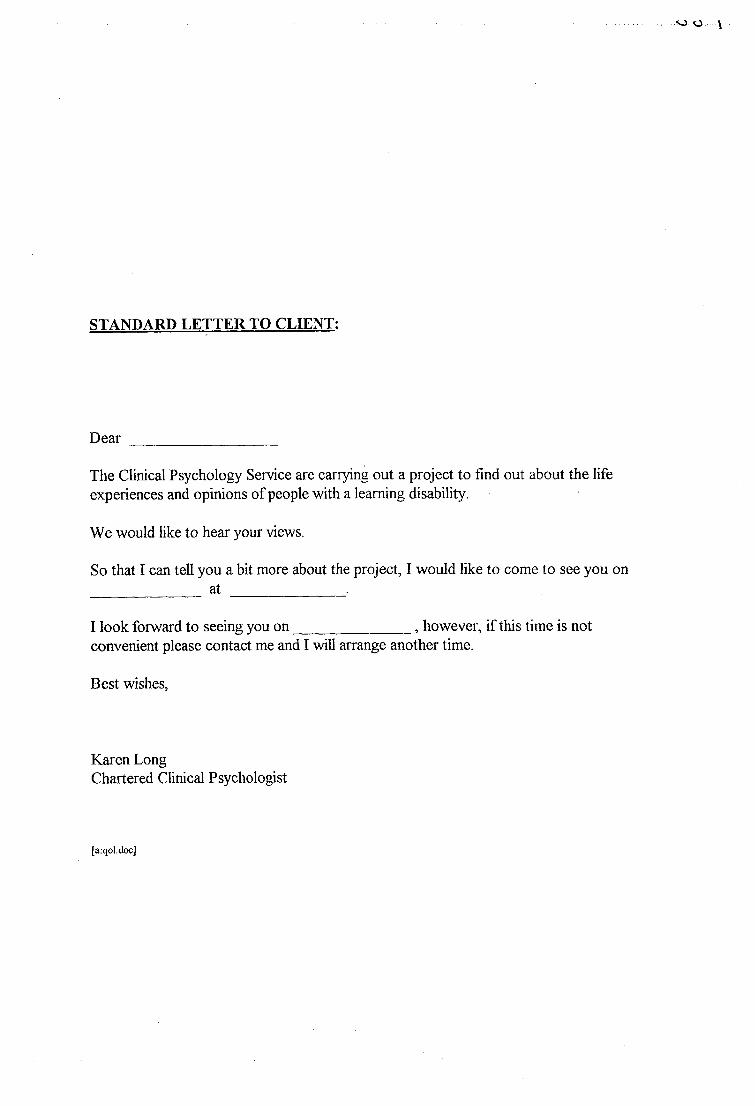
so o \
STANDARD LETTER TO CLIENT:
Dear
The Clinical Psychology Service are carrying out a project to find out about the life experiences and opinions of people with a learning disability.
We would like to hear your views.
So that I can tell you a bit more about the project, I would like to come to see you on _____________ at ______________ .
I look forward to seeing you on______________ , however, if this time is notconvenient please contact me and I will arrange another time.
Best wishes,
Karen LongChartered Clinical Psychologist
[a.qoI.doc]
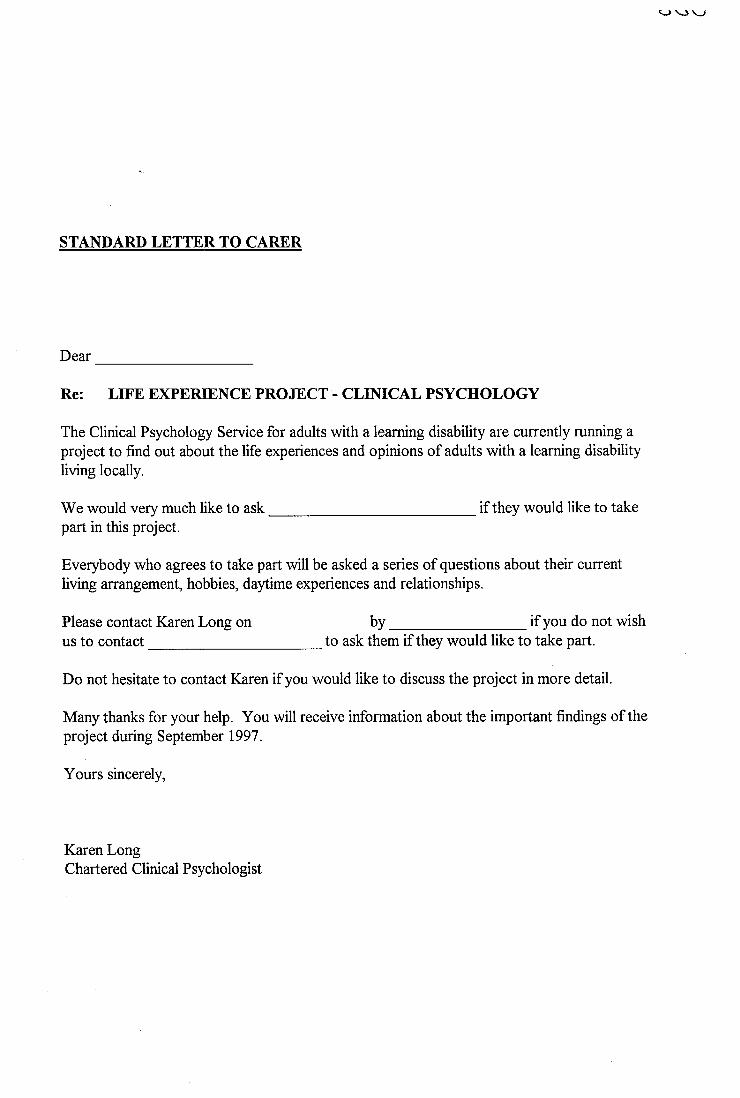
xo VJI
STANDARD LETTER TO CARER
Dear
Re: LIFE EXPERIENCE PROJECT - CLINICAL PSYCHOLOGY
The Clinical Psychology Service for adults with a learning disability are currently running a project to find out about the life experiences and opinions of adults with a learning disability living locally.
We would very much like to ask ______________________ if they would like to takepart in this project.
Everybody who agrees to take part will be asked a series of questions about their current living arrangement, hobbies, daytime experiences and relationships.
Please contact Karen Long on by_________________ if you do not wishus to contact______________________to ask them if they would like to take part.
Do not hesitate to contact Karen if you would like to discuss the project in more detail.
Many thanks for your help. You will receive information about the important findings of the project during September 1997.
Yours sincerely.
Karen LongChartered Clinical Psychologist
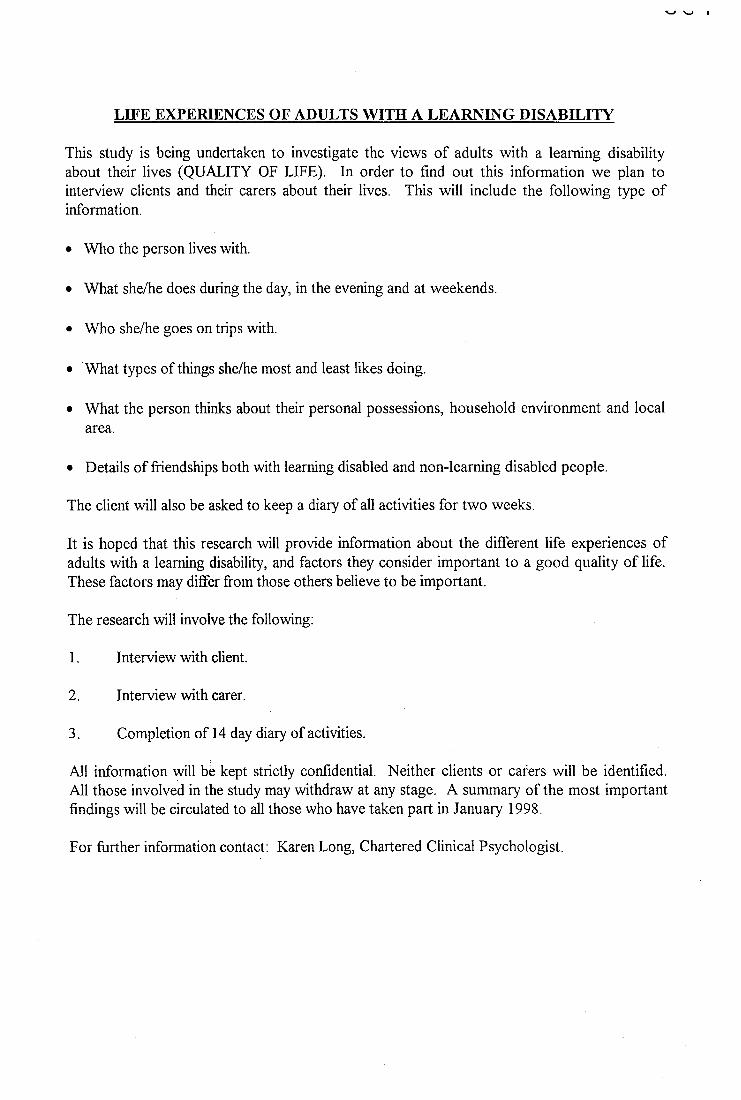
LIFE EXPERIENCES OF ADULTS WITH A LEARNING DISABILITY
This study is being undertaken to investigate the views of adults with a learning disability about their lives (QUALITY OF LIFE). In order to find out this information we plan to interview clients and their carers about their lives. This will include the following type of information.
• Who the person lives with.
• What she/he does during the day, in the evening and at weekends.
• Who she/he goes on trips with.
• What types of things she/he most and least likes doing.
• What the person thinks about their personal possessions, household environment and localarea.
• Details of fiiendships both with learning disabled and non-learning disabled people.
The client will also be asked to keep a diary of all activities for two weeks.
It is hoped that this research will provide information about the different life experiences of adults with a learning disability, and factors they consider important to a good quality of life. These factors may differ from those others believe to be important.
The research will involve the following;
1. Interview with client.
2. Interview with carer.
3. Completion of 14 day diary of activities.
All information will be kept strictly confidential. Neither clients or carers will be identified. All those involved in the study may withdraw at any stage. A summary of the most important findings will be circulated to all those who have taken part in January 1998.
For fiarther information contact; Karen Long, Chartered Clinical Psychologist.
362
APPENDIX TWO
HEALTH AUTHORITY ETHICS COMMITTEE CONSENT LETTER
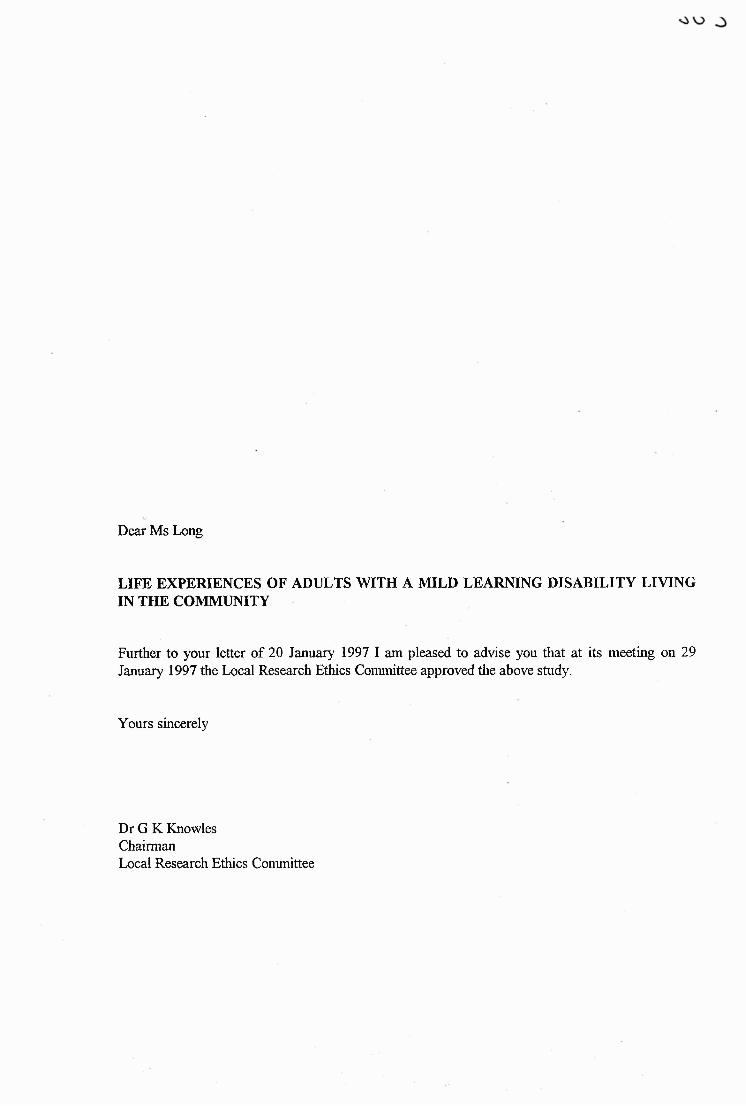
Dear Ms Long
LIFE EXPERIENCES OF ADULTS WITH A MILD LEARNING DISABILITY LIVING IN THE COMMUNITY
Further to your letter of 20 January 1997 I am pleased to advise you that at its meeting on 29 January 1997 the Local Research Ethics Committee approved the above study.
Yours sincerely
Dr G K Knowles ChairmanLocal Research Ethics Committee

364
APPENDIX THREE
PARTICIPANT CHARACTERISTICS
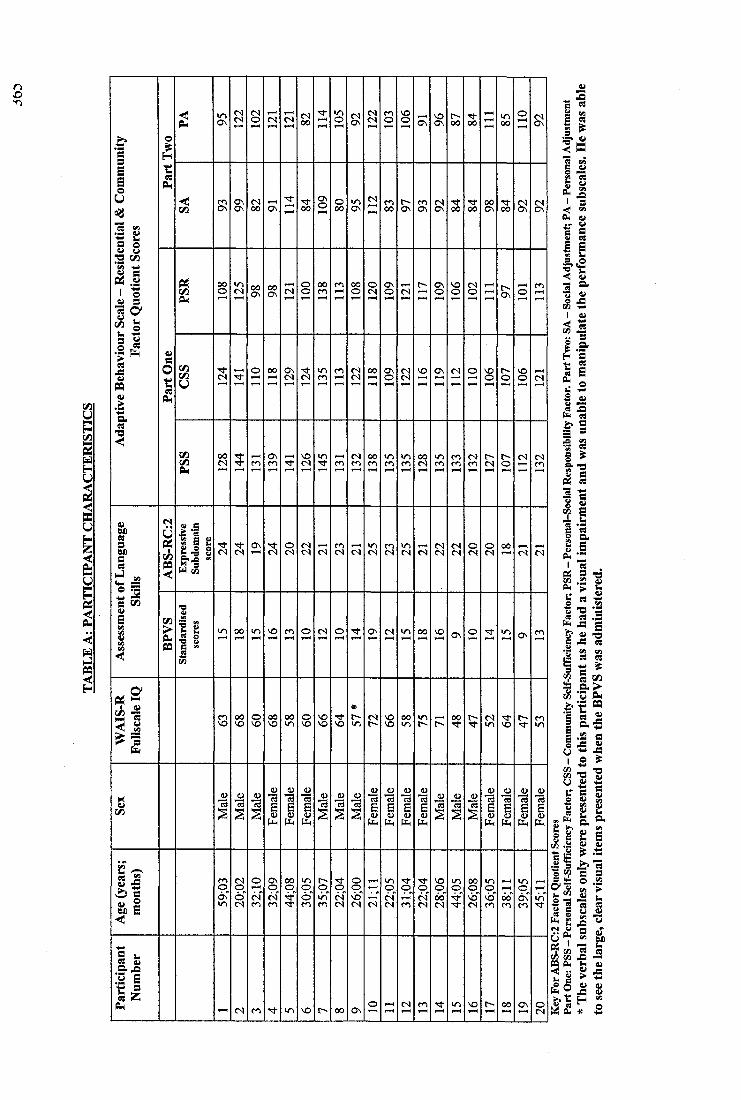
no
Ii<
I
i
j
ilI Ii l% k
1 1 I
I
Ii*s jS
i l
II§ k
ÎII&4
IIl i
( S
ON
( S
CS
<S
C<l
ON
N
C'J
( S
04
ON
04
ON
NO
04
NO
04
04
ON
04
04
II
!1@4 44
II1 Î
II
i «*
HIts
liIIf4 «
k I
i l
II
If% % c ^fiil
II!Jtlliit> Ie s
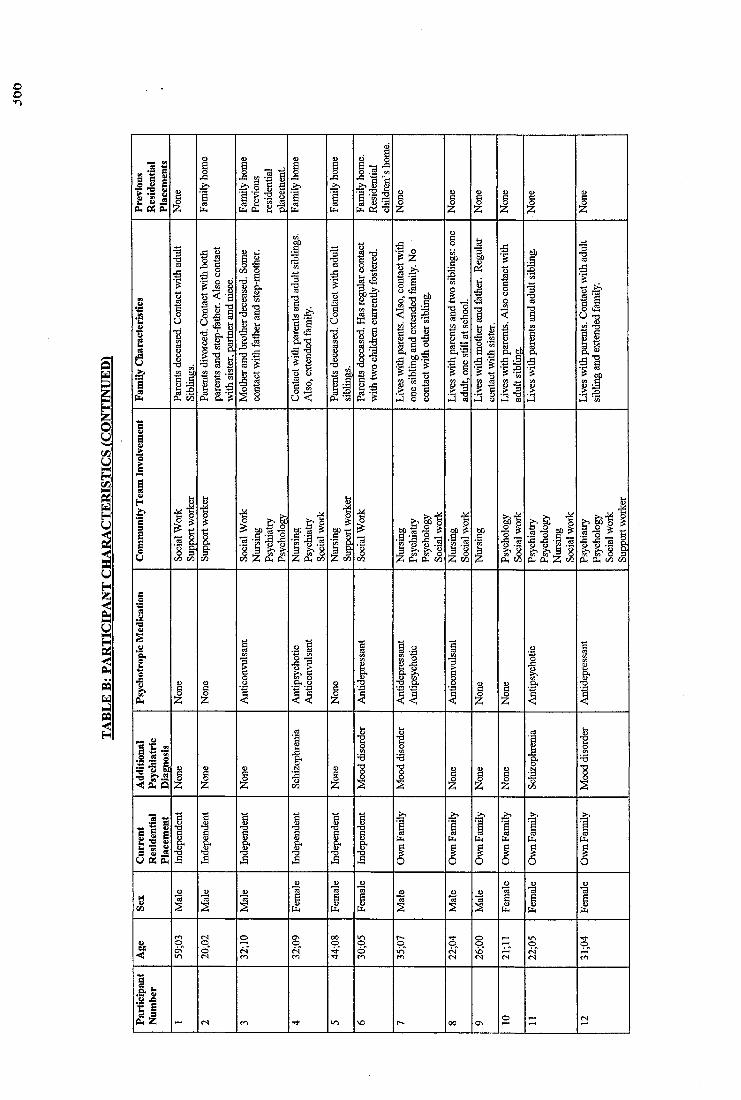
oo■n
fiJ till
l l
<• "a
l i
I I
III III
Î
iiII II
IIK S 1 1
liil
hJ r|*8 «2 .
^ 1 1
I IÎÎ5'"rS g
1-4 03
liII
a, bpis i
H
iiII? ep
II
ii III 1 1 1 III; Ii 11 llli (S'(S'ii
"II
I I &
IIIIL
fc
ii
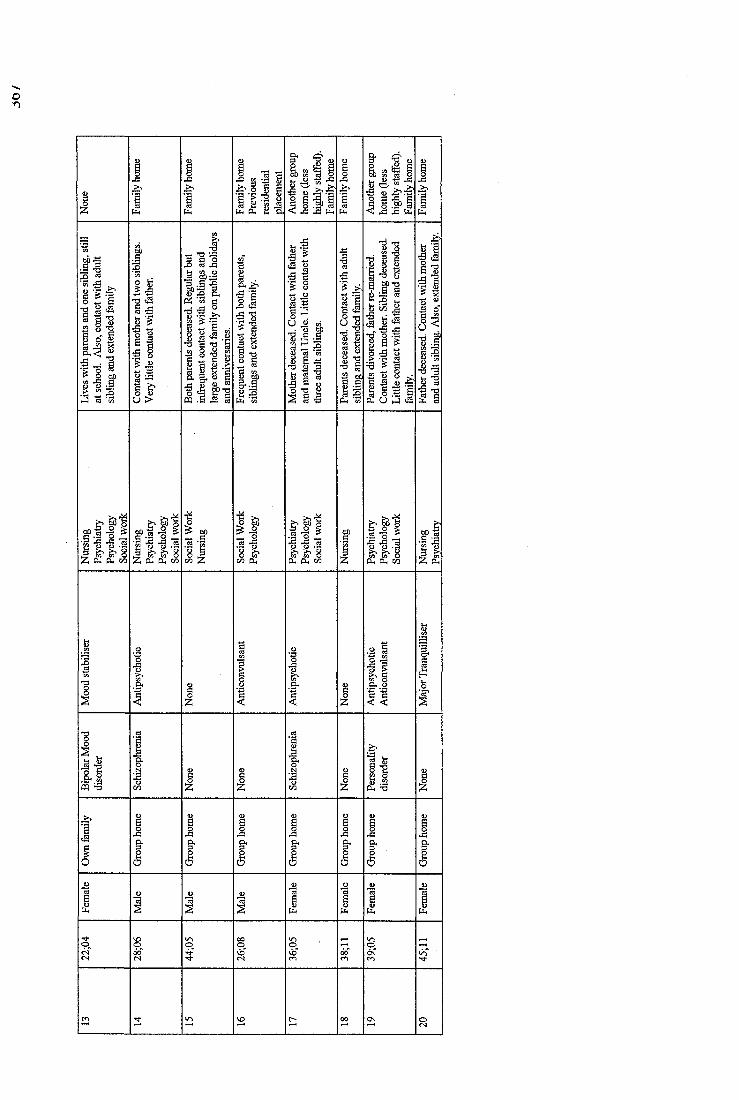
fil Sîf I IIIf I
ill111
cs
!1S «50:3
a 8-3
I!g "8
II
n .
Il f-§ #3
g
i |ÏÎ% -g
I I
^ -g
II!I IIII(2 u 3 a
fill fill L11 Î ! Ill P S' 5Oh Ph 00
| l% Ph
■8
r2 -g• a
p4
1l l
P h 73

368
APPENDIX FOUR
THE LIFE EXPERIENCES CHECKLIST ITEM CONTENT

MATERIAL REDACTED AT REQUEST OF UNIVERSITY
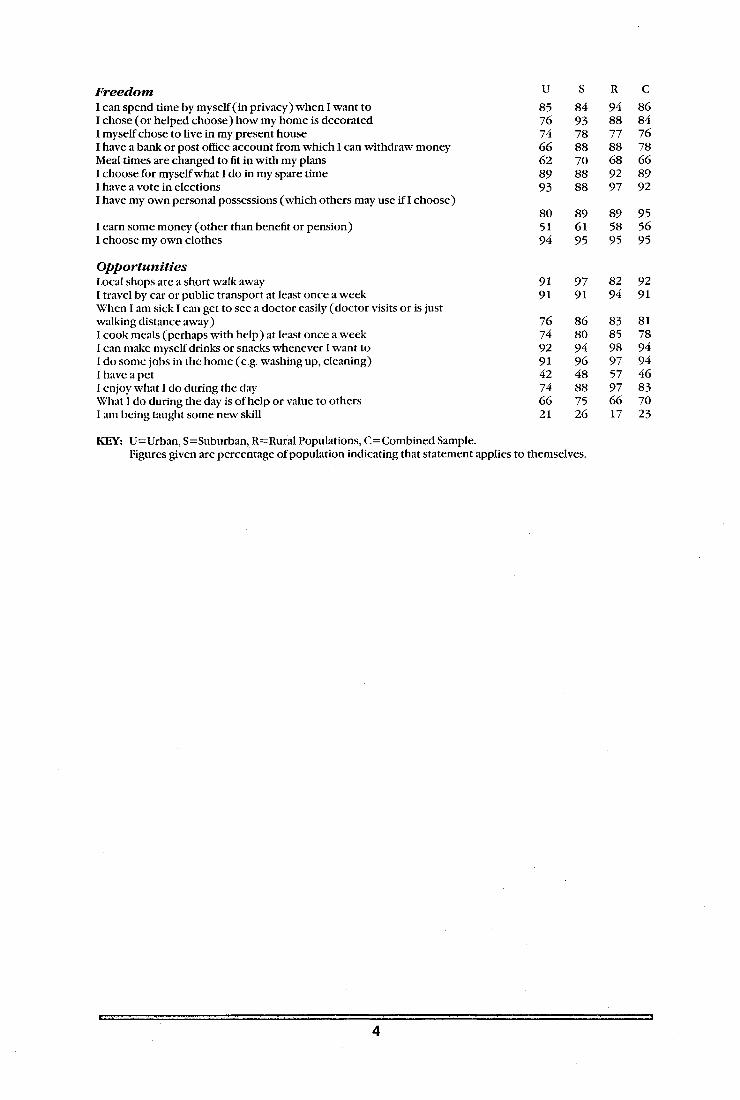
F reed o mI can spend time by myself (in privacy) when I want to I chose (or helped choose) how my home is decorated I myself chose to live in my present houseI have a bank or post office account from which 1 can withdraw money Meal times are changed to fit in with my plans I choose for myself what I do in my spare time I have a vote in electionsI have my own personal possessions (which others may use if I choose)
1 earn some money (other than benefit or pension)1 choose my own clothes
O p p o r tu n itie sLocal shops are a short walk away I travel by car or public transport at least once a week When I am sick I can get to see a doctor easily (doctor visits or is just walking distance away)I cook meals (perhaps with help) at least once a week 1 can make myself drinks or snacks whenever I want to 1 do some jobs in the home (e.g. washing up, cleaning)1 have a pet1 enjoy what I do during the day Wiiat 1 do during the day is of help or value to others 1 am being taught some new skill
KEY: U=Urban, S=Suburban, R=Rural Populations, C=Combined Sample.Figures given are percentage of population indicating that statement applies to themselves.
u S R C85 84 94 8676 93 88 8474 78 77 7666 88 88 7862 70 68 6689 88 92 8993 88 97 92
80 89 89 9551 61 58 5694 95 95 95
91 97 82 9291 91 94 91
76 86 83 8174 80 85 7892 94 98 9491 96 97 9442 48 57 4674 88 97 8366 75 66 7021 26 17 23

371
APPENDIX FIVE
DAILY DIARY SHEET
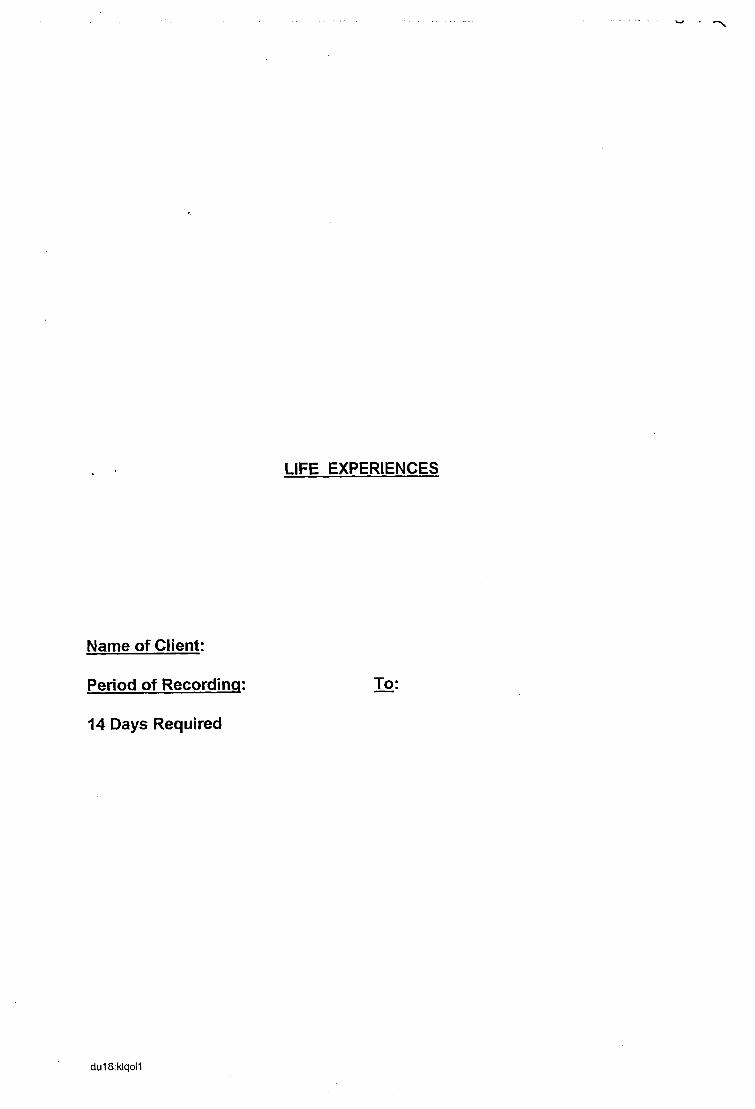
LIFE EXPERIENCES
Name of Client:
Period of Recording: To:
14 Days Required
du18;klqol1
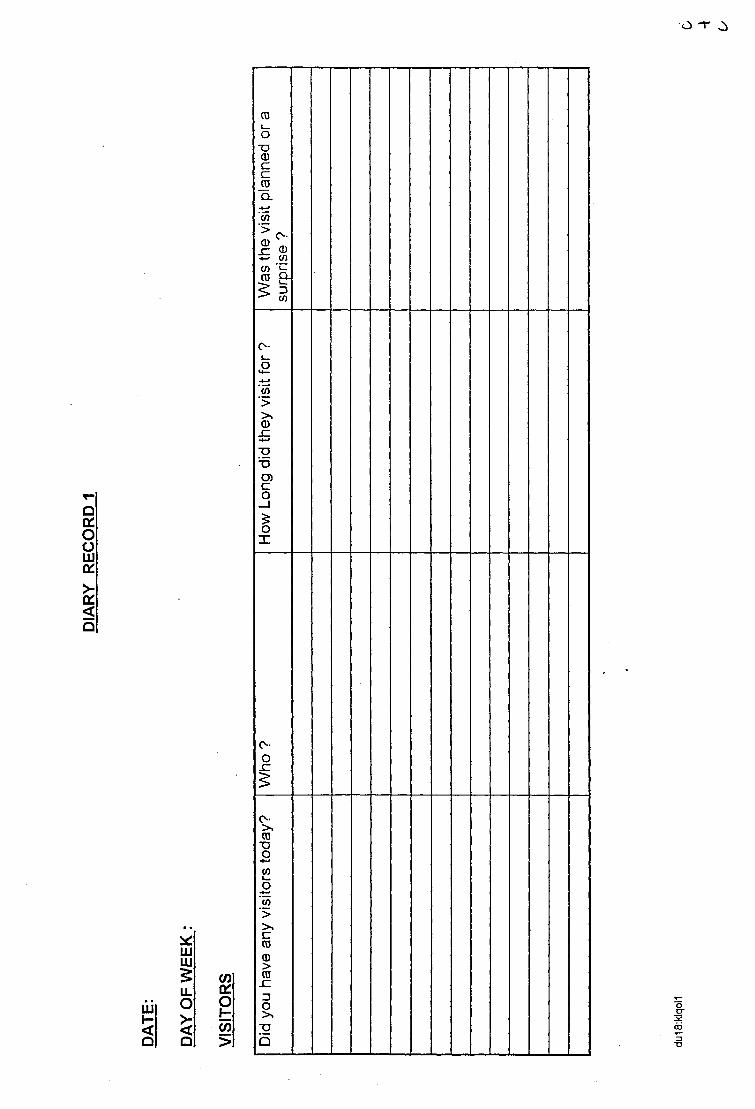
o -r
QOHOOUJa:
<a
L JÜ
<O
inmgu.0
1Oh-(g>
(DOTJ(DCcjroCL
w>0
o-o
I>
g-£■g■DD)c0
1X
c -
Tf5(25w
■ >>\£1COQ)>CDH3§.■gb
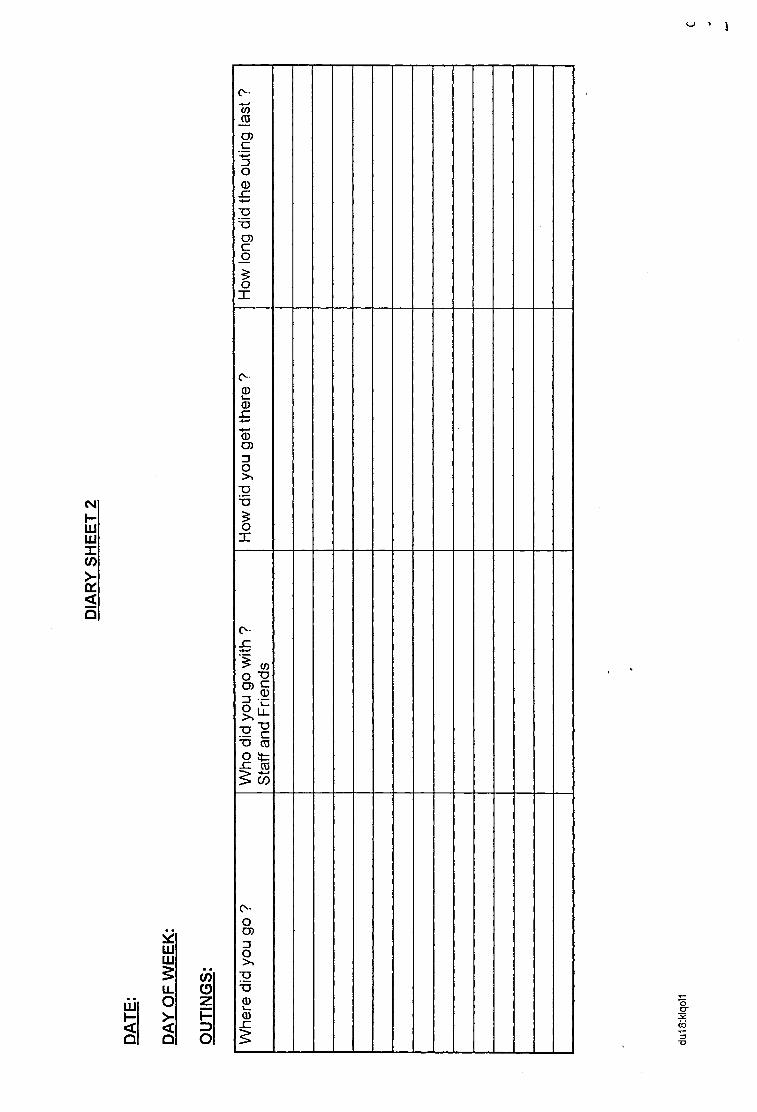
CMh -LULU
S
<Q
coO)c3o0S•gyO)c0
1X
0O)30•gy1X
o-
II■D C 0
■gy
I I
LULUgLi.
LU O1 - > -< <Û Q
(OozH3o
c-oD)3
■gy20JC

375
APPENDIX SIX
SEMI-STRUCTURED INTERVIEW FORMAT
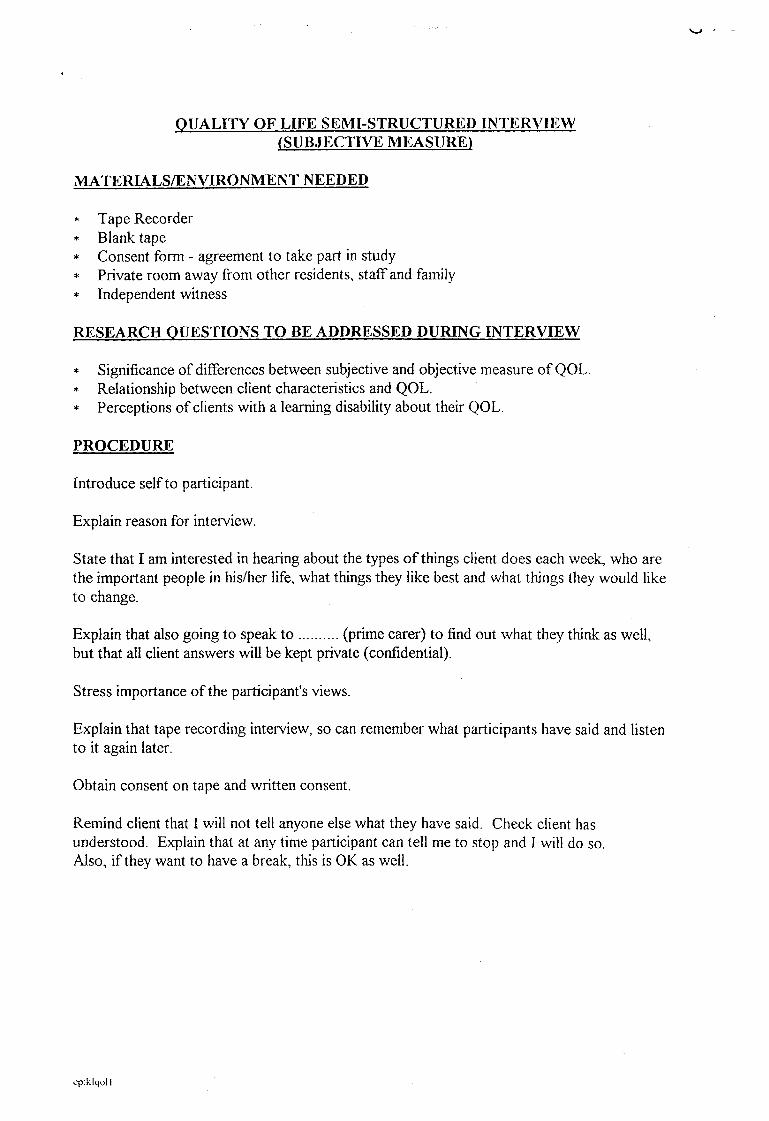
QUALITY OF LIFE SEMI-STRUCTURED INTERVIEW (SUBJECTIVE MEASURE)
MATERIALS/ENVIRONMENT NEEDED
* Tape Recorder* Blank tape* Consent form - agreement to take part in study* Private room away from other residents, staff and family* Independent witness
RESEARCH QUESTIONS TO BE ADDRESSED DURING INTERVIEW
* Significance of differences between subjective and objective measure o f QOL.* Relationship between client characteristics and QOL.* Perceptions of clients with a learning disability about their QOL.
PROCEDURE
Introduce self to participant.
Explain reason for interview.
State that I am interested in hearing about the types o f things client does each week, who are the important people in his/her life, what things they like best and what things they would like to change.
Explain that also going to speak t o (prime carer) to find out what they think as well,but that all client answers will be kept private (confidential).
Stress importance of the participant’s views.
Explain that tape recording interview, so can remember what participants have said and listen to it again later.
Obtain consent on tape and written consent.
Remind client that I will not tell anyone else what they have said. Check client has understood. Explain that at any time participant can tell me to stop and I will do so.Also, if they want to have a break, this is OK as well.
cpiklqoi 1
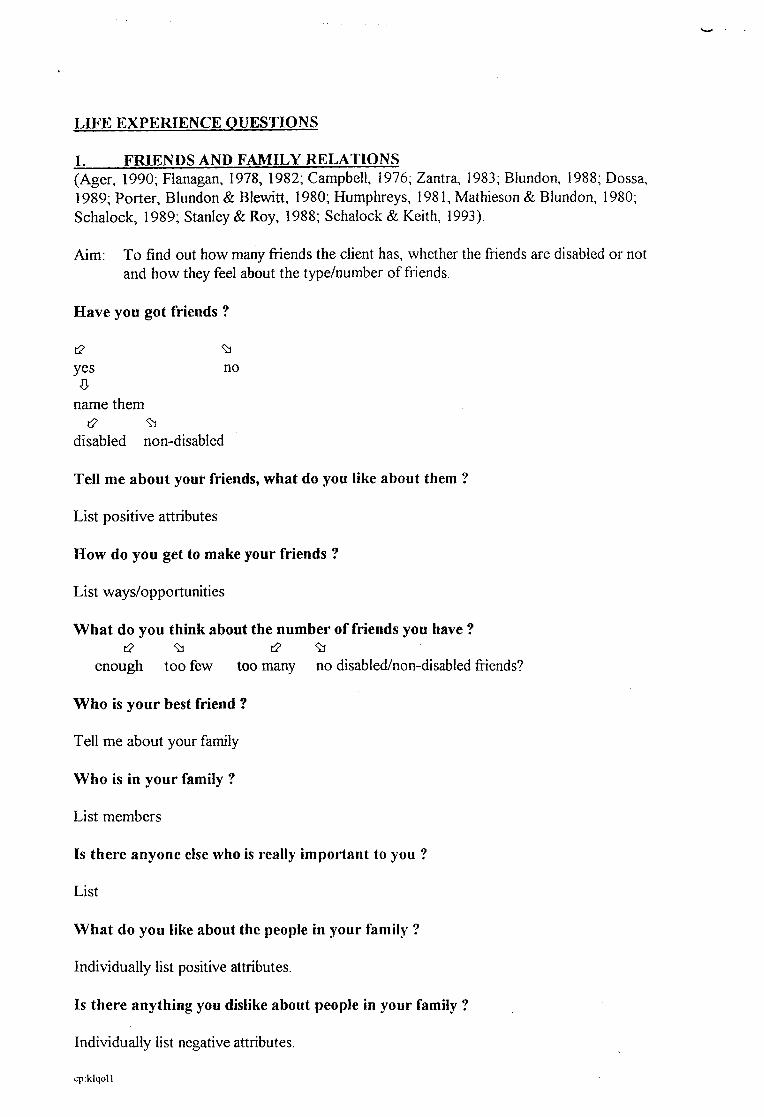
LIFE EXPERIENCE QUESTIONS
1. FRIENDS AND FAMILY RELATIONS(Ager, 1990; Flanagan, 1978, 1982; Campbell, 1976; Zantra, 1983; Blundon, 1988; Dossa, 1989; Porter, Blundon & Blewitt, 1980; Humphreys, 1981, Mathieson & Blundon, 1980; Schalock, 1989; Stanley & Roy, 1988; Schalock & Keith, 1993).
Aim: To find out how many friends the client has, whether the friends are disabled or notand how they feel about the type/number of friends.
Have you got friends ?
yes no0
name them
disabled non-disabled
Tell me about your friends, what do you like about them ?
List positive attributes
How do you get to make your friends ?
List ways/opportunities
What do you think about the number of friends you have ?
enough too few too many no disabled/non-disabled friends?
Who is your best friend ?
Tell me about your family
Who is in your family ?
List members
Is there anyone else who is really important to you ?
List
What do you like about the people in your family ?
Individually list positive attributes.
Is there anything you dislike about people in your family ?
Individually list negative attributes.
cp:klqo11
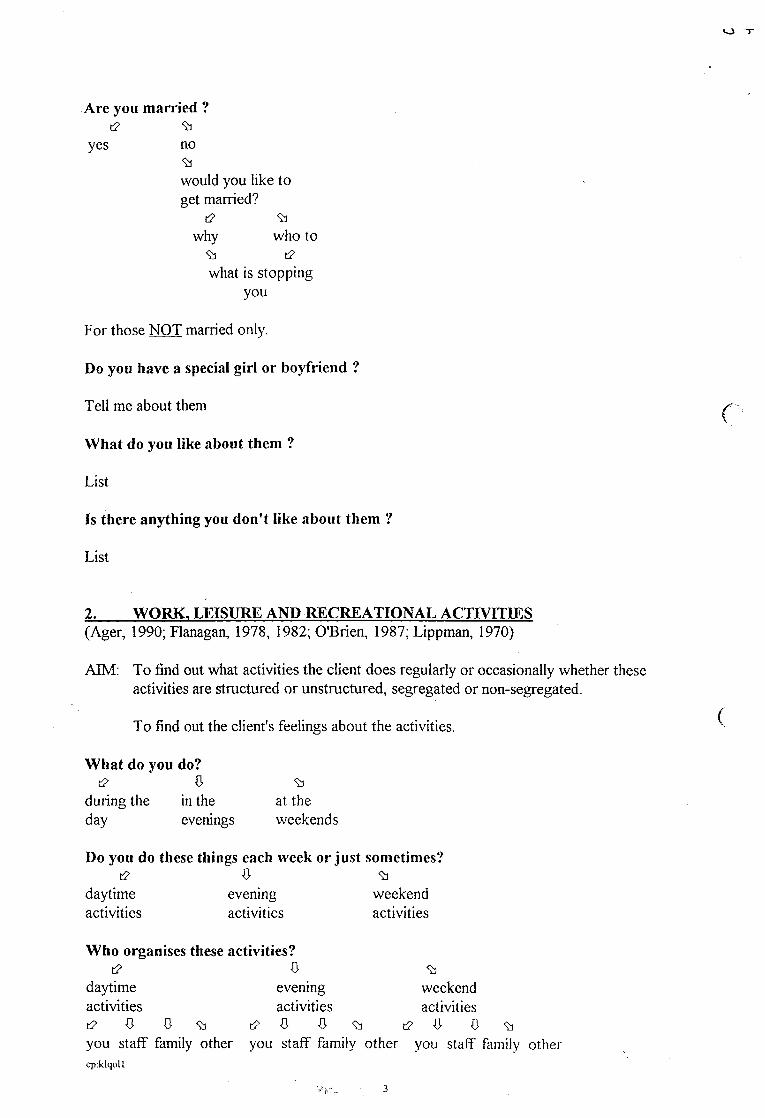
*o
Are you married ?
yes no
would you like to get married?
why who to
what is stopping you
For those NOT married only.
Do you have a special girl or boyfriend ?
Tell me about them ^
What do you like about them ?
List
Is there anything you don’t like about them ?
List
2. WORK, LEISURE AND RECREATIONAL ACTIVITIES(Ager, 1990; Flanagan, 1978, 1982; O'Brien, 1987; Lippman, 1970)
AIM: To find out what activities the client does regularly or occasionally whether these activities are structured or unstructured, segregated or non-segregated.
To find out the client's feelings about the activities.
What do you do?d? O' 8:]
during the in the at theday evenings weekends
Do you do these things each week or just sometimes?0
daytime evening weekendactivities activities activities
Who organises these activities?0
daytime evening weekendactivities activities activities[ 2 0 0 ^you staff family other you staff family other you staff family othercp:klqoU
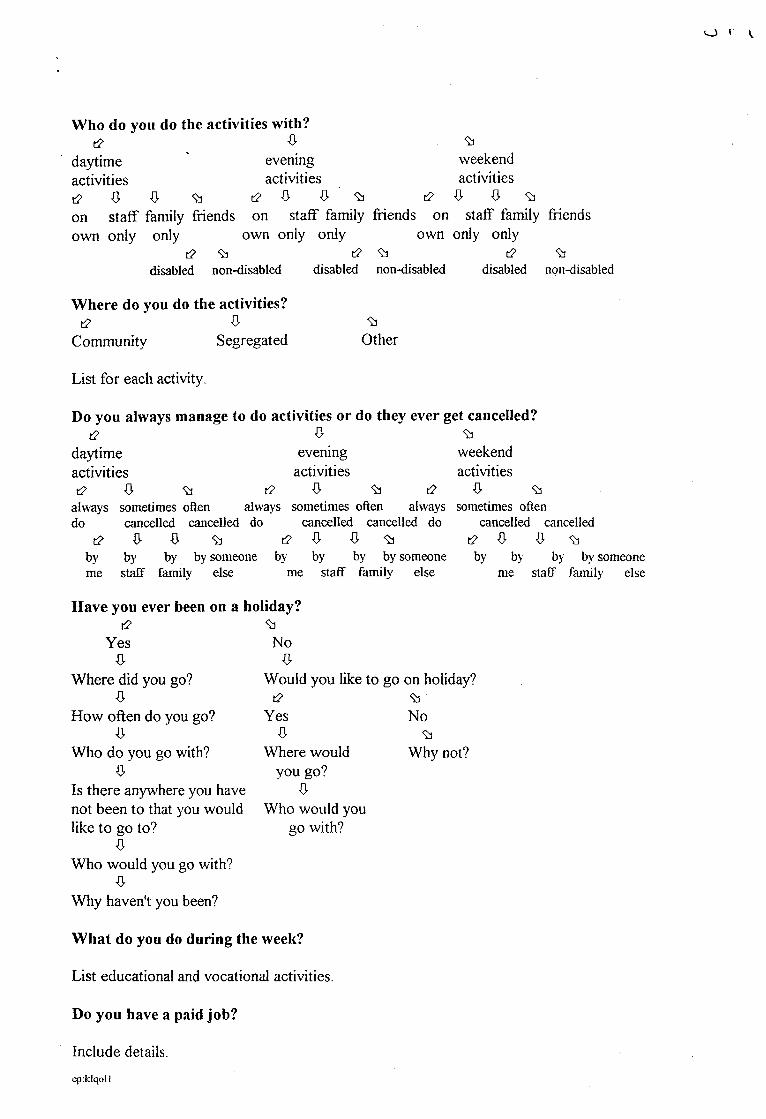
o r
0evening
Who do you do the activities with?
daytime activities
0 0 on staff family friends own only only
93
93weekend activities
93 0 0 93on staff family friends on staff family friends
own only only own only onlyt:? 93 c2 93
activities [2 0 0
disabled non-disabled disabled non-disabled disabled non-disabled
Where do you do the activities?0 93
Community Segregated Other
List for each activity.
Do you always manage to do activities or do they ever get cancelled?(2 0
daytime eveningactivities activities[2 0 93 t2 0 c2
always sometimes often always sometimes often always do cancelled cancelled do cancelled cancelled do
[ 2 0 0 9 3 [ 2 0 0 9 3by by by by someone by by by by someone me staff family else me staff family else
93weekend activities
0 93sometimes often
cancelled cancelled [2 0 0 93by by by by someone
me staff family else
Have you ever been on a holiday?(2
Yes 0
Where did you go?0
How often do you go?0
Who do you go with?0
Is there anywhere you have not been to that you would like to go to?
Who would you go with?
Why haven't you been?
93No
Would you like to go on holiday?[2 93
Yes Noft 93
Where would Why not?you go?
Who would you go with?
What do you do during the week?
List educational and vocational activities.
Do you have a paid job?
Include details.q ) ; k l q o l l
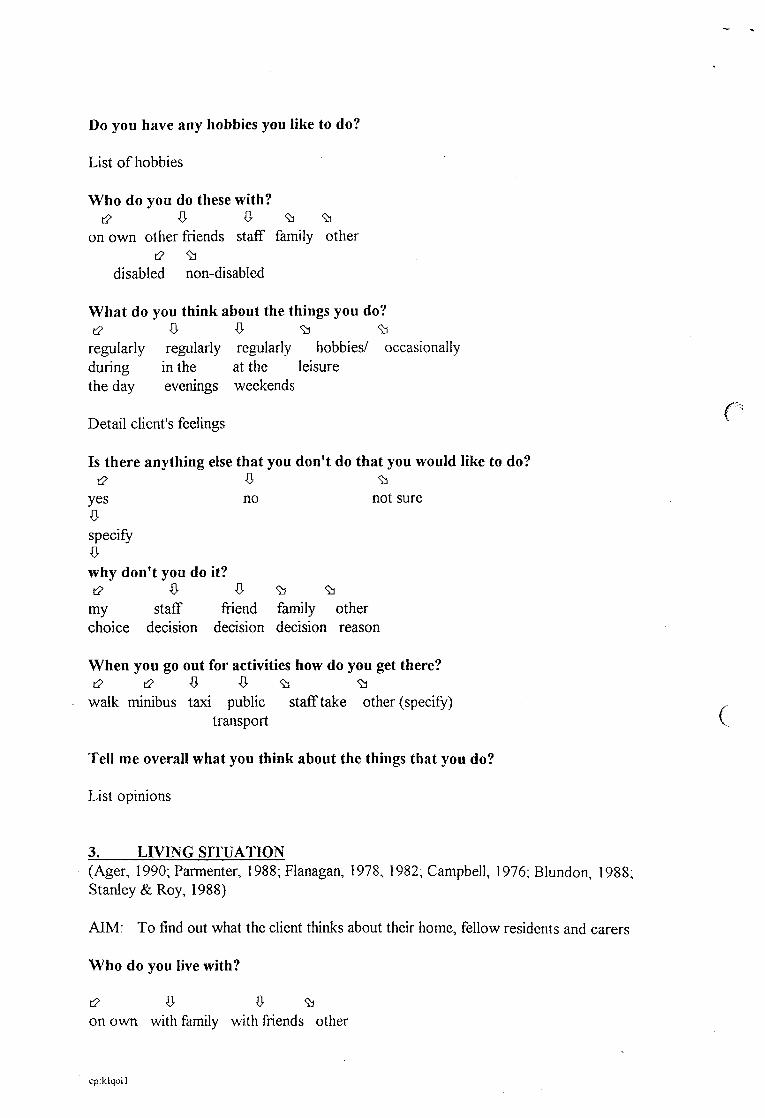
Do you have any hobbies you like to do?
List o f hobbies
Who do you do these with?t2 0 93 93
on own other friends staff family other
disabled non-disabled
What do you think about the things you do?[2 93 93
regularly regularly regularly hobbies/ occasionally during in the at the leisurethe day evenings weekends
fDetail client's feelings
Is there anything else that you don’t do that you would like to do?[2 93
yes no not sure
specify
why don’t you do it?[2 fr 93 93
my staff friend family otherchoice decision decision decision reason
When you go out for activities how do you get there? t2 i2 93 93
walk minibus taxi public staff take other (specify) ,transport V
Tell me overall what you think about the things that you do?
List opinions
3. LIVING SITUATION(Ager, 1990; Parmenter, 1988; Flanagan, 1978, 1982; Campbell, 1976; Blundon, 1988; Stanley & Roy, 1988)
AIM: To find out what the client thinks about their home, fellow residents and carers
Who do you live with?
t2 fr fr 93on own with family with friends other
cp.klqoll
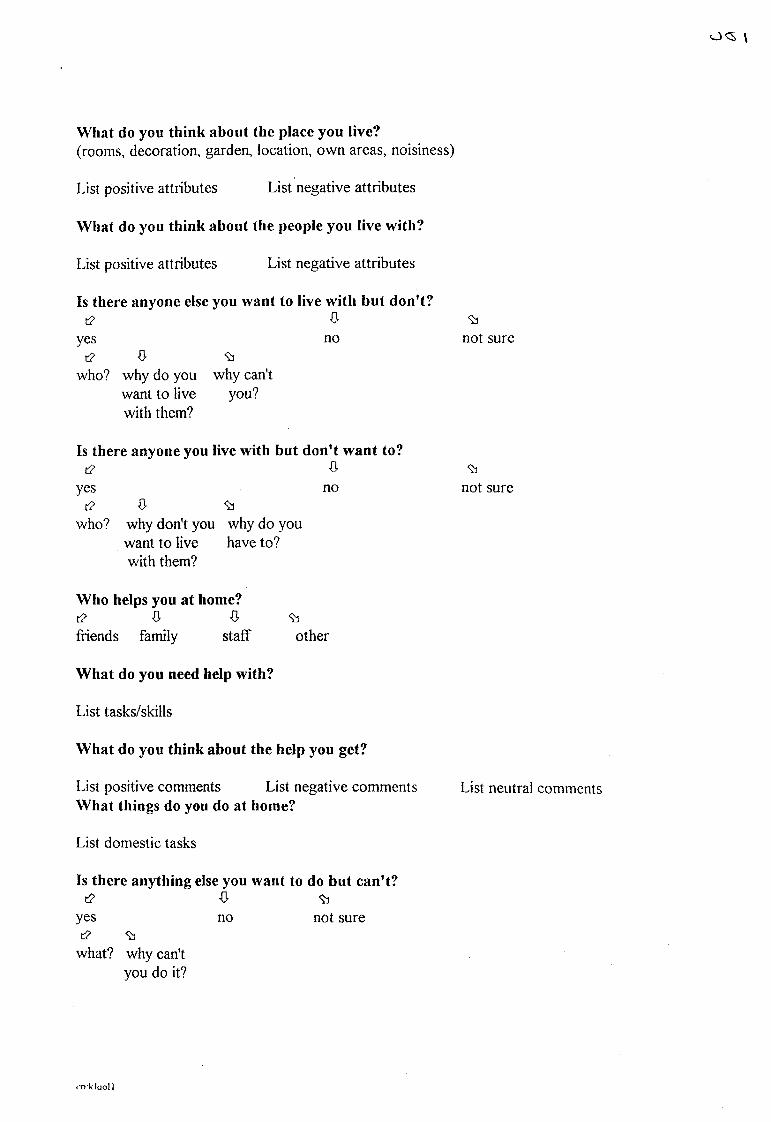
C Q \
What do you think about the place you live?(rooms, decoration, garden, location, own areas, noisiness)
List positive attributes List negative attributes
What do you think about the people you live with?
List positive attributes List negative attributes
Is there anyone else you want to live with but don’t?[2 ft
yes not2 ft 93
who? why do you why can't want to live you?with them?
Is there anyone you live with but don’t want to?[2 0
yes noc2 93
who? why don't you why do youwant to live have to?with them?
93not sure
93not sure
Who helps you at home?[2 f t 0 93friends family staff other
What do you need help with?
List tasks/skills
What do you think about the help you get?
List positive comments List negative comments What things do you do at home?
List domestic tasks
Is there anything else you want to do but can’t?[2 fr 93
yes no not sure[2 93
what? why can't you do it?
List neutral comments
i -nkluoll
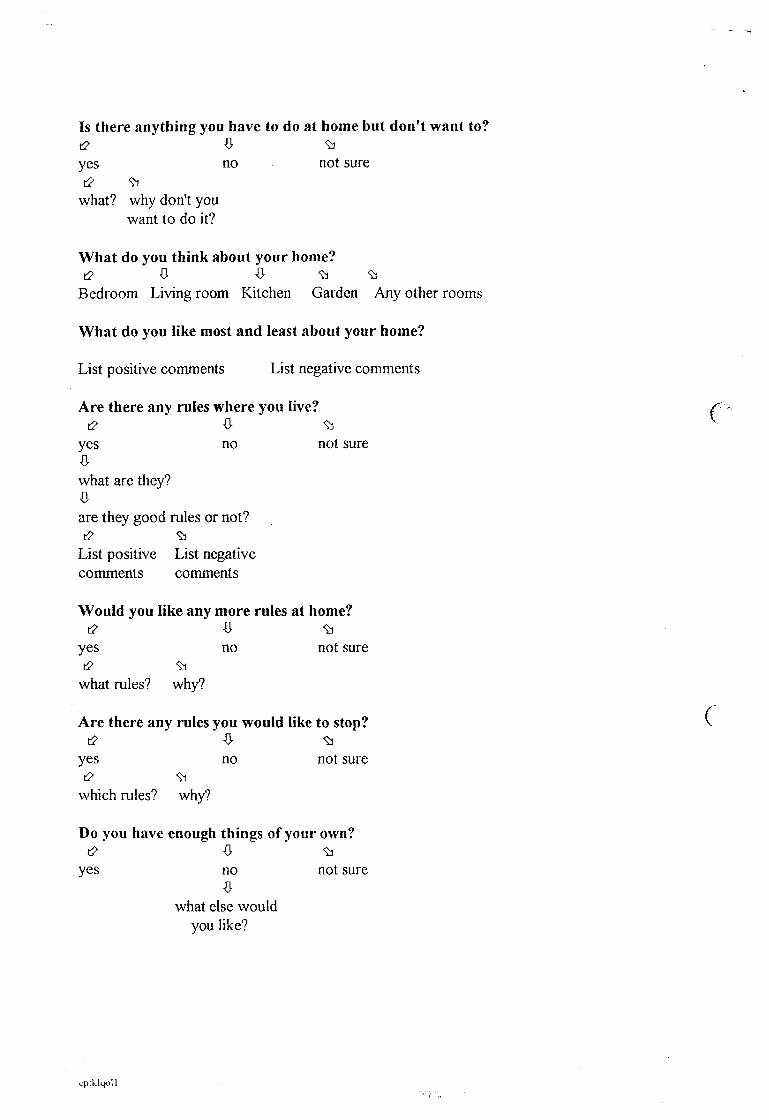
Is there anything you have to do at home but don't want to?t2 ft 93yes no not sure[2 93
what? why don't you want to do it?
What do you think about your home?t2 ft ft 93 93
Bedroom Living room Kitchen Garden Any other rooms
What do you like most and least about your home?
List positive comments List negative comments
Are there any rules where you live? ^[2 ft 93 ^
yes no not sureftwhat are they?ftare they good rules or not?[2 93
List positive List negative comments comments
Would you like any more rules at home?[2 f t 93
yes no not sure(2 93
what rules? why?
Are there any rules you would like to stop? C[2 ft 9]
yes no not suret2 93
which rules? why?
Do you have enough things of your own?(2 f t 93
yes no not sureft
what else would you like?
cpiklqoll
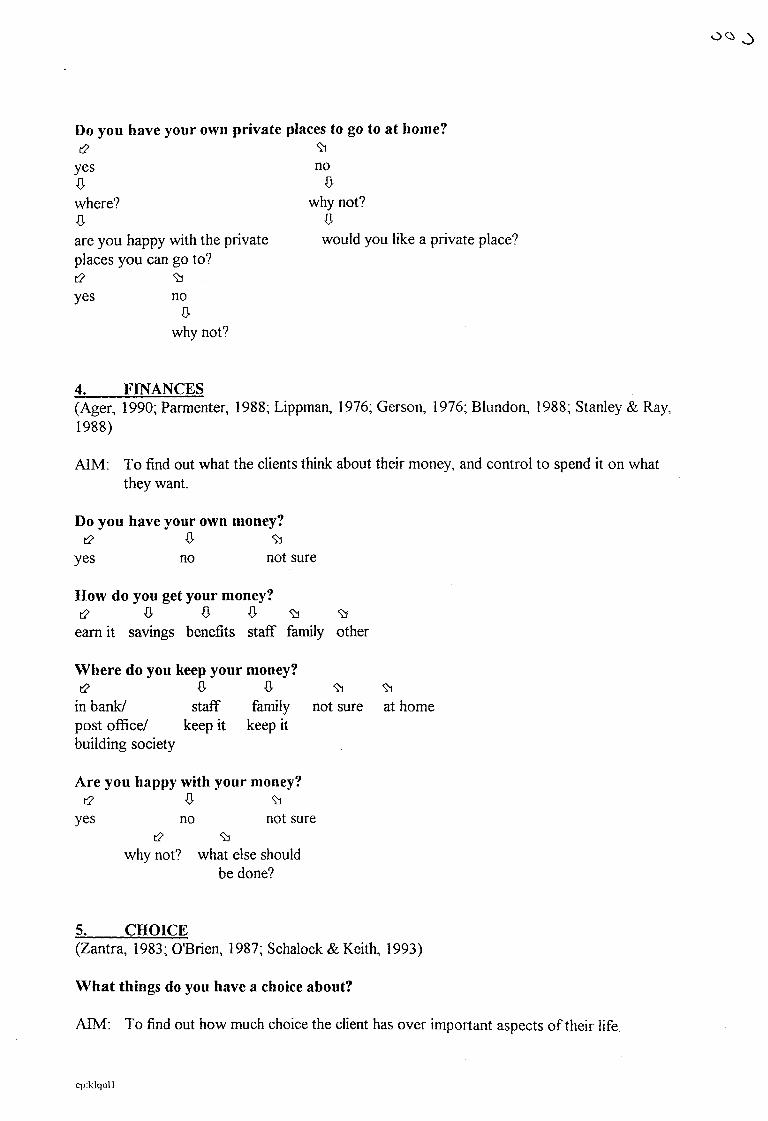
COS
Do you have your own private places to go to at home?t2 9]
yes noft ftwhere? why not?ft ftare you happy with the private would you like a private place?places you can go to?[2 9]yes no
ftwhy not?
4. FINANCES(Ager, 1990; Parmenter, 1988; Lippman, 1976; Gerson, 1976; Blundon, 1988; Stanley & Ray, 1988)
AIM: To find out what the clients think about their money, and control to spend it on what they want.
Do you have your own money?i2 ft 9]
yes no not sure
How do you get your money?[2 ft ft ft 9) 9)
earn it savings benefits staff family other
Where do you keep your money?[2 ft ft 93 9]
in bank/ staff family not sure at homepost office/ keep it keep itbuilding society
Are you happy with your money?t2 ft 93
yes no not sure(2 9i
why not? what else should be done?
5. CHOICE(Zantra, 1983; O'Brien, 1987; Schalock & Keith, 1993)
What things do you have a choice about?
AIM: To find out how much choice the client has over important aspects of their life.
cp:klqoU
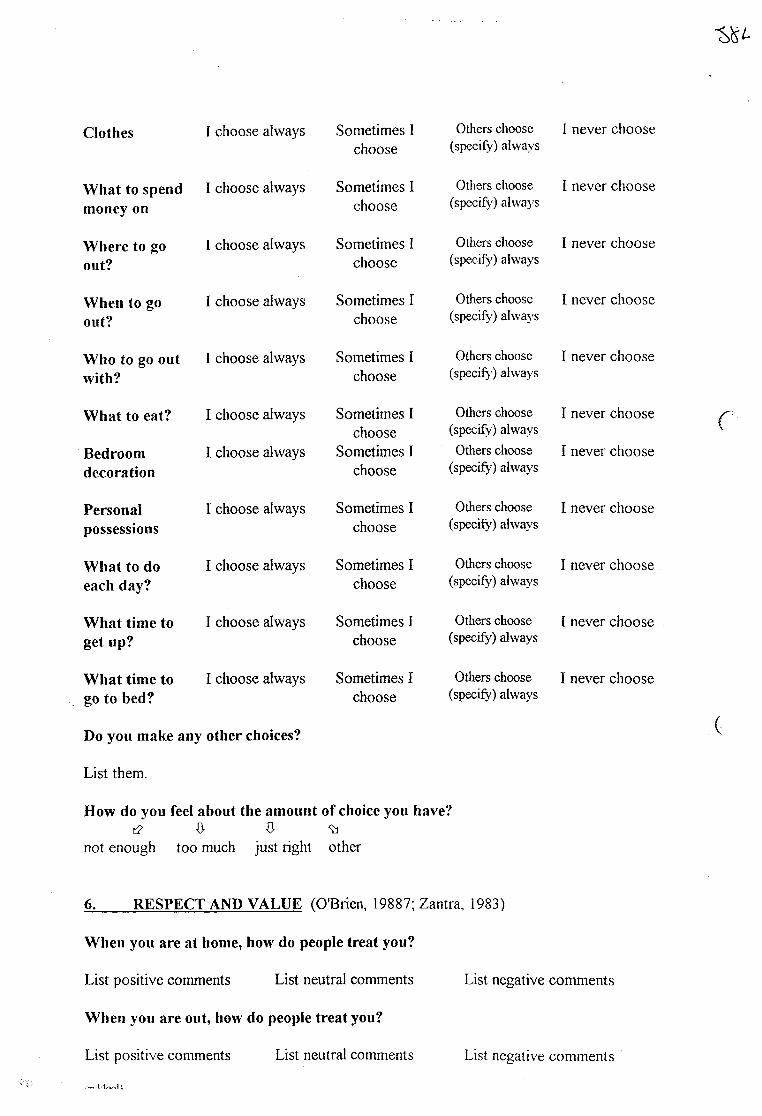
Clothes I choose always Sometimes I choose
Others choose (specify) always
I never choose
What to spend money on
I choose always Sometimes I choose
Others choose (speeify) always
I never choose
Where to go out?
I choose always Sometimes I choose
Others choose (speeify) always
I never choose
When to go out?
I choose always Sometimes I choose
Others choose (specify) always
I never choose
Who to go out with?
I choose always Sometimes I choose
Others choose (specify') always
I never choose
What to eat? I choose always Sometimes I choose
Others choose (specify) always
I never choose
Bedroomdecoration
I choose always Sometimes I choose
Others choose (specify) always
I never choose
Personalpossessions
I choose always Sometimes I choose
Others choose (specify) always
I never choose
What to do each day?
I choose always Sometimes I choose
Others choose (speeify) always
I never choose
What time to get up?
I choose always Sometimes I choose
Others choose (specify) always
I never choose
What time to go to bed?
I choose always Sometimes I choose
Others choose (specify) always
I never choose
Do you make any other choices?
List them.
How do you feel about the amount of choice you have?[2 ft ft
not enough too much just right other
r
(
6. RESPECT AND VALUE (O'Brien, 19887; Zantra, 1983)
When you are at home, how do people treat you?
List positive comments List neutral comments List negative comments
When you are out, how do people treat you?
List positive comments List neutral comments List negative comments
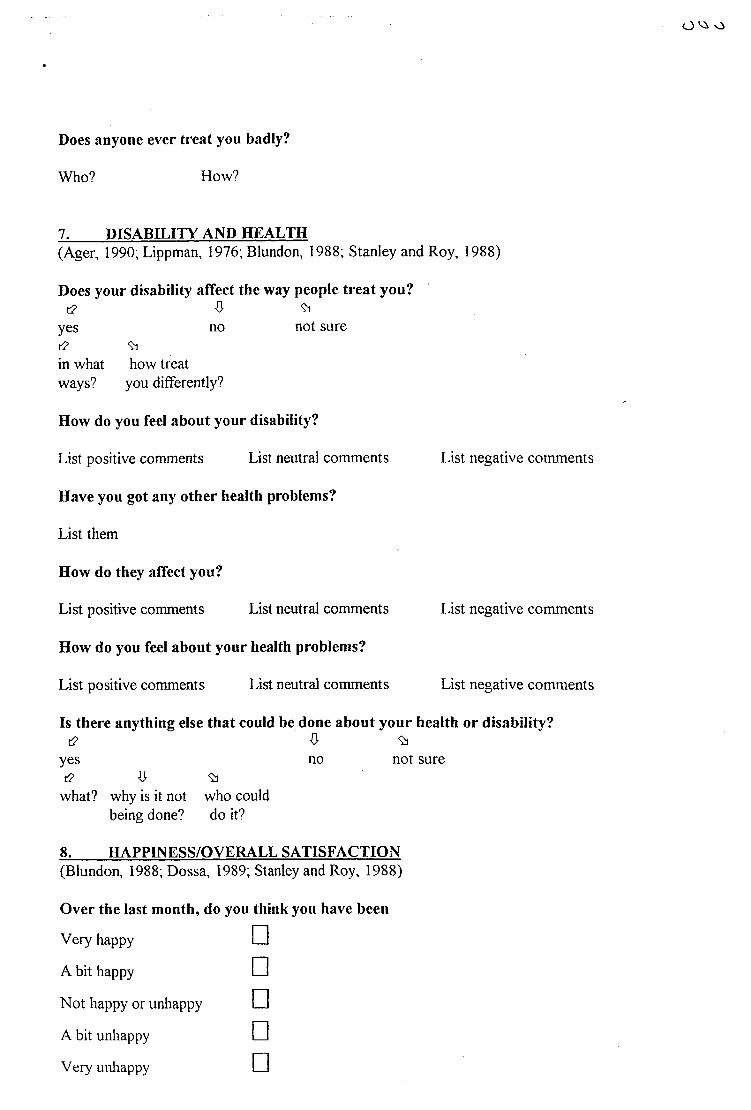
O Vs o
Does anyone ever treat you badly?
Who? How?
7. DISABILITY AND HEALTH(Ager, 1990; Lippman, 1976; Blundon, 1988; Stanley and Roy, 1988)
Does your disability affect the way people treat you?[2 ft 93
yes no not sure[2 93in what how treat ways? you differently?
How do you feel about your disability?
List positive comments List neutral comments
Have you got any other health problems?
List them
How do they affect you?
List positive comments List neutral comments
How do you feel about your health problems?
List positive comments List neutral comments
List negative comments
List negative comments
List negative comments
Is there anything else that could be done about your health or disability?[2 ft 93
yes no not sure[2 ft 93
what? why is it not who could being done? do it?
8. HAPPINESS/OVERALL SATISFACTION(Blundon, 1988; Dossa, 1989; Stanley and Roy, 1988)
Over the last month, do you think you have been
Very happy
A bit happy
Not happy or unhappy
A bit unhappy
Very unhappy
□□□□□
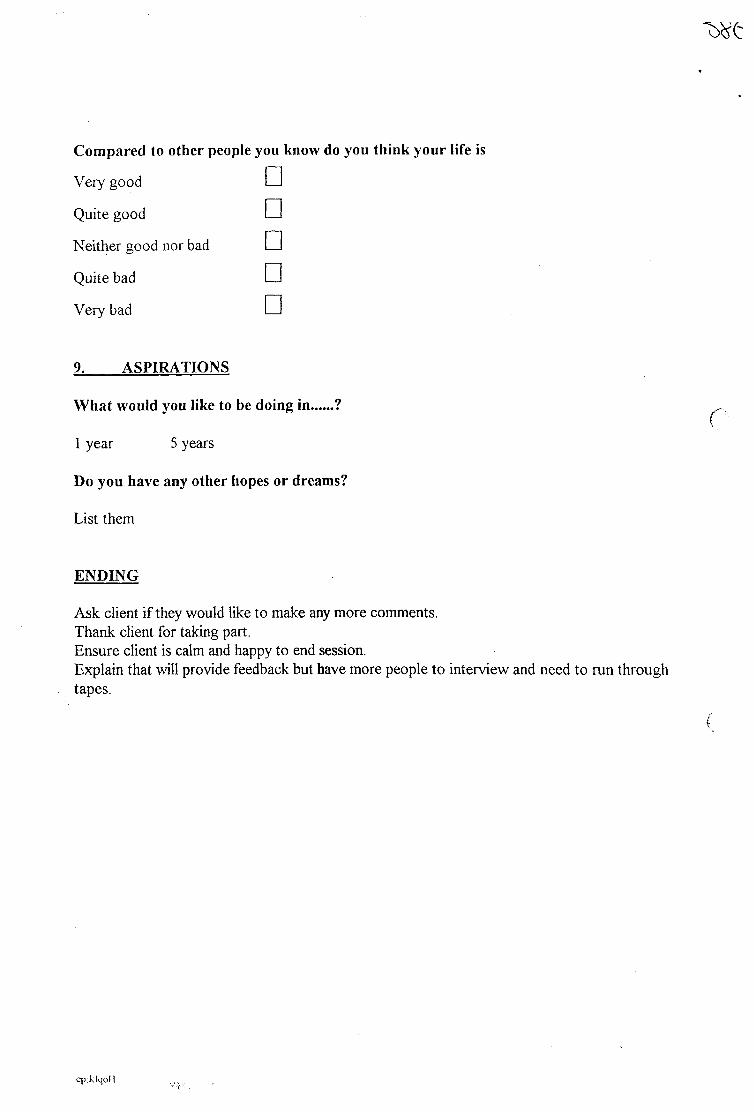
Compared to other people you
Very good □Quite good □Neither good nor bad □Quite bad □Very bad □9. ASPIRATIONS
What would you like to be doing in ?
1 year 5 years
Do you have any other hopes or dreams?
List them
ENDING
Ask client if they would like to make any more comments.Thank client for taking part.Ensure client is calm and happy to end session.Explain that will provide feedback but have more people to interview and need to run through tapes.
cp:klqoH

387
APPENDIX SEVEN
PARTICIPANT NUMBER 8 SEMI-STRUCTURED INTERVIEW
TRANSCRIPT
388
INTERVIEW WITH PARTICIPANT NUMBER 8
KL And just check that it is recording. OK, is that all right if we leave the tape recorder on?
P Yeah.KL OK. So we are just going to have a chat about all the things you do each week and
what things you like best and what things you would like to change, if there isanything you want to change. And then, em, if you want to stop, just let me know andwe will have a break, OK? Now we talked a little about your friends and your family.Have you got friends P-?
P Yeah.KL Who are your friends?P I have a lot of them.KL Have you! Oh, give me a few names then.P P-.KL P-.P A-.KL Right.P My boss.KL Yeah. What’s your boss called?P S-.KL OK.P M- P., the Assistant Manager.KL Right.P K- who works with me.KL Right.P G- who works with me.KL Right.P M- she works with me.KL Right.P ... he works with me.KL Right. So some of these people are people you work with?P Yeah.KL Have you met any friends any other way?P Only in pubs.KL In pubs. Right. So that is somewhere else you can meet friends. Right, do your
friends have, em, a learning disability or not? Do they ... they have any otherproblems.... or are they just kind of ordinary people?
P No. Ordinary people. One of them has got a problem. D- B-, he’s, er, he’s on fits.KL Oh, right.P Has fits.KL Does he, yeah. Yeah. So what do you like about your friends then? What things do
they do that are really good?P Good. They play football.KL Play football.P All the time, yeah.
389
KL Right. So you are interested in the same things then?P Yeah.KL Mmm.P Same teams.KL What football teams do you support?P I support Chelsea.KL Do you?P Yeah.KL Right, and what about your friends?P Some support Chelsea, some support Palace.KL Oh! Right. Oh, so some, er, disagreements there then!P P- and A- are brothers.KL Are they? Do they support the same team?P Yeah. Palace.KL Right. What else do you like about... they have got the same interests and... P Good blokes.KL Yeah. Yeah. What is good about them?P Em, don’t know really. Just play football with me.KL Do you play football often?P Yeah. A lot.KL How often do you play football then?P When the kids was off, on the Monday I played football about four hours.KL Did you!P Yeah. I played football Sunday after work. I was working Sunday.KL Mmm. Mmm.P Ten to one.KL Mmm.P Go home, change and go play football till half past three or four.KL Gosh! Must keep you fit!P Mmm.KL Yeah. So you say you get to make friends through work and at pubs...P Yeah.KL Are there any other ways you get to make your friends?P Yeah. Got loads of friends on the buses.KL On the buses?P Yeah. Working on the bus.KL Right. Is that something you used to do or do you do that still?P No. I still do it, em, L- G- and all he drives the 285, he used to drive 141.KL Right.P M-, he drives the 121.KL Right.P L-.KL You work on the buses?P No.KL No.P I know them.KL You know them because they work on the buses?
390
P Yeah.KL Right, right. So apart from playing football what other things do you do with your
friends?P Snooker.KL Right, yeah.P I play a lot of snooker. Karaoke.KL Right. You do it, do you get up and sing?P Yeah. I done it on Friday, last Friday.KL Did you? What did you sing?P Stand By Me.KL Did you! What on your own?P Yeah.KL Gosh, you are very brave in front of people!P Was on about getting a girlfriend, yeah.KL Right. Is that something you would like. You’d like a girlfriend would you? Have
you had a girlfriend in the past?P Yeah. In my old school.KL In your old school. Right, so there is nobody special at the moment?P No, not yet!KL Right, em, who is your best friend then?P I’ve got loads.KL You have got loads. You can’t pick out one person in particular?P Yeah.KL Who?P P-.KL P-. Right. And, er, is there anything, because sometimes people get on our nerves
don’t they? Is there anything you don’t like about your friends?P No.KL No. That’s good! What do you think about the number, you said you had got loads of
friends, do you think you have got enough friends or not enough friends?P Enough.KL Enough. Have you got too many?P Yeah.KL Em, now we have just been talking a bit, haven’t we, about who is in your family?
Now let’s go through who is in your family. We have got...P Mum, Dad.KL Yeah.P G-, C-.KL Right. And G- and C- are, how old are they?P G-is 18.KL Yeah.P And C-, he is 13.KL Right.P And I’m 22.KL Right, so you are the oldest?P Yeah.KL And your Mum and Dad, do they still live together or separately?
391
P No. Still together.KL Still together, that’s good isn’t it?P He’s in Norway.KL He’s in Norway...P My old man, yeah.KL What does he do out there?P Working.KL Oh, does he!P He, er, just come back from America and he has gone to Norway.KL Right.P For eight days.KL Right! What does he do in Norway then? What job?P He’s doing explorations.KL Right, sounds interesting. Is it an interesting job of your Dad’s then?P Yeah, you get a lot of money for it.KL Do you? Do you get to travel a lot sometimes as well?P Yeah. He went to Norway again, Germany, then Scotland, Austria, Australia,
America, France and all those other countries.KL Have you ever been to visit these countries?P No.KL Have you ever been abroad?P No. Never been on a plane.KL Never been on a plane?P But I’ve been to Devon.KL Been to Devon?P Yeah. I was bom there.KL Been to anywhere else in Britain?P No.KL Would you like to go on a plane?P ... yeah.KL Where would you go on holiday?P Greece.KL You would go to Greece would you?P Yeah.KL Someone was telling us weren’t they that they were going to Greece?P Yeah. See Grease film!KL That would be funny wouldn’t it?P Yeah.KL So you would like to go to Greece. Right. Do you know people that have been to
Greece?P No.KL Who would you go to Greece with?P Me,.. and my friend probably P-.KL Right. So you would go with your friend rather than your family?P Yeah. He’s got a girlfriend.KL Right.P He would probably bring her.
392
KL Right.P And if I get a girlfriend.KL Right.P I haven’t got a girlfriend yet.KL Right.P I’m looking.KL You’re looking are you?P Yeah
(Laughter)KL OK, so is there anybody else apart from Mum and Dad and two brothers in your
family?P My niece.KL Your niece?P Yeah.KL Yeah, what’s her name?P J-.KL And she is nearly one?P Don’t know.KL Right, em.P Don’t know because I haven’t seen her for ages.KL No. You were saying she was bom in August, did you say?P August the 16th. No, she was supposed to be due August 13th and she came August
16th, and I haven’t seen her since October.KL Em, tell me what you like about the people in your family. What do you like about
your Mum?P Don’t know. I always have arguments.KL What do you have arguments about with your Mum?P (Long pause) Brothers.KL Brothers, yeah. Can you think about what your Mum does that is nice? Is there
anything that you like about her?P (Long pause) Don’t know.KL Don’t know, but you have arguments with her?P Mmm.KL Is there anything that you don’t like about your Mum?P No.KL Apart from the arguments! (No answer) What about your brothers? Do you like your
brothers?P (Shakes head)K Not at all? Can you think about anything good about them?P Yeah, they support mbbish team.KL They support a mbbish team?P Yeah. Spurs and Arsenal.KL Yeah, why is that good then?P Can’t stand them.KL Can’t stand...P Can’t stand Arsenal or Spurs.KL Right. And you can’t think of anything else good about your brothers?
393
P Yeah. G -got a good job.KL ...sorry?P .... Got a good job.KL Right, right.P And C-... I don’t know about him... ‘cos been naughty at school.KL Has he?P Yeah. Detention he’s got.KL Has he? Is he in trouble then? What about your Dad? What is good about your Dad?P Don’t know really, ‘cos he always, you know, he always go away.KL How do you feel about him going away?P ... I’m pleased ‘cos he probably, he needs the money.KL Because he brings the money in?P Yeah. Because you know we’ve got Sky, yeah?KL Yeah.P Yeah, you know we have to pay for the Sky and the TV licence.KL Yeah. So you think if he didn’t got away you probably wouldn’t have Sky?P Mmm.KL Right.P And now he’s, you know, working, yeah, you get extra money for going away.KL Yeah, yeah.P You get, you know, loads of money, he showed me it. He showed me money, how
much you get.KL So that is a good thing about him going away. Are there any bad things about him
going away?P ... Yeah, my Mum don’t like staying by herself indoors.KL Right, right. Does that mean you have to do more things when Dad is away?P Yeah.KL Yeah. What do you have to do?P ... Gardening.KL Yeah.P She wash up, my Mum wash up... Just help her.KL Have to help her a bit more?P Mmm.KL Yeah. Em, em, is there anyone else apart from your friends and your family, anybody
who is really important to you? Have you got any pets or anything that are important? P Yeah.KL What have you got?P A rabbit.KL Mmm.P A hamster or a guinea pig, don’t know now!KL Is it a big one or a tiny one?P No. Got a rabbit who’s small.KL Does the small one live with the rabbit?P No. The rabbit lives down the bottom and the small one lives up the top.KL Probably is a guinea pig.P Think it’s a guinea pig.KL Has it got tufty hair or...?
394
P No, fur all over. Yeah, if s a guinea pig.KL I f s a guinea pig. Is it about that big? (gestures)P Yeah.KL Probably a guinea pig.P I’ve got fishes, got bird, got budgerigar.KL What is the favourite out of all your pets?P Rabbit.KL Rabbit?P Yeah, ‘cos got floppy ears.KL Big long ones?P YeahKL You like that? Have you had him a long time?P Yeah.KL So you were saying you haven’t got a girlfriend at the moment?P No.KL And you are not married?P No. I want to be.KL You want to be?P Yeah. Find a girlfriend.KL Yeah. What do you think would be good about being married?P Have kids.KL Yeah. You like children don’t you?P Yeah. I do.KL Because you work with children. Tell me what you like about children.,P Don’t know. I just love children! ... that’s why I ... When I was, you know, used to
be at school I was, you know, I still loved children. I always was with children, you know, I still like them.
KL So during the day you work.P I work for the council, yeah.KL Yeah. Looking after the children in the children’s playground. Right. And you do
that, you have Mondays off...P Yeah. Tuesday, Wednesday, Thursday, Friday, Saturday and Sunday.KL Gosh! You work hard then. And you get paid for that?P Yeah.KL And what do you do in the evenings?P (Long pause) Em, I watch my programme. East Enders,KL You like East Enders?P Yeah... Friday nights I work down the Youth Club.KL Yeah.P Down - Youth Club.KL Mmm.P Then afterwards we go down - Club.KL Yeah.P Council Club and Saturday go down the pub. Sunday I’m working, you know, one
until five and that’s it.KL OK, good. And at weekend you work so you don’t have weekend off, which is like
Mondays?

395
P No.KL Right. And all the things you do during the evenings, do you do those every week or
just sometimes or...P Every week.KL Right, right. So who organised your work for you?P Me.KL You, oh right. So how did you get the job then?P I used to go over there, yeah, when I was a kid.KL Mmm.P And S- was still over there, boss, and he promised me, yeah, a job over there.KL Right.P And was over and just got me a job over there.KL Got you a job?P Yeah.KL So you did well. You decided where you wanted to work and you got a job sorted.P I used to be security and a caretaker down at - College.KL Mm, mm.P I done it for two years.KL Right.P I’ve been a caretaker for six years.KL Right.P Work been - up.KL Yeah, yeah.P And for two years done security at - College. It’s a job.KL Mmm. So do you like your job, your job at the moment?P Yeah.KL Yeah. So do you think you will stay in this job for a while or are you going to look for
another job?P No, I’ll stay in this job.KL And who organises the things you do in the evening?P Me.KL You. Right. So you, em, sort out most of the things that you do then?P Yeah.KL Yeah. Evening activities, you go down to the Youth Club and, em, that’s with, er ...
teenagers is it, I guess?P No, kids.KL No, kids again. Little ones?P Yeah.KL Right.P Em, Friday nights it’s seven to eleven?KL Right.P Mondays and Wednesdays .... I think is sixteen or fifteen up to twenty five.KL Right. So the older ones are the Mondays and Wednesdays?P Yeah. I don’t go there, I go on Fridays.KL Yeah. Why is that then?P More troubles there Mondays and Wednesdays.KL Are there? So you like the little ones better?
396
P Yeah.KL Right. Do they have other staff at the club then?P Yeah.KL OK, em, right. Now we were talking about things that you do, weren’t we, and, so you
do the clubs with the other staff, when you go off to the pub and snooker and things like that...?
P Yeah.KL Who do you do those things with?P Me.KL You. You go down to the pub on your own? Do you know people in the pub?P Yeah.KL Yeah. Do you have the same pub that you tend to go to?P Yeah.KL So, the next question I have got is that do you always manage to do activities or do
they ever get cancelled?P No.KL No. I guess they wouldn’t because you organise most of them don’t you? So you
choose what to do?P Yeah.KL OK. Do you do any other things that are specifically for people with a learning
disability or not?P (Pause) No.KL No. OK. Now holidays, you say you have been to Devon?P Yeah.KL And Bognor.P Yeah.KL Been anywhere else?P No.KL OK. And you were saying you’d like to goto ...P Greece.KL With P- and his girlfriend, and if you had one.P Yeah.KL Right. Is there anywhere else apart from Greece that you’d like to go to on holiday?P No.KL No, OK. Got any other hobbies?P No, just football and snooker - oh, and music.KL And music.P Singing.KL And singing, yes. Karaoke.P Yeah. I’ve got a karaoke machine.KL Have you got a machine? Oh right!P Karaoke and got karaoke tapes.KL Right. So you can practise at home? What is your favourite karaoke song to sing
then?P All Shook Up.KL Right. ‘60’s.P Yeah and Tom Jones.
397
KL And when you go off to do your karaoke, who do you do that with?P On me own.KL On your own. Does P-, your friend, ever come with you or not?P No.KL No. Does he not like karaoke?P No.KL Is there anything else that you don’t do at the moment that you would really like to do?P (Long pause) No.KL No. Quite happy with what you are doing?P (Long pause) Ijust want to play football for Chelsea.KL That would be what you would really like to do?P Yeah, you know, train and...KL Who is your favourite player then?P Dennis Morris and Sillnor.KL Er, when you go out to the pubs and do karaoke and things...P Mmm.KL How do you get to the places that you go to?P Bus.KL And that’s how you get to meet some of the people that drive on the routes?P Mmm.KL OK, so overall thinking about the things that you do, what do you think about the
things that you do?P It’s good.KL Yeah. You think it’s good. OK. Now, you were saying about your family and you
live with your family don’t you?P Yeah.KL So whose, whose... your Dad is often away... ?P Mmm.KL But at home we have got...P Me, Mum, D-, C-.KL Right. Em, what do you think about the house, the place that you live in?P (Long pause) It’s OK.KL It’s OK. What are the rooms like?P (Long pause) It’s OK. We got all posters on the wall.KL Have you? Football posters o r ...?P Yeah. Chelsea.KL Chelsea posters. Right. Who chose the decoration for your bedroom?P Me.KL And you are happy with the way it is decorated?P Yeah, and motorbikes.KL And motorbikes as well. Is that something else you are interested in?P Mmm.KL What about the rest of the house? How is that decorated? Are you...?P All right. Yeah. My Dad done it.KL Did you help your Dad decorate your room?P No.KL Did he do it, and you chose it?
398
P Yeah.KL What about the area you live in?P ... All right.KL You’re happy with it?P Yeah.KL Right. And noisiness?P Not there.KL Yeah. It is all right? Quiet enough?P Yeah.KL You have, you don’t share a bedroom with your brothers?P No.KL So you have your bedroom to go to?P Yeah, I got me own room.KL Right. What do you think about the way your can go to your room when you want to
be on your own? Have you got enough places you can go to?P Yeah.KL Yeah. Er. Just your bedroom then?P Yeah. Ijust lock, Ijust lock my, Ijust lock me in.KL Have you got a lock on your bedroom door?P No, a key.KL A key. Right. Do you keep the key with you o r ...?P No. If it’s in the door I don’t lose it.KL Em, that’s true and then you wouldn’t get back in would you? Yeah, see what you
mean. If you could choose where you live, would you live with your family in the house or...?
P No.KL Where would you like to be living?P By myself.KL You would like to live on your own? Right.P And if I got a girlfriend. I’d live with her.KL Right, right. Are you making plans to move out o r ...?P Yeah.KL Yeah.P I think I’m on the housing list.KL You are, are you? Yeah. How are things at home at the moment?P Not.KL You’re shaking your head!P I’m moods.KL Moods?P Getting bad.KL Are the always?P I went to the doctors yesterday and my Mum told the doctor I’m on moods.KL What did the doctor say?P Doctor gave me, er, mood tablets, yeah, and the doctor said, “No stop it”. Stop the
mood tablet because it’s getting worse, my moods. It is.KL Do you know what these mood tablets are called?P No, I think they, er, stop me punching - last night.
399
KL So you fight with them! Do they fight back?P ...Yeah.KL Did you get punched as well?P No, I didn’t.KL Why was that then?P Because I grabbed them and they didn’t punch me, they didn’t punch me because I
grabbed their arms.KL So you stopped them punching you. So things are bad at home then?P Mmm. It my, it’s my, just my, you know, moods.KL Have you been thinking you would like to move for a long time or is it quite a new
thought?P No, long time.KL Mmm. Do you know how close you are to getting a house on the council list?P No.KL Mmm. It’s difficult isn’t it? So, em, do you need any help around the house? If you
were going to move out and live on your own, you would have to do most thingsyourself, wouldn’t you? Do you need any help with things? Are there things you need to learn before you move out?
P Brm, only a couple of things.KL Yeah. What are the couple of things?P Ironing.KL Ironing?P I don’t do it. My Mum do it.KL Mmm.P Because she don’t trust me. Because she says I might bum the clothes.KL Right. You might bum the clothes. Do you think she is right or not?P And cooking. No, I’m good at ironing and cooking.KL Would you like to iron more?P Yeah, and cooking.KL And cooking. Does your Mum let you cook at home?P No.KL She does the cooking does she?P Not yet, because she think I bum it.KL Is she right?P No.KL No. What things can you cook?P .... beans on toast, I can cook chips and burgers done on foil at the college. I cook it
up when I used to come here.KL You used to come to the Day Unit did you?P Yeah, help out.KL Can you remember what you used to cook when you came here?P Stir fry. That was nice, stir fry. I done it with, em, James. He has gone now. He was,
you know, a good bloke, James.KL He used to work here?P Yeah.KL Mmm. So it sounds to me that you can cook quite a lot, but you don’t cook at home?P No.
400
KL No.P No, my Mum do it.KL Would you like to cook more at home?P Yeah.KL Well, I guess if you are going to move out you need to practise don’t you?P Mmm.KL Yeah. Are there other things that Mum does at home for you? ... what about the
washing - who does the washing?P Mum. I do the washing sometimes. That’s it.KL Em, is there anything else you want to do around the house at home that you can’t do
at the moment, somebody else does it?P ... hoovering.KL You want to practise the hoovering a bit more?P Yeah. I did do it. I missed a bit though.KL Did you?P Yeah. My Mum says, “Look boy, you have missed a bit over there,” and I did.KL So, did you go back and do it again?P No.KL No, you left it for next time?P No. Mum did.KL Mum did it. Is there anything that have, that your Mum, your Dad or your brothers tell
you you have to do at home that you don’t want to?P ... No.KL No. Nobody makes you do things that you don’t want to do? What do you think
about, we have talked, your bedroom?P Mmm.KL What other rooms have you got at home? You have got a kitchen obviously?P Yeah.KL Have you got...?P A living room.KL Yeah.P And a hallway.KL Right. And a garden?P Yeah.KL You said you did the garden. OK. Is there anything you don’t like about any of those
rooms?P No.KL What do you like best about where you live?P Best. (Long pause) It’s got a garden.KL Right. So on a day like this...P Sunbathing.KL It would be nice to sit outside, sunbathing.P Yeah.KL And what do you like about least about where you live?P (Long pause) Don’t know.KL Or the people you live with?P Oh, my brother.
401
KL Your brother! Which...?P G-.KL G-. Rules. Do Mum and Dad have any rules where you live?P Yeah.KL What rules do they have?P No swearing.KL Yeah. Any other rules?P Yeah. I know it’s not fair, no smoking indoors.KL And you smoke don’t you?P Yeah. And me Mum and Dad, and G-.KL Right. But you, none of you are allowed to smoke inside?P Only Mum and Dad, yeah.KL So, Mum and Dad can smoke inside but you and G- can’t?P Yeah.KL Right.P ‘cos fighting, ‘cos me and G- might have a fight with a fag in hand.KL OK, and then what would happen?P Drop.KL And... that wouldn’t be good would it?P No.KL Right. So no smoking indoors. Any other rules?P No shouting.KL Yeah.P No music loud.KL No loud music.P I do.KL You do?P That’s it.KL So, em, what do you think about these rules? You were saying about any of the rules
were good?P Only one.KL Which one is that?P Swearing.KL No swearing is a good rule.P Yeah.KL Right, right. OK, em, what would you like to do about these rules? Would you like
them to carry on or do you want them to stop?P Stop.KL Yeah, OK. So do you think there are enough rules at home, or too many, or not
enough?P Enough.KL Yeah. Why would you like to stop the no smoking indoors rule?P Don’t know really. Because I smoke a lot.KL Yeah. So you have to go outside a lot?P Yeah. Even when raining as well.KL Yeah. And what about the, no, you said there was a no shouting rule but you did it
anyway?
402
P Mmm, when Pm in a mood, I shout.KL Yeah. OK. At home you have got lots of posters on your things in your bedroom, and
you have a karaoke machine and tape.P CD player.KL CD player, em, do you have enough things of your own?P Yeah.KL Yeah. Is there anything else that you would like that you don’t have at the moment?P (Long pause) Yeah, big stack system.KL Right. A big stack system.P A disco one, and do private discos.KL Right. So you would be the DJ?P Yeah. Done them before.KL Have you? When was that then?P Went to f-.KL OK. Em, so you get paid for your work. Do you have your own money? Do you have
your own bank account or accounts...?P Yeah. Abbey.KL You have an Abbey National account? Right. Do you have your own cheque book
and cards for that account?P Yeah. Mum keep it.KL Mum keeps it.P ‘cos I lose it. Yeah. Whenever I lose it can’t get my money out.KL Right. Right. Do you have any other money that you get? Do you have any benefits
or savings or anything?P Yeah, benefit.KL Yeah. Does that go into your account as well?P No, not Abbey National. Got a Post Office.KL Right, and you get your benefits at your Post Office account?P Yeah.KL Yeah, and is that in your name as well?P Yeah.KL Yeah. Do you keep that book or does Mum keep it?P Mum keep it.KL Are you happy with Mum keeping your money?P No.KL What would you like to happen?P Me look after money.KL Have you ever looked after your money?P Have on holiday. Isle of Wight. I’ve been to the Isle of Wight before.KL Oh! Been to the Isle of Wight? Right.P Yes.KL Oh, right! Had your own money then. What is the trouble with Mum keeping it?P She don’t trust me.KL Doesn’t she?P No, she knows I spend it just like this (snapped fingers).KL OK, so she knows how much you can spend, she knows how much you spend?P Yeah.
403
KL Yeah. Does she ever say you can’t have the money if you want some?P No.KL She normally lets you have it? Lets you have your book. Are you happy with how
much money you get?P Yeah.KL You normally have enough money to buy the things you want to buy? That’s good
isn’t it? You work very hard for your money by the sound of it as well!P Yeah.KL The next thing is about choices, choosing things. I have got a list here of all the kinds
of things people often choose. Now, clothes and what to wear. See, I have a list down here of clothes and these are the, er, ratings here - I choose always, sometimes I choose, other people choose, I never choose. So with your clothes, who chooses your clothes?
P Mum. I never choose.KL You never choose?P No ‘cos I’m always busy.KL Are you? Who chooses your clothes then for you?P Mum.KL Your Mum.P ‘cos I’m always working.KL Right. Are you happy with Mum choosing your clothes or would you like to choose?P I’d like to choose.KL Right. What about what to spend your money on, who chooses about that?P (Long pause) Em, me.KL Yeah. Do you always choose or sometimes choose?P I always choose on drink.KL You spend it on drink?P Yeah.KL Do you spend your money on anything else?P No. My Mum buys me clothes ‘cos I’m always working.KL Right, right. So what is your favourite drink then?P Fosters.KL Yeah. Do you drink that in pints?P Yeah.KL Yeah.P Do you drink?KL I drink yeah. I don’t drink Fosters though! Em, where to go out - who chooses about
that?P Me.KL Yeah. Do you choose always?P Yeah!KL And when to go out?P Yeah.KL Is that the same one is it, that one there? Always. Who to go out with? Same one?P Yeah.KL What to eat - who chooses about that?P Yeah. Me.
404
KL Yeah. What about when Mum does the cooking?P Well, Mum does it.KL Yeah, does she choose?P Yeah, she choose.KL Yeah, but when you’re out you choose?P Yeah.KL So I guess, where would that be on the scale then? Would it be somewhere here?P It would be there.KL There, sometimes I choose. So you choose when you’re out. What is your favourite
kind of food?P Chinese.KL You like Chinese. Have you got a Chinese take-away near you?P Yeah.KL Yeah. OK. Bedroom decoration.P No, me Dad.KL Y our Dad chooses that?P No, I choose motorbike thing.KL OK.P Me Dad decorated.KL OK, so that is that one. Right. Personal possessions. You choose what things to buy
like tapes and stuff?P Yeah, really I write them down.KL Yeah.P I write them down and Mum get it.KL OK. And you always do that?P Yeah.KL Right. Why does your Mum go and get them?P ‘cos I’m always working.KL ‘cos you’re busy. You do work very hard don’t you! One day off a week is not very
much is it? OK. And what to do each day. Who chooses about that?P Me.KL Yeah. Always. Yeah. What time to get up. You’re smiling there! What happens in
the morning, do you have an alarm clock or anything?P No.KL No.P My Mum wakes me up.KL Does she?P I just like staying in bed.KL You like staying in bed.P Yes. I can’t, ‘cos of work.KL So, who chooses when you get up - your Mum or you?P Mum, no sorry, me because of work.KL You?P Mum call me up.KL Right, right. So you know what time you want Mum to get you up?P Yeah. Always half asleep.
405
KL When you live in a house on your own you will have to get an alarm clock orsomething won’t you?
P Yeah. I have got an alarm clock.KL Yeah.P Got.KL Probably something to practise if you are going to move out, isn’t it? And what about
what time to go to bed? Who chooses about that?P Me.KL Yeah. What time do you normally go to bed at night?P Any time.KL Any time you feel like it?P Yeah.KL Right.P ‘cos I watch TV indoors upstairs.KL Have you got a TV in your bedroom?P Yeah,KL So you can go to bed and watch TV for a while before you go to sleep?P Yeah.KL Do you make any other choices during the day?P No.KL Anything else you choose about?P Just work.KL You choose to work. How do you feel about the amount of choice that you have?
Would you like to have more choice over things or less choice or...?P More.KL More choice. OK, what things would you, em, like to choose more about?P ... Money.KL Money. Yeah! That’s a big one, isn’t it! Yeah, OK. So how do people treat you at
home then P-? Do people treat you...?P Terrible.KL Do they?P Yeah. That’s why I want to leave. I’m fed up.KL Yeah. They treat you terrible at home. How do they treat you terrible at home?P ... I don’t Imow, ‘cos C-’s starting it, my youngest one, he start, and, er, G- got up and
hit him.KL Right.P And G- stopping him.KL So G- is trying to stop you hitting him, but C- starts it?P Yeah. G-get out of the way. G- gets in my way.KL Mmm.P Trying to hit him, em. Mum says, “P-, em, no C- stop, you know, winding P- up”,
sticking up for me and, er, G- came in and starts.KL Right. So is that something good about your Mum that she does stick up for you?P Yeah, she does stick up for me.KL She does. Right.P Because she told C- to, em, stop, em, you know, annoying me.KL So what does C- do that is annoying?
406
P ... calls me names.KL Calls you names. You mentioned about taking the tapes as well.P Yeah. And G-start with me.KL Does he call you names as well?P Yeah, em, you know, just sarcasm G- and C-. I start on C- and G-, em, G- was in front
of me, yeah, trying to stop me hitting him.KL Mmm, mmm.P I said, “G- you always stick up for C-”.KL Does G-, is G- not thinking about leaving home? Is he happy there?P He’s happy there.KL He’s happy there. And C- is happy there as well?P He’s thirteen.KL He’s quite little though isn’t he?P Yeah.KL Mmm, OK, em, so when you are out, how do people treat you?P All right.KL Yeah. Does anyone ever treat you badly when you are out?P No.KL Mmm. So you, you said you have epilepsy, but you haven’t had a fit fo r...P About five years now.KL Do you have any other difficulties?P ... No.KL No. Have you ever heard the word learning disability?P Yeah.KL Do you think you have one of those?P No.KL Right, OK. So does your epilepsy, does it affect the way people treat you? Do they
treat you differently because you have epilepsy?P (Long pause) Don’t know really.KL No. OK, how do you feel about having epilepsy?P (Long pause) Em. (Long pause) Upset or cross, no not cross, upset.KL Upset, yeah.P ‘cos see, don’t know where you are.KL Yeah.P If you have a fit you don’t know where you are.KL No, no. Do you, so do you, think everything is being done that should be done about
your epilepsy?P Yeah.KL Yeah. I suppose that is right isn’t it if you haven’t had a fit for five years?P Mmm.KL OK, do you have any other problems that... apart from your moods?P No.KL OK So, over the last month, think back over the last month, we are just in June aren’t
we now, think sort of May and June, how happy do you think you have been?P No.KL No.P My moods.
407
KL Because of your moods, and at home, yeah. What about on this scale where wouldyou be? There’s very happy, a bit happy, neither, a bit unhappy or very unhappy.Where would you be?
P (Long pause) The bottom one.KL The bottom one, this one, very unhappy.P Yeah, ‘cos of me moods.KL Because of your moods. Right, em, compared to other people that you know, your
friends and people you work with, what do you think your life is like? Is your life verygood, quite good, neither, quite bad, very bad?
P Very good.KL Your life is very good.P No, sorry no ... em, bad.KL Which one? Quite bad or very bad?P Bottom.KL The bottom one. OK, right, we talked a bit about this didn’t we, but what would you
like to be doing in a year?P Year?KL Year.P Policeman.KL You would like to be a policeman,... playing football with Chelsea.P Yeah.KL And how about in five years?P ... Five years...KL Would you like to still be at home?P No.KL Would you like to be at home in a year?P No.KL So you would like to be ... living somewhere else?P Yeah... Be a policeman and play football for Chelsea.KL Right.P Five years.KL Do you think you will play football for Chelsea?P Yeah.KL Do you?P Yeah. That’s what I reckon.KL And you would like to be living away from where you live now?P Yeah.KL Do you have any other hopes or dreams about the future?P No.KL What about special people?P (Long pause) No.KL OK, right, that’s it. Thank you very much. You did very well. Shall we turn the tape
off now then, you seem to be very good at these things aren’t you?
408
APPENDIX EIGHT
SUBJECTIVE RATING SCALE WITH INSTRUCTIONS FOR USE
GUIDE TO COMPLETING A OOL RATING SCALE
The rating scale has 10 domains and 36 sub-questions.
For each question you should make a rating of the participant’s QOL in this area by placing a X on the 5-point scale which best corresponds to your opinion.
Suggestions to help you make your decision are given below.
Relationships
...with immediate family
Make your judgement based on the participants’ statements about their family. Especially negative comments about the family as a whole or individual members should lead you to make a more negative judgement. The more negative or more diffuse the comments the lower the rating. Ambivalent, neutral or no comments would lead you to rate the scale on point 3. More positive, favourable comments would lead you to rate this sub-question more highly.
...with fiiends
This does not include the opportunity to make friends or the number. Again, consider the client’s statements about named individuals, what they like and what they don’t like about them. Make your judgement based on the balance of their comments. Comments may be specific or general.
.. .with staff/paid carers
as above.
... opportunitv to make friends
This is not vour evaluation of the participant’s opportunity - rely on their comments only. Do they think they have sufficient opportunity? How well do they feel this matches their need?
Daytime Activities
... quantity
Again, this is not your rating, but the participant’s perception. How full do they feel their week is? Do they feel isolated? Do they get bored? Are there things they would like to do?
.. .type and variety
How stimulated are they? Again, consider any reports of boredom.
... regularity
Do activities ever get cancelled, do they happen at the time they should, on the day they should?
H - \ C
... integration
Are the daytime activities primarily segregated or in usual community facilities? How integrated in the community is the participant?
Leisure
.. ■ self-occupving activities
How suitable and sufficient do the clients perceive their hobbies to be? Do they have activities that they can carry out without staff support to keep themselves busy?
...team, group, leisure activities
Is the client involved in team, group or leisure activities? How do they perceive these? Dothey view them positively, negatively or are they ambivalent? ^
...regularitv
As for daytime activities.
...integration
As for daytime activities.
...variety
As for daytime activities.
Home
... compatibility of others (
How do the participants view the people they live with (this may be their family)? Include either general or specific comments about individuals and characteristics.
... decorative condition
What is the participant’s overall view of the decoration within their house?
... space and room size
What is the participant’s overall view of the space and room size available for them?
■.. help
Is there a mismatch between the help required and help provided by carers within the home?This may be paid, family or other.
.. .local neighbourhood
Does this meet the participant’s needs? Do they prefer a busy or a quiet neighbourhood?Does this match their current neighbourhood? Are there aspects of their environment that they especially like or dislike?
...rules
Do they perceive that they have enough, too few, just right? What are their comments about these?
... privacy
Do they have sufficient opportunity for privacy? Do others interrupt? Do they feel they want private areas?
Finances
... incoming/outgoing
How sufficient are their funds? Is there a mismatch? What do they think about the amount of money that they have?
...accessibility
Can they get at it, when and if they want to? How difficult is this for them?
...regularitv
Do they get their money at the same time each week/month etc.? Do they know when this it?
... control
How much control do they have? How much control do they want?
Choice
What do the participants think about their choices during the day? Remember this is their view, not yours.
Is there a mismatch between desired and actual choice?
Respect and Value
...local community
Are there specific incidents which the participant reports (bullying, exploitation etc.)? If so, this would lead you to rate more negatively.
\ i
.. .peers
As above.
...familv
As above.
... carers
As above.
Health and Disability
... impact (disability)
Again, not your opinion. How do the participants feel that their disability impedes or facilitates their life?
... attitude (disability)
Again rate this by considering specific or general comments.
... impact (health)
As above.
... attitude (health)
As above.
... treatment (health)
Is there a mismatch between the treatment the participant is receiving and the treatment they feel they should receive?
Outlook for future
Do they have hopes and dreams for the future? Do they believe that they will be able to achieve them or do they feel more hopeless?
Overall Rating
Considering all sub-questions. This is a global rating of overall QOL. How does the participant feel about their life generally?
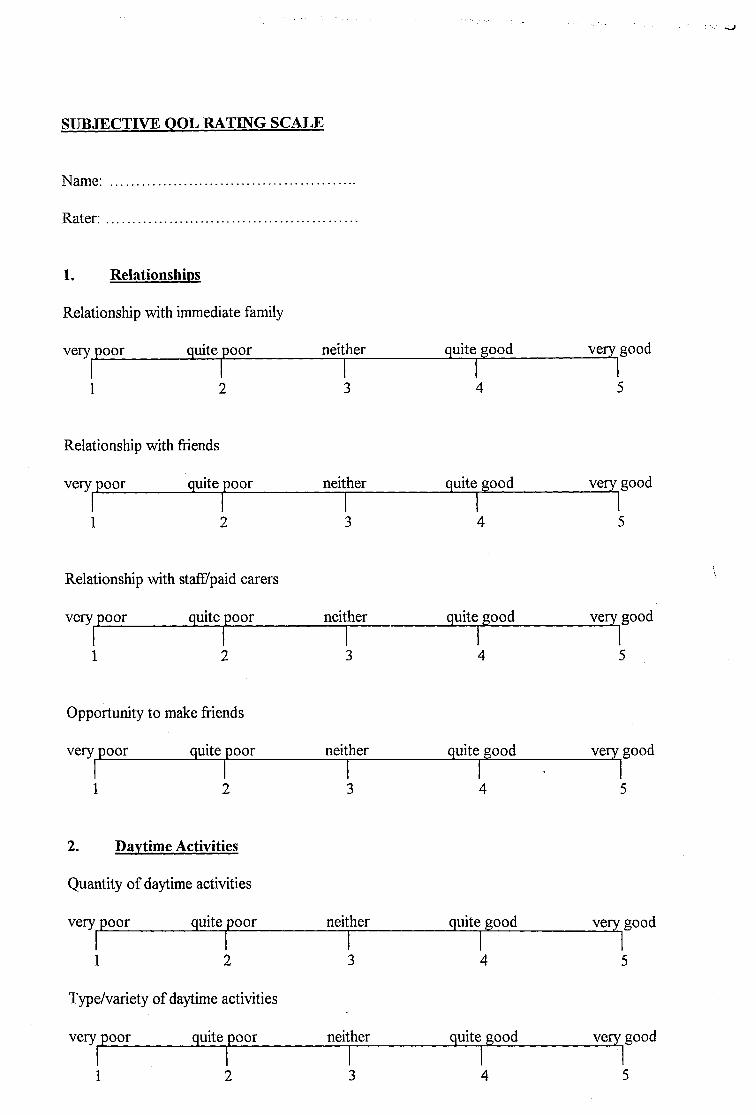
SUBJECTIVE OOL RATING SCALE
Name:
Rater:
1. Relationships
Relationship with immediate family
very poor quite poor neither quite good very good
1 2 3 4 5
Relationship with fiiends
very poor quite poor neither quite good very good1 1 1 2 3 4 5
Relationship with stafifipaid carers
very poor quite poor neither quite good very good
1 2 3 4 5
Opportunity to make friends
very poor quite poor neither quite good very good
1 2 3 4 5
2. Daytime Activities
Quantity of daytime activities
very poor quite poor neither quite good very good
1 2 314 5
Type/variety of daytime activities
very poor quite poor neither quite good very good1 1 1 2 3 4 5
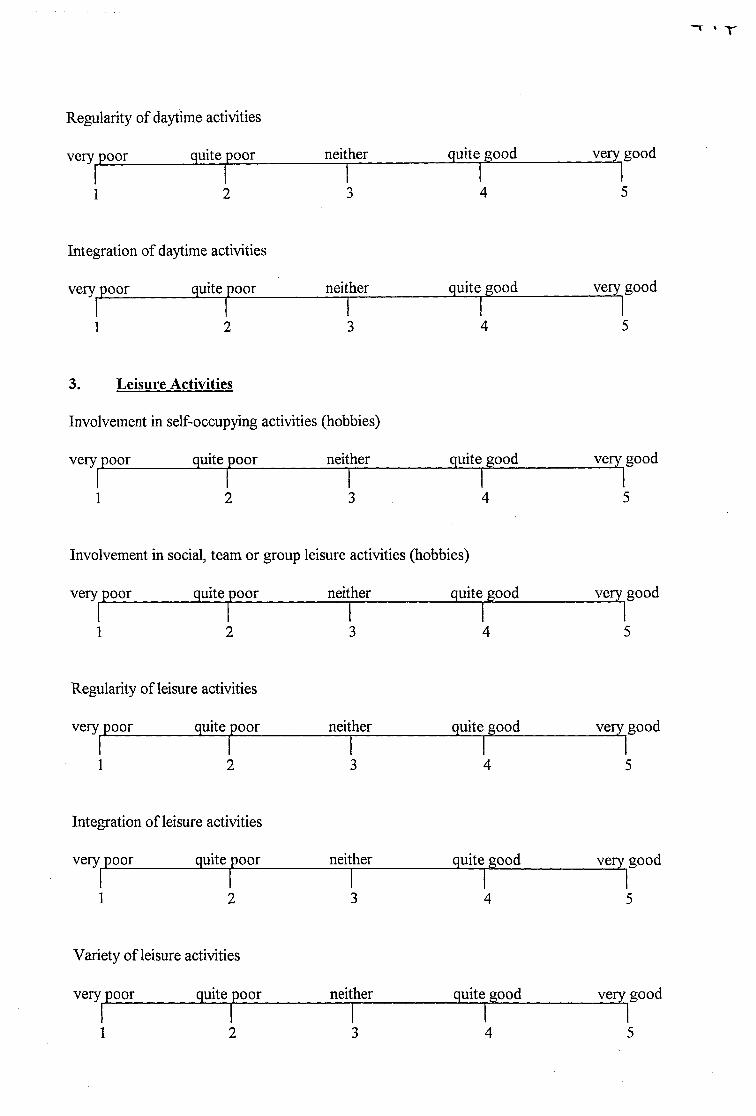
' T
Regularity of daytime activities
very poor quite poor neither quite good very good11 2 3 4 5
Integration of daytime activities
very poor quite poor neither quite good very good
1 2 3 4 5
3. Leisure Activities
Involvement in self-occupying activities (hobbies)
very poor quite poor neither quite good very good
1 2 3 4 5
Involvement in social, team or group leisure activities (hobbies)
very poor quite poor neither quite good very good1 1 1 2 3
14 5
Regularity of leisure activities
very poor quite poor neither quite good very good
1 2 314 5
Integration of leisure activities
very poor quite poor neither quite good very good
1 2 314 5
Variety of leisure activities
very poor quite poor neither quite good very good1 1 1 2 3 4
15
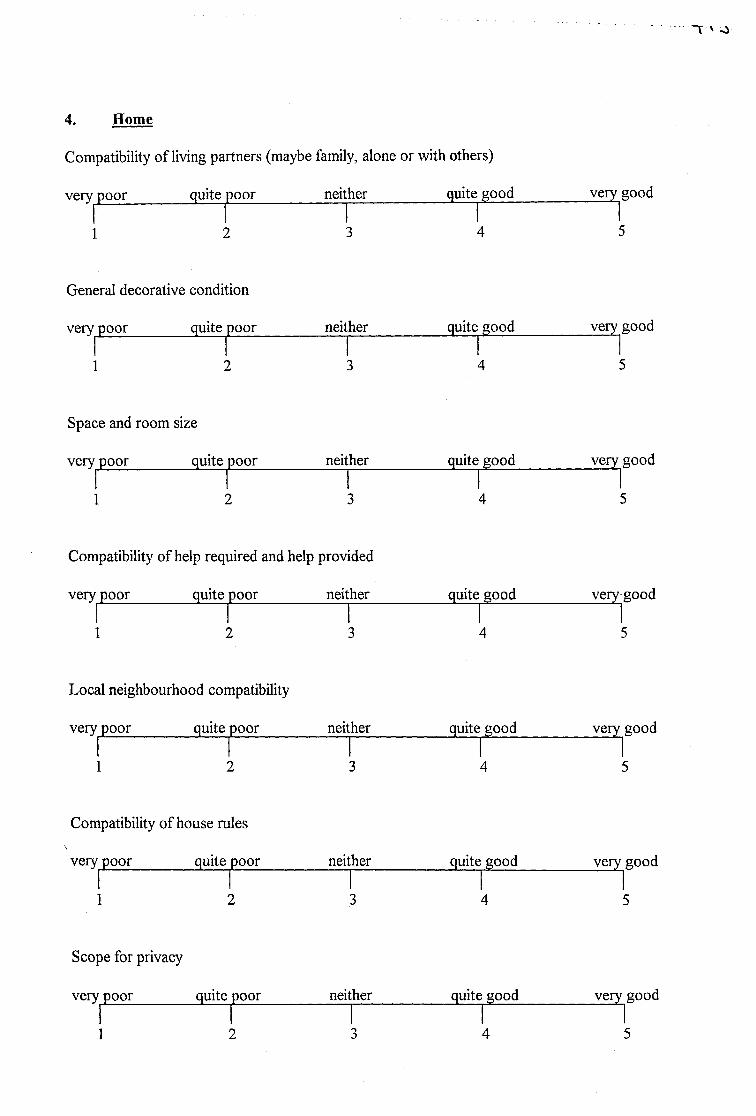
4. Home
Compatibility of living partners
very poor quite poor
(maybe family, alone or with others)
neither quite good very good1 " 1 1 2 3
14 5
General decorative condition
very poor quite poor neither quite good very good
1 213
14 5
Space and room size
very poor quite poor neither quite good very good
1 2 3 4 5
Compatibility of help required and help provided
very poor quite poor neither quite good very good1 1 1 2 3 4 5
Local neighbourhood compatibility
very poor quite poor neither quite good very good1 1 1 2 3
14
15
Compatibility of house rules
very poor quite poor neither quite good very good1 1 1 2
13
14 5
Scope for privacy
very poor quite poor neither quite good very good
1 2 3 4 5
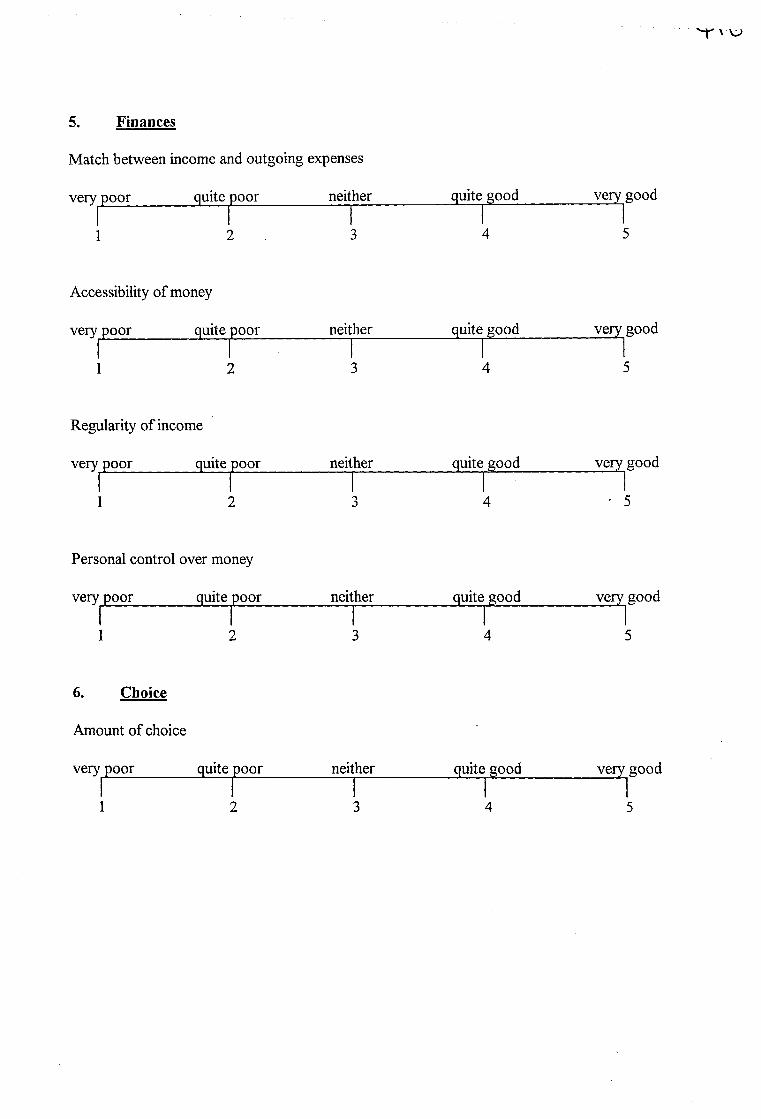
5. Finances
Match between income and outgoing expenses
very poor quite poor neither quite good very good
1 213 4 5
Accessibility of money
very poor quite poor neither quite good very good1 11 2 3
14
15
Regularity of income
very poor quite poor neither quite good very good
1 2 3 4 ' 5
Personal control over money
very poor quite poor neither quite good very good1 1 1 2 3 4 5
6. Choice
Amount of choice
very poor quite poor neither quite good very good
1 2 314
15
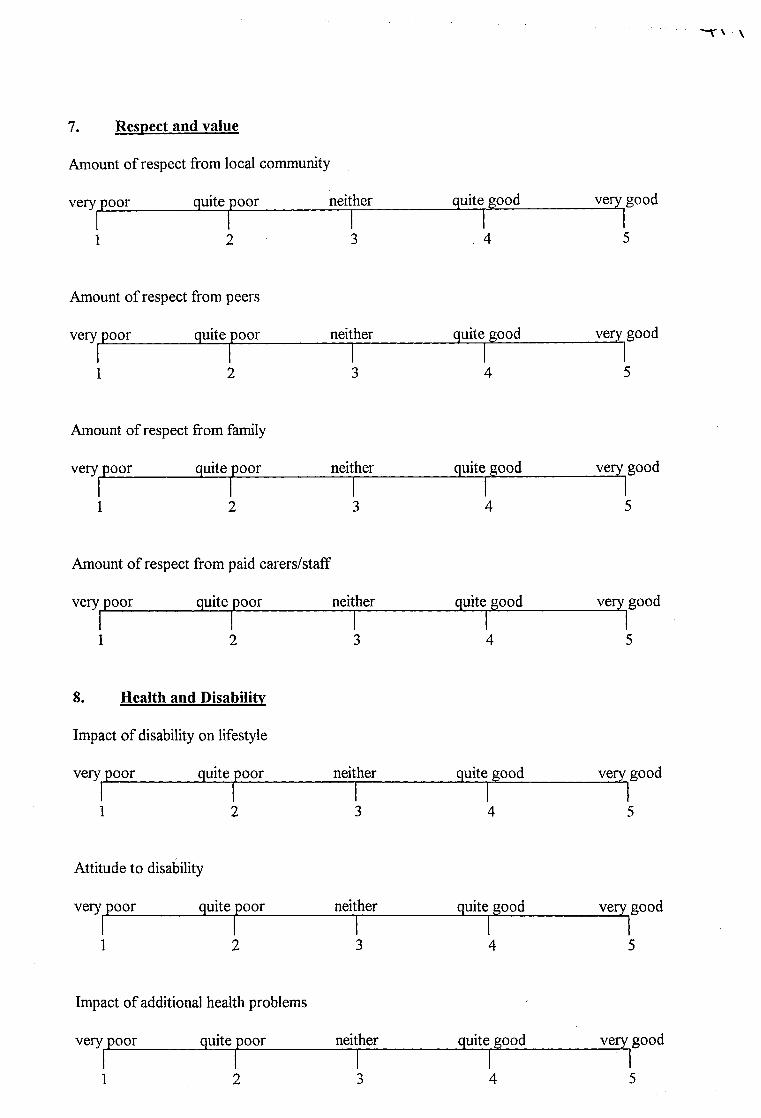
' T V ^
7. Resoect and value
Amount of respect from local community
very poor quite poor neither quite good very good1 1 1 2 3 . 4 5
Amount of respect from peers
very poor quite poor neither quite good very good
1 2 3 4 5
Amount of respect from family
very poor quite poor neither quite good very good
1 213 4 5
Amount of respect from paid carers/staff
very poor quite poor neither quite good very good1 1 1 2 3 4 5
8. Health and Disability
Impact of disability on lifestyle
very poor quite poor neither quite good very good
1 2 314 5
Attitude to disability
very poor quite poor neither quite good very good1 1 1 2 3
14
15
Impact of additional health problems
very poor quite poor neither quite good very good
1 213
14 5
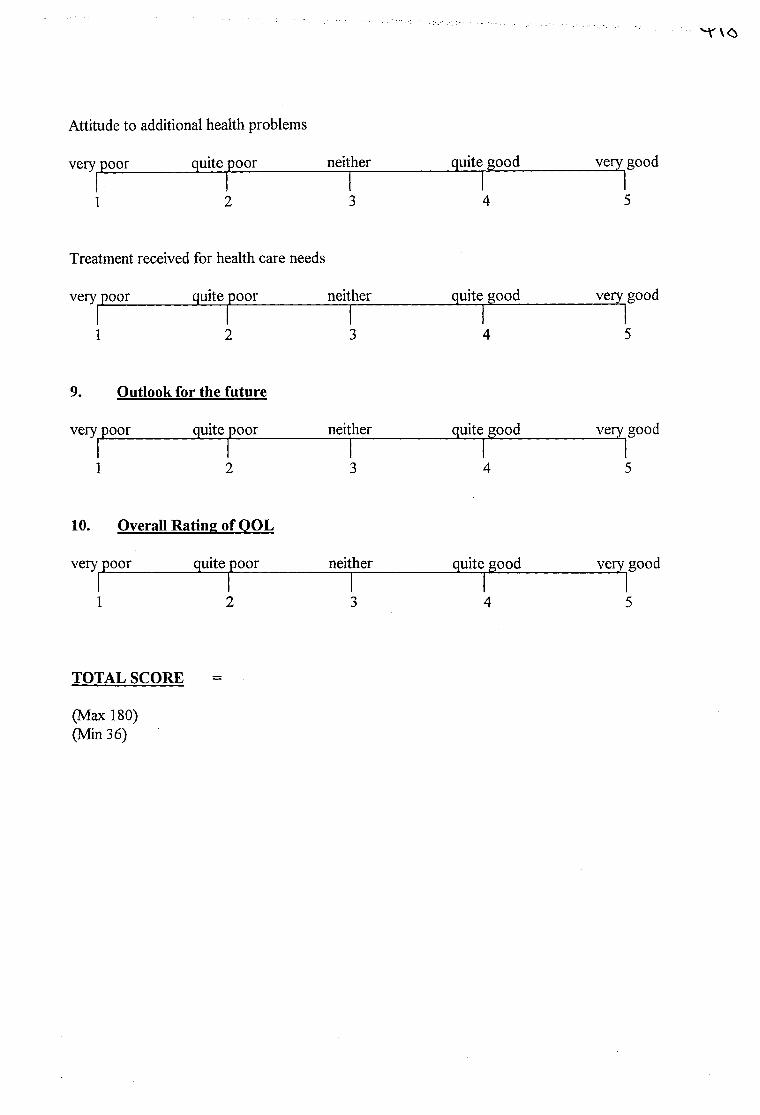
M '\0
Attitude to additional health problems
very poor quite poor neither quite good very good
1 2 3 415
Treatment received for health care needs
very poor quite poor neither quite good very good
1 2 3 4 5
9. Outlook for the future
very poor quite poor neither quite good very good1 1 1 2 3
14 5
10. Overall Rating of OOL
very poor quite poor neither quite good very good1 1 1 2 3 4 5
TOTAL SCORE
(Max 180) (Min 36)

419
APPENDIX NINE
LIST OF DATA COLLATED USING DAILY DIARY

420
LIST OF DATA COLLATED USING THE PARTICIPANT DAILY DIARY
VISITORS RECEIVED
Mean length of visitor stay
Total number of visitors received
Family
Non-disabled friend
Disabled friend
Professional
Number of planned visits received
Number of unplanned visits received
OUTINGS FROM HOME
Mean length of outing
Total number of outings
On own
With staff only
With non-disabled friend
With disabled friend only
With family
With staff and clients
With professional
On foot
By car
By taxi
422
APPENDIX 10
TYPE OF HOBBIES ENGAGED IN BY THE PARTICIPANTS
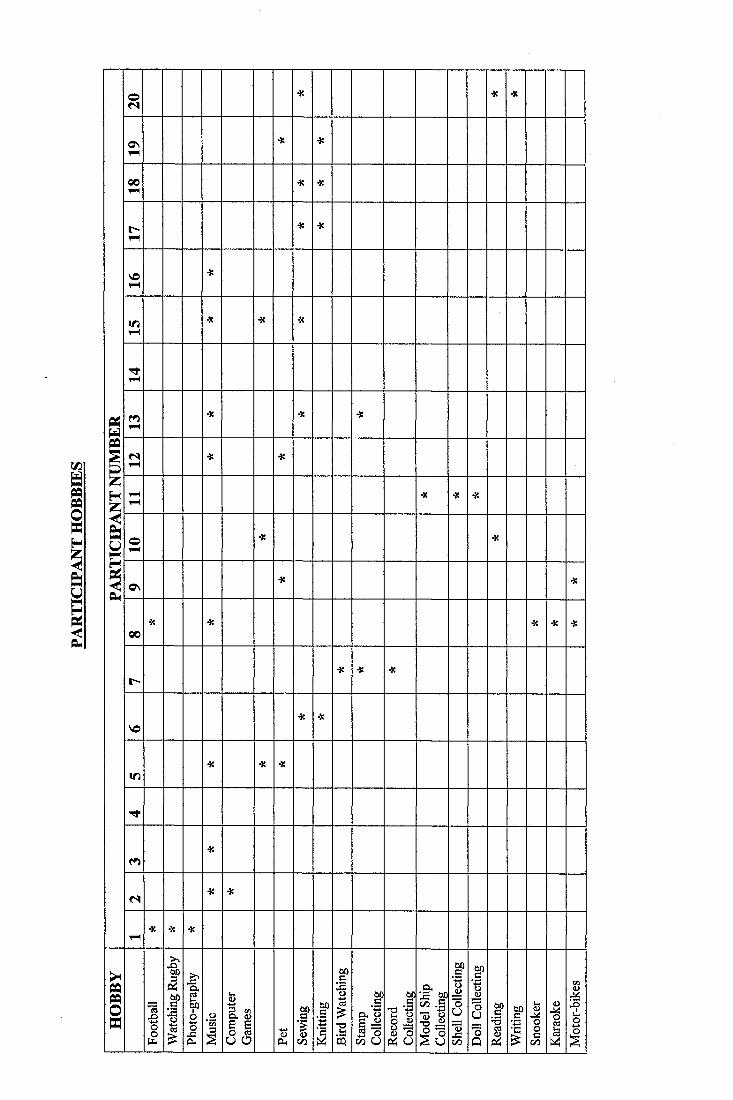
I
!i
O<N
* 4! 4«
ONtH
•X 4Î
0 0v 4
■a 4:
r -T-4
•X 4«
VO1-4
>«
IT)1-4
4: 4: •X
v 4
i"4•K 4: 4S
< s1-4
■K ■a
I1-41-4
4« 4Î 4Î
O1-4
■X 4:
ON■K 4!
0 04: •3: 4: 4: 4:
t -4C 4: 4:
V©4: 4:
If)-X ■X ■X
m4:
N4(
v 44( * 4:
i1
ff 1 1 l l 1
f%
I f
1 l li fPi U
O h
i . l '
I Ï
1
11
1 f f
1111
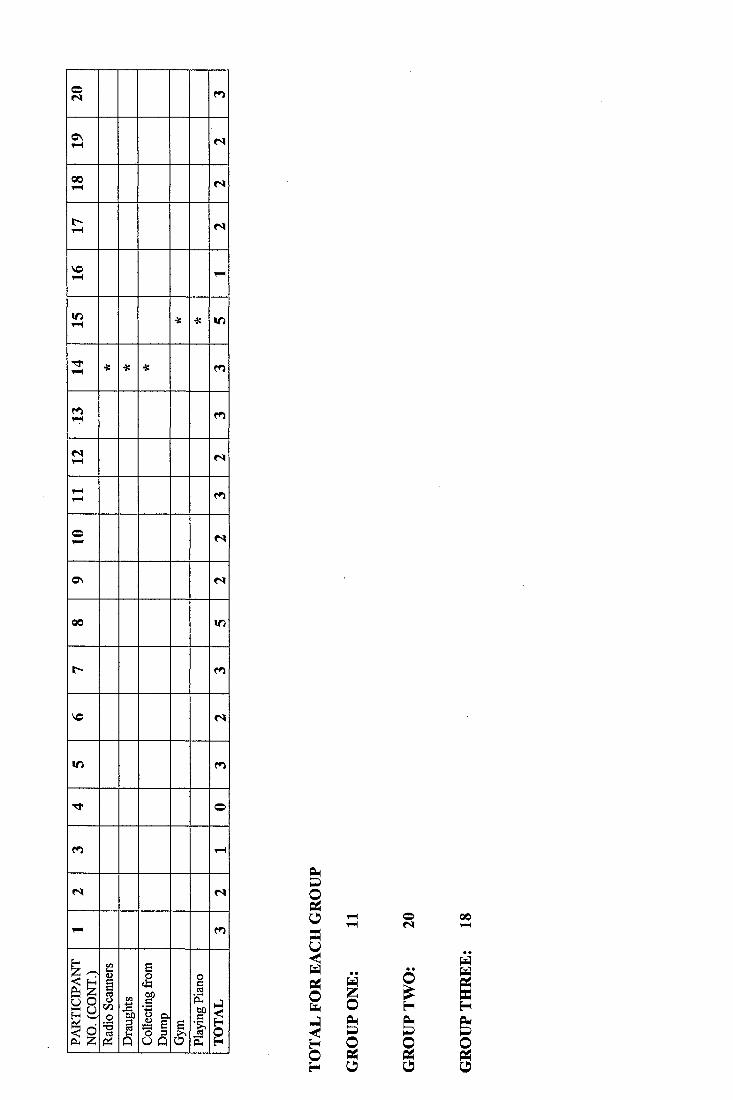
C nrH N
001—1 N
r -1-4 <S
1-4
If)1-4 4: 4: If)
iH ■X ■X •X
(S1—4 N
1-41-4
O1-4 N
0 \ N
00 If)
m
VO n
If)
T t o
m 1-4
N N
1-4 m
!CO1Î
1l l 11I I
IIII
0
1II
00

425
APPENDIX 11
PARTICIPANT ASPIRATIONS
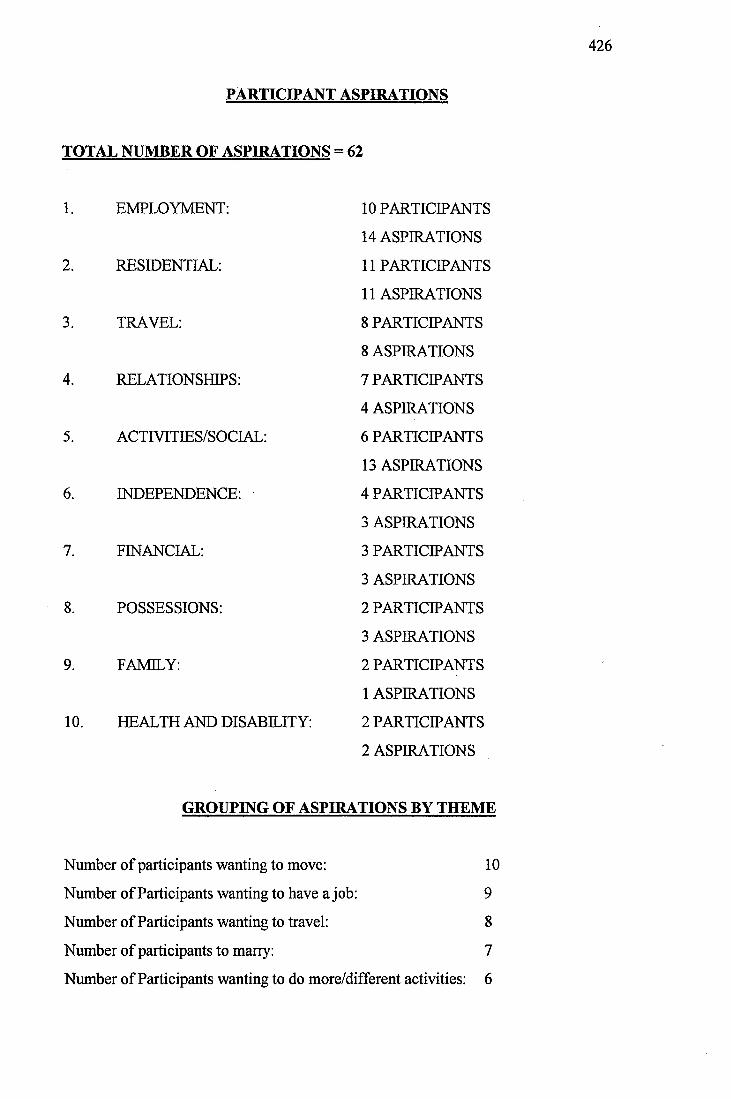
426
PARTICIPANT ASPIRATIONS
TOTAL NUMBER OF ASPIRATIONS = 62
1. EMPLOYMENT:
2. RESIDENTIAL:
3. TRAVEL:
4. RELATIONSHIPS:
5. ACTIVITIES/SOCIAL:
INDEPENDENCE:
7. FINANCIAL:
8. POSSESSIONS:
9. FAMILY:
10. HEALTH AND DISABILITY:
10 PARTICIPANTS
14 ASPIRATIONS
11 PARTICIPANTS
11 ASPIRATIONS
8 PARTICIPANTS
8 ASPIRATIONS
7 PARTICIPANTS
4 ASPIRATIONS
6 PARTICIPANTS
13 ASPIRATIONS
4 PARTICIPANTS
3 ASPIRATIONS
3 PARTICIPANTS
3 ASPIRATIONS
2 PARTICIPANTS
3 ASPIRATIONS
2 PARTICIPANTS
1 ASPIRATIONS
2 PARTICIPANTS
2 ASPIRATIONS
GROUPING OF ASPIRATIONS BY THEME
Number of participants wanting to move:
Number of Participants wanting to have a job:
Number of Participants wanting to travel:
Number of participants to marry:
10
9
8
7
Number of Participants wanting to do more/different activities: 6
4.2
THE SELF-CONCEPT, PERCEPTION OF DISABILITY AND
ASPIRATIONS OF PEOPLE WITH A MILD LEARNING
DISABILITY
RESEARCH PREVIOUSLY SUBMITTED
FOR MSC IN 1992
427
THE SELF-CONCEPT, PERCEPTION OF DISABILITY AND ASPIRATIONS
OF PEOPLE WITH MILD LEARNING DISABILITIES
CONTENTS
1. ABSTRACT
2. LITERATURE REVIEW
2.1 Theories of Self
2.2 The Self-Concept of People with Learning Disabilities
2.2.1 General Studies
2.2.2 Institutional Versus Community Living
2.2.3 Mainstreamed Versus Segregated Education
2.2.4 Self-Concept and IQ
2.2.5 Academic Achievement
2.2.6 Peer Acceptance
2.2.7 Ideal Self
2.2.8 Sex Difference
2.2.9 Learning disabled versus Non-Learning Disabled
2.3 Stigma and Attitudes Towards Disability
2.4 Aspirations and Expectations
2.5 Semantic Differential Technique
2.5.1 Administration
2.5.2 Factor Analysis
2.5.3 Reliability and Validity
2.5.4 Measurement of Self-Concept
2.6 Interviewing People with Learning Disabilities
428
3. HYPOTHESES/RATIONALE FOR PRESENT STUDY
4. METHODOLOGY
4.1 Instruments
4.1.1 Self-Concept Measure
4.1.2 Semantic Differential Teaching Scale
4.1.3 Aspiration Scale
4.1.4 Perception of/Attitudes Towards Disability
4.2 Participants
4.3 Procedure
4.3.1 Sample Selection
4.3.2 Teaching Session and Test
4.3.3 Self-Concept Measure
4.3.4 Aspiration / Expectation Scale
4.3.5 Perception of/Attitudes Towards Disability
5. RESULTS
5.1 Descriptive Statistics
5.2 Parametric Analysis
6. DISCUSSION
7. SUMMARY AND CONCLUSIONS
8. REFERENCES
429
APPENDICES
Appendix One: Bipolar Adjective scale/Semantic Differential Task
Appendix Two: Teaching Semantic Differential Tasks
Appendix Three: Perceptions ofrAttitudes Towards Disability
Appendix Four: Demographic and Background Details of Participant Sample
430
TABLES
Table One: Maslow’s Hierarchy of Needs (1954)
Table Two: Experimental Groups/Criteria for Inclusion
Table Three: Rank Order Aspirations - Mean Item Response
Table Four: Summary of Responses to Autonomy Questions
Table Five: Table of Results
431
1. ABSTRACT
Literature on theories of the self, the measurement of the self-concept and its
relevance to people with learning disabilities is discussed. The effects of
stigmatisation and devaluation are outlined.
Details of this study, investigating the perception of/attitudes towards disability of
people with mild learning disabilities and its relationship to their self-concept,
aspirations in life, expectations of being able to fulfil these aspirations, and
aspiration/expectation discrepancy are described.
22 participants with mild learning disabilities, who were attending a group to prepare
for community living at an Adult Training Centre, were involved in the study.
Participants who rejected a view of themselves as globally intellectually disabled
(Group One - Rejectors, N=13) showed significantly more negative self-concepts,
significantly higher aspirations in life and significantly greater discrepancy between
their aspirations and expectations of being able to fulfil them, than participants who
accepted a view of themselves as globally intellectually disabled (Group Two -
Acceptors, N=9). Reasons for these differences are discussed in the light of the
research literature.
This study explores the relationship between the self-concept, perception of disability
and aspirations of people with mild learning disabilities.
2. LITERATURE REVIEW
The following section reviews theoretical issues and previously documented research
related to the present study. Methodological issues are highlighted where appropriate;
• Firstly, theories of the self are discussed and differing approaches to the study
of this theoretical construct are highlighted. This section also includes a brief
discussion of the developmental stages involved in obtaining a concept of the
432
self and the relationship between the self-concept and fundamental human
needs (Maslow, 1954). Section 2.1.
The second section explores the self-concept of people with learning
disabilities, with particular emphasis on methodological problems of
measurement. Operational definitions of self-concept are discussed and
previous research is reviewed. Section 2.2
Issues relating to people with learning disabilities as a stigmatised and
devalued group are discussed in the next section. The coping mechanisms and
attitudes adopted by people with learning disabilities towards their difficulties
are highlighted. Section 2.3.
The next section briefly reviews the literature on the aspirations and
expectations of people with learning disabilities as well as illustrating the
importance of these in establishing self-concept. Section 2.4.
The fifth section details the administration, factor analysis, reliability and
validity of the semantic differential technique. Its usefulness and relevance as a
measurement of self-concept is discussed. Section 2.5.
Finally, issues to be considered when interviewing people with learning
disabilities are discussed in relation to past literature. Section 2.6.
2.1 Theories of The Self
In this section important theories of the ‘self are discussed in order to highlight the
variety and historical perspective of approaches adopted and to place the present study
within a theoretical context.
Wylie (1974) stated that in psychological discussions the word ‘self has been used in
many different ways. She stated that these uses may be conveniently grouped into
433
those which refer to the self as an agent or process and those which refer to the self as
the object of the individual’s own knowledge and evaluation. One of the most
commonly adopted approaches to the study of the self is based upon Social
Construction Theory (Mead, 1934/1964; Festinger 1954). According to this theory,
one’s self-concept is largely determined by the ways in which one is treated by
significant others. Thus, the parent-child relationship is particularly important. Mead
held the view that an individual adopts the attitudes of others toward him/herself
during the process of social experience and did not acknowledge that an individual
may be aware of his/her abilities and is able to actively evaluate personal actions.
Recently, several proponents of the social interactionalist approach have referred to
human agency (Gergen, 1987). However, they did not clarify the ways in which
agency contributes to a person’s self-concept. Mead also stated that language must be
present for the development of the self (this statement is especially relevant to the
study of the self-concept of people with learning disabilities or profound congenital
deafness). In contrast to the social interactionalist or social constructionalist view,
Markova et al. (1987) stated that it is both human agency and the ability to internalise
others’ views about the development and maintenance of one’s self-concept that are
important.
Lewis (1973) stated that self-concept consists:
“...of a whole cluster of attitudes that an individual holds about himself It is a
person’s total appraisal of his appearance, background, origins, strengths,
weaknesses, possessions, attitudes and feelings. The self-concept is considered central
to an individual's motivations and personality... ”
This statement suggests that the way in which an individual sees him/herself (self-
image) and the value that s/he places upon him/herself (self-esteem) are both a part of
the global self-concept and will be crucial in determining the goals an individual sets,
the attitudes they hold, the behaviour they imitate and the responses they make to
others.
434
The ‘self has occupied a central position in the personality theory of Carl R. Rogers
(1951). Efforts to alter the self-concept, so as to improve adjustment, have frequently
been carried out during Rogers’ client centred therapeutic interventions. Rogers
visualised each individual as the centre of a continually changing world, some of
which is experienced consciously but most of which is not. Individuals think, feel and
act in response to their environment in accordance with how they perceive it to be.
Rogers believed that a concept of self was developed during infancy. As the child
develops and has more experiences, perceptions will become organised into a
changeable yet consistent and recognisable pattern, which Rogers called the self
structure. The individual’s self-concept forms a part of this self-structure and Rogers
stated that it is usually consistent with the individual’s general mode of thinking,
feeling and acting.
Combs and Snygg (1959) further developed this idea and supported Lewis’ view of the
self-concept as representing the individual from his/her point of view, not merely a
group of isolated concepts about the person but an interrelationship or gestalt of all
these. Combs and Snygg also stated that it is a fundamental human need to preserve
and enhance the concept of self. They believed that human behaviour (including
thoughts, attitudes, values and feelings) was directed towards satisfying this need.
There were thought to be several levels or stages which made up these overall basic
needs. Maslow (1954) proposed that these needs could be arranged in a hierarchy,
ranging from the most primitive and fundamental to the most psychologically and
socially sophisticated. Table One (below) summarises Maslow’s hierarchy of needs.
435
TABLE ONE
MAST OW'S HIERARCHY OF NEEDS (1954)
LEVEL NEEDS
1 Essential biological needs (nourishment, water, air, comfort
and so on).
2 Maintenance of physical integrity of the organism to avoid and
defend the organism against physical threats and dangers.
3 The need to receive attention and love from others.
4 The need to belong; to be valued, accepted and appreciated as
a person and to possess status within a group.
5 Needs concerned with creativity, productivity and self-
expression, such as the need to perform actions that are useful
and valuable to others; the need to realise ones own potential
and to translate it into reality (the need for ‘self-
actualisation’). Actions related to needs at this level are
undertaken for their own sake and not merely to attain status,
to attract attention, or to earn a living.
Thus, one can see that the preservation of the self-concept formed a part of the highest
(level 5) need.
Several researchers have studied the development of the self-concept. Lindgren and
Fisk (1976) stated that the newborn infant does not possess a sense of self as s/he is
unable to differentiate between self and the environment. During infancy the child
satisfies level one needs via the caretakers. When level one and two needs are not
436
satisfied the child’s health will be affected as s/he may become vulnerable to
disease/injury or may fail to develop at the normal rate. However, level three needs are
also present and important during infancy. Rheingold (1956) demonstrated the
importance of the need for love and attention in an investigation of the effect of
differing levels of verbal soothing, bathing and talking to institutionalised infants.
After eight weeks the infants in the experimental group were more socially responsive
and scored higher on infant development scales than those in the control group, who
did not receive increased amounts of verbal soothing, bathing and talking. Lindgren
and Fisk (1976) stated that, although it is difficult to identify exactly when the concept
of the self image emerges in infancy;
“Sometime during the first year of life the child begins to realise that s/he is a
separate entity... ”.
Lewis (1973) stated that as the child’s self-awareness grows s/he begins to note the
reactions of others towards him/her. It is in these perceived reactions that the child’s
value of him/herself as a person begins to emerge. He also reiterated that the self-
concept is most powerfully influenced by those considered important to the child.
Initially, these will include parents or other carers; however, when the child enters
school, teachers and friends will become important. A well defined concept of self is
regarded as having been established by 10 years of age but alterations and adjustments
will be made throughout life. Studies have revealed the personality characteristics of
people considered to have positive or negative self-concepts.
Satir (1967) says that people with positive self-concepts tend to be;
Assured
Confident
Relaxed
Explorative
Adaptive
Adventurous
Innovative
Aware of their own strengths and weaknesses
437
Those with low self-regard or negative self-concepts tend to be characterised by;
• Feelings of unworthiness
• Timidity
• Conformity
• Shyness and withdrawn behaviour
• Awareness only of their own weaknesses
However, the above groups refer to the extremes of a continuum; most people will be
situated somewhere in between. Barker (1992) added that family structures which
appear to foster positive self-attitudes are democratic and structured with clear and
specific rules or limits, where the child is able to establish identification with a
competent and assured adult role model.
2.2 The Self-Concept of People with Learning Disabilities
The following section highlights research on the relevance of the self-concept to
people with learning disabilities.
Gowans and Hulbert (1983) highlighted several areas of difficulty when assessing the
self-concept of people with learning disabilities. They identified the difficulty of using
traditional assessment procedures standardised for use with the general population
with people who may lack adequate verbal and reading skills to complete the tasks.
The increased likelihood of defensive behaviour and the desire for social approval
were also highlighted as being important factors to consider. However, the authors still
considered the self-concept of people with learning disabilities to be an important area
of investigation as they stated that how an individual perceives him/herself is
fimdamental to an understanding of personality.
Schurr et al. (1970) highlighted four major areas of weakness in the literature on the
self-concept of people with learning disabilities. The first was the fact that there were
so many different instruments used to measure self-concept. As with Gowans and
Hulbert (1983) they also stated that these tests have often been standardised for use on
438
the general population only. Another major problem was the extreme flexibility and
variability between studies in the operational definitions of self-concept. All of the
above problems meant that generalisations from experiment results were difficult to
establish. Another factor was that much of the research started from the premise that
there was something inherently harmful in having a discrepancy between the attributes
an individual would prefer to have and those s/he had in reality. However, it was often
overlooked that preferred states reflected the social norms, ideals and values of the
cultural context within which the person existed and that, although aware of them,
many people did not meet such norms and ideals. Rather than simply establishing
whether a discrepancy existed between ideals and reality, a more useful measure may
have been to determine the value a person places upon an ideal contrasted with the
value placed upon his/her perceived present state.
Jahoda et al. (1988) further commented on the shortcomings of many studies of the
self-concept of people with learning disabilities. They reiterated the problem of using
tests standardised for use on the general population and stated that many provide only
a quantitative statement about the location of the self-concept of the participants with
learning disabilities on a continuum from positive to negative. They stated that since
such scores are external to the person whose self-concept is being measured they are
relatively uninformative. They do not help one to understand the internal mental
processes of people sharing the common experience of having learning disabilities, or
to understand the stigma imposed by society on people with these disabilities.
Lawrence and Winschel (1973) carried out a brief review of the various instruments
which have been used to study the self-concept of the people with learning disabilities.
The more widely used scales are:
• Laurelton Self-Attitudes Scale (Guthrie, Butler and Gorlow, 1961)
• The Way I Feel About Myself (Piers and Harris, 1964)
• Tennessee Self Concept Scale (Fitts, 1965)
• Childrens Self-Concept Scale (Lippsitt, 1958)
• Illinois Index of Self-Derogation (Goldstein, 1964)
• California Test of Personality (Snyder, Jefferson and Strauss, 1965)
• Adapted Bills Index (Bills, Vance and McLean, 1951)
439
• General Self-Concept of Ability Scale (Towne and Joiner, 1966)
• Repertory Grid Technique (Oliver, 1986)
Thus, it can be seen that there has been a huge diversity of instruments used to study
the self-concepts of people with learning disabilities and that attention should be paid
to developing a reliable, valid, assessment procedure standardised for use with this
group of individuals.
The following sections review studies carried out using the assessment procedures
detailed above. The studies have been divided into nine main areas.
2.2.1 General Studies
This section considers general studies on the self-concept of people with learning
disabilities. Two important series of studies are discussed.
Zisfein and Rosen (1974) carried out a study aimed at developing self-concept as an
objectively measurable phenomenon with clinical utility. Their operational definition
of self-concept was an individual’s perceived ability to achieve important goals. Their
study examined the relationship between four measures: a general self-evaluation
questionnaire, a measure of aspirations, a measure of risk taking and a self
comparison procedure, as well as more broadly defined indices of functioning. All the
participants were adults with mild learning disabilities attending an advanced
vocational training programme. The authors found that by using the four measures of
self-concept, people with mild learning disabilities could be meaningfully assessed.
The students designated by the authors are having particularly high or particularly low
levels of self-concept on the four scales had a high probability of being classified
consistently.
Guthrie, Butler and Gorlow (1961) conducted a series of studies of the self-concept of
people with mild learning disabilities. These studies were based on the premise that
the individual learns a set of attitudes about him/herself which are in turn reflected in
his/her behaviour and that the self-concept of an individual consists of a constellation
440
of self-attitudes. In their original study they used factor analysis to study the responses
of institutionalised women with learning disabilities to the Laurelton Self-Attitude
Scale and revealed three positive themes shown by statements such as:
• There’s nothing wrong with me
• I do as well as others
• I don’t give trouble
and four themes of failure:
• I act hatefully
• I am shy and weak
• I am useless
• Nobody likes me
Replication (Guthrie et al., 1963b) supported the findings of this study and the
researchers concluded that each group of statements represented a different
organisation of self-attitudes that should be considered when planning treatment
programmes. A further study by the same authors in 1964 identified dimensions of
both self-attitudes and ideal selves. In this experiment participants were asked to
respond to 50 pairs of pictures according to which was; ‘more like them’. Factor
analysis revealed that self-attitudes were organised around:
"... themes of popularity, acceptability to the opposite sex, compliance, friendliness
with peers; and on the negative side themes of being ignored, actively rejected,
dominated, giving but not receiving and being angry with peers... ”
An analysis of self-ideals revealed themes of:
self-confidence, popularity, receiving help, being helpful, loyal, assertive and
aware of others and avoiding involvement with peers... ”
The authors concluded that people with learning disabilities act to protect themselves
from rejection (probably because of past abuse) rather than to gain approval through
achievement.
441
These studies demonstrated that the self-concept is relevant to people with learning
disabilities and that, possibly due to their disabilities and circumstances, this client
group may possess certain clusters of self-attitudes.
2.2.2. Institutional Versus Community Living
Another area of investigation was the difference between the self-concepts of people
with learning disabilities living in institutional environments, compared to those living
in the community. Guthrie, Butler and Gorlow (1963a) carried out a study of
adolescent young women with mild learning disabilities and found that those living in
an institutional setting had significantly more negative self-attitudes than those who
attended training centres in the community. However, it was not clear to what extent
the negative self-attitudes were a precursor to, or a direct result of institutionalisation.
Guthrie et al. (1963) do state, however, that the results show that segregated
placements are not conducive to positive concepts of self and cannot be justified on
that basis, thus supporting the principles of community care.
2.2.3 Mainstreamed Versus Segregated Education
In the 1960s a popular area of study was the effect of educational placement on the
self-concept of learning disabled children and the following section illustrates that
much of the research provided conflicting results. Meyerowitz (1962) studied the self-
concepts of children of average intelligence and children with mild learning
difficulties, in segregated or mainstreamed classes. He found that the children with
learning disabilities had more negative self-concepts than the control group and that
those children who were placed in segregated classes had the poorest self-concepts of
all.
In contrast Towne and Joiner (1966) studied the effects of segregated class placement
on the self-concept of children with mild learning disabilities using the General Self
Concept of Ability Scale. They found an initial enhancement of self-concept
immediately following placement in segregated classes, this increase continued
442
towards the end of the first year of placement, at which point there was a decline in
self-concept scores.
Mayer (1966) examined the time of placement in segregated classes in relation to the
development of self-concept. It was hypothesised that early placement would result in
more positive self-concepts. Mayer used both the Piers and Harris Scale (1964) and
the Lipsitt Scale (1958) to measure self-concept. However, the hypothesis was not
supported as there were no differences between the self-concepts of children with mild
learning disabilities placed in segregated classes early or late in the academic year.
The effect of different types of segregation were studied by two researchers. Carroll
(1967) compared the effects of totally and partially segregated school programmes on
39 mildly learning disabled children who had not previously been separated from their
peers for lessons. The Illinois Index of Self-Derogation was administered at the end of
the first month of the study and again after eight months. Carroll found that after the
first month both groups had a similar spread of self-derogations (feelings of
inferiority). There was a higher reporting of hopelessness, self-rejection, and rejection
by peers in the totally segregated group.
Strang et al. (1978) carried out a similar series of studies comparing partially
segregated and mainstreamed children with mild learning disabilities to mainstreamed
children of average intelligence. The results of these studies showed that children who
were segregated for 50% of the time displayed enhanced self-concepts whilst those
who were totally mainstreamed displayed a decline in self-concept. The researchers
claimed that their results provided evidence in support of the Social Comparison and
Group Reference Theories (Festinger, 1954). These theories suggest that in the
absence of objective standards of comparison people will employ significant others in
their environment as the basis for forming estimates of self-worth. Furthermore, given
the choice of similar or dissimilar individuals, people are more likely to select similar
individuals as the comparison. Thus, learning disabled children in segregated classes
would be expected to base social comparisons on learning disabled peers in the same
classroom and there would be no reason to expect these children to display attenuated
443
self-concepts. The presence of other children without learning disabilities would
introduce another basis for social comparison and, as the non-disabled children would
possess superior academic capabilities and higher achievement levels, the self-concept
of the learning disabled child might be diminished.
Some of the disparities between the studies can be explained by the fact that different
assessment measures of self-concept were used. Towne and Joiner (1966) used a more
narrowly defined instrument which was related to curricular aspects of the school
programmes under investigation. Mayer (1966) used a general/global measure of self-
concept in his study. It was also possible that the reference group for academically
oriented self-concept in a segregated class, with its restricted range of ability, led the
individual to see him/herself in a positive light whilst at the same time the reference
group for more global, non-academically oriented aspects of the self-concept
continued to be one’s peers irrespective of the educational programme and thus no
improvement in these aspects of the self-concept would be expected as a result of
segregated class placement (Lawrence and Winschel, 1973).
2.2.4 Self-Concept and IQ
Ringness (1961) carried out a study on the relationship between self-concept and IQ.
Children with a high IQ who received education in mainstreamed classes had the most
positive self-concepts, children with mild learning disabilities receiving education
within the context of segregated classes had slightly lower levels of self-concept and
children with average IQ scores in mainstream lessons had the lowest self-concept
scores. In addition the variation in the estimates of ability and actual success was
greatest in the children with learning disabilities. Ringness concluded that these
children tended to be over confident rather than to underestimate their abilities. Knight
(1968) also found no relationship between self-concept and IQ.
However, in contrast Piers and Harris (1964) compared the responses of 88
institutionalised teenage women with learning disabilities to girls of average
intelligence in mainstream state education and found that the learning disabled
444
participants had lower self-concept scores than the other group of teenagers. There are
reservations about the validity of this study as there were other differences apart from
IQ between the subject groups which could account for the differences. Other, more
reliable, studies of both children and adults (Gorlow, Butler and Guthrie, 1963; Curtis,
1964) have also found a positive relationship between IQ and self-concept. A more
recent study was carried out by Kershner (1990) investigating self-concept and IQ as
predictors of remedial success in children with learning disabilities. In this study it
was stated that two common assumptions were that self-concept and intellectual
ability were important contributory factors to academic success. Children with
relatively high intelligence levels, who also feel good about themselves and are
confident in their ability to cope with peer relationships, family dynamics and school
demands are more likely to be successful learners. Kershner stated that for children
with learning disabilities these assumptions may not be valid. 22 children aged
between eight and 14 years with mild learning disabilities were assessed using the
Coopersmith Self-Esteem Inventory (Coopersmith, 1981), initially and again after 21
months of small group teaching focused upon teaching language and arithmetic skills.
Kershner found that IQ did not correlate with the ability to profit from the teaching
programme. However, there was a positive relationship between self-concept and
achievement levels.
As with much of the research on the self-concepts of people with learning disabilities
the studies carried out provide conflicting results. However, as a group, the studies do
support the idea that the self-concept of people with learning disabilities is a valid area
of study, even though important methodological considerations need to be addressed.
2.2.5 Academic Achievement
Snyder et al. (1965) reported a study which involved two groups of children with mild
learning disabilities. Both groups had equal IQ levels but different reading abilities.
The better readers had more positive self-concepts than those who could not read so
well and Snyder said this supported the notion of a positive relationship between self-
concept and academic achievement. In a further study Snyder (1966) replicated these
445
findings. However, neither of these studies showed whether a positive self-concept
preceded academic achievement or whether it was to some extent a consequence of
achievement.
Hardy (1967) provided some evidence that a positive self-concept is an antecedent to
achievement. The self-concepts of 56 mildly learning disabled students were assessed
and they were either assigned to a high or a low self-concept group accordingly. The
two groups did not differ in IQ or chronological age. Both groups were given paired
associates learning tasks which were scored according to the number of errors made in
mastering the list. Participants with high self-concept scores needed fewer trials and
made fewer errors in mastering the list.
2.2.6 Peer Acceptance
Howard et al. (1972) carried out a study of the relationship between self-concept and
peer acceptance using the Self-Social Symbols Task, an unpublished method which
measured group identification. The 11 children with learning disabilities involved in
this small study were also asked to give the names of three classmates in order of
preference in response to three hypothetical situation questions. The two most popular
students saw themselves as being outsiders, as these children also had the mildest
learning disabilities. Howard et al. stated that they probably did not want to be
associated with or identified as part of this segregated group. Two of the four least
popular students saw themselves as being outsiders and Howard stated that the other
two who scored highly on group identification were possibly exhibiting a proneness
toward ^wish-fulfilling thought'. The remaining seven children demonstrated a close
relationship between self-concept and peer acceptance.
2.2.7 Ideal Self
Kniss et al. (1962) used the Laurelton Self-Attitude Scale to measure the attitudes of
institutionalised, mildly learning disabled, adolescent girls. The data from this study
was factor analysed and a general factor of personal worth and physical health
446
emerged, as well as four factors representative o f‘getting along with others’. Ideal self
attitudes were found to be independent of age, IQ or length of institutionalisation. The
authors stated that:
it may well be that the lack of relationship reflects the fact that ideal self is
conceptualised rather early in life. This is congruent with the view generally held in
self theory, that ideals for the self arise early in development and are generally
resistive to change."
2.2.8 Sex Differences
Two studies indirectly examined the relationship between self-concept and sex.
Ringness (1961) found that, in general, the self-concept of girls exceeded that of boys,
the two exceptions were self-esteem in the areas of arithmetic and sport. Snyder
(1966) found a trend for adolescent girls with learning disabilities to have higher
scores on the California Test of Personality and the Laurelton Self-Attitude Scale than
their male counterparts. However, these differences were not significant.
2.2.9 Learning Disabled Versus Non-Learning Disabled
Finally, the study carried out by Meyerowitz (1962) detailed earlier found that, in
general, children with learning disabilities exhibited significantly more self
derogations than their non-learning disabled peers.
2.3 Stigma and Attitudes towards Disability
Several authors have stated that, as a result of stigmatisation, people with learning
disabilities may develop specific attitudes towards their disability which may have an
effect on their self-concepts. Goffman (1963) provided a useful definition of stigma,
he said it was the:
"'...discrepancy between one's actual and virtual identity, that is, the difference
between how one actually is and how one is expected to be..."
447
In 1989 Brandon said that:
"People with learning difficulties are amongst the most oppressed of all minorities.
They are rejected and sentimentalised over as objects of pity, mawkishness and
whimsy. There is a great danger that we [as professionals] may compound the overall
oppression aimed at their submission. The system tries to break their spirit by
enchaining both them and us. We need solidarity with them, recognising our mutual
humanity... "
There is a growing body of evidence that people with learning disabilities are aware of
their stigmatisation (Szivos and Griffiths, 1990). Barron (1989), a man who has
learning disabilities himself and who had previously lived in an institutional setting for
many years, recalled his first impressions:
“ ... The place seemed more like a prison than a ward... The attendant in change took
me through two rooms which were both locked. He had to unlock the doors then lock
them again behind... The attendant took me through to a bathroom and even that was
locked... All the windows had bars... ”
Reiss and Benson (1984) highlighted the possible effects of being labelled as learning
disabled. These are all implicated as having an effect on the development and
maintenance of the self-concept:
• Being rejected and ridiculed for making mistakes and engaging in behaviours
that are construed as ‘different’. This ridicule may be expressed by peers,
family members or by strangers.
• Segregation in institutions and programmes designed to address their needs.
Those living at home with their families may also experience segregation as
families often control the person’s access to public events in order to protect
them or to avoid embarrassment. The resulting social isolation may have an
effect on the individual’s social development, self-concept and affect.
448
• Infantilization. People with learning disabilities are often treated like children
long after they become adults. Others rarely ask their opinions and families do
not necessarily consult them on important decisions.
• A high level of social disruption and loss when they move from one residential
facility to another. Individuals in institutions may experience periodic
regroupings as well as high rates of caretaker turnover. Those living with their
family are sometimes moved from one relative’s home to another and may face
residential placement when their relatives die. The abrupt loss of significant
others, residential changes and the disruption of friendships may increase the
risk of mental health problems.
• Restricted opportunities. An important source of stress among people with
learning disabilities is the difficulty they have in finding employment. These
difficulties may lead to increased dependency upon others and to poverty, for
example.
• Victimization, which may include physical abuse, robbery or being exploited
by an employer.
Goffman (1963) said that the process of stigmatisation involves the individual initially
becoming aware of society’s disdain for its members who possess a particular
characteristic (e.g. learning disabilities) and then also recognising that s/he is
considered a member of the stigmatised group. The individual’s reaction to being
associated with a negatively perceived group is then dependent on a number of factors,
including: the family’s attitude, which directly affects how they transmit the message
of their child’s disability to the child; the visibility and severity of the disability; and
the local community’s response to the disability.
More evidence that people with learning disabilities are aware of their possible
stigmatisation is provided by Jones (1972). He found that teenagers attending a
segregated class for students with learning disabilities concealed information about
449
their placement and course work in order to avoid ridicule from mainstream students.
Flynn and Knussen (1986) presented a brief single case study of the impact of being
labelled as having learning disabilities. They reported that the client vividly conveyed
the feelings and experiences of people with mild learning disabilities when she
explained:
"I'm a mencap... the psychologist, not long ago said about my IQ [drawing a bell
shape in the air] normal people are just here, but you're below it, here... I used to
have a job in an old people's home. I was there for five years, I got ill and they found
me a place in the training centre. It's not the same as having a job."
and:
"The sister at the health centre where I go for injections said she was sorry for me
with my social life... she said it was a shame... "
However, these studies did not attempt to explain how an individual may cope with
stigmatisation, nor did they expand on the relationship between stigma and self-
concept.
In his famous series of studies, Edgerton (1967) argued that people with learning
disabilities cope with stigmatisation by denying their disability. He said that they show
a; single minded effort to pass and to deny' their disability. He found that this desire
to ‘pass’ into mainstream society was reflected in a tendency, particularly by the
women in his study, to associate primarily with non-disabled people to the exclusion
of disabled peers. However, in a follow-up study, Koegel and Edgerton (1982) found
that their sample of 45 school leavers with learning disabilities could be divided into
those who denied or avoided the topic of disability altogether (38%) and those who
willingly declared themselves to be learning disabled (60%). Koegel and Edgerton
stated that these findings were best interpreted as an indication that a significant
number of their research participants had difficulty in coping with a stigmatised
identity and not as an accurate representation of 38% of participants who truly
believed that they were not intellectually disabled in any way. They also found that
neither the age, sex or IQ of the participants was related to what they said about
450
themselves or how they were perceived by their parents, significant others or
researchers.
Gibbons (1985) stated that people with learning difficulties are aware of the stigma of
being labelled learning disabled and to some extent retain the same negative
perceptions of people so labelled. This leads to relatively unfavourable opinions of
other people with learning disabilities, or to what Gibbons terms the group concept
problem'. When the learning disabled participants in this study were shown
photographs of people labelled as either learning disabled or non-learning disabled,
they rated the photographs of learning disabled people as being less socially skilled,
less physically attractive and less desirable as dating or marriage partners than those of
people labelled as not having learning disabilities. The participants also had
pessimistic opinions of their own chances of success at social behaviour.
Gibbons went on to say that this negative reaction by people with learning disabilities
to their disabled peers provides evidence of a ^downward comparison process'. When
asked to compare themselves with a hypothetical learning disabled person along
several dimensions many will compare themselves to someone who is more severely
disabled than they are. This downward comparison process, displayed by many groups
of stigmatised or victimised individuals, is thought to help the individual accept and
feel better about his/her own situation. Goffman (1963) briefly addressed the
downward comparison process when he said that there are hierarchies of stigma in
which stigmatised individuals will derogate each other in order to maintain a
somewhat fragile sense of self-acceptance.
Jahoda (1988) carried out a small (N=12), yet important study of the attitudes of
people with mild learning disabilities towards their disability. The results showed that
all of the participants were aware of the stigma associated with their difficulties. They
knew that being regarded as disabled often resulted in being treated as someone who
did not deserve equality with non-disabled people. The participants could also be
divided into two groups according to their attitudes towards their disability. The first
group viewed themselves as essentially the same as non-disabled people and stated
451
that they had specific difficulties rather than global cognitive deficits. Jahoda said that
these people did not merely want to state that they were not globally impaired but
wanted to distance themselves from the stigma associated with disability. The second
group consisted of those people who saw themselves as essentially different from non
disabled people, hence they accepted a view of themselves as primarily disabled and
felt that they could not engage in the same activities as non-disabled people because of
their difficulties. Interestingly these attitudes were not related to the way in which the
participants were perceived by family or staff members, to their involvement in non
segregated activities or to the level of autonomy they were afforded.
The results of this study, together with those of Koegel and Edgerton (1982), cannot
be interpreted in terms of the social constructionist theory which was discussed
earlier. This would have predicted that all participants would have an internalised
view of themselves as disabled. Mead’s (1934, 1964) theory would predict that all
people with learning disabilities who had been segregated since childhood in schools,
clubs for the learning disabled and adult training centres must have a view of
themselves as essentially different from others. Edgerton’s earlier study (1967) is in
accord with this theory of self-concept development. Another important aspect of
Mead’s theory is that he stated that language is vital for the development of a self-
concept, however, this raises issues for the study of a self-concept of people with
learning disabilities as they may have delayed or disturbed language development.
Zetlin and Turner’s (1984) study also examined how people with mild learning
disabilities have adapted to being labelled. This study focused upon the attitudes of
people with mild learning disabilities towards their social identities as disabled people
and the relationship between these attitudes and other indices of personal and social
adjustment. Rather than identifying two distinct groups of attitudes, as Jahoda (1988)
and Koegel and Edgerton (1982) report, Zetlin and Turner found evidence of four
distinct attitudes based upon the participants’ willingness or reluctance to discuss their
disability; the tension and anxiety related to the acknowledgement of having
problems; the salience they assigned their disabilities in daily living and the strategies
452
they employed in order to cope with their difficulties. Zetlin and Turner’s distinct
attitudes towards the learning disabled label were:
• Acceptance of the label and its inclusion in their self-definitions.
• Qualification, which involved a rejection of the label and a use of terms which
implied less serious and more specific difficulties.
• Vacillation, or tension, anxiety or a reluctance to discuss the label.
• Denial, or a refusal to acknowledge having any disabilities at all, whether
specific or global.
Tajfel (1981) developed the Social Identity Theory which stated that a person’s
identity, self-concept and self-esteem depend at least partly on the social categories to
which that person belongs. An individual will be motivated to remain in a group
which contributes positively and distinctively to his or her identity, and to leave a
group which does not. According to Tajfel’s theory, disadvantaged group members
have two options when they cannot leave the group that is the source of their
disadvantage. They may assimilate (attempt to pass) into the mainstream group or they
may attempt to construct a positive identity based on being different. The first option
has several unpleasant psychological consequences, such as: disaffiliation from one’s
own group, guilt and derogation of others in the group or the group concept problem.
Szivos and Griffiths (1990) stated that the answer to belonging to a stigmatised group
does not lie in ignoring it or in attempting to ‘pass’ into mainstream society, but in
discovering the meaning of the stigma. They developed a Consciousness Raising
Paradigm as a development of Tajfel’s (1981) Social Identity Theory. This paradigm
parallels Tajfel’s second option of constructing a positive identity for the group.
Szivos and Griffiths stated that stigmatised groups have found it therapeutically useful
to ‘own’ the stigma, whether it be race, gender or sexual orientation. Through an
exploration of the stigma Szivos and Griffiths claimed that people with learning
disabilities will be able to develop a strong and positive group identity, thereby
eliminating the group concept problem. Other research has shown that professionals
453
working with people with learning disabilities may be, albeit inadvertently, involved
in the process of stigmatisation (Szivos, 1992).
In a review of the principle of normalization Wolfensberger (1983) said that the most
explicit and highest goal of normalization is to create, support and defend valued
social roles for people who are at risk of social devaluation. He went on to explain that
if an individual is in possession of a socially valued role then other desirable items
will be accorded to that person automatically. To be seen to fill a valued role may
protect the person from becoming devalued because of a characteristic which would
ordinarily place others in a devalued status. Apparent in these writings is an emphasis
on the image of people with learning disabilities, Szivos and Griffiths (1990) stated
that Wolfensberger’s over-concern with image may place people with learning
disabilities in a stressful situation in which they try to achieve normative
accomplishments at great personal cost.
The concern that normalization principles may actually increase an individual’s
stigmatisation was also noted by Brechin and Swain (1988). They stated that
normalization has been primarily profession led and can be interpreted in at least three
ways. The first of these is concerned with the notion of ‘normalizing’ people, or
eliminating aspects of the individual which separate him/her from the norm. They
stated that this approach is in conflict with the individual’s right to be valued
unconditionally and to have opportunities for an ordinary life. The second
interpretation is that people with learning disabilities be seen to live in ordinary
housing, go on ordinary holidays in ordinary vehicles, wear attractive clothes and
receive the same support services as non-disabled people. However, Brechin and
Swain stated that as a result of this approach the person becomes secondary to the
image. Again the individual’s rights to be who s/he wishes to be are in danger of
becoming lost in the system.
The authors also discussed a third, more positive interpretation of the normalization
principle which focuses upon providing the individual with a range of life-style
opportunities which are available to other members of the general population. This
454
interpretation highlights the commonly experienced deprivations and restrictions
placed upon people with learning disabilities and supports a view of people as
potentially autonomous, with a right to self-determination within a restrictive social
milieu.
2.4 Aspirations and Expectations
The next area of research relevant to the present study is the aspirations and
expectations of people with learning disabilities and its relationship to the self-
concept.
As early as 1890, James identified that the aspirations an individual has and his or her
ability to fulfil these aims are an important source of self-esteem. The aspirations and
expectations of people with learning disabilities have received little attention from
researchers. Although people with learning disabilities may hold culturally normative
aspirations, achieving them may present a source of anxiety. Szivos (1990) carried out
a study examining the attitudes to work and their relationship to self-esteem and
aspirations among young adults with learning disabilities. A short interview schedule
was developed by the author for the purposes of this study, focusing upon the
aspirations people with learning disabilities have in life and their expectations of
being able to fulfil them. Szivos found that all eight aspirations included in her
interview schedule were positively valued by the students involved in her study. The
two most highly valued items were; to get a job and earn a lot of money. The three
least valued items were: to get married, have children, have a boy/girlfriend not on
their course (i.e. without learning disabilities). Other aspirations were, to drive a car or
motorbike, to have a girl/boyfiiend and to live somewhere different.
These results are in contrast to Edgerton’s (1967) study which examined the life
circumstances of mildly learning disabled people living in non-institutional settings in
a city. He found that his cohort aspired to having non-learning disabled
girl/boyfriends, getting married and having children. Szivos postulated that these
differences reflected the decreasing stigma associated with receiving special
455
provision, as her sample did not have to be seen to disaffiliate themselves from their
peers in their choice of fi-iends. She stated that the difference may also be due to the
youth of her sample. Although non-significant, Szivos also found a trend for those
with high self-esteem to have high aspirations in life, in line with James’ (1890)
statements.
2.5 Semantic Differential technique
The following section discusses the semantic differential technique, which is of
importance as it has been hypothesised to be a suitable measure of the self-concept of
various groups of people.
2.5.1 Administration
The semantic differential instrument was developed by Osgood, Suci and
Tannenbaum (1957). Participants rate one or more concepts or stimuli on each of a
number of bipolar adjective scales. A concept can refer to a person or object (e.g.
Henry VIII, Scissors), can be more inclusive, or can refer to more abstract ideas (e.g.
democracy, justice). The participant pairs the stimulus word with each set of bipolar
adjectives, indicating the strength of each association by marking an appropriate
position along a seven point scale. The closer the mark is to one or other of the polar
words, the more applicable the particular objective is to the stimulus concept. A
numerical value can then be assigned to each individual response (usually one to
seven), in order that the data may be statistically analysed. The responses of a single
participant may be interpreted for clinical research or, more commonly, the response
patterns of groups of participants can be studied.
It is important to note that the semantic differential is a technique by which many
different measures can be obtained rather than being in itself a measuring device.
Warr and Knapper (1968) stated that the order of the scales presented in the semantic
differential task is unlikely to influence the way in which participants respond to those
scales. However, it is possible that previous concepts to be rated in a sequence will
456
create a framework within which later ones will be judged. Indeed Osgood et al.
(1957) stated that independence between the concepts judged on the same set of
semantic differential scales is essential. The major advantages of using the semantic
differential technique to measure self-concept are that it is a very flexible and general
instrument which is easy to administer and which has clearly established validity and
reliability. The major disadvantages are that the researcher has to decide which scales
to administer, thus, the adjectives used are supplied rather than representing personal
constructs obtained spontaneously from the participant. The choice of adjectives is
open to experimenter bias and may not be wide enough to cover the stimulus concept
adequately.
2.5.2 Factor Analysis
Factor analysis of the semantic differential instrument has yielded three major factors.
The first is the evaluative dimension which accounts for up to 75% of the extractable
variance. Examples of scales which have been shown to have a high loading on the
evaluative dimension are: good - bad, beautiful - ugly, fair - unfair and honest -
dishonest. The second factor is described as the potency factor, which typically
accounts for half as much variance as the evaluative dimension. This factor is
concerned with power and related concepts such as size and weight. Scales which
typically load highly on this dimension are: strong - weak, heavy - light, hard - soft,
and rugged - delicate. Activity is the third factor or dimension to emerge from factor
analysis and is usually of similar magnitude to the potency factor. Scales loading
highly on this dimension are: fast - slow, active - passive, tense - relaxed and excitable
- calm. Sometimes the potency and activity factors have been found to collapse into a
single dynamism factor.
These three factors were interpreted by Osgood et al. (1957) as representing basic
dimensions of ^connotative meaning' or semantic space'. The functional semantic
space will vary with the concepts being rated as all factors or dimensions of the
semantic space are not equally important or equally used by participants when
evaluating the stimulus concepts. The individual scales vary considerably in their
457
meaning and their correlation with each other from concept to concept. Thus, a single
semantic differential form cannot be devised which adequately covers the three factors
and which is applicable across a wide range of stimulus concepts. The selection of
scales to be included will vary depending upon the stimulus concept to be rated.
2.5.3 Reliability and Validity
Warr and Knapper (1968) reviewed a large number of experimental studies in addition
to their own which investigated the reliability and validity of the semantic differential
technique. They found that in all their studies the test-retest reliability of the semantic
differential seven point scale exceeded 0.94 which compared favourably with Osgood
et al.’s (1957) test-retest coefficients of 0.85 and 0.91. They also carried out studies of
internal consistency using the split-half method and measures of between forms
reliability and concluded that the reliability of the semantic differential is; usually
acceptably high with both adults and children... ”.
Warr and Knapper (1968) also reviewed a number of studies investigating the validity
of the semantic differential. They stated that the face and intrinsic validity of the
technique are high. They outlined two difficulties with measuring the predictive
validity of the scale, the first of these is that the responses to many kinds of concepts
are not expected to be predictive of future behaviour and it would not be useful to try
to validate these measures in this way. The second is that it is difficult to decide which
responses to use when making a prediction as the semantic differential is a
heterogeneous scale. Various possibilities exist, one could;
• Summate the response to all the scales
• Use only specified dimensions
• Select a number of apparently relevant scales
It is important to note that as the semantic differential is a technique rather than an
instrument which takes only one form. Any study of validity only allows us to
comment upon one form of the technique and will not apply to other forms not used.
Osgood and his colleagues stated that the evaluative dimension of the semantic
458
differential can be used on its own as a measure of attitudes and, since self-concept
can be described as a series of attitudes towards oneself, the evaluative dimension of
the semantic differential is an appropriate method of studying self-concept. Several
studies have examined the concurrent validity of the semantic differential evaluative
dimension to other measures of attitude. Osgood et al. (1957) showed a high level of
concurrent validity in comparison with the Thurstone and Guttman Scale and the
Bogardus Social Distance Scale. Warr and Knapper (1968) demonstrated a strong
association (rank order correlation, rho=0.82) between measures derived from a
semantic differential task and the Adjective Checklist (Gough and Heilbrun, 1965).
They concluded that:
“... there is no doubt that responses to evaluative scales [o f the semantic differential]
provide a valid measure of at least part of an attitudinal complex."
2.5.4 Measurement of Self-Concept
Thompson (1988) devised a semantic differential task to measure the self-concept of
hospitalised psychiatric patients and whether they identified themselves as more like a
typical psychiatric patient or a typical community member. He used 20 bipolar
adjectives from Osgood et al. (1957) and found that of these, 11 discriminated
between psychiatrically identified and community identified patients. These were:
Clear-headed / Confused
Independent / Dependent
Self-reliant / Dependent on others
Relaxed / Tense
Outgoing / Shy
Free / Trapped
Content / Uneasy
Peaceful / Irritable
Accepted / Rejected
Confident / Uncertain
Open with others / Withholding
459
Taylor and Perkins (1991) used the same scale to operationalise and measure the
responses to chronic psychiatric illness of denial or adoption of a sick role and to
identify their correlates and relationship to self-concept.
Burke and Tully (1977) outlined a procedure using the semantic differential technique
to measure the components of the self-concept termed gender role/identities in
adolescent school children. Again the evaluative dimension of the technique was used.
Oles (1973) carried out a study which is especially relevant to the present research. A
five point semantic differential attitude scale was administered to 238 eight to 11 year
olds in an individualised instruction programme. The participants were taught to use
the scales prior to the study and two scales were included in the test to identify
children who were inserting random answers or did not understand how to use the
scales. No children were excluded from the study as they were all found to be using
the scales from the study appropriately. Each point on the Likert scale was verbally
labelled ‘very, sort of, neither, sort of, very’ and nine concepts were rated by the
children concerning various aspects of school lessons as well as a rating of self-
concept (T am’).
2.6 Interviewing People with Learning Disabilities
As the present study employed an interview procedure, the following section
summarises the main issues to be considered when interviewing people with learning
disabilities.
Interviews require a respondent to possess a degree of verbal fluency and the ability to
comment upon his/her own personal circumstances, skills which people with learning
disabilities may not have. Many people with learning disabilities have additional
speech and language disabilities and the extent of speech and language delay or
disability is frequently related to the degree of learning disability (Grossman, 1983). A
few studies have been carried out examining interview techniques and questioning
460
styles with people with predominantly mild learning disabilities. The following
section will review some of these.
Sigelman et al. (1986) drew attention to the fact that, although both researchers and
clinicians in the field of learning disabilities often seek information directly from their
clients via formal and informal interviewing, testing and scientific study, very little
attention has been paid to the methodological issues involved in doing so. Research
among members of the non-disabled population has shown that several specific forms
of response bias threaten the validity of answers given during the process of interview.
Furthermore these are more commonly encountered when interviewing children or
less educated adults, suggesting that the same problems may be acute amongst people
with learning difficulties. One of the most frequently encountered and most important
response biases is acquiescence, or the tendency to respond affirmatively regardless of
content (Rothenberg, 1969). Schuman and Presser (1979) stated that the types of
responses less educated adults give in interview situations depend upon how the
questions are structured. The reasons for employing open rather than closed questions
include:
To discover the responses that individuals give spontaneously
To avoid bias that may result from suggesting responses to individuals
Closed questions which are constructed in an a priori way may fail to provide
an appropriate set of alternatives which are meaningful to the respondents
Respondents may be influenced by the specific closed questions given, and a
more valid picture of the respondent’s choice is obtained if they must provide
an answer themselves
Open questions measure aspects most salient to the individual, avoid social
desirability effect to a greater degree and prevent mechanical choice or
guessing
461
Sigelman et al. (1980) described the findings of a study of the feasibility and utility of
survey research with people with learning disabilities. They focused upon interview
performance as a fimction of IQ, finding that people with milder learning disabilities
were generally more responsive, able to answer questions more often in agreement
with non-learning disabled informants and were less likely to acquiesce in response to
‘yes-no’ questions than were people with more severe learning disabilities. In a
follow-up study, Sigelman et al. (1981) reported negative associations between IQ and
several response biases and large discrepancies between responses as a fimction of
alterations in question wording and structure. This study stated that when factual
information is being sought from learning disabled participants, verbal and pictorial
multiple choice questions increased the participants’ responsiveness without lowering
agreement with non-disabled informants and without generating systematic response
bias. However, the researchers stated that this method would probably not be
appropriate if the information being sought is of a less factual nature. In this instance
open-ended questions may be more appropriate, although care must be taken to ensure
that the learning disabled respondents can answer the questions. A closed question
format increased systematic response bias in the form of acquiescence leading to
serious concerns about the validity of the answers.
Ballinger (1973) used an open-ended question format to study the opinions of people
with learning disabilities in hospital about their environment and care. He found that
the intellectual and social experience of the patients should be taken into account
when assessing the results of his study.
This section has reviewed the literature on the theories of the self, the self-concepts of
people with learning disabilities, stigma and attitudes towards disability,
aspirations/expectations, and interview techniques in order to place the present
research within a theoretical context in the light of previous research.
462
3. HYPOTHESES / RATIONALE FOR PRESENT STUDY
Following previous research findings on the self-concept and hypothesised
relationships between the self-concept, aspirations/expectations and stigmatisation, it
was proposed that the present research should empirically investigate the relationship
between these four factors.
Based on past research it was hypothesised that:
• The concept of self is relevant to people with mild learning disabilities (Zisfein
and Rosen, 1974; Guthrie, Butler and Gorlow, 1961 and Gowans and Hulbert,
1983).
• The evaluative dimension of the semantic differential is a suitable method of
measuring the self-concept (Thompson, 1988; Taylor and Perkins, 1991; Burke
and Tully, 1977). Although it does not appear that this technique has been used
to study the self-concept patterns of people with learning disabilities, studies
with children suggest that the method of presentation will have to be simplified
in order for the participants to be able to use the scale effectively (Oles, 1973).
• As members of the a stigmatised group (Brandon, 1989), who are aware of
their status as devalued members of society (Szivos and Griffiths, 1990; Jones,
1972; Edgerton, 1967) the people with learning disabilities involved in the
study will attempt to cope with their membership of a stigmatised group by
either denying their disability and refusing to accept that they have global or
specific cognitive deficits; or by accepting the label of having learning
disabilities and the attributes which accompany it (Koegel and Edgerton, 1982;
and Jahoda, 1983).
• There will be differences in the self-concepts of those people with learning
disabilities who reject the label and those who accept it (Jahoda, 1988; Szivos
and Griffiths, 1990). Research carried out by Lewis (1973) provides the
experimental basis for this hypothesis as he stated that the way an individual

463
sees him/herself and the value they place upon him/herself is crucial in
determining the goals an individual sets, the attitudes they hold, the behaviour
they imitate and the responses they make towards others.
• The aspirations and expectations of the participants will be related to their self-
concept and to their attitudes towards their disability (James, 1890; Szivos,
1990; Zisfein and Rosen, 1974).
As a result of the literature review the operational definition of self-concept adopted
by the researcher for the purposes of this study was the self-concept as a collection of
evaluated beliefs or organised set of attitudes a person holds about him/herself. It is
not a unitary concept and consists of three components:
• The cognised self or the self as known to the individual
• The self as others perceive and believe him/her to be
• The ideal self or the self as the individual would like to be
The focus of the present research was primarily upon the first and third components of
the self-concept. Also, each cluster of attitudes or beliefs can be further divided into
four components:
• A belief or knowledge
• An affective or emotional component
• An evaluation
• A predisposition to respond
4. METHODOLOGY
4.1 Instruments
4.1.1 Self-Concept Measure
A semantic differential task was used to measure self-concept. The concept to be rated
was T AM’ along 25 bipolar adjective dimensions. All the bipolar adjective scales.
464
selected from previous studies, had been demonstrated as being relevant to the study
of self-concept and as discriminating between participants with different patterns of
self-concepts (Osgood, Suci and Tannenbaum, 1957; Oles, 1973; Hardstaffe, 1973;
Lipsitt, 1958). Appendix One provides a summary of the 25 bipolar scales rated,
together with a note of the authors who previously used the adjectives in their research
on the self-concept. Following the results of a study carried out by Oles (1973), and to
avoid distraction, it was decided that each bipolar adjective scale should be presented
on a separate page, the target concept to be rated (T AM’) written at the top of each
page and only a five point likert scale used, rather than the traditional seven point
scale. Rather than using a broken line to represent the bipolar dimension, five boxes
were used to illustrate the five points on the scale.
The scoring was as follows: a neutral composite self-concept score = 75. Any score
higher than 75 represented a negative self-concept, the higher the score the more
negatively the participant had rated themselves. A score below 75 represented a
positive self-concept, the lower the score the more positive the rating.
4.1.2 Semantic Differential Teaching Scale
A scale based upon a method used by Oles (1973) was developed to teach the
participants how to use the semantic differential instrument. It consisted of three
stimuli concepts to be rated:
• Going to the cinema is
• I am
• Doing the washing up is
Three bipolar adjective five point scales were used and verbal modifiers labelled each
of the five points along the continuum (i.e. very, sort of, neither, sort of, very). Two
test items were also included to identify participants who did not understand how to
use the semantic differential scale, or who were inserting random answers. The first
item should be rated negatively and the second positively, in order to demonstrate
465
accurate use of the scale. Appendix Two provides a summary of the teaching and test
semantic differential tasks used in the study.
4.1.3. Aspiration Scale
The series of questions comprising the assessment of the participants’ aspirations in
life and expectations of being able to achieve these aspirations was taken from Szivos
(1990). Eight items were included in the Aspiration/Expectation Scales:
• Get a job
• Earn a lot of money
• Drive a car or motorbike
• Have a girlfriend/boyfriend
• Live somewhere different
• Get married
• Have children
• Have a girlfriend/boyfriend ‘outside’ (i.e. not on their course)
4.1.4 Perception Of /Attitudes Towards disability
A semi-structured interview format was used to assess each participant’s attitudes
towards his/her disability and to assess coping styles. The interview format was based
upon the interview used by Jahoda et al. (1988), to explore the participants’ views on
the topics of stigma and disability, and to establish facts about their social lives and
autonomy. The interview addressed the participants’ feelings about attending the adult
training centre and their lives outside the centre. The areas covered during the
interview were:
• Social life
• Autonomy
• Disability
• Stigma
Appendix Three provides a summary of the specific areas of questioning covered.
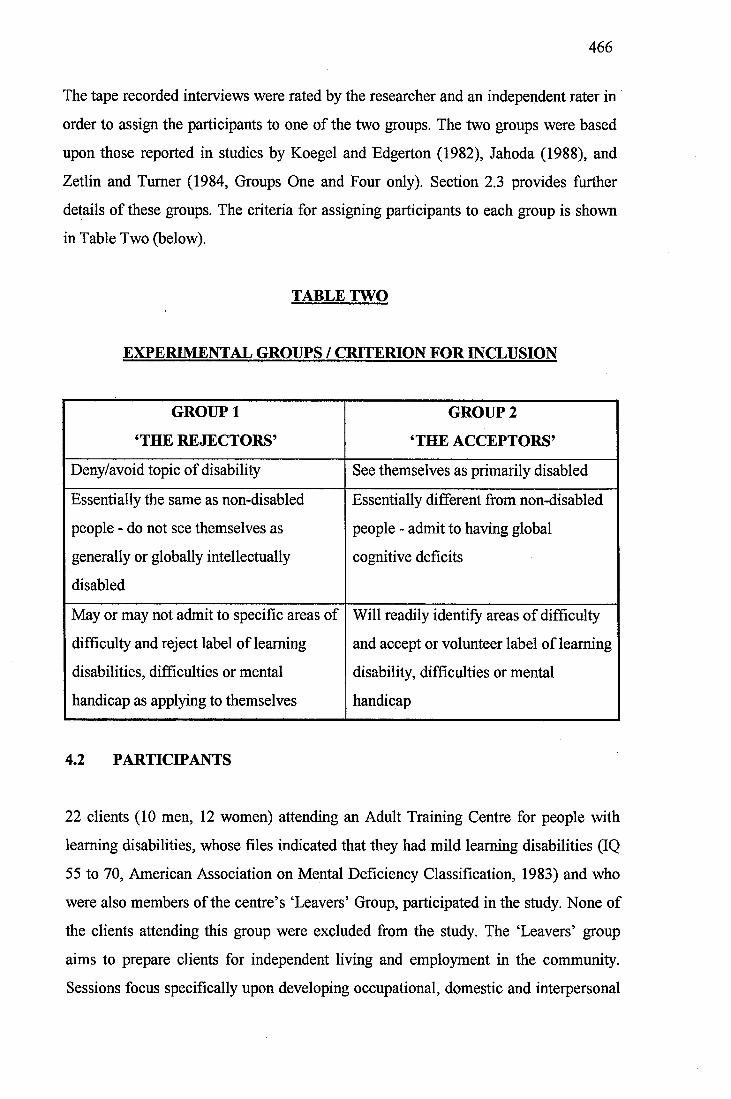
466
The tape recorded interviews were rated by the researcher and an independent rater in
order to assign the participants to one of the two groups. The two groups were based
upon those reported in studies by Koegel and Edgerton (1982), Jahoda (1988), and
Zetlin and Turner (1984, Groups One and Four only). Section 2.3 provides further
details of these groups. The criteria for assigning participants to each group is shown
in Table Two (below).
TABLE TWO
EXPERIMENTAL GROUPS / CRITERION FOR INCLUSION
GROUP 1
‘THE REJECTORS’
GROUP2
THE ACCEPTORS’
Deny/avoid topic of disability See themselves as primarily disabled
Essentially the same as non-disabled
people - do not see themselves as
generally or globally intellectually
disabled
Essentially different from non-disabled
people - admit to having global
cognitive deficits
May or may not admit to specific areas of
difficulty and reject label of learning
disabilities, difficulties or mental
handicap as applying to themselves
Will readily identify areas of difficulty
and accept or volunteer label of learning
disability, difficulties or mental
handicap
4.2 PARTICIPANTS
22 clients (10 men, 12 women) attending an Adult Training Centre for people with
learning disabilities, whose files indicated that they had mild learning disabilities (IQ
55 to 70, American Association on Mental Deficiency Classification, 1983) and who
were also members of the centre’s ‘Leavers’ Group, participated in the study. None of
the clients attending this group were excluded from the study. The ‘Leavers’ group
aims to prepare clients for independent living and employment in the community.
Sessions focus specifically upon developing occupational, domestic and interpersonal
467
skills. The participants were aged 24;05 to 53;04 years (mean 36;05 years, standard
deviation 9;07 years) and did not have behavioural or emotional difficulties.
Unfortunately, it was not possible to carry out intellectual assessments prior to
inclusion in the experimental group. They were considered by their tutor group leader
and the manager of the centre as having the potential to live independently in the
community with limited staff support; that is, they had the skills or potential to live in
a setting where they would be required to shop, cook and look after a house. All
participants already lived in community facilities (group homes, family homes, hostels
and a council flat). All were able to travel to and from the centre on public transport.
Thus, they represented a relatively homogenous group. Appendix Four provides
information on the participants’ demographic and background details.
4.3 Procedure
4.3.1 Sample Selection
23 people identified by the tutor group leader as suitable to be involved in the present
study were approached, initially by letter asking whether they would be interested in
speaking to the researcher confidentially about the study in more detail. All the people
approached agreed to speak to the researcher. The 23 potential participants were then
interviewed by the researcher individually at the adult training centre in order to
discuss further details of the study. Frequent checking was carried out during the
meeting to ensure that the clients understood the information being given. It was
stressed that if at any time they wished to leave they were free to do so. The measures
and small tape recorder to be used in the study were shown to the participants at this
point. At the end of the meeting (approximately 20 minutes) each person was asked
whether they would like to participate in the study or whether they would prefer more
time to consider. All but one person immediately said that they would like to
participate in the study. The man who did not wish to participate was thanked for
meeting the researcher and was not contacted further. The 22 participants who had
agreed to take part all signed a consent form, which was read aloud to them. They
468
took a letter for their relatives/carers explaining the project and urging them to contact
the researcher should they have any questions or concerns regarding the project. Each
participant was given a copy of the consent form which contained details of the
project to keep. It was also verbally reiterated at this point that, if at any time the
participants decided that they wished to withdraw from the study, they were free to do
so. This was also written on the consent form given to each participant and signed by
the researcher.
Following this initial meeting the researcher waited one week before commencing the
administration of the test instruments to the participants in order to allow
relatives/carers sufficient time to highlight any concerns they had. None of the
relatives/carers contacted raised any objections, although several did contact the
researcher to state that they were happy for their relative to participate in the study.
4.3.2 Teaching Session and Test
A standardised teaching session was developed for the purposes of this study, using
the instruments outlined in Section 4.1.2 and Appendix Two. Each participant was
taught how to use the semantic differential scales individually during a 60 minute
teaching session. The researcher encouraged each participant to read the stimuli
concepts and the bipolar adjectives in order to check they understood them. The points
on each adjective scale were verbally labelled (very, sort of, neither, sort of, very).
Each participant was given an example of how others with differing attitudes towards
the stimulus concept would complete the task, and was then asked to fill in the box
which corresponded to how they felt about the target concept. Teaching focused upon
helping the participants to use all five boxes, rather than the two boxes nearest to the
bipolar adjectives.
All participants quickly learned how to use the scale and were able to use all five
boxes. At the end of the teaching session, each participant completed the two test
items (Section 4.1.2 and Appendix Two). Again the researcher requested the
participant to read the stimuli concepts and the bipolar adjectives aloud. This time
469
verbal labels for the five points on the scale were not given. As a result of this test
none of the participants were excluded from the study, they all rated the first test item
negatively and the second item positively. Thus, they demonstrated that they
understood the task and were able to use the semantic differential scales accurately.
This was in accord with the results of Oles (1973).
4.3.3. Self Concept Measure
The semantic differential self-concept scale was administered by the researcher to
each of the participants individually, the same day as the teaching session in order to
ensure that they had not forgotten how to carry out the task. The booklet containing
the adjective pairs to be rated was presented to the participant who was asked to write
his/her name on the front cover. A standardised method of presentation was used.
Each participant was first reassured that there were no right or wrong answers, but that
the researcher was just interested in how they felt about the items in the booklet. They
were then requested to read the stimulus concept printed at the top of each page (T
am’), as well as the bipolar adjectives at either end of the rating scale. All participants
were able to correctly read the words. The researcher then checked that the participant
understood the meaning of the words s/he had read. If the participant reported that s/he
did not understand the words, a brief explanation of the meaning was given. The
meaning of each adjective was derived from Collins Concise Dictionary and
Thesaurus (e.g. timid means easily frightened or afraid and nervous). In fact further
explanation of the adjectives was rarely necessary as all the participants involved in
the study appeared to have a high level reading ability and comprehension levels. The
participant was then requested to fill in the appropriate box. This procedure was
repeated for all 25 items and the session lasted 40-45 minutes. All participants
successfully completed the task.
Following the session the participants were thanked and given a date and a time for
the semi-structured interview.
470
A numerical value of one to five was assigned to each of the 25 self-concept items
(one = extreme positive and five = extreme negative), a numerical score for each
participant on each item could be obtained as well as an overall numerical self-
concept score (the sum of the score on each of the 25 items). The higher the
participant’s composite score the more negative had been his/her attitudes towards
him/herself (self-concept).
4.3.4 Aspiration/Expectation Scale
This scale (see Section 4.1.3) was administered prior to the semi-structured interview.
A standardised format was used to administer the scale and for each item on the scale
participants were asked:
‘Would you like t o (item one to eight)?’
In order to give an aspiration score their responses were scored:
3 - would like to
2 - don’t know/don’t mind
1 - would not like to
The participants were then asked to respond to the question:
‘Do you think you will be able t o ................ (item one to eight)?’
In order to give an expectation score their responses were scored:
3 - will be able to
2 - don’t know
1 - will not be able to
An Aspiration - Expectation Score was calculated for each participant by subtracting
their total expectation score from their total Aspiration Score (TOT A - TOT E).
471
All participants readily answered the 16 questions included in this scale.
4.3.5 Perception of/Attitudes Towards Disability
A semi-structured format was used in order to ask each participant individually about
their attitudes towards disability, and their personal experiences. The interview formed
the final section of the experimental procedure. As the researcher asked each
participant personal and potentially emotionally laden questions about their lives,
disabilities and personal experiences of stigma, it was felt important for the
participants to have met the researcher on several occasions prior to the interview in
order to build up a sense of trust and to present the questions in as non-threatening a
framework as possible. The areas covered in the interview are summarised in
Appendix Three and are discussed in Section 4.1.4. Confidentiality was stressed at the
beginning of the interview and permission to use the tape recorder was again obtained
from each participant. The interview lasted approximately 30 minutes and frequent
checking was carried out with all participants to ascertain whether they were happy to
continue with the interview. In fact all of the participants were willing to answer the
questions and spoke freely about many of the issues, none of the sample became
overtly distressed or asked to terminate the session. The researcher was guided
throughout the interview by a list of areas to be covered. Information about the
participants’ social lives and autonomy were obtained first by a direct line of
questioning and the topics of disability and stigma were approached indirectly. Unlike
Jahoda (1988) the researcher was prepared to use labels (learning disability, learning
difficulties, mental handicap) during the session if all other areas of questioning failed
to raise the topics of disability and stigma spontaneously. It was not necessary to carry
out this policy as at least one line of questioning revealed the participants’ attitudes
towards learning disabilities and the stigma associated with them. The labels used by
the participants themselves were then adopted by the interviewer during the session.
Following the interview the participant was thanked for participating in the study.
472
5. RESULTS
Upon completion of data collection and assignment of participants to one of two
groups the data, which did not show obviously non-normal distribution, were analysed
using the T-Test procedure. This is a parametric statistical analysis designed to
compare the means of two different groups. As a prediction about the direction of
differences in the scores of the two groups on the measures of Self-Concept,
Aspirations, Expectations, Aspiration-Expectation Discrepancy was not being made
the Two-Tailed Independent Samples T-Test was used.
All 22 participants had insight into their situation as potentially stigmatised
individuals. They knew that to be regarded as having learning disabilities often
resulted in being treated ‘differently’ or as someone who did not deserve equality with
non-disabled people. Nine participants reported periods of unhappiness at school, and
19 reported that they had experienced teasing, bullying and abusive treatment from
other non-learning disabled children. These incidents involved:
• Physical assaults
Including: being kicked, hit, tripped over, having ones hair pulled
• Name calling
• Neglect/being ignored
Including: not being allowed to join in with games, excluded from ‘gangs’, and
not being spoken to
All participants reported incidents which demonstrated that, to a greater or lesser
extent, they still had to contend with abuse, rejection or simply being ignored by
children or adults. These incidents primarily consisted of name-calling by school
children and teenagers and people giggling, ignoring or staring at them in shops and
on public transport. 10 (i.e. all but two) of the participants who still lived at home with
their families experienced restrictions which did not apply to their non-disabled
siblings or peers. Examples of these restrictions were:
• Not being allowed or asked to help around the house, to cook snacks or to use
hot water
473
• Not being allowed to shop unaccompanied or to select clothes to purchase
without assistance.
• Having to go to bed earlier than other people in the house or having a set
bedtime each night
• Not being able to go out at night unless to organised activities
• Not having a private bank account or managing financial affairs
• Not being able to ride a bicycle when young
• Not selecting which clothes to wear each morning
15 were aware of the stigma attached to day services for people with learning
disabilities and the fact that some members of the general public tended to negatively
stereotype individuals attending the training centre.
5.1 Descriptive Statistics
13 participants were assigned to Group One (Rejectors) and nine participants were
assigned to Group Two (Acceptors).
There were no significant age or sex differences between Group One and Group Two.
The mean Self-Concept Score, independent of group assignment, was 77.80 (SD =
21.04, range 42 -107). Possible scores obtainable 25 -125.
The mean composite Aspiration Score, independent of group assignment, was 18 (SD
= 4.32, range 8 - 24). All the aspiration items included in the scale were positively
valued by the participants, with mean responses, independent of groups, ranging from
2.82 to 1.54. The item receiving the highest rating was: to earn a lot of money (mean
2.82), followed by: to get a job (mean 2.73). The two least highly rated aspirations
were: to drive a car/motorbike (mean 1.82) and to have children (mean 1.54). Table
Three (below) provides a summary of this data together with the ratings by group.
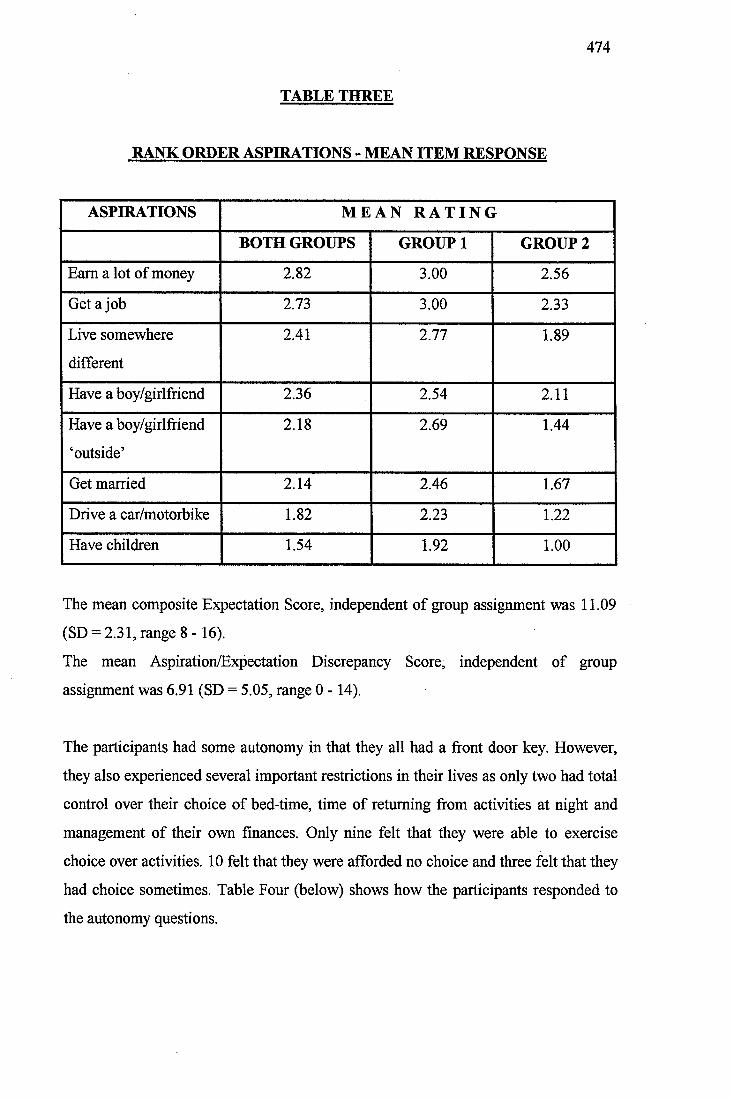
474
TABLE THREE
RANK ORDER ASPHIATIONS - MEAN ITEM RESPONSE
ASPIRATIONS M E A N R A T I N G
BOTH GROUPS GROUP 1 GROUP2
Earn a lot of money 2.82 3.00 2.56
Get a job 2.73 3.00 2.33
Live somewhere
different
2.41 2.77 1.89
Have a boy/girlfriend 2.36 2.54 2.11
Have a boy/girlfriend
‘outside’
2.18 2.69 1.44
Get married 2.14 2.46 1.67
Drive a car/motorbike 1.82 2.23 1.22
Have children 1.54 1.92 1.00
The mean composite Expectation Score, independent of group assignment was 11.09
(SD = 2.31, range 8 -16).
The mean Aspiration/Expectation Discrepancy Score, independent of group
assignment was 6.91 (SD = 5.05, range 0 -14).
The participants had some autonomy in that they all had a front door key. However,
they also experienced several important restrictions in their lives as only two had total
control over their choice of bed-time, time of returning from activities at night and
management of their own finances. Only nine felt that they were able to exercise
choice over activities. 10 felt that they were afforded no choice and three felt that they
had choice sometimes. Table Four (below) shows how the participants responded to
the autonomy questions.
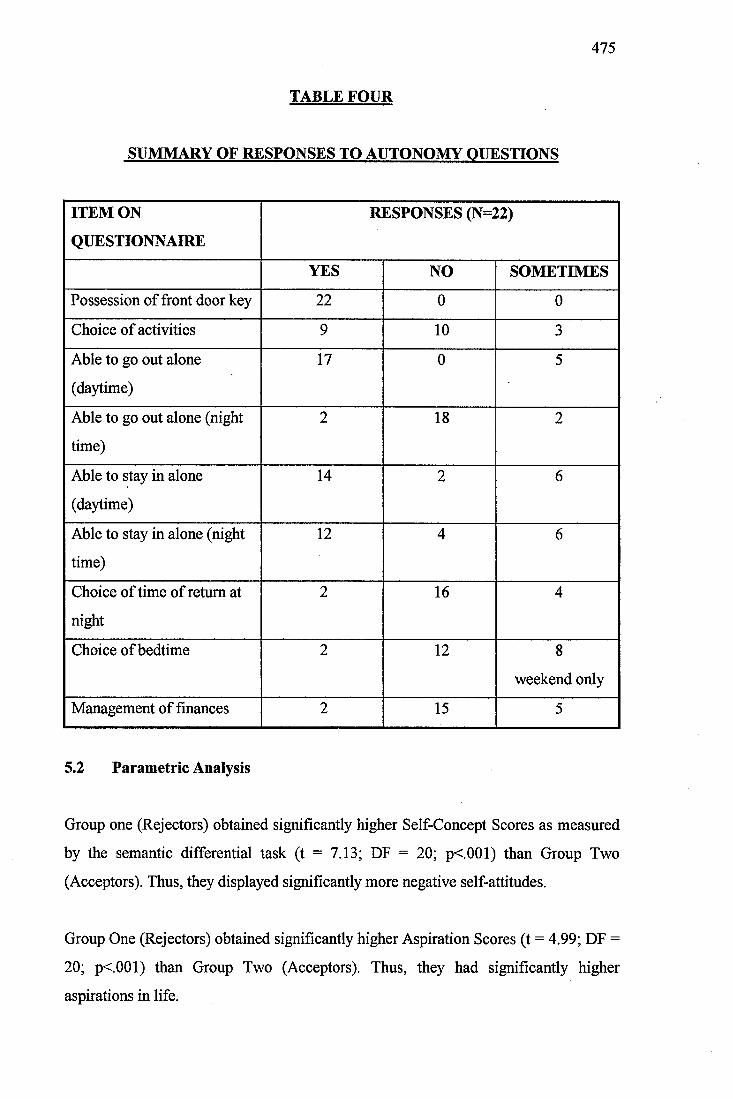
475
TABLE FOUR
SUMMARY OF RESPONSES TO AUTONOMY OUESTIONS
ITEM ON
QUESTIONNAIRE
RESPONSES (N=22)
YES NO SOMETIMES
Possession of front door key 22 0 0
Choice of activities 9 10 3
Able to go out alone
(daytime)
17 0 5
Able to go out alone (night
time)
2 18 2
Able to stay in alone
(daytime)
14 2 6
Able to stay in alone (night
time)
12 4 6
Choice of time of return at
night
2 16 4
Choice of bedtime 2 12 8
weekend only
Management of finances 2 15 5
5.2 Parametric Analysis
Group one (Rejectors) obtained significantly higher Self-Concept Scores as measured
by the semantic differential task (t = 7.13; DF = 20; p<.001) than Group Two
(Acceptors). Thus, they displayed significantly more negative self-attitudes.
Group One (Rejectors) obtained significantly higher Aspiration Scores (t = 4.99; DF =
20; p<.001) than Group Two (Acceptors). Thus, they had significantly higher
aspirations in life.
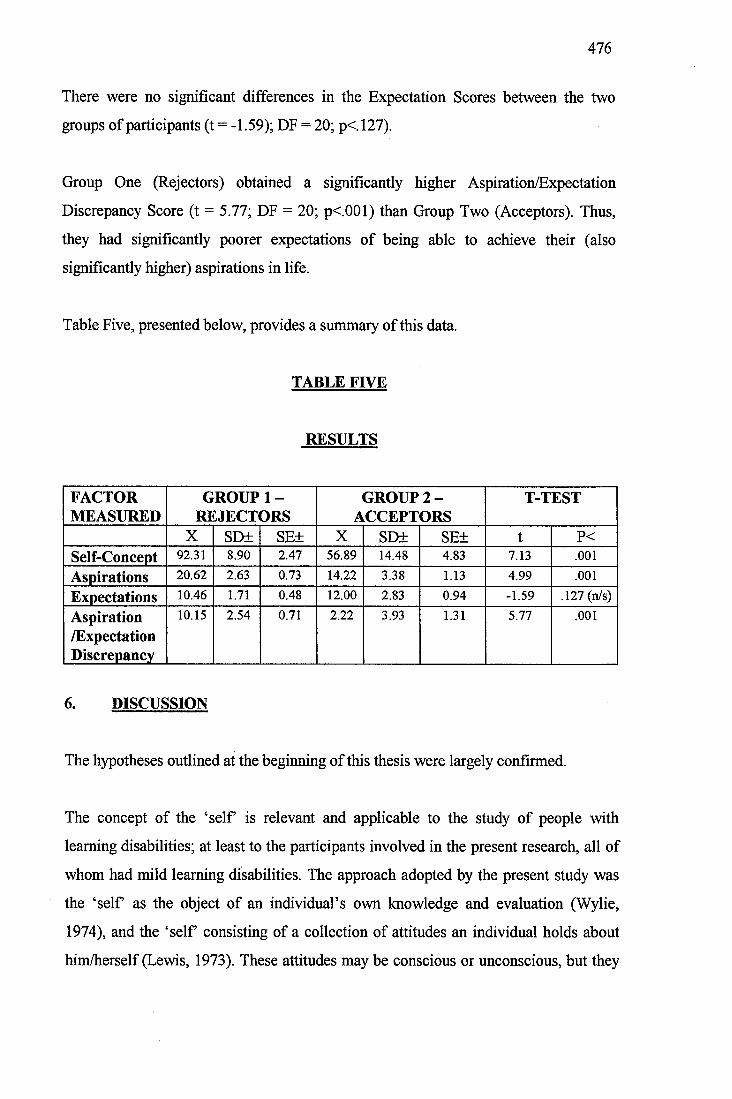
476
There were no significant differences in the Expectation Scores between the two
groups of participants (t = -1.59); DF = 20; p<. 127).
Group One (Rejectors) obtained a significantly higher Aspiration/Expectation
Discrepancy Score (t = 5.77; DF = 20; p<.001) than Group Two (Acceptors). Thus,
they had significantly poorer expectations of being able to achieve their (also
significantly higher) aspirations in life.
Table Five, presented below, provides a summary of this data.
TABLE FIVE
RESULTS
FACTORMEASURED
GROUPREJECT!
1 -DRS
GROUP 2 - ACCEFTORS
T-TEST
X SD± SE± X SD± SE± t P <Self-Concept 92.31 8.90 2.47 56.89 14.48 4.83 7.13 .001
Aspirations 20.62 2.63 0.73 14.22 3.38 1.13 4.99 .001
Expectations 10.46 1.71 0.48 12.00 2.83 0.94 -1.59 .127 (n/s)
Aspiration/ExpectationDiscrepancy
10.15 2.54 0.71 2.22 3.93 1.31 5.77 .001
6. DISCUSSION
The hypotheses outlined at the beginning of this thesis were largely confirmed.
The concept of the ‘self is relevant and applicable to the study of people with
learning disabilities; at least to the participants involved in the present research, all of
whom had mild learning disabilities. The approach adopted by the present study was
the ‘self as the object of an individual’s own knowledge and evaluation (Wylie,
1974), and the ‘self consisting of a collection of attitudes an individual holds about
him/herself (Lewis, 1973). These attitudes may be conscious or unconscious, but they
477
are open to evaluation and hence to consciousness if necessary (Combs and Snygg,
1959).
The participants involved did not all have negative self-concepts and thus, the present
study does not support the Social Construction Theory (Mead, 1934,1964; Festinger,
1954). This theory would predict that all people with learning disabilities would have
overwhelmingly negative views of themselves as they all possess the common
attribute of belonging to a group which is stigmatised and devalued by society.
According to this theory, these negative societal attitudes would have resulted in
people with learning disabilities adopting and internalising similar views. However,
one possible argument against rejection of the Social Construction Theory on the basis
of these results is that the attitudes of significant others in the lives of those with
learning disabilities (e.g. parents/carers, siblings, teachers and fi-iends) are not
necessarily negative and devaluing and may protect against the attitudes of society as a
whole.
The evaluative dimension of the semantic differential technique (Osgood et al., 1957)
together with bipolar adjectives selected from previous research and adapted for use
with people with learning disabilities was found to be a suitable method of assessing
the self-concept of participants involved in the present study. The teaching session
carried out prior to the administration of the Self-Concept Scale was sufficient and
effective in enabling the participants to accurately use the scales. Teaching
specifically focused upon the middle three boxes on the bipolar scale and participants
were subsequently able to use all five boxes during the self-concept task. However,
methodological issues and reservations still exist. The researcher had little to support
the view that the self-report provided by the participants was an accurate
representation of their actual self-concepts. This issue exists whenever self-report
measures are used and is not unique to the present study.
The fact that all the participants rapidly and successfully completed the test items
prior to self-concept assessment and that they were able to ask for definitions of
478
adjectives where necessary (a facility they made use of), does reduce these
methodological concerns to some extent.
Another disadvantage of using the semantic differential technique is that the
researcher decides which scale to administer, or which adjectives to include. Rather
than representing personal constructs obtained spontaneously from the participants,
the range of possible answers are supplied. The researcher may not include all the
adjectives related to the concept being evaluated and so the semantic differential is
open to experimenter bias. However, since all adjectives used in this study were
obtained from previous studies of the self-concept of various groups of people and the
number of bipolar scales used was considerably larger than in previous studies, it can
be assumed fairly confidently that the adjectives selected represented a relevant and
broad evaluation of the self-concept.
The sample of participants involved in the present study was not representative of the
general population of learning disabled people and a semantic differential would
probably only be considered appropriate to use with the most able members of this
group. Although the mildly learning disabled participants involved in the present study
appeared to be able to effectively rate themselves along the 25 dimensions, using all
five points on the scale, the task required of them was essentially very complex and
many people with more severe learning disabilities would not be able to effectively
rate themselves using the present format of the scale. The degree of reading and
comprehension abilities needed to carry out the task were considerable.
Problems people with learning disabilities may have reading and comprehending the
adjectives used in the study were resolved by reading them for the participants and by
providing meanings where appropriate. However, this would only be effective with
more able participants. Also, the group of participants involved in the present study
were sophisticated in their ability to rate the concept T am...’. Many people with
learning disabilities would not possess, or be used to applying, the degree of insight
required to successfully complete the rating task.
479
One explanation for the high level of personal insight and ease with which the
participants were able to complete the self-concept task could be that they were all
involved in day to day activities which required them to examine their individual
strengths and areas of difficulty and to explore ways of addressing or overcoming
these needs. They were all involved, or had previously been involved in discussion
groups concerning disability issues, women’s issues and men’s issues, and did not
appear to find the interview carried out within the context of the present research
intimidating or threatening.
Another methodological issue or area for concern was that, to the researcher’s
knowledge the semantic differential technique had not previously been used to explore
the responses of people with learning disabilities to stimulus concepts or to examine
their self-concept. As mentioned earlier, this technique had been used to investigate
the attitudes/evaluations of members of the general population, people with mental
health needs (Thompson, 1988; Taylor and Perkins, 1991) and children (Oles, 1973;
Burke and Tully, 1977). Its applicability to different groups within society has been
established. The lack of standardisation for use with people with learning disabilities
must, however, remain a concern for the present study.
The use of procedures and measurements not standardised on this population has been
cited by many authors as a potentially serious methodological flaw (Gowans and
Hulbert, 1983; Schurr et al, 1970; Jahoda, 1988). The semantic differential technique
provides a quantitative statement about the location of the self-concept of people with
learning disabilities along a continuum from positive to negative and, as Jahoda
(1988) states, this technique may be uninformative. However, since the present study
was primarily interested in the differences in self-concept between groups who
displayed different attitudes towards disability, this issue is not so relevant.
There are a great diversity of instruments with a variety of accompanying operational
definitions of self-concept (none of which are totally satisfactory) already available to
measure aspects of the self-concept of people with learning disabilities. Authors have
highlighted the difficulty of generalising the results of these studies (Schurr et al..
480
1970; Gowans and Hulbert, 1988), and the present study could be seen as
compounding the problems. However, although the present study utilises a different
measurement procedure to examine the self-concept, attempts have been made to
integrate this research into the self-concept studies of other groups within society and
to present a wide-reaching and global definition of the self-concept derived from the
study of theories of the self. Furthermore, the self-concept scale used in the present
study has proven reliability and validity and has recently been used to study the self-
concepts of various groups of participants (Thompson, 1988; Taylor and Perkins,
1991; Burke and Tully, 1977 and Oles, 1973).
As IQ assessments were not carried out on the participants prior to involvement in the
study, methodological issues arise concerning the homogeneity of the participants and
the potential for IQ differences to exist between the two attitudinal groups. However,
as all the participants were involved in a group aimed at fulfilling the needs of the
most able clients at the Adult Training Centre and were labelled as mildly learning
disabled (or an equivalent term) in their client files, it is justifiable to state that they
can be regarded as representing a homogenous group typical of people with mild
learning disabilities.
The interviewing procedure used in the present study required a high degree of verbal
fluency and the ability to comment upon personal circumstances. Many people with
more severe learning disabilities than those involved in the current research would not
be able to carry out the complex tasks involved or may possess additional speech and
language difficulties which would present difficulties. The interview technique
detailed would not be appropriate for all but the most able participants. However,
since a ‘yes-no’ format was not adopted in the present study the response bias
resulting from acquiescence (Sigelman et al., 1986) was not a major methodological
issue. Far more serious was the possibility that the participants could have responded
with socially desirable answers, however, as can be seen from the results of the study
and the willingness with which the participants volunteered information, this does not
seem to have been the case with the present sample. This issue should be borne in
mind when carrying out further studies with other groups of participants who may not
481
be so used to answering the personal and potentially painful questions as the present
sample appeared to be.
The next hypothesis concerned the effect belonging to a stigmatised group would have
upon the participants’ attitudes towards their disabilities. The results of the present
study were largely in accord with previous studies. The participants involved in the
present study had insight into their situation (or the situation of those they defined as
having learning disabilities), as potentially stigmatised individuals. They reported
episodes of negative appraisal or evaluation by others, both whilst at school and
during their present lives. Thus, each participant, to a greater or lesser extent, had to
contend with the stigmatising/devaluing behaviour or others. Due to the fact that the
participants involved in the present study possessed considerable insight and were
used to discussing issues with others at the Adult Training Centre, they were able to
articulate these events and the feelings that accompanied them very clearly.
Many other researchers have stated that people with learning disabilities are aware of
their position as stigmatised members of society (Szivos and Griffiths, 1990; Reiss and
Benson, 1984; Jones, 1972; Flynn and Knussen, 1980). In contrast to Edgerton’s initial
study (1967), the present study did not find that people with learning disabilities
always denied their disability and attempted to ‘pass’ or assimilate into mainstream
society. Certainly a considerable number (N=13), but not all, of the participants did
reject/deny a view of themselves as globally cognitively disabled individuals, many
avoided this topic of conversation as far as possible. This group (Rejectors) denied
having any difficulties at all, saw themselves as essentially the same as non-disabled
people and identified peers at the Adult Training Centre who were more severely
intellectually disabled or who had physical or emotional/behavioural difficulties as
being learning disabled. Very few admitted that they did have specific difficulties in
some areas. The areas they did highlight were mainly concerned with reading and
writing. The primary reason given by this group for attending the Adult Training
Centre was that they could not get a job. These results can best be interpreted as
representing the difficulty the participants (56.6%) had in coping with a stigmatised
482
identity rather than that they truly believed that they were not intellectually disabled in
any way.
The present study also found evidence of a second category of participants (N=9) who
did regard themselves as learning disabled and thus, essentially different from non-
learning disabled people. This group of participants saw themselves as having many
areas of difficulty in areas such as:
• Reading, writing and spelling
• Mathematical or quantitative difficulties (e.g. calculation of change, telling the
time)
• General intellectual limitations, including comprehension.
They also volunteered the label of having learning difficulties or being mentally
handicapped as directly applying to themselves. Many did see themselves as fortunate,
however, as their disabilities were mild compared to many of their peers. These results
support the findings of recent studies by Koegel and Edgerton (1982) and Jahoda
(1988). Zetlin and Turner’s (1984) study found evidence of four clusters of attitudes
towards disability displayed by the participants with learning disabilities involved in
their project. If the present study had involved a longer interview following an
increased period of facilitating the participants’ trust, it may have been possible to re
create these four typologies. However, since the inter-rater agreement was 100% and
classification into the two groups was easily accomplished, the classification system
used in the present study can be seen as a valid, effective and relevant process,
supported by the literature.
It is interesting that there were no age or sex differences between the two groups, as
Edgerton (1967) stated that women with learning disabilities showed a particular
desire to reject their disabilities and to attempt to ‘pass’ into mainstream society
(Group Concept Problem). Therefore, one might expect there to be more women in
Group One (Rejectors). However, there was relatively little evidence that the
participants categorised by Group One (Rejectors) in the present study demonstrated
the Group Concept Problem. This is surprising as Gibbons (1985) hypothesised that
483
community-based care would exacerbate the Group Concept Problem as it allows
more social freedom and promotes more contact with non-learning disabled people.
The results of the present study can partly be explained by the fact that all but one of
the participants associated exclusively (except for family/carers) with learning
disabled people and did not have many opportunities to socialise with non-learning
disabled people, contrary to the suggestions of Gibbons (1985). The fact that many
participants adopted the role of a carer towards those who possessed more severe
learning disabilities is suggestive of a Group Concept Problem, although it could be
interpreted alternatively as an act of solidarity with those who they perceived as
belonging to the same stigmatised group as themselves.
These results further refute Social Construction Theory (as do those of Jahoda, 1988;
Koegel and Edgerton, 1982). This theory would have predicted that all participants
would have adopted and internalised a view of themselves as disabled and as
essentially different from other, non-learning disabled people. Some individuals
involved in the present study were clearly very aware of their abilities and were able to
actively evaluate themselves (human agency). Mead’s theory does not allow for these
personal insights. Thus, the results of the current study provide support for an
alternative interpretation of the development and maintenance of the self-concept
which is in line with Markova et al.’s (1987) approach. Also Szivos and Griffiths’
(1990) Consciousness Raising Paradigm, which is based upon Tajfel’s (1981) Social
Identity Theory is the preferred explanation for these differences. These theories
proposed that individuals belonging to a stigmatised group which they are unable to
leave have two options. The first is to attempt to ‘pass’ into the mainstream society
and the second is to create a positive identity for the stigmatised group. The fact that
the participants involved in the present study developed different attitudes/methods of
coping with a stigmatised identity also supports the theories of Combs and Snygg
(1959) and Maslow (1954) that it is a fundamental human need to preserve and
enhance the self-concept. Group One (Rejectors) who distanced themselves from the
label learning disabled and created an image of themselves which did not include this
factor can be seen to be preserving a, somewhat fragile, sense of self; whereas it could
484
be argued that Group Two (Acceptors) were also adopting a different strategy to
preserve their sense of self by creating a positive image of learning disabled people.
However, these points are purely speculative.
Those participants who rejected their disabilities regarded themselves as essentially
the same as non-learning disabled people, had significantly higher aspirations in life,
significantly greater discrepancies between their aspirations and their perceived
expectations of being able to achieve these wishes, and significantly more negative
self-concepts than participants who stated that they were essentially different from
non-disabled people and accepted a view of themselves as globally impaired. These
results are in accord with previous research (Jahoda, 1988; Szivos and Griffiths, 1990;
Lewis, 1973; James, 1890; Szivos, 1990; Zisfein and Rosen, 1974).
Reasons for these results can be hypothesised. Group One (Rejectors) saw themselves
as being essentially the same as non-learning disabled members of society and held
normative aspirations without feeling that they were likely to fulfil them (i.e. to get a
job, earning a lot of money). They were faced, on a daily basis, with activities and
attitudes from others which supported a view of themselves as devalued and not
competent to achieve their aims. Many of the participants in the present study had
been rejected for employment following job interviews, currently did not have
employment when not at the Adult Training Centre and consequently had low
incomes. These factors alone could result in a heightening of their sense of not being
able to fulfil their aspirations. The perception of their negative life-events, the
discrepancy between their aspirations and their perceived likelihood of being able to
achieve these aims can be argued as potentially leading the participants towards a
more negative appraisal of themselves (self-worth and self-esteem would be affected),
and consequently to a poor self-concept. Tajfel (1981) states that attempting to ‘pass’
into mainstream society has several, potentially unpleasant, psychological
consequences involving an individual’s self-esteem and self-image.
Group Two (Acceptors) saw themselves as essentially different from non-learning
disabled people, and tended to regard themselves as not capable of culturally
485
normative activities as a consequence of their disabilities. It could be argued that they
would consequently have lower aspirations in life (as supported by the present
research), or would possess aspirations which differed from the societally valued ones,
such as those detailed in the present research. Their expectations of achieving their
life goals would not be as discrepant as Group One (Rejectors) and so there would be
no reason to expect their self-concepts to be damaged or threatened. It is interesting
that the present research confirmed the results of Szivos (1990) which found that
participants did not aspire to having a non-learning disabled boy/girlfriend, getting
married and having children as Edgerton’s (1967) cohort had done.
The present study found that the same two aspirations as in Szivos’ study (earn a lot of
money and get a job) were most highly rated by the participants, although in the
reverse order. Szivos postulated two explanations for these differences; the first being
that the results reflected a reduction in the stigma associated with receiving special
provision and so the individuals involved in her study did not have to be seen to
disaffiliate in their choice of friends. The present study would support this
explanation. Szivos also suggested that the differences could also be due to the fact
that her sample was considerably younger than Edgerton’s. The sample of participants
involved in the present study were not all young school leavers and so this explanation
cannot account for the discrepancy. A third suggestion is presented, stating that the
societally normative aspirations adopted during the 1960s, when Edgerton carried out
his study have themselves altered and that the aspirations of the participants with
learning disabilities involved in the more recent studies merely reflect these changes.
7. SUMMARY AND CONCLUSIONS
The present study demonstrated that the concept of the ‘self is relevant to people with
learning disabilities. The results do not support the Social Construction Theory (Mead,
1934,1964; Festinger, 1954), although all the participants belonged to a stigmatised
and devalued group, they had not all adopted and internalised a correspondingly
negative view of themselves.
486
This preliminary study demonstrated that the semantic differential technique may be
an effective and appropriate instrument to use to measure the self-concept of people
with mild learning disabilities. However, this study also highlighted several
methodological issues. The semantic differential instrument used supplied the
participant with adjective scales to use when rating the self-concept, and thus, was
open to experimenter bias, required a high level of verbal fluency and reading
ability/comprehension and was relatively insensitive as it only comprised 25 scales to
be rated. Also, although it had been used to explore the self-concepts of children and
people with mental health needs, it had not been used to study the self-concepts of
people with learning disabilities and so its reliability and validity for use with this
client group had not been separately determined prior to the study being carried out.
Normative data does not exist for people with learning disabilities.
All the participants had insight into their situation, or the situation of those they
defined as having learning disabilities, as potentially stigmatised individuals. They all
reported negative appraisals or evaluations by others, both in the past and in their
current everyday lives. Contrary to Edgerton’s (1976) study the participants did not
always attempt to assimilate into mainstream society, although 13 did reject a view of
themselves as globally learning disabled. A second group emerged in this study who
regarded themselves as learning disabled and as essentially different from non
disabled people. These results were in accord with previous studies (Koegel and
Edgerton, 1982; Jahoda, 1988). Methodological issues arose in that the interview used
to categorise individuals as belonging to either group was short and was therefore a
relatively crude and insensitive measure of the participants’ attitudes towards his/her
disabilities. The interviews also required that the participants possess a high level of
verbal fluency and insight into their situation as learning disabled people.
Participants who rejected their position as having learning disabilities and who
regarded themselves as being the same as non-learning disabled people had
significantly higher aspirations in life, significantly greater discrepancies between
their aspirations and their expectations of being able to fulfil them and significantly
more negative self-concepts than those who stated that they were essentially different
487
from non-disabled people and accepted a view of themselves as globally learning
disabled. Again these results are in accord with previous research.
In view of these findings, the present study can be thought to be a valid and
worthwhile initial exploration of the relationship between self-concept, aspirations,
expectations and attitudes towards disability. However, subsequent research should
involve intellectual assessments carried out prior to the study in order to establish the
homogeneity of the sample. As only 22 participants were included in the present
study, subsequent research should involve larger sample sizes as well as a more
detailed interview, allowing in depth examination of the attitudes of the participants
towards their disability. This may provide support for Zetlin and Turner’s (1984)
findings of four categories of attitudes towards disability.
Due to the limitations of the semantic differential technique further research should
attempt to devise a more suitable assessment procedure. It may be possible to utilise
pictorial representations of some of the bipolar adjectives, this may enable people with
more severe reading and comprehension difficulties to use the semantic differential
scale. Also the likert-type scale could be adapted so that, instead of colouring in one of
five boxes, the client moves a counter or photograph of themselves along the scale to
show how relevant each adjective is to their self-concept. The scale could be
represented as a vertical ladder, rather than as a series of horizontal organised boxes.
Further research should be carried out in order to standardise and validate the use of
the semantic differential technique with people with mild learning disabilities.
This study, in line with much of the past literature, has been carried out with people
with mild learning disabilities and high levels of comprehension and personal insight.
Research should be carried out in order to examine the self-concept patterns of people
with more severe learning disabilities (the semantic differential technique may not be
appropriate for this research).
The findings of this study also have implications for clinical practice and for the
services provided for people with learning disabilities. The semantic differential task
488
may be clinically useful in helping to determine individuals with poor self-concepts
and individual variation in personality functioning so that services can be tailored to
suit clients’ individual needs.
This study supports the view that people with learning disabilities are aware of their
situation as potentially stigmatised and devalued individuals. With the growth of
community care provision, people with learning disabilities have become increasingly
involved with members of the general population of non-learning disabled people.
This has led to increased opportunities for, potentially negative, social comparisons. It
may be possible to over-emphasise image and competency and to encourage ‘passing’
and assimilation into mainstream values/society. This may perpetuate a cycle of
devaluing disability, making it harder for the person to come to terms with his/her
disability.
Service providers should not regard the discussion of disability as a taboo, but as a
topic for open group analysis in order to facilitate positive and distinct group
identities. The Consciousness Raising Paradigm (Szivos and Griffiths, 1990; Szivos,
1992) recommends specific exploration of the meaning of the disability and a
recognition of individual differences, aspirations and abilities. Aspirations should not
be assumed to be culturally normative.
Each individual’s attitudes towards his/her disabilities should be explored. The results
of this study demonstrate that it is incorrect to assume that people with learning
disabilities form a homogenous group with similar attitudes towards their disabilities.
These may vary with the severity and type of disabilities involved as well as
personality variables.
489
8. REFERENCES
1. Ballinger, B.R. (1973). The Viewpoint of the Mentally Subnormal Patient.
British Journal of Psychiatry, 122,315-317.
2. Barker, P. (1992). Basic Family Therapy (Third Edition) Blackwell Scientific
Publications, Oxford.
3. Barron, D. (1989). Slings and Arrows. In; Brandon, D. (Ed.). Mutual Respect
Good Impressions. Surbiton.
4. Bell, I. (1984). Communication and Language in Mental Handicap 1.
Meaningful terms. Mental Handicap, 12 (1), 5-8.
5. Bills, R., Vance, E., & McLean, O. (1951). An Index of Adjustment and
Values. Journal of Consulting Psychology, 15,257-261.
6. Brandon, D. (1989). Professional Behaviours. In; Brandon, D. (Ed.). Mutual
Respect Good Impressions. Surbiton.
7. Brechin, A., & Swain, J. (1988). Professional/Client Relationships: Creating a
‘Working Alliance’ with People with Learning Difficulties. Disability,
Handicap and Society, 3 (3), 213-225.
8. Burke, P.J., & Tully, J.C. (1977). The Measurement of Role Identity. Social
Forces, 55 (4), 881-897.
9. Carroll, A.W. (1967). The Effects of Segregated and Partially Integrated
School Programs on Self-Concept and Academic Achievement of Educable
Mental Retardates. Exceptional Children, 34,93-99.
490
10. Combs, A.W., & Snygg, D. (1959). Individual Behaviour (Revised Edition)
Harper Press, New York, USA.
11. Curtis, L.T. (1964). A Comparative Analysis of the Self Concept of the
Adolescent Mentally Retarded in Relation to Certain Groups of Adolescents.
Dissertation Abstracts, 25,2846-2847.
12. Edgerton, R.B. (1967). The Cloak of Competence, Stigma in the Lives of the
Mentally Retarded. University of California Press, USA.
13. Festinger, L. (1954). A Theory of Social Comparison Processes. Human
Relations, 7,117-140.
14. Fitts, W.H. (1965). Tennessee Self-Concept Scale Manual. Counselor
Recordings and Tests, Nashville, USA.
15. Flynn, M., & Knussen, C. (1986). What it Means to be Labelled ‘Mentally
Handicapped’. Social Work Today, 17 (40), 11.
16. Gergen, K.J. (1987). Toward Self or Relationship. In; Yardley, K.M.; &
Honess, T.M. (Eds.). Self and Identity. J. Wiley and Sons, Chichester, UK.
17. Gibbons, F.X. (1985). Stigma Perception: Social Comparison Among Mentally
Retarded Persons. American Journal of Mental Deficiency, 90 (1), 98-106.
18. Goffman, E. (1963). Stigma. Notes on the Management of a Spoiled Identity.
Penguin Books, Middlesex.
19. Goldstein, H. (1964). The Development of the Illinois Index of Self
Derogation. Washington D C., USA.
491
20. Gowans, F., & Hulbert, H. (1983). Self Concept Assessment of Mentally
Handicapped Adults: A Review. British Institute of Mental Handicap, 11, 121-
123.
21. Grossman, H.J. (1983). Classification in Mental Retardation. American
Association on Mental Deficiency. Washington D C., USA.
22. Guthrie, G., Butler, A., & Gorlow, L. (1961). Patterns of Self-Attitudes of
Retardates. American Journal of Mental Deficiency, 60,222-229.
23. Guthrie, G., Butler, A., & Gorlow, L. (1963a). Personality Differences
between Institutionalised and Non-lnstitutionalised Retardates. American
Journal of Mental Deficiency, 67, 543-548.
24. Guthrie, G., Butler, A., & Gorlow, L. (1963b). Correlates of Self-Attitudes
of Retardates. American Journal of Mental Deficiency, 67, 549-555.
25. Guthrie, G., Butler, A., & Gorlow, L. (1964). Non-Verbal Expression of
Self-Attitudes of Retardates. American Journal of Mental Deficiency, 69, 42-
45.
26. Hardy, H. (1967). The Relationship between Self-Attitudes and Performance
on a Paired Associates Learning Task in Educable Retardates. Dissertation
Extracts, 27,1657.
27. Howard, D.P., Stainback, S B., & Stainback, W.C. (1972). The Relationship
between Self-Concept and Peer Acceptance. Journal of School Health, XLll
(2), 109-110.
28. James, W. (1890). The Principles of Psychology (Second Edition 1950). Dover
Publications.
492
29. Jahoda, A., Markova, I., & Cattermole, M. (1988). Stigma and the Self-
Concept of People with a Mild Mental Handicap. Journal of Mental Deficiency
Research, 32,103-115.
30. Jones, R.L. (1972). Labels and Stigma in Special Education. Exceptional
Children, 38, 553-564.
31. Kershner, J.R. (1990). Self-Concept and IQ as Predictors of Remedial
Success in Children with Learning Disabilities. Journal of Learning
Disabilities, 23(6), 368-374.
32. Knight, O.B. (1968). The Self Concept of Educable Mentally Retarded
Children in Special and Regular Classes. Dissertation Abstracts, 28,4483.
33. Kniss, J.T., Butler, A., Gorlow, L., & Guthrie, G.M. (1962). Ideal Self
Patterns of Female Retardates. American Journal of Mental Deficiency, 67,
245-249.
34. Koegel, P., & Edgerton, R.B. (1982). Labeling and the Perception of
Handicap among Black Mildly Mentally Retarded Adults. American Journal of
Mental Deficiency, 87 (3), 266-276.
35. Lawrence, E.A., & Winschel, J.F. (1973). Self Concept and the Retarded:
Research and Issues. Exceptional Children, January, 311-319.
36. Lewis, T. (1973). Self-Concept Theory and Handicapped Children. In; Palmer,
J. (Ed.). Special Education in the New Community Services.
37. Lindgren, H.C., & Fisk, L.W. (1976). Psychology of Personal Development
(Third Edition). J. Wiley & Sons, Chichester, UK.
493
38. Lipsitt, L.P. (1958). A Self-Concept Scale for Children and its Relationship to
the Children’s Form of the Manifest Anxiety Scale. Child Development, 29,
463-472.
39. Markova, I. (1987). Knowledge of the Self through Interaction. In; Yardley,
K.M.; & Honess, T.M. (Eds.). Self and Identity. J. Wiley & Sons, Chichester,
UK.
40. Maslow, A.H. (1954). Motivation and Personality. Harper Press, New York,
USA.
41. Mayer, C.C. (1966). The Relationship of Early Special Class Placement and
the Self-Concepts of Mentally Handicapped Children. Exceptional Children,
34,77-81.
42. Mead, G.H. (1934). Mind, Self and Society. University of Chicago Press,
Chicago, USA.
43. Mead, G.H. (1964). On Social Psychology: Selected Papers. University of
Chicago Press, Chicago, USA.
44. Meyerowitz, J. (1962). Self-Derogations in Young Retardates and Special
Class Placement. Child Development, 33,443-451.
45. Oles, H.J. (1973). Semantic Differential for Third through Fifth Grade
Students. Psychological Reports, 33,24-26.
46. Oliver, C. (1986). Self Concept Assessment: A Case Study. Mental Handicap,
14,24-25.
47. Osgood, C.E., Suci, G.J., & Tannenbaum, P.H. (1957). The Measurement of
Meaning. University of Illinois Press.
494
48. Piers, E., & Harris, D. (1964). Age and Other Correlates of Self-Concept in
Children. Journal of Education Psychology, 55,91-95.
49. Reiss, S., & Benson, B.A. (1984). Awareness of Negative Social Conditions
Among Mentally Retarded, Emotionally Disturbed Outpatients. American
Journal of Psychiatry, 141 (1), 88-90.
50. Rheingold, H.L. (1956). The Modification of Social Responsiveness in
Institutional Babies. Monographs of the Society for Research in Child
Development, 21 (2), 44.
51. Ringness, T. (1961). Self Concept of Children of Low, Average and High
Intelligence. American Journal of Mental Deficiency, 65,453-461.
52. Rogers, C.R. (1951). Client-Centred Therapy. Houghton Miffin Press, Boston,
USA.
53. Rothenberg, B. (1969). Conservation of Number Among Four- and Five- Year
Old Children: Some Methodological Considerations. Child Development, 40,
383-406.
54. Ryan, J., & Thomas, F. (1991). The Politics of Mental Handicap (Revised
Edition). Free Association Books, London, UK.
55. Satir, V. (1967). Conjoint Family Therapy. Science and Behaviour Books.
56. Schuman, H., & Presser, S. (1979). The Open and Closed Question.
American Sociological Review, 44,692-712.
57. Schurr, K.T., Joiner, L.M., & Towne, R.C. (1970). Self-Concept Research
on the Mentally Retarded: A Review of Empirical Studies Mental Retardation,
8,39-43.
495
58. Strang, L., Smith, M.D, & Rogers, C.M. (1978). Social Comparison,
Multiple Reference Groups, and the Self-Concepts of Academically
Handicapped Children Before and After Mainstreaming. Journal of
Educational Psychology, 70(4), 487-497.
59. Sigelman, C.K. (1980). Surveying Mentally Retarded Persons: Responsiveness
and Response Validity in Three Samples. American Journal of Mental
Deficiency, 84(5), 479-486.
60. Sigelman, C.K. (1986). Evaluating Alternative Techniques of Questioning
Mentally Retarded Persons. American Journal of Mental Deficiency, 86 (5),
511-518.
61. Snyder, R. (1966). Personality Adjustment, Self-Attitudes and Anxiety
Differences in Retarded Adolescents. American Journal of Mental Deficiency,
71,33-41.
62. Snyder, R., Jefferson, W., & Strauss, R. (1965). Personality Variables as
Determiners of Academic Achievement of the Mentally Retarded. Mental
Retardation, 3(1), 15-18.
63. Sudman, S., & Bradburn, N.M. (1974). Response Effects in Surveys. A
Review and Synthesis. Aldine Publishing Company, Chicago, USA.
64. Szivos, S.E. (1990). Attitudes to Work and their Relationship to Self-Esteem
and Aspirations among Young Adults with a Mild Mental Handicap. The
British Journal of Mental Subnormality, 71(2), 108-117.
65. Szivos, S. (1992). Straight Talking. Nursing Times, 88(7), 61-62.
496
66. Szivos, S.E., & Griffiths, E. (1990). Consciousness Raising and Social
Identity Theory: A challenge to Normalization. Clinical Psychology Forum,
August, 11-15.
67. Szivos, S.E., & Griffiths, E. (1990). Group Processes Involved in Coming to
Terms with a Mentally Retarded Identity. Mental Retardation, 28(6), 333-341.
68. Tajfel, H. (1981). Human Groups and Social Categories. Cambridge
University Press, Cambridge.
69. Taylor, K.E., & Perkins, R.E. (1991). Identity and Coping with Mental
Illness in Long-Stay Psychiatric Rehabilitation. British Journal of Clinical
Psychology, 30,73-85.
70. Thompson, E.H. (1988). Variation in the Self Concept of Young Adult
Chronic Patients: Chronicity Reconsidered. Hospital and Community
Psychiatry, 39(7), 771-775.
71. Towne, R.C., & Joiner, L.M. (1966). The Effect of Special Class Placement
on the Self-Concept-of-Ability of the Educable Mentally Retarded Child.
Washington D.C., USA.
72. W arr, P.B., & Knapper, C. (1968). The Perception of People and Events. J.
Wiley & Sons, Cambridge, UK.
73. Wolfensberger, W. (1972). The Principle of Normalization in Human
Services. National Institute on Mental Retardation, Toronto, Canada.
74. Wolfensberger, W. (1983). Social Role Valorization: A Proposed New Term
for the Principle of Normalization. Mental Retardation, 21(6), 234-239.

497
75. Wylie, R.C. (1974). The Self-Concept. A Review of Methodological
Considerations and Measuring Instruments. University of Nebraska Press.
76. Zetlin, A.G., & Turner, J.L. (1984). Self Perspectives on Being Handicapped:
Stigma and Adjustment. In; Edgerton, R. (Ed.). Lives in Process: Mildly
Retarded Adults in a Large City. Monograph 6, American Association of
Mental Deficiency.
77. Zisfein, L., & Rosen, M. (1974). Self-Concept and Mental Retardation:
Theory, Measurement and Clinical Utility. Mental Retardation, August, 15-19.

498
APPENDICES

499
APPENDIX ONE
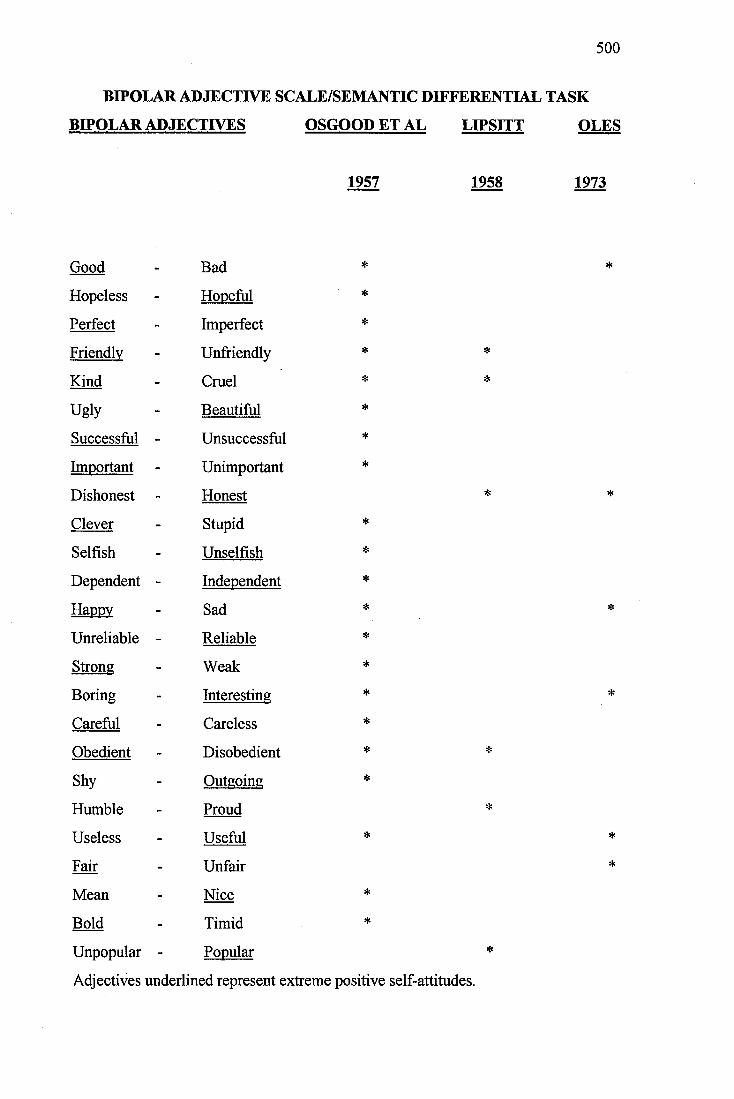
500
BIPOLAR ADJECTIVE SCALE/SEMANTIC DIFFERENTIAL TASK
BIPOLAR ADJECTIVES OSGOOD ET AL LIPSITT OLES
1957 1958 1973
Good Bad * *
Hopeless - Hopeful *
Perfect - Imperfect *
Friendlv - Unfriendly * *
Kind - Cruel * *
Ugly - Beautiful *
Successful - Unsuccessful *
Imnortant - Unimportant *
Dishonest - Honest * *
Clever - Stupid *
Selfish - Unselfish *
Dependent - Independent *
Happv - Sad * *
Unreliable - Reliable *
Strong - Weak *
Boring - Interesting * »
Careful - Careless »
Obedient - Disobedient * *
Shy - Outgoing *
Humble - Proud *
Useless - Useful » *
Fair - Unfair »
Mean - Nice *
Bold - Timid *
Unpopular - Popular *
Adjectives underlined represent extreme positive self-attitudes.

501
APPENDIX TWO
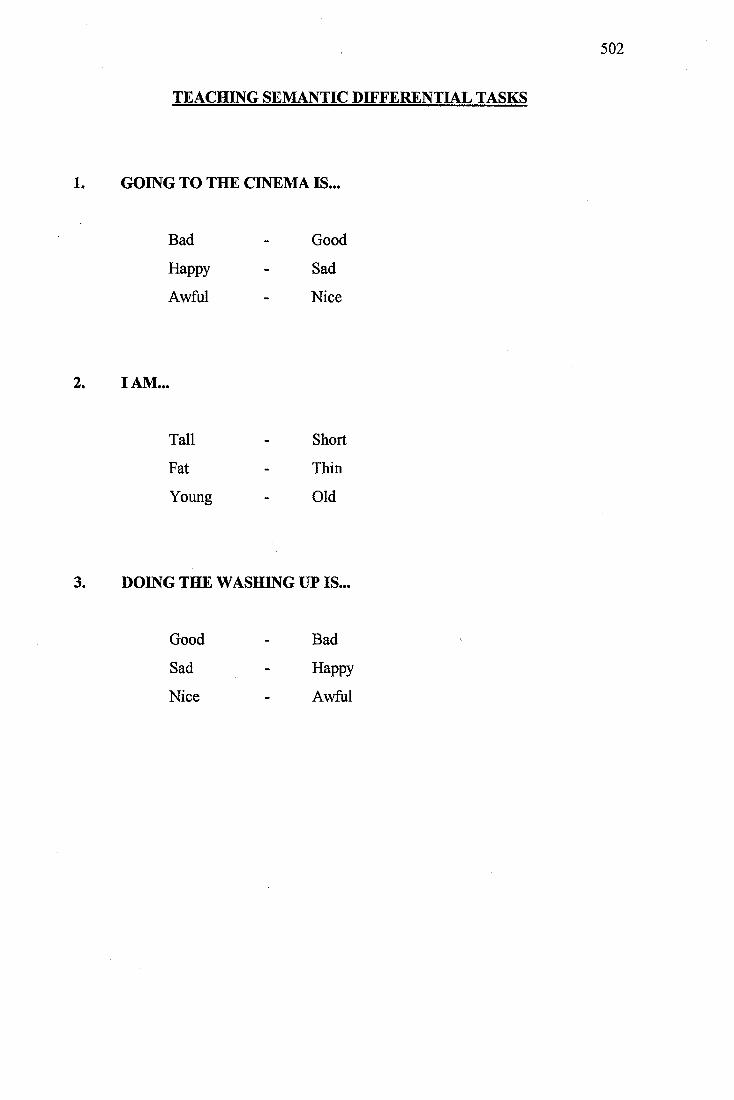
502
TEACHING SEMANTIC DIFFERENTIAL TASKS
1. GOING TO THE CINEMA IS...
Bad - Good
Happy - Sad
Awful - Nice
2. I AM..
Tall - Short
Fat - Thin
Young - Old
3. DOING THE WASHING UP IS...
Good - Bad
Sad - Happy
Nice - Awful
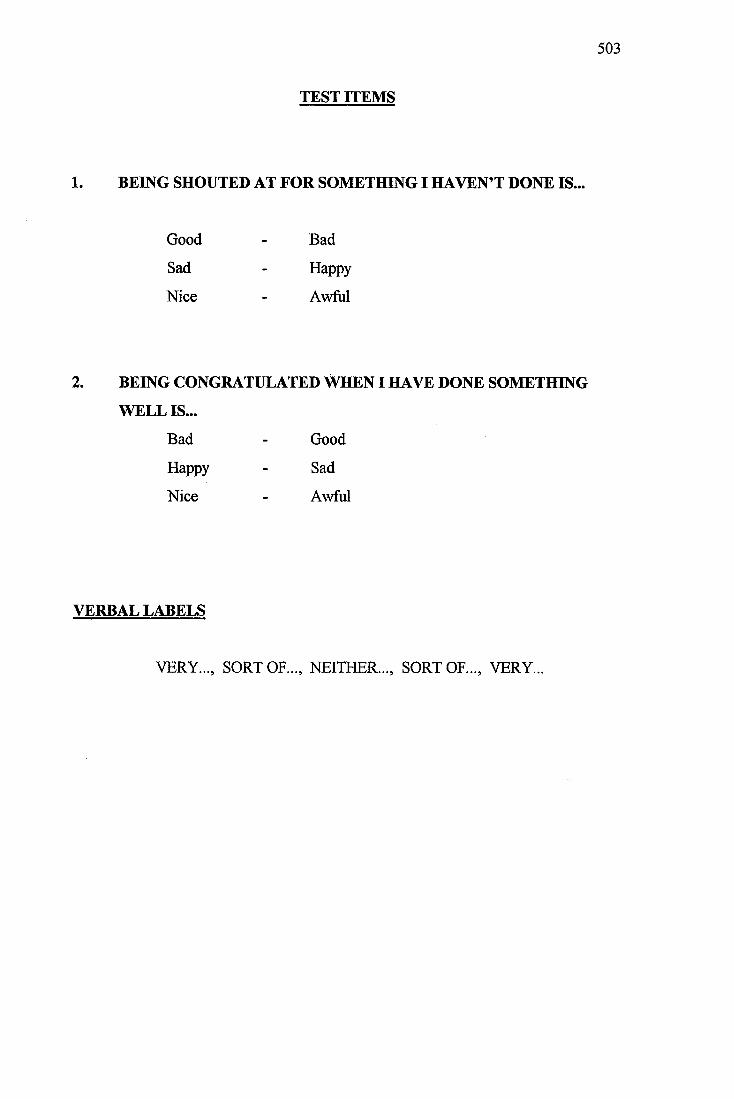
503
TEST ITEMS
1. BEING SHOUTED AT FOR SOMETHING I HAVEN’T DONE IS.
Good - Bad
Sad - Happy
Nice - Awflil
2. BEING CONGRATULATED WHEN I HAVE DONE SOMETHING
WELL IS...
Bad - Good
Happy - Sad
Nice - Awful
VERBAL LABELS
VERY..., SORT OF..., NEITHER..., SORT OF..., VERY.

504
APPENDIX THREE
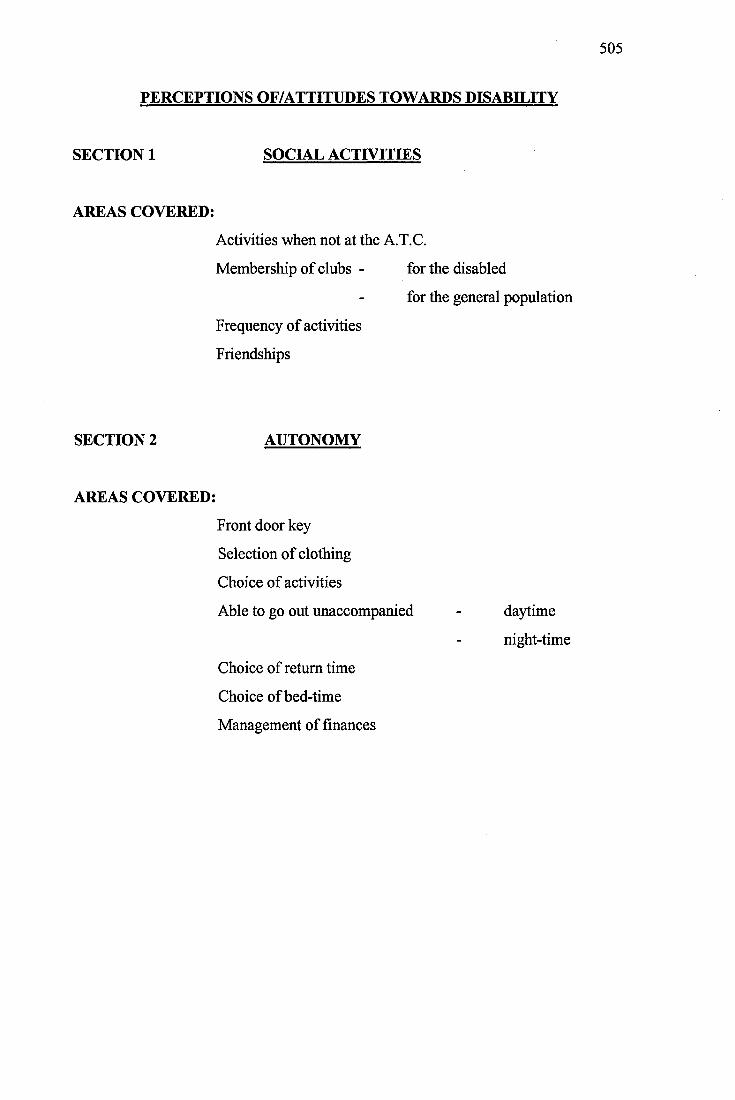
505
PERCEPTIONS OF/ATTITUDES TOWARDS DISABILITY
SECTION 1 SOCIAL ACTIVITIES
AREAS COVERED:
Activities when not at the A.T.C.
Membership of clubs - for the disabled
for the general population
Frequency of activities
Friendships
SECTION 2 AUTONOMY
AREAS COVERED:
Front door key
Selection of clothing
Choice of activities
Able to go out unaccompanied - daytime
night-time
Choice of return time
Choice of bed-time
Management of finances
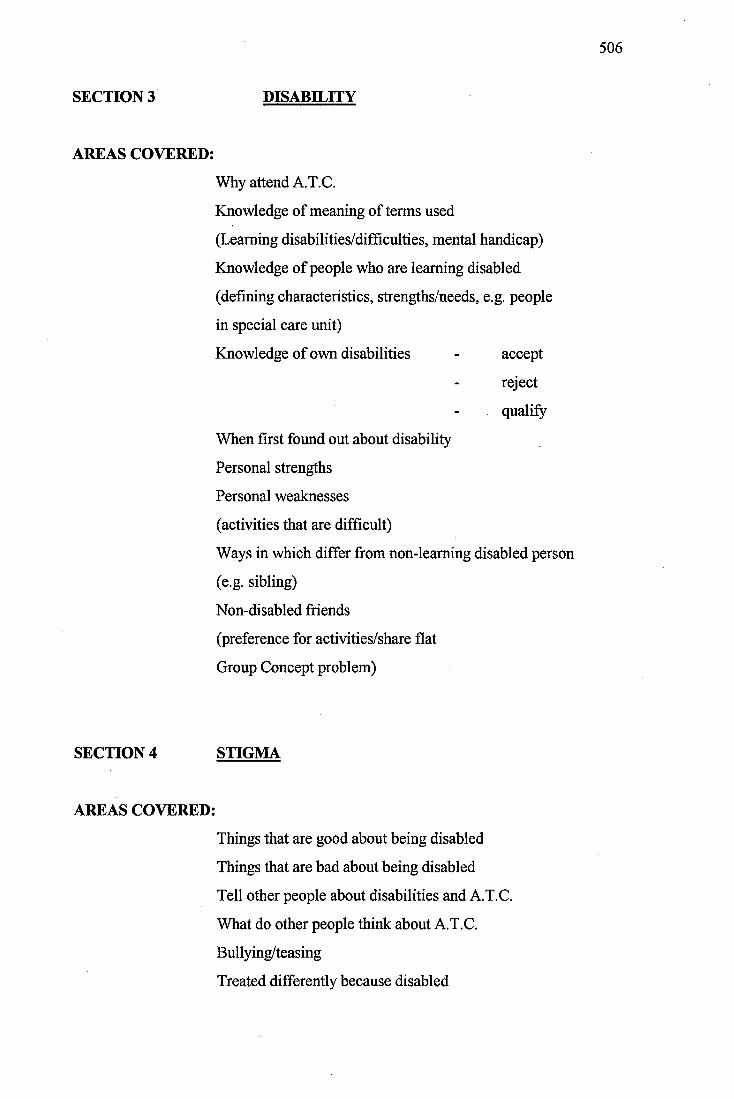
506
SECTION 3 DISABILITY
AREAS COVERED:
Why attend A.T.C.
Knowledge of meaning of terms used
(Learning disabilities/difficulties, mental handicap)
Knowledge of people who are learning disabled
(defining characteristics, strengths/needs, e.g. people
in special care unit)
Knowledge of own disabilities - accept
reject
qualify
When first found out about disability
Personal strengths
Personal weaknesses
(activities that are difficult)
Ways in which differ from non-learning disabled person
(e.g. sibling)
Non-disabled friends
(preference for activities/share flat
Group Concept problem)
SECTION 4 STIGMA
AREAS COVERED:
Things that are good about being disabled
Things that are bad about being disabled
Tell other people about disabilities and A.T.C.
What do other people think about A.T.C.
Bullying/teasing
Treated differently because disabled

507
APPENDIX FOUR
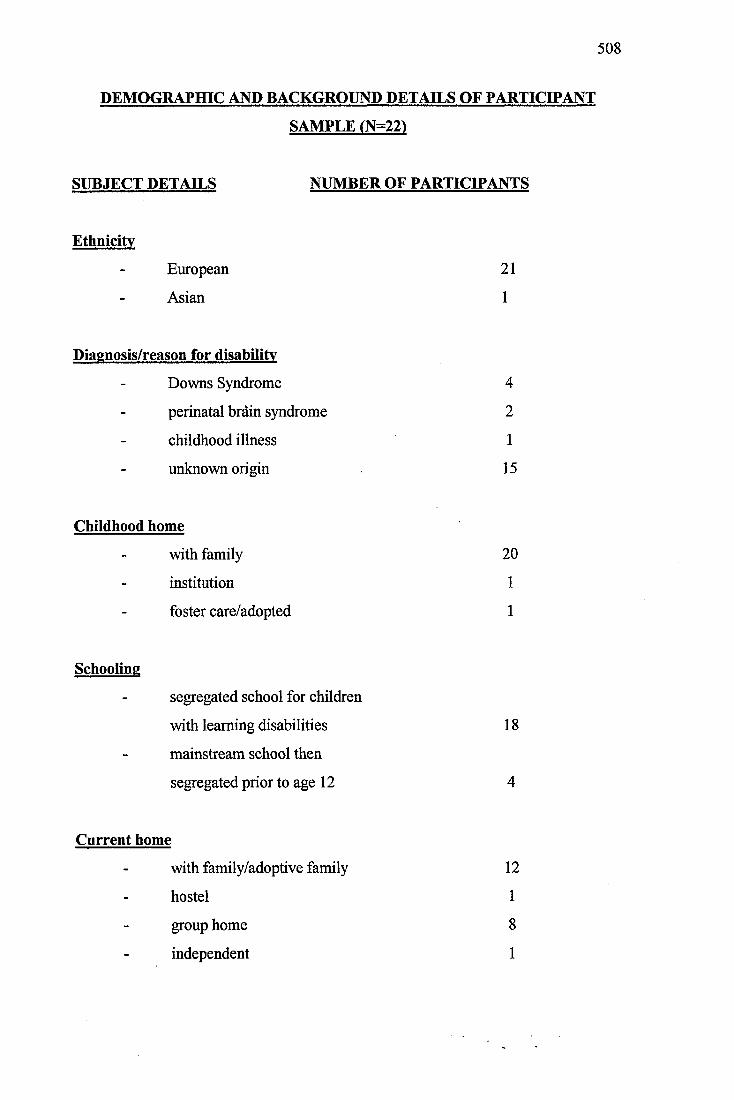
508
DEMOGRAPHIC AND BACKGROUND DETAILS OF PARTICIPANT
SAMPLE (N=22)
SUBJECT DETAILS NUMBER OF PARTICIPANTS
Ethnicity
European 21
Asian 1
Diagnosis/reason for disability
Downs Syndrome 4
perinatal brdin syndrome 2
childhood illness 1
unknown origin 15
Childhood home
with family 20
institution 1
foster care/adopted 1
Schooling
segregated school for children
with learning disabilities 18
mainstream school then
segregated prior to age 12 4
Current home
with family/adoptive family 12
hostel 1
group home 8
independent 1
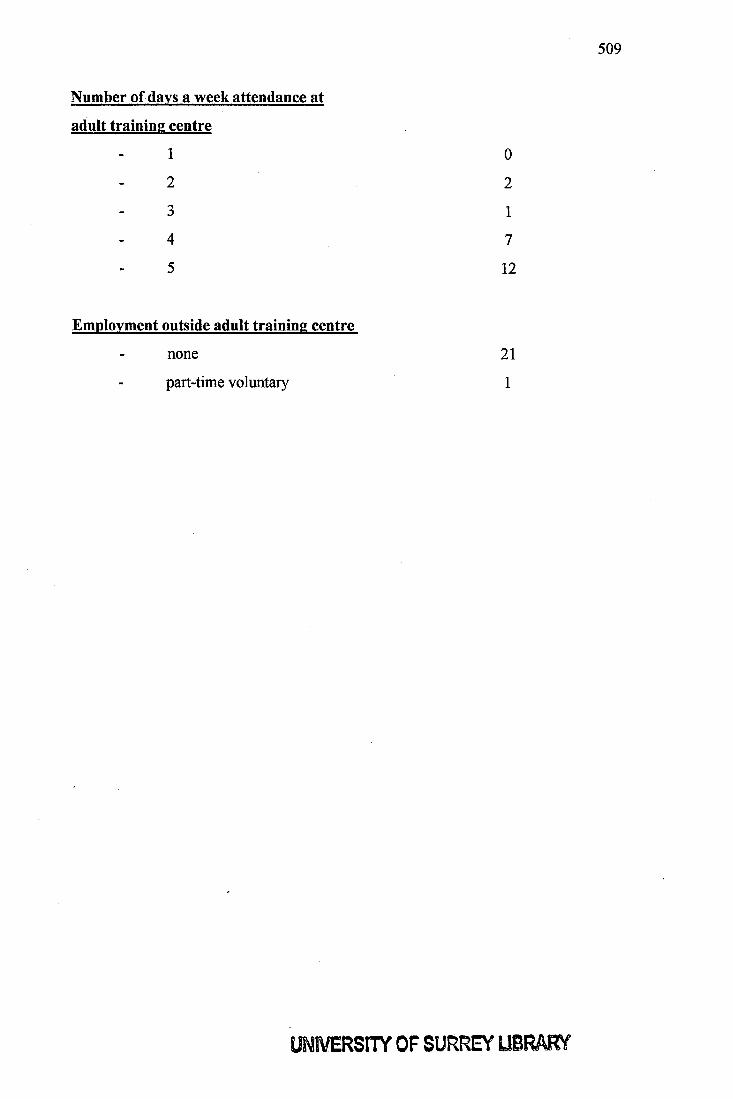
509
Number of days a week attendance at
adult training centre
1 0
2 2
3 1
4 7
5 12
Employment outside adult training centre
none 21
part-time voluntary 1
UNIVERSITY OF SURREY UBRARV