Embed Size (px)
Citation preview
CORPORATE REPORT
NO: R138 COUNCIL DATE: June 26, 2017
REGULAR COUNCIL
TO: Mayor & Council DATE: June 21, 2017
FROM: Acting General Manager, Finance & Technology FILE: 1880‐20
SUBJECT: 2016 Statement of Financial Information
RECOMMENDATION
The Finance & Technology Department recommend that Council:
1. Receive this report as information; and
2. Approve the 2016 Statement of Financial Information that is attached to this report asAppendix “I”.
INTENT
The purpose of this report is to fulfil the annual Financial Information Act (the “Act”) requirement to report publicly, the Statement of Financial Information.
BACKGROUND
The Financial Information Act was enacted in the fall of 1993 and requires all municipalities to provide the Province with a Statement of Financial Information on an annual basis. The Statement is to include, for the year being reported, the City’s audited financial statements along with information regarding the remuneration paid to the Mayor and each Councillor, the name of and the remuneration paid to each employee who received more than $75,000 from the City, the name of and the amount paid to each supplier of goods and/or services to whom the City paid more than $25,000, and grants paid by the City for more than $25,000.
The Act requires that Council approve the Statement of Financial Information prior to its submission to the Province. The Act also requires that the Statement be made available to the public before June 30th of the year following the year to which the information in the Statement applies.
2
DISCUSSION The 2016 Statement of Financial Information has been prepared in accordance with the Act and is attached as Appendix “I” to this report. The Statement includes the 2016 audited financial statements, which were adopted by Council on May 8, 2017. The remuneration and expenses paid to City staff are reported in the Statement under three categories as follows:
Base Salary: This is the salary that the employee earned in 2016;
Taxable Benefit and Other: This includes any payout of earned time related to vacations, gratuity payments, pay for performance, lump sum payments, banked overtime, retirement and/or vehicle allowances; and
Expenses: This includes amounts paid by the City to or for the employee in performing their job function, including annual professional association and membership fees, conferences, training, seminars and travel related to City business.
As part of our ongoing efforts to be an open, transparent and accessible government, staff will post this report to the Financial Documents section of the City’s website.
SUSTAINABILITY CONSIDERATIONS The 2016 Statement of Financial Information is required as part of the Financial Information Act. This reporting supports the objectives of the City’s Sustainability Charter, specifically with the following Charter action item:
Corporate SO8: Work towards corporate financial sustainability, including financial reporting.
CONCLUSION The Act requires that municipalities provide to the Province, a Statement of Financial Information for each calendar year. This Statement is to be approved by Council before it is forwarded to the Province. The Act stipulates that the Statement is to be made available to the public before June 30th of the year following the year to which the information in the Statement applies. Based on the above discussion, it is recommended that Council approve the 2016 Statement of Financial Information that is attached as Appendix “I” to this report and which has been prepared in accordance with the requirements of the Act. Kam Grewal, CPA Acting General Manager, Finance & Technology Appendix “I”: 2016 Statement of Financial Information for the City of Surrey
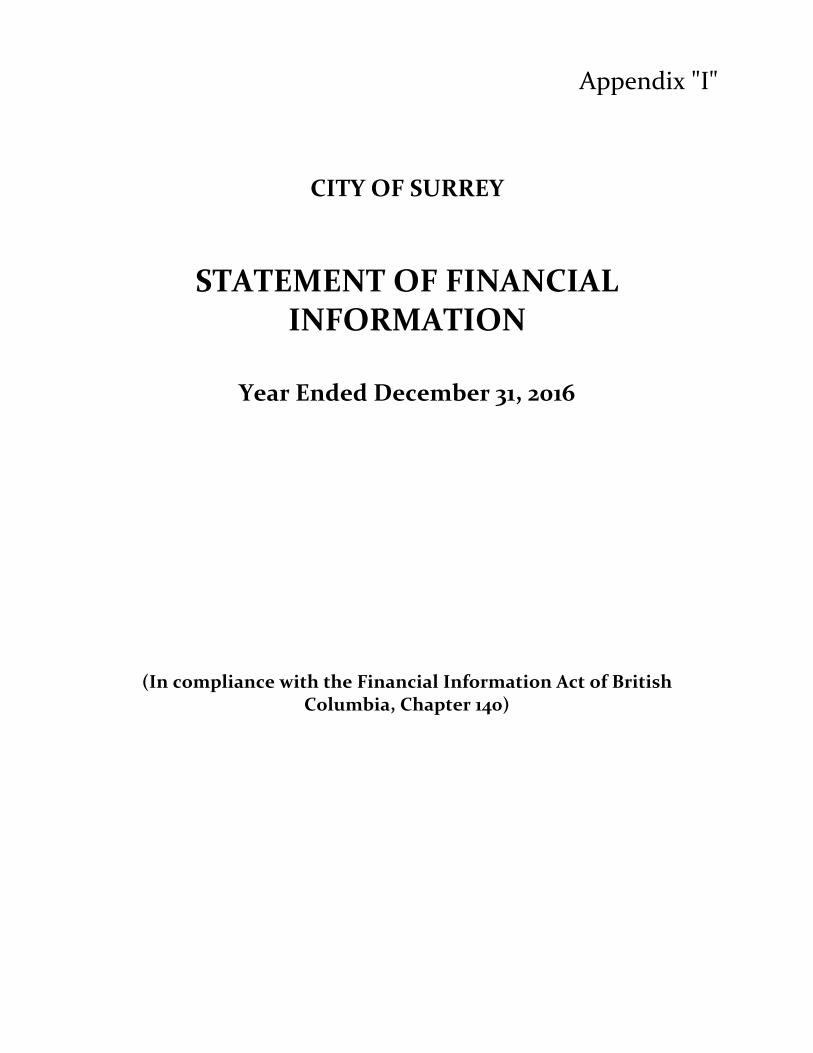
CITY OF SURREY
STATEMENT OF FINANCIAL INFORMATION
Year Ended December 31, 2016
(In compliance with the Financial Information Act of British Columbia, Chapter 140)
Appendix "I"
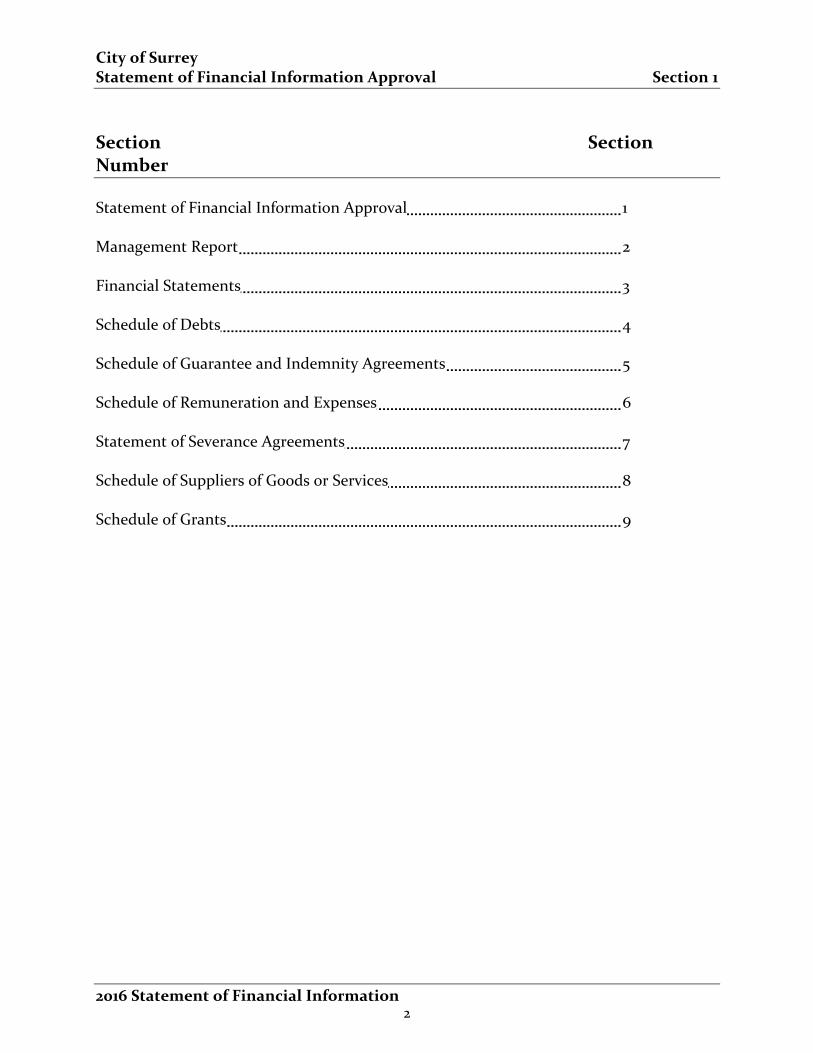
City of Surrey Statement of Financial Information Approval Section 1
2016 Statement of Financial Information
Section Section Number
Statement of Financial Information Approval 1 Management Report 2 Financial Statements 3 Schedule of Debts 4 Schedule of Guarantee and Indemnity Agreements 5 Schedule of Remuneration and Expenses 6 Statement of Severance Agreements 7 Schedule of Suppliers of Goods or Services 8 Schedule of Grants 9
2
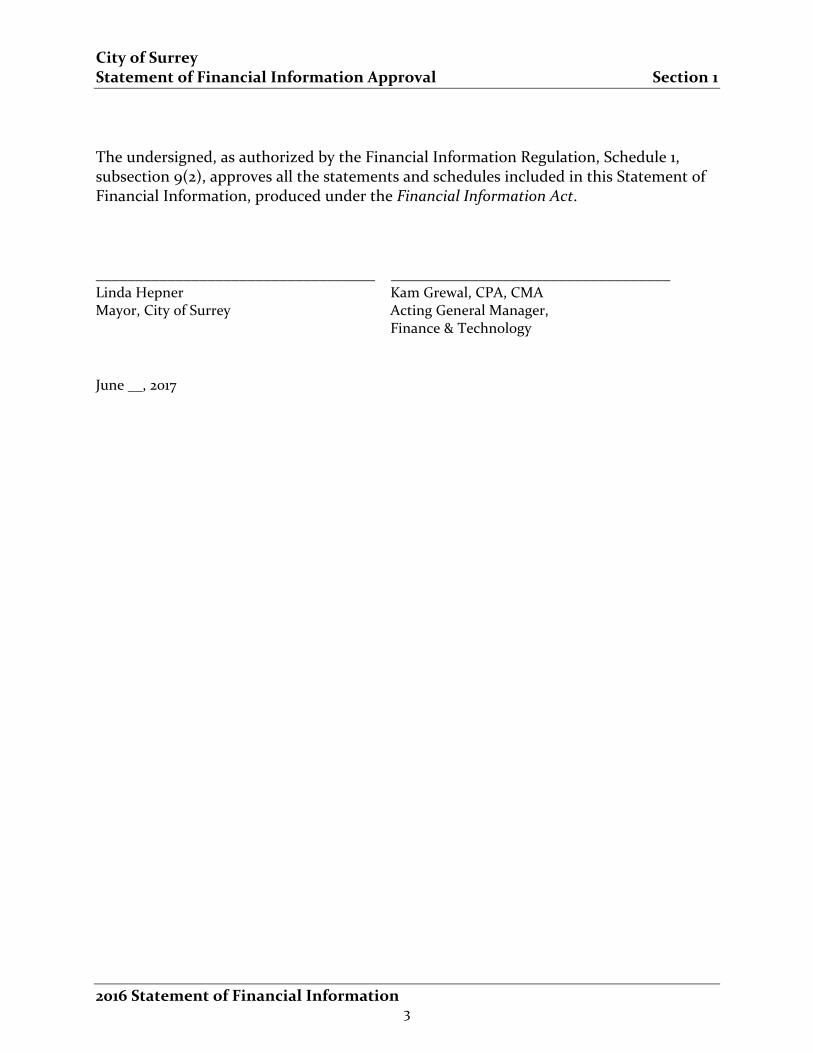
City of Surrey Statement of Financial Information Approval Section 1
2016 Statement of Financial Information
The undersigned, as authorized by the Financial Information Regulation, Schedule 1, subsection 9(2), approves all the statements and schedules included in this Statement of Financial Information, produced under the Financial Information Act.
___________________________________ ___________________________________ Linda Hepner Kam Grewal, CPA, CMA Mayor, City of Surrey Acting General Manager,
Finance & Technology
June __, 2017
3
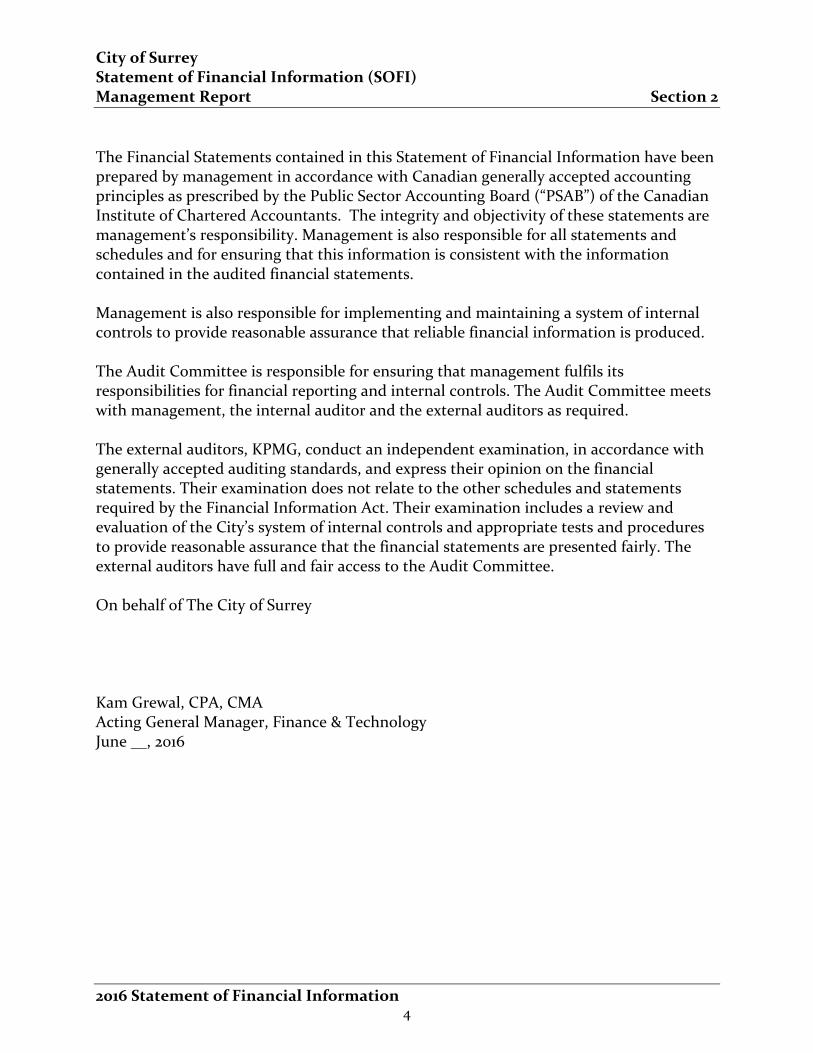
City of Surrey Statement of Financial Information (SOFI) Management Report Section 2
2016 Statement of Financial Information
The Financial Statements contained in this Statement of Financial Information have been prepared by management in accordance with Canadian generally accepted accounting principles as prescribed by the Public Sector Accounting Board (“PSAB”) of the Canadian Institute of Chartered Accountants. The integrity and objectivity of these statements are management’s responsibility. Management is also responsible for all statements and schedules and for ensuring that this information is consistent with the information contained in the audited financial statements. Management is also responsible for implementing and maintaining a system of internal controls to provide reasonable assurance that reliable financial information is produced. The Audit Committee is responsible for ensuring that management fulfils its responsibilities for financial reporting and internal controls. The Audit Committee meets with management, the internal auditor and the external auditors as required. The external auditors, KPMG, conduct an independent examination, in accordance with generally accepted auditing standards, and express their opinion on the financial statements. Their examination does not relate to the other schedules and statements required by the Financial Information Act. Their examination includes a review and evaluation of the City’s system of internal controls and appropriate tests and procedures to provide reasonable assurance that the financial statements are presented fairly. The external auditors have full and fair access to the Audit Committee. On behalf of The City of Surrey Kam Grewal, CPA, CMA Acting General Manager, Finance & Technology June __, 2016
4
City of Surrey Statement of Financial Information (SOFI) Financial Statements Section 3
2016 Statement of Financial Information
5
40
CITY OF SURREY
6

1217
37
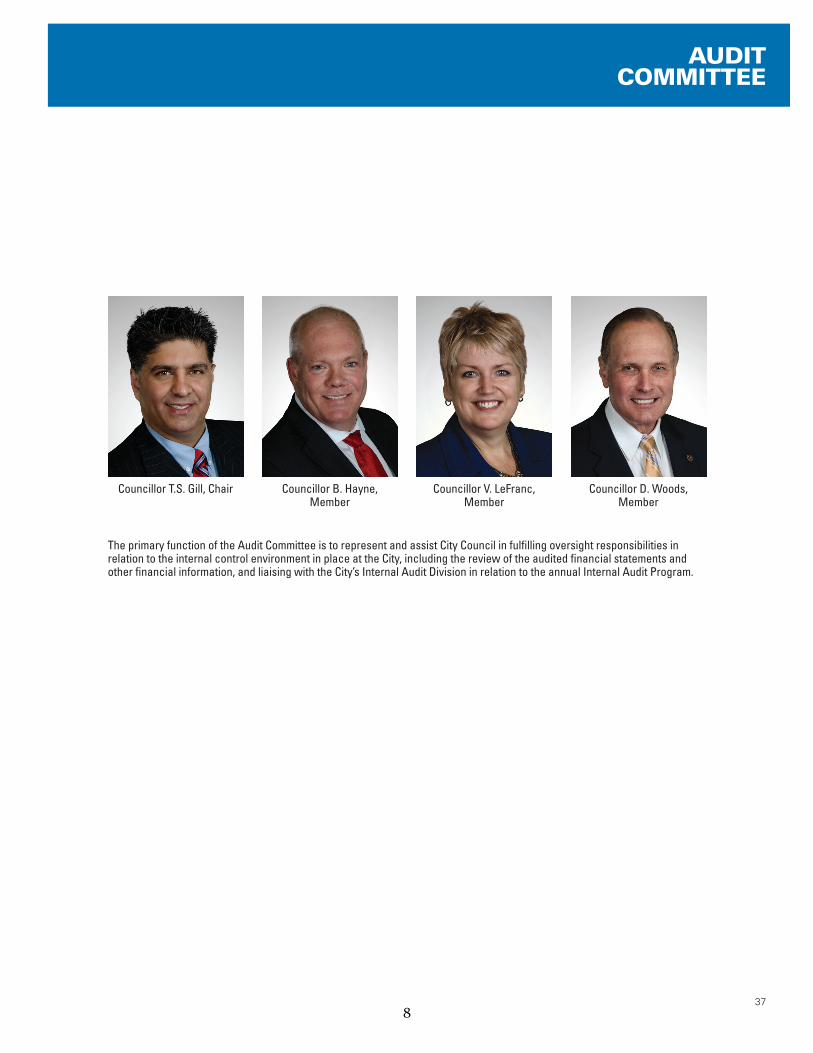
The primary function of the Audit Committee is to represent and assist City Council in fulfilling oversight responsibilities in relation to the internal control environment in place at the City, including the review of the audited financial statements and other financial information, and liaising with the City’s Internal Audit Division in relation to the annual Internal Audit Program.
Councillor T.S. Gill, Chair Councillor B. Hayne, Member
Councillor V. LeFranc, Member
Councillor D. Woods, Member
AUDIT COMMITTEE
8
38
MAY 8, 2017To Mayor Linda Hepner and Members of City Council
It is my pleasure to submit the Annual Financial Report for the year ended December 31, 2016. The purpose of this report is to publish the consolidated Financial Statements and the Auditors’ Report for the City of Surrey pursuant to Section 167 of the Community Charter.
The preparation of the consolidated financial statements is the responsibility of City Council and the management of the City of Surrey. The financial statements and related information have been prepared in accordance with Canadian Public Sector Accounting Standards as prescribed by the Public Sector Accounting Board (PSAB) of the Chartered Professional Accountants of Canada (CPA). In addition to the City of Surrey, the reporting entity comprises all organizations, boards and enterprises financially accountable to the City of Surrey, including the Surrey Public Library, the Surrey Homelessness and Housing Society and the Surrey City Development Corporation.
The public accounting firm KPMG LLP, which was appointed by City Council as the external auditor, has given the City an unqualified audit opinion on the City’s Consolidated Financial Statements, stating that in their professional opinion, the Consolidated Financial Statements present fairly, in all material respects, the consolidated financial position of the City of Surrey as at December 31, 2016 including its consolidated results of operations, its changes in net consolidated financial assets and its consolidated cash flows for the year then ended in accordance with Canadian Public Sector Accounting Standards.
FINANCIAL OVERVIEW
2016 in Review
The construction of new facilities under the ‘Build Surrey’ Program continued to facilitate development activity throughout the City during 2016. Of particular significance was the opening of the Grandview Heights Indoor Pool, serving the growing community of South Surrey. Design work also began on the new Clayton Hub, which will incorporate integrated arts, library, recreation and outdoor space in a single facility to serve the communities of East and West Clayton. In the residential development community, the shift toward the construction of multi-family dwellings has continued into 2016, although the City still continues to offer excellent value in the single family residential sector relative to the rest of the Greater Vancouver area. Another healthy sign of development was the strong commercial and institutional sector activity; which has been particularly evident in the City Centre. In addition, industrial development in the Campbell Heights area remains steady.
The City’s revenues in 2016 totaled $914.7 million, which is an increase in comparison to revenues of $853.4 million collected in 2015. This increase was attributable primarily to additional property taxes, utility fees, license, permits and one-time land sale proceeds. The additional revenue generated from the increased property related fees and taxes was required to support a $12.5 million budgeted increase in Public Safety along with a $8.8 million budgeted increase in support for new Civic Facilities opening in 2016 and necessary labour and inflationary cost increases.
The City’s expenses totaled $698.8 million in 2016, which was an increase in comparison to expenses of $670.5 million in 2015. This increase was primarily attributable to increase in the RCMP contract, increases in Parks, Recreation and Culture programming and a reclassification of utility overhead cost recoveries.
REPORT FROM THE GENERAL MANAGER, FINANCE & TECHNOLOGY
9
39
Investments
The City’s investment policy, which complies with Community Charter requirements, outlines how City funds are to be invested to achieve reasonable returns and with investment security while meeting the City’s cash flow requirements. The average portfolio balance related to the City’s investments during 2016 was $747.2 million ($643.7 million in 2015), which earned $16.5 million in interest in 2016; plus an additional $1.2 million was earned specifically for deferred development cost charges. The average rate of return during 2016 on the City’s investment portfolio was 2.05%.
Reserve Funds
The City’s statutory reserve funds amount to $116.9 million at the end of 2016 compared to a balance of $111.0 million at the end of 2015. This increase is mainly due to the sale of lands in Campbell Heights. The deferred development cost charge balance at the end of 2016 was $267.0 million, which is an increase over the balance of $239.6 million at the end of 2015. This is a reflection of the City’s steady development activity. These funds will be used to fund capital projects that are listed in the City’s Five-Year (2017-2021) Financial Plan.
Financial Position
The financial position is calculated as Financial Assets less Liabilities and results in either a Net Financial Asset or a Net Financial Debt. A Net Financial Asset position is an indicator of the funds available for future expenditures and a Net Financial Debt position is an indicator of funds required to pay for past expenditures.
In 2016, the City’s the financial position improved by $25.5 million resulting in a Net Financial Asset position of $58.7 million mainly due to the City’s annual consolidated surplus (revenues exceeding expenses) of $215.9 million offset by net capital acquisitions.
The City’s non-financial assets increased in 2016 by $190.4 million, bringing the total to $8.3 billion. The increase is the net result of capital additions of physical assets in the year offset by disposals and amortization expense.
The result of the increase in financial position and non-financial assets was accumulated surplus increasing in 2016 to $8.4 billion (2015 - $8.2 billion). Overall, the City continues to maintain a strong financial position.
THE FUTURE
The City’s future financial, social and environmental health holds promise and opportunity. The significant growth and transformation we have experienced in the last several years continues as over 1,000 new residents per month make Surrey their home. With this level of growth expected to sustain for the next two decades, the City needs to continue to expand its infrastructure and service levels to ensure that both current and future residents and business needs are adequately met. 2016 marked the official opening of New Grandview Heights Pool and the City’s New Works Yard facility. An additional gas boiler plant and distribution system to support the City’s District Energy System was completed in 2016 and construction continued on the public/private partnership of one of the largest Organics Biofuel Facilities in Canada, allowing for the introduction of cost and environmentally effective energy to more residential customers. Planning has also started on some significant community projects to support our growing population, these include the relocation of the North Surrey Arenas, the addition of a Multi-use facility in Clayton and expansion of the Surrey Museum and additional ice surfaces in Cloverdale.
In light of the fiscal and operational pressures that come with such significant expansion and growth, City staff will endeavor to ensure that property owners continue to have competitive property tax rates relative to other cities of a similar size both in the local region and across Canada. The continued effective use of City resources will play a critical role in ensuring fiscal prudency, and effective and efficient utilization of resources will certainly be driven by the use of technology and the implementation of innovative solutions. The City continues to introduce technology that improves customer service as well as enhancing and expanding our online service delivery.
Staff is staying abreast with financial statement changes that are being considered by the Public Sector Accounting Board (PSAB) with a view to ensuring that the City implements changes in a timely and efficient manner. Staff are currently studying the potential impact and developing policies to implement the upcoming guidelines related to Inter-Equity Transactions; Related Party Disclosures; Assets, Contingent Assets, and Contractual Rights. These new standards will be required to be adopted by January 1, 2018. Effective January 1, 2019 and January 1, 2020 respectively, staff will also be required to adopt new standards related to Restructuring and Financial Instruments. Other areas of potential change include possible changes to asset retirement obligations, revenue recognition, public private partnerships, employee future benefit obligations and the conceptual framework for financial performance. Staff will monitor potential impacts of these areas as they evolve.
Under the direction and guidance of City Council, the City of Surrey is well positioned to continue to deliver a high quality of services for its current and future residents and businesses in support of a continued high quality of life. The City’s tag line, “The Future Lives Here”, aptly characterizes the growing, exciting, youthful city that Surrey has become.
Respectfully submitted,
Vivienne Wilke, CPA, CGAGeneral Manager, Finance & Technology Department
10
36
FINANCIAL STATEMENTS FOR THE YEAR ENDED DECEMBER 31, 2016
11
41
KPMG EnterpriseTM Metro Tower I 4710 Kingsway, Suite 2400 Burnaby BC V5H 4M2 Canada Telephone (604) 527-3600 Fax (604) 527-3636
KPMG LLP is a Canadian limited liability partnership and a member firm of the KPMG network of independent member firms affiliated with KPMG International Cooperative (“KPMG International”), a Swiss entity. KPMG Canada provides services to KPMG LLP.
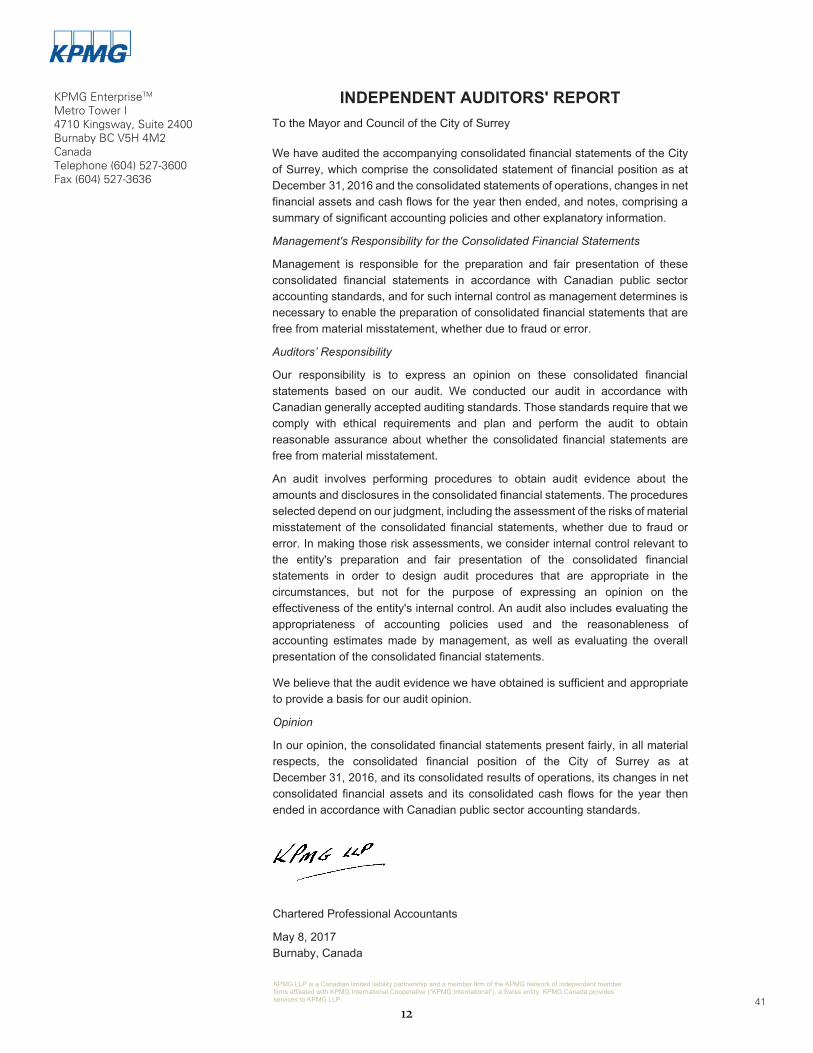
INDEPENDENT AUDITORS' REPORT To the Mayor and Council of the City of Surrey
We have audited the accompanying consolidated financial statements of the City of Surrey, which comprise the consolidated statement of financial position as at December 31, 2016 and the consolidated statements of operations, changes in net financial assets and cash flows for the year then ended, and notes, comprising a summary of significant accounting policies and other explanatory information.
Management's Responsibility for the Consolidated Financial Statements
Management is responsible for the preparation and fair presentation of these consolidated financial statements in accordance with Canadian public sector accounting standards, and for such internal control as management determines is necessary to enable the preparation of consolidated financial statements that are free from material misstatement, whether due to fraud or error.
Auditors’ Responsibility
Our responsibility is to express an opinion on these consolidated financial statements based on our audit. We conducted our audit in accordance with Canadian generally accepted auditing standards. Those standards require that we comply with ethical requirements and plan and perform the audit to obtain reasonable assurance about whether the consolidated financial statements are free from material misstatement.
An audit involves performing procedures to obtain audit evidence about the amounts and disclosures in the consolidated financial statements. The procedures selected depend on our judgment, including the assessment of the risks of material misstatement of the consolidated financial statements, whether due to fraud or error. In making those risk assessments, we consider internal control relevant to the entity's preparation and fair presentation of the consolidated financial statements in order to design audit procedures that are appropriate in the circumstances, but not for the purpose of expressing an opinion on the effectiveness of the entity's internal control. An audit also includes evaluating the appropriateness of accounting policies used and the reasonableness of accounting estimates made by management, as well as evaluating the overall presentation of the consolidated financial statements.
KPMG EnterpriseTM Metro Tower I 4710 Kingsway, Suite 2400 Burnaby BC V5H 4M2 Canada Telephone (604) 527-3600 Fax (604) 527-3636
KPMG LLP is a Canadian limited liability partnership and a member firm of the KPMG network of independent member firms affiliated with KPMG International Cooperative (“KPMG International”), a Swiss entity. KPMG Canada provides services to KPMG LLP.
INDEPENDENT AUDITORS' REPORT To the Mayor and Council of the City of Surrey
We have audited the accompanying consolidated financial statements of the City of Surrey, which comprise the consolidated statement of financial position as at December 31, 2016 and the consolidated statements of operations, changes in net financial assets and cash flows for the year then ended, and notes, comprising a summary of significant accounting policies and other explanatory information.
Management's Responsibility for the Consolidated Financial Statements
Management is responsible for the preparation and fair presentation of these consolidated financial statements in accordance with Canadian public sector accounting standards, and for such internal control as management determines is necessary to enable the preparation of consolidated financial statements that are free from material misstatement, whether due to fraud or error.
Auditors’ Responsibility
Our responsibility is to express an opinion on these consolidated financial statements based on our audit. We conducted our audit in accordance with Canadian generally accepted auditing standards. Those standards require that we comply with ethical requirements and plan and perform the audit to obtain reasonable assurance about whether the consolidated financial statements are free from material misstatement.
An audit involves performing procedures to obtain audit evidence about the amounts and disclosures in the consolidated financial statements. The procedures selected depend on our judgment, including the assessment of the risks of material misstatement of the consolidated financial statements, whether due to fraud or error. In making those risk assessments, we consider internal control relevant to the entity's preparation and fair presentation of the consolidated financial statements in order to design audit procedures that are appropriate in the circumstances, but not for the purpose of expressing an opinion on the effectiveness of the entity's internal control. An audit also includes evaluating the appropriateness of accounting policies used and the reasonableness of accounting estimates made by management, as well as evaluating the overall presentation of the consolidated financial statements.
City of Surrey Page 3
We believe that the audit evidence we have obtained is sufficient and appropriate to provide a basis for our audit opinion.
Opinion
In our opinion, the consolidated financial statements present fairly, in all material respects, the consolidated financial position of the City of Surrey as at December 31, 2016, and its consolidated results of operations, its changes in net consolidated financial assets and its consolidated cash flows for the year then ended in accordance with Canadian public sector accounting standards.
Chartered Professional Accountants
May 8, 2017 Burnaby, Canada
12
As at December 31, 2016, with comparative figures for 2015[in thousands of dollars]
To be read in conjunction with the Notes to the Consolidated Financial Statements
42
2016 2015
( recast - note 2 )
FINANCIAL ASSETS
Cash $ 32,794 $ 12,121
Accounts receivable ( note 3 ) 120,753 109,251
Properties held-for-sale ( note 4 ) - 42,506
Investments ( note 5 ) 826,195 706,717
979,742 870,595
LIABILITIES
Accounts payable and accrued liabilities ( note 6 ) 157,779 143,826
Deposits and prepayments ( note 7 ) 236,442 194,784
Deferred revenue ( note 8 ) 35,314 31,305
Deferred development cost charges ( note 9 ) 266,968 239,631
Debt ( note 10 ) 224,562 227,918
921,065 837,464
NET FINANCIAL ASSETS 58,677 33,131
NON-FINANCIAL ASSETS
Tangible capital assets ( note 12 ) 8,312,963 8,123,149
Inventories of supplies 880 857
Prepaid expenses 4,517 3,997
8,318,360 8,128,003
ACCUMULATED SURPLUS ( note 13 ) $ 8,377,037 $ 8,161,134
Commitments and contingencies ( note 14 )
Vivienne Wilke, CPA, CGAGeneral ManagerFinance & Technology Department
Linda HepnerMayor, City of Surrey
CONSOLIDATED STATEMENT OF FINANCIAL POSITION CITY OF SURREY
13
To be read in conjunction with the Notes to the Consolidated Financial Statements
For the year ended December 31, 2016, with comparative figures for 2015 [in thousands of dollars]
43
2016 Budget 2016 2015
( note 24 ) ( recast - note 2 )
REVENUES
Taxation revenue ( note 16 ) $ 368,277 $ 365,863 $ 343,460
Sales of goods and services 219,533 226,242 211,520
Development cost charges ( note 9 ) 133,486 61,260 58,598
Developer contributions 132,901 141,214 143,004
Investment income 17,160 16,500 16,437
Transfers from other governments ( note 23 ) 52,783 22,784 22,405
Other 66,904 80,838 58,016
TOTAL REVENUES 991,044 914,701 853,440
EXPENSES
Police services 148,154 148,379 133,003
Parks, recreation and culture 102,500 102,710 93,830
General government 82,796 80,232 75,323
Roads and traffic safety 72,659 66,936 75,269
Water 69,458 67,147 65,281
Fire services 59,600 60,183 58,858
Sewer 56,499 55,096 52,471
Solid waste 32,884 28,999 28,690
Drainage 32,868 32,171 33,790
Planning and development 29,319 25,449 24,003
Library services 18,476 18,532 18,283
Engineering 5,686 10,326 9,717
Surrey City Energy 1,289 395 231
Parking 859 2,243 1,724
TOTAL EXPENSES 713,047 698,798 670,473
ANNUAL SURPLUS 277,997 215,903 182,967
Accumulated Surplus, beginning of year 8,161,134 8,161,134 7,978,167
Accumulated Surplus, end of year $ 8,439,131 $ 8,377,037 $ 8,161,134
CONSOLIDATED STATEMENT OF CITY OF SURREY OPERATIONS
14
As at December 31, 2016, with comparative figures for 2015[in thousands of dollars]
To be read in conjunction with the Notes to the Consolidated Financial Statements
44
2016 Budget 2016 2015
( note 24 )
ANNUAL SURPLUS $ 277,997 $ 215,903 $ 182,967
Acquisition of tangible capital assets (534,708) (335,442) (338,776)
Amortization of tangible capital assets 116,775 120,838 116,837
Loss (gain) on disposal of tangible capital assets - (5,460) 10,134
Proceeds on disposal of tangible capital assets - 14,622 7,506
(139,936) 10,461 (21,332)
Acquisition of inventories of supplies - (880) (857)
Consumption of inventories of supplies - 857 1,011
Acquisition of prepaid expenses - (4,517) (3,997)
Use of prepaid expenses - 3,997 3,962
Transfer to properties held-for-sale - 15,628 63,836
- 15,085 63,955
CHANGE IN NET FINANCIAL ASSETS (DEBT) (139,936) 25,546 42,623
Net financial assets (debt), beginning of year 33,131 33,131 (9,492)
Net financial assets (debt) , end of year $ (106,805) $ 58,677 $ 33,131
CONSOLIDATED STATEMENT OF CHANGES INNET FINANCIAL ASSETS (DEBT) CITY OF SURREY
15
To be read in conjunction with the Notes to the Consolidated Financial Statements
For the year ended December 31, 2016, with comparative figures for 2015 [in thousands of dollars]
45
2016 2015
Cash provided by (used in):
OPERATING TRANSACTIONSAnnual Surplus $ 215,903 $ 182,967
Non-Cash charges to operations:
Amortization expense 120,838 116,837
Loss (gain) on disposal of tangible capital assets (5,460) 10,134
Developer contributions of tangible capital assets ( note 12( b ) ) (114,215) (129,608)
Change in non-cash operating working capital:
Accounts receivable (11,502) 35,422
Inventories of supplies (23) 154
Prepaid expenses (520) (35)
Accounts payable and accrued liabilities 13,953 (10,508)
Deposits and prepayments 41,658 24,260
Deferred revenue 4,009 4,862
Deferred development cost charges 27,337 10,036
Net change in cash from operating transactions 291,978 244,521
FINANCING TRANSACTIONSRepayment of debt (5,323) (5,119)
Proceeds from issuance of loan payable 27,703 2,910
Repayment on loan payable (25,736) (11,849)
Cash used by financing transactions (3,356) (14,058)
CAPITAL TRANSACTIONSCash used to acquire tangible capital assets (221,227) (209,168)
Acquisition of properties held-for-sale (6,955) (9,272)
Disposal of properties held-for-sale 65,089 61,717
Proceeds on disposal of tangible capital assets 14,622 7,506
Cash used by capital transactions (148,471) (149,217)
INVESTING TRANSACTIONSIncrease in investments (119,478) (116,252)
Cash used by investing transactions (119,478) (116,252)
Increase (decrease) in cash 20,673 (35,006)
Cash, beginning of year 12,121 47,127
Cash, end of year $ 32,794 $ 12,121
CONSOLIDATED STATEMENT OF CITY OF SURREY CASH FLOWS
16
46
For the year ended December 31, 2016 [tabular amounts in thousands of dollars]
NOTES TO THE CONSOLIDATED FINANCIAL STATEMENTS CITY OF SURREY
GENERAL
The City of Surrey (the “City”) is incorporated under the Local Government Act of British Columbia. The City’s principal activities include the provision of local government services to residents of the incorporated area. These include administrative, protective, infrastructure, environmental, recreational, water, sewer, and drainage services.
1. SIGNIFICANT ACCOUNTING POLICIES
The consolidated financial statements of the City are prepared in accordance with Canadian Public Sector Accounting Standards as prescribed by the Public Sector Accounting Board (“PSAB”) of the Chartered Professional Accountants of Canada.
a) Basis of consolidation The consolidated financial statements are comprised of the City’s Operating, Capital and Reserve Funds plus the Surrey Public Library (the “Library”), Surrey City Development Corporation (“SCDC”) and Surrey Homelessness and Housing Society (“SHHS”). The Library, SHHS and SCDC are consolidated as they are controlled by the City by virtue of their Board being appointed by the City. Inter-fund transactions, fund balances and activities are eliminated on consolidation.
i) Operating Funds These funds include the General, Drainage, Parking, Roads & Traffic Safety, Sewer, Solid Waste, Surrey City Energy and Water Operating Funds as well as the Surrey Public Library. They are used to record the operating costs of the services provided by the City.
ii) Capital Funds These funds include the General, Drainage, Parking, Roads & Traffic Safety, Sewer, Solid Waste, Surrey City Energy and Water Capital Funds and Surrey Public Library Capital. They are used to record the acquisition costs of tangible capital assets and any related debt outstanding.
iii) Reserve Funds Under the Community Charter of British Columbia, City Council may, by by-law, establish reserve funds for specified purposes. Money in a reserve fund and interest earned thereon must be expended only for the purpose for which the fund was established. If the amount in a reserve fund is greater than required for the purposes for which it was established, City Council may transfer all or part of the amount to another reserve fund.
iv) Surrey City Development Corporation The consolidated financial statements reflect the assets, liabilities, revenues and expenses of Surrey City Development Corporation (“SCDC”). All inter-departmental and inter-entity accounts and transactions between SCDC and the City are eliminated upon consolidation. SCDC has the following wholly owned subsidiaries and government partnerships, which are accounted for as follows:
i) Surrey City Investment Corporation (“SCIC”) - (100% owned and fully consolidated)
SCIC has a 29.9% ownership in the following entities (proportionately consolidated), referred to as the “Surrey Centre Limited Partnerships”: • Surrey Centre Office Limited Partnership • Surrey Centre Hotel Limited Partnership • Surrey Centre Residential Limited Partnership
SCIC has a 50% ownership in nine holding companies (proportionately consolidated) referred to as the “Surrey Centre Tower Holdings”.
17
47
For the year ended December 31, 2016[tabular amounts in thousands of dollars]
NOTES TO THE CONSOLIDATED CITY OF SURREY FINANCIAL STATEMENTS
1. SIGNIFICANT ACCOUNTING POLICIES (CONTINUED)
a) Basis of consolidation (continued)
iv) Surrey City Development Corporation (continued)
ii) Grove Limited Partnership and Grove (G.P.) Inc. - (50% owned and proportionately consolidated)
iii) Surrey City Investment (Industrial) Corporation (“SCIIC”) - (100% owned and fully consolidated)
SCIIC has a 50% ownership in the Beedie SCDC (34A Ave) Limited Partnership (“Beedie LP”) - (50% owned and proportionately consolidated)
SCIIC has a 50% ownership in the Beedie SCDC (34A Ave) G.P. Ltd., the General Partner of Beedie LP - (50% owned and proportionately consolidated)
v) Surrey Homelessness and Housing Society The consolidated financial statements include the assets, liabilities, revenues and expenses of Surrey Homelessness and Housing Society (“SHHS”). All inter-entity accounts and transactions between SHHS and the City are eliminated upon consolidation. The City provided seed money to the Surrey Homelessness and Housing Society and oversees its operations.
vi) Innovation Boulevard Corporation The City has a 50% ownership in the Innovation Boulevard Corporation (“IBC”), a government partnership. The consolidated financial statements include the City’s 50% proportional share of the assets, liabilities, revenues and expenses of IBC. There was no impact to the City’s financial statements for 2016. All inter-entity accounts and transactions between IBC and the City are eliminated proportionally upon consolidation.
vii) Trust Funds These funds account for assets which must be administered as directed by agreement or statute for certain beneficiaries. In accordance with PSAB recommendations on financial statement presentation for local governments, trust funds are not included in the City’s consolidated financial statements. Trust funds administered by the City are presented in note 18.
b) Revenue recognition Revenues are recognized in the period in which the transaction or event occurs that give rise to the revenues. All revenues are recorded on an accrual basis, except when the amounts cannot be determined with a reasonable degree of certainty or when their estimation is impractical.
The City is required to act as the agent for the collection of certain taxes and fees imposed by other authorities. Collections for other authorities are excluded from the City’s taxation revenues.
Revenue recognition on sales of properties occurs when the City has transferred the significant risks and rewards of ownership. Property lease revenue includes all amounts earned from tenants, including property tax and operating cost recoveries. Lease revenues are recognized on a straight-line basis over the term of the lease. Consulting revenue is recorded at the time services are provided.
Restricted transfers from governments are deferred and recognized as revenue in the period the stipulations in the related agreement are met.
Unrestricted transfers are recognized as revenue when received or receivable if the amount to be received can be reasonably estimated and collection is reasonably assured.
18
48
For the year ended December 31, 2016 [tabular amounts in thousands of dollars]
NOTES TO THE CONSOLIDATED FINANCIAL STATEMENTS CITY OF SURREY
1. SIGNIFICANT ACCOUNTING POLICIES (CONTINUED)
c) Deferred revenue The City defers the portion of the revenue collected from permits, licenses and other fees relating to services not yet rendered. This revenue is recognized in the year in which related inspections are performed or other related services are provided.
d) Investment income Investment income is reported as revenue in the period earned.
e) Expenses Expenses are recognized as they are incurred and measurable as a result of receipt of goods or services and/or the creation of a legal obligation to pay. Interest expense is accrued as incurred.
f) Properties held-for-sale Properties held for sale include real estate properties which are ready and available to be sold and for which there is an available market. They are valued at the lower of cost or expected net realizable value. No amortization is recorded for properties held-for-sale. Properties held-for-sale is presented in note 4.
g) Investments City investments consist of demand deposits, short-term investments, bonds and debentures, which are recorded at amortized cost. Discounts and premiums arising on the purchase of these investments are amortized over the term of the investments on a straight line basis.
h) Employee future benefits The City and its employees participate in the Municipal Pension Plan. The Municipal Pension Plan is a multi-employer contributory defined benefit pension plan. Payments in the year are expensed.
Sick leave and post-employment benefits also accrue to the City’s employees. The liability relating to these benefits is actuarially determined based on length of service, best estimates of retirement ages and expected future salary and wage increases. The liabilities under these benefit plans are accrued based on projected benefits pro-rated as employees render services necessary to earn the future benefits.
Actuarial gains or losses are amortized over the expected average remaining service life of the related employee group.
The liability for event driven benefits, such as disability benefits, is calculated after the event occurs. The expense is recognized in the year the event occurs.
i) Budget data The budget data presented in these consolidated financial statements was included in the City of Surrey 2016 – 2020 Consolidated Financial Plan and was adopted through By-law #18563 on March 7, 2016.
19
49
For the year ended December 31, 2016[tabular amounts in thousands of dollars]
NOTES TO THE CONSOLIDATED CITY OF SURREY FINANCIAL STATEMENTS
1. SIGNIFICANT ACCOUNTING POLICIES (CONTINUED)
j) Non-financial assets Non-financial assets are not available to discharge existing liabilities and are held for use in the provision of services. They have useful lives extending beyond the current year and are not intended for sale in the ordinary course of operations.
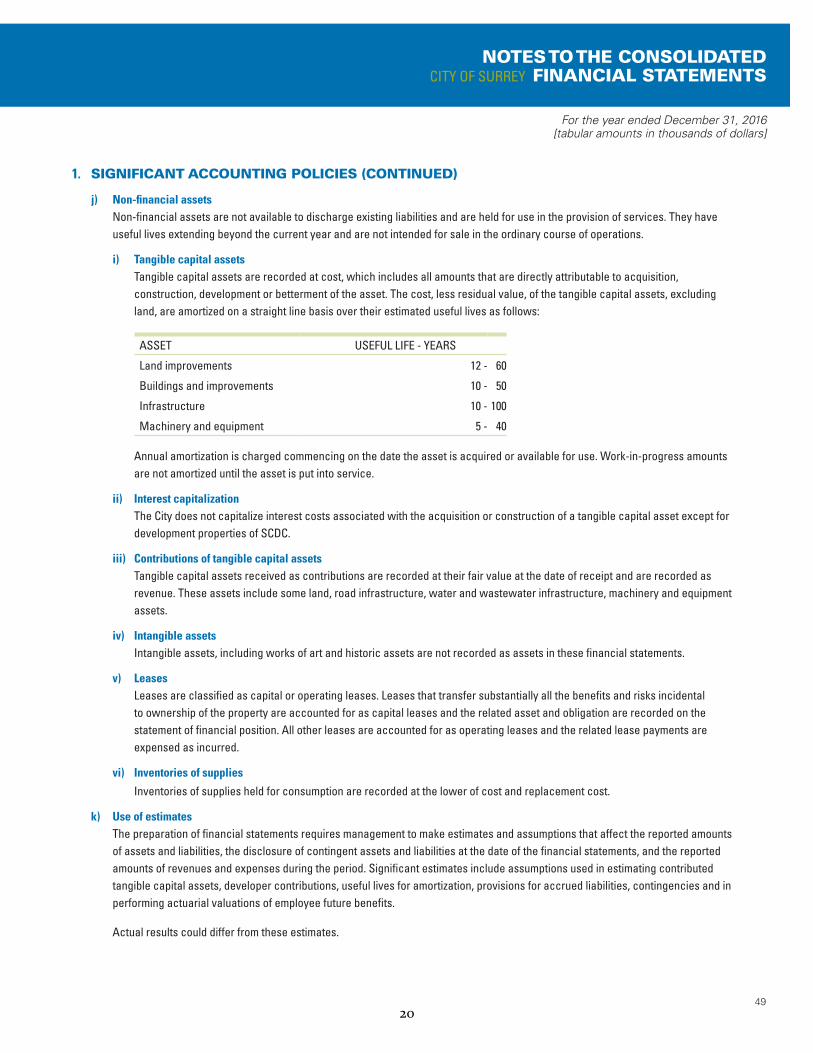
i) Tangible capital assets Tangible capital assets are recorded at cost, which includes all amounts that are directly attributable to acquisition, construction, development or betterment of the asset. The cost, less residual value, of the tangible capital assets, excluding land, are amortized on a straight line basis over their estimated useful lives as follows:
ASSET USEFUL LIFE - YEARS
Land improvements 12 - 60
Buildings and improvements 10 - 50
Infrastructure 10 - 100
Machinery and equipment 5 - 40
Annual amortization is charged commencing on the date the asset is acquired or available for use. Work-in-progress amounts are not amortized until the asset is put into service.
ii) Interest capitalization The City does not capitalize interest costs associated with the acquisition or construction of a tangible capital asset except for development properties of SCDC.
iii) Contributions of tangible capital assets Tangible capital assets received as contributions are recorded at their fair value at the date of receipt and are recorded as revenue. These assets include some land, road infrastructure, water and wastewater infrastructure, machinery and equipment assets.
iv) Intangible assets Intangible assets, including works of art and historic assets are not recorded as assets in these financial statements.
v) Leases Leases are classified as capital or operating leases. Leases that transfer substantially all the benefits and risks incidental to ownership of the property are accounted for as capital leases and the related asset and obligation are recorded on the statement of financial position. All other leases are accounted for as operating leases and the related lease payments are expensed as incurred.
vi) Inventories of supplies
Inventories of supplies held for consumption are recorded at the lower of cost and replacement cost.
k) Use of estimates The preparation of financial statements requires management to make estimates and assumptions that affect the reported amounts of assets and liabilities, the disclosure of contingent assets and liabilities at the date of the financial statements, and the reported amounts of revenues and expenses during the period. Significant estimates include assumptions used in estimating contributed tangible capital assets, developer contributions, useful lives for amortization, provisions for accrued liabilities, contingencies and in performing actuarial valuations of employee future benefits.
Actual results could differ from these estimates.
20
50
For the year ended December 31, 2016 [tabular amounts in thousands of dollars]
NOTES TO THE CONSOLIDATED FINANCIAL STATEMENTS CITY OF SURREY
1. SIGNIFICANT ACCOUNTING POLICIES (CONTINUED)
l) Segment disclosure A segment is defined as a distinguishable activity or group of activities of a government for which it is appropriate to separately report financial information to achieve the objectives of the standard. The City of Surrey has provided definitions of segments used by the City (note 1(a)) as well as presented financial information in segmented format (note 22).
m) Liabilities for contaminated sites Contaminated sites are a result of contamination being introduced into air, soil, water or sediment of a chemical, organic or radioactive material or live organism that exceeds an environmental standard. A liability for remediation of contaminated sites is recognized when a site is not in productive use and all of the following criteria are met:
• An environmental standard exists; • Contamination exceeds an environmental standard; • The City is directly responsible or accepts responsibility; • The City expects that future economic benefits will be given up; and, • A reasonable estimate of the amount can be made.
The liability is measured as management’s estimate of the cost of post remediation, including operations, maintenance and monitoring, which are an integral part of the remediation strategy for a contaminated site. The liability is recorded net of any expected recoveries.
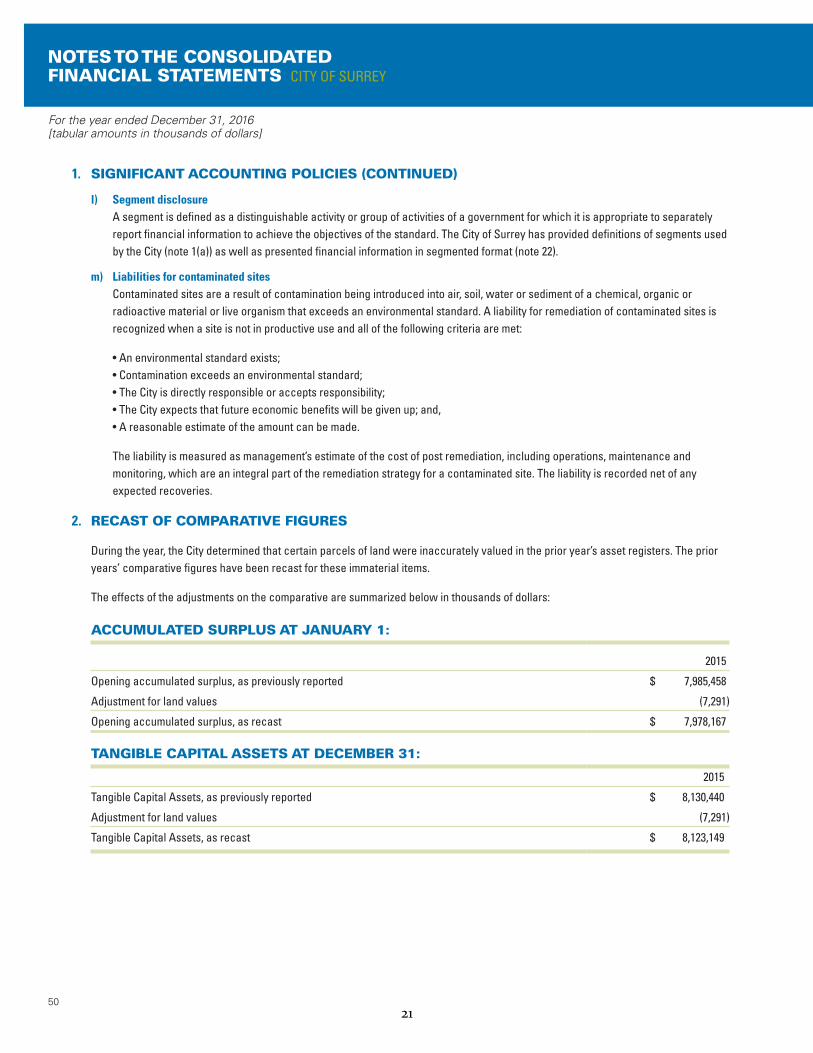
2. RECAST OF COMPARATIVE FIGURES
During the year, the City determined that certain parcels of land were inaccurately valued in the prior year’s asset registers. The prior years’ comparative figures have been recast for these immaterial items.
The effects of the adjustments on the comparative are summarized below in thousands of dollars:
ACCUMULATED SURPLUS AT JANUARY 1:
2015
Opening accumulated surplus, as previously reported $ 7,985,458
Adjustment for land values (7,291)
Opening accumulated surplus, as recast $ 7,978,167
TANGIBLE CAPITAL ASSETS AT DECEMBER 31:
2015
Tangible Capital Assets, as previously reported $ 8,130,440
Adjustment for land values (7,291)
Tangible Capital Assets, as recast $ 8,123,149
21
51
For the year ended December 31, 2016[tabular amounts in thousands of dollars]
NOTES TO THE CONSOLIDATED CITY OF SURREY FINANCIAL STATEMENTS
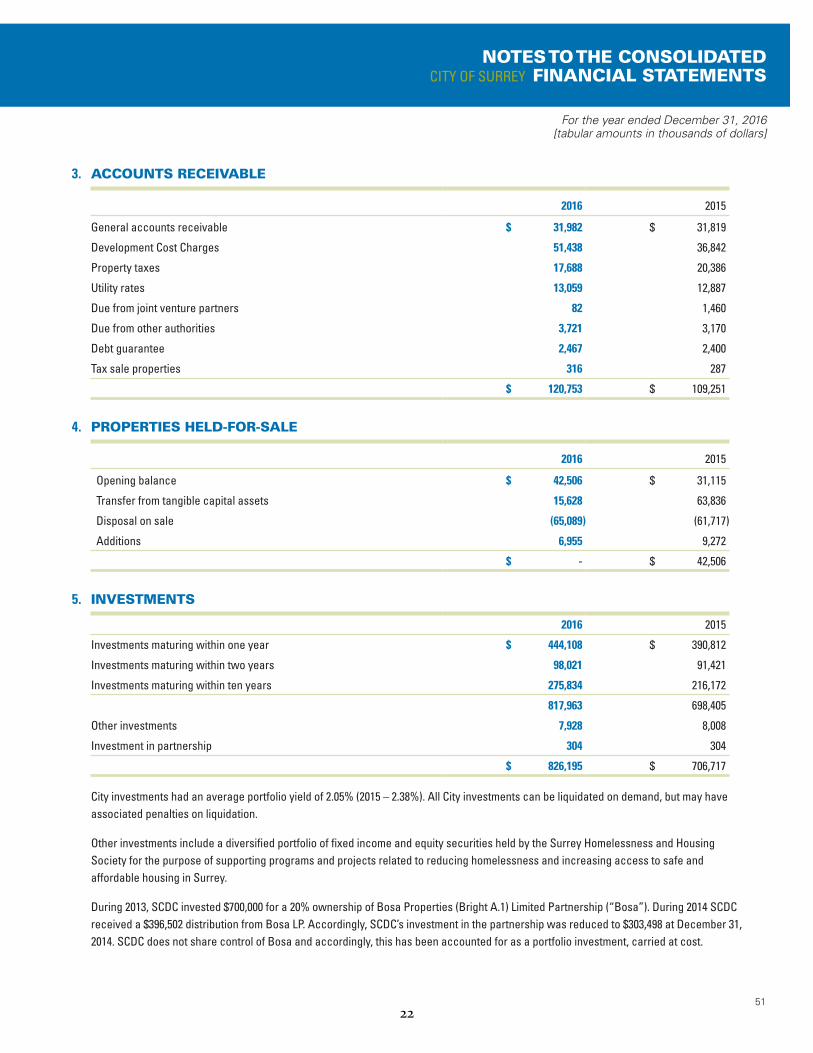
3. ACCOUNTS RECEIVABLE
2016 2015
General accounts receivable $ 31,982 $ 31,819
Development Cost Charges 51,438 36,842
Property taxes 17,688 20,386
Utility rates 13,059 12,887
Due from joint venture partners 82 1,460
Due from other authorities 3,721 3,170
Debt guarantee 2,467 2,400
Tax sale properties 316 287
$ 120,753 $ 109,251
4. PROPERTIES HELD-FOR-SALE
2016 2015
Opening balance $ 42,506 $ 31,115
Transfer from tangible capital assets 15,628 63,836
Disposal on sale (65,089) (61,717)
Additions 6,955 9,272
$ - $ 42,506
5. INVESTMENTS
2016 2015
Investments maturing within one year $ 444,108 $ 390,812
Investments maturing within two years 98,021 91,421
Investments maturing within ten years 275,834 216,172
817,963 698,405
Other investments 7,928 8,008
Investment in partnership 304 304
$ 826,195 $ 706,717
City investments had an average portfolio yield of 2.05% (2015 – 2.38%). All City investments can be liquidated on demand, but may have associated penalties on liquidation.
Other investments include a diversified portfolio of fixed income and equity securities held by the Surrey Homelessness and Housing Society for the purpose of supporting programs and projects related to reducing homelessness and increasing access to safe and affordable housing in Surrey.
During 2013, SCDC invested $700,000 for a 20% ownership of Bosa Properties (Bright A.1) Limited Partnership (“Bosa”). During 2014 SCDC received a $396,502 distribution from Bosa LP. Accordingly, SCDC’s investment in the partnership was reduced to $303,498 at December 31, 2014. SCDC does not share control of Bosa and accordingly, this has been accounted for as a portfolio investment, carried at cost.
22
52
For the year ended December 31, 2016 [tabular amounts in thousands of dollars]
NOTES TO THE CONSOLIDATED FINANCIAL STATEMENTS CITY OF SURREY
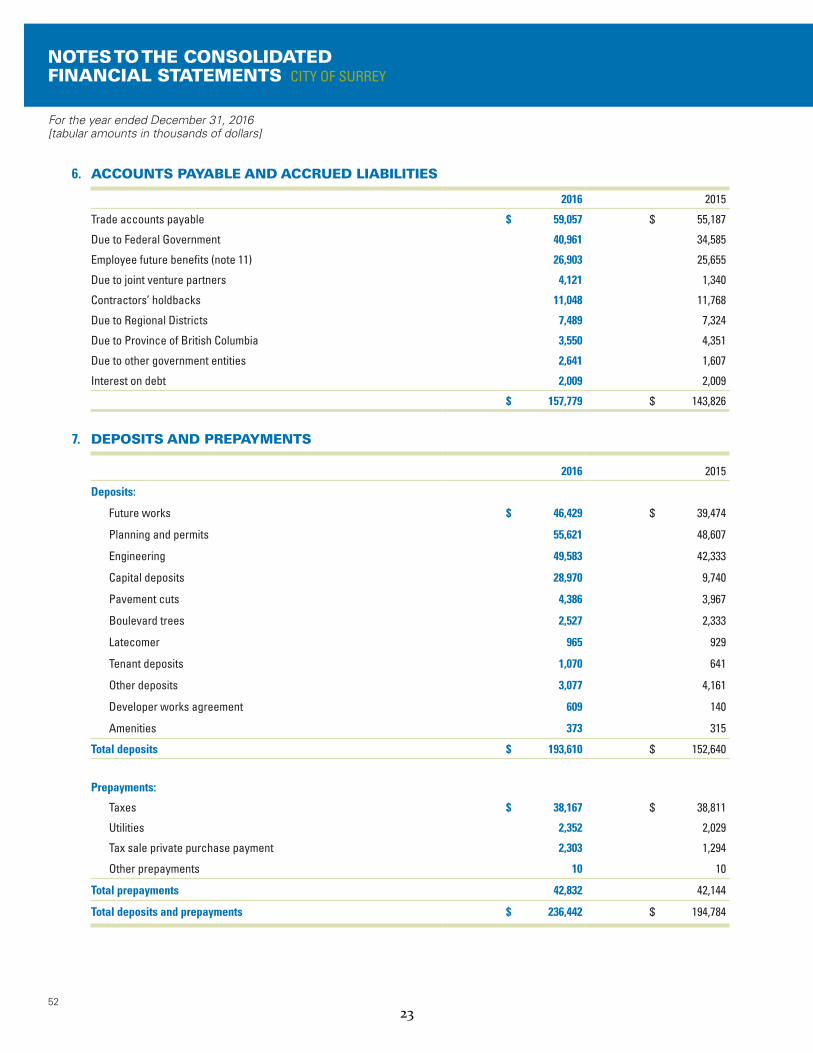
6. ACCOUNTS PAYABLE AND ACCRUED LIABILITIES
2016 2015
Trade accounts payable $ 59,057 $ 55,187
Due to Federal Government 40,961 34,585
Employee future benefits (note 11) 26,903 25,655
Due to joint venture partners 4,121 1,340
Contractors’ holdbacks 11,048 11,768
Due to Regional Districts 7,489 7,324
Due to Province of British Columbia 3,550 4,351
Due to other government entities 2,641 1,607
Interest on debt 2,009 2,009
$ 157,779 $ 143,826
7. DEPOSITS AND PREPAYMENTS
2016 2015
Deposits:
Future works $ 46,429 $ 39,474
Planning and permits 55,621 48,607
Engineering 49,583 42,333
Capital deposits 28,970 9,740
Pavement cuts 4,386 3,967
Boulevard trees 2,527 2,333
Latecomer 965 929
Tenant deposits 1,070 641
Other deposits 3,077 4,161
Developer works agreement 609 140
Amenities 373 315
Total deposits $ 193,610 $ 152,640
Prepayments:
Taxes $ 38,167 $ 38,811
Utilities 2,352 2,029
Tax sale private purchase payment 2,303 1,294
Other prepayments 10 10
Total prepayments 42,832 42,144
Total deposits and prepayments $ 236,442 $ 194,784
23
53
For the year ended December 31, 2016[tabular amounts in thousands of dollars]
NOTES TO THE CONSOLIDATED CITY OF SURREY FINANCIAL STATEMENTS
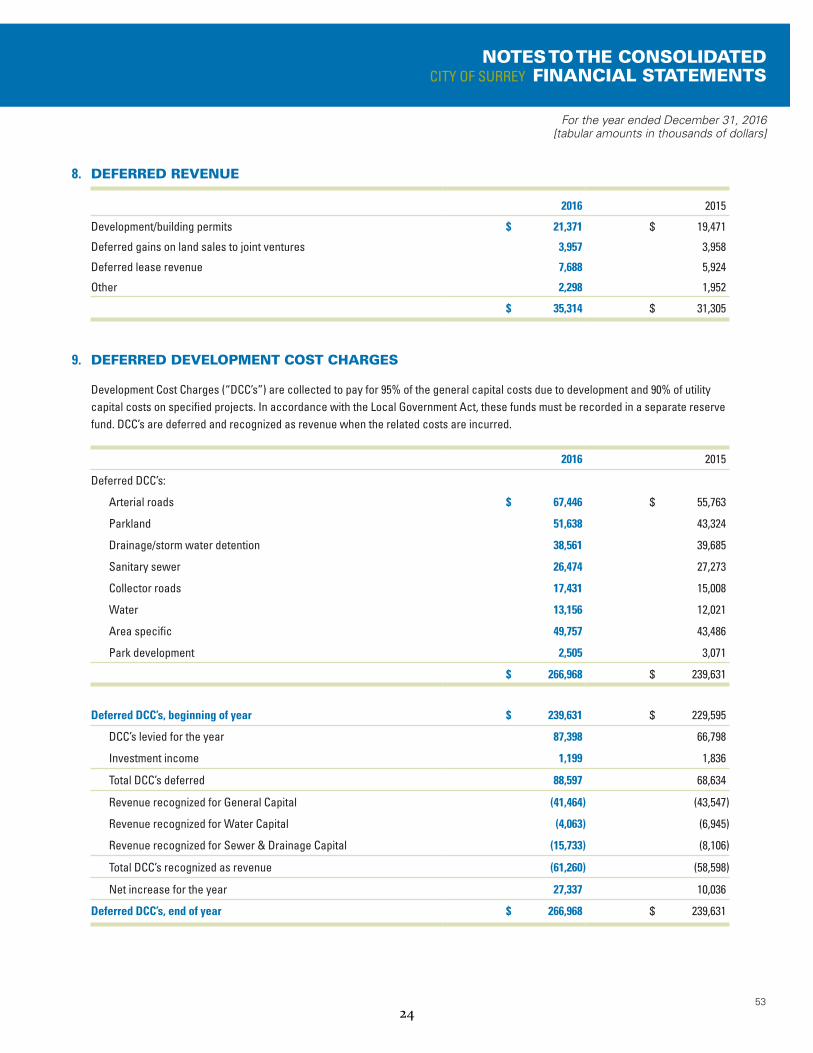
8. DEFERRED REVENUE
2016 2015
Development/building permits $ 21,371 $ 19,471
Deferred gains on land sales to joint ventures 3,957 3,958
Deferred lease revenue 7,688 5,924
Other 2,298 1,952
$ 35,314 $ 31,305
9. DEFERRED DEVELOPMENT COST CHARGES
Development Cost Charges (“DCC’s”) are collected to pay for 95% of the general capital costs due to development and 90% of utility capital costs on specified projects. In accordance with the Local Government Act, these funds must be recorded in a separate reserve fund. DCC’s are deferred and recognized as revenue when the related costs are incurred.
2016 2015
Deferred DCC’s:
Arterial roads $ 67,446 $ 55,763
Parkland 51,638 43,324
Drainage/storm water detention 38,561 39,685
Sanitary sewer 26,474 27,273
Collector roads 17,431 15,008
Water 13,156 12,021
Area specific 49,757 43,486
Park development 2,505 3,071
$ 266,968 $ 239,631
Deferred DCC’s, beginning of year $ 239,631 $ 229,595
DCC’s levied for the year 87,398 66,798
Investment income 1,199 1,836
Total DCC’s deferred 88,597 68,634
Revenue recognized for General Capital (41,464) (43,547)
Revenue recognized for Water Capital (4,063) (6,945)
Revenue recognized for Sewer & Drainage Capital (15,733) (8,106)
Total DCC’s recognized as revenue (61,260) (58,598)
Net increase for the year 27,337 10,036
Deferred DCC’s, end of year $ 266,968 $ 239,631
24
54
For the year ended December 31, 2016 [tabular amounts in thousands of dollars]
NOTES TO THE CONSOLIDATED FINANCIAL STATEMENTS CITY OF SURREY
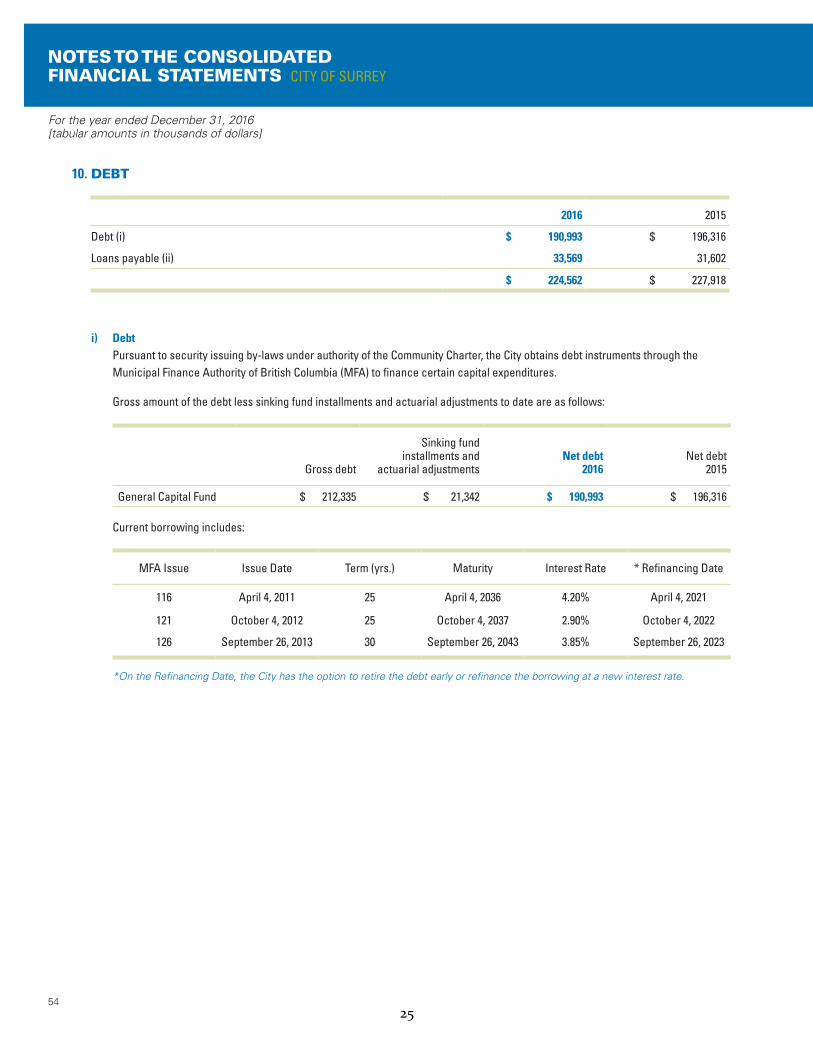
10. DEBT
2016 2015
Debt (i) $ 190,993 $ 196,316
Loans payable (ii) 33,569 31,602
$ 224,562 $ 227,918
i) Debt Pursuant to security issuing by-laws under authority of the Community Charter, the City obtains debt instruments through the Municipal Finance Authority of British Columbia (MFA) to finance certain capital expenditures.
Gross amount of the debt less sinking fund installments and actuarial adjustments to date are as follows:
Gross debt
Sinking fund installments and
actuarial adjustmentsNet debt
2016Net debt
2015
General Capital Fund $ 212,335 $ 21,342 $ 190,993 $ 196,316
Current borrowing includes:
MFA Issue Issue Date Term (yrs.) Maturity Interest Rate * Refinancing Date
116 April 4, 2011 25 April 4, 2036 4.20% April 4, 2021
121 October 4, 2012 25 October 4, 2037 2.90% October 4, 2022
126 September 26, 2013 30 September 26, 2043 3.85% September 26, 2023
*On the Refinancing Date, the City has the option to retire the debt early or refinance the borrowing at a new interest rate.
25
55
For the year ended December 31, 2016[tabular amounts in thousands of dollars]
NOTES TO THE CONSOLIDATED CITY OF SURREY FINANCIAL STATEMENTS
10. DEBT (CONTINUED)
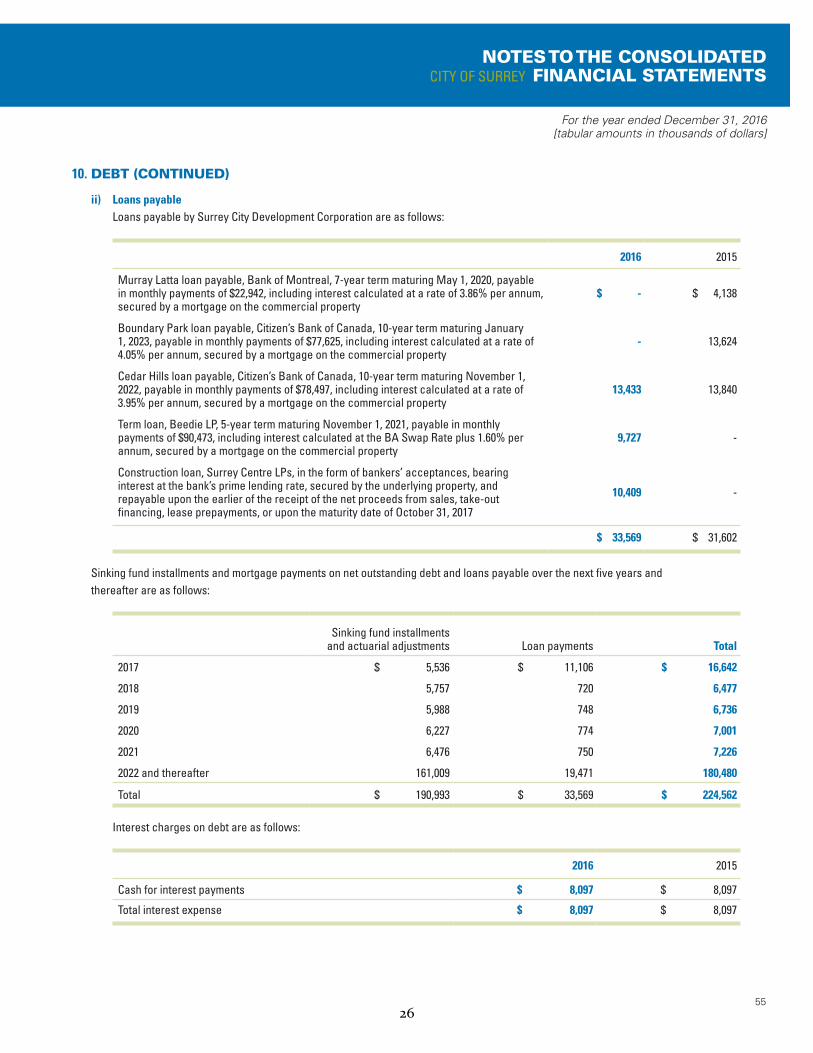
ii) Loans payable Loans payable by Surrey City Development Corporation are as follows:
2016 2015
Murray Latta loan payable, Bank of Montreal, 7-year term maturing May 1, 2020, payable in monthly payments of $22,942, including interest calculated at a rate of 3.86% per annum, secured by a mortgage on the commercial property
$ - $ 4,138
Boundary Park loan payable, Citizen’s Bank of Canada, 10-year term maturing January 1, 2023, payable in monthly payments of $77,625, including interest calculated at a rate of 4.05% per annum, secured by a mortgage on the commercial property
- 13,624
Cedar Hills loan payable, Citizen’s Bank of Canada, 10-year term maturing November 1, 2022, payable in monthly payments of $78,497, including interest calculated at a rate of 3.95% per annum, secured by a mortgage on the commercial property
13,433 13,840
Term loan, Beedie LP, 5-year term maturing November 1, 2021, payable in monthly payments of $90,473, including interest calculated at the BA Swap Rate plus 1.60% per annum, secured by a mortgage on the commercial property
9,727 -
Construction loan, Surrey Centre LPs, in the form of bankers’ acceptances, bearing interest at the bank’s prime lending rate, secured by the underlying property, and repayable upon the earlier of the receipt of the net proceeds from sales, take-out financing, lease prepayments, or upon the maturity date of October 31, 2017
10,409 -
$ 33,569 $ 31,602
Sinking fund installments and mortgage payments on net outstanding debt and loans payable over the next five years and thereafter are as follows:
Sinking fund installments
and actuarial adjustments Loan payments Total
2017 $ 5,536 $ 11,106 $ 16,642
2018 5,757 720 6,477
2019 5,988 748 6,736
2020 6,227 774 7,001
2021 6,476 750 7,226
2022 and thereafter 161,009 19,471 180,480
Total $ 190,993 $ 33,569 $ 224,562
Interest charges on debt are as follows:
2016 2015
Cash for interest payments $ 8,097 $ 8,097
Total interest expense $ 8,097 $ 8,097
26
56
For the year ended December 31, 2016 [tabular amounts in thousands of dollars]
NOTES TO THE CONSOLIDATED FINANCIAL STATEMENTS CITY OF SURREY
11. EMPLOYEE FUTURE BENEFITS
The City provides certain post-employment and sick leave benefits to its employees. These benefits include accumulated non-vested sick leave, post-employment service pay and post-retirement top-ups for dental, life insurance and accidental death, dismemberment insurance, vacation deferral, supplementary vacation and benefit continuation for disabled employees. The liability associated with these benefits is calculated based on the present value of expected future payments pro-rated for services, and is included in accounts payable and accrued liabilities.
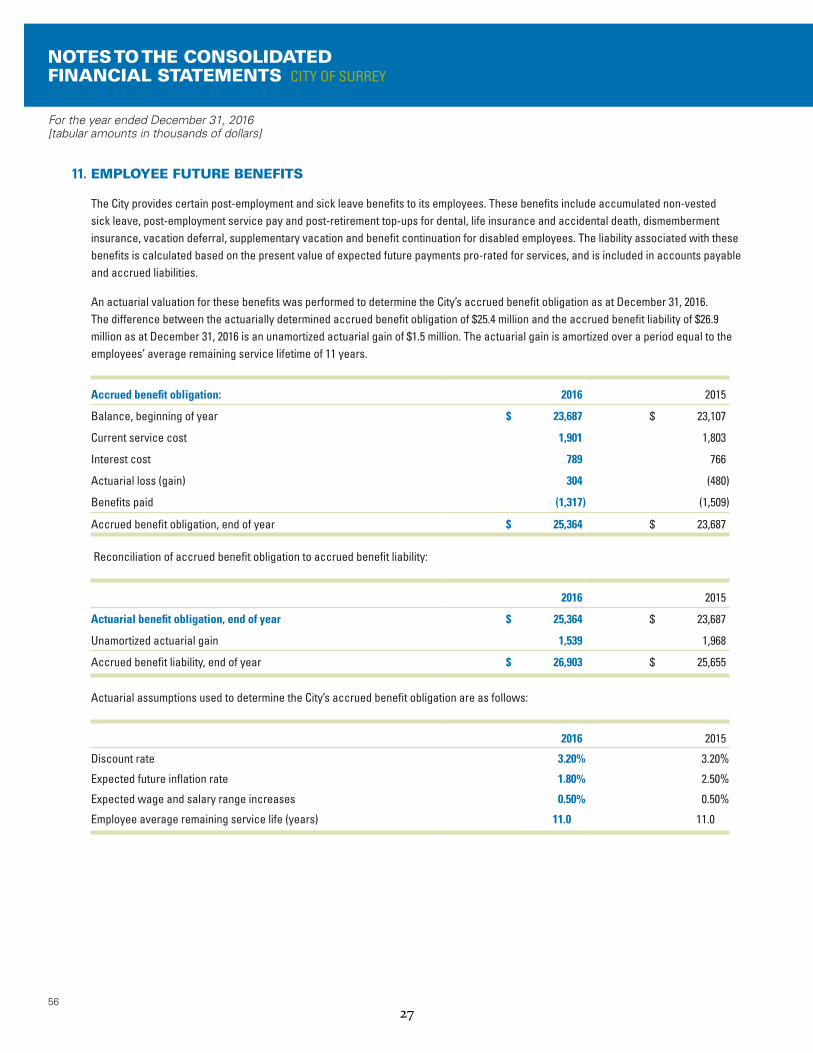
An actuarial valuation for these benefits was performed to determine the City’s accrued benefit obligation as at December 31, 2016. The difference between the actuarially determined accrued benefit obligation of $25.4 million and the accrued benefit liability of $26.9 million as at December 31, 2016 is an unamortized actuarial gain of $1.5 million. The actuarial gain is amortized over a period equal to the employees’ average remaining service lifetime of 11 years.
Accrued benefit obligation: 2016 2015
Balance, beginning of year $ 23,687 $ 23,107
Current service cost 1,901 1,803
Interest cost 789 766
Actuarial loss (gain) 304 (480)
Benefits paid (1,317) (1,509)
Accrued benefit obligation, end of year $ 25,364 $ 23,687
Reconciliation of accrued benefit obligation to accrued benefit liability:
2016 2015
Actuarial benefit obligation, end of year $ 25,364 $ 23,687
Unamortized actuarial gain 1,539 1,968
Accrued benefit liability, end of year $ 26,903 $ 25,655
Actuarial assumptions used to determine the City’s accrued benefit obligation are as follows:
2016 2015
Discount rate 3.20% 3.20%
Expected future inflation rate 1.80% 2.50%
Expected wage and salary range increases 0.50% 0.50%
Employee average remaining service life (years) 11.0 11.0
27
57
For the year ended December 31, 2016[tabular amounts in thousands of dollars]
NOTES TO THE CONSOLIDATED CITY OF SURREY FINANCIAL STATEMENTS
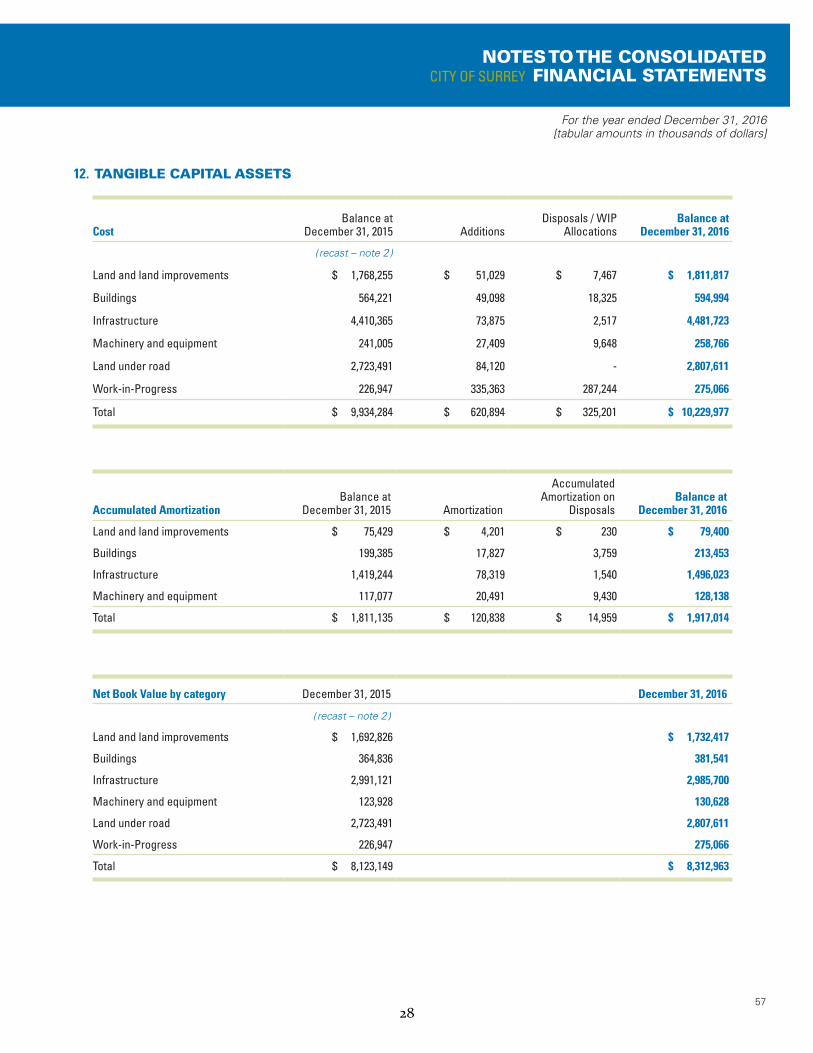
12. TANGIBLE CAPITAL ASSETS
CostBalance at
December 31, 2015 AdditionsDisposals / WIP
AllocationsBalance at
December 31, 2016
( recast – note 2 )
Land and land improvements $ 1,768,255 $ 51,029 $ 7,467 $ 1,811,817
Buildings 564,221 49,098 18,325 594,994
Infrastructure 4,410,365 73,875 2,517 4,481,723
Machinery and equipment 241,005 27,409 9,648 258,766
Land under road 2,723,491 84,120 - 2,807,611
Work-in-Progress 226,947 335,363 287,244 275,066
Total $ 9,934,284 $ 620,894 $ 325,201 $ 10,229,977
Accumulated AmortizationBalance at
December 31, 2015 Amortization
Accumulated Amortization on
DisposalsBalance at
December 31, 2016
Land and land improvements $ 75,429 $ 4,201 $ 230 $ 79,400
Buildings 199,385 17,827 3,759 213,453
Infrastructure 1,419,244 78,319 1,540 1,496,023
Machinery and equipment 117,077 20,491 9,430 128,138
Total $ 1,811,135 $ 120,838 $ 14,959 $ 1,917,014
Net Book Value by category December 31, 2015 December 31, 2016
( recast – note 2 )
Land and land improvements $ 1,692,826 $ 1,732,417
Buildings 364,836 381,541
Infrastructure 2,991,121 2,985,700
Machinery and equipment 123,928 130,628
Land under road 2,723,491 2,807,611
Work-in-Progress 226,947 275,066
Total $ 8,123,149 $ 8,312,963
28
58
For the year ended December 31, 2016 [tabular amounts in thousands of dollars]
NOTES TO THE CONSOLIDATED FINANCIAL STATEMENTS CITY OF SURREY
12. TANGIBLE CAPITAL ASSETS (CONTINUED)
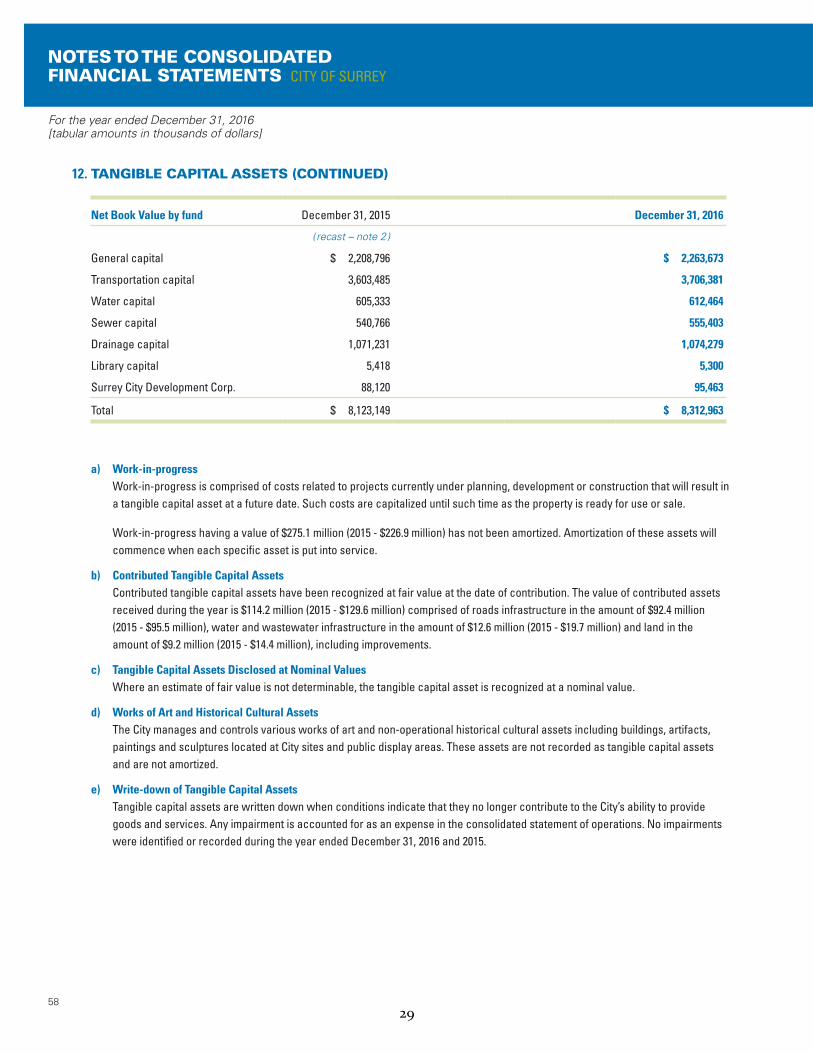
Net Book Value by fund December 31, 2015 December 31, 2016
( recast – note 2 )
General capital $ 2,208,796 $ 2,263,673
Transportation capital 3,603,485 3,706,381
Water capital 605,333 612,464
Sewer capital 540,766 555,403
Drainage capital 1,071,231 1,074,279
Library capital 5,418 5,300
Surrey City Development Corp. 88,120 95,463
Total $ 8,123,149 $ 8,312,963
a) Work-in-progress Work-in-progress is comprised of costs related to projects currently under planning, development or construction that will result in a tangible capital asset at a future date. Such costs are capitalized until such time as the property is ready for use or sale.
Work-in-progress having a value of $275.1 million (2015 - $226.9 million) has not been amortized. Amortization of these assets will commence when each specific asset is put into service.
b) Contributed Tangible Capital Assets Contributed tangible capital assets have been recognized at fair value at the date of contribution. The value of contributed assets received during the year is $114.2 million (2015 - $129.6 million) comprised of roads infrastructure in the amount of $92.4 million (2015 - $95.5 million), water and wastewater infrastructure in the amount of $12.6 million (2015 - $19.7 million) and land in the amount of $9.2 million (2015 - $14.4 million), including improvements.
c) Tangible Capital Assets Disclosed at Nominal Values Where an estimate of fair value is not determinable, the tangible capital asset is recognized at a nominal value.
d) Works of Art and Historical Cultural Assets The City manages and controls various works of art and non-operational historical cultural assets including buildings, artifacts, paintings and sculptures located at City sites and public display areas. These assets are not recorded as tangible capital assets and are not amortized.
e) Write-down of Tangible Capital Assets Tangible capital assets are written down when conditions indicate that they no longer contribute to the City’s ability to provide goods and services. Any impairment is accounted for as an expense in the consolidated statement of operations. No impairments were identified or recorded during the year ended December 31, 2016 and 2015.
29
59
For the year ended December 31, 2016[tabular amounts in thousands of dollars]
NOTES TO THE CONSOLIDATED CITY OF SURREY FINANCIAL STATEMENTS
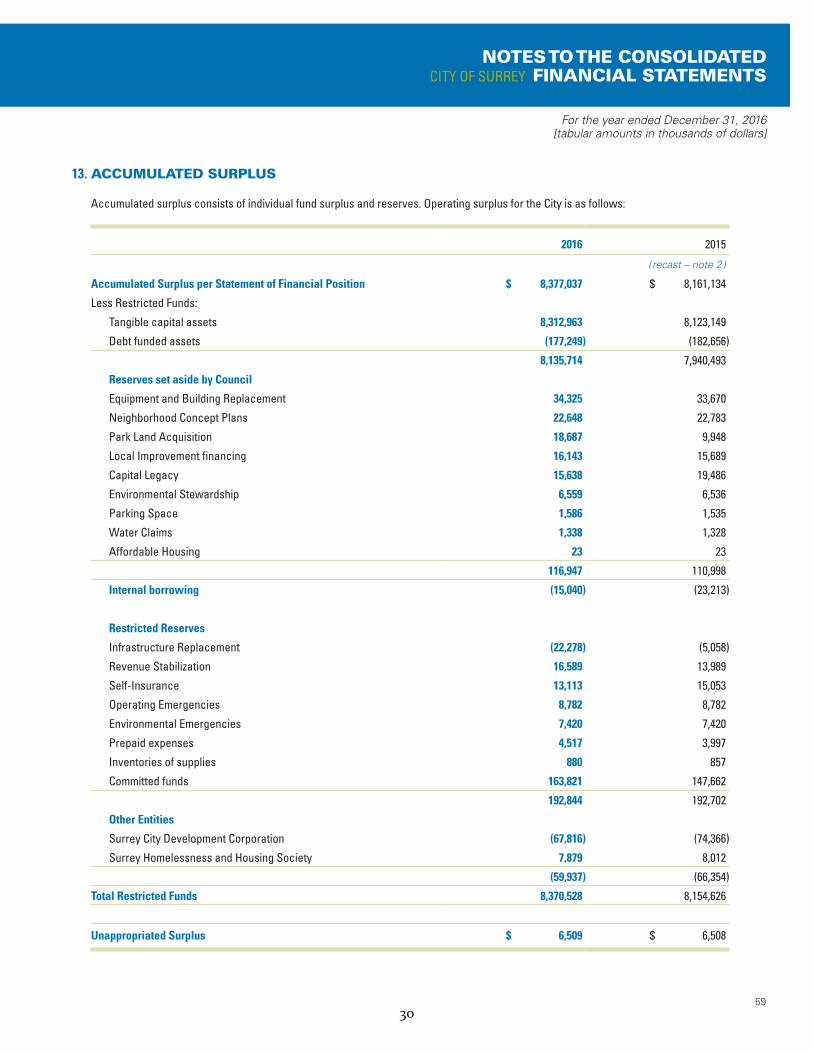
13. ACCUMULATED SURPLUS
Accumulated surplus consists of individual fund surplus and reserves. Operating surplus for the City is as follows:
2016 2015
( recast – note 2 )
Accumulated Surplus per Statement of Financial Position $ 8,377,037 $ 8,161,134
Less Restricted Funds:
Tangible capital assets 8,312,963 8,123,149
Debt funded assets (177,249) (182,656)
8,135,714 7,940,493
Reserves set aside by Council
Equipment and Building Replacement 34,325 33,670
Neighborhood Concept Plans 22,648 22,783
Park Land Acquisition 18,687 9,948
Local Improvement financing 16,143 15,689
Capital Legacy 15,638 19,486
Environmental Stewardship 6,559 6,536
Parking Space 1,586 1,535
Water Claims 1,338 1,328
Affordable Housing 23 23
116,947 110,998
Internal borrowing (15,040) (23,213)
Restricted Reserves
Infrastructure Replacement (22,278) (5,058)
Revenue Stabilization 16,589 13,989
Self-Insurance 13,113 15,053
Operating Emergencies 8,782 8,782
Environmental Emergencies 7,420 7,420
Prepaid expenses 4,517 3,997
Inventories of supplies 880 857
Committed funds 163,821 147,662
192,844 192,702
Other Entities
Surrey City Development Corporation (67,816) (74,366)
Surrey Homelessness and Housing Society 7,879 8,012
(59,937) (66,354)
Total Restricted Funds 8,370,528 8,154,626
Unappropriated Surplus $ 6,509 $ 6,508
30
60
For the year ended December 31, 2016 [tabular amounts in thousands of dollars]
NOTES TO THE CONSOLIDATED FINANCIAL STATEMENTS CITY OF SURREY
14. COMMITMENTS AND CONTINGENCIES
a) The City has significant future contractual commitments for incomplete capital acquisitions and capital construction projects in progress. The City records the capital costs incurred to the end of the year on these projects as work in progress under tangible capital assets. To provide for the completion of the projects, unexpended budget money for incomplete projects is appropriated as Committed Funds (see note 13). The Financial Plan, updated annually, provides for the financing of these and future obligations within the estimated financial resources of the City.
b) The City has a contingent liability with respect to debentures of the Greater Vancouver Water District, Greater Vancouver Sewerage and Drainage District and Greater Vancouver Regional District, to the extent provided in their respective Enabling Acts, Acts of Incorporation and Amending Acts. Management does not consider payment under this contingency to be likely and therefore no amounts have been accrued.
c) The City is a shareholder of the Emergency Communications for Southwest British Columbia Incorporated (E-Comm) whose services provided include: regional 9-1-1 call centre for the Greater Vancouver Regional District; Wide Area Radio network; dispatch operations; and records management. The City holds 2 Class “A” shares and 1 Class “B” share (of a total of 28 Class “A” and 23 Class “B” shares issued and outstanding as at December 31, 2016). As a Class “A” shareholder, the City shares in both funding the future operations and capital obligations of E-Comm (in accordance with a cost sharing formula), including any lease obligations committed to by E-Comm up to the shareholder’s withdrawal date. As a Class “B” shareholder, the City is obligated to share in funding of the ongoing operating costs. In accordance with the members’ agreement, upon withdrawal from E-Comm, Class A shareholders shall be obligated to pay to the withdrawal date as requested by E-Comm their share of the class A shareholders’ obligation to any long-term capital obligations, including any lease obligations. This includes any lease obligations or repayments thereof committed to by E-Comm up to the withdrawal date.
d) The City entered into an agreement with the YMCA of Greater Vancouver for the joint development of a facility in Surrey. The City contributed $5.5 million towards the completion of the project, which was matched by the YMCA. The City has also provided a guarantee through an $8.0 million pledge agreement in connection with a non-recourse first collateral mortgage expiring October 15, 2017, in favor of the Royal Bank of Canada that is registered against the land and facility, which can be renewed annually. The City does not expect to make any payments on the guarantee and no amounts have been accrued in the financial statements.
e) The City insures itself through a combination of insurance policies and self-insurance. The City has a funded self-insurance appropriation included in surplus (note 13). Based on estimates, this appropriation reasonably provides for all outstanding claims where the outcome is not currently determinable.
f) The City is, from time to time, engaged in or party to certain legal actions, assessment appeals and other existing conditions involving uncertainty which may result in material losses. The outcome and amounts that may be payable, if any, under some of these claims, cannot be determined and accordingly only those claims in which a payment is considered likely and the amounts
can be reasonably estimated have been recorded in the financial statements as a liability.
31
61
For the year ended December 31, 2016[tabular amounts in thousands of dollars]
NOTES TO THE CONSOLIDATED CITY OF SURREY FINANCIAL STATEMENTS
14. COMMITMENTS AND CONTINGENCIES (CONTINUED)
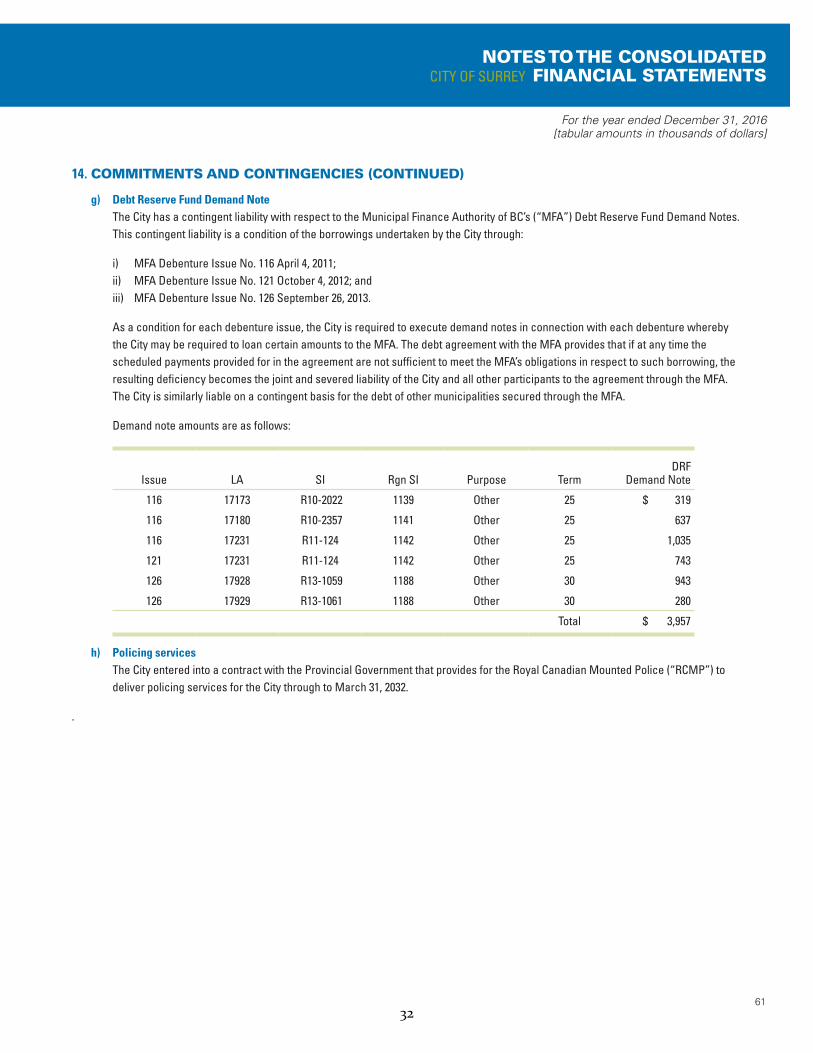
g) Debt Reserve Fund Demand Note The City has a contingent liability with respect to the Municipal Finance Authority of BC’s (“MFA”) Debt Reserve Fund Demand Notes. This contingent liability is a condition of the borrowings undertaken by the City through:
i) MFA Debenture Issue No. 116 April 4, 2011; ii) MFA Debenture Issue No. 121 October 4, 2012; and iii) MFA Debenture Issue No. 126 September 26, 2013.
As a condition for each debenture issue, the City is required to execute demand notes in connection with each debenture whereby the City may be required to loan certain amounts to the MFA. The debt agreement with the MFA provides that if at any time the scheduled payments provided for in the agreement are not sufficient to meet the MFA’s obligations in respect to such borrowing, the resulting deficiency becomes the joint and severed liability of the City and all other participants to the agreement through the MFA. The City is similarly liable on a contingent basis for the debt of other municipalities secured through the MFA.
Demand note amounts are as follows:
Issue LA SI Rgn SI Purpose TermDRF
Demand Note
116 17173 R10-2022 1139 Other 25 $ 319
116 17180 R10-2357 1141 Other 25 637
116 17231 R11-124 1142 Other 25 1,035
121 17231 R11-124 1142 Other 25 743
126 17928 R13-1059 1188 Other 30 943
126 17929 R13-1061 1188 Other 30 280
Total $ 3,957
h) Policing services The City entered into a contract with the Provincial Government that provides for the Royal Canadian Mounted Police (“RCMP”) to deliver policing services for the City through to March 31, 2032.
.
32
62
For the year ended December 31, 2016 [tabular amounts in thousands of dollars]
NOTES TO THE CONSOLIDATED FINANCIAL STATEMENTS CITY OF SURREY
14. COMMITMENTS AND CONTINGENCIES (CONTINUED)
i) Surrey Organics Biofuel Processing facility The City has entered into a 25-year agreement with Orgaworld Surrey Limited Partnership (the “Operator”) to design, build, finance, operate and maintain the Surrey Organics Biofuel Processing facility. The City has provided the land upon which the facility is being constructed and will fund 25% of the construction costs up to a maximum of $16 million, to be received through a P3 Canada Infrastructure Grant. The constructions costs, as at December 31, 2016, were $45 million. Under the agreement, the City has guaranteed to deliver to the Operator a minimum tonnage of City Organic Waste (as defined in the Agreement) for processing. The City will make payments to the Operator for acceptance of City Organic Waste in accordance with a specified formula. The Operator will also have the right to earn revenue from the delivery/acceptance of organic waste from third parties. In return the City will receive 100% of the biomethane produced at the facility and will share in certain other revenues generated at the facility. Upon expiry of the lease term the facility will become the asset of the City.
The facility is expected to be completed and to commence operation in 2017. At the time of completion, the City will receive the grant revenue from P3 Canada and remit the funds to the Operator. The City will record the facility on its financial statements as a tangible capital asset in the amount of its cost of construction, estimated to be approximately $60 million. The City will also record a liability representing future obligations to the Operator in an amount equal to the difference between the construction cost of the facility and the P3 Canada Infrastructure Grant. The liability and deferred revenue will be reduced over the term of the agreement as payments are made to the Operator.
15. PENSION PLAN
The City and its employees contribute to the Municipal Pension Plan (the “Plan”), a jointly trusteed pension plan. The Board of Trustees, representing plan members and employers, is responsible for administering the Plan, including investment of the assets and administration of benefits. The Plan is a multi-employer defined benefit pension plan. Basic pension benefits provided are based on a formula. As at December 31, 2016, the Plan has about 189,000 active members and approximately 85,000 retired members. Active members include approximately 37,000 contributors from local government.
Every three years, an actuarial valuation is performed to assess the financial position of the plan and adequacy of plan funding. The most recent valuation for the Plan as at December 31, 2015, indicated a $2,224 million funding surplus for basic pension benefits on a going concern basis. The next valuation will be as at December 31, 2018, with results available in 2019.
Employers participating in the Plan record their pension expense as the amount of employer contributions made during the fiscal year (defined contribution pension plan accounting). This is because the Plan records accrued liabilities and accrued assets for the Plan in aggregate, resulting in no consistent and reliable basis for allocating the obligation, assets and cost to the individual employers participating in the Plan.
The City paid $17.6 million (2015 - $16.8 million) for employer contributions while employees contributed $14.7 million (2015 - $14.0 million) to the Plan in 2016.
33
63
For the year ended December 31, 2016[tabular amounts in thousands of dollars]
NOTES TO THE CONSOLIDATED CITY OF SURREY FINANCIAL STATEMENTS
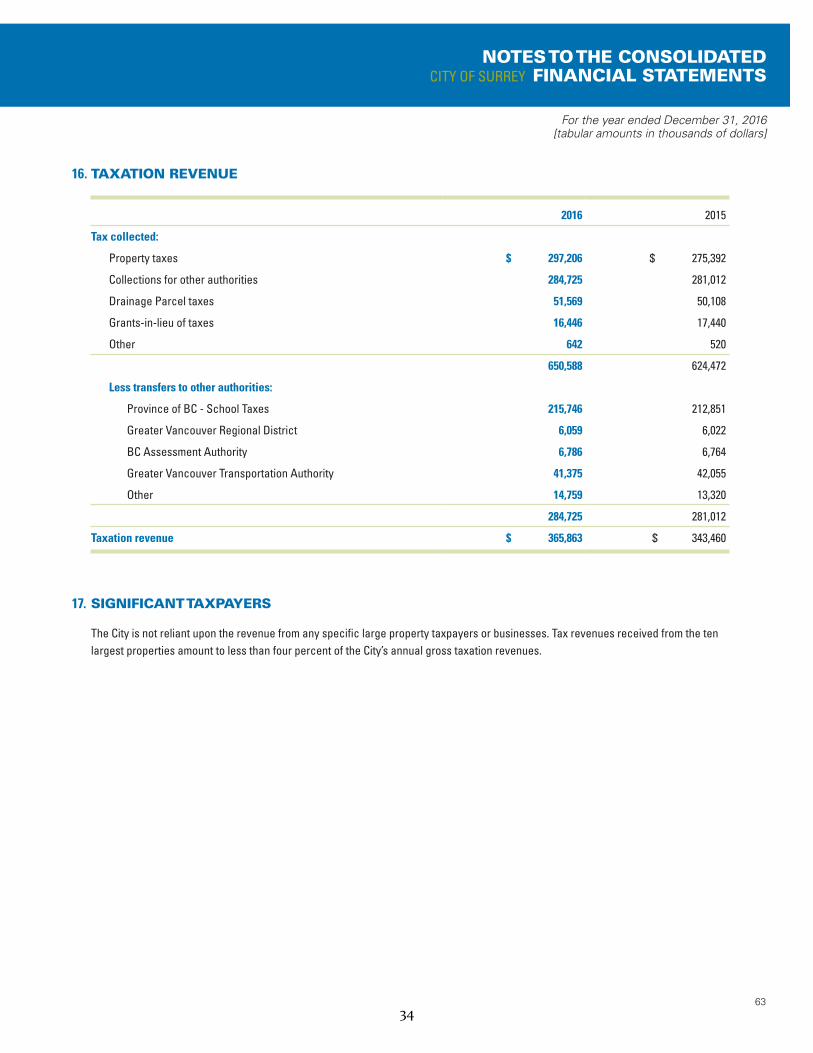
16. TAXATION REVENUE
2016 2015
Tax collected:
Property taxes $ 297,206 $ 275,392
Collections for other authorities 284,725 281,012
Drainage Parcel taxes 51,569 50,108
Grants-in-lieu of taxes 16,446 17,440
Other 642 520
650,588 624,472
Less transfers to other authorities:
Province of BC - School Taxes 215,746 212,851
Greater Vancouver Regional District 6,059 6,022
BC Assessment Authority 6,786 6,764
Greater Vancouver Transportation Authority 41,375 42,055
Other 14,759 13,320
284,725 281,012
Taxation revenue $ 365,863 $ 343,460
17. SIGNIFICANT TAXPAYERS
The City is not reliant upon the revenue from any specific large property taxpayers or businesses. Tax revenues received from the ten largest properties amount to less than four percent of the City’s annual gross taxation revenues.
34
64
For the year ended December 31, 2016 [tabular amounts in thousands of dollars]
NOTES TO THE CONSOLIDATED FINANCIAL STATEMENTS CITY OF SURREY
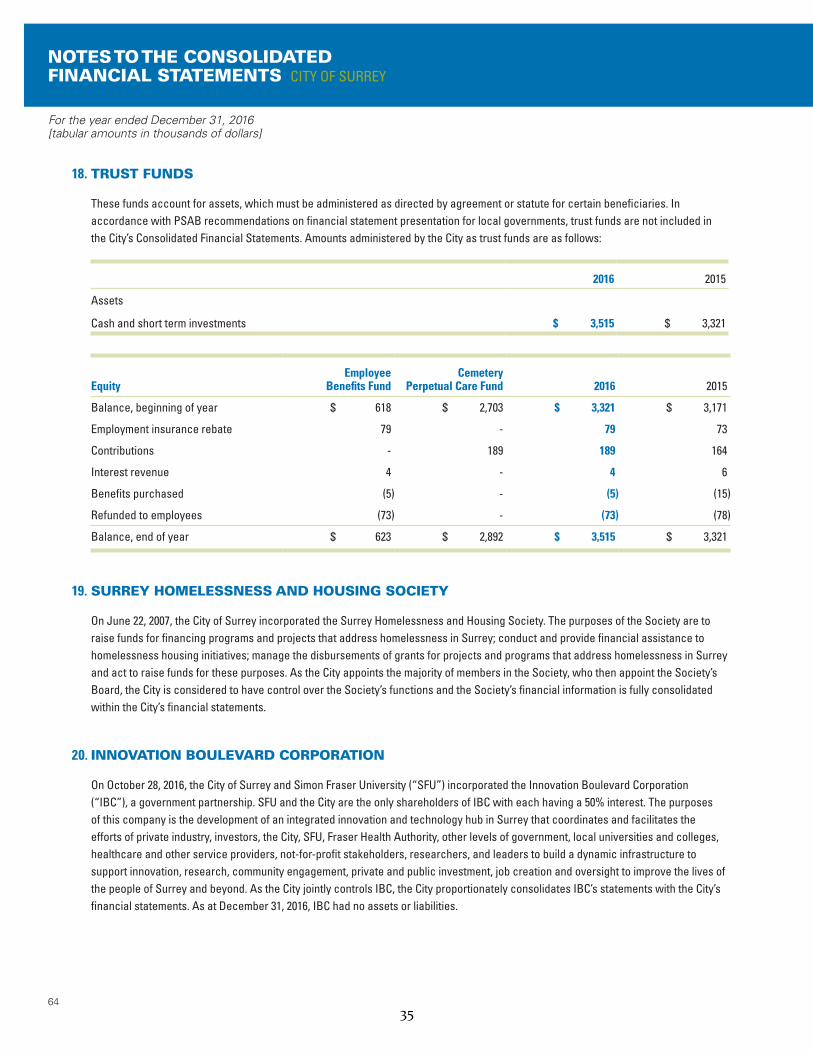
18. TRUST FUNDS
These funds account for assets, which must be administered as directed by agreement or statute for certain beneficiaries. In accordance with PSAB recommendations on financial statement presentation for local governments, trust funds are not included in the City’s Consolidated Financial Statements. Amounts administered by the City as trust funds are as follows:
2016 2015
Assets
Cash and short term investments $ 3,515 $ 3,321
Equity Employee
Benefits Fund Cemetery
Perpetual Care Fund 2016 2015
Balance, beginning of year $ 618 $ 2,703 $ 3,321 $ 3,171
Employment insurance rebate 79 - 79 73
Contributions - 189 189 164
Interest revenue 4 - 4 6
Benefits purchased (5) - (5) (15)
Refunded to employees (73) - (73) (78)
Balance, end of year $ 623 $ 2,892 $ 3,515 $ 3,321
19. SURREY HOMELESSNESS AND HOUSING SOCIETY
On June 22, 2007, the City of Surrey incorporated the Surrey Homelessness and Housing Society. The purposes of the Society are to raise funds for financing programs and projects that address homelessness in Surrey; conduct and provide financial assistance to homelessness housing initiatives; manage the disbursements of grants for projects and programs that address homelessness in Surrey and act to raise funds for these purposes. As the City appoints the majority of members in the Society, who then appoint the Society’s Board, the City is considered to have control over the Society’s functions and the Society’s financial information is fully consolidated within the City’s financial statements.
20. INNOVATION BOULEVARD CORPORATION
On October 28, 2016, the City of Surrey and Simon Fraser University (“SFU”) incorporated the Innovation Boulevard Corporation (“IBC”), a government partnership. SFU and the City are the only shareholders of IBC with each having a 50% interest. The purposes of this company is the development of an integrated innovation and technology hub in Surrey that coordinates and facilitates the efforts of private industry, investors, the City, SFU, Fraser Health Authority, other levels of government, local universities and colleges, healthcare and other service providers, not-for-profit stakeholders, researchers, and leaders to build a dynamic infrastructure to support innovation, research, community engagement, private and public investment, job creation and oversight to improve the lives of the people of Surrey and beyond. As the City jointly controls IBC, the City proportionately consolidates IBC’s statements with the City’s financial statements. As at December 31, 2016, IBC had no assets or liabilities.
35
65
For the year ended December 31, 2016[tabular amounts in thousands of dollars]
NOTES TO THE CONSOLIDATED CITY OF SURREY FINANCIAL STATEMENTS
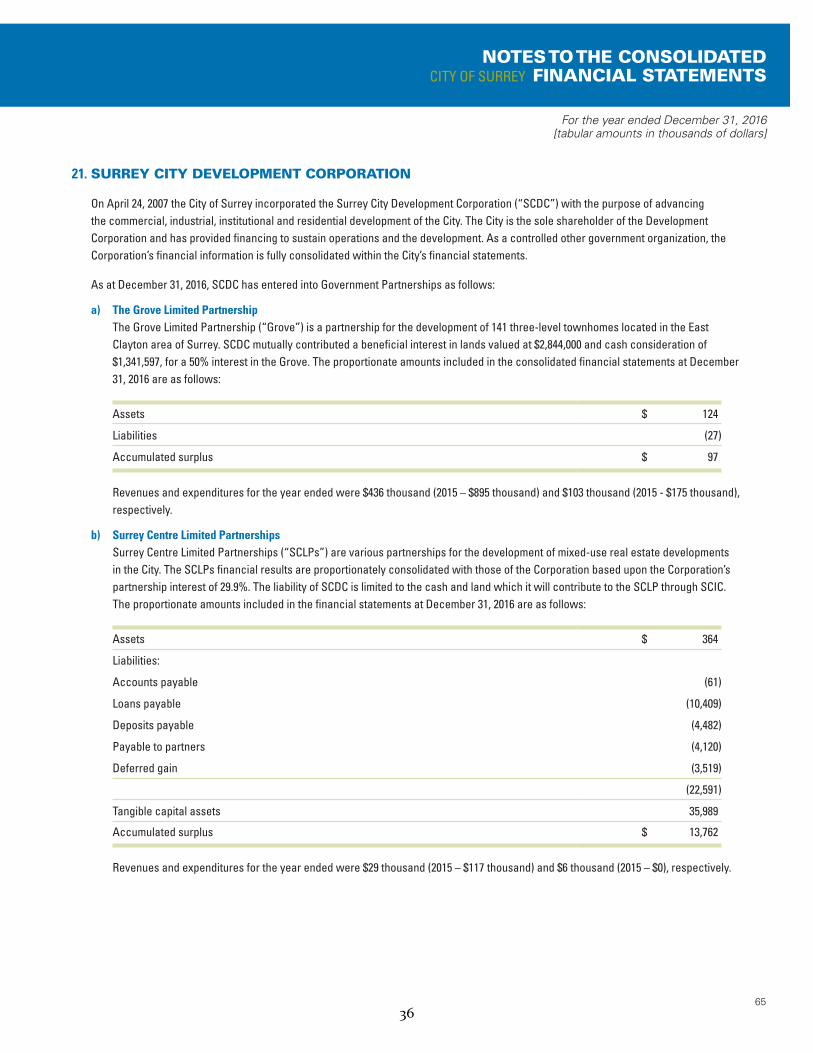
21. SURREY CITY DEVELOPMENT CORPORATION
On April 24, 2007 the City of Surrey incorporated the Surrey City Development Corporation (“SCDC”) with the purpose of advancing the commercial, industrial, institutional and residential development of the City. The City is the sole shareholder of the Development Corporation and has provided financing to sustain operations and the development. As a controlled other government organization, the Corporation’s financial information is fully consolidated within the City’s financial statements.
As at December 31, 2016, SCDC has entered into Government Partnerships as follows:
a) The Grove Limited Partnership The Grove Limited Partnership (“Grove”) is a partnership for the development of 141 three-level townhomes located in the East Clayton area of Surrey. SCDC mutually contributed a beneficial interest in lands valued at $2,844,000 and cash consideration of $1,341,597, for a 50% interest in the Grove. The proportionate amounts included in the consolidated financial statements at December 31, 2016 are as follows:
Assets $ 124
Liabilities (27)
Accumulated surplus $ 97
Revenues and expenditures for the year ended were $436 thousand (2015 – $895 thousand) and $103 thousand (2015 - $175 thousand), respectively.
b) Surrey Centre Limited Partnerships Surrey Centre Limited Partnerships (“SCLPs”) are various partnerships for the development of mixed-use real estate developments in the City. The SCLPs financial results are proportionately consolidated with those of the Corporation based upon the Corporation’s partnership interest of 29.9%. The liability of SCDC is limited to the cash and land which it will contribute to the SCLP through SCIC. The proportionate amounts included in the financial statements at December 31, 2016 are as follows:
Assets $ 364
Liabilities:
Accounts payable (61)
Loans payable (10,409)
Deposits payable (4,482)
Payable to partners (4,120)
Deferred gain (3,519)
(22,591)
Tangible capital assets 35,989
Accumulated surplus $ 13,762
Revenues and expenditures for the year ended were $29 thousand (2015 – $117 thousand) and $6 thousand (2015 – $0), respectively.
36
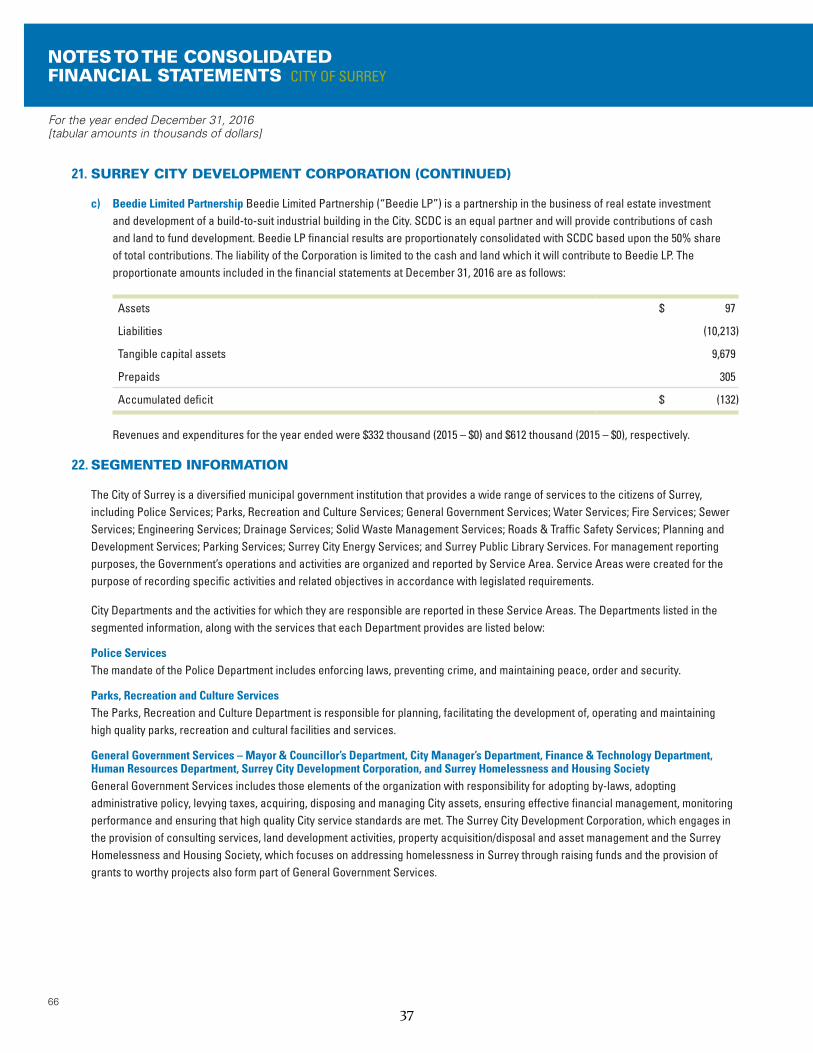
66
For the year ended December 31, 2016 [tabular amounts in thousands of dollars]
NOTES TO THE CONSOLIDATED FINANCIAL STATEMENTS CITY OF SURREY
21. SURREY CITY DEVELOPMENT CORPORATION (CONTINUED)
c) Beedie Limited Partnership Beedie Limited Partnership (“Beedie LP”) is a partnership in the business of real estate investment and development of a build-to-suit industrial building in the City. SCDC is an equal partner and will provide contributions of cash and land to fund development. Beedie LP financial results are proportionately consolidated with SCDC based upon the 50% share of total contributions. The liability of the Corporation is limited to the cash and land which it will contribute to Beedie LP. The proportionate amounts included in the financial statements at December 31, 2016 are as follows:
Assets $ 97
Liabilities (10,213)
Tangible capital assets 9,679
Prepaids 305
Accumulated deficit $ (132)
Revenues and expenditures for the year ended were $332 thousand (2015 – $0) and $612 thousand (2015 – $0), respectively.
22. SEGMENTED INFORMATION
The City of Surrey is a diversified municipal government institution that provides a wide range of services to the citizens of Surrey, including Police Services; Parks, Recreation and Culture Services; General Government Services; Water Services; Fire Services; Sewer Services; Engineering Services; Drainage Services; Solid Waste Management Services; Roads & Traffic Safety Services; Planning and Development Services; Parking Services; Surrey City Energy Services; and Surrey Public Library Services. For management reporting purposes, the Government’s operations and activities are organized and reported by Service Area. Service Areas were created for the purpose of recording specific activities and related objectives in accordance with legislated requirements.
City Departments and the activities for which they are responsible are reported in these Service Areas. The Departments listed in the segmented information, along with the services that each Department provides are listed below:
Police Services The mandate of the Police Department includes enforcing laws, preventing crime, and maintaining peace, order and security.
Parks, Recreation and Culture Services The Parks, Recreation and Culture Department is responsible for planning, facilitating the development of, operating and maintaining high quality parks, recreation and cultural facilities and services.
General Government Services – Mayor & Councillor’s Department, City Manager’s Department, Finance & Technology Department, Human Resources Department, Surrey City Development Corporation, and Surrey Homelessness and Housing Society General Government Services includes those elements of the organization with responsibility for adopting by-laws, adopting administrative policy, levying taxes, acquiring, disposing and managing City assets, ensuring effective financial management, monitoring performance and ensuring that high quality City service standards are met. The Surrey City Development Corporation, which engages in the provision of consulting services, land development activities, property acquisition/disposal and asset management and the Surrey Homelessness and Housing Society, which focuses on addressing homelessness in Surrey through raising funds and the provision of grants to worthy projects also form part of General Government Services.
37
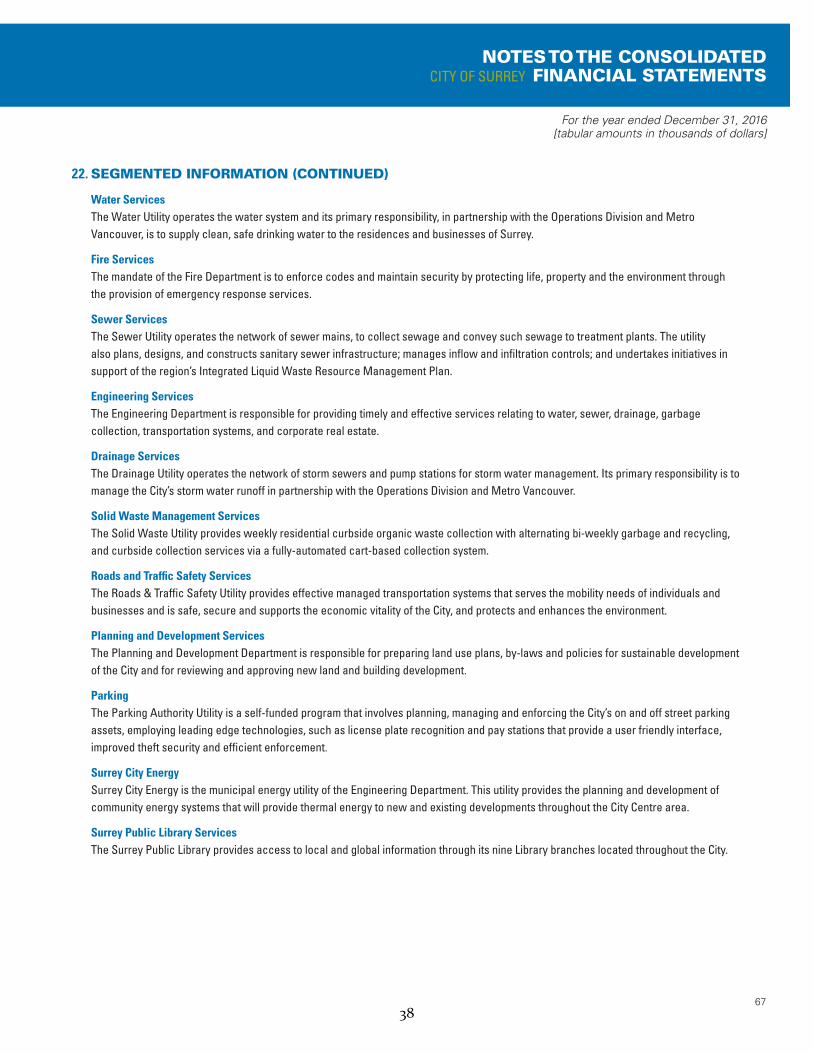
67
For the year ended December 31, 2016[tabular amounts in thousands of dollars]
NOTES TO THE CONSOLIDATED CITY OF SURREY FINANCIAL STATEMENTS
22. SEGMENTED INFORMATION (CONTINUED)
Water Services The Water Utility operates the water system and its primary responsibility, in partnership with the Operations Division and Metro Vancouver, is to supply clean, safe drinking water to the residences and businesses of Surrey.
Fire Services The mandate of the Fire Department is to enforce codes and maintain security by protecting life, property and the environment through the provision of emergency response services.
Sewer Services The Sewer Utility operates the network of sewer mains, to collect sewage and convey such sewage to treatment plants. The utility also plans, designs, and constructs sanitary sewer infrastructure; manages inflow and infiltration controls; and undertakes initiatives in support of the region’s Integrated Liquid Waste Resource Management Plan.
Engineering Services The Engineering Department is responsible for providing timely and effective services relating to water, sewer, drainage, garbage collection, transportation systems, and corporate real estate.
Drainage Services The Drainage Utility operates the network of storm sewers and pump stations for storm water management. Its primary responsibility is to manage the City’s storm water runoff in partnership with the Operations Division and Metro Vancouver.
Solid Waste Management Services The Solid Waste Utility provides weekly residential curbside organic waste collection with alternating bi-weekly garbage and recycling, and curbside collection services via a fully-automated cart-based collection system.
Roads and Traffic Safety Services The Roads & Traffic Safety Utility provides effective managed transportation systems that serves the mobility needs of individuals and businesses and is safe, secure and supports the economic vitality of the City, and protects and enhances the environment.
Planning and Development Services The Planning and Development Department is responsible for preparing land use plans, by-laws and policies for sustainable development of the City and for reviewing and approving new land and building development.
Parking The Parking Authority Utility is a self-funded program that involves planning, managing and enforcing the City’s on and off street parking assets, employing leading edge technologies, such as license plate recognition and pay stations that provide a user friendly interface, improved theft security and efficient enforcement.
Surrey City Energy Surrey City Energy is the municipal energy utility of the Engineering Department. This utility provides the planning and development of community energy systems that will provide thermal energy to new and existing developments throughout the City Centre area.
Surrey Public Library Services The Surrey Public Library provides access to local and global information through its nine Library branches located throughout the City.
38
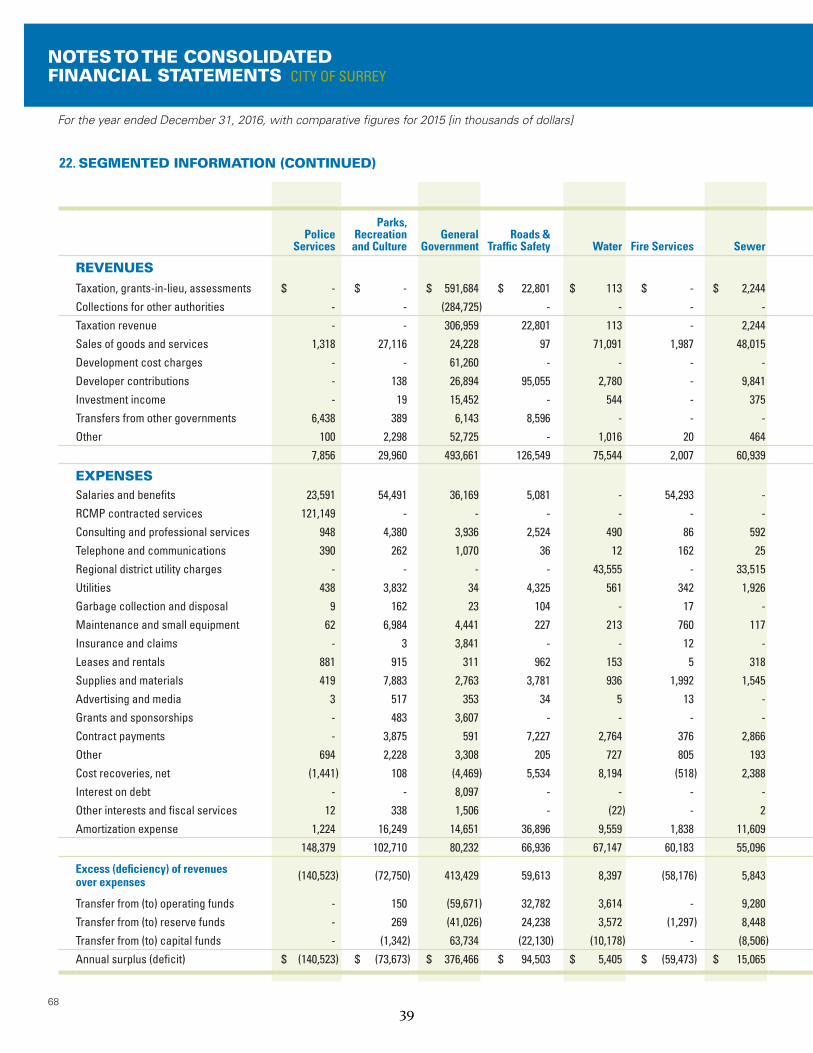
68
NOTES TO THE CONSOLIDATED FINANCIAL STATEMENTS CITY OF SURREY
CONSOLIDATED
Police Services
Parks, Recreation and Culture
General Government
Roads & Traffic Safety Water Fire Services Sewer
Solid Waste Management Drainage
Planning and Development
Library Services Engineering
Surrey City Energy Parking 2016 2015
REVENUESTaxation, grants-in-lieu, assessments $ - $ - $ 591,684 $ 22,801 $ 113 $ - $ 2,244 $ - $ 33,746 $ - $ - $ - $ - $ - $ 650,588 $ 624,472
Collections for other authorities - - (284,725) - - - - - - - - - - - (284,725) (281,012)
Taxation revenue - - 306,959 22,801 113 - 2,244 - 33,746 - - - - - 365,863 343,460
Sales of goods and services 1,318 27,116 24,228 97 71,091 1,987 48,015 39,744 - 3,697 256 5,644 283 2,766 226,242 211,520
Development cost charges - - 61,260 - - - - - - - - - - - 61,260 58,598
Developer contributions - 138 26,894 95,055 2,780 - 9,841 - 6,481 - 25 - - - 141,214 143,004
Investment income - 19 15,452 - 544 - 375 - 110 - - - - - 16,500 16,437
Transfers from other governments 6,438 389 6,143 8,596 - - - - 245 - 973 - - - 22,784 22,405
Other 100 2,298 52,725 - 1,016 20 464 139 99 20,715 395 2,252 - 615 80,838 58,016
7,856 29,960 493,661 126,549 75,544 2,007 60,939 39,883 40,681 24,412 1,649 7,896 283 3,381 914,701 853,440
EXPENSESSalaries and benefits 23,591 54,491 36,169 5,081 - 54,293 - - - 20,121 13,282 36,830 372 626 244,856 227,643
RCMP contracted services 121,149 - - - - - - - - - - - - - 121,149 107,732
Consulting and professional services 948 4,380 3,936 2,524 490 86 592 834 2,676 729 84 388 37 9 17,713 19,000
Telephone and communications 390 262 1,070 36 12 162 25 8 11 69 30 122 1 41 2,239 2,075
Regional district utility charges - - - - 43,555 - 33,515 - - - - - - - 77,070 74,240
Utilities 438 3,832 34 4,325 561 342 1,926 - 8 478 373 597 150 - 13,064 11,574
Garbage collection and disposal 9 162 23 104 - 17 - 19,923 2 9 9 37 - - 20,295 18,934
Maintenance and small equipment 62 6,984 4,441 227 213 760 117 18 182 1,533 194 985 10 145 15,871 16,858
Insurance and claims - 3 3,841 - - 12 - 2 - - - 58 - - 3,916 3,309
Leases and rentals 881 915 311 962 153 5 318 264 747 8 47 405 - - 5,016 4,312
Supplies and materials 419 7,883 2,763 3,781 936 1,992 1,545 2,312 874 1,651 441 5,106 5 29 29,737 28,547
Advertising and media 3 517 353 34 5 13 - 24 4 17 1,095 18 - - 2,083 2,066
Grants and sponsorships - 483 3,607 - - - - - - 80 - - - - 4,170 2,684
Contract payments - 3,875 591 7,227 2,764 376 2,866 596 1,286 14 20 1,244 8 289 21,156 31,629
Other 694 2,228 3,308 205 727 805 193 75 638 1,224 691 760 - 8 11,556 12,587
Cost recoveries, net (1,441) 108 (4,469) 5,534 8,194 (518) 2,388 3,361 6,241 (575) 272 (40,947) (231) (61) (22,144) (19,898)
Interest on debt - - 8,097 - - - - - - - - - - - 8,097 8,097
Other interests and fiscal services 12 338 1,506 - (22) - 2 62 - 26 5 1 43 143 2,116 2,247
Amortization expense 1,224 16,249 14,651 36,896 9,559 1,838 11,609 1,520 19,502 65 1,989 4,722 - 1,014 120,838 116,837
148,379 102,710 80,232 66,936 67,147 60,183 55,096 28,999 32,171 25,449 18,532 10,326 395 2,243 698,798 670,473
Excess (deficiency) of revenues over expenses (140,523) (72,750) 413,429 59,613 8,397 (58,176) 5,843 10,884 8,510 (1,037) (16,883) (2,430) (112) 1,138 215,903 182,967
Transfer from (to) operating funds - 150 (59,671) 32,782 3,614 - 9,280 (6,133) 1,220 - 16,258 4,206 (215) (1,491) - -
Transfer from (to) reserve funds - 269 (41,026) 24,238 3,572 (1,297) 8,448 - 7,668 (166) 509 (2,215) - - - -
Transfer from (to) capital funds - (1,342) 63,734 (22,130) (10,178) - (8,506) (13) (17,677) 202 (5) 58 (4,206) 63 - -
Annual surplus (deficit) $ (140,523) $ (73,673) $ 376,466 $ 94,503 $ 5,405 $ (59,473) $ 15,065 $ 4,738 $ (279) $ (1,001) $ (121) $ (381) $ (4,533) $ (290) $ 215,903 $ 182,967
For the year ended December 31, 2016, with comparative figures for 2015 [in thousands of dollars]
22. SEGMENTED INFORMATION (CONTINUED)
39
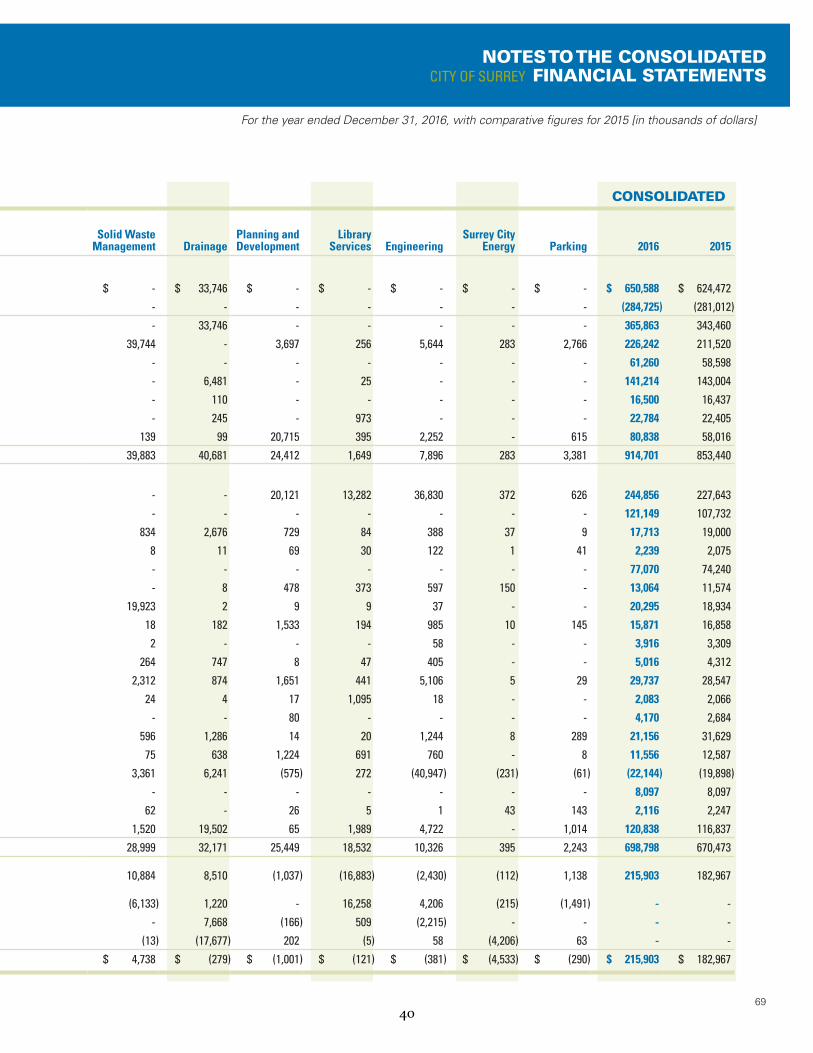
69
NOTES TO THE CONSOLIDATED CITY OF SURREY FINANCIAL STATEMENTS
CONSOLIDATED
Police Services
Parks, Recreation and Culture
General Government
Roads & Traffic Safety Water Fire Services Sewer
Solid Waste Management Drainage
Planning and Development
Library Services Engineering
Surrey City Energy Parking 2016 2015
REVENUESTaxation, grants-in-lieu, assessments $ - $ - $ 591,684 $ 22,801 $ 113 $ - $ 2,244 $ - $ 33,746 $ - $ - $ - $ - $ - $ 650,588 $ 624,472
Collections for other authorities - - (284,725) - - - - - - - - - - - (284,725) (281,012)
Taxation revenue - - 306,959 22,801 113 - 2,244 - 33,746 - - - - - 365,863 343,460
Sales of goods and services 1,318 27,116 24,228 97 71,091 1,987 48,015 39,744 - 3,697 256 5,644 283 2,766 226,242 211,520
Development cost charges - - 61,260 - - - - - - - - - - - 61,260 58,598
Developer contributions - 138 26,894 95,055 2,780 - 9,841 - 6,481 - 25 - - - 141,214 143,004
Investment income - 19 15,452 - 544 - 375 - 110 - - - - - 16,500 16,437
Transfers from other governments 6,438 389 6,143 8,596 - - - - 245 - 973 - - - 22,784 22,405
Other 100 2,298 52,725 - 1,016 20 464 139 99 20,715 395 2,252 - 615 80,838 58,016
7,856 29,960 493,661 126,549 75,544 2,007 60,939 39,883 40,681 24,412 1,649 7,896 283 3,381 914,701 853,440
EXPENSESSalaries and benefits 23,591 54,491 36,169 5,081 - 54,293 - - - 20,121 13,282 36,830 372 626 244,856 227,643
RCMP contracted services 121,149 - - - - - - - - - - - - - 121,149 107,732
Consulting and professional services 948 4,380 3,936 2,524 490 86 592 834 2,676 729 84 388 37 9 17,713 19,000
Telephone and communications 390 262 1,070 36 12 162 25 8 11 69 30 122 1 41 2,239 2,075
Regional district utility charges - - - - 43,555 - 33,515 - - - - - - - 77,070 74,240
Utilities 438 3,832 34 4,325 561 342 1,926 - 8 478 373 597 150 - 13,064 11,574
Garbage collection and disposal 9 162 23 104 - 17 - 19,923 2 9 9 37 - - 20,295 18,934
Maintenance and small equipment 62 6,984 4,441 227 213 760 117 18 182 1,533 194 985 10 145 15,871 16,858
Insurance and claims - 3 3,841 - - 12 - 2 - - - 58 - - 3,916 3,309
Leases and rentals 881 915 311 962 153 5 318 264 747 8 47 405 - - 5,016 4,312
Supplies and materials 419 7,883 2,763 3,781 936 1,992 1,545 2,312 874 1,651 441 5,106 5 29 29,737 28,547
Advertising and media 3 517 353 34 5 13 - 24 4 17 1,095 18 - - 2,083 2,066
Grants and sponsorships - 483 3,607 - - - - - - 80 - - - - 4,170 2,684
Contract payments - 3,875 591 7,227 2,764 376 2,866 596 1,286 14 20 1,244 8 289 21,156 31,629
Other 694 2,228 3,308 205 727 805 193 75 638 1,224 691 760 - 8 11,556 12,587
Cost recoveries, net (1,441) 108 (4,469) 5,534 8,194 (518) 2,388 3,361 6,241 (575) 272 (40,947) (231) (61) (22,144) (19,898)
Interest on debt - - 8,097 - - - - - - - - - - - 8,097 8,097
Other interests and fiscal services 12 338 1,506 - (22) - 2 62 - 26 5 1 43 143 2,116 2,247
Amortization expense 1,224 16,249 14,651 36,896 9,559 1,838 11,609 1,520 19,502 65 1,989 4,722 - 1,014 120,838 116,837
148,379 102,710 80,232 66,936 67,147 60,183 55,096 28,999 32,171 25,449 18,532 10,326 395 2,243 698,798 670,473
Excess (deficiency) of revenues over expenses (140,523) (72,750) 413,429 59,613 8,397 (58,176) 5,843 10,884 8,510 (1,037) (16,883) (2,430) (112) 1,138 215,903 182,967
Transfer from (to) operating funds - 150 (59,671) 32,782 3,614 - 9,280 (6,133) 1,220 - 16,258 4,206 (215) (1,491) - -
Transfer from (to) reserve funds - 269 (41,026) 24,238 3,572 (1,297) 8,448 - 7,668 (166) 509 (2,215) - - - -
Transfer from (to) capital funds - (1,342) 63,734 (22,130) (10,178) - (8,506) (13) (17,677) 202 (5) 58 (4,206) 63 - -
Annual surplus (deficit) $ (140,523) $ (73,673) $ 376,466 $ 94,503 $ 5,405 $ (59,473) $ 15,065 $ 4,738 $ (279) $ (1,001) $ (121) $ (381) $ (4,533) $ (290) $ 215,903 $ 182,967
For the year ended December 31, 2016, with comparative figures for 2015 [in thousands of dollars]
40
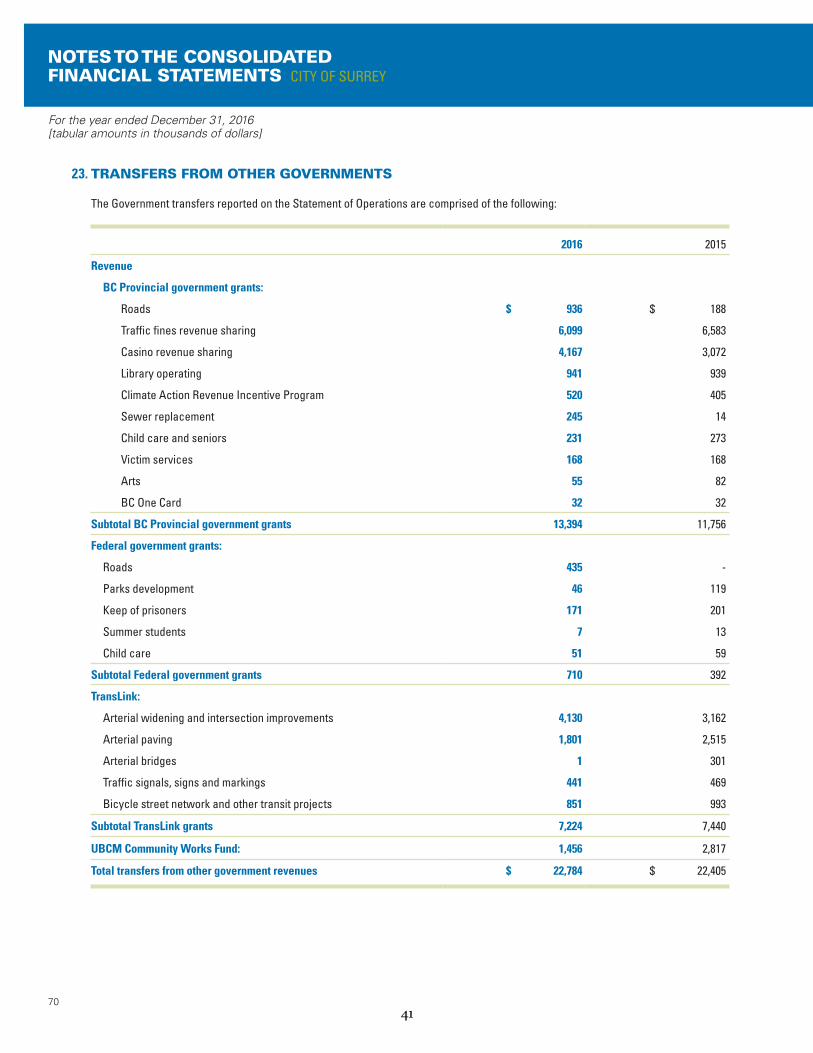
70
For the year ended December 31, 2016 [tabular amounts in thousands of dollars]
NOTES TO THE CONSOLIDATED FINANCIAL STATEMENTS CITY OF SURREY
23. TRANSFERS FROM OTHER GOVERNMENTS
The Government transfers reported on the Statement of Operations are comprised of the following:
2016 2015
Revenue
BC Provincial government grants:
Roads $ 936 $ 188
Traffic fines revenue sharing 6,099 6,583
Casino revenue sharing 4,167 3,072
Library operating 941 939
Climate Action Revenue Incentive Program 520 405
Sewer replacement 245 14
Child care and seniors 231 273
Victim services 168 168
Arts 55 82
BC One Card 32 32
Subtotal BC Provincial government grants 13,394 11,756
Federal government grants:
Roads 435 -
Parks development 46 119
Keep of prisoners 171 201
Summer students 7 13
Child care 51 59
Subtotal Federal government grants 710 392
TransLink:
Arterial widening and intersection improvements 4,130 3,162
Arterial paving 1,801 2,515
Arterial bridges 1 301
Traffic signals, signs and markings 441 469
Bicycle street network and other transit projects 851 993
Subtotal TransLink grants 7,224 7,440
UBCM Community Works Fund: 1,456 2,817
Total transfers from other government revenues $ 22,784 $ 22,405
41
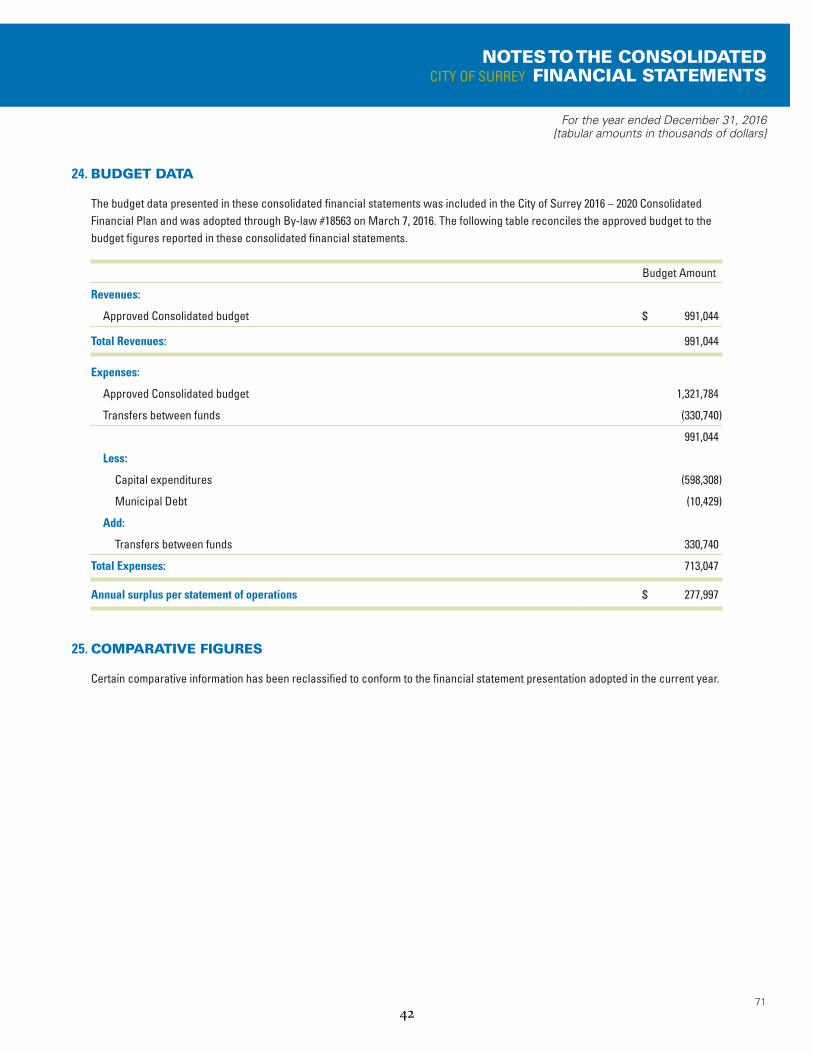
71
For the year ended December 31, 2016[tabular amounts in thousands of dollars]
NOTES TO THE CONSOLIDATED CITY OF SURREY FINANCIAL STATEMENTS
24. BUDGET DATA
The budget data presented in these consolidated financial statements was included in the City of Surrey 2016 – 2020 Consolidated Financial Plan and was adopted through By-law #18563 on March 7, 2016. The following table reconciles the approved budget to the budget figures reported in these consolidated financial statements.
Budget Amount
Revenues:
Approved Consolidated budget $ 991,044
Total Revenues: 991,044
Expenses:
Approved Consolidated budget 1,321,784
Transfers between funds (330,740)
991,044
Less:
Capital expenditures (598,308)
Municipal Debt (10,429)
Add:
Transfers between funds 330,740
Total Expenses: 713,047
Annual surplus per statement of operations $ 277,997
25. COMPARATIVE FIGURES
Certain comparative information has been reclassified to conform to the financial statement presentation adopted in the current year.
42
CITY OF SURREYSUPPLEMENTARY
FINANCIAL INFORMATION
43

12144
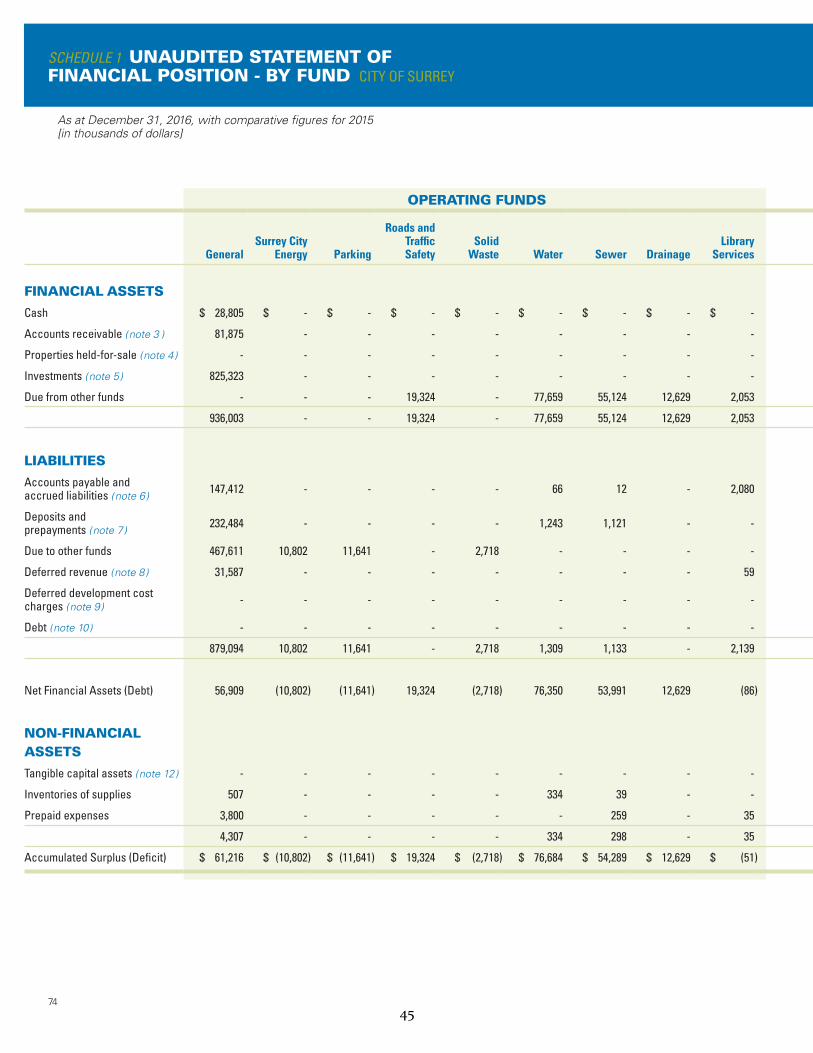
As at December 31, 2016, with comparative figures for 2015[in thousands of dollars]
74
SCHEDULE 1 UNAUDITED STATEMENT OF FINANCIAL POSITION - BY FUND CITY OF SURREY
OPERATING FUNDS CAPITAL FUNDS OTHER ENTITIES CONSOLIDATED
GeneralSurrey City
Energy Parking
Roads and Traffic Safety
Solid Waste Water Sewer Drainage
Library Services
General and Utilities
Library Services SCDC SHHS
Reserve Funds Adjustments 2016 2015
( recast - note 2 )
FINANCIAL ASSETS
Cash $ 28,805 $ - $ - $ - $ - $ - $ - $ - $ - $ - $ - $ 3,827 $ 162 $ - $ - $ 32,794 $ 12,121
Accounts receivable ( note 3 ) 81,875 - - - - - - - - 470 - 1,023 - 60,349 (22,964) 120,753 109,251
Properties held-for-sale ( note 4 ) - - - - - - - - - - - - - - - - 42,506
Investments ( note 5 ) 825,323 - - - - - - - - - - 303 7,928 - (7,359) 826,195 706,717
Due from other funds - - - 19,324 - 77,659 55,124 12,629 2,053 13,274 - - - 309,175 (489,238) - -
936,003 - - 19,324 - 77,659 55,124 12,629 2,053 13,744 - 5,153 8,090 369,524 (519,561) 979,742 870,595
LIABILITIES
Accounts payable and accrued liabilities ( note 6 )
147,412 - - - - 66 12 - 2,080 - - 34,786 211 - (26,788) 157,779 143,826
Deposits and prepayments ( note 7 )
232,484 - - - - 1,243 1,121 - - - - 1,070 - 649 (125) 236,442 194,784
Due to other funds 467,611 10,802 11,641 - 2,718 - - - - - - - - - (492,772) - -
Deferred revenue ( note 8 ) 31,587 - - - - - - - 59 - - 3,957 - - (289) 35,314 31,305
Deferred development cost charges ( note 9 )
- - - - - - - - - - - - - 251,928 15,040 266,968 239,631
Debt ( note 10 ) - - - - - - - - - 190,993 - 33,569 - - - 224,562 227,918
879,094 10,802 11,641 - 2,718 1,309 1,133 - 2,139 190,993 - 73,382 211 252,577 (504,934) 921,065 837,464
Net Financial Assets (Debt) 56,909 (10,802) (11,641) 19,324 (2,718) 76,350 53,991 12,629 (86) (177,249) - (68,229) 7,879 116,947 (14,627) 58,677 33,131
NON-FINANCIAL ASSETS
Tangible capital assets ( note 12 ) - - - - - - - - - 8,225,179 5,300 98,614 - - (16,130) 8,312,963 8,123,149
Inventories of supplies 507 - - - - 334 39 - - - - - - - - 880 857
Prepaid expenses 3,800 - - - - - 259 - 35 - - 539 - - (116) 4,517 3,997
4,307 - - - - 334 298 - 35 8,225,179 5,300 99,153 - - (16,246) 8,318,360 8,128,003
Accumulated Surplus (Deficit) $ 61,216 $ (10,802) $ (11,641) $ 19,324 $ (2,718) $ 76,684 $ 54,289 $ 12,629 $ (51) $ 8,047,930 $ 5,300 $ 30,924 $ 7,879 $ 116,947 $ (30,873) $ 8,377,037 $ 8,161,134
45
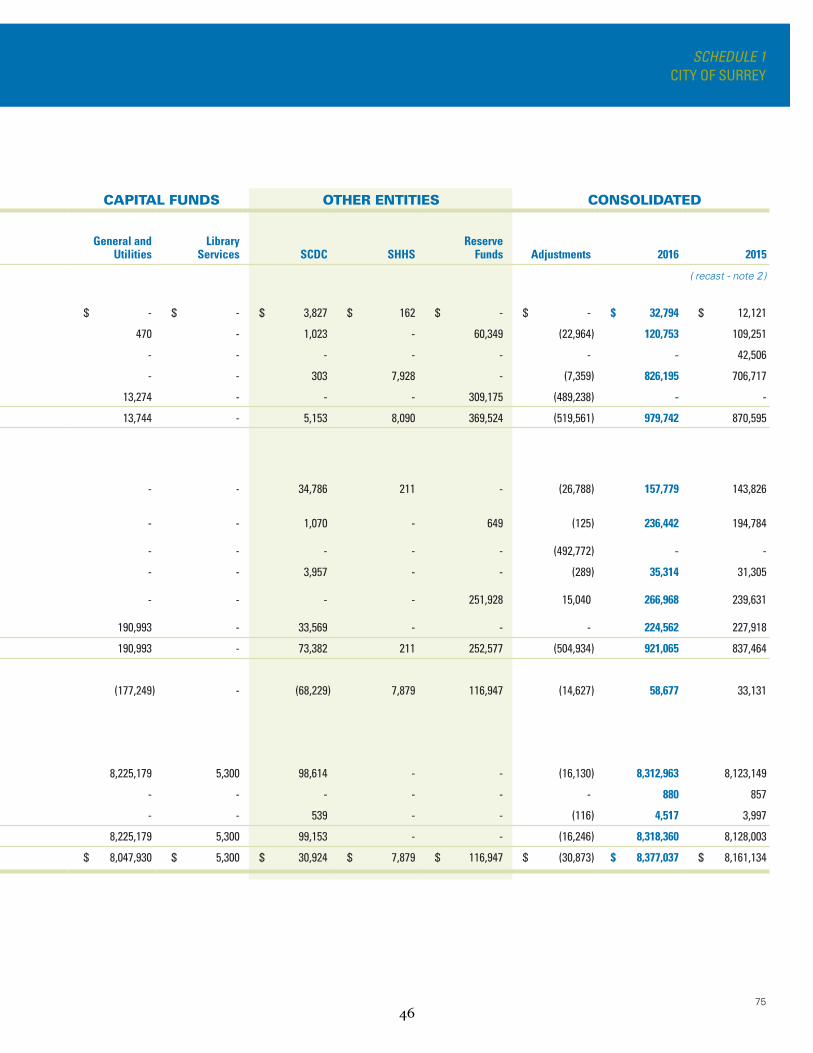
75
SCHEDULE 1 CITY OF SURREY
OPERATING FUNDS CAPITAL FUNDS OTHER ENTITIES CONSOLIDATED
GeneralSurrey City
Energy Parking
Roads and Traffic Safety
Solid Waste Water Sewer Drainage
Library Services
General and Utilities
Library Services SCDC SHHS
Reserve Funds Adjustments 2016 2015
( recast - note 2 )
FINANCIAL ASSETS
Cash $ 28,805 $ - $ - $ - $ - $ - $ - $ - $ - $ - $ - $ 3,827 $ 162 $ - $ - $ 32,794 $ 12,121
Accounts receivable ( note 3 ) 81,875 - - - - - - - - 470 - 1,023 - 60,349 (22,964) 120,753 109,251
Properties held-for-sale ( note 4 ) - - - - - - - - - - - - - - - - 42,506
Investments ( note 5 ) 825,323 - - - - - - - - - - 303 7,928 - (7,359) 826,195 706,717
Due from other funds - - - 19,324 - 77,659 55,124 12,629 2,053 13,274 - - - 309,175 (489,238) - -
936,003 - - 19,324 - 77,659 55,124 12,629 2,053 13,744 - 5,153 8,090 369,524 (519,561) 979,742 870,595
LIABILITIES
Accounts payable and accrued liabilities ( note 6 )
147,412 - - - - 66 12 - 2,080 - - 34,786 211 - (26,788) 157,779 143,826
Deposits and prepayments ( note 7 )
232,484 - - - - 1,243 1,121 - - - - 1,070 - 649 (125) 236,442 194,784
Due to other funds 467,611 10,802 11,641 - 2,718 - - - - - - - - - (492,772) - -
Deferred revenue ( note 8 ) 31,587 - - - - - - - 59 - - 3,957 - - (289) 35,314 31,305
Deferred development cost charges ( note 9 )
- - - - - - - - - - - - - 251,928 15,040 266,968 239,631
Debt ( note 10 ) - - - - - - - - - 190,993 - 33,569 - - - 224,562 227,918
879,094 10,802 11,641 - 2,718 1,309 1,133 - 2,139 190,993 - 73,382 211 252,577 (504,934) 921,065 837,464
Net Financial Assets (Debt) 56,909 (10,802) (11,641) 19,324 (2,718) 76,350 53,991 12,629 (86) (177,249) - (68,229) 7,879 116,947 (14,627) 58,677 33,131
NON-FINANCIAL ASSETS
Tangible capital assets ( note 12 ) - - - - - - - - - 8,225,179 5,300 98,614 - - (16,130) 8,312,963 8,123,149
Inventories of supplies 507 - - - - 334 39 - - - - - - - - 880 857
Prepaid expenses 3,800 - - - - - 259 - 35 - - 539 - - (116) 4,517 3,997
4,307 - - - - 334 298 - 35 8,225,179 5,300 99,153 - - (16,246) 8,318,360 8,128,003
Accumulated Surplus (Deficit) $ 61,216 $ (10,802) $ (11,641) $ 19,324 $ (2,718) $ 76,684 $ 54,289 $ 12,629 $ (51) $ 8,047,930 $ 5,300 $ 30,924 $ 7,879 $ 116,947 $ (30,873) $ 8,377,037 $ 8,161,134
46
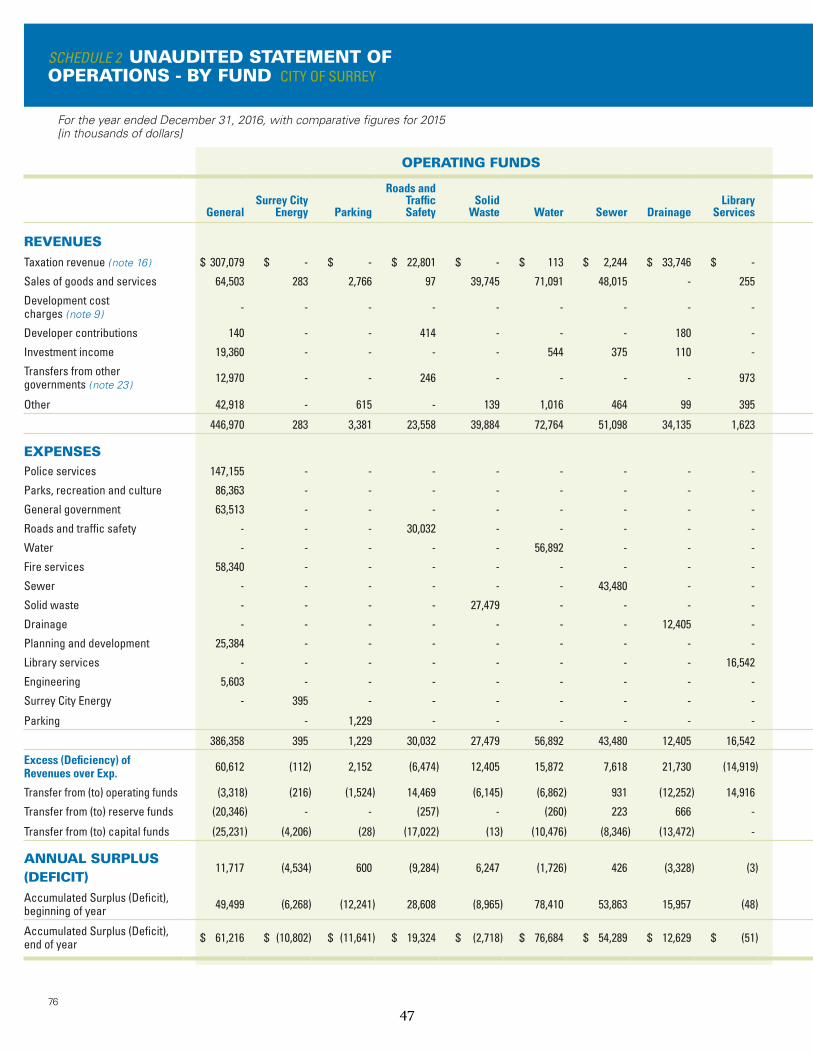
76
For the year ended December 31, 2016, with comparative figures for 2015[in thousands of dollars]
SCHEDULE 2 UNAUDITED STATEMENT OF OPERATIONS - BY FUND CITY OF SURREY
OPERATING FUNDS CAPITAL FUNDS OTHER ENTITIES CONSOLIDATED
GeneralSurrey City
Energy Parking
Roads and Traffic Safety
Solid Waste Water Sewer Drainage
Library Services
General and Utilities
Library Services SCDC SHHS
Reserve Funds Adjustments 2016 2015
( recast - note 2 )REVENUESTaxation revenue ( note 16 ) $ 307,079 $ - $ - $ 22,801 $ - $ 113 $ 2,244 $ 33,746 $ - $ - $ - $ - $ - $ - $ (120) $ 365,863 $ 343,460
Sales of goods and services 64,503 283 2,766 97 39,745 71,091 48,015 - 255 - - 39 - 40 (592) 226,242 211,520
Development cost charges ( note 9 )
- - - - - - - - - - - - - 53,087 8,173 61,260 58,598
Developer contributions 140 - - 414 - - - 180 - 125,288 25 - - 15,167 - 141,214 143,004
Investment income 19,360 - - - - 544 375 110 - 751 - 22 270 719 (5,651) 16,500 16,437
Transfers from other governments ( note 23 )
12,970 - - 246 - - - - 973 8,595 - - - - - 22,784 22,405
Other 42,918 - 615 - 139 1,016 464 99 395 8 - 24,068 106 284 10,726 80,838 58,016
446,970 283 3,381 23,558 39,884 72,764 51,098 34,135 1,623 134,642 25 24,129 376 69,297 12,536 914,701 853,440
EXPENSESPolice services 147,155 - - - - - - - - 1,224 - - - - - 148,379 133,003
Parks, recreation and culture 86,363 - - - - - - - - 17,657 - - - - (1,310) 102,710 93,830
General government 63,513 - - - - - - - - 9,360 - 11,321 509 (14,545) 10,074 80,232 75,323
Roads and traffic safety - - - 30,032 - - - - - 36,904 - - - - - 66,936 75,269
Water - - - - - 56,892 - - - 10,255 - - - - - 67,147 65,281
Fire services 58,340 - - - - - - - - 1,847 - - - - (4) 60,183 58,858
Sewer - - - - - - 43,480 - - 11,616 - - - - - 55,096 52,471
Solid waste - - - - 27,479 - - - - 1,520 - - - - - 28,999 28,690
Drainage - - - - - - - 12,405 - 19,766 - - - - - 32,171 33,790
Planning and development 25,384 - - - - - - - - 65 - - - - - 25,449 24,003
Library services - - - - - - - - 16,542 - 1,990 - - - - 18,532 18,283
Engineering 5,603 - - - - - - - - 18,834 - - - - (14,111) 10,326 9,717
Surrey City Energy - 395 - - - - - - - - - - - - - 395 231
Parking - 1,229 - - - - - - 1,014 - - - - - 2,243 1,724
386,358 395 1,229 30,032 27,479 56,892 43,480 12,405 16,542 130,062 1,990 11,321 509 (14,545) (5,351) 698,798 670,473
Excess (Deficiency) of Revenues over Exp. 60,612 (112) 2,152 (6,474) 12,405 15,872 7,618 21,730 (14,919) 4,580 (1,965) 12,808 (133) 83,842 17,887 215,903 182,967
Transfer from (to) operating funds (3,318) (216) (1,524) 14,469 (6,145) (6,862) 931 (12,252) 14,916 77,455 1,343 - - 19,976 - 98,773 78,164
Transfer from (to) reserve funds (20,346) - - (257) - (260) 223 666 - 97,360 509 - - - - 77,895 55,064
Transfer from (to) capital funds (25,231) (4,206) (28) (17,022) (13) (10,476) (8,346) (13,472) - - (5) - - (97,869) - (176,668) (133,228)
ANNUAL SURPLUS (DEFICIT)
11,717 (4,534) 600 (9,284) 6,247 (1,726) 426 (3,328) (3) 179,395 (118) 12,808 (133) 5,949 17,887 215,903 182,967
Accumulated Surplus (Deficit), beginning of year 49,499 (6,268) (12,241) 28,608 (8,965) 78,410 53,863 15,957 (48) 7,868,535 5,418 18,116 8,012 110,998 (48,760) 8,161,134 7,978,167
Accumulated Surplus (Deficit), end of year $ 61,216 $ (10,802) $ (11,641) $ 19,324 $ (2,718) $ 76,684 $ 54,289 $ 12,629 $ (51) $ 8,047,930 $ 5,300 $ 30,924 $ 7,879 $ 116,947 $ (30,873) $ 8,377,037 $ 8,161,134
47
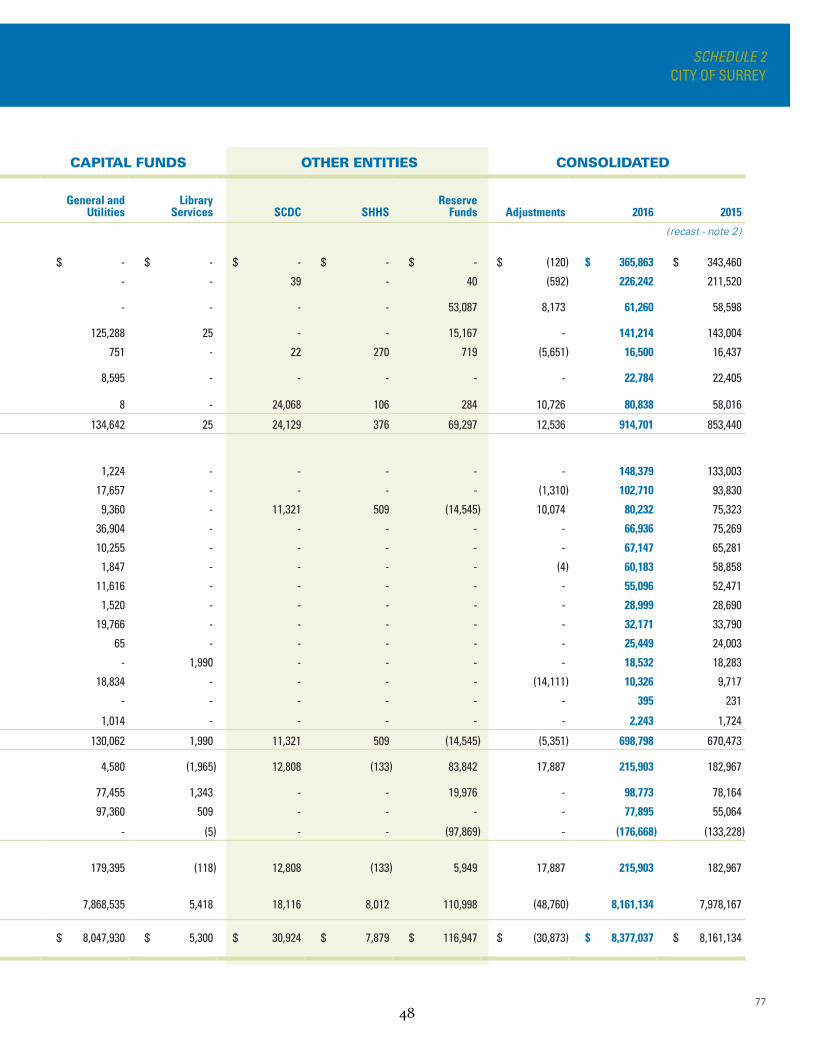
77
SCHEDULE 2 CITY OF SURREY
OPERATING FUNDS CAPITAL FUNDS OTHER ENTITIES CONSOLIDATED
GeneralSurrey City
Energy Parking
Roads and Traffic Safety
Solid Waste Water Sewer Drainage
Library Services
General and Utilities
Library Services SCDC SHHS
Reserve Funds Adjustments 2016 2015
( recast - note 2 )REVENUESTaxation revenue ( note 16 ) $ 307,079 $ - $ - $ 22,801 $ - $ 113 $ 2,244 $ 33,746 $ - $ - $ - $ - $ - $ - $ (120) $ 365,863 $ 343,460
Sales of goods and services 64,503 283 2,766 97 39,745 71,091 48,015 - 255 - - 39 - 40 (592) 226,242 211,520
Development cost charges ( note 9 )
- - - - - - - - - - - - - 53,087 8,173 61,260 58,598
Developer contributions 140 - - 414 - - - 180 - 125,288 25 - - 15,167 - 141,214 143,004
Investment income 19,360 - - - - 544 375 110 - 751 - 22 270 719 (5,651) 16,500 16,437
Transfers from other governments ( note 23 )
12,970 - - 246 - - - - 973 8,595 - - - - - 22,784 22,405
Other 42,918 - 615 - 139 1,016 464 99 395 8 - 24,068 106 284 10,726 80,838 58,016
446,970 283 3,381 23,558 39,884 72,764 51,098 34,135 1,623 134,642 25 24,129 376 69,297 12,536 914,701 853,440
EXPENSESPolice services 147,155 - - - - - - - - 1,224 - - - - - 148,379 133,003
Parks, recreation and culture 86,363 - - - - - - - - 17,657 - - - - (1,310) 102,710 93,830
General government 63,513 - - - - - - - - 9,360 - 11,321 509 (14,545) 10,074 80,232 75,323
Roads and traffic safety - - - 30,032 - - - - - 36,904 - - - - - 66,936 75,269
Water - - - - - 56,892 - - - 10,255 - - - - - 67,147 65,281
Fire services 58,340 - - - - - - - - 1,847 - - - - (4) 60,183 58,858
Sewer - - - - - - 43,480 - - 11,616 - - - - - 55,096 52,471
Solid waste - - - - 27,479 - - - - 1,520 - - - - - 28,999 28,690
Drainage - - - - - - - 12,405 - 19,766 - - - - - 32,171 33,790
Planning and development 25,384 - - - - - - - - 65 - - - - - 25,449 24,003
Library services - - - - - - - - 16,542 - 1,990 - - - - 18,532 18,283
Engineering 5,603 - - - - - - - - 18,834 - - - - (14,111) 10,326 9,717
Surrey City Energy - 395 - - - - - - - - - - - - - 395 231
Parking - 1,229 - - - - - - 1,014 - - - - - 2,243 1,724
386,358 395 1,229 30,032 27,479 56,892 43,480 12,405 16,542 130,062 1,990 11,321 509 (14,545) (5,351) 698,798 670,473
Excess (Deficiency) of Revenues over Exp. 60,612 (112) 2,152 (6,474) 12,405 15,872 7,618 21,730 (14,919) 4,580 (1,965) 12,808 (133) 83,842 17,887 215,903 182,967
Transfer from (to) operating funds (3,318) (216) (1,524) 14,469 (6,145) (6,862) 931 (12,252) 14,916 77,455 1,343 - - 19,976 - 98,773 78,164
Transfer from (to) reserve funds (20,346) - - (257) - (260) 223 666 - 97,360 509 - - - - 77,895 55,064
Transfer from (to) capital funds (25,231) (4,206) (28) (17,022) (13) (10,476) (8,346) (13,472) - - (5) - - (97,869) - (176,668) (133,228)
ANNUAL SURPLUS (DEFICIT)
11,717 (4,534) 600 (9,284) 6,247 (1,726) 426 (3,328) (3) 179,395 (118) 12,808 (133) 5,949 17,887 215,903 182,967
Accumulated Surplus (Deficit), beginning of year 49,499 (6,268) (12,241) 28,608 (8,965) 78,410 53,863 15,957 (48) 7,868,535 5,418 18,116 8,012 110,998 (48,760) 8,161,134 7,978,167
Accumulated Surplus (Deficit), end of year $ 61,216 $ (10,802) $ (11,641) $ 19,324 $ (2,718) $ 76,684 $ 54,289 $ 12,629 $ (51) $ 8,047,930 $ 5,300 $ 30,924 $ 7,879 $ 116,947 $ (30,873) $ 8,377,037 $ 8,161,134
48
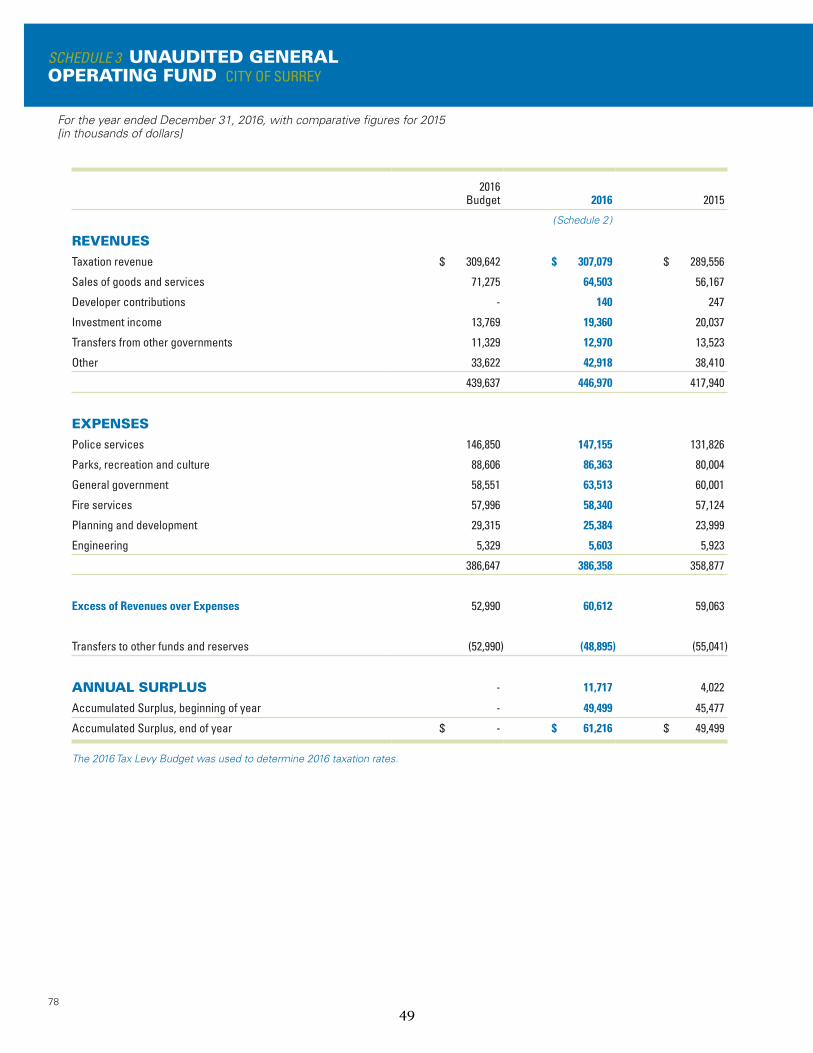
78
For the year ended December 31, 2016, with comparative figures for 2015[in thousands of dollars]
SCHEDULE 3 UNAUDITED GENERAL OPERATING FUND CITY OF SURREY
2016 Budget 2016 2015
( Schedule 2 )
REVENUESTaxation revenue $ 309,642 $ 307,079 $ 289,556
Sales of goods and services 71,275 64,503 56,167
Developer contributions - 140 247
Investment income 13,769 19,360 20,037
Transfers from other governments 11,329 12,970 13,523
Other 33,622 42,918 38,410
439,637 446,970 417,940
EXPENSESPolice services 146,850 147,155 131,826
Parks, recreation and culture 88,606 86,363 80,004
General government 58,551 63,513 60,001
Fire services 57,996 58,340 57,124
Planning and development 29,315 25,384 23,999
Engineering 5,329 5,603 5,923
386,647 386,358 358,877
Excess of Revenues over Expenses 52,990 60,612 59,063
Transfers to other funds and reserves (52,990) (48,895) (55,041)
ANNUAL SURPLUS - 11,717 4,022
Accumulated Surplus, beginning of year - 49,499 45,477
Accumulated Surplus, end of year $ - $ 61,216 $ 49,499
The 2016 Tax Levy Budget was used to determine 2016 taxation rates.
49
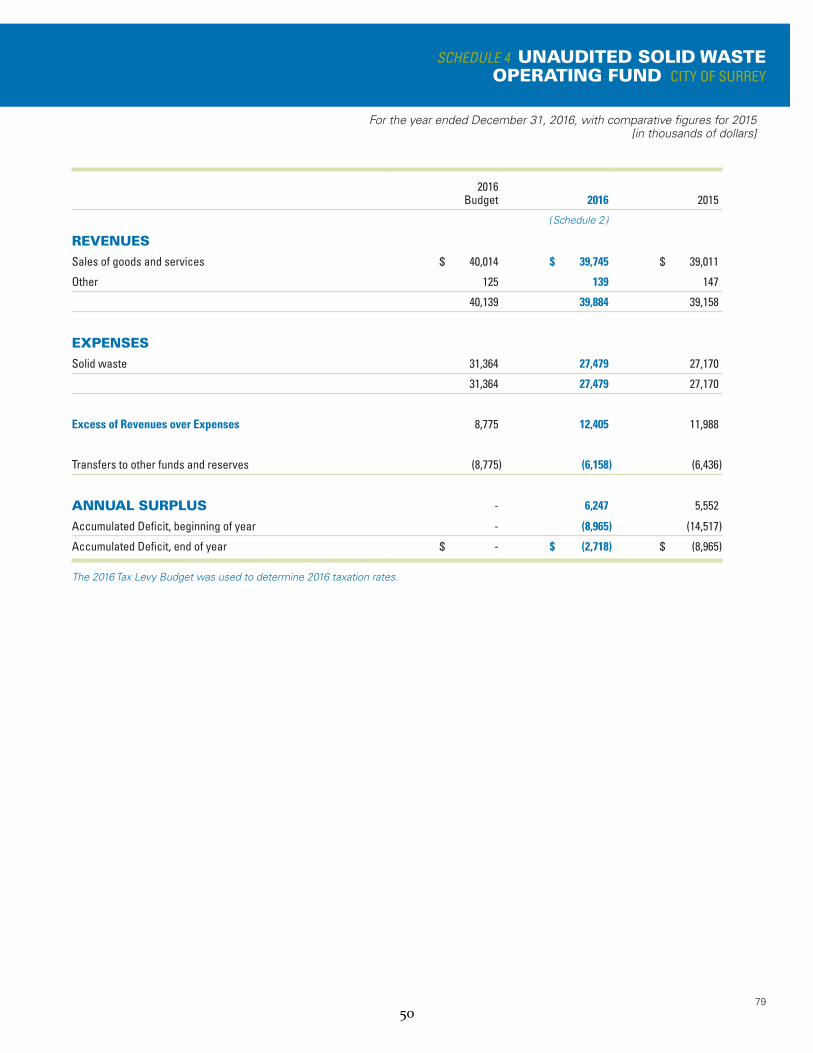
For the year ended December 31, 2016, with comparative figures for 2015[in thousands of dollars]
79
SCHEDULE 4 UNAUDITED SOLID WASTE OPERATING FUND CITY OF SURREY
2016 Budget 2016 2015
( Schedule 2 )
REVENUESSales of goods and services $ 40,014 $ 39,745 $ 39,011
Other 125 139 147
40,139 39,884 39,158
EXPENSESSolid waste 31,364 27,479 27,170
31,364 27,479 27,170
Excess of Revenues over Expenses 8,775 12,405 11,988
Transfers to other funds and reserves (8,775) (6,158) (6,436)
ANNUAL SURPLUS - 6,247 5,552
Accumulated Deficit, beginning of year - (8,965) (14,517)
Accumulated Deficit, end of year $ - $ (2,718) $ (8,965)
The 2016 Tax Levy Budget was used to determine 2016 taxation rates.
50
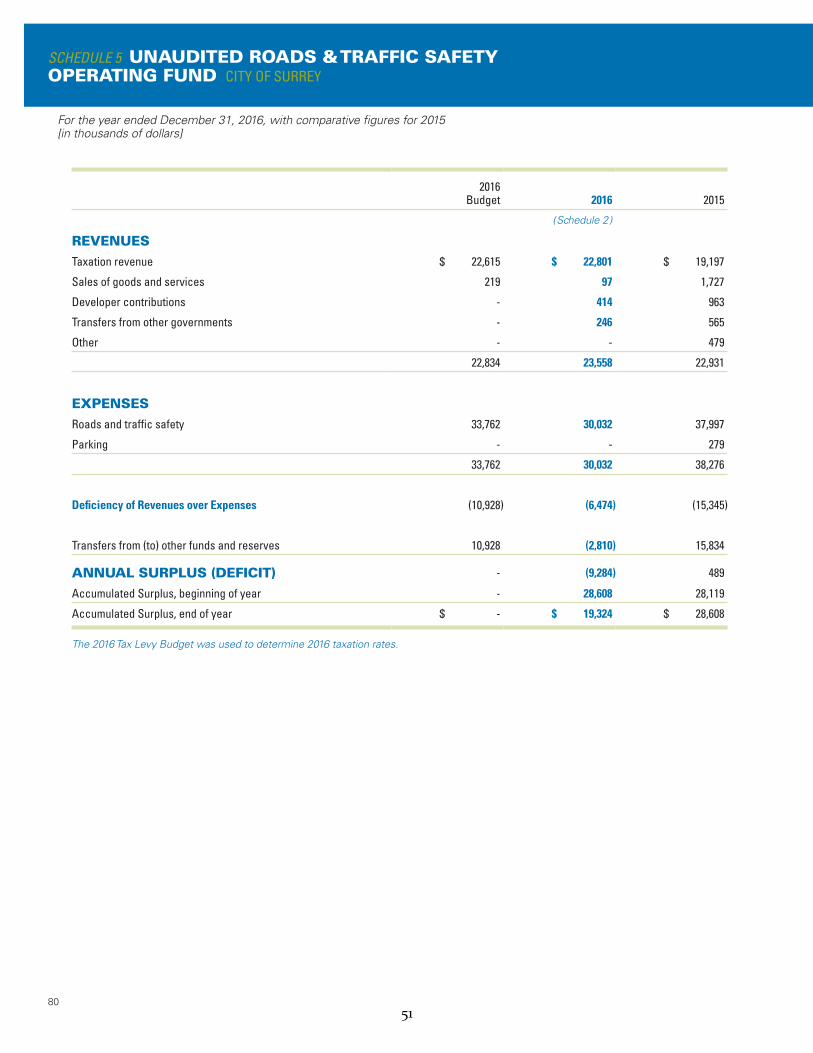
80
For the year ended December 31, 2016, with comparative figures for 2015[in thousands of dollars]
SCHEDULE 5 UNAUDITED ROADS & TRAFFIC SAFETY OPERATING FUND CITY OF SURREY
2016 Budget 2016 2015
( Schedule 2 )
REVENUESTaxation revenue $ 22,615 $ 22,801 $ 19,197
Sales of goods and services 219 97 1,727
Developer contributions - 414 963
Transfers from other governments - 246 565
Other - - 479
22,834 23,558 22,931
EXPENSESRoads and traffic safety 33,762 30,032 37,997
Parking - - 279
33,762 30,032 38,276
Deficiency of Revenues over Expenses (10,928) (6,474) (15,345)
Transfers from (to) other funds and reserves 10,928 (2,810) 15,834
ANNUAL SURPLUS (DEFICIT) - (9,284) 489
Accumulated Surplus, beginning of year - 28,608 28,119
Accumulated Surplus, end of year $ - $ 19,324 $ 28,608
The 2016 Tax Levy Budget was used to determine 2016 taxation rates.
51
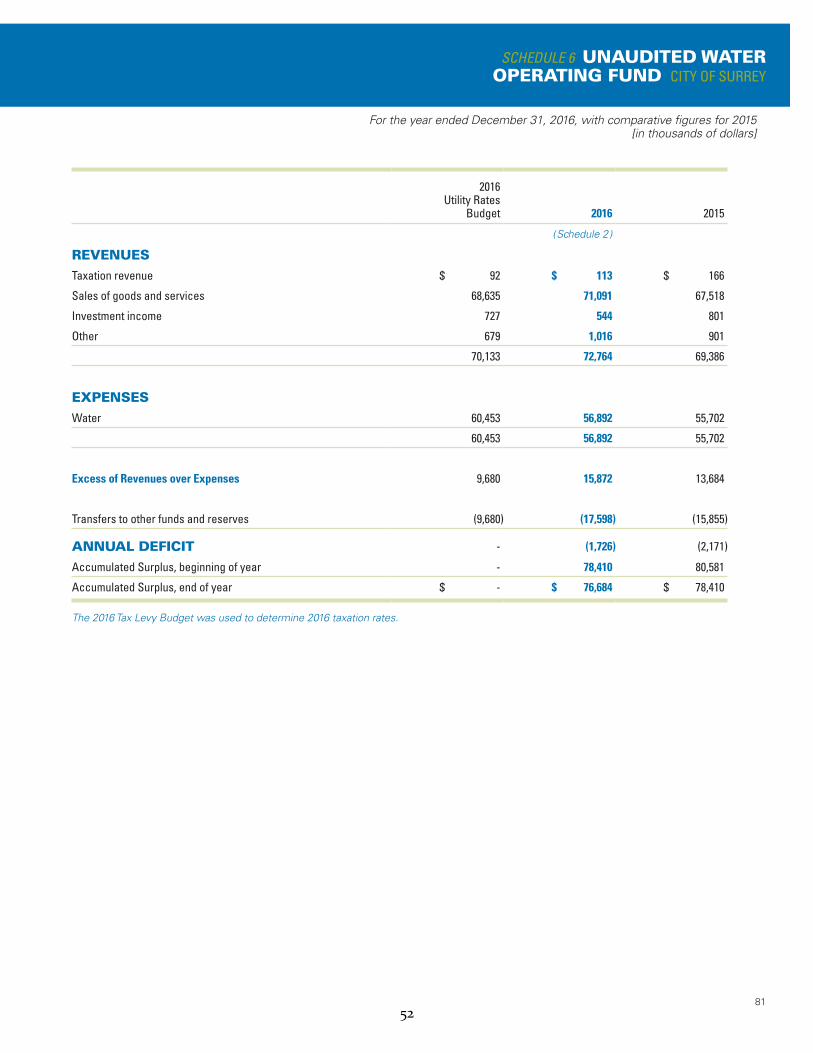
For the year ended December 31, 2016, with comparative figures for 2015[in thousands of dollars]
81
SCHEDULE 6 UNAUDITED WATER OPERATING FUND CITY OF SURREY
2016 Utility Rates
Budget 2016 2015
( Schedule 2 )
REVENUESTaxation revenue $ 92 $ 113 $ 166
Sales of goods and services 68,635 71,091 67,518
Investment income 727 544 801
Other 679 1,016 901
70,133 72,764 69,386
EXPENSESWater 60,453 56,892 55,702
60,453 56,892 55,702
Excess of Revenues over Expenses 9,680 15,872 13,684
Transfers to other funds and reserves (9,680) (17,598) (15,855)
ANNUAL DEFICIT - (1,726) (2,171)
Accumulated Surplus, beginning of year - 78,410 80,581
Accumulated Surplus, end of year $ - $ 76,684 $ 78,410
The 2016 Tax Levy Budget was used to determine 2016 taxation rates.
52
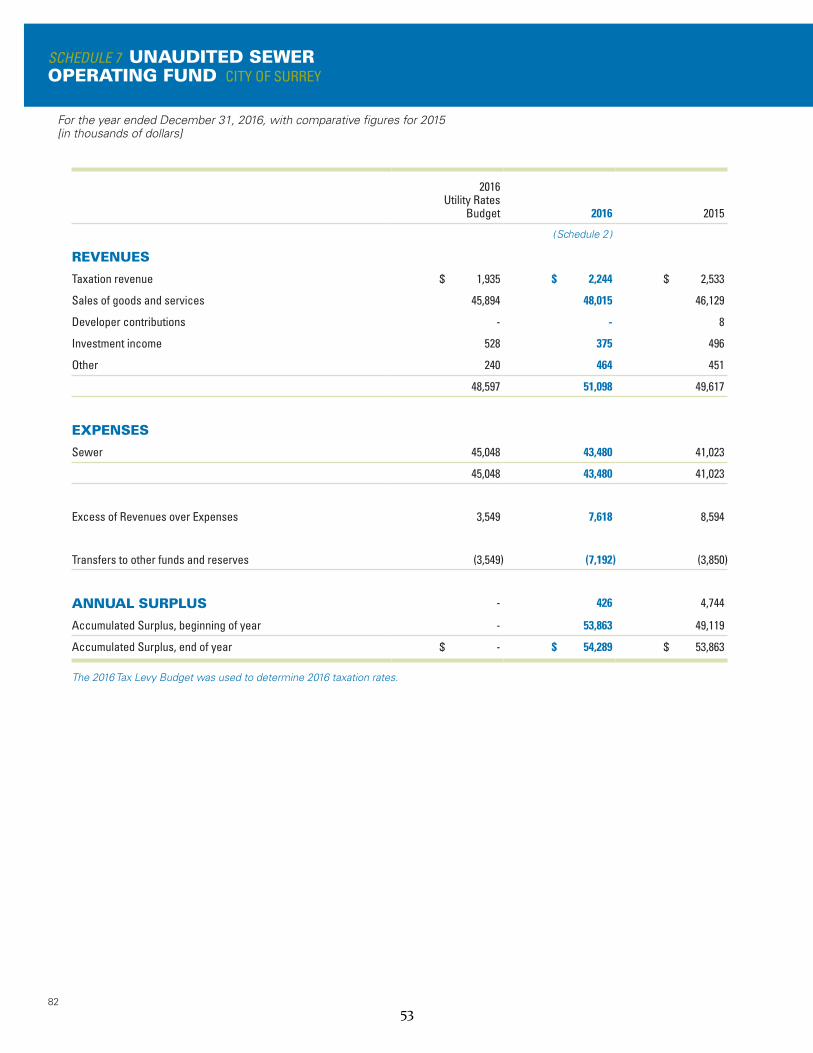
82
SCHEDULE 7 UNAUDITED SEWER OPERATING FUND CITY OF SURREY
2016 Utility Rates
Budget 2016 2015
( Schedule 2 )
REVENUES
Taxation revenue $ 1,935 $ 2,244 $ 2,533
Sales of goods and services 45,894 48,015 46,129
Developer contributions - - 8
Investment income 528 375 496
Other 240 464 451
48,597 51,098 49,617
EXPENSES
Sewer 45,048 43,480 41,023
45,048 43,480 41,023
Excess of Revenues over Expenses 3,549 7,618 8,594
Transfers to other funds and reserves (3,549) (7,192) (3,850)
ANNUAL SURPLUS - 426 4,744
Accumulated Surplus, beginning of year - 53,863 49,119
Accumulated Surplus, end of year $ - $ 54,289 $ 53,863
The 2016 Tax Levy Budget was used to determine 2016 taxation rates.
For the year ended December 31, 2016, with comparative figures for 2015[in thousands of dollars]
53
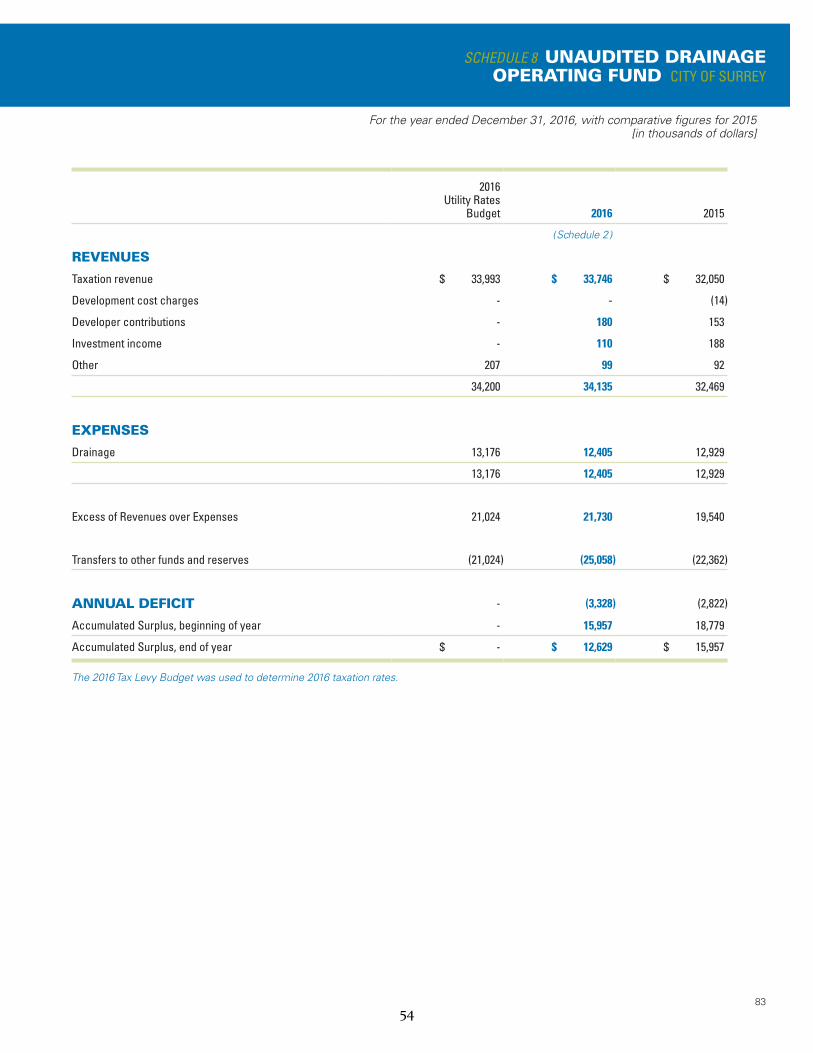
For the year ended December 31, 2016, with comparative figures for 2015[in thousands of dollars]
83
SCHEDULE 8 UNAUDITED DRAINAGE OPERATING FUND CITY OF SURREY
2016 Utility Rates
Budget 2016 2015
( Schedule 2 )
REVENUES
Taxation revenue $ 33,993 $ 33,746 $ 32,050
Development cost charges - - (14)
Developer contributions - 180 153
Investment income - 110 188
Other 207 99 92
34,200 34,135 32,469
EXPENSES
Drainage 13,176 12,405 12,929
13,176 12,405 12,929
Excess of Revenues over Expenses 21,024 21,730 19,540
Transfers to other funds and reserves (21,024) (25,058) (22,362)
ANNUAL DEFICIT - (3,328) (2,822)
Accumulated Surplus, beginning of year - 15,957 18,779
Accumulated Surplus, end of year $ - $ 12,629 $ 15,957
The 2016 Tax Levy Budget was used to determine 2016 taxation rates.
54
84
SCHEDULE 9 UNAUDITED PARKING OPERATING FUND CITY OF SURREY
For the year ended December 31, 2016, with comparative figures for 2015[in thousands of dollars]
2016 Budget 2016 2015
( Schedule 2 )
REVENUES
Sales of goods and services $ 2,763 $ 2,766 $ 716
Other - 615 -
2,763 3,381 716
EXPENSES
Parking 859 1,229 435
859 1,229 435
Excess of Revenues over Expenses 1,904 2,152 281
Transfers to other funds and reserves (1,904) (1,552) (2,316)
ANNUAL SURPLUS (DEFICIT) - 600 (2,035)
Accumulated Deficit, beginning of year - (12,241) (10,206)
Accumulated Deficit, end of year $ - $ (11,641) $ (12,241)
The 2016 Tax Levy Budget was used to determine 2016 taxation rates.
55
For the year ended December 31, 2016, with comparative figures for 2015[in thousands of dollars]
85
SCHEDULE 10 UNAUDITED SURREY CITY ENERGY OPERATING FUND CITY OF SURREY
2016 Budget 2016 2015
( Schedule 2 )
REVENUES
Sales of goods and services $ 1,086 $ 283 $ 166
Developer contributions - - 151
1,086 283 317
EXPENSES
Surrey City Energy 1,289 395 231
1,289 395 231
Excess (Deficiency) of Revenues over Expenses (203) (112) 86
Transfers from (to) other funds and reserves 203 (4,422) (2,769)
ANNUAL DEFICIT - (4,534) (2,683)
Accumulated Deficit, beginning of year - (6,268) (3,585)
Accumulated Deficit, end of year $ - $ (10,802) $ (6,268)
The 2016 Tax Levy Budget was used to determine 2016 taxation rates.
56
86
SCHEDULE 11 UNAUDITED RESERVE FUNDS CITY OF SURREY
As at December 31, 2016, [in thousands of dollars]
Equipment and Building Replacement
*** Municipal Land
Park Land Acquisition
*Capital Legacy
Neighborhood Concept Plans
Environmental Stewardship
**Local Improvement
FinancingWater
ClaimsAffordable
HousingParking
SpaceReserves Subtotal
****Deferred Development
ChargesFuture
Commitments
Balance, beginning of year $ 33,670 $ - $ 9,948 $ 19,486 $ 22,783 $ 6,536 $ 15,689 $ 1,328 $ 23 $ 1,535 $ 110,998 $ 239,631 $ 184,232
DCC’s levied for the year - - - - - - - - - - - 87,398 -
Investment income 233 12 69 134 157 45 51 10 - 11 722 1,199 -
Other revenue - 324 9,931 - 5,196 - - - - 40 15,491 - -
Other Contributions 345 14,200 - - - - - - - - 14,545 - -
578 14,536 10,000 134 5,353 45 51 10 - 51 30,758 88,597 -
Transfers from (to)
Operating funds (11,006) (138) - (10,982) 220 22 (403) - - - (22,287) - -
Capital funds 10,929 29,714 1,261 14,964 5,268 - - - - - 62,136 (61,260) (9,006)
Internal borrowing - (15,040) - - - - - - - - (15,040) (15,040) -
(77) 14,536 1,261 3,982 5,488 22 (403) - - - 24,809 (76,300) (9,006)
Balance, end of year $ 34,325 $ - $ 18,687 $ 15,638 $ 22,648 $ 6,559 $ 16,143 $ 1,338 $ 23 $ 1,586 $ 116,947 $ 251,928 $ 175,226
ADDITIONAL INFORMATION:
* Capital Legacy Reserve Fund (created by Bylaw in 1999): The City borrows from this Fund to finance capital projects. Principal and interest repayment schedules are based upon reasonable business case plans approved by City Council. The debt costs are provided for annually within the operating budget of each capital project.
Capital Legacy Fund Prior to Borrowing $ 46,120
Principal Repayable, Guildford Pool Loan (14,349)
Principal Repayable, East Clayton Fitness Facility Loan (5,219)
Principal Repayable, RCMP Facility Loan (4,577)
Principal Repayable, Newton Fitness Facility Loan (4,220)
Principal Repayable, Grandview Heights Pool Loan (1,156)
Principal Repayable, Other Facility, Parks and Culture Loans $ (961)
Funds on Hand for Financing Projects $ 15,638
** Local Improvement Financing Reserve Fund: The City borrows from this Fund to finance local improvement projects. The property owners’ share, repayable with interest over 10 years, is levied against the benefiting properties. The City’s share, repayable with interest over 10 years, is provided for annually within General Operating Fund debt costs.
Funds on Hand For Financing Projects $ 8,042
Receivable From Property Owners 8,101
Equity, December 31, 2016 $ 16,143
57
87
SCHEDULE 11 CITY OF SURREY
Equipment and Building Replacement
*** Municipal Land
Park Land Acquisition
*Capital Legacy
Neighborhood Concept Plans
Environmental Stewardship
**Local Improvement
FinancingWater
ClaimsAffordable
HousingParking
SpaceReserves Subtotal
****Deferred Development
ChargesFuture
Commitments
Balance, beginning of year $ 33,670 $ - $ 9,948 $ 19,486 $ 22,783 $ 6,536 $ 15,689 $ 1,328 $ 23 $ 1,535 $ 110,998 $ 239,631 $ 184,232
DCC’s levied for the year - - - - - - - - - - - 87,398 -
Investment income 233 12 69 134 157 45 51 10 - 11 722 1,199 -
Other revenue - 324 9,931 - 5,196 - - - - 40 15,491 - -
Other Contributions 345 14,200 - - - - - - - - 14,545 - -
578 14,536 10,000 134 5,353 45 51 10 - 51 30,758 88,597 -
Transfers from (to)
Operating funds (11,006) (138) - (10,982) 220 22 (403) - - - (22,287) - -
Capital funds 10,929 29,714 1,261 14,964 5,268 - - - - - 62,136 (61,260) (9,006)
Internal borrowing - (15,040) - - - - - - - - (15,040) (15,040) -
(77) 14,536 1,261 3,982 5,488 22 (403) - - - 24,809 (76,300) (9,006)
Balance, end of year $ 34,325 $ - $ 18,687 $ 15,638 $ 22,648 $ 6,559 $ 16,143 $ 1,338 $ 23 $ 1,586 $ 116,947 $ 251,928 $ 175,226
*** Municipal Land Reserve Fund: The City borrows from this Fund to finance specified projects. Principal and interest repayment schedules are based upon reasonable business case plans approved by City Council.
Municipal Land Fund Prior to Borrowing $ 19,284
Internal Borrowing from Reserves 14,611
Principal Repayable, City Centre Land Loan (8,555)
Principal Repayable, City Centre Social Lands Loan (3,371)
Principal Repayable, City Centre Development Loan (2,485)
Principal Repayable, University Drive (1,008)
Principal Repayable, City Parkway (1,155)
Principal Repayable, Social Housing Loan (1,458)
Principal Repayable, Bridgeview Ind. Land Loan (54)
Principal Repayable, Green Timbers (15,809)
Funds on Hand for Financing Projects $ -
**** Deferred Development Charges: The City borrowed from this Fund to resolve revolving fund shortfall. Principal and interest to be repaid.
Deferred Development Cost Charges per note 9 $ 266,968
Less: Internal borrowings (15,040)
Funds on Hand for Financing Projects $ 251,928
58
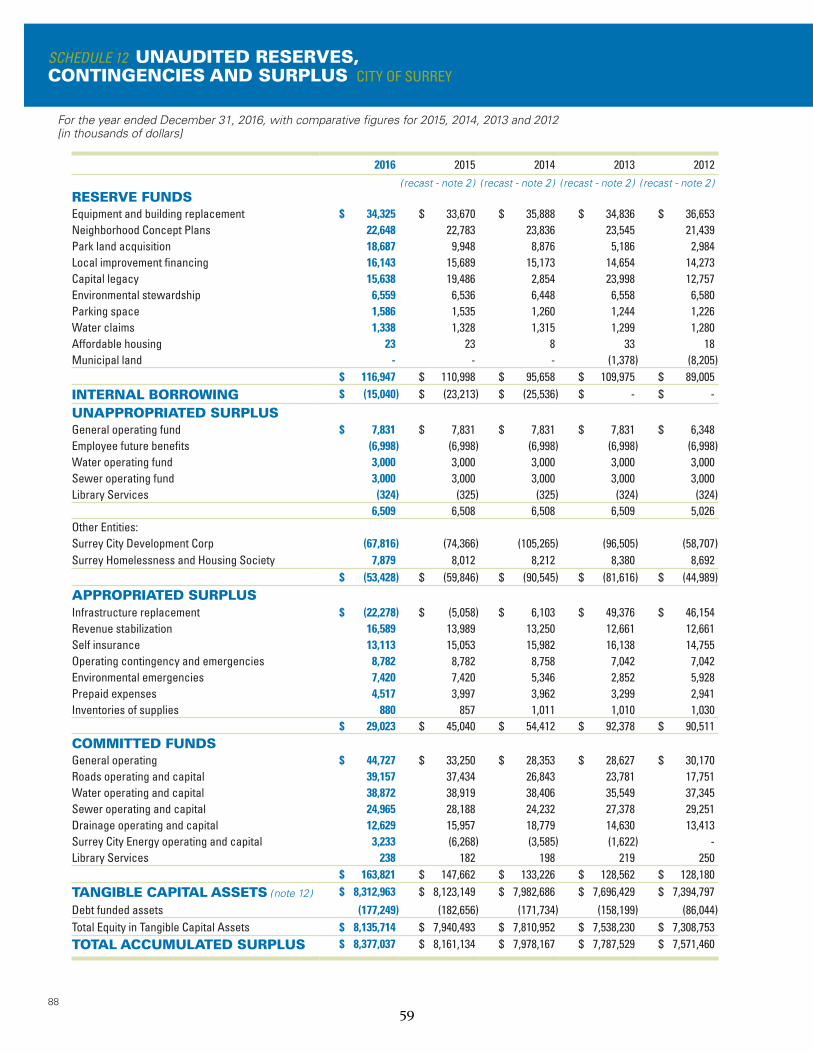
88
SCHEDULE 12 UNAUDITED RESERVES, CONTINGENCIES AND SURPLUS CITY OF SURREY
2016 2015 2014 2013 2012( recast - note 2 ) ( recast - note 2 ) ( recast - note 2 ) ( recast - note 2 )
RESERVE FUNDSEquipment and building replacement $ 34,325 $ 33,670 $ 35,888 $ 34,836 $ 36,653 Neighborhood Concept Plans 22,648 22,783 23,836 23,545 21,439 Park land acquisition 18,687 9,948 8,876 5,186 2,984 Local improvement financing 16,143 15,689 15,173 14,654 14,273 Capital legacy 15,638 19,486 2,854 23,998 12,757 Environmental stewardship 6,559 6,536 6,448 6,558 6,580 Parking space 1,586 1,535 1,260 1,244 1,226 Water claims 1,338 1,328 1,315 1,299 1,280 Affordable housing 23 23 8 33 18 Municipal land - - - (1,378) (8,205)
$ 116,947 $ 110,998 $ 95,658 $ 109,975 $ 89,005 INTERNAL BORROWING $ (15,040) $ (23,213) $ (25,536) $ - $ -
UNAPPROPRIATED SURPLUSGeneral operating fund $ 7,831 $ 7,831 $ 7,831 $ 7,831 $ 6,348 Employee future benefits (6,998) (6,998) (6,998) (6,998) (6,998)Water operating fund 3,000 3,000 3,000 3,000 3,000 Sewer operating fund 3,000 3,000 3,000 3,000 3,000 Library Services (324) (325) (325) (324) (324)
6,509 6,508 6,508 6,509 5,026 Other Entities:Surrey City Development Corp (67,816) (74,366) (105,265) (96,505) (58,707)Surrey Homelessness and Housing Society 7,879 8,012 8,212 8,380 8,692
$ (53,428) $ (59,846) $ (90,545) $ (81,616) $ (44,989)APPROPRIATED SURPLUSInfrastructure replacement $ (22,278) $ (5,058) $ 6,103 $ 49,376 $ 46,154 Revenue stabilization 16,589 13,989 13,250 12,661 12,661 Self insurance 13,113 15,053 15,982 16,138 14,755 Operating contingency and emergencies 8,782 8,782 8,758 7,042 7,042 Environmental emergencies 7,420 7,420 5,346 2,852 5,928 Prepaid expenses 4,517 3,997 3,962 3,299 2,941 Inventories of supplies 880 857 1,011 1,010 1,030
$ 29,023 $ 45,040 $ 54,412 $ 92,378 $ 90,511 COMMITTED FUNDSGeneral operating $ 44,727 $ 33,250 $ 28,353 $ 28,627 $ 30,170 Roads operating and capital 39,157 37,434 26,843 23,781 17,751 Water operating and capital 38,872 38,919 38,406 35,549 37,345 Sewer operating and capital 24,965 28,188 24,232 27,378 29,251 Drainage operating and capital 12,629 15,957 18,779 14,630 13,413 Surrey City Energy operating and capital 3,233 (6,268) (3,585) (1,622) - Library Services 238 182 198 219 250
$ 163,821 $ 147,662 $ 133,226 $ 128,562 $ 128,180 TANGIBLE CAPITAL ASSETS ( note 12 ) $ 8,312,963 $ 8,123,149 $ 7,982,686 $ 7,696,429 $ 7,394,797 Debt funded assets (177,249) (182,656) (171,734) (158,199) (86,044)Total Equity in Tangible Capital Assets $ 8,135,714 $ 7,940,493 $ 7,810,952 $ 7,538,230 $ 7,308,753 TOTAL ACCUMULATED SURPLUS $ 8,377,037 $ 8,161,134 $ 7,978,167 $ 7,787,529 $ 7,571,460
For the year ended December 31, 2016, with comparative figures for 2015, 2014, 2013 and 2012 [in thousands of dollars]
59
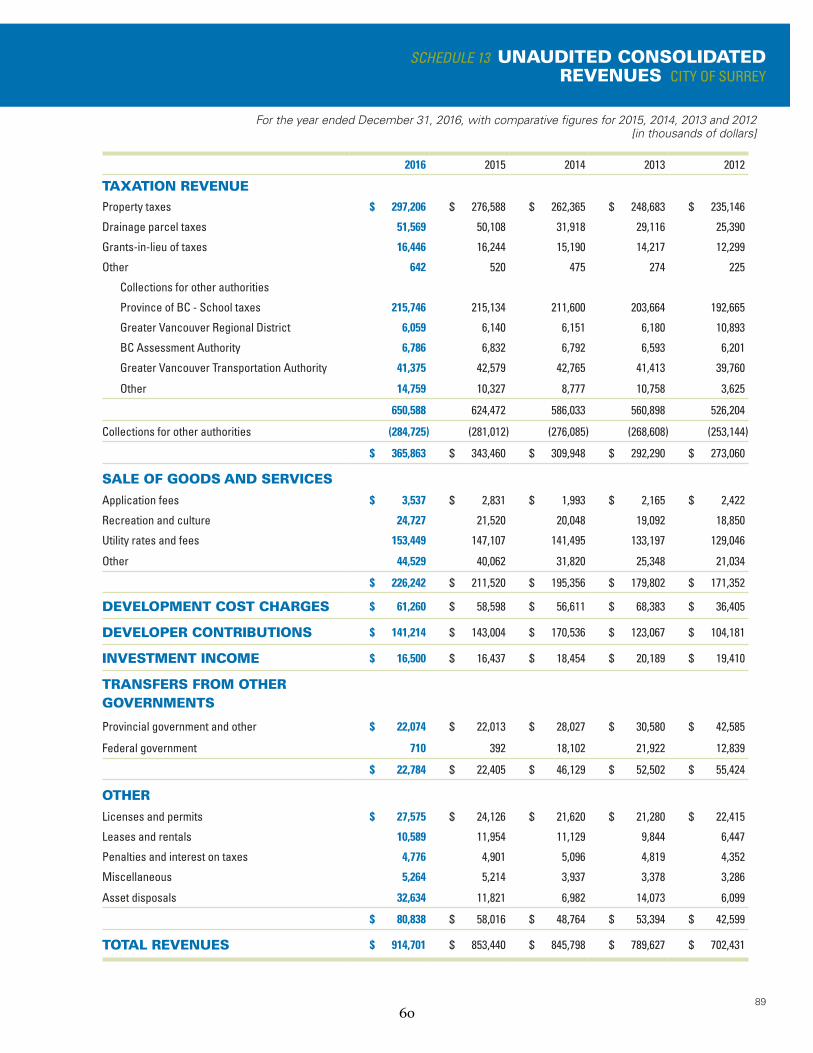
89
SCHEDULE 13 UNAUDITED CONSOLIDATED REVENUES CITY OF SURREY
For the year ended December 31, 2016, with comparative figures for 2015, 2014, 2013 and 2012 [in thousands of dollars]
2016 2015 2014 2013 2012
TAXATION REVENUEProperty taxes $ 297,206 $ 276,588 $ 262,365 $ 248,683 $ 235,146
Drainage parcel taxes 51,569 50,108 31,918 29,116 25,390
Grants-in-lieu of taxes 16,446 16,244 15,190 14,217 12,299
Other 642 520 475 274 225
Collections for other authorities
Province of BC - School taxes 215,746 215,134 211,600 203,664 192,665
Greater Vancouver Regional District 6,059 6,140 6,151 6,180 10,893
BC Assessment Authority 6,786 6,832 6,792 6,593 6,201
Greater Vancouver Transportation Authority 41,375 42,579 42,765 41,413 39,760
Other 14,759 10,327 8,777 10,758 3,625
650,588 624,472 586,033 560,898 526,204
Collections for other authorities (284,725) (281,012) (276,085) (268,608) (253,144)
$ 365,863 $ 343,460 $ 309,948 $ 292,290 $ 273,060
SALE OF GOODS AND SERVICES
Application fees $ 3,537 $ 2,831 $ 1,993 $ 2,165 $ 2,422
Recreation and culture 24,727 21,520 20,048 19,092 18,850
Utility rates and fees 153,449 147,107 141,495 133,197 129,046
Other 44,529 40,062 31,820 25,348 21,034
$ 226,242 $ 211,520 $ 195,356 $ 179,802 $ 171,352
DEVELOPMENT COST CHARGES $ 61,260 $ 58,598 $ 56,611 $ 68,383 $ 36,405
DEVELOPER CONTRIBUTIONS $ 141,214 $ 143,004 $ 170,536 $ 123,067 $ 104,181
INVESTMENT INCOME $ 16,500 $ 16,437 $ 18,454 $ 20,189 $ 19,410
TRANSFERS FROM OTHER GOVERNMENTS
Provincial government and other $ 22,074 $ 22,013 $ 28,027 $ 30,580 $ 42,585
Federal government 710 392 18,102 21,922 12,839
$ 22,784 $ 22,405 $ 46,129 $ 52,502 $ 55,424
OTHER
Licenses and permits $ 27,575 $ 24,126 $ 21,620 $ 21,280 $ 22,415
Leases and rentals 10,589 11,954 11,129 9,844 6,447
Penalties and interest on taxes 4,776 4,901 5,096 4,819 4,352
Miscellaneous 5,264 5,214 3,937 3,378 3,286
Asset disposals 32,634 11,821 6,982 14,073 6,099
$ 80,838 $ 58,016 $ 48,764 $ 53,394 $ 42,599
TOTAL REVENUES $ 914,701 $ 853,440 $ 845,798 $ 789,627 $ 702,431
60
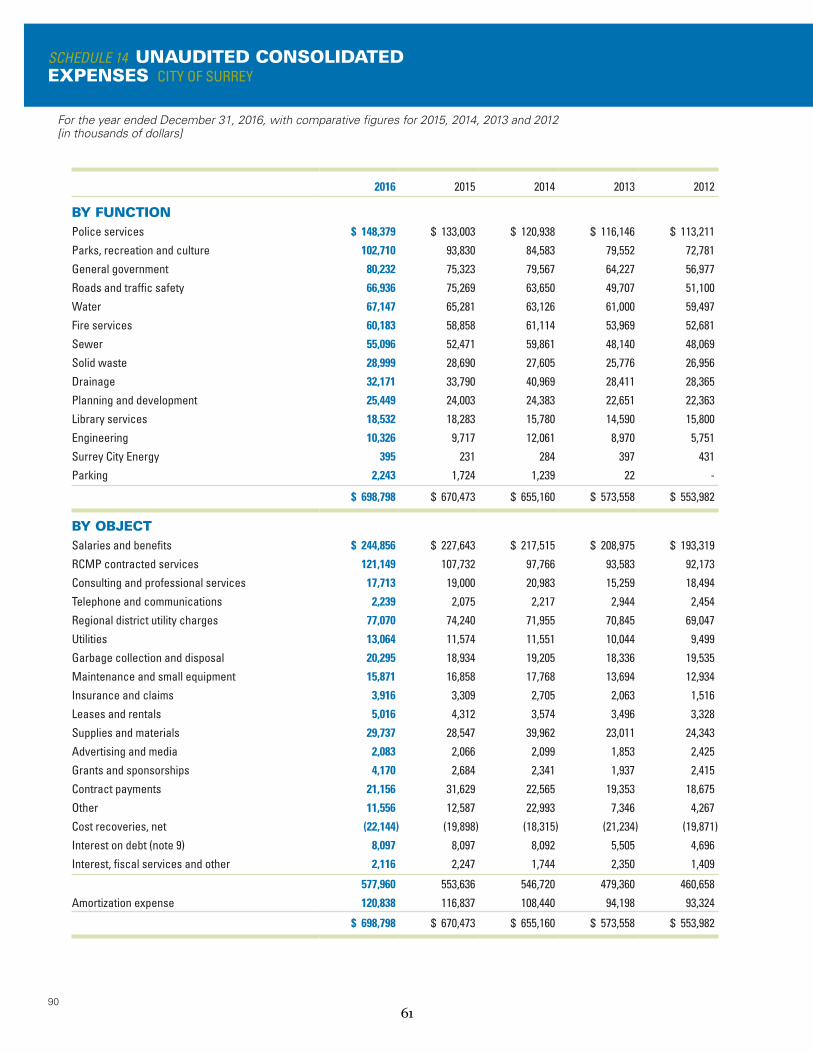
90
SCHEDULE 14 UNAUDITED CONSOLIDATED EXPENSES CITY OF SURREY
2016 2015 2014 2013 2012
BY FUNCTIONPolice services $ 148,379 $ 133,003 $ 120,938 $ 116,146 $ 113,211
Parks, recreation and culture 102,710 93,830 84,583 79,552 72,781
General government 80,232 75,323 79,567 64,227 56,977
Roads and traffic safety 66,936 75,269 63,650 49,707 51,100
Water 67,147 65,281 63,126 61,000 59,497
Fire services 60,183 58,858 61,114 53,969 52,681
Sewer 55,096 52,471 59,861 48,140 48,069
Solid waste 28,999 28,690 27,605 25,776 26,956
Drainage 32,171 33,790 40,969 28,411 28,365
Planning and development 25,449 24,003 24,383 22,651 22,363
Library services 18,532 18,283 15,780 14,590 15,800
Engineering 10,326 9,717 12,061 8,970 5,751
Surrey City Energy 395 231 284 397 431
Parking 2,243 1,724 1,239 22 -
$ 698,798 $ 670,473 $ 655,160 $ 573,558 $ 553,982
BY OBJECTSalaries and benefits $ 244,856 $ 227,643 $ 217,515 $ 208,975 $ 193,319
RCMP contracted services 121,149 107,732 97,766 93,583 92,173
Consulting and professional services 17,713 19,000 20,983 15,259 18,494
Telephone and communications 2,239 2,075 2,217 2,944 2,454
Regional district utility charges 77,070 74,240 71,955 70,845 69,047
Utilities 13,064 11,574 11,551 10,044 9,499
Garbage collection and disposal 20,295 18,934 19,205 18,336 19,535
Maintenance and small equipment 15,871 16,858 17,768 13,694 12,934
Insurance and claims 3,916 3,309 2,705 2,063 1,516
Leases and rentals 5,016 4,312 3,574 3,496 3,328
Supplies and materials 29,737 28,547 39,962 23,011 24,343
Advertising and media 2,083 2,066 2,099 1,853 2,425
Grants and sponsorships 4,170 2,684 2,341 1,937 2,415
Contract payments 21,156 31,629 22,565 19,353 18,675
Other 11,556 12,587 22,993 7,346 4,267
Cost recoveries, net (22,144) (19,898) (18,315) (21,234) (19,871)
Interest on debt (note 9) 8,097 8,097 8,092 5,505 4,696
Interest, fiscal services and other 2,116 2,247 1,744 2,350 1,409
577,960 553,636 546,720 479,360 460,658
Amortization expense 120,838 116,837 108,440 94,198 93,324
$ 698,798 $ 670,473 $ 655,160 $ 573,558 $ 553,982
For the year ended December 31, 2016, with comparative figures for 2015, 2014, 2013 and 2012[in thousands of dollars]
61

12162
City of Surrey Statement of Financial Information (SOFI) Schedule of Debts Section 4
2016 Statement of Financial Information
Information on the City of Surrey’s outstanding debt is included in Note 10 of the 2016 Notes to the Consolidated Financial Statements. Prepared under the Financial Information Regulation, Schedule 1, section 4
63
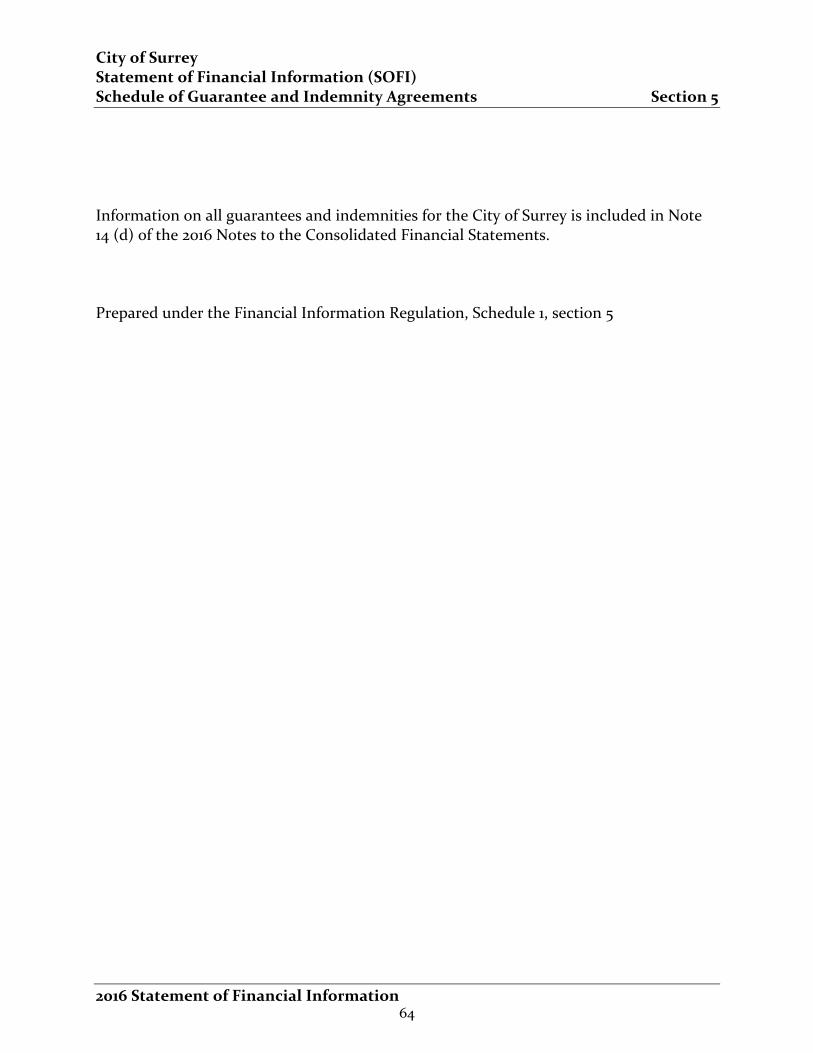
City of Surrey Statement of Financial Information (SOFI) Schedule of Guarantee and Indemnity Agreements Section 5
2016 Statement of Financial Information
Information on all guarantees and indemnities for the City of Surrey is included in Note 14 (d) of the 2016 Notes to the Consolidated Financial Statements. Prepared under the Financial Information Regulation, Schedule 1, section 5
64
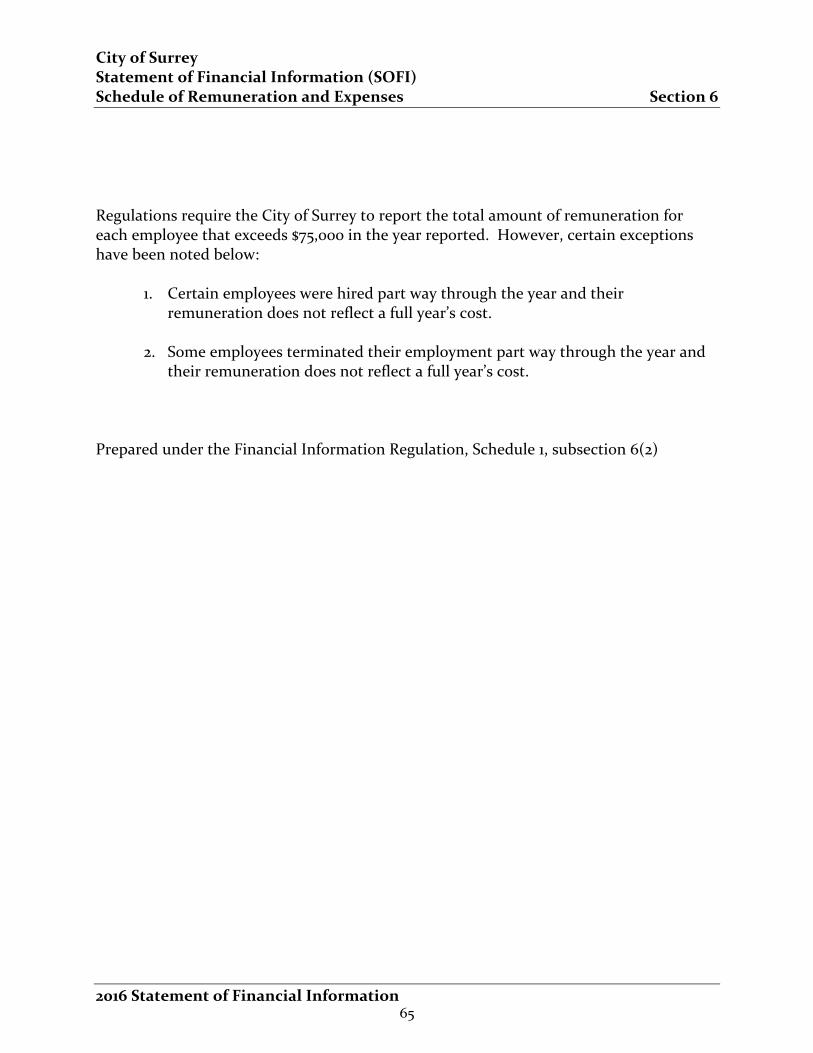
City of Surrey Statement of Financial Information (SOFI) Schedule of Remuneration and Expenses Section 6
2016 Statement of Financial Information
Regulations require the City of Surrey to report the total amount of remuneration for each employee that exceeds $75,000 in the year reported. However, certain exceptions have been noted below:
1. Certain employees were hired part way through the year and their remuneration does not reflect a full year’s cost.
2. Some employees terminated their employment part way through the year and
their remuneration does not reflect a full year’s cost.
Prepared under the Financial Information Regulation, Schedule 1, subsection 6(2)
65
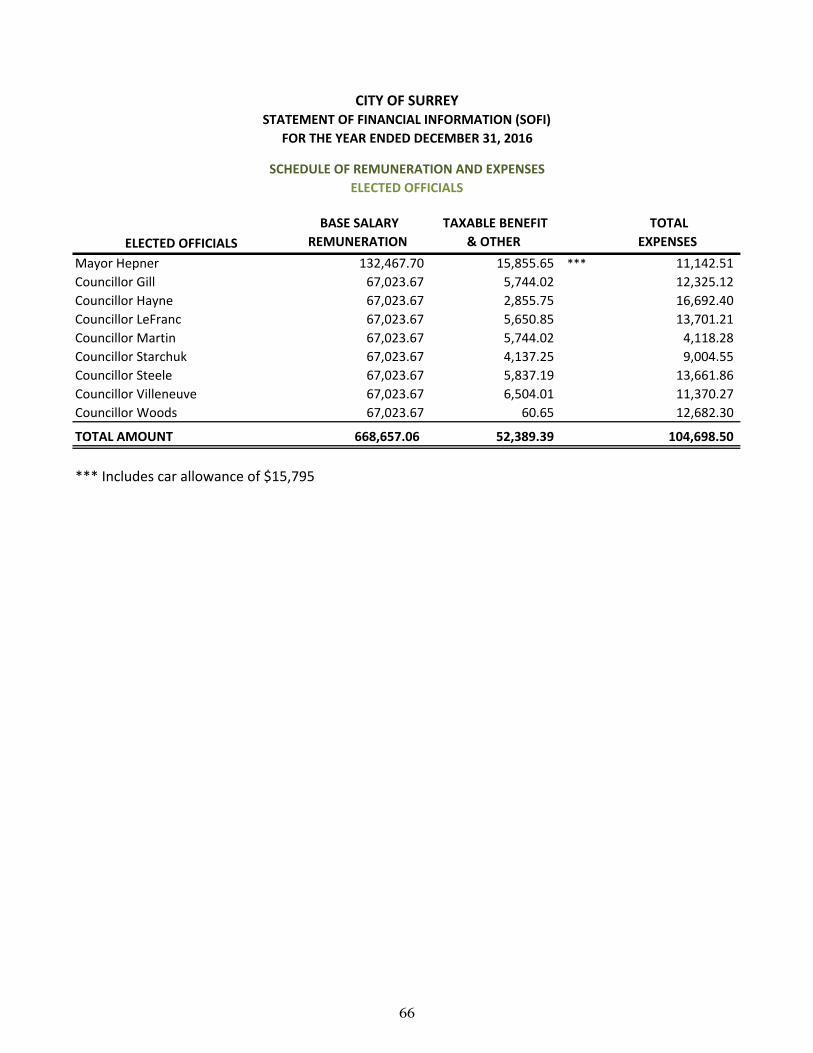
ELECTED OFFICIALS
BASE SALARY
REMUNERATION
TAXABLE BENEFIT
& OTHER
TOTAL
EXPENSES
Mayor Hepner 132,467.70 15,855.65 *** 11,142.51
Councillor Gill 67,023.67 5,744.02 12,325.12
Councillor Hayne 67,023.67 2,855.75 16,692.40
Councillor LeFranc 67,023.67 5,650.85 13,701.21
Councillor Martin 67,023.67 5,744.02 4,118.28
Councillor Starchuk 67,023.67 4,137.25 9,004.55
Councillor Steele 67,023.67 5,837.19 13,661.86
Councillor Villeneuve 67,023.67 6,504.01 11,370.27
Councillor Woods 67,023.67 60.65 12,682.30
TOTAL AMOUNT 668,657.06 52,389.39 104,698.50
*** Includes car allowance of $15,795
CITY OF SURREY
FOR THE YEAR ENDED DECEMBER 31, 2016
ELECTED OFFICIALS
STATEMENT OF FINANCIAL INFORMATION (SOFI)
SCHEDULE OF REMUNERATION AND EXPENSES
66
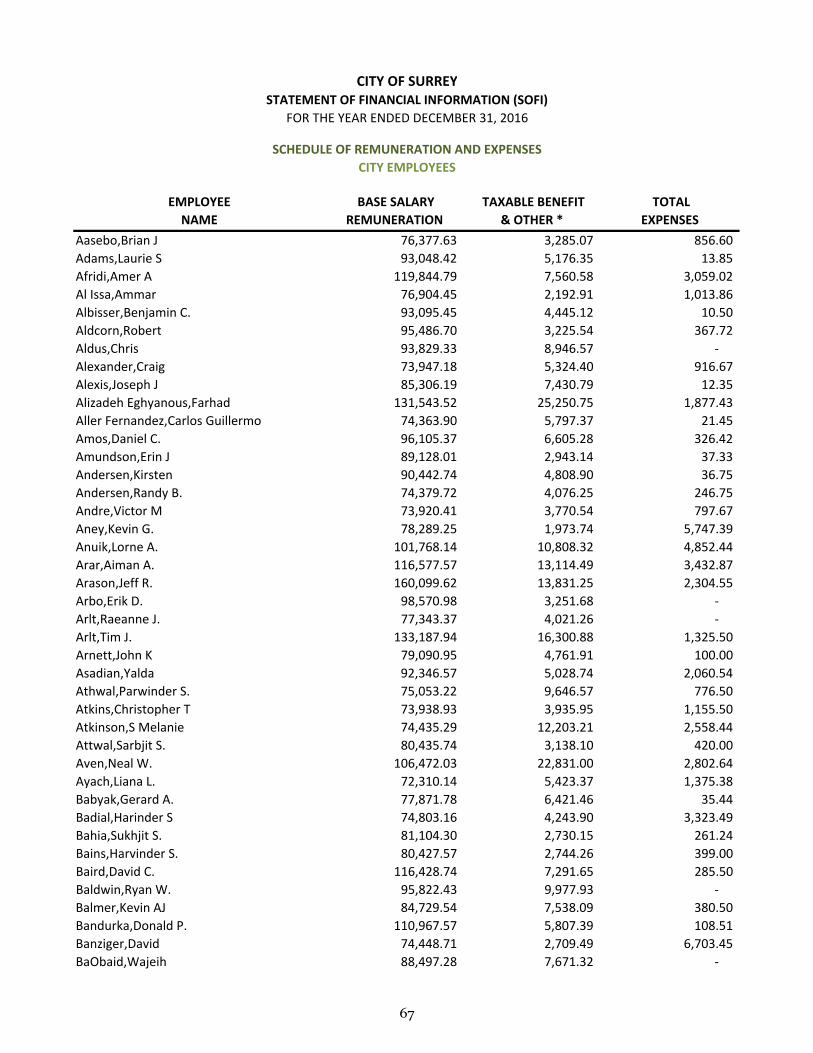
EMPLOYEE
NAME
BASE SALARY
REMUNERATION
TAXABLE BENEFIT
& OTHER *
TOTAL
EXPENSES
Aasebo,Brian J 76,377.63 3,285.07 856.60
Adams,Laurie S 93,048.42 5,176.35 13.85
Afridi,Amer A 119,844.79 7,560.58 3,059.02
Al Issa,Ammar 76,904.45 2,192.91 1,013.86
Albisser,Benjamin C. 93,095.45 4,445.12 10.50
Aldcorn,Robert 95,486.70 3,225.54 367.72
Aldus,Chris 93,829.33 8,946.57 ‐
Alexander,Craig 73,947.18 5,324.40 916.67
Alexis,Joseph J 85,306.19 7,430.79 12.35
Alizadeh Eghyanous,Farhad 131,543.52 25,250.75 1,877.43
Aller Fernandez,Carlos Guillermo 74,363.90 5,797.37 21.45
Amos,Daniel C. 96,105.37 6,605.28 326.42
Amundson,Erin J 89,128.01 2,943.14 37.33
Andersen,Kirsten 90,442.74 4,808.90 36.75
Andersen,Randy B. 74,379.72 4,076.25 246.75
Andre,Victor M 73,920.41 3,770.54 797.67
Aney,Kevin G. 78,289.25 1,973.74 5,747.39
Anuik,Lorne A. 101,768.14 10,808.32 4,852.44
Arar,Aiman A. 116,577.57 13,114.49 3,432.87
Arason,Jeff R. 160,099.62 13,831.25 2,304.55
Arbo,Erik D. 98,570.98 3,251.68 ‐
Arlt,Raeanne J. 77,343.37 4,021.26 ‐
Arlt,Tim J. 133,187.94 16,300.88 1,325.50
Arnett,John K 79,090.95 4,761.91 100.00
Asadian,Yalda 92,346.57 5,028.74 2,060.54
Athwal,Parwinder S. 75,053.22 9,646.57 776.50
Atkins,Christopher T 73,938.93 3,935.95 1,155.50
Atkinson,S Melanie 74,435.29 12,203.21 2,558.44
Attwal,Sarbjit S. 80,435.74 3,138.10 420.00
Aven,Neal W. 106,472.03 22,831.00 2,802.64
Ayach,Liana L. 72,310.14 5,423.37 1,375.38
Babyak,Gerard A. 77,871.78 6,421.46 35.44
Badial,Harinder S 74,803.16 4,243.90 3,323.49
Bahia,Sukhjit S. 81,104.30 2,730.15 261.24
Bains,Harvinder S. 80,427.57 2,744.26 399.00
Baird,David C. 116,428.74 7,291.65 285.50
Baldwin,Ryan W. 95,822.43 9,977.93 ‐
Balmer,Kevin AJ 84,729.54 7,538.09 380.50
Bandurka,Donald P. 110,967.57 5,807.39 108.51
Banziger,David 74,448.71 2,709.49 6,703.45
BaObaid,Wajeih 88,497.28 7,671.32 ‐
CITY EMPLOYEES
CITY OF SURREYSTATEMENT OF FINANCIAL INFORMATION (SOFI)
FOR THE YEAR ENDED DECEMBER 31, 2016
SCHEDULE OF REMUNERATION AND EXPENSES
67
EMPLOYEE
NAME
BASE SALARY
REMUNERATION
TAXABLE BENEFIT
& OTHER *
TOTAL
EXPENSES
CITY EMPLOYEES
CITY OF SURREYSTATEMENT OF FINANCIAL INFORMATION (SOFI)
FOR THE YEAR ENDED DECEMBER 31, 2016
SCHEDULE OF REMUNERATION AND EXPENSES
Baragan,Roxana 80,142.07 2,695.96 1,950.47
Barber,Duncan 95,600.97 4,589.66 ‐
Barnscher,Daniel A. 163,961.45 27,275.74 3,910.18
Baron,Carolyn A. 134,946.24 9,969.99 3,437.82
Bartholomew,Claude C. 98,480.31 9,174.35 ‐
Bartlett,Scott M. 98,922.52 12,368.63 178.25
Bartnik,Thomas 123,311.93 12,732.61 604.42
Basnayake,Koshala 93,110.27 4,983.81 250.18
Bates,Laurie A. 72,901.22 6,783.99 ‐
Baynham,Maggie E 72,779.95 5,409.88 3,881.91
Baysan,Gem 107,802.20 6,828.11 3,551.86
Beaton,Lisa 67,046.73 12,384.59 ‐
Beattie,Joshua Raymond 92,830.99 2,981.33 ‐
Becker,Edward W. 96,105.37 6,819.29 ‐
Beenham,Kevin R. 121,453.22 9,200.33 ‐
Begin,Gabriel 93,023.70 10,902.42 ‐
Bellefontaine,Bernice R 73,213.92 10,687.47 46.59
Bellefontaine,Philip J. 138,527.86 18,138.58 56.04
Bennest,Aaron L 79,551.84 4,908.60 7,172.10
Bentley,Darin R. 96,562.45 11,615.16 2,051.20
Berar,Baldev S. 82,305.81 23,803.14 11.00
Berdusco,Kevin A 95,542.66 7,803.01 255.67
Berg,Douglas E. 116,909.16 9,037.08 128.00
Berg,Fred N. 114,127.99 7,593.34 103.44
Bergen,Brian D. 113,417.41 11,811.20 86.90
Berg‐Iverson,Keith W. 103,043.17 16,947.30 ‐
Bernat,Siegfried 87,716.99 3,672.07 461.25
Bertoia,Daniel R 101,668.93 4,377.00 229.90
Bertoia,Farah 92,816.67 3,492.45 ‐
Bertoia,Mark A 93,915.18 3,365.51 50.00
Berube,Marc 115,236.94 7,798.25 123.43
Best,Jeffrey W. 116,846.05 9,224.54 100.00
Best,Rob M. 104,127.87 9,336.55 80.00
Betts,Mark E. 98,457.37 10,485.99 ‐
Bhullar‐Gill,Sally S 123,574.53 15,205.96 1,042.45
Blackburn,Timothy A. 117,057.29 7,018.43 50.49
Blakey,Cheryl D 76,859.19 2,087.83 1,240.00
Blandy,Cameron J 77,267.09 2,572.75 2,259.92
Blom,James W. 116,053.92 8,314.50 ‐
Boan,Jaime A. 175,183.34 23,387.53 3,507.30
Bobsien,Alex W. 116,227.73 5,246.40 ‐
68
EMPLOYEE
NAME
BASE SALARY
REMUNERATION
TAXABLE BENEFIT
& OTHER *
TOTAL
EXPENSES
CITY EMPLOYEES
CITY OF SURREYSTATEMENT OF FINANCIAL INFORMATION (SOFI)
FOR THE YEAR ENDED DECEMBER 31, 2016
SCHEDULE OF REMUNERATION AND EXPENSES
Bodnark,Richard D. 95,715.80 5,589.42 ‐
Boechler,Dave F. 115,677.82 8,091.68 ‐
Boehm,Andreas Michael 72,862.20 2,535.53 4,693.58
Bogen,Jan E. 99,664.89 2,904.25 1,164.71
Boles,Theresa M 95,715.80 4,507.67 ‐
Boles,W Brian 95,486.70 4,008.11 ‐
Bolt,Heather L. 94,675.52 9,085.83 1,854.12
Bolton,Lyle P. 117,057.29 6,766.53 10.50
Bonn,Trevor A. 117,249.22 5,438.97 125.00
Booiman,Rudy S. 82,157.91 3,471.79 389.26
Boon,Jason 93,095.45 4,492.36 ‐
Boreson,Robert A. 95,313.56 4,303.97 322.34
Boros,John D. 74,095.16 3,663.98 1,333.44
Botelho,Randy M 66,058.98 17,023.50 ‐
Boyal,Ravinder S. 74,215.13 7,820.56 ‐
Boychuk,Ronald W. 68,490.19 13,890.02 ‐
Boyes,Jason 114,020.20 5,975.62 1,387.58
Brand,I Johan 138,559.83 14,642.96 3,662.64
Brar,Equbal S 80,764.34 4,697.25 157.50
Brar,Joey J. 127,029.34 13,461.50 9,100.43
Brar,Kanwardeep S. 80,480.75 6,939.54 350.00
Brar,Sandeep S 82,409.05 9,072.23 1,793.77
Brayfield,Ryan M. 74,186.09 5,083.07 520.83
Bridgwater,Dominika M 76,468.32 5,763.33 35.71
Briscoe,Simon 86,608.21 4,754.71 20.00
Brisson,Montgomery C. 108,115.32 9,551.93 996.54
Britton,Tammy R. 101,686.65 5,108.21 900.65
Broersma,Keith 88,821.91 4,080.13 2,694.20
Bromley,Chris F. 116,258.71 7,717.57 155.50
Broughton,Bruce F. 78,587.18 326.30 3,684.74
Brown,Janiece A. 66,207.53 12,935.33 3,759.03
Brown,Matthew K 92,500.63 10,278.68 4,457.37
Bruinink,Karen V 73,979.22 4,939.73 87.80
Buchanan,Donald F 81,889.02 2,437.81 385.71
Buchmann,Thomas 106,042.85 4,519.28 1,913.40
Bukowski,John T. 98,860.58 9,009.50 ‐
Buljevic,Ivan 75,992.11 2,130.97 5,697.99
Bulka,Michael J. 116,969.70 10,895.33 115.00
Bull,Dennis R. 117,115.25 6,423.07 1,750.05
Bull,Richard W. 101,681.39 6,105.13 ‐
Bunsko,Mark W. 118,102.76 13,459.54 ‐
69
EMPLOYEE
NAME
BASE SALARY
REMUNERATION
TAXABLE BENEFIT
& OTHER *
TOTAL
EXPENSES
CITY EMPLOYEES
CITY OF SURREYSTATEMENT OF FINANCIAL INFORMATION (SOFI)
FOR THE YEAR ENDED DECEMBER 31, 2016
SCHEDULE OF REMUNERATION AND EXPENSES
Burger,Jason A. 129,926.33 6,624.91 128.00
Burkholder,Ross V 87,366.88 11,305.74 ‐
Burns,David R 116,645.14 8,594.73 3,235.46
Burns,Peter R. 98,281.57 11,592.35 ‐
Bushnell,Jason 70,042.38 6,967.42 2,561.17
Butchart,Brandon 95,125.65 14,949.66 412.21
Butula,Christine M. 97,865.36 5,933.50 ‐
Caines,Andrew M 73,843.08 2,818.99 264.05
Cairney,Jason W. 98,060.34 12,321.07 18.25
Callard,Jeff 93,362.95 11,182.74 10.50
Callewaert,James R 79,408.94 5,539.57 1,004.60
Calvert,Kyle F 93,305.57 7,542.41 ‐
Campbell,Alan K. 75,541.62 3,794.71 6.00
Campbell,Gordon W. 74,504.81 13,787.57 1,683.49
Campbell,Hugh Macmillan 106,902.95 7,665.20 4,386.56
Canton,Stephen James 75,583.40 4,892.66 640.74
Capuccinello Iraci,Anthony 150,599.75 8,463.86 3,430.25
Carmichael,Brian K. 133,066.54 3,846.84 2,500.00
Carnegie,Ralston L. 115,491.05 5,672.96 ‐
Carson,Elizabeth S 80,448.73 4,744.19 5,553.61
Castiglia,Danny V 99,018.35 5,365.90 1,991.60
Catlin,Michael D 95,438.31 9,597.91 8.25
Caughlan,Glen P. 81,103.85 3,467.37 7,703.08
Cavan,Laurie A. 220,754.41 38,645.74 5,458.51
Cavezza,Vince 73,623.03 1,586.01 ‐
Cerezo,Ernesto 94,727.50 11,678.21 52.60
Cesario,Lisa J. 74,217.00 5,677.82 250.75
Chamberlayne,Curtis M 94,425.88 9,916.90 ‐
Chan,Helen Gee 90,431.90 3,331.59 2,787.64
Chan,Nadia P 81,304.89 5,403.90 3,764.37
Chand,Sherel S. 73,718.16 16,271.94 2,019.18
Chapman,Ricky D 71,103.76 12,354.81 570.30
Chauhan,Satnam S 116,579.31 17,081.48 5,290.18
Che,Manh P 80,135.35 4,002.93 5,272.96
Cherry,Jami L 95,740.96 5,025.11 ‐
Cheyne,Dwayne D. 74,215.13 3,414.53 1,223.82
Chinery,Gary B. 68,732.64 55,739.66 ‐
Ching,Miranda K. 73,999.11 3,939.06 40.15
Chohan,Debra D 70,749.99 8,159.96 ‐
Chong,Randy E. 94,958.92 9,761.13 259.30
Chow,Marion 81,221.35 8,633.28 331.45
70
EMPLOYEE
NAME
BASE SALARY
REMUNERATION
TAXABLE BENEFIT
& OTHER *
TOTAL
EXPENSES
CITY EMPLOYEES
CITY OF SURREYSTATEMENT OF FINANCIAL INFORMATION (SOFI)
FOR THE YEAR ENDED DECEMBER 31, 2016
SCHEDULE OF REMUNERATION AND EXPENSES
Chow,Nathan 85,318.70 3,153.73 2,100.92
Christian,Anna M 81,144.87 5,434.09 4,436.97
Christiansen,Mack N 73,768.60 4,697.48 ‐
Chu,Clinton W. 109,720.89 5,420.97 591.10
Chun,Nora 94,631.26 2,843.57 4,292.76
Clark,Cameron 78,213.68 5,645.72 1,129.75
Clayton,Steve J. 75,354.36 4,487.91 420.00
Cleave,Dean B. 115,767.98 5,303.71 69.99
Clifford,Kevin J 79,646.10 16,567.07 5,389.79
Codron,Matthew 92,186.29 4,420.80 160.00
Cole,Ryan Thomas 84,735.18 8,503.62 ‐
Collins,Scott 74,270.39 7,493.13 617.51
Conway‐Brown,Russell J. 116,270.31 11,913.75 ‐
Cook,Jordi D. 93,380.51 9,913.66 ‐
Cook,Karen A. 99,235.64 7,170.54 ‐
Cooke,Robert 87,417.46 20,651.20 366.06
Cooper,Scott D. 115,236.93 6,093.85 499.24
Cooper,Steven J. 66,014.92 12,860.23 143.60
Coplin,Kevin W. 95,876.27 10,187.40 ‐
Corda,Goran 80,486.91 2,905.81 699.87
Cormack,Justin M. 98,090.28 11,713.55 1,074.71
Corrin,Graham M. 93,030.86 9,748.67 ‐
Corrin,Keith D. 95,991.35 5,351.63 312.21
Corrin,Matthew J. 94,001.05 8,343.36 ‐
Costanzo,Robert A. 160,086.25 30,205.27 3,126.90
Cowx,Wayne A. 73,641.70 3,897.03 2,136.17
Cronin,Paul M. 95,995.58 2,325.47 389.01
Crosby,Kenneth B. 74,366.36 9,485.32 1,238.17
Croy,Owen C. 166,507.31 25,604.64 3,259.53
Cugnet,Jaimie 80,363.64 5,919.54 750.65
Cumiford,Alan 70,433.15 4,875.72 ‐
Curley,Chris G. 74,370.32 3,249.71 156.62
Currie,Amber 69,067.64 13,942.04 761.45
Cuthbert,Andrew 73,912.99 2,968.79 ‐
Cyr,Aaron W 92,614.72 10,711.70 1,283.80
Cyr,Brian 98,834.40 5,201.95 ‐
Dallas,Ken W 80,511.00 7,499.05 607.25
Dance,Ryan G. 95,566.94 10,576.97 97.35
Daniel,Geoffrey I 53,757.20 28,164.09 505.11
Daniwall,Harnaik S 80,641.60 19,206.31 291.20
Danylchuk,Roderick C. 78,606.05 2,333.79 5,315.49
71
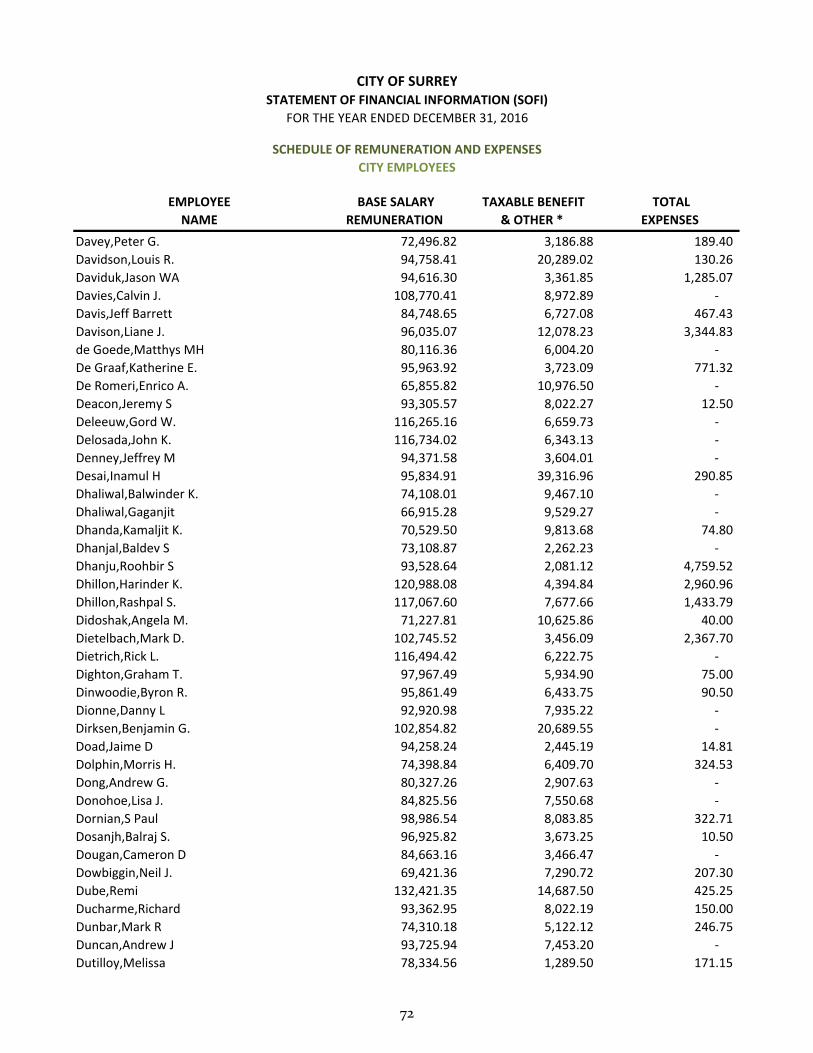
EMPLOYEE
NAME
BASE SALARY
REMUNERATION
TAXABLE BENEFIT
& OTHER *
TOTAL
EXPENSES
CITY EMPLOYEES
CITY OF SURREYSTATEMENT OF FINANCIAL INFORMATION (SOFI)
FOR THE YEAR ENDED DECEMBER 31, 2016
SCHEDULE OF REMUNERATION AND EXPENSES
Davey,Peter G. 72,496.82 3,186.88 189.40
Davidson,Louis R. 94,758.41 20,289.02 130.26
Daviduk,Jason WA 94,616.30 3,361.85 1,285.07
Davies,Calvin J. 108,770.41 8,972.89 ‐
Davis,Jeff Barrett 84,748.65 6,727.08 467.43
Davison,Liane J. 96,035.07 12,078.23 3,344.83
de Goede,Matthys MH 80,116.36 6,004.20 ‐
De Graaf,Katherine E. 95,963.92 3,723.09 771.32
De Romeri,Enrico A. 65,855.82 10,976.50 ‐
Deacon,Jeremy S 93,305.57 8,022.27 12.50
Deleeuw,Gord W. 116,265.16 6,659.73 ‐
Delosada,John K. 116,734.02 6,343.13 ‐
Denney,Jeffrey M 94,371.58 3,604.01 ‐
Desai,Inamul H 95,834.91 39,316.96 290.85
Dhaliwal,Balwinder K. 74,108.01 9,467.10 ‐
Dhaliwal,Gaganjit 66,915.28 9,529.27 ‐
Dhanda,Kamaljit K. 70,529.50 9,813.68 74.80
Dhanjal,Baldev S 73,108.87 2,262.23 ‐
Dhanju,Roohbir S 93,528.64 2,081.12 4,759.52
Dhillon,Harinder K. 120,988.08 4,394.84 2,960.96
Dhillon,Rashpal S. 117,067.60 7,677.66 1,433.79
Didoshak,Angela M. 71,227.81 10,625.86 40.00
Dietelbach,Mark D. 102,745.52 3,456.09 2,367.70
Dietrich,Rick L. 116,494.42 6,222.75 ‐
Dighton,Graham T. 97,967.49 5,934.90 75.00
Dinwoodie,Byron R. 95,861.49 6,433.75 90.50
Dionne,Danny L 92,920.98 7,935.22 ‐
Dirksen,Benjamin G. 102,854.82 20,689.55 ‐
Doad,Jaime D 94,258.24 2,445.19 14.81
Dolphin,Morris H. 74,398.84 6,409.70 324.53
Dong,Andrew G. 80,327.26 2,907.63 ‐
Donohoe,Lisa J. 84,825.56 7,550.68 ‐
Dornian,S Paul 98,986.54 8,083.85 322.71
Dosanjh,Balraj S. 96,925.82 3,673.25 10.50
Dougan,Cameron D 84,663.16 3,466.47 ‐
Dowbiggin,Neil J. 69,421.36 7,290.72 207.30
Dube,Remi 132,421.35 14,687.50 425.25
Ducharme,Richard 93,362.95 8,022.19 150.00
Dunbar,Mark R 74,310.18 5,122.12 246.75
Duncan,Andrew J 93,725.94 7,453.20 ‐
Dutilloy,Melissa 78,334.56 1,289.50 171.15
72
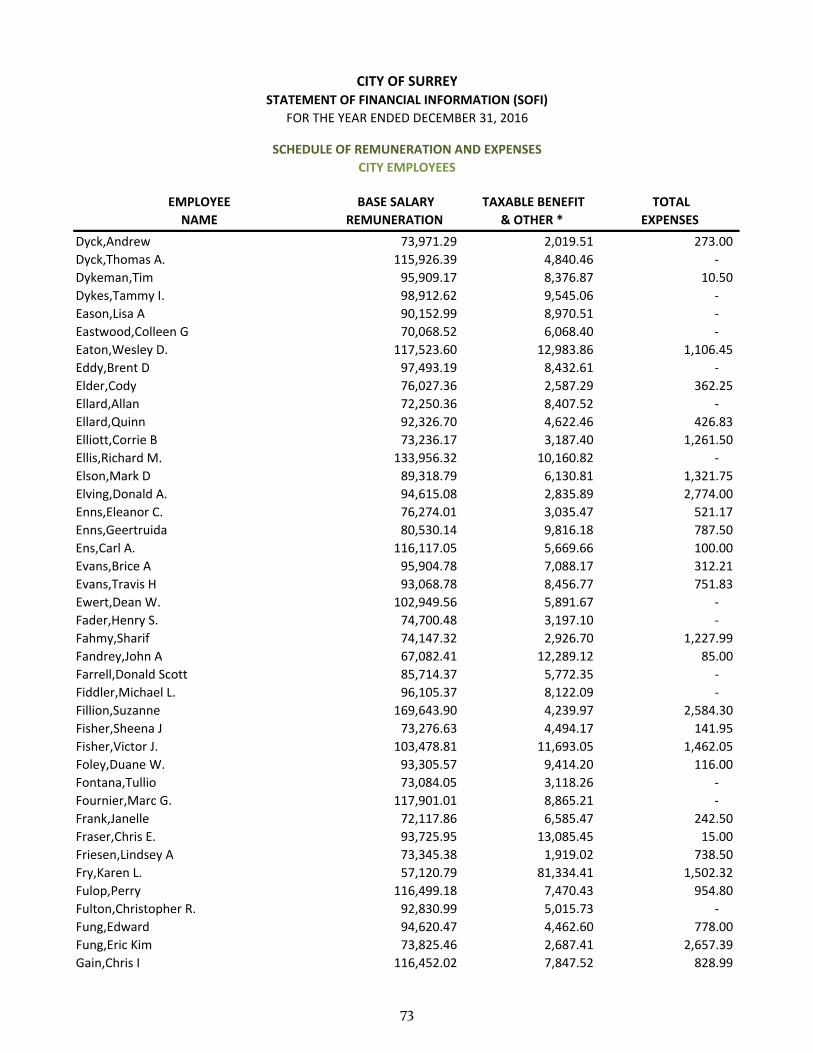
EMPLOYEE
NAME
BASE SALARY
REMUNERATION
TAXABLE BENEFIT
& OTHER *
TOTAL
EXPENSES
CITY EMPLOYEES
CITY OF SURREYSTATEMENT OF FINANCIAL INFORMATION (SOFI)
FOR THE YEAR ENDED DECEMBER 31, 2016
SCHEDULE OF REMUNERATION AND EXPENSES
Dyck,Andrew 73,971.29 2,019.51 273.00
Dyck,Thomas A. 115,926.39 4,840.46 ‐
Dykeman,Tim 95,909.17 8,376.87 10.50
Dykes,Tammy I. 98,912.62 9,545.06 ‐
Eason,Lisa A 90,152.99 8,970.51 ‐
Eastwood,Colleen G 70,068.52 6,068.40 ‐
Eaton,Wesley D. 117,523.60 12,983.86 1,106.45
Eddy,Brent D 97,493.19 8,432.61 ‐
Elder,Cody 76,027.36 2,587.29 362.25
Ellard,Allan 72,250.36 8,407.52 ‐
Ellard,Quinn 92,326.70 4,622.46 426.83
Elliott,Corrie B 73,236.17 3,187.40 1,261.50
Ellis,Richard M. 133,956.32 10,160.82 ‐
Elson,Mark D 89,318.79 6,130.81 1,321.75
Elving,Donald A. 94,615.08 2,835.89 2,774.00
Enns,Eleanor C. 76,274.01 3,035.47 521.17
Enns,Geertruida 80,530.14 9,816.18 787.50
Ens,Carl A. 116,117.05 5,669.66 100.00
Evans,Brice A 95,904.78 7,088.17 312.21
Evans,Travis H 93,068.78 8,456.77 751.83
Ewert,Dean W. 102,949.56 5,891.67 ‐
Fader,Henry S. 74,700.48 3,197.10 ‐
Fahmy,Sharif 74,147.32 2,926.70 1,227.99
Fandrey,John A 67,082.41 12,289.12 85.00
Farrell,Donald Scott 85,714.37 5,772.35 ‐
Fiddler,Michael L. 96,105.37 8,122.09 ‐
Fillion,Suzanne 169,643.90 4,239.97 2,584.30
Fisher,Sheena J 73,276.63 4,494.17 141.95
Fisher,Victor J. 103,478.81 11,693.05 1,462.05
Foley,Duane W. 93,305.57 9,414.20 116.00
Fontana,Tullio 73,084.05 3,118.26 ‐
Fournier,Marc G. 117,901.01 8,865.21 ‐
Frank,Janelle 72,117.86 6,585.47 242.50
Fraser,Chris E. 93,725.95 13,085.45 15.00
Friesen,Lindsey A 73,345.38 1,919.02 738.50
Fry,Karen L. 57,120.79 81,334.41 1,502.32
Fulop,Perry 116,499.18 7,470.43 954.80
Fulton,Christopher R. 92,830.99 5,015.73 ‐
Fung,Edward 94,620.47 4,462.60 778.00
Fung,Eric Kim 73,825.46 2,687.41 2,657.39
Gain,Chris I 116,452.02 7,847.52 828.99
73
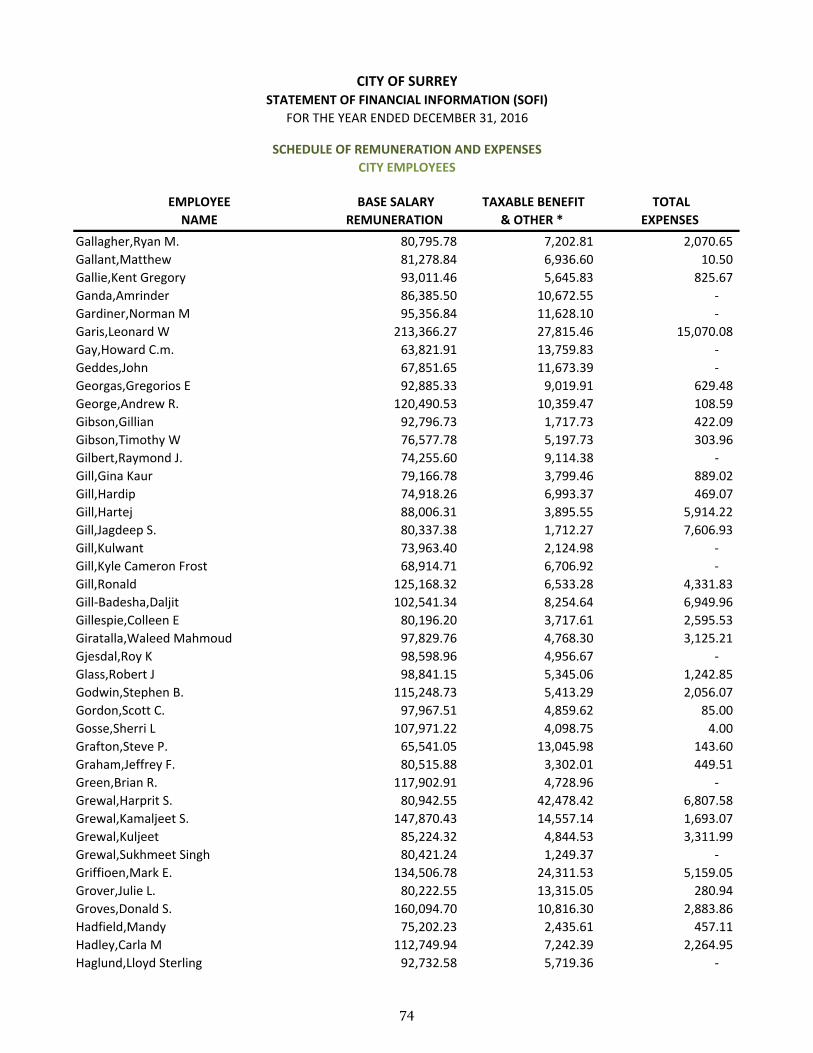
EMPLOYEE
NAME
BASE SALARY
REMUNERATION
TAXABLE BENEFIT
& OTHER *
TOTAL
EXPENSES
CITY EMPLOYEES
CITY OF SURREYSTATEMENT OF FINANCIAL INFORMATION (SOFI)
FOR THE YEAR ENDED DECEMBER 31, 2016
SCHEDULE OF REMUNERATION AND EXPENSES
Gallagher,Ryan M. 80,795.78 7,202.81 2,070.65
Gallant,Matthew 81,278.84 6,936.60 10.50
Gallie,Kent Gregory 93,011.46 5,645.83 825.67
Ganda,Amrinder 86,385.50 10,672.55 ‐
Gardiner,Norman M 95,356.84 11,628.10 ‐
Garis,Leonard W 213,366.27 27,815.46 15,070.08
Gay,Howard C.m. 63,821.91 13,759.83 ‐
Geddes,John 67,851.65 11,673.39 ‐
Georgas,Gregorios E 92,885.33 9,019.91 629.48
George,Andrew R. 120,490.53 10,359.47 108.59
Gibson,Gillian 92,796.73 1,717.73 422.09
Gibson,Timothy W 76,577.78 5,197.73 303.96
Gilbert,Raymond J. 74,255.60 9,114.38 ‐
Gill,Gina Kaur 79,166.78 3,799.46 889.02
Gill,Hardip 74,918.26 6,993.37 469.07
Gill,Hartej 88,006.31 3,895.55 5,914.22
Gill,Jagdeep S. 80,337.38 1,712.27 7,606.93
Gill,Kulwant 73,963.40 2,124.98 ‐
Gill,Kyle Cameron Frost 68,914.71 6,706.92 ‐
Gill,Ronald 125,168.32 6,533.28 4,331.83
Gill‐Badesha,Daljit 102,541.34 8,254.64 6,949.96
Gillespie,Colleen E 80,196.20 3,717.61 2,595.53
Giratalla,Waleed Mahmoud 97,829.76 4,768.30 3,125.21
Gjesdal,Roy K 98,598.96 4,956.67 ‐
Glass,Robert J 98,841.15 5,345.06 1,242.85
Godwin,Stephen B. 115,248.73 5,413.29 2,056.07
Gordon,Scott C. 97,967.51 4,859.62 85.00
Gosse,Sherri L 107,971.22 4,098.75 4.00
Grafton,Steve P. 65,541.05 13,045.98 143.60
Graham,Jeffrey F. 80,515.88 3,302.01 449.51
Green,Brian R. 117,902.91 4,728.96 ‐
Grewal,Harprit S. 80,942.55 42,478.42 6,807.58
Grewal,Kamaljeet S. 147,870.43 14,557.14 1,693.07
Grewal,Kuljeet 85,224.32 4,844.53 3,311.99
Grewal,Sukhmeet Singh 80,421.24 1,249.37 ‐
Griffioen,Mark E. 134,506.78 24,311.53 5,159.05
Grover,Julie L. 80,222.55 13,315.05 280.94
Groves,Donald S. 160,094.70 10,816.30 2,883.86
Hadfield,Mandy 75,202.23 2,435.61 457.11
Hadley,Carla M 112,749.94 7,242.39 2,264.95
Haglund,Lloyd Sterling 92,732.58 5,719.36 ‐
74
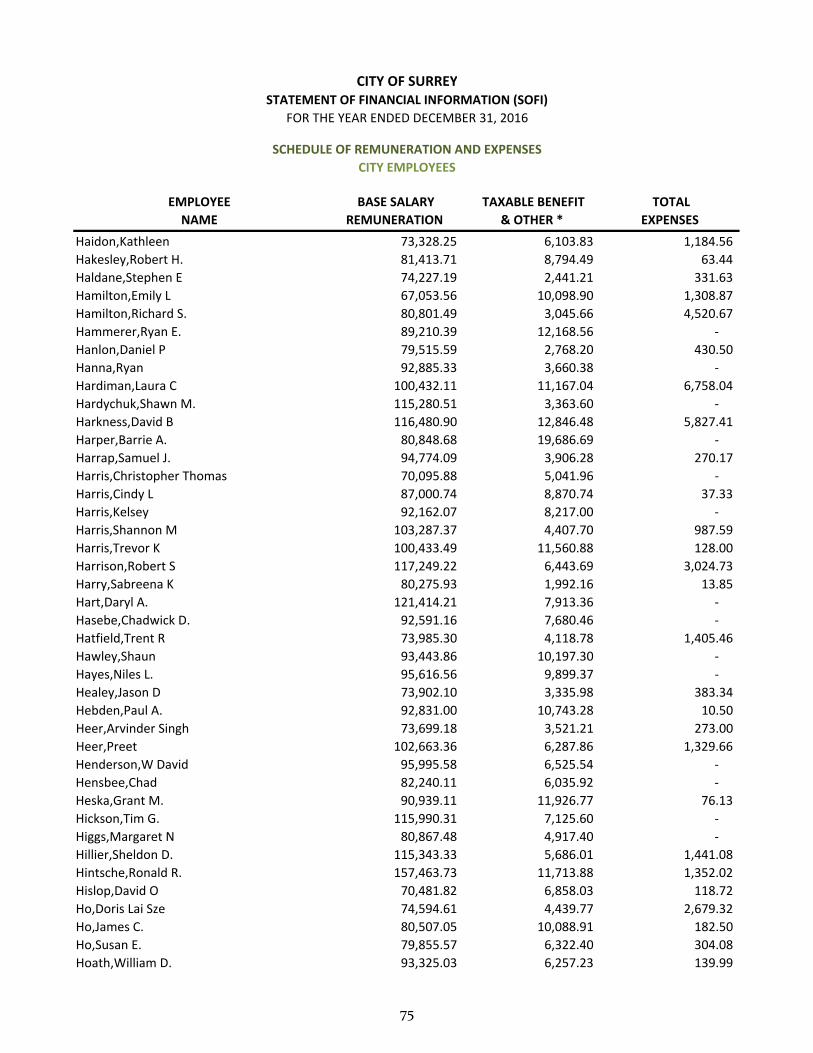
EMPLOYEE
NAME
BASE SALARY
REMUNERATION
TAXABLE BENEFIT
& OTHER *
TOTAL
EXPENSES
CITY EMPLOYEES
CITY OF SURREYSTATEMENT OF FINANCIAL INFORMATION (SOFI)
FOR THE YEAR ENDED DECEMBER 31, 2016
SCHEDULE OF REMUNERATION AND EXPENSES
Haidon,Kathleen 73,328.25 6,103.83 1,184.56
Hakesley,Robert H. 81,413.71 8,794.49 63.44
Haldane,Stephen E 74,227.19 2,441.21 331.63
Hamilton,Emily L 67,053.56 10,098.90 1,308.87
Hamilton,Richard S. 80,801.49 3,045.66 4,520.67
Hammerer,Ryan E. 89,210.39 12,168.56 ‐
Hanlon,Daniel P 79,515.59 2,768.20 430.50
Hanna,Ryan 92,885.33 3,660.38 ‐
Hardiman,Laura C 100,432.11 11,167.04 6,758.04
Hardychuk,Shawn M. 115,280.51 3,363.60 ‐
Harkness,David B 116,480.90 12,846.48 5,827.41
Harper,Barrie A. 80,848.68 19,686.69 ‐
Harrap,Samuel J. 94,774.09 3,906.28 270.17
Harris,Christopher Thomas 70,095.88 5,041.96 ‐
Harris,Cindy L 87,000.74 8,870.74 37.33
Harris,Kelsey 92,162.07 8,217.00 ‐
Harris,Shannon M 103,287.37 4,407.70 987.59
Harris,Trevor K 100,433.49 11,560.88 128.00
Harrison,Robert S 117,249.22 6,443.69 3,024.73
Harry,Sabreena K 80,275.93 1,992.16 13.85
Hart,Daryl A. 121,414.21 7,913.36 ‐
Hasebe,Chadwick D. 92,591.16 7,680.46 ‐
Hatfield,Trent R 73,985.30 4,118.78 1,405.46
Hawley,Shaun 93,443.86 10,197.30 ‐
Hayes,Niles L. 95,616.56 9,899.37 ‐
Healey,Jason D 73,902.10 3,335.98 383.34
Hebden,Paul A. 92,831.00 10,743.28 10.50
Heer,Arvinder Singh 73,699.18 3,521.21 273.00
Heer,Preet 102,663.36 6,287.86 1,329.66
Henderson,W David 95,995.58 6,525.54 ‐
Hensbee,Chad 82,240.11 6,035.92 ‐
Heska,Grant M. 90,939.11 11,926.77 76.13
Hickson,Tim G. 115,990.31 7,125.60 ‐
Higgs,Margaret N 80,867.48 4,917.40 ‐
Hillier,Sheldon D. 115,343.33 5,686.01 1,441.08
Hintsche,Ronald R. 157,463.73 11,713.88 1,352.02
Hislop,David O 70,481.82 6,858.03 118.72
Ho,Doris Lai Sze 74,594.61 4,439.77 2,679.32
Ho,James C. 80,507.05 10,088.91 182.50
Ho,Susan E. 79,855.57 6,322.40 304.08
Hoath,William D. 93,325.03 6,257.23 139.99
75

EMPLOYEE
NAME
BASE SALARY
REMUNERATION
TAXABLE BENEFIT
& OTHER *
TOTAL
EXPENSES
CITY EMPLOYEES
CITY OF SURREYSTATEMENT OF FINANCIAL INFORMATION (SOFI)
FOR THE YEAR ENDED DECEMBER 31, 2016
SCHEDULE OF REMUNERATION AND EXPENSES
Hobson,Joshua S 96,799.15 5,284.07 322.33
Hoeller,Charles 93,539.42 2,646.89 1,077.68
Holland,Jeffrey B. 92,966.83 8,441.21 844.25
Holovach,Kelvin M. 87,518.28 22,997.29 ‐
Horn,Randy H 93,457.43 8,597.94 ‐
Howlett,Lawrence S. 116,106.75 7,041.79 60.00
Howling,Gordon S. 95,925.94 4,574.08 3,623.90
Hryb,Nicholas O. 95,789.71 9,274.36 99.99
Hua,Ning Ning 71,020.92 8,014.82 74.99
Hughan,Sarah 99,436.85 12,525.67 1,308.07
Hughes,Joshua P. 80,029.16 5,073.68 2,309.99
Hungar,Schaelen M. 98,493.70 5,852.59 ‐
Hunt,Terence J. 117,273.66 6,591.54 28.00
Hunter,Brad J. 102,389.01 9,495.47 ‐
Huynh,Philip 150,641.82 10,091.48 5,294.30
Icasiano,Ryan 74,863.09 2,546.84 563.58
Innes,Nancy E. 116,258.75 5,528.27 ‐
Ireland,Jerome K. 74,099.80 5,023.82 789.25
Irvine,Kelly D. 88,292.15 8,129.12 1,276.57
Ivanov,Viatcheslav 87,228.83 11,081.58 ‐
Iverson,Eileen M 129,976.08 10,548.00 1,372.29
Iverson,Kalum A. 92,704.93 4,660.29 230.00
Izzard,David 108,811.52 1,527.41 3,978.37
Jackson,Kim Michelle 70,660.61 7,698.91 ‐
Jackson,Tyler R 69,800.44 6,547.11 ‐
Jagielski,Arkadiusz R. 80,469.35 10,430.73 6,033.91
Jamieson,Aaron G 102,203.79 9,107.21 118.00
Jamin,Francois 75,860.35 3,290.80 14.50
Janda,Harjinder S 111,551.20 22,245.48 2,147.17
Janzen,Erwin P. 116,478.97 4,606.18 ‐
Jaswal,Gopal 92,830.99 7,854.59 466.83
Jeklin,Troy W 72,980.06 13,305.46 543.13
Jensen,G Hiroshi 73,963.40 2,131.79 2,580.85
Jensen,Joshua 80,337.98 11,935.26 1,011.24
Jerome,Reo R. 120,807.79 12,955.42 ‐
Jesson,Claudia 95,450.01 2,966.40 266.38
Jhingan,Waqt 86,272.24 2,449.54 392.67
Johal,Snover 63,810.38 20,279.22 ‐
Johnson,Alicia D. 82,000.94 2,401.03 1,673.05
Johnson,Duane A 78,984.03 5,710.61 ‐
Johnson,Melissa C 74,838.11 2,458.91 618.27
76
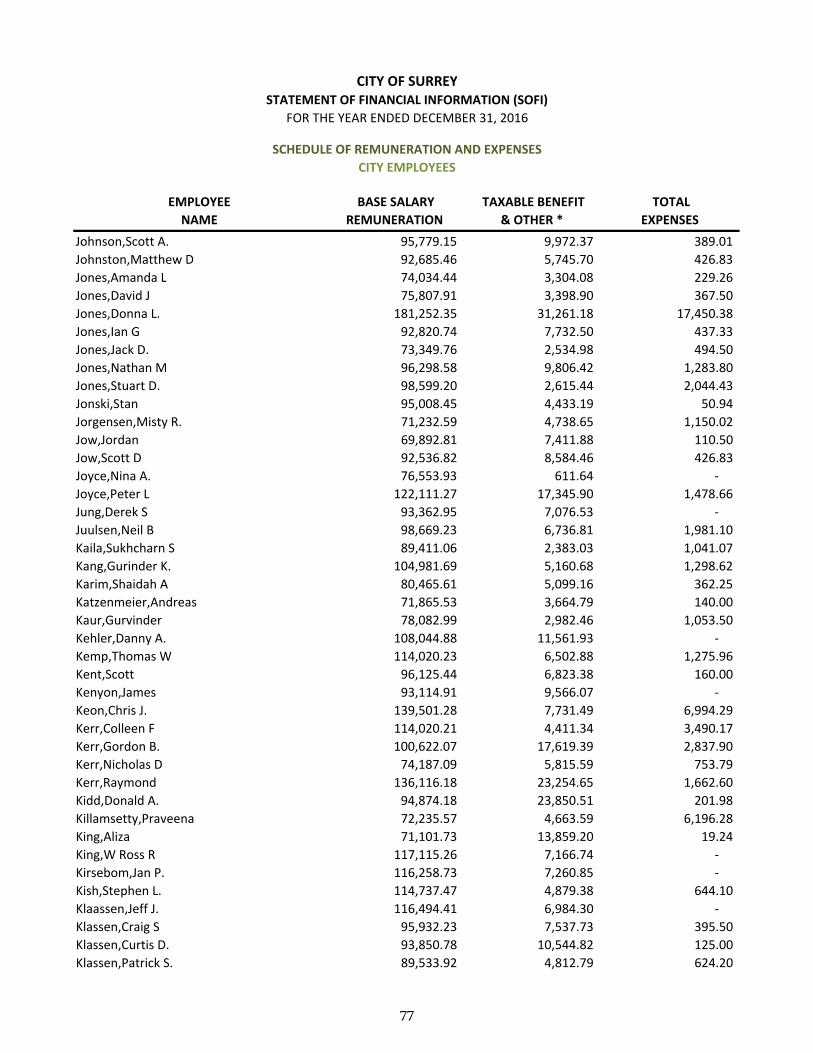
EMPLOYEE
NAME
BASE SALARY
REMUNERATION
TAXABLE BENEFIT
& OTHER *
TOTAL
EXPENSES
CITY EMPLOYEES
CITY OF SURREYSTATEMENT OF FINANCIAL INFORMATION (SOFI)
FOR THE YEAR ENDED DECEMBER 31, 2016
SCHEDULE OF REMUNERATION AND EXPENSES
Johnson,Scott A. 95,779.15 9,972.37 389.01
Johnston,Matthew D 92,685.46 5,745.70 426.83
Jones,Amanda L 74,034.44 3,304.08 229.26
Jones,David J 75,807.91 3,398.90 367.50
Jones,Donna L. 181,252.35 31,261.18 17,450.38
Jones,Ian G 92,820.74 7,732.50 437.33
Jones,Jack D. 73,349.76 2,534.98 494.50
Jones,Nathan M 96,298.58 9,806.42 1,283.80
Jones,Stuart D. 98,599.20 2,615.44 2,044.43
Jonski,Stan 95,008.45 4,433.19 50.94
Jorgensen,Misty R. 71,232.59 4,738.65 1,150.02
Jow,Jordan 69,892.81 7,411.88 110.50
Jow,Scott D 92,536.82 8,584.46 426.83
Joyce,Nina A. 76,553.93 611.64 ‐
Joyce,Peter L 122,111.27 17,345.90 1,478.66
Jung,Derek S 93,362.95 7,076.53 ‐
Juulsen,Neil B 98,669.23 6,736.81 1,981.10
Kaila,Sukhcharn S 89,411.06 2,383.03 1,041.07
Kang,Gurinder K. 104,981.69 5,160.68 1,298.62
Karim,Shaidah A 80,465.61 5,099.16 362.25
Katzenmeier,Andreas 71,865.53 3,664.79 140.00
Kaur,Gurvinder 78,082.99 2,982.46 1,053.50
Kehler,Danny A. 108,044.88 11,561.93 ‐
Kemp,Thomas W 114,020.23 6,502.88 1,275.96
Kent,Scott 96,125.44 6,823.38 160.00
Kenyon,James 93,114.91 9,566.07 ‐
Keon,Chris J. 139,501.28 7,731.49 6,994.29
Kerr,Colleen F 114,020.21 4,411.34 3,490.17
Kerr,Gordon B. 100,622.07 17,619.39 2,837.90
Kerr,Nicholas D 74,187.09 5,815.59 753.79
Kerr,Raymond 136,116.18 23,254.65 1,662.60
Kidd,Donald A. 94,874.18 23,850.51 201.98
Killamsetty,Praveena 72,235.57 4,663.59 6,196.28
King,Aliza 71,101.73 13,859.20 19.24
King,W Ross R 117,115.26 7,166.74 ‐
Kirsebom,Jan P. 116,258.73 7,260.85 ‐
Kish,Stephen L. 114,737.47 4,879.38 644.10
Klaassen,Jeff J. 116,494.41 6,984.30 ‐
Klassen,Craig S 95,932.23 7,537.73 395.50
Klassen,Curtis D. 93,850.78 10,544.82 125.00
Klassen,Patrick S. 89,533.92 4,812.79 624.20
77
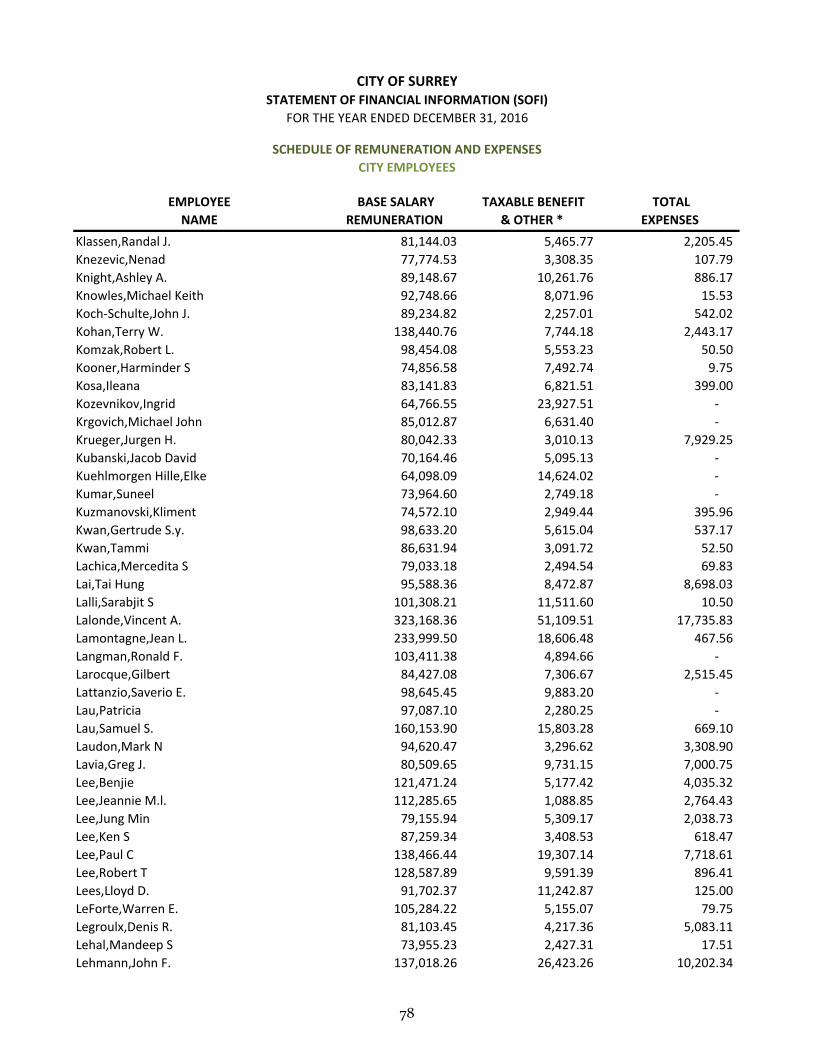
EMPLOYEE
NAME
BASE SALARY
REMUNERATION
TAXABLE BENEFIT
& OTHER *
TOTAL
EXPENSES
CITY EMPLOYEES
CITY OF SURREYSTATEMENT OF FINANCIAL INFORMATION (SOFI)
FOR THE YEAR ENDED DECEMBER 31, 2016
SCHEDULE OF REMUNERATION AND EXPENSES
Klassen,Randal J. 81,144.03 5,465.77 2,205.45
Knezevic,Nenad 77,774.53 3,308.35 107.79
Knight,Ashley A. 89,148.67 10,261.76 886.17
Knowles,Michael Keith 92,748.66 8,071.96 15.53
Koch‐Schulte,John J. 89,234.82 2,257.01 542.02
Kohan,Terry W. 138,440.76 7,744.18 2,443.17
Komzak,Robert L. 98,454.08 5,553.23 50.50
Kooner,Harminder S 74,856.58 7,492.74 9.75
Kosa,Ileana 83,141.83 6,821.51 399.00
Kozevnikov,Ingrid 64,766.55 23,927.51 ‐
Krgovich,Michael John 85,012.87 6,631.40 ‐
Krueger,Jurgen H. 80,042.33 3,010.13 7,929.25
Kubanski,Jacob David 70,164.46 5,095.13 ‐
Kuehlmorgen Hille,Elke 64,098.09 14,624.02 ‐
Kumar,Suneel 73,964.60 2,749.18 ‐
Kuzmanovski,Kliment 74,572.10 2,949.44 395.96
Kwan,Gertrude S.y. 98,633.20 5,615.04 537.17
Kwan,Tammi 86,631.94 3,091.72 52.50
Lachica,Mercedita S 79,033.18 2,494.54 69.83
Lai,Tai Hung 95,588.36 8,472.87 8,698.03
Lalli,Sarabjit S 101,308.21 11,511.60 10.50
Lalonde,Vincent A. 323,168.36 51,109.51 17,735.83
Lamontagne,Jean L. 233,999.50 18,606.48 467.56
Langman,Ronald F. 103,411.38 4,894.66 ‐
Larocque,Gilbert 84,427.08 7,306.67 2,515.45
Lattanzio,Saverio E. 98,645.45 9,883.20 ‐
Lau,Patricia 97,087.10 2,280.25 ‐
Lau,Samuel S. 160,153.90 15,803.28 669.10
Laudon,Mark N 94,620.47 3,296.62 3,308.90
Lavia,Greg J. 80,509.65 9,731.15 7,000.75
Lee,Benjie 121,471.24 5,177.42 4,035.32
Lee,Jeannie M.l. 112,285.65 1,088.85 2,764.43
Lee,Jung Min 79,155.94 5,309.17 2,038.73
Lee,Ken S 87,259.34 3,408.53 618.47
Lee,Paul C 138,466.44 19,307.14 7,718.61
Lee,Robert T 128,587.89 9,591.39 896.41
Lees,Lloyd D. 91,702.37 11,242.87 125.00
LeForte,Warren E. 105,284.22 5,155.07 79.75
Legroulx,Denis R. 81,103.45 4,217.36 5,083.11
Lehal,Mandeep S 73,955.23 2,427.31 17.51
Lehmann,John F. 137,018.26 26,423.26 10,202.34
78
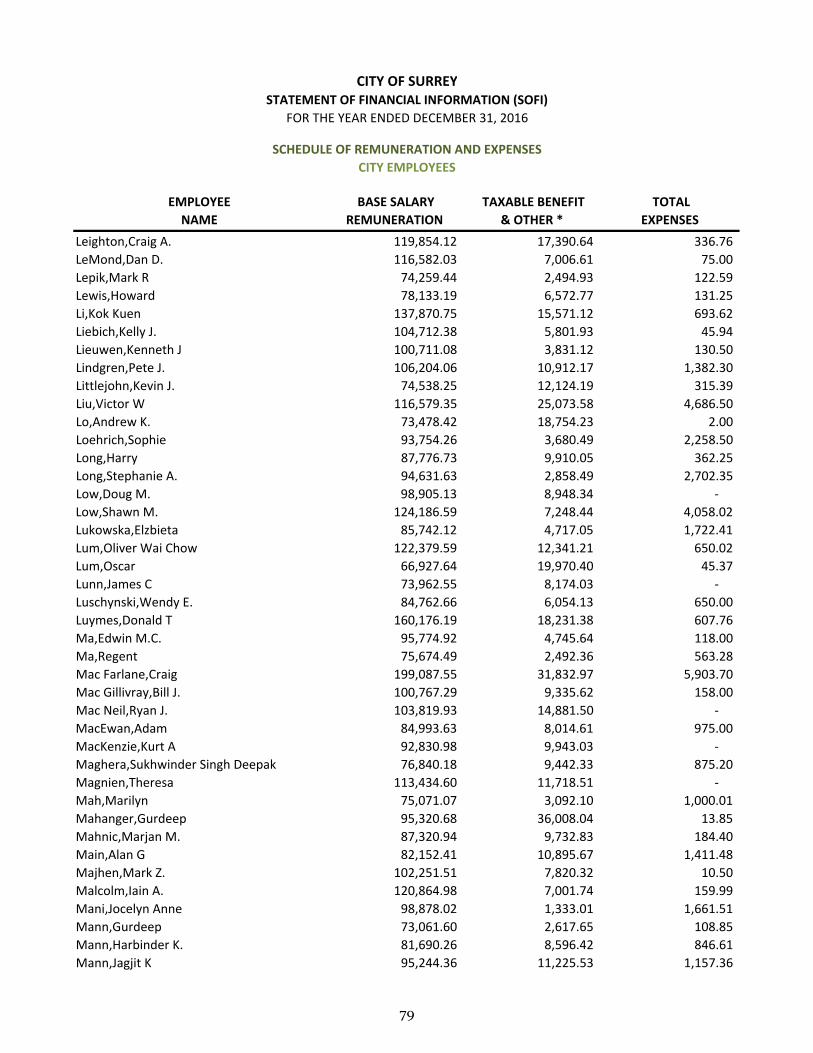
EMPLOYEE
NAME
BASE SALARY
REMUNERATION
TAXABLE BENEFIT
& OTHER *
TOTAL
EXPENSES
CITY EMPLOYEES
CITY OF SURREYSTATEMENT OF FINANCIAL INFORMATION (SOFI)
FOR THE YEAR ENDED DECEMBER 31, 2016
SCHEDULE OF REMUNERATION AND EXPENSES
Leighton,Craig A. 119,854.12 17,390.64 336.76
LeMond,Dan D. 116,582.03 7,006.61 75.00
Lepik,Mark R 74,259.44 2,494.93 122.59
Lewis,Howard 78,133.19 6,572.77 131.25
Li,Kok Kuen 137,870.75 15,571.12 693.62
Liebich,Kelly J. 104,712.38 5,801.93 45.94
Lieuwen,Kenneth J 100,711.08 3,831.12 130.50
Lindgren,Pete J. 106,204.06 10,912.17 1,382.30
Littlejohn,Kevin J. 74,538.25 12,124.19 315.39
Liu,Victor W 116,579.35 25,073.58 4,686.50
Lo,Andrew K. 73,478.42 18,754.23 2.00
Loehrich,Sophie 93,754.26 3,680.49 2,258.50
Long,Harry 87,776.73 9,910.05 362.25
Long,Stephanie A. 94,631.63 2,858.49 2,702.35
Low,Doug M. 98,905.13 8,948.34 ‐
Low,Shawn M. 124,186.59 7,248.44 4,058.02
Lukowska,Elzbieta 85,742.12 4,717.05 1,722.41
Lum,Oliver Wai Chow 122,379.59 12,341.21 650.02
Lum,Oscar 66,927.64 19,970.40 45.37
Lunn,James C 73,962.55 8,174.03 ‐
Luschynski,Wendy E. 84,762.66 6,054.13 650.00
Luymes,Donald T 160,176.19 18,231.38 607.76
Ma,Edwin M.C. 95,774.92 4,745.64 118.00
Ma,Regent 75,674.49 2,492.36 563.28
Mac Farlane,Craig 199,087.55 31,832.97 5,903.70
Mac Gillivray,Bill J. 100,767.29 9,335.62 158.00
Mac Neil,Ryan J. 103,819.93 14,881.50 ‐
MacEwan,Adam 84,993.63 8,014.61 975.00
MacKenzie,Kurt A 92,830.98 9,943.03 ‐
Maghera,Sukhwinder Singh Deepak 76,840.18 9,442.33 875.20
Magnien,Theresa 113,434.60 11,718.51 ‐
Mah,Marilyn 75,071.07 3,092.10 1,000.01
Mahanger,Gurdeep 95,320.68 36,008.04 13.85
Mahnic,Marjan M. 87,320.94 9,732.83 184.40
Main,Alan G 82,152.41 10,895.67 1,411.48
Majhen,Mark Z. 102,251.51 7,820.32 10.50
Malcolm,Iain A. 120,864.98 7,001.74 159.99
Mani,Jocelyn Anne 98,878.02 1,333.01 1,661.51
Mann,Gurdeep 73,061.60 2,617.65 108.85
Mann,Harbinder K. 81,690.26 8,596.42 846.61
Mann,Jagjit K 95,244.36 11,225.53 1,157.36
79
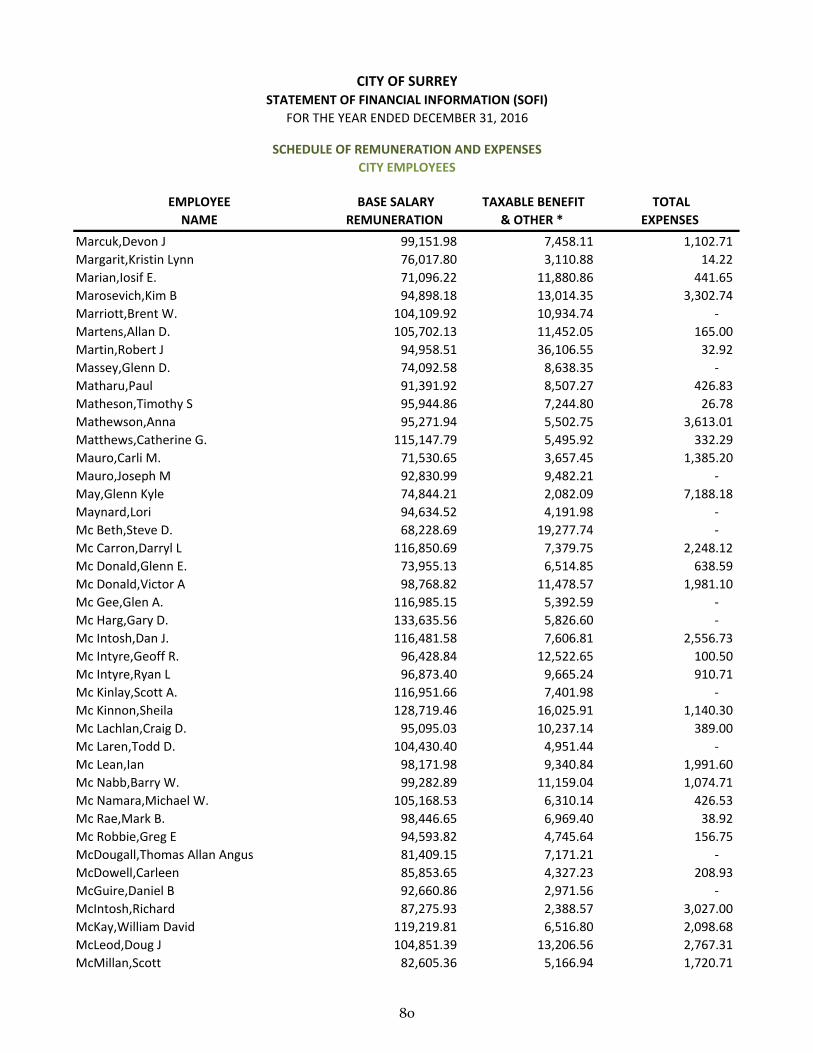
EMPLOYEE
NAME
BASE SALARY
REMUNERATION
TAXABLE BENEFIT
& OTHER *
TOTAL
EXPENSES
CITY EMPLOYEES
CITY OF SURREYSTATEMENT OF FINANCIAL INFORMATION (SOFI)
FOR THE YEAR ENDED DECEMBER 31, 2016
SCHEDULE OF REMUNERATION AND EXPENSES
Marcuk,Devon J 99,151.98 7,458.11 1,102.71
Margarit,Kristin Lynn 76,017.80 3,110.88 14.22
Marian,Iosif E. 71,096.22 11,880.86 441.65
Marosevich,Kim B 94,898.18 13,014.35 3,302.74
Marriott,Brent W. 104,109.92 10,934.74 ‐
Martens,Allan D. 105,702.13 11,452.05 165.00
Martin,Robert J 94,958.51 36,106.55 32.92
Massey,Glenn D. 74,092.58 8,638.35 ‐
Matharu,Paul 91,391.92 8,507.27 426.83
Matheson,Timothy S 95,944.86 7,244.80 26.78
Mathewson,Anna 95,271.94 5,502.75 3,613.01
Matthews,Catherine G. 115,147.79 5,495.92 332.29
Mauro,Carli M. 71,530.65 3,657.45 1,385.20
Mauro,Joseph M 92,830.99 9,482.21 ‐
May,Glenn Kyle 74,844.21 2,082.09 7,188.18
Maynard,Lori 94,634.52 4,191.98 ‐
Mc Beth,Steve D. 68,228.69 19,277.74 ‐
Mc Carron,Darryl L 116,850.69 7,379.75 2,248.12
Mc Donald,Glenn E. 73,955.13 6,514.85 638.59
Mc Donald,Victor A 98,768.82 11,478.57 1,981.10
Mc Gee,Glen A. 116,985.15 5,392.59 ‐
Mc Harg,Gary D. 133,635.56 5,826.60 ‐
Mc Intosh,Dan J. 116,481.58 7,606.81 2,556.73
Mc Intyre,Geoff R. 96,428.84 12,522.65 100.50
Mc Intyre,Ryan L 96,873.40 9,665.24 910.71
Mc Kinlay,Scott A. 116,951.66 7,401.98 ‐
Mc Kinnon,Sheila 128,719.46 16,025.91 1,140.30
Mc Lachlan,Craig D. 95,095.03 10,237.14 389.00
Mc Laren,Todd D. 104,430.40 4,951.44 ‐
Mc Lean,Ian 98,171.98 9,340.84 1,991.60
Mc Nabb,Barry W. 99,282.89 11,159.04 1,074.71
Mc Namara,Michael W. 105,168.53 6,310.14 426.53
Mc Rae,Mark B. 98,446.65 6,969.40 38.92
Mc Robbie,Greg E 94,593.82 4,745.64 156.75
McDougall,Thomas Allan Angus 81,409.15 7,171.21 ‐
McDowell,Carleen 85,853.65 4,327.23 208.93
McGuire,Daniel B 92,660.86 2,971.56 ‐
McIntosh,Richard 87,275.93 2,388.57 3,027.00
McKay,William David 119,219.81 6,516.80 2,098.68
McLeod,Doug J 104,851.39 13,206.56 2,767.31
McMillan,Scott 82,605.36 5,166.94 1,720.71
80
EMPLOYEE
NAME
BASE SALARY
REMUNERATION
TAXABLE BENEFIT
& OTHER *
TOTAL
EXPENSES
CITY EMPLOYEES
CITY OF SURREYSTATEMENT OF FINANCIAL INFORMATION (SOFI)
FOR THE YEAR ENDED DECEMBER 31, 2016
SCHEDULE OF REMUNERATION AND EXPENSES
Medeiros,Victor 86,377.28 21,877.02 152.25
Melnyk,Jenel 80,183.42 2,819.56 1,406.10
Meneely,Jason A. 78,377.51 2,990.84 7.31
Meng,Qi 114,020.23 6,996.67 1,295.09
Merry,Douglas J 82,068.41 6,323.99 3,053.96
Michielin,Dino F. 93,157.71 9,511.36 109.99
Miklossy,Scott 114,486.96 4,898.77 ‐
Mikulski,Katarzyna 81,176.07 2,524.01 780.76
Miller,Cynthia M 89,718.78 4,713.45 37.33
Miller,Evan J. 115,343.33 6,442.72 991.08
Miller,Owen 85,339.15 5,655.23 ‐
Milling,Tyler W 73,345.52 2,830.53 21.30
Milloy,Jonathan D 80,367.11 1,959.74 7,483.53
Minaker,Gordon R. 116,071.95 7,719.67 10.50
Moore,Derrick 80,431.97 1,284.47 1,259.60
Moore,Raymond 81,190.65 9,499.12 4,064.59
Moquin,Jeffrey A. 74,460.43 16,599.36 ‐
Morgan,Aaron 85,339.14 5,667.30 7.00
Morris,Shelley C 99,164.46 9,623.34 150.00
Morrison,Angus E 93,221.52 7,090.40 426.83
Morrison,Gwen A. 80,076.67 1,264.33 ‐
Mossey,Douglas V 110,550.97 7,605.99 2,270.62
Moyen,Curtis L 95,263.94 6,472.48 389.00
Mueller,Peter M. 64,437.48 25,847.45 ‐
Mulldoon,Rosalinda J. 84,152.56 6,602.77 ‐
Muller,Keith J. 93,236.88 15,458.56 ‐
Murphy,Aileen M. 98,632.90 5,534.74 3,196.55
Murphy,John D. 99,401.00 10,702.09 708.00
Murphy,Robert D. 110,961.75 11,009.24 100.00
Murphy,Rory K. 116,721.12 7,350.28 ‐
Muzzin,Stephen P 94,612.00 2,618.66 19.10
Myette,Ken H 90,314.02 3,359.02 555.27
Myette,Robert P 73,905.84 1,352.93 157.50
Myring,Nicholas M. 92,830.99 6,173.16 ‐
Nagpal,Vinay 80,421.25 2,295.63 ‐
Narayan,Leslie A. 70,961.61 7,808.66 ‐
Narayan,Shiri 118,777.08 8,808.42 1,576.52
Nardi,Amanda J 77,677.50 6,648.80 1,611.26
Nawrocki,Linda R 71,015.06 6,298.70 2,532.80
Nazeman,Mehran R. 162,766.67 21,209.47 1,292.43
Neal,Marion H 66,752.69 9,892.01 220.02
81
EMPLOYEE
NAME
BASE SALARY
REMUNERATION
TAXABLE BENEFIT
& OTHER *
TOTAL
EXPENSES
CITY EMPLOYEES
CITY OF SURREYSTATEMENT OF FINANCIAL INFORMATION (SOFI)
FOR THE YEAR ENDED DECEMBER 31, 2016
SCHEDULE OF REMUNERATION AND EXPENSES
Neary,Brian Richard 80,422.56 2,435.71 3,360.18
Neilson,Layna 75,580.87 801.29 807.40
Nelson Smith,Matthew B 76,219.34 6,131.08 ‐
Nesci,Cory 77,540.28 1,865.19 666.40
Ness,Byron S. 116,071.96 7,398.40 100.00
Netherton,Scott E. 111,388.89 7,741.56 852.02
Neufeld,Adrian 93,305.57 9,106.31 ‐
Neufeld,Tim C 116,579.49 24,204.40 2,081.84
Neuman,Scott 160,041.39 16,029.30 725.48
Neustaedter,Charles H 116,553.42 14,001.70 832.48
Ng,Jeffrey C. 94,839.15 21,663.55 10,258.69
Nielsen,Dan K. 111,505.24 21,007.33 2,479.62
Nielsen,Mark F. 104,759.87 11,566.10 1,420.30
Nijjar,Harnek 90,112.03 2,862.53 6,140.20
Nip,Donald Dat Ming 93,541.35 1,886.46 560.92
Nolan,Andrew 67,779.58 10,335.97 937.30
Norris,Hugh F. 116,559.58 22,683.55 1,526.66
Nylander,James 95,538.42 4,741.98 415.35
Oakley,Tina Louise 80,111.61 3,084.02 152.25
O'Brien,Keldon S. 110,693.13 10,647.26 ‐
Oliver,Jeff A. 98,128.29 5,120.18 ‐
Oliver‐Trygg,Steve W. 115,889.08 8,007.51 130.00
Olivier,Nathan 95,861.49 4,947.80 150.00
Olsen,Richard D. 105,225.32 3,693.76 150.00
Olson,George A. 116,529.18 5,159.78 ‐
ONeill,Eoin 80,424.17 1,559.85 1,099.40
Oppelt,Richard D. 116,473.59 10,872.59 ‐
Orcutt,Brenda L. 86,767.82 5,020.33 929.66
Ordeman,Arjen A 117,412.81 7,618.39 3,013.39
Orsetti,David F. 74,183.00 18,252.49 1,543.98
Osler,Matthew F 102,568.49 5,503.87 2,854.17
Overland,Graham A 92,830.99 9,752.16 426.83
Owen,Jason 111,752.26 7,179.44 5,828.21
Padilla,Sarah 84,013.30 3,394.17 306.67
Pandher,Karandeep S. 95,925.98 5,243.66 2,606.88
Pang,Jeffrey 87,894.59 8,281.94 232.05
Pape,Matthew N 81,227.65 7,731.77 ‐
Pargee,Robert 93,325.03 7,938.12 88.50
Parkinson,Sarah F 65,082.47 12,501.95 ‐
Parry,Ryan W 115,223.83 13,806.65 36.66
Pasqua,Richard M. 104,843.94 10,433.56 ‐
82
EMPLOYEE
NAME
BASE SALARY
REMUNERATION
TAXABLE BENEFIT
& OTHER *
TOTAL
EXPENSES
CITY EMPLOYEES
CITY OF SURREYSTATEMENT OF FINANCIAL INFORMATION (SOFI)
FOR THE YEAR ENDED DECEMBER 31, 2016
SCHEDULE OF REMUNERATION AND EXPENSES
Patrick,David 92,320.55 11,012.56 426.77
Paulrajan,Stanley P. 116,448.07 8,195.33 10,523.60
Peake,Scott S. 115,556.75 5,423.42 2,086.77
Pearson,Ryan M. 73,731.82 2,352.00 188.25
Pegios,Spiro 117,835.64 9,439.52 100.00
Pencer,Glenn C. 117,513.23 11,656.36 ‐
Percival,Peter H 93,362.95 8,495.37 ‐
Pereira,Les P 95,786.78 5,797.52 255.67
Perka,Daniel 92,156.40 11,043.86 100.00
Perkins,Tyler Shane 77,864.78 5,267.82 5,677.50
Pervan,Ward A 99,139.81 12,988.89 1,652.21
Peters,David 80,425.80 2,480.86 6,855.33
Peters,Raelyn S. 123,081.03 15,227.57 3,241.51
Peters,Shawna 69,949.26 5,649.93 ‐
Petersen,Lauren 72,474.13 3,378.01 1,629.68
Petretta,May 75,250.58 6,826.07 1,973.33
Petrovic,Mirjana 89,770.51 4,229.22 1,787.83
Petrovic,Sinisa 100,979.82 7,464.28 798.00
Picard,Chi Ying 72,698.61 6,742.12 603.75
Pinchin,Jay D. 104,962.55 4,415.52 ‐
Pitcairn,Lee‐Anne 98,611.80 5,563.75 68.82
Pladson,Gord C 77,001.68 5,210.17 2,765.67
Planzer,Eric 77,659.09 4,412.67 20.00
Poettcker,Alan M. 95,053.87 11,610.65 ‐
Pokorny,Harold J 80,153.32 13,359.33 ‐
Pollock,Eric 93,152.83 8,166.53 501.83
Pollock,Michael E. 116,258.75 10,104.22 100.00
Poon,Kenneth M 86,177.40 3,108.84 1,053.62
Possey,Chad 95,672.51 4,459.23 255.67
Price,Christopher C. 95,183.70 9,965.33 322.33
Price,Ivan C 100,914.53 15,293.96 ‐
Pruden,Nicole Ashleigh 93,114.91 9,957.80 426.83
Pyne,Matthew A. 73,362.47 4,228.32 583.75
Radovich,Joseph I. 105,274.71 23,126.76 ‐
Rai,Ranjeev Randy 76,749.01 2,393.13 36.90
Ramsay,David D. 98,949.68 6,335.88 28.00
Rankin,Donald I 101,176.58 9,642.04 128.00
Rawcliffe,Nicholas N. 164,329.39 14,734.83 1,149.77
Rayek,Deborah 77,730.07 2,052.81 424.22
Rayter,Kelly E. 150,599.71 6,467.87 3,460.39
Reddy,Rajesh K. 80,488.52 7,985.90 2,314.38
83

EMPLOYEE
NAME
BASE SALARY
REMUNERATION
TAXABLE BENEFIT
& OTHER *
TOTAL
EXPENSES
CITY EMPLOYEES
CITY OF SURREYSTATEMENT OF FINANCIAL INFORMATION (SOFI)
FOR THE YEAR ENDED DECEMBER 31, 2016
SCHEDULE OF REMUNERATION AND EXPENSES
Redmond,John J. 98,253.24 8,087.95 ‐
Rehal,Jaspreet 138,112.29 11,099.19 5,692.75
Reimer,Brian 93,083.14 5,471.32 ‐
Relitz,Trevor K. 73,848.52 3,467.33 140.00
Rennie,Stacey A. 117,997.95 8,820.92 8,332.91
Reny,Robert D 81,121.82 3,951.26 5,265.71
Restrepo,Juan J. 73,979.15 4,479.70 105.00
Resurreccion,Ryan R 75,755.58 7,240.08 ‐
Reynolds,Guy Q.j. 74,383.97 5,078.26 656.25
Rezazadah,Akhshid Ali 80,441.06 4,734.53 448.46
Rezazadeh,Forouzan 99,924.20 2,328.84 1,291.49
Richards,Brad William 70,401.63 4,835.63 ‐
Riley,Chris G. 74,389.53 4,658.71 188.97
Rimek,Brad W. 101,442.59 16,932.20 150.00
Rines,William A. 116,773.98 3,713.13 ‐
Ristau,Kevin W. 104,325.82 12,652.81 28.00
Ritchie,Ronald M. 116,509.85 6,897.77 ‐
Roberts,Stephen C 73,827.66 4,605.99 416.60
Roberts,Tara M 77,071.19 733.93 3,312.90
Robertson,Judith I. 160,086.27 12,778.48 3,135.37
Robertson,Ken 95,832.99 5,562.93 322.34
Robinson,Lorne F. 87,112.71 16,000.77 1,307.25
Robinson,Pierre B. 100,365.95 11,582.55 313.41
Robinson,Steve E. 130,231.01 43,073.37 12,393.15
Roeck,Aaron Matthew 81,635.98 8,020.82 10.50
Rondeau,Mary Beth S. 108,530.68 11,466.64 1,017.45
Rothwell,Michael L. 116,448.09 5,680.12 13.85
Rudzki,Remi 92,915.04 9,307.53 ‐
Ruediger,Isabel 116,509.90 12,087.78 617.50
Ruitenbeck,Gregory 92,025.49 2,232.77 1,420.35
Rukavina,Mary 116,448.13 5,268.35 1,905.25
Ryan,Richard M. 116,486.53 20,838.77 2,915.97
Rychly,Carey 75,156.64 4,745.21 ‐
Sachdeva,Vipin 112,454.65 5,306.74 1,369.65
Sadafi,Asma 114,020.21 6,403.86 798.00
Sadler,David R 70,977.36 4,300.35 4,992.46
Sadowski,Jordan Tyler 85,760.07 8,321.15 158.10
Saffery,Lynn A. 87,012.54 5,437.75 2,471.78
Sagastizado,Juan F 74,366.09 2,409.65 243.96
Sahota,Parwinder K. 76,975.37 2,981.53 1,241.75
Salisbury,Derek M. 97,616.13 5,623.54 ‐
84
EMPLOYEE
NAME
BASE SALARY
REMUNERATION
TAXABLE BENEFIT
& OTHER *
TOTAL
EXPENSES
CITY EMPLOYEES
CITY OF SURREYSTATEMENT OF FINANCIAL INFORMATION (SOFI)
FOR THE YEAR ENDED DECEMBER 31, 2016
SCHEDULE OF REMUNERATION AND EXPENSES
Sampietro,Terry P. 100,769.67 9,913.12 733.15
Samson,Geoff P. 154,405.05 8,550.94 59.45
Sander,Tim W 80,149.83 2,920.36 5,742.03
Sanderson,Daryl R. 116,803.53 7,759.22 65.00
Sandu,Rabinder S. 121,765.67 17,368.29 102.47
Sangha,Amrjit S. 95,616.56 10,966.17 100.00
Sanghera,Harinder K 88,340.56 5,119.92 1,823.75
Sarai,Scott 92,904.79 9,744.76 ‐
Savage,Reginald H. 92,522.48 7,289.10 219.99
Saxton,Lauralene 71,270.14 12,425.45 ‐
Sayson,Justin R 92,830.99 8,706.79 10.50
Schaafsma,Jeffrey L. 111,314.96 14,962.41 2,172.91
Schenk,Amanda 76,994.35 3,242.14 816.53
Schiebler,Katherine 84,020.80 6,201.50 ‐
Schierling,Todd D. 102,669.19 6,371.39 ‐
Schmidt,Michael K. 94,779.36 4,804.62 98.00
Schmitz,William F. 95,774.92 10,017.45 ‐
Schmor,Carl V. 108,589.86 8,581.82 ‐
Schnare,Philippe A. 116,592.33 10,662.24 10.50
Scholes,Samuel Douglas Delaney 69,825.65 5,527.34 ‐
Schulz,Alanna J 81,540.22 10,958.33 1,476.87
Schulz,Mark S 73,253.00 9,022.04 18.08
Schulze,Kevin M. 100,661.47 6,784.50 ‐
Schwartz,Andy A 97,377.54 6,760.11 1,074.71
Scott,Eric D. 114,975.88 5,217.86 ‐
Scott,Guthrie Blair 69,938.28 6,945.76 ‐
Scott,Lindsay D 81,971.62 2,404.17 ‐
Scovill,Dean M 75,026.65 3,119.85 156.24
Seco,Paul Rio 77,145.74 7,988.21 18.08
Seehra,Gurbaksh K. 80,421.25 2,372.99 480.50
Sekhon,Hartej S 82,710.88 3,755.26 476.58
Serediuk,James M. 81,161.72 6,603.05 1,568.33
Seter,Mark H. 108,025.31 11,365.90 ‐
Shah,Javed Ali 73,986.35 3,924.35 ‐
Shah,Nipesh D 74,328.40 3,693.24 792.73
Shangari,Kishore K. 63,194.99 16,941.77 792.75
Sharp,Keith Gordon 130,052.43 31,799.76 1,698.23
Shauer,Jennie‐Lee R 96,274.83 5,157.68 ‐
Shcherbyna,Olga 73,158.01 7,766.92 2,603.03
Sheel,Daniel D. 115,223.38 10,879.12 63.44
Sheeley,Patrick J 95,443.42 6,981.28 ‐
85

EMPLOYEE
NAME
BASE SALARY
REMUNERATION
TAXABLE BENEFIT
& OTHER *
TOTAL
EXPENSES
CITY EMPLOYEES
CITY OF SURREYSTATEMENT OF FINANCIAL INFORMATION (SOFI)
FOR THE YEAR ENDED DECEMBER 31, 2016
SCHEDULE OF REMUNERATION AND EXPENSES
Sheriff,David C 85,315.47 8,073.22 ‐
Sherwood,J Evan 77,320.13 1,962.54 13.85
Shield,Jonathan W. 94,627.20 3,937.68 32.74
Sidhu,Jagdeep Richie 79,106.99 5,297.22 ‐
Siemens,Jonathan M 92,530.67 10,301.85 174.99
Siggs,Jerry L. 96,298.58 11,757.88 ‐
Silvestre,Jorge M 89,595.56 7,548.42 3,193.33
Simoes,Fernando M. 113,224.90 5,247.70 23.35
Simonsen,Kirk K 95,480.37 6,563.18 ‐
Simpson,Joshua R 94,076.68 5,460.18 1,283.80
Simpson,Martin 93,275.76 6,056.90 ‐
Simpson,Sean T. 155,013.63 20,002.98 5,443.33
Singh,Andrew W. 75,482.64 10,247.23 6.87
Singh,Gian 101,768.11 10,066.41 5,837.85
Sirk,Albert A 74,264.43 2,951.71 ‐
Siudut,George E. 140,435.14 13,990.69 103.31
Siudut,Rodney G 77,484.83 7,253.94 157.50
Skowronski,Michael 73,979.75 3,860.31 61.05
Skyers,Maria CL 69,811.14 5,498.02 535.50
Skytte,Steven A. 117,321.32 13,997.08 75.00
Slamang,Hassem 116,839.63 3,454.42 10.50
Sloan,Richard G. 106,334.00 12,612.81 10.50
Sloan,Stephen G 93,305.57 7,029.31 426.83
Smeenk,Andrea L 93,024.68 2,506.47 1,002.75
Smid,Yme 72,407.25 6,730.35 ‐
Smith,Donald V. 75,108.76 9,798.76 ‐
Smith,Fraser John 234,263.05 36,128.68 16,414.62
Smith,Murray G. 114,902.45 5,475.47 ‐
Smith,Roger 87,270.18 5,290.48 ‐
Smith,Ryan G. 101,061.65 6,944.35 90.50
Snelling,Anthony I. 73,910.61 2,590.84 256.50
Snider,Gregory M 94,625.09 3,241.16 5,667.24
Snyder,Colin B. 105,527.74 7,682.93 ‐
Solomon,Scott T. 99,504.35 13,221.50 ‐
Somerville,Janelle S 76,162.31 2,549.82 3,028.79
Sorenson,Kris J. 76,844.97 3,670.58 4,783.78
Spraggs,Taylor B J 73,720.94 3,888.58 1,714.17
St Cyr,Maureen L. 150,653.99 10,201.89 7,481.47
Stack,Falina D 92,573.31 4,141.01 849.97
Standfield,Shira B 89,811.16 2,691.78 4,856.27
Stapleton,Jesse 69,800.43 6,851.67 ‐
86

EMPLOYEE
NAME
BASE SALARY
REMUNERATION
TAXABLE BENEFIT
& OTHER *
TOTAL
EXPENSES
CITY EMPLOYEES
CITY OF SURREYSTATEMENT OF FINANCIAL INFORMATION (SOFI)
FOR THE YEAR ENDED DECEMBER 31, 2016
SCHEDULE OF REMUNERATION AND EXPENSES
Steele,Paul S. 94,872.41 30,481.85 783.68
Steenge,Dirk A 73,416.00 2,188.41 430.50
Stevens,Christopher 93,362.95 6,125.98 426.83
Stevens,Mark A 79,815.96 2,746.93 6,640.24
Stewart,Carla A 98,675.10 6,914.55 2,400.31
Stewart,Christopher L 93,095.45 7,510.89 ‐
Stickley,Susan A. 78,841.46 9,456.79 340.00
Stiebel,Thomas A. 118,297.21 11,874.96 85.00
Strating,Jeff 74,368.21 2,630.96 1,517.06
Stretch,Bryan P 95,909.01 9,030.95 389.00
Sukenick,Freedom S. 90,369.10 4,769.95 ‐
Sullivan,Jane L 138,427.09 6,665.97 612.84
Sutherland,Derek V 93,734.18 5,460.19 ‐
Swanson,Kelsey 115,599.64 13,911.16 4,403.97
Symons,Charleen M. 80,142.06 3,773.53 194.00
Szostak,Chris S. 97,958.30 13,096.29 472.33
Tagliafierro,Domenic T 73,914.58 3,071.87 ‐
Taha,Ehab 73,806.42 6,257.38 3,932.60
Takhar,Rosy K 116,448.13 5,004.26 792.06
Tallarico,Caroline G 70,278.59 8,168.94 350.21
Tanggara,Anita 102,030.51 3,039.35 1,910.67
Taylor,Christopher J. 93,443.86 9,455.07 120.00
Teeple,Michael N. 74,421.20 6,152.66 ‐
Temperton,Ross G 75,828.70 4,497.96 85.00
Terzariol,Lory 90,285.78 4,601.17 1,378.41
Tetrault,Bruce E. 107,063.08 7,261.11 588.00
Tewson,Robert E. 116,543.96 11,895.21 126.00
Thibaudeau,Jerome P 97,727.08 12,999.47 327.53
Thiessen,Scott J 81,514.53 7,432.81 ‐
Thind,Bobby S 80,423.67 824.34 15.53
Thody,Derek R 69,938.28 5,659.38 ‐
Thomas,Larry S. 154,730.05 28,427.98 3,322.15
Thompson,Lance 73,127.99 2,706.44 578.67
Tiede,Kristen L 102,086.30 5,885.62 3,210.34
Tojcic,Angela D 66,712.59 9,866.14 1,578.82
Tooke,Thoreau Benjamin Rowe 83,215.66 3,310.91 1,104.82
Tosdevine‐Tataryn,Sahra‐Lea 76,262.88 6,812.71 129.35
Townsend,Charles A. 116,615.81 10,211.09 193.00
Toxopeus,Brian 81,325.10 7,551.77 10.50
Traa,John J 94,534.42 6,041.42 ‐
Trainor,Michael 75,846.51 9,731.60 ‐
87

EMPLOYEE
NAME
BASE SALARY
REMUNERATION
TAXABLE BENEFIT
& OTHER *
TOTAL
EXPENSES
CITY EMPLOYEES
CITY OF SURREYSTATEMENT OF FINANCIAL INFORMATION (SOFI)
FOR THE YEAR ENDED DECEMBER 31, 2016
SCHEDULE OF REMUNERATION AND EXPENSES
Trill,Dallas J. 115,208.41 5,339.43 17.24
Trotman,Robert S. 80,127.38 2,937.31 7,243.36
Trottier,Judith 86,860.49 2,023.71 1,242.51
Tulud,Nele B 73,911.67 2,694.18 ‐
Tyakoff,Alexander 108,085.32 10,861.79 861.25
Tyler,James F. 116,550.02 18,938.21 657.53
Uhrich,Edward L. 116,448.13 3,248.33 2,389.08
Underhill,Candy L 75,506.80 3,246.88 7.85
Unsworth,James D 99,973.67 7,421.51 ‐
Upshon,Simon B. 99,600.00 21,323.15 2,496.52
Uy,Manuel 76,970.81 3,556.68 1,154.85
Vadik,David J. 99,010.52 8,933.09 116.00
Vallis,James B 98,792.14 3,781.01 190.00
Van Dijk,Victor H 95,212.21 5,105.38 440.21
Van Dongen,George C. 60,161.19 16,965.48 222.95
Van Houten,Alanna M. 88,764.19 8,244.56 37.33
Van Rooyen,Dylan 93,030.86 7,500.57 10.50
Varaitch,Terri K. 71,859.02 8,736.68 ‐
Varner,James W. 73,364.86 3,492.44 1,196.18
Vaughan,K David 116,956.86 3,874.18 ‐
Vaughan,Lyle D. 117,321.31 8,399.59 303.79
Velin,Chris E 89,590.52 8,108.37 1,796.03
Veras Pena,Ramon Alfredo 73,205.21 2,580.29 ‐
Vestergaard,Dorothy C 72,855.95 2,332.65 686.25
Vincent,Michael J 93,389.61 8,727.80 ‐
Virk,Arminder Singh 91,716.30 7,608.69 ‐
Wade,Lisa 71,033.61 7,858.81 570.35
Wadhwa,Harsukhdip S. 72,451.79 3,644.67 157.50
Walker,Benjamin 93,278.92 6,392.38 437.33
Wallace,Michael B. 105,804.57 5,158.21 119.90
Walters,Corey D 116,745.56 7,607.55 ‐
Walters,Troy 93,878.21 7,198.84 ‐
Wang,Timothy X. 111,162.17 10,606.53 1,298.87
Ward,Samantha 106,121.94 5,070.31 2,591.54
Warren,Kenneth C 73,076.75 3,070.05 140.00
Warren,Tracy 98,972.60 6,934.38 2,009.97
Waskito,Joseph 73,976.60 3,266.37 ‐
Waterhouse,Terry 176,564.62 9,908.29 16,252.28
Watt,Jason Allan 133,827.94 5,333.00 1,244.19
Watts,Nicholas J. 112,683.30 16,871.21 104.42
Watts,Trevor M. 117,321.31 10,410.17 28.00
88
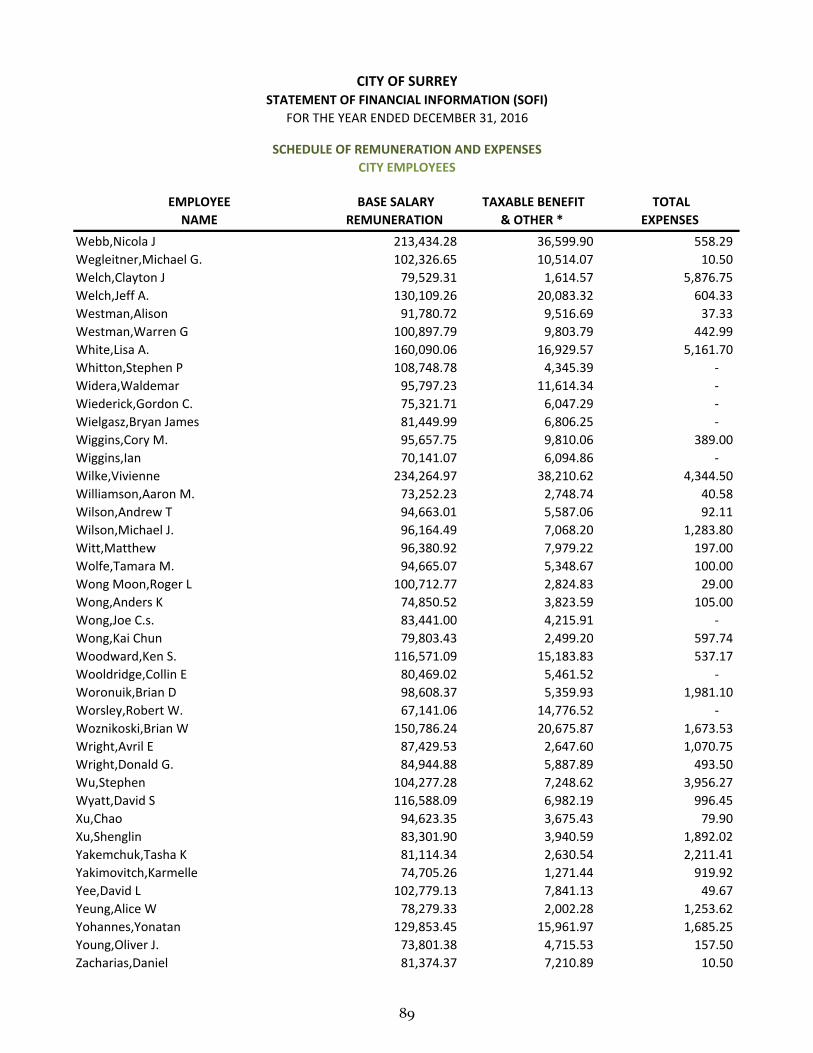
EMPLOYEE
NAME
BASE SALARY
REMUNERATION
TAXABLE BENEFIT
& OTHER *
TOTAL
EXPENSES
CITY EMPLOYEES
CITY OF SURREYSTATEMENT OF FINANCIAL INFORMATION (SOFI)
FOR THE YEAR ENDED DECEMBER 31, 2016
SCHEDULE OF REMUNERATION AND EXPENSES
Webb,Nicola J 213,434.28 36,599.90 558.29
Wegleitner,Michael G. 102,326.65 10,514.07 10.50
Welch,Clayton J 79,529.31 1,614.57 5,876.75
Welch,Jeff A. 130,109.26 20,083.32 604.33
Westman,Alison 91,780.72 9,516.69 37.33
Westman,Warren G 100,897.79 9,803.79 442.99
White,Lisa A. 160,090.06 16,929.57 5,161.70
Whitton,Stephen P 108,748.78 4,345.39 ‐
Widera,Waldemar 95,797.23 11,614.34 ‐
Wiederick,Gordon C. 75,321.71 6,047.29 ‐
Wielgasz,Bryan James 81,449.99 6,806.25 ‐
Wiggins,Cory M. 95,657.75 9,810.06 389.00
Wiggins,Ian 70,141.07 6,094.86 ‐
Wilke,Vivienne 234,264.97 38,210.62 4,344.50
Williamson,Aaron M. 73,252.23 2,748.74 40.58
Wilson,Andrew T 94,663.01 5,587.06 92.11
Wilson,Michael J. 96,164.49 7,068.20 1,283.80
Witt,Matthew 96,380.92 7,979.22 197.00
Wolfe,Tamara M. 94,665.07 5,348.67 100.00
Wong Moon,Roger L 100,712.77 2,824.83 29.00
Wong,Anders K 74,850.52 3,823.59 105.00
Wong,Joe C.s. 83,441.00 4,215.91 ‐
Wong,Kai Chun 79,803.43 2,499.20 597.74
Woodward,Ken S. 116,571.09 15,183.83 537.17
Wooldridge,Collin E 80,469.02 5,461.52 ‐
Woronuik,Brian D 98,608.37 5,359.93 1,981.10
Worsley,Robert W. 67,141.06 14,776.52 ‐
Woznikoski,Brian W 150,786.24 20,675.87 1,673.53
Wright,Avril E 87,429.53 2,647.60 1,070.75
Wright,Donald G. 84,944.88 5,887.89 493.50
Wu,Stephen 104,277.28 7,248.62 3,956.27
Wyatt,David S 116,588.09 6,982.19 996.45
Xu,Chao 94,623.35 3,675.43 79.90
Xu,Shenglin 83,301.90 3,940.59 1,892.02
Yakemchuk,Tasha K 81,114.34 2,630.54 2,211.41
Yakimovitch,Karmelle 74,705.26 1,271.44 919.92
Yee,David L 102,779.13 7,841.13 49.67
Yeung,Alice W 78,279.33 2,002.28 1,253.62
Yohannes,Yonatan 129,853.45 15,961.97 1,685.25
Young,Oliver J. 73,801.38 4,715.53 157.50
Zacharias,Daniel 81,374.37 7,210.89 10.50
89
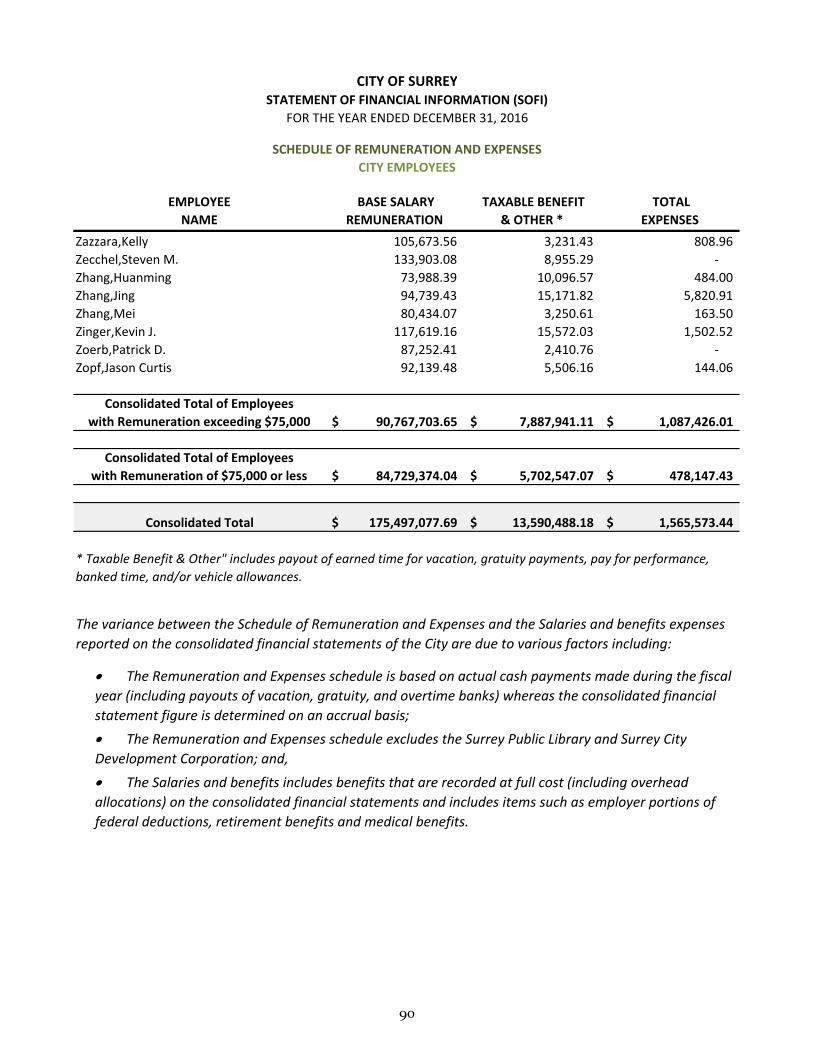
EMPLOYEE
NAME
BASE SALARY
REMUNERATION
TAXABLE BENEFIT
& OTHER *
TOTAL
EXPENSES
CITY EMPLOYEES
CITY OF SURREYSTATEMENT OF FINANCIAL INFORMATION (SOFI)
FOR THE YEAR ENDED DECEMBER 31, 2016
SCHEDULE OF REMUNERATION AND EXPENSES
Zazzara,Kelly 105,673.56 3,231.43 808.96
Zecchel,Steven M. 133,903.08 8,955.29 ‐
Zhang,Huanming 73,988.39 10,096.57 484.00
Zhang,Jing 94,739.43 15,171.82 5,820.91
Zhang,Mei 80,434.07 3,250.61 163.50
Zinger,Kevin J. 117,619.16 15,572.03 1,502.52
Zoerb,Patrick D. 87,252.41 2,410.76 ‐
Zopf,Jason Curtis 92,139.48 5,506.16 144.06
Consolidated Total of Employees
with Remuneration exceeding $75,000 90,767,703.65$ 7,887,941.11$ 1,087,426.01$
Consolidated Total of Employees
with Remuneration of $75,000 or less 84,729,374.04$ 5,702,547.07$ 478,147.43$
Consolidated Total 175,497,077.69$ 13,590,488.18$ 1,565,573.44$
* Taxable Benefit & Other" includes payout of earned time for vacation, gratuity payments, pay for performance,
banked time, and/or vehicle allowances.
The variance between the Schedule of Remuneration and Expenses and the Salaries and benefits expenses
reported on the consolidated financial statements of the City are due to various factors including:
The Remuneration and Expenses schedule is based on actual cash payments made during the fiscal
year (including payouts of vacation, gratuity, and overtime banks) whereas the consolidated financial
statement figure is determined on an accrual basis;
The Remuneration and Expenses schedule excludes the Surrey Public Library and Surrey City
Development Corporation; and,
The Salaries and benefits includes benefits that are recorded at full cost (including overhead
allocations) on the consolidated financial statements and includes items such as employer portions of
federal deductions, retirement benefits and medical benefits.
90
City of Surrey Statement of Financial Information (SOFI) Statement of Severance Agreements Section 7
2016 Statement of Financial Information
During the fiscal year ending December 31, 2016, the City of Surrey entered into 3 severance agreements ranging from 1.4 months to 3 months in duration. Prepared under the Financial Information Regulation, Schedule 1, subsection 6(7)
91
City of Surrey Statement of Financial Information (SOFI) Schedule of Suppliers of Goods or Services Section 8
2016 Statement of Financial Information
Regulations require the City of Surrey to report the total amount paid to each supplier for goods and services that exceeds $25,000 in the year reported. Prepared under the Financial Information Regulation, Schedule 1, subsection 7(1)
92
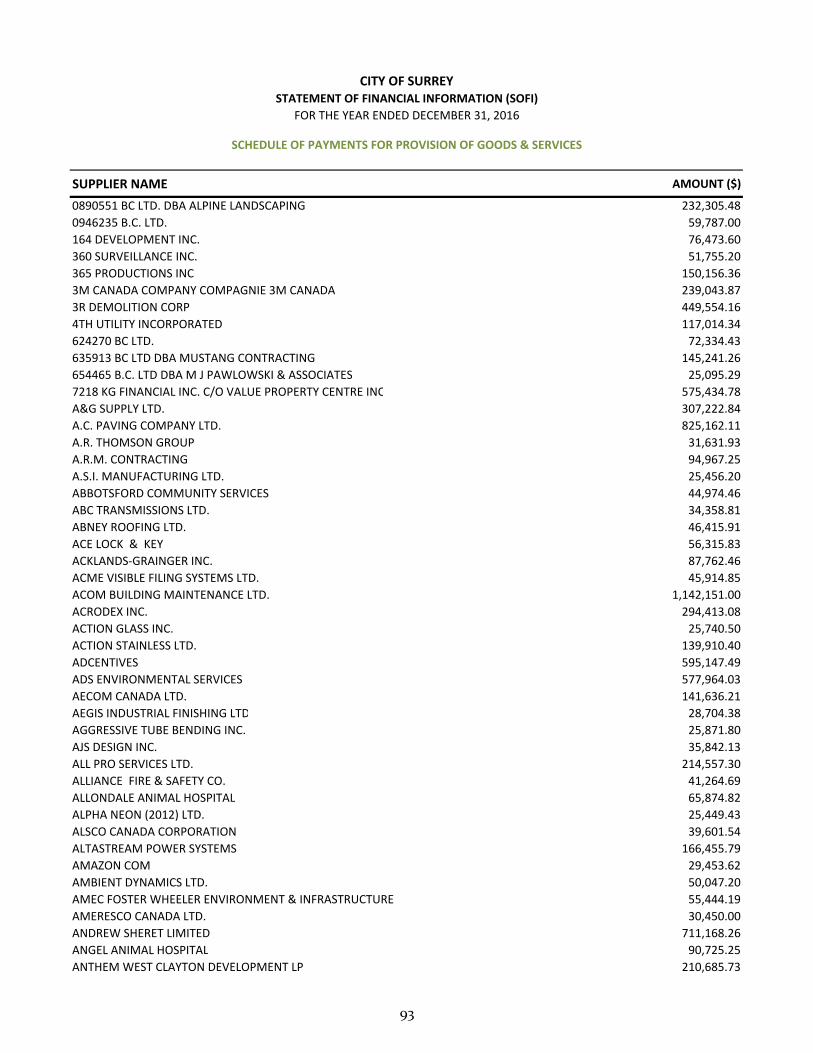
SUPPLIER NAME AMOUNT ($)
0890551 BC LTD. DBA ALPINE LANDSCAPING 232,305.48
0946235 B.C. LTD. 59,787.00
164 DEVELOPMENT INC. 76,473.60
360 SURVEILLANCE INC. 51,755.20
365 PRODUCTIONS INC 150,156.36
3M CANADA COMPANY COMPAGNIE 3M CANADA 239,043.87
3R DEMOLITION CORP 449,554.16
4TH UTILITY INCORPORATED 117,014.34
624270 BC LTD. 72,334.43
635913 BC LTD DBA MUSTANG CONTRACTING 145,241.26
654465 B.C. LTD DBA M J PAWLOWSKI & ASSOCIATES 25,095.29
7218 KG FINANCIAL INC. C/O VALUE PROPERTY CENTRE INC 575,434.78
A&G SUPPLY LTD. 307,222.84
A.C. PAVING COMPANY LTD. 825,162.11
A.R. THOMSON GROUP 31,631.93
A.R.M. CONTRACTING 94,967.25
A.S.I. MANUFACTURING LTD. 25,456.20
ABBOTSFORD COMMUNITY SERVICES 44,974.46
ABC TRANSMISSIONS LTD. 34,358.81
ABNEY ROOFING LTD. 46,415.91
ACE LOCK & KEY 56,315.83
ACKLANDS‐GRAINGER INC. 87,762.46
ACME VISIBLE FILING SYSTEMS LTD. 45,914.85
ACOM BUILDING MAINTENANCE LTD. 1,142,151.00
ACRODEX INC. 294,413.08
ACTION GLASS INC. 25,740.50
ACTION STAINLESS LTD. 139,910.40
ADCENTIVES 595,147.49
ADS ENVIRONMENTAL SERVICES 577,964.03
AECOM CANADA LTD. 141,636.21
AEGIS INDUSTRIAL FINISHING LTD 28,704.38
AGGRESSIVE TUBE BENDING INC. 25,871.80
AJS DESIGN INC. 35,842.13
ALL PRO SERVICES LTD. 214,557.30
ALLIANCE FIRE & SAFETY CO. 41,264.69
ALLONDALE ANIMAL HOSPITAL 65,874.82
ALPHA NEON (2012) LTD. 25,449.43
ALSCO CANADA CORPORATION 39,601.54
ALTASTREAM POWER SYSTEMS 166,455.79
AMAZON COM 29,453.62
AMBIENT DYNAMICS LTD. 50,047.20
AMEC FOSTER WHEELER ENVIRONMENT & INFRASTRUCTURE 55,444.19
AMERESCO CANADA LTD. 30,450.00
ANDREW SHERET LIMITED 711,168.26
ANGEL ANIMAL HOSPITAL 90,725.25
ANTHEM WEST CLAYTON DEVELOPMENT LP 210,685.73
CITY OF SURREYSTATEMENT OF FINANCIAL INFORMATION (SOFI)
FOR THE YEAR ENDED DECEMBER 31, 2016
SCHEDULE OF PAYMENTS FOR PROVISION OF GOODS & SERVICES
93
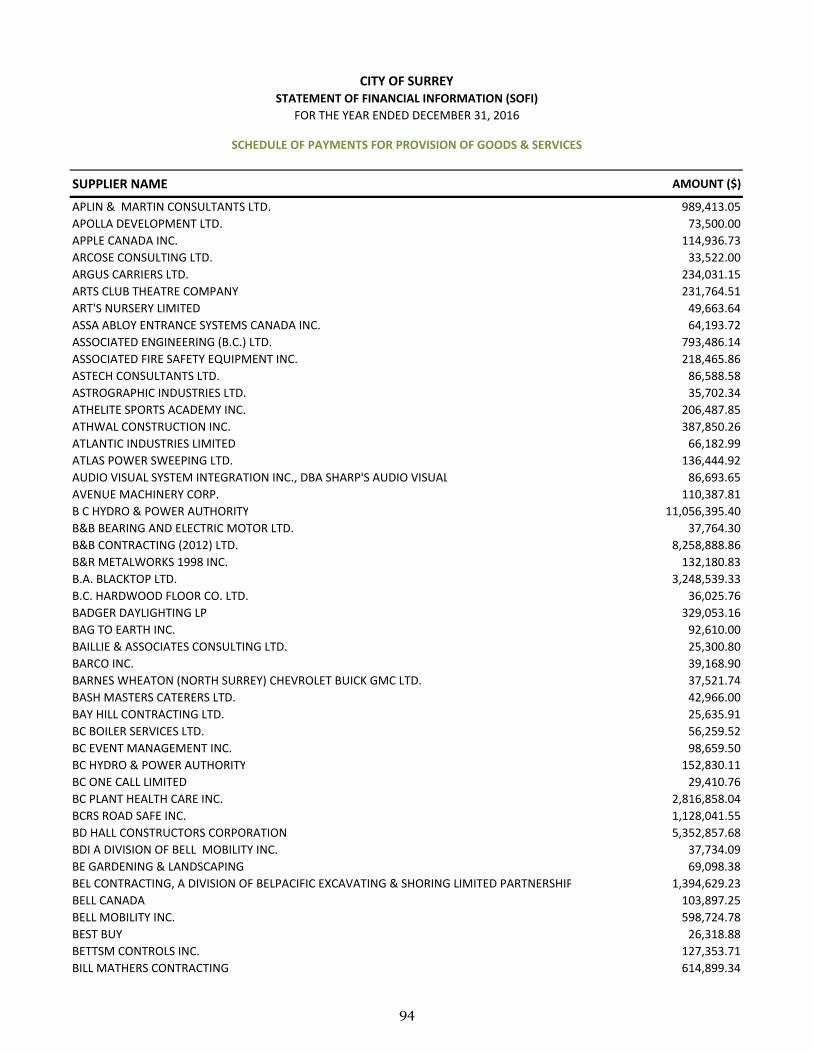
SUPPLIER NAME AMOUNT ($)
CITY OF SURREYSTATEMENT OF FINANCIAL INFORMATION (SOFI)
FOR THE YEAR ENDED DECEMBER 31, 2016
SCHEDULE OF PAYMENTS FOR PROVISION OF GOODS & SERVICES
APLIN & MARTIN CONSULTANTS LTD. 989,413.05
APOLLA DEVELOPMENT LTD. 73,500.00
APPLE CANADA INC. 114,936.73
ARCOSE CONSULTING LTD. 33,522.00
ARGUS CARRIERS LTD. 234,031.15
ARTS CLUB THEATRE COMPANY 231,764.51
ART'S NURSERY LIMITED 49,663.64
ASSA ABLOY ENTRANCE SYSTEMS CANADA INC. 64,193.72
ASSOCIATED ENGINEERING (B.C.) LTD. 793,486.14
ASSOCIATED FIRE SAFETY EQUIPMENT INC. 218,465.86
ASTECH CONSULTANTS LTD. 86,588.58
ASTROGRAPHIC INDUSTRIES LTD. 35,702.34
ATHELITE SPORTS ACADEMY INC. 206,487.85
ATHWAL CONSTRUCTION INC. 387,850.26
ATLANTIC INDUSTRIES LIMITED 66,182.99
ATLAS POWER SWEEPING LTD. 136,444.92
AUDIO VISUAL SYSTEM INTEGRATION INC., DBA SHARP'S AUDIO VISUAL 86,693.65
AVENUE MACHINERY CORP. 110,387.81
B C HYDRO & POWER AUTHORITY 11,056,395.40
B&B BEARING AND ELECTRIC MOTOR LTD. 37,764.30
B&B CONTRACTING (2012) LTD. 8,258,888.86
B&R METALWORKS 1998 INC. 132,180.83
B.A. BLACKTOP LTD. 3,248,539.33
B.C. HARDWOOD FLOOR CO. LTD. 36,025.76
BADGER DAYLIGHTING LP 329,053.16
BAG TO EARTH INC. 92,610.00
BAILLIE & ASSOCIATES CONSULTING LTD. 25,300.80
BARCO INC. 39,168.90
BARNES WHEATON (NORTH SURREY) CHEVROLET BUICK GMC LTD. 37,521.74
BASH MASTERS CATERERS LTD. 42,966.00
BAY HILL CONTRACTING LTD. 25,635.91
BC BOILER SERVICES LTD. 56,259.52
BC EVENT MANAGEMENT INC. 98,659.50
BC HYDRO & POWER AUTHORITY 152,830.11
BC ONE CALL LIMITED 29,410.76
BC PLANT HEALTH CARE INC. 2,816,858.04
BCRS ROAD SAFE INC. 1,128,041.55
BD HALL CONSTRUCTORS CORPORATION 5,352,857.68
BDI A DIVISION OF BELL MOBILITY INC. 37,734.09
BE GARDENING & LANDSCAPING 69,098.38
BEL CONTRACTING, A DIVISION OF BELPACIFIC EXCAVATING & SHORING LIMITED PARTNERSHIP 1,394,629.23
BELL CANADA 103,897.25
BELL MOBILITY INC. 598,724.78
BEST BUY 26,318.88
BETTSM CONTROLS INC. 127,353.71
BILL MATHERS CONTRACTING 614,899.34
94
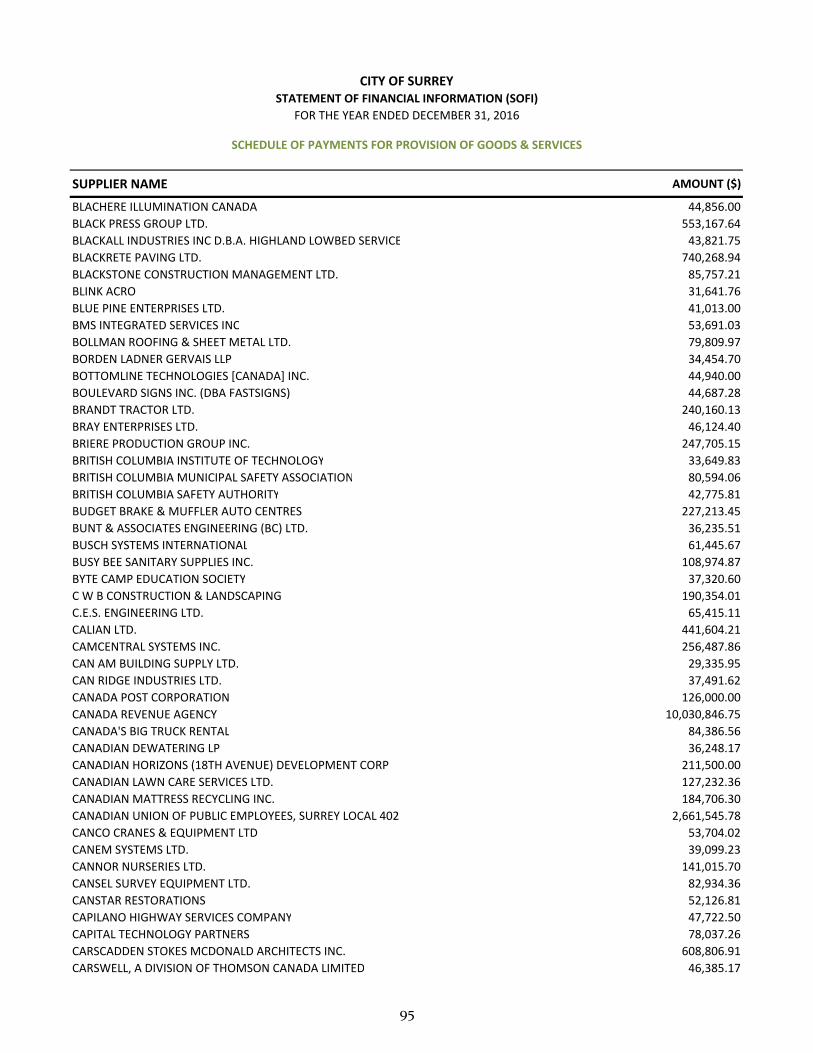
SUPPLIER NAME AMOUNT ($)
CITY OF SURREYSTATEMENT OF FINANCIAL INFORMATION (SOFI)
FOR THE YEAR ENDED DECEMBER 31, 2016
SCHEDULE OF PAYMENTS FOR PROVISION OF GOODS & SERVICES
BLACHERE ILLUMINATION CANADA 44,856.00
BLACK PRESS GROUP LTD. 553,167.64
BLACKALL INDUSTRIES INC D.B.A. HIGHLAND LOWBED SERVICE 43,821.75
BLACKRETE PAVING LTD. 740,268.94
BLACKSTONE CONSTRUCTION MANAGEMENT LTD. 85,757.21
BLINK ACRO 31,641.76
BLUE PINE ENTERPRISES LTD. 41,013.00
BMS INTEGRATED SERVICES INC 53,691.03
BOLLMAN ROOFING & SHEET METAL LTD. 79,809.97
BORDEN LADNER GERVAIS LLP 34,454.70
BOTTOMLINE TECHNOLOGIES [CANADA] INC. 44,940.00
BOULEVARD SIGNS INC. (DBA FASTSIGNS) 44,687.28
BRANDT TRACTOR LTD. 240,160.13
BRAY ENTERPRISES LTD. 46,124.40
BRIERE PRODUCTION GROUP INC. 247,705.15
BRITISH COLUMBIA INSTITUTE OF TECHNOLOGY 33,649.83
BRITISH COLUMBIA MUNICIPAL SAFETY ASSOCIATION 80,594.06
BRITISH COLUMBIA SAFETY AUTHORITY 42,775.81
BUDGET BRAKE & MUFFLER AUTO CENTRES 227,213.45
BUNT & ASSOCIATES ENGINEERING (BC) LTD. 36,235.51
BUSCH SYSTEMS INTERNATIONAL 61,445.67
BUSY BEE SANITARY SUPPLIES INC. 108,974.87
BYTE CAMP EDUCATION SOCIETY 37,320.60
C W B CONSTRUCTION & LANDSCAPING 190,354.01
C.E.S. ENGINEERING LTD. 65,415.11
CALIAN LTD. 441,604.21
CAMCENTRAL SYSTEMS INC. 256,487.86
CAN AM BUILDING SUPPLY LTD. 29,335.95
CAN RIDGE INDUSTRIES LTD. 37,491.62
CANADA POST CORPORATION 126,000.00
CANADA REVENUE AGENCY 10,030,846.75
CANADA'S BIG TRUCK RENTAL 84,386.56
CANADIAN DEWATERING LP 36,248.17
CANADIAN HORIZONS (18TH AVENUE) DEVELOPMENT CORP 211,500.00
CANADIAN LAWN CARE SERVICES LTD. 127,232.36
CANADIAN MATTRESS RECYCLING INC. 184,706.30
CANADIAN UNION OF PUBLIC EMPLOYEES, SURREY LOCAL 402 2,661,545.78
CANCO CRANES & EQUIPMENT LTD 53,704.02
CANEM SYSTEMS LTD. 39,099.23
CANNOR NURSERIES LTD. 141,015.70
CANSEL SURVEY EQUIPMENT LTD. 82,934.36
CANSTAR RESTORATIONS 52,126.81
CAPILANO HIGHWAY SERVICES COMPANY 47,722.50
CAPITAL TECHNOLOGY PARTNERS 78,037.26
CARSCADDEN STOKES MCDONALD ARCHITECTS INC. 608,806.91
CARSWELL, A DIVISION OF THOMSON CANADA LIMITED 46,385.17
95
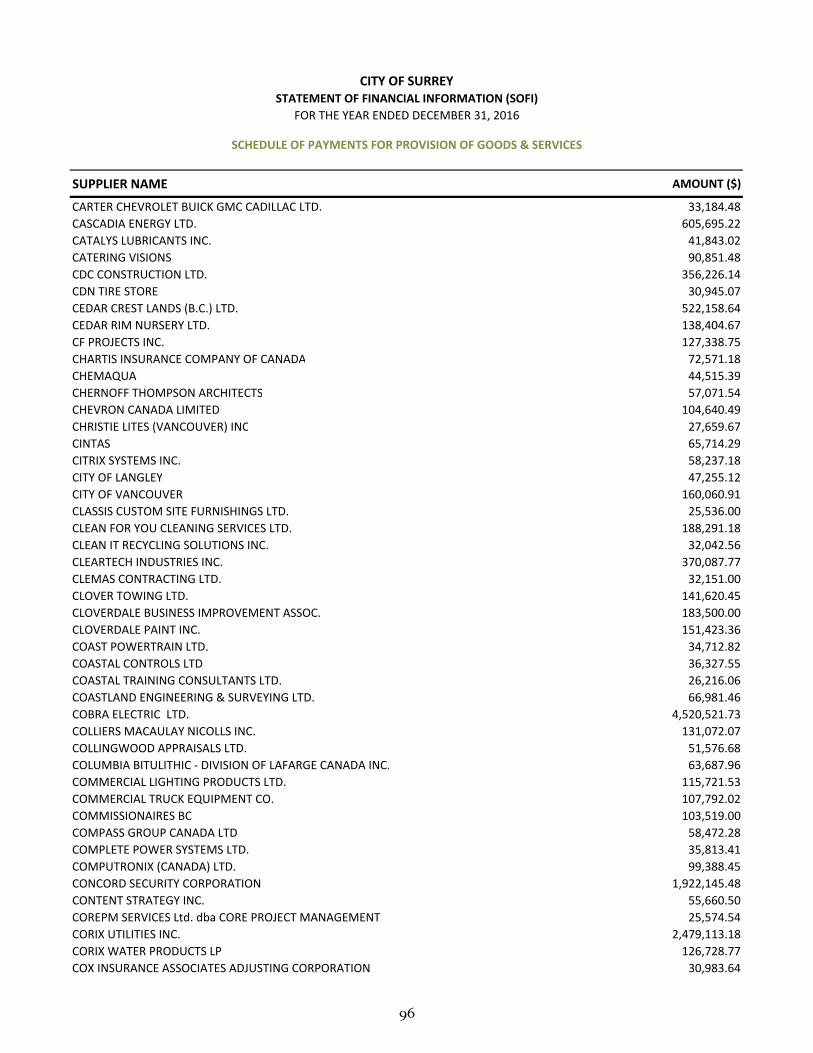
SUPPLIER NAME AMOUNT ($)
CITY OF SURREYSTATEMENT OF FINANCIAL INFORMATION (SOFI)
FOR THE YEAR ENDED DECEMBER 31, 2016
SCHEDULE OF PAYMENTS FOR PROVISION OF GOODS & SERVICES
CARTER CHEVROLET BUICK GMC CADILLAC LTD. 33,184.48
CASCADIA ENERGY LTD. 605,695.22
CATALYS LUBRICANTS INC. 41,843.02
CATERING VISIONS 90,851.48
CDC CONSTRUCTION LTD. 356,226.14
CDN TIRE STORE 30,945.07
CEDAR CREST LANDS (B.C.) LTD. 522,158.64
CEDAR RIM NURSERY LTD. 138,404.67
CF PROJECTS INC. 127,338.75
CHARTIS INSURANCE COMPANY OF CANADA 72,571.18
CHEMAQUA 44,515.39
CHERNOFF THOMPSON ARCHITECTS 57,071.54
CHEVRON CANADA LIMITED 104,640.49
CHRISTIE LITES (VANCOUVER) INC 27,659.67
CINTAS 65,714.29
CITRIX SYSTEMS INC. 58,237.18
CITY OF LANGLEY 47,255.12
CITY OF VANCOUVER 160,060.91
CLASSIS CUSTOM SITE FURNISHINGS LTD. 25,536.00
CLEAN FOR YOU CLEANING SERVICES LTD. 188,291.18
CLEAN IT RECYCLING SOLUTIONS INC. 32,042.56
CLEARTECH INDUSTRIES INC. 370,087.77
CLEMAS CONTRACTING LTD. 32,151.00
CLOVER TOWING LTD. 141,620.45
CLOVERDALE BUSINESS IMPROVEMENT ASSOC. 183,500.00
CLOVERDALE PAINT INC. 151,423.36
COAST POWERTRAIN LTD. 34,712.82
COASTAL CONTROLS LTD 36,327.55
COASTAL TRAINING CONSULTANTS LTD. 26,216.06
COASTLAND ENGINEERING & SURVEYING LTD. 66,981.46
COBRA ELECTRIC LTD. 4,520,521.73
COLLIERS MACAULAY NICOLLS INC. 131,072.07
COLLINGWOOD APPRAISALS LTD. 51,576.68
COLUMBIA BITULITHIC ‐ DIVISION OF LAFARGE CANADA INC. 63,687.96
COMMERCIAL LIGHTING PRODUCTS LTD. 115,721.53
COMMERCIAL TRUCK EQUIPMENT CO. 107,792.02
COMMISSIONAIRES BC 103,519.00
COMPASS GROUP CANADA LTD 58,472.28
COMPLETE POWER SYSTEMS LTD. 35,813.41
COMPUTRONIX (CANADA) LTD. 99,388.45
CONCORD SECURITY CORPORATION 1,922,145.48
CONTENT STRATEGY INC. 55,660.50
COREPM SERVICES Ltd. dba CORE PROJECT MANAGEMENT 25,574.54
CORIX UTILITIES INC. 2,479,113.18
CORIX WATER PRODUCTS LP 126,728.77
COX INSURANCE ASSOCIATES ADJUSTING CORPORATION 30,983.64
96
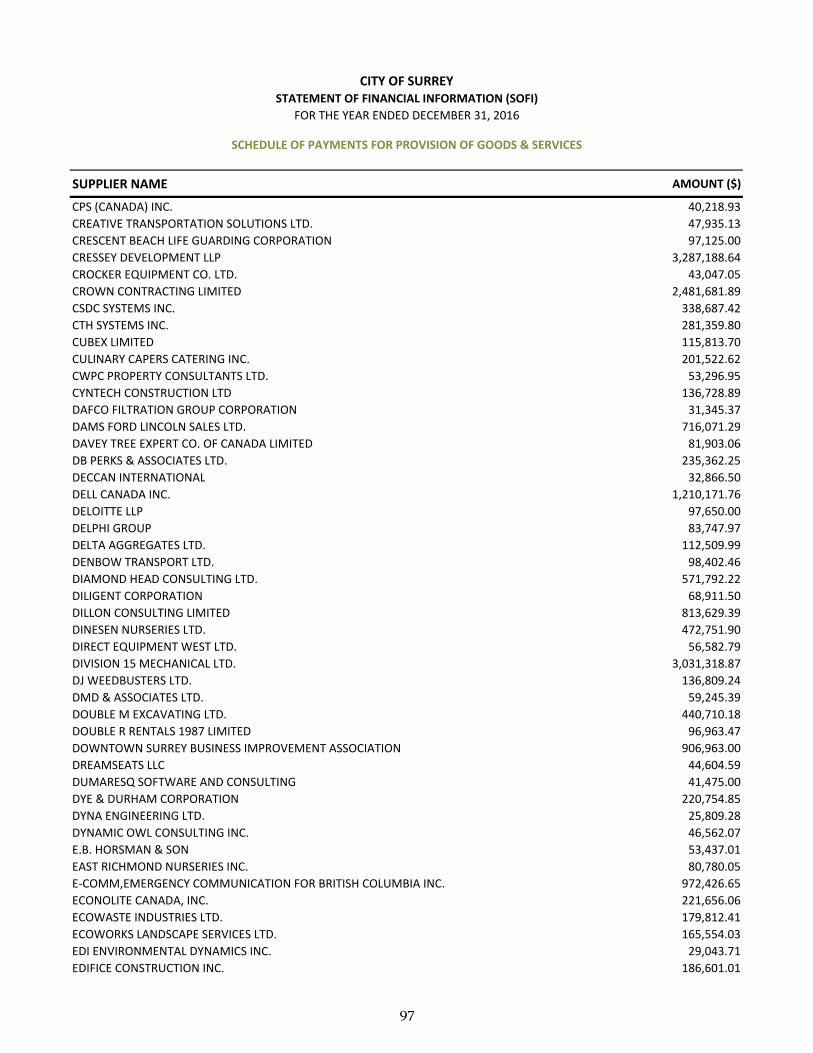
SUPPLIER NAME AMOUNT ($)
CITY OF SURREYSTATEMENT OF FINANCIAL INFORMATION (SOFI)
FOR THE YEAR ENDED DECEMBER 31, 2016
SCHEDULE OF PAYMENTS FOR PROVISION OF GOODS & SERVICES
CPS (CANADA) INC. 40,218.93
CREATIVE TRANSPORTATION SOLUTIONS LTD. 47,935.13
CRESCENT BEACH LIFE GUARDING CORPORATION 97,125.00
CRESSEY DEVELOPMENT LLP 3,287,188.64
CROCKER EQUIPMENT CO. LTD. 43,047.05
CROWN CONTRACTING LIMITED 2,481,681.89
CSDC SYSTEMS INC. 338,687.42
CTH SYSTEMS INC. 281,359.80
CUBEX LIMITED 115,813.70
CULINARY CAPERS CATERING INC. 201,522.62
CWPC PROPERTY CONSULTANTS LTD. 53,296.95
CYNTECH CONSTRUCTION LTD 136,728.89
DAFCO FILTRATION GROUP CORPORATION 31,345.37
DAMS FORD LINCOLN SALES LTD. 716,071.29
DAVEY TREE EXPERT CO. OF CANADA LIMITED 81,903.06
DB PERKS & ASSOCIATES LTD. 235,362.25
DECCAN INTERNATIONAL 32,866.50
DELL CANADA INC. 1,210,171.76
DELOITTE LLP 97,650.00
DELPHI GROUP 83,747.97
DELTA AGGREGATES LTD. 112,509.99
DENBOW TRANSPORT LTD. 98,402.46
DIAMOND HEAD CONSULTING LTD. 571,792.22
DILIGENT CORPORATION 68,911.50
DILLON CONSULTING LIMITED 813,629.39
DINESEN NURSERIES LTD. 472,751.90
DIRECT EQUIPMENT WEST LTD. 56,582.79
DIVISION 15 MECHANICAL LTD. 3,031,318.87
DJ WEEDBUSTERS LTD. 136,809.24
DMD & ASSOCIATES LTD. 59,245.39
DOUBLE M EXCAVATING LTD. 440,710.18
DOUBLE R RENTALS 1987 LIMITED 96,963.47
DOWNTOWN SURREY BUSINESS IMPROVEMENT ASSOCIATION 906,963.00
DREAMSEATS LLC 44,604.59
DUMARESQ SOFTWARE AND CONSULTING 41,475.00
DYE & DURHAM CORPORATION 220,754.85
DYNA ENGINEERING LTD. 25,809.28
DYNAMIC OWL CONSULTING INC. 46,562.07
E.B. HORSMAN & SON 53,437.01
EAST RICHMOND NURSERIES INC. 80,780.05
E‐COMM,EMERGENCY COMMUNICATION FOR BRITISH COLUMBIA INC. 972,426.65
ECONOLITE CANADA, INC. 221,656.06
ECOWASTE INDUSTRIES LTD. 179,812.41
ECOWORKS LANDSCAPE SERVICES LTD. 165,554.03
EDI ENVIRONMENTAL DYNAMICS INC. 29,043.71
EDIFICE CONSTRUCTION INC. 186,601.01
97
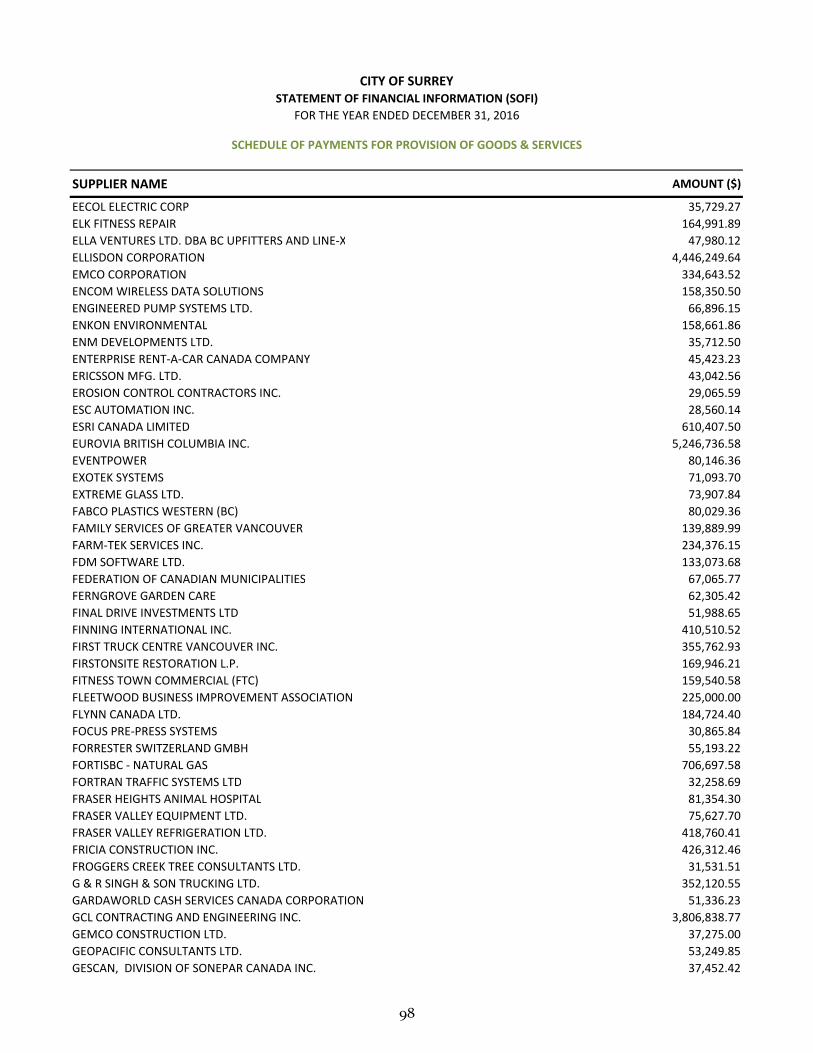
SUPPLIER NAME AMOUNT ($)
CITY OF SURREYSTATEMENT OF FINANCIAL INFORMATION (SOFI)
FOR THE YEAR ENDED DECEMBER 31, 2016
SCHEDULE OF PAYMENTS FOR PROVISION OF GOODS & SERVICES
EECOL ELECTRIC CORP 35,729.27
ELK FITNESS REPAIR 164,991.89
ELLA VENTURES LTD. DBA BC UPFITTERS AND LINE‐X 47,980.12
ELLISDON CORPORATION 4,446,249.64
EMCO CORPORATION 334,643.52
ENCOM WIRELESS DATA SOLUTIONS 158,350.50
ENGINEERED PUMP SYSTEMS LTD. 66,896.15
ENKON ENVIRONMENTAL 158,661.86
ENM DEVELOPMENTS LTD. 35,712.50
ENTERPRISE RENT‐A‐CAR CANADA COMPANY 45,423.23
ERICSSON MFG. LTD. 43,042.56
EROSION CONTROL CONTRACTORS INC. 29,065.59
ESC AUTOMATION INC. 28,560.14
ESRI CANADA LIMITED 610,407.50
EUROVIA BRITISH COLUMBIA INC. 5,246,736.58
EVENTPOWER 80,146.36
EXOTEK SYSTEMS 71,093.70
EXTREME GLASS LTD. 73,907.84
FABCO PLASTICS WESTERN (BC) 80,029.36
FAMILY SERVICES OF GREATER VANCOUVER 139,889.99
FARM‐TEK SERVICES INC. 234,376.15
FDM SOFTWARE LTD. 133,073.68
FEDERATION OF CANADIAN MUNICIPALITIES 67,065.77
FERNGROVE GARDEN CARE 62,305.42
FINAL DRIVE INVESTMENTS LTD 51,988.65
FINNING INTERNATIONAL INC. 410,510.52
FIRST TRUCK CENTRE VANCOUVER INC. 355,762.93
FIRSTONSITE RESTORATION L.P. 169,946.21
FITNESS TOWN COMMERCIAL (FTC) 159,540.58
FLEETWOOD BUSINESS IMPROVEMENT ASSOCIATION 225,000.00
FLYNN CANADA LTD. 184,724.40
FOCUS PRE‐PRESS SYSTEMS 30,865.84
FORRESTER SWITZERLAND GMBH 55,193.22
FORTISBC ‐ NATURAL GAS 706,697.58
FORTRAN TRAFFIC SYSTEMS LTD 32,258.69
FRASER HEIGHTS ANIMAL HOSPITAL 81,354.30
FRASER VALLEY EQUIPMENT LTD. 75,627.70
FRASER VALLEY REFRIGERATION LTD. 418,760.41
FRICIA CONSTRUCTION INC. 426,312.46
FROGGERS CREEK TREE CONSULTANTS LTD. 31,531.51
G & R SINGH & SON TRUCKING LTD. 352,120.55
GARDAWORLD CASH SERVICES CANADA CORPORATION 51,336.23
GCL CONTRACTING AND ENGINEERING INC. 3,806,838.77
GEMCO CONSTRUCTION LTD. 37,275.00
GEOPACIFIC CONSULTANTS LTD. 53,249.85
GESCAN, DIVISION OF SONEPAR CANADA INC. 37,452.42
98
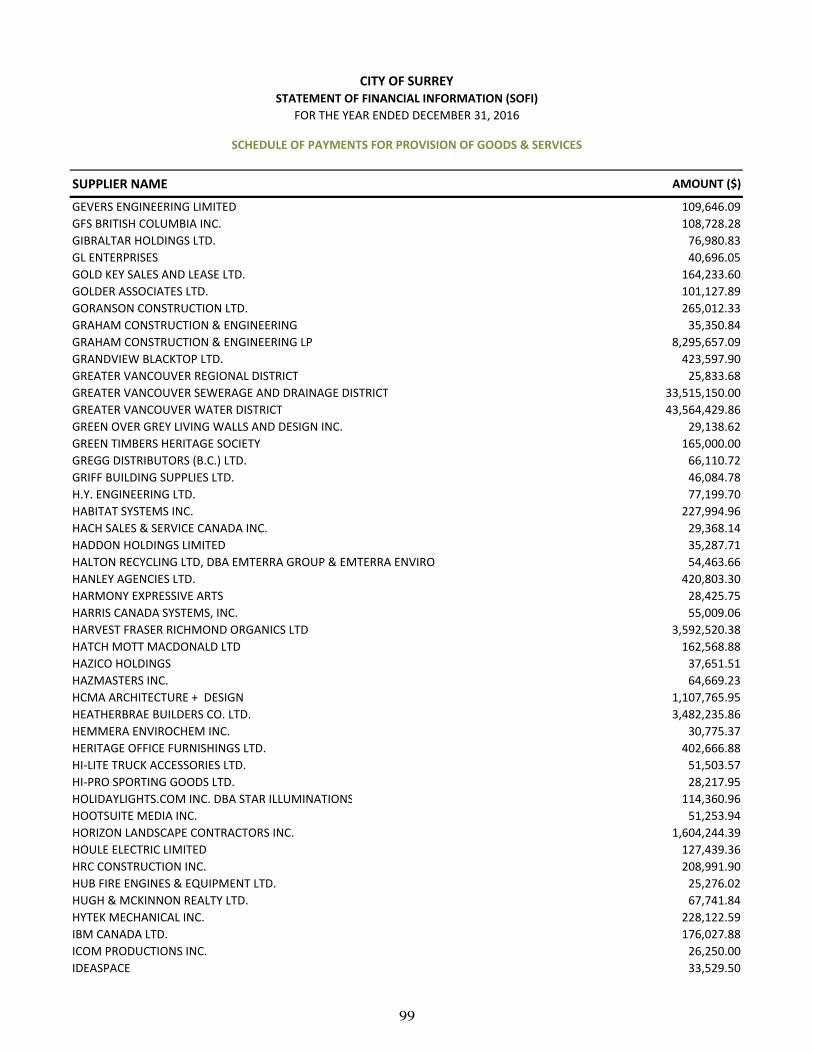
SUPPLIER NAME AMOUNT ($)
CITY OF SURREYSTATEMENT OF FINANCIAL INFORMATION (SOFI)
FOR THE YEAR ENDED DECEMBER 31, 2016
SCHEDULE OF PAYMENTS FOR PROVISION OF GOODS & SERVICES
GEVERS ENGINEERING LIMITED 109,646.09
GFS BRITISH COLUMBIA INC. 108,728.28
GIBRALTAR HOLDINGS LTD. 76,980.83
GL ENTERPRISES 40,696.05
GOLD KEY SALES AND LEASE LTD. 164,233.60
GOLDER ASSOCIATES LTD. 101,127.89
GORANSON CONSTRUCTION LTD. 265,012.33
GRAHAM CONSTRUCTION & ENGINEERING 35,350.84
GRAHAM CONSTRUCTION & ENGINEERING LP 8,295,657.09
GRANDVIEW BLACKTOP LTD. 423,597.90
GREATER VANCOUVER REGIONAL DISTRICT 25,833.68
GREATER VANCOUVER SEWERAGE AND DRAINAGE DISTRICT 33,515,150.00
GREATER VANCOUVER WATER DISTRICT 43,564,429.86
GREEN OVER GREY LIVING WALLS AND DESIGN INC. 29,138.62
GREEN TIMBERS HERITAGE SOCIETY 165,000.00
GREGG DISTRIBUTORS (B.C.) LTD. 66,110.72
GRIFF BUILDING SUPPLIES LTD. 46,084.78
H.Y. ENGINEERING LTD. 77,199.70
HABITAT SYSTEMS INC. 227,994.96
HACH SALES & SERVICE CANADA INC. 29,368.14
HADDON HOLDINGS LIMITED 35,287.71
HALTON RECYCLING LTD, DBA EMTERRA GROUP & EMTERRA ENVIRO 54,463.66
HANLEY AGENCIES LTD. 420,803.30
HARMONY EXPRESSIVE ARTS 28,425.75
HARRIS CANADA SYSTEMS, INC. 55,009.06
HARVEST FRASER RICHMOND ORGANICS LTD 3,592,520.38
HATCH MOTT MACDONALD LTD 162,568.88
HAZICO HOLDINGS 37,651.51
HAZMASTERS INC. 64,669.23
HCMA ARCHITECTURE + DESIGN 1,107,765.95
HEATHERBRAE BUILDERS CO. LTD. 3,482,235.86
HEMMERA ENVIROCHEM INC. 30,775.37
HERITAGE OFFICE FURNISHINGS LTD. 402,666.88
HI‐LITE TRUCK ACCESSORIES LTD. 51,503.57
HI‐PRO SPORTING GOODS LTD. 28,217.95
HOLIDAYLIGHTS.COM INC. DBA STAR ILLUMINATIONS 114,360.96
HOOTSUITE MEDIA INC. 51,253.94
HORIZON LANDSCAPE CONTRACTORS INC. 1,604,244.39
HOULE ELECTRIC LIMITED 127,439.36
HRC CONSTRUCTION INC. 208,991.90
HUB FIRE ENGINES & EQUIPMENT LTD. 25,276.02
HUGH & MCKINNON REALTY LTD. 67,741.84
HYTEK MECHANICAL INC. 228,122.59
IBM CANADA LTD. 176,027.88
ICOM PRODUCTIONS INC. 26,250.00
IDEASPACE 33,529.50
99
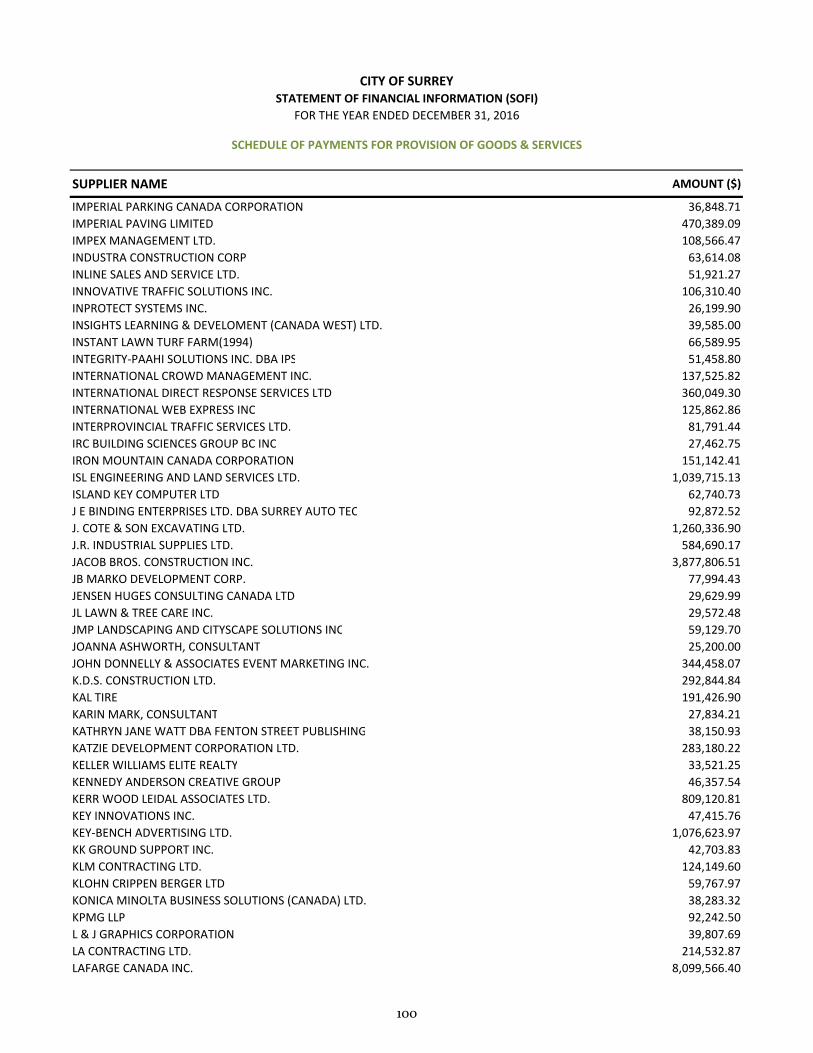
SUPPLIER NAME AMOUNT ($)
CITY OF SURREYSTATEMENT OF FINANCIAL INFORMATION (SOFI)
FOR THE YEAR ENDED DECEMBER 31, 2016
SCHEDULE OF PAYMENTS FOR PROVISION OF GOODS & SERVICES
IMPERIAL PARKING CANADA CORPORATION 36,848.71
IMPERIAL PAVING LIMITED 470,389.09
IMPEX MANAGEMENT LTD. 108,566.47
INDUSTRA CONSTRUCTION CORP 63,614.08
INLINE SALES AND SERVICE LTD. 51,921.27
INNOVATIVE TRAFFIC SOLUTIONS INC. 106,310.40
INPROTECT SYSTEMS INC. 26,199.90
INSIGHTS LEARNING & DEVELOMENT (CANADA WEST) LTD. 39,585.00
INSTANT LAWN TURF FARM(1994) 66,589.95
INTEGRITY‐PAAHI SOLUTIONS INC. DBA IPS 51,458.80
INTERNATIONAL CROWD MANAGEMENT INC. 137,525.82
INTERNATIONAL DIRECT RESPONSE SERVICES LTD 360,049.30
INTERNATIONAL WEB EXPRESS INC 125,862.86
INTERPROVINCIAL TRAFFIC SERVICES LTD. 81,791.44
IRC BUILDING SCIENCES GROUP BC INC 27,462.75
IRON MOUNTAIN CANADA CORPORATION 151,142.41
ISL ENGINEERING AND LAND SERVICES LTD. 1,039,715.13
ISLAND KEY COMPUTER LTD 62,740.73
J E BINDING ENTERPRISES LTD. DBA SURREY AUTO TEC 92,872.52
J. COTE & SON EXCAVATING LTD. 1,260,336.90
J.R. INDUSTRIAL SUPPLIES LTD. 584,690.17
JACOB BROS. CONSTRUCTION INC. 3,877,806.51
JB MARKO DEVELOPMENT CORP. 77,994.43
JENSEN HUGES CONSULTING CANADA LTD 29,629.99
JL LAWN & TREE CARE INC. 29,572.48
JMP LANDSCAPING AND CITYSCAPE SOLUTIONS INC 59,129.70
JOANNA ASHWORTH, CONSULTANT 25,200.00
JOHN DONNELLY & ASSOCIATES EVENT MARKETING INC. 344,458.07
K.D.S. CONSTRUCTION LTD. 292,844.84
KAL TIRE 191,426.90
KARIN MARK, CONSULTANT 27,834.21
KATHRYN JANE WATT DBA FENTON STREET PUBLISHING 38,150.93
KATZIE DEVELOPMENT CORPORATION LTD. 283,180.22
KELLER WILLIAMS ELITE REALTY 33,521.25
KENNEDY ANDERSON CREATIVE GROUP 46,357.54
KERR WOOD LEIDAL ASSOCIATES LTD. 809,120.81
KEY INNOVATIONS INC. 47,415.76
KEY‐BENCH ADVERTISING LTD. 1,076,623.97
KK GROUND SUPPORT INC. 42,703.83
KLM CONTRACTING LTD. 124,149.60
KLOHN CRIPPEN BERGER LTD 59,767.97
KONICA MINOLTA BUSINESS SOLUTIONS (CANADA) LTD. 38,283.32
KPMG LLP 92,242.50
L & J GRAPHICS CORPORATION 39,807.69
LA CONTRACTING LTD. 214,532.87
LAFARGE CANADA INC. 8,099,566.40
100
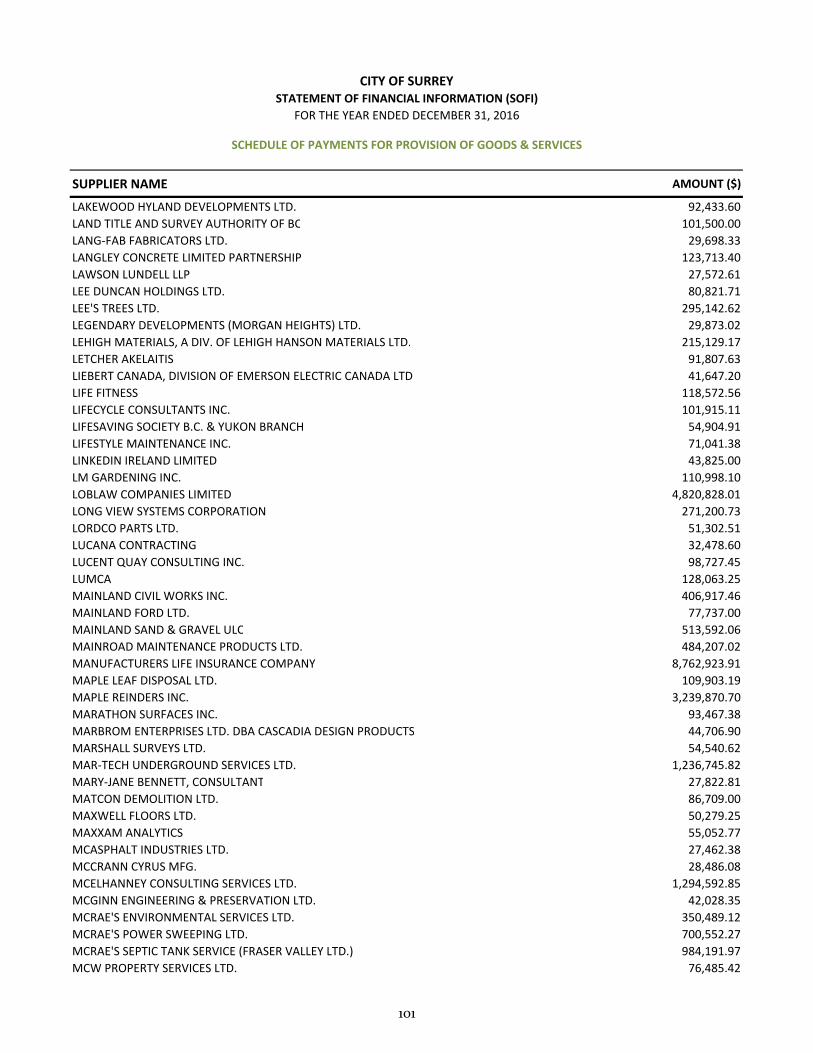
SUPPLIER NAME AMOUNT ($)
CITY OF SURREYSTATEMENT OF FINANCIAL INFORMATION (SOFI)
FOR THE YEAR ENDED DECEMBER 31, 2016
SCHEDULE OF PAYMENTS FOR PROVISION OF GOODS & SERVICES
LAKEWOOD HYLAND DEVELOPMENTS LTD. 92,433.60
LAND TITLE AND SURVEY AUTHORITY OF BC 101,500.00
LANG‐FAB FABRICATORS LTD. 29,698.33
LANGLEY CONCRETE LIMITED PARTNERSHIP 123,713.40
LAWSON LUNDELL LLP 27,572.61
LEE DUNCAN HOLDINGS LTD. 80,821.71
LEE'S TREES LTD. 295,142.62
LEGENDARY DEVELOPMENTS (MORGAN HEIGHTS) LTD. 29,873.02
LEHIGH MATERIALS, A DIV. OF LEHIGH HANSON MATERIALS LTD. 215,129.17
LETCHER AKELAITIS 91,807.63
LIEBERT CANADA, DIVISION OF EMERSON ELECTRIC CANADA LTD 41,647.20
LIFE FITNESS 118,572.56
LIFECYCLE CONSULTANTS INC. 101,915.11
LIFESAVING SOCIETY B.C. & YUKON BRANCH 54,904.91
LIFESTYLE MAINTENANCE INC. 71,041.38
LINKEDIN IRELAND LIMITED 43,825.00
LM GARDENING INC. 110,998.10
LOBLAW COMPANIES LIMITED 4,820,828.01
LONG VIEW SYSTEMS CORPORATION 271,200.73
LORDCO PARTS LTD. 51,302.51
LUCANA CONTRACTING 32,478.60
LUCENT QUAY CONSULTING INC. 98,727.45
LUMCA 128,063.25
MAINLAND CIVIL WORKS INC. 406,917.46
MAINLAND FORD LTD. 77,737.00
MAINLAND SAND & GRAVEL ULC 513,592.06
MAINROAD MAINTENANCE PRODUCTS LTD. 484,207.02
MANUFACTURERS LIFE INSURANCE COMPANY 8,762,923.91
MAPLE LEAF DISPOSAL LTD. 109,903.19
MAPLE REINDERS INC. 3,239,870.70
MARATHON SURFACES INC. 93,467.38
MARBROM ENTERPRISES LTD. DBA CASCADIA DESIGN PRODUCTS 44,706.90
MARSHALL SURVEYS LTD. 54,540.62
MAR‐TECH UNDERGROUND SERVICES LTD. 1,236,745.82
MARY‐JANE BENNETT, CONSULTANT 27,822.81
MATCON DEMOLITION LTD. 86,709.00
MAXWELL FLOORS LTD. 50,279.25
MAXXAM ANALYTICS 55,052.77
MCASPHALT INDUSTRIES LTD. 27,462.38
MCCRANN CYRUS MFG. 28,486.08
MCELHANNEY CONSULTING SERVICES LTD. 1,294,592.85
MCGINN ENGINEERING & PRESERVATION LTD. 42,028.35
MCRAE'S ENVIRONMENTAL SERVICES LTD. 350,489.12
MCRAE'S POWER SWEEPING LTD. 700,552.27
MCRAE'S SEPTIC TANK SERVICE (FRASER VALLEY LTD.) 984,191.97
MCW PROPERTY SERVICES LTD. 76,485.42
101
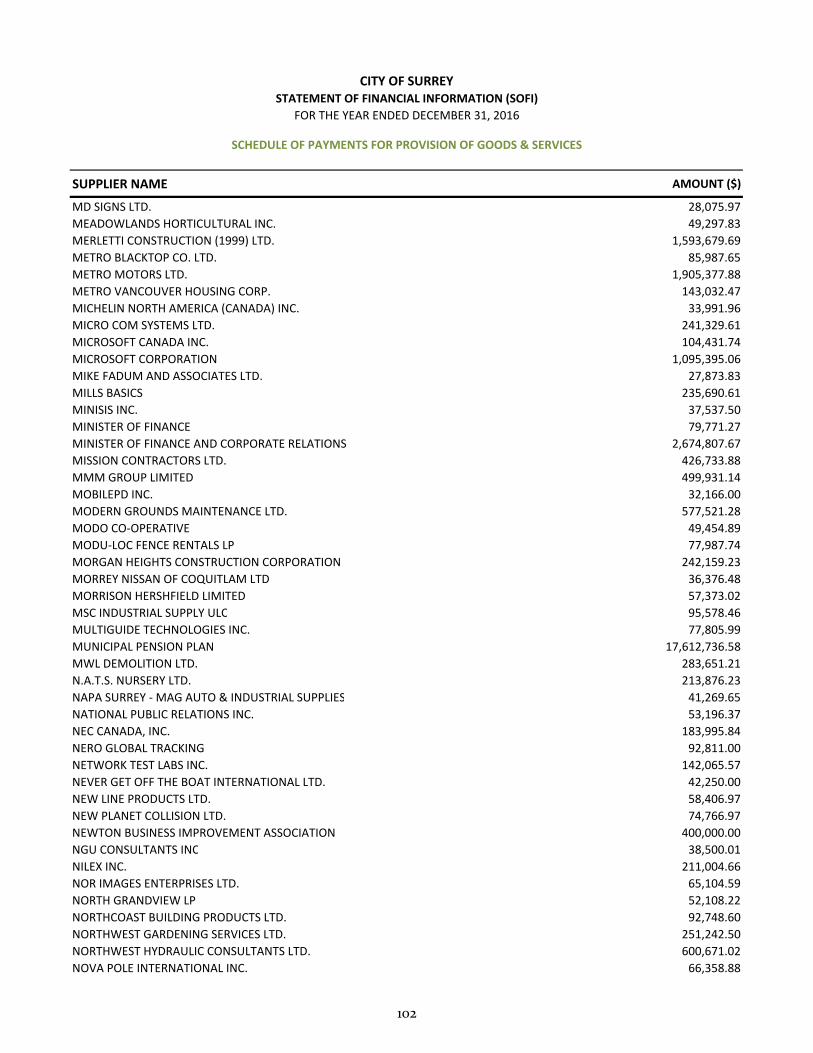
SUPPLIER NAME AMOUNT ($)
CITY OF SURREYSTATEMENT OF FINANCIAL INFORMATION (SOFI)
FOR THE YEAR ENDED DECEMBER 31, 2016
SCHEDULE OF PAYMENTS FOR PROVISION OF GOODS & SERVICES
MD SIGNS LTD. 28,075.97
MEADOWLANDS HORTICULTURAL INC. 49,297.83
MERLETTI CONSTRUCTION (1999) LTD. 1,593,679.69
METRO BLACKTOP CO. LTD. 85,987.65
METRO MOTORS LTD. 1,905,377.88
METRO VANCOUVER HOUSING CORP. 143,032.47
MICHELIN NORTH AMERICA (CANADA) INC. 33,991.96
MICRO COM SYSTEMS LTD. 241,329.61
MICROSOFT CANADA INC. 104,431.74
MICROSOFT CORPORATION 1,095,395.06
MIKE FADUM AND ASSOCIATES LTD. 27,873.83
MILLS BASICS 235,690.61
MINISIS INC. 37,537.50
MINISTER OF FINANCE 79,771.27
MINISTER OF FINANCE AND CORPORATE RELATIONS 2,674,807.67
MISSION CONTRACTORS LTD. 426,733.88
MMM GROUP LIMITED 499,931.14
MOBILEPD INC. 32,166.00
MODERN GROUNDS MAINTENANCE LTD. 577,521.28
MODO CO‐OPERATIVE 49,454.89
MODU‐LOC FENCE RENTALS LP 77,987.74
MORGAN HEIGHTS CONSTRUCTION CORPORATION 242,159.23
MORREY NISSAN OF COQUITLAM LTD 36,376.48
MORRISON HERSHFIELD LIMITED 57,373.02
MSC INDUSTRIAL SUPPLY ULC 95,578.46
MULTIGUIDE TECHNOLOGIES INC. 77,805.99
MUNICIPAL PENSION PLAN 17,612,736.58
MWL DEMOLITION LTD. 283,651.21
N.A.T.S. NURSERY LTD. 213,876.23
NAPA SURREY ‐ MAG AUTO & INDUSTRIAL SUPPLIES 41,269.65
NATIONAL PUBLIC RELATIONS INC. 53,196.37
NEC CANADA, INC. 183,995.84
NERO GLOBAL TRACKING 92,811.00
NETWORK TEST LABS INC. 142,065.57
NEVER GET OFF THE BOAT INTERNATIONAL LTD. 42,250.00
NEW LINE PRODUCTS LTD. 58,406.97
NEW PLANET COLLISION LTD. 74,766.97
NEWTON BUSINESS IMPROVEMENT ASSOCIATION 400,000.00
NGU CONSULTANTS INC 38,500.01
NILEX INC. 211,004.66
NOR IMAGES ENTERPRISES LTD. 65,104.59
NORTH GRANDVIEW LP 52,108.22
NORTHCOAST BUILDING PRODUCTS LTD. 92,748.60
NORTHWEST GARDENING SERVICES LTD. 251,242.50
NORTHWEST HYDRAULIC CONSULTANTS LTD. 600,671.02
NOVA POLE INTERNATIONAL INC. 66,358.88
102
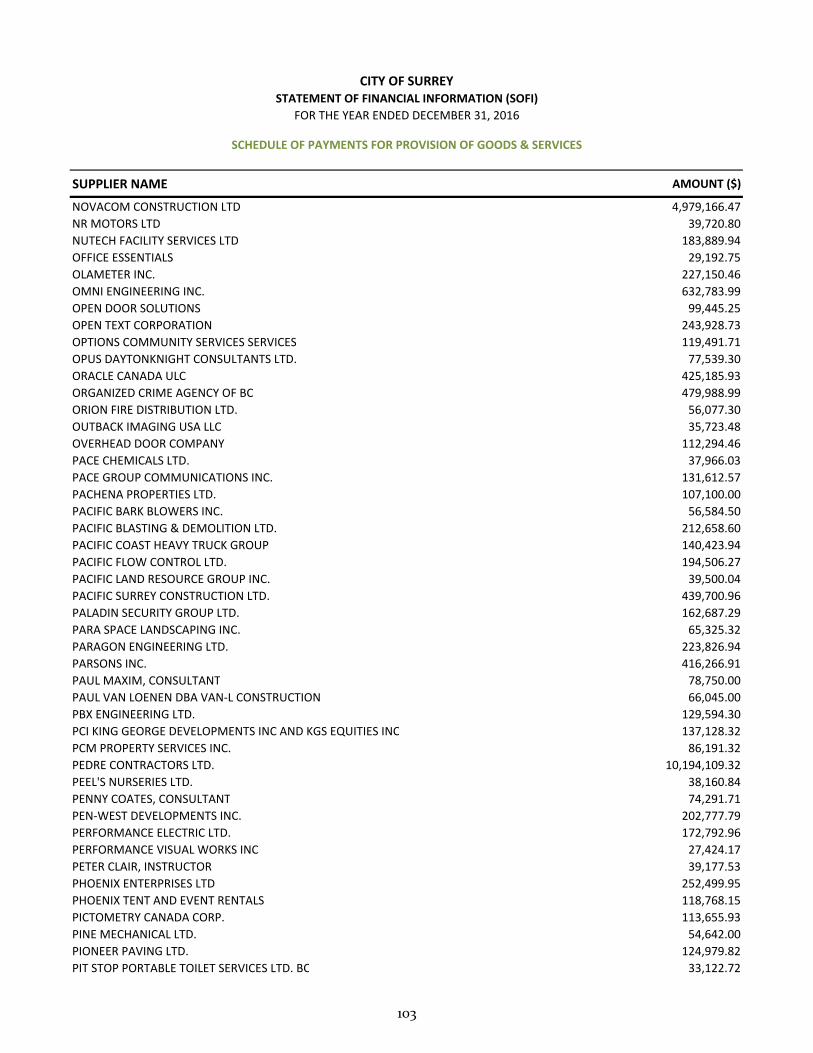
SUPPLIER NAME AMOUNT ($)
CITY OF SURREYSTATEMENT OF FINANCIAL INFORMATION (SOFI)
FOR THE YEAR ENDED DECEMBER 31, 2016
SCHEDULE OF PAYMENTS FOR PROVISION OF GOODS & SERVICES
NOVACOM CONSTRUCTION LTD 4,979,166.47
NR MOTORS LTD 39,720.80
NUTECH FACILITY SERVICES LTD 183,889.94
OFFICE ESSENTIALS 29,192.75
OLAMETER INC. 227,150.46
OMNI ENGINEERING INC. 632,783.99
OPEN DOOR SOLUTIONS 99,445.25
OPEN TEXT CORPORATION 243,928.73
OPTIONS COMMUNITY SERVICES SERVICES 119,491.71
OPUS DAYTONKNIGHT CONSULTANTS LTD. 77,539.30
ORACLE CANADA ULC 425,185.93
ORGANIZED CRIME AGENCY OF BC 479,988.99
ORION FIRE DISTRIBUTION LTD. 56,077.30
OUTBACK IMAGING USA LLC 35,723.48
OVERHEAD DOOR COMPANY 112,294.46
PACE CHEMICALS LTD. 37,966.03
PACE GROUP COMMUNICATIONS INC. 131,612.57
PACHENA PROPERTIES LTD. 107,100.00
PACIFIC BARK BLOWERS INC. 56,584.50
PACIFIC BLASTING & DEMOLITION LTD. 212,658.60
PACIFIC COAST HEAVY TRUCK GROUP 140,423.94
PACIFIC FLOW CONTROL LTD. 194,506.27
PACIFIC LAND RESOURCE GROUP INC. 39,500.04
PACIFIC SURREY CONSTRUCTION LTD. 439,700.96
PALADIN SECURITY GROUP LTD. 162,687.29
PARA SPACE LANDSCAPING INC. 65,325.32
PARAGON ENGINEERING LTD. 223,826.94
PARSONS INC. 416,266.91
PAUL MAXIM, CONSULTANT 78,750.00
PAUL VAN LOENEN DBA VAN‐L CONSTRUCTION 66,045.00
PBX ENGINEERING LTD. 129,594.30
PCI KING GEORGE DEVELOPMENTS INC AND KGS EQUITIES INC 137,128.32
PCM PROPERTY SERVICES INC. 86,191.32
PEDRE CONTRACTORS LTD. 10,194,109.32
PEEL'S NURSERIES LTD. 38,160.84
PENNY COATES, CONSULTANT 74,291.71
PEN‐WEST DEVELOPMENTS INC. 202,777.79
PERFORMANCE ELECTRIC LTD. 172,792.96
PERFORMANCE VISUAL WORKS INC 27,424.17
PETER CLAIR, INSTRUCTOR 39,177.53
PHOENIX ENTERPRISES LTD 252,499.95
PHOENIX TENT AND EVENT RENTALS 118,768.15
PICTOMETRY CANADA CORP. 113,655.93
PINE MECHANICAL LTD. 54,642.00
PIONEER PAVING LTD. 124,979.82
PIT STOP PORTABLE TOILET SERVICES LTD. BC 33,122.72
103
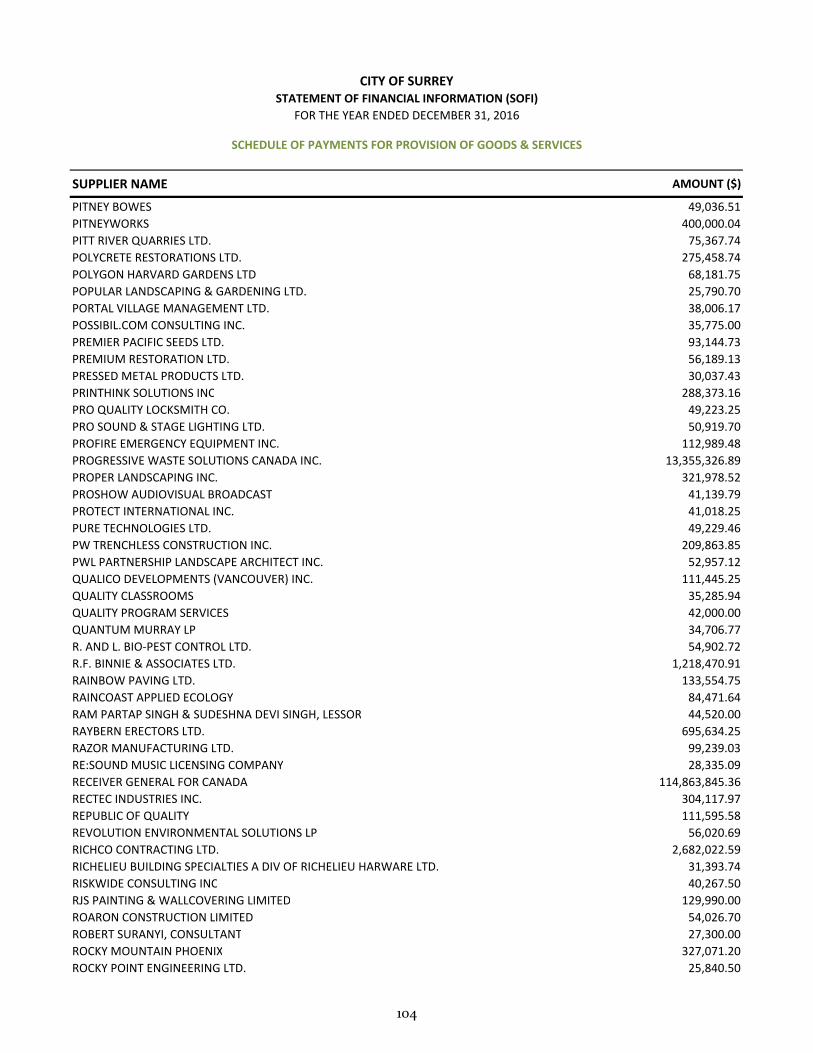
SUPPLIER NAME AMOUNT ($)
CITY OF SURREYSTATEMENT OF FINANCIAL INFORMATION (SOFI)
FOR THE YEAR ENDED DECEMBER 31, 2016
SCHEDULE OF PAYMENTS FOR PROVISION OF GOODS & SERVICES
PITNEY BOWES 49,036.51
PITNEYWORKS 400,000.04
PITT RIVER QUARRIES LTD. 75,367.74
POLYCRETE RESTORATIONS LTD. 275,458.74
POLYGON HARVARD GARDENS LTD 68,181.75
POPULAR LANDSCAPING & GARDENING LTD. 25,790.70
PORTAL VILLAGE MANAGEMENT LTD. 38,006.17
POSSIBIL.COM CONSULTING INC. 35,775.00
PREMIER PACIFIC SEEDS LTD. 93,144.73
PREMIUM RESTORATION LTD. 56,189.13
PRESSED METAL PRODUCTS LTD. 30,037.43
PRINTHINK SOLUTIONS INC 288,373.16
PRO QUALITY LOCKSMITH CO. 49,223.25
PRO SOUND & STAGE LIGHTING LTD. 50,919.70
PROFIRE EMERGENCY EQUIPMENT INC. 112,989.48
PROGRESSIVE WASTE SOLUTIONS CANADA INC. 13,355,326.89
PROPER LANDSCAPING INC. 321,978.52
PROSHOW AUDIOVISUAL BROADCAST 41,139.79
PROTECT INTERNATIONAL INC. 41,018.25
PURE TECHNOLOGIES LTD. 49,229.46
PW TRENCHLESS CONSTRUCTION INC. 209,863.85
PWL PARTNERSHIP LANDSCAPE ARCHITECT INC. 52,957.12
QUALICO DEVELOPMENTS (VANCOUVER) INC. 111,445.25
QUALITY CLASSROOMS 35,285.94
QUALITY PROGRAM SERVICES 42,000.00
QUANTUM MURRAY LP 34,706.77
R. AND L. BIO‐PEST CONTROL LTD. 54,902.72
R.F. BINNIE & ASSOCIATES LTD. 1,218,470.91
RAINBOW PAVING LTD. 133,554.75
RAINCOAST APPLIED ECOLOGY 84,471.64
RAM PARTAP SINGH & SUDESHNA DEVI SINGH, LESSOR 44,520.00
RAYBERN ERECTORS LTD. 695,634.25
RAZOR MANUFACTURING LTD. 99,239.03
RE:SOUND MUSIC LICENSING COMPANY 28,335.09
RECEIVER GENERAL FOR CANADA 114,863,845.36
RECTEC INDUSTRIES INC. 304,117.97
REPUBLIC OF QUALITY 111,595.58
REVOLUTION ENVIRONMENTAL SOLUTIONS LP 56,020.69
RICHCO CONTRACTING LTD. 2,682,022.59
RICHELIEU BUILDING SPECIALTIES A DIV OF RICHELIEU HARWARE LTD. 31,393.74
RISKWIDE CONSULTING INC 40,267.50
RJS PAINTING & WALLCOVERING LIMITED 129,990.00
ROARON CONSTRUCTION LIMITED 54,026.70
ROBERT SURANYI, CONSULTANT 27,300.00
ROCKY MOUNTAIN PHOENIX 327,071.20
ROCKY POINT ENGINEERING LTD. 25,840.50
104
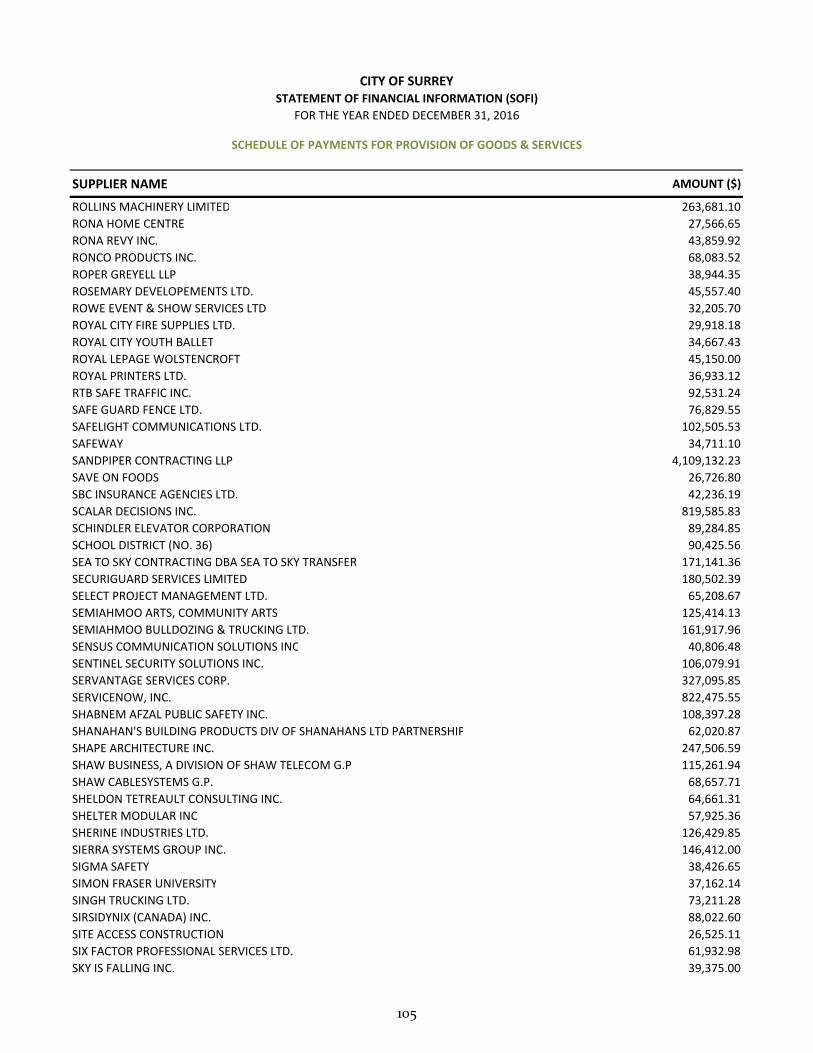
SUPPLIER NAME AMOUNT ($)
CITY OF SURREYSTATEMENT OF FINANCIAL INFORMATION (SOFI)
FOR THE YEAR ENDED DECEMBER 31, 2016
SCHEDULE OF PAYMENTS FOR PROVISION OF GOODS & SERVICES
ROLLINS MACHINERY LIMITED 263,681.10
RONA HOME CENTRE 27,566.65
RONA REVY INC. 43,859.92
RONCO PRODUCTS INC. 68,083.52
ROPER GREYELL LLP 38,944.35
ROSEMARY DEVELOPEMENTS LTD. 45,557.40
ROWE EVENT & SHOW SERVICES LTD 32,205.70
ROYAL CITY FIRE SUPPLIES LTD. 29,918.18
ROYAL CITY YOUTH BALLET 34,667.43
ROYAL LEPAGE WOLSTENCROFT 45,150.00
ROYAL PRINTERS LTD. 36,933.12
RTB SAFE TRAFFIC INC. 92,531.24
SAFE GUARD FENCE LTD. 76,829.55
SAFELIGHT COMMUNICATIONS LTD. 102,505.53
SAFEWAY 34,711.10
SANDPIPER CONTRACTING LLP 4,109,132.23
SAVE ON FOODS 26,726.80
SBC INSURANCE AGENCIES LTD. 42,236.19
SCALAR DECISIONS INC. 819,585.83
SCHINDLER ELEVATOR CORPORATION 89,284.85
SCHOOL DISTRICT (NO. 36) 90,425.56
SEA TO SKY CONTRACTING DBA SEA TO SKY TRANSFER 171,141.36
SECURIGUARD SERVICES LIMITED 180,502.39
SELECT PROJECT MANAGEMENT LTD. 65,208.67
SEMIAHMOO ARTS, COMMUNITY ARTS 125,414.13
SEMIAHMOO BULLDOZING & TRUCKING LTD. 161,917.96
SENSUS COMMUNICATION SOLUTIONS INC 40,806.48
SENTINEL SECURITY SOLUTIONS INC. 106,079.91
SERVANTAGE SERVICES CORP. 327,095.85
SERVICENOW, INC. 822,475.55
SHABNEM AFZAL PUBLIC SAFETY INC. 108,397.28
SHANAHAN'S BUILDING PRODUCTS DIV OF SHANAHANS LTD PARTNERSHIP 62,020.87
SHAPE ARCHITECTURE INC. 247,506.59
SHAW BUSINESS, A DIVISION OF SHAW TELECOM G.P 115,261.94
SHAW CABLESYSTEMS G.P. 68,657.71
SHELDON TETREAULT CONSULTING INC. 64,661.31
SHELTER MODULAR INC 57,925.36
SHERINE INDUSTRIES LTD. 126,429.85
SIERRA SYSTEMS GROUP INC. 146,412.00
SIGMA SAFETY 38,426.65
SIMON FRASER UNIVERSITY 37,162.14
SINGH TRUCKING LTD. 73,211.28
SIRSIDYNIX (CANADA) INC. 88,022.60
SITE ACCESS CONSTRUCTION 26,525.11
SIX FACTOR PROFESSIONAL SERVICES LTD. 61,932.98
SKY IS FALLING INC. 39,375.00
105
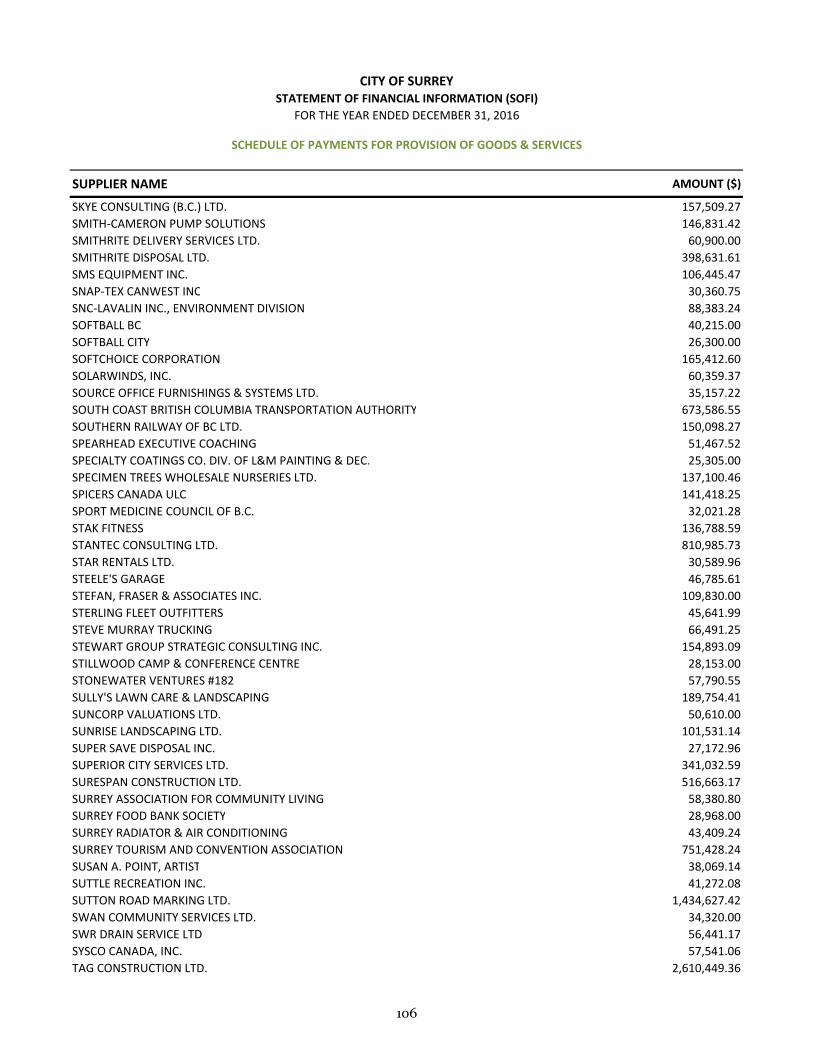
SUPPLIER NAME AMOUNT ($)
CITY OF SURREYSTATEMENT OF FINANCIAL INFORMATION (SOFI)
FOR THE YEAR ENDED DECEMBER 31, 2016
SCHEDULE OF PAYMENTS FOR PROVISION OF GOODS & SERVICES
SKYE CONSULTING (B.C.) LTD. 157,509.27
SMITH‐CAMERON PUMP SOLUTIONS 146,831.42
SMITHRITE DELIVERY SERVICES LTD. 60,900.00
SMITHRITE DISPOSAL LTD. 398,631.61
SMS EQUIPMENT INC. 106,445.47
SNAP‐TEX CANWEST INC 30,360.75
SNC‐LAVALIN INC., ENVIRONMENT DIVISION 88,383.24
SOFTBALL BC 40,215.00
SOFTBALL CITY 26,300.00
SOFTCHOICE CORPORATION 165,412.60
SOLARWINDS, INC. 60,359.37
SOURCE OFFICE FURNISHINGS & SYSTEMS LTD. 35,157.22
SOUTH COAST BRITISH COLUMBIA TRANSPORTATION AUTHORITY 673,586.55
SOUTHERN RAILWAY OF BC LTD. 150,098.27
SPEARHEAD EXECUTIVE COACHING 51,467.52
SPECIALTY COATINGS CO. DIV. OF L&M PAINTING & DEC. 25,305.00
SPECIMEN TREES WHOLESALE NURSERIES LTD. 137,100.46
SPICERS CANADA ULC 141,418.25
SPORT MEDICINE COUNCIL OF B.C. 32,021.28
STAK FITNESS 136,788.59
STANTEC CONSULTING LTD. 810,985.73
STAR RENTALS LTD. 30,589.96
STEELE'S GARAGE 46,785.61
STEFAN, FRASER & ASSOCIATES INC. 109,830.00
STERLING FLEET OUTFITTERS 45,641.99
STEVE MURRAY TRUCKING 66,491.25
STEWART GROUP STRATEGIC CONSULTING INC. 154,893.09
STILLWOOD CAMP & CONFERENCE CENTRE 28,153.00
STONEWATER VENTURES #182 57,790.55
SULLY'S LAWN CARE & LANDSCAPING 189,754.41
SUNCORP VALUATIONS LTD. 50,610.00
SUNRISE LANDSCAPING LTD. 101,531.14
SUPER SAVE DISPOSAL INC. 27,172.96
SUPERIOR CITY SERVICES LTD. 341,032.59
SURESPAN CONSTRUCTION LTD. 516,663.17
SURREY ASSOCIATION FOR COMMUNITY LIVING 58,380.80
SURREY FOOD BANK SOCIETY 28,968.00
SURREY RADIATOR & AIR CONDITIONING 43,409.24
SURREY TOURISM AND CONVENTION ASSOCIATION 751,428.24
SUSAN A. POINT, ARTIST 38,069.14
SUTTLE RECREATION INC. 41,272.08
SUTTON ROAD MARKING LTD. 1,434,627.42
SWAN COMMUNITY SERVICES LTD. 34,320.00
SWR DRAIN SERVICE LTD 56,441.17
SYSCO CANADA, INC. 57,541.06
TAG CONSTRUCTION LTD. 2,610,449.36
106
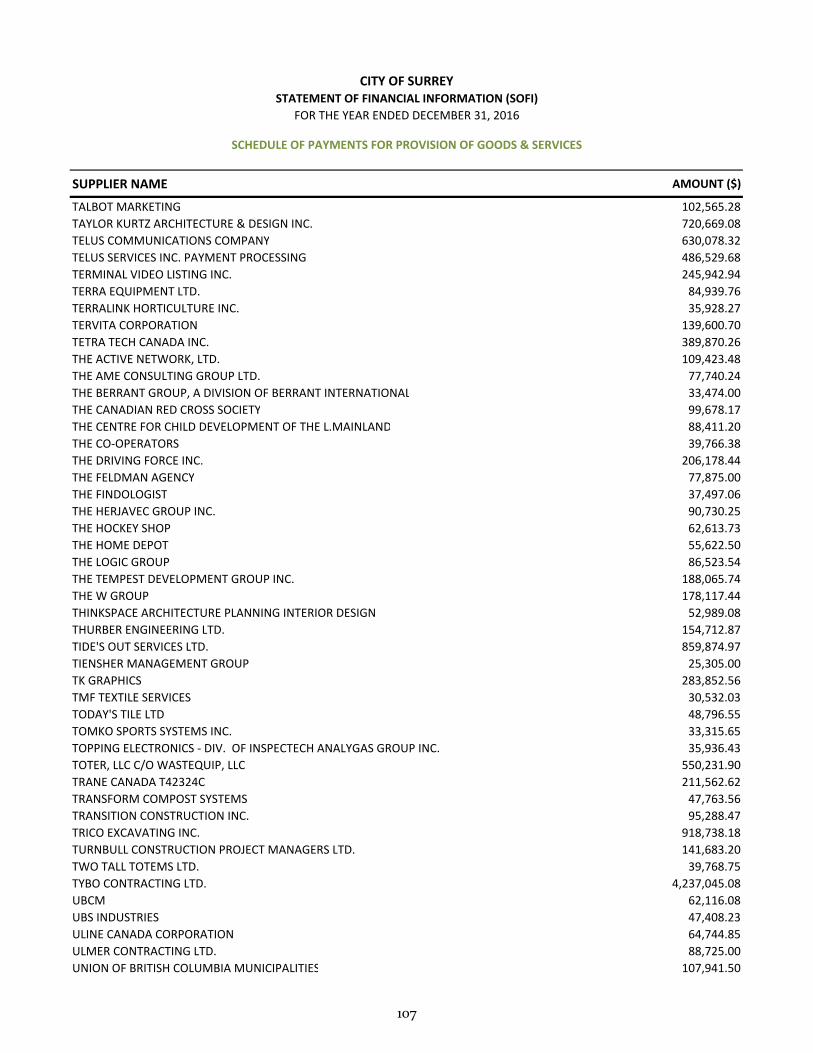
SUPPLIER NAME AMOUNT ($)
CITY OF SURREYSTATEMENT OF FINANCIAL INFORMATION (SOFI)
FOR THE YEAR ENDED DECEMBER 31, 2016
SCHEDULE OF PAYMENTS FOR PROVISION OF GOODS & SERVICES
TALBOT MARKETING 102,565.28
TAYLOR KURTZ ARCHITECTURE & DESIGN INC. 720,669.08
TELUS COMMUNICATIONS COMPANY 630,078.32
TELUS SERVICES INC. PAYMENT PROCESSING 486,529.68
TERMINAL VIDEO LISTING INC. 245,942.94
TERRA EQUIPMENT LTD. 84,939.76
TERRALINK HORTICULTURE INC. 35,928.27
TERVITA CORPORATION 139,600.70
TETRA TECH CANADA INC. 389,870.26
THE ACTIVE NETWORK, LTD. 109,423.48
THE AME CONSULTING GROUP LTD. 77,740.24
THE BERRANT GROUP, A DIVISION OF BERRANT INTERNATIONAL 33,474.00
THE CANADIAN RED CROSS SOCIETY 99,678.17
THE CENTRE FOR CHILD DEVELOPMENT OF THE L.MAINLAND 88,411.20
THE CO‐OPERATORS 39,766.38
THE DRIVING FORCE INC. 206,178.44
THE FELDMAN AGENCY 77,875.00
THE FINDOLOGIST 37,497.06
THE HERJAVEC GROUP INC. 90,730.25
THE HOCKEY SHOP 62,613.73
THE HOME DEPOT 55,622.50
THE LOGIC GROUP 86,523.54
THE TEMPEST DEVELOPMENT GROUP INC. 188,065.74
THE W GROUP 178,117.44
THINKSPACE ARCHITECTURE PLANNING INTERIOR DESIGN 52,989.08
THURBER ENGINEERING LTD. 154,712.87
TIDE'S OUT SERVICES LTD. 859,874.97
TIENSHER MANAGEMENT GROUP 25,305.00
TK GRAPHICS 283,852.56
TMF TEXTILE SERVICES 30,532.03
TODAY'S TILE LTD 48,796.55
TOMKO SPORTS SYSTEMS INC. 33,315.65
TOPPING ELECTRONICS ‐ DIV. OF INSPECTECH ANALYGAS GROUP INC. 35,936.43
TOTER, LLC C/O WASTEQUIP, LLC 550,231.90
TRANE CANADA T42324C 211,562.62
TRANSFORM COMPOST SYSTEMS 47,763.56
TRANSITION CONSTRUCTION INC. 95,288.47
TRICO EXCAVATING INC. 918,738.18
TURNBULL CONSTRUCTION PROJECT MANAGERS LTD. 141,683.20
TWO TALL TOTEMS LTD. 39,768.75
TYBO CONTRACTING LTD. 4,237,045.08
UBCM 62,116.08
UBS INDUSTRIES 47,408.23
ULINE CANADA CORPORATION 64,744.85
ULMER CONTRACTING LTD. 88,725.00
UNION OF BRITISH COLUMBIA MUNICIPALITIES 107,941.50
107
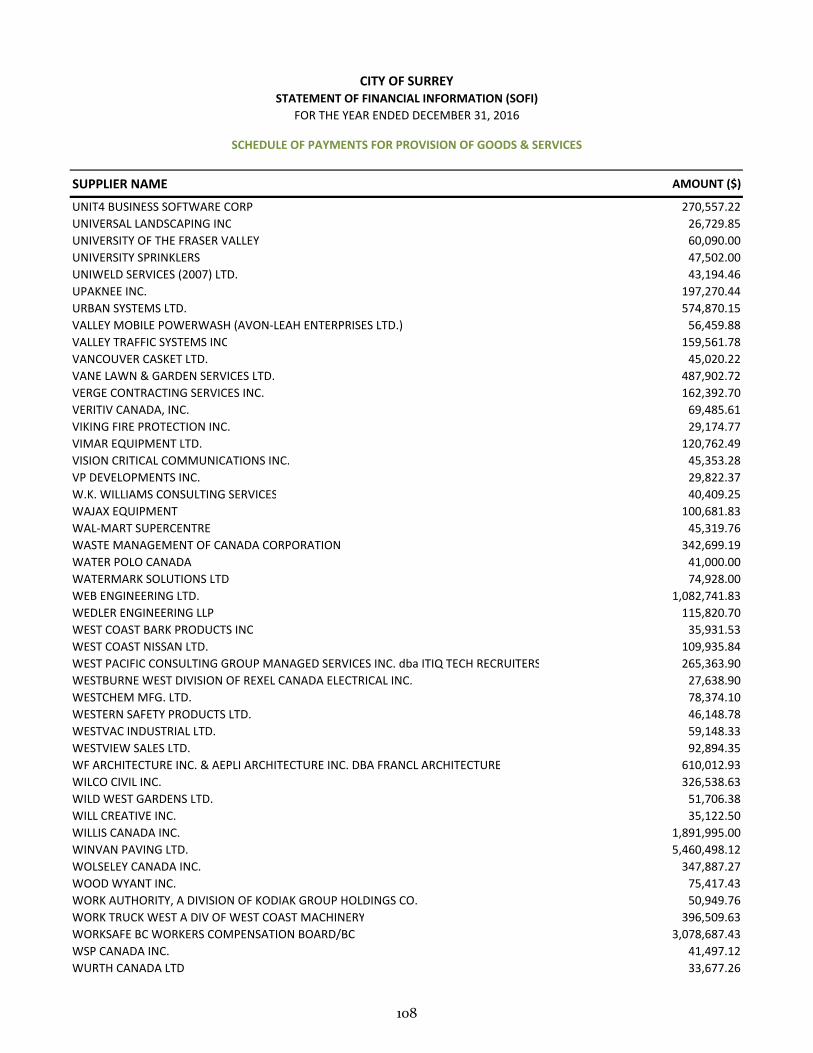
SUPPLIER NAME AMOUNT ($)
CITY OF SURREYSTATEMENT OF FINANCIAL INFORMATION (SOFI)
FOR THE YEAR ENDED DECEMBER 31, 2016
SCHEDULE OF PAYMENTS FOR PROVISION OF GOODS & SERVICES
UNIT4 BUSINESS SOFTWARE CORP 270,557.22
UNIVERSAL LANDSCAPING INC 26,729.85
UNIVERSITY OF THE FRASER VALLEY 60,090.00
UNIVERSITY SPRINKLERS 47,502.00
UNIWELD SERVICES (2007) LTD. 43,194.46
UPAKNEE INC. 197,270.44
URBAN SYSTEMS LTD. 574,870.15
VALLEY MOBILE POWERWASH (AVON‐LEAH ENTERPRISES LTD.) 56,459.88
VALLEY TRAFFIC SYSTEMS INC 159,561.78
VANCOUVER CASKET LTD. 45,020.22
VANE LAWN & GARDEN SERVICES LTD. 487,902.72
VERGE CONTRACTING SERVICES INC. 162,392.70
VERITIV CANADA, INC. 69,485.61
VIKING FIRE PROTECTION INC. 29,174.77
VIMAR EQUIPMENT LTD. 120,762.49
VISION CRITICAL COMMUNICATIONS INC. 45,353.28
VP DEVELOPMENTS INC. 29,822.37
W.K. WILLIAMS CONSULTING SERVICES 40,409.25
WAJAX EQUIPMENT 100,681.83
WAL‐MART SUPERCENTRE 45,319.76
WASTE MANAGEMENT OF CANADA CORPORATION 342,699.19
WATER POLO CANADA 41,000.00
WATERMARK SOLUTIONS LTD 74,928.00
WEB ENGINEERING LTD. 1,082,741.83
WEDLER ENGINEERING LLP 115,820.70
WEST COAST BARK PRODUCTS INC 35,931.53
WEST COAST NISSAN LTD. 109,935.84
WEST PACIFIC CONSULTING GROUP MANAGED SERVICES INC. dba ITIQ TECH RECRUITERS 265,363.90
WESTBURNE WEST DIVISION OF REXEL CANADA ELECTRICAL INC. 27,638.90
WESTCHEM MFG. LTD. 78,374.10
WESTERN SAFETY PRODUCTS LTD. 46,148.78
WESTVAC INDUSTRIAL LTD. 59,148.33
WESTVIEW SALES LTD. 92,894.35
WF ARCHITECTURE INC. & AEPLI ARCHITECTURE INC. DBA FRANCL ARCHITECTURE 610,012.93
WILCO CIVIL INC. 326,538.63
WILD WEST GARDENS LTD. 51,706.38
WILL CREATIVE INC. 35,122.50
WILLIS CANADA INC. 1,891,995.00
WINVAN PAVING LTD. 5,460,498.12
WOLSELEY CANADA INC. 347,887.27
WOOD WYANT INC. 75,417.43
WORK AUTHORITY, A DIVISION OF KODIAK GROUP HOLDINGS CO. 50,949.76
WORK TRUCK WEST A DIV OF WEST COAST MACHINERY 396,509.63
WORKSAFE BC WORKERS COMPENSATION BOARD/BC 3,078,687.43
WSP CANADA INC. 41,497.12
WURTH CANADA LTD 33,677.26
108
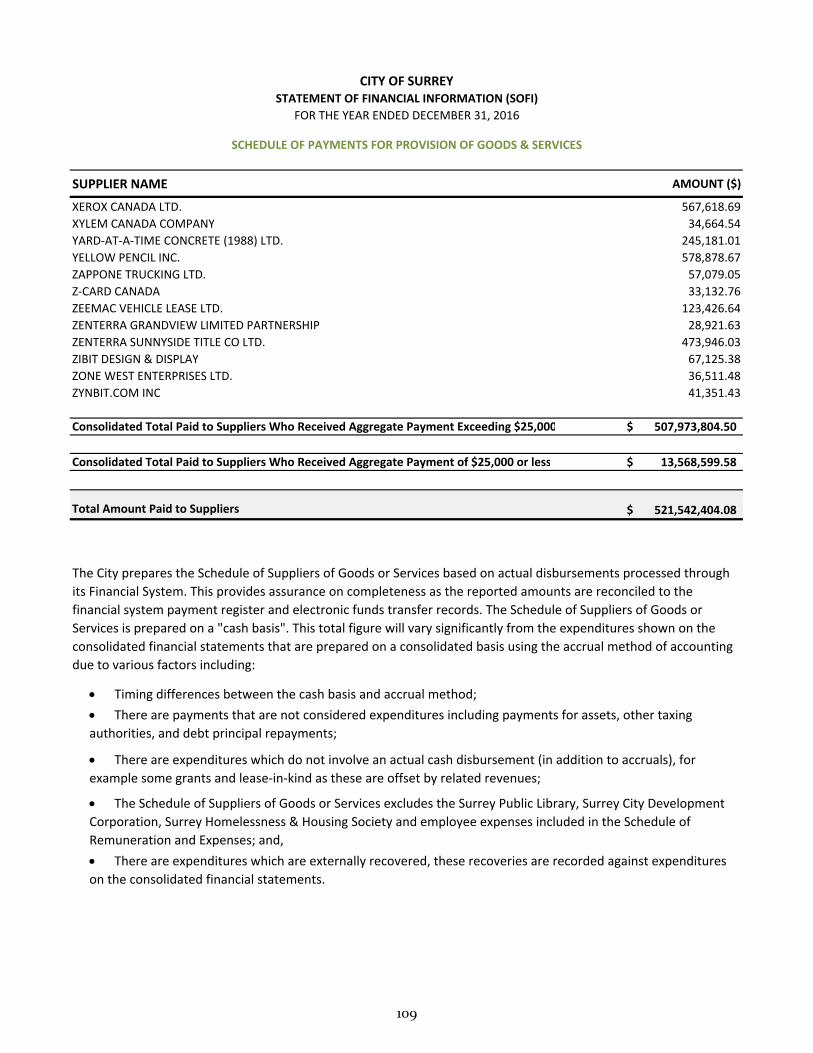
SUPPLIER NAME AMOUNT ($)
CITY OF SURREYSTATEMENT OF FINANCIAL INFORMATION (SOFI)
FOR THE YEAR ENDED DECEMBER 31, 2016
SCHEDULE OF PAYMENTS FOR PROVISION OF GOODS & SERVICES
XEROX CANADA LTD. 567,618.69
XYLEM CANADA COMPANY 34,664.54
YARD‐AT‐A‐TIME CONCRETE (1988) LTD. 245,181.01
YELLOW PENCIL INC. 578,878.67
ZAPPONE TRUCKING LTD. 57,079.05
Z‐CARD CANADA 33,132.76
ZEEMAC VEHICLE LEASE LTD. 123,426.64
ZENTERRA GRANDVIEW LIMITED PARTNERSHIP 28,921.63
ZENTERRA SUNNYSIDE TITLE CO LTD. 473,946.03
ZIBIT DESIGN & DISPLAY 67,125.38
ZONE WEST ENTERPRISES LTD. 36,511.48
ZYNBIT.COM INC 41,351.43
Consolidated Total Paid to Suppliers Who Received Aggregate Payment Exceeding $25,000 507,973,804.50$
Consolidated Total Paid to Suppliers Who Received Aggregate Payment of $25,000 or less 13,568,599.58$
Total Amount Paid to Suppliers 521,542,404.08$
There are payments that are not considered expenditures including payments for assets, other taxing
authorities, and debt principal repayments;
There are expenditures which do not involve an actual cash disbursement (in addition to accruals), for
example some grants and lease‐in‐kind as these are offset by related revenues;
The Schedule of Suppliers of Goods or Services excludes the Surrey Public Library, Surrey City Development
Corporation, Surrey Homelessness & Housing Society and employee expenses included in the Schedule of
Remuneration and Expenses; and,
There are expenditures which are externally recovered, these recoveries are recorded against expenditures
on the consolidated financial statements.
The City prepares the Schedule of Suppliers of Goods or Services based on actual disbursements processed through
its Financial System. This provides assurance on completeness as the reported amounts are reconciled to the
financial system payment register and electronic funds transfer records. The Schedule of Suppliers of Goods or
Services is prepared on a "cash basis". This total figure will vary significantly from the expenditures shown on the
consolidated financial statements that are prepared on a consolidated basis using the accrual method of accounting
due to various factors including:
Timing differences between the cash basis and accrual method;
109
City of Surrey Statement of Financial Information (SOFI) Schedule of Grants Section 9
2016 Statement of Financial Information
Regulations require the City of Surrey to report the total amount paid for grants and contributions that exceeds $25,000 in the year reported. Prepared under the Financial Information Regulation, Schedule 1, subsection 7(2)(b)
110
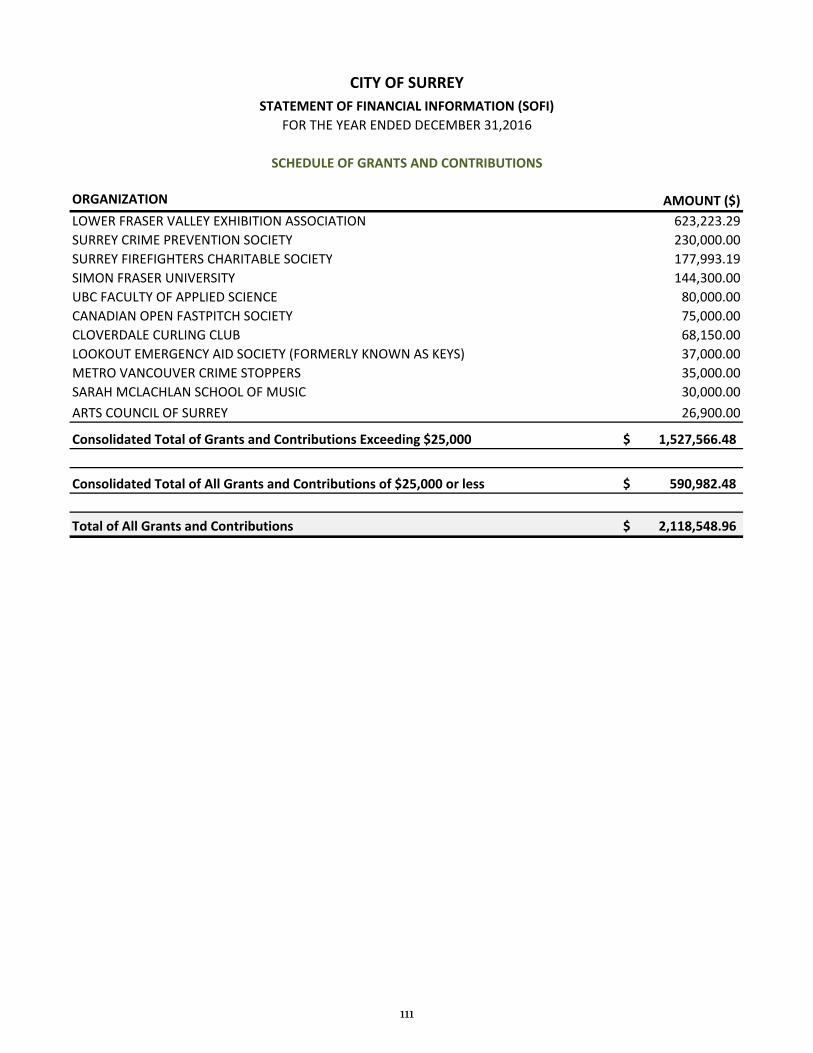
ORGANIZATION AMOUNT ($)
LOWER FRASER VALLEY EXHIBITION ASSOCIATION 623,223.29
SURREY CRIME PREVENTION SOCIETY 230,000.00
SURREY FIREFIGHTERS CHARITABLE SOCIETY 177,993.19
SIMON FRASER UNIVERSITY 144,300.00
UBC FACULTY OF APPLIED SCIENCE 80,000.00
CANADIAN OPEN FASTPITCH SOCIETY 75,000.00
CLOVERDALE CURLING CLUB 68,150.00
LOOKOUT EMERGENCY AID SOCIETY (FORMERLY KNOWN AS KEYS) 37,000.00
METRO VANCOUVER CRIME STOPPERS 35,000.00
SARAH MCLACHLAN SCHOOL OF MUSIC 30,000.00
ARTS COUNCIL OF SURREY 26,900.00
Consolidated Total of Grants and Contributions Exceeding $25,000 1,527,566.48$
Consolidated Total of All Grants and Contributions of $25,000 or less 590,982.48$
Total of All Grants and Contributions 2,118,548.96$
CITY OF SURREY
SCHEDULE OF GRANTS AND CONTRIBUTIONS
FOR THE YEAR ENDED DECEMBER 31,2016
STATEMENT OF FINANCIAL INFORMATION (SOFI)
111
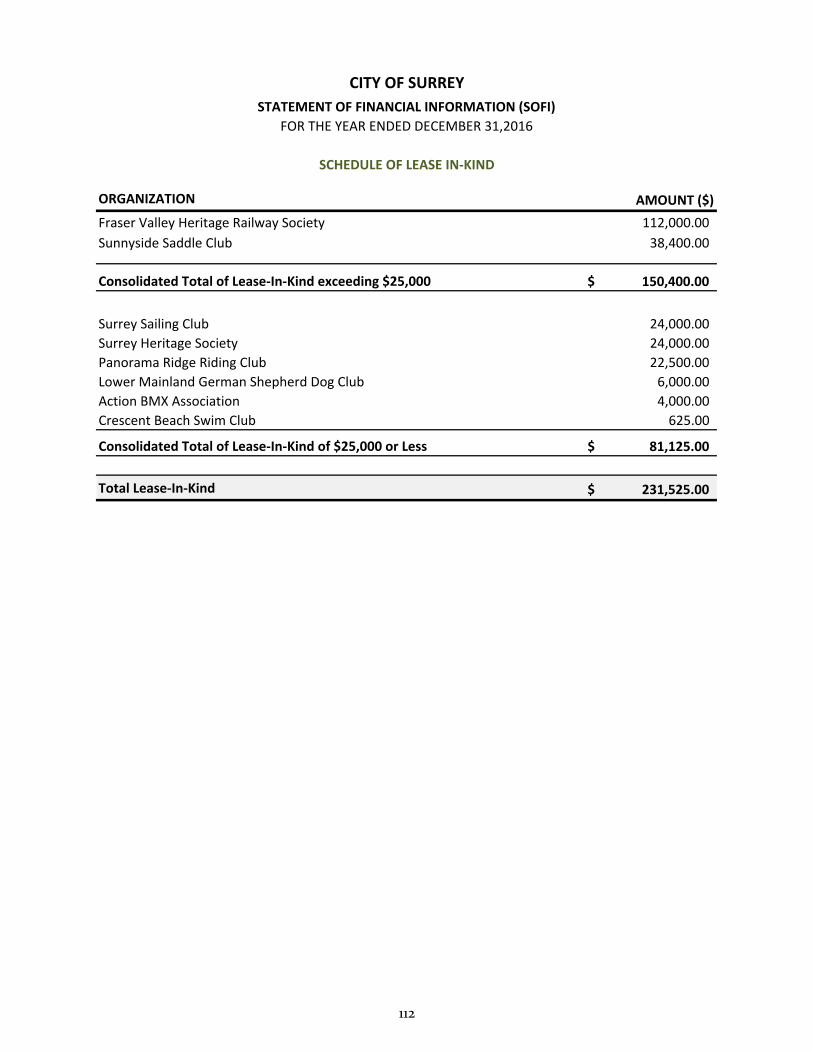
ORGANIZATION AMOUNT ($)
Fraser Valley Heritage Railway Society 112,000.00
Sunnyside Saddle Club 38,400.00
Consolidated Total of Lease‐In‐Kind exceeding $25,000 150,400.00$
Surrey Sailing Club 24,000.00
Surrey Heritage Society 24,000.00
Panorama Ridge Riding Club 22,500.00
Lower Mainland German Shepherd Dog Club 6,000.00
Action BMX Association 4,000.00
Crescent Beach Swim Club 625.00
Consolidated Total of Lease‐In‐Kind of $25,000 or Less 81,125.00$
Total Lease‐In‐Kind 231,525.00$
CITY OF SURREY
SCHEDULE OF LEASE IN‐KIND
FOR THE YEAR ENDED DECEMBER 31,2016
STATEMENT OF FINANCIAL INFORMATION (SOFI)
112