Embed Size (px)
Citation preview

ARTICLE IN PRESS
0022-5193/$ - se
doi:10.1016/j.jtb
�CorrespondE-mail addr
Journal of Theoretical Biology 251 (2008) 297–316
www.elsevier.com/locate/yjtbi
Understanding cyclical thrombocytopenia:A mathematical modeling approach
Raluca Apostua,�, Michael C. Mackeyb
aDepartment of Mathematics and Statistics & Centre for Nonlinear Dynamics in Physiology and Medicine, McGill University,
3655 Promenade Sir William Osler, Montreal, QC, Canada H3G 1Y6bDepartments of Physiology, Physics & Mathematics and Centre for Nonlinear Dynamics in Physiology and Medicine, McGill University,
3655 Promenade Sir William Osler, Montreal, QC, Canada, H3G 1Y6
Received 14 August 2007; received in revised form 16 November 2007; accepted 26 November 2007
Available online 11 January 2008
Abstract
Cyclical thrombocytopenia (CT) is a rare hematological disease characterized by periodic oscillations in the platelet count. Although
first reported in 1936, the pathogenesis and an effective therapy remain to be identified. Since besides fluctuations in platelet levels the
patients hematological profile have been consistently normal, a destabilization of a peripheral control mechanism might play an
important role in the genesis of this disorder. In this paper, we investigate through computer simulations the mechanisms underlying the
platelet oscillations observed in CT. First, we collected the data published in the last 40 years and quantified the significance of the
platelet fluctuations using Lomb–Scargle periodograms. Our analysis reveals that the incidence of the statistically significant periodic
data is equally distributed in men and women. The mathematical model proposed in this paper captures the essential features of
hematopoiesis and successfully duplicates the characteristics of CT. With the same parameter changes, the model is able to fit the platelet
counts and to qualitatively reproduce the TPO oscillations (when data is available). Our results indicate that a variation in the
megakaryocyte maturity, a slower relative growth rate of megakaryocytes, as well as an increased random destruction of platelets are the
critical elements generating the platelet oscillations in CT.
r 2007 Elsevier Ltd. All rights reserved.
Keywords: Cyclical thrombocytopenia; Platelet oscillations; Delay differential equations; Spectral data analysis; Mathematical model
1. Introduction
All blood cells arise from a common origin in the bonemarrow, the hematopoietic stem cells (HSC). HSC aremorphologically undifferentiated cells which can eitherproliferate or differentiate to produce all types of bloodcells (erythrocytes, neutrophils and platelets). The prolif-eration of the stem cells and progenitor cells is controlledby a negative feedback system mediated by hematopoieticcytokines. Erythropoietin (EPO) is the hormone thatmediates the RBC production, granulocyte colony stimu-lating factor (G-CSF) controls the regulation of neutro-phils, and thrombopoietin (TPO) known as C-Mpl ligand
e front matter r 2007 Elsevier Ltd. All rights reserved.
i.2007.11.029
ing author. Tel.: +1514 398 8092; fax: +1 514 398 7452.
ess: [email protected] (R. Apostu).
or megakaryocyte growth and development factor, is theprimary regulator of thrombopoiesis.Hematopoiesis is a homeostatic system and, conse-
quently, most disorders of its regulation lead to chronicfailures in the production of either all or only one bloodcell type. Among the wide range of diseases affecting theblood cells, there are some which are characterized bypredictable oscillations in one or more cellular elements ofthe blood. They are called periodic or dynamical diseases(Glass and Mackey, 1988). The investigation of theirdynamic character offers an opportunity to enrich ourknowledge about some regulation processes of bloodcell production and may suggest better therapeutic stra-tegies (Foley et al., 2006). Cyclical neutropenia (Colijn andMackey, 2005a; Haurie et al., 1998, 1999, 2000), periodicchronic myelogenous leukemia (Colijn and Mackey,2005a; Fortin and Mackey, 1999), periodic autoimmune

ARTICLE IN PRESSR. Apostu, M.C. Mackey / Journal of Theoretical Biology 251 (2008) 297–316298
hemolytic anemia (Mackey and Glass, 1977) and cyclicalthrombocytopenia (CT) (Swinburne and Mackey,2000) are some classical examples of dynamical hemato-logical diseases. Diseases like periodic chronic myelogen-ous leukemia (PCML) and cyclical neutropenia (CN),which involve fluctuations in all major blood cell lineswith the same period on a given subject, are believed toarise in the stem cell compartment in the bonemarrow. Since in CT or periodic autoimmune hemolyticanemia besides oscillations in one type of cell count thepatients hematological profile have been consistentlynormal, a destabilization of a peripheral control mechan-ism might play an important role in the genesis of thisdisorders.
Of particular interest in this paper is CT. CT is a rarehematological disorder described mostly in adults andcharacterized by periodic platelet count fluctuations ofunknown etiology. It seems to occur predominantly inwomen but the incidence of the statistically significantperiodic platelet data is equally distributed between menand women. Sometimes this disease is associated withbleeding symptoms which have no apparent cause otherthan thrombocytopenia (low platelet count): purpura,petechiae, epitaxis, gingival bleeding, menorrhagia, easybruising and gastrointestinal bleeding. Although, in gen-eral, human platelet levels remain relatively stable for years(150� 1092450� 109 platelets=L with an average of290� 109 platelets=L), many factors can influence anindividual’s platelet count (e.g. exercise, racial origin, somediseases, pregnancy). In CT the platelet counts oscillatefrom very low ð1� 109 platelets=LÞ to normal or very highlevels ð2000� 109 platelets=LÞ. This hematological disorderwas reviewed by Go (2005), Swinburne and Mackey (2000),Cohen and Cooney (1974), and has been the subject ofmathematical modeling (Santillan et al., 2000; VonSchulthess and Gessner, 1986). Our goal is to investigatethrough computer simulations CT and to formulate ahypothesis of the mechanisms underlying the plateletfluctuations. For this purpose we develop a mathematicalmodel which captures the essential characteristics ofhematopoiesis and offers an advantage comparable withthe earlier models consisting of one cell line or one linecoupled to the stem cells.
This paper is organized as follows. Section 1 presents abrief overview of CT. In Section 2 we quantify the plateletoscillations using Lomb–Scargle periodograms. The math-ematical model developed in Section 4 is used to explorethe origin of the rhythmic fluctuations which characterizeCT. A detailed numerical analysis of the model dynamicsallows us to zoom in the parameter space, and to identifythe parameters with essential role in generating a modelresponse similar with CT data (Section 4.1). Section 4.2reveals that the hematopoietic model successfully dupli-cates the platelet counts of CT patients, and provides aqualitative fitting of the TPO levels when they wereavailable. The biological interpretation of the results, thecomparison with the clinical findings, and the conclusions
drawn from the previous modeling effort are presented inthe last two sections.
1.1. Cyclical thrombocytopenia
Since the first report of Minot (1936), many CT patientshave been described. Searching the English literature from1962 to 2005 we found 38 well-documented cases of plateletfluctuations (34 putative patients and four healthy indivi-duals). All the reports have been sporadic, except for anapparently unique family described by Aranda andDorantes (1977), in which the platelet cycling was observedin four out of nine siblings and their father. Some of thesestudies presented patients without any treatment (Arandaand Dorantes, 1977; Lewis, 1974; Rice et al., 2001;Wilkinson and Firkin, 1966; Zent et al., 1999), and othersdescribed subjects undergoing various therapies.The pathogenesis of CT is poorly understood and
various mechanism have been proposed. The clinicalfindings suggest at least two pathways: immune-mediatedplatelet destruction (autoimmune CT) and megakaryocytedeficiency and cyclical failure in platelet production(amegakaryocytic CT). Autoimmune CT is thought to bean unusual form of immune thrombocytopenia purpura(ITP) and is more common in females. The hematologicalprofile of most of these patients reveals high levels ofantiplatelet antibodies, shorter platelet lifespan at theplatelet nadir and normal to high levels of marrowmegakaryocytes. Amegakaryocytic CT is postulated to bea variant of acquired amegakaryocytic thrombocytopenicpurpura and is mainly characterized by the absence ofmegakaryocytes in the thrombocytopenia phase andincreased megakaryocyte number during thrombocytosis.Serial tests for serum antiplatelet antibodies are negativeand the platelet lifespan is normal. To determine the causeof cyclic megakaryocytopenia, Nagasawa et al. (1998)examined the integrity of the megakaryocyte progenitorcompartment just prior to the nadir and the peak ofplatelet cycle. They noticed that in the autoimmune casethe mean size of megakaryocytes does not change with thecyclic variations in the platelet count, while in patients withthe amegakaryocytic variety the number of colony-formingunit-megakaryocyte (CFU-Meg), the megakaryocyte num-ber, and the cytoplasmic area fluctuated with the plateletcycle. In all reported cases, except for Fureder et al. (2002)and Menitove et al. (1989), besides oscillations in plateletcount, the patient’s hematological profile has been con-sistently normal. The peripheral red and white blood cellcounts were within the normal range, and the blood smearshows no morphological abnormalities or platelet clumps.In the case presented by Fureder et al. (2002), erythropoi-esis and granulopoiesis were slightly affected. The Meni-tove et al. (1989) patient manifested a severe iron deficiencywith anemia and reticulocytosis. A synchronization be-tween the fluctuations in the platelet count and menses hasbeen reported in some female patients (Helleberg, 1995;Minot, 1936; Tomer et al., 1989). The fact that CT occurs

ARTICLE IN PRESSR. Apostu, M.C. Mackey / Journal of Theoretical Biology 251 (2008) 297–316 299
also in men and females after menopause indicates that thepathogenesis of this disorder is not necessarily related tothe menstrual cycle. For example, Cohen and Cooney(1974) observe that platelet cycles are in phase with theirpatient’s menstrual cycle only when she was underexogenous hormone therapy, while other groups ofinvestigators (Hoffman et al., 1989; Menitove et al., 1989;Yanabu et al., 1993) report no correlation between plateletoscillations and menses.
2. Spectral analysis of platelet data
We tested all data sets for the presence of statisticallysignificant periodicity in the platelet counts. Since the timeseries are unevenly sampled and may contain randommeasurement errors, the best way of extracting informationabout the oscillatory components is through Lomb–Scargleperiodogram (Lomb, 1976; Scargle, 1982; Press et al.,1993). Specifically, let xj be the concentration of theplatelets as measured at time tj , j ¼ 1;N, where N is thenumber of total data points. As usual, the mean andvariance of data values are defined by
x ¼1
N
XN
j¼1
xj and s2 ¼1
N � 1
XN
j¼1
ðxj � xÞ2.
The Lomb–Scargle periodogram (also called Lomb nor-malized periodogram) defines the spectral power PðoÞ as afunction of the angular frequency o ¼ 2pf by the followingformula:
PðoÞ ¼1
2s2ðPN
j¼1 ðxj � xÞ cosoðtj � rÞÞ2PNj¼1 cos
2oðtj � rÞ
(
þðPN
j¼1 ðxj � xÞ sinoðtj � rÞÞ2PNj¼1 sin
2oðtj � rÞ
), ð1Þ
where r is a constant defined implicitly by
tanð2orÞ ¼
PNj¼1 sinð2otjÞPNj¼1 cosð2otjÞ
.
The value of PðoÞ indicates the likelihood of a periodicitywith period P ¼ 2p
o ¼1fin the data set. To determine the
presence or absence of a periodic signal we need to quantifythe significance of a peak in the periodogram. Given thenull hypothesis that the values xj are independent Gaussianrandom values, and that PðoÞ has an exponential prob-ability distribution with unit mean, the significance level p
of every peak in a periodogram is given by
p ¼ 1� ð1� e�PðoÞÞM , (2)
where M represents the number of independent frequen-cies. In our work, an individual data set is consideredperiodic if the significance level p of the principal peak inthe periodogram is less than 0.05.
The spectral analysis of the platelet counts is displayedgraphically in Appendix A, where each data set is identified
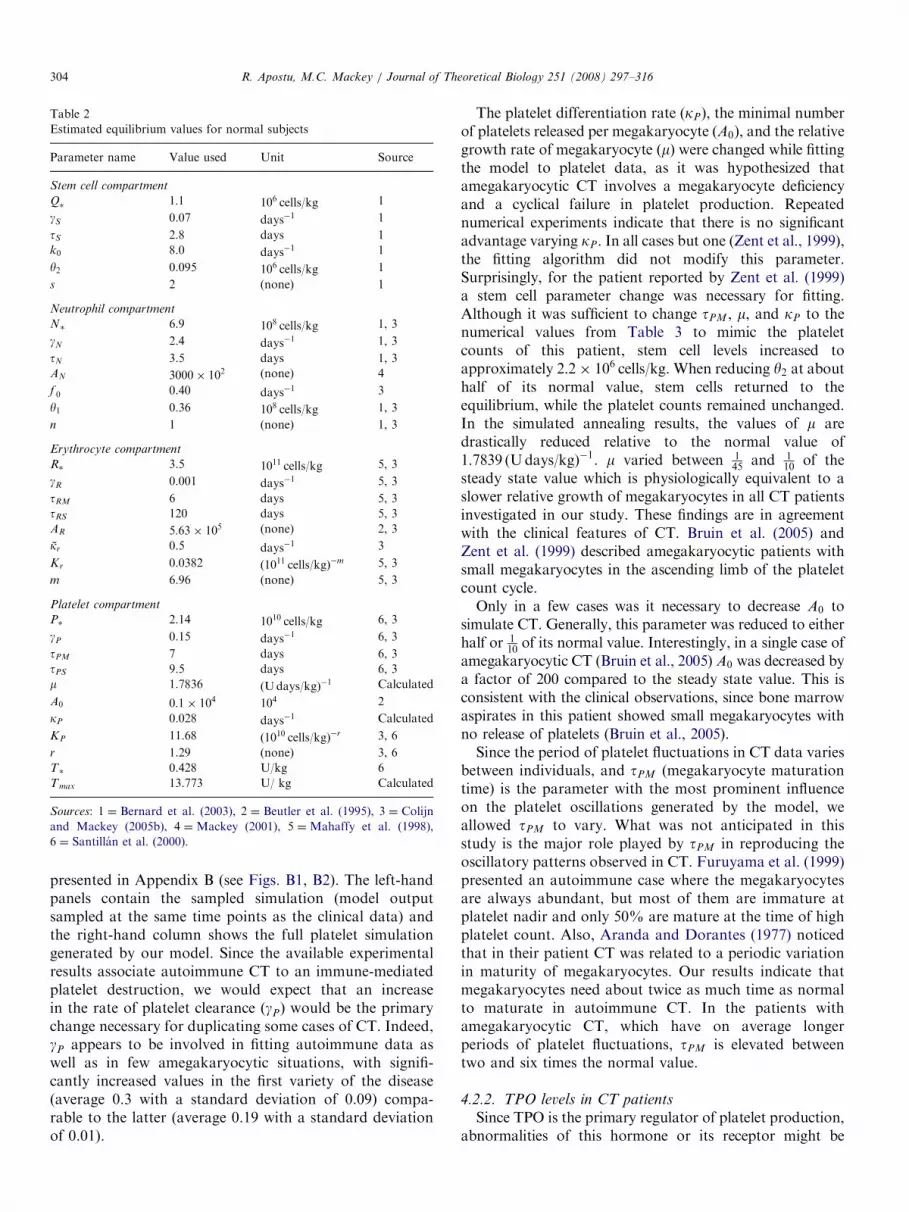
as to source. Based on our criterion for statisticalsignificance, only 22 out of 38 data sets are significantlyperiodic (11 males and 11 females). The period of plateletoscillations varies between individuals, with a shorteraverage period in women (26� 10 days) compared tomen (35� 12 days). There is a connection between thepatient’s diagnosis and the range of significant periods ofplatelet variations. The oscillations in autoimmune datahave periods ranging from 13 to 31 days which, on average,are shorter than the periods in amegakaryocytic cases.The latter vary from 19 to 64 days. Table 1 summarizes theresults of our data analysis. For each patient we specify thesex, the diagnosis, and the significant period(s).
3. A mathematical model of hematopoiesis
Recently, Colijn and Mackey (2005b) synthesized a G0-type model for the HSC dynamics (Mackey, 1978) with themathematical models for leukocyte (Bernard et al., 2003;Haurie et al., 2000; Hearn et al., 1998), erythrocyte (Belairet al., 1995; Mackey, 1979; Mahaffy et al., 1998), andplatelet production (Belair and Mackey, 1987; Santillanet al., 2000) into a comprehensive model of hematopoiesis.Since their model has been shown to display the features oftwo dynamical diseases (CN in Colijn and Mackey, 2005aand PCML in Colijn and Mackey, 2005b), we chose it as astarting point in our quantitative investigation of CT.Extensive numerical experiments showed that any inducedoscillations in the platelet compartment destabilize theneutrophil line. Our successive attempts lead to theconclusion that the hematopoietic model in this formcannot generate oscillatory solutions in platelet compart-ment while maintaining all the other variables at theirsteady state levels. The main cause of this phenomenon isthe assumed dependence of the platelet differentiation rateon the number of circulating platelets. Since the molecularmechanisms of platelet regulation are not completelyelucidated, given the similarities between erythropoiesisand thrombopoiesis, the authors assumed that the plateletdifferentiation rate follows the same mechanism as in thecase of erythrocytes, and depends on the number ofcirculating cells. Searching the literature, we found thatexperimental data suggests that the megakaryocyte com-partment is maintained by an approximately constantinflux of progenitor cells (Branehog et al., 1975). Therefore,in our modeling work, we assume that the plateletdifferentiation rate is constant. For this reason, we willderive a new equation for the platelet dynamics and whilemaintaining the structure of the stem cell, neutrophil anderythrocyte compartments given in Colijn and Mackey(2005b) (see Fig. 1 for a cartoon representation). In thefollowing, we present a brief model development, with aparticular emphasis on the platelet compartment. Thepluripotential, non-proliferating stem cells, the circulatingneutrophils, platelets and erythrocytes are denoted by Q,N, P and R, respectively. We adopt the notationconvention X tðtÞ :¼ X ðt� tÞ for any variable X.

ARTICLE IN PRESS
Fig. 1. The mathematic model of hematopoiesis. Solid arrows show the
movement of cells, while dashed lines reflect the feedback functions.
Table 1
Inventory of the CT patients
Source and patient ID Sex Diagnosis Mean of the data Significant
ð�1010 cells/kgÞ period(s) (days)
Fogarty et al. (2005) M AI 1.7741 46
Rice et al. (2001) F AI&AM 0.1042 27
Kimura et al. (1996) M AI&AM 1.579 37 and 9
Helleberg (1995) F AI 0.9059 27
Kosugi et al. (1994) F AI 0.3290 25
Yanabu et al. (1993) F AI 1.9507 24
Rocha et al. (1991) F AI 1.0455 21 and 10
Menitove et al. (1989) F AI 1.1452 13
Skoog et al. (1957) F AI 0.5625 26
Bruin et al. (2005) M AM 0.6304 27
Fureder et al. (2002) F AM 1.7806 27
Zent et al. (1999) M AM 0.7267 30
Hoffman et al. (1989) F AM 1.1260 64
Aranda and Dorantes (1977) M AM 1.0984 29
Cohen and Cooney (1974) F AM 0.8064 30
Wilkinson and Firkin (1966) M AM 1.8701 41
Wasastjerna (1967) M AM 1.1354 23
Engstrom et al. (1966) M AM 1.7984 43
Von Schulthess and Gessner (1986),
case 1
M Healthy 1.9858 23
Von Schulthess and Gessner (1986),
case 2
M Healthy 2.9230 31 and 49
Morley (1969), subject 8 M Healthy 1.7704 31
Lewis (1974) F C-TPO 0.9180 23
AI indicates autoimmune CT, AM denotes amegakaryocytic CT diagnosis, C-TPO stands for cycling TPO levels, and ‘‘healthy’’ are the asymptomatic
patients.
R. Apostu, M.C. Mackey / Journal of Theoretical Biology 251 (2008) 297–316300
3.1. Model development
3.1.1. Stem cell compartment
The stem cells in the resting phase (or G0 phase) of the cellcycle do not divide. There are only two ways that they can exit
the non-proliferating compartment: either enter the proliferat-ing phase at a rate bðQÞ or differentiate into erythrocytes,neutrophils and platelets at rate kR, kN and kP, respectively.After re-entering the proliferating phase, the cells divide, takinga time tS to do so. Immediately after, the two daughter cellsmove into the resting phase. Using this notation, we can writea balance equation for the rate of change of HSC number asthe difference between their production and their loss:
dQ
dt¼ �bðQÞQ|fflfflfflfflffl{zfflfflfflfflffl}
movement intoproliferation
� ðkNðNÞ þ kPðPÞ þ kRðRÞÞQ|fflfflfflfflfflfflfflfflfflfflfflfflfflfflfflfflfflfflfflfflfflfflfflffl{zfflfflfflfflfflfflfflfflfflfflfflfflfflfflfflfflfflfflfflfflfflfflfflffl}loss due to differentiation
þ 2e�gStSbðQtSÞQtS|fflfflfflfflfflfflfflfflfflfflfflfflffl{zfflfflfflfflfflfflfflfflfflfflfflfflffl}
cells reenteringthe G0 compartment
.
3.1.2. Platelet compartment
Once a cell is committed to this pathway, it undergoes aseries of nuclear divisions until it reaches the stage ofmegakaryocyte, which no longer proliferates but undergoesendoreduplication. A megakaryocyte needs tPM days tomature and to release platelets into circulation. After tPS
days the platelets are primarily lost to senescence at a rateof gP per day. Colijn and Mackey (2005b) described theplatelet variation by the following DDE:
dP
dt¼ � gPPþ APfkPðPtPM
ÞQtPM
� e�gPtPSkPðPtPMþtPSÞQtPMþtPS
g,

ARTICLE IN PRESSR. Apostu, M.C. Mackey / Journal of Theoretical Biology 251 (2008) 297–316 301
where the platelet differentiation rate kP is given by
kPðPÞ ¼kr
1þ KPPr.
In our work, we assume that the platelet differentiationrate is constant, and we use
dP
dt¼ �gPPþ APkPðQtPM
� e�gPtPS QtPMþtPSÞ. (3)
to model the platelet dynamics. The main agent controllingthe peripheral platelet regulatory system through AP (theaverage number of platelets released per megakaryocyte) isTPO. Let V ðtÞ denote the megakaryocyte volume and TðtÞ
the TPO concentration at the time t. The availableexperimental data suggests that
(i)
APðtÞ / V ðtÞ and (ii) V ðtÞ obeys the ordinary differential equationdVdtðtÞ ¼ mTðtÞV ðtÞ.
From this we obtain:
V ðtÞ ¼ V ðt� tPM ÞemR t
t�tPMTðt0Þ dt0
.
Since the differentiation rate kP is constant we can considerV ðt� tPMÞ ¼ V 0. Hence
APðtÞ ¼ A0emR t
t�tPMTðt0Þ dt0
,
where A0 denotes the minimal number of plateletsproduced per megakaryocyte. Note that
TðtÞ :¼1
tPM
Z t
t�tPM
Tðt0Þdt0
represents the average TPO concentration at the time t.Hence
APðtÞ ¼ A0emtPM TðtÞ.
Santillan et al. (2000) model the TPO concentration underthe assumption that the number of megakaryocytes of agezero entering from the stem cell compartment is directlyproportional to the TPO levels. They find
dT
dt¼
a
1þ KPPr � kT .
Additionally, if we consider that TPO concentration is indynamic equilibrium with the number of circulatingplatelets then dT
dt¼ 0. Therefore
T /1
1þ KPPr; which implies T ¼Tmax
1þ KPPr.
Tmax represents the maximum TPO level in blood.
3.1.3. Erythrocyte compartment
The erythrocyte and platelet dynamics share commonfeatures and display some important differences. The primarydifference between erythropoiesis and thrombopoiesis is
related to the development of the precursor cells. Inerythropoiesis, the stem cells undergo rapid proliferationand differentiation until they become reticulocyte, whichmature and become circulating erythrocytes. Therefore thetotal variation of erythrocytes is described by
dR
dt¼ �gRR|fflffl{zfflffl}
random loss
þARkRðRtRMÞQtRM|fflfflfflfflfflfflfflfflfflfflfflfflffl{zfflfflfflfflfflfflfflfflfflfflfflfflffl}
cells entering from thestem cell compartment
� ARe�gRtRSkRðRtRMþtRS
ÞQtRMþtRS|fflfflfflfflfflfflfflfflfflfflfflfflfflfflfflfflfflfflfflfflfflfflfflfflfflfflfflffl{zfflfflfflfflfflfflfflfflfflfflfflfflfflfflfflfflfflfflfflfflfflfflfflfflfflfflfflffl}loss due to senescence
.
All the notation (except for AR) is analogous to that inEq. (3). AR is a dimensionless parameter corresponding tothe amplification stage due to cell division.
3.1.4. Neutrophil compartment
As the neutrophil precursors differentiate, their numberis amplified by a constant factor AN which accounts for thestages of cell division. After tN days they become matureand are released into circulation. The neutrophils arerandomly lost at the rate gN . Their dynamics is governed bythe equation:
dN
dt¼ �gNN|fflfflffl{zfflfflffl}
random loss
þANkNðNtNÞQtN|fflfflfflfflfflfflfflfflfflfflfflffl{zfflfflfflfflfflfflfflfflfflfflfflffl}
cells entering from thestem cell compartment
.
We adopt the same form of the negative feedback functionsfor the erythrocyte ðkRðRÞÞ and neutrophil ðkN ðNÞÞ
compartments, as well as the form of the stem cell reentryrate ðbðQÞÞ as in Colijn and Mackey (2005b). They are theresult of the previous modeling work (Bernard et al., 2003;Mahaffy et al., 1998; Mackey, 1979) and are consistentwith the physiological framework.Summarizing, the equations comprising the model are:
dQ
dt¼ �ðbðQÞ þ kNðNÞ þ kP þ kRðRÞÞQ
þ2e�gStSbðQtSÞQtS
;
dN
dt¼ �gNN þ ANkNðNtN
ÞQtN;
dR
dt¼ �gRRþ ARðkRðRtRM
ÞQtRM
�e�gRtRSkRðRtRMþtRSÞQtRMþtRS
Þ;
dP
dt¼ �gPPþ APkPðQtPM
� e�gPtPS QtPMþtPSÞ;
8>>>>>>>>>>>>>>>><>>>>>>>>>>>>>>>>:
(4)
where
bðQÞ ¼ k0ys2
ys2 þQs; T ¼
Tmax
1þ KPPr,
kN ðNÞ ¼ f 0
yn1
yn1 þNn; APðtÞ ¼ A0e
mtPM TðtÞ,
kRðRÞ ¼kr
1þ KrRm; TðtÞ ¼
1
tPM
Z t
t�tPM
Tðt0Þdt0.
ARTICLE IN PRESSR. Apostu, M.C. Mackey / Journal of Theoretical Biology 251 (2008) 297–316302
3.2. Parameter estimation
The parameter estimation is one of the most importantaspects of our modeling work since the biologicallyrelevant choice of the parameters is crucial to establishthe onset of oscillations observed in CT. Using experi-mental data published in the literature we evaluate all theparameters outside the negative feedback functions.Bernard et al. (2003) derived all the values correspondingto the stem cell and leukocyte compartments. We use theirevaluations except for the dimensionless amplificationparameter AN and the Hill coefficient f 0. AN has beenestimated by Mackey (2001) as 300,000 and we use thisvalue. The normal range for f 0 is 0:4� 1:5 (Bernard et al.,2003). Bernard et al. (2003) chose f 0 ¼ 0:8 to make themodel fit the data. Since our model estimates
f 0 ¼ kðN�Þy1 þN�
y1¼
gNN�
ANQ��
y1 þN�
y1¼ 0:4,
we set f 0 ¼ 0:4.The erythrocyte parameters are evaluated by Mahaffy et
al. (1998) based on experimental human data. To theirestimates we add the dimensionless amplification para-meter AR ¼ 563; 000 (Beutler et al., 1995; Colijn andMackey, 2005b), and the Hill coefficient kr estimated inColijn and Mackey, 2005b as 1:1 days�1.
Santillan et al. (2000) give the normal values of gP, tPM ,tPS and the mean platelet count P� ¼ 2:5� 108 cells/ml.Using the fact that 70 kg adult has 6 L of blood (Colijn andMackey, 2005b) we find P� ¼ 2:14� 1010 cells/kg. For theplatelet control dynamics we need to estimate the effectivegrowth rate of megakaryocytes ðmÞ, the minimum numberof platelets produced per megakaryocyte ðA0Þ, the differ-entiation rate ðkPÞ, and the maximum TPO concentrationðTmaxÞ. Experimental measurements show that one maturemegakaryocyte can give rise to 1000–5000 platelets (Beutleret al., 1995). Therefore we choose A0 ¼ 1000 platelets permegakaryocyte. By fitting the TPO concentrations versusthe platelet count, Santillan et al. (2000) evaluate
T� ¼ 0:005U/ml; Tmax ¼ 32:18T�; KP ¼31:18
ðP�Þr ,
and r ¼ 1:29.
Converting to cells/kg we obtain
T� ¼ 0:428U/kg; Tmax ¼ 13:773U/kg
and KP ¼ 11:66� ð1010 cells/kgÞ�r.
Deriving the model parameters we have to make sure thatthere is a balance between the influx and the efflux from theresting phase of the stem cell compartment. Mathemati-cally, this means that at steady state the following relationshould be satisfied
�ðk�R þ k�N þ kPÞ þ 2e�gStSb� ¼ 0.
The above equation determines the normal value of theplatelet differentiation rate:
kP ¼ ð2e�gStS � 1Þb� � k�R � k�N ¼ 0:028 days�1.
Once all the other parameters are estimated, it is easy toevaluate the effective growth rate of megakaryocytes:
m ¼1
T�tPM
lnAP�
A0¼
1
T�tPM
lngPP�
kPA0Q�ð1� e�gPtPS Þ
¼ 1:7836 (U days/kg)�1.
4. Simulating CT
First, we want to understand the model dynamics bylooking at the influence of each parameter on the stabilityof the steady state, and by analyzing the changes in theamplitude and the period of oscillations once stability islost. Periodic hematological diseases like PCML and CN,which involve fluctuations in all blood cell lines, arebelieved to arise in the stem cell compartment in the bonemarrow. Since all the reported cases of CT, except forFureder et al. (2002) and Menitove et al. (1989), reveal thatbesides oscillations in platelet count the patient’s hemato-logical profile has been consistently normal, a destabiliza-tion of a peripheral control mechanism might play animportant role in the genesis of this disorder. For thisreason we confine our numerical investigation to the set ofparameters which generate periodic solutions in the plateletcompartment and held all the other model variables at theirnormal values. The next step of our investigation is to fitthe simulated data provided by the model to the publishedplatelet counts.
4.1. Model dynamics
Initially, we tried numerical experiments based on theexisting notions of the mechanisms of CT. The literature upto now explains the aetiology of this disease in terms ofplatelet destruction (autoimmune CT) or cyclical failure inplatelet production (amegakaryocytic CT). Spectral dataanalysis revealed that an important feature of CT is thesignificant periods of platelet fluctuations. They varybetween individuals and are in the range 13–64 days. First,we increased the death rate of circulating platelets gP todetermine whether this change induces oscillations likethose seen in autoimmune data. Although the modeldisplays a highly sensitive response to small changes in gP
and the platelet counts start immediately to oscillate, theperiod of fluctuations remains unchanged (’ 13 days). It isof interest to discover how the mathematical model cangenerate oscillatory solutions with different periodicity.Repeated numerical integrations show that the mainparameter controlling the period of platelet fluctuations isthe maturation time of megakaryocytes tPM . Fig. 2captures the period evolution when tPM is varied over a

ARTICLE IN PRESS
0 5 10 15 20 25 30 35 40 450
20
40
60
80
100
120
140
τPM
period (
days)
Fig. 2. Evolution of periodicity in platelet oscillations when the
maturation time of megakaryocytes tPM is modified.
R. Apostu, M.C. Mackey / Journal of Theoretical Biology 251 (2008) 297–316 303
large range. As it is illustrated in Fig. 3, changes in gp or mdo not significantly affect the period of platelet oscillations.Based on the hypothesis that the cyclical patterns inamegakaryocytic CT are secondary to the failure in plateletproduction, we decreased the platelet differentiation ratekP from its steady state value to much lower levels. Thischange did not lead to a bifurcation in the stability of thesteady state, with sustained oscillations in the plateletcompartment.
CT involves either thrombocytosis (high platelet count),thrombocytopenia (low platelet values) or an alternation ofboth. One way to simulate the low/high platelet levels is bydecreasing/increasing the minimal number of plateletsreleased per megakaryocyte ðA0Þ and the effective growthrate of megakaryocytes ðmÞ.
The above discussion identifies a subset in the parameterspace with an essential role in generating a model responsesimilar with the CT platelet data: the platelet apoptosis rateðgPÞ, the effective growth rate of megakaryocytes ðmÞ, theminimal number of platelets released per megakaryocyteðA0Þ, and the megakaryocytes maturation time ðtPM Þ. Noneof the changes in the values of these four para-meters perturb the stem cells, erythrocytes or neutrophilsnormal levels.
4.2. Fitting the model simulations to platelet data
To our knowledge, simulated annealing is one of themost successful techniques for large scale optimizationproblems where the global minimum is hidden betweenmany local extrema. It was introduced by Kirkpatrick et al.(1983) and it is inspired by the slow cooling of the liquidmetals (annealing). The algorithm works by simulating arandom walk on the set of the configuration space thatsearches for low energy states. At each instant during thesimulation we have a current state from which werandomly select a neighbor and consider probabilisticallywhether to move at the new configuration and try again.
The great advantage of this technique is that the systemcannot be trapped in a local minimum. Inspired by thephysical processes, Kirkpatrick et al. (1983) introduce aglobal temperature parameterT to control the cooling rateof the system. If none of the moves tested decrease theenergy, then an uphill move is accepted with probabilityP ¼ e�DE=T. DE denotes the difference between the newand the old values of the energy function E.For our optimization problem we choose as an energy
function the square root of the pointwise least squarebetween the clinical data and simulated platelet data:
E ¼
ffiffiffiffiffiffiffiffiffiffiffiffiffiffiffiffiffiffiffiffiffiffiffiffiffiffiffiffiXMi¼1
ðPsi � PiÞ
2
P2
vuut .
M is the number of points available, the presence/lack ofthe superscript s indicates simulated/CT data. The squareroot and the mean of the CT data P are introduced fortechnical reasons. The square root deforms the functionmonotonically, making the energy landscape less steep andP provides scaling information. The success of thealgorithm depends on the sequence of decreasing tempera-tures (the annealing schedule). This schedule is not uniqueand it is challenging to find the appropriate one for eachproblem. Initially, we tried a geometric schedule, i.e.Tðtþ 1Þ ¼ aTðtÞ, with a very close to 1 ða ¼ 0:999Þ, butit was not slow enough to find the ‘‘optimum’’ configura-tion. Although not very common, the constant thermo-dynamic speed schedule allowed sufficient time for findingthe minimum energy state:
DT ¼ �vT2
esðEÞ,
where DT is the difference between the current and theprevious temperature, sðEÞ represents the standard devia-tion of the current energy, e is the estimate of the relaxationtime, and v is the thermodynamic speed (constant). TheMatlab implementation of this method was constructed inthe framework offered by Press et al. (1993) and Salamonet al. (2002). The delay differential equations comprisingthe model (4) are numerically integrated using a Runge–Kutta method (time step 0.05 days) incorporated in themathematical software XPP (Ermentrout, 2002). Theinitial conditions are the steady state values from Table 2and approximately 200 days are discarded to eliminatetransient behavior.
4.2.1. Fitting results
We applied this approach to the CT data, comparingthe model simulation to the platelet counts published inthe literature. By varying the parameters gP, m, tPM , A0,and, in some isolated cases, kP and y2, we were ableto successfully duplicate the dynamic clinical features ofCT. The simulated annealing output and platelet datarecorded from the patients diagnosed with CT are
ARTICLE IN PRESS
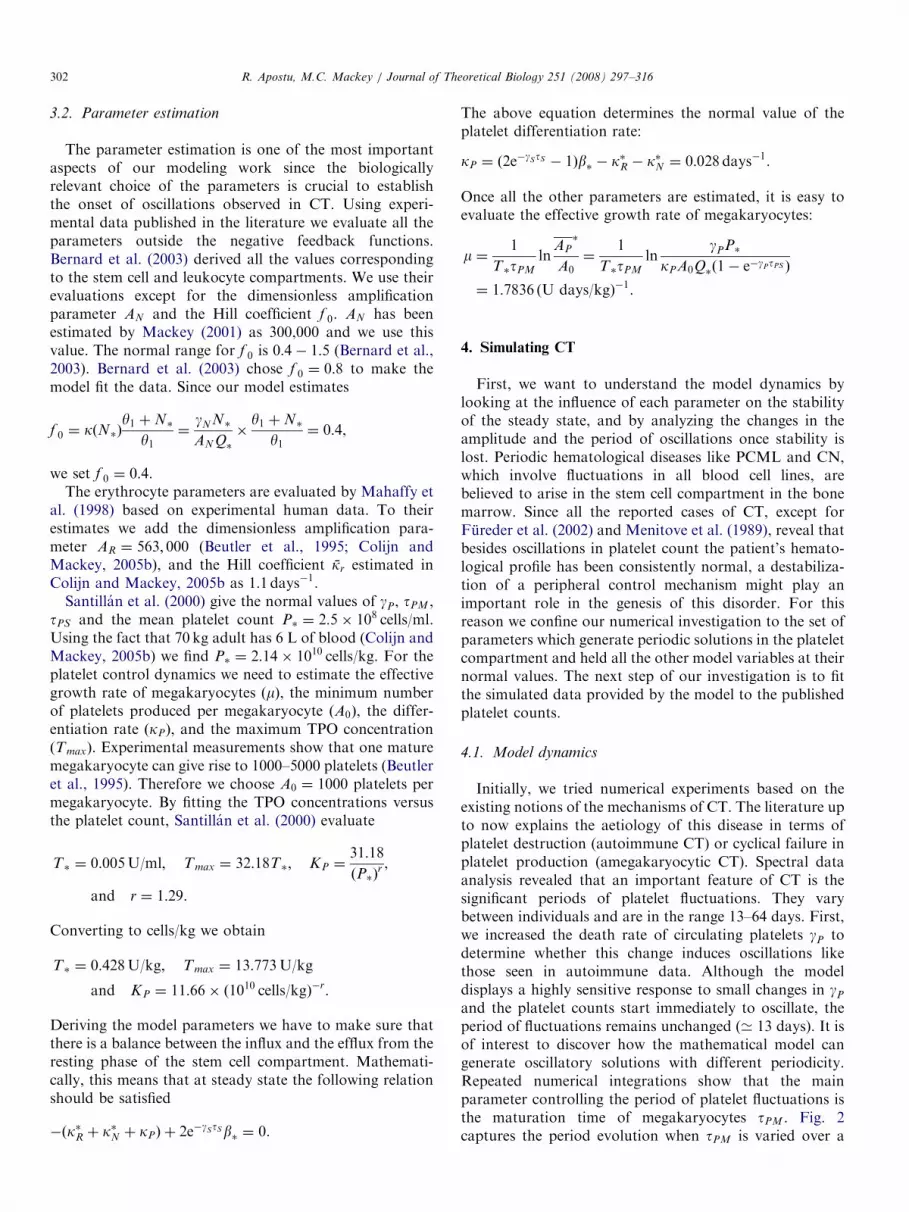
Table 2
Estimated equilibrium values for normal subjects
Parameter name Value used Unit Source
Stem cell compartment
Q� 1:1 106 cells/kg 1
gS 0.07 days�1 1
tS 2.8 days 1
k0 8.0 days�1 1
y2 0.095 106 cells/kg 1
s 2 (none) 1
Neutrophil compartment
N� 6.9 108 cells/kg 1, 3
gN 2.4 days�1 1, 3
tN 3.5 days 1, 3
AN 3000� 102 (none) 4
f 0 0.40 days�1 3
y1 0.36 108 cells/kg 1, 3
n 1 (none) 1, 3
Erythrocyte compartment
R� 3.5 1011 cells/kg 5, 3
gR 0.001 days�1 5, 3
tRM 6 days 5, 3
tRS 120 days 5, 3
AR 5:63� 105 (none) 2, 3
kr 0.5 days�1 3
Kr 0.0382 ð1011 cells/kgÞ�m 5, 3
m 6.96 (none) 5, 3
Platelet compartment
P� 2.14 1010 cells/kg 6, 3
gP 0.15 days�1 6, 3
tPM 7 days 6, 3
tPS 9.5 days 6, 3
m 1.7836 (Udays/kg)�1 Calculated
A0 0:1� 104 104 2
kP 0.028 days�1 Calculated
KP 11.68 ð1010 cells/kg)�r 3, 6
r 1.29 (none) 3, 6
T� 0.428 U/kg 6
Tmax 13.773 U/ kg Calculated
Sources: 1 ¼ Bernard et al. (2003), 2 ¼ Beutler et al. (1995), 3 ¼ Colijn
and Mackey (2005b), 4 ¼Mackey (2001), 5 ¼Mahaffy et al. (1998),
6 ¼ Santillan et al. (2000).
R. Apostu, M.C. Mackey / Journal of Theoretical Biology 251 (2008) 297–316304
presented in Appendix B (see Figs. B1, B2). The left-handpanels contain the sampled simulation (model outputsampled at the same time points as the clinical data) andthe right-hand column shows the full platelet simulationgenerated by our model. Since the available experimentalresults associate autoimmune CT to an immune-mediatedplatelet destruction, we would expect that an increasein the rate of platelet clearance ðgPÞ would be the primarychange necessary for duplicating some cases of CT. Indeed,gP appears to be involved in fitting autoimmune data aswell as in few amegakaryocytic situations, with signifi-cantly increased values in the first variety of the disease(average 0.3 with a standard deviation of 0.09) compa-rable to the latter (average 0.19 with a standard deviationof 0.01).
The platelet differentiation rate (kP), the minimal numberof platelets released per megakaryocyte (A0), and the relativegrowth rate of megakaryocyte (m) were changed while fittingthe model to platelet data, as it was hypothesized thatamegakaryocytic CT involves a megakaryocyte deficiencyand a cyclical failure in platelet production. Repeatednumerical experiments indicate that there is no significantadvantage varying kP. In all cases but one (Zent et al., 1999),the fitting algorithm did not modify this parameter.Surprisingly, for the patient reported by Zent et al. (1999)a stem cell parameter change was necessary for fitting.Although it was sufficient to change tPM , m, and kP to thenumerical values from Table 3 to mimic the plateletcounts of this patient, stem cell levels increased toapproximately 2:2� 106 cells/kg. When reducing y2 at abouthalf of its normal value, stem cells returned to theequilibrium, while the platelet counts remained unchanged.In the simulated annealing results, the values of m aredrastically reduced relative to the normal value of1:7839 (Udays/kg)�1. m varied between 1
45 and 110 of the
steady state value which is physiologically equivalent to aslower relative growth of megakaryocytes in all CT patientsinvestigated in our study. These findings are in agreementwith the clinical features of CT. Bruin et al. (2005) andZent et al. (1999) described amegakaryocytic patients withsmall megakaryocytes in the ascending limb of the plateletcount cycle.Only in a few cases was it necessary to decrease A0 to
simulate CT. Generally, this parameter was reduced to eitherhalf or 1
10of its normal value. Interestingly, in a single case of
amegakaryocytic CT (Bruin et al., 2005) A0 was decreased bya factor of 200 compared to the steady state value. This isconsistent with the clinical observations, since bone marrowaspirates in this patient showed small megakaryocytes withno release of platelets (Bruin et al., 2005).Since the period of platelet fluctuations in CT data varies
between individuals, and tPM (megakaryocyte maturationtime) is the parameter with the most prominent influenceon the platelet oscillations generated by the model, weallowed tPM to vary. What was not anticipated in thisstudy is the major role played by tPM in reproducing theoscillatory patterns observed in CT. Furuyama et al. (1999)presented an autoimmune case where the megakaryocytesare always abundant, but most of them are immature atplatelet nadir and only 50% are mature at the time of highplatelet count. Also, Aranda and Dorantes (1977) noticedthat in their patient CT was related to a periodic variationin maturity of megakaryocytes. Our results indicate thatmegakaryocytes need about twice as much time as normalto maturate in autoimmune CT. In the patients withamegakaryocytic CT, which have on average longerperiods of platelet fluctuations, tPM is elevated betweentwo and six times the normal value.
4.2.2. TPO levels in CT patients
Since TPO is the primary regulator of platelet production,abnormalities of this hormone or its receptor might be

ARTICLE IN PRESS
5 10 150
5
10
15
20
25
τPM
γP = 0.15
5 10 150
5
10
15
20
25
τPM
γP = 0.16
5 10 150
5
10
15
20
25
τPM
γP = 0.17
5 10 150
5
10
15
20
25
τPM
γP = 0.18
5 10 150
5
10
15
20
25
τPM
γP = 0.19
5 10 150
5
10
15
20
25
τPM
γP = 0.2
5 10 150
5
10
15
20
25
τPM
γP = 0.21
5 10 150
5
10
15
20
25
τPM
γP = 0.22
5 10 150
5
10
15
20
25
τPM
γP = 0.23
5 10 150
5
10
15
20
25
τPM
γP = 0.24
amplitude period
Fig. 3. Changes in the period (days) and the amplitude ð�1010 cells/kgÞ of platelet fluctuations when gP and tPM are varied simultaneously. All the other
parameters are kept at their normal values (see Table 2). A small increase in gP determines an oscillatory response with an increased amplitude but
unchanged period. Similarly, perturbations in tPM values induce platelet oscillations with variable period and unchanged amplitude.
Table 3
Parameter estimates for the CT patients based on simulated annealing method
Source and patient ID gP tPM m A0 y2 kP Transient CV
Normal values (NV) 0.15 7 1.7836 0.1 0.095 0.028
Autoimmune CT
Kosugi et al. 0.40317 16.995 0.044527 0.056734 NV NV 200 0.6710
Yanabu et al. 0.2738 17.001 0.23746 NV NV NV 212 0.7098
Rocha et al. 0.35764 14.0086 0.16654 NV NV NV 200 0.6398
Kimura et al. 0.2 26 0.17836 NV NV NV 216 0.8346
Skoog et al. 0.21923 20.0024 0.17913 0.016788 NV NV 203.5 0.8871
Amegakaryocytic CT
Bruin et al. NV 16.598 0.200644 0.00050384 NV NV 215 0.9570
Zent et al. NV 19.656 0.1482 NV 0.05435 0.002332 198 0.9748
Hoffman et al. NV 40.044 0.048642 NV NV NV 205 0.7735
Wilkinson & Firkin 0.09319 27.843 0.1595 NV NV NV 205 0.7248
Engstrom et al. 0.19614 27.4434 0.17548 NV NV NV 205 0.9120
Aranda & Dorantes 0.20632 19.297 0.15719 NV NV NV 218 0.4243
Wasastjerna 0.39526 16.374 0.17911 NV NV NV 222 0.8254
C-TPO
Lewis 0.22 18 0.17836 0.01 NV NV 215 0.9228
NV stands for the normal value taken from Table 2. CV denotes the coefficient of variation between the clinical data and our simulations.
R. Apostu, M.C. Mackey / Journal of Theoretical Biology 251 (2008) 297–316 305

ARTICLE IN PRESSR. Apostu, M.C. Mackey / Journal of Theoretical Biology 251 (2008) 297–316306
responsible for platelet fluctuations. Some research groups(Bruin et al., 2005; Kimura et al., 1996; Rice et al., 2001;Zent et al., 1999) measured the platelet counts in CT patientsas well as the temporal evolution of TPO concentration. Forthese patients, the same parameter changes generated a very
0 20 40 60 80 100 1200
0.5
1
1.5
2
days
Pla
tele
ts
(x 1
010 c
ells
/kg)
Pla
tele
ts
(x 1
010 c
ells
/kg)
Pla
tele
ts
(x 1
010 c
ells
/kg)
Pla
tele
ts
(x 1
010 c
ells
/kg)
Pla
tele
ts
(x 1
010 c
ells
/kg)
Pla
tele
ts
(x 1
010 c
ells
/kg)
Sampled simulation
sampled simulation
data CT
0 20 40 600
0.5
1
1.5
2
day
Full sim
0 10 20 30 400
0.5
1
1.5
days
0 10 200
0.5
1
1.5
day
0 20 40 60 80 1000
1
2
3
4
5
days
0 20 400
1
2
3
4
5
6
day
Fig. 4. With the same parameter changes, the model is able to fit the platelet c
(2005), (B) Zent et al. (1999), (C) Kimura et al. (1996).
0 500 1000 15000
2
4
6
8
10
12
Fogarty et al. 2005
days
Pla
tele
ts (
x 1
010 c
ells
/kg)
Fig. A1. Left-hand panels: Published platelet counts of a patient diagnosed wit
humans ð2:14� 1010 cells/kgÞ. Right-hand panels: The corresponding periodogr
levels.
good fit of the platelet counts and an encouragingqualitative comparison of the predicted and the publishedTPO levels (Fig. 4). This supports the accuracy of our modelpredictions and suggests that the TPO oscillations aresecondary manifestations of some other pathology.
80 100 120
s
ulation
full simulation
data CT
0 20 40 60 80 1000
5
10
days
TPO levels
Pre
dic
ted T
PO
levels
(U/k
g)
0
50
100
Clin
ical data
(A
U/m
l)
30 40
s
0 10 20 30 400
1
2
3
4
5
6
daysP
redic
ted T
PO
levels
(U/k
g)
0
50
100
150
200
250
300
Clin
ical data
(pg/m
l)
60 80 100
s
0 20 40 60 80 1000
1
2
3
days
Pre
dic
ted T
PO
levels
(U/k
g)
0
5
10
15
Clin
ical data
(fm
ol/m
l)
clinical data
ounts and to qualitatively reproduce the TPO oscillations. (A) Bruin et al.
0 0.01 0.02 0.03 0.04 0.05 0.06 0.070
5
10
15
20
25
30
35
Frequency
Pow
er
Power Spectrum: Fogarty et al. 2005
α = 0.001α = 0.005α = 0.01α = 0.05α = 0.1α = 0.5
Significant period: 45.58
h autoimmune CT. The horizontal line shows the normal platelet value in
am (power versus frequency). The horizontal lines specify the significance
ARTICLE IN PRESSR. Apostu, M.C. Mackey / Journal of Theoretical Biology 251 (2008) 297–316 307
5. Hypothesis for the origin of oscillations in CT
A variety of modeling studies (Belair and Mackey, 1987;Belair et al., 1995; Bernard et al., 2003; Colijn and Mackey,2005a, b, 2007; Mahaffy et al., 1998; Pujo-Menjouet et al.,2005; Santillan et al., 2000) have associated the onset of
0 50 100 150 200 250 3000
0.5
1
1.5
2
2.5Helleberg et al. 1995
days
Pla
tele
ts (
x 1
010 c
ells
/kg)
0 50 100 150 200 250 300 350 400 4500
0.5
1
1.5
2
2.5Kosugi et al. 1994
days
Pla
tele
ts (
x 1
010 c
ells
/kg)
0 20 40 60 80 100 120 140 1600
1
2
3
4
5
6Yanabu et al.1993
days
Pla
tele
ts (
x 1
010 c
ells
/kg)
0 20 40 60 80 100 120 140 160 1800
0.5
1
1.5
2
2.5
3
3.5
4Rocha et al. 1991
days
Pla
tele
ts (
x 1
010 c
ells
/kg)
Pow
er
Fig. A2. Published platelet counts of patients diagnosed wit
oscillations in hematological disease with a Hopf bifurca-tion induced by the change of one or more physiologicalparameters. Though the model we have developed here wastoo complicated for a complete stability analysis (Apostu,2007) we hypothesize that the oscillations seen in CT andstudied here are also due to a Hopf bifurcation.
0 0.02 0.04 0.06 0.08 0.10
1
2
3
4
5
6
7
FrequencyP
ow
er
Power Spectrum: Helleberg et al. 1995
α = 0.05
α = 0.1
α = 0.5
Significant period: 27.15
0 0.02 0.04 0.06 0.080
1
2
3
4
5
6
7
8
Frequency
Pow
er
Power Spectrum: Kosugi et al. 1994
α = 0.01
α = 0.05α = 0.1
α = 0.5
Significant period: 25.31
0 0.02 0.04 0.06 0.08 0.1 0.120
1
2
3
4
5
6
7
Frequency
Pow
er
Power Spectrum: Yanabu et al. 1993
α = 0.05
α = 0.1
α = 0.5
Significant period: 24.32
0 0.05 0.1 0.150
2
4
6
8
10
Frequency
Power Spectrum: Rocha et al. 1991
α = 0.005α = 0.01
α = 0.05α = 0.1
α = 0.5
Two significant periods: 20.71 and 10.33
h autoimmune CT. All the other notation as in Fig. A1.
ARTICLE IN PRESSR. Apostu, M.C. Mackey / Journal of Theoretical Biology 251 (2008) 297–316308
The mathematical model (4) successfully duplicated boththe qualitative and quantitative features of CT. The highvalues of the coefficient of variation between the clinical dataand the model simulations lend credibility to our hypothesis(See Table 3). The platelet fluctuations in amegakaryocytic
0 10 20 30 40 50 60 70 80 90 1000
0.5
1
1.5
2
2.5
3
3.5
4Menitove et al. 1989
days
Pla
tele
ts (
x 1
010 c
ells
/kg)
0 20 40 60 80 100 1200
0.5
1
1.5
2
2.5Bruin et al. 2005
days
Pla
tele
ts (
x 1
010 c
ells
/kg)
0 5 10 15 20 25 30 35 40 450
0.5
1
1.5
2
2.5Skoog et al. 1957
days
Pla
tele
ts (
x 1
010 c
ells
/kg)
0 10 20 30 40 50 60 70 80 90 1000
0.5
1
1.5
2
2.5
3
3.5
4
4.5
5
Kimura et al. 1996
days
Pla
tele
ts (
x 1
010 c
ells
/kg)
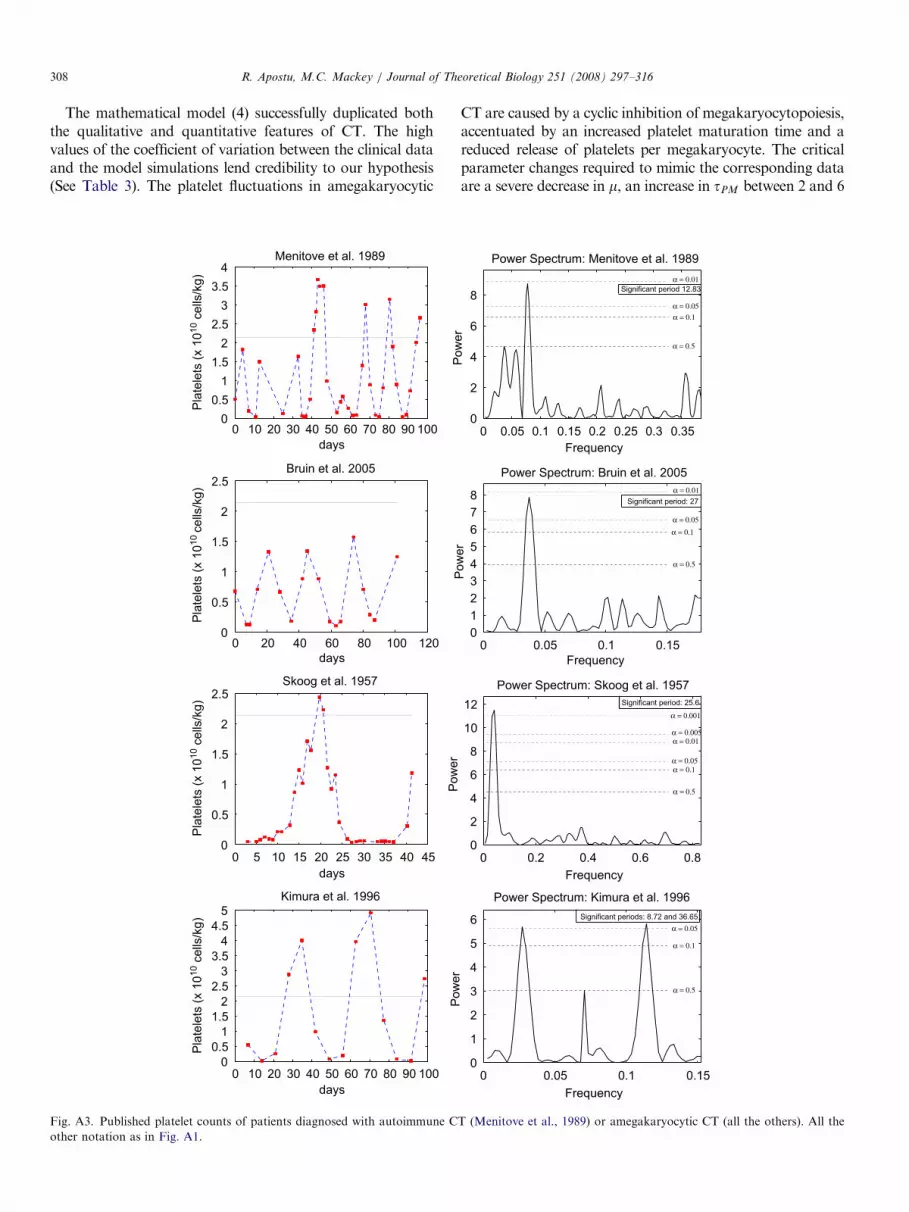
Fig. A3. Published platelet counts of patients diagnosed with autoimmune C
other notation as in Fig. A1.
CT are caused by a cyclic inhibition of megakaryocytopoiesis,accentuated by an increased platelet maturation time and areduced release of platelets per megakaryocyte. The criticalparameter changes required to mimic the corresponding dataare a severe decrease in m, an increase in tPM between 2 and 6
0 0.05 0.1 0.15 0.2 0.25 0.3 0.350
2
4
6
8
FrequencyP
ow
er
Power Spectrum: Menitove et al. 1989
α = 0.01
α = 0.05α = 0.1
α = 0.5
Significant period 12.83
0 0.05 0.1 0.150
1
2
3
4
5
6
7
8
Frequency
Pow
er
Power Spectrum: Bruin et al. 2005
α = 0.01
α = 0.05α = 0.1
α = 0.5
Significant period: 27
0 0.2 0.4 0.6 0.80
2
4
6
8
10
12
Frequency
Pow
er
Power Spectrum: Skoog et al. 1957
α = 0.001
α = 0.005α = 0.01
α = 0.05α = 0.1
α = 0.5
Significant period: 25.6
0 0.05 0.1 0.150
1
2
3
4
5
6
Frequency
Pow
er
Power Spectrum: Kimura et al. 1996
α = 0.05
α = 0.1
α = 0.5
Significant periods: 8.72 and 36.65
T (Menitove et al., 1989) or amegakaryocytic CT (all the others). All the
ARTICLE IN PRESSR. Apostu, M.C. Mackey / Journal of Theoretical Biology 251 (2008) 297–316 309
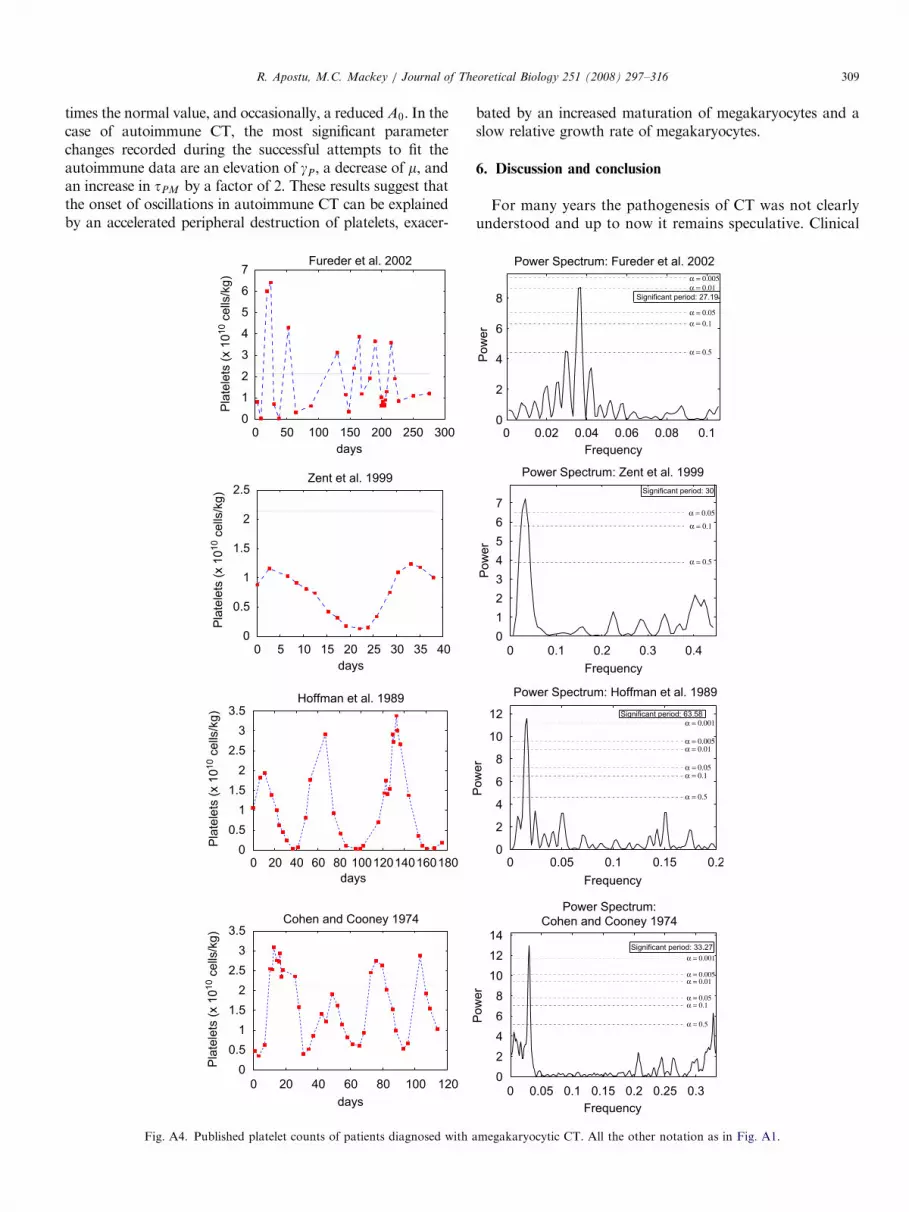
times the normal value, and occasionally, a reduced A0. In thecase of autoimmune CT, the most significant parameterchanges recorded during the successful attempts to fit theautoimmune data are an elevation of gP, a decrease of m, andan increase in tPM by a factor of 2. These results suggest thatthe onset of oscillations in autoimmune CT can be explainedby an accelerated peripheral destruction of platelets, exacer-
0 50 100 150 200 250 3000
1
2
3
4
5
6
7Fureder et al. 2002
days
Pla
tele
ts (
x 1
010 c
ells
/kg)
0 5 10 15 20 25 30 35 400
0.5
1
1.5
2
2.5Zent et al. 1999
days
Pla
tele
ts (
x 1
010 c
ells
/kg)
0 20 40 60 80 1001201401601800
0.5
1
1.5
2
2.5
3
3.5Hoffman et al. 1989
Pla
tele
ts (
x 1
010 c
ells
/kg)
0 20 40 60 80 100 120
0
0.5
1
1.5
2
2.5
3
3.5Cohen and Cooney 1974
days
Pla
tele
ts (
x 1
010 c
ells
/kg)
days
Fig. A4. Published platelet counts of patients diagnosed with a
bated by an increased maturation of megakaryocytes and aslow relative growth rate of megakaryocytes.
6. Discussion and conclusion
For many years the pathogenesis of CT was not clearlyunderstood and up to now it remains speculative. Clinical
0 0.02 0.04 0.06 0.08 0.10
2
4
6
8
Frequency
Pow
er
Power Spectrum: Fureder et al. 2002
α = 0.005α = 0.01
α = 0.05α = 0.1
α = 0.5
Significant period: 27.19
0 0.1 0.2 0.3 0.40
1
2
3
4
5
6
7
Frequency
Pow
er
Power Spectrum: Zent et al. 1999
α = 0.05
α = 0.1
α = 0.5
Significant period: 30
0 0.05 0.1 0.15 0.20
2
4
6
8
10
12
Frequency
Pow
er
Power Spectrum: Hoffman et al. 1989
α = 0.001
α = 0.005α = 0.01
α = 0.05α = 0.1
α = 0.5
Significant period: 63.58
0 0.05 0.1 0.15 0.2 0.25 0.30
2
4
6
8
10
12
14
Pow
er
Power Spectrum:
Cohen and Cooney 1974
α = 0.001
α = 0.005α = 0.01
α = 0.05α = 0.1
α = 0.5
Significant period: 33.27
Frequency
megakaryocytic CT. All the other notation as in Fig. A1.
ARTICLE IN PRESSR. Apostu, M.C. Mackey / Journal of Theoretical Biology 251 (2008) 297–316310
attempts to explain the aetiology of platelet fluctuations ledto different conclusions. Generally, the onset of oscillationswas explained in terms of immune-mediated plateletdestruction or periodic failure of platelet production. Toour knowledge, only two modeling studies have beendirected at the investigation of CT. Von Schulthess and
0 10 20 30 40 50 60 70 80 900
1
2
3
4
5
6
7
8Engstrom et al. 1966
days
Pla
tele
ts (
x 1
010 c
ells
/kg)
0 10 20 30 40 50 60 700
0.5
1
1.5
2
2.5
3
3.5
4
4.5Wasastjerna 1967
days
Pla
tele
ts (
x 1
010 c
ells
/kg)
0 50 100 150 200 250 3000
1
2
3
4
5
6Aranda and Dorantes 1977
days
Pla
tele
ts (
x 1
010 c
ells
/kg)
0 50 100 150 200 250 300 350 4000
1
2
3
4
5
6Wilkinson and Firkin 1966
days
Pla
tele
ts (
x 1
010 c
ells
/kg)
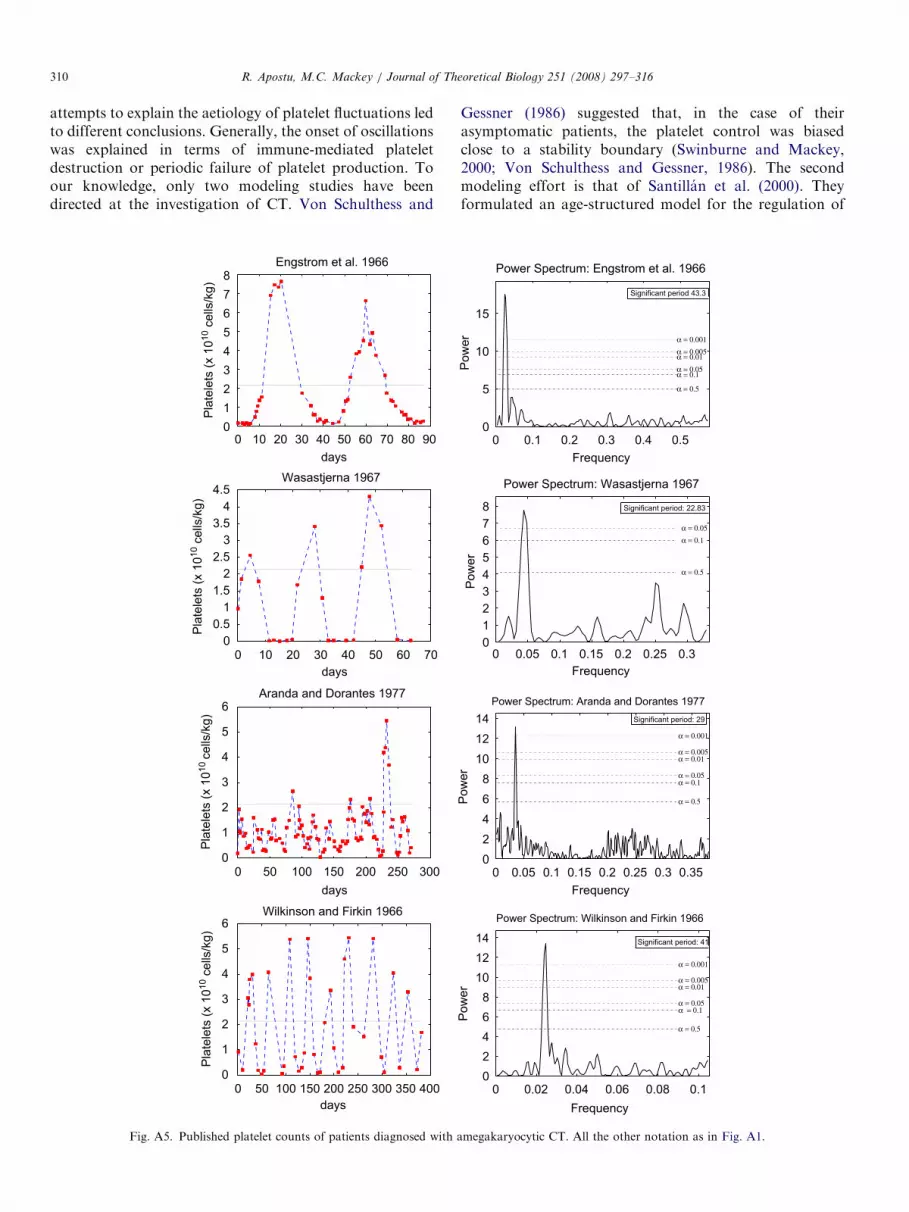
Fig. A5. Published platelet counts of patients diagnosed with a
Gessner (1986) suggested that, in the case of theirasymptomatic patients, the platelet control was biasedclose to a stability boundary (Swinburne and Mackey,2000; Von Schulthess and Gessner, 1986). The secondmodeling effort is that of Santillan et al. (2000). Theyformulated an age-structured model for the regulation of
0 0.1 0.2 0.3 0.4 0.50
5
10
15
Frequency P
ow
er
Power Spectrum: Engstrom et al. 1966
α = 0.001α = 0.005α = 0.01α = 0.05α = 0.1
α = 0.5
Significant period 43.3
0 0.05 0.1 0.15 0.2 0.25 0.30
1
2
3
4
5
6
7
8
Pow
er
Power Spectrum: Wasastjerna 1967
α = 0.05α = 0.1
α = 0.5
Significant period: 22.83
0 0.05 0.1 0.15 0.2 0.25 0.3 0.350
2
4
6
8
10
12
14
Frequency
Pow
er
Power Spectrum: Aranda and Dorantes 1977
α = 0.001
α = 0.005α = 0.01
α = 0.05α = 0.1
α = 0.5
Significant period: 29
0 0.02 0.04 0.06 0.08 0.10
2
4
6
8
10
12
14
Frequency
Pow
er
Power Spectrum: Wilkinson and Firkin 1966
α = 0.001
α = 0.005α = 0.01
α = 0.05α = 0.1
α = 0.5
Significant period: 41
Frequency
megakaryocytic CT. All the other notation as in Fig. A1.

ARTICLE IN PRESSR. Apostu, M.C. Mackey / Journal of Theoretical Biology 251 (2008) 297–316 311
the platelet production which reproduced the features ofautoimmune CT. Their work suggests that autoimmuneand amegakaryocytic CT have a different dynamical origin
0 5 10 15 20 25 30 35 40 45 50
0
0.5
1
1.5
2
2.5Lewis 1974
days
Pla
tele
ts (
x 1
010 c
ells
/kg)
0 10 20 30 40 50 60 70 80 90 100
1.4
1.6
1.8
2
2.2
2.4
2.6
2.8
von Schulthess and Gesser
1986, case 1
days
Pla
tele
ts (
x 1
010 c
ells
/kg)
0 10 20 30 40 50 60 70 80 90
2
2.2
2.4
2.6
2.8
3
3.2
3.4
3.6
von Schulthess and Gesser
1986, case 2
days
Pla
tele
ts (
x 1
010 c
ells
/kg)
0 10 20 30 40 50 60 70 80
1.4
1.5
1.6
1.7
1.8
1.9
2
2.1
2.2Morley 1969, subject 8
days
Pla
tele
ts (
x 1
010 c
ells
/kg)
Fig. A6. Published platelet counts of asymptomatic patients
and that the platelet oscillations in autoimmune CT are dueto a supercritical Hopf bifurcation induced by an increaseddeath rate of the circulating platelets.
0 0.05 0.1 0.15 0.2 0.25 0.3 0.35
0
1
2
3
4
5
6
7
8
Frequency
Pow
er
Power Spectrum: Lewis 1974
α = 0.05α = 0.1
α = 0.5
Significant period: 22.81
0 0.2 0.4 0.6 0.80
2
4
6
8
Frequency
Pow
er
Power Spectrum: von Schulthess and
Gesser 1986, case 1
α = 0.05α = 0.1
α = 0.5
Significant period: 23.27
0 0.2 0.4 0.6 0.8
0
2
4
6
8
10
Frequency
Pow
er
Power Spectrum: von Schulthess
and Gesser 1986, case 2
α = 0.005α = 0.01
α = 0.05α = 0.1
α = 0.5
Two significant periods: 49 and 31.18
0 0.05 0.1 0.15 0.2 0.25 0.3 0.35
0
1
2
3
4
5
6
7
8
Frequency
Pow
er
Power Spectrum: Morley 1969,
subject 8
α = 0.05α = 0.1
α = 0.5
Significant period: 30.66
diagnosed with CT. All the other notation as in Fig. A1.
ARTICLE IN PRESS
0 5 10 15 20 25 300
0.5
1
1.5
2
2.5Rice et al. 2001
days
Pla
tele
ts (
x 1
010 c
ells
/kg)
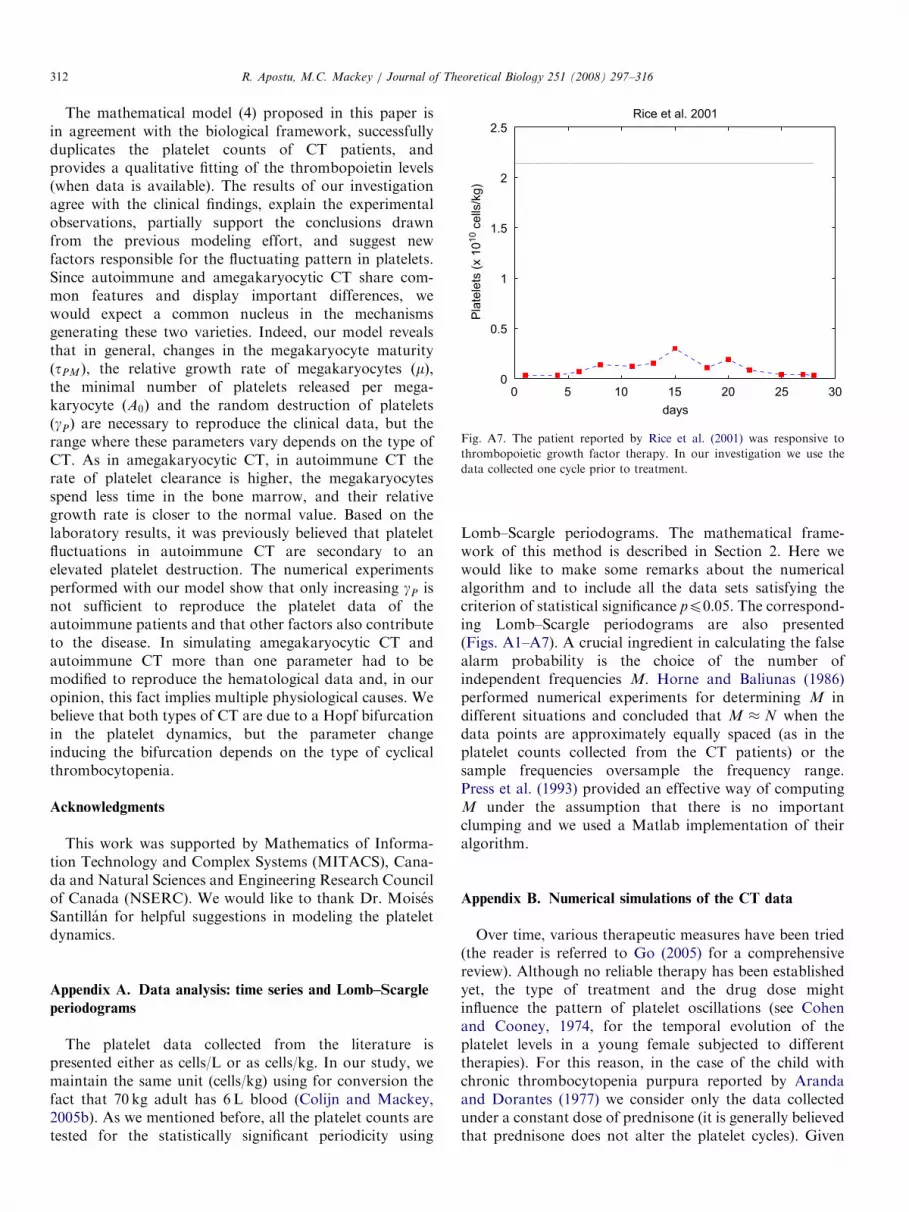
Fig. A7. The patient reported by Rice et al. (2001) was responsive to
thrombopoietic growth factor therapy. In our investigation we use the
data collected one cycle prior to treatment.
R. Apostu, M.C. Mackey / Journal of Theoretical Biology 251 (2008) 297–316312
The mathematical model (4) proposed in this paper isin agreement with the biological framework, successfullyduplicates the platelet counts of CT patients, andprovides a qualitative fitting of the thrombopoietin levels(when data is available). The results of our investigationagree with the clinical findings, explain the experimentalobservations, partially support the conclusions drawnfrom the previous modeling effort, and suggest newfactors responsible for the fluctuating pattern in platelets.Since autoimmune and amegakaryocytic CT share com-mon features and display important differences, wewould expect a common nucleus in the mechanismsgenerating these two varieties. Indeed, our model revealsthat in general, changes in the megakaryocyte maturityðtPMÞ, the relative growth rate of megakaryocytes ðmÞ,the minimal number of platelets released per mega-karyocyte ðA0Þ and the random destruction of plateletsðgPÞ are necessary to reproduce the clinical data, but therange where these parameters vary depends on the type ofCT. As in amegakaryocytic CT, in autoimmune CT therate of platelet clearance is higher, the megakaryocytesspend less time in the bone marrow, and their relativegrowth rate is closer to the normal value. Based on thelaboratory results, it was previously believed that plateletfluctuations in autoimmune CT are secondary to anelevated platelet destruction. The numerical experimentsperformed with our model show that only increasing gP isnot sufficient to reproduce the platelet data of theautoimmune patients and that other factors also contributeto the disease. In simulating amegakaryocytic CT andautoimmune CT more than one parameter had to bemodified to reproduce the hematological data and, in ouropinion, this fact implies multiple physiological causes. Webelieve that both types of CT are due to a Hopf bifurcationin the platelet dynamics, but the parameter changeinducing the bifurcation depends on the type of cyclicalthrombocytopenia.
Acknowledgments
This work was supported by Mathematics of Informa-tion Technology and Complex Systems (MITACS), Cana-da and Natural Sciences and Engineering Research Councilof Canada (NSERC). We would like to thank Dr. MoisesSantillan for helpful suggestions in modeling the plateletdynamics.
Appendix A. Data analysis: time series and Lomb–Scargle
periodograms
The platelet data collected from the literature ispresented either as cells/L or as cells/kg. In our study, wemaintain the same unit (cells/kg) using for conversion thefact that 70 kg adult has 6 L blood (Colijn and Mackey,2005b). As we mentioned before, all the platelet counts aretested for the statistically significant periodicity using
Lomb–Scargle periodograms. The mathematical frame-work of this method is described in Section 2. Here wewould like to make some remarks about the numericalalgorithm and to include all the data sets satisfying thecriterion of statistical significance pp0:05. The correspond-ing Lomb–Scargle periodograms are also presented(Figs. A1–A7). A crucial ingredient in calculating the falsealarm probability is the choice of the number ofindependent frequencies M. Horne and Baliunas (1986)performed numerical experiments for determining M indifferent situations and concluded that M � N when thedata points are approximately equally spaced (as in theplatelet counts collected from the CT patients) or thesample frequencies oversample the frequency range.Press et al. (1993) provided an effective way of computingM under the assumption that there is no importantclumping and we used a Matlab implementation of theiralgorithm.
Appendix B. Numerical simulations of the CT data
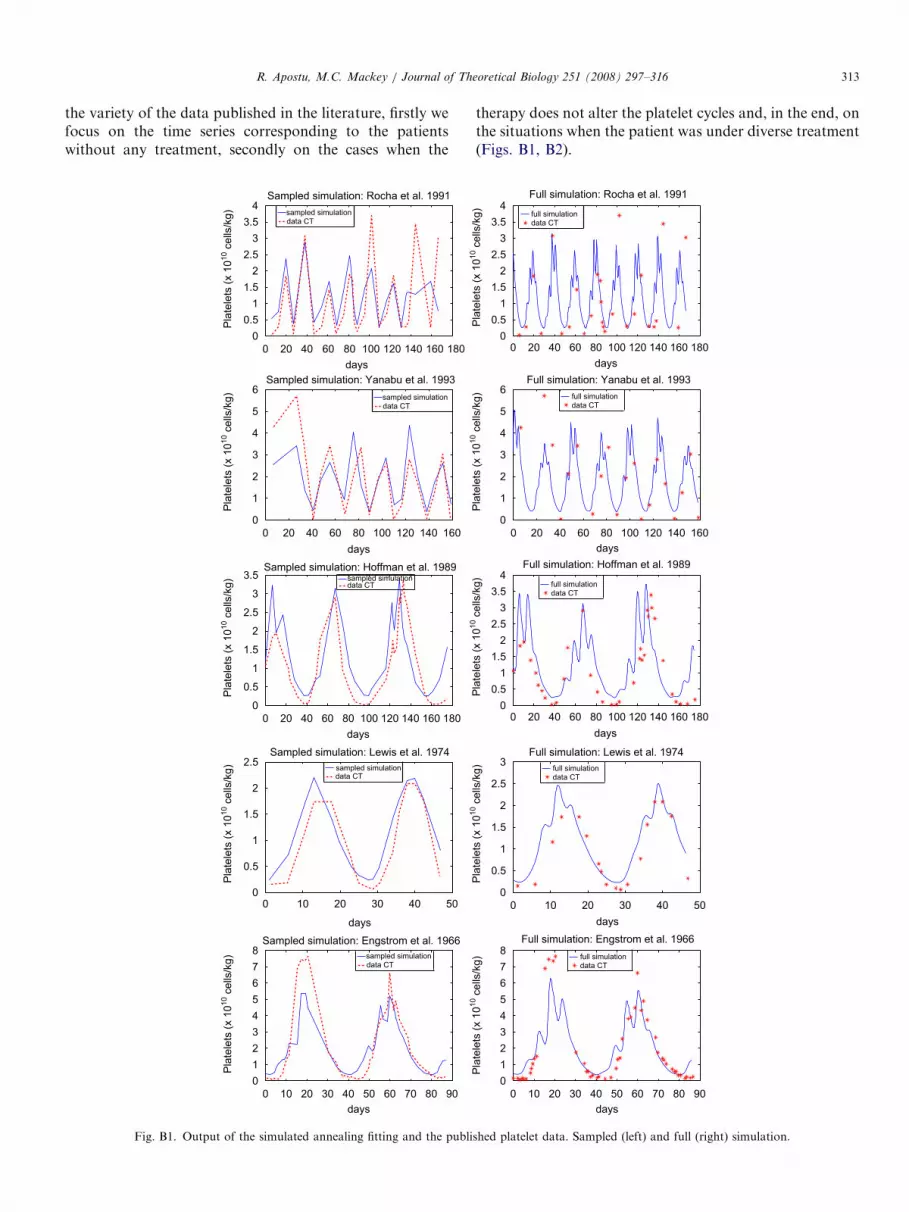
Over time, various therapeutic measures have been tried(the reader is referred to Go (2005) for a comprehensivereview). Although no reliable therapy has been establishedyet, the type of treatment and the drug dose mightinfluence the pattern of platelet oscillations (see Cohenand Cooney, 1974, for the temporal evolution of theplatelet levels in a young female subjected to differenttherapies). For this reason, in the case of the child withchronic thrombocytopenia purpura reported by Arandaand Dorantes (1977) we consider only the data collectedunder a constant dose of prednisone (it is generally believedthat prednisone does not alter the platelet cycles). Given
ARTICLE IN PRESSR. Apostu, M.C. Mackey / Journal of Theoretical Biology 251 (2008) 297–316 313
the variety of the data published in the literature, firstly wefocus on the time series corresponding to the patientswithout any treatment, secondly on the cases when the
0 20 40 60 80 100 120 140 160 180
0
0.5
1
1.5
2
2.5
3
3.5
4
days
Pla
tele
ts (
x 1
01
0 c
ells
/kg
)
Sampled simulation: Rocha et al. 1991
sampled simulationdata CT
sampled simulationdata CT
sampled simulationdata CT
0 20 40 60 80 100 120 140 160
0
1
2
3
4
5
6
days
Pla
tele
ts (
x 1
010 c
ells
/kg
)
Sampled simulation: Yanabu et al. 1993
0 20 40 60 80 100 120 140 160 180
0
0.5
1
1.5
2
2.5
3
3.5
days
Pla
tele
ts (
x 1
010 c
ells
/kg)
Sampled simulation: Hoffman et al. 1989sampled simulationdata CT
0 10 20 30 40 500
0.5
1
1.5
2
2.5
days
Pla
tele
ts (
x 1
010 c
ells
/kg)
Sampled simulation: Lewis et al. 1974
sampled simulationdata CT
0 10 20 30 40 50 60 70 80 90
0
1
2
3
4
5
6
7
8
days
Pla
tele
ts (
x 1
010 c
ells
/kg)
Sampled simulation: Engstrom et al. 1966
Fig. B1. Output of the simulated annealing fitting and the publi
therapy does not alter the platelet cycles and, in the end, onthe situations when the patient was under diverse treatment(Figs. B1, B2).
0 20 40 60 80 100 120 140 160 1800
0.5
1
1.5
2
2.5
3
3.5
4
days
Pla
tele
ts (
x 1
01
0 c
ells
/kg
)
Full simulation: Rocha et al. 1991
0 20 40 60 80 100 120 140 160
0
1
2
3
4
5
6
days
Pla
tele
ts (
x 1
010 c
ells
/kg
)
Full simulation: Yanabu et al. 1993
0 20 40 60 80 100 120 140 160 1800
0.5
1
1.5
2
2.5
3
3.5
4
days
Pla
tele
ts (
x 1
010 c
ells
/kg)
Full simulation: Hoffman et al. 1989
0 10 20 30 40 50
0
0.5
1
1.5
2
2.5
3
days
Pla
tele
ts (
x 1
010 c
ells
/kg)
Full simulation: Lewis et al. 1974
0 10 20 30 40 50 60 70 80 90
0
1
2
3
4
5
6
7
8
days
Pla
tele
ts (
x 1
010 c
ells
/kg)
Full simulation: Engstrom et al. 1966
full simulationdata CT
full simulationdata CT
full simulationdata CT
full simulationdata CT
full simulationdata CT
shed platelet data. Sampled (left) and full (right) simulation.

ARTICLE IN PRESS
0 50 100 150 200 250 300 350 4000
1
2
3
4
5
6
days
Pla
tele
ts (
x 1
01
0 c
ells
/kg
)
Sampled simulation: Wilkinson and Firkin 1966
0 50 100 150 200 250 300 350 400
0
1
2
3
4
5
6
days
Pla
tele
ts (
x 1
01
0 c
ells
/kg
)
Full simulation: Wilkinson and Firkin 1966
0 10 20 30 40 50 60 70
0
1
2
3
4
5
6
7
days
Pla
tele
ts (
x 1
01
0 c
ells
/kg
)
Sampled simulation: Wasastjerna 1967
sampled simulationdata CT
sampled simulationdata CT
sampled simulationdata CT
sampled simulationdata CT
sampled simulationdata CT
0 10 20 30 40 50 60 70
0
1
2
3
4
5
6
7
8
9
10
days
Pla
tele
ts (
x 1
01
0 c
ells
/kg
)
Full simulation: Wasastjerna 1967
0 50 100 150 200 250 300
0
1
2
3
4
5
6
days
Pla
tele
ts (
x 1
01
0 c
ells
/kg
)
Sampled simulation: Aranda and Dorantes 1977
0 50 100 150 200 250 300
0
1
2
3
4
5
6
days
Pla
tele
ts (
x 1
01
0 c
ells
/kg
)
Full simulation: Aranda and Dorantes 1977
0 5 10 15 20 25 30 35 40 45
0
0.5
1
1.5
2
2.5
3
days
Pla
tele
ts (
x 1
01
0 c
ells
/kg
)
Sampled simulation: Skoog et al. 1957
0 5 10 15 20 25 30 35 40 45
0
0.5
1
1.5
2
2.5
3
full simulationdata CT
full simulationdata CT
full simulationdata CT
full simulationdata CT
full simulationdata CT
days
Pla
tele
ts (
x 1
01
0 c
ells
/kg
)
Full simulation: Skoog et al. 1957
0 50 100 150 200 250 300 350 400 450
0
0.2
0.4
0.6
0.8
1
1.2
1.4
days
Pla
tele
ts (
x 1
010 c
ells
/kg)
Sampled simulation: Kosugi et al. 1994
0 50 100 150 200 250 300 350 400 4500
0.2
0.4
0.6
0.8
1
1.2
1.4
days
Pla
tele
ts (
x 1
010 c
ells
/kg)
Full simulation: Kosugi et al. 1994
Fig. B2. Output of the simulated annealing fitting and the published platelet data. Sampled (left) and full (right) simulation.
R. Apostu, M.C. Mackey / Journal of Theoretical Biology 251 (2008) 297–316314

ARTICLE IN PRESSR. Apostu, M.C. Mackey / Journal of Theoretical Biology 251 (2008) 297–316 315
References
Apostu, R., 2007. Understanding cyclical thrombocytopenia: a mathema-
tical modeling approach. Master’s thesis, Department of Mathematics
and Statistics, McGill University.
Aranda, E., Dorantes, S., 1977. Garcia’s disease: cyclic thrombocytopenic
purpura in a child and abnormal platelet counts in his family. Scand. J.
Haematol. 18, 39–46.
Belair, J., Mackey, M.C., 1987. A model for the regulation of mammalian
platelet. Ann. N.Y. Acad. Sci. 504, 280–282.
Belair, J., Mackey, M.C., Mahaffy, J.M., 1995. Age-structured and two-
delay models for erythropoiesis. Math. Biosci. 128, 317–346.
Bernard, S., Belair, J., Mackey, M.C., 2003. Oscillations in cyclical
neutropenia: New evidence based on mathematical modeling. J. Theor.
Biol. 223, 283–298.
Beutler, E., Lichtman, M.A., Coller, B.S., Kipps, T.J., 1995. Williams
Hematology. McGraw-Hill, New York.
Branehog, I., Kutti, J., Ridell, B., Swolin, B., Weinfeld, A., 1975.
The relation of thrombokinetics to bone marrow megakaryo-
cytes in ideopathic thrombocytopenic purpura (ITP). Blood 45,
552–562.
Bruin, M., Tijssen, M.R., Bierings, M., de Haas, M., 2005. Juvenile cyclic
amegakaryocytic thrombocytopenia: a novel entity. J. Pediatr.
Hematol. Oncol. 27 (3), 148–152.
Cohen, T., Cooney, D.P., 1974. Cyclic thrombocytopenia. Case report and
review of literature. Scand. J. Haematol. 12, 9–17.
Colijn, C., Mackey, M.C., 2005a. A mathematical model of hemato-
poiesis: Cyclical neutropenia, part II. J. Theor. Biol. 237, 133–146.
Colijn, C., Mackey, M.C., 2005b. A mathematical model of hematopoi-
esis: Periodic chronic myelogenous leukemia, part I. J. Theor. Biol.
237, 117–132.
Colijn, C., Mackey, M.C., 2007. Bifurcation and bistability in a
model of hematopoietic regulation. SIAM J. Appl. Dynam. Sys. 6,
378–394.
Engstrom, K., Lundquist, A., Soderstrom, N., 1966. Periodic thrombo-
cytopenia or tidal platelet dysgenesis in a man. Scand. J. Haemat. 3,
290–292.
Ermentrout, B., 2002. Simulating, Analyzing, and Animating Dynamical
Systems: A Guide to XPPAUT for Researchers and Students
(Software, Environments, Tools), first ed. SIAM, Philadelphia, PA.
Fogarty, P.F., Stetler-Stevenson, M., Pereira, A., Dunbar, C.E., 2005.
Large granular lymphocytic proliferation-associated cyclic thrombo-
cytopenia. Am. J. Hematol. 79, 334–336.
Foley, C., Bernard, S., Mackey, M.C., 2006. Cost-effective G-CSF therapy
strategies for cyclical neutropenia: mathematical modelling based
hypotheses. J. Theor. Biol. 238, 754–763.
Fortin, P., Mackey, M.C., 1999. Periodic chronic myelogenous leukaemia:
spectral analysis of blood cell counts and aetiological implications.
Brit. J. Haematol. 104, 336–345.
Fureder, W., Mitterbauer, G., Thalhammer, R., Geissler, K., Panzer, S.,
Krebs, M., Simonitsch-Klupp, I., Sperr, W.R., Lechner, K., Kyrle,
P.A., 2002. Clonal T cell-mediated cyclic thrombocytopenia. Brit. J.
Haematol. 119, 1059–1061.
Furuyama, H., Koga, Y., Hamasaki, K., Kuroki, F., Itami, N., Ishikawa,
Y., 1999. Effective treatment of cyclic thrombocytopenia with
cepharanthin. Pediatr. Int. 41, 584–585.
Glass, L., Mackey, M.C., 1988. From Clock to Chaos. Princeton
University Press.
Go, R.S., 2005. Ideopathic cyclic thrombocytopenia. Blood Rev. 19,
53–59.
Haurie, C., Dale, D.C., Mackey, M.C., 1998. Cyclical neutropenia and
other periodic hematological diseases: A review of mechanisms and
mathematical models. Blood 92, 2629–2640.
Haurie, C., Dale, D.C., Mackey, M.C., 1999. Occurrence of periodic
oscillations in the differential blood counts of congenital, ideopathic
and cyclical neutropenic patients before and during treatment with G-
CSF. Exp. Hematol. 27, 401–409.
Haurie, C., Dale, D.C., Rudnicki, R., Mackey, M.C., 2000. Modeling
complex neutrophil dynamics in the Grey Collie. J. Theor. Biol. 204,
505–519.
Hearn, T., Haurie, C., Mackey, M.C., 1998. Cyclical neutropenia and the
peripheral control of white blood cell production. J. Theor. Biol. 192,
167–181.
Helleberg, C., 1995. Cyclical thrombocytopenia successfully treated with
low dose hormonal contraception. Am. J. Hematol. 48, 62–63.
Hoffman, R., Briddell, R., van Besien, K., Srour, E., Guscar, T., Hudson,
N., Ganser, A., 1989. Acquired cyclical amegakaryocytic thrombocy-
topenia associated with an immunoglobulin blocking the action of
granulocytemacrophage colony-stimulating factor. N. Engl. J. Med.
312, 97–102.
Horne, J.H., Baliunas, S.L., 1986. A prescription for period analysis of
unevenly sampled time series. Astrophys. J. 302, 757–763.
Kimura, F., Nakamura, Y., Sato, K., Wakimoto, N., 1996. Cyclic change
of cytokines in a patient with cyclical thrombocytopenia. Brit. J.
Haematol. 94, 171–174.
Kirkpatrick, S., Gelatt, C.D., Vecchi, M.P., 1983. Optimization by
simulated annealing. Science 220, 671–680.
Kosugi, S., Tomiyama, Y., Shiraga, M., Kashiwagi, H., Nakao, H.,
Kanayama, Y., Kurata, Y., Matsuzawa, Y., 1994. Cyclic thrombocy-
topenia associated with IgM anti-GPIIb-IIa autoantibodies. Brit. J.
Haematol. 88, 809–815.
Lewis, M.L., 1974. Cyclical thrombocytopenia: a thrombopoietin
deficiency? J. Clin. Path. 27, 242–246.
Lomb, N.R., 1976. Least-squares frequency analysis of unequally spaced
data. Astrophys. Space Sci. 39, 447–462.
Mackey, M.C., 1978. Unified hypothesis for the origin of aplastic anemia
and periodic hematopoiesis. Blood 51, 941–956.
Mackey, M.C., 1979. Periodic auto-immune hemolytic anemia: An
induced dynamical disease. Bull. Math. Biol. 41, 829–834.
Mackey, M.C., 2001. Cell kinetic status of hematopoietic stem cells. Cell
Prolif. 34, 71–83.
Mackey, M.C., Glass, L., 1977. Oscillation and chaos in physiological
control systems. Science 197, 287–289.
Mahaffy, J.M., Belair, J., Mackey, M.C., 1998. Hematopoietic model with
moving boundary condition and state dependent delay: Applications
in erythropoiesis. J. Theor. Biol. 190, 135–146.
Menitove, J.E., Pereira, J., Hoffman, R., Anderson, T., Fried, W., Aster,
R.H., 1989. Cyclical thrombocytopenia of apparent autoimmune
etiology. Blood 73, 1561–1569.
Minot, G.S., 1936. Pupura hemorragica with lymphocytosis: an acute
type and an interminent menstrual type. Am. J. Med. Sci. 192,
445–456.
Morley, A., 1969. A platelet cycle in normal individuals. Aust. Ann. Med.
18, 127–129.
Nagasawa, T., Hasegawa, Y., Kamoshita, M., et al., 1998. Serum
thrombopoietin level is mainly regulated by megakaryocyte mass
rather than platelet mass in human subjects. Brit. J. Haematol. 101,
242–244.
Press, W.H., Flannery, B.P., Vetterling, W.T., Teukolsky, S.A., 1993.
Numerical recipes in C, second ed. Cambridge University Press,
Cambridge.
Pujo-Menjouet, L., Bernard, S., Mackey, M.C., 2005. Long period
oscillations in a g0 model of hematopoietic stem cells. SIAM J. Appl.
Dynam. Sys. 4 (2), 312–332.
Rice, L., Nichol, J.L., McMillan, R., Roskos, L.K., Bacile, M., 2001.
Cyclic immune thrombocytopenia responsive to thrombopoietic factor
therapy. Am. J. Hematol. 68, 210–214.
Rocha, R., Horstman, L., Ahn, Y.S., Mylvaganam, R., Harrington, W.J.,
1991. Danazol therapy for cyclic thrombocytopenia. Am. J. Hematol.
36, 140–143.
Salamon, P., Sibani, P., Frost, R., 2002. Facts, Conjectures, and
Improvements for Simulated Annealing. SIAM, Philadelphia, PA.
Santillan, M., Belair, J., Mahaffy, J.M., Mackey, M.C., 2000. Regulation
of platelet production: the normal response to perturbation and
cyclical platelet disease. J. Theor. Biol. 206, 585–603.

ARTICLE IN PRESSR. Apostu, M.C. Mackey / Journal of Theoretical Biology 251 (2008) 297–316316
Scargle, J.D., 1982. Studies in astronomical time series analysis, II.
Statistical aspects of spectral analysis of unevenly spaced data.
Astrophys. J. 263, 835–853.
Skoog, W., Lawrence, J.S., Adams, W.S., 1957. A metabolic study of a
patient with ideopatic cyclical thrombocytopenic purpura. Blood 12,
844–856.
Swinburne, J., Mackey, M.C., 2000. Cyclical thrombocytopenia: Char-
acterisation by spectral analysis and a review. J. Theor. Med. 2, 81–91.
Tomer, A., Schreiber, A.D., McMillan, R., Cines, D.B., Burnstein, S.A.,
Thiessen, A.R., Harker, L.A., 1989. Menstrual cyclic thrombocytope-
nia. Brit. J. Haematol. 71, 519–524.
Von Schulthess, G.K., Gessner, U., 1986. Oscillating platelet counts in
healthy individuals: Experimental investigation and quantitative
evaluation of thrombocytopenic feedback control. Scand. J. Haematol.
36, 473–479.
Wasastjerna, C., 1967. Cyclical thrombocytopenia of acute type. Scand. J.
Haemat. 4, 380–384.
Wilkinson, T., Firkin, B., 1966. Ideopathic cyclical acute thrombocyto-
penic purpura. Med. J. Aust. 1, 217–219.
Yanabu, M., Nomura, S., Kukuroi, T., et al., 1993. Periodic production of
antiplatelet autoantibody directed against GPIIIa in cyclic thrombo-
cytopenia. Acta Haematol. 89, 155–159.
Zent, C.S., Ratajczak, J., Ratajczak, M.Z., Anastasi, J., Hoffman, P.C.,
Gewirtz, A.M., 1999. Relationship between megakaryocyte mass and
serum thrombopoietin levels as revealed by a case of cyclic amegakar-
yocytic thrombocytopenic purpura. Brit. J. Haematol. 105, 452–458.