Embed Size (px)
Citation preview
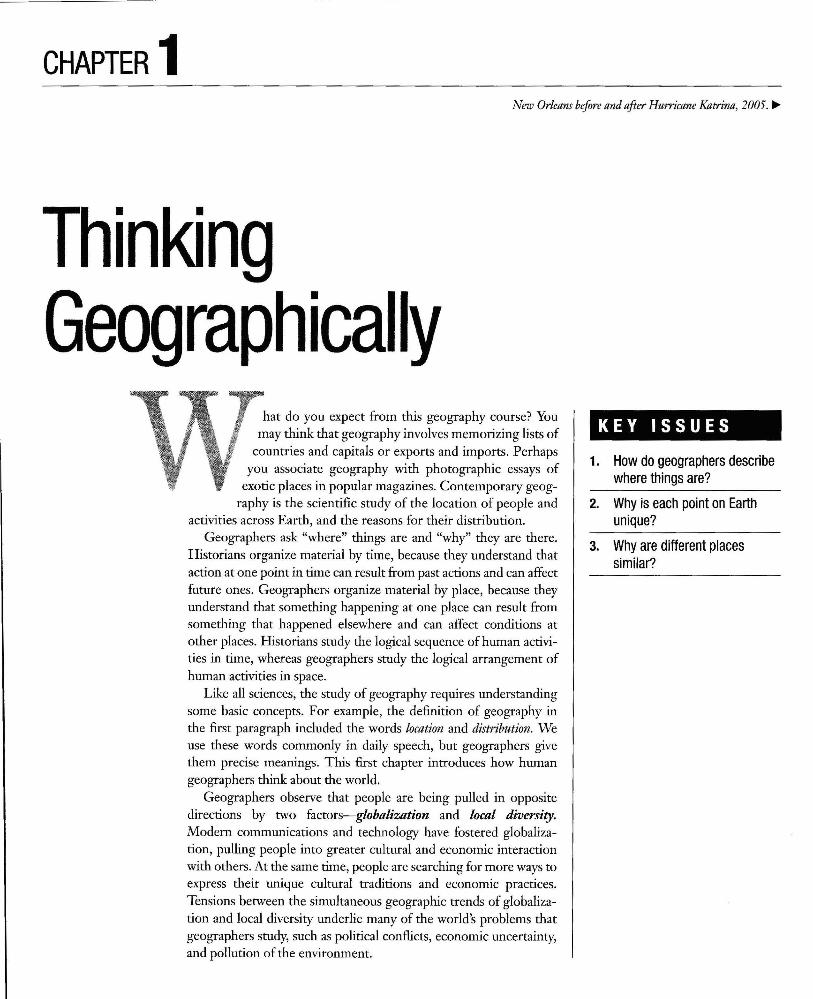
CHAPTER 1 New Orleans before and after Hurricane Katrina, 2005. ~
Thinking Geographically
hat do you expect from this geography course? You may think that geography involves memorizing lists of
countries and capitals or exports and imports. Perhaps you associate geography with photographic essays of
exotic places in popular magazines. Contemporary geography is the scientific study of the location of people and
activities across Earth, and the reasons for their distribution. Geographers ask "where" things are and "why" they are there.
Historians organize material by time, because they understand that action at one point in time can result from past actions and can affect future ones. Geographers organize material by place, because they understand that something happening at one place can result from something that happened elsewhere and can affect conditions at other places. Historians study the logical sequence of human activities in time, whereas geographers study the logical arrangement of human activities in space.
Like all sciences, the study of geography requires understanding some basic concepts. For example, the definition of geography in the first paragraph included the words location and distribution. We use these words commonly in daily speech, but geographers give them precise meanings. This first chapter introduces how human geographers think about the world.
Geographers observe that people are being pulled in opposite directions by two factors-g/,obalization and weal divernty. Modern communications and technology have fostered globalization, pulling people into greater cultural and economic interaction with others. At the same time, people are searching for more ways to express their unique cultural traditions and economic practices. Tensions between the simultaneous geographic trends of globalization and local diversity underlie many of the world's problems that geographers study, such as political conflicts, economic uncertainty, and pollution of the environment.
KEY ISSUES
1. How do geographers describe where things are?
2. Why is each point on Earth unique?
3. Why are different places similar?
4 Chapter 1 Thinking Geographically
CASE STUDY
Big Mac Attack If when driving across the vast expanses of the United States on an interstate highway you are hit by hunger pangs, you are unlikely to be thinking about geography. At the next interchange you scan the horizon for fast-food restaurant signs, again in vain. Now, very hungry, you are again disappointed at the second interchange. Finally, as you approach the third interchange, you spot a familiar image atop a very large pole-McDonald's "golden arches."
When you drive up the ramp from the highway to the local road, you are confronted with a choice of a halfdozen fast-food restaurants. Very annoyed, you wonder why none of these establishments were located at the two previous interchanges. Why cluster a half dozen at a single interchange instead of dispersing one or two at each interchange? Now you are asking questions about geography. Geographers ask where things are located and why.
Geographers are interested in the location of McDonald's restaurants around the world, not just around a U.S. interstate exit. The spread of McDonald's from a single establishment in Des Plaines, Illinois, in 19 5 5, to 32,000 establishments worldwide reflects what for many human geographers was the defining trend of the late twentieth century-globalization of economy and culture.
Thinking geographically is one of the oldest human activities. Perhaps the first geographer was a prehistoric human who crossed a river or climbed a hill, observed what was on the other side, returned home to tell about it, and scratched the route in the dirt. Perhaps the second geographer was a friend or relative who followed the dirt map to reach the other side. The word geo!Sf"aphy, invented by the ancient Greek scholar Eratosthenes, is based on two Greek words. Geo means "Earth," and !Sf"aphy means "to write."
Today, geographers are still trying to reach the other side, to understand more about the world in which we live. Geography is the study of where things are found on Earth's surface and the reasons for the location. Human geographers ask two simple questions: Where are people and activities found on Earth? Why are they found there?
Geography is divided broadly into two categories-human geography and physical geography-and within each category, slightly different "where" and "why" questions are addressed. Human geography is the study of where and why human activities are located where they are-for example, religions, businesses, and cities. Physical geography studies where and why natural forces occur as they do-for example, climates, landforms, and types of vegetation.
This book focuses on human geography, but it never forgets Earth's atmosphere, land, water, vegetation, and other living
Human geographers are interested in understanding the economic and cultural conditions that permitted, and even encouraged, companies such as McDonald's to spread around the world during that time. Especially significant for some human geographers is the prominent role played by American companies, from Coca-Cola and Ford to Microsoft and MTV; in the creation of a global economy and culture.
In the twenty-first century, human geographers also recognize that global forces have not eliminated local diversity in economic conditions and cultural preferences. McDonald's success has been built on many individual decisions concerning the local economy and culture. The company encourages local operators to tailor menu items to local tastes-such as Japan's Teriyaki McBurger (with sausage and teriyaki sauce) and Chile's McPalta (with avocado)-and it avoids countries where few people can afford its meals.
Human geography is an especially exciting subject in the twenty-first century because of the constant interplay between the common and the exotic, between global forces and local distinctiveness. Every McDonald's-every place on Earth-is in some way tied to a global economy and culture, yet at the same time reflects certain characteristics that are unlike anywhere else.
creatures. Because geographers are trained in both social and physical sciences, they are particularly well equipped to understand interactions between people and their environment, such as the devastation in the southern United States after Hurricane Katrina in 2005.
Physical geography concepts explain the process by which hurricanes, such as Katrina, form in the Atlantic Ocean during the late summer and autumn and gather strength over the warms waters of the Gulf of Mexico. When it passes over land, a hurricane can generate a powerful storm surge that floods low-lying areas.
It is here that physical and human geography intersect. Katrina caused massive damage, in part because it made landfall near heavily populated areas, including the cities of Biloxi and Gulfport, Mississippi; Mobile, Alabama; and New Orleans, Louisiana. In an effort to protect these low-lying cities from flooding, government agencies constructed a complex system of levees, dikes, seawalls, canals, and pumps. The experience of Katrina proved that humans are not able to control and tame all of the forces of nature.
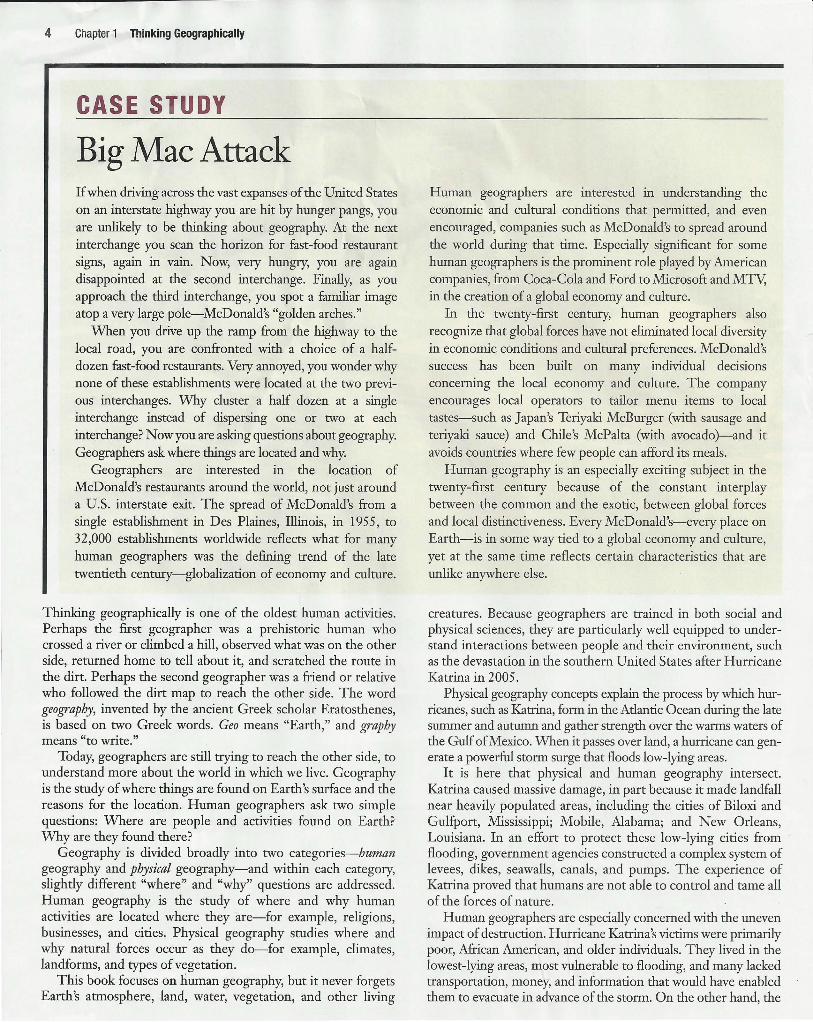
Human geographers are especially concerned with the uneven impact of destruction. Hurricane Katrina's victims were primarily poor, African American, and older individuals. They lived in the lowest-lying areas, most vulnerable to flooding, and many lacked transportation, money, and information that would have enabled them to evacuate in advance of the storm. On the other hand, the
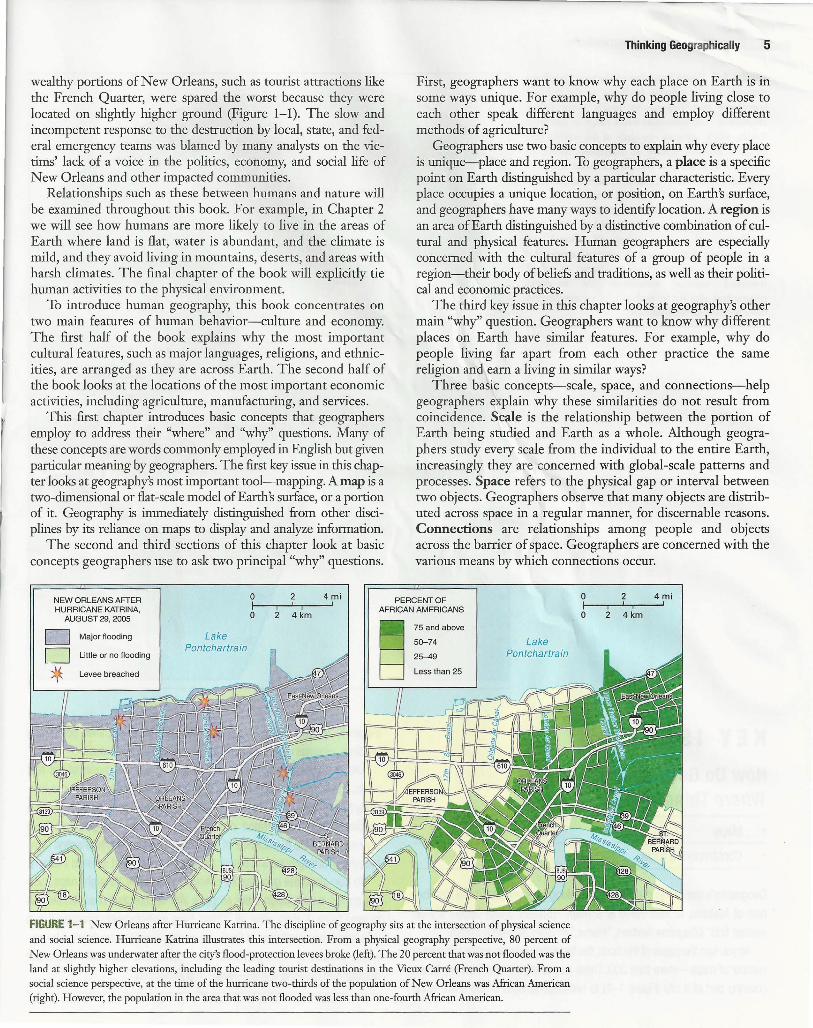
wealthy portions of New Orleans, such as tourist attractions like the French Quarter, were spared the worst because they were located on slightly higher ground (Figure 1-1). The slow and incompetent response to the destruction by local, state, and federal emergency teams was blamed by many analysts on the victims' lack of a voice in the politics, economy, and social life of New Orleans and other impacted communities.
Relationships such as these between humans and nature will be examined throughout this book. For example, in Chapter 2 we will see how humans are more likely to live in the areas of Earth where land is flat, water is abundant, and the climate is mild, and they avoid living in mountains, deserts, and areas with harsh climates. The final chapter of the book will explicitly tie human activities to the physical environment.
To introduce human geography, this book concentrates on two main features of human behavior-culture and economy. The first half of the book explains why the most important cultural features, such as major languages, religions, and ethnicities, are arranged as they are across Earth. The second half of the book looks at the locations of the most important economic activities, including agriculture, manufacturing, and services.
This first chapter introduces basic concepts that geographers employ to address their "where" and "why'' questions. Many of these concepts are words commonly employed in English but given particular meaning by geographers. The first key issue in this chapter looks at geography's most important tool-mapping. A map is a two-dimensional or flat-scale model of Earth's surface, or a portion of it. Geography is immediately distinguished from other disciplines by its reliance on maps to display and analyze information.
The second and third sections of this chapter look at basic concepts geographers use to ask two principal "why" questions.
0 2 4 mi
Thinking Geographically 5
First, geographers want to know why each place on Earth is in some ways unique. For example, why do people living close to each other speak different languages and employ different methods of agriculture?
Geographers use two basic concepts to explain why every place is unique-place and region. To geographers, a place is a specific point on Earth distinguished by a particular characteristic. Every place occupies a unique location, or position, on Earth's surface, and geographers have many ways to identify location. A region is an area of Earth distinguished by a distinctive combination of cultural and physical features. Human geographers are especially concerned with the cultural features of a group of people in a region-their body of beliefs and traditions, as well as their political and economic practices.
The third key issue in this chapter looks at geography's other main "why" question. Geographers want to know why different places on Earth have similar features. For example, why do people living far apart from each other practice the same religion and earn a living in similar ways?
Three basic concepts-scale, space, and connections-help geographers explain why these similarities do not result from coincidence. Scale is the relationship between the portion of Earth being studied and Earth as a whole. Although geographers study every scale from the individual to the entire Earth, increasingly they are concerned with global-scale patterns and processes. Space refers to the physical gap or interval between two objects. Geographers observe that many objects are distributed across space in a regular manner, for discernable reasons. Connections are relationships among people and objects across the barrier of space. Geographers are concerned with the various means by which connections occur.
PERCENT OF O 2 4 mi NEW ORLEANS AFTER HURRICANE KATRINA,
AUGUST 29, 2005 0 2 4 km AFRICAN AMERICANS
O 2 4km
Major flooding
Little or no flooding
Levee breached
Lake Pontchartrain
:~~:above
25-49
Less than 25
Lake Pontchartrain
FIGURE 1-1 New Orleans after Hurricane Katrina. The discipline of geography sits at the intersection of physical science and social science. Hurricane Katrina illustrates this intersection. From a physical geography perspective, 80 percent of New Orleans was underwater after the city's flood-protection levees broke Oeft). The 20 percent that was not flooded was the land at slightly higher elevations, including the leading tourist destinations in the Vieux Carre (French Quarter). From a social science perspective, at the time of the hurricane two-thirds of the population of New Orleans was African American (right). However, the population in the area that was not flooded was less than one-fourth African American.
6 Chapter 1 Thinking Geographically
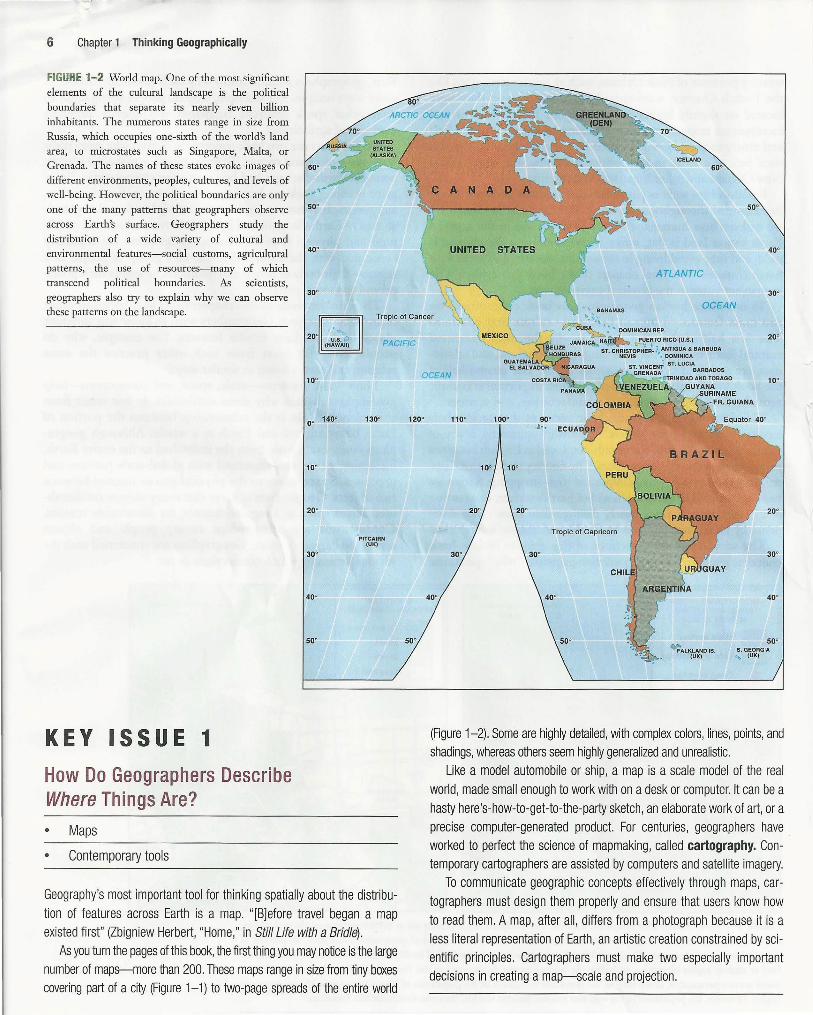
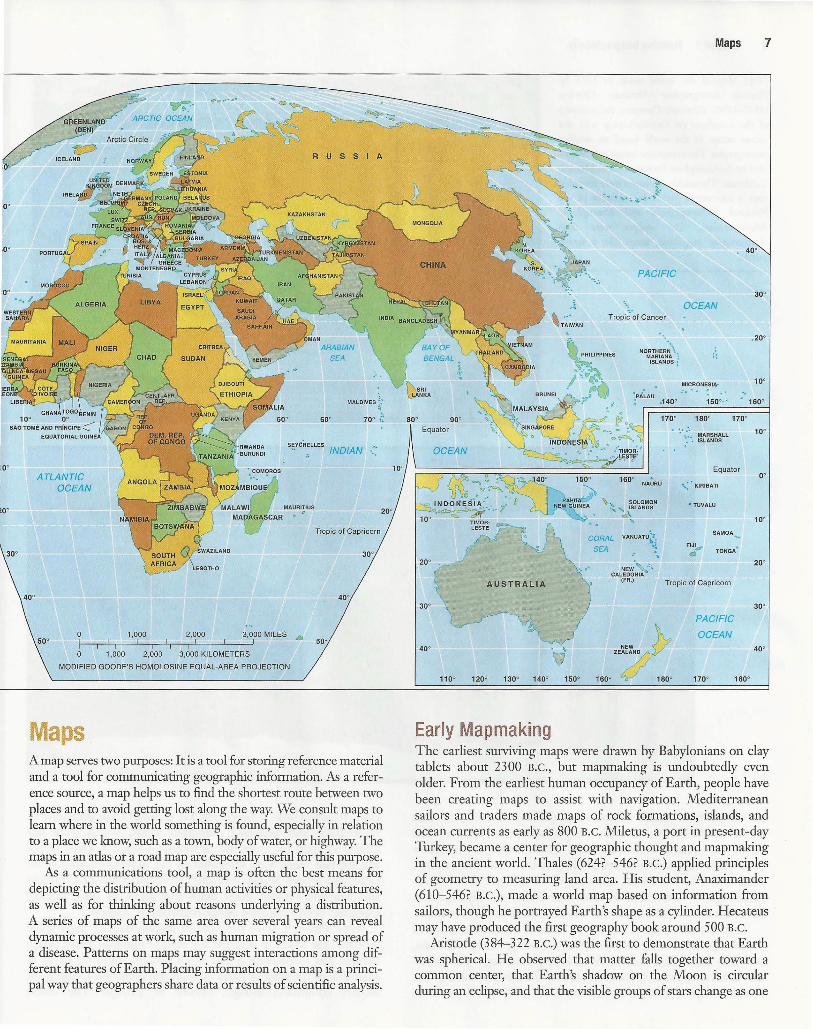
FIGURE 1-2 World map. One of the most significant elements of the cultural landscape is the political boundaries that separate its nearly seven billion inhabitants. The numerous states range in size from Russia, which occupies one-sixth of the world's land area, to microstates such as Singapore, Malta, or Grenada. The names of these states evoke images of different environments, peoples, cultures, and levels of well-being. However, the political boundaries are only one of the many patterns that geographers observe across Earth's surface. Geographers study the distribution of a wide variety of cultural and environmental features-social customs, agricultural patterns, the use of resources- many of which transcend political boundaries. As scientists, geographers also try to explain why we can observe these patterns on the landscape.
KEY ISSU E 1
How Do Geographers Describe Where Things Are? • Maps
• Contemporary tools
20 ·· ~.;~A (HAWAII)
10°
oo 140° 130°
10°
20°
.. PITCAIRN (UK)
30°
40°
50°
Geography's most important tool for thinking spatially about the distribution of features across Earth is a map. "[B]efore travel began a map existed first" (Zbigniew Herbert, "Home," in Still Ute with a Bridle).
As you turn the pages of this book, the first thing you may notice is the large number of maps-more than 200. These maps range in size from tiny boxes covering part of a city (Figure 1-1) to two-page spreads of the entire world
~ ICELAND
60°
50°
40°
30°
OCEAN
20°
OCEAN
120°
50°
110° 100°
Tropic of Capricorn
30° 30°
40° 40°
50° 50° ~ALKLAND IS. S. GEORGIA
(UK) ~ (UK)
(Figure 1-2). Some are highly detailed, with complex colors, lines, points, and shadings, whereas others seem highly generalized and unrealistic.
Like a model automobile or ship, a map is a scale model of the real world, made small enough to work with on a desk or computer. It can be a hasty here's-how-to-get-to-the-party sketch, an elaborate work of art, or a precise computer-generated product. For centuries, geographers have worked to perfect the science of mapmaking, called cartography. Contemporary cartographers are assisted by computers and satellite imagery.
To communicate geographic concepts effectively through maps, cartographers must design them properly and ensure that users know how to read them. A map, after all , differs from a photograph because it is a less literal representation of Earth, an artistic creation constrained by scientific principles. Cartographers must make two especially important decisions in creating a map-scale and projection.
.o"
10° 0°
~· o,,,,, ... .. ..
MALDIVES ~: ..
LI BE HtA f ,...-~'-i'
GHANATOGOBENIN /,
sAo TOME AN D PRiNCI PE <" EQUATORIAL GUINEA
60° 70° ,7
40°
ATLANTIC OCEAN
50°
sevtHELLES /AN --•. ,. IND
Tropic of Capricorn
30°
40°
1,000 3,000 MILES 4r 50°
2,000
1,000 2,000 3,000 KILOMETERS
MODIFIED GOODE'S HOMOLOSINE EQUAL-AREA PROJECTION
Maps A map serves two purposes: It is a tool for storing reference material and a tool for communicating geographic information. As a reference source, a map helps us to find the shortest route between two places and to avoid getting lost along the way. We consult maps to learn where in the world something is found, especially in relation to a place we know, such as a town, body of water, or highway. The maps in an atlas or a road map are especially useful for this purpose.
As a communications tool, a map is often the best means for depicting the distribution of human activities or physical features, as well as for thinking about reasons underlying a distribution. A series of maps of the same area over several years can reveal dynamic processes at work, such as human migration or spread of a disease. Patterns on maps may suggest interactions among different features of Earth. Placing information on a map is a principal way that geographers share data or results of scientific analysis.
20°
30°
40°
110° 120° 130° 140°
Early Mapmaking
Maps 7
l-.... ,. -~~ ..... ...-.
• 40°
PACIFIC
30°
-~ ··•. OCEAN
\ v 150°
Tropic· of Cancer
-•.. . 20°
NO:~~~~ ··: :; ISLANDS :
MICRON ES!~· 10°
.. ·. . .. ~ -.140° 150°•" • 160°
170° 180° 170° 0
: • .-:· MARSHALL •• •• ISLANDS
CORAL
SEA
NAURU
VANUATU~:: ·~ ·,
Equator
•..: ° KIRIBATI
0 TUVALU
SAMOA-
F~', TONGA•
NEW·,:, CALE DONIA
(FR.) Tropic of Capricorn
PACIFIC
OCEAN NEW [/
'"d 160° £) 180° 170' 160°
10°
0'
10°
20°
30°
40°
The earliest surviving maps were drawn by Babylonians on clay tablets about 2300 B.C., but mapmaking is undoubtedly even older. From the earliest human occupancy of Earth, people have been creating maps to assist with navigation. Mediterranean sailors and traders made maps of rock formations, islands, and ocean currents as early as 800 B.C. Miletus, a port in present-day Turkey, became a center for geographic thought and mapmaking in the ancient world. Thales (624?- 546? B.C.) applied principles of geometry to measuring land area. His student, Anaximander (610- 546? B.C.), made a world map based on information from sailors, though he portrayed Earth's shape as a cylinder. Hecateus may have produced the first geography book around 500 B.C.
Aristotle (384-322 B.C.) was the first to demonstrate that Earth was spherical. He observed that matter falls together toward a common center, that Earth's shadow on the Moon is circular during an eclipse, and that the visible groups of stars change as one
8 Chapter 1 Thinking Geographically
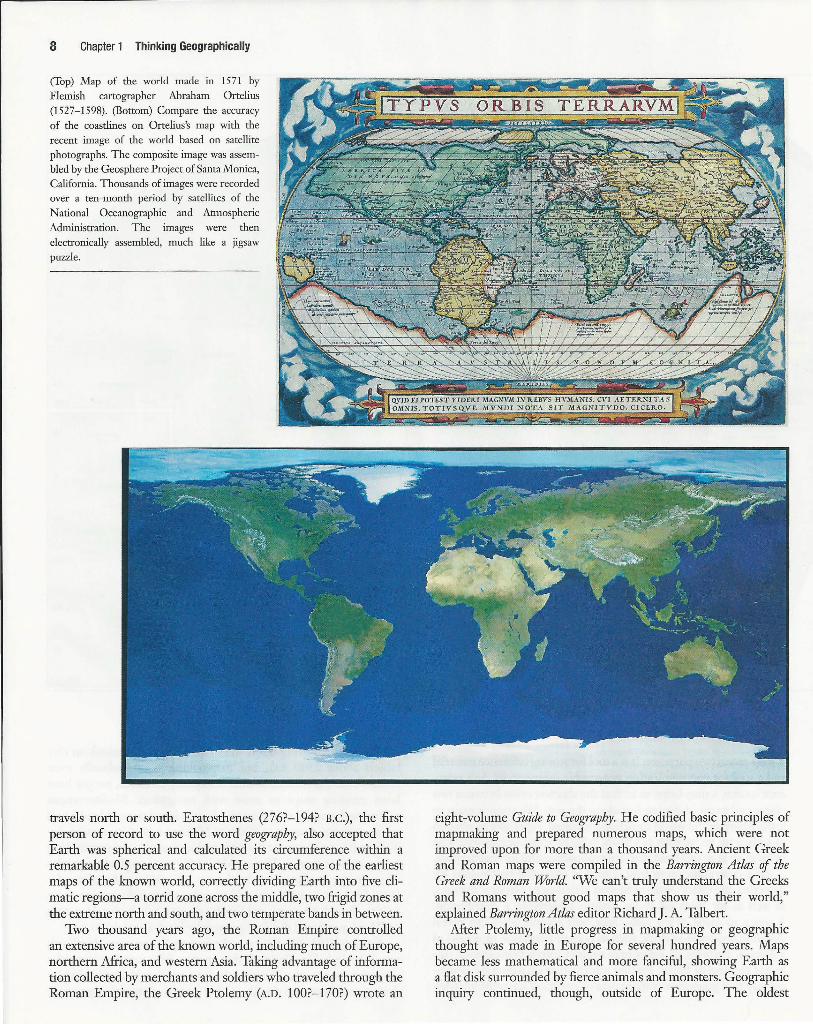
(Top) Map of the world made in 1571 by
Flemish cartographer Abraham Ortelius (1527-1598). (Bottom) Compare the accuracy of the coastlines on Ortelius's map with the recent image of the world based on satellite photographs. The composite image was assembled by the Geosphere Project of Santa Monica, California. Thousands of images were recorded over a ten-month period by satellites of the National Oceanographic and Atmospheric Administration. The images were then electronically assembled, much like a jigsaw
puzzle.
QYJD fl POTIST VIDEllI :.\IAGNVAI IN lUllVS HVMANJS. CV! AE T:ERNI TA S OA!NIS, TOTIVSQ.VE MVNDI NOTA SIT .l>IAGNTTVDO. CICERO.
travels north or south. Eratosthenes (276?-194? B.C.), the first person of record to use the word geography, also accepted that Earth was spherical and calculated its circumference within a remarkable 0.5 percent accuracy. He prepared one of the earliest maps of the lmown world, correctly dividing Earth into five climatic regions-a torrid zone across the middle, two frigid zones at the extreme north and south, and two temperate bands in between.
Two thousand years ago, the Roman Empire controlled an extensive area of the lmown world, including much of Europe, northern Africa, and western Asia. Taking advantage of information collected by merchants and soldiers who traveled through the Roman Empire, the Greek Ptolemy (A.D. 100?-170?) wrote an
eight-volume Guide to Geography. He codified basic principles of mapmaking and prepared numerous maps, which were not improved upon for more than a thousand years. Ancient Greek and Roman maps were compiled in the Barrington Atlas of the Greek and Roman World. "We can't truly understand the Greeks and Romans without good maps that show us t:h,eir world," explained Barrington Atlas editor Richard]. A. Talbert.
After Ptolemy, little progress in mapmaking or geographic thought was made in Europe for several hundred years. Maps became less mathematical and more fanciful, showing Earth as a flat disk surrounded by fierce animals and monsters. Geographic inquiry continued, though, outside of Europe. The oldest
Chinese geographical wntmg, from the fifth century B.C.,
describes the economic resources of the country's different provinces. Phei Hsiu (or Fei Xiu), the "father of Chinese cartography," produced an elaborate map of the country in A.D. 267. The Muslim geographer al-Idrisi (1100-1165?) prepared a world map and geography text in 1154, building on Ptolemy's long-neglected work. Ibn-Battutah (1304-1368?) wrote Rihlah ("Travels") based on three decades of journeys covering more than 120,000 kilometers (75,000 miles) through the Muslim world of northern Africa, southern Europe, and much of Asia.
A revival of geography and mapmaking occurred during the Age of Exploration and Discovery. Ptolemy's maps were rediscovered, and his writings were translated into European languages. Columbus, Magellan, and other explorers who sailed across the oceans in search of trade routes and resources required accurate maps to reach desired destinations without wrecking their ships. In turn, cartographers such as Gerardus Mercator (1512-1594) and Abraham Ortelius (1527-1598) took information collected by the explorers to create more accurate maps. By the seventeenth century, maps accurately displayed the outline of most continents and the positions of oceans. Bernhardus Varenius (1622-1650) produced Geographia Generalis, which stood for more than a century as the standard treatise on systematic geography.
Map Scale The first decision a cartographer faces is how much of Earth's surface to depict on the map. Is it necessary to show the entire globe, or just one continent, or a country, or a city? To make a scale model of the entire world, many details must be omitted because there simply is not enough space. Conversely, if a map shows only a small portion of Earth's surface, such as a street map of a city, it can provide a wealth of detail about a particular place.
The level of detail and the amount of area covered on a map depend on its scale. When specifically applied to a map, scale refers to the relationship of a feature's size on a map to its actual size on Earth. Map scale is presented in three ways: a fraction (1124,000) or ratio (1 :24,000), a written statement (" 1 inch equals 1 mile"), or a graphic bar scale (Figure 1-3). Maps often display scale in more than one of these three ways.
A fractional scale shows the numerical ratio between distances on the map and Earth's surface. A scale of 1:24,000 or 1124,000 means that one unit (inch, centimeter, foot, finger length) on the map represents 24,000 of the same unit (inch, centimeter, foot, finger length) on the ground. The unit chosen for distance can be anything, as long as the units of measure on both the map and the ground are the same. The 1 on the left side of the ratio always refers to a unit of distance on the map, and the number on the right always refers to the same unit of distance on Earths suiface.
The written scale describes this relation between map and Earth distances in words. For example, the statement "l inch equals 1 mile" on a map means that one inch on the map represents one mile on Earth's surface. Again, the first number always refers to map distance, and the second to distance on Earth's surface.
A graphic scale usually consists of a bar line marked to show distance on Earth's surface. To use a bar line, first determine with a ruler the distance on the map in inches or centimeters. Then hold the ruler against the bar line and read the number on
Maps 9
the bar line opposite the map distance on the ruler. The number on the bar line is the equivalent distance on Earth's surface.
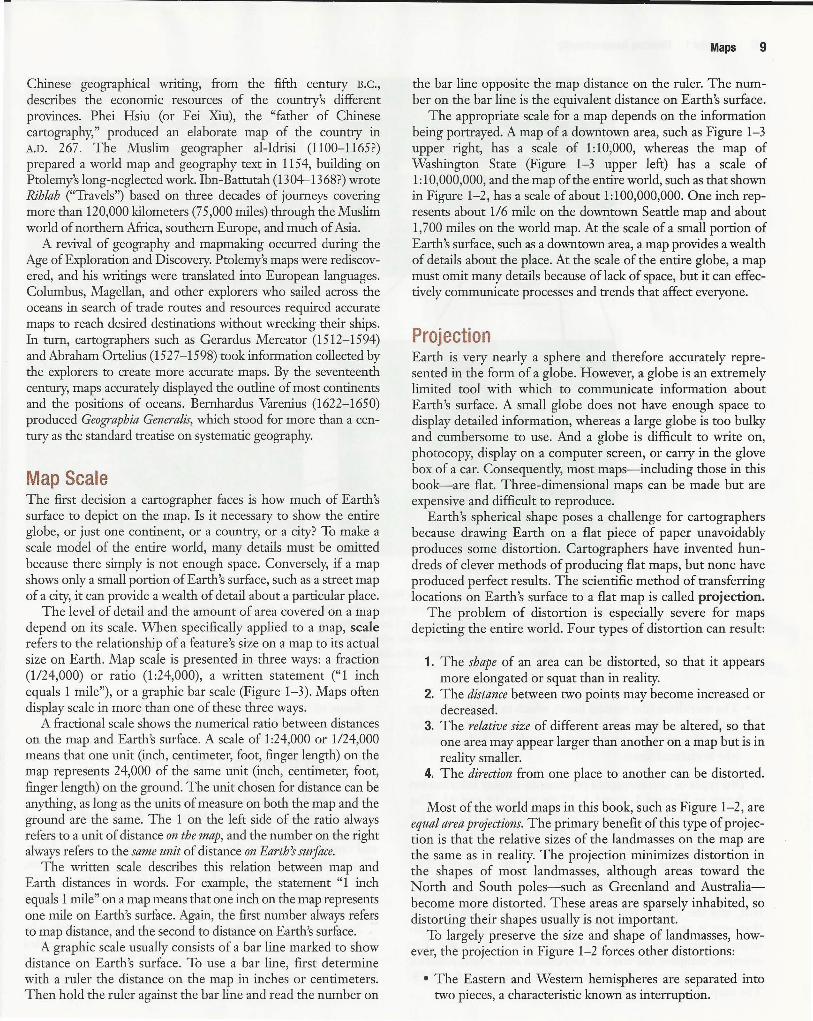
The appropriate scale for a map depends on the information being portrayed. A map of a downtown area, such as Figure 1-3 upper right, has a scale of 1:10,000, whereas the map of Washington State (Figure 1-3 upper left) has a scale of 1: 10,000,000, and the map of the entire world, such as that shown in Figure 1-2, has a scale of about 1:100,000,000. One inch represents about 1/6 mile on the downtown Seattle map and about 1,700 miles on the world map. At the scale of a small portion of Earth's surface, such as a downtown area, a map provides a wealth of details about the place. At the scale of the entire globe, a map must omit many details because of lack of space, but it can effectively communicate processes and trends that affect everyone.
Projection Earth is very nearly a sphere and therefore accurately represented in the form of a globe. However, a globe is an extremely limited tool with which to communicate information about Earth's surface. A small globe does not have enough space to display detailed information, whereas a large globe is too bulky and cumbersome to use. And a globe is difficult to write on, photocopy, display on a computer screen, or carry in the glove box of a car. Consequently, most maps-including those in this book-are flat. Three-dimensional maps can be made but are expensive and difficult to reproduce.
Earth's spherical shape poses a challenge for cartographers because drawing Earth on a flat piece of paper unavoidably produces some distortion. Cartographers have invented hundreds of clever methods of producing flat maps, but none have produced perfect results. The scientific method of transferring locations on Earth's surface to a flat map is called projection.
The problem of distortion is especially severe for maps depicting the entire world. Four types of distortion can result:
1. The shape of an area can be distorted, so that it appears more elongated or squat than in reality.
2. The distance between two points may become increased or decreased.
3. The relative size of different areas may be altered, so that one area may appear larger than another on a map but is in reality smaller.
4. The direction from one place to another can be distorted.
Most of the world maps in this book, such as Figure 1-2, are equal area projections. The primary benefit of this type of projection is that the relative sizes of the landmasses on the map are the same as in reality. The projection minimizes distortion in the shapes of most landmasses, although areas toward the North and South poles-such as Greenland and Australiabecome more distorted. These areas are sparsely inhabited, so distorting their shapes usually is not important.
To largely preserve the size and shape of landmasses, however, the projection in Figure 1-2 forces other distortions:
• The Eastern and Western hemispheres are separated into two pieces, a characteristic known as interruption.
10 Chapter 1 Thinking Geographically
1 :1,000,000 1:100,000
5 10 MILES 0.5 1 MILE
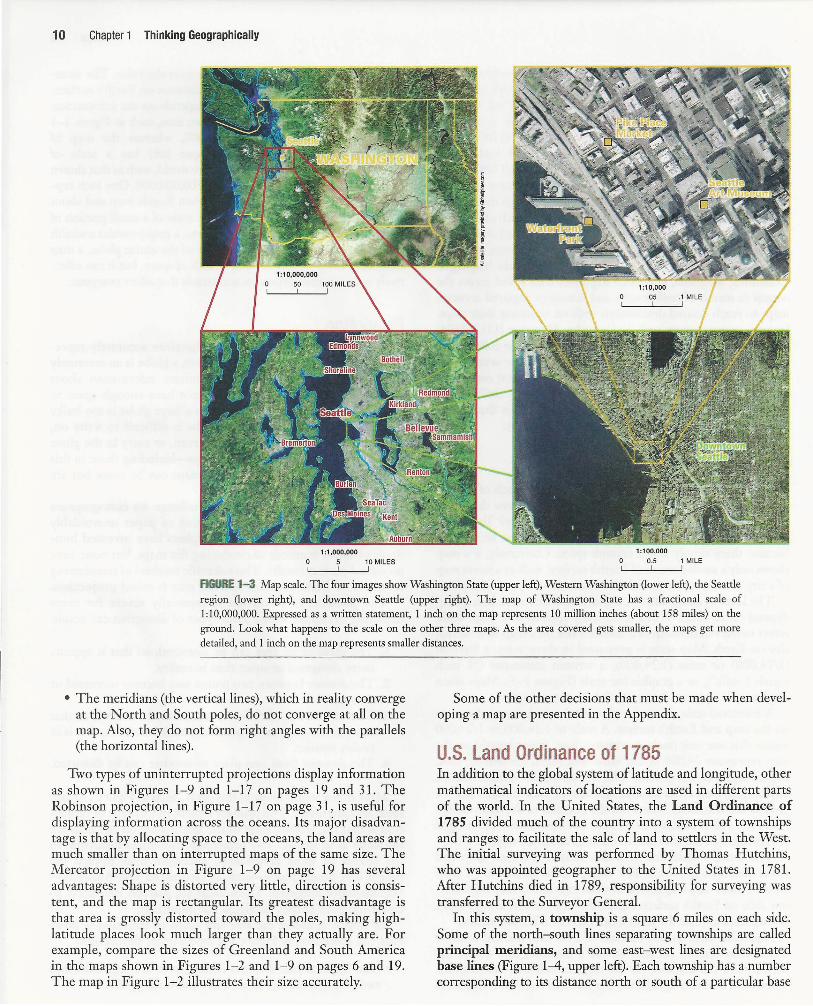
FIGURE 1-3 Map scale. The four images show Washington State (upper left), Western Washington (lower left), the Seattle region (lower right), and downtown Seattle (upper right). The map of Washington State has a fractional scale of 1:10,000,000. Expressed as a written statement, 1 inch on the map represents 10 million inches (about 158 miles) on the ground. Look what happens to the scale on the other three maps. As the area covered gets smaller, the maps get more detailed, and 1 inch on the map represents smaller distances.
• The meridians (the vertical lines), which in reality converge at the North and South poles, do not converge at all on the map. Also, they do not form right angles with the parallels (the horizontal lines).
Two types of uninterrupted projections display information as shown in Figures 1-9 and 1-1 7 on pages 19 and 31. The Robinson projection, in Figure 1- 17 on page 31, is useful for displaying information across the oceans. Its major disadvantage is that by allocating space to the oceans, the land areas are much smaller than on interrupted maps of the same size. The Mercator projection in Figure 1-9 on page 19 has several advantages: Shape is distorted very little, direction is consistent, and the map is rectangular. Its greatest disadvantage is that area is grossly distorted toward the poles, making highlatitude places look much larger than they actually are. For example, compare the sizes of Greenland and South America in the maps shown in Figures 1-2 and 1-9 on pages 6 and 19. The map in Figure 1- 2 illustrates their size accurately.
Some of the other decisions that must be made when developing a map are presented in the Appendix.
U.S. Land Ordinance of 1785 In addition to the global system oflatitude and longitude, other mathematical indicators of locations are used in different parts of the world. In the United States, the Land Ordinance of 1 785 divided much of the country into a system of townships and ranges to facilitate the sale of land to settlers in the West~ The initial surveying was performed by Thomas Hutchins, who was appointed geographer to the United States in 1781. After Hutchins died in 1789, responsibility for surveying was transferred to the Surveyor General.
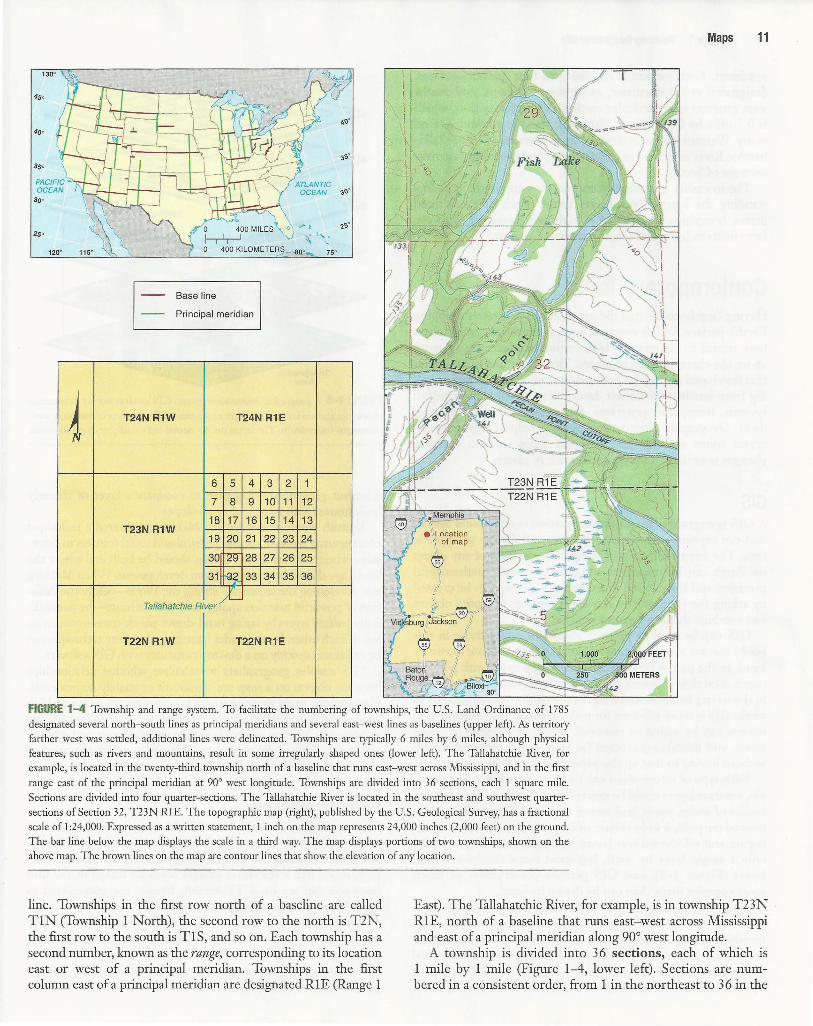
In this system, a township is a square 6 miles on each side. Some of the north-south lines separating townships are called principal meridians, and some east- west lines are designated base lines (Figure 1-4, upper left). Each township has a number corresponding to its distance north or south of a particular base
Base line
Principal meridian
~ T24N R1W T24N R1E
6 5 4 3 2 1
7 8 9 10 11 12
18 17 16 15 14 13 I T23N R1W
19 20 21 22 23 24
30 ""29"" 28 27 26 25
31 ~ 33 34 35 36
Tallahatchie River _,;(_
T22N R1W T22N R1E
RGURE 1-4 Township and range system. To facilitate the numbering of townships, the U.S. Land Ordinance of 1785 designated several north-south lines as principal meridians and several east-west lines as baselines (upper left). As territory farther west was settled, additional lines were delineated. Townships are typically 6 miles by 6 miles, although physical features, such as rivers and mountains, result in some irregularly shaped ones (lower left). The Tallahatchie River, for example, is located in the twenty-third township north of a baseline that runs east- west across Mississippi, and in the first range east of the principal meridian at 90° west longitude. Townships are divided into 36 sections, each 1 square mile. Sections are divided into four quarter-sections. The Tallahatchie River is located in the southeast and southwest quartersections of Section 32, T23N RlE. The topographic map (right), published by the U.S. Geological Survey, has a fractional scale of 1 :24,000. Expressed as a written statement, 1 inch on the map represents 24,000 inches (2,000 feet) on the ground. The bar line below the map displays the scale in a third way. The map displays portions of two townships, shown on the above map. The brown lines on the map are contour lines that show the elevation of any location.
Maps 11
line. Townships in the first row north of a baseline are called TlN (Township 1 North), the second row to the north is T2N, the first row to the south is TlS, and so on. Each township has a second number, known as the range, corresponding to its location east or west of a principal meridian. Townships in the first column east of a principal meridian are designated RlE (Range 1
East). The Tallahatchie River, for example, is in township T23N RlE, north of a baseline that runs east-west across Mississippi and east of a principal meridian along 90° west longitude.
A township is divided into 36 sections, each of which is 1 mile by 1 mile (Figure 1-4, lower left). Sections are numbered in a consistent order, from 1 in the northeast to 36 in the
12 Chapter 1 Thinking Geographically
southeast. Each section is divided into four quarter-sections, designated as the northeast, northwest, southeast, and southwest quarters of a particular section. A quarter-section, which is 0.5 mile by 0.5 mile, or 160 acres, was the amount of land many Western pioneers bought as a homestead. The Tallahatchie River is located in the southeast and southwest quartersections of Section 3 2.
The township and range system remains important in understanding the location of objects across much of the United States. It explains the location of highways across the Midwest, farm fields in Iowa, and major streets in Chicago.
Contemporary Tools Having largely completed the great task of accurately mapping Earth's surface, which required several centuries, geographers have turned to Geographic Information Science to learn more about the characteristics of places. Two important technologies that developed during the past quarter-century are remote sensing from satellites (to collect data) and geographic information systems (computer programs for manipulating geographic data). Geographic Information Science helps geographers to create more accurate and complex maps and to measure changes over time in the characteristics of places.
GIS A GIS (geographic information system) is a computer system that can capture, store, query, analyze, and display geographic data. The key to GIS is geocoding: The position of any object on Earth can be measured and recorded with mathematical precision and then stored in a computer. A map can be created by asking the computer to retrieve a number of stored objects and combine them to form an image.
GIS can be used to produce maps (including those in this book) that are more accurate and attractive than those drawn by hand. In the past, when cartographers drew maps with pen and paper, a careless moment could result in an object being placed in the wrong location, and a slip of the hand could ruin hours of work. GIS is more efficient for making a map than pen and ink: objects can be added or removed, colors brightened or toned down, and mistakes corrected (as long as humans find them!) without having to tear up the paper and start from scratch.
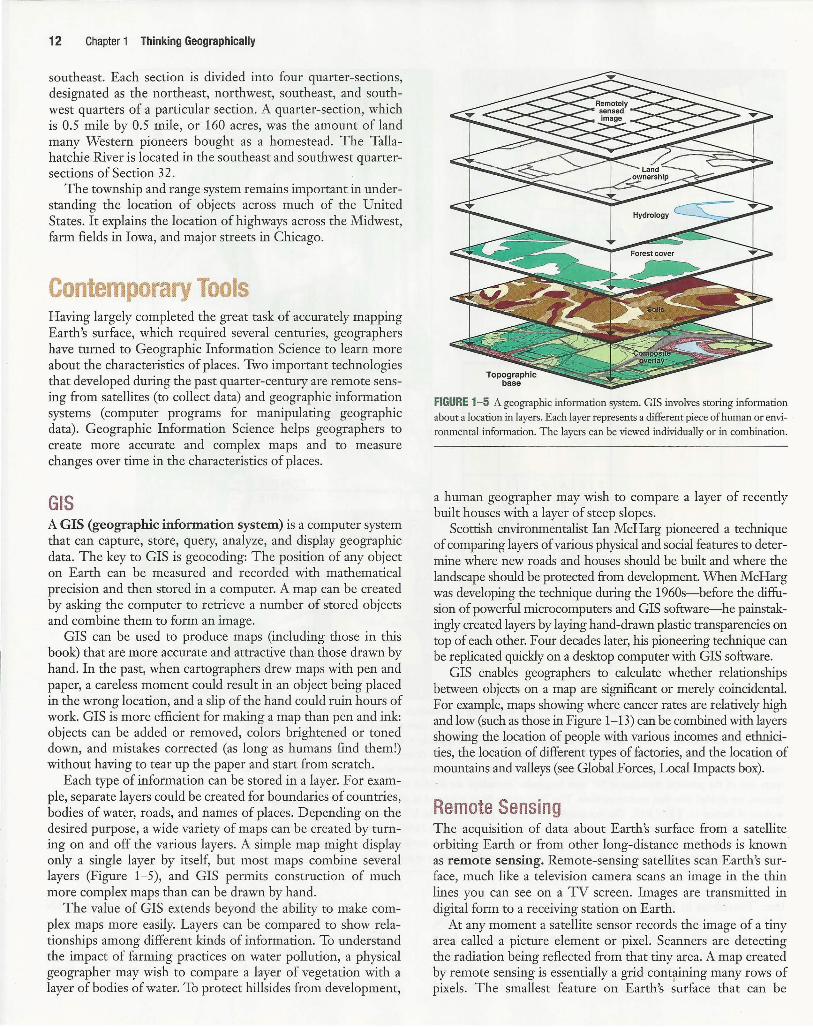
Each type of information can be stored in a layer. For example, separate layers could be created for boundaries of countries, bodies of water, roads, and names of places. Depending on the desired purpose, a wide variety of maps can be created by turning on and off the various layers. A simple map might display only a single layer by itself, but most maps combine several layers (Figure 1-5), and GIS permits construction of much more complex maps than can be drawn by hand.
The value of GIS extends beyond the ability to make complex maps more easily. Layers can be compared to show relationships among different kinds of information. To understand the impact of farming practices on water pollution, a physical geographer may wish to compare a layer of vegetation with a layer of bodies of water. To protect hillsides from development,
FIGURE 1-5 A geographic information system. GIS involves storing information about a location in layers. Each layer represents a different piece of human or envi
ronmental information. The layers can be viewed individually or in combination.
a human geographer may wish to compare a layer of recently built houses with a layer of steep slopes.
Scottish environmentalist Ian McHarg pioneered a technique of comparing layers of various physical and social features to determine where new roads and houses should be built and where the landscape should be protected from development. When McHarg was developing the technique during the 1960s-before the diffusion of powerful microcomputers and GIS software-he painstakingly created layers by laying hand-drawn plastic transparencies on top of each other. Four decades later, his pioneering technique can be replicated quickly on a desktop computer with GIS software.
GIS enables geographers to calculate whether relationships between objects on a map are significant or merely coincidental. For example, maps showing where cancer rates are relatively high and low (such as those in Figure 1-13) can be combined with layers showing the location of people with various incomes and ethnicities, the location of different types of factories, and the location of mountains and valleys (see Global Forces, Local Impacts box).
Remote Sensing The acquisition of data about Earth's surface from a satellite orbiting Earth or from other long-distance methods is known as remote sensing. Remote-sensing satellites scan Earth's surface, much like a television camera scans an image in the thin lines you can see on a TV screen. Images are transmitted in digital form to a receiving station on Earth.
At any moment a satellite sensor records the image of a tiny area called a picture element or pixel. Scanners are detecting the radiation being reflected from that tiny area. A map created by remote sensing is essentially a grid contjlining many rows of pixels. The smallest feature on Earth's surface that can be
GLOBAL FORCES, LOCAL IMPACTS Computer Mapping Services
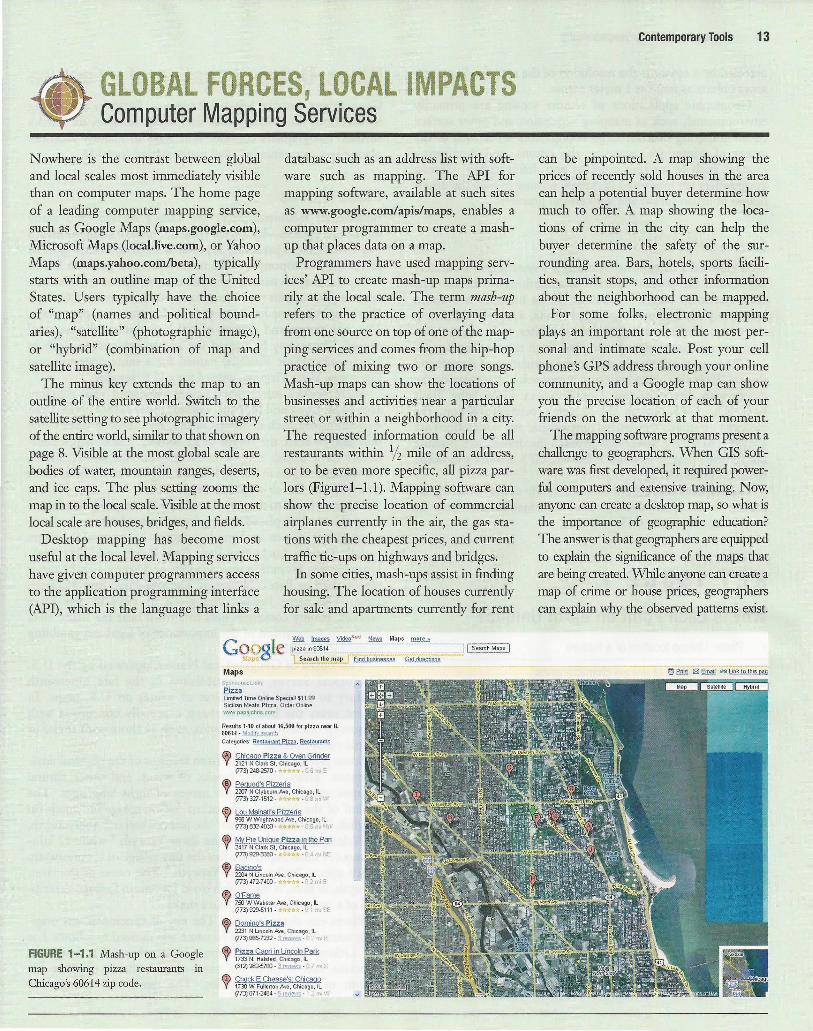
Nowhere is the contrast between global and local scales most immediately visible than on computer maps. The home page of a leading computer mapping service, such as Google Maps (maps.google.com), Microsoft Maps (local.live.com), or Yahoo Maps (maps.yahoo.com/beta), typically starts with an outline map of the United States. Users typically have the choice of "map" (names and political boundaries), "satellite" (photographic image), or "hybrid" (combination of map and satellite image).
database such as an address list with software such as mapping. The API for mapping software, available at such sites as www.google.com/apis/maps, enables a computer programmer to create a mashup that places data on a map.
Programmers have used mapping services' API to create mash-up maps primarily at the local scale. The term mash-up refers to the practice of overlaying data from one source on top of one of the mapping services and comes from the hip-hop practice of mixing two or more songs. Mash-up maps can show the locations of businesses and activities near a particular street or within a neighborhood in a city. The requested information could be all restaurants within 1/ 2 mile of an address, or to be even more specific, all pizza parlors (Figurel-1.1). Mapping software can show the precise location of commercial airplanes currently in the air, the gas stations with the cheapest prices, and current traffic tie-ups on highways and bridges.
The minus key extends the map to an outline of the entire world. Switch to the satellite setting to see photographic imagery of the entire world, similar to that shown on page 8. Visible at the most global scale are bodies of water, mountain ranges, deserts, and ice caps. The plus setting zooms the map in to the local scale. Visible at the most local scale are houses, bridges, and fields.
Desktop mapping has become most useful at the local level. Mapping services have given computer programmers access to the application programming interface (API), which is the language that links a
In some cities, mash-ups assist in finding housing. The location of houses currently for sale and apartments currently for rent
FIGURE 1-1.1 Mash-up on a Google map showing pizza restaurants in Chicago's 60614 zip code.
Maps SpJn<;N~jL-n
Pizza Limited Time Online Special! $11.99 Sicilian Meats Pizz.1. Order Online. wwwpapaJohnscom
Results 1·10 of about 16.500 fo1 11iu.1 near IL 606U· ~$!1 Categories: Restaurant pjuR ,~
(A) Chicago Pizza & Oven Grinder Y 2121 N Clark St, Chicago, 1L
(773)248-2570· • ** · DGm;E
(B) Pequod's Pizzeria Y 2'107 N Clyboum Ave, Chicago, IL
(173) 327·1512 · • ll'** · ll 8 r'1
© Lou Malnali's Pjzzeda Y 958 W Wrigh1wood Ave, Chicago, ll
(773)832-4030· ••• .r;. . i:s mi~·
(15) My Pie Unique Pizza tn the Pan Y 2417 N Clark SI, Chicago, IL
(773) 929-3380 - • - W 4 rr:; ~.E
(E)~ Y 2204 N Lincoln Ave, Chicago, IL
(773) 472-7400 - "+ - 0:: l't'i E
(F) O'Fame Y 750WWebsterAve, Chicago, IL
(773) 929-5111 - "'*.i * -D' rr,, SE
® Domino's Pizza Y 2231 N Lincoln Ave, Chicago, IL
(173) 665-7232 - ~ rt>·~""'· s - _ ._ ri E
(H) Pizza Capri in Lincoln Park V 1m N. Hals1ed, Chicago, IL
(312) 280-5700 -~ - 0 7 :'tli s
(i) Chuck E Cheese's: Chicago V 1730 W Fullerton Ave, Chicago . !L
(773)871 -2484 -~- ' ;::.,.,,,,.,
Contemporary Tools 13
can be pinpointed. A map showing the prices of recently sold houses in the area can help a potential buyer determine how much to offer. A map showing the locations of crime in the city can help the buyer determine the safety of the surrounding area. Bars, hotels, sports facilities, transit stops, and other information about the neighborhood can be mapped.
For some folks, electronic mapping plays an important role at the most personal and intimate scale. Post your cell phone's GPS address through your online community, and a Google map can show you the precise location of each of your friends on the network at that moment.
The mapping software programs present a challenge to geographers. When GIS software was first developed, it required powerful computers and extensive training. Now, anyone can create a desktop map, so what is the importance of geographic education? The answer is that geographers are equipped to explain the significance of the maps that are being created. While anyone can create a map of crime or house prices, geographers can explain why the observed patterns exist.
14 Chapter 1 Thinking Geographically
detected by a sensor is the resolution of the scanner. Some can sense objects as small as 1 meter across.
Geographic applications of remote sensing are primarily environmental, such as mapping vegetation and other surface cover, gathering data for large unpopulated areas such as the extent of winter ice cover on the oceans, and monitoring changes such as weather patterns and deforestation. Human geographers are interested in remote sensing to map the distribution of urban sprawl and agricultural practices.
GPS GPS (Global Positioning System) is a system that accurately determines the precise position of something on Earth. The GPS system in use in the United States includes two dozen satellites placed in predetermined orbits, a series of tracking stations to monitor and control the satellites, and receivers that compute position, velocity, and time from the satellite signals.
GPS is most commonly used in the navigation of aircraft and ships. GPS is also being built into motor vehicles to provide the driver with directions (see Contemporary Geography Tools box). The GPS detects the vehicle's current position, the motorist programs the desired destination, and instructions are provided to tell the driver how to reach the destination. Because the vehicle's precise location is known, GPS enables a motorist to summon help in an emergency.
Geographers find GPS to be particularly useful in coding the precise location of objects. That information can later be entered as a layer in a GIS.
KEY ISSUE 2
Why Is Each Point on Earth Unique? • Place: Unique location of a feature
• Regions: Areas of unique characteristics
Each place on Earth is in some respects unique and in other respects similar to other places. The interplay between the uniqueness of each place and the similarities among places lies at the heart of geographic inquiry into why things are found where they are. Two basic concepts help geographers to explain why every point on Earth is in some ways unique-place and region. The difference between the two concepts is partly a matter of scale: A place is a point, whereas a region is an area.
Humans possess a strong sense of place-that is, a feeling for the features that contribute to the distinctiveness of a particular spot on Earth, perhaps a hometown, vacation destination, or part of a country. Describing the features of a place or region is an essential building block for geographers to explain similarities, differences, and changes across Earth. Geographers think about where particular places and regions are located and the combination of features that make each place and region on Earth distinct.
Place: Unique Location of a Feature Geographers describe a feature's place on Earth by identifying its location, the position that something occupies on Earth's surface. Geographers consider four ways to identify location: place name, site, situation, and mathematical location.
Place Names Because all inhabited places on Earth's surface-and many uninhabited places-have been named, the most straightforward way to describe a particular location is often by referring to its place name. A toponym is the name given to a place on Earth.
A place may be named for a person, perhaps its founder or a famous person with no connection to the community. George Washington's name has been selected for one state, counties in 31 other states, and dozens of cities, including the national capital. Places may be named for an obscure person, such as Jenkinjones, West Virginia, named for a mine operator, and Gassaway, West Virginia, named for a U.S. senator.
Some settlers select place names associated with religion, such as St. Louis and St. Paul, whereas other names derive from ancient history, such as Athens, Attica, and Rome. A place name may also indicate the origin of its settlers. Place names commonly have British origins in North America and Australia, Portuguese origins in Brazil, Spanish origins elsewhere in Latin America, and Dutch origins in South Africa.
Pioneers lured to the American West by the prospect of finding gold or silver placed many picturesque names on the landscape. Place names in Nevada selected by successful miners include Eureka, Lucky Boy Pass, Gold Point, and Silver Peak. Unsuccessful Nevada pioneers sadly or bitterly named other places, such as Battle Mountain, Disaster Peak, and Massacre Lake. The name Jackpot was given in 1959 by the Elko, Nevada, county commissioners to a town near the Idaho state border in recognition of the importance of legalized gambling to the local economy.
The Board of Geographical Names, operated by the U.S. Geological Survey, was established in the late nineteenth century to be the final arbiter of names on U.S. maps. In recent years the board has been especially concerned with removing offensive place names, such as those with racial or ethnic connotations.
Some place names derive from features of the physical environment. Trees, valleys, bodies of water, and other natural features appear in the place names of most languages. The capital of the Netherlands, called 's-Gravenhage in Dutch (in English, The Hague), means "the prince's forest." Aberystwyth, in Wales, means "mouth of the River Ystwyth," while 22 kilometers (13 miles) upstream lies the tiny village of Cwmystwyth, which means "valley of the Ystwyth." The name of the river, Ystwyth, in turn, is the Welsh word for "meandering," descriptive of a stream that bends like a snake.
Places can change names. The city of Cincinnati was originally named Losantiville. The name was derived as follows: L is for Licking River; os is Latin for mouth; anti is Latin for opposite; ville is Latin for town-hence, "town opposite the mouth of the Licking River." The name was changed to
Place: Unique Location of a Feature 15
CONTEMPORARY GEOGRAPHIC TOOLS Navigation Devices from Hand-Drawn to Electronic
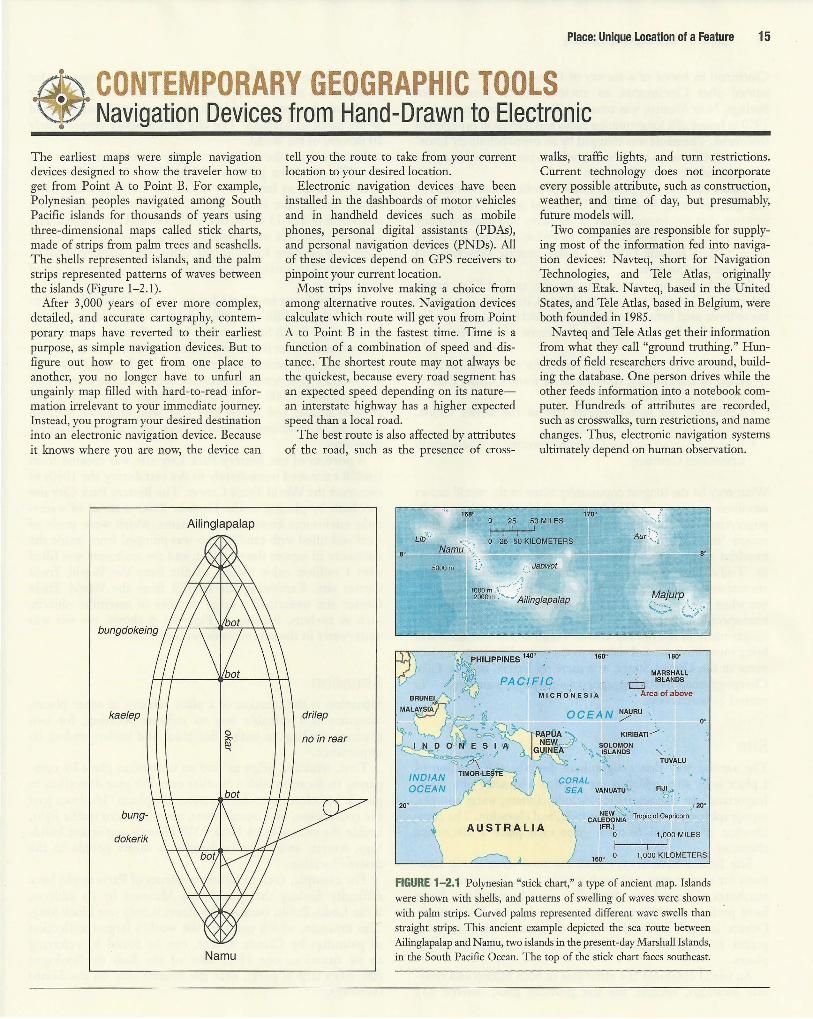
The earliest maps were simple navigation devices designed to show the traveler how to get from Point A to Point B. For example, Polynesian peoples navigated among South Pacific islands for thousands of years using three-dimensional maps called stick charts, made of strips from palm trees and seashells. The shells represented islands, and the palm strips represented patterns of waves between the islands (Figure 1-2.1).
After 3,000 years of ever more complex, detailed, and accurate cartography, contemporary maps have reverted to their earliest purpose, as simple navigation devices. But to figure out how to get from one place to another, you no longer have to unfurl an ungainly map filled with hard-to-read information irrelevant to your immediate journey. Instead, you program your desired destination into an electronic navigation device. Because it knows where you are now, the device can
Ailinglapalap
kaelep
Na mu
tell you the route to take from your current location to your desired location.
Electronic navigation devices have been installed in the dashboards of motor vehicles and in handheld devices such as mobile phones, personal digital assistants (PDAs), and personal navigation devices (PNDs). All of these devices depend on GPS receivers to pinpoint your current location.
Most trips involve making a choice from among alternative routes. Navigation devices calculate which route will get you from Point A to Point B in the fastest time. Time is a function of a combination of speed and distance. The shortest route may not always be the quickest, because every road segment has an expected speed depending on its naturean interstate highway has a higher expected speed than a local road.
The best route is also affected by attributes of the road, such as the presence of cross-
168°
walks, traffic lights, and turn restrictions. Current technology does not incorporate every possible attribute, such as construction, weather, and time of day, but presumably, future models will.
Two companies are responsible for supplying most of the information fed into navigation devices: Navteq, short for Navigation Technologies, and Tele Atlas, originally known as Etak. Navteq, based in the United States, and Tele Atlas, based in Belgium, were both founded in 1985.
Navteq and Tele Atlas get their information from what they call "ground trothing." Hundreds of field researchers drive around, building the database. One person drives while the other feeds information into a notebook computer. Hundreds of attributes are recorded, such as crosswalks, turn restrictions, and name changes. Thus, electronic navigation systems ultimately depend on human observation.
25 50 MILES ··-.. ~
I 1
I 1
~···· O 25 50 KILOMETERS Namu .
·:-.
.5000m L' , ... Jabwot
drilep
no in rear
20°
·? 1000 m _,._ ...... · . :-
2000 m · • .• _ .. Ailinglapalap
PHILIPPINES 1400
PAC/FIG
160°
ryrajurp .
~, C:::./'
180°
MARSHALL
.M 1.C R o"'N_E .S I A
, L'.:3 ISLANDS
.• Area of above
AUSTRALIA
OCEAN ~Ru ·._
KIRIBATI_/ .
, .. TUVALU
. VANUATU 'b- FIJI ,,.
~· •· .• ' ... 20°
NEW'\; ' i; · fC · CALEDONIA rop1c o apncorn (FR.)
0 1,000 MILES
1600 0 1,000 KILOMETERS
FIGURE 1-2.1 Polynesian "stick chart," a type of ancient map. Islands were shown with shells, and patterns of swelling of waves were shown with palm strips. Curved palms represented different wave swells than straight strips. This ancient example depicted the sea route between Ailinglapalap and Namu, two islands in the present-day Marshall Islands, in the South Pacific Ocean. The top of the stick chart faces southeast.
16 Chapter 1 Thinking Geographically
Cincinnati in honor of a society of Revolutionary War heroes named after Cincinnatus, an ancient Roman general. Hot Springs, New Mexico, was renamed Truth or Consequences in 1950 in honor of a long-running radio and television program of that name. The name was changed by an overwhelmingly favorable vote of the town residents in order to promote publicity for the economically struggling town.
Names can also change as a result of political upheavals. For example, following World War II, Poland gained control over territory that was formerly part of Germany and changed many of the place names from German to Polish. Among the larger cities, Danzig became Gdansk, Breslau became Wroclaw, and Stettin became Szczecin.
After the fall of communism in the early 1990s, names throughout Eastern Europe were changed, in many cases reverting to those used before the Communists had gained power a few decades earlier. For example, after the demise of communism:
• Gottwaldov, Czechoslovakia, named for a Communist president of the country, reverted to its former name, Zlin, in the Czech Republic.
• Leningrad, the second-largest city in the Soviet Union, reverted to St. Petersburg, Russia.
• Karl-Marx-Stadt in East Germany reverted to Chemnitz in a reunified Germany.
What may be the longest community name in the world has an economic origin-the Welsh town of Llanfairpwllgwyngyllgogerychwyrndrobwllllantysiliogogogoch. The 58-letter name means "the Church of St. Mary's in the grove of the white hazelnut tree near the rapid whirlpool and the Church of St. Tisilio near the red cave." The town's name originally encompassed only the first 20 letters (Llanfairpwllgwyngyll), but when the railway was built in the nineteenth century, the townspeople lengthened it. They decided that signs with the longer name in the railway station would attract attention and bring more business and visitors to the town. The longest place name in the United States, at a mere 45 letters, may be Lake Chargoggagoggmanchauggagoggchaubunagungamaugg, m central Massachusetts.
Site The second way that geographers describe the location of a place is by site, which is the physical character of a place. Important site characteristics include climate, water sources, topography, soil, vegetation, latitude, and elevation. The combination of physical features gives each place a distinctive character.
Site factors have always been essential in selecting locations for settlements, although people have disagreed on the attributes of a good site, depending on cultural values. Some have preferred a hilltop site for easy defense from attack. Others located settlements near convenient river-crossing points to facilitate communication with people in other places.
An island combines the attributes of both hilltop and riverside locations, because the site provides good defense and
transportation links. The site of the country of Singapore, for example, is a small, swampy island approximately 1 kilometer off the southern tip of the Malay Peninsula at the eastern end of the Strait of Malacca. The city of Singapore covers nearly 20 percent of the island.
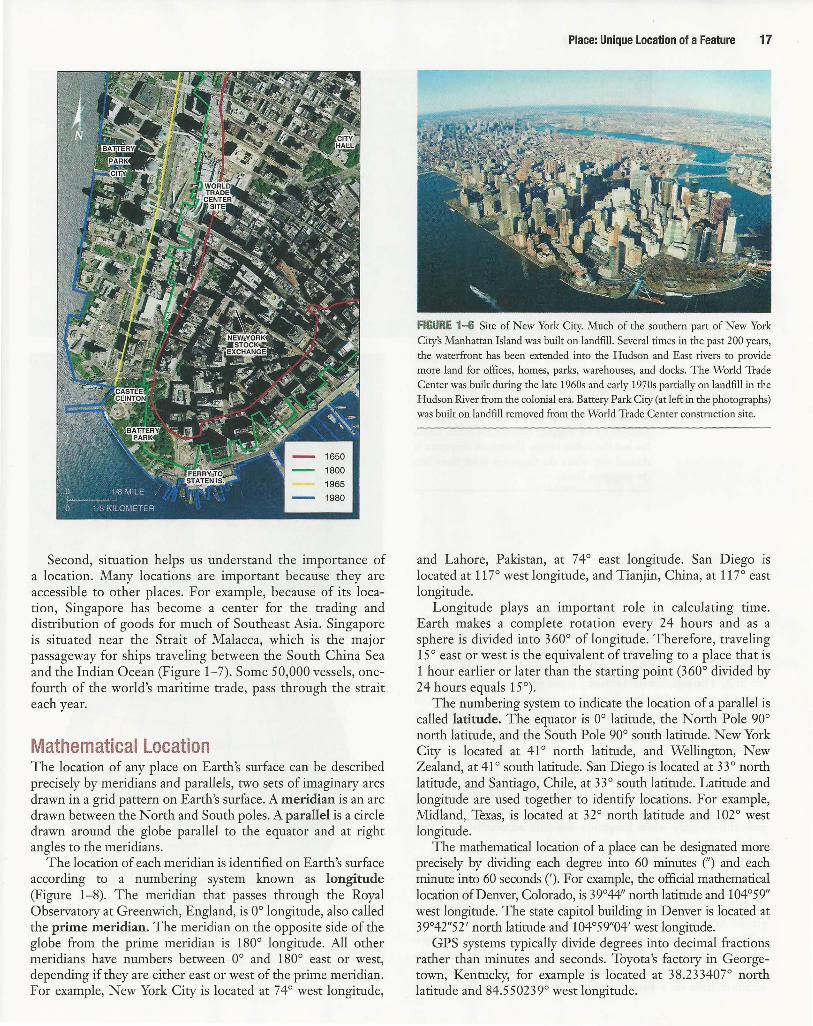
Humans have the ability to modify the characteristics of a site. The southern portion of New York City's Manhattan Island is twice as large today as it was in 1626, when Peter Minuit bought the island from its native inhabitants for the equivalent of $2 3. 7 5 worth of Dutch gold and silver coins. The additional land area was created by filling in portions of the East River and Hudson River. In the eighteenth century, landfills were created by sinking old ships and dumping refuse on top of them.
Because of poor health conditions, the city decided in 1797 to cover all the landfills with soil and gravel and to lay out a new street, called South Street, to halt further dumping in the river. Today South Street is two blocks from the river. More recently, New York City permitted construction of Battery Park City, a 57-hectare (142-acre) site designed to house more than 20,000 residents and 30,000 office workers (Figure 1-6). The central areas of Boston and Tokyo have also been expanded through centuries of landfilling in nearby bays, substantially changing these sites.
A portion of the Battery Park City site was created from landfill excavated immediately to the east during the 1960s to construct the World Trade Center. The Battery Park City site was built by placing in the Hudson River a series of watertight enclosures known as cofferdams, which were made of steel and filled with sand. Water was pumped from inside the enclosure to expose the riverbed, and the enclosure was filled with 1 million cubic meters of dirt from the World Trade Center site. Excavating the landfill from the World Trade Center site unearthed a large number of maritime objects, such as anchors, because as Figure 1-6 shows, the site was underwater in the seventeenth century.
Situation Situation is the location of a place relative to other places. Situation is a valuable way to indicate location, for two reasons-finding an unfamiliar place and understanding its importance.
First, situation helps us find an unfamiliar place by comparing its location with a familiar one. We give directions to people by referring to the situation of a place: "It's down past the courthouse, on Locust Street, after the third traffic light, beside the yellow-brick bank." We identify important buildings, streets, and other landmarks to direct people to the desired location.
For example, even longtime residents of Paris might have difficulty finding the Marmottan Museum by its address, 2 rue Louis-Boilly, because the street is only one block long. The museum, which contains the world's largest collection of paintings by Claude Monet, can be found by referring to its situation: one block east of the Bois de Boulogne (the city's largest park), near the Muette stop on the Metro (subway).
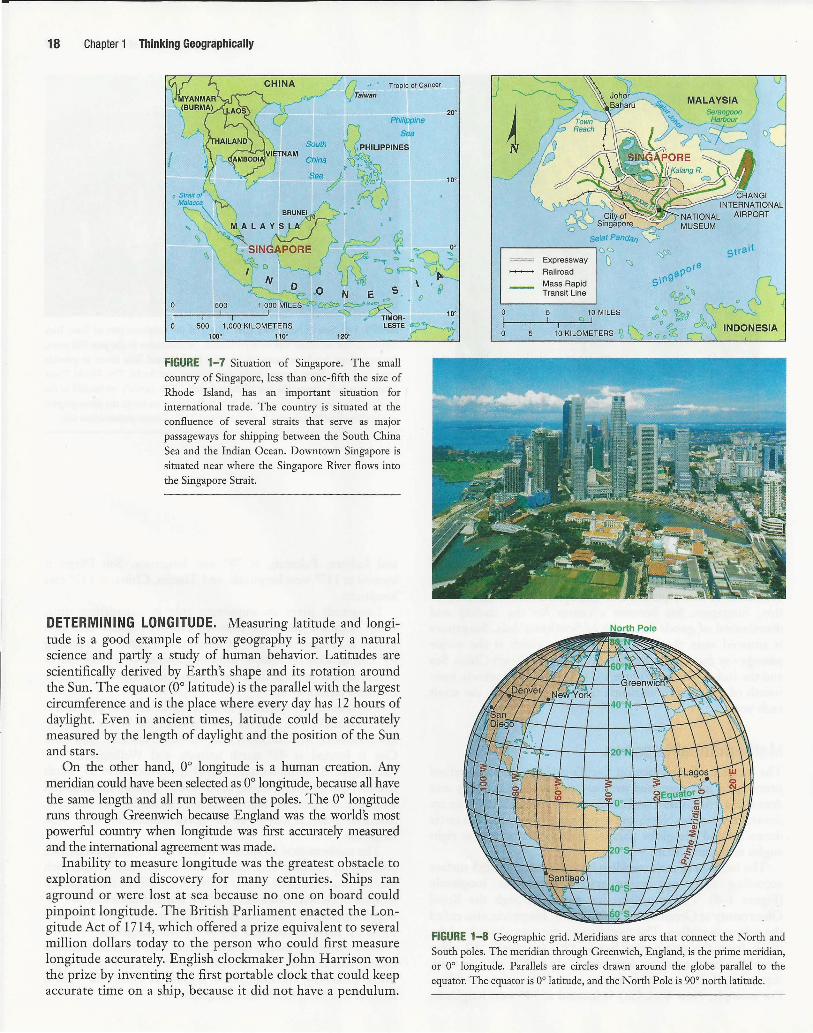
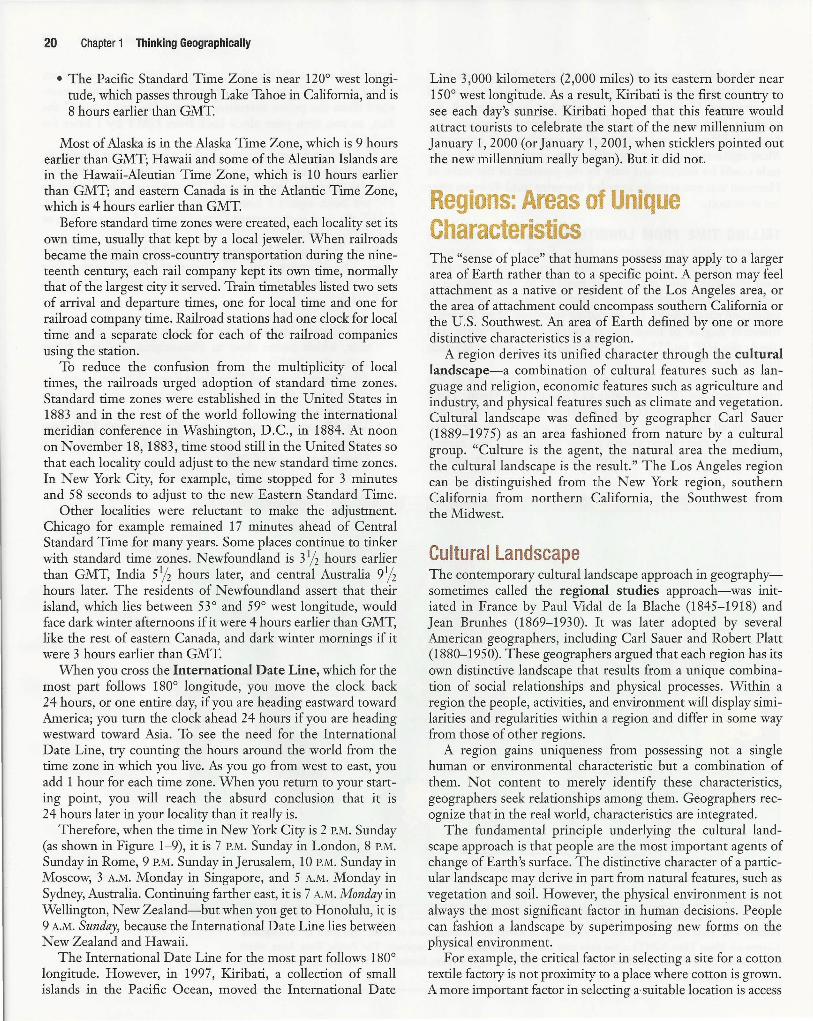
Second, situation helps us understand the importance of a location. Many locations are important because they are accessible to other places. For example, because of its location, Singapore has become a center for the trading and distribution of goods for much of Southeast Asia. Singapore is situated near the Strait of Malacca, which is the major passageway for ships traveling between the South China Sea and the Indian Ocean (Figure 1-7). Some 50,000 vessels, onefourth of the world's maritime trade, pass through the strait each year.
Mathematical Location The location of any place on Earth's surface can be described precisely by meridians and parallels, two sets of imaginary arcs drawn in a grid pattern on Earth's surface. A meridian is an arc drawn between the North and South poles. A parallel is a circle drawn around the globe parallel to the equator and at right angles to the meridians.
The location of each meridian is identified on Earth's surface according to a numbering system known as longitude (Figure 1-8). The meridian that passes through the Royal Observatory at Greenwich, England, is 0° longitude, also called the prime meridian. The meridian on the opposite side of the globe from the prime meridian is 180° longitude. All other meridians have numbers between 0° and 180° east or west, depending if they are either east or west of the prime meridian. For example, New York City is located at 74° west longitude,
Place: Unique Location of a Feature 17
FIGURE 1-6 Site of New York City. Much of the southern part of New York City's Manhattan Island was built on landfill. Several times in the past 200 years, the waterfront has been extended into the Hudson and East rivers to provide more land for offices, homes, parks, warehouses, and docks. The World Trade Center was built during the late 1960s and early 1970s partially on landfill in the Hudson River from the colonial era. Battery Park City (at left in the photographs) was built on landfill removed from the World Trade Center construction site.
and Lahore, Pakistan, at 74° east longitude. San Diego is located at 117° west longitude, and Tianjin, China, at 117° east longitude.
Longitude plays an important role in calculating time. Earth makes a complete rotation every 24 hours and as a sphere is divided into 360° of longitude. Therefore, traveling 15° east or west is the equivalent of traveling to a place that is 1 hour earlier or later than the starting point (360° divided by 24 hours equals 15°).
The numbering system to indicate the location of a parallel is called latitude. The equator is 0° latitude, the North Pole 90° north latitude, and the South Pole 90° south latitude. New York City is located at 41° north latitude, and Wellington, New Zealand, at 41 ° south latitude. San Diego is located at 3 3 ° north latitude, and Santiago, Chile, at 33° south latitude. Latitude and longitude are used together to identify locations. For example, Midland, Texas, is located at 32° north latitude and 102° west longitude.
The mathematical location of a place can be designated more precisely by dividing each degree into 60 minutes n and each minute into 60 seconds('). For example, the official mathematical location of Denver, Colorado, is 39°44" north latitude and 104°59" west longitude. The state capitol building in Denver is focated at 39°42"52' north latitude and 104°59"04' west longitude.
GPS systems typically divide degrees into decimal fractions rather than minutes and seconds. Toyota's factory in Georgetown, Kentucky, for example is located at 38.233407° north latitude and 84.5 50239° west longitude.
18 Chapter 1 Thinking Geographically
/7 ·· ' Tropic of Cancer v Taiwan
0 500
0 500 1,000 KILOMETERS 100° 110°
FIGURE 1-7 Situation of Singapore. The small country of Singapore, less than one-fifth the size of Rhode Island, has an important situation for international trade. The country is situated at the confluence of several straits that serve as major passageways for shipping between the South China Sea and the Indian Ocean. Downtown Singapore is situated near where the Singapore River flows into the Singapore Strait.
DETERMINING LONGITUDE. Measuring latitude and longitude is a good example of how geography is partly a natural science and partly a study of human behavior. Latitudes are scientifically derived by Earth's shape and its rotation around the Sun. The equator (0° latitude) is the parallel with the largest circumference and is the place where every day has 12 hours of daylight. Even in ancient times, latitude could be accurately measured by the length of daylight and the position of the Sun and stars.
On the other hand, 0° longitude is a human creation. Any meridian could have been selected as 0° longitude, because all have the same length and all run between the poles. The 0° longitude runs through Greenwich because England was the world's most powerful country when longitude was first accurately measured and the international agreement was made.
Inability to measure longitude was the greatest obstacle to exploration and discovery for many centuries. Ships ran aground or were lost at sea because no one on board could pinpoint longitude. The British Parliament enacted the Longitude Act of 1714, which offered a prize equivalent to several million dollars today to the person who could first measure longitude accurately. English clockmaker John Harrison won the prize by inventing the first portable clock that could keep accurate time on a ship, because it did not have a pendulum.
20°
10°
.---------, <:> c:,
0
Expressway () "'° Railroad
Mass Rapid Transit Line
10 MILES c
10 KILOMETERS I/,
()
CHANG I INTERNATIONAL
NATIONAL AIRPORT MUSEUM
FIGURE 1-8 Geographic grid. Meridians are arcs that connect the North and South poles. The meridian through Greenwich, England, is the prime meridian, or 0° longitude. Parallels are circles drawn around the globe parallel to the equator. The equator is 0° latitude, and the North Pole is 90° north latitude.
When the Sun was directly overhead of the ship-noon local time-Harrison's portable clock set to Greenwich time could be examined. If the clock said it was 2 P.M. in Greenwich, for example, then the ship was at 30° west longitude, because each hour of difference was equivalent to traveling 15° longitude. Most eighteenth-century scientists were convinced that longitude could be determined only by the position of the stars, so Harrison was not actually awarded the prize until 40 years after his invention.
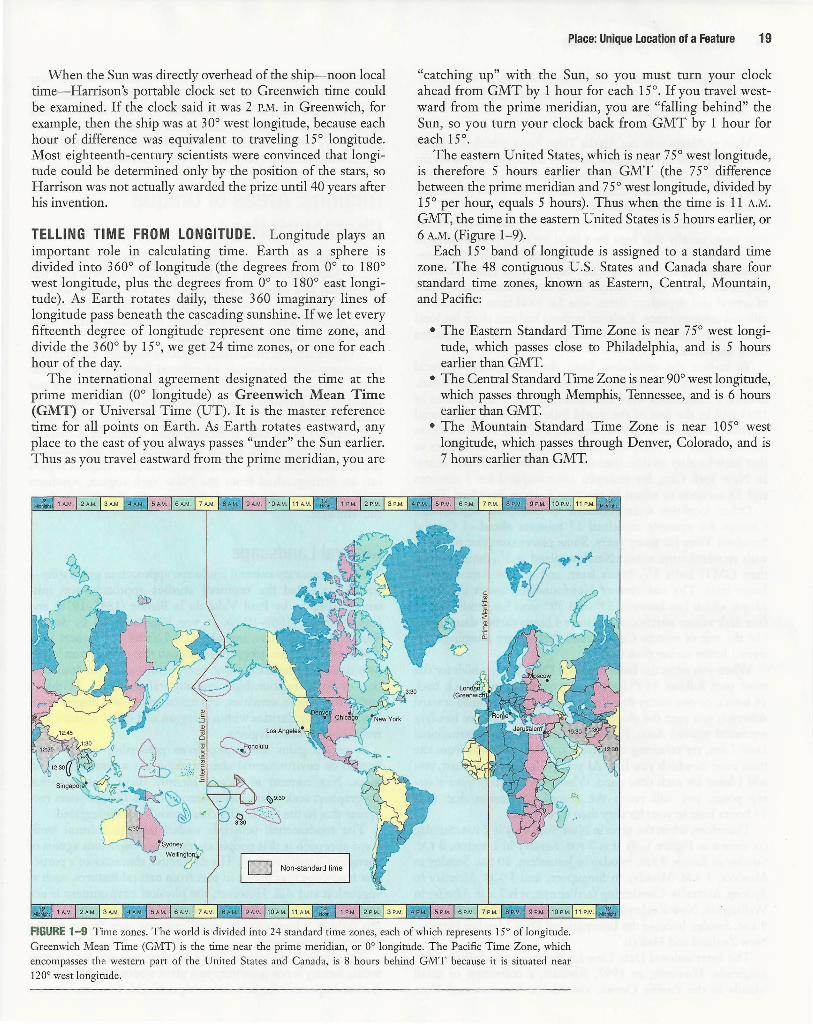
TELLING TIME FROM LONGITUDE. Longitude plays an important role in calculating time. Earth as a sphere is divided into 360° of longitude (the degrees from 0° to 180° west longitude, plus the degrees from 0° to 180° east longitude). As Earth rotates daily, these 360 imaginary lines of longitude pass beneath the cascading sunshine. If we let every fifteenth degree of longitude represent one time zone, and divide the 360° by 15°, we get 24 time zones, or one for each . hour of the day.
The international agreement designated the time at the prime meridian (0° longitude) as Greenwich Mean Time (GMT) or Universal Time (UT). It is the master reference time for all points on Earth. As Earth rotates eastward, any place to the east of you always passes "under" the Sun earlier. Thus as you travel eastward from the prime meridian, you are
Place: Unique Location of a Feature 19
"catching up" with the Sun, so you must turn your clock ahead from GMT by 1 hour for each 15°. If you travel westward from the prime meridian, you are "falling behind" the Sun, so you turn your clock back from GMT by 1 hour for each 15°.
The eastern United States, which is near 75° west longitude, is therefore 5 hours earlier than GMT (the 75° difference between the prime meridian and 7 5° west longitude, divided by 15° per hour, equals 5 hours). Thus when the time is 11 A.M.
GMT, the time in the eastern United States is 5 hours earlier, or 6 A.M. (Figure 1- 9).
Each 15° band of longitude is assigned to a standard time zone. The 48 contiguous U.S. States and Canada share four standard time zones, known as Eastern, Central, Mountain, and Pacific:
• The Eastern Standard Time Zone is near 75° west longitude, which passes close to Philadelphia, and is 5 hours earlier than GMT
• The Central Standard Time Zone is near 90° west longitude, which passes through Memphis, Tennessee, and is 6 hours earlier than GMT
• The Mountain Standard Time Zone is near 105° west longitude, which passes through Denver, Colorado, and is 7 hours earlier than GMT
~t 1 A.M. 2A.M. 3A.M. 4A.M. 5 A.M. 6A.M. 7A.M. 8A.M. 9A.M. 10 A.M. 11A.M. ~ 1P.M. 2P.M. 3P.M. 4PM. 5P.M. 6 P.M. 7 P.M. SP.M. 9P.M. 10P.M. 11P.M. M~
Sydney 'tnnb \I Wellin6r D Non-standard time
M~ 1A.M. 2 A.M. 3A.M. 4A.M. SAM. 6 A.M. 7A.M. BAM. 9A.M. 10A.M. 11 A.M. ~ 1P.M. 2P.M. 3P.M. 4P.M. 5P.M. 6 P.M. 7P.M. 8P.M. 9P.M. 10P.M. 11 P.M. MJtil
FIGURE 1-9 Time zones. The world is divided into 24 standard time zones, each of which represents 15° of longitude. Greenwich Mean Time (GMT) is the time near the prime meridian, or 0° longitude. The Pacific Time Zone, which encompasses the western part of the United States and Canada, is 8 hours behind GMT because it is situated near 120° west longitude.
20 Chapter 1 Thinking Geographically
• The Pacific Standard Time Zone is near 120° west longitude, which passes through Lake Tahoe in California, and is 8 hours earlier than GMT
Most of Alaska is in the Alaska Time Zone, which is 9 hours earlier than GMT; Hawaii and some of the Aleutian Islands are in the Hawaii-Aleutian Time Zone, which is 10 hours earlier than GMT; and eastern Canada is in the Atlantic Time Zone, which is 4 hours earlier than GMT
Before standard time zones were created, each locality set its own time, usually that kept by a local jeweler. When railroads became the main cross-country transportation during the nineteenth century, each rail company kept its own time, normally that of the largest city it served. Train timetables listed two sets of arrival and departure times, one for local time and one for railroad company time. Railroad stations had one clock for local time and a separate clock for each of the railroad companies using the station.
To reduce the confusion from the multiplicity of local times, the railroads urged adoption of standard time zones. Standard time zones were established in the United States in 1883 and in the rest of the world following the international meridian conference in Washington, D.C., in 1884. At noon on November 18, 1883, time stood still in the United States so that each locality could adjust to the new standard time zones. In New York City, for example, time stopped for 3 minutes and 58 seconds to adjust to the new Eastern Standard Time.
Other localities were reluctant to make the adjustment. Chicago for example remained 17 minutes ahead of Central Standard Time for many years. Some places continue to tinker with standard time zones. Newfoundland is 31/ 2 hours earlier than GMT, India 51
/ 2 hours later, and central Australia 91/ 2
hours later. The residents of Newfoundland assert that their island, which lies between 53° and 59° west longitude, would face dark winter afternoons if it were 4 hours earlier than GMT, like the rest of eastern Canada, and dark winter mornings if it were 3 hours earlier than GMT
When you cross the International Date Line, which for the most part follows 180° longitude, you move the clock back 24 hours, or one entire day, if you are heading eastward toward America; you turn the clock ahead 24 hours if you are heading westward toward Asia. To see the need for the International Date Line, try counting the hours around the world from the time zone in which you live. As you go from west to east, you add 1 hour for each time zone. When you return to your starting point, you will reach the absurd conclusion that it is 24 hours later in your locality than it really is.
Therefore, when the time in New York City is 2 P.M. Sunday (as shown in Figure 1-9), it is 7 P.M. Sunday in London, 8 P.M.
Sunday in Rome, 9 P.M. Sunday in Jerusalem, 10 P.M. Sunday in Moscow, 3 A.M. Monday in Singapore, and 5 A.M. Monday in Sydney, Australia. Continuing farther east, it is 7 A.M. Monday in Wellington, New Zealand-but when you get to Honolulu, it is 9 A.M. Sunday, because the International Date Line lies between New Zealand and Hawaii.
The International Date Line for the most part follows 180° longitude. However, in 1997, Kiribati, a collection of small islands in the Pacific Ocean, moved the International Date
Line 3,000 kilometers (2,000 miles) to its eastern border near 150° west longitude. As a result, Kiribati is the first country to see each day's sunrise. Kiribati hoped that this feature would attract tourists to celebrate the start of the new millennium on January 1, 2000 (or January 1, 2001, when sticklers pointed out the new millennium really began). But it did not.
Regions: Areas of Unique Characteristics The "sense of place" that humans possess may apply to a larger area of Earth rather than to a specific point. A person may feel attachment as a native or resident of the Los Angeles area, or the area of attachment could encompass southern California or the U.S. Southwest. An area of Earth defined by one or more distinctive characteristics is a region.
A region derives its unified character through the cultural landscape-a combination of cultural features such as language and religion, economic features such as agriculture and industry, and physical features such as climate and vegetation. Cultural landscape was defined by geographer Carl Sauer (1889-197 5) as an area fashioned from nature by a cultural group. "Culture is the agent, the natural area the medium, the cultural landscape is the result." The Los Angeles region can be distinguished from the New York region, southern California from northern California, the Southwest from the Midwest.
Cultural Landscape The contemporary cultural landscape approach in geographysometimes called the regional studies approach-was initiated in France by Paul Vidal de la Blache (1845-1918) and Jean Brunhes (1869-1930). It was later adopted by several American geographers, including Carl Sauer and Robert Platt (1880-1950). These geographers argued that each region has its own distinctive landscape that results from a unique combination of social relationships and physical processes. Within a region the people, activities, and environment will display similarities and regularities within a region and differ in some way from those of other regions.
A region gains uniqueness from possessing not a single human or environmental characteristic but a combination of them. Not content to merely identify these characteristics, geographers seek relationships among them. Geographers recognize that in the real world, characteristics are integrated.
The fundamental principle underlying the cultural landscape approach is that people are the most important agents of change of Earth's surface. The distinctive character of a particular landscape may derive in part from natural features, such as vegetation and soil. However, the physical environment is not always the most significant factor in human decisions. People can fashion a landscape by superimposing new forms on the physical environment.
For example, the critical factor in selecting a site for a cotton textile factory is not proximity to a place where cotton is grown. A more important factor in selecting a-suitable location is access
to a supply of low-cost labor. Economic systems, political structures, living arrangements, religious practices, and human activities can produce distinctive landscapes that do not stem primarily from distinctive physical features.
The geographer's job is to sort out the associations among various social characteristics, each of which is uniquely distributed across Earth's surface. For example, geographers conclude that political unrest in the Middle East, Eastern Europe, and other areas derives in large measure from the fact that the distributions of important features, such as ethnicity and resources, do not match the political boundaries of individual countries.
Types of Regions The designation of "region" can be applied to any area larger than a point and smaller than the entire planet. But geographers most often apply the concept at one of two scales-either several neighboring countries that share important features, such as those in Latin America, or many localities within a country, such as those in southern California. A particular place can be included in more than one region depending on how the region is defined. Geographers identify three types of regionsformal, functional, and vernacular.
FORMAL REGION. A formal region, also called a uniform region or a homogeneous region, is an area within which everyone shares in common one or more distinctive characteristics. The shared feature could be a cultural value such as a common language, an economic activity such as production of a particular crop, or an environmental property such as climate. In a formal region the selected characteristic is present throughout.
Some formal regions are easy to identify, such as countries or local government units. Montana is an example of a formal region, characterized by a government that passes laws, collects taxes, and issues license plates with equal intensity throughout the state. The formal region of Montana has clearly drawn and
Regions: Areas of Unique Characteristics 21
legally recognized boundaries, and everyone living within them shares the status of being subject to a common set of laws.
In other kinds of formal regions a characteristic may be predominant rather than universal. For example, the North American wheat belt is a formal region in which wheat is the most commonly grown crop, but other crops are grown there as well. And the wheat belt can be distinguished from the corn belt-a region where corn is the most commonly grown crop.
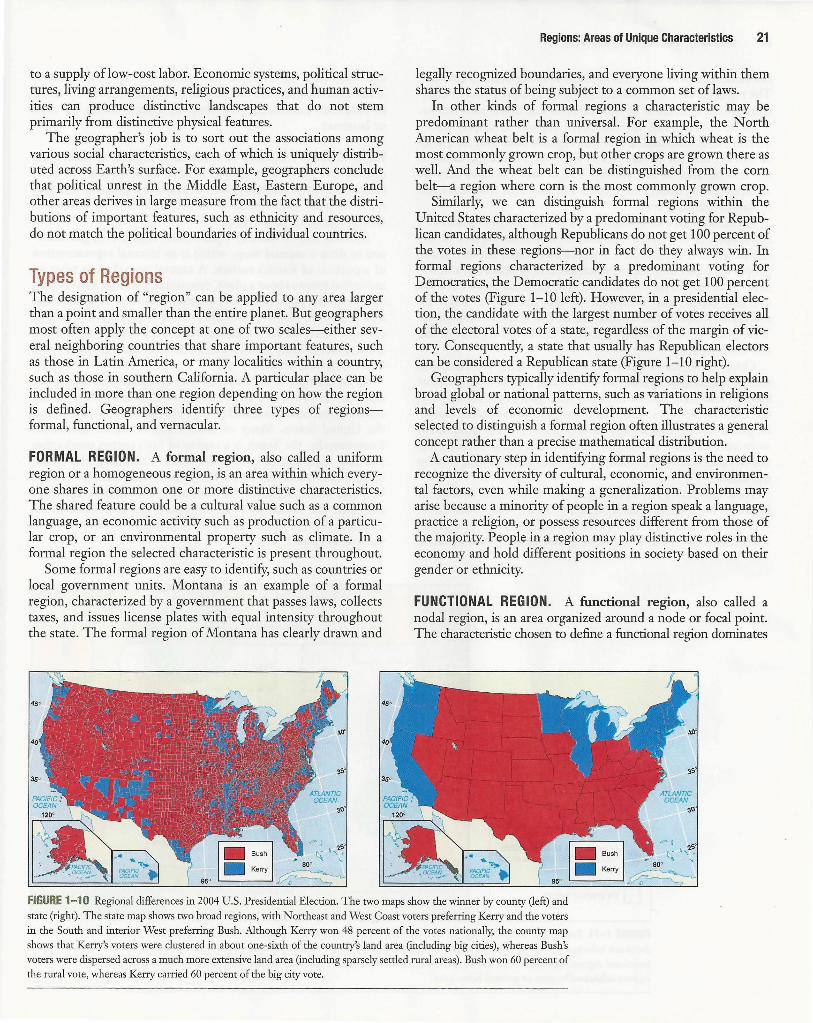
Similarly, we can distinguish formal regions within the United States characterized by a predominant voting for Republican candidates, although Republicans do not get 100 percent of the votes in these regions-nor in fact do they always win. In formal regions characterized by a predominant voting for Democracies, the Democratic candidates do not get 100 percent of the votes (Figure 1-10 left). However, in a presidential election, the candidate with the largest number of votes receives all of the electoral votes of a state, regardless of the margin of victory. Consequently, a state that usually has Republican electors can be considered a Republican state (Figure 1-10 right).
Geographers typically identify formal regions to help explain broad global or national patterns, such as variations in religions and levels of economic development. The characteristic selected to distinguish a formal region often illustrates a general concept rather than a precise mathematical distribution.
A cautionary step in identifying formal regions is the need to recognize the diversity of cultural, economic, and environmental factors, even while making a generalization. Problems may arise because a minority of people in a region speak a language, practice a religion, or possess resources different from those of the majority. People in a region may play distinctive roles in the economy and hold different positions in society based on their gender or ethnicity.
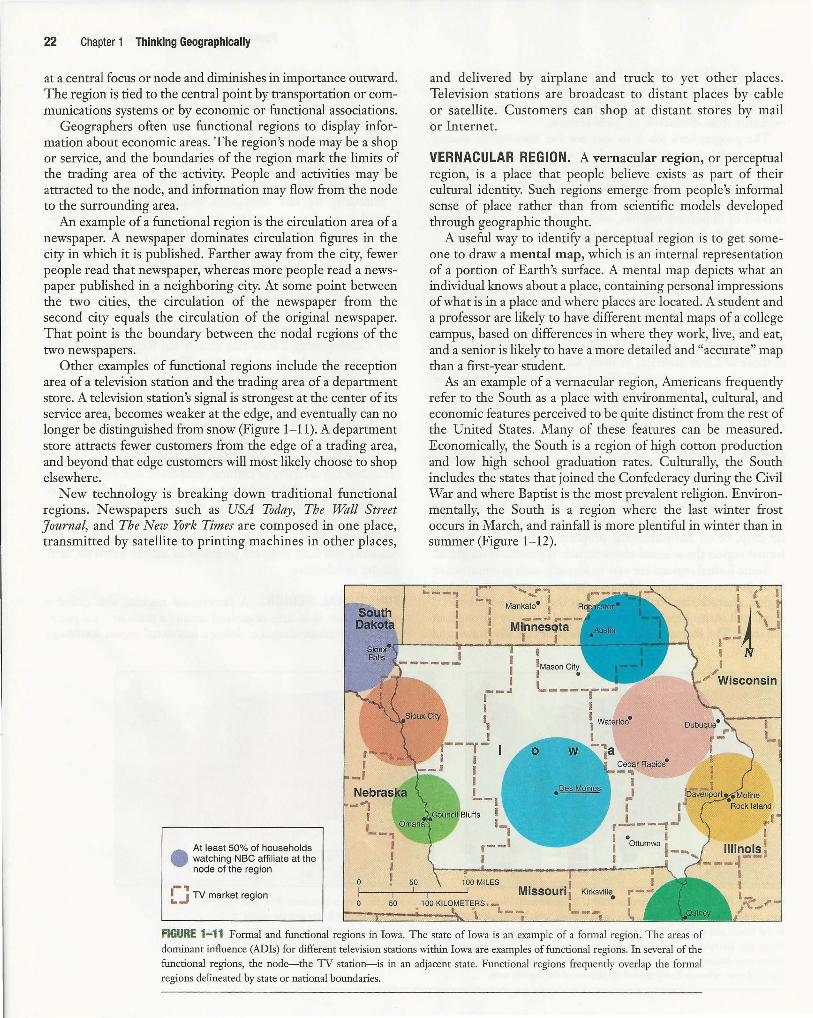
FUNCTIONAL REGION. A functional region, also called a nodal region, is an area organized around a node or focal point. The characteristic chosen to define a functional region dominates
FIGURE 1-10 Regional differences in 2004 U .S. Presidential Election. The two maps show the winner by county (left) and
state (right). The state map shows two broad regions, with Northeast and West Coast voters preferring Kerry and the voters
in the South and interior West preferring Bush. Although Kerry won 48 percent of the votes nationally, the county map
shows that Kerry's voters were clustered in about one-sixth of the country's land area (including big cities), whereas Bush's voters were dispersed across a much more extensive land area (including sparsely settled rural areas). Bush won 60 percent of the rural vote, whereas Kerry carried 60 percent of the big city vote.
22 Chapter 1 Thinking Geographically
at a central focus or node and diminishes in importance outward. The region is tied to the central point by transportation or communications systems or by economic or functional associations.
Geographers often use functional regions to display information about economic areas. The region's node may be a shop or service, and the boundaries of the region mark the limits of the trading area of the activity. People and activities may be attracted to the node, and information may flow from the node to the surrounding area.
An example of a functional region is the circulation area of a newspaper. A newspaper dominates circulation figures in the city in which it is published. Farther away from the city, fewer people read that newspaper, whereas more people read a newspaper published in a neighboring city. At some point between the two cities, the circulation of the newspaper from the second city equals the circulation of the original newspaper. That point is the boundary between the nodal regions of the two newspapers.
Other examples of functional regions include the reception area of a television station and the trading area of a department store. A television station's signal is strongest at the center of its service area, becomes weaker at the edge, and eventually can no longer be distinguished from snow (Figure 1-11). A department store attracts fewer customers from the edge of a trading area, and beyond that edge customers will most likely choose to shop elsewhere.
New technology is breaking down traditional functional regions. Newspapers such as USA Today, The Wall Street Journal, and The New York Times are composed in one place, transmitted by satellite to printing machines in other places,
At least 50% of households • watching NBC affiliate at the
node of the region
-, ~ J TV market region
Nebraska _ _., I I --,
I I I I 50
and delivered by airplane and truck to yet other places. Television stations are broadcast to distant places by cable or satellite. Customers can shop at distant stores by mail or Internet.
VERNACULAR REGION. A vernacular region, or perceptual region, is a place that people believe exists as part of their cultural identity. Such regions emerge from people's informal sense of place rather than from scientific models developed through geographic thought.
A useful way to identify a perceptual region is to get someone to draw a mental map, which is an internal representation of a portion of Earth's surface. A mental map depicts what an individual knows about a place, containing personal impressions of what is in a place and where places are located. A student and a professor are likely to have different mental maps of a college campus, based on differences in where they work, live, and eat, and a senior is likely to have a more detailed and "accurate" map than a first-year student.
As an example of a vernacular region, Americans frequently refer to the South as a place with environmental, cultural, and economic features perceived to be quite distinct from the rest of the United States. Many of these features can be measured. Economically, the South is a region of high cotton production and low high school graduation rates. Culturally, the South includes the states that joined the Confederacy during the Civil War and where Baptist is the most prevalent religion. Environmentally, the South is a region where the last winter frost occurs in March, and rainfall is more plentiful in winter than in summer (Figure 1-12).
.. __ .. I I I I
,--.. I I I
........... Mankato• I __ .... __ Mihnesqta
I I I I Mason City I •
•-----r-"' I
.oes Moines
I t
I \ I I -1~ \ I
,--1 N
) "" Wisconsin
I ._,
FIGURE 1-11 Formal and functional regions in Iowa. The state of Iowa is an example of a formal region. The areas of dominant influence (ADis) for different television stations within Iowa are examples of functional regions. In several of the functional regions, the node-the TV station-is in an adjacent state. Functional regions frequently overlap the formal regions delineated by state or national boundaries.
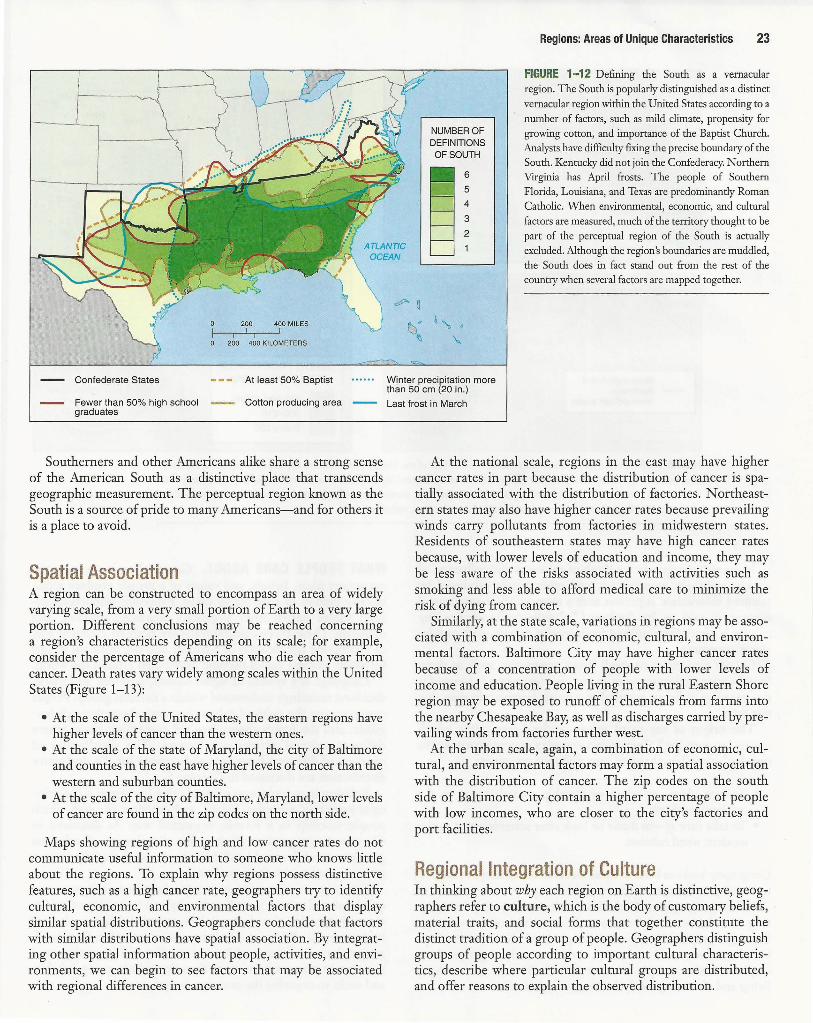
Confederate States
Fewer than 50% high school graduates
200 400 MILES
0 200 400 KILOMETERS
At least 50% Baptist
Cotton producing area
Southerners and other Americans alike share a strong sense of the American South as a distinctive place that transcends geographic measurement. The perceptual region known as the South is a source of pride to many Americans-and for others it is a place to avoid.
Spatial Association A region can be constructed to encompass an area of widely varying scale, from a very small portion of Earth to a very large portion. Different conclusions may be reached concerning a region's characteristics depending on its scale; for example, consider the percentage of Americans who die each year from cancer. Death rates vary widely among scales within the United States (Figure 1-13):
• At the scale of the United States, the eastern regions have higher levels of cancer than the western ones.
• At the scale of the state of Maryland, the city of Baltimore and counties in the east have higher levels of cancer than the western and suburban counties.
• At the scale of the city of Baltimore, Maryland, lower levels of cancer are found in the zip codes on the north side.
Maps showing regions of high and low cancer rates do not communicate useful information to someone who knows little about the regions. To explain why regions possess distinctive features, such as a high cancer rate, geographers try to identify cultural, economic, and environmental factors that display similar spatial distributions. Geographers conclude that factors with similar distributions have spatial association. By integrating other spatial information about people, activities, and environments, we can begin to see factors that may be associated with regional differences in cancer.
NUMBER OF DEFINITIONS OF SOUTH
6
5
4
3
2
Winter precipitation more than 50 cm (20 in .)
Last frost in March
Regions: Areas of Unique Characteristics 23
FIGURE 1-12 Defining the South as a vernacular region. The South is popularly distinguished as a distinct
vernacular region within the United States according to a
number of factors, such as mild climate, propensity for growing cotton, and importance of the Baptist Church. Analysts have difficulty fixing the precise boundary of the South. Kentucky did not join the Confederacy. Northern Virginia has April frosts. The people of Southern Florida, Louisiana, and Texas are predominantly Roman Catholic. When environmental, economic, and cultural
factors are measured, much of the territory thought to be part of the perceptual region of the South is actually excluded. Although the region's boundaries are muddled, the South does in fact stand out from the rest of the country when several factors are mapped together.
At the national scale, regions in the east may have higher cancer rates in part because the distribution of cancer is spatially associated with the distribution of factories. Northeastern states may also have higher cancer rates because prevailing winds carry pollutants from factories in midwestern states. Residents of southeastern states may have high cancer rates because, with lower levels of education and income, they may be less aware of the risks associated with activities such as smoking and less able to afford medical care to minimize the risk of dying from cancer.
Similarly, at the state scale, variations in regions may be associated with a combination of economic, cultural, and environmental factors. Baltimore City may have higher cancer rates because of a concentration of people with lower levels of income and education. People living in the rural Eastern Shore region may be exposed to runoff of chemicals from farms into the nearby Chesapeake Bay, as well as discharges carried by prevailing winds from factories further west.
At the urban scale, again, a combination of economic, cultural, and environmental factors may form a spatial association with the distribution of cancer. The zip codes on the south side of Baltimore City contain a higher percentage of people with low incomes, who are closer to the city's factories and port facilities.
Regional Integration of Culture In thinking about why each region on Earth is distinctive, geographers refer to culture, which is the body of customary beliefs, material traits, and social forms that together constitute the distinct tradition of a group of people. Geographers distinguish groups of people according to important cultural characteristics, describe where particular cultural groups are distributed, and offer reasons to explain the observed distribution.
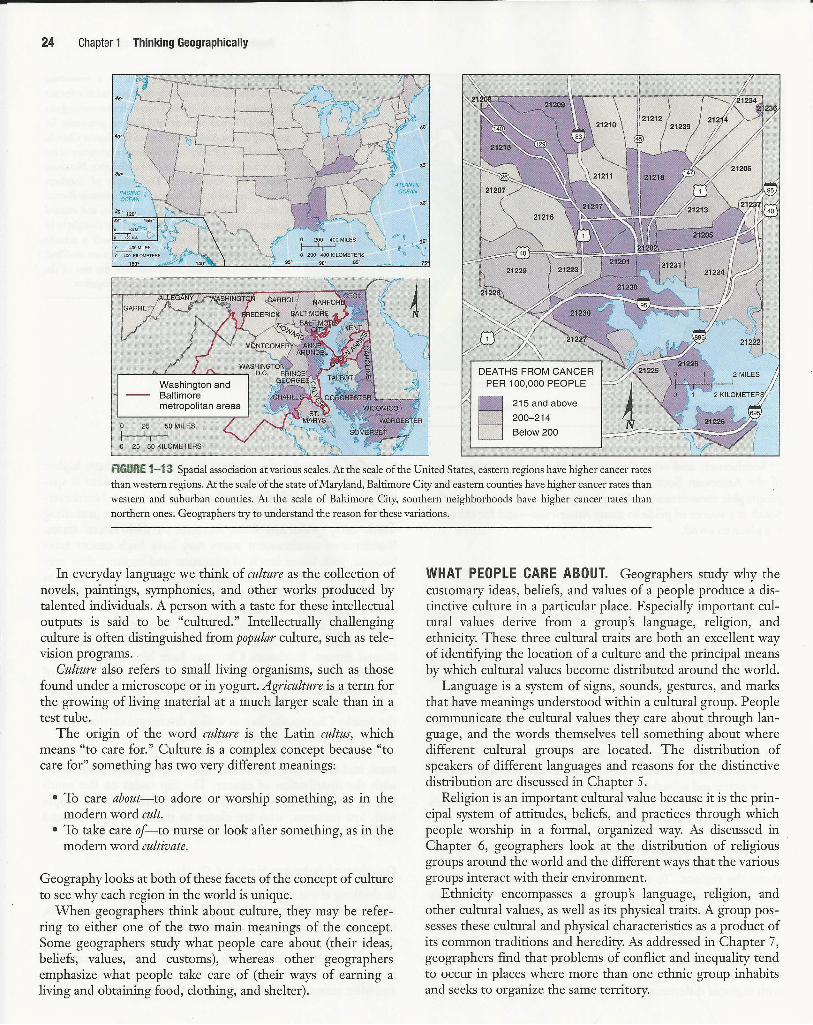
24 Chapter 1 Thinking Geographically
25 50 MILES
I 1
I 1
0 25 50 KILOMETERS
PER 100,000 PEOPLE
§ 215 and above
200-214
Below 200
FIGURE 1- 13 Spatial association at various scales. At the scale of the United States, eastern regions have higher cancer rates than western regions. At the scale of the state of Maryland, Baltimore City and eastern counties have higher cancer rates than western and suburban counties. At the scale of Baltimore City, southern neighborhoods have higher cancer rates than northern ones. Geographers try to understand the reason for these variations.
In everyday language we think of culture as the collection of novels, paintings, symphonies, and other works produced by talented individuals. A person with a taste for these intellectual outputs is said to be "cultured." Intellectually challenging culture is often distinguished from popular culture, such as television programs.
Culture also refers to small living organisms, such as those found under a microscope or in yogurt. Agriculture is a term for the growing of living material at a much larger scale than in a test tube.
The origin of the word culture is the Latin cultus, which means "to care for." Culture is a complex concept because "to care for" something has two very different meanings:
• To care about-to adore or worship something, as in the modern word cult.
• To take care of-to nurse or look after something, as in the modern word cultivate.
Geography looks at both of these facets of the concept of culture to see why each region in the world is unique.
When geographers think about culture, they may be referring to either one of the two main meanings of the concept. Some geographers study what people care about (their ideas, beliefs, values, and customs), whereas other geographers emphasize what people take care of (their ways of earning a living and obtaining food, clothing, and shelter).
WHAT PEOPLE CARE ABOUT. Geographers study why the customary ideas, beliefs, and values of a people produce a distinctive culture in a particular place. Especially important cultural values derive from a group's language, religion, and ethnicity. These three cultural traits are both an excellent way of identifying the location of a culture and the principal means by which cultural values become distributed around the world.
Language is a system of signs, sounds, gestures, and marks that have meanings understood within a cultural group. People communicate the cultural values they care about through language, and the words themselves tell something about where different cultural groups are located. The distribution of speakers of different languages and reasons for the distinctive distribution are discussed in Chapter 5.
Religion is an important cultural value because it is the principal system of attitudes, beliefs, and practices through which people worship in a formal, organized way. As discussed in Chapter 6, geographers look at the distribution of religious groups around the world and the different ways that the various groups interact with their environment.
Ethnicity encompasses a group's language, religion, and other cultural values, as well as its physical traits. A group possesses these cultural and physical characteristics as a product of its common traditions and heredity. As addressed in Chapter 7, geographers find that problems of conflict and inequality tend to occur in places where more than one ethnic group inhabits and seeks to organize the same territory.
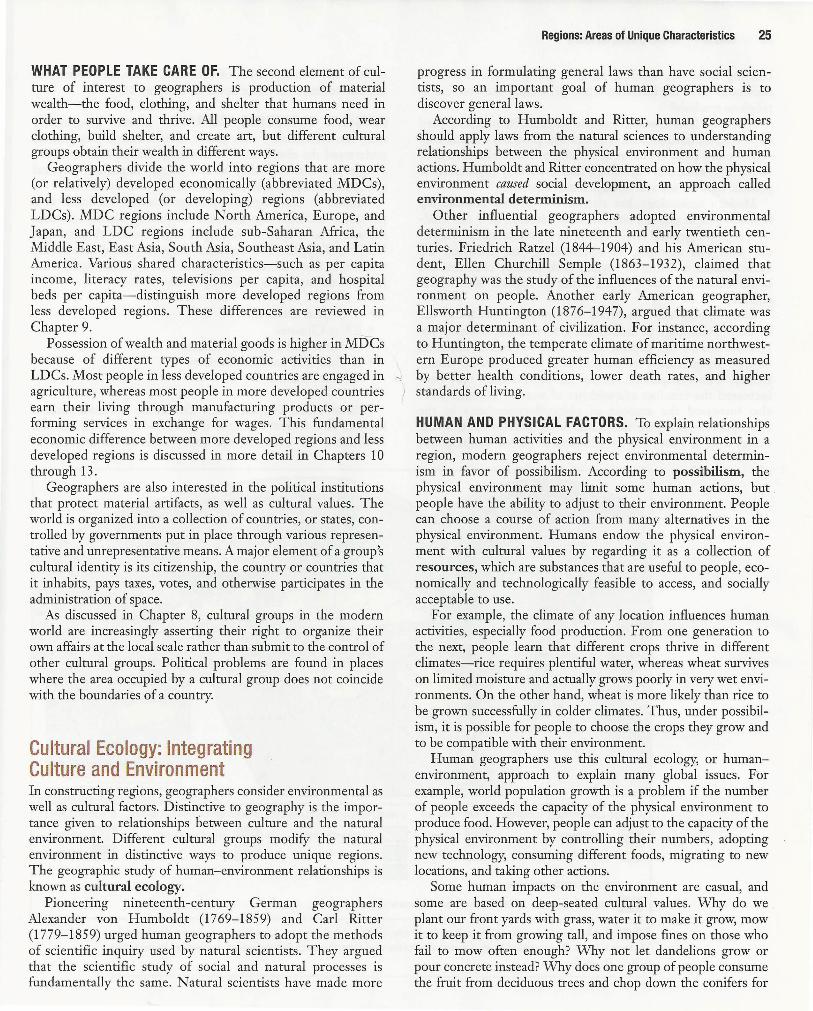
WHAT PEOPLE TAKE CARE OF. The second element of culture of interest to geographers is production of material wealth-the food, clothing, and shelter that humans need in order to survive and thrive. All people consume food, wear clothing, build shelter, and create art, but different cultural groups obtain their wealth in different ways.
Geographers divide the world into regions that are more (or relatively) developed economically (abbreviated MDCs), and less developed (or developing) regions (abbreviated LDCs). MDC regions include North America, Europe, and Japan, and LDC regions include sub-Saharan Africa, the Middle East, East Asia, South Asia, Southeast Asia, and Latin America. Various shared characteristics-such as per capita income, literacy rates, televisions per capita, and hospital beds per capita-distinguish more developed regions from less developed regions. These differences are reviewed in Chapter 9.
Possession of wealth and material goods is higher in MD Cs because of different types of economic activities than in LDCs. Most people in less developed countries are engaged in agriculture, whereas most people in more developed countries earn their living through manufacturing products or performing services in exchange for wages. This fundamental economic difference between more developed regions and less developed regions is discussed in more detail in Chapters 10 through 13.
Geographers are also interested in the political institutions that protect material artifacts, as well as cultural values. The world is organized into a collection of countries, or states, controlled by governments put in place through various representative and unrepresentative means. A major element of a group's cultural identity is its citizenship, the country or countries that it inhabits, pays taxes, votes, and otherwise participates in the administration of space.
As discussed in Chapter 8, cultural groups in the modern world are increasingly asserting their right to organize their own affairs at the local scale rather than submit to the control of other cultural groups. Political problems are found in places where the area occupied by a cultural group does not coincide with the boundaries of a country.
Cultural Ecology: Integrating Culture and Environment In constructing regions, geographers consider environmental as well as cultural factors. Distinctive to geography is the importance given to relationships between culture and the natural environment. Different cultural groups modify the natural environment in distinctive ways to produce unique regions. The geographic study of human-environment relationships is known as cultural ecology.
Pioneering nineteenth-century German geographers Alexander von Humboldt (1769-1859) and Carl Ritter (1 779-1859) urged human geographers to adopt the methods of scientific inquiry used by natural scientists. They argued that the scientific study of social and natural processes is fundamentally the same. Natural scientists have made more
Regions: Areas of Unique Characteristics 25
progress in formulating general laws than have social scientists, so an important goal of human geographers is to discover general laws.
According to Humboldt and Ritter, human geographers should apply laws from the natural sciences to understanding relationships between the physical environment and human actions. Humboldt and Ritter concentrated on how the physical environment caused social development, an approach called environmental determinism.
Other influential geographers adopted environmental determinism in the late nineteenth and early twentieth centuries. Friedrich Ratzel (1844-1904) and his American student, Ellen Churchill Semple (1863-1932), claimed that geography was the study of the influences of the natural environment on people. Another early American geographer, Ellsworth Huntington (187 6-194 7), argued that climate was a major determinant of civilization. For instance, according to Huntington, the temperate climate of maritime northwestern Europe produced greater human efficiency as measured
-< by better health conditions, lower death rates, and higher standards of living.
HUMAN AND PHYSICAL FACTORS. To explain relationships between human activities and the physical environment in a region, modern geographers reject environmental determinism in favor of possibilism. According to possibilism, the physical environment may limit some human actions, but people have the ability to adjust to their environment. People can choose a course of action from many alternatives in the physical environment. Humans endow the physical environment with cultural values by regarding it as a collection of resources, which are substances that are useful to people, economically and technologically feasible to access, and socially acceptable to use.
For example, the climate of any location influences human activities, especially food production. From one generation to the next, people learn that different crops thrive in different climates-rice requires plentiful water, whereas wheat survives on limited moisture and actually grows poorly in very wet environments. On the other hand, wheat is more likely than rice to be grown successfully in colder climates. Thus, under possibilism, it is possible for people to choose the crops they grow and to be compatible with their environment.
Human geographers use this cultural ecology, or humanenvironment, approach to explain many global issues. For example, world population growth is a problem if the number of people exceeds the capacity of the physical environment to produce food. However, people can adjust to the capacity of the physical environment by controlling their numbers, adopting new technology, consuming different foods, migrating to new locations, and taking other actions.
Some human impacts on the environment are casual, and some are based on deep-seated cultural values. Why do we plant our front yards with grass, water it to make it grow, mow it to keep it from growing tall, and impose fines on those who fail to mow often enough? Why not let dandelions grow or pour concrete instead? Why does one group of people consume the fruit from deciduous trees and chop down the conifers for
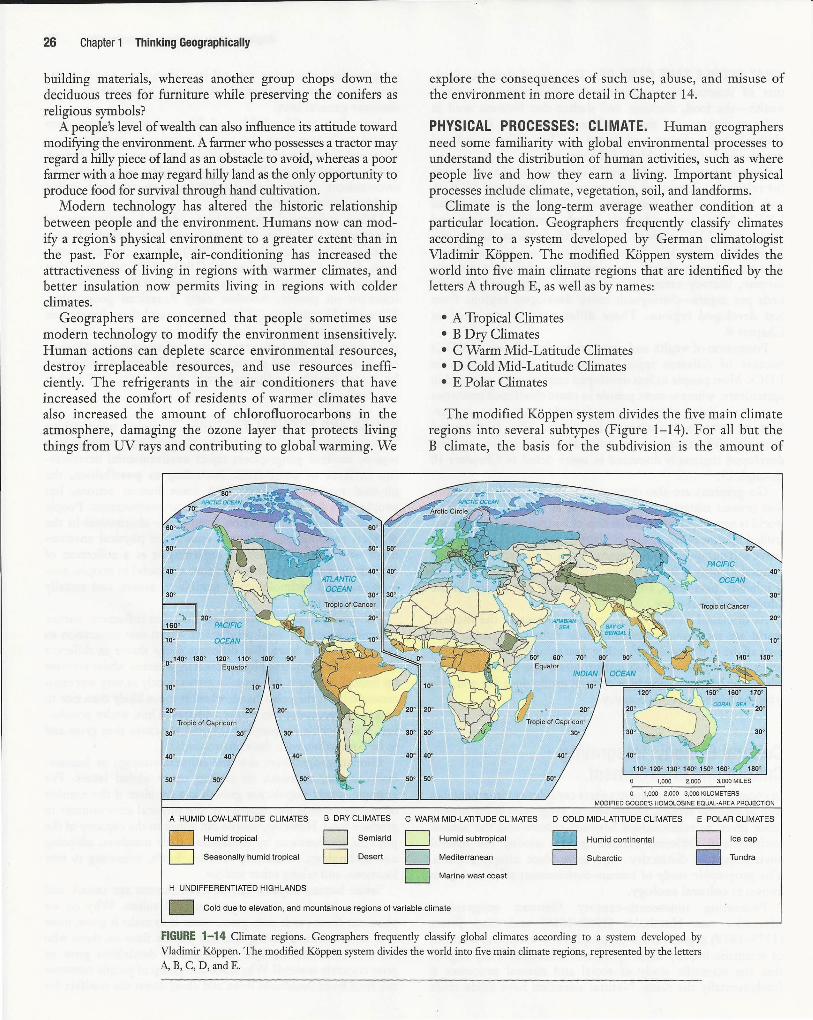
26 Chapter 1 Thinking Geographically
building materials, whereas another group chops down the deciduous trees for furniture while preserving the conifers as religious symbols?
A people's level of wealth can also influence its attitude toward modifying the environment. A farmer who possesses a tractor may regard a hilly piece of land as an obstacle to avoid, whereas a poor farmer with a hoe may regard hilly land as the only opportunity to produce food for survival through hand cultivation.
Modern technology has altered the historic relationship between people and the environment. Humans now can modify a region's physical environment to a greater extent than in the past. For example, air-conditioning has increased the attractiveness of living in regions with warmer climates, and better insulation now permits living in regions with colder climates.
Geographers are concerned that people sometimes use modern technology to modify the environment insensitively. Human actions can deplete scarce environmental resources, destroy irreplaceable resources, and use resources inefficiently. The refrigerants in the air conditioners that have increased the comfort of residents of warmer climates have also increased the amount of chlorofluorocarbons in the atmosphere, damaging the ozone layer that protects living things from UV rays and contributing to global warming. We
40°
30°
0"140° 130°
10°
20°
OCEAN
120° 110° Equator
Tropic of Capricorn
30° 30°
40° 40°
50' 50'
explore the consequences of such use, abuse, and misuse of the environment in more detail in Chapter 14.
PHYSICAL PROCESSES: CLIMATE. Human geographers need some familiarity with global environmental processes to understand the distribution of human activities, such as where people live and how they earn a living. Important physical processes include climate, vegetation, soil, and landforms.
Climate is the long-term average weather condition at a particular location. Geographers frequently classify climates according to a system developed by German climatologist Vladimir Koppen. The modified Koppen system divides the world into five main climate regions that are identified by the letters A through E, as well as by names:
• A Tropical Climates • B Dry Climates • C Warm Mid-Latitude Climates • D Cold Mid-Latitude Climates • E Polar Climates
The modified Koppen system divides the five main climate regions into several subtypes (Figure 1-14). For all but the B climate, the basis for the subdivision is the amount of
40° 40°
50° 50°
j; •' 20~00
~ropic of Capricorn
30°
40'
50'
.• PACIFIC
OCEAN
50'
Tropic of Cancer
40'
30'
20'
10'
140' 150'
. .J~
30'
40' • }
110' 120' 130' 140'~50' 160' ~BO' 1,000 2,000 3,000 MILES
0 1,000 2,000 3,000 KILOMETERS
MODIFIED GOODE'S HOMOLOSINE EQUAL-AREA PROJECTION
A HUMID LOW-LATITUDE CLIMATES B DRY CLIMATES C WARM MID-LATITUDE CLIMATES D COLD MID-LATITUDE CLIMATES E POLAR CLIMATES
D Humid tropical
D Seasonally humid tropical
H UNDIFFERENTIATED HIGHLANDS
D Semiarid
D Desert
D Humid subtropical
D Mediterranean
D Marine west coast
D Cold due to elevation , and mountainous regions of variable climate
D Humid continental
D Subarctic
D Icecap
D Tundra
FIGURE 1-14 Climate regions. Geographers frequently classify global climates according to a system developed by Vladimir Koppen. The modified Koppen system divides the world into five main climate regions, represented by the letters A, B, C, D , and E.
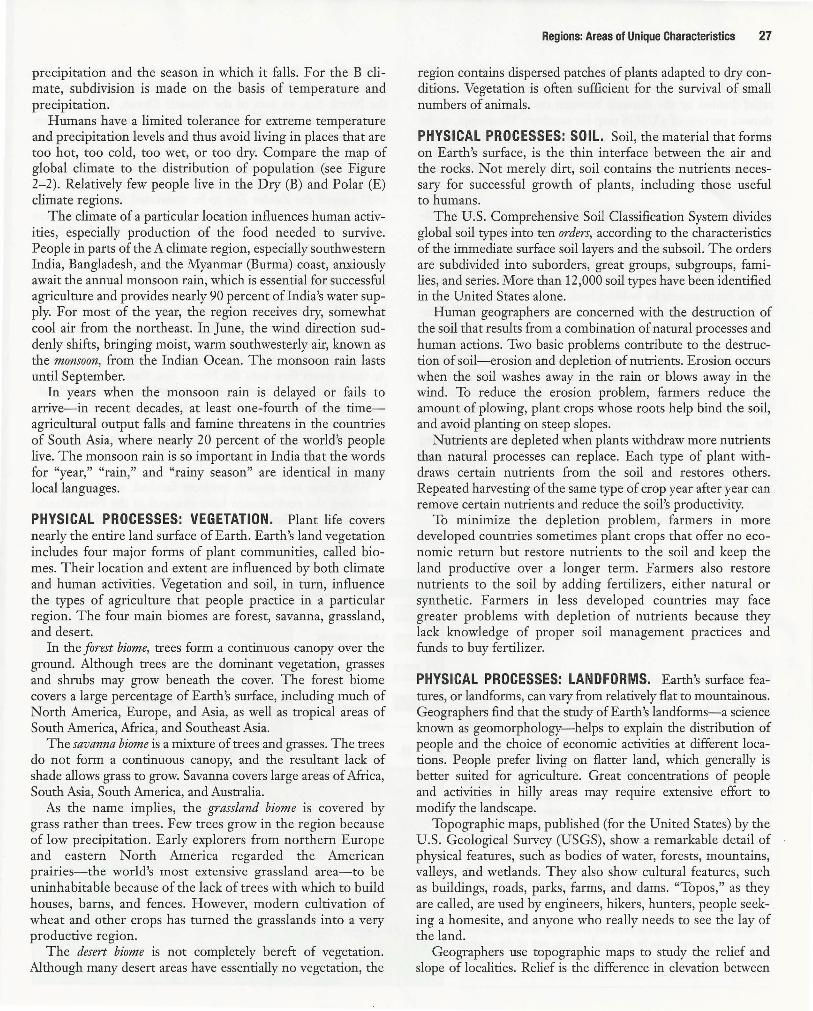
precipitation and the season in which it falls. For the B climate, subdivision is made on the basis of temperature and precipitation.
Humans have a limited tolerance for extreme temperature and precipitation levels and thus avoid living in places that are too hot, too cold, too wet, or too dry. Compare the map of global climate to the distribution of population (see Figure 2-2). Relatively few people live in the Dry (B) and Polar (E) climate regions.
The climate of a particular location influences human activities, especially production of the food needed to survive. People in parts of the A climate region, especially southwestern India, Bangladesh, and the Myanmar (Burma) coast, anxiously await the annual monsoon rain, which is essential for successful agriculture and provides nearly 90 percent oflndia's water supply. For most of the year, the region receives dry, somewhat cool air from the northeast. In June, the wind direction suddenly shifts, bringing moist, warm southwesterly air, known as the monsoon, from the Indian Ocean. The monsoon rain lasts until September.
In years when the monsoon rain is delayed or fails to arrive-in recent decades, at least one-fourth of the timeagricultural output falls and famine threatens in the countries of South Asia, where nearly 20 percent of the world's people live. The monsoon rain is so important in India that the words for "year," "rain," and "rainy season" are identical in many local languages.
PHYSICAL PROCESSES: VEGETATION. Plant life covers nearly the entire land surface of Earth. Earth's land vegetation includes four major forms of plant communities, called biomes. Their location and extent are influenced by both climate and human activities. Vegetation and soil, in turn, influence the types of agriculture that people practice in a particular region. The four main biomes are forest, savanna, grassland, and desert.
In the forest biome, trees form a continuous canopy over the ground. Although trees are the dominant vegetation, grasses and shrubs may grow beneath the cover. The forest biome covers a large percentage of Earth's surface, including much of North America, Europe, and Asia, as well as tropical areas of South America, Africa, and Southeast Asia.
The savanna biome is a mixture of trees and grasses. The trees do not form a continuous canopy, and the resultant lack of shade allows grass to grow. Savanna covers large areas of Africa, South Asia, South America, and Australia.
As the name implies, the grassland biome is covered by grass rather than trees. Few trees grow in the region because of low precipitation. Early explorers from northern Europe and eastern North America regarded the American prairies-the world's most extensive grassland area-to be uninhabitable because of the lack of trees with which to build houses, barns, and fences. However, modern cultivation of wheat and other crops has turned the grasslands into a very productive region.
The desert biome is not completely bereft of vegetation. Although many desert areas have essentially no vegetation, the
Regions: Areas of Unique Characteristics 27
region contains dispersed patches of plants adapted to dry conditions. Vegetation is often sufficient for the survival of small numbers of animals.
PHYSICAL PROCESSES: SOIL. Soil, the material that forms on Earth's surface, is the thin interface between the air and the rocks. Not merely dirt, soil contains the nutrients necessary for successful growth of plants, including those useful to humans.
The U.S. Comprehensive Soil Classification System divides global soil types into ten orders, according to the characteristics of the immediate surface soil layers and the subsoil. The orders are subdivided into suborders, great groups, subgroups, families, and series. More than 12,000 soil types have been identified in the United States alone.
Human geographers are concerned with the destruction of the soil that results from a combination of natural processes and human actions. Two basic problems contribute to the destruction of soil-erosion and depletion of nutrients. Erosion occurs when the soil washes away in the rain or blows away in the wind. To reduce the erosion problem, farmers reduce the amount of plowing, plant crops whose roots help bind the soil, and avoid planting on steep slopes.
Nutrients are depleted when plants withdraw more nutrients than natural processes can replace. Each type of plant withdraws certain nutrients from the soil and restores others. Repeated harvesting of the same type of crop year after year can remove certain nutrients and reduce the soil's productivity.
To minimize the depletion problem, farmers in more developed countries sometimes plant crops that offer no economic return but restore nutrients to the soil and keep the land productive over a longer term. Farmers also restore nutrients to the soil by adding fertilizers , either natural or synthetic. Farmers in less developed countries may face greater problems with depletion of nutrients because they lack knowledge of proper soil management practices and funds to buy fertilizer.
PHYSICAL PROCESSES: LANDFORMS. Earth's surface features, or landforms, can vary from relatively flat to mountainous. Geographers find that the study of Earth's landforms-a science known as geomorphology-helps to explain the distribution of people and the choice of economic activities at different locations. People prefer living on flatter land, which generally is better suited for agriculture. Great concentrations of people and activities in hilly areas may require extensive effort to modify the landscape.
Topographic maps, published (for the United States) by the U .S. Geological Survey (USGS), show a remarkable detail of physical features, such as bodies of water, forests , mountains, valleys, and wetlands. They also show cultural features, such as buildings, roads, parks, farms, and dams. "Topos," as they are called, are used by engineers, hikers, hunters, people seeking a homesite, and anyone who really needs to see the lay of the land.
Geographers use topographic maps to study the relief and slope of localities. Relief is the difference in elevation between
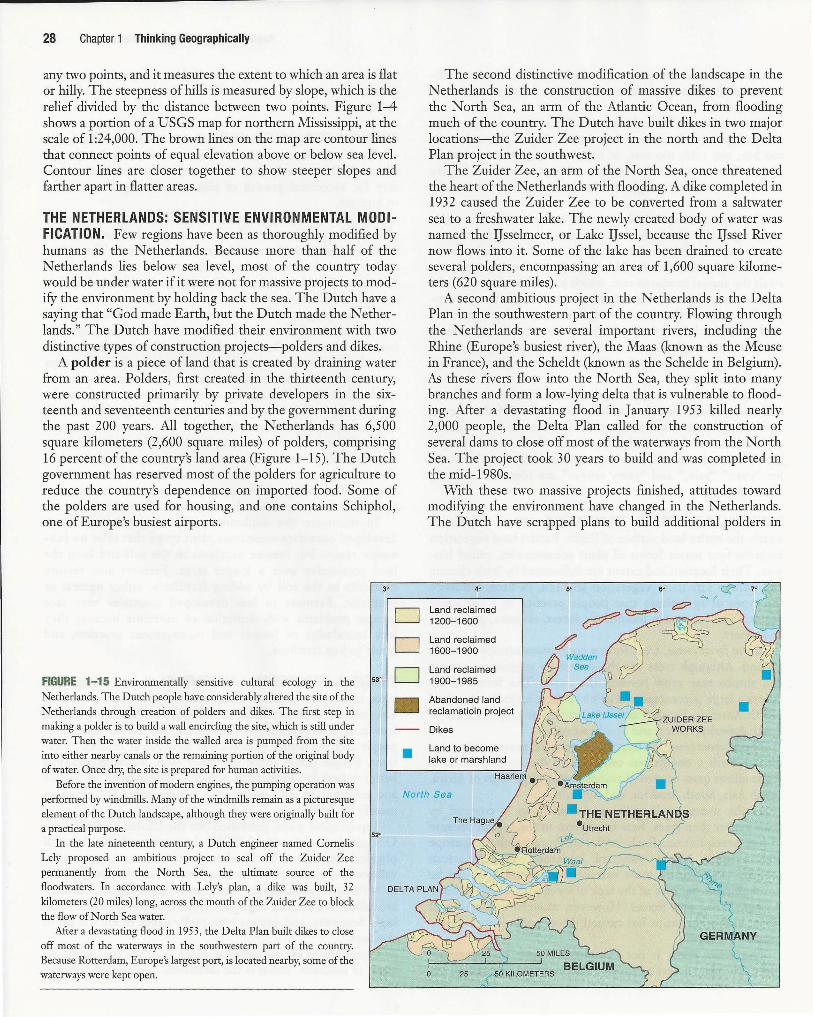
28 Chapter 1 Thinking Geographically
any two points, and it measures the extent to which an area is flat or hilly. The steepness of hills is measured by slope, which is the relief divided by the distance between two points. Figure 1-4 shows a portion of a USGS map for northern Mississippi, at the scale of 1:24,000. The brown lines on the map are contour lines that connect points of equal elevation above or below sea level. Contour lines are closer together to show steeper slopes and farther apart in flatter areas.
THE NETHERLANDS: SENSITIVE ENVIRONMENTAL MODIFICATION. Few regions have been as thoroughly modified by humans as the Netherlands. Because more than half of the Netherlands lies below sea level, most of the country today would be under water if it were not for massive projects to modify the environment by holding back the sea. The Dutch have a saying that "God made Earth, but the Dutch made the Netherlands." The Dutch have modified their environment with two distinctive types of construction projects-polders and dikes.
A polder is a piece of land that is created by draining water from an area. Folders, first created in the thirteenth century, were constructed primarily by private developers in the sixteenth and seventeenth centuries and by the government during the past 200 years. All together, the Netherlands has 6,500 square kilometers (2,600 square miles) of polders, comprising 16 percent of the country's land area (Figure 1-15). The Dutch government has reserved most of the polders for agriculture to reduce the country's dependence on imported food. Some of the polders are used for housing, and one contains Schiphol, one of Europe's busiest airports.
3'
D
FIGURE 1-15 Environmentally sensitive cultural ecology in the Netherlands. The Dutch people have considerably altered the site of the Netherlands through creation of polders and dikes. The first step in making a polder is to build a wall encircling the site, which is still under water. Then the water inside the walled area is pumped from the site into either nearby canals or the remaining portion of the original body of water. Once dry, the site is prepared for human activities.
53°
D D ~
•
The second distinctive modification of the landscape in the Netherlands is the construction of massive dikes to prevent the North Sea, an arm of the Atlantic Ocean, from flooding much of the country. The Dutch have built dikes in two major locations-the Zuider Zee project in the north and the Delta Plan project in the southwest.
The Zuider Zee, an arm of the North Sea, once threatened the heart of the Netherlands with flooding. A dike completed in 1932 caused the Zuider Zee to be converted from a saltwater sea to a freshwater lake. The newly created body of water was named the Ijsselmeer, or Lake IJssel, because the IJssel River now flows into it. Some of the lake has been drained to create several polders, encompassing an area of 1,600 square kilometers (620 square miles).
A second ambitious project in the Netherlands is the Delta Plan in the southwestern part of the country. Flowing through the Netherlands are several important rivers, including the Rhine (Europe's busiest river), the Maas (known as the Meuse in France), and the Scheldt (known as the Schelde in Belgium). As these rivers flow into the North Sea, they split into many branches and form a low-lying delta that is vulnerable to flooding. After a devastating flood in January 1953 killed nearly 2,000 people, the Delta Plan called for the construction of several dams to close off most of the waterways from the North Sea. The project took 30 years to build and was completed in the mid-1980s.
With these two massive projects finished, attitudes toward modifying the environment have changed in the Netherlands. The Dutch have scrapped plans to build additional polders in
4'
Land reclaimed 1200-1600
Land reclaimed 1600-1900
Land reclaimed 1900-1985
Abandoned land reclamatioin project
Dikes
Land to become lake or marshland
Before the invention of modem engines, the pumping operation was performed by windmills. Many of the windmills remain as a picturesque element of the Dutch landscape, although they were originally built for a practical purpose.
North Sea
In the late nineteenth century, a Dutch engineer named Comelis Lely proposed an ambitious project to seal off the Zuider Zee permanently from the North Sea, the ultimate source of the floodwaters. In accordance with Lely's plan, a dike was built, 32 kilometers (20 miles) long, across the mouth of the Zuider Zee to block the flow of North Sea water.
After a devastating flood in 1953, the Delta Plan built dikes to close off most of the waterways in the southwestern part of the country. Because Rotterdam, Europe's largest port, is located nearby, some of the waterways were kept open.
52°
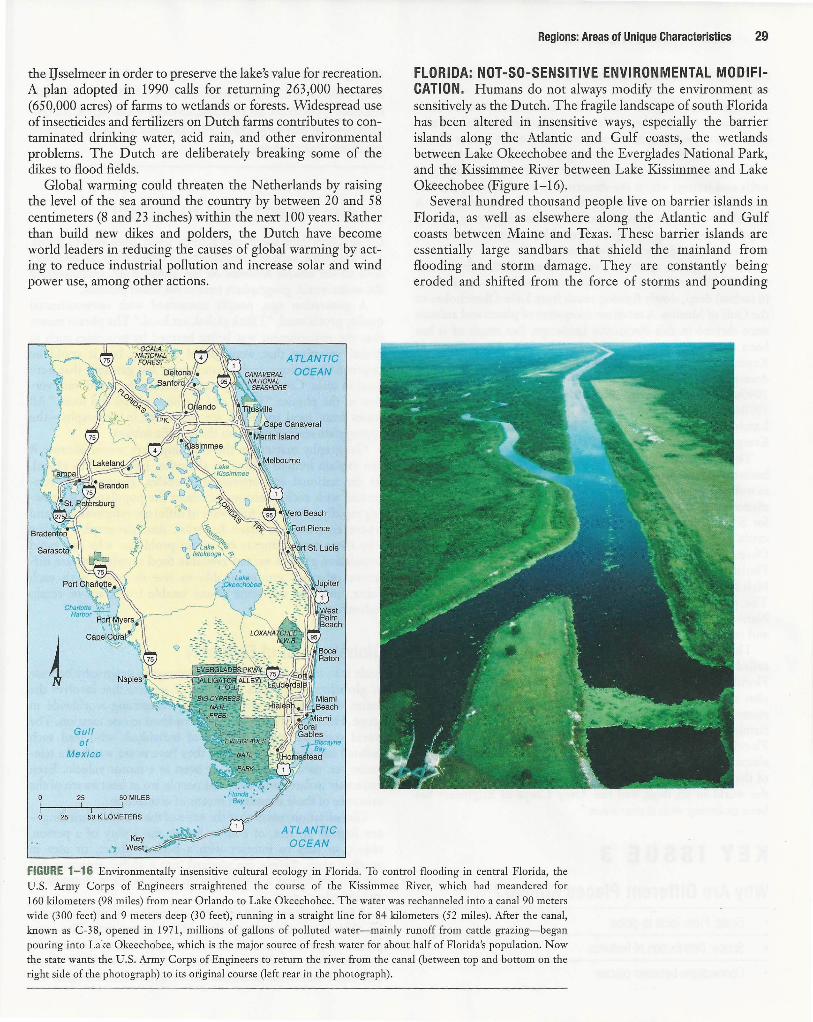
the IJsselmeer in order to preserve the lake's value for recreation. A plan adopted in 1990 calls for returning 263,000 hectares (650,000 acres) of farms to wetlands or forests . Widespread use of insecticides and fertilizers on Dutch farms contributes to contaminated drinking water, acid rain, and other environmental problems. The Dutch are deliberately breaking some of the dikes to flood fields.
Global warming could threaten the Netherlands by raising the level of the sea around the country by between 20 and 58 centimeters (8 and 23 inches) within the next 100 years. Rather than build new dikes and polders, the Dutch have become world leaders in reducing the causes of global warming by acting to reduce industrial pollution and increase solar and wind power use, among other actions.
Gulf of
Mexico
25 50 MILES
25 50 KI LOMETERS
ATLANTIC OCEAN
ATLANTIC OCEAN
Regions: Areas of Unique Characteristics 29
FLORIDA: NOT-SO-SENSITIVE ENVIRONMENTAL MODIFICATION. Humans do not always modify the environment as sensitively as the Dutch. The fragile landscape of south Florida has been altered in insensitive ways, especially the barrier islands along the Atlantic and Gulf coasts, the wetlands between Lake Okeechobee and the Everglades National Park, and the Kissimmee River between Lake Kissimmee and Lake Okeechobee (Figure 1-16).
Several hundred thousand people live on barrier islands in Florida, as well as elsewhere along the Atlantic and Gulf coasts between Maine and Texas. These barrier islands are essentially large sandbars that shield the mainland from flooding and storm damage. They are constantly being eroded and shifted from the force of storms and pounding
FIGURE 1-16 Environmentally insensitive cultural ecology in Florida. To control flooding in central Florida, the U.S. Army Corps of Engineers straightened the course of the Kissimmee River, which had meandered for 160 kilometers (98 miles) from near Orlando to Lake Okeechobee. The water was rechanneled into a canal 90 meters wide (300 feet) and 9 meters deep (30 fee t), running in a straight line for 84 kilometers (52 miles). After the canal, known as C-3 8, opened in 1971, millions of gallons of polluted water- mainly runoff from cattle grazing-began pouring into Lake Okeechobee, which is the major source of fresh water for about half of Florida's population. Now the state wants the U.S. Army Corps of Engineers to return the river from the canal (between top and bottom on the right side of the photograph) to its original course (left rear in the photograph).
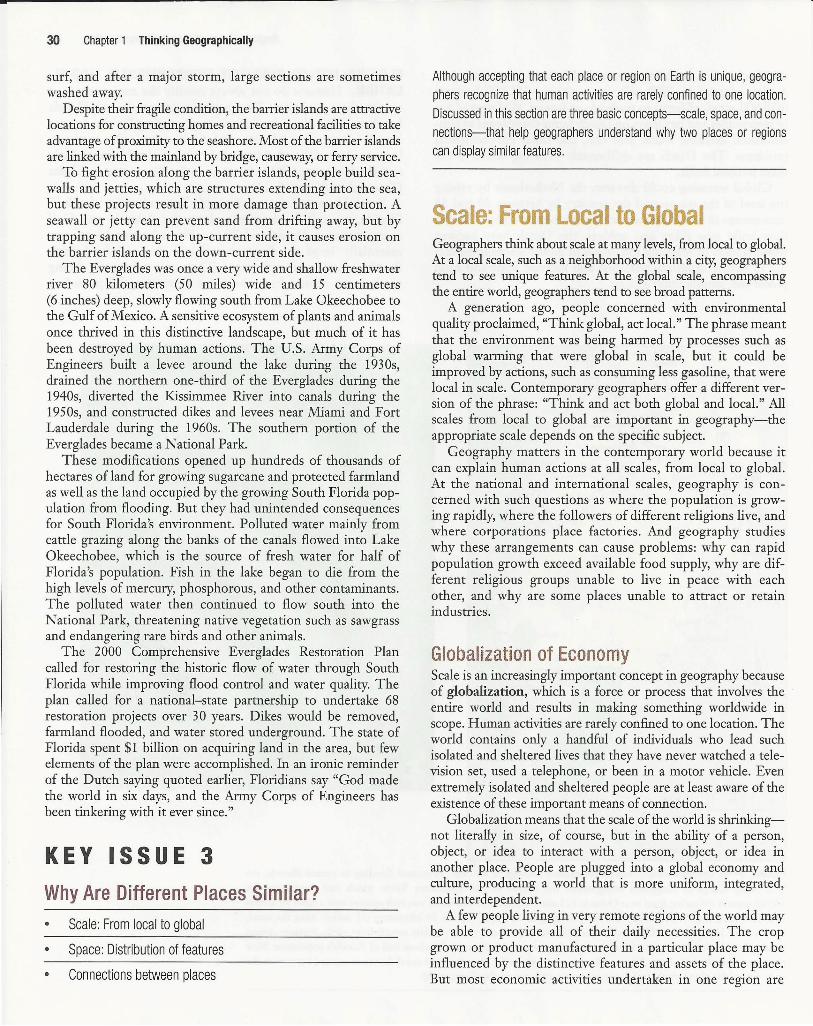
30 Chapter 1 Thinking Geographically
surf, and after a major storm, large sections are sometimes washed away.
Despite their fragile condition, the barrier islands are attractive locations for constructing homes and recreational facilities to take advantage of proximity to the seashore. Most of the barrier isla~ds are linked with the mainland by bridge, causeway, or ferry serv:Ice.
To fight erosion along the barrier islands, people build seawalls and jetties, which are structures extending into the sea, but these projects result in more damage than protection. A seawall or jetty can prevent sand from drifting away, but by trapping sand along the up-current side, it causes erosion on the barrier islands on the down-current side.
The Everglades was once a very wide and shallow freshwater river 80 kilometers (50 miles) wide and 15 centimeters (6 inches) deep, slowly flowing south from Lake Okeechob.ee to the Gulf of Mexico. A sensitive ecosystem of plants and animals once thrived in this distinctive landscape, but much of it has been destroyed by human actions. The U.S. Army Corps of Engineers built a levee around the lake during the. 1930s, drained the northern one-third of the Everglades dunng the 1940s, diverted the Kissimmee River into canals during the 1950s, and constructed dikes and levees near Miami and Fort Lauderdale during the 1960s. The southern portion of the Everglades became a National Park.
These modifications opened up hundreds of thousands of hectares of land for growing sugarcane and protected farmland as well as the land occupied by the growing South Florida population from flooding. But they had unintended consequences for South Florida's environment. Polluted water mainly from cattle grazing along the banks of the canals flowed into Lake Okeechobee, which is the source of fresh water for half of Florida's population. Fish in the lake began to die from the high levels of mercury, phosphorous, and other contaminants. The polluted water then continued to flow south into the National Park, threatening native vegetation such as sawgrass and endangering rare birds and other animals.
The 2000 Comprehensive Everglades Restoration Plan called for restoring the historic flow of water through South Florida while improving flood control and water quality. The plan called for a national-state partnership to undertake 68 restoration projects over 30 years. Dikes would be removed, farmland flooded, and water stored underground. The state of Florida spent $1 billion on acquiring land in the area, but few elements of the plan were accomplished. In an ironic reminder of the Dutch saying quoted earlier, Floridians say "God made the world in six days, and the Army Corps of Engineers has been tinkering with it ever since."
KEY ISSUE 3
Why Are Different Places Similar? • Scale: From local to global
• Space: Distribution of features
• Connections between places
Although accepting that each place or region on Earth is unique, geographers recognize that human activities are rarely confined to one location. Discussed in this section are three basic concepts-scale, space, and connections-that help geographers understand why two places or regions can display similar features.
Scale: From Local to Global Geographers think about scale at many levels, from local to global. At a local scale, such as a neighborhood within a city, geographers tend to see unique features. At the global scale, encompassing the entire world, geographers tend to see broad patterns.
A generation ago, people concerned with environmental quality proclaimed, "Think global, act local." The phrase meant that the environment was being harmed by processes such as global warming that were global in scale, but it could be improved by actions, such as consuming less gasoli~e, that were local in scale. Contemporary geographers offer a different version of the phrase: "Think and act both global and local." All scales from local to global are important in geography-the appropriate scale depends on the specific subject. .
Geography matters in the contemporary world because it can explain human actions at all scales, from local to global. At the national and international scales, geography is concerned with such questions as where the population is growing rapidly, where the followers of different religions live, a~d where corporations place factories. And geography studies why these arrangements can cause problems: why can rap.id population growth exceed available food supply, why are different religious groups unable to live in peace with ea~h other, and why are some places unable to attract or retam industries.
Globalization of Economy Scale is an increasingly important concept in geography because of globalization, which is a force or process that involves the entire world and results in making something worldwide in scope. Human activities are rarely confined to one location. The world contains only a handful of individuals who lead such isolated and sheltered lives that they have never watched a television set, used a telephone, or been in a motor vehicle. Even extremely isolated and sheltered people are at least aware of the existence of these important means of connection.
Globalization means that the scale of the world is shrinkingnot literally in size, of course, but in the ability of a person, object, or idea to interact with a person, object, or idea in another place. People are plugged into a global economy and culture, producing a world that is more uniform, integrated, and interdependent. .
A few people living in very remote regions of the world may be able to provide all of their daily necessities. The crop grown or product manufactured in a particular place may be influenced by the distinctive features and assets of the place. But most economic activities undertaken in one region are
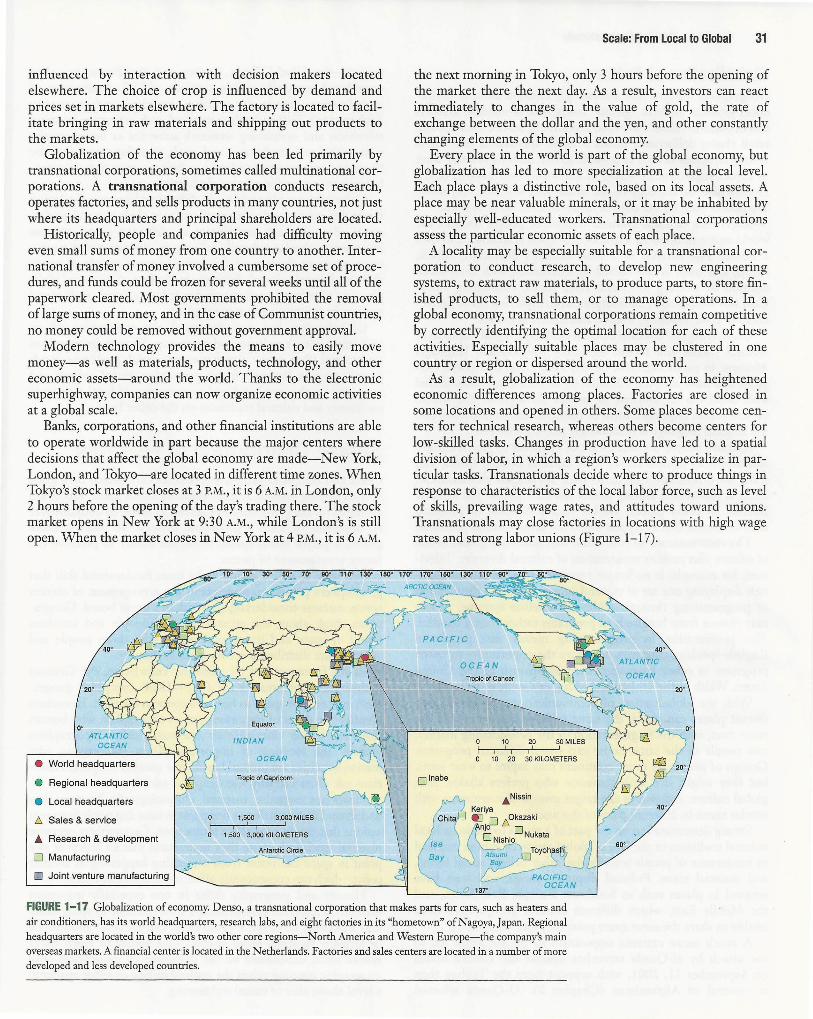
influenced by interaction with decision makers located elsewhere. The choice of crop is influenced by demand and prices set in markets elsewhere. The factory is located to facilitate bringing in raw materials and shipping out products to the markets.
Globalization of the economy has been led primarily by transnational corporations, sometimes called multinational corporations. A transnational corporation conducts research, operates factories, and sells products in many countries, not just where its headquarters and principal shareholders are located.
Historically, people and companies had difficulty moving even small sums of money from one country to another. International transfer of money involved a cumbersome set of procedures, and funds could be frozen for several weeks until all of the paperwork cleared. Most governments prohibited the removal of large sums of money, and in the case of Communist countries, no money could be removed without government approval.
Modern technology provides the means to easily move money-as well as materials, products, technology, and other economic assets-around the world. Thanks to the electronic superhighway, companies can now organize economic activities at a global scale.
Banks, corporations, and other financial institutions are able to operate worldwide in part because the major centers where decisions that affect the global economy are made-New York, London, and Tokyo-are located in different time zones. When Tokyo's stock market closes at 3 P.M., it is 6 A.M. in London, only 2 hours before the opening of the day's trading there. The stock market opens in New York at 9:30 A.M., while London's is still open. When the market closes in New York at 4 P.M., it is 6 A.M.
0' ATLANTIC
OCEAN
• World headquarters
e Regional headquarters
e Local headquarters
!::,. Sales & service
.A Research & development
D Manufacturing
O Joint venture manufacturing
IND/AN
OCEAN
Tropic of Capricorn
1,500 3,000 MILES
0 1,500 3,000 KILOMETERS
Antarctic Circle _,......~.._..-~---
Scale: From Local to Global 31
the next morning in Tokyo, only 3 hours before the opening of the market there the next day. As a result, investors can react immediately to changes in the value of gold, the rate of exchange between the dollar and the yen, and other constantly changing elements of the global economy.
Every place in the world is part of the global economy, but globalization has led to more specialization at the local level. Each place plays a distinctive role, based on its local assets. A place may be near valuable minerals, or it may be inhabited by especially well-educated workers. Transnational corporations assess the particular economic assets of each place.
A locality may be especially suitable for a transnational corporation to conduct research, to develop new engineering systems, to extract raw materials, to produce parts, to store finished products, to sell them, or to manage operations. In a global economy, transnational corporations remain competitive by correctly identifying the optimal location for each of these activities. Especially suitable places may be clustered in one country or region or dispersed around the world.
As a result, globalization of the economy has heightened economic differences among places. Factories are closed in some locations and opened in others. Some places become centers for technical research, whereas others become centers for low-skilled tasks. Changes in production have led to a spatial division of labor, in which a region's workers specialize in particular tasks. Transnationals decide where to produce things in response to characteristics of the local labor force, such as level of skills, prevailing wage rates, and attitudes toward unions. Transnationals may close factories in locations with high wage rates and strong labor unions (Figure 1-17).
40°
20'
10 20
0 10 20 30 KILOMETERS
.&Nissin
FIGURE 1-17 Globalization of economy. Denso, a transnational corporation that makes parts for cars, such as heaters and
air conditioners, has its world headquarters, research labs, and eight factories in its "hometown" of Nagoya, Japan. Regional
headquarters are located in the world's two other core regions-North America and Western Europe-the company's main
overseas markets. A financial center is located in the Netherlands. Factories and sales centers are located in a number of more developed and less developed countries.
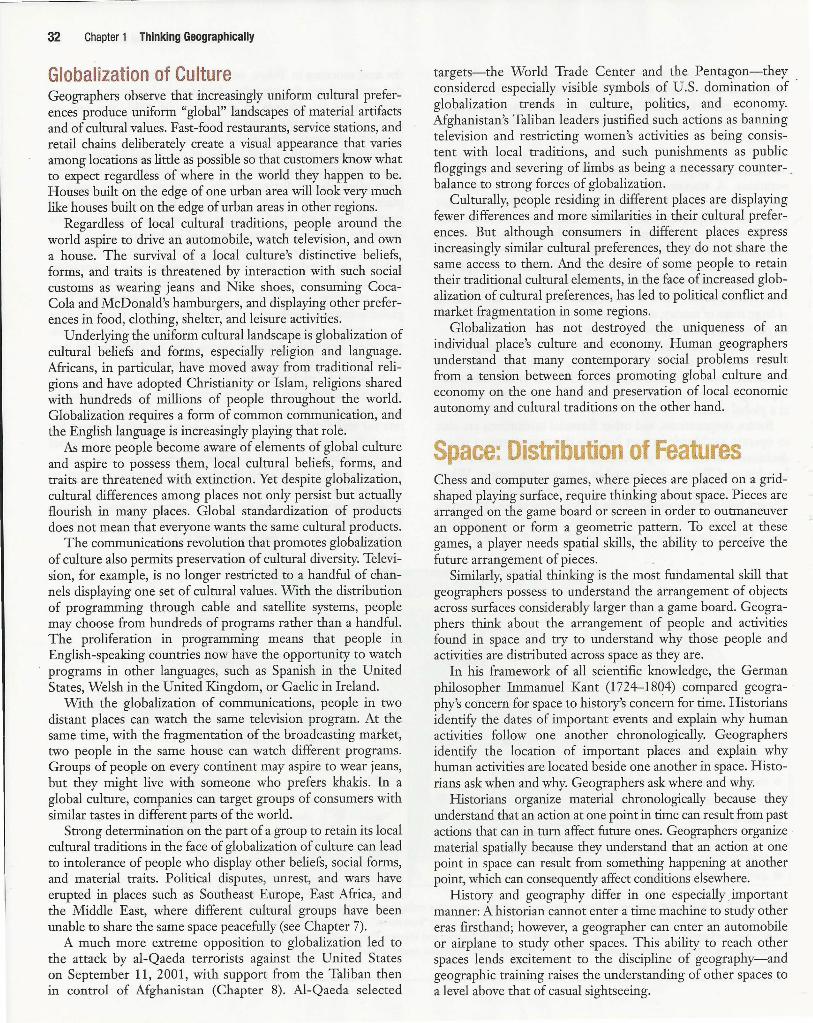
32 Chapter 1 Thinking Geographically
Globalization of Culture Geographers observe that increasingly uniform cultural preferences produce uniform "global" landscapes of material artifacts and of cultural values. Fast-food restaurants, service stations, and retail chains deliberately create a visual appearance that varies among locations as little as possible so that customers know what to expect regardless of where in the world they happen to be. Houses built on the edge of one urban area will look very much like houses built on the edge of urban areas in other regions.
Regardless of local cultural traditions, people around the world aspire to drive an automobile, watch television, and own a house. The survival of a local culture's distinctive beliefs, forms, and traits is threatened by interaction with such social customs as wearing jeans and Nike shoes, consuming CocaCola and McDonald's hamburgers, and displaying other preferences in food, clothing, shelter, and leisure activities.
Underlying the uniform cultural landscape is globalization of cultural beliefs and forms, especially religion and language. Africans, in particular, have moved away from traditional religions and have adopted Christianity or Islam, religions shared with hundreds of millions of people throughout the world. Globalization requires a form of common communication, and the English language is increasingly playing that role.
As more people become aware of elements of global culture and aspire to possess them, local cultural beliefs, forms, and traits are threatened with extinction. Yet despite globalization, cultural differences among places not only persist but actually flourish in many places. Global standardization of products does not mean that everyone wants the same cultural products.
The communications revolution that promotes globalization of culture also permits preservation of cultural diversity. Television, for example, is no longer restricted to a handful of channels displaying one set of cultural values. With the distribution of programming through cable and satellite systems, people may choose from hundreds of programs rather than a handful. The proliferation in programming means that people in English-speaking countries now have the opportunity to watch programs in other languages, such as Spanish in the United States, Welsh in the United Kingdom, or Gaelic in Ireland.
With the globalization of communications, people in two distant places can watch the same television program. At the same time, with the fragmentation of the broadcasting market, two people in the same house can watch different programs. Groups of people on every continent may aspire to wear jeans, but they might live with someone who prefers khakis. In a global culture, companies can target groups of consumers with similar tastes in different parts of the world.
Strong determination on the part of a group to retain its local cultural traditions in the face of globalization of culture can lead to intolerance of people who display other beliefs, social forms, and material traits. Political disputes, unrest, and wars have erupted in places such as Southeast Europe, East Africa, and the Middle East, where different cultural groups have been unable to share the same space peacefully (see Chapter 7).
A much more extreme opposition to globalization led to the attack by al-Qaeda terrorists against the United States on September 11, 2001, with support from the Taliban then in control of Afghanistan (Chapter 8). Al-Qaeda selected
targets-the World Trade Center and the Pentagon-they considered especially visible symbols of U.S. domination of globalization trends in culture, politics, and economy. Afghanistan's Taliban leaders justified such actions as banning television and restricting women's activities as being consistent with local traditions, and such punishments as public floggings and severing of limbs as being a necessary counter- . balance to strong forces of globalization.
Culturally, people residing in different places are displaying fewer differences and more similarities in their cultural preferences. But although consumers in different places express increasingly similar cultural preferences, they do not share the same access to them. And the desire of some people to retain their traditional cultural elements, in the face of increased globalization of cultural preferences, has led to political conflict and market fragmentation in some regions.
Globalization has not destroyed the uniqueness of an individual place's culture and economy. Human geographers understand that many contemporary social problems result from a tension between forces promoting global culture and economy on the one hand and preservation of local economic autonomy and cultural traditions on the other hand.
Space: Distribution of Features Chess and computer games, where pieces are placed on a gridshaped playing surface, require thinking about space. Pieces are arranged on the game board or screen in order to outmaneuver an opponent or form a geometric pattern. To excel at these games, a player needs spatial skills, the ability to perceive the future arrangement of pieces.
Similarly, spatial thinking is the most fundamental skill that geographers possess to understand the arrangement of objects across surfaces considerably larger than a game board. Geographers think about the arrangement of people and activities found in space and try to understand why those people and activities are distributed across space as they are.
In his framework of all scientific knowledge, the German philosopher Immanuel Kant (1724-1804) compared geography's concern for space to history's concern for time. Historians identify the dates of important events and explain why human activities follow one another chronologically. Geographers identify the location of important places and explain why human activities are located beside one another in space. Historians ask when and why. Geographers ask where and why.
Historians organize material chronologically because they understand that an action at one point in time can result from past actions that can in turn affect future ones. Geographers organize material spatially because they understand that an action at one point in space can result from something happening at another point, which can consequently affect conditions elsewhere.
History and geography differ in one especially .important manner: A historian cannot enter a time machine to study other eras firsthand; however, a geographer can enter an automobile or airplane to study other spaces. This ability to reach other spaces lends excitement to the discipline of geography-and geographic training raises the understanding of other spaces to a level above that of casual sightseeing.
Distribution Look around the space you currently occupy- perhaps a classroom, residence hall, or room in a house. Tables, chairs, and other large objects are arranged regularly, such as in a row in a classroom or against a wall at home (though books and papers may be strewn about the space randomly). The room is located in a building that occupies an organized space- along a street, a side of a quadrangle, or next to a park. Similarly, the community containing the campus or house is part of a system of communities arranged across the country and around the world.
Each building and community, as well as every other human or natural object, occupies a unique space on Earth, and geographers explain how these features are arranged across Earth. On Earth as a whole, or within an area of Earth, features may be numerous or scarce, close together or far apart. The arrangement of a feature in space is known as its distribution. Geographers identify three main properties of distribution across Earth- density, concentration, and pattern.
DENSITY. The frequency with which something occurs in space is its density. The feature being measured could be people, houses, cars, volcanoes, or anything. The area could be measured in square kilometers, square miles, hectares, acres, or any other unit of area.
Arithmetic density, which is the total number of objects in an area, is commonly used to compare the distribution of population in different countries. The arithmetic density of Belgium, for example, is 345 persons per square kilometer (900 persons per square mile). This density is the country's total population (10.5 million people) divided by its area (30,278 square kilometers, or 11,690 square miles) .
Remember that a large population does not necessarily lead to a high density. Arithmetic density involves two measures-the number of people and the land area. The most populous country in the world, China, with approximately 1.3 billion inhabitants, by no means has the highest density. The arithmetic density of China-approximately 140 persons per square kilometer (3 5 5 persons per square mile)- is less than half that of Belgium. Although China has 125 times more inhabitants than Belgium, it has more than 300 times more land.
High population density is also unrelated to poverty. The Netherlands, one of the world's wealthiest countries, has an arithmetic density of approximately 400 persons per square kilometer (1,040 persons per square mile). One of the poorest countries, Mali, has an arithmetic density of only 11 persons per square kilometer (29 persons per square mile).
Geographers measure density in other ways, depending on the subject being studied. A high physiological density-the number of persons per unit of area suitable for agriculturemay mean that a country has difficulty growing enough food to sustain its population. A high agricultural density-the number of farmers per unit area of farmland- may mean that a country has inefficient agriculture. A high housing density-the number of dwelling units per unit of area-may mean that people live in overcrowded housing.
CONCENTRATION. The extent of a feature 's spread over space is its concentration. If the objects in an area are close together, they are clustered; if relatively far apart, they are dispersed. To
Space: Distribution of Features 33
0 200 400 FEET
FIGURE 1-18 Distribution. The top plan for a residential area has a lower density
than the middle plan (24 houses compared to 32 houses on the same 82-acre piece
of land), but both have dispersed concentrations. The middle and lower plans have
the same density (32 houses on 82 acres), but the distribution of houses is more
clustered in the lower plan. The lower plan has shared open space, whereas the
middle plan provides a larger, private yard surrounding each house.
compare the level of concentration most clearly, two areas need to have the same number of objects and the same size area.
Geographers use concentration to describe changes in distribution. For example, the distribution of people across the United States is increasingly dispersed. The total number of people living in the United States is growing slowly-less than 1 percent per year-and the land area is essentially unchanged. But the population distribution is changing from relatively clustered in the Northeast to more evenly dispersed across the country.
Concentration is not the same as density. Two neighborhoods could have the same density of housing but different concentrations. In a dispersed neighborhood each house has a large private yard, whereas in a clustered neighborhood the houses are close together and the open space is shared as a community park (Figure 1-18).
34 Chapter 1 Thinking Geographically
FIGURE 1-19 Density and concentration of baseball teams. The changing distribution of North American baseball teams illustrates the difference between density and concentration.
These six teams moved to other cities during the 19 5 Os and 1960s:
•Braves-Boston to Milwaukee in 1953, then to Atlanta in 1966 • Browns-St. Louis to Baltimore (Orioles) in 1954 •Athletics- Philadelphia to Kansas City in 1955, then to Oakland in 1968 • Dodgers-Brooklyn to Los Angeles in 1958 •Giants- New York to San Francisco in 1958 •Senators-Washington to Minneapolis (Minnesota Twins) in 1961
These 14 teams were added between the 1960s and 1990s:
• Angels-Los Angeles in 1961, then to Anaheim (California) in 1965 •Senators-Washington in 1961, then to Dallas (Texas Rangers) in 1971 •Mets- New York in 1962 • Astros-Houston (originally Colt .45s) in 1962 • Royals-Kansas City in 1969 • Padres-San Diego in 1969 • Expos-Montreal in 1969, then to Washington (Nationals) in 2005 • Pilots- Seattle in 1969, then to Milwaukee (Brewers) in 1970 • Blue Jays-Toronto in 1977 • Mariners-Seattle in 1977 • Marlins- Miami (Florida) in 1993 •Rockies-Denver (Colorado) in 1993 • Devil Rays-Tampa Bay in 1998 • Diamondbacks-Phoenix (Arizona) in 1998
As a result of these relocations and additions, the density of teams increased, and the distribution became more dispersed.
We can illustrate the difference between density and concentration at a far larger scale than a neighborhood. Within North America the distribution of major-league baseball teams changed during the second half of the twentieth century after remaining unchanged during the first half of the twentieth century (Figure 1-19). The major leagues expanded from 16 to 30 teams in North America between 1960 and 1998, thus increasing the density.
At the same time, six of the 16 original teams moved to other locations. In 1952 every team was clustered in the Northeast United States, but the moves dispersed several teams to the West Coast and Southeast. These moves, as well as the spaces occupied by the expansion teams, resulted in a more dispersed distribution.
PATTERN. The third property of distribution is the pattern, which is the geometric arrangement of objects in space. Some features are organized in a geometric pattern, whereas others are distributed irregularly. Geographers observe that many
objects form a linear distribution, such as the arrangement of houses along a street or stations along a subway line.
Objects are frequently arranged in a square or rectangular pattern. Many American cities contain a regular pattern of streets, known as a grid pattern, which intersect at right angles at uniform intervals to form square or rectangular blocks. The system of townships, ranges, and sections established by the Land Ordinance of 1785 is another example of a square or grid pattern. The distribution of baseball teams also follows a regular pattern-the teams are located in North America's largest metropolitan areas (the three largest metropolitan areas have two teams).
A sinister pattern was placed on the American landscape in 2002 by a college student through placement of two dozen pipe bombs. The bomber confessed that he was trying to create a large "smile" pattern across the U.S. interior. He got as far as creating the two "eyes" by placing bombs in two large circles, one in Nebraska and one in eastern Iowa and western Illinois. Before being caught, he also placed bombs in Colorado and Texas to start the "mouth."
Gender and Ethnic Diversity in Space Patterns in space vary according to gender and ethnicity. Consider first the daily patterns of an "all-American" family of mother, father, son, and daughter. Leave aside for the moment that this type of family constitutes less than one-fourth of American households. In the morning Dad gets in his car and drives from home to work, where he parks the car and spends the day; then, in the late afternoon, he collects the car and drives home. The location of the home was selected in part to ease Dad's daily commute to work.
The mother's local-scale travel patterns are likely to be far more complex than the father's. Mom takes the children to school and returns home. She also drives to the supermarket, visits Grandmother, and walks the dog. In between she organizes the several thousand square feet of space that the family calls home. In the afternoon she picks up the youngsters at school and takes them to Little League or ballet lessons. Later she brings them home, just in time for her to resume her responsibility for organizing the home.
Most American women are now employed at work outside the home, adding a substantial complication to an already complex pattern of moving across urban space. Where is her job located? The family house was already selected largely for access to Dad's place of employment, so Mom may need to travel across town. Who leaves work early to drive a child to a doctor's office? Who takes a day off work when a child is at home sick?
The importance of gender in space is learned as a child. Which child-the boy or girl-went to Little League, and which went to ballet lessons? To which activity is substantially more land allocated in a city-ballfields or dance studios?
If the family described above consisted of persons of color, its connections with space would change. The effects of race on spatial interaction can be seen across America. In downtown Dayton, Ohio, watch the people at the bus stops along the main east-west street, Third Street. In the afternoon, when office workers are heading home, persons of color are waiting on the north side of Third Street for westbound buses, while whites are waiting on the south side for eastbound buses. Why do persons of color head west on Dayton's afternoon buses? Virtually all African Americans in Dayton live on the west side, whereas the east side is home to a virtually all white population.
In most U.S. neighborhoods the residents are virtually all white people or virtually all persons of color. Although it is illegal to discriminate against people of color, segregation persists in part because people want to reinforce their cultural identity by living near persons of similar background, and in part because persons of color have lower than average incomes. But many Americans of European ancestry still practice discrimination because of a deep-seated fear of spatial interaction with a person of color.
Openly homosexual men and lesbian women may be attracted to some locations to reinforce spatial interaction with other gays. San Francisco reinforces its reputation as a sympathetic home for homosexuals and lesbians through such practical means as preventing the city from doing business with
Connections Between Places 35
companies that do not provide their employees with domesticpartner benefits. Specific neighborhoods in other cities may be known to have large gay populations.
A pet dog doesn't care if you are male or female, black or white, gay or not. As long as you feed it, take care of it, and maintain close spatial interaction with it, your dog will respond with total, unquestioned devotion. Although dogs don't care about these cultural traits, people do. They are key characteristics to which people refer in order to identify who they are. Cultural identity is a source of pride to people at the local scale and an inspiration for personal values.
Even more important than self-identification, these traits matter to other people. They are the criteria by which other people classify us and choose to interact with us. Whatever biological basis may or may not exist for distinguishing among humans, differences in gender, race, and sexual orientation are first and foremost constructed by the attitudes and actions of others. Geographers consider cultural identity to be important in understanding spatial interaction, because humans repeatedly demonstrate that these factors are important in explaining why they sort themselves out in space and move across the landscape in distinctive ways.
All academic disciplines and workplaces have proclaimed sensitivity to issues of cultural diversity. For geographers, cone\~ , for cultural diversity is not merely a politically correct ex~~ ency; it lies at the heart of geography's spatial tradition. :r:>TOr for · geographers is deep respect for the dignity of all cultural" groups merely a politically correct expediency; it lies at th{ heart of geography's explanation of why each place on Earth 'is unique.
Connections Between Places \ Geographers increasingly think about connections among places and regions. More rapid connections have reduced the distance across space between places, not literally in miles, of course, but in time. Geographers apply the term space-time compression to describe the reduction in the time ir takes for something to reach another place. Distant places seem less remote and more accessible to us. We know more about what is happening elsewhere in the world, and we know sooner.
Space-time compression promotes rapid change, as the culture and economy of one place reach other places much more quickly than in the past. With better connections between places, people in one region are now exposed to a constant barrage of cultural traits and economic initiatives from people in other regions, and they may adopt some of these cultural and economic elements (Figure 1-20). Geographers explain the process, called diffusion, by which connections are made between regions, as well as the mechanism by which connections are maintained through networks.
Spatial Interaction In the past, most forms of interaction among cultural groups required the physical movement of settlers, explorers, and plunderers from one location to another. As recently as
36 Chapter 1 Thinking Geographically
FIGURE 1-20 Space-time compression. Transportation improvements have shrunk the world. In 1492 Christopher Columbus took 3 7 days (nearly 900 hours) to sail across the Atlantic Ocean from the Canary Islands to San Salvador Island. In 1912 the Titanic was scheduled to sail from Queenstown (now Cobh), Ireland, to New York in about 5 days, although two-thirds of the way across, after 80 hours at sea, it hit an iceberg and sank. In 1927 Charles Lindbergh was the first person to fly nonstop across the Atlantic, taking 3 3 .5 hours to go from New York to Paris. In 1962 John Glenn, the first American to orbit in space, crossed above the Atlantic in about a quarter-hour and circled the globe three times in 5 hours.
A.D. 1800, people traveled in the same ways and at about the same speeds as in 1800 B.C.-they were carried by an animal, took a sailboat, or walked.
FIGURE 1- 21 Continental Airlines' network. Continental, like other major U.S. airlines, has configured its route network in a system known as "hub and spokes." Lines connect each airport to the ciry to which it sends the most nonstop flights. Most flights originate or end at one of the company's hubs, especially at Houston, Newark, and Cleveland.
Today travel by motor vehicle or airplane is much quicker. But we do not even need to travel to know about another place. We can transmit images and messages from one part of the world to another at the touch of a button. We can communicate instantly with people in distant places through computers and telecommunications, and we can instantly see people in distant places on television. These and other forms of communication have made it possible for people in different places to be aware of the same cultural beliefs, forms, and traits. When places are connected to each other through a network, geographers say there is spatial interaction between them.
Interaction takes place through networks, which are chains of communication that connect places. A well-known example of a network in the United States is the television network (ABC, CBS, FOX, NBC, PBS). Each comprises a chain of stations around the country simultaneously broadcasting the same program, such as a football game.
Transportation systems also form networks that connect places to each other. Airlines in the United States, for example, have adopted distinctive networks known as "huband-spokes." Under the hub-and-spokes system, airlines fly planes from a large number of places into one hub airport within a short period of time and then a short time later send the planes to another set of places. In principle, travelers originating in relatively small towns can reach a wide variety of destinations by changing planes at the hub airport (Figure 1-21).
Interaction among groups can be retarded by barriers. These can be physical, such as oceans and deserts, or cultural, such as language and traditions. We regard the landscape as part of our inheritance from the past. As a result, we may be reluctant to modify it unless we are under heavy pressure to do so. A major change in the landscape may reflect an upheaval in a people's culture.
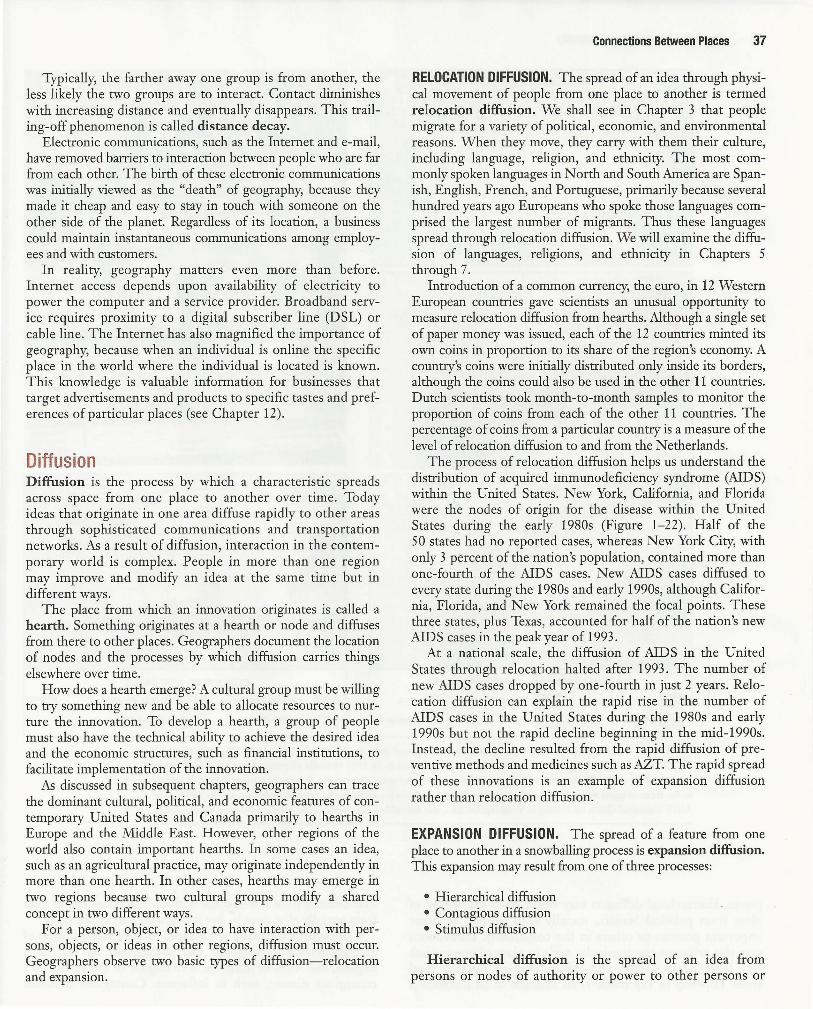
Typically, the farther away one group is from another, the less likely the two groups are to interact. Contact diminishes with increasing distance and eventually disappears. This trailing-off phenomenon is called distance decay.
Electronic communications, such as the Internet and e-mail, have removed barriers to interaction between people who are far from each other. The birth of these electronic communications was initially viewed as the "death" of geography, because they made it cheap and easy to stay in touch with someone on the other side of the planet. Regardless of its location, a business could maintain instantaneous communications among employees and with customers.
In reality, geography matters even more than before. Internet access depends upon availability of electricity to power the computer and a service provider. Broadband service requires proximity to a digital subscriber line (DSL) or cable line. The Internet has also magnified the importance of geography, because when an individual is online the specific place in the world where the individual is located is known. This knowledge is valuable information for businesses that target advertisements and products to specific tastes and preferences of particular places (see Chapter 12).
Diffusion Diffusion is the process by which a characteristic spreads across space from one place to another over time. Today ideas that originate in one area diffuse rapidly to other areas through sophisticated communications and transportation networks. As a result of diffusion, interaction in the contemporary world is complex. People in more than one region may improve and modify an idea at the same time but in different ways.
The place from which an innovation originates is called a hearth. Something originates at a hearth or node and diffuses from there to other places. Geographers document the location of nodes and the processes by which diffusion carries things elsewhere over time.
How does a hearth emerge? A cultural group must be willing to try something new and be able to allocate resources to nurture the innovation. To develop a hearth, a group of people must also have the technical ability to achieve the desired idea and the economic structures, such as financial institutions, to facilitate implementation of the innovation.
As discussed in subsequent chapters, geographers can trace the dominant cultural, political, and economic features of contemporary United States and Canada primarily to hearths in Europe and the Middle East. However, other regions of the world also contain important hearths. In some cases an idea, such as an agricultural practice, may originate independently in more than one hearth. In other cases, hearths may emerge in two regions because two cultural groups modify a shared concept in two different ways.
For a person, object, or idea to have interaction with persons, objects, or ideas in other regions, diffusion must occur. Geographers observe two basic types of diffusion-relocation and expansion.
Connections Between Places 37
RELOCATION DIFFUSION. The spread of an idea through physical movement of people from one place to another is termed relocation diffusion. We shall see in Chapter 3 that people migrate for a variety of political, economic, and environmental reasons. When they move, they carry with them their culture, including language, religion, and ethnicity. The most commonly spoken languages in North and South America are Spanish, English, French, and Portuguese, primarily because several hundred years ago Europeans who spoke those languages comprised the largest number of migrants. Thus these languages spread through relocation diffusion. We will examine the diffusion of languages, religions, and ethnicity in Chapters 5 through 7.
Introduction of a common currency, the euro, in 12 Western European countries gave scientists an unusual opportunity to measure relocation diffusion from hearths. Although a single set of paper money was issued, each of the 12 countries minted its own coins in proportion to its share of the region's economy. A country's coins were initially distributed only inside its borders, although the coins could also be used in the other 11 countries. Dutch scientists took month-to-month samples to monitor the proportion of coins from each of the other 11 countries. The percentage of coins from a particular country is a measure of the level of relocation diffusion to and from the Netherlands.
The process of relocation diffusion helps us understand the distribution of acquired immunodeficiency syndrome (AIDS) within the United States. New York, California, and Florida were the nodes of origin for the disease within the United States during the early 1980s (Figure 1-22). Half of the 50 states had no reported cases, whereas New York City, with only 3 percent of the nation's population, contained more than one-fourth of the AIDS cases. New AIDS cases diffused to every state during the 1980s and early 1990s, although California, Florida, and New York remained the focal points. These three states, plus Texas, accounted for half of the nation's new AIDS cases in the peak year of 1993.
At a national scale, the diffusion of AIDS in the United States through relocation halted after 1993. The number of new AIDS cases dropped by one-fourth in just 2 years. Relocation diffusion can explain the rapid rise in the number of AIDS cases in the United States during the 1980s and early 1990s but not the rapid decline beginning in the mid-1990s. Instead, the decline resulted from the rapid diffusion of preventive methods and medicines such as AZT. The rapid spread of these innovations is an example of expansion diffusion rather than relocation diffusion.
EXPANSION DIFFUSION. The spread of a feature from one place to another in a snowballing process is expansion diffusion. This expansion may result from one of three processes:
• Hierarchical diffusion • Contagious diffusion • Stimulus diffusion
Hierarchical diffusion is the spread of an idea from persons or nodes of authority or power to other persons or
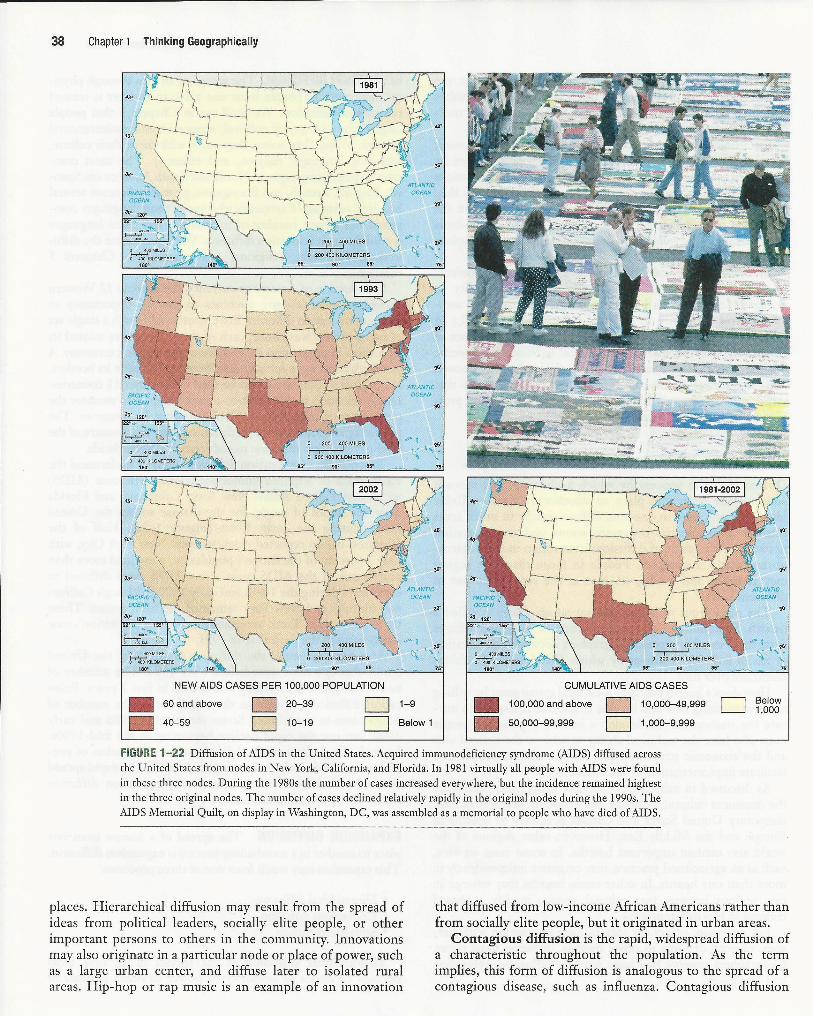
38 Chapter 1 Thinking Geographically
NEW AIDS CASES PER 100,000 POPULATION
• 60 and above
D 40-59
D 20-39
D 10-19
D 1-9
D Below1
CUMULATIVE AIDS CASES
• 100,000 and above
D 50.000-99,999
D D
10,000-49,999
1,000-9,999 D Below
1,000
FIGURE 1- 22 Diffusion of AIDS in the United States. Acquired immunodeficiency syndrome (AIDS) diffused across the United States from nodes in New York, California, and Florida. In 1981 virtually all people with AIDS were found in these three nodes. During the 1980s the number of cases increased everywhere, but the incidence remained highest in the three original nodes. The number of cases declined relatively rapidly in the original nodes during the 1990s. The AIDS Memorial Quilt, on display in Washington, DC, was assembled as a memorial to people who have died of AIDS.
places. Hierarchical diffusion may result from the spread of ideas from political leaders, socially elite people, or other important persons to others in the community. Innovations may also originate in a particular node or place of power, such as a large urban center, and diffuse later to isolated rural areas. Hip-hop or rap music is an example of an innovation
that diffused from low-income African Americans Tather than from socially elite people, but it originated in urban areas.
Contagious diffusion is the rapid, widespread diffusion of a characteristic throughout the population. As the term implies, this form of diffusion is analogous to the spread of a contagious disease, such as influenza. Contagious diffusion
spreads like a wave among fans in a stadium, without regard for hierarchy and without requiring permanent relocation of people. The rapid adoption throughout the United States of AIDS prevention methods and new medicines is an example of contagious diffusion. Ideas placed on the World Wide Web spread through contagious diffusion, because Web surfers throughout the world have access to the same material simultaneously-and quickly.
Stimulus diffusion is the spread of an underlying principle, even though a characteristic itself apparently fails to diffuse. For example, early desktop computer sales in the United States were divided about evenly between Macintosh Apple and IBM-compatible DOS systems. By the 1990s Apple sales had fallen far behind IBM-compatibles in the United States, and the company had limited presence in rapidly expanding overseas markets. But principles pioneered by Apple, notably making selections by pointing a mouse at an icon rather than typing a string of words, diffused through a succession of IBM-compatible Windows systems.
Expansion diffusion occurs much more rapidly in the contemporary world than in the past. Modern methods of communications, such as computers, facsimile machines, and electronic mail systems, have encouraged more rapid hierarchical diffusion than in the past. Use of the Internet, especially the World Wide Web, has encouraged more rapid contagious diffusion. All the new technologies support the possibility of stimulus diffusion. Diffusion from one place to another can be instantaneous in time, even if the physical distance between two places- as measured in kilometers or miles-is large.
DIFFUSION OF CULTURE AND ECONOMY. In a global culture and economy, transportation and communications systems have been organized to rapidly diffuse raw materials, goods, services, and capital from nodes of origin to other regions. Every area of the world plays some role intertwined with the roles played by other regions. Workers and cultural groups that in the past were largely unaffected by events elsewhere in the world now share a single economic and cultural world with other workers and cultural groups. The fate of an autoworker in Detroit is tied to investment decisions made in Mexico City, Seoul, Stuttgart, and Tokyo.
Global culture and economy are increasingly centered on three core or hearth regions of North America, Western Europe, and Japan. These three regions have a large percentage of the world's advanced technology, capital to invest in
SUMMARY Each chapter has a summary that reviews the chapter's most important concepts. The summary is organized around the major headings within the chapter. In all of the subsequent chapters, these headings will be in the form of questions that are answered in the text. In this first chapter, the principal headings concern thinking about five key concepts in geography:
Summary 39
new act1vmes, and wealth to purchase goods and services. From "command centers" in the three major world cities of New York, London, and Tokyo, key decision makers employ modern telecommunications to send out orders to factories, shops, and research centers around the world, an example of hierarchical diffusion.
Meanwhile, "nonessential" employees of the companies can be relocated to lower-cost offices outside the major financial centers. For example, Fila maintains headquarters in Italy but has moved 90 percent of its production of sportswear to Asian countries. Mitsubishi's corporate offices are in Japan, but all of its VCRs and DVDs are produced in other Asian countries.
Countries in Africa, Asia, and Latin America contain threefourths of the world's population and nearly all of its population growth, but they find themselves on a periphery, or outer edge, of global investment that arrives through hierarchical diffusion of decisions made by transnational corporations through hierarchical diffusion. People in peripheral regions, who once toiled in isolated farm fields to produce food for their families, now produce crops for sale in core regions or have given up farm life altogether and migrated to cities in search of jobs in factories and offices.
As a result, the global economy has produced greater disparities than in the past between the levels of wealth and wellbeing enjoyed by people in the core and in the periphery. The increasing gap in economic conditions between regions in the core and periphery that results from the globalization of the economy is known as uneven development.
Many people take for granted the ability to watch events in distant places through television, speak to others in distant places by telephone, and travel to far-off places by motor vehicle. An increasing number of the world's population regard access to these communications systems as novelties, perhaps recently experienced for the first time.
For some people, access to these cultural elements is a distant aspiration. Knowledge of these communications systems is global, but the ability to purchase them is not. Access to television, telephones, motor vehicles, and other means of communicating culture is restricted by an uneven division of wealth in the world. In some regions possession of these objects is widespread, but in other regions few people have enough wealth to buy them. Even within regions, access to cultural elements may be restricted because of uneven distribution of wealth or because of discrimination against women or minority groups.
1. How do geographers describe where things are? Geography is most fundamentally a spatial science. Geographers use maps to display the location of objects and to extract information about places. Early geographers drew maps of Earth's surface based on exploration and observation. GIS and other contemporary tools assist geographers in understanding reasons for observed regularities across Earth.
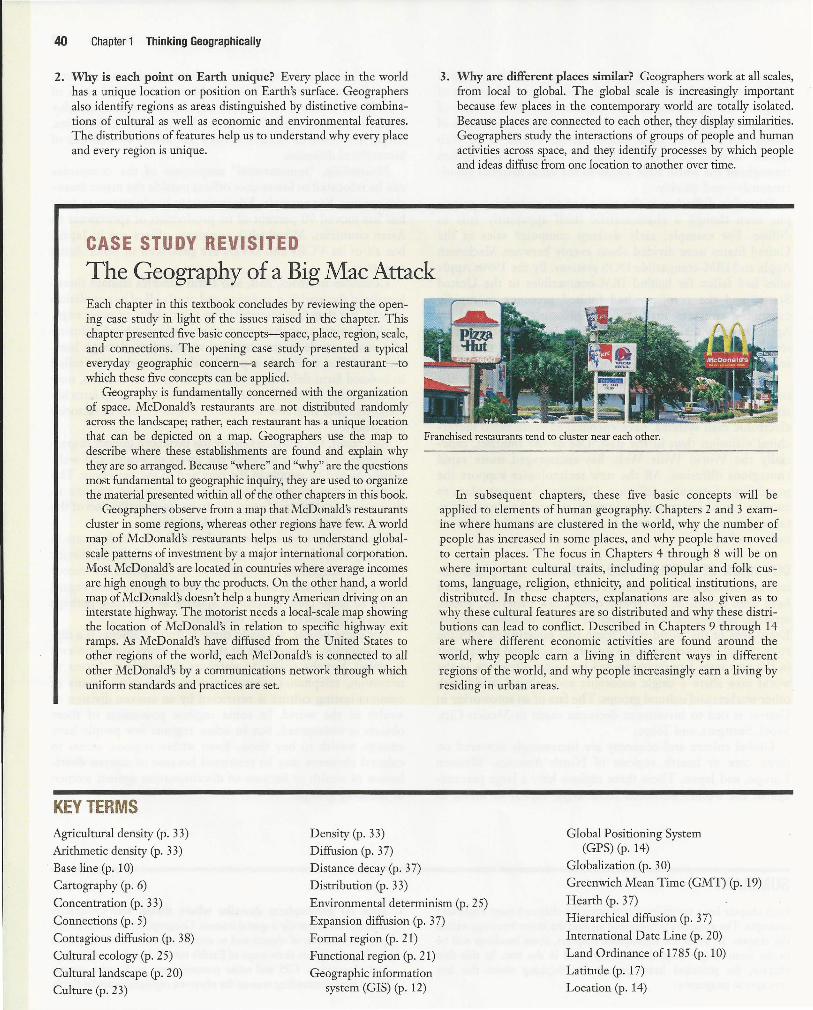
40 Chapter 1 Thinking Geographically
2. Why is each point on Earth unique? Every place in the world has a unique location or position on Earth's surface. Geographers also identify regions as areas distinguished by distinctive combinations of cultural as well as economic and environmental features. The distributions of features help us to understand why every place and every region is unique.
CASE STUDY REVISITED
The Geography of a Big Mac Attack Each chapter in this textbook concludes by reviewing the opening case study in light of the issues raised in the chapter. This chapter presented five basic concepts-space, place, region, scale, and connections. The opening case study presented a typical everyday geographic concern-a search for a restaurant-to which these five concepts can be applied.
3. Why are different places similar? Geographers work at all scales, from local to global. The global scale is increasingly important because few places in the contemporary world are totally isolated. Because places are connected to each other, they display similarities. Geographers study the interactions of groups of people and human activities across space, and they identify processes by which people and ideas diffuse from one location to another over time.
Geography is fundamentally concerned with the organization of space. McDonald's restaurants are not distributed randomly across the landscape; rather, each restaurant has a unique location that can be depicted on a map. Geographers use the map to describe where these establishments are found and explain why they are so arranged. Because "where" and "why" are the questions most fundamental to geographic inquiry, they are used to organize the material presented within all of the other chapters in this book.
Franchised restaurants tend to cluster near each other.
Geographers observe from a map that McDonald's restaurants cluster in some regions, whereas other regions have few. A world map of McDonald's restaurants helps us to understand globalscale patterns of investment by a major international corporation. Most McDonald's are located in countries where average incomes are high enough to buy the products. On the other hand, a world map of McDonald's doesn't help a hungry American driving on an interstate highway. The motorist needs a local-scale map showing the location of McDonald's in relation to specific highway exit ramps. As McDonald's have diffused from the United States to other regions of the world, each McDonald's is connected to all other McDonald's by a communications network through which uniform standards and practices are set.
KEY TERMS Density (p. 33)
Diffusion (p. 3 7)
Distance decay (p. 3 7)
Distribution (p. 33)
In subsequent chapters, these five basic concepts will be applied to elements of human geography. Chapters 2 and 3 examine where humans are clustered in the world, why the number of people has increased in some places, and why people have moved to certain places. The focus in Chapters 4 through 8 will be on where important cultural traits, including popular and folk customs, language, religion, ethnicity, and political institutions, are distributed. In these chapters, explanations are also given as to why these cultural features are so distributed and why these distributions can lead to conflict. Described in Chapters 9 through 14 are where different economic activities are found around the world, why people earn a living in different ways in different regions of the world, and why people increasingly earn a living by residing in urban areas.
Global Positioning System (GPS) (p. 14)
Globalization (p. 30)
Agricultural density (p. 33)
Arithmetic density (p. 33)
Base line (p. 10)
Cartography (p. 6)
Concentration (p. 3 3)
Connections (p. 5)
Contagious diffusion (p. 38)
Cultural ecology (p. 25)
Cultural landscape (p. 20)
Culture (p. 23)
Environmental determinism (p. 25)
Expansion diffusion (p. 3 7)
Greenwich Mean Time (GMT) (p. 19)
Hearth (p. 3 7)
Hierarchical diffusion (p. 3 7)
International Date Line (p. 20)
Land Ordinance of 1785 (p. 10)
Latitude (p. 17)
Formal region (p. 21)
Functional region (p. 21)
Geographic information system (GIS) (p. 12) Location (p. 14)
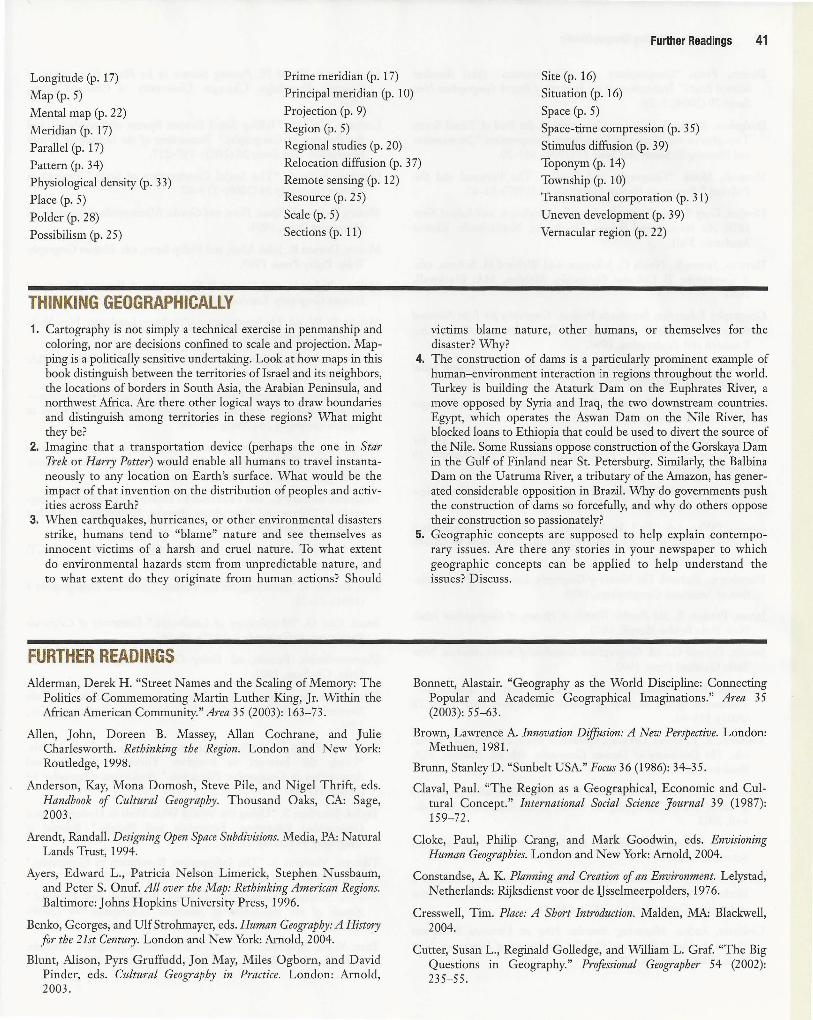
Longitude (p. 17)
Map (p. 5)
Mental map (p. 22)
Meridian (p. 17)
Prime meridian (p. 1 7)
Principal meridian (p. 10)
Projection (p. 9)
Region (p. 5)
Site (p. 16)
Situation (p. 16)
Space (p. 5)
Further Readings 41
Parallel (p. 17)
Pattern (p. 34)
Physiological density (p. 33)
Place (p. 5)
Regional studies (p. 20)
Relocation diffusion (p. 3 7)
Remote sensing (p. 12)
Resource (p. 25)
Space-time compression (p. 3 5)
Stimulus diffusion (p. 39)
Toponym (p. 14)
Township (p. 10)
Transnational corporation (p. 31)
Uneven development (p. 39)
Vernacular region (p. 22) Folder (p. 28) Scale (p. 5)
Possibilism (p. 25) Sections (p. 11)
THINKING GEOGRAPHICALLY 1. Cartography is not simply a technical exercise in penmanship and
coloring, nor are decisions confined to scale and projection. Mapping is a politically sensitive undertaking. Look at how maps in this book distinguish between the territories oflsrael and its neighbors, the locations of borders in South Asia, the Arabian Peninsula, and northwest Africa. Are there other logical ways to draw boundaries and distinguish among territories in these regions? What might they be?
2. Imagine that a transportation device (perhaps the one in Star Trek or Harry Potter) would enable all humans to travel instantaneously to any location on Earth's surface. What would be the impact of that invention on the distribution of peoples and activities across Earth?
3. When earthquakes, hurricanes, or other environmental disasters strike, humans tend to "blame" nature and see themselves as innocent victims of a harsh and cruel nature. To what extent do environmental hazards stem from unpredictable nature, and to what extent do they originate from human actions? Should
FURTHER READINGS Alderman, Derek H. "Street Names and the Scaling of Memory: The
Politics of Commemorating Martin Luther King, Jr. Within the African American Community." Area 35 (2003): 163-73.
Allen, John, Doreen B. Massey, Allan Cochrane, and Julie Charlesworth. Rethinking the Region. London and New York: Routledge, 1998.
Anderson, Kay, Mona Domosh, Steve Pile, and Nigel Thrift, eds. Handbook of Cultural Geography. Thousand Oaks, CA: Sage, 2003.
Arendt, Randall. Designing Open Space Subdivisions. Media, PA: Natural Lands Trust, 1994.
Ayers, Edward L., Patricia Nelson Limerick, Stephen Nussbaum, and Peter S. Onuf. All over the Map: Rethinking American Regions. Baltimore: Johns Hopkins University Press, 1996.
Benko, Georges, and Ulf Strohmayer, eds. Human Geography: A History for the 21st Century. London and New York: Arnold, 2004.
Blunt, Alison, Pyrs Gruffudd, Jon May, Miles Ogborn, and David Pinder, eds. Cultural Geography in Practice. London: Arnold, 2003.
victims blame nature, other humans, or themselves for the disaster? Why?
4. The construction of dams is a particularly prominent example of human-environment interaction in regions throughout the world. Turkey is building the Ataturk Dam on the Euphrates River, a move opposed by Syria and Iraq, the two downstream countries. Egypt, which operates the Aswan Dam on the Nile River, has blocked loans to Ethiopia that could be used to divert the source of the Nile. Some Russians oppose construction of the Gorskaya Dam in the Gulf of Finland near St. Petersburg. Similarly, the Balbina Dam on the Uatruma River, a tributary of the Amazon, has generated considerable opposition in Brazil. Why do governments push the construction of dams so forcefully, and why do others oppose their construction so passionately?
5. Geographic concepts are supposed to help explain contemporary issues. Are there any stories in your newspaper to which geographic concepts can be applied to help understand the issues? Discuss.
Bonnett, Alastair. "Geography as the World Discipline: Connecting Popular and Academic Geographical Imaginations." Area 3 5 (2003): 55-63.
Brown, Lawrence A. Innovation Diffusion: A New Perspective. London: Methuen, 1981.
Brunn, Stanley D. "Sunbelt USA." Focus 36 (1986): 34-35.
Claval, Paul. "The Region as a Geographical, Economic and Cultural Concept." International Social Science Journal 39 (1987): 159-72.
Cloke, Paul, Philip Crang, and Mark Goodwin, eds. Envisioning Human Geographies. London and New York: Arnold, 2004.
Constandse, A. K. Planning and Creation of an Environment. Lelystad, Netherlands: Rijksdienst voor de I]sselmeerpolders, 1976.
Cresswell, Tim. Place: A Short Introduction. Malden, MA: Blackwell, 2004.
Cutter, Susan L., Reginald Golledge, and William L. Graf. "The Big Questions in Geography." Professional Geographer 54 (2002): 235-55.
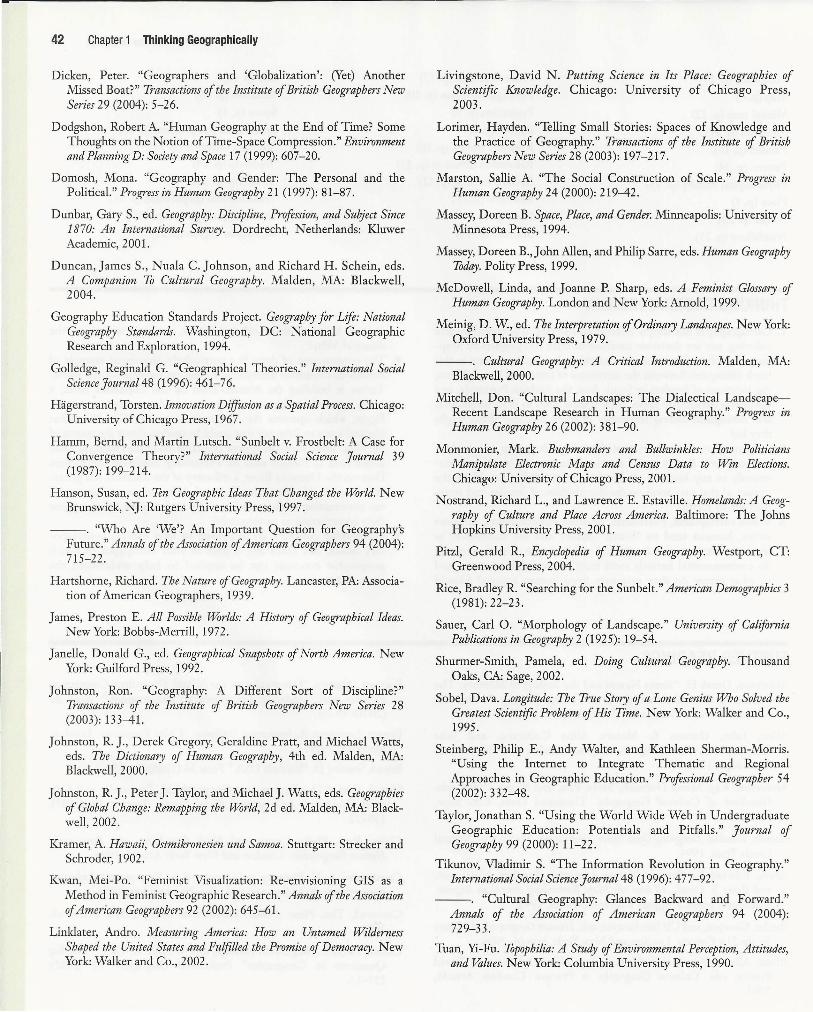
42 Chapter 1 Thinking Geographically
Dicken, Peter. "Geographers and 'Globalization': (Yet) Another Missed Boat?" Transactions of the Institute of British Geographers New Series 29 (2004): 5-26.
Dodgshon, Robert A. "Human Geography at the End of Time? Some Thoughts on the Notion of Time-Space Compression." Environment and Planning D: Societ:y and Space 17 (1999): 607-20.
Domosh, Mona. "Geography and Gender: The Personal and the Political." Progress in Human Geography 21 (1997): 81-87.
Dunbar, Gary S., ed. Geography: Discipline, Profession, and Subject Since 1870: An International Survey. Dordrecht, Netherlands: Kluwer Academic, 2001.
Duncan, James S., Nuala C. Johnson, and Richard H. Schein, eds. A Companion To Cultural Geography. Malden, MA: Blackwell, 2004.
Geography Education Standards Project. Geography for Life: National Geography Standards. Washington, DC: National Geographic Research and Exploration, 1994.
Golledge, Reginald G. "Geographical Theories." International Social Science Journal 48 (1996): 461-76.
Hagerstrand, Torsten. Innovation Diffusion as a Spatial Process. Chicago: University of Chicago Press, 1967.
Hamm, Bernd, and Martin Lutsch. "Sunbelt v. Frostbelt: A Case for Convergence Theory?" International Social Science Journal 39 (1987): 199-214.
Hanson, Susan, ed. Ten Geographic Ideas That Changed the World. New Brunswick, NJ: Rutgers University Press, 1997.
---. "Who Are 'We'? An Important Question for Geography's Future." Annals of the Association of American Geographers 94 (2004): 715-22.
Hartshorne, Richard. The Nature of Geography. Lancaster, PA: Association of American Geographers, 1939.
James, Preston E. All Possible Worlds: A History of Geographical Ideas. New York: Bobbs-Merrill, 1972.
Janelle, Donald G., ed. Geographical Snapshots of North America. New York: Guilford Press, 1992.
Johnston, Ron. "Geography: A Different Sort of Discipline?" Transactions of the Institute of British Geographers New Series 28 (2003): 133-41.
Johnston, R. ]., Derek Gregory, Geraldine Pratt, and Michael Watts, eds. The Dictionary of Human Geography, 4th ed. Malden, MA: Blackwell, 2000.
Johnston, R. ]., Peter J. Taylor, and Michael]. Watts, eds. Geographies of Global Change: Remapping the World, 2d ed. Malden, MA: Blackwell, 2002.
Kramer, A. Hawaii, Ostmikronesien und Samoa. Stuttgart: Strecker and Schroder, 1902.
Kwan, Mei-Po. "Feminist Visualization: Re-envisioning GIS as a Method in Feminist Geographic Research." Annals of the Association of American Geographers 92 (2002): 645-61.
Linklater, Andro. Measuring America: How an Untamed Wilderness Shaped the United States and Fulfilled the Promise of Democracy. New York: Walker and Co., 2002.
Livingstone, David N. Putting Science in Its Place: Geographies of Scientific Knowledge. Chicago: University of Chicago Press, 2003.
Lorimer, Hayden. "Telling Small Stories: Spaces of Knowledge and the Practice of Geography." Transactions of the Institute of British Geographers New Series 28 (2003): 197-217.
Marston, Sallie A. "The Social Construction of Scale." Progress in Human Geography 24 (2000): 219-42.
Massey, Doreen B. Space, Place, and Gender. Minneapolis: University of Minnesota Press, 1994.
Massey, Doreen B.,John Allen, and Philip Sarre, eds. Human Geography Today. Polity Press, 1999.
McDowell, Linda, and Joanne P. Sharp, eds. A Feminist Glossary of Human Geography. London and New York: Arnold, 1999.
Meinig, D. W, ed. The Interpretation of Ordinary Landscapes. New York: Oxford University Press, 1979.
---. Cultural Geography: A Critical Introduction. Malden, MA: Blackwell, 2000.
Mitchell, Don. "Cultural Landscapes: The Dialectical LandscapeRecent Landscape Research in Human Geography." Progress in Human Geography 26 (2002): 381-90.
Monmonier, Mark. Bushmanders and Bullwinkles: How Politicians Manipulate Electronic Maps and Census Data to Win Elections. Chicago: University of Chicago Press, 2001.
Nostrand, Richard L., and Lawrence E. Estaville. Homelands: A Geography of Culture and Place Across America. Baltimore: The Johns Hopkins University Press, 2001.
Pitz!, Gerald R., Encyclopedia of Human Geography. Westport, CT: Greenwood Press, 2004.
Rice, Bradley R. "Searching for the Sunbelt." American Demographics 3 (1981): 22-23.
Sauer, Carl 0. "Morphology of Landscape." University of California Publications in Geography 2 (192 5): 19-54.
Shurmer-Smith, Pamela, ed. Doing Cultural Geography. Thousand Oaks, CA: Sage, 2002.
Sobel, Dava. Longitude: The True Story of a Lone Genius Who Solved the Greatest Scientific Problem of His Time. New York: Walker and Co., 1995.
Steinberg, Philip E., Andy Walter, and Kathleen Sherman-Morris. "Using the Internet to Integrate Thematic and Regional Approaches in Geographic Education." Professional Geographer 54 (2002): 332-48.
Taylor, Jonathan S. "Using the World Wide Web in Undergraduate Geographic Education: Potentials and Pitfalls." Journal of Geography 99 (2000): 11-22.
Tikunov, Vladimir S. "The Information Revolution in Geography." International Social Science Journal 48 (1996): 477-92.
---. "Cultural Geography: Glances Backward an~ Forward." Annals of the Association of American Geographers 94 (2004): 729-33.
Tuan, Yi-Fu. Topophilia: A Study of Environmental Perception, Attitudes, and Values. New York: Columbia University Press, 1990.
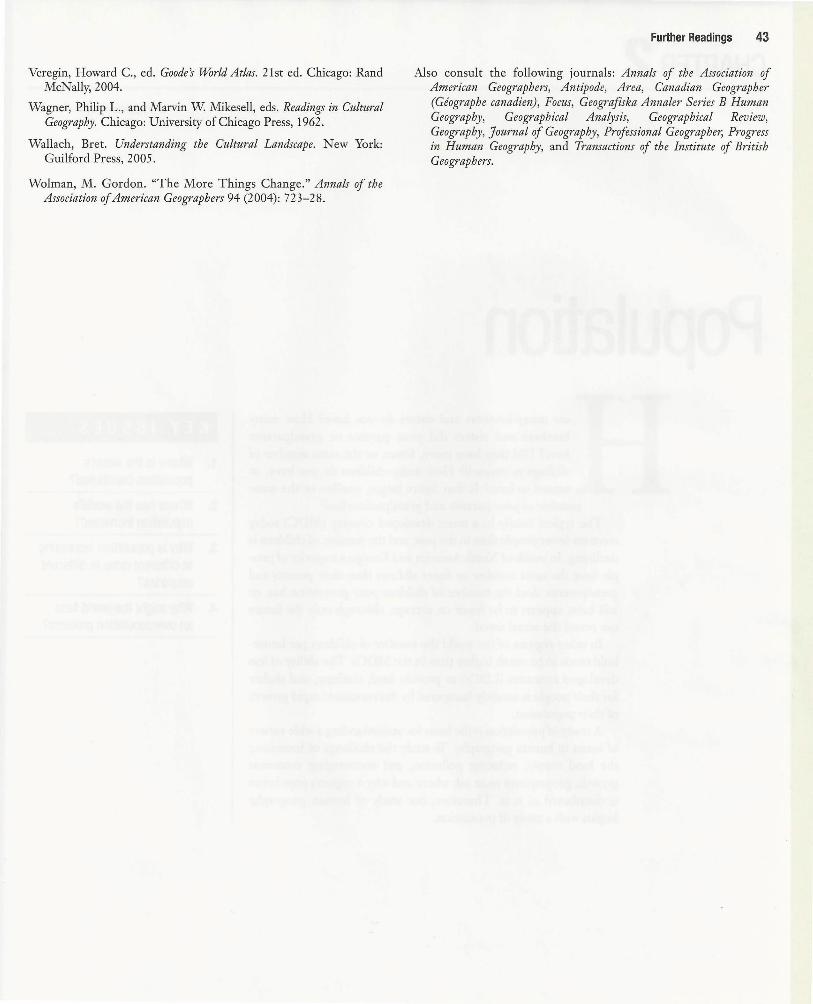
Veregin, Howard C., ed. Goode's World Atlas. 21st ed. Chicago: Rand McNally, 2004.
Wagner, Philip L., and Marvin W Mikesell, eds. Readings in Cultural Geography. Chicago: University of Chicago Press, 1962.
Wallach, Bret. Understanding the Cultural Landscape. New York: Guilford Press, 2005.
Wolman, M. Gordon. "The More Things Change." Annals of the Association of American Geographers 94 (2004): 723-28.
Further Readings 43
Also consult the following journals: Annals of the Association of American Geographers, Antipode, Area, Canadian Geographer (Geographe canadien), Focus, Geografiska Anna/er Series B Human Geography, Geographical Analysis, Geographical Review, Geography, Journal of Geography, Professional Geographer, Progress in Human Geography, and Transactions of the Institute of British Geographers.