Embed Size (px)
Citation preview
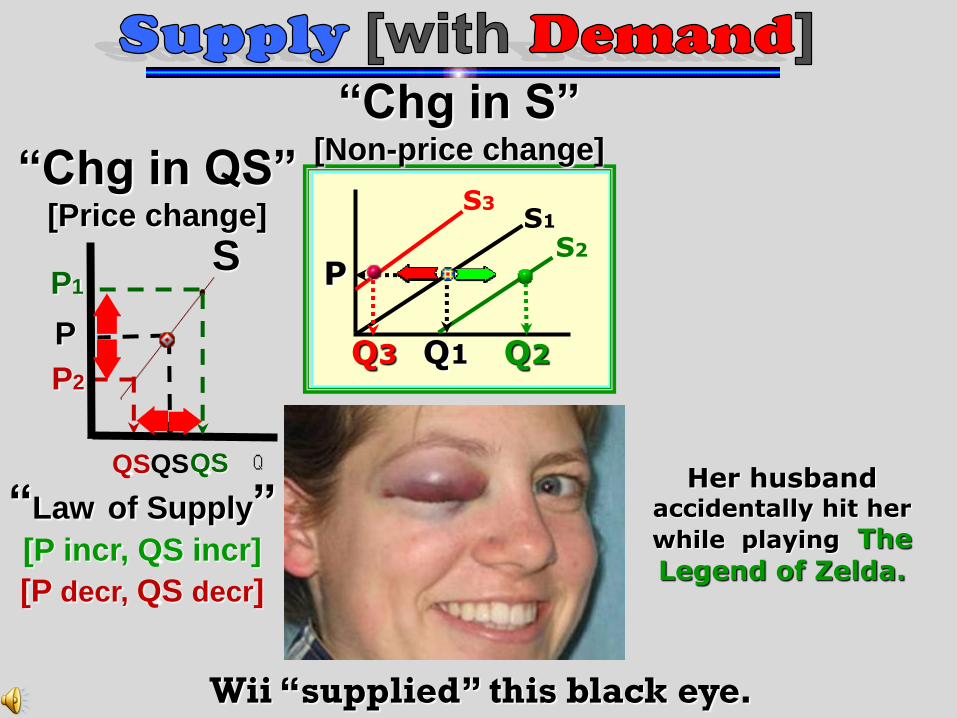
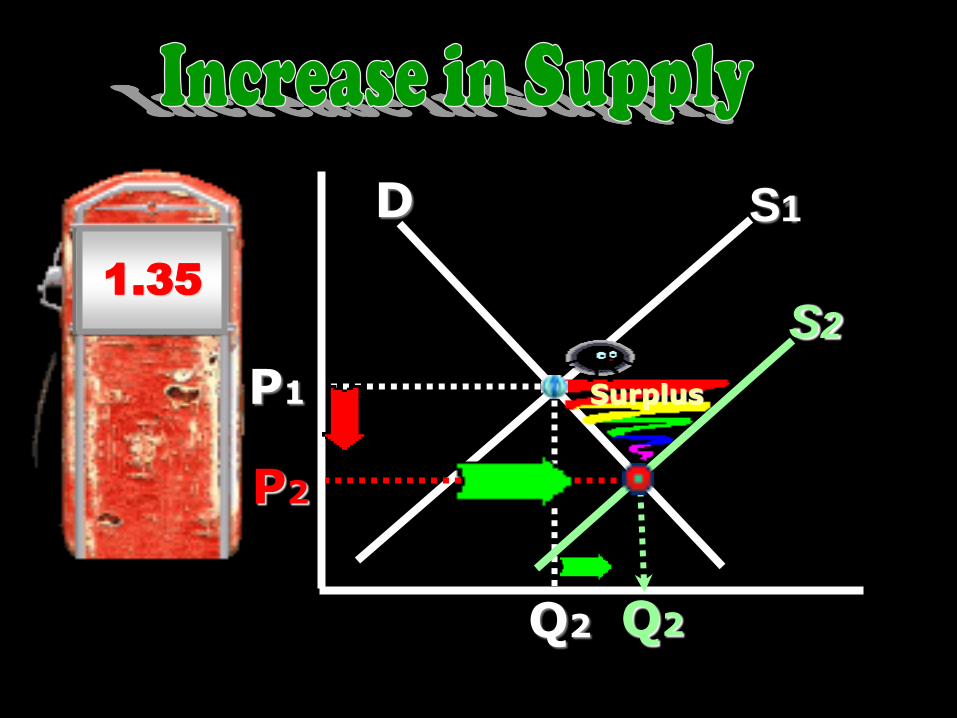
P
Q1
S1 S3
S2
Q2 Q3
Her husband accidentally hit her
while playing The Legend of Zelda.
Wii “supplied” this black eye.
P1
QS
S
P2
“Chg in QS” [Price change]
QS
“Law of Supply” [P incr, QS incr]
P
[P decr, QS decr]
QS
“Chg in S” [Non-price change]
D S1 S2
S3
P1
Q1 Q2
P2
Q3
P3
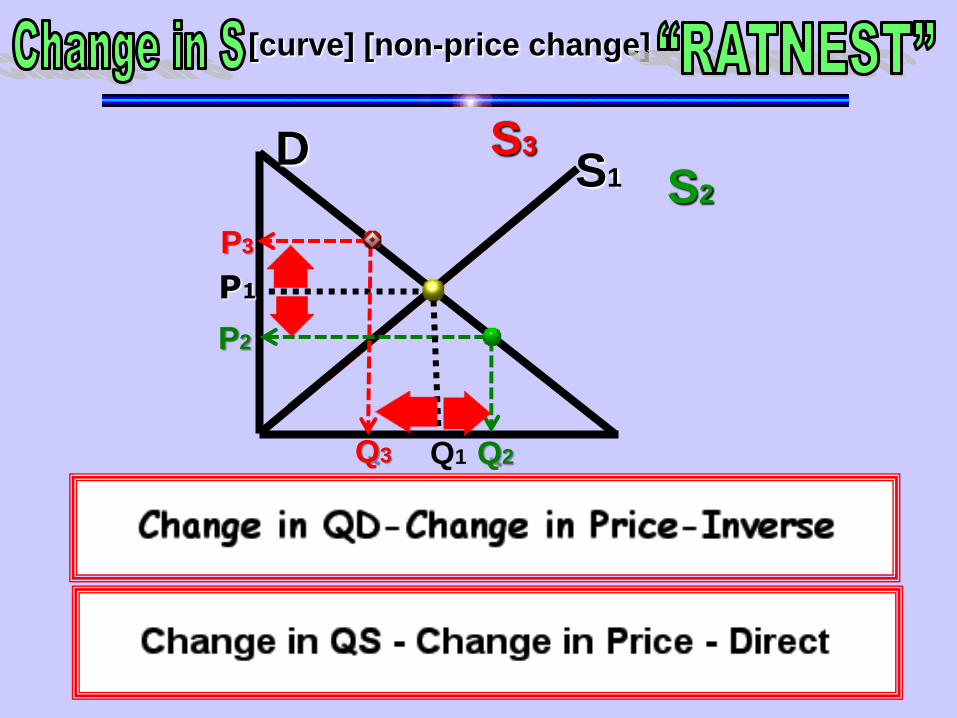
[curve] [non-price change]
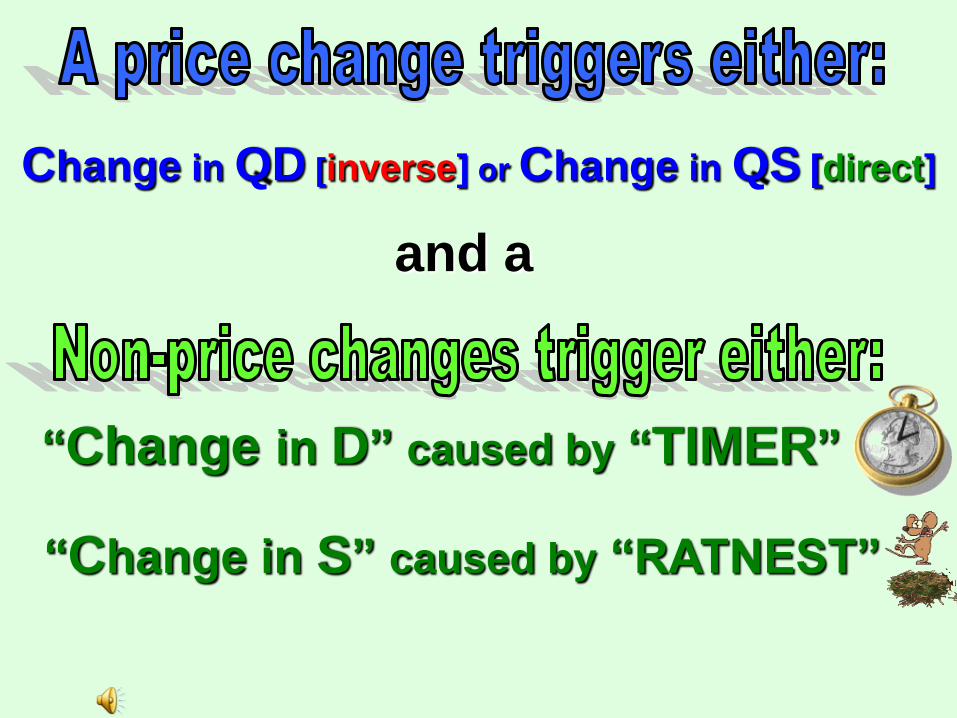
“Change in D” caused by “TIMER”
Change in QD [inverse] or Change in QS [direct]
and a
“Change in S” caused by “RATNEST”
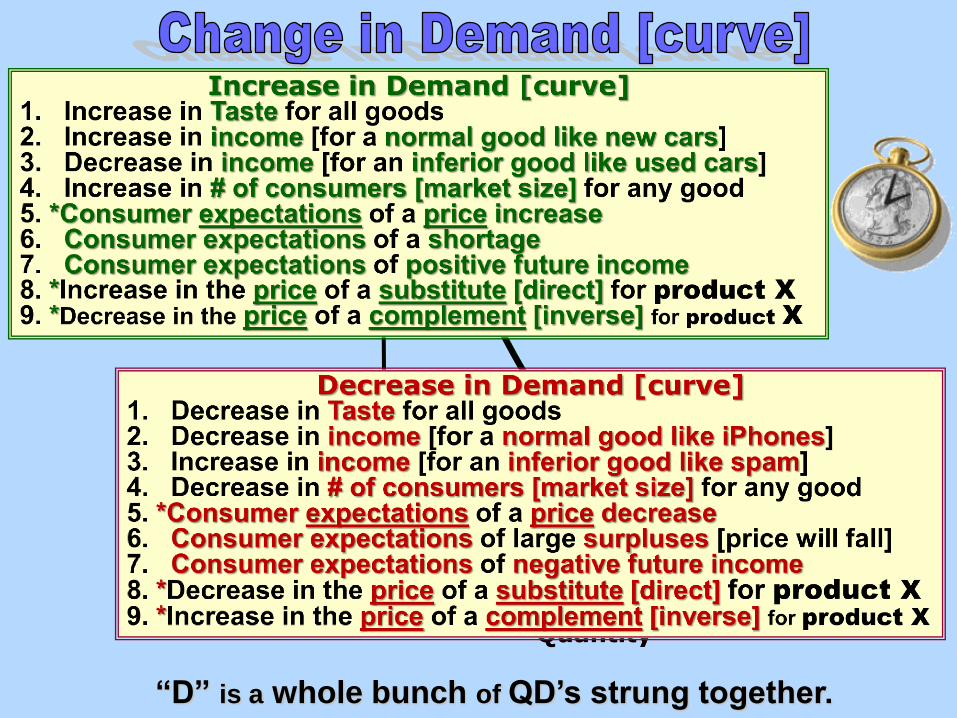
“Decrease in D”
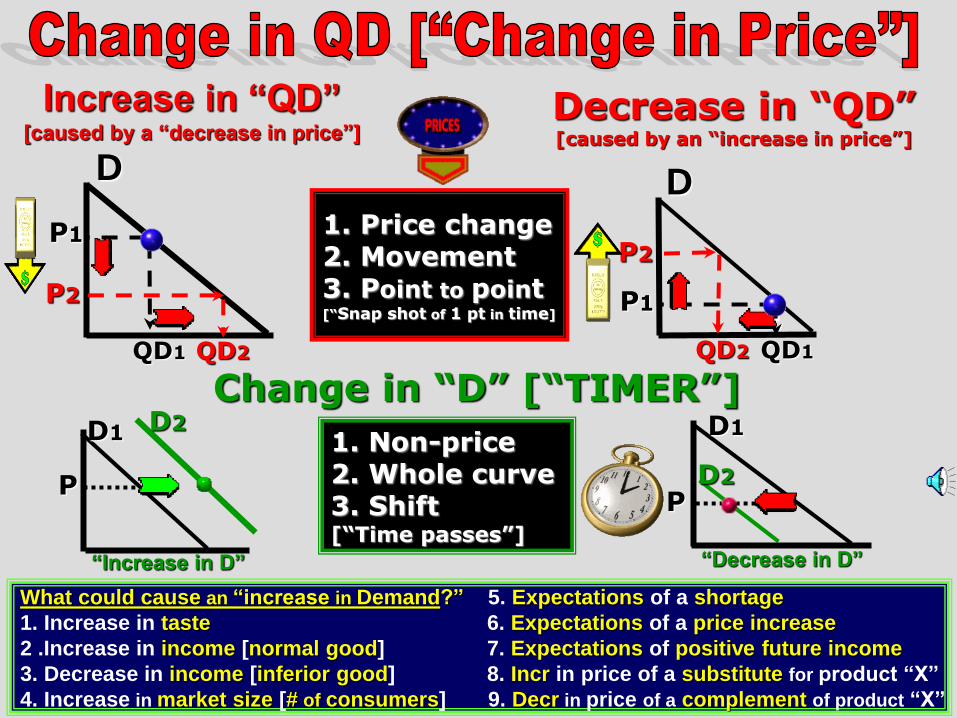
Increase in “QD” [caused by a “decrease in price”]
Decrease in “QD” [caused by an “increase in price”]
1. Price change 2. Movement 3. Point to point [“Snap shot of 1 pt in time]
Change in “D” [“TIMER”]
1. Non-price 2. Whole curve 3. Shift [“Time passes”]
What could cause an “increase in Demand?” 5. Expectations of a shortage
1. Increase in taste 6. Expectations of a price increase
2 .Increase in income [normal good] 7. Expectations of positive future income
3. Decrease in income [inferior good] 8. Incr in price of a substitute for product “X”
4. Increase in market size [# of consumers] 9. Decr in price of a complement of product “X”
P1
P2
QD1
P1
P2
QD1
D D
D1 D2 D1
D2
P P
“Increase in D”
QD2 QD2
“Increase in S”
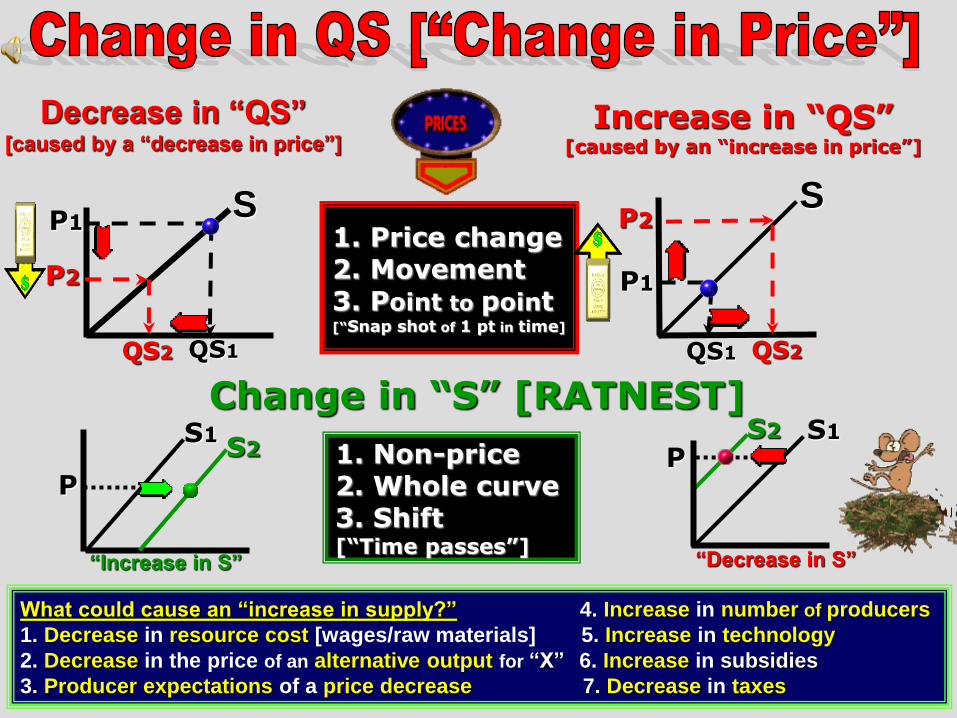
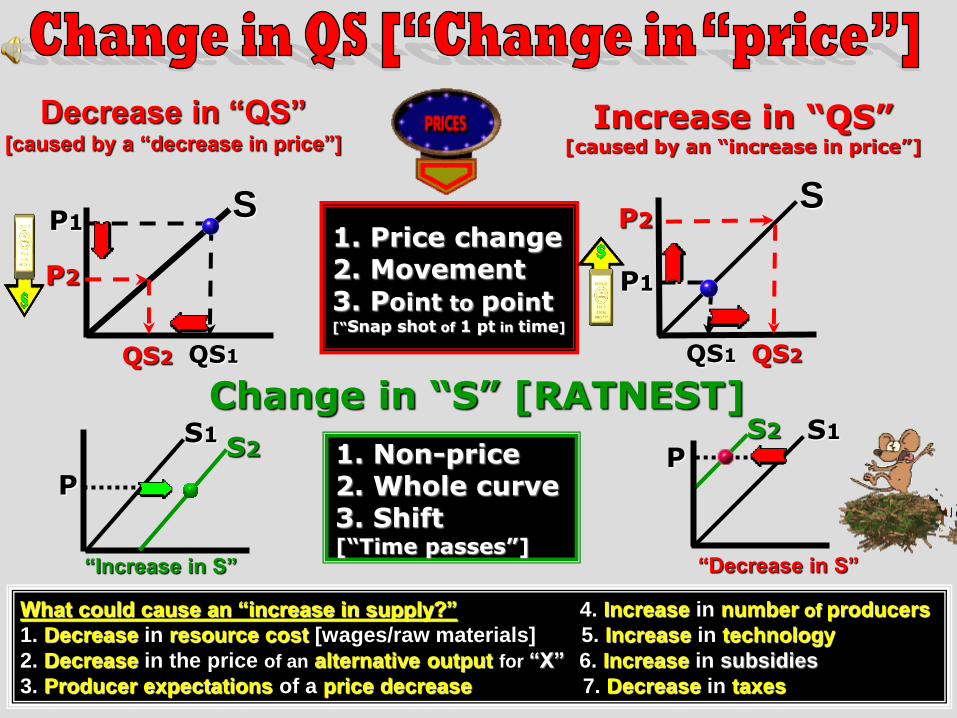
Decrease in “QS” [caused by a “decrease in price”]
Increase in “QS” [caused by an “increase in price”]
1. Price change 2. Movement 3. Point to point [“Snap shot of 1 pt in time]
Change in “S” [RATNEST]
1. Non-price 2. Whole curve 3. Shift [“Time passes”]
What could cause an “increase in supply?” 4. Increase in number of producers
1. Decrease in resource cost [wages/raw materials] 5. Increase in technology
2. Decrease in the price of an alternative output for “X” 6. Increase in subsidies
3. Producer expectations of a price decrease 7. Decrease in taxes
P1
P2
QS1
P1
P2
QS1
S S
S1 S2
S1 S2
P P
“Decrease in S”
QS2 QS2
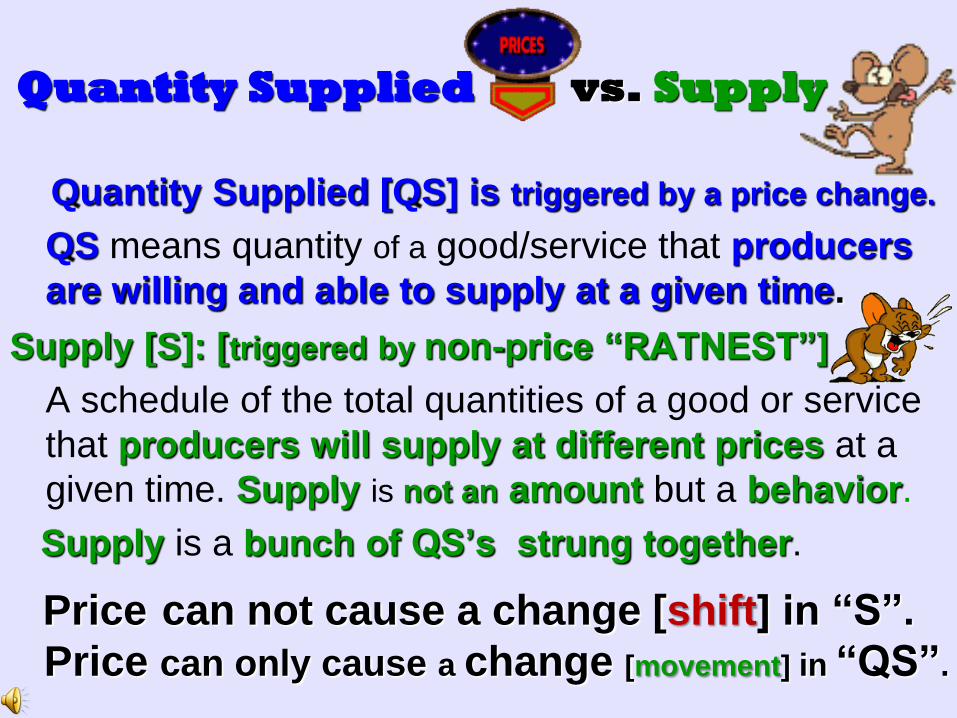
Quantity Supplied vs. Supply
Quantity Supplied [QS] is triggered by a price change.
QS means quantity of a good/service that producers
are willing and able to supply at a given time.
Price can not cause a change [shift] in “S”.
Price can only cause a change [movement] in “QS”.
Supply [S]: [triggered by non-price “RATNEST”]
A schedule of the total quantities of a good or service
that producers will supply at different prices at a
given time. Supply is not an amount but a behavior.
Supply is a bunch of QS’s strung together.
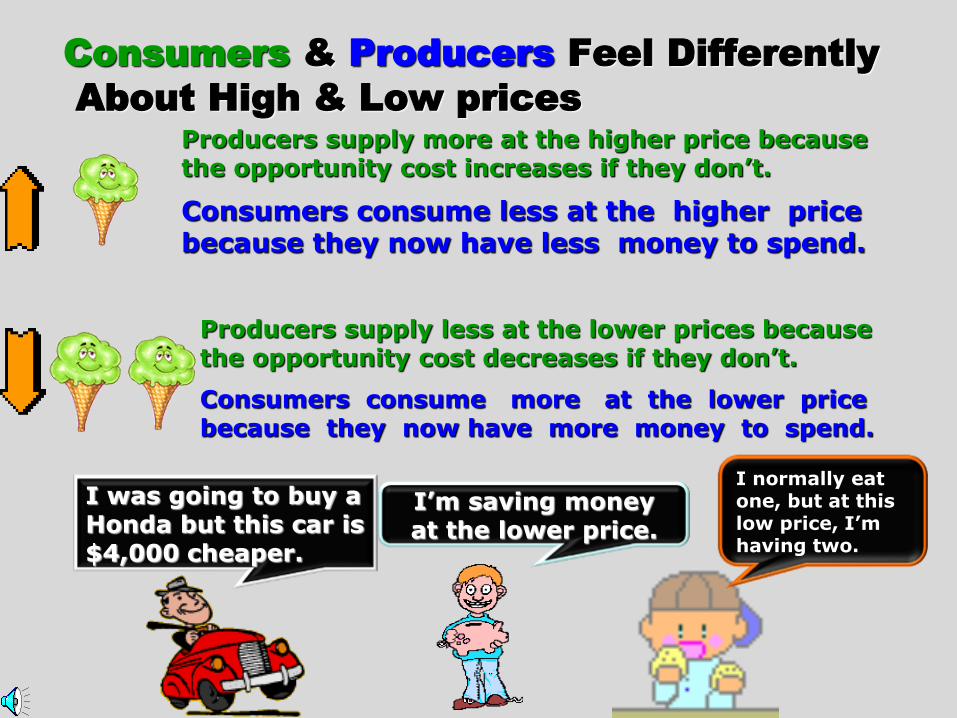
Consumers & Producers Feel Differently
About High & Low prices
Producers supply more at the higher price because the opportunity cost increases if they don’t.
Consumers consume less at the higher price because they now have less money to spend.
Producers supply less at the lower prices because the opportunity cost decreases if they don’t.
Consumers consume more at the lower price because they now have more money to spend.
I was going to buy a Honda but this car is $4,000 cheaper.
I’m saving money at the lower price.
I normally eat one, but at this low price, I’m having two.
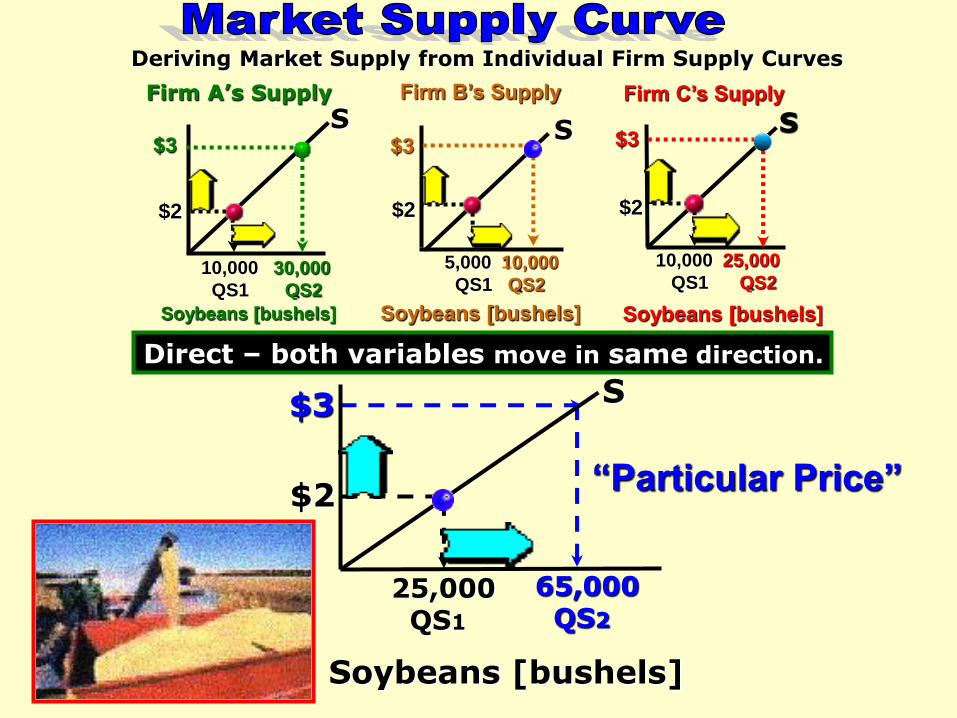
10,000 30,000
QS1 QS2
5,000 10,000
QS1 QS2
65,000 QS2
25,000 QS1
S $3
$2
Soybeans [bushels]
“Particular Price”
Firm A’s Supply Firm B’s Supply Firm C’s Supply
Soybeans [bushels] Soybeans [bushels] Soybeans [bushels]
$3
$2
$3
$2
$3
$2
10,000 25,000
QS1 QS2
S S
Direct – both variables move in same direction.
S
Deriving Market Supply from Individual Firm Supply Curves
.
QS2
Direct
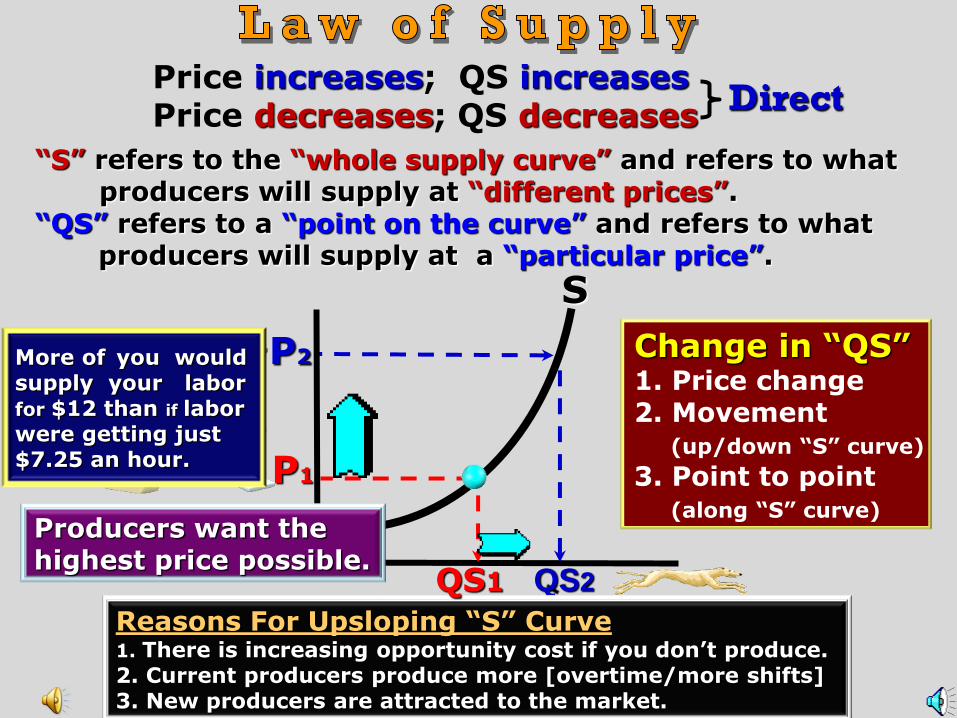
Reasons For Upsloping “S” Curve 1. There is increasing opportunity cost if you don’t produce. 2. Current producers produce more [overtime/more shifts] 3. New producers are attracted to the market.
“S” refers to the “whole supply curve” and refers to what producers will supply at “different prices”. “QS” refers to a “point on the curve” and refers to what
producers will supply at a “particular price”.
Change in “QS” 1. Price change 2. Movement (up/down “S” curve)
3. Point to point (along “S” curve)
S
QS1
P2
P1
Price increases; QS increases Price decreases; QS decreases
Producers want the highest price possible.
More of you would supply your labor for $12 than if labor were getting just $7.25 an hour.
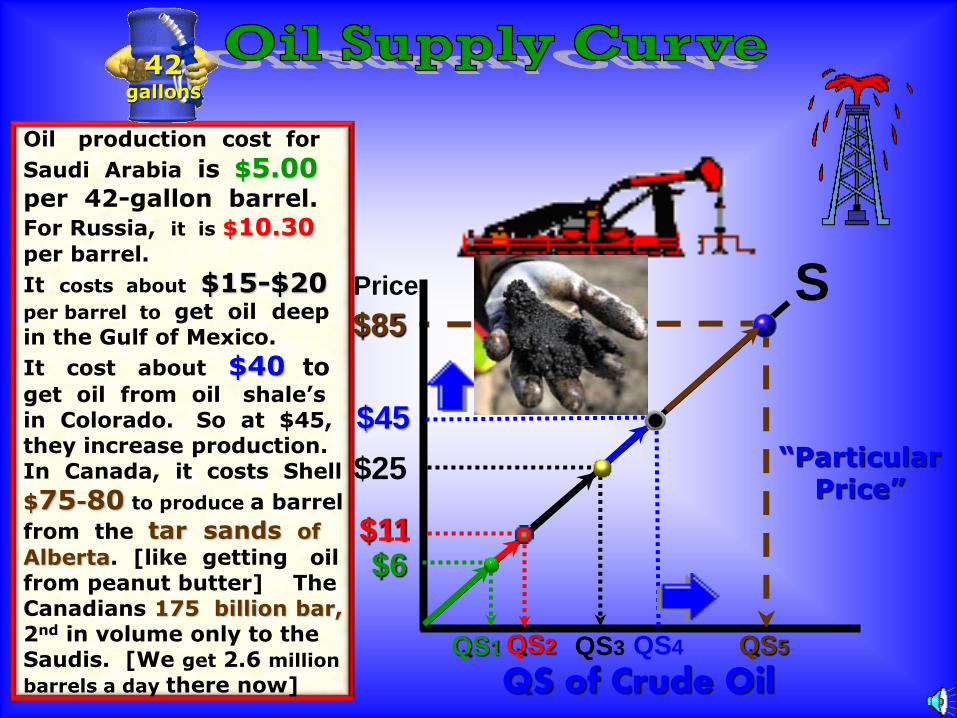
QS of Crude Oil
QS1
S
“Particular Price”
$85
$11
Oil production cost for
Saudi Arabia is $5.00 per 42-gallon barrel. For Russia, it is $10.30
per barrel.
It costs about $15-$20 per barrel to get oil deep in the Gulf of Mexico.
It cost about $40 to
get oil from oil shale’s in Colorado. So at $45, they increase production. In Canada, it costs Shell
$75-80 to produce a barrel
from the tar sands of
Alberta. [like getting oil from peanut butter] The Canadians 175 billion bar, 2nd in volume only to the Saudis. [We get 2.6 million
barrels a day there now]
$6
$25
$45
QS2 QS3 QS4 QS5
Price
42 gallons
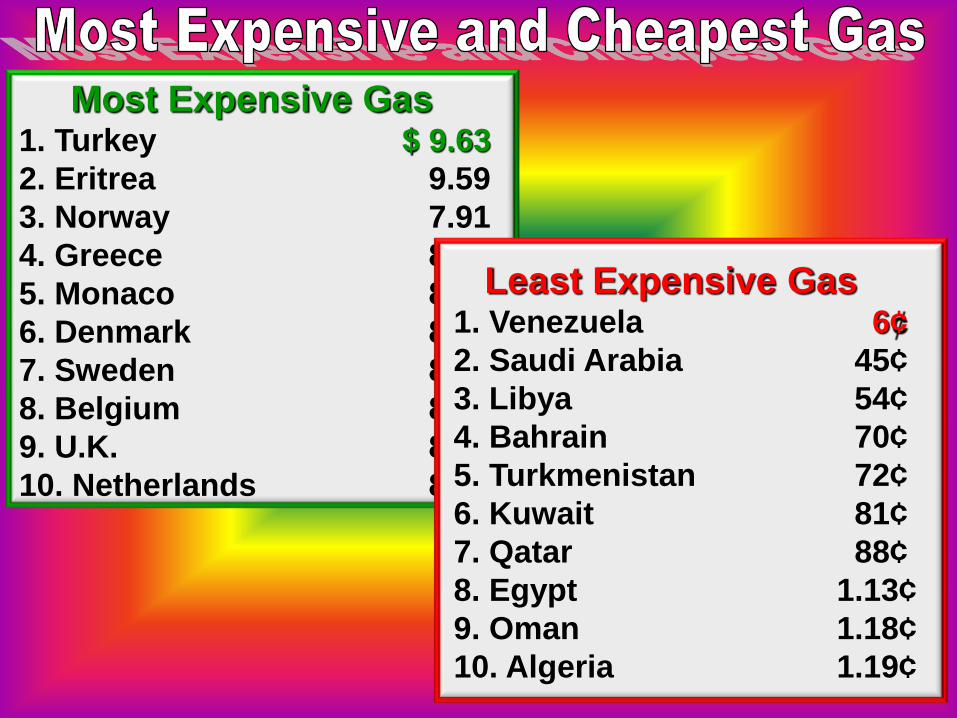
Most Expensive Gas 1. Turkey $ 9.63
2. Eritrea 9.59
3. Norway 7.91
4. Greece 8.50
5. Monaco 8.45
6. Denmark 8.42
7. Sweden 8.18
8. Belgium 8.17
9. U.K. 8.17
10. Netherlands 8.01
Least Expensive Gas 1. Venezuela 6¢
2. Saudi Arabia 45¢
3. Libya 54¢
4. Bahrain 70¢
5. Turkmenistan 72¢
6. Kuwait 81¢
7. Qatar 88¢
8. Egypt 1.13¢
9. Oman 1.18¢
10. Algeria 1.19¢
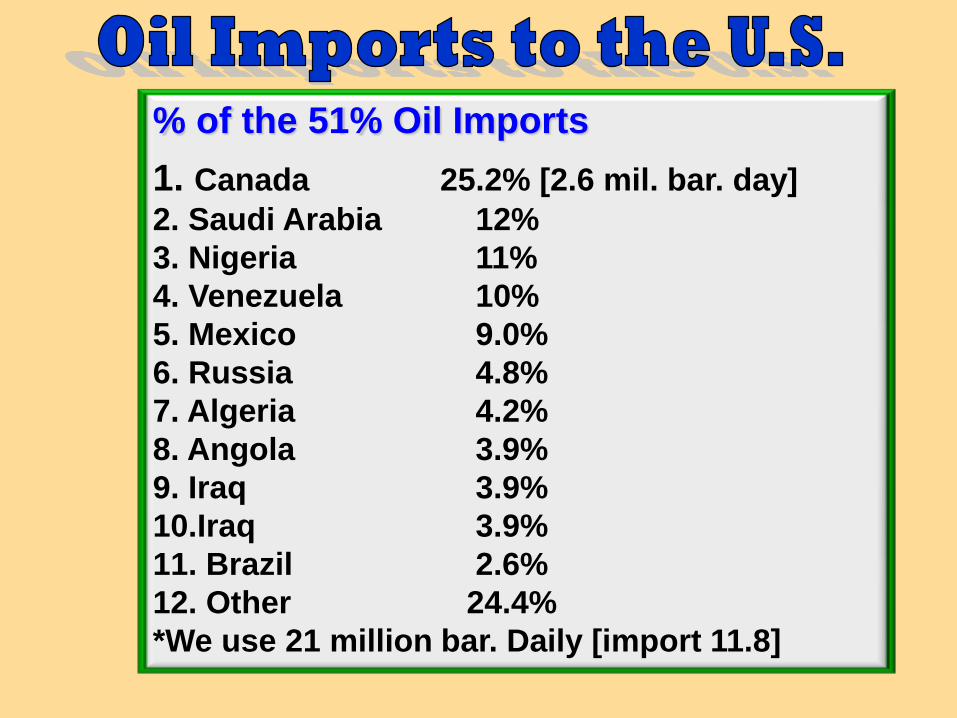
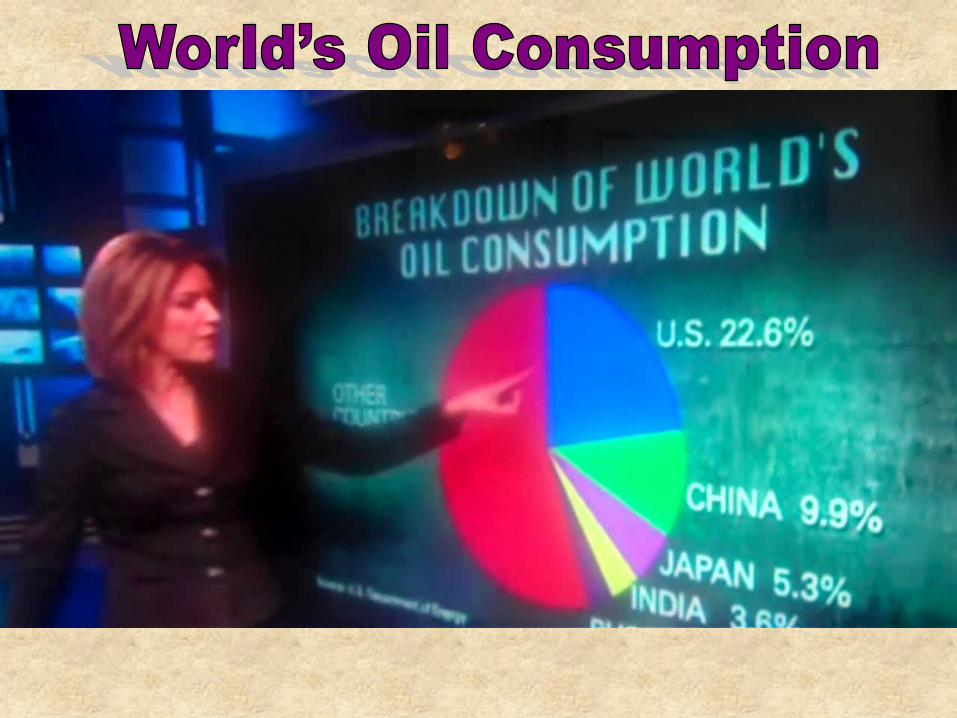
% of the 51% Oil Imports
1. Canada 25.2% [2.6 mil. bar. day]
2. Saudi Arabia 12%
3. Nigeria 11%
4. Venezuela 10%
5. Mexico 9.0%
6. Russia 4.8%
7. Algeria 4.2%
8. Angola 3.9%
9. Iraq 3.9%
10.Iraq 3.9%
11. Brazil 2.6%
12. Other 24.4%
*We use 21 million bar. Daily [import 11.8]
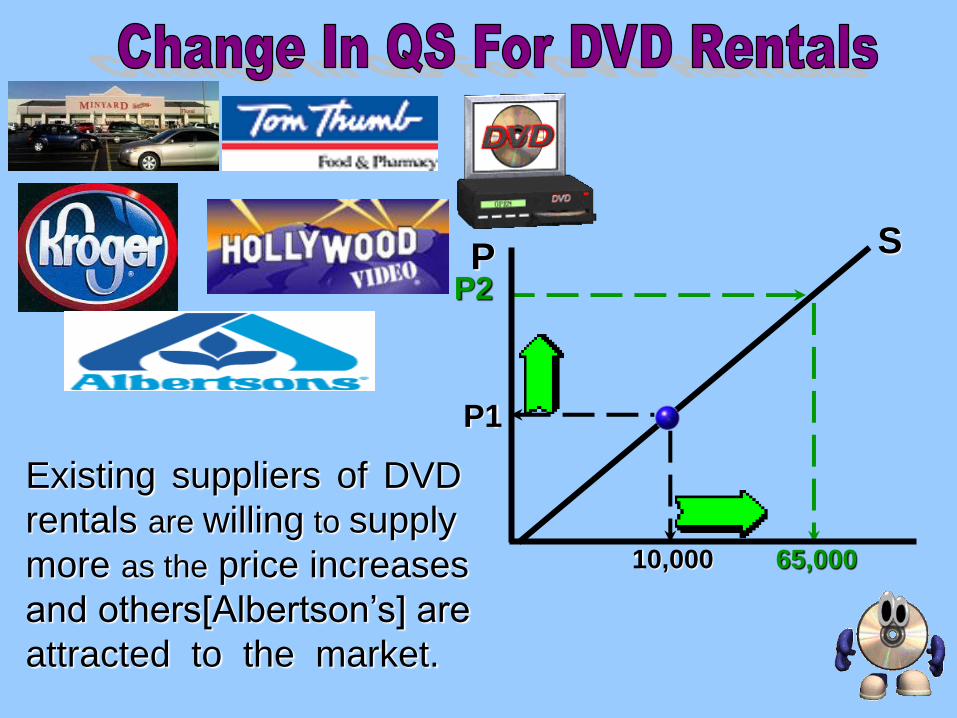
10,000 65,000
P2
Existing suppliers of DVD
rentals are willing to supply
more as the price increases
and others[Albertson’s] are
attracted to the market.
P1
S P
$100
$90
$80
$70
$60
$50
$40
$30
$20
$10
0
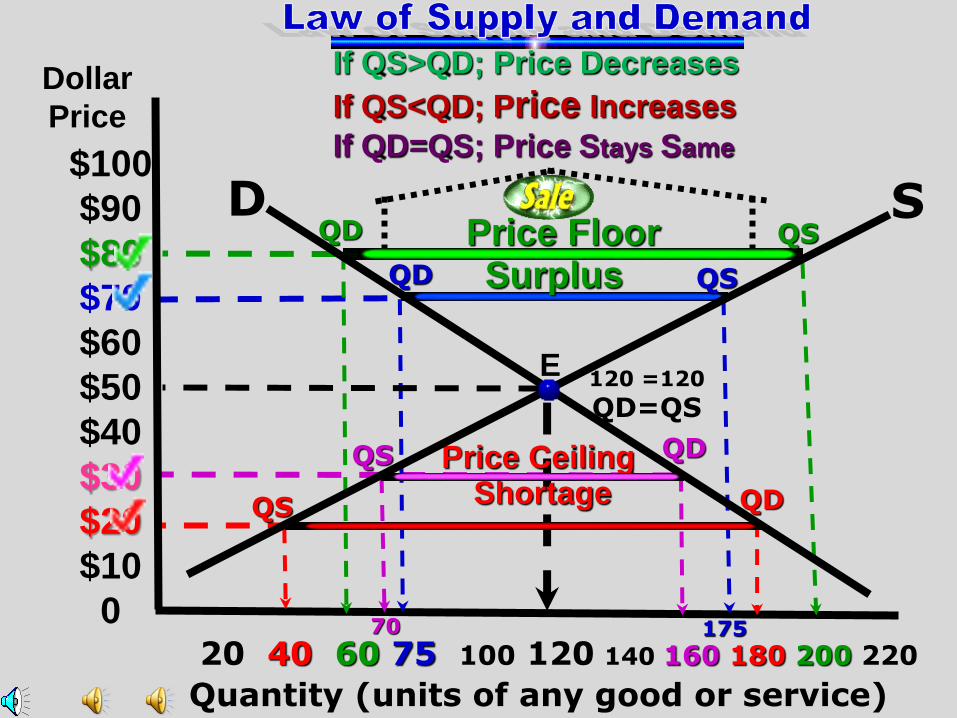
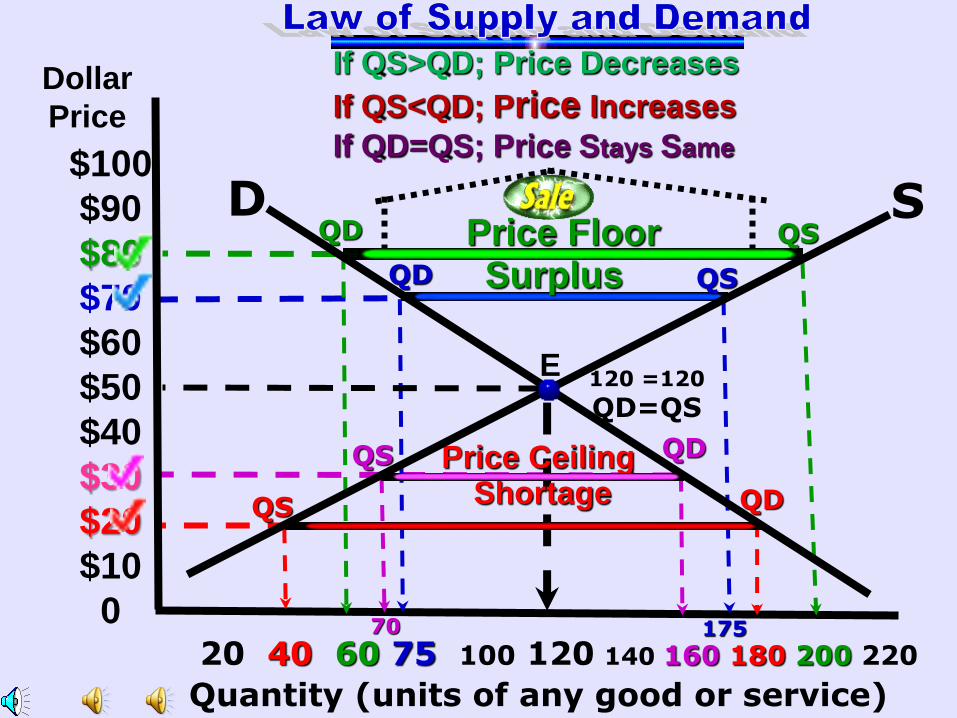
20 40 60 75 100 120 140 160 180 200 220
Quantity (units of any good or service)
70 175
120 =120
QD=QS
E
QD QS
QD QS
QS QD
QS QD
D S Price Floor Surplus
Price Ceiling Shortage
Dollar
Price
If QS>QD; Price Decreases
If QS<QD; Price Increases
If QD=QS; Price Stays Same
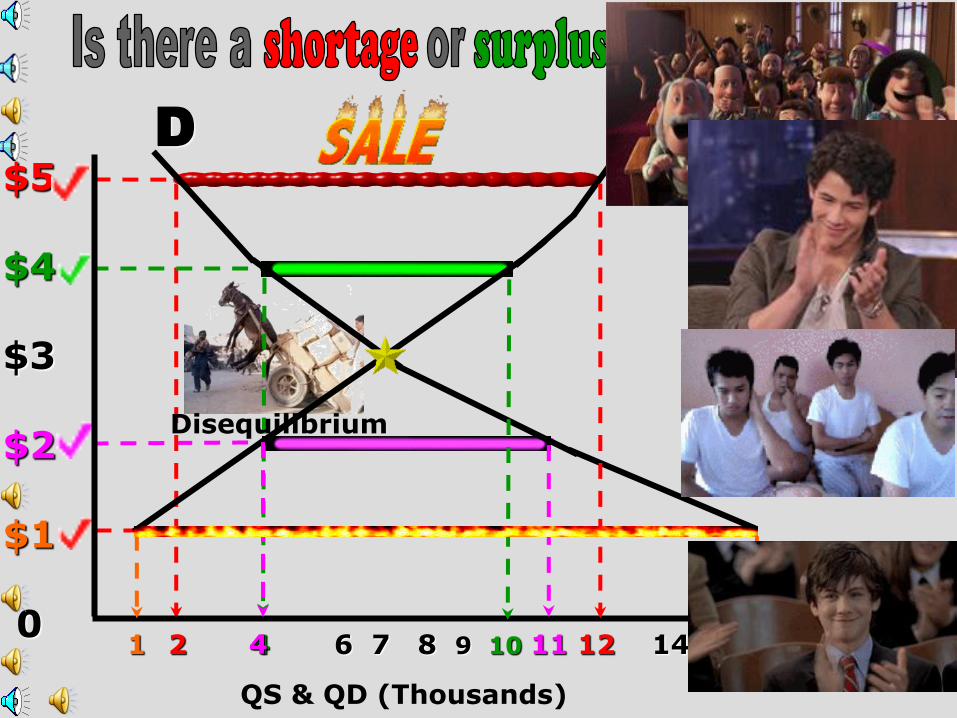
1 2 4 6 7 8 9 10 11 12 14 16
$5
$4
$3
$2
$1
0 4
QS & QD (Thousands)
D S
Disequilibrium
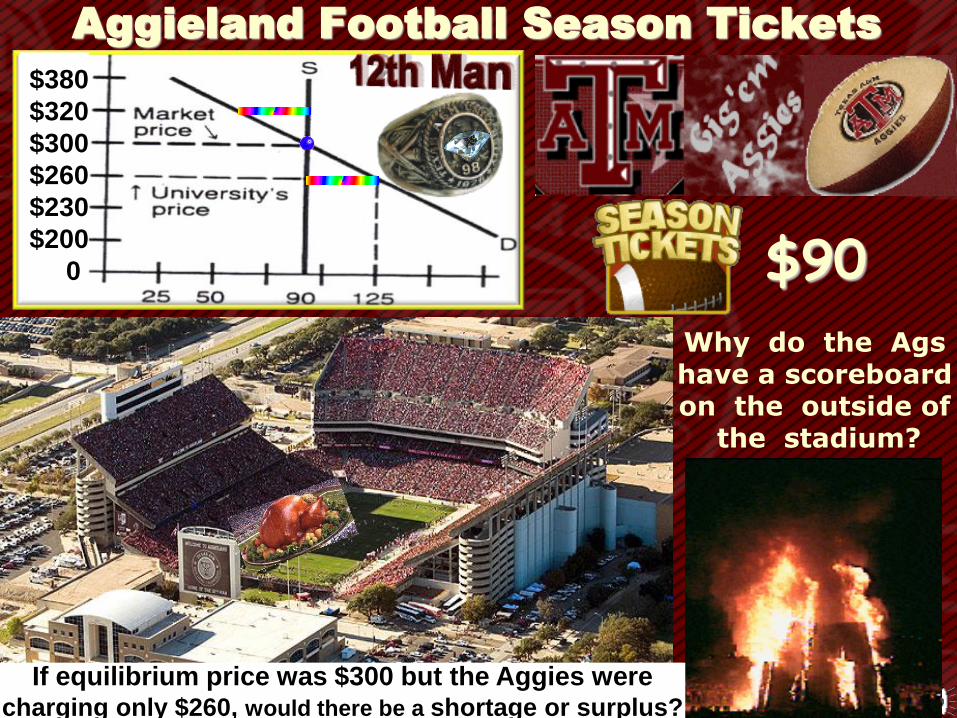
$90
Why do the Ags have a scoreboard on the outside of
the stadium?
Aggieland Football Season Tickets
If equilibrium price was $300 but the Aggies were charging only $260, would there be a shortage or surplus?
$380
$320
$300
$260
$230
$200
0

The Aggies have a scoreboard outside so that the 5 Reveilles who are buried outside the stadium can see the scoreboard.
The 5 mascots are ranked as 5-Star generals and are buried facing the scoreboard.
The Plaque says this: “Reveille 1st, and the other Reveilles that follow her, will always have a special place in an Aggie’s heart and
symbolize the undying spirit of Texas A&M.”
I will be the Aggie
mascot one day.
24 4 17


The Aggie War Hymn Hullabaloo, Caneck, Caneck
Hullabaloo, Caneck, Caneck
Good bye to texas university
So long to the orange and the white
Good luck to dear old Texas Aggies They are the boys who show the real old fight
‘the eyes of Texas are upon you’
That is the song they sing so well
Sounds Like hell
So good bye to texas university
We’re gonna beat you all to
Chigaroogarem
Chigaroogarem Rough, Tough, Real stuff, Texas A&M
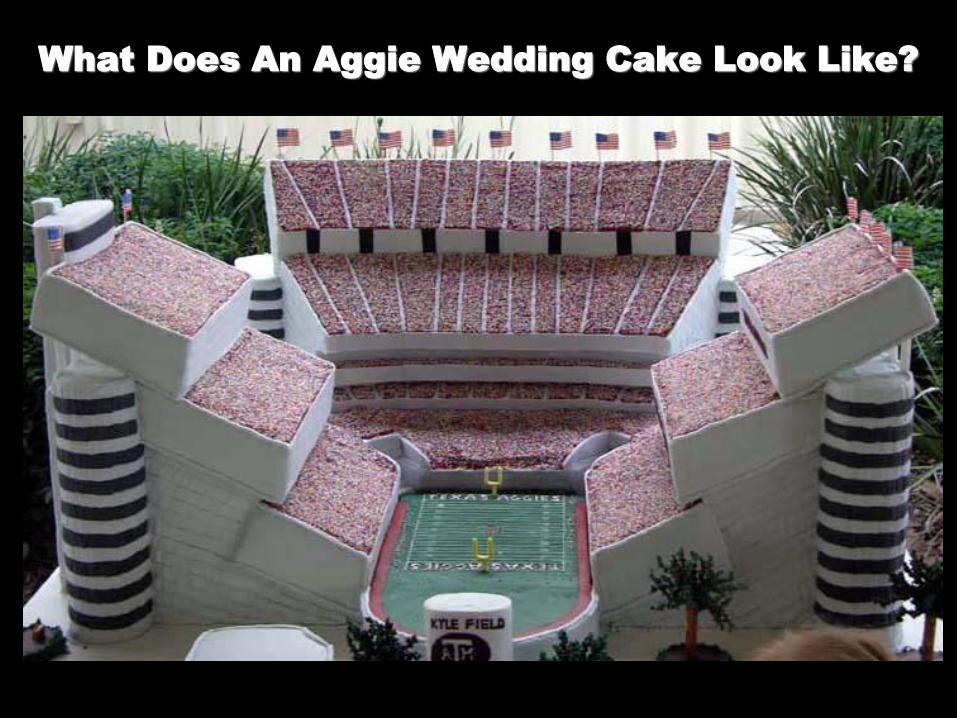
What Does An Aggie Wedding Cake Look Like?

For
California
Teachers
[and students]

Southern California at
LA Memorial Coliseum
National Champs 2003-2004
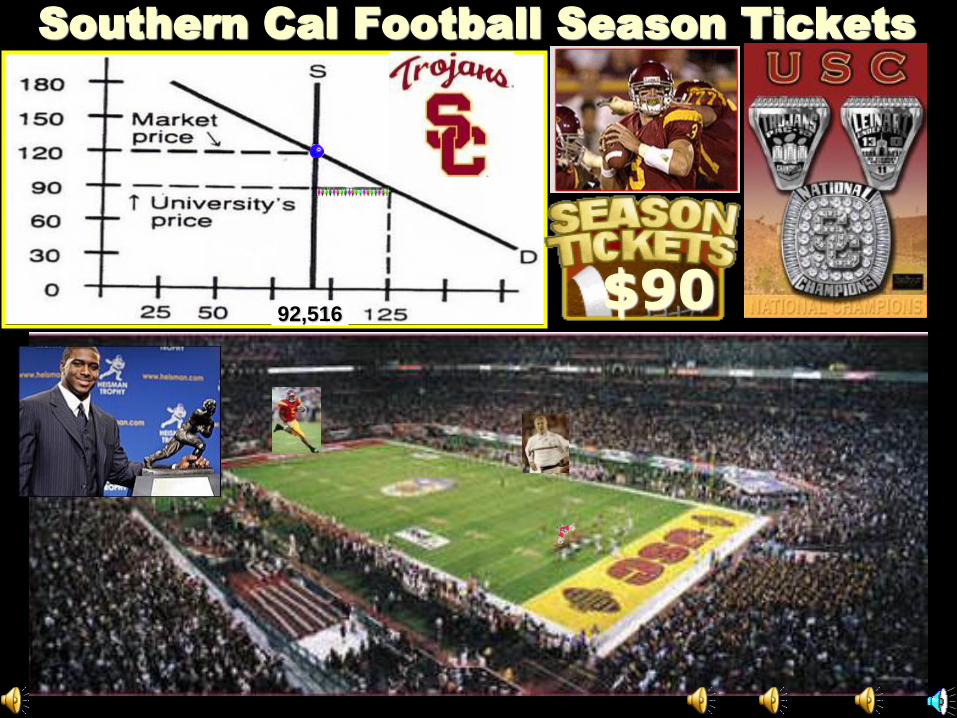
92,516
Southern Cal Football Season Tickets
$90
“Bread & Butter” of Economics
[“perfectly competitive markets”]
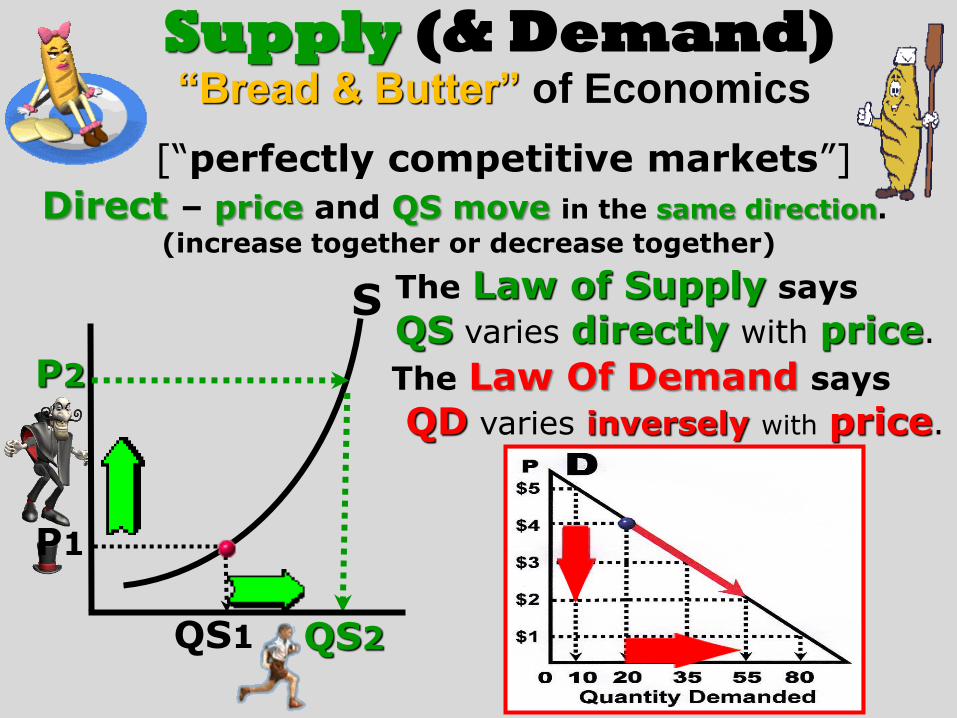
The Law of Supply says
QS varies directly with price.
P2
QS1
S
Direct – price and QS move in the same direction.
(increase together or decrease together)
P1
Supply (& Demand)
The Law Of Demand says
QD varies inversely with price.
QS2
The law of supply and demand is learned in
infancy. Infants demand clean diapers and are willing to supply peace and quiet in exchange. Mothers demand peace and quiet and are willing to supply clean diapers in exchange. The terms of trade are arranged. “One scream equals one diaper. The price of one diaper is one scream.”
Supply – producers “willingness to sell.” Or, the
amount of products suppliers are “willing & able to sell” at each price during a specific time period.”
I want a
clean diaper
All of you learned supply & demand as babies.
Your mom wanted
peace and quiet.
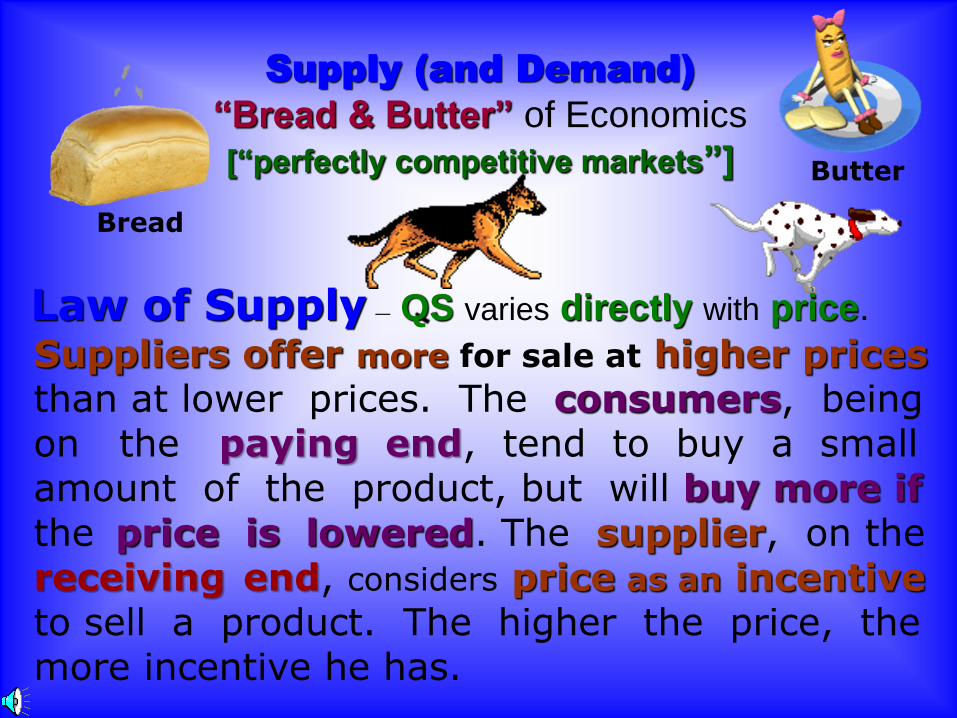
Supply (and Demand) “Bread & Butter” of Economics
[“perfectly competitive markets”]
Suppliers offer more for sale at higher prices than at lower prices. The consumers, being on the paying end, tend to buy a small amount of the product, but will buy more if the price is lowered. The supplier, on the receiving end, considers price as an incentive to sell a product. The higher the price, the more incentive he has.
Bread
Butter
Law of Supply – QS varies directly with price.
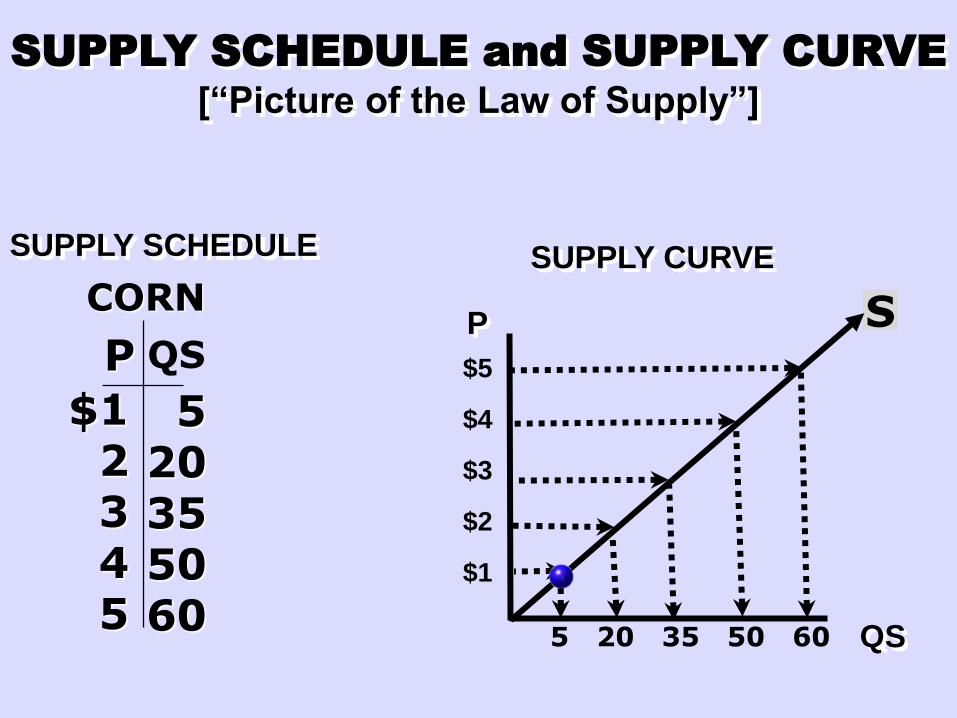
SUPPLY SCHEDULE
$1 2 3 4 5
P QS
CORN
5 20 35 50 60
S
5 20 35 50 60
SUPPLY CURVE
$5
$4
$3
$2
$1
SUPPLY SCHEDULE and SUPPLY CURVE
[“Picture of the Law of Supply”]
P
QS
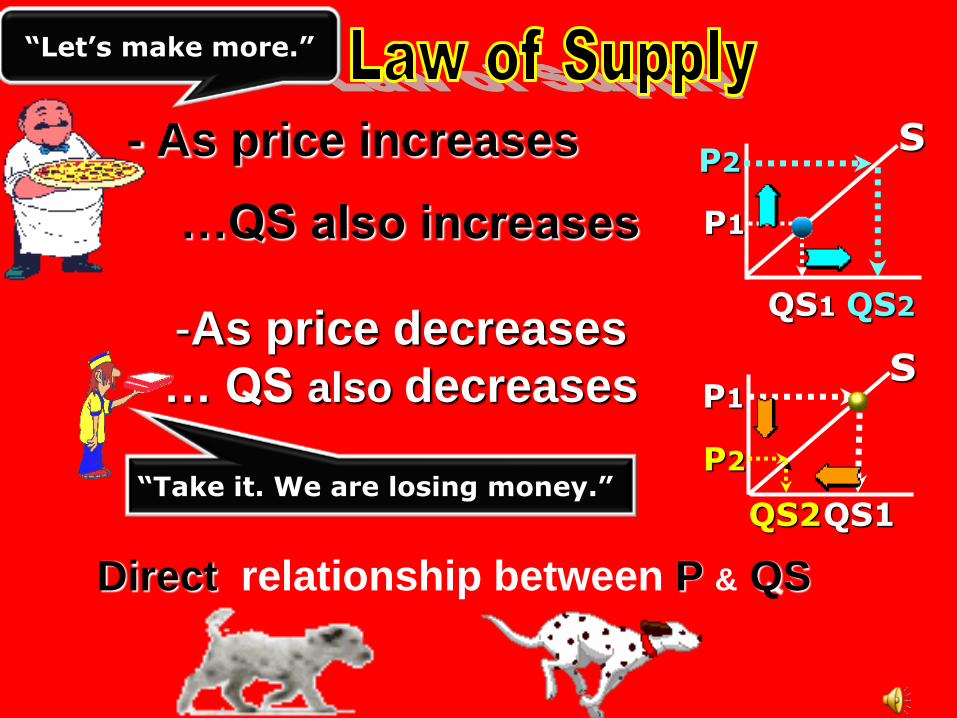
- As price increases
…QS also increases
Direct relationship between P & QS
P2
P1
QS1
S
P1
P2
S
“Take it. We are losing money.” QS1
-As price decreases
… QS also decreases
“Let’s make more.”
QS2
QS2
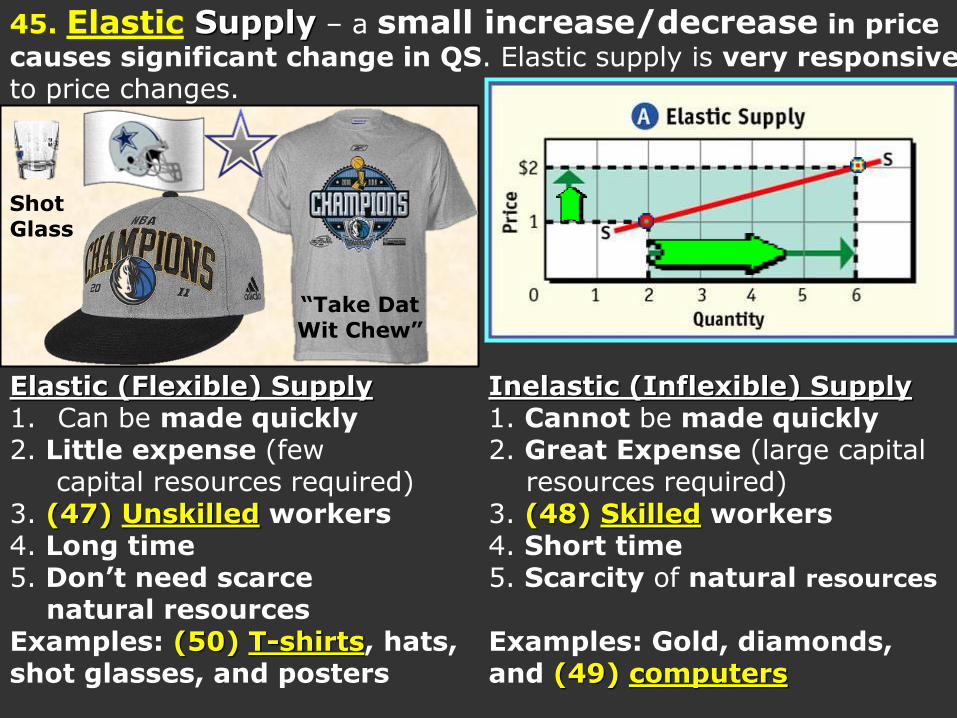
45. Elastic Supply – a small increase/decrease in price
causes significant change in QS. Elastic supply is very responsive to price changes.
Elastic (Flexible) Supply Inelastic (Inflexible) Supply 1. Can be made quickly 1. Cannot be made quickly 2. Little expense (few 2. Great Expense (large capital capital resources required) resources required) 3. (47) Unskilled workers 3. (48) Skilled workers 4. Long time 4. Short time 5. Don’t need scarce 5. Scarcity of natural resources
natural resources Examples: (50) T-shirts, hats, Examples: Gold, diamonds, shot glasses, and posters and (49) computers
Shot Glass
“Take Dat Wit Chew”
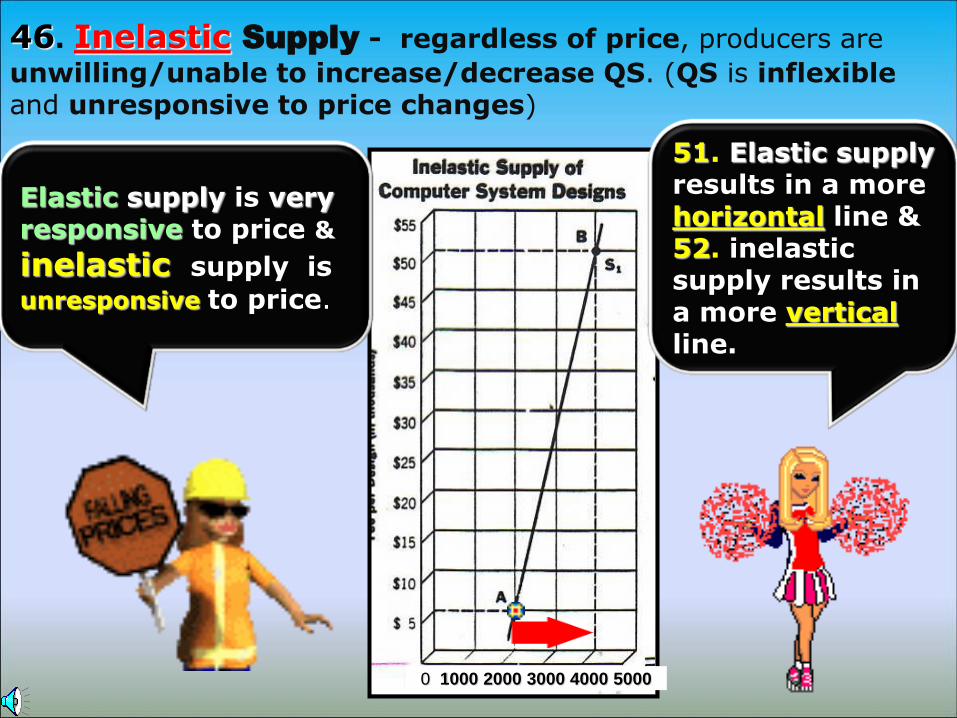
46. Inelastic Supply - regardless of price, producers are
unwilling/unable to increase/decrease QS. (QS is inflexible and unresponsive to price changes)
51. Elastic supply results in a more horizontal line & 52. inelastic supply results in a more vertical line.
0 1000 2000 3000 4000 5000
Elastic supply is very responsive to price &
inelastic supply is
unresponsive to price.
Quantity Supplied
Quantity Supplied
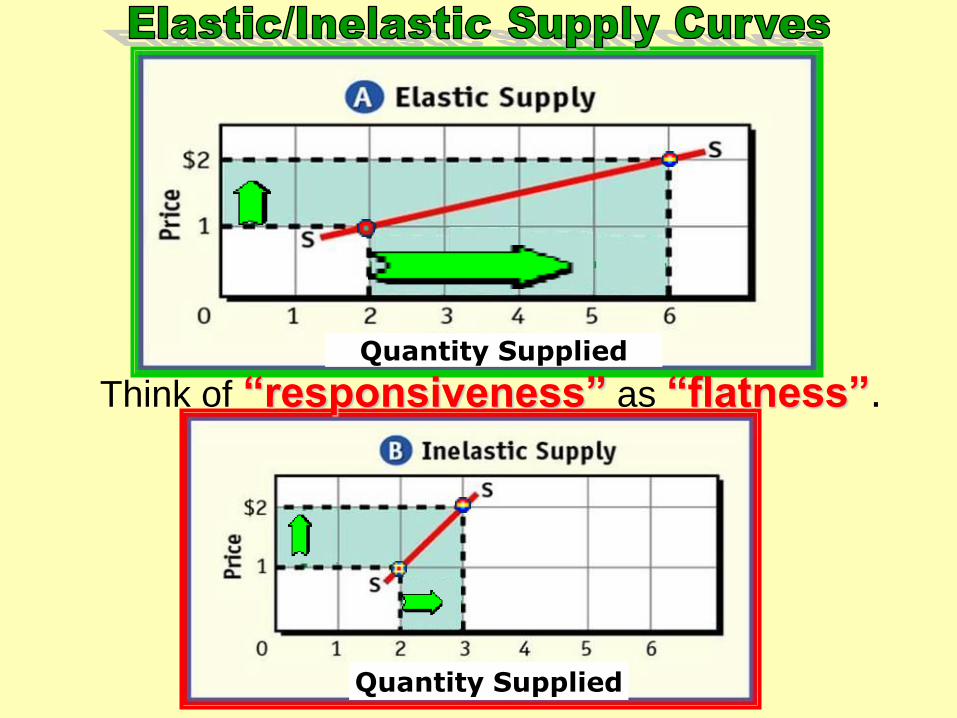
Think of “responsiveness” as “flatness”.
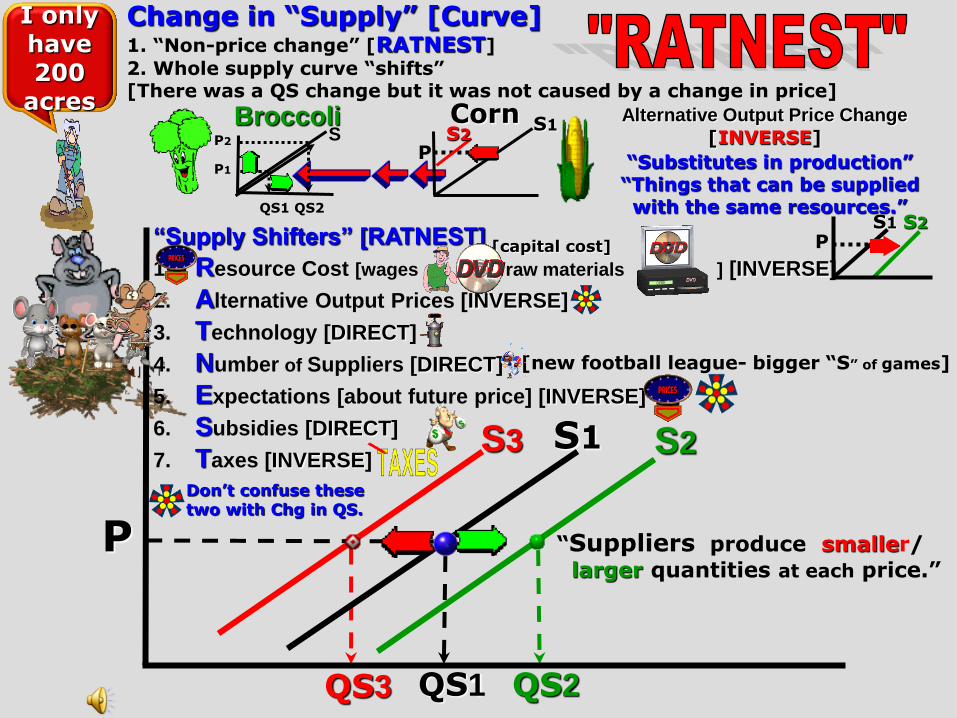
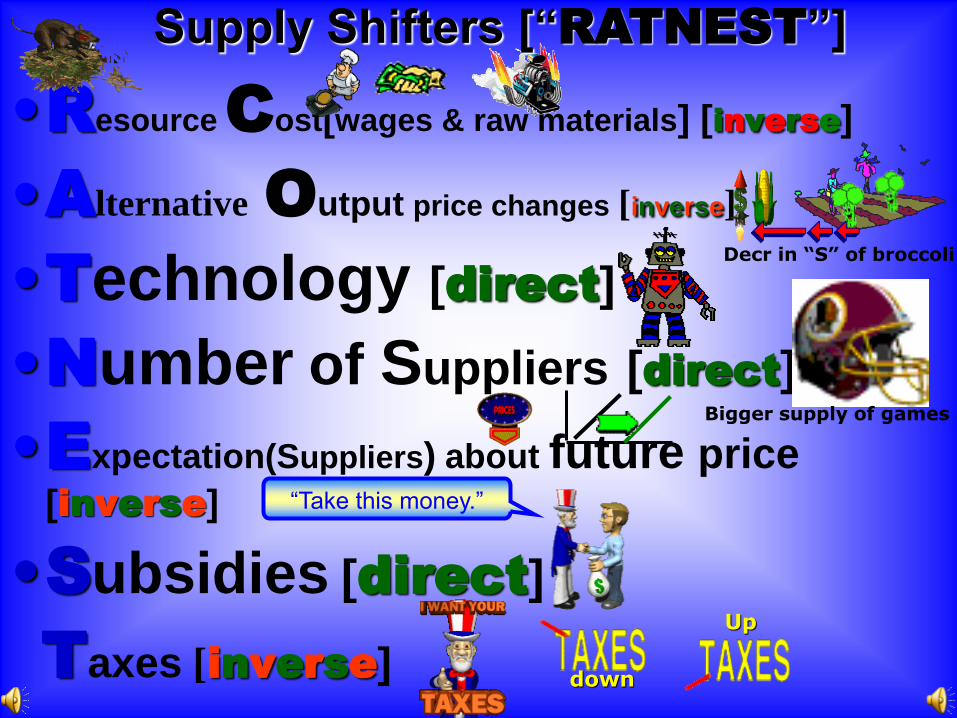
“Supply Shifters” [RATNEST]
1. Resource Cost [wages /raw materials ] [INVERSE]
2. Alternative Output Prices [INVERSE]
3. Technology [DIRECT]
4. Number of Suppliers [DIRECT]
5. Expectations [about future price] [INVERSE]
6. Subsidies [DIRECT]
7. Taxes [INVERSE]
QS1 QS2
Change in “Supply” [Curve] 1. “Non-price change” [RATNEST]
2. Whole supply curve “shifts” [There was a QS change but it was not caused by a change in price]
.
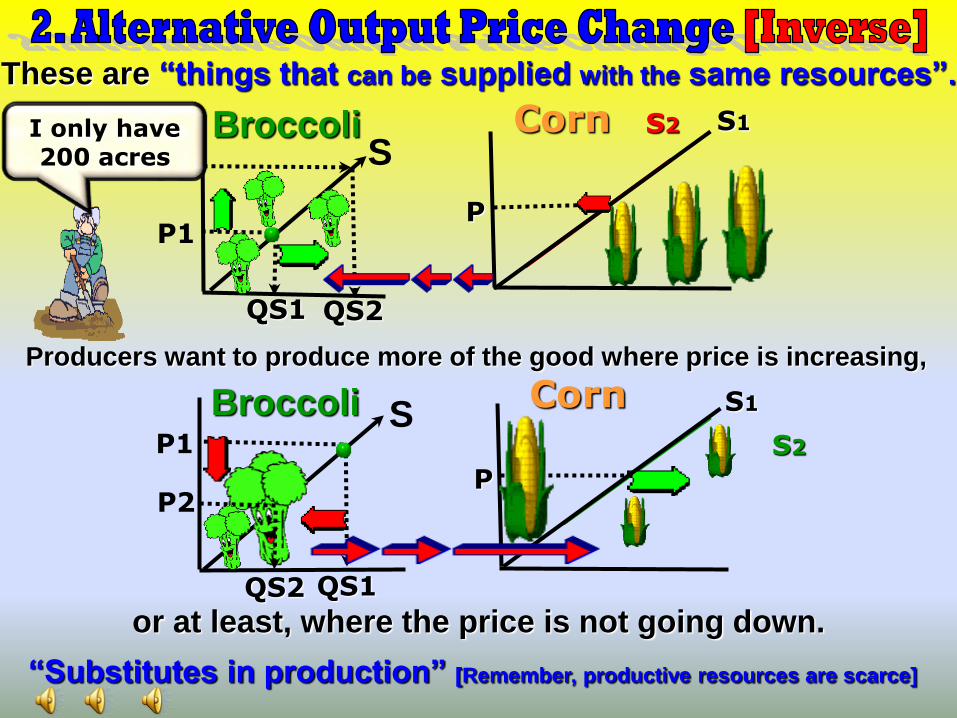
Broccoli
“Suppliers produce smaller/
larger quantities at each price.”
“Substitutes in production” “Things that can be supplied with the same resources.”
I only have 200
acres
S1
S Corn S1
P S2
Alternative Output Price Change
[INVERSE]
QS1
P2
P1
P S1 S2
[new football league- bigger “S” of games]
Don’t confuse these two with Chg in QS.
QS2 QS3
S3 S2
P
[capital cost]
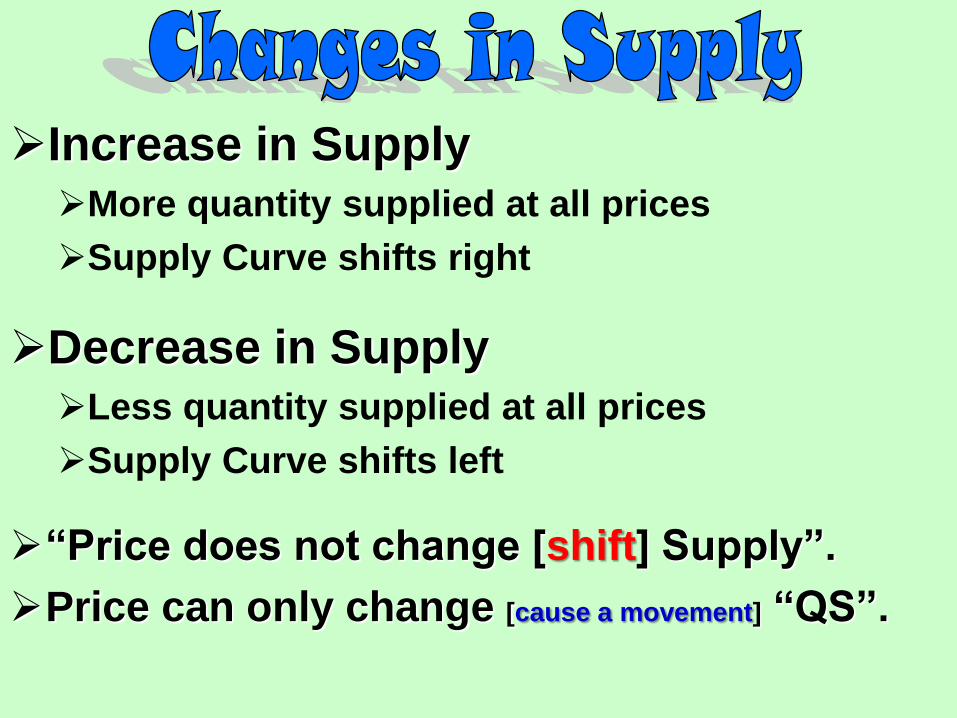
Increase in Supply More quantity supplied at all prices
Supply Curve shifts right
Decrease in Supply Less quantity supplied at all prices
Supply Curve shifts left
“Price does not change [shift] Supply”.
Price can only change [cause a movement] “QS”.

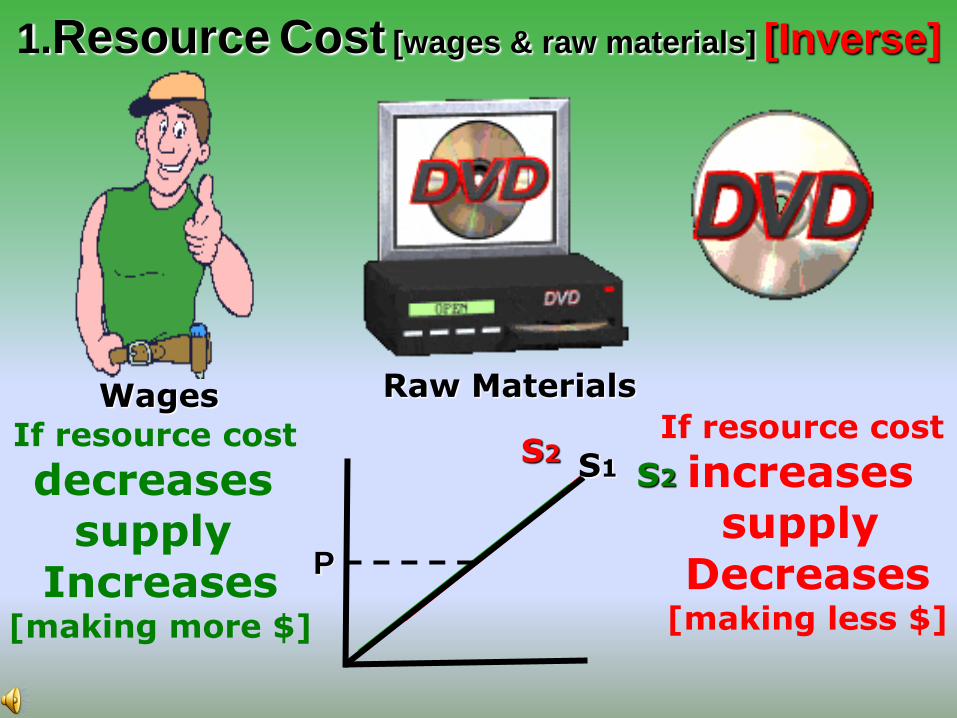
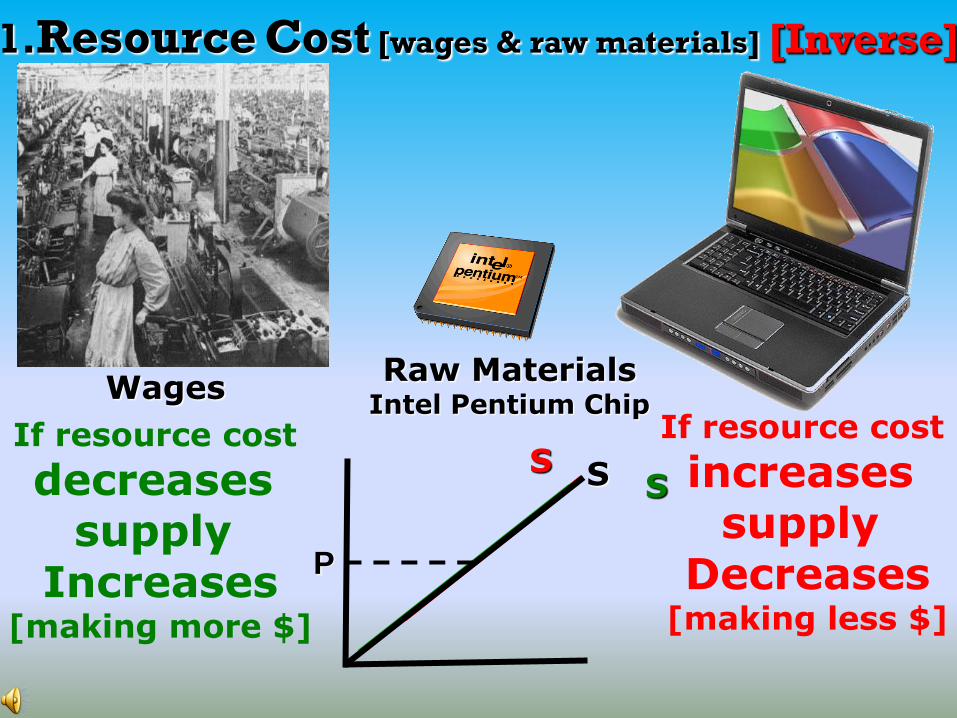
1.Resource Cost [wages & raw materials] [Inverse]
Wages Raw Materials
S1
If resource cost
decreases supply
Increases [making more $]
If resource cost
increases supply
Decreases [making less $]
S2 S2
P
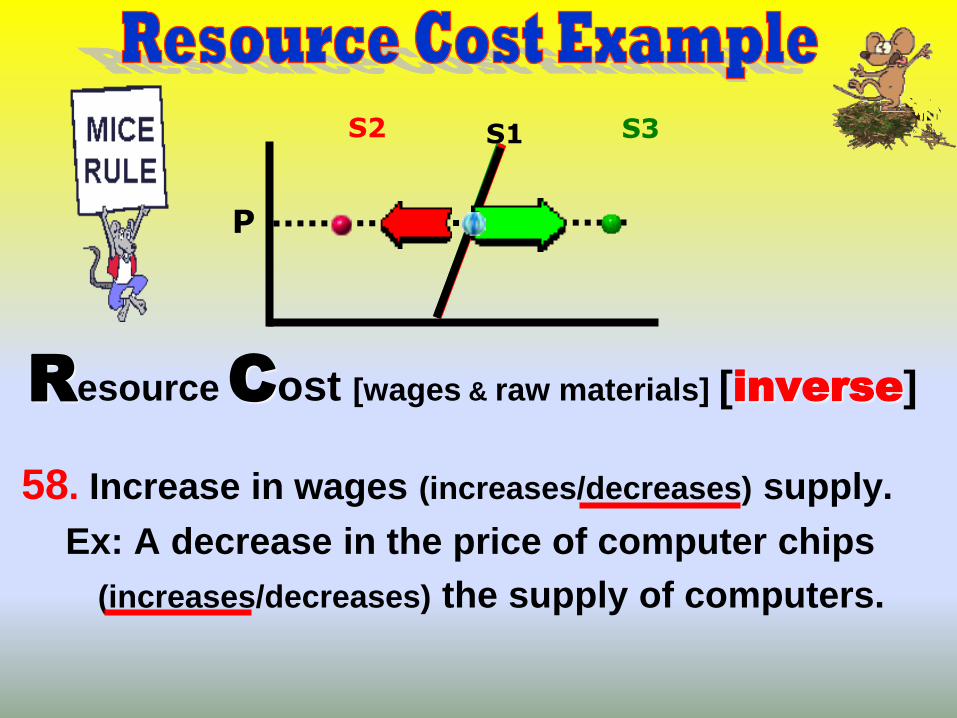
Resource Cost [wages & raw materials] [inverse]
58. Increase in wages (increases/decreases) supply.
Ex: A decrease in the price of computer chips
(increases/decreases) the supply of computers.
S1
P
S2 S3
P1
P1
QS1
Broccoli
“Substitutes in production” [Remember, productive resources are scarce]
S Corn S1
P
S2
QS1
S1
P
S2
S Corn
Producers want to produce more of the good where price is increasing,
or at least, where the price is not going down.
Broccoli
P2
QS2
P2
QS2
These are “things that can be supplied with the same resources”.
I only have 200 acres
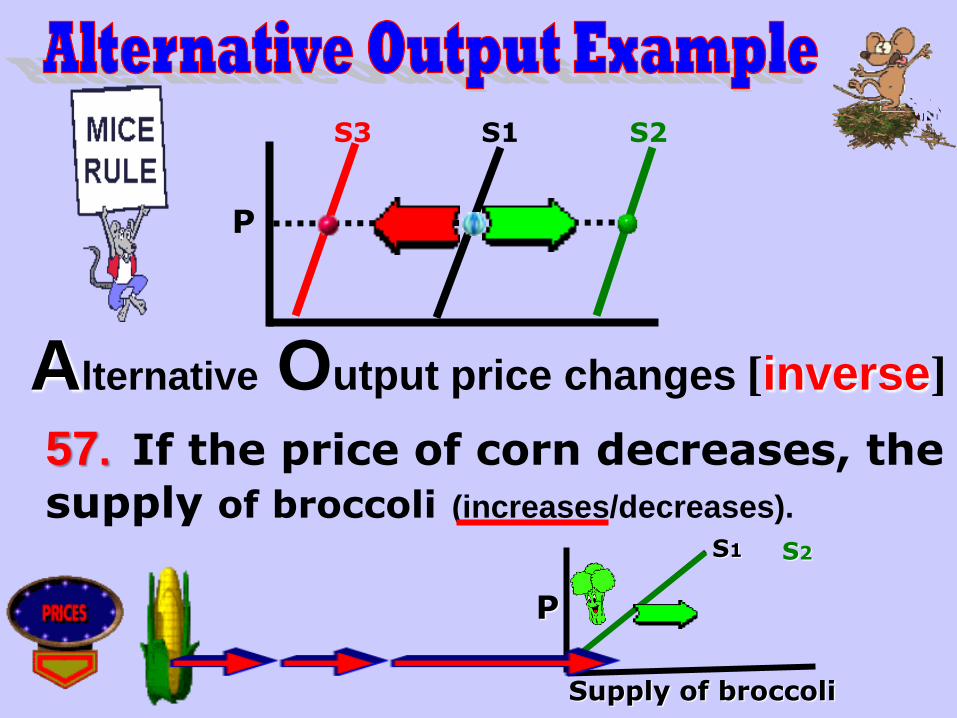
Alternative Output price changes [inverse]
57. If the price of corn decreases, the
supply of broccoli (increases/decreases).
S3 S1 S2
P
Supply of broccoli
P
S1 S2
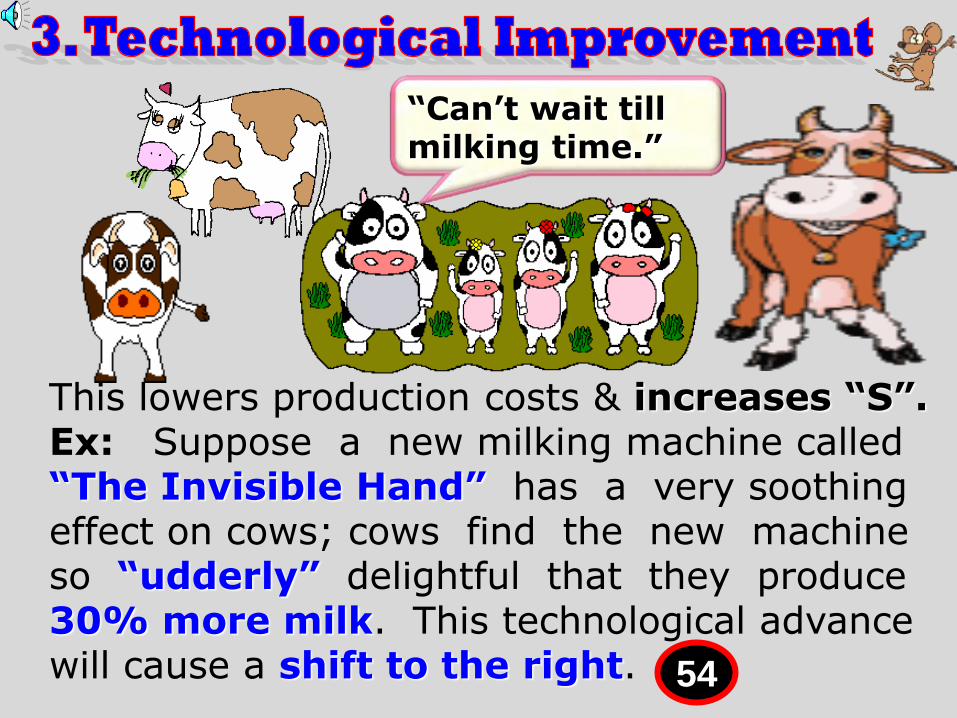
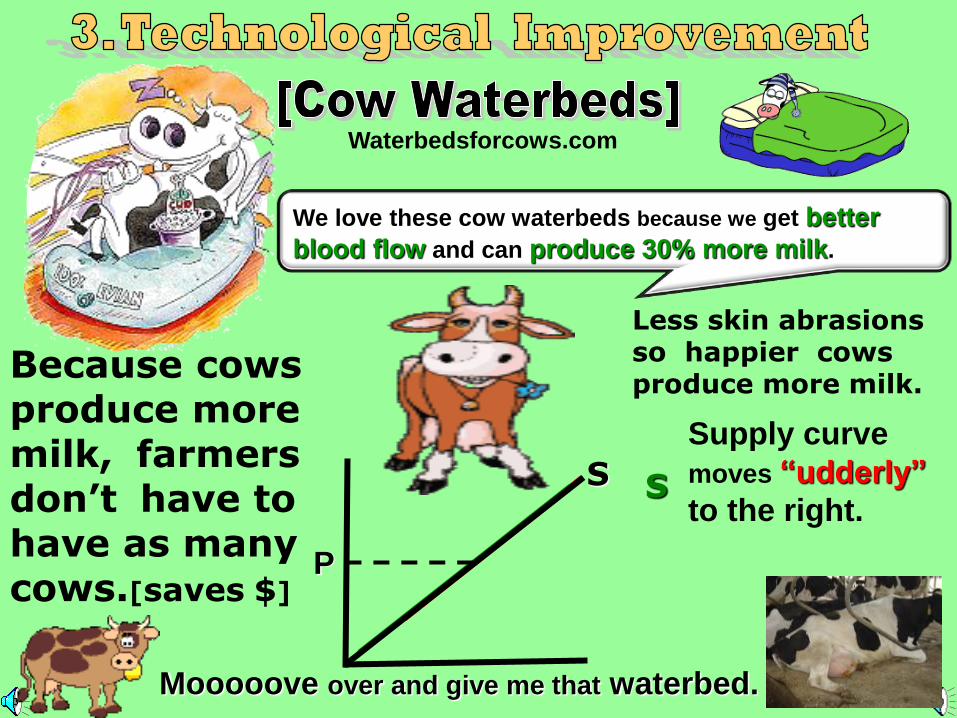
This lowers production costs & increases “S”. Ex: Suppose a new milking machine called “The Invisible Hand” has a very soothing effect on cows; cows find the new machine so “udderly” delightful that they produce 30% more milk. This technological advance will cause a shift to the right. 54
“Can’t wait till milking time.”
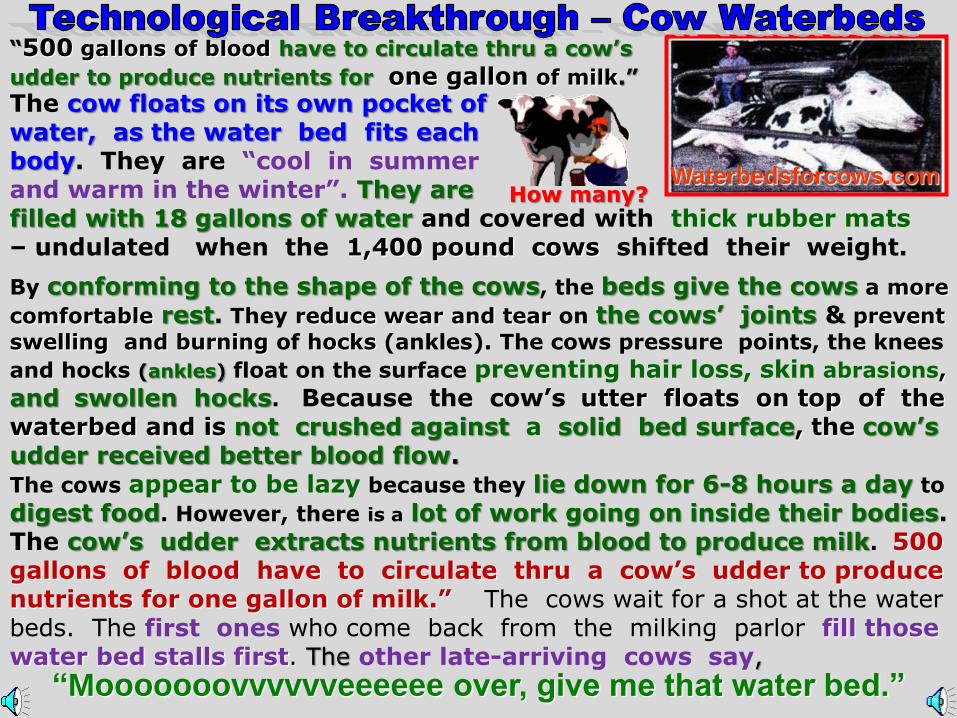
The cow floats on its own pocket of water, as the water bed fits each body. They are “cool in summer and warm in the winter”. They are filled with 18 gallons of water and covered with thick rubber mats – undulated when the 1,400 pound cows shifted their weight.
By conforming to the shape of the cows, the beds give the cows a more
comfortable rest. They reduce wear and tear on the cows’ joints & prevent
swelling and burning of hocks (ankles). The cows pressure points, the knees
and hocks (ankles) float on the surface preventing hair loss, skin abrasions,
and swollen hocks. Because the cow’s utter floats on top of the
waterbed and is not crushed against a solid bed surface, the cow’s
udder received better blood flow. The cows appear to be lazy because they lie down for 6-8 hours a day to
digest food. However, there is a lot of work going on inside their bodies. The cow’s udder extracts nutrients from blood to produce milk. 500 gallons of blood have to circulate thru a cow’s udder to produce nutrients for one gallon of milk.” The cows wait for a shot at the water beds. The first ones who come back from the milking parlor fill those water bed stalls first. The other late-arriving cows say,
“500 gallons of blood have to circulate thru a cow’s
udder to produce nutrients for one gallon of milk.”
How many?
“Mooooooovvvvvveeeeee over, give me that water bed.”
Waterbedsforcows.com
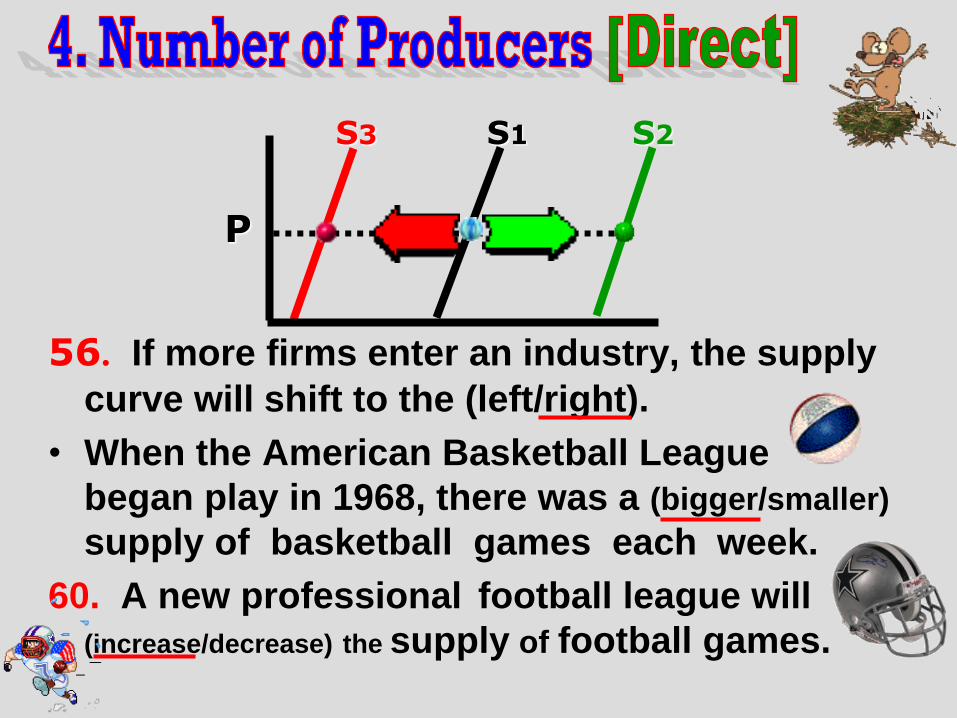
56. If more firms enter an industry, the supply
curve will shift to the (left/right).
• When the American Basketball League
began play in 1968, there was a (bigger/smaller)
supply of basketball games each week.
60. A new professional football league will
(increase/decrease) the supply of football games.
S3 S1 S2
P

NFL
S1 P
Q
$50
Supply of FB games increased when the XFL was formed.
S2
QS1 QS2
XFL in 2001
Because of the XFL’s cheerleaders
many called this league, not the
XFL, but the
Supply of FB games each week
XXXFL XFL [Extreme Football League]
8 new teams
More games
each year

Dallas Chaparrals I’m going for “3”.
Bigger Supply of Basketball
Games in 1968 with the ABA
S1 P
Q
$2.00
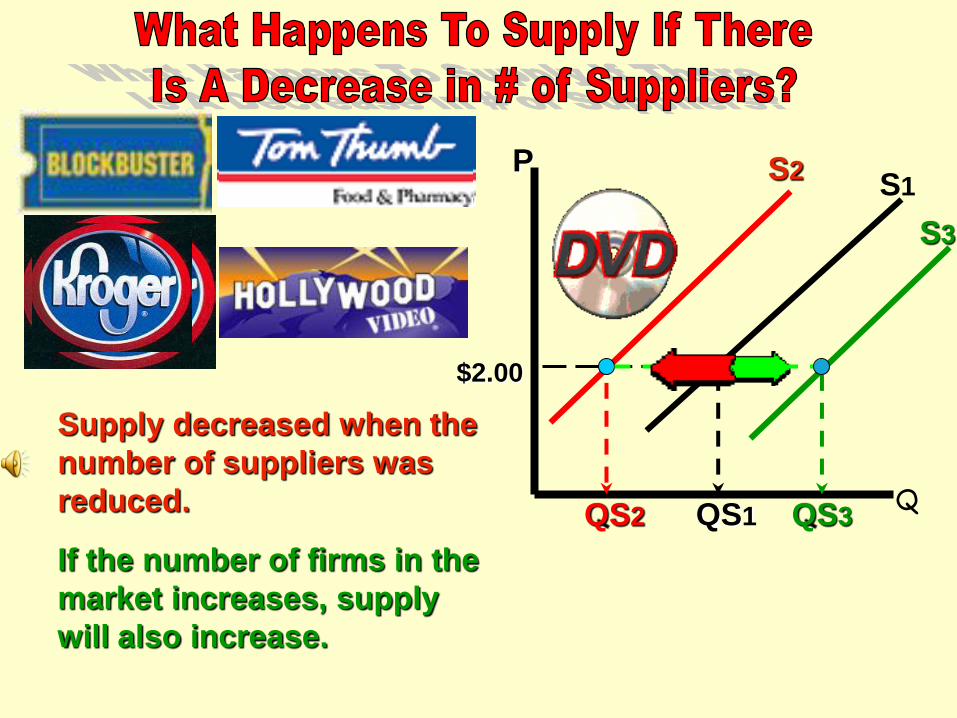
Supply decreased when the
number of suppliers was
reduced.
If the number of firms in the
market increases, supply
will also increase.
S2
S3
QS1 QS2 QS3
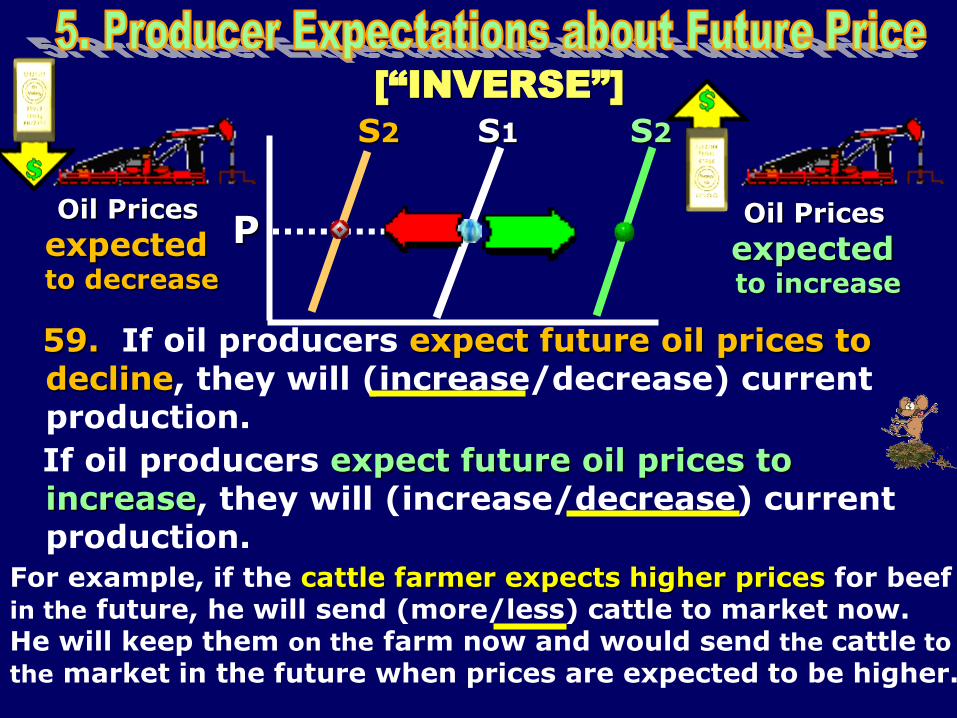
59. If oil producers expect future oil prices to decline, they will (increase/decrease) current production.
S1
Oil Prices
expected to decrease
[“INVERSE”]
P
S2
If oil producers expect future oil prices to increase, they will (increase/decrease) current production.
S2
Oil Prices
expected to increase
For example, if the cattle farmer expects higher prices for beef in the future, he will send (more/less) cattle to market now. He will keep them on the farm now and would send the cattle to
the market in the future when prices are expected to be higher.
S3
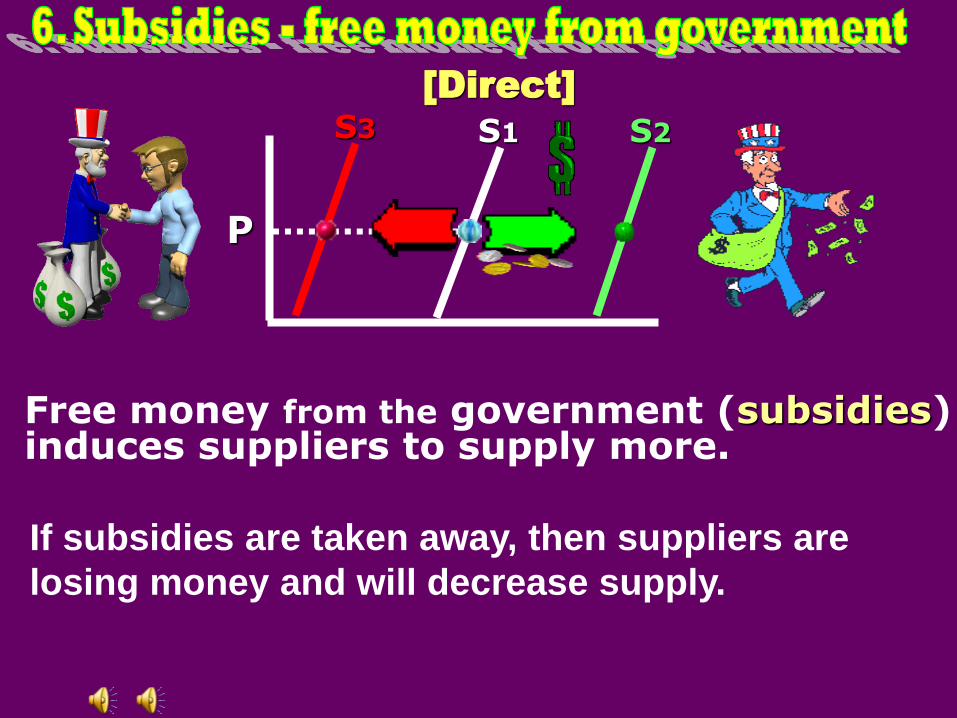
[Direct]
P
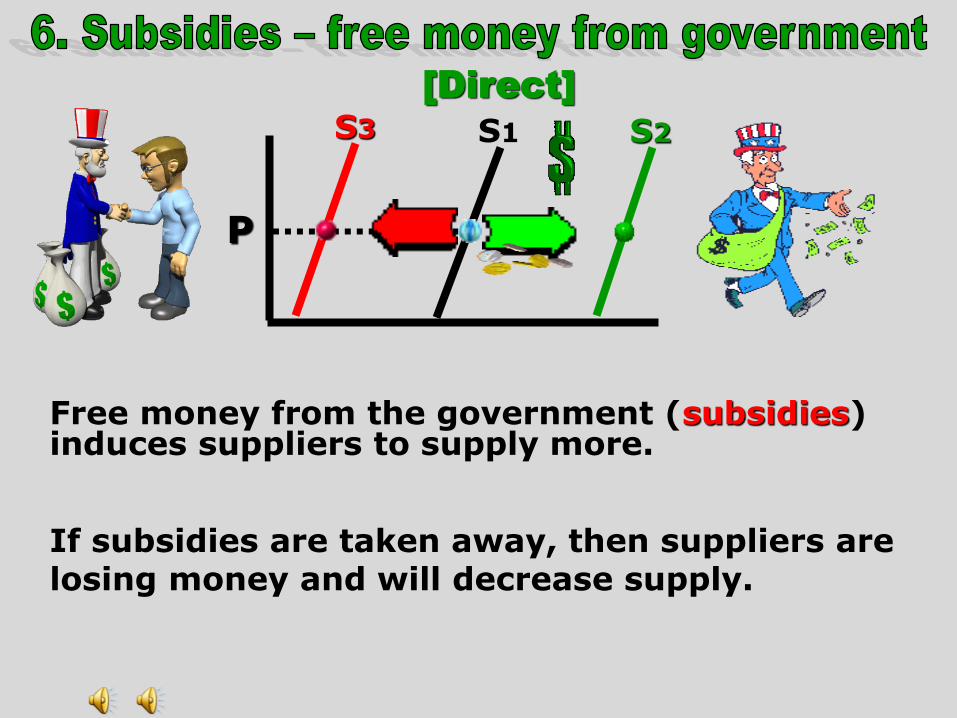
Free money from the government (subsidies) induces suppliers to supply more.
S1 S2
If subsidies are taken away, then suppliers are losing money and will decrease supply.
S3
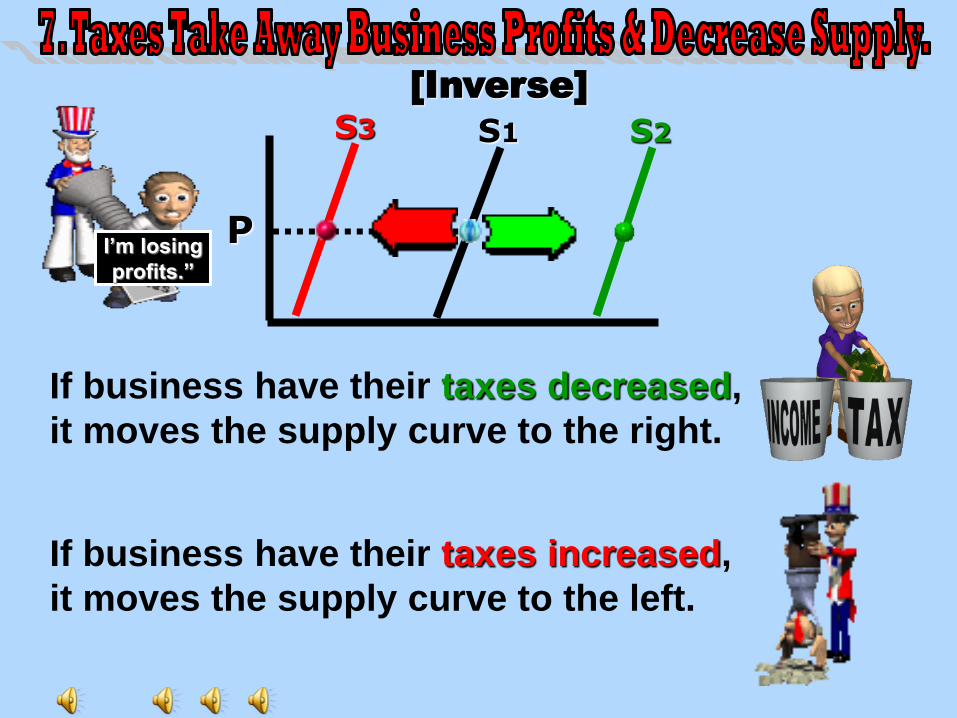
[Inverse]
P
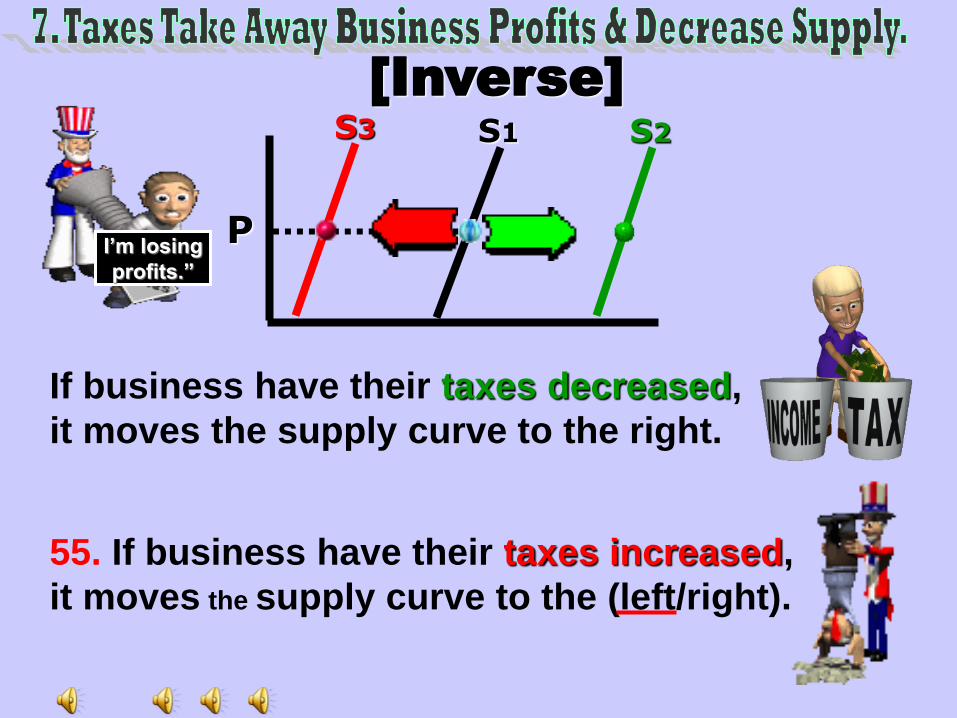
If business have their taxes decreased,
it moves the supply curve to the right.
S1 S2
55. If business have their taxes increased,
it moves the supply curve to the (left/right).
I’m losing
profits.”
•Resource Cost[wages & raw materials] [inverse]
•Alternative Output price changes [inverse]
•Technology [direct]
•Number of Suppliers [direct]
•Expectation(Suppliers) about future price [inverse]
•Subsidies [direct]
Taxes [inverse]
Bigger supply of games
“Take this money.”
Decr in “S” of broccoli
Supply Shifters [“RATNEST”]
Up
down

Supply Can Increase or Decrease
6
5
4
3
2
1
0
Quantity Supplied (bushels per week)
Pri
ce (
per
bu
sh
el)
P Qs
$5
4
3
2
1
60
50
35
20
5
Individual
Supply
P
Q
S1
S2
S3
2 4 6 8 10 12 14
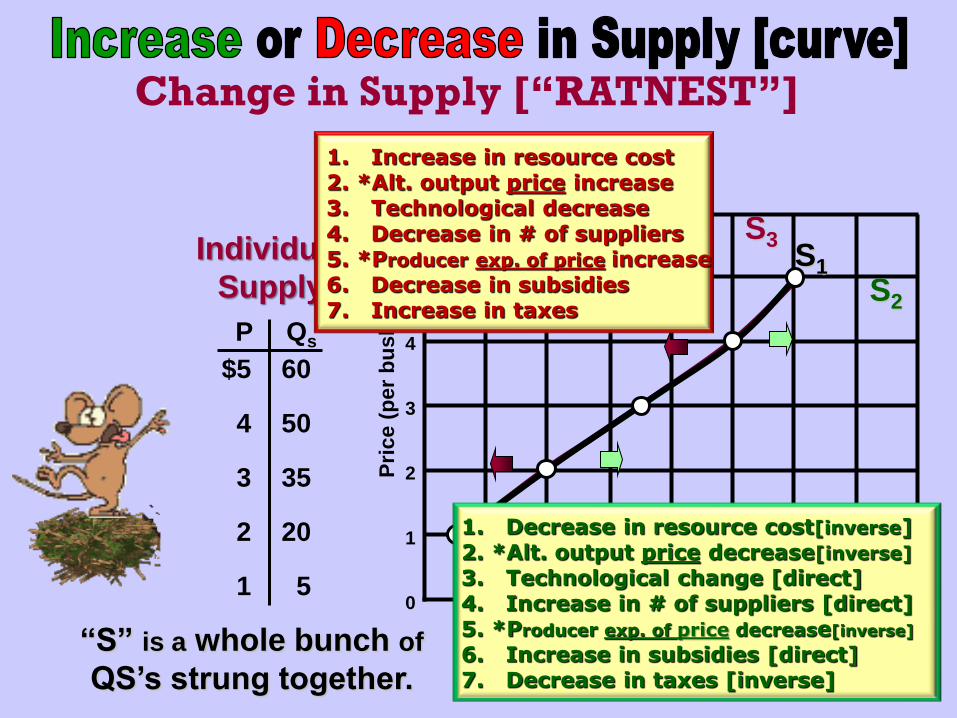
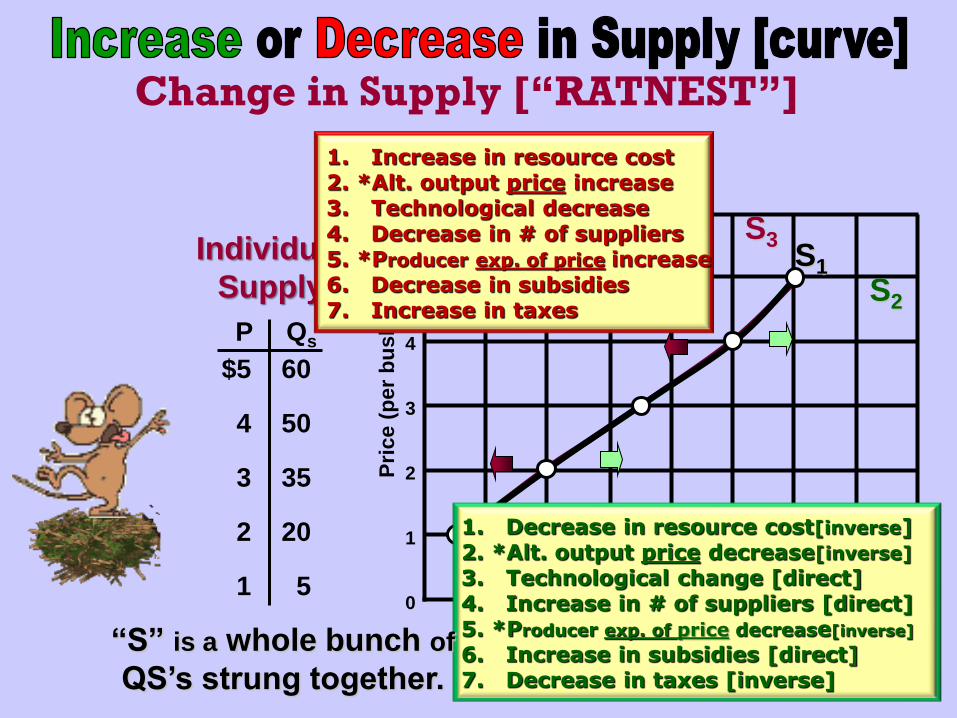
Change in Supply [“RATNEST”]
1. Decrease in resource cost 2. Alt. output price decrease 3. Technological change 4. Increase in # of suppliers 5. Producer exp. of price decrease 6. Increase in subsidies 7. Decrease in taxes
1. Increase in resource cost 2. Alt. output price increase 3. Technological decrease 4. Decrease in # of suppliers 5. Producer exp. of price increase 6. Decrease in subsidies 7. Increase in taxes
“S” is a whole bunch of
QS’s strung together.
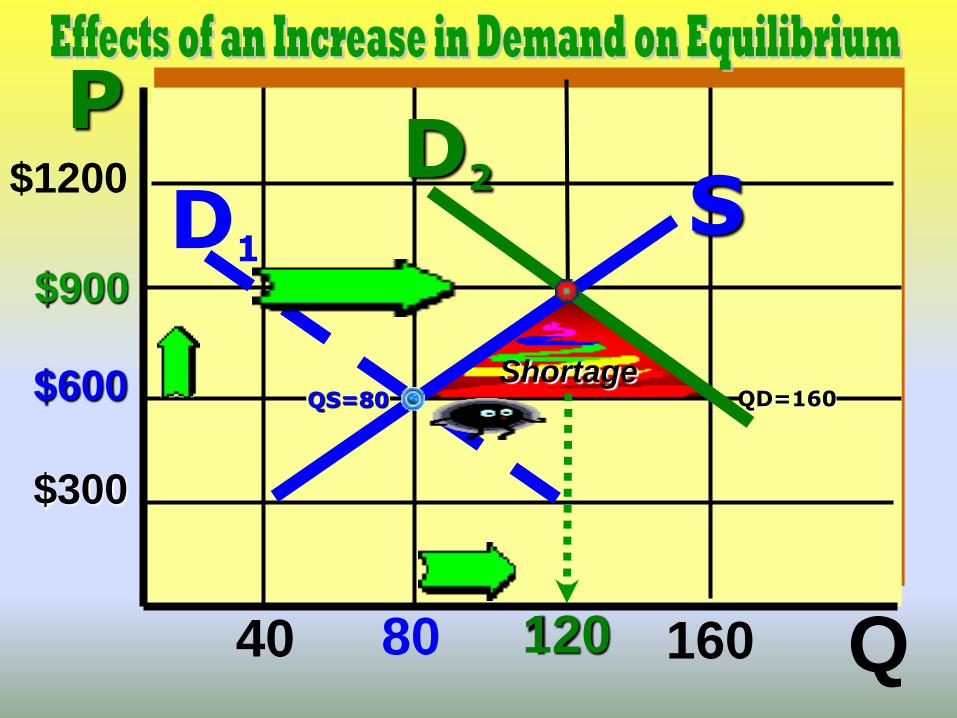
$1200
$600
$300
40 80 120
D1
D2
$900
S
P
Q 160
QD=160 QS=80 Shortage
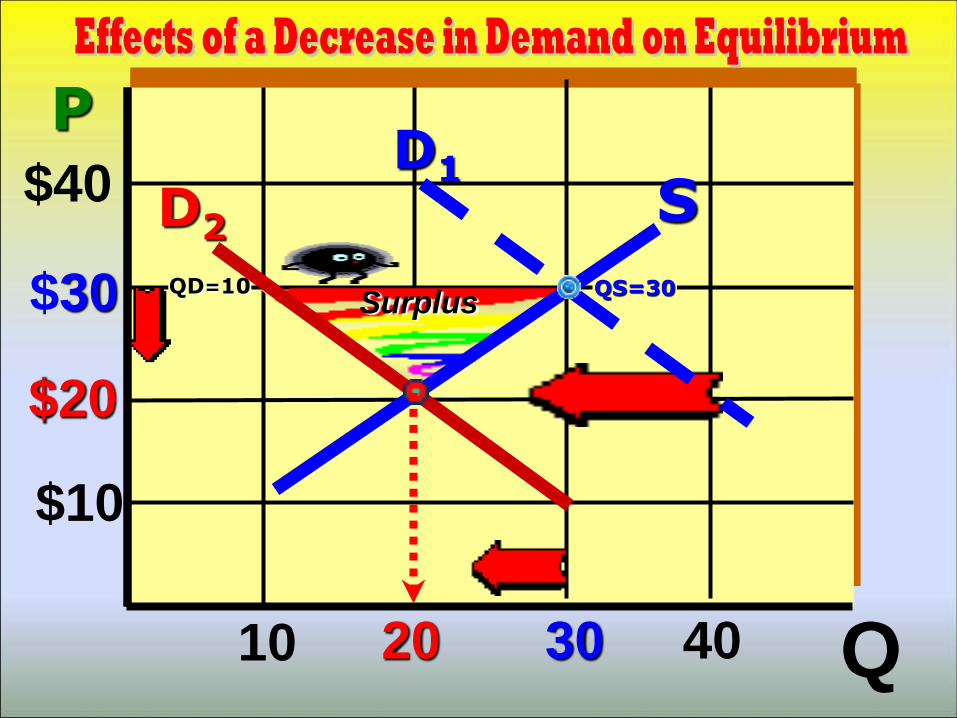
$40
$30
$10
10 20 30 40
D2 S D1
$20
P
QS=30 QD=10 Surplus
Q
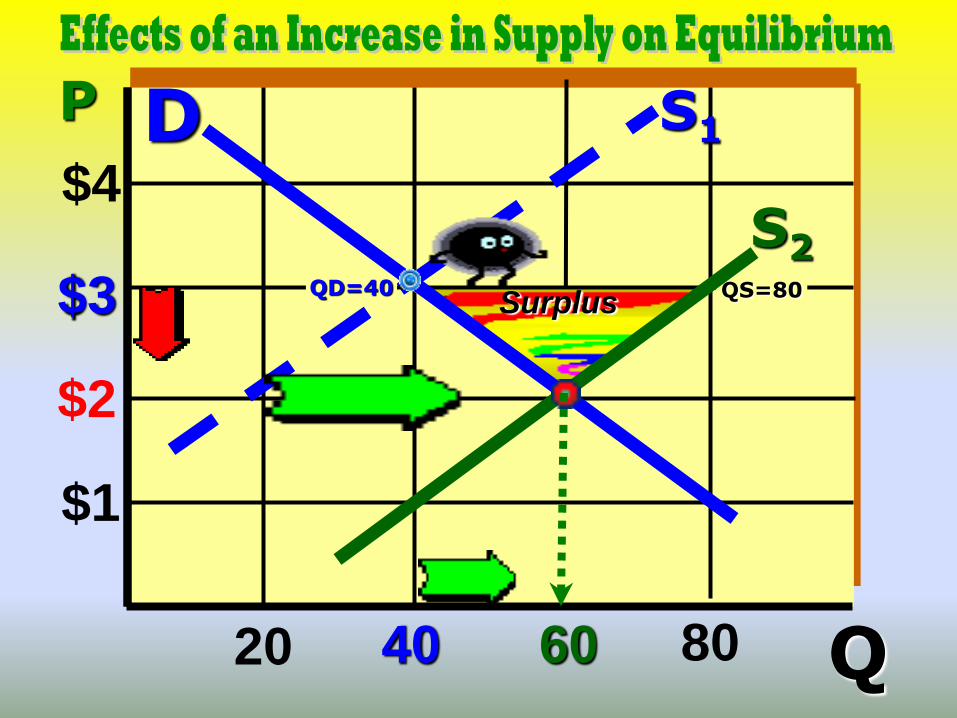
$4
$1
20 40 60 80
D
$3
$2
S1
S2 QS=80 QD=40
Surplus
P
Q
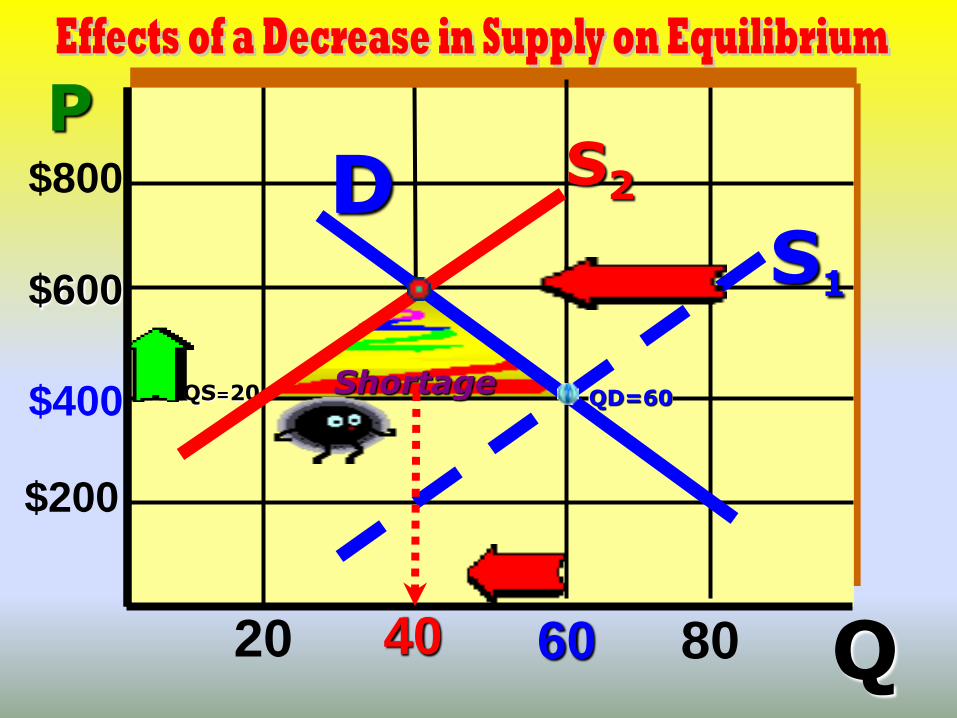
$800
$200
20 40 60 80
D $600
S1
S2
$400 QS=20 QD=60 Shortage
P
Q

D1 D2 S
P1
P2
Q1 Q2
Shortage
Increase in Demand [For clownfish after “Finding Nemo”]
D2
S
P1
P2
Q2 Q1
D1
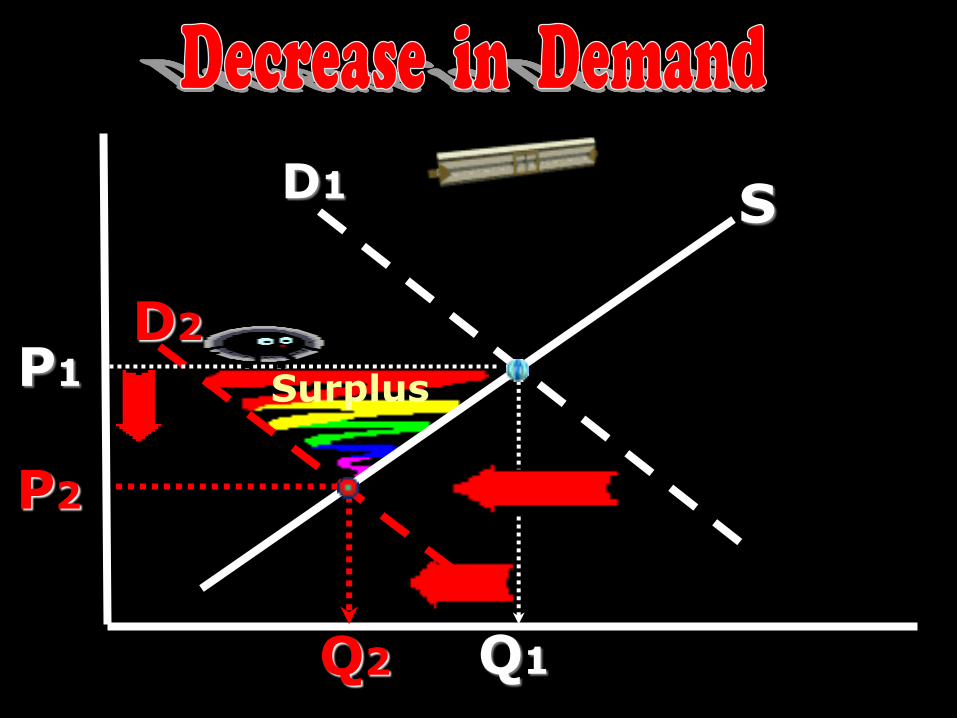
Surplus
D S1
P1
Q1
P2
Q2
S2
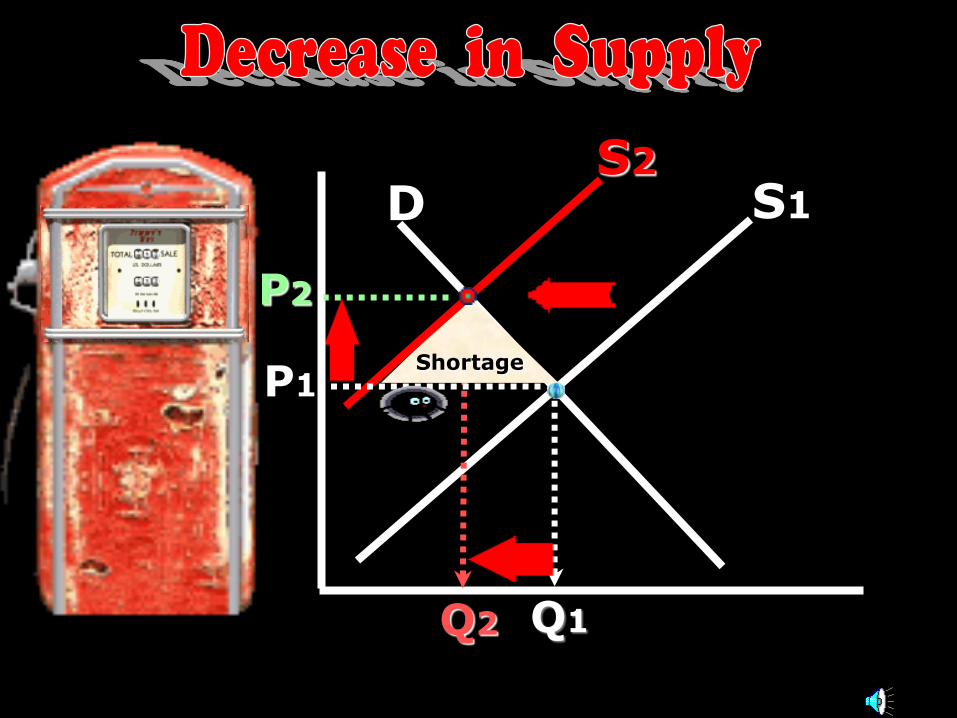
Shortage
D S1
P1
Q2
P2
Q2
S2
Surplus
$2.70 1.35
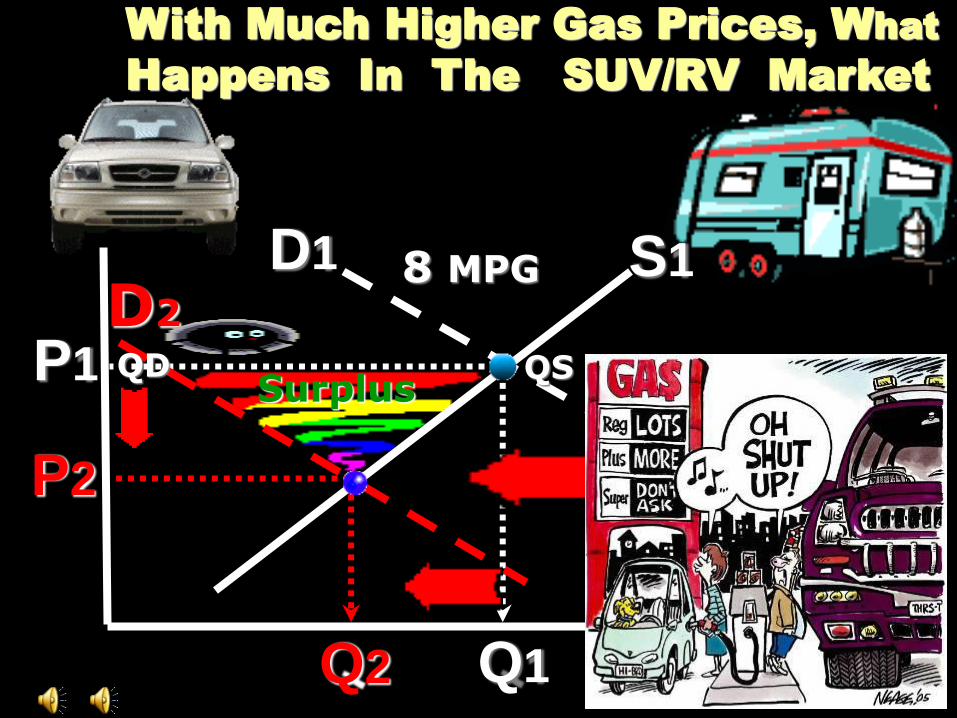
D2
With Much Higher Gas Prices, What
Happens In The SUV/RV Market
P1
P2
Q2 Q1
D1 8 MPG
Surplus QS QD
S1
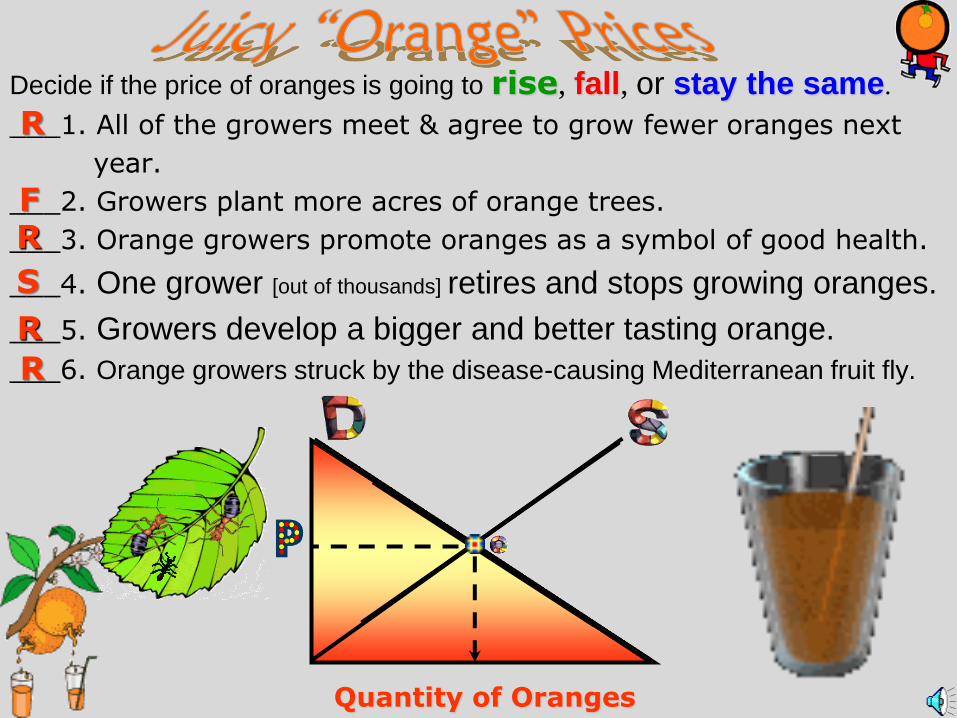
Decide if the price of oranges is going to rise, fall, or stay the same.
___1. All of the growers meet & agree to grow fewer oranges next
year.
___2. Growers plant more acres of orange trees.
___3. Orange growers promote oranges as a symbol of good health.
___4. One grower [out of thousands] retires and stops growing oranges.
___5. Growers develop a bigger and better tasting orange.
___6. Orange growers struck by the disease-causing Mediterranean fruit fly.
Quantity of Oranges
R
F R
S
R
R
“Increase in S”
Decrease in “QS” [caused by a “decrease in price”]
Increase in “QS” [caused by an “increase in price”]
1. Price change 2. Movement 3. Point to point [“Snap shot of 1 pt in time]
Change in “S” [RATNEST]
1. Non-price 2. Whole curve 3. Shift [“Time passes”]
What could cause an “increase in supply?” 4. Increase in number of producers
1. Decrease in resource cost [wages/raw materials] 5. Increase in technology
2. Decrease in the price of an alternative output for “X” 6. Increase in subsidies
3. Producer expectations of a price decrease 7. Decrease in taxes
P1
P2
QS1
P1
P2
QS1
S S
S1 S2
S1 S2
P P
“Decrease in S”
QS2 QS2
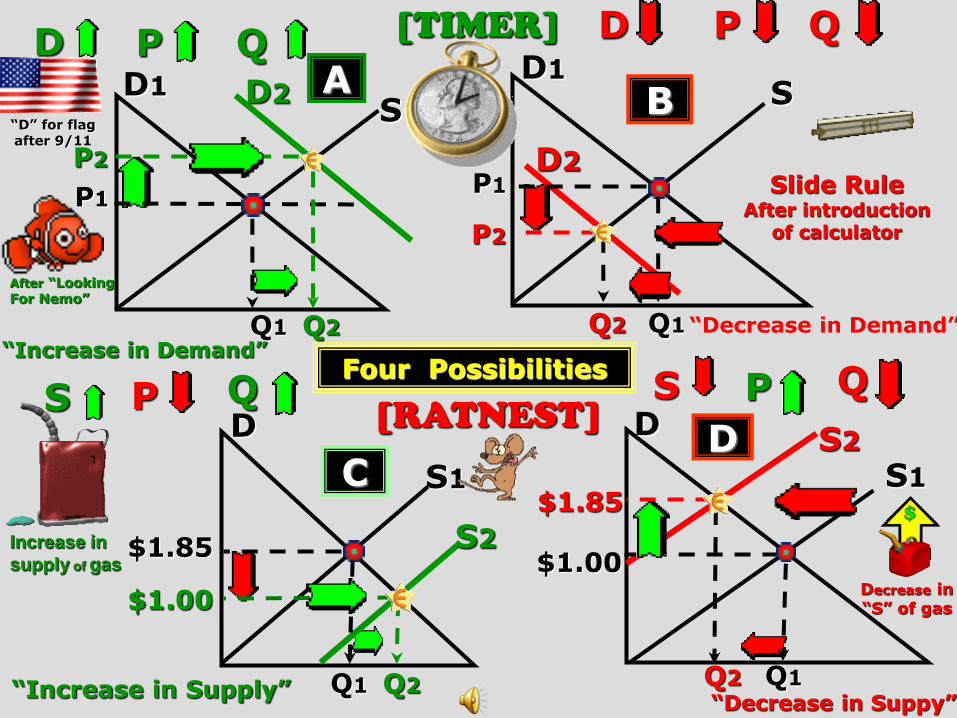
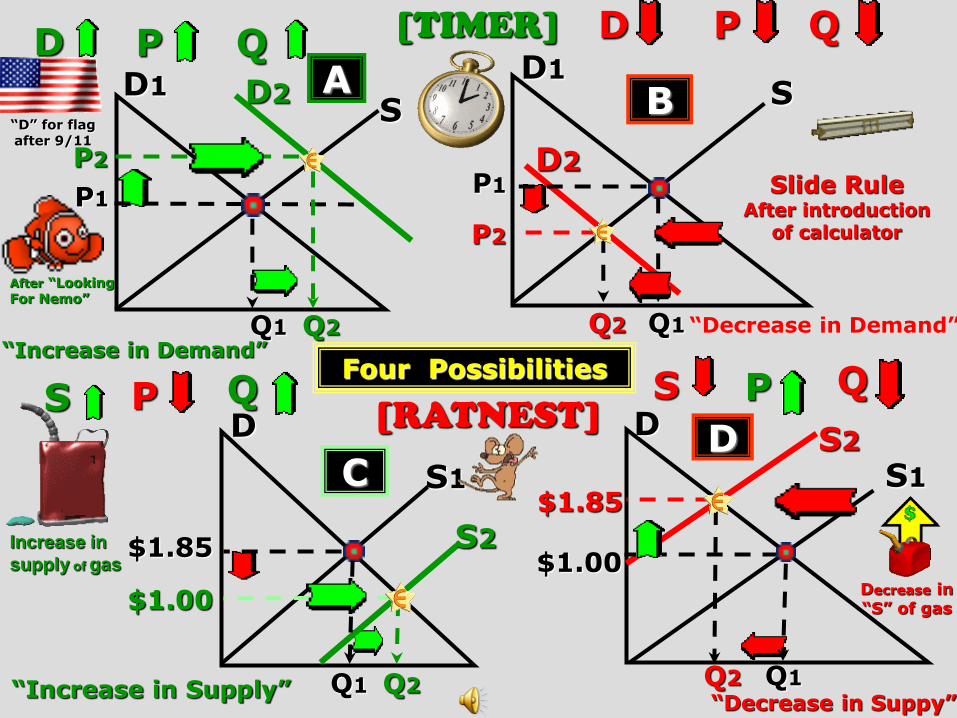
Four Possibilities
D1 D2 S
A B
C D
Increase in
supply of gas
Slide Rule After introduction
of calculator
S D1
D2
[TIMER]
[RATNEST]
“D” for flag after 9/11
“Increase in Demand” “Decrease in Demand”
“Increase in Supply” “Decrease in Suppy”
Decrease in “S” of gas
D P Q D P Q
S Q P P S Q D
S1
D
S1
S2
$1.85
$1.00
Q1 Q2 Q2 Q1
$1.85
S2 $1.00
P2
P1 P1
P2
Q1 Q2 Q2 Q1
After “Looking For Nemo”
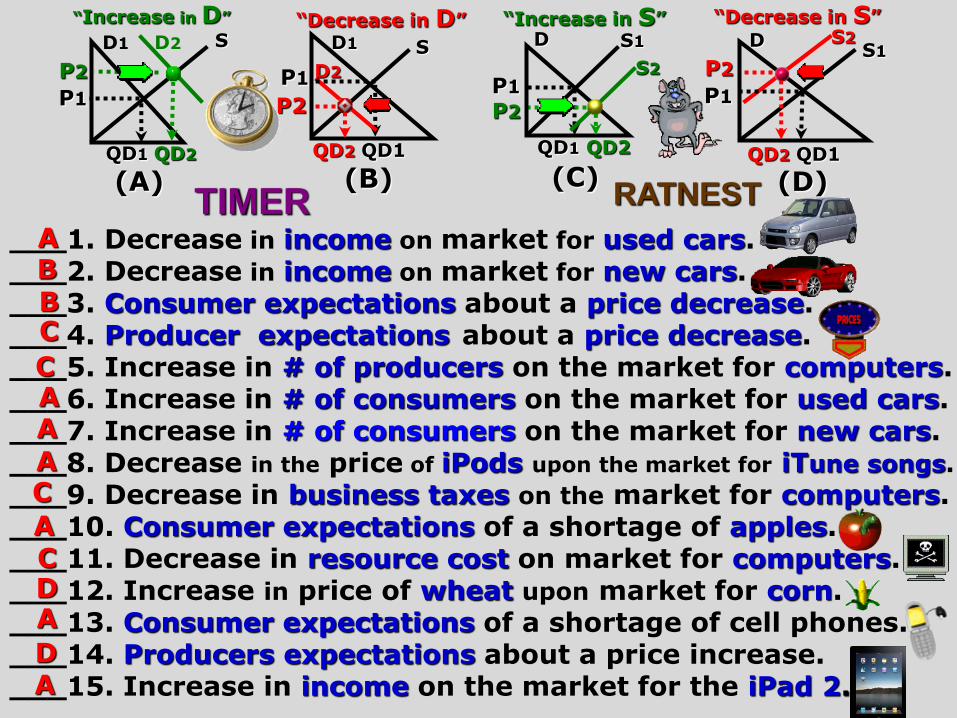
“Increase in D” “Decrease in D” “Increase in S” “Decrease in S”
___1. Decrease in income on market for used cars. ___2. Decrease in income on market for new cars. ___3. Consumer expectations about a price decrease. ___4. Producer expectations about a price decrease. ___5. Increase in # of producers on the market for computers. ___6. Increase in # of consumers on the market for used cars. ___7. Increase in # of consumers on the market for new cars. ___8. Decrease in the price of iPods upon the market for iTune songs.
___9. Decrease in business taxes on the market for computers. ___10. Consumer expectations of a shortage of apples. ___11. Decrease in resource cost on market for computers. ___12. Increase in price of wheat upon market for corn. ___13. Consumer expectations of a shortage of cell phones. ___14. Producers expectations about a price increase. ___15. Increase in income on the market for the iPad 2.
B
B
C
C A
A C
A
D C
A
A
A
A
D
D1 D2
(A) (B) (C) (D)
D1
D2
S S S1 S1
S2
S2 D D
TIMER RATNEST
P2 P1 P1 P2
P1 P2 P2 P1
QD1 QD2 QD2 QD1 QD1 QD2 QD2 QD1
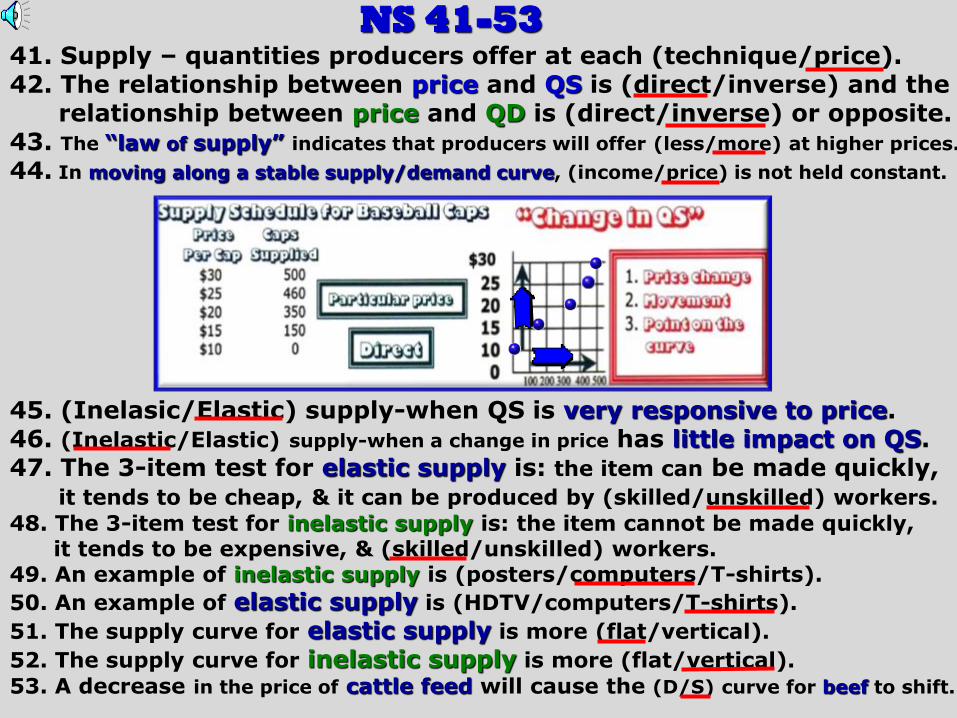
NS 41-53 41. Supply – quantities producers offer at each (technique/price). 42. The relationship between price and QS is (direct/inverse) and the relationship between price and QD is (direct/inverse) or opposite. 43. The “law of supply” indicates that producers will offer (less/more) at higher prices.
44. In moving along a stable supply/demand curve, (income/price) is not held constant.
45. (Inelasic/Elastic) supply-when QS is very responsive to price. 46. (Inelastic/Elastic) supply-when a change in price has little impact on QS. 47. The 3-item test for elastic supply is: the item can be made quickly, it tends to be cheap, & it can be produced by (skilled/unskilled) workers.
48. The 3-item test for inelastic supply is: the item cannot be made quickly, it tends to be expensive, & (skilled/unskilled) workers. 49. An example of inelastic supply is (posters/computers/T-shirts).
50. An example of elastic supply is (HDTV/computers/T-shirts).
51. The supply curve for elastic supply is more (flat/vertical).
52. The supply curve for inelastic supply is more (flat/vertical).
53. A decrease in the price of cattle feed will cause the (D/S) curve for beef to shift.
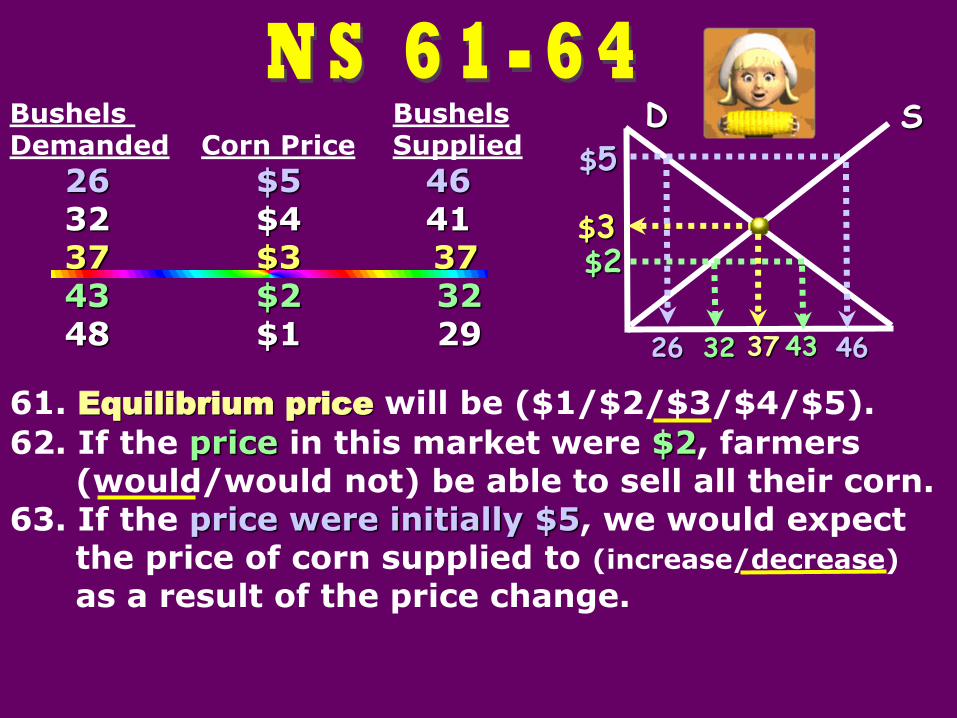
Bushels Bushels Demanded Corn Price Supplied
26 $5 46 32 $4 41 37 $3 37 43 $2 32 48 $1 29
61. Equilibrium price will be ($1/$2/$3/$4/$5).
62. If the price in this market were $2, farmers (would/would not) be able to sell all their corn. 63. If the price were initially $5, we would expect the price of corn supplied to (increase/decrease)
as a result of the price change.
$3 $2
$5
D S
26 46 32 43 37
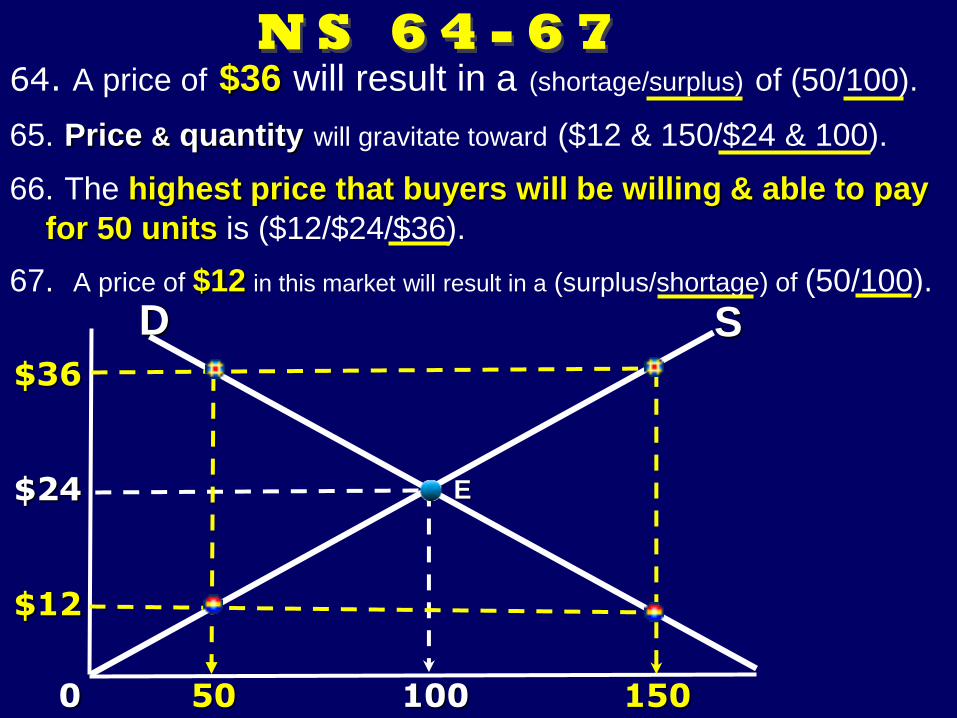
64. A price of $36 will result in a (shortage/surplus) of (50/100).
65. Price & quantity will gravitate toward ($12 & 150/$24 & 100).
66. The highest price that buyers will be willing & able to pay
for 50 units is ($12/$24/$36).
67. A price of $12 in this market will result in a (surplus/shortage) of (50/100).
0 50 100 150
$36
$24
$12
S D
E
Quantity
P D1
[caused by “TIMER”]
D2
QD1
QD2
“D” is a whole bunch of QD’s strung together.
6
5
4
3
2
1
0
Quantity Supplied (bushels per week)
Pri
ce (
per
bu
sh
el)
P Qs
$5
4
3
2
1
60
50
35
20
5
Individual
Supply
P
Q
S1
S2
S3
2 4 6 8 10 12 14
Change in Supply [“RATNEST”]
1. Decrease in resource cost[inverse] 2. *Alt. output price decrease[inverse] 3. Technological change [direct] 4. Increase in # of suppliers [direct] 5. *Producer exp. of price decrease[inverse]
6. Increase in subsidies [direct] 7. Decrease in taxes [inverse]
1. Increase in resource cost 2. *Alt. output price increase 3. Technological decrease 4. Decrease in # of suppliers 5. *Producer exp. of price increase 6. Decrease in subsidies 7. Increase in taxes
“S” is a whole bunch of
QS’s strung together.
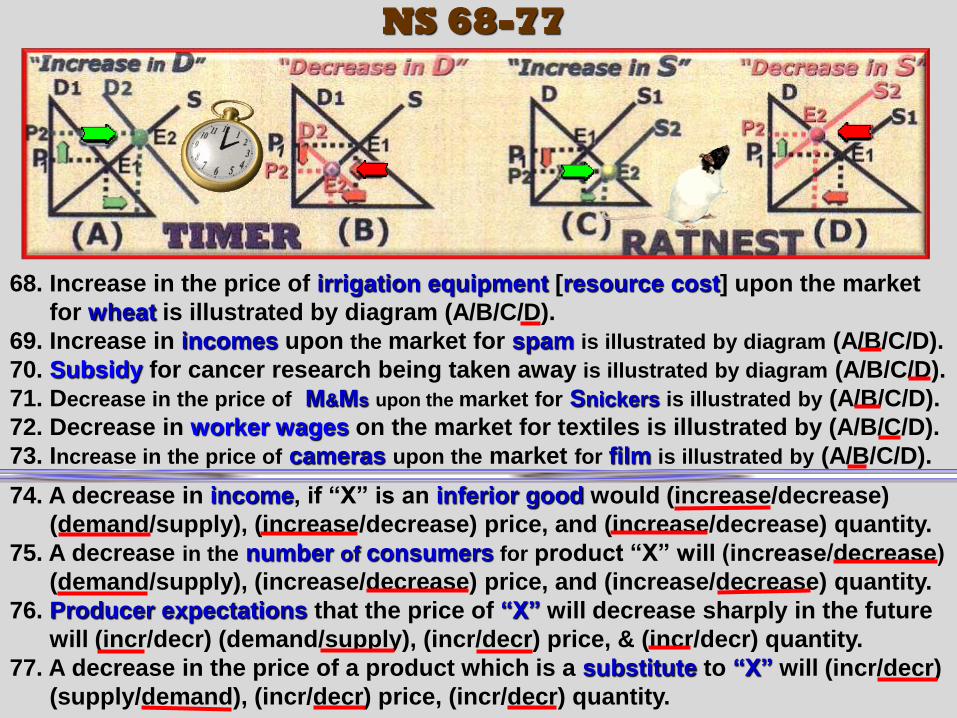
74. A decrease in income, if “X” is an inferior good would (increase/decrease)
(demand/supply), (increase/decrease) price, and (increase/decrease) quantity.
75. A decrease in the number of consumers for product “X” will (increase/decrease)
(demand/supply), (increase/decrease) price, and (increase/decrease) quantity.
76. Producer expectations that the price of “X” will decrease sharply in the future
will (incr/decr) (demand/supply), (incr/decr) price, & (incr/decr) quantity.
77. A decrease in the price of a product which is a substitute to “X” will (incr/decr)
(supply/demand), (incr/decr) price, (incr/decr) quantity.
68. Increase in the price of irrigation equipment [resource cost] upon the market
for wheat is illustrated by diagram (A/B/C/D).
69. Increase in incomes upon the market for spam is illustrated by diagram (A/B/C/D).
70. Subsidy for cancer research being taken away is illustrated by diagram (A/B/C/D).
71. Decrease in the price of M&Ms upon the market for Snickers is illustrated by (A/B/C/D).
72. Decrease in worker wages on the market for textiles is illustrated by (A/B/C/D).
73. Increase in the price of cameras upon the market for film is illustrated by (A/B/C/D).
NS 68-77
S2
P2 E2
D2 S2
D2
E2
S2
Q2 D2
S2
Q2
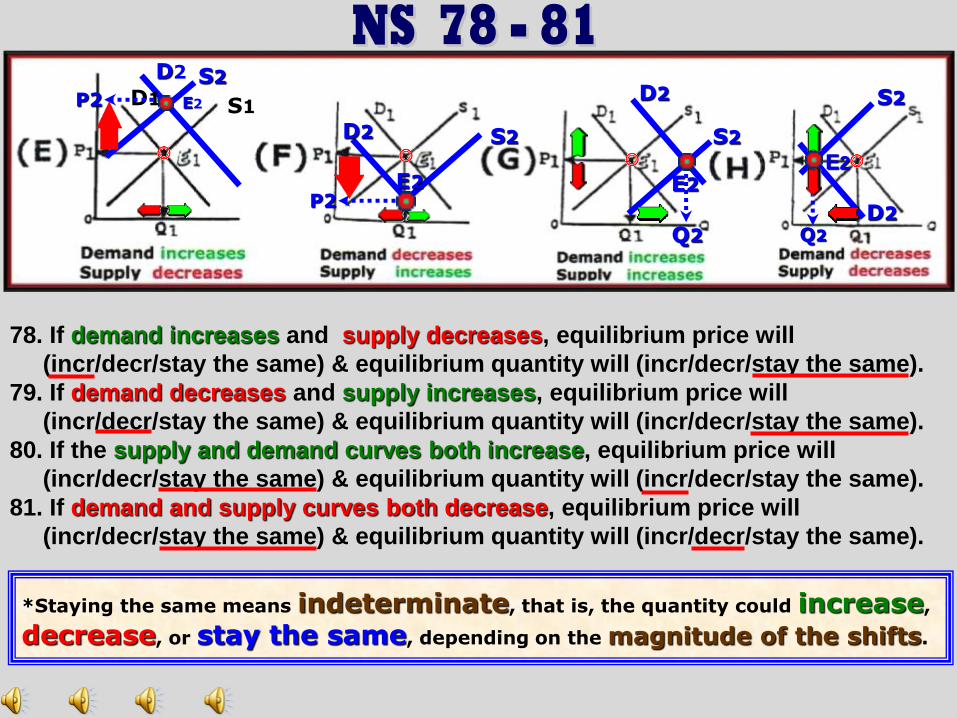
78. If demand increases and supply decreases, equilibrium price will
(incr/decr/stay the same) & equilibrium quantity will (incr/decr/stay the same).
79. If demand decreases and supply increases, equilibrium price will
(incr/decr/stay the same) & equilibrium quantity will (incr/decr/stay the same).
80. If the supply and demand curves both increase, equilibrium price will
(incr/decr/stay the same) & equilibrium quantity will (incr/decr/stay the same).
81. If demand and supply curves both decrease, equilibrium price will
(incr/decr/stay the same) & equilibrium quantity will (incr/decr/stay the same).
E2
*Staying the same means indeterminate, that is, the quantity could increase,
decrease, or stay the same, depending on the magnitude of the shifts.
S1 D1
D2
E2 P2
S
Q o
$5
$4
$3
$2
$1
10 20 30 40 50 60 70 80
$5
4
3
2
1
60
50
35
20
5
P QS
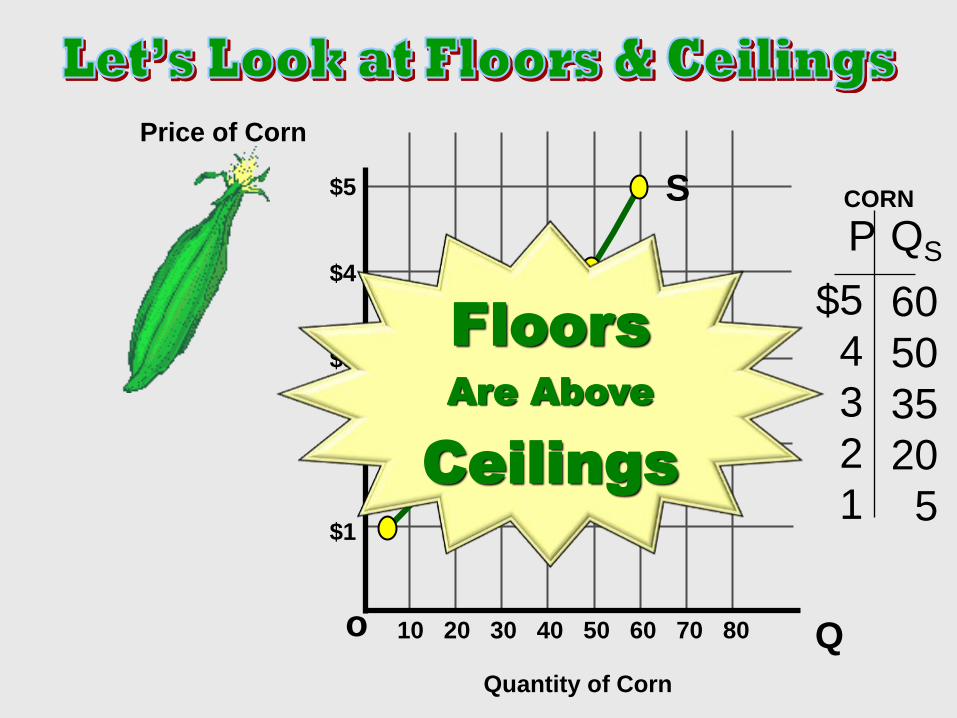
Price of Corn
Quantity of Corn
CORN
Floors
Are Above
Ceilings
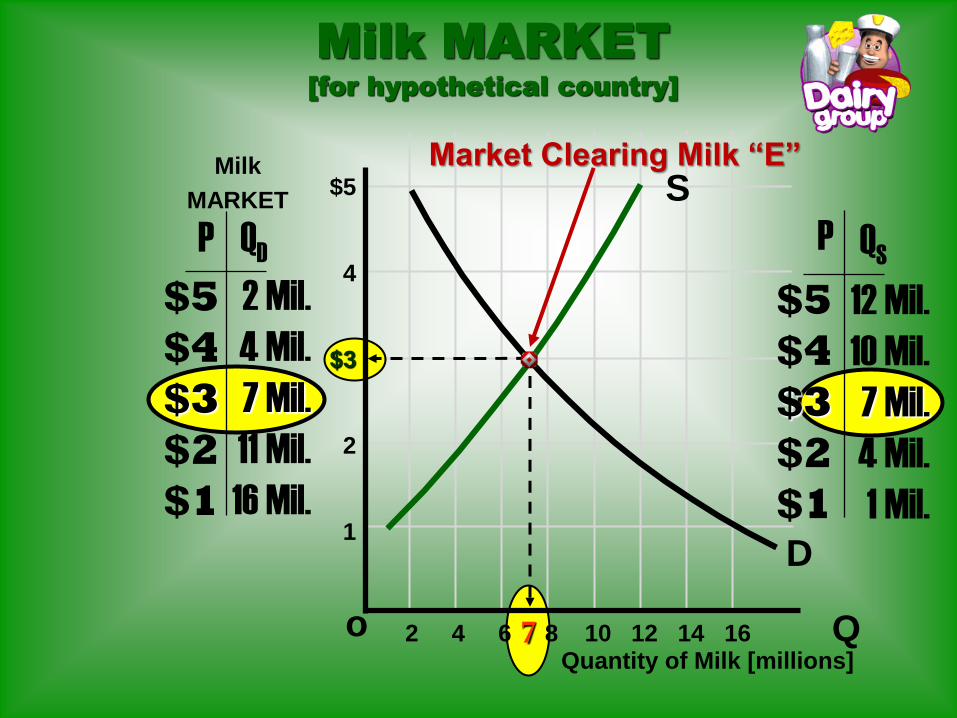
Milk MARKET
[for hypothetical country]
7
S
Q o
$5
4
$3
2
1
2 4 6 8 10 12 14 16
P QD
$5
$4
$3
$2
$1
2 Mil.
4 Mil.
7 Mil.
11 Mil.
16 Mil.
$5
$4
$3
$2
$1
12 Mil.
10 Mil.
7 Mil.
4 Mil.
1 Mil.
D
P QS
Quantity of Milk [millions]
Milk
MARKET
Market Clearing Milk “E”
.
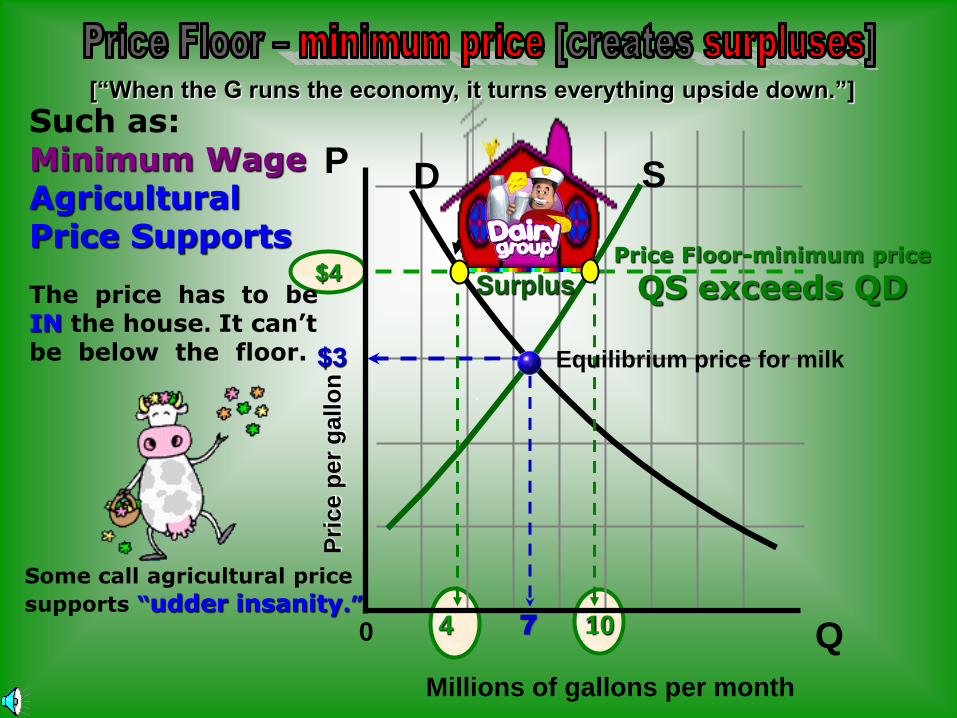
$4
S P
Q 0 4 7 10
D
Surplus
Such as: Minimum Wage Agricultural Price Supports
The price has to be IN the house. It can’t be below the floor.
Some call agricultural price
supports “udder insanity.”
Price Floor-minimum price
QS exceeds QD
Millions of gallons per month
$3 P
rice p
er
gallo
n Equilibrium price for milk
[“When the G runs the economy, it turns everything upside down.”]
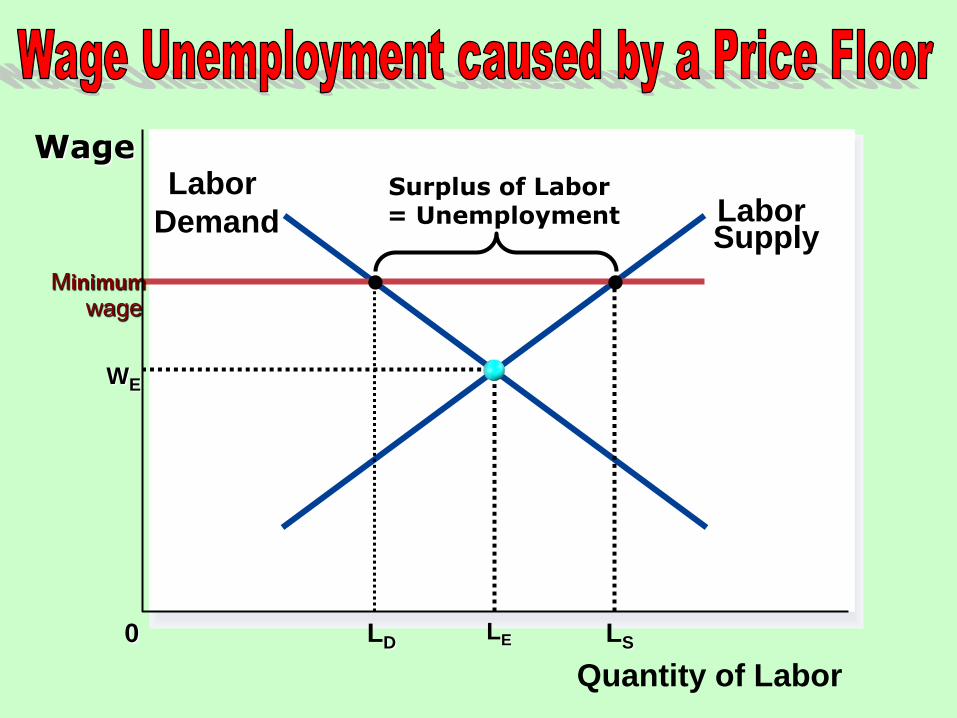
Quantity of Labor
0
Labor Supply
Minimum
wage
LD LS
WE
LE
Surplus of Labor = Unemployment
Wage Labor
Demand
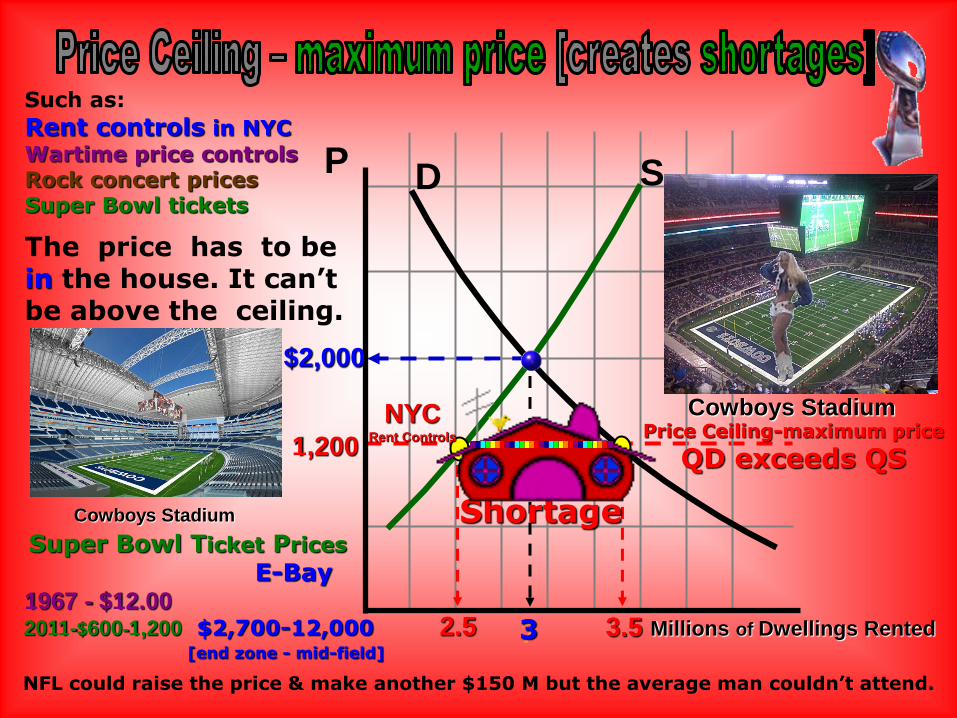
7
S P D
Shortage
Such as:
Rent controls in NYC
Wartime price controls Rock concert prices Super Bowl tickets
The price has to be in the house. It can’t be above the ceiling.
Super Bowl Ticket Prices
E-Bay 1967 - $12.00
2011-$600-1,200 $2,700-12,000 [end zone - mid-field]
NFL could raise the price & make another $150 M but the average man couldn’t attend.
2.5 3
Price Ceiling-maximum price
QD exceeds QS
Millions of Dwellings Rented
$2,000
1,200
3.5
NYC Rent Controls
Cowboys Stadium
Cowboys Stadium
Price Floor [ Minimum Price]
In Economics, Floors Are Above Ceilings
Price Ceiling [ Maximum Price]
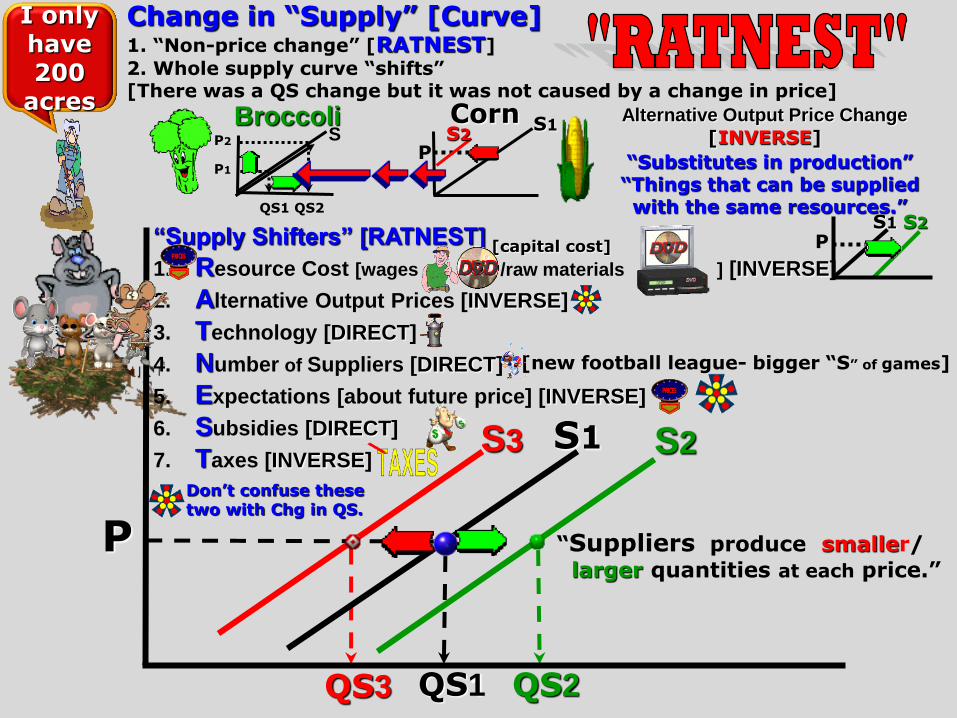
“Supply Shifters” [RATNEST]
1. Resource Cost [wages /raw materials ] [INVERSE]
2. Alternative Output Prices [INVERSE]
3. Technology [DIRECT]
4. Number of Suppliers [DIRECT]
5. Expectations [about future price] [INVERSE]
6. Subsidies [DIRECT]
7. Taxes [INVERSE]
QS1 QS2
Change in “Supply” [Curve] 1. “Non-price change” [RATNEST]
2. Whole supply curve “shifts” [There was a QS change but it was not caused by a change in price]
.
Broccoli
“Suppliers produce smaller/
larger quantities at each price.”
“Substitutes in production” “Things that can be supplied with the same resources.”
I only have 200
acres
S1
S Corn S1
P S2
Alternative Output Price Change
[INVERSE]
QS1
P2
P1
P S1 S2
[new football league- bigger “S” of games]
Don’t confuse these two with Chg in QS.
QS2 QS3
S3 S2
P
[capital cost]

Four Possibilities
D1 D2 S
A B
C D
Increase in
supply of gas
Slide Rule After introduction
of calculator
S D1
D2
[TIMER]
[RATNEST]
“D” for flag after 9/11
“Increase in Demand” “Decrease in Demand”
“Increase in Supply” “Decrease in Suppy”
Decrease in “S” of gas
D P Q D P Q
S Q P P S Q D
S1
D
S1
S2
$1.85
$1.00
Q1 Q2 Q2 Q1
$1.85
S2 $1.00
P2
P1 P1
P2
Q1 Q2 Q2 Q1
After “Looking For Nemo”
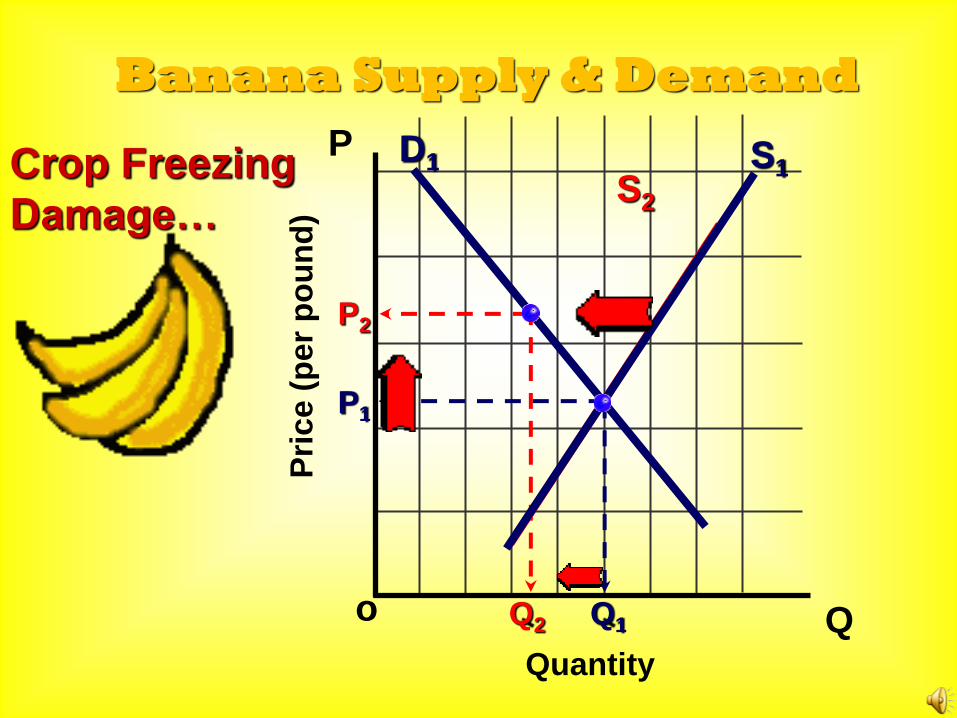
Banana Supply & Demand Q o
D1
Quantity
Pri
ce (
per
po
un
d)
S1 S2
P
Q1 Q2
P1
P2
Crop Freezing
Damage…
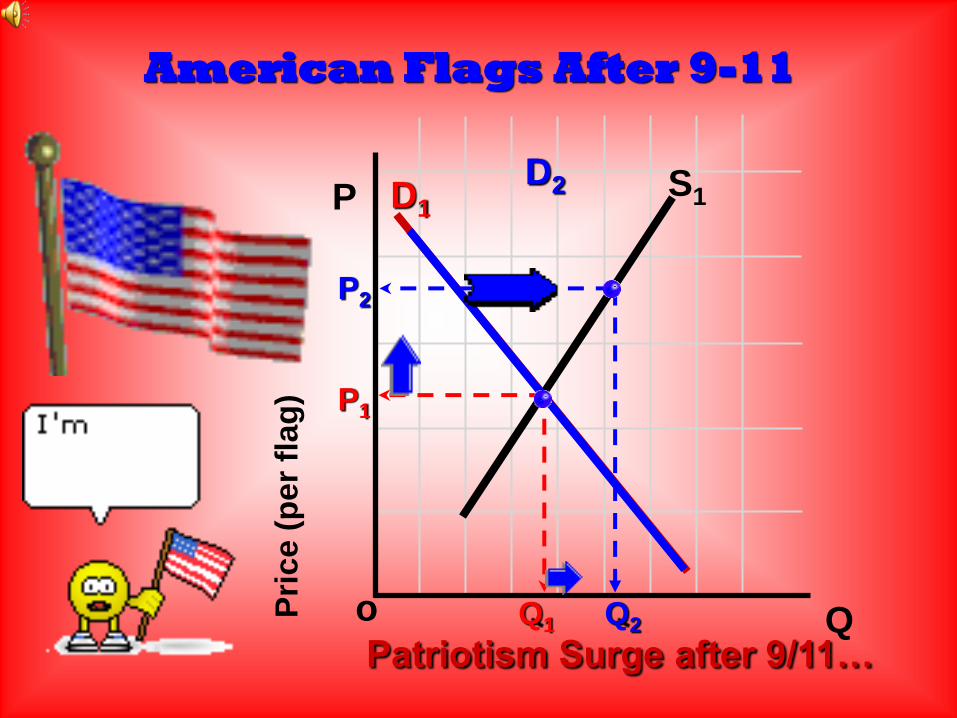
Patriotism Surge after 9/11…
American Flags After 9-11
Q o
D1
Pri
ce
(p
er
flag
)
S1 P
Q1 Q2
P1
P2
D2
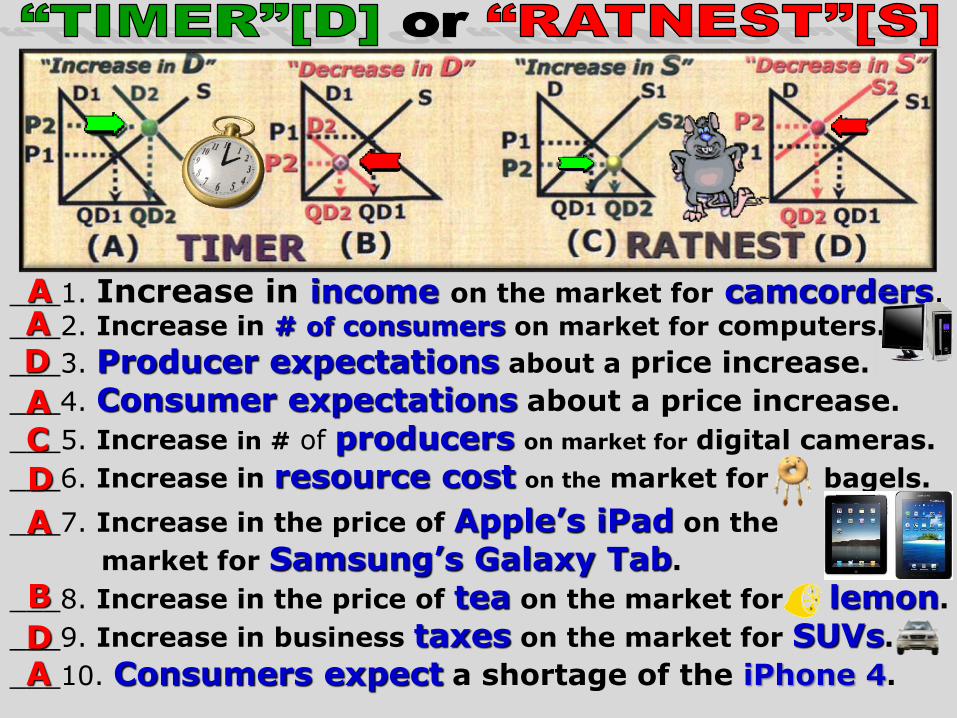
___1. Increase in income on the market for camcorders. ___2. Increase in # of consumers on market for computers.
___3. Producer expectations about a price increase.
___4. Consumer expectations about a price increase.
___5. Increase in # of producers on market for digital cameras.
___6. Increase in resource cost on the market for bagels.
___7. Increase in the price of Apple’s iPad on the
market for Samsung’s Galaxy Tab.
___8. Increase in the price of tea on the market for lemon.
___9. Increase in business taxes on the market for SUVs.
___10. Consumers expect a shortage of the iPhone 4.
A A D
A C
D
A
B
D A
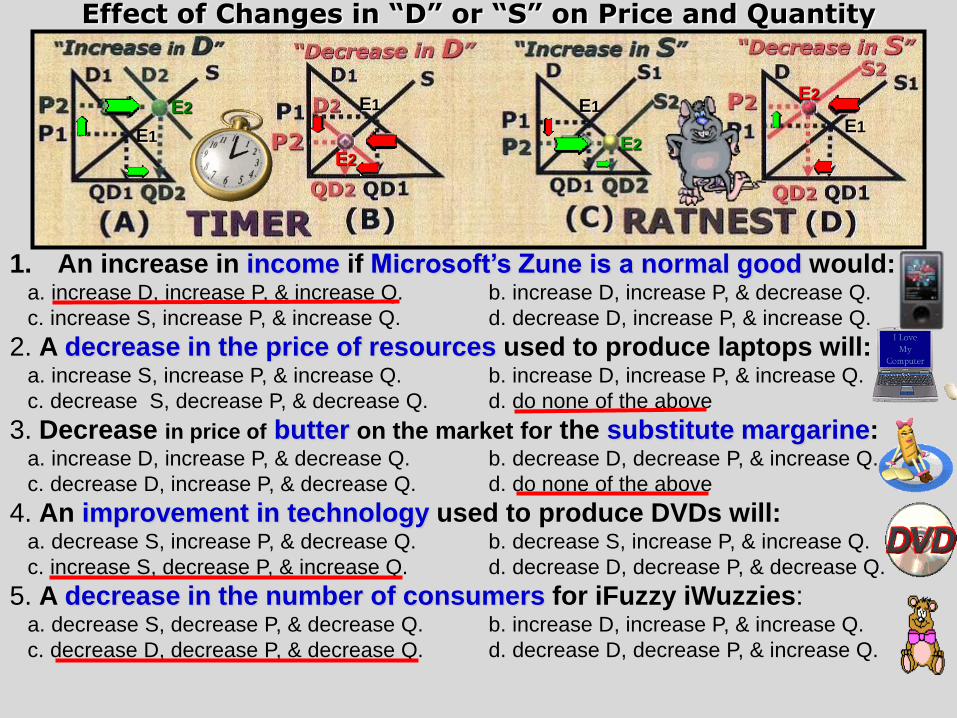
1. An increase in income if Microsoft’s Zune is a normal good would: a. increase D, increase P, & increase Q. b. increase D, increase P, & decrease Q.
c. increase S, increase P, & increase Q. d. decrease D, increase P, & increase Q.
2. A decrease in the price of resources used to produce laptops will: a. increase S, increase P, & increase Q. b. increase D, increase P, & increase Q.
c. decrease S, decrease P, & decrease Q. d. do none of the above
3. Decrease in price of butter on the market for the substitute margarine: a. increase D, increase P, & decrease Q. b. decrease D, decrease P, & increase Q.
c. decrease D, increase P, & decrease Q. d. do none of the above
4. An improvement in technology used to produce DVDs will: a. decrease S, increase P, & decrease Q. b. decrease S, increase P, & increase Q.
c. increase S, decrease P, & increase Q. d. decrease D, decrease P, & decrease Q.
5. A decrease in the number of consumers for iFuzzy iWuzzies: a. decrease S, decrease P, & decrease Q. b. increase D, increase P, & increase Q.
c. decrease D, decrease P, & decrease Q. d. decrease D, decrease P, & increase Q.
Effect of Changes in “D” or “S” on Price and Quantity
E1
E2 E1
E2
E1
E2
E2
E1
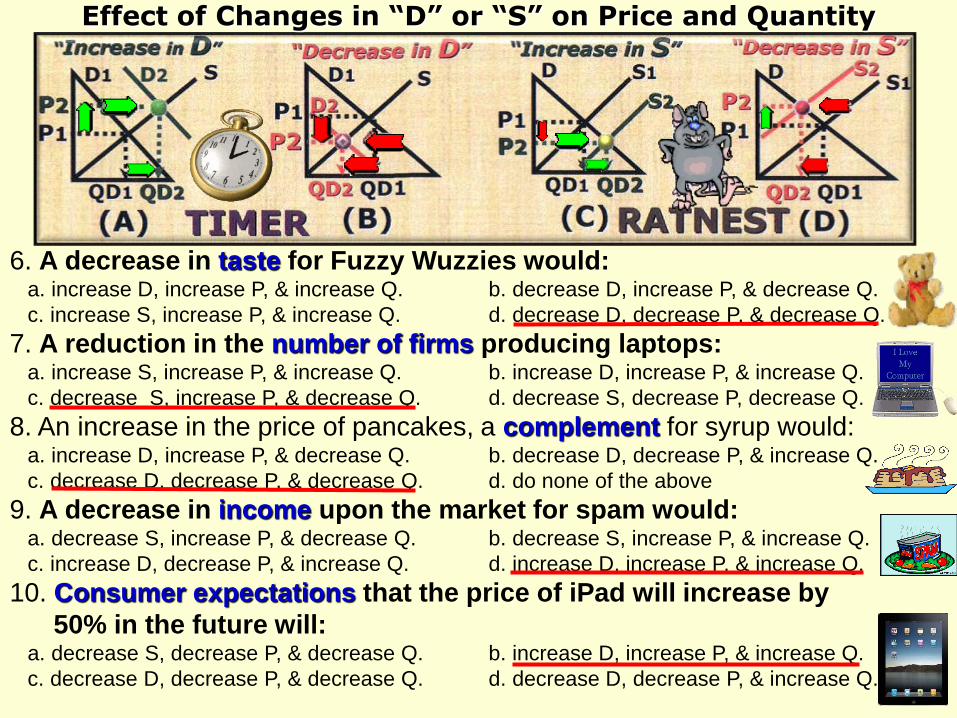
6. A decrease in taste for Fuzzy Wuzzies would: a. increase D, increase P, & increase Q. b. decrease D, increase P, & decrease Q.
c. increase S, increase P, & increase Q. d. decrease D, decrease P, & decrease Q.
7. A reduction in the number of firms producing laptops: a. increase S, increase P, & increase Q. b. increase D, increase P, & increase Q.
c. decrease S, increase P, & decrease Q. d. decrease S, decrease P, decrease Q.
8. An increase in the price of pancakes, a complement for syrup would: a. increase D, increase P, & decrease Q. b. decrease D, decrease P, & increase Q.
c. decrease D, decrease P, & decrease Q. d. do none of the above
9. A decrease in income upon the market for spam would: a. decrease S, increase P, & decrease Q. b. decrease S, increase P, & increase Q.
c. increase D, decrease P, & increase Q. d. increase D, increase P, & increase Q.
10. Consumer expectations that the price of iPad will increase by
50% in the future will: a. decrease S, decrease P, & decrease Q. b. increase D, increase P, & increase Q.
c. decrease D, decrease P, & decrease Q. d. decrease D, decrease P, & increase Q.
Effect of Changes in “D” or “S” on Price and Quantity
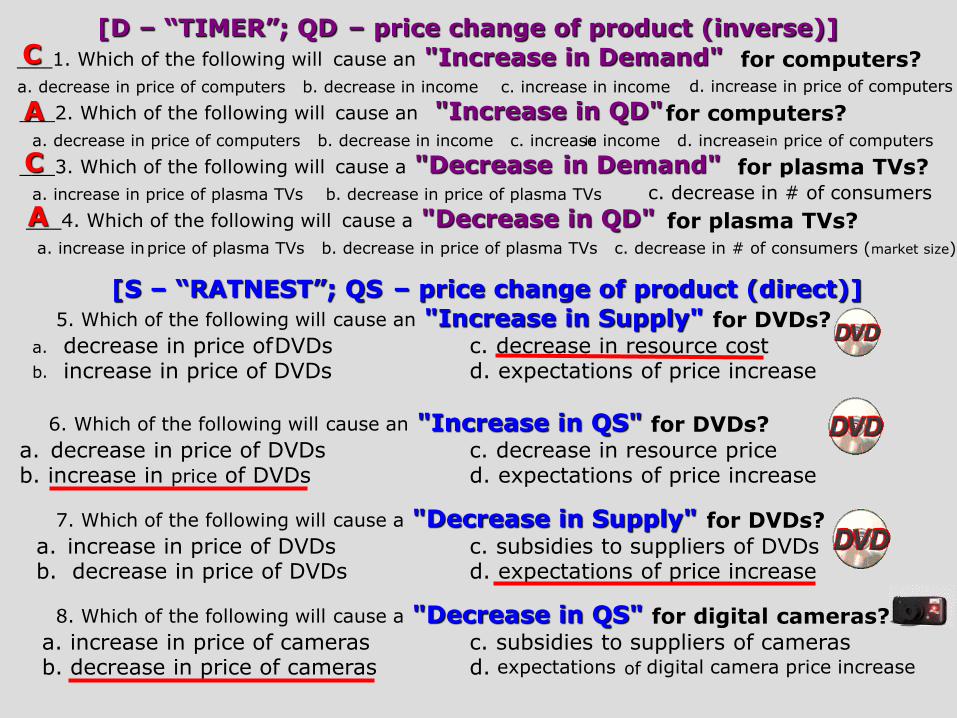
[D – “TIMER”; QD – price change of product (inverse)]
___1. Which of the following will cause an "Increase in Demand" for computers? a. decrease in price of computers b. decrease in income c. increase in income d. increase in the price of compu ters
___2. Which of the following will cause an "Increase in QD" for computers?
a. decrease in price of computers b. decrease in income c. increase in income d. increase in price of computers
___3. Which of the following will cause a "Decrease in Demand" for plasma TVs? a. increase in price of plasma TVs b. decrease in price of plasma TVs c. decrease in # of consum ers(marketsize)
___4. Which of the following will cause a "Decrease in QD" for plasma TVs? a. increase in price of plasma TVs b. decrease in price of plasma TVs c. decrease in # of consumers (market size)
[S – “RATNEST”; QS – price change of product (direct)] 5. Which of the following will cause an "Increase in Supply" for DVDs?
a. decrease in price of DVDs c. decrease in resource cost b. increase in price of DVDs d. expectations of price increase
6. Which of the following will cause an "Increase in QS" for DVDs?
a. decrease in price of DVDs c. decrease in resource price b. increase in pric e of DVDs d. expectations of price increase
7. Which of the following will cause a "Decrease in Supply" for DVDs?
a. increase in price of DVDs c. subsidies to suppliers of DVDs b. decrease in price of DVDs d. expectations of price increase
8. Which of the following will cause a "Decrease in QS" for digital cameras?
a. increase in price of cameras c. subsidies to suppliers of cameras b. decrease in price of cameras d. expectations of digital camera price increase
C
A
C
A
d. increase in price of computers
c. decrease in # of consumers
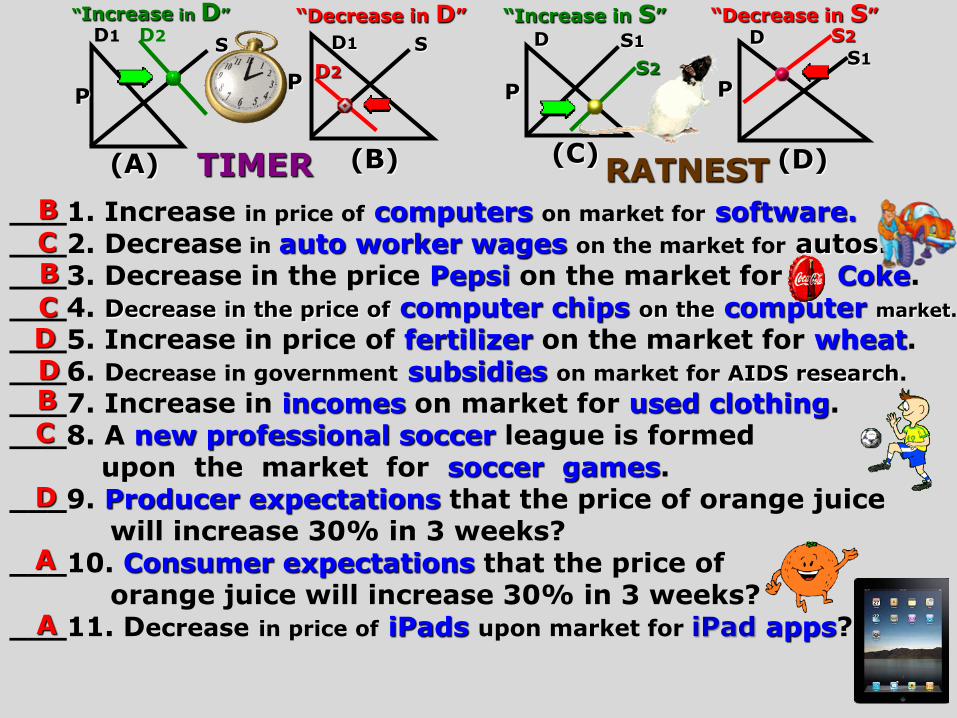
“Increase in D” “Decrease in D” “Increase in S” “Decrease in S”
___1. Increase in price of computers on market for software. ___2. Decrease in auto worker wages on the market for autos. ___3. Decrease in the price Pepsi on the market for Coke. ___4. Decrease in the price of computer chips on the computer market.
___5. Increase in price of fertilizer on the market for wheat. ___6. Decrease in government subsidies on market for AIDS research.
___7. Increase in incomes on market for used clothing. ___8. A new professional soccer league is formed upon the market for soccer games. ___9. Producer expectations that the price of orange juice will increase 30% in 3 weeks? ___10. Consumer expectations that the price of orange juice will increase 30% in 3 weeks? ___11. Decrease in price of iPads upon market for iPad apps?
B C
C D D
C
D
A
B
B
D1 D2
(A) (B) (C) (D)
D1
D2
S S S1 S1
S2
S2 D D
TIMER RATNEST
P P P P
A
Before taking the
Demand [TIMER]
v.
Supply [RATNEST] Quiz,
let’s review what the non-price
TIMER Shifters and non-price
RATNEST Shifters are.
Quantity
P D1
[caused by “TIMER”]
D2
QD1
QD2
“D” is a whole bunch of QD’s strung together.
6
5
4
3
2
1
0
Quantity Supplied (bushels per week)
Pri
ce (
per
bu
sh
el)
P Qs
$5
4
3
2
1
60
50
35
20
5
Individual
Supply
P
Q
S1
S2
S3
2 4 6 8 10 12 14
Change in Supply [“RATNEST”]
1. Decrease in resource cost[inverse] 2. *Alt. output price decrease[inverse] 3. Technological change [direct] 4. Increase in # of suppliers [direct] 5. *Producer exp. of price decrease[inverse]
6. Increase in subsidies [direct] 7. Decrease in taxes [inverse]
1. Increase in resource cost 2. *Alt. output price increase 3. Technological decrease 4. Decrease in # of suppliers 5. *Producer exp. of price increase 6. Decrease in subsidies 7. Increase in taxes
“S” is a whole bunch of
QS’s strung together.

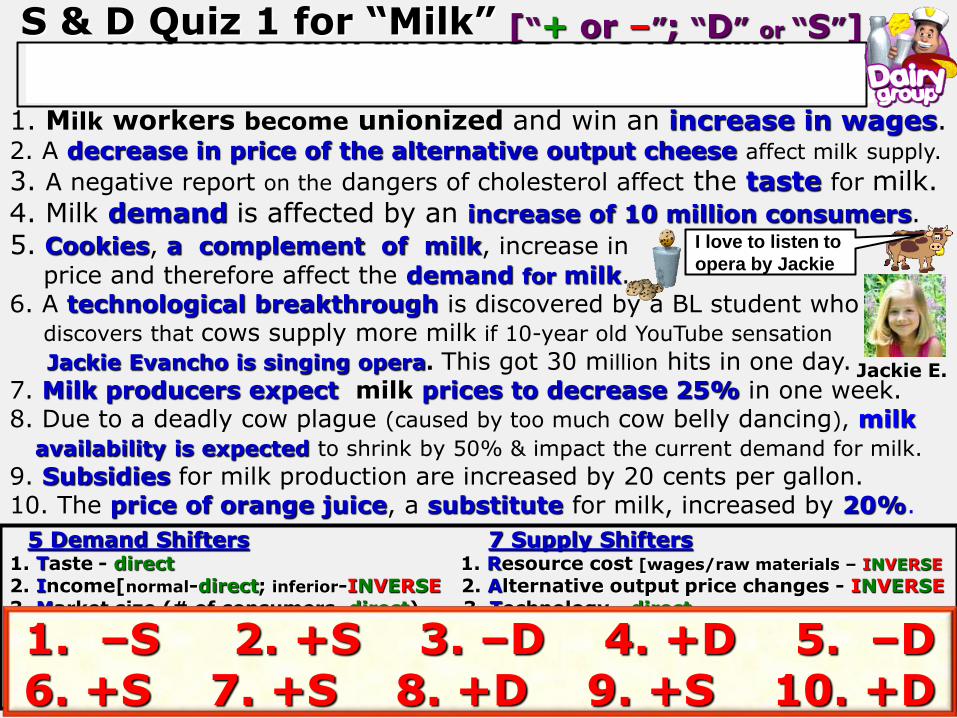
1. Milk workers become unionized and win an increase in wages. 2. A decrease in price of the alternative output cheese affect milk supply.
3. A negative report on the dangers of cholesterol affect the taste for milk. 4. Milk demand is affected by an increase of 10 million consumers.
5. Cookies, a complement of milk, increase in
price and therefore affect the demand for milk. 6. A technological breakthrough is discovered by a BL student who discovers that cows supply more milk if 10-year old YouTube sensation
Jackie Evancho is singing opera. This got 30 million hits in one day. 7. Milk producers expect milk prices to decrease 25% in one week. 8. Due to a deadly cow plague (caused by too much cow belly dancing), milk availability is expected to shrink by 50% & impact the current demand for milk.
9. Subsidies for milk production are increased by 20 cents per gallon. 10. The price of orange juice, a substitute for milk, increased by 20%.
S & D Quiz 1 for “Milk”
5 Demand Shifters 7 Supply Shifters 1. Taste - direct 1. Resource cost [wages/raw materials – INVERSE
2. Income[normal-direct; inferior-INVERSE 2. Alternative output price changes - INVERSE 3. Market size (# of consumers–direct) 3. Technology - direct 4. Expectations(Consumer) availability-INVERSE 4. Number of suppliers - direct
future income-direct; future price-direct 5. Expectations[producer] about future price-INVERSE
5. Related good price changes 6. Subsidies - direct [substitutes-direct; complements-INVERSE 7. Taxes - INVERSE
1. –S 2. +S 3. –D 4. +D 5. –D 6. +S 7. +S 8. +D 9. +S 10. +D
[“+ or –”; “D” or “S”]
I love to listen to
opera by Jackie
Jackie E.
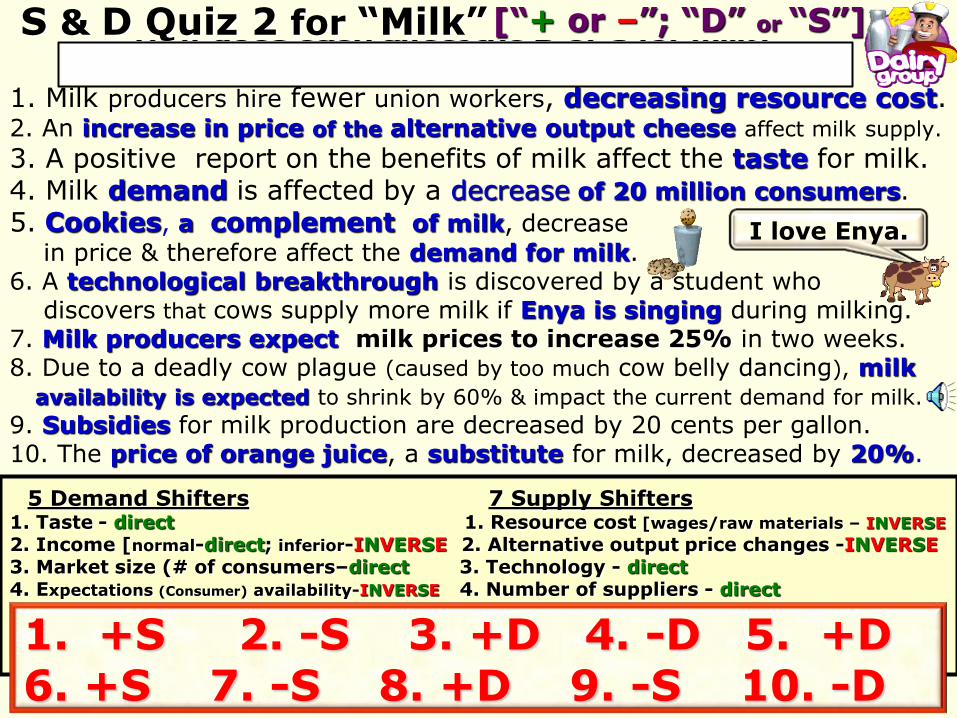
S & D Quiz 2 for “Milk”
1. Milk producers hire fewer union workers, decreasing resource cost. 2. An increase in price of the alternative output cheese affect milk supply.
3. A positive report on the benefits of milk affect the taste for milk. 4. Milk demand is affected by a decrease of 20 million consumers.
5. Cookies, a complement of milk, decrease
in price & therefore affect the demand for milk. 6. A technological breakthrough is discovered by a student who discovers that cows supply more milk if Enya is singing during milking. 7. Milk producers expect milk prices to increase 25% in two weeks. 8. Due to a deadly cow plague (caused by too much cow belly dancing), milk availability is expected to shrink by 60% & impact the current demand for milk.
9. Subsidies for milk production are decreased by 20 cents per gallon. 10. The price of orange juice, a substitute for milk, decreased by 20%.
5 Demand Shifters 7 Supply Shifters 1. Taste - direct 1. Resource cost [wages/raw materials – INVERSE
2. Income [normal-direct; inferior-INVERSE 2. Alternative output price changes -INVERSE 3. Market size (# of consumers–direct 3. Technology - direct 4. Expectations (Consumer) availability-INVERSE 4. Number of suppliers - direct future income-direct; future price-direct; 5. Expectations[producer] about future price-INVERSE
5. Related good price changes 6. Subsidies - direct [substitutes-direct; complements-INVERSE 7. Taxes - INVERSE 1. +S 2. -S 3. +D 4. -D 5. +D 6. +S 7. -S 8. +D 9. -S 10. -D
I love Enya.
[“+ or –”; “D” or “S”]

Review for
Demand & Supply
“You da man”

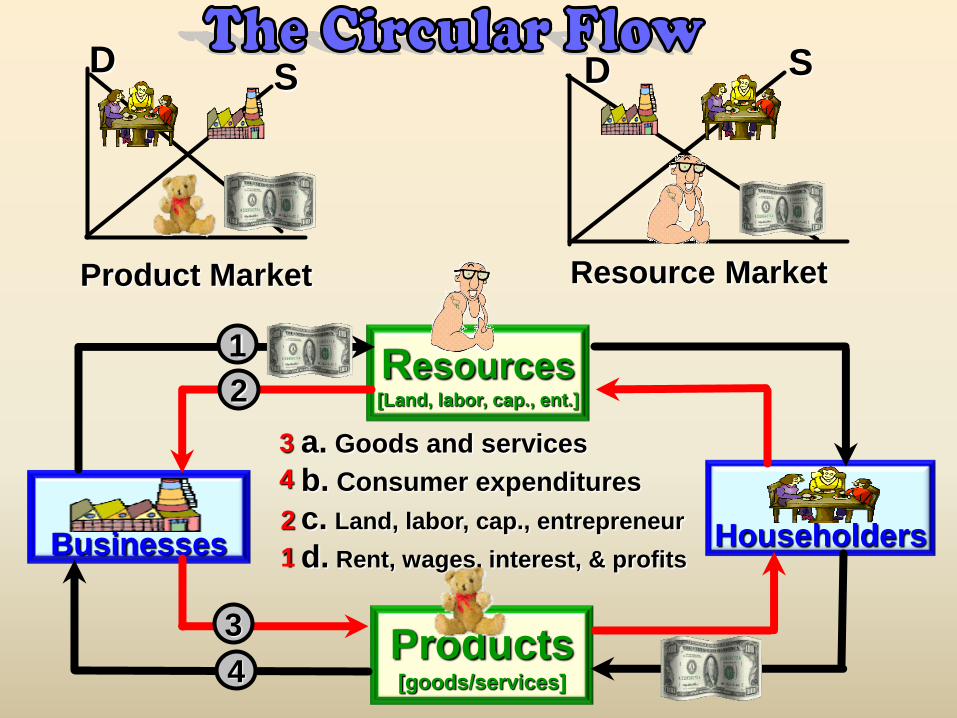
Businesses
Householders
Products [goods/services]
Resources [Land, labor, cap., ent.]
a. Goods and services
b. Consumer expenditures
c. Land, labor, cap., entrepreneur
d. Rent, wages, interest, & profits
1
2
3
4
3
4
2
1
D S
Product Market Resource Market
D S

The “Gangsta Car”
Businesses
Product Market
Resource Market
Which flow represents? A. Consumer expenditures?
B. Goods and services?
C. Land, labor, capital, and
entrepreneurial ability?
D. Rent, wages, interest,
and profits? Households
3
4
2 1 4
3
Labor for “Gangsta Cars”
Chrysler300 “Gangsta Car
2
BusinessesBusinessesBusinesses
Chrysler Plant
1
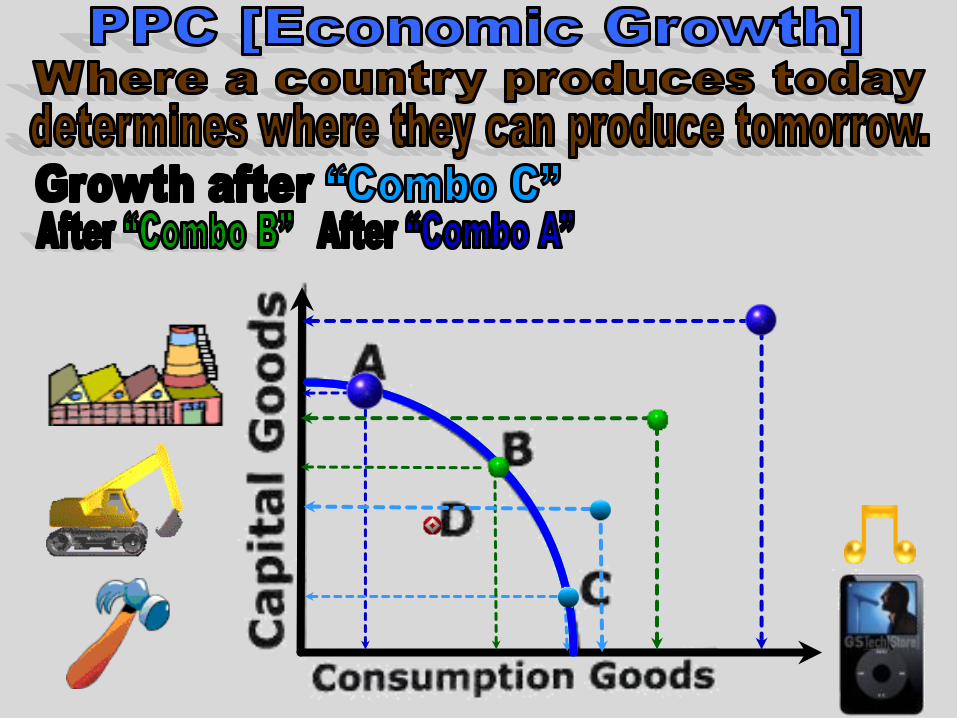
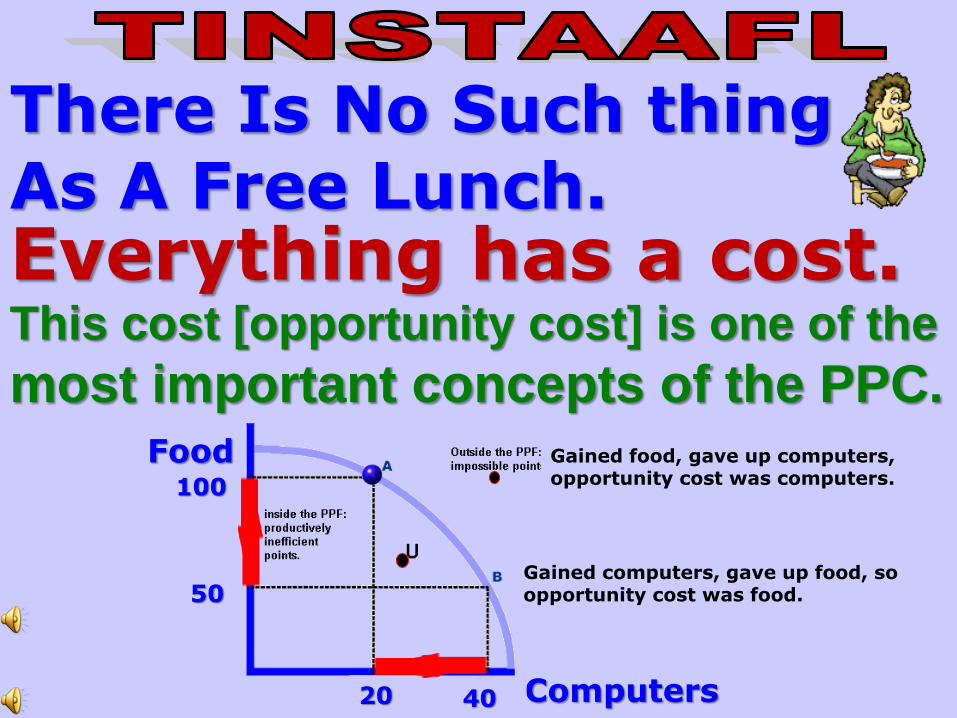
There Is No Such thing As A Free Lunch. Everything has a cost. This cost [opportunity cost] is one of the
most important concepts of the PPC. Food
Computers
100
40
50
20
Gained food, gave up computers, opportunity cost was computers.
Gained computers, gave up food, so opportunity cost was food.
Consumption Goods
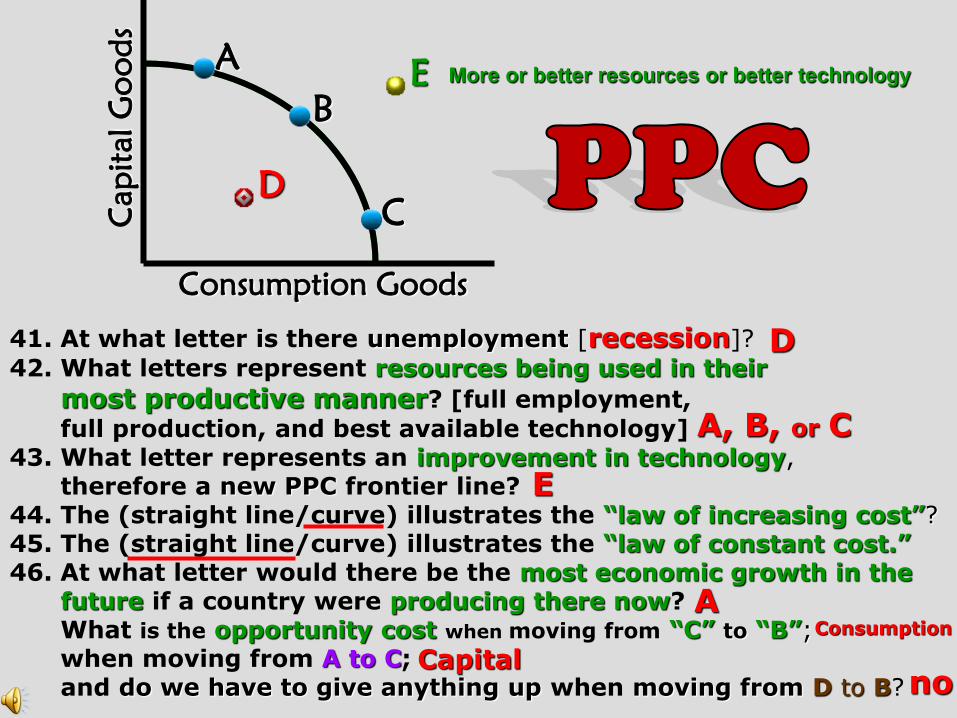
41. At what letter is there unemployment [recession]?
42. What letters represent resources being used in their
most productive manner? [full employment,
full production, and best available technology] 43. What letter represents an improvement in technology, therefore a new PPC frontier line? 44. The (straight line/curve) illustrates the “law of increasing cost”? 45. The (straight line/curve) illustrates the “law of constant cost.” 46. At what letter would there be the most economic growth in the future if a country were producing there now? What is the opportunity cost when moving from “C” to “B”; when moving from A to C; and do we have to give anything up when moving from D to B?
D
A, B, or C
E
A Consumption
Capital no
D
A
B
C Capit
al G
oo
ds
E More or better resources or better technology
QD2 QD1
Price QD
Inverse relationship
$499.00
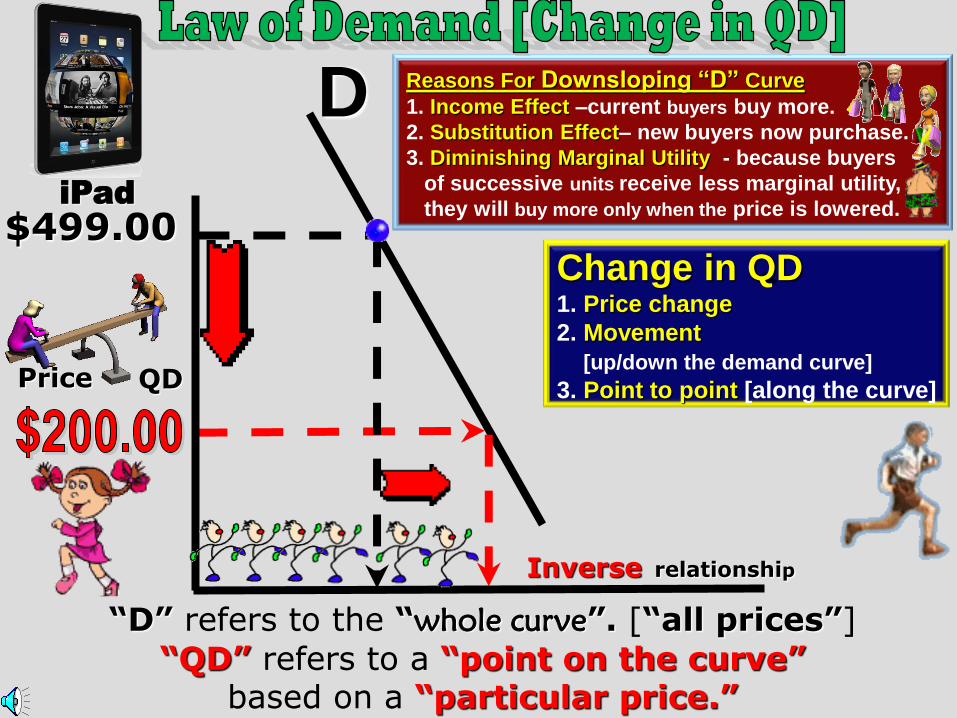
D Reasons For Downsloping “D” Curve
1. Income Effect –current buyers buy more.
2. Substitution Effect– new buyers now purchase.
3. Diminishing Marginal Utility - because buyers
of successive units receive less marginal utility,
they will buy more only when the price is lowered.
Change in QD 1. Price change
2. Movement
[up/down the demand curve]
3. Point to point [along the curve]
iPad
“D” refers to the “whole curve”. [“all prices”]
“QD” refers to a “point on the curve” based on a “particular price.”
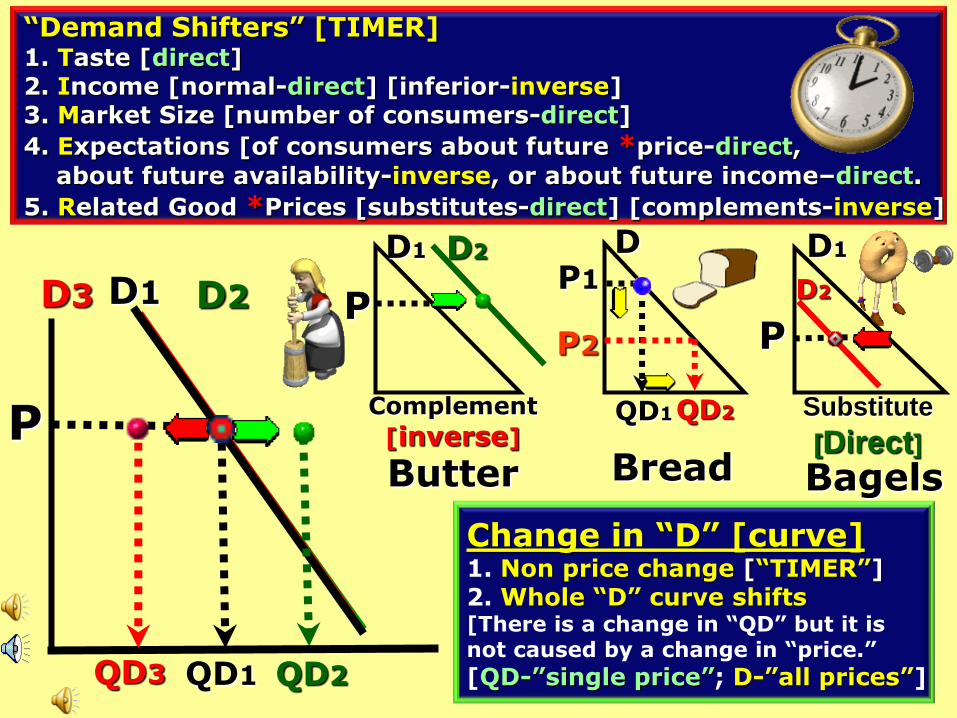
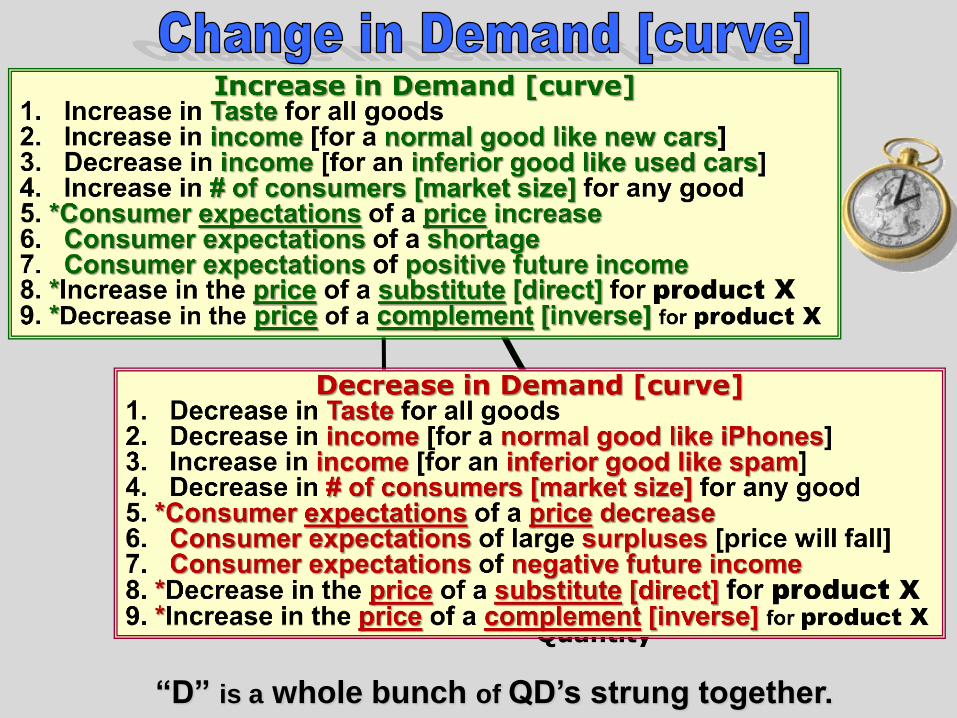
“Demand Shifters” [TIMER] 1. Taste [direct] 2. Income [normal-direct] [inferior-inverse] 3. Market Size [number of consumers-direct]
4. Expectations [of consumers about future *price-direct,
about future availability-inverse, or about future income–direct.
5. Related Good *Prices [substitutes-direct] [complements-inverse]
Change in “D” [curve] 1. Non price change [“TIMER”] 2. Whole “D” curve shifts [There is a change in “QD” but it is not caused by a change in “price.”
[QD-”single price”; D-”all prices”]
Complement
[inverse]
Substitute
[Direct] Butter Bread Bagels
P
D3 D1 D2
QD3 QD1 QD2
D1 D2
P P1
QD1
P2
D1
D2
D
P
QD2

D1 D2
P
QD1 QD2
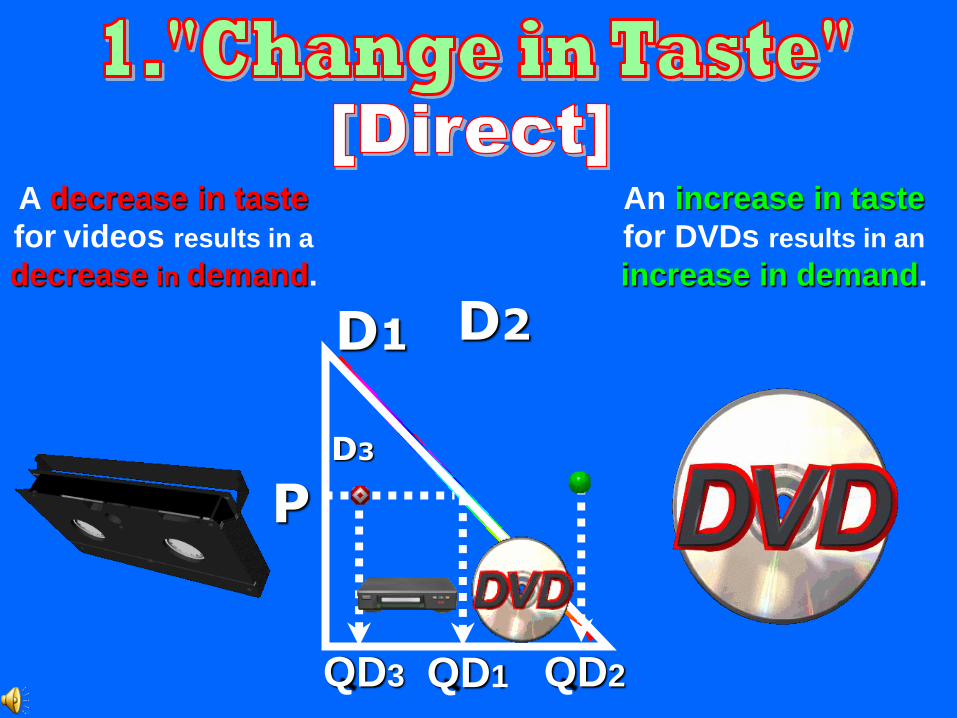
An increase in taste
for DVDs results in an
increase in demand.
A decrease in taste
for videos results in a
decrease in demand.
D3
QD3
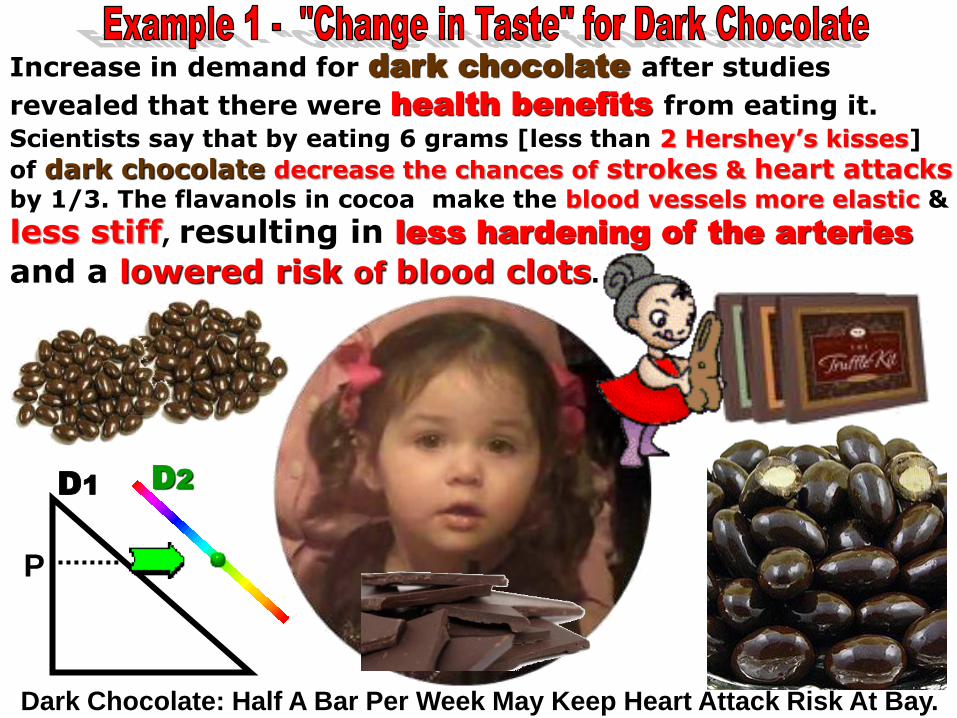
Increase in demand for dark chocolate after studies
revealed that there were health benefits from eating it. Scientists say that by eating 6 grams [less than 2 Hershey’s kisses]
of dark chocolate decrease the chances of strokes & heart attacks by 1/3. The flavanols in cocoa make the blood vessels more elastic &
less stiff, resulting in less hardening of the arteries
and a lowered risk of blood clots.
D1 D2
P
Dark Chocolate: Half A Bar Per Week May Keep Heart Attack Risk At Bay.
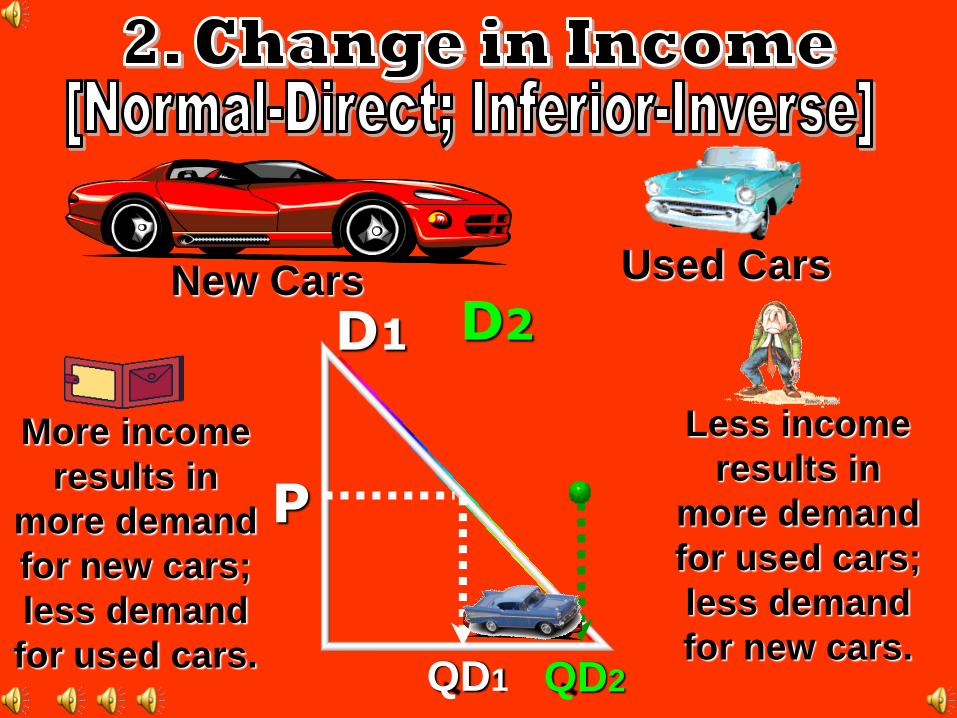
D1 D2
P
QD1 QD2
More income
results in
more demand
for new cars;
less demand
for used cars.
New Cars Used Cars
Less income
results in
more demand
for used cars;
less demand
for new cars.
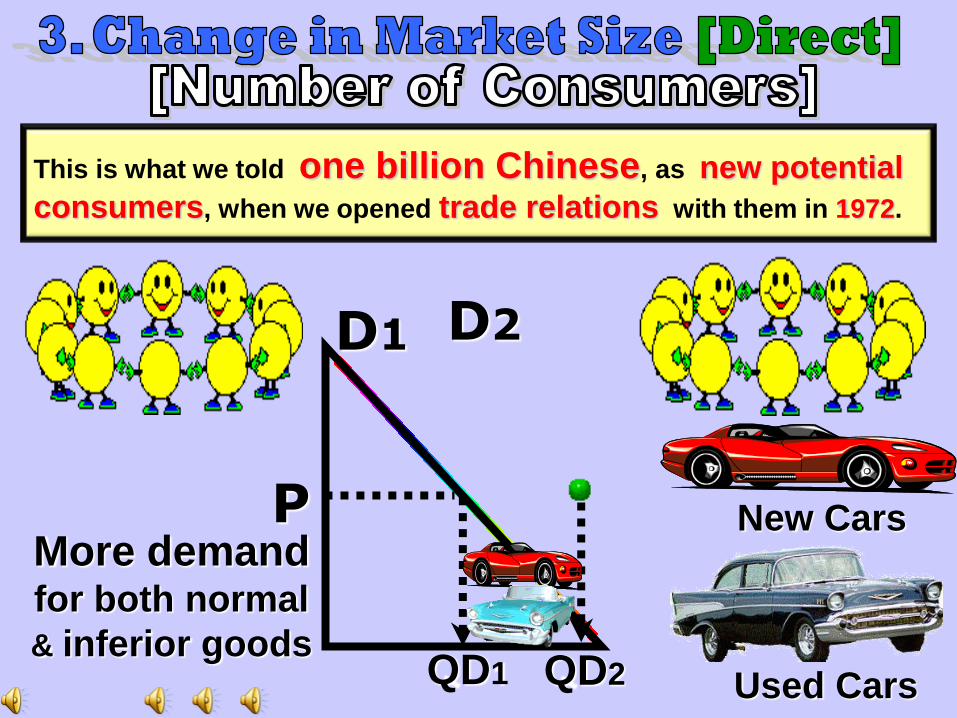
D1 D2
P
QD1 QD2
More demand for both normal
& inferior goods
New Cars
Used Cars
This is what we told one billion Chinese, as new potential
consumers, when we opened trade relations with them in 1972.
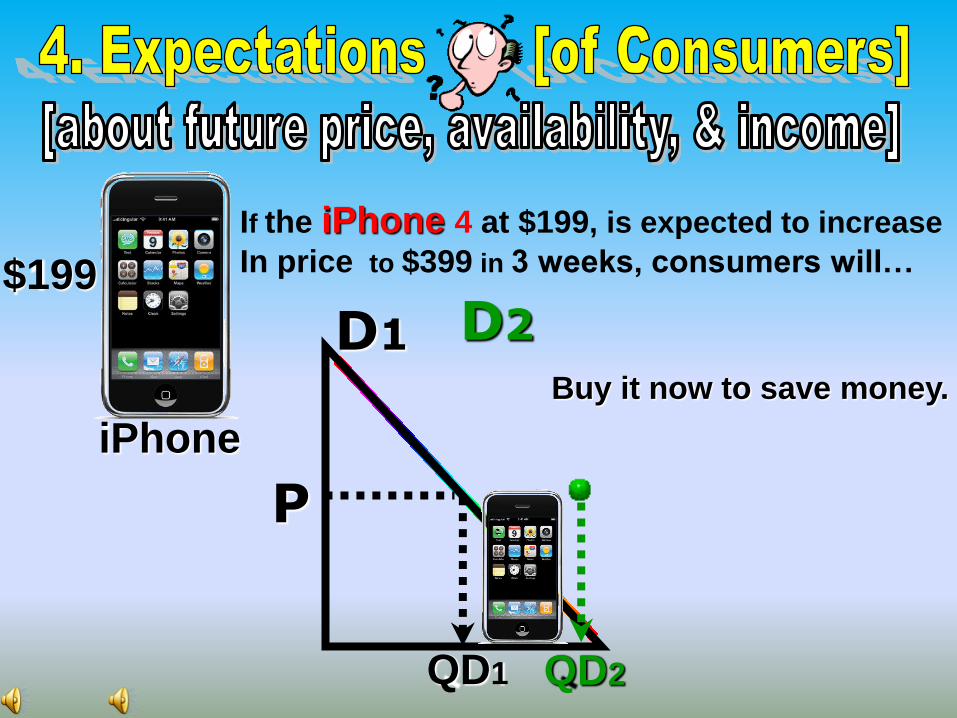
D1 D2
P
QD1 QD2
If the iPhone 4 at $199, is expected to increase
In price to $399 in 3 weeks, consumers will…
iPhone
$199
Buy it now to save money.
D1 D2
P
QD1 QD2
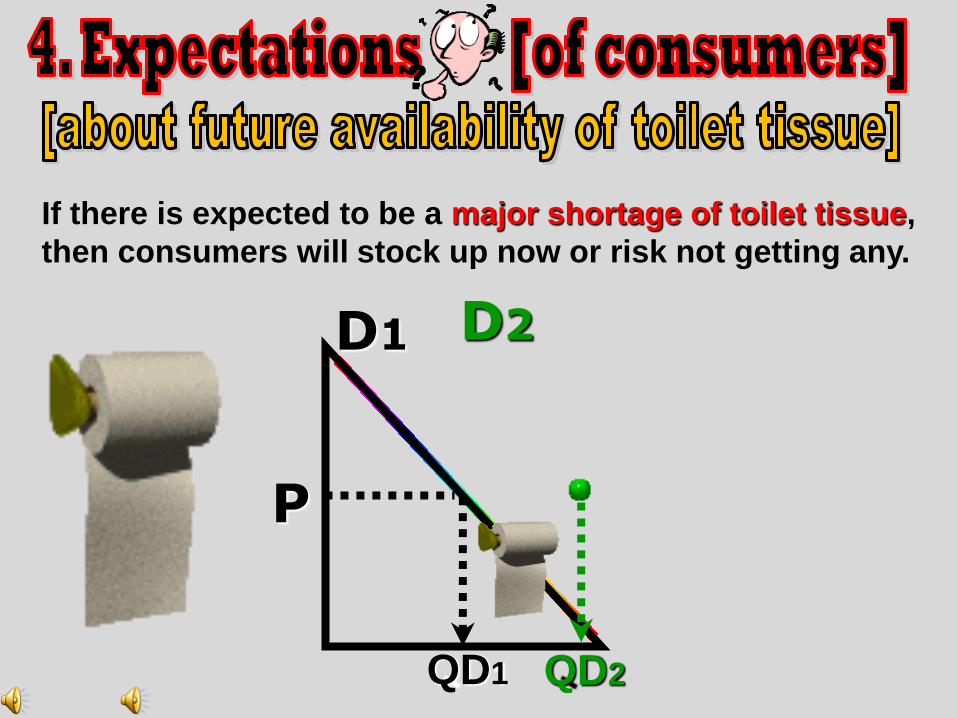
If there is expected to be a major shortage of toilet tissue,
then consumers will stock up now or risk not getting any.
D1 D2
P
QD1 QD2
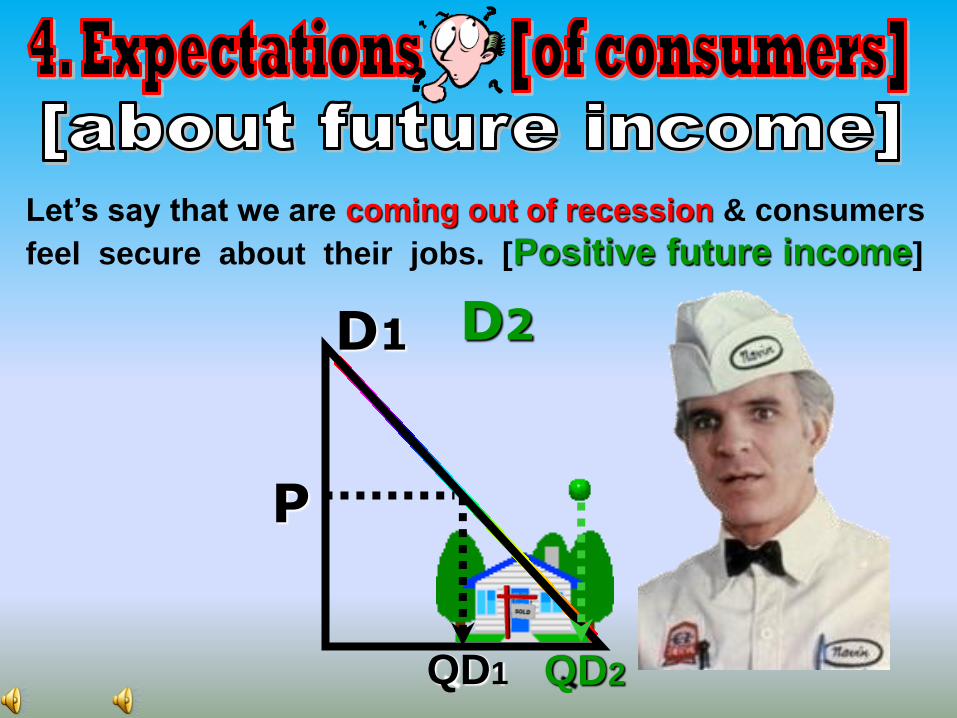
Let’s say that we are coming out of recession & consumers
feel secure about their jobs. [Positive future income]
D1
D2
P
QD1 QD2
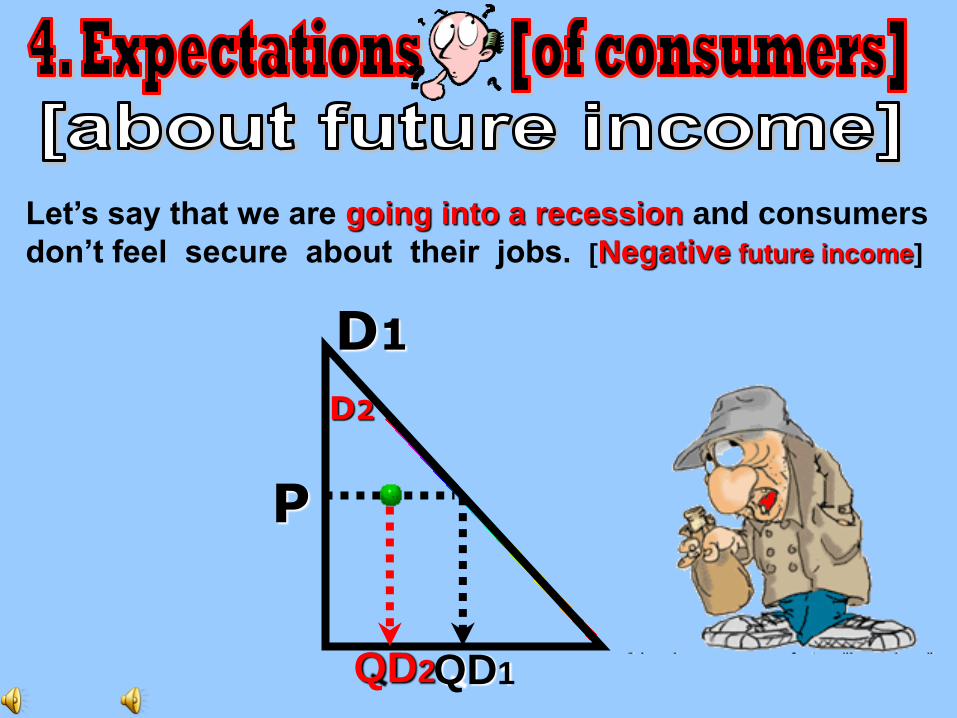
Let’s say that we are going into a recession and consumers
don’t feel secure about their jobs. [Negative future income]
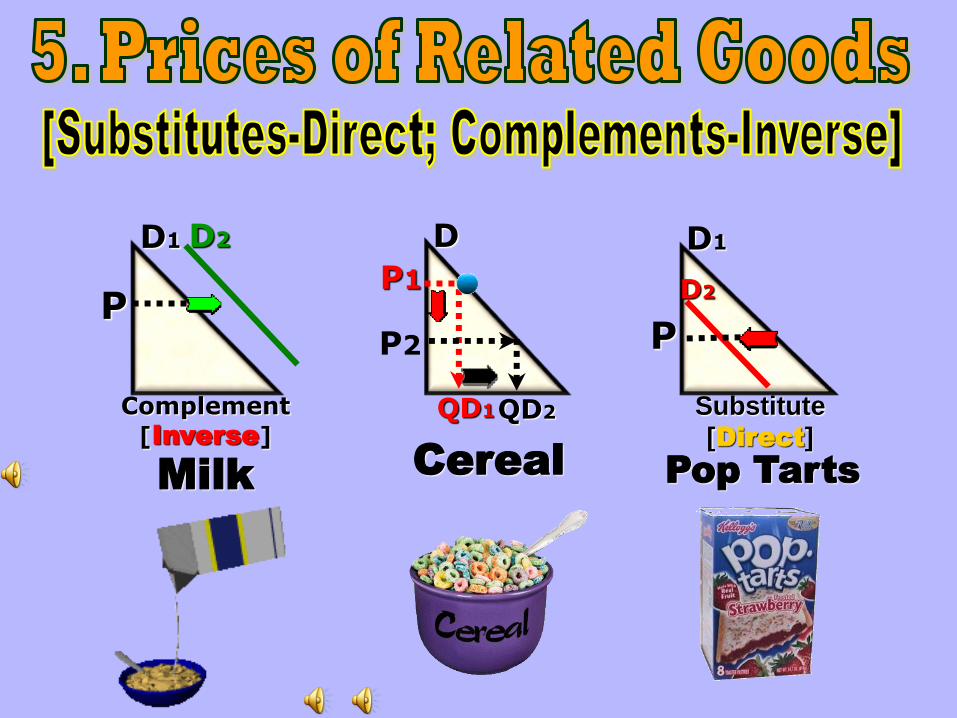
Complement
[Inverse]
Substitute [Direct]
Milk Cereal Pop Tarts
D1 D2
P P1
QD1
P2
D1
D2
D
P
QD2

1.Resource Cost [wages & raw materials] [Inverse]
Wages Raw Materials
Intel Pentium Chip
S
If resource cost
decreases supply
Increases [making more $]
If resource cost
increases supply
Decreases [making less $]
S S
P

P1
P1
QS1
Broccoli
“Substitutes in production”
I only have 200 acres S
Corn S1
P
S2
QS1
S1
P
S2
S Corn
Producers want to produce more of the good where price is increasing,
or at least, where the price is not going down.
Broccoli
P2
QS2
P2
QS2
These are “things that can be supplied with the same resources”.
S
Because cows produce more milk, farmers don’t have to have as many cows.[saves $]
S
P
We love these cow waterbeds because we get better
blood flow and can produce 30% more milk.
Supply curve
moves “udderly”
to the right.
Less skin abrasions so happier cows produce more milk.
Mooooove over and give me that waterbed.
Waterbedsforcows.com
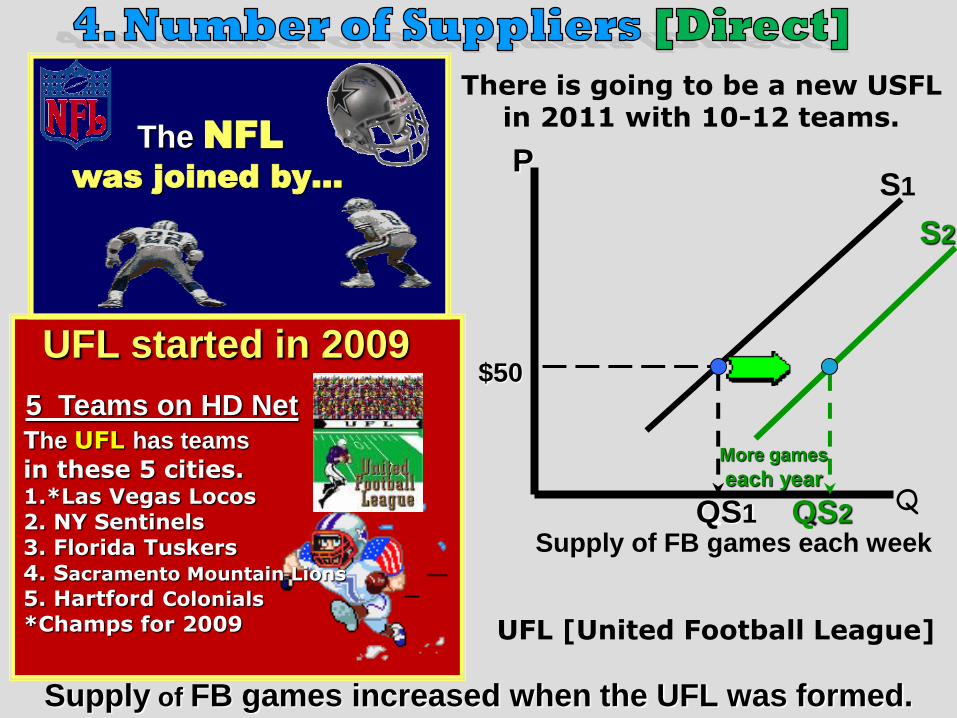
UFL started in 2009
The NFL
was joined by…
S1
P
Q
$50
Supply of FB games increased when the UFL was formed.
S2
QS1 QS2
The UFL has teams
in these 5 cities. 1.*Las Vegas Locos 2. NY Sentinels 3. Florida Tuskers 4. Sacramento Mountain Lions
5. Hartford Colonials
*Champs for 2009
Supply of FB games each week
UFL [United Football League]
5 Teams on HD Net
More games
each year
There is going to be a new USFL in 2011 with 10-12 teams.
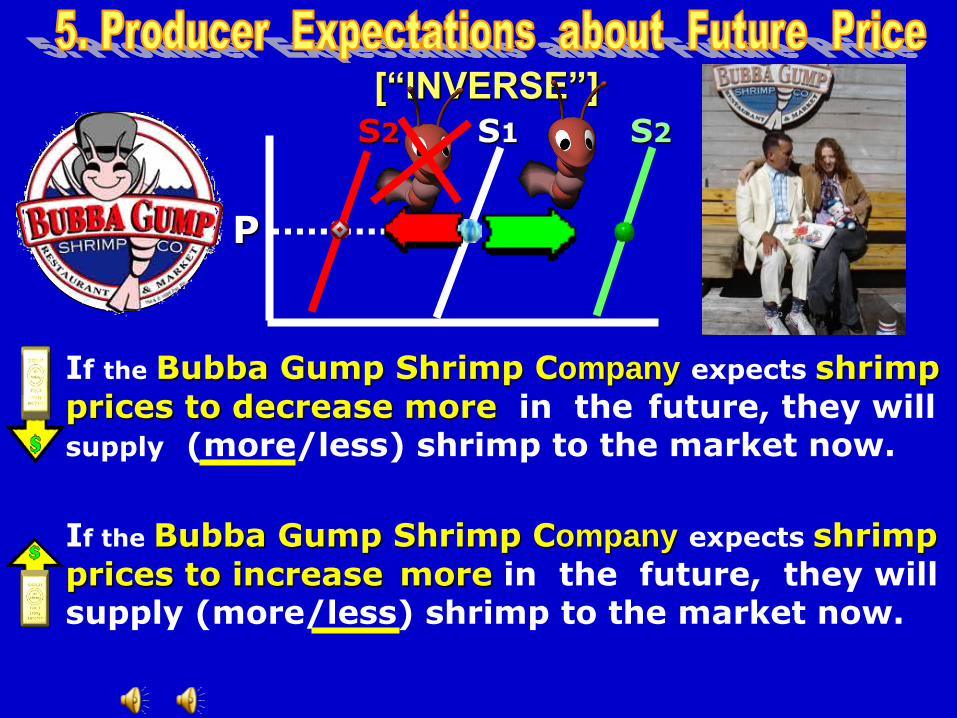
If the Bubba Gump Shrimp Company expects shrimp
prices to increase more in the future, they will supply (more/less) shrimp to the market now.
If the Bubba Gump Shrimp Company expects shrimp
prices to decrease more in the future, they will supply (more/less) shrimp to the market now.
S1
[“INVERSE”]
P
S2 S2
S3
[Direct]
P
Free money from the government (subsidies) induces suppliers to supply more.
S1 S2
If subsidies are taken away, then suppliers are
losing money and will decrease supply.
S3
[Inverse]
P
If business have their taxes decreased,
it moves the supply curve to the right.
S1 S2
If business have their taxes increased,
it moves the supply curve to the left.
I’m losing
profits.”

Price Floor [ Minimum Price]
Price Ceiling [ Maximum Price]
In Economics, Floors Are Above Ceilings
$100
$90
$80
$70
$60
$50
$40
$30
$20
$10
0
20 40 60 75 100 120 140 160 180 200 220
Quantity (units of any good or service)
70 175
120 =120
QD=QS
E
QD QS
QD QS
QS QD
QS QD
D S Price Floor Surplus
Price Ceiling Shortage
Dollar
Price
If QS>QD; Price Decreases
If QS<QD; Price Increases
If QD=QS; Price Stays Same
Four Possibilities
D1 D2 S
A B
C D
Increase in
supply of gas
Slide Rule After introduction
of calculator
S D1
D2
[TIMER]
[RATNEST]
“D” for flag after 9/11
“Increase in Demand” “Decrease in Demand”
“Increase in Supply” “Decrease in Suppy”
Decrease in “S” of gas
D P Q D P Q
S Q P P S Q D
S1
D
S1
S2
$1.85
$1.00
Q1 Q2 Q2 Q1
$1.85
S2 $1.00
P2
P1 P1
P2
Q1 Q2 Q2 Q1
After “Looking For Nemo”
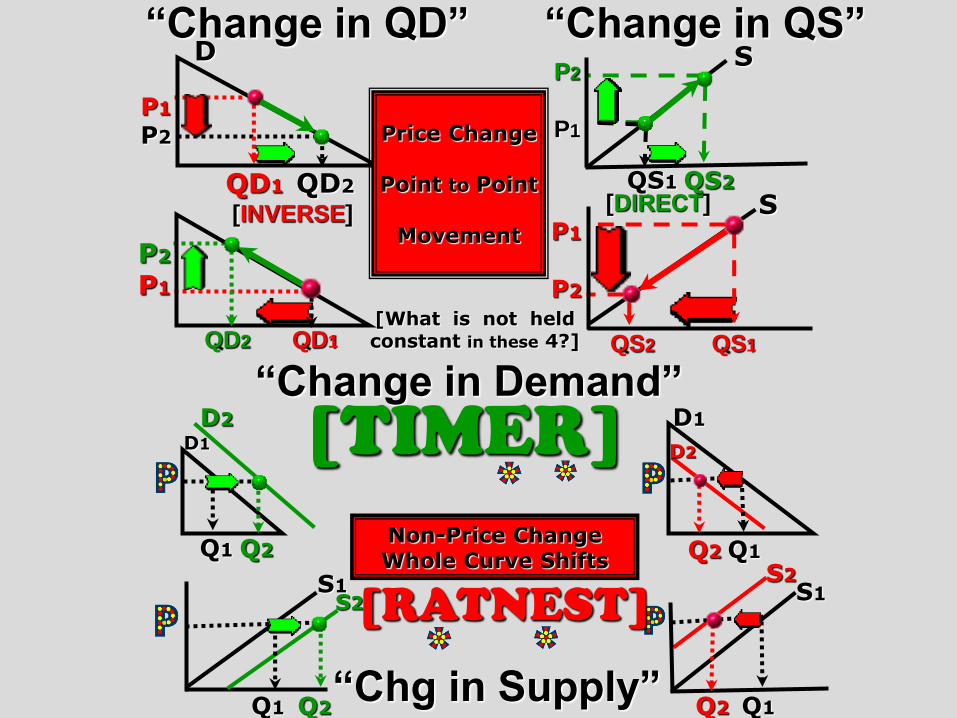
“Change in QD” “Change in QS”
“Change in Demand”
“Chg in Supply”
Non-Price Change Whole Curve Shifts
[What is not held constant in these 4?]
Price Change
Point to Point
Movement [INVERSE] [DIRECT]
P1
P2
P2
P1
QD1 QD2
D S
QD2 QD1
QS1 QS2
QS2 QS1
P1
P2
P2
P1
S
D1
D2 D1
D2
S1 S2
S2 S1
Q1 Q2 Q2 Q1
Q1 Q2 Q2 Q1
[TIMER]
[RATNEST]
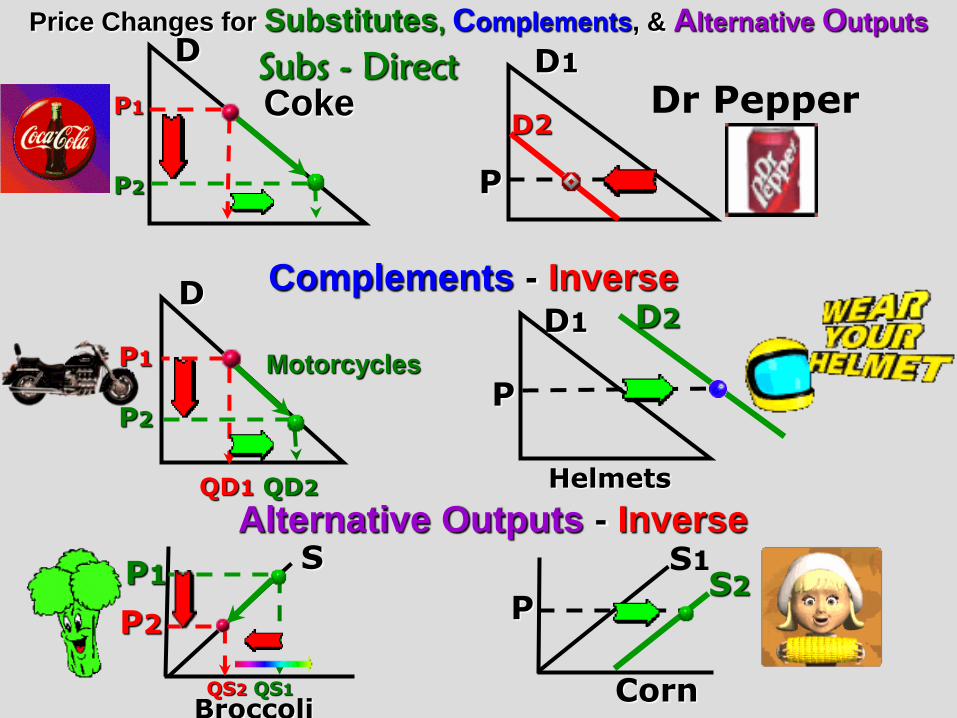
Price Changes for Substitutes, Complements, & Alternative Outputs
Subs - Direct
Dr Pepper
Complements - Inverse
Coke P1
P2
P1
P2
QD1 QD2
D
D D1
D2
D1 D2
Alternative Outputs - Inverse S S1
S2 P1
P2 P
QS2 QS1
Broccoli Corn
Helmets
Motorcycles
P
P
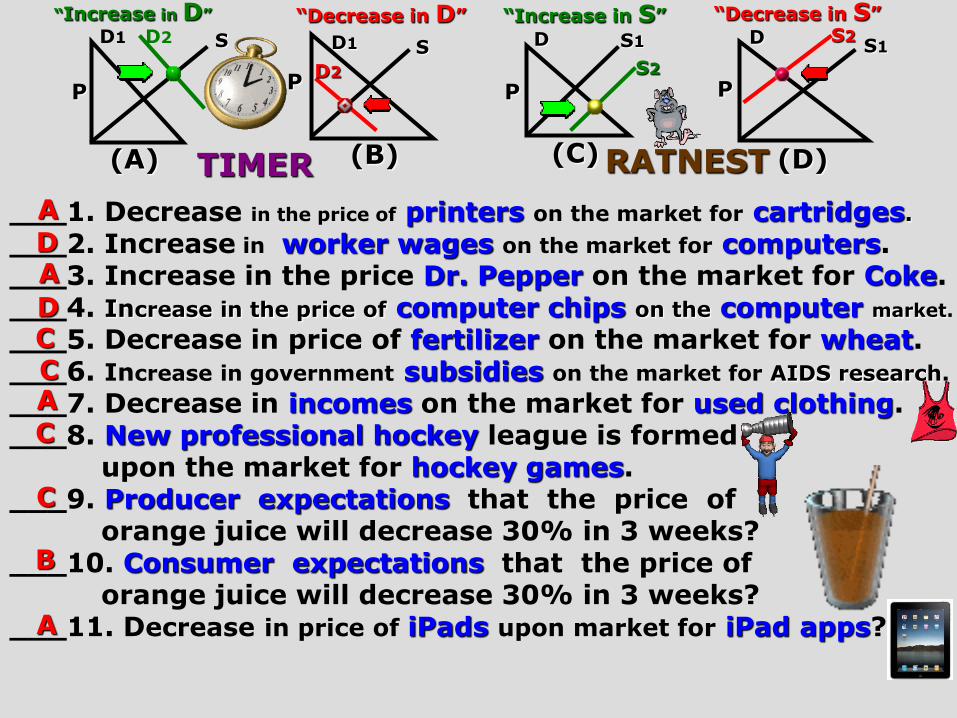
“Increase in D” “Decrease in D” “Increase in S” “Decrease in S”
___1. Decrease in the price of printers on the market for cartridges.
___2. Increase in worker wages on the market for computers. ___3. Increase in the price Dr. Pepper on the market for Coke. ___4. Increase in the price of computer chips on the computer market.
___5. Decrease in price of fertilizer on the market for wheat. ___6. Increase in government subsidies on the market for AIDS research.
___7. Decrease in incomes on the market for used clothing. ___8. New professional hockey league is formed upon the market for hockey games. ___9. Producer expectations that the price of orange juice will decrease 30% in 3 weeks? ___10. Consumer expectations that the price of orange juice will decrease 30% in 3 weeks? ___11. Decrease in price of iPads upon market for iPad apps?
A D
D C C
C
C
B
A
A
D1 D2
(A) (B) (C) (D)
D1
D2
S S S1 S1
S2
S2 D D
TIMER RATNEST
P P P P
A
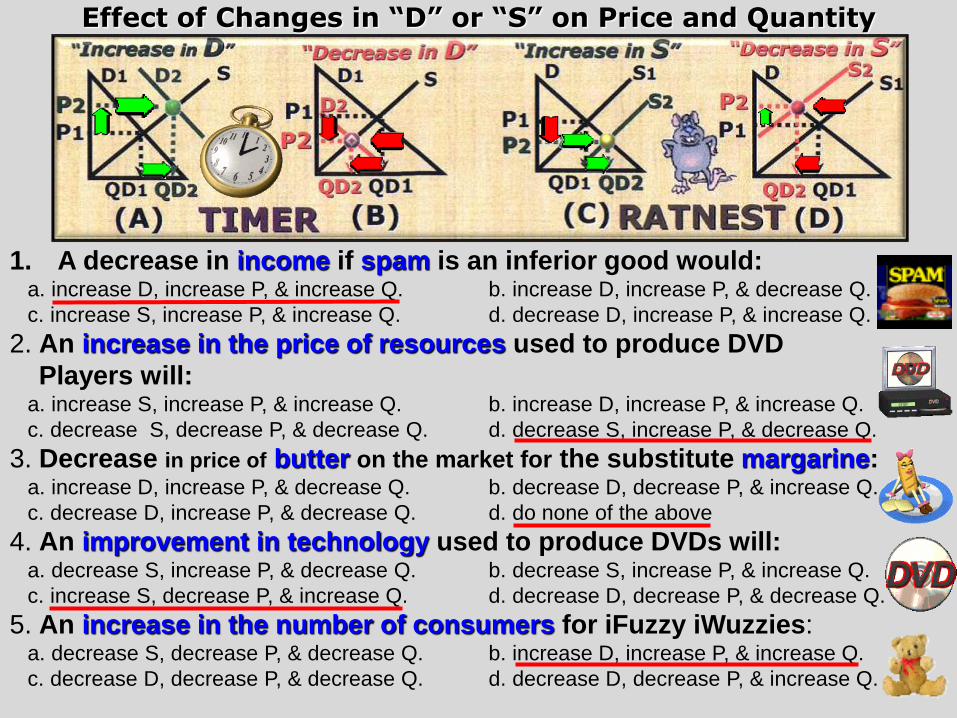
1. A decrease in income if spam is an inferior good would: a. increase D, increase P, & increase Q. b. increase D, increase P, & decrease Q.
c. increase S, increase P, & increase Q. d. decrease D, increase P, & increase Q.
2. An increase in the price of resources used to produce DVD
Players will: a. increase S, increase P, & increase Q. b. increase D, increase P, & increase Q.
c. decrease S, decrease P, & decrease Q. d. decrease S, increase P, & decrease Q.
3. Decrease in price of butter on the market for the substitute margarine: a. increase D, increase P, & decrease Q. b. decrease D, decrease P, & increase Q.
c. decrease D, increase P, & decrease Q. d. do none of the above
4. An improvement in technology used to produce DVDs will: a. decrease S, increase P, & decrease Q. b. decrease S, increase P, & increase Q.
c. increase S, decrease P, & increase Q. d. decrease D, decrease P, & decrease Q.
5. An increase in the number of consumers for iFuzzy iWuzzies: a. decrease S, decrease P, & decrease Q. b. increase D, increase P, & increase Q.
c. decrease D, decrease P, & decrease Q. d. decrease D, decrease P, & increase Q.
Effect of Changes in “D” or “S” on Price and Quantity
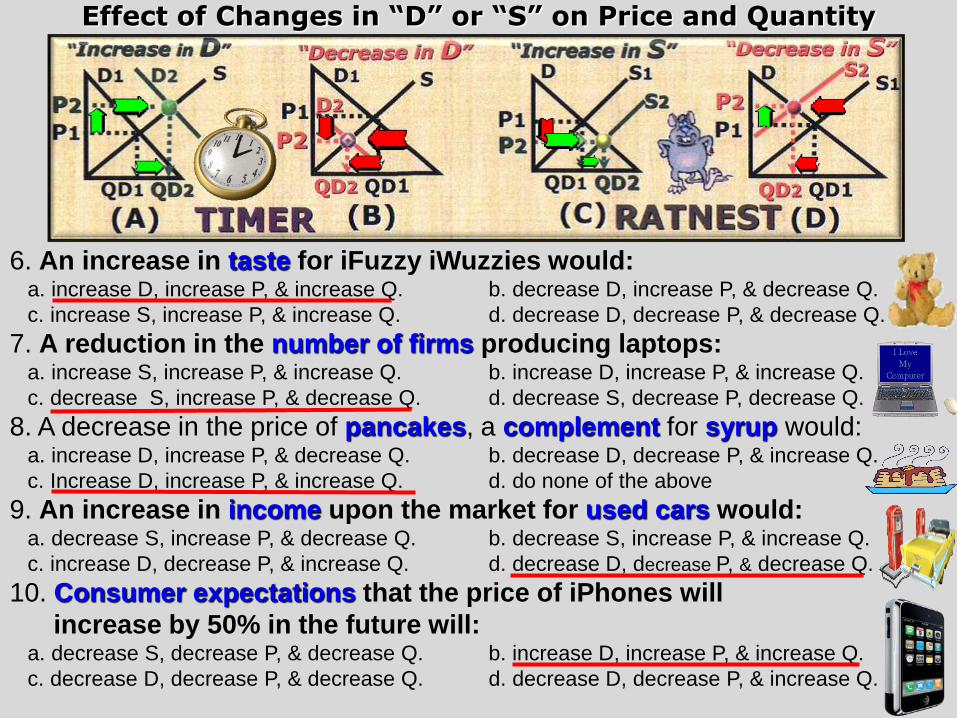
6. An increase in taste for iFuzzy iWuzzies would: a. increase D, increase P, & increase Q. b. decrease D, increase P, & decrease Q.
c. increase S, increase P, & increase Q. d. decrease D, decrease P, & decrease Q.
7. A reduction in the number of firms producing laptops: a. increase S, increase P, & increase Q. b. increase D, increase P, & increase Q.
c. decrease S, increase P, & decrease Q. d. decrease S, decrease P, decrease Q.
8. A decrease in the price of pancakes, a complement for syrup would: a. increase D, increase P, & decrease Q. b. decrease D, decrease P, & increase Q.
c. Increase D, increase P, & increase Q. d. do none of the above
9. An increase in income upon the market for used cars would: a. decrease S, increase P, & decrease Q. b. decrease S, increase P, & increase Q.
c. increase D, decrease P, & increase Q. d. decrease D, decrease P, & decrease Q.
10. Consumer expectations that the price of iPhones will
increase by 50% in the future will: a. decrease S, decrease P, & decrease Q. b. increase D, increase P, & increase Q.
c. decrease D, decrease P, & decrease Q. d. decrease D, decrease P, & increase Q.
Effect of Changes in “D” or “S” on Price and Quantity
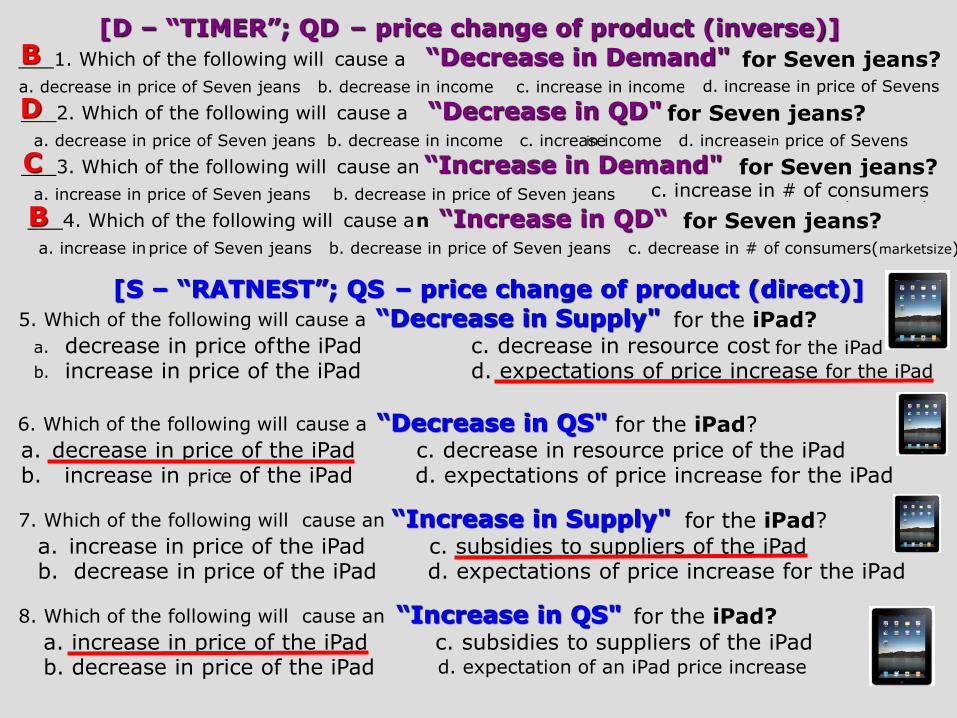
[D – “TIMER”; QD – price change of product (inverse)]
___1. Which of the following will cause a “Decrease in Demand" for Seven jeans? a. decrease in price of Seven jeans b. decrease in income c. increase in income d. increase in the price of compu ters
___2. Which of the following will cause a “Decrease in QD" for Seven jeans?
a. decrease in price of Seven jeans b. decrease in income c. increase in income d. increase in price of Sevens
___3. Which of the following will cause an “Increase in Demand" for Seven jeans? a. increase in price of Seven jeans b. decrease in price of Seven jeans c. decrease in # of consum ers(marketsize)
___4. Which of the following will cause a n “Increase in QD“ for Seven jeans? a. increase in price of Seven jeans b. decrease in price of Seven jeans c. decrease in # of consumers(marketsize)
[S – “RATNEST”; QS – price change of product (direct)] 5. Which of the following will cause a “Decrease in Supply" for the iPad?
a. decrease in price of the iPad c. decrease in resource cost b. increase in price of the iPad d. expectations of price increase
6. Which of the following will cause a “Decrease in QS" for the iPad?
a. decrease in price of the iPad c. decrease in resource price of the iPad b. increase in pric e of the iPad d. expectations of price increase for the iPad
7. Which of the following will cause an “Increase in Supply" for the iPad?
a. increase in price of the iPad c. subsidies to suppliers of the iPad b. decrease in price of the iPad d. expectations of price increase for the iPad
8. Which of the following will cause an “Increase in QS" for the iPad?
a. increase in price of the iPad c. subsidies to suppliers of the iPad b. decrease in price of the iPad d. expectation of an iPad price increase
B
D
C
B
d. increase in price of Sevens
c. increase in # of consumers
for the iPad
for the iPad
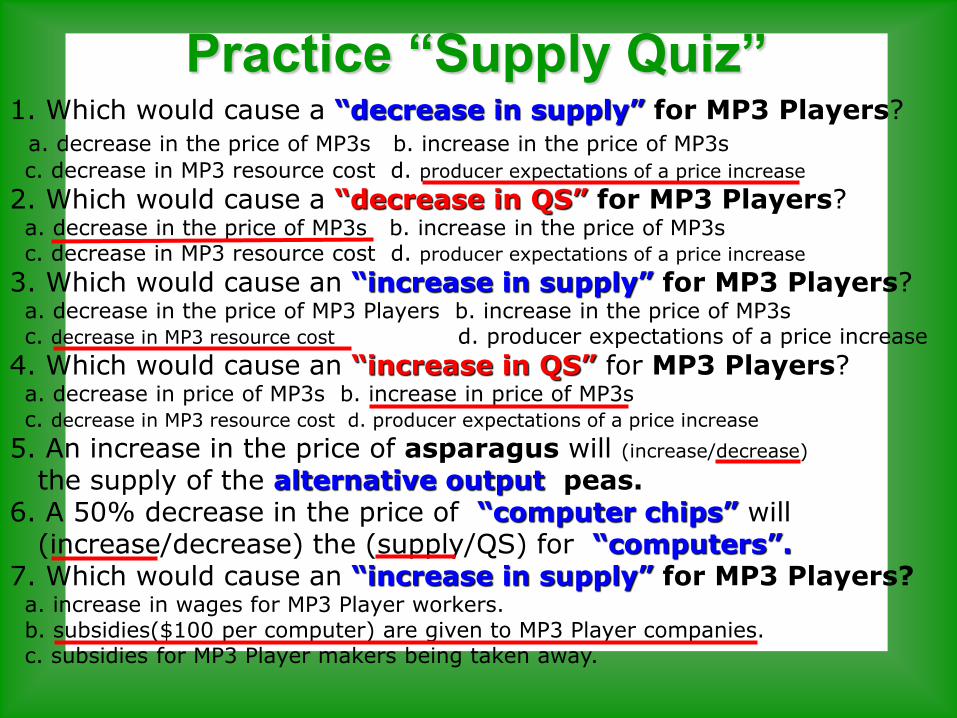
Practice “Supply Quiz”
1. Which would cause a “decrease in supply” for MP3 Players? a. decrease in the price of MP3s b. increase in the price of MP3s
c. decrease in MP3 resource cost d. producer expectations of a price increase
2. Which would cause a “decrease in QS” for MP3 Players? a. decrease in the price of MP3s b. increase in the price of MP3s c. decrease in MP3 resource cost d. producer expectations of a price increase
3. Which would cause an “increase in supply” for MP3 Players? a. decrease in the price of MP3 Players b. increase in the price of MP3s c. decrease in MP3 resource cost d. producer expectations of a price increase
4. Which would cause an “increase in QS” for MP3 Players? a. decrease in price of MP3s b. increase in price of MP3s c. decrease in MP3 resource cost d. producer expectations of a price increase
5. An increase in the price of asparagus will (increase/decrease)
the supply of the alternative output peas. 6. A 50% decrease in the price of “computer chips” will (increase/decrease) the (supply/QS) for “computers”. 7. Which would cause an “increase in supply” for MP3 Players? a. increase in wages for MP3 Player workers. b. subsidies($100 per computer) are given to MP3 Player companies. c. subsidies for MP3 Player makers being taken away.