Embed Size (px)
Citation preview
1
The Value Relevance of Inflation Accounting Disclosure of Quoted Petroleum Firms in Nigeria
By
ABUBAKAR Zaid M.Sc/Admin/4073/2010-2011
BEING THESIS SUBMITTED TO THE POST-GRADUATE SCHOOL, AHAMDU BELLO UNIVERSITY ZARIA IN PARTIAL FULFILLMENT
FOR THE AWARD OF MASTERS DEGREE IN ACCOUNTING AND FINANCE
MARCH 2013
2
Declaration I hereby declare that this thesis titled “The Value Relevance of Inflation
Accounting Disclosure of Quoted Petroleum Firms in Nigeria” is a product of
my modest research effort, carried out under the supervision of Dr. Ahmad
Bello (Major Supervisor) and Mal Isah Shittu. Acknowledgements were duly
observed in respect of all sources from which information were sourced. In
addition, this research work has not been presented anywhere for the award of
any educational certificate.
______________________ _______________
Zaid Abubakar Date
Certification
3
This Thesis titled “The Value Relevance of Inflation Accounting Disclosure of
Quoted Petroleum Firms in Nigeria” by Zaid Abubakar, meets the regulation
governing the award of the degree of Masters in Accounting and Finance of
Ahmadu Bello University, and is approved for its contribution to knowledge
and Literary Presentation
______________________ _______________ ______________
Chairman, Supervisory Committee Signature Date
____________________ _______________ ______________
Member, supervisory committee signature Date
____________________ ________________ ______________
Head of Department Signature Date
____________________ ________________ ______________
Dean school of Postgraduate studies signature Date

4
Acknowledgements
All praises are due to Allah, we praise Him, we thank Him and seek His
forgiveness. We seek refuge in ALLAH from the evils of our souls and that of
our actions. Whomever Allah guides, none can misguide him and whoever
misguides, there is none to guide him. I bear witness that there is no worthy of
worship but Allah, and I bear witness that Muhammad (S.A.W) is His servant
and Messenger.
It is by Allah’s will that; this study comes to its logical conclusion. This
acknowledgement is meant to show my sincere appreciation to a number of
people who have contributed in one way or the other in realizing this dream.
In view of this, my unreserved thanks and appreciation goes to my kind-
hearted supervisor, the amiable Dr, Ahmad Bello,(Major Supervisor) a scholar
per excellence and a professor in the making, for his constructive comments,
contributions and observations that have actually enriched the work. A special
appreciation also goes to Malam Isah Shittu, my minor supervisor, for his
technical inputs, comments and pieces of advice that also make the work what
it is today. In this line, my appreciation also goes to Dr Salisu Abubakar, ( The
M.sc coordinator) for his support and advice. To all of you I say jazakumullahu
khayrah.

5
I sincerely, acknowledge the parental prayers, care and support I receive from
my parents, Fatima Abdulhameed and Malam Abubakar Muhammad Bello, my
granny Alh Abdulhameed, who believe in the continuous pursuit of knowledge.
Also in this angle are my brothers and sisters, Suleiman Abubakar, Najeeb
Abubakar, Fatima Abubakar, Nabeela Abubakar and Ahmad Abubakar, for
their constant prayers. This paragraph shall never be complete without
acknowledging and appreciating the prayers, support, and care of my beloved
wife, Amina Auwal Ahamad, who had to do without me for most of the time
this study is being conducted. I say jazakillah for your understanding and for
some editorial comments you offered.
I also appreciate the kind gesture of some of my lecturers for their
encouragement and support, such as Dr Shehu Usman Hassan, who has been
reviewing this work, right from proposal stage to-date; Dr Ahmad Bello
Dogarawa, Dr Hassan Ibrahim; Mal Idris Ahmad, from Department of
Business Administration, who has proved to be a brother, a lecturer and a guide
at all times. At this point, I would like to acknowledge and appreciate the
fatherly contributions, comments and observations of my Father-in-law Dr
Auwal Yahya Ahmad, he had not only offered his observations but some
editorials on the study. Some other colleagues worth mentioning are: Malam
Jubril Yero and Malam Nasiru Yunusa for their contributions toward the
success of the work.

6
At coursework class level, I acknowledge the support, concern and
observations of Moddibbo Abubakar, a friend and brother indeed, Salami
Suleiman, and Ahmad Abubakar,
7
Abstract
Income is one of the most important economic variables in financial statements that reports the direction of business entities and as well, serve as a decision base for different users of financial information. Unless financial information is adjusted for inflation, income will to certain extent be meaningless. This is because market values and opportunity cost are not reflected. It is in this view; this study examines the individual value relevance of historical cost model, inflation adjusted model, and joint value relevance of inflation accounting disclosure on the quoted petroleum firms in Nigeria. In view of the objectives, three hypotheses were formulated and subjected to OLS estimation initially, and later to the panel models, considering the fixed effects (FE) and random effects (RE); these estimation techniques were later dropped, because of the inability of data for the study to meet the asymptotic assumptions of the Hausman specification test. Thereafter, the study employs the seemingly unrelated estimation technique (SUR), upon which correlation contemporaneous diagnosis was performed to obtain the best linear unbiased estimates of the variables (BLUE). Further, the study uses modified Olhson (1995) price valuation model for analysis. Correlational and Ex facto Research design were employed, and data for the study were sourced from Nigerian stock exchange fact book and available annual reports and accounts of the firms. Price indexes provided by the Central Bank of Nigeria (CBN) website were used to adjust the historical cost financial statements into the inflation adjusted values. The findings of the study revealed that inflation adjusted financial information is slightly more explanatory than the historical cost financial information, and marginal information provided by the inflation adjusted financial information does not mean anything to the financial information users. While on the overall, the inflation adjusted cost model shows a little more relevance if the joint reporting is adopted. The study concludes that, the inflation adjusted financial information is as explanatory as historical financial information, and joint reporting could provide financial information users with broad opportunity to focus on other variables for their decision making rather than earnings and book values. Therefore, it is recommended among others that policymakers, especially the financial reporting council of Nigeria (FRC) should require firms in the petroleum industry to provide inflation adjusted financial information in addition to the historical cost statements; while the financial information users should use the inflation adjusted financial statements as a complementary to historical cost statement rather than alternative.

8
Table of Contents
Page
Title page
Declaration i
Certification ii
Acknowledgement iii
Abstract vi
Table of contents vii
List of Tables x
List of Appendices xi
CHAPTER ONE: INTRODUCTION
1.1 Background to the Study 1 1.2 Statement of the Problem 4 1.3 Objectives of the Study 6 1.4 Research Hypotheses 6 1.5 Scope of the Study 6 1.6 Significance of the Study 7
CHAPTER TWO: LITERATURE REVIEW
2.1 Introduction 9
2.2 Conceptualization 9
2.3 Inflationary Trend in Nigeria: Factors Responsible 18
2.4 Income and Income Measurement 20
2.5 Joint and Marginal Information Content of Financial Reports 28
2.6 Inflation Accounting Technique 29
2.7 Components of Financial Statements Quality 32

9
2.8 Impact of Price Level Changes on Financial Reporting 35
2.9 Effects of Inflation on Decision Making Process 37
2.10 Review of Empirical Studies 39
2.11 Theoretical Framework and Model Development 45
2.12 summary 51
CHAPTER THREE: RESEARCH METHODOLOGY
3.1 Introduction 51
3.2 Research Design 51
3.3 Population and Sample of the Study 53
3.4 Sources and Method of Data Collection 53
3.5 Techniques of Data Analysis 53
3.6 Justification of Technique for Data Analysis 55
3.7 summary 55
CHAPTER FOUR: ANALYSIS, RESULTS AND DISCUSSIONS
4.1 Introduction 56
4.2 Descriptive Statistics and Normality Test 56
4.3 Corrective Transformation 63
4.4 Presentation of Inferential Statistics Results 67
4.5 Implications of Findings 73
4.6 summary 76
CHAPTER FIVE:SUMMARY, CONCLUSION AND
RECOMMENDATION

10
5.1 Summary 75
5.2 Conclusion 76
5.3 Recommendation 77
5.4 Limitations of the Study 78
5.6 Areas of Further Study 78
Bibliography
Appendices
11
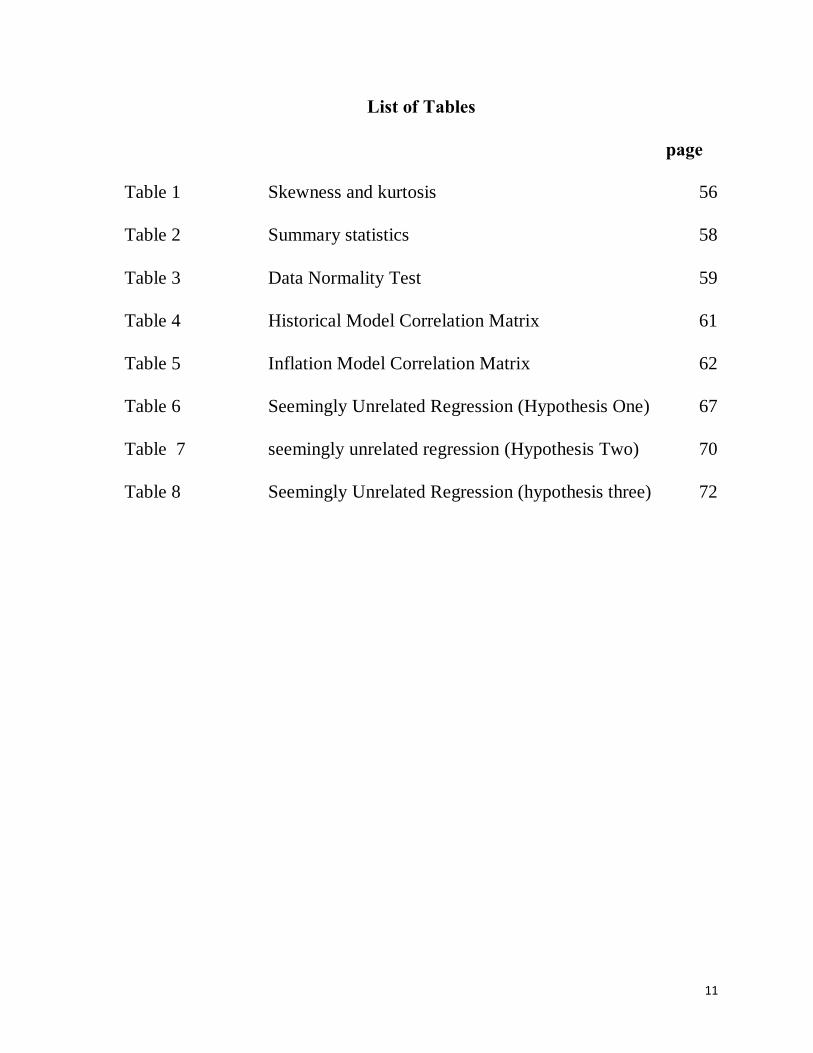
List of Tables
page
Table 1 Skewness and kurtosis 56
Table 2 Summary statistics 58
Table 3 Data Normality Test 59
Table 4 Historical Model Correlation Matrix 61
Table 5 Inflation Model Correlation Matrix 62
Table 6 Seemingly Unrelated Regression (Hypothesis One) 67
Table 7 seemingly unrelated regression (Hypothesis Two) 70
Table 8 Seemingly Unrelated Regression (hypothesis three) 72
12
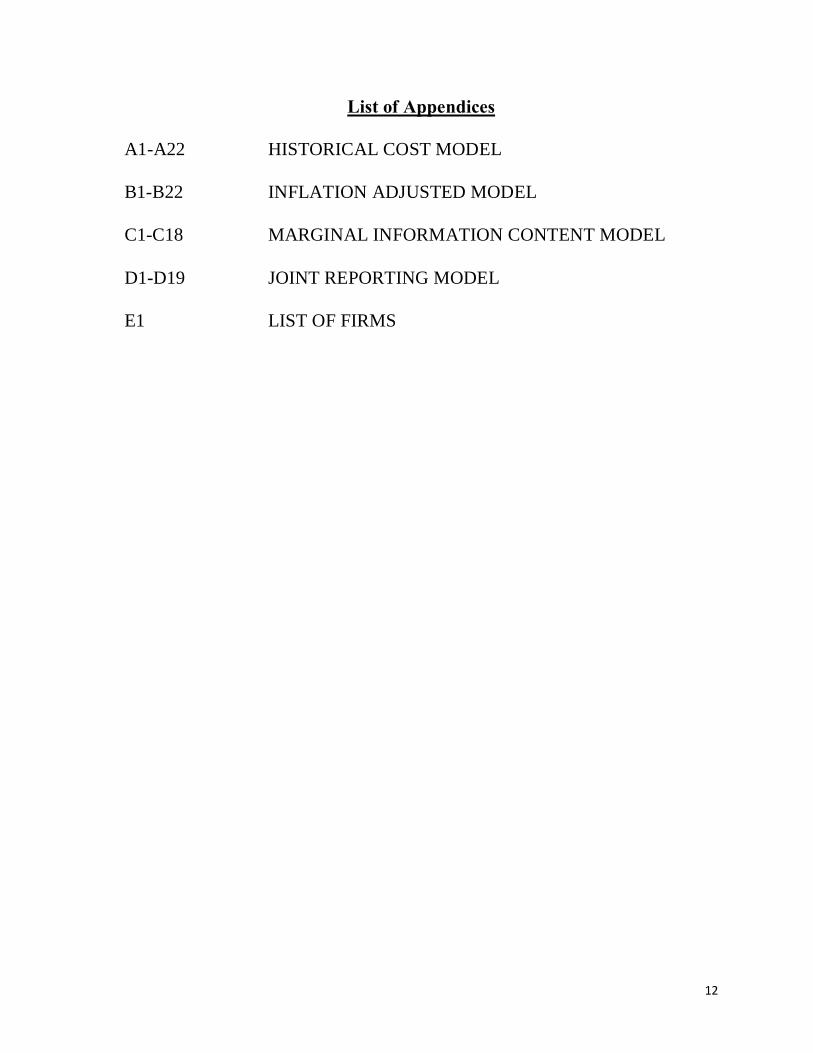
List of Appendices
A1-A22 HISTORICAL COST MODEL
B1-B22 INFLATION ADJUSTED MODEL
C1-C18 MARGINAL INFORMATION CONTENT MODEL
D1-D19 JOINT REPORTING MODEL
E1 LIST OF FIRMS
13
CHAPTER ONE
INTRODUCTION
1.1 Background to the Study
The major role of financial accounting is to provide quality financial information on the
activities of entity for economic decisions. Such information should be up-to-date and
should present the true and fair position of the reporting entity. It should be free from bias,
to considerably enhance the users’ reliance and more importantly relevant to current and
future decisions. Thus, the only instrument by which financial information could be related
to users is the financial statements that are often prepared for the purposes of stewardship.
Conventionally, financial statements provide information, using the Historical Cost
Accounting Model (HCA), which has for decades been claimed to be objective, reproducible
and prudent. However, during periods of price changes historical cost based statements
could present financial information in a misleading way. Commenting on the weakness of
HCA, Panton (1920) opines that direct comparison of financial events arising from different
periods might be difficult to achieve. This is because; accountants deal with an unstable
currency. The reliability and objective qualities labeled in favor of HCA could be of little
relevance if it does not measure income, accurately; being an indispensable variable of the
financial statements. (Solomon, 1961)
Therefore, financial statements prepared in inflationary condition could be misleading.
Furthermore, it reduces the Financial Accounting role as input for decision making. Hence
the need for adjustment to the historical cost approach to reflect current economic realities
becomes inevitable. The need for Accounting for changing price levels was not a recently
14
observed issue. It dates back to 1938, an article by Sir Ronald Edwards brought the subject
matter to fore, this was followed by series of write ups from Accounting bodies and
scholars. Effort ranges from issuance of exposure drafts monographs to formulation of
valuation models in light of the phenomenon.
The first inflation standard, issued in the United States by the Financial Accounting
Standard Board was in 1979, Statement of Financial Accounting Standard No. 33 (SFAS 33)
termed financial reporting and changing prices. This was later replaced by statement of
Financial Accounting Standard No. 89 (SFAS 89) in 1984, ‘Financial Reporting and Change
in Prices”.
In the U.K, the story was not different; there was the Accounting for stewardship in a period
of inflation, published in 1968 by the Research foundation of the Institute of Chartered
Accountants of England and Wales (ICAEW), as a result of Exposure Draft No. 8 (ED8).
The ED 8 provided the proposal that companies should be required to publish, in addition to
their conventional financial statements, supplementary statements which would be in effect,
their final financial statements amended to conform to current purchasing power (CPP)
principles.
In 1974, there was also, the Statement of Standard Accounting Practice No. 7 (SSAP 7) in
the UK, which, stipulates that the Retail Price Index (RPI) be used in conversions of
financial statements from Historical Cost. After the release of SSAP 7, the U.K. Government
inaugurated a Committee of Inquiry in 1975, which was popularly known as the Sandilands
Committee. The committee recommended the system of Current Cost Accounting (CCA),

15
approving the Concept of Capital Maintenance as the Maintenance of Operating Capacity
and also led to the emergence of SSAP 16. (Wood and Sangster, 2005).
In Nigeria, no amount of effort could be seen from the regulatory authorities in addressing
the effect of inflation on financial reporting. The Nigerian Accounting Standard Board
(NASB) now Financial Reporting Council of Nigeria (FRC) has not issued any standard in
that regard, or called for compliance with any international existing standard, despite the
persistent inflationary environment, in which entities operate in the country. Some
Developing Countries such as Turkey, did not only issue standards on price changing levels
but also make it compulsory for the entities to comply by supplementing their Historical
Annual Reports and Accounts with the inflation-adjusted ones. This therefore shows the
inactivity and absence of pro activeness on the part of local Accounting Regulatory
Authorities. Hence the need for empirical studies in the area with a view to exposing the
value derivable from additional reporting.
Moreover International Accounting Standard Board (IASB) is a body responsible for
drafting and issuing standards aimed at overcoming country differences. To address the
problem of inflation, the board came up with the international accounting Standards No. 17
in 1981 and No. 29 in 1989 respectively even with this development, a significant
achievement has not been recorded in developing countries, such as Nigeria where neither
an alternative valuation model is developed nor the available one adopted for financial
reporting.
16
The motivation for this study was triggered by the persistent inflationary condition in which
the Nigerian economy operates, which is further aggravated by Government policy
inconsistency over the years. During the democratic regime of Obasanjo (1999 to 2007), lots
of economic tensions came to being as a result of increases in prices of fuel, which brought
about general increases in prices of goods and services across the country, however the fuel
price increase was reversed by the administration of Yar’adua (2007 to 2009), but other
prices never came down. Now with the recent announcement of fuel subsidy removal by
Jonathan’s administration (2012), another fold of inflation has begun to set in. The Nigerian
economy is primarily run on oil, so any slight change on fuel prices will automatically have
an inflationary effect on the entire economy. Hence the need to study the effect of price level
changes on financial reporting.
1.2 Statement of the Problem
As the General Price levels fluctuate overtime, the value of a unit of measurement fluctuates
alongside, (Sweeny, 1936). Therefore, the unit of measurement becomes a unit of different
magnitude. What this signifies is that the value of a Naira today is different from that of
yesterday. As such, Accountants in the guise of conservative historical accounting, report
figures with an implicit assumption that values at the end of a fiscal year are comparable to
values at the beginning; embedded also, with an assumption of price stability. This
assumption has never been true, especially in developing economies, where monetary units
loose values by the day, either at the instances of forces of demand and supply or at a
slightest change or anticipated change in economic policies. Thus, affecting income of
entities; this could in turn impact on market prices in such an environment.

17
In view of the above, Income ,being an important economic variable in financial statements
that measures the direction of business entity as well as decision base by different users, will
to some extent be meaningless in an inflationary environment, because market values and
opportunity cost are not reflected. This therefore leaves the users of financial information
stuck with inadequate data that will disable them to draw an informed decision. They would
be left at the mercy of Historical figures that fail to recognize the time value of money.
Furthermore, in some Developing economies, to which Nigeria belongs, various episodes of
inflations are experienced; ranging from creeping to galloping, running to hyper, yet
accounting regulatory bodies in some of these countries have not been proactive in
formulating standards that will address prices instability in financial reporting. In Nigeria for
instance, the Nigerian Accounting Standard Board (NASB), now Financial Reporting
Council of Nigeria (FRC) has none, out of its 30 issued standards that deals with price
stabilization, this indicates the regulatory laxity and seeming indifference on Accounting
regulation in Nigeria, which is further enhanced by non appreciation of the value derivable
from reporting financial information reflecting current economic reality
Debates about the relevance or otherwise of inflation accounting has been on for decades. It
is in this view that some empirical studies were carried out in the area, with a view to
investigating the value of incremental information content of financial statements as a result
of extra reporting of inflation adjusted figures, some of the studies concluded in slight or
insignificant relevance, this however might not be unconnected with the fact that, bulk of
these studies were conducted in developed economies where inflation is always within
check, while the few carried out in the developing economies suffer from methodological

18
challenges, ranging from inadequacy in model strength and robustness to data paucity, hence
ended up without achieving the set objective. This study addresses the topic by using a more
robust methodological approach and design.
1.3 Objectives of the Study
In view of the problem stated above, the study achieves the following objectives:
a. To examine the value relevance of Inflation adjusted numbers beyond Historical cost
numbers for financial decision purposes on quoted Petroleum firms in Nigeria.
b. To examine the relevance of the Marginal incremental Information of Inflation
adjusted numbers for financial decision purposes on quoted Petroleum firms in
Nigeria.
c. To investigate the value relevance of joint information content of inflation adjusted
and Historical Cost Accounting numbers for financial decision purposes on quoted
Petroleum firms in Nigeria.
1.4 Research Hypotheses
For the purpose of this study, the following hypotheses were tested:
Ho1: Information content of inflation adjusted numbers is not relevant beyond Historical
cost numbers for financial decision purposes of quoted Petroleum firms in Nigeria.
Ho2: Marginal incremental information content of inflation adjusted numbers is not
significant to users of financial information of quoted petroleum firms in Nigeria.
Ho3: Joint Informational Content of Inflation-Adjusted and Historical Cost Accounting
Numbers are not value relevant for financial decision purposes of quoted petroleum
firms in Nigeria.

19
1.5 Scope of the Study
The study covers a period of seven years, from 2005 to 2011. It has been a period that
various economic policies and pronouncements are made in respect to increases in workers’
salaries and fuel prices without a due regard to the purchasing ability of the Naira, as well as
its exchange power against other currencies. During this period, the value of Naira has
assumed the worst shape ever in history, likewise its exchange ability against International
currencies, such as the Dollar. It is also within this period that the world experienced another
fold of Global Economic Crisis, the first of its kind in the New Millennium, forcing
countries currencies to assume various purchasing powers against one another and several
transactions to take different value from what was initially expected.
The study used the down Stream sector of the Nigerian petroleum industry as its domain.
This is because; it is one of the few sectors of the economy that have direct contact with the
International monetary system, as noted in Anyanwu (1992), as such, pressure from global
economy might have effect on it. Further, the study observes it, to be one of the few sectors,
neglected for accounting researches, hence the need to examine its contribution.
The study adopts out of the numerous inflation–Accounting approaches; the current cost
Accounting Technique. This is due its robustness, in its approach to valuation (any of
replacement, net realizable value and discounted cash flow methods) and its flexibility in
both high and low inflationary environments. Its basic principle is in tracking the monetary
price changes; and the units of measurement is the monetary unit itself rather than
purchasing power index.

20
1.6 Significance of the Study
The focal point of Accounting is to periodically measure and report economic wealth and it
changes for informed decisions by financial information users. The financial information
users are numerous and usually require relevant information that will aid them in day-to-day
decisions. This therefore, overemphasis the need for relevance in financial reporting that
addresses current economic reality and has the ability to predict the occurrences in the
future. This study would be of benefit to investors, management, Government, Accounting
Regulatory bodies and the academics.
Investors will have the most current information on companies to enable them assess the
actual performance of their investment, the amount of dividend they expect and more
importantly how market values their investment. This will go a long way in helping
investors in deciding whether to check out their share in pursuance of capital gains, or
maintain their stake in a company.
Management of companies would be enabled to fairly plan for Assets replacement by
providing proportionate asset allowances, based on current economic realities. The
government in its capacity as the custodian of businesses will be able to assess companies
fairly for taxation purposes. While the accounting regulatory bodies could use the findings,
to issue new standards or amend any existing one. This work will add to the existing body of
knowledge, because of its currency and the methodological approach.
21
CHAPTER TWO
LITERATURE REVIEW
2.1 Introduction
This Chapter presents and review relevant empirical studies after review of the variables of
the study. Included in this section are reviews on the inflation Accounting technique and
Model Development for the study.
2.2 Conceptualization
There are various definitions of the term inflation by many scholars. Keynes (1936) views
inflation as an attempt to increase investment in a period of full employment, positing that,
there can be no inflation while there is unemployment. In periods of non-full employment
rising prices indicate rising total real income. Keynes in his definition tried to establish an
inverse relationship between inflation and unemployment. This makes his definition to be
practically wrong in the Nigerian case, where inflation co exist with unemployment.
In view of the above, the concept is further viewed as the time-period of rising prices
because total money spending is increasing faster than the amount of goods being sold,
practically implying that inflation is a general increase in prices that exceeds the increase in
goods and services provided. This has it root cause in the change in total money spending,
relative to the flow of goods offered for sales. (Samuelson, 1948).
Friedman (1963) in his submission defines inflation as a steady and sustained increase in the
general price level. He emphasized the differences between a steady inflation, as one that
proceeds at a more or less constant rate. Intermittent inflation is the one that proceeds by fits
22
and starts. Friedman further opines that, the steady or persistent element of inflation will
tend to be incorporated into expectations and will consequently be comparatively benign,
while the intermittent inflation will be less benign. This definition succeeded only in
separating the less benign form of inflation from the high ones. In reality all forms of
inflation tend to have a negative impact on transactions.
Some scholars, such as (Quah and Vahey, 1985; and Roger, 1998) view the concept from its
core and hyper perspective. In this view, inflation is seen as the component of measured
inflation that has medium-to-long-term impact on real output. Hence, this definition views
inflation as a phenomenon that affects output only.
Furthermore, Salvary (2004) in his submission views inflation as persistent changes in
relative prices which produce a sustained change in the general level of prices in an
economy to the detriment of some members of the economy. His definition tends to be
incomprehensive, because it has not captured all individual customers within an economy.
Sequel to this, inflation is seen as an increase in the supply of money that causes the general
price level to rise, (Saville, 2005).
To accountants, inflation accounting is a method of accounting that includes inflationary
index. One records price changes that affect the purchasing power of current assets and the
value of the company’s long term assets and liabilities, thus, providing a more accurate
picture of a company’s value. It is an alteration of a firm’s financial statement to account for
changes in the purchasing power of money. With inflation accounting, gains and losses from
holding monetary items during periods of changing prices are recognized. Like-wise, long-
23
term assets and liabilities are adjusted for changing price levels. Inflation accounting is used
to supplement regular financial statements. In order to illustrate how changing price levels
can affect a firm, also called general price level accounting, (Woods, 2005).
Finally, Inflation could be seen as the general level rise in prices of goods and services with
a fall in purchasing power of a currency within an economy. It is an upward movement in
the average level of prices, though, It is quite possible that some individual prices may
remain stable even fall, but when prices in general, say a year period are compared with one
another, It will clearly be seen that there has been a significant overall increase in prices.
2.2.1 Causes of Inflation
Inflation causes, are for the purpose of this study explained in relation to demand and supply
forces, as well as impact of exchange rate and the prices of goods and services in the
international economy. The inflation causes could be categorized as follows: Cost push-
inflation, Demand full inflation, Wage spiral inflation. (Saville, 1980; Riley, 2006; and
Bello, 2009)
Cost Push-inflation according to Riley (2006) occurs when businesses respond to rising
production cost, by raising prices in order to maintain their profit margin. There are
numerous reasons why costs might rise, this include: pricing imported raw materials costs,
caused by inflation in countries that are heavily dependent on exports of these commodities
or alternatives, a fall in the value of a particular currency say the Naira in the foreign
exchange markets which increases the prices of imported inputs in the local economy.
24
Secondly, rising labor costs, caused by wage increases which exceed any improvement in
productivity, just as the case in developing economies like Nigeria. The cost is important to
those industries that are Labor-intensive. These firms may decide to pass these higher costs
onto their customers, in the short run, but in the long-run, wage inflation tends to move
closely with price inflation because there are limits to the extent to which any business can
absorb higher wage expense.
Third reason for cost push inflation is the higher indirect taxes imposed by the government.
for example, a rise in the rate of excise duty, increase in government charge for fuel just as
the case in Nigeria, rise in the standard rate of value added tax (VAT) or extension to other
range of product which were hitherto excluded from VAT. (Nwaobi, n.d).
Demand-Pull Inflation occurs when there is full employment of resources and when supply
is inelastic. In this scenario, an increase in Aggregate Demand will lead to an increase in
prices. Aggregate demand might rise for a number of reasons. Some of which occur together
at the same moment of the economic cycle. A depreciation of the exchange rate, which has
the effect of increasing the price of imports and reduces the foreign price of exports. If
consumers buy fewer imports, while foreigners buy more exports, Aggregate Demand will
rise. If the economy is already at full employment, prices are pulled upwards.
Another factor responsible for demand – pull inflation is reduction in direct or indirect
taxation. If direct taxes are reduced consumer have more real disposable income causing
demand to rise. A reduction in indirect taxes will mean that a given amount of income will
now buy a greater real volume of goods and services. Both factors can take aggregate
25
demand and real GDP higher and beyond potential GDP. The monetarist economists believe
that the causes of inflation are monetary in particular when the monetary authorities permit
an excessive growth of the supply of money in circulation beyond what is needed to finance
the volume of transactions produced in the economy. Another factor is for the demand-pull
inflation is the rising consumer confidence and an increase in the rate of growth and house
prices – both of which would lead to an increase in total household demand for goods and
services.
The Wage Price Spiral – “Expectation – Induced Inflation occurs as a result of rising
expectations. When people expect prices to continue rising, they are unlikely to accept a pay
less than an expected inflation rate because they want to protect the real purchasing power of
their incomes. In this scenario, workers will seek to negotiate higher wages and there is then
a danger that this will trigger a wage-price spiral that then requires the introduction of
deflationary policies such as higher interest rates or increase in direct taxation.
Other factors that could trigger inflation could be looked at from productivity point view
(Riley, 2006). Productivity measures output per person employed or output per person hour.
A rise in productivity helps to keep unit cost down. However, if earnings to people in work
are rising faster than productivity, then unit labor costs will increase, thereby a tendency for
price increases occur.
Empirically, a lot of researchers have one thing or the other to say on the cause of inflation.
Friedman (1980) holds the view that inflation is a monetary phenomenon, wherever it exists,
drawing his submission from the quantity theory of money. Following the footsteps of
26
monetarist, Salvary (2004) also concludes that in the absence of monetary dislocation or
collapse of the monetary system, nominal money, the measuring unit used by Accountants is
not defective under general economic conditions, hence positing money to be the prime
cause of inflation. Also commenting on the same subject matter, Bello (2009;25) stated that
“while an increase in the money supply can accommodate or accentuate a rise in the price
level, changes in the general price level is not a monetary phenomenon.”
The foregoing discussion and analysis on the causes of inflation in this study leads us to the
conclusion that factors other than money such as government policies summersaults are
responsible for inflation, especially in developing economies like Nigeria.
2.2.2 Types of Inflation
Going through some of the economic literatures, Inflation could be broadly grouped into
four types according to its magnitude, these are: Creeping, Walking, Running and Hyper
Inflation. Riley (2006) is of the view that creeping Inflation occurs when the rise in price is
very slow. A sustained annual rise in prices of less than 3% per annum falls under this
category. Such an increase in prices is regarded safe and essential for economic growth.
Walking inflation happens when prices rise moderately and annual inflation rate is at single
digit. This occurs when the rate of rise in price is in the intermediate range of 3 to less than
10 percent. Inflation of this rate is a warning signal for the government to control it, before it
turns into running one.
27
Running inflation is when prices rise rapidly at the rate of 10 to 20 percent per annum. At
this point a running inflation is said to have occurred. This type of inflation has tremendous
adverse effects on the poor and middle class. Its control requires strong monetary and fiscal
measures. Hyper inflation occurs when prices rise very fast at double or triple digit rates.
This could get to a situation where the inflation rate can no longer be measurable and
absolutely uncontrollable. Prices could rise many times every single day. Such a situation
brings a total collapse of the monetary system because of the continuous fall in the
purchasing power of money. (Kimberly, n.d)
2.2.3 Measuring Inflation
The simplest way to convert money measurement into a real measure, according to
Alexander (1962) is through an accepted index of the general price level. Because perfect
satisfactory index of the general price level does not exists. Furthermore, it is not only that,
price indices are imperfect because of poor price reporting and inadequate coverage, but
even in theory, it seems impossible to construct a perfect price index no matter how much
information one gathers. This is because all prices do not move together. In view of this, it is
necessary to use an average of different price movements. The average must be weighted
and the appropriate weights change as between the beginning and end of the period over
which price is being measured. However, this approach fails to state the category of goods
on which prices are to be captured.
It is in view of the deficiency in the preceding measurement approach, that Kirkman (1974)
opines that inflation is measured by observing the change in the price level of a large
number of goods and services in an economy. That is the prices of essential commodities
28
within an economy have to be tracked for any inflationary measurement unit to be arrived at.
The problem with this submission is in identifying what constitute essential commodities in
a given economy. This is in addition to the problem of consistent price tracking.
In an attempt to solve the problem of the range of goods to capture in tracking the price
index, Diewert (2005) is of the opinion that one of the simplest choices is to use the inflation
rate for a widely traded commodity, such as gold as the index of general inflation. Another
alternative is to use the rate of increase in the exchange rate of country against a stable
currency. More still, instead of using the price of gold or any single commodity as the
indicator of inflation, the general inflation between the beginning and the end of the
accounting period might be better captured by looking at the price change of a representative
basket of goods. It is in this light that Inflation measurement is viewed as the process
through which changes in the prices of individual goods and services are combined to yield
a measure of general price change (Lebow and Rudd, 2006).
Silver (2007) in his contribution asserts that consumer price Index (CPI) is usually the unit
used in measuring inflation, especially in economies that adopt inflation targeting. To
achieve this measurement, the index to be used should be one that the public is familiar
with. Thus, the consumer price index (CPI) should have requisite high public profile and
prevalence as a target for measurement.
Whichever point of argument we take; there will always be an imperfection in the index to
be used in adjusting the Historical Cost Accounts for inflationary purposes. However, this
does not preclude us from agreeing with Staubus (1975) where he opines that adjusting
29
historical costs for general inflation by an imperfect index will generally be an improvement
over historical cost accounting.
Empirically, some of the recommendations submitted by some scholars, (e.g Lebow and
Rudd, 2006) for the choice of index choice are: cost-of-goods-index, cost-of-living-index,
policy assessment measures, prediction method, consumer price index, gross domestic
product deflator, and misery index. They asserts that, Cost-of-Goods-Index (COGI) tends to
cover a broad enough basket of goods that will provide adequate base of arriving at an
index. COGI comes very close to what most people intuitively mean by an inflation rate.
However, this index is not free from some deficiencies because COGI is for fixed bundle of
goods, it will not be of enough representation when new goods are introduced or when
changes occur in the features of the products covered.
Cost-of-living-index (COLI) is a measure of inflation based on the expenditures needed for
an optimizing consumer to maintain a specified level of utility as price changes. The cost-of-
living index derived its strength from the theory of consumer behavior, which can provide
clear-cut suggestions as to how to deal with such problems as changes in expenditure
patterns or the introduction of new goods. However, cost of-living-index (COLI) provides
little or no guidance about the construction of broader measures of inflation that include
prices for other components of output.
Consumer Price Index (CPI) is a method whereby a bundle of goods and services in a
certain weighted combination is determined. The total price of the bundle is calculated every
month and an annual average is also determined. CPI in the submission of many economists
30
provides more accurate insight into the deeper, underlying inflationary pressures within the
economy. However, CPI has some of its own deficiencies, CPI measures may overstate the
true rate of inflation, because they do not take into account improvements in the quality of
goods and services which may offset, in some cases, some of the rise in their prices, it does
not also provide adequate allowances for changes in the cost of housing and other hard-to-
estimate prices. (Stanford, 2008).
Gross Domestic Product Deflator, is a price index which adjusts the overall value of GDP
according to the average to the average increase in the prices of all output. The GDP deflator
equals the ratio of nominal GDP to real GDP. It is an alternative measure of inflation to the
consumer price index. GDP deflator captures the overall level of inflation in everything that
an economy produces
Misery Index equates economic unhappiness as weighted sum of inflation and
unemployment. (Smith, 1937). Consequently, the choice of a particular index depends on
the needs of the user; in this case we can deduce from the foregoing discussions that CPI
favors the individual consumers and the firms, while Group deflator favors the government.
Furthermore, some researchers (e.g. Silver, 2007; Roberts, 2008) argued that inflation signal
and inflation noise have to be distinctively understood for any meaningful measurement to
be achieved, they defined Inflation signal as a warning in general price increases, with a
great tendency to continue into the future, while inflation noise, is the rise in the prices of
specific goods or services – within an economy; in other words, it is the volatility in prices
of certain goods and services within an economy. Consequently, the study adopts the
consumer price index in adjusting the historical cost accounts to inflation adjusted.
31
2.3 Inflationary Trend in Nigeria: Factors Responsible
Nigerian Inflationary trend is the price of President Babangida’s Structural Adjustment
programme. This is because it assumed a doomsday scenario since its inception in July 1986
(from 5.4% in 1986 inflation rate to 40.9% in 1989), and has also been threatening to
destroy the very fabric of Nigerian society. It has included hyperinflation, depleted external
resources, worsened balance of payment positions and increased personal insecurity as well
as lessening personal satisfaction, (Anyanwu, 1992).
The country has experienced high volatility in inflation rates. From the early 1970s, as a
result of increases in the world price of oil and with oil production expanding, the country
seemed to be on track to prosperity. Because oil revenues allowed for a large investment
programs and rapidly rising government expenditure led to increasing purchasing power for
significant numbers of people (Kuijs, 1998).
However, following the fall in international oil prices and subsequent cut off of Nigeria from
the international capital markets, the government sustained its annual budget by increased
foreign borrowing, which rapidly assisted in building the country’s foreign debt; also at this
period, the government maintained an overvalued exchange rate with distortionary foreign
exchange controls which drove up the parallel market premium against the official market
(Anyanwu, 1992). This however, led to damage to local industry and agriculture, coupled
with highly expansionary monetary policy, powered by monetary financing of deficit
budget, which fuel high inflation in Nigeria.
According to Masha (2000), there have been four major episodes of high inflation, in excess
of 30 percent in Nigeria from the 1970s. The first inflation episode occurred in 1976, the

32
cause of which was the drought experienced in Northern Nigeria which destroyed
agricultural production and pushed up the cost of agricultural food items. Factors
responsible for the second episode of the inflation include: excessive monetization of oil
export revenue, which gave the inflation a monetary character, devaluation of the domestic
currency, causing prices to adjust to the parallel rate of exchange, thereby fuelling inflation
further.
The third inflation episode in Nigeria was characterized by fiscal expansion that
accompanied the 1988 budget, in addition was the debt conversion exercise, through which
debt for equity swaps took place, external debt was repurchased with new local currency.
However, with the drastic monetary contraction coupled with the aforementioned factors,
inflation was brought to a lower level.
The fourth inflationary episode started in 1993 through 1995. The major factor here was the
inability of regulatory authorities to contain the growth of private sector domestic credit and
bank liquidity, which made growth in money supply to move beyond demand.
Finally we view the New Millennium inflation in Nigeria as one, been characterized by poor
governmental policy on fuel prices, announcement of fuel subsidy removal, jumbo salaries
to political office holders, demand for salaries increases by the Labor Unions and worst of
all financial indiscipline by the people in the position of authorities, yet without any
commensurate effort in supply of essential goods and services.
33
2.4 Income and Income Measurement
Income is nothing more than consumption, (Fisher, 1927). From this view, anything besides
consumption is not income. Therefore, income is the net revenue that remained after
deducting the expenses for maintaining fixed assets and the day-to-day expenses as opined
by (Smith, 1937). This view is in line with that of most accountants; however do not provide
any procedure for measurement.
In an attempt to circumvent the measurement problem, Hicks (1950) sees Business income
as the maximum amount which the firm can distribute as dividends and still be as well off at
the end of the period as at the beginning. Thus income is in economies is mostly thought of
in real terms and is the result of balance sheet valuation rather than the residual from income
statement as the case in Accountants view. Thus, being as well off economically is
interpreted as maintaining capital intact in terms of the discounted value of expected future
receipts.
Bedford (1951) views income or profit as an increase of net rights in property. It could be
construed from this definition that an increase of rights in property refers to an increase in
the ability of property to satisfy wants. It is not a mere increase in physical form, or increase
only in money or its equivalent. Therefore, income is the difference between incomings of a
business or proprietor and the outgoings; hence it is the net of gross incomings and the gross
outgoings. (Marshall, 1952)
Generally, according to Chang (1962) Business income is concerned with the residue from
matching revenue realized against costs consumed. In other words, it is the residue or
34
remnants of Revenue realized from business operations after deducting all expenditures
incurred for that sole purpose, meaning that, income is a money concept, measured
periodically for a specific time through the instrument of the income statement. As such, it is
the excess of business revenue over related cost. Hence, the main task of income accounting
is to match revenue realized and cost consumed. This matching process causes an
aggregation of unallocated costs (non monetary assets) together with monetary resources of
an entity after deducting the liabilities, which gave rise to a residue called accounting or
residual equity (kirkman, 1974; Belkaou, 1992).
There have been various views by scholars as demonstrated above,of what income is,
however, some groups such as the Mercantilists, that view business income as the balance
of profit on the merchants book at the end of the year, this view, see business profit as an
annual phenomenon, and do not take into regards procedures needed to arrive at the final
income.
The Physiocrats, in their opinion, income is only the net product of an agricultural
entrepreneur, implying income to be something available for consumption after deducting
land usage allowances, annual expenditure incurred in the course of generating the gross
product; the definition views business income from a narrow perspective, without any
measurement yardstick.
Finally from the economists point of view, income is seen as the money value of the net
accretion to ones economic power between two points of time, while from the accounting
35
perspectives, more procedural approach is emphasized, hence the view that income is the
end result of the process of matching efforts and accomplishments.
Income measurements on the other hand is the process of assigning symbols to selected
objects, so that important class distinction, ordinal status, variations and differences, scales
for establishing comparative magnitude could be disclosed. (Williams and Griffin, 1967),
for any measurement to be significant, there must be a presupposition of purpose or
objective on the part of the measure. Ijiri (1966) views measurement as a special language
which represents real world phenomena by means of numbers that are predetermined within
the number system.
Measurement in accounting is done through the scale of ratio and money or price as
measuring unit. The choice of these two mechanisms is criticized on whether such
assignment can truly represent what is to be measured under different conditions and
circumstances (Bello, 2009), therefore, numbers resulting from applications of measurement
procedures have relevance only as they are identified through the use of formal theoretical,
construct as opined by Campbell (1963).
2.4.1 Income Valuation Approaches
Income is the end product of any measurement yardstick applied, especially in Asset
valuation. Traditionally, income is determined through the historical cost accounting model
which states assets on the basis of its original cost; therefore, the final figure from the
income statement will also be historical in nature. The earnings referred to mostly in
Accounting literature are either income derived from residual income approach or a
36
discounted cash flow approach. Income determined through residual income – measures
according to Fernández (2001), could be through one of the following valuations techniques:
Economic Value Added, economic Profit and Cash Value Added.
Economic Value Added (EVA), which is defined as earnings before interest less firm’s book
value multiplied by the average cost of capital. Economic value added as enunciated by
Stern steward & Co’s, is the measure that correctly takes into account value creation or
destruction in a company, because it measures the true financial performance of a company.
The proponents of this income valuation model argued that income determined through the
method is most directly linked to the creation of shareholder wealth over a time, thus, the
higher the EVA of a company, the higher its stock prices. Furthermore, Mekalainen (1998)
posits that, an essential component of EVA is the weighted Average Cost of Capital
(WACC) determined with the costs of both debt and equity. He further asserted that
theoretically EVA is much better than conventional measures in explaining the market value
of a company. Economic Profit (EP), is a form of income or profit, defined as book profit
less the equity’s book value multiplied by the required return to equity. The income
valuation was propounded by Boston consulting group.
Cash Value Added Model (CVA), is defined as earnings before interest plus amortization
less economic depreciation, less cost of capital employed. The model was also introduced by
the Boston Consulting Group, as an alternative to the EVA. They defined Income as the Net
Operating Profit after Tax (NOPAT), plus book depreciation (DEP) less economic
Depreciation (ED) less cost of capital employed.
37
The aforementioned incomes measurement techniques are categorized as Residual Income
Approach, which could be arrived from both Historical Cost Account and Current Value
Accounts. In continuation of our exploration of Income Determination Technique, Historical
Cost Accounts, as mentioned earlier has its own peculiar advantages. Hence, Posits Daines
(1929), that its greatest advantage is the fact that an original cost method is most easily
subjected to objective verification, thus, the easiest to use in practice. Furthermore, Littleton
(1956) in continuous defense for Historical Cost Accounts reflects the opinion of most
financial accountants, that historical Cost Accounting is best for financial reporting because
of its reproducibility properties, therefore, adjusting the Historical Cost valuations of assets
is best left to management.
However, during periods of price changes, the objectivity and reproducibility properties of
the Historical cost accounts cease to exist, therefore, during this period. The following assets
valuation methods, according to lamberg (n.d), could be considered: Net Realization Value
Method, Replacement Cost Method, Future Discounted Cash Flow Method, Specific Price
Historical Adjustment Method, and Prepaid Expenses Method.
Net Realization Value, is also referred to as exit values. This is the value an asset can fetch
if it is to be sold now at the market. It is the defined as the Asset- realizable value less
consequential cost as a result of Disposal Edwards and Bell (1961) views it in a similar
direction, defining it as the maximum price a currently held asset could be sold for in the
market less the transaction cost of the sale, i.e. the net realizable value for the asset. Net –
realizable value is current value accounting model advocated by many leading –
Accountants and Economist (e.g. Sweeney, 1936; Staubus, 1961 and Chambers, 1965).
38
However, the valuation method is not free from certain deficiencies such as lack of
reproducibility and Additivity problems unlike the historical cost accounts.
Replacement Cost Method is otherwise called Reproduction method or Entry value method.
It is defined by Edward and Bells (1961) as the minimum cost of purchasing a replacement
for a correctly held asset. It is the sum of money which would have to be expended at the
present time to reproduce a physical property identical with that in existence at the present
time and used for the benefit of the public (Hammod and Hayes, 1913).
Though the usage of replacement cost accounting has drastically been reduced as a current
value accounting, some accountants still find it relevant as a basis for computing
depreciation on a current cost basis. The drastic reduction in its usage might not be
unconnected with the same two difficulties that were associated with the use of net
realizable values model of not being generally reproducible and lack of additivity.
Future Discounted Cash flow: In accounting literature, estimating a current asset value as
the discount stream of its future expected returns is known as the economic approach to
asset valuation. This technique as posited by Fisher (1897) is based on the economic concept
of capital maintenance. However, the valuation methods has been criticized for its non-
reliability as the discounted net returns could not be known with any degree of certainty and
even where the returns are known, it is quite difficult or even impossible to allocate
combined revenues generated by aggregate assets to individual assets.
Specific Price Level Adjusted Historical Cost happens to be another current value valuation
concept put forward by Daines (1929) and Sweeney (1934). The method attempts to classify
39
assets into finite numbers of distinct classes at the beginning of an accounting period, called
period zero (0), with an index number attached with same classification, so that during
inflation, the depreciation value of the asset for that year would be zero, while the asset
value will stand at the asset index at the beginning scaled by index at the end. The
distinctive feature of this method is that general index is not used for all Assets; rather, each
class of Asset will take its specific index. However, the difficulty attached in obtaining
individual asset index, is of the deficiencies of the method, even where those indices are
arrived, the certainty is not always guaranteed, hence, subjectivity sets in.
Prepaid Expenses Assets and their allocation is current value accounting model which takes
a rather different approach, from the traditional way to valuing only tangible assets to
intangibles. The method views investments in intangible assets such as research and
development, advertisement and market expenses as well as training expenses. Assets whose
benefits are for more than one accounting period, and are capable of increasing the future
earnings potentials of a company, even though not reflected in the balances sheets of the
companies. The method advocates for allocating the intangible expenditures over estimated
period from which benefits are expected to accrue, thus, arriving at an income that has a fair
share of those expenditures, rather than charging these intangible assets expenditures to the
period when they were incurred. The concept of prepaid expenses is the major attribute of
the valuation model used in this study, with the approach of matching current costs with
future expected revenues. Haffield (1927) correctly noted that this type of Asset is different
from the usual sort of tangible asset, since they cannot readily be converted into cash,
thereby dispossessing opportunity cost value.
40
However, the problems faced in adopting this valuation method is not far from the intangible
assets possessing the nature of fixed cost, which are usually of no consequence for a firms
future strategic behavior. Nevertheless, the method has some utility, hence the conclusion by
Edwards (1954) “Even crude attempts should result in an improvement over present
depreciation practices. During periods of rapidly changing prices crude – measurements of
relevant item are likely to be much more meaningful than accurate measurements of an
irrelevant one”. This valuation model contributed immensely in modifying the model used
for this study.
2.5 Joint and Marginal Information Content of Financial Report
Most of the studies on information content of accounting data, view the announcement
aspects, by examining whether the announcement of some events result in a change in the
characteristics of the stock- return distribution, such as mean or variance. (Leu and Olhson,
1982).
The information content of financial reports could be separated into joint information
content and marginal information content, because different set of accounting income data
are viewed as signals about the attributes of a firm in a particular condition. Therefore, the
dependency of security returns on a given signal is generally defined as the information
content of that signal.
In view of this, Joint Information Content according to Matolcosy (1984) is the sum of the
information contents of simultaneously realized signals, while marginal information
contents of a signal is the information content of that signal beyond the information content
41
of all other simultaneously realized signals. In view of this, it should be noted that, the signal
which the information is sending, is what affects the firms’ values, whether disclosed or not.
Ball and Brown (1968) study signals on earnings announcements in which unexpected
annual earnings changes were correlated with residual stock returns and also tested for the
information content of the earnings. The study concluded that consistent evidence does exist
on the relevance and timeliness of accounting earnings.
However, the difficulties in testing for joint and marginal information content of two or
more signals from accounting data is the potential for compounding effects, in the form of
release of information about the realization of inflation-adjusted accounting – numbers
coinciding with the release of the information on the realization of Historical Cost
accounting income numbers, Matolcosy (1984). However, this study intends to overcome
this problem by coming up with a modified price model that will test for the information
content as against market – return models used by previous studies.
2.6 Inflation Accounting Technique
There are several techniques used in adjusting historical based financial statements to
inflation adjusted statements. The techniques are hereunder discussed as follows:
2.6.1 Current Cost Approach: - This approach is found in a number of different methods.
In general, the approach uses replacement cost as the primary measurement basis, if
however, replacement cost is higher than net realizable value and present value, the higher
of net realizable value and present value is usually used as the measurement basis. (lamberg,
n.d).
42
The replacement cost of a specific asset is normally derived from the current acquisition cost
of a similar asset, new or used, or of an equivalent production capacity or service potential.
While net realizable value usually represents the current selling price of the asset whereas
present value represents a current estimate of future net receipts attributable to the asset,
appropriately discounted.
Furthermore, specific price indices are often used as a means to determine current cost for
items. Particularly if no recent transaction involving these items has occurred, no price lists
are available or the use of price list is not practical. Current costs methods generally require
recognition of the effects on depreciation and cost of sales for changes in prices specific to
the enterprise. The method also require the application of some form of adjustments which
have in common a general recognition of the interaction between changing prices and the
financing of an enterprise.
Current cost methods also require an adjustment reflecting the effects of changing prices on
all net monetary items. Including long-term liabilities, leading to a loss from holding net
monetary assets or to a gain from having net monetary liabilities when prices are rising, and
vice versa. Most often the adjustment in this regard is limited to the monetary assets and
liabilities included in the working capital of the enterprise.
A variant of the current cost method apply a general price – level index to the amount of
shareholders interests. This indicates the extent to which shareholders equity in the
enterprise has been maintained in terms of the general purchasing power when the increase
in the replacement cost of the assets arising during the period is less than the decrease in the
43
purchasing power of the shareholders interest during the same period. Sometimes, this
calculation is merely noted to enable a comparison to be made between net assets in terms of
general purchasing and net assets in terms of current costs. The difference between two net
assets figures is treated as a gain or loss accruing to the shareholders (wood and Sangster,
2005).
However, the valuation methods embedded in current cost technique have proved to be
inadequate to valuation problems, on their individual capacity, hence the proposal by the
Sandilands Committee of Concept “value to the owner” a method which encapsulates the
elements of replacement, net realizable value and present value methods.
Value to the owner is defined as the minimum loess which an entity might incur if it were
deprived of an asset. Values from the three methods are compared to determine the
minimum loss by assuming that the business is deprived of an asset and at the same time
trying to maximize its profits. A way of deferring value to the owner according to Glutier
and Underdown (1986) is by reversing the opportunity cost concept, which is defined as the
least costly sacrifice avoided by owning an Asset. Value to the owner is sometimes referred
to as “Value to the firm”.
However, current cost method or current value Accounting as otherwise called was
criticized for making it difficult to make comparisons over a period of time when the unit of
measurement is unstable, this notwithstanding does not render the method useless , because
relevance of the financial information is of paramounce and superior to comparison.[FASB]
44
2.6.2 General Purchasing Power Approach
This method is known by different names, such as Constant Purchasing Power Accounting
(CPPA), General Price Level Accounting (GPLA), Constant Dollar Accounting, and
General Purchasing Power Accounting (GPPA), which was first highlighted by Sweeny
(1936). The general purchasing power approach involves the restatement of some or all the
items in the financial statements for changes in the general price level proposals. This
subject emphasis that general purchasing power statements change the unit of account but do
not change the underlying measurement bases, under this approach the amount reported in
conventional financial statements are measured in terms of the number of units of money
expanded for the object of measurement.
According to Gynther (1974) the method uses purchasing power unit rather than money, and
the method are not strictly a change from the historical cost based Accounting. It is merely
an attempt to remove the distortions in the financial statements which arises due to changing
price levels. It makes accounting income normally reflects the effects, using an appropriate
index of general price level changes on depreciation, cost of sales and net monetary items is
reported after the general purchasing power of the shareholders equity in the enterprise has
been maintained.
The overall objective of the method is to determine the real changes in well being of the
value of money which do not represent real – changes in the financial position of a business
[Institute of Chartered Accountants of Nigeria, ICAN].
However, the method is not free from its own deficiencies; it is believed to be potentially
misleading for including net gains on monetary items on holding gain in income stated.
45
2.7 Components of Financial Statements Quality
Financial reporting is the most important product of the accounting system, the most
important goal of which is to provide necessary financial data to evaluate the economic
units, function and their ability to make profits (Salehi, 2009b). In the same vein, Telebnia,
Salehi and Kangarluei (2010) stressed that the quality of financial reporting indicates a limit
in which the financial reports of a company, its economic status, and functions which are
measured in a period of time, is presented honestly. Financial reporting is not only the
financial reporting product, but it is also a process which is formed by several components.
The quality of financial reporting ultimately depends on the quality of each part of these
reporting components. In view of this, the Financial Accounting Standard Board (FASB)
outlines the components of quality information: predictive ability, feedback value,
timeliness, verifiability, neutrality and representational faithfulness (Valury and Jenkins,
2006). The International Accounting Standard Board (1989) framework identifies four
principal qualitative characteristics of financial reports, viz: understandability, relevance,
reliability and comparability.
2.7.1 Understandability
Information in financial statements should be readily understandable by users who have
business, economics and accounting knowledge and willingness to study the information
carefully, although financial reports should be understandable, complex matters that are
relevant to economic decision – making should not be excluded merely because they are too
difficult for users to understand.
46
2.7.2 Relevance
Financial information should be relevant to the decision –making needs of users for it to be
useful. According to the IASB framework, information has the quality of relevance when it
influences the economic decisions of users by helping them evaluate past, present or future
events or confirming or correcting their past evaluations. Information may be considered
relevant either because of its nature or because it is material.
Financial information is material if its omission or misstatement could affect the economic
decisions of users. The IASB framework regards materiality as a threshold or cut-off point,
therefore any information that fails the test of materiality need not be disclosed separately in
the financial statements and vice versa.
2.7.3 Reliability
Information is said to be reliable when it is free from material bias and can be depended
upon by users to represent faithfully that which it either purports to represent or could
reasonably be expected to represent,[ICAN]. In view of the inherent difficulties in
identifying certain transactions, or in finding appropriate methods of measurement or
presentation, financial statements cannot be perfectly “accurate” hence faithful
representation might be regarded as describing to the closest that accountants can come
towards total accuracy.
2.7.4 Comparability
Comparability components of financial reporting enables users to compare the financial
statements of an entity through time, that is over a period of time), to identify trends in its
47
financial position and performance. It also enables financial statement users to compare
different entities to determine their relative financial positions, performance and changes in
financial positions, performance and changes in financial position.
Other ingredients of financial statements include; neutrality, prudence, completeness and
timeliness.
However, there is usually a tradeoff between and among these financial statement
ingredients, especially between Relevance and reliability (ICAN). Reliability measures the
degree of verifiability and objectivity of the accounting members, however, lack predictive
ability renders it inappropriate for current and future decision-making, while relevance
shows the extent of accounting numbers, currency, appropriates and fitness to the prevailing
economic reality, hence relevant to decision making. In view of this, relevance as a
component of financial statement quality is one of the key concepts that underscore this
study. In summary, the study rests on relevance of accounting numbers to financial
information users.
2.8 Impact of Price Level Changes on Financial Reports
For more than 65 years, the accounting profession has been reminded that inflation affects
the contents of financial statements. (Schneider, 2000). Earlier, one of leading accounting
researchers, Patton (1920) was not far behind in making a similar observation, he posits:“It
is evident that the whole problem (accounting for effects of changes in price law) is an
unsettled one, with much to be said on both sides. It is a question to be determined on its
own merits with particular reference to the sound needs of business management and not on
the basis of tradition. The accountant in general will do well to concentrate his attention on
48
the development of methods of bringing re-evaluations and their subsequent effects onto the
books in a manner which will not impair the integrity of original cost figures, nor lead to the
misinterpretation of financial reports, rather than take the position that the effects of
revaluation are outlawed for as accounting records are concerned. (Adopted from Wolk et al
1989).
In light of the above quote therefore, it is evident that inflation being the systematic decrease
in purchasing power and it erodes entities capital, is a fundamental fact of economic activity
over item and it creates serious financial reporting and financial management problems
(Gucenme, 2004). Thies and Sturrock (1987) in their study of inflation-adjusted Accounting
Data and the prediction of Bond ratings, established that: During inflationary period, the
traditional Historical Accounting model overstates profitability and misrepresents the
relative financial strengths of firms, hence raises a serious concern to an extent that analysts,
investors and other financial information cannot make informed financial decisions without
understanding the impact of inflation on financial information.
In the same vein, Gucenme (2004) posits that reports that are prepared according to
historical cost principle overstate profitability, weaken equity by causing over taxation and
reduce the accounting reports role in decision making within inflationary environments.
Looking critically at the two accounting valuation methods: Historical and Inflation –
adjusted Accounts, it was an established fact in literatures, that Historical Cost Accounting
model maintains only money capital of entities, by assuming that monetary values at the end
of an accounting period are comparable to monetary values at the beginning of the
accounting period, implicitly assuming stability of price level. The paradox here is that, the
49
capital purported to be maintained loses relevance and is eroded by price level changes in
periods of inflation. While, current value accounting model, maintains the physical capital,
comprising of predictive and operative capacities of entities.
In view of this controversy, the Conceptual framework of the International Accounting
Standard Board (IASB) also recognizes the capital maintenance concept; differentiating it
into financial and physical capital maintenance concepts, without however, emphasizing on
a particular concept. Financial capital maintenance, is defined as a profit earned only if the
amount of net assets at the end of a period exceeds the amount at the beginning of the
period, excluding any inflows from or outflows to owners, such as contribution and
distributions whereas, Physical capital maintenance, defined as income or capital as long as
the entities – productive or operating capacity at the end of a period is mentioned intact.
2.9 Effects of Inflation on Decision Making Process
A major impact on both financial theory and practice of financial decision making has been
the economic instability, especially in Prices (Mills, 1996). Inflation, as general price level
changes affects both internal and external users of financial information in their decision –
making processes. Inflation affects financial management, inventory management, working
capital management and investment decisions.
Financial management defined as the process of financial decision-making, has three
categories, namely: financing decisions, investment decisions and dividend decisions.
During inflationary conditions, the financial decisions should be influenced by the impact of
the declining purchasing power of money on the company. The single and important maxim
50
of financial management that influences every decision is that “time eats money”. This
maxim holds well even in the absence of inflation, because of cost of capital, it gains extra
strength during inflationary conditions. A finance manager should consider the basis of
decision making and pricing decisions while taking such decisions during the inflationary
conditions. (Gupta, 1998).
Basis of Decision – Making: The profit reported by Historical Cost accounting is inflated,
hence should not be the basis for decision making, therefore need to be adjusted. The pricing
policies undergo a dramatic transformation during inflation. Prices must be revised
frequently and sharply to accurately reflect the impact of inflation. Under investment
decisions, capital budgeting is one of the major tools which helps financial managers in
evaluating investment proposals. Inflation according to Kannadhasan (N.d) affects two
aspects of capital budgeting namely: projected cash flows and discounting rate. Inflation will
change the projected cash flows by making it different from those projected in the absence
of inflation. It also affects interest rates and in turn changes the cost of capital of an entity.
Furthermore, if investors do not get his return in real terms, he would suffer some loss in
terms of purchasing power of money.
Financing decisions need to be given a serious attention during inflationary periods. The
finance manager should consider inflation while embarking on his financing decision
processes. Loans may be taken on fixed rate basis and not on the basis of floating rate, as
floating rate rises in the case of inflation. He should note that the stock market may become
an uncertain source of capital. Shareholders will expect real rate of return in the form of
51
dividend as well as capital on their investment otherwise the share prices may go down in
the share market.
Inflation also affects the dividend – decisions of entities, liquidity position becomes a very
important determinant of dividend payment as during inflationary conditions, generally
companies face the shortage of cash. Besides, the finance manager should see that the
dividend decisions are based on real profit, calculated on the basis of inflation adjustment,
after providing depreciation on replacement cost basis, otherwise the company would be
consuming its capital, other issues, the finance manager has to pay attention to are;
understanding the time value of money and developing an appropriate inflationary
adjustment for capital replacement or the capital will disappear.(Gupta, 1998)
During period of rising prices, firms need more funds to finance working capital; hence, it
should be planned properly. Not understanding the impact of inflation on working capital
has been established by scholars to be the cause of many business failures. Cost of financing
the working capital rises because of increase in interest rates. Cash should never be allowed
to remain idle because time eats value of money, while on the other hand the company
suffers loss and the purchasing power of wealth kept declines. Daly (1985) in his study of
Canadian firms was able to establish that reported profits are overstated and total assets are
undervalued during and after periods of inflation with traditional accounting concepts
relative to an economic concept designed to maintain the firm as an ongoing entity It is at
this juncture we bring a conclusion by Mills (1996), that inflation has a positive correlation
with net working capital, thus, the higher the net working capital, the greater the impact of
52
inflation on capital spending and that corporation financial behavior is influenced by
inflation.
2.10 Review of Empirical Studies
There have been studies on the relevance, impact, effect and contribution of inflation
adjusted accounting data to the financial information quality of entities. Studies in this area
could be categorized into various groups as follows: studies that investigate the strength of
historical cost figures and inflation adjusted numbers on stock returns in terms of
information content; studies that investigate the predictive abilities of inflation adjusted data
for informed decision making, studies that assess the quality of financial reporting based on
inflation-adjusted data and their usage by investors and other users in their economic and
financial decisions. Other studies, on value relevance of the inflation adjusted numbers, the
group to which this study falls.
Sweeney (1922) was one of the early researchers in this area, he conducted a research on
effects of inflation on financial statement, the study concluded with a recommendation for
the use of index to adjust financial statement, from historical cost based to inflationary
based. However, the study was not particular about the index to be used in the adjustment.
McDonald and Morris (1984) in their US study of 630 firms, test the reaction of security
returns to anticipated and unanticipated inflation using SFAS 33 data. The result of the study
confirmed that, there was a significant negative impact of unanticipated inflation on security
returns for the period of 1980-82 covered by the study. However, the span of period covered
by the study was too short; only two years period was covered therefore the data used is also
53
limited to these two years, which might be too inadequate for any improvement in inflation–
data to be observed.
Matolcsy (1984) studies the joint and marginal information content of inflation-adjusted
accounting income numbers on 197 Australian firms. The study gathered sufficient evidence
to prove for the joint information content of inflation – adjusted and historical accounting
income numbers, but could not prove for the marginal information content of inflation
disclosure beyond historical cost figures. Thus, one of the null hypotheses was rejected
based on the findings of the study, this could be due to the usage of market model for
examining the inflationary effects, besides the application of consumer price index (CPI) in
adjusting the accounts to reflect current economic realities. In addition, absence
consideration for the impact of inflation adjustment on the estimates of systematic risk as
used in the model. Furthermore, Bublitz, Frecka and Mckeown (1985) in their re
examination of whether statement no 33 mandated disclosures add explanatory power to
models containing historical cost earnings variables, found no significant incremental
explanatory power for the statement no 33 variables.
Bernard and Ruland (1987) investigate the incremental information content of Historical
cost and current cost income numbers using industry-by-industry time-series analysis on 113
US firms for 19 years. They found evidence of incremental information content in current
cost income for a small subset of industries whose correlation between historical cost
income and current cost income is low. However, the study suffered from sampling
problems because firms were selected randomly without any specified sampling technique,
54
which resulted into few firms constituting the sample size, hence, there is existing
survivorship bias.
Thies and Sturrock (1989) in their study of 100 large U.S. manufacturing firms, investigates
the ability of inflation adjusted accounting data in predicting bond ratings relative to
historical cost data. The study found for the period of the study that moderate inflation –
historical cost accounting data proved to have almost as much predictive content as inflation
– adjusted data. The study concluded that real contribution of inflation accounting may not
be in the financial analysis of large public corporations for which market value of equity is
available, instead, real contribution may exist in the financial analysis of small or non-public
corporations and non-incorporated firms, for which market valuation is not readily available.
This might be as a result of restricting the sample of the study to moody industrial debt
ratings which designed for a different purpose. The result of this study however, is opposed
to that of Bernard and Ruland (1987) that established evidence for small sample size and
low income companies. The reason for this might be from the differences in technique of
analyses and the sample sizes used in two studies.
Kirkulak and Balsari (2009) investigated the role plays by incremental information content
of inflation accounting in explaining the market value of equity and stock returns on Istanbul
stock exchange (ISE). Regression model was used as the technique for data analysis based
on Olhson (1995) price valuation model. The study found that investors mainly take
earnings and inflation adjusted ratios into consideration when making investment decisions
and that inflation adjusted results have slightly more predictive power for stock returns than
inflation non-adjusted results. Therefore, concluded, that both inflation-adjusted and
55
historical cost data complement each other. There would have been a more improved result
if the period covered by the study is longer than two years, as adopted by the study.
The findings and conclusion of kirkulak and Balsari (2009) is however different from that
of Brayshaw and Miro (1985), where they found lack of evidence in support of a market
response to disclosure of current cost adjustments, when investigating the information
content of inflation – adjustment financial statements of 112 firms in the UK. Nevertheless,
the study was not free from the problem of coverage, as it considered only two accounting
years for the study.
Barniv (1999) examines the value relevance of unexpected inflation-adjusted earnings
against the historical – cost- based earnings on 106 publicly traded manufacturing firms in
the Israel. The findings of the study shows that the explanatory powers of the inflation –
adjusted earnings are statistically higher than those of the historical – cost regression. Thus,
concluded that inflation adjusted earnings (IAE) are value relevant beyond the historical cost
earnings in a hyperinflationary environment. However, this study concentrated only on
earnings; therefore nothing could be said about the asset figure, which is one of the most
important accounting numbers affected by inflation.
Gordon (2001) assesses the value relevance of historical cost, price level and replacement
cost, accounting on Mexican data. The analyses of their findings support their conclusion
that price level and replacement cost Accounting adjustments are value relevant beyond
historical cost. Their results indicate that replacement cost adjustments are relatively and
incrementally relevant beyond both historical cost and price level measures while price level
56
adjustments accounting figures are incrementally value relevant beyond historical cost
measures during the period examined. However, the sample size used for the study was
small, implying that the results might differ if a large sample size was used and secondly,
the variables used were estimated which indicates the possibility of measurement error.
Konchitchki (2009) in assessing the implications of inflation and nominal financial reporting
on firm performance and stock prices of 3,891 US firms, for 81,575 firm-year observations,
found that unrecognized inflation gains are informative for predicting future cash flows and
stock prices do not fully reflect the implications of inflation gains for future cash flows. He
further found that stock prices act as if investors do not fully distinguish between monetary
and nonmonetary asset, which is pertinent to determining the true effects of inflation. Hence,
concluded that unrecognized inflation effects have significant economic implications, even
during a period in which inflation is relatively low. However, the study employed cross
sectional data set, which might be biased as a result of industry peculiarity.
The findings of Bello (2009) are also of relevance to the current study where his results,
demonstrated relevance of inflation adjusted accounts on the quality of financial reporting,
as well as additional value as result of joint information content in the financial reporting.
However, his test of relative absolute value relevance revealed no evidence of additional
relevance on individual basis by both CCA and MCC beyond the traditional Historical Cost
Accounting model in absolute term. The findings of this study might not be unconnected
with the fact that the period covered by the study was prior to the global financial crisis and
as well the SPSS Software used for the study is not as robust as STATA and EVIEWS that
the current study intends to employ.
57
The fact that bulk of the studies ended with absence of evidence in favor of inflation –
adjusted data does not mean that research and further debates in this area is no longer
needed. Most of these studies were either carried out in developed economies where
inflation rate is within check; therefore hardly would one find significant evidence in favor
of inflation adjusted numbers or were carried out in developing economies at time when the
inflationary conditions of the countries are at a moderate rate.
Other reasons might not be unconnected with the choice of industry for the study, the
dataset and choice of methodology, especially the data analysis technique. The current study
tends to differ from all above, by using a panel data set with a modified tool of analysis
[modified Ohlson (1995) model], and numerous robustness tests that are to be captured in
section three of the work..
2.11 Theoretical Framework and Model Development
The theory that underpins this study is the decision usefulness theory as propounded by
normative theorist in the 1960s.the theory relates accounting objective to its reporting and
operating environment. This was officially propounded in the Trueblood Committee Report
of 1973 and thus instrumental to the development of FASB conceptual frameworks between
1974 and 1985 (Sutton, 2009). According to (Ravenscroft and Williams, 2009) The theory
was further formalized by Staubus (1999), “that for over forty years, the criteria around
which financial reporting policy making and related academic researches has been centered
is decision usefulness”.
58
Financial Reporting Objectives is premised within decision usefulness of Accounting
Information because the basic principle of the theory is that additional information can
change a decision maker’s prior beliefs, and therefore tends to act in a more rational way.
Providing useful information in making investment and credit decisions reflect expectation
about the future, this useful information, also enable financial information users to estimate
value and focus on earnings and its components. The overriding quality that makes
information useful is its contribution to a more accurate prediction of future economic
condition. Therefore, for any information to influence any decision making, it must be
relevant and timely. Thus, the incremental information content of inflation-adjusted
accounts are expected to better off the financial information users in terms of firms valuation
and earnings expectations.
Following the works of Maximillian and Max (2011), the study shall adopt an extended
version of Ohlson (1995) model, which rests directly on clean surplus relations. This theory
provides a complete framework in dealing with value of accounting data; it forces value to
depend on accounting data, because the data influences the evaluation of the present value of
expected dividends, Olhson (1995). Clean Surplus Accounting Relations states that the value
of a firm equals to its current book value plus change in future abnormal earnings. The
theory is a product of the classical works of Edwards and Bell (1961), also known as
Residual Income model.
The model has been widely used in empirical studies for testing the differences that exist in
the value relevance of Accounting Information under different Reporting Requirements –
59
(Sami & Zhou, 2004, Kirkulak & Kaytmaz, 2009,). Therefore, the basic form of the model is
presented as:
�� = ∑ ��"��
α��� �δ� + ��…………………………………………………… (1)
Where
Pt= the market value, or price of the firm’s equity at date t.
δt = net dividend paid at date t
Rf = the Risk foree rate plus one
Et[.] = the expected value operator conditioned for the date t
The model permits negative dividend (dt), that is capital contribution exceeding dividends
may occur.
Ohlson went further to impose the clean surplus relation by introducing restriction, which is
change in book value of equity bvt between two dates, equals current earnings λt. It also
assumes that dividends reduce bvt. He formalizes the equation into two aspects of owners’
equity accounting.
��� = ����� + λ� − ��……………………………………………………….. (2)
And
������
= − 1………………………………………………………………………… (3)
������
= 0……………………………………………………………..…………… (4)
The Assumptions under clean surplus theory further implies that any change in assets and
liabilities of a company have to pass through the income statement, therefore to reflect this
assumption as enunciated by Edwards and Bell (1961), the dividend dt from equation (1), bvt
and λt, from equation (2), result to the following equation.
60
�� = ��� + ∑ (1 + + γ�)���������− ����� + �− 1�α��� …………………………..(5)
Where
Pt = the market value or price of the firm’s equity
bvt = book value of a company at time t
rf = Risk free returns
E = the expected value of operator conditioned on the date t information.
et+1= Earnings over due period.
rfbvt+i-1 = Abnormal earnings over period t.
The above equation (5) is now transformed into the following ordinary least square (OLS)
regression model; this is in line with many studies carried out using EBO model (e.g.
Maxmillian & Max, 2011).
Ƥit = β0 + β1erit + β2bvit + Ɛit………………………………………………………….(6)
Where:
Pit = market price of firm i at time t
β0 = the interception of the model
erit = earnings of firm i at time t
bvit = book value of firm i at time t
Ɛit = error term
following leading literatures in Accounting that implicitly or explicitly follows Ohlson and
Feltham (1995) Model, the study regresses the market- price of firms on the firms book
value, current earnings and other proxies for expected earnings growth, which represents the
future residual earnings of a company as put by Edwards and Bell (1961).
61
By including proxies for expected growth in earnings, into a regression model for firm
valuation, it mitigates the loss in explanatory power of accounting information imposed by
those proxies on the firms’ market prices; that is lack of relevance in the accounting
information as a result of their exclusion. Consistent with prior researches, such as Darrough
and Ye (2007), the study includes Capital expenditures, represented by “cpx” in the model;
to cater for expected growth in future earnings due to investments in tangible assets; this is
also in line with the approach of Samy and Mohammed (1998); and Core, Guay and
Buskirk, (2003).
Ƥit = β0 + β1erit + β2bvit + β3cpxit + Ɛit…………………………………………… (7)
Sales growth of a company over a preceding accounting year is also added into the model;
represented by “slg” as an additional proxy variable for future earnings growth (e.g. Wu.
Fergher and Wright, 2010).The modified EBO model is therefore stated thus:
Ƥit = β0 + β1erit + β2bvit + β3cpxit + β4slgit + Ɛit…………………………….………..... (8)
To control for possible nonlinearity in the model for firms with positive or negative sales
growth, the study introduces a dummy variable “Negative sales growth” represented by
“nsg”, which shall take the value of one when the growth is positive and zero when it is
negative, (Darrough & Ye, 2007).
Ƥit = β0 + β1erit + β2bvit + β3cpxit + β4slgit + β5nsgit + Ɛit…………………………….. (9)
To control for firms size, previous studies used various parameters, Wang and Alam (2007)
used total Assets for the control, while Muhanna and Stoel (2010) used total sales figure per
share. The study adopts the lagged total sales figure scaled by share. This is represented in
62
the model by “st”, this is needed to avoid a possible occurrence of multi-co linearity. Hence
the following equation:
Ƥit = β0 + β1erit + β2bvit + β3cpxit + β4slgit + β5nsgit + β6sti-t + Ɛit……………………… (10)
In deflating variables used in the EBO model, researchers used various deflating factors
ranging from beginning of period book value, end of period book value to number of shares
outstanding. This study goes ahead to deflate all the variables in equation (10) by number of
shares outstanding at end of each accounting period covered by the study, this is consistent
with Bello (2009).
To achieve the objective of the study, the study now introduces the inflation component into
the model owing in mind that market price is not always equal to book value in an
inflationary environment, hence the following equations.
Ƥit = β0 + β1erithc + β2bvit
hc + β3cpxithc + β4slgit
hc + β5nsgithc + β6sti-t
hc + Ɛit…………… (11)
Where the above equation represents the historical cost model, with superscript “hc”
Ƥit = β0 + β1eritinf + β2bvit
inf + β3cpxitinf + β4slgit
inf + β5nsgitinf + β6sti-t
inf + Ɛit…………… (12)
Where equation (12) represents the inflation accounting model. Furthermore, subtracting
equation (11) from equation (12) results in the marginal value that forms our marginal
information content model. This approach is taken to underscore the statement by Matolcosy
(1984) that the Marginal information content, is the information content of that signal
beyond the information content of all other simultaneously recognized signals. The model is
stated thus:
Ƥit = β0+ β1eritm+ β2bvit
m+ β3cpxitm+ β4slgit
m+ β5nsgitm + β6sti-t
m+ Ɛit………………….. (13)
63
Combining equations (11) and (12), a new model that addresses the joint reporting emerges.
This is because; joint information content is the sum of the information contents of
simultaneously realized signals, hence the combination.
Ƥit = β0 + β1erithc + β2erit
inf + β3bvithc + β4bvit
inf + β5cpxithc + β6cpxit
inf + β7slgithc + β8slgit
inf +
β9nsgit+ β10sti-t + Ɛit……………………………………………………………. (14)
Thus, equations (11), (12), (13) and (14) are the parsimonious equations used to test all the
hypotheses formulated in chapter one of the study,
2.12 Summary
This chapter begins with conceptualization of inflation, thereby discusses the causes, types,
process and procedures of measuring inflation. The chapter also reviews inflationary trends
in Nigeria, income and its measurement and income valuation approaches. It goes ahead to
review the concept of joint and marginal information content of financial report, inflation
accounting technique, components of financial statements quality, impacts of price level
changes on financial reports, as well as the effects of inflation on decision making process.
Other relevant parts of this chapter are the review of empirical studies, theoretical
framework and model development where the parsimonious models used for the study were
arrived at.
64
CHAPTER THREE
RESEARCH METHODOLOGY
3.1 Introduction
This chapter presents the design of the study, population, methods of data collection and
instruments. It also presents the technique of data analysis employed. It gives a vivid
explanation of the study structure, it concludes by justifying the methodology.
3.2 Research Design
In testing the hypotheses the price approach based on the Ohlson (1995) model though
modified for the purpose of this study, to capture some other value relevant variables that
aid in explaining further, the earning potentials of entities, this approach is in line with Wu
et al (2010) and Darrough et al (2007). In view of the above, a Correlation Research design
was used. This is further justified by the number of independent variables obtained in each
of equations used for the models. It also enables the researcher to capture as much as
possible variables that impact on the future earnings of the entities, which is translated into
their market prices.
Finally, the study employs the use of ex post factor design. The historical aspect allows for
obtaining relevant accounting figure from companies annual reports and accounts, as well as
the Nigerian Stock Exchange fact book, while the experimental aspect enables the researcher
to conduct examination in pursuance of the objectives.
3.3 Population and Sample of the Study The population of the study constituted all the
nine (9) quoted Downstream Petroleum firms on the Nigerian Stock Exchange as at
December 2011. The Relevant Accounting figures were obtained from the historically based

65
annual reports and accounts of the firms, which are adjusted for inflation with the aid of the
Excel software. The study adopts census strategy that is using the entire elements of the
population. However, for a company to be enlisted, it must have scaled the following
criteria:
i. A company must be quoted and remain quoted on the Nigerian Stock Exchange within the
last ten years.
ii. It shares must have been traded on the exchange within the period covered by the study.
iii. A company shall be enlisted based on data availability.
After applying the above filtering criteria, three companies were eliminated. The companies
were: Eterna Oil and Gas Company, Afroil Plc and Beco Petroleum and Products. The study
finally arrived at six firms, which constituted filtered population subjected to analysis.
3.4 Sources and Method of Data Collection
The data were obtained purely from the secondary sources. It was collected from the
published financial statements of the Companies, covering a period of seven years (2005 to
2011). The Nigerian Stock Exchange fact book and the available annual reports and
accounts of the companies were basically utilized.
Finally, for the purpose of this study, the research uses the price index provide by the
Central Bank of Nigeria, CBN, to track the price changes. This rate is used in adjusting
relevant figures in financial statements to reflect the inflation adjusted status of the
organizations
.
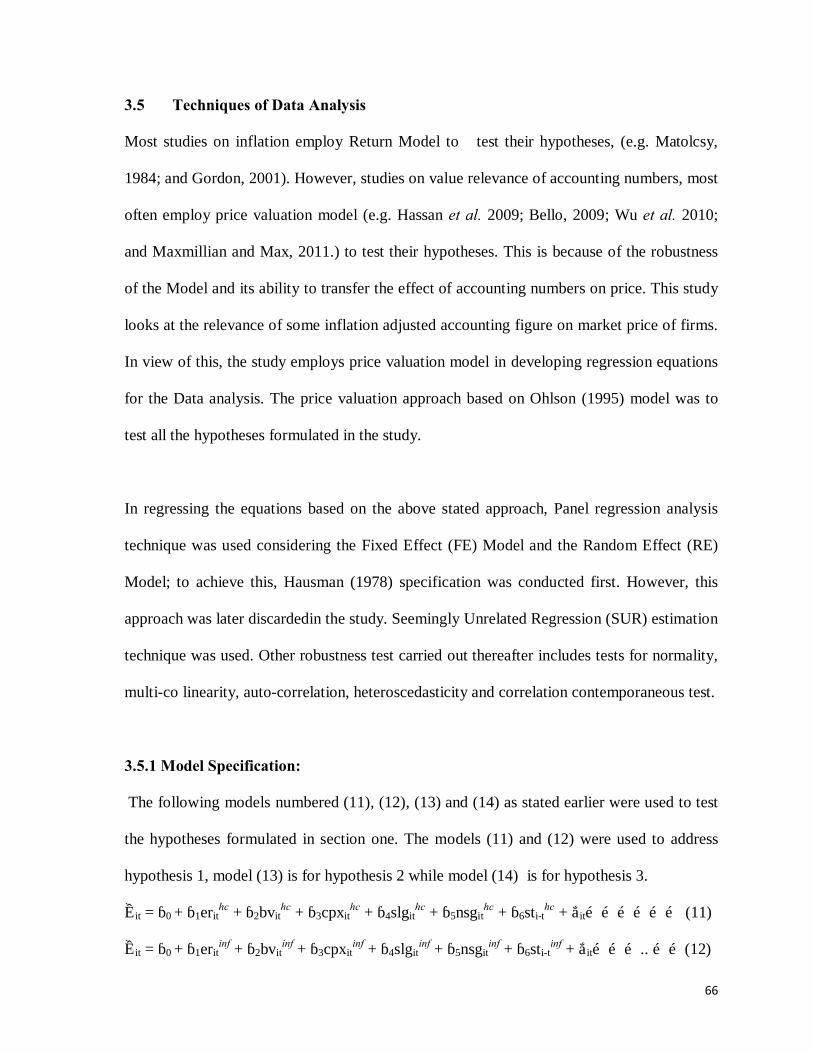
66
3.5 Techniques of Data Analysis
Most studies on inflation employ Return Model to test their hypotheses, (e.g. Matolcsy,
1984; and Gordon, 2001). However, studies on value relevance of accounting numbers, most
often employ price valuation model (e.g. Hassan et al. 2009; Bello, 2009; Wu et al. 2010;
and Maxmillian and Max, 2011.) to test their hypotheses. This is because of the robustness
of the Model and its ability to transfer the effect of accounting numbers on price. This study
looks at the relevance of some inflation adjusted accounting figure on market price of firms.
In view of this, the study employs price valuation model in developing regression equations
for the Data analysis. The price valuation approach based on Ohlson (1995) model was to
test all the hypotheses formulated in the study.
In regressing the equations based on the above stated approach, Panel regression analysis
technique was used considering the Fixed Effect (FE) Model and the Random Effect (RE)
Model; to achieve this, Hausman (1978) specification was conducted first. However, this
approach was later discardedin the study. Seemingly Unrelated Regression (SUR) estimation
technique was used. Other robustness test carried out thereafter includes tests for normality,
multi-co linearity, auto-correlation, heteroscedasticity and correlation contemporaneous test.
3.5.1 Model Specification:
The following models numbered (11), (12), (13) and (14) as stated earlier were used to test
the hypotheses formulated in section one. The models (11) and (12) were used to address
hypothesis 1, model (13) is for hypothesis 2 while model (14) is for hypothesis 3.
Ƥit = β0 + β1erithc + β2bvit
hc + β3cpxithc + β4slgit
hc + β5nsgithc + β6sti-t
hc + Ɛit……………… (11)
Ƥit = β0 + β1eritinf + β2bvit
inf + β3cpxitinf + β4slgit
inf + β5nsgitinf + β6sti-t
inf + Ɛit……….. ……(12)
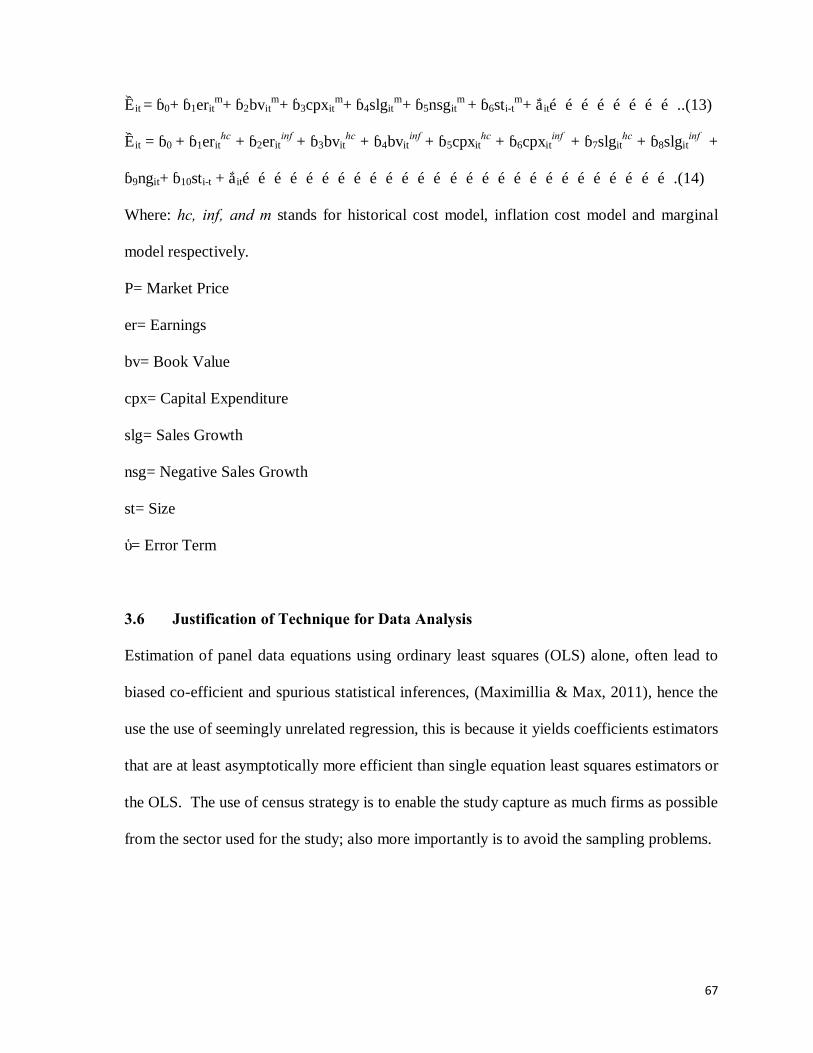
67
Ƥit = β0+ β1eritm+ β2bvit
m+ β3cpxitm+ β4slgit
m+ β5nsgitm + β6sti-t
m+ Ɛit……………………..(13)
Ƥit = β0 + β1erithc + β2erit
inf + β3bvithc + β4bvit
inf + β5cpxithc + β6cpxit
inf + β7slgithc + β8slgit
inf +
β9ngit+ β10sti-t + Ɛit……………………………………………………………………….(14)
Where: hc, inf, and m stands for historical cost model, inflation cost model and marginal
model respectively.
P= Market Price
er= Earnings
bv= Book Value
cpx= Capital Expenditure
slg= Sales Growth
nsg= Negative Sales Growth
st= Size
ɛ= Error Term
3.6 Justification of Technique for Data Analysis
Estimation of panel data equations using ordinary least squares (OLS) alone, often lead to
biased co-efficient and spurious statistical inferences, (Maximillia & Max, 2011), hence the
use the use of seemingly unrelated regression, this is because it yields coefficients estimators
that are at least asymptotically more efficient than single equation least squares estimators or
the OLS. The use of census strategy is to enable the study capture as much firms as possible
from the sector used for the study; also more importantly is to avoid the sampling problems.
68
3.7 Summary
The study employs correlational research design with multiple regressions as a technique for
analysis. A census strategy was used applying some filtering criteria on the overall
population. This led to the emergence of six firms that qualified for the study. The study
uses purely a secondary source of data, from annual reports and accounts of the firms.
Consequently, the chapter comes to an end with a justification of the design and population.
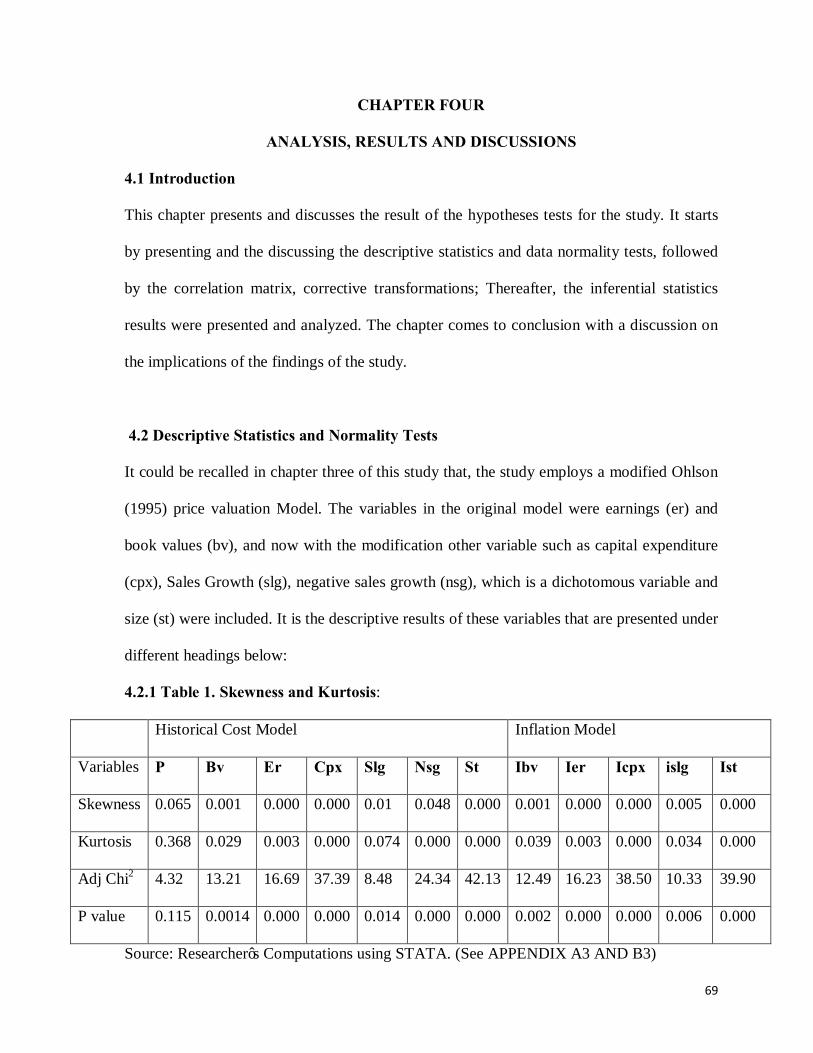
69
CHAPTER FOUR
ANALYSIS, RESULTS AND DISCUSSIONS
4.1 Introduction
This chapter presents and discusses the result of the hypotheses tests for the study. It starts
by presenting and the discussing the descriptive statistics and data normality tests, followed
by the correlation matrix, corrective transformations; Thereafter, the inferential statistics
results were presented and analyzed. The chapter comes to conclusion with a discussion on
the implications of the findings of the study.
4.2 Descriptive Statistics and Normality Tests
It could be recalled in chapter three of this study that, the study employs a modified Ohlson
(1995) price valuation Model. The variables in the original model were earnings (er) and
book values (bv), and now with the modification other variable such as capital expenditure
(cpx), Sales Growth (slg), negative sales growth (nsg), which is a dichotomous variable and
size (st) were included. It is the descriptive results of these variables that are presented under
different headings below:
4.2.1 Table 1. Skewness and Kurtosis:
Historical Cost Model Inflation Model
Variables P Bv Er Cpx Slg Nsg St Ibv Ier Icpx islg Ist
Skewness 0.065 0.001 0.000 0.000 0.01 0.048 0.000 0.001 0.000 0.000 0.005 0.000
Kurtosis 0.368 0.029 0.003 0.000 0.074 0.000 0.000 0.039 0.003 0.000 0.034 0.000
Adj Chi2 4.32 13.21 16.69 37.39 8.48 24.34 42.13 12.49 16.23 38.50 10.33 39.90
P value 0.115 0.0014 0.000 0.000 0.014 0.000 0.000 0.002 0.000 0.000 0.006 0.000
Source: Researcher’s Computations using STATA. (See APPENDIX A3 AND B3)

70
As could be seen from the table 1 above, all variables from the two models (Historical and
Inflation models) with the exception of price, are normally skewed and are significant at 1%
level. They are within the zero regions for Skewness. However, with a little exception on
price, whose probability is insignificant. This might be as a result of frequent changes in fuel
prices in Nigeria that automatically affects earnings which in turn could have an impact on
the firms’ market prices. Variables such earnings, capital expenditure and size standout from
the above results, as they show a perfect zero skewness, thereby indicating more normalized
distribution than others.
On the overall, the result indicates that the average value, mean of the distribution is equal to
the median and to the mode as would be proven or otherwise by additional descriptive
statistics. It further indicates that the distribution is neither skewed to the right nor to the left
and therefore the entire distributions are symmetrical with exception of price. The kurtosis
indicates that the variables are Platykurtic, less peaked; an indication that there are no
extreme values or outliers in the in the distributions that might cause estimation bias. The
result also shows that the values are far less than the acceptable boundary of 3; this means
that the distributions have thicker tails and lower peak compared to standard normal
distribution, using kurtosis as a yardstick.
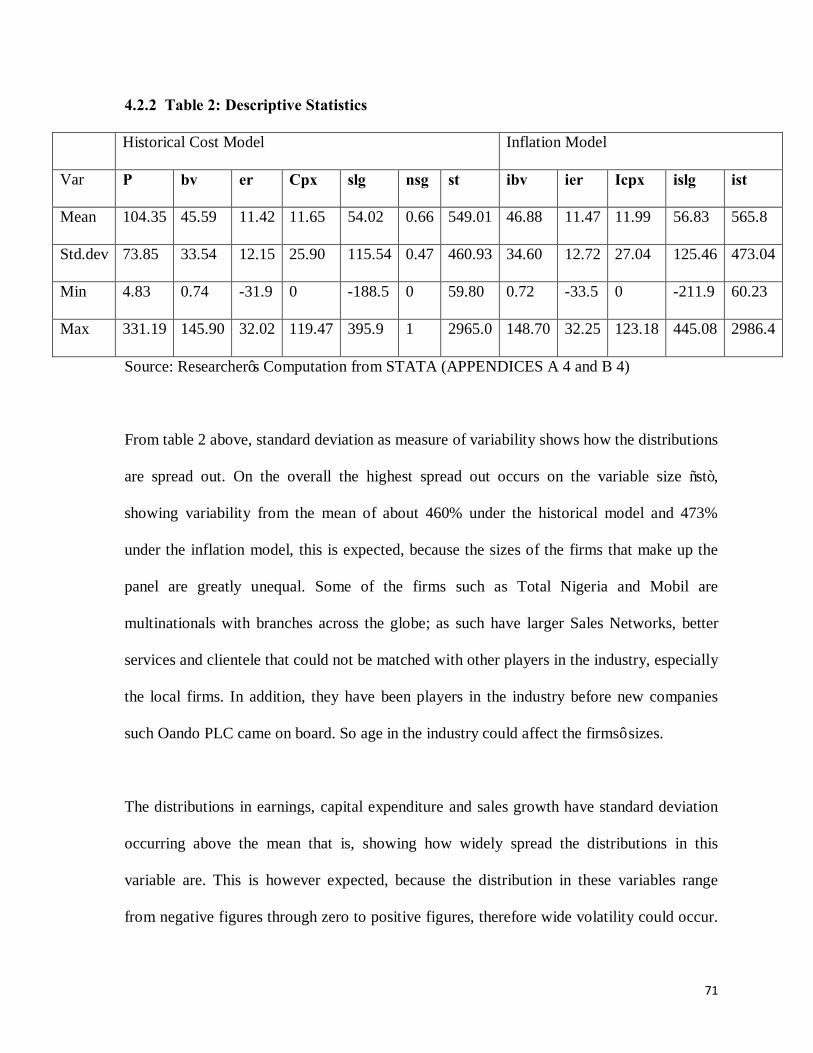
71
4.2.2 Table 2: Descriptive Statistics
Historical Cost Model Inflation Model
Var P bv er Cpx slg nsg st ibv ier Icpx islg ist
Mean 104.35 45.59 11.42 11.65 54.02 0.66 549.01 46.88 11.47 11.99 56.83 565.8
Std.dev 73.85 33.54 12.15 25.90 115.54 0.47 460.93 34.60 12.72 27.04 125.46 473.04
Min 4.83 0.74 -31.9 0 -188.5 0 59.80 0.72 -33.5 0 -211.9 60.23
Max 331.19 145.90 32.02 119.47 395.9 1 2965.0 148.70 32.25 123.18 445.08 2986.4
Source: Researcher’s Computation from STATA (APPENDICES A 4 and B 4)
From table 2 above, standard deviation as measure of variability shows how the distributions
are spread out. On the overall the highest spread out occurs on the variable size “st”,
showing variability from the mean of about 460% under the historical model and 473%
under the inflation model, this is expected, because the sizes of the firms that make up the
panel are greatly unequal. Some of the firms such as Total Nigeria and Mobil are
multinationals with branches across the globe; as such have larger Sales Networks, better
services and clientele that could not be matched with other players in the industry, especially
the local firms. In addition, they have been players in the industry before new companies
such Oando PLC came on board. So age in the industry could affect the firms’ sizes.
The distributions in earnings, capital expenditure and sales growth have standard deviation
occurring above the mean that is, showing how widely spread the distributions in this
variable are. This is however expected, because the distribution in these variables range
from negative figures through zero to positive figures, therefore wide volatility could occur.
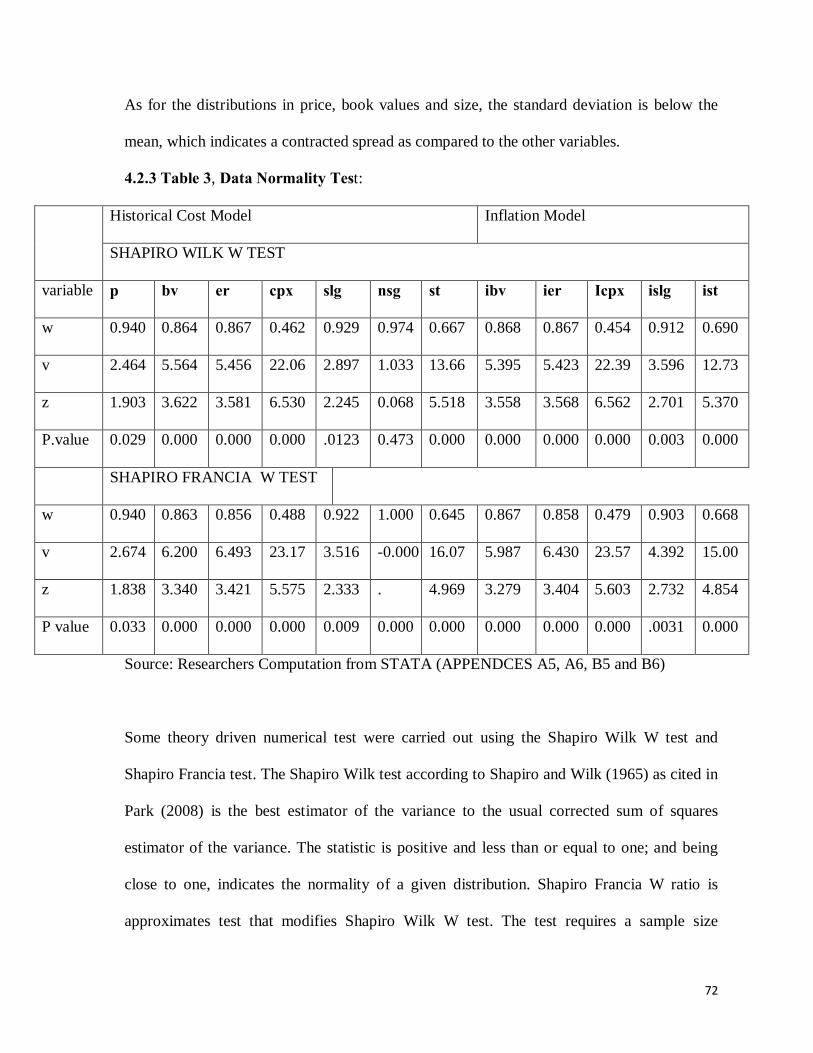
72
As for the distributions in price, book values and size, the standard deviation is below the
mean, which indicates a contracted spread as compared to the other variables.
4.2.3 Table 3, Data Normality Test:
Historical Cost Model Inflation Model
SHAPIRO WILK W TEST
variable p bv er cpx slg nsg st ibv ier Icpx islg ist
w 0.940 0.864 0.867 0.462 0.929 0.974 0.667 0.868 0.867 0.454 0.912 0.690
v 2.464 5.564 5.456 22.06 2.897 1.033 13.66 5.395 5.423 22.39 3.596 12.73
z 1.903 3.622 3.581 6.530 2.245 0.068 5.518 3.558 3.568 6.562 2.701 5.370
P.value 0.029 0.000 0.000 0.000 .0123 0.473 0.000 0.000 0.000 0.000 0.003 0.000
SHAPIRO FRANCIA W TEST
w 0.940 0.863 0.856 0.488 0.922 1.000 0.645 0.867 0.858 0.479 0.903 0.668
v 2.674 6.200 6.493 23.17 3.516 -0.000 16.07 5.987 6.430 23.57 4.392 15.00
z 1.838 3.340 3.421 5.575 2.333 . 4.969 3.279 3.404 5.603 2.732 4.854
P value 0.033 0.000 0.000 0.000 0.009 0.000 0.000 0.000 0.000 0.000 .0031 0.000
Source: Researchers Computation from STATA (APPENDCES A5, A6, B5 and B6)
Some theory driven numerical test were carried out using the Shapiro Wilk W test and
Shapiro Francia test. The Shapiro Wilk test according to Shapiro and Wilk (1965) as cited in
Park (2008) is the best estimator of the variance to the usual corrected sum of squares
estimator of the variance. The statistic is positive and less than or equal to one; and being
close to one, indicates the normality of a given distribution. Shapiro Francia W ratio is
approximates test that modifies Shapiro Wilk W test. The test requires a sample size
73
between 7 and 2000; this is unlike other form of normality test such as Jacque Bera that
requires the sample size to be between 5 and 5000.
The test as used above best suit the dataset of the study as it ranges between 1 and 42
observations per variable. A significant P-value of the W ratio in both Shapiro Wilk and
Shapiro Francia indicates the probability that the null hypothesis of normality is true.
Therefore, if the P-value is not significant, it means that the distribution is statistically not
normally distributed.
From table 3 above, (considering Shapiro Wilk first) price, book value, earnings and sales
growth from the two models (Historical and inflation adjusted models) have values almost
close to one and are significant at 1% level, thus indicating how normally distributed the
variables are more than Capital expenditure which has a mild W ratio value, though also
significant 1% level. Except for negative sales growth that has a W ration close to one but
insignificant at 1% level, this result is however expected because the data was dichotomized
ranging from 0 to 1 to cater for possible nonlinearity in variable sales Growth that could be
caused by decrease in turnover through the succeeding years covered by the study.
Furthermore, with the approximated “W” ratio value from Shapiro Francia W test, the
normality of the distributions were proved further as all variables were significant at 1%
level, thus confirming the null hypothesis, that the data are normally distributed, however,
with the exception of negative sales growth, “nsg” on which the rule of normality could not
be obviously assumed, because of its dichotomous nature. With the foregoing therefore, the
dataset could be declared normally distributed for further analysis in the study.
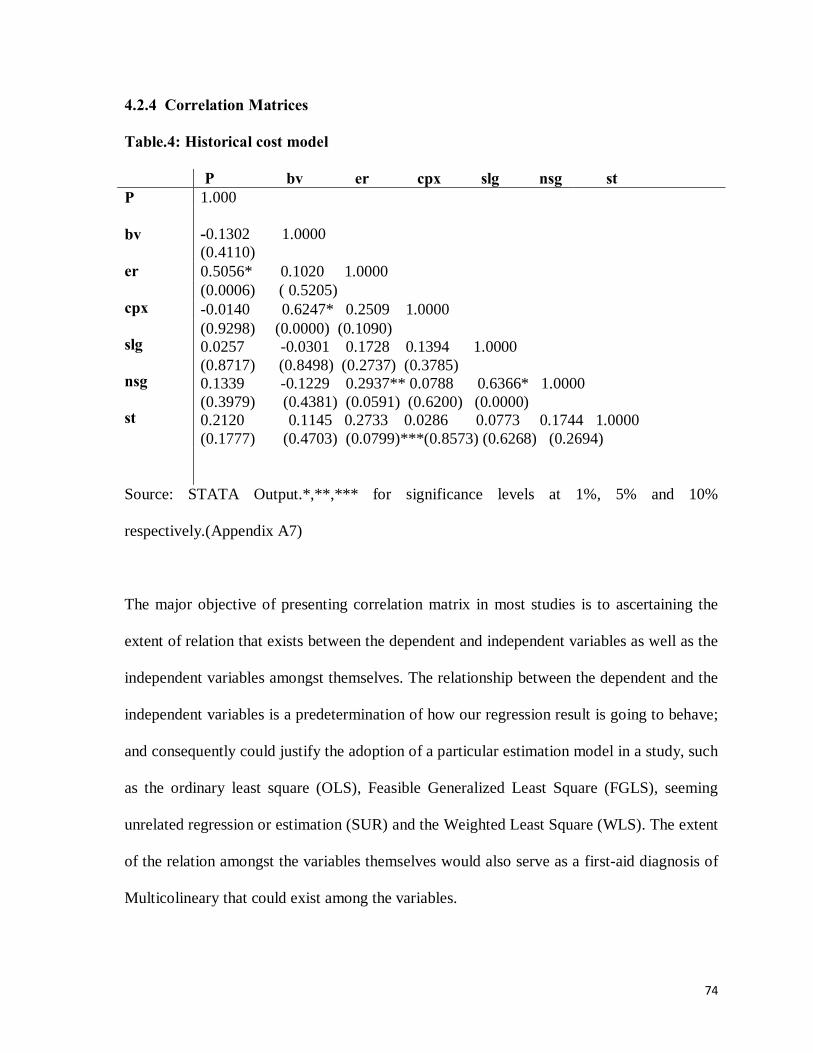
74
4.2.4 Correlation Matrices
Table.4: Historical cost model
Source: STATA Output.*,**,*** for significance levels at 1%, 5% and 10%
respectively.(Appendix A7)
The major objective of presenting correlation matrix in most studies is to ascertaining the
extent of relation that exists between the dependent and independent variables as well as the
independent variables amongst themselves. The relationship between the dependent and the
independent variables is a predetermination of how our regression result is going to behave;
and consequently could justify the adoption of a particular estimation model in a study, such
as the ordinary least square (OLS), Feasible Generalized Least Square (FGLS), seeming
unrelated regression or estimation (SUR) and the Weighted Least Square (WLS). The extent
of the relation amongst the variables themselves would also serve as a first-aid diagnosis of
Multicolineary that could exist among the variables.
P bv er cpx slg nsg st P bv er cpx slg nsg st
1.000 -0.1302 1.0000 (0.4110)
0.5056* 0.1020 1.0000 (0.0006) ( 0.5205) -0.0140 0.6247* 0.2509 1.0000 (0.9298) (0.0000) (0.1090) 0.0257 -0.0301 0.1728 0.1394 1.0000 (0.8717) (0.8498) (0.2737) (0.3785) 0.1339 -0.1229 0.2937** 0.0788 0.6366* 1.0000 (0.3979) (0.4381) (0.0591) (0.6200) (0.0000) 0.2120 0.1145 0.2733 0.0286 0.0773 0.1744 1.0000 (0.1777) (0.4703) (0.0799)***(0.8573) (0.6268) (0.2694)
75
From table 4 above, which is the correlation matrix for Historical Cost Model, only
earnings has a significant positive correlation with the price. This indicates that to large
extent earnings influences the price of petroleum firms at 51%. Two other variables that are
of concern, from the result, are book values and capital expenditures, which show a negative
relationship with price. It is a striking result which is not unconnected with the domain of
the study, the downstream sector of the Nigerian petroleum industry. In the Nigerian setting
the industry is largely a service oriented sector, marketing petroleum products and allied
services. So any capital expenditure and book value could have a negative correlation with
the market prices of the firms as indicated by the results.
Further, among the predictors, a significant positive correlation exist between book value
“bv” and capital expenditure “cpx”, this is however expected, because the more the firms
incur additional capital expenditure the more robust the book value of the firm is, as there
would be a significant increase in the asset size of the firms. However, the correlation
between the two predictors is not to the extent that could cause an estimation bias in terms of
collenearity. It is worth noting at this point, that the dichotomized negative sales growth
“nsg” has actually taken care of the negativities in the variable, sales growth “slg” as
predicted during the model build up in chapter two. The relationship is at 64%. Sequel to the
foregoing, earnings of the firms have a significant positive relationship with the size of the
firms, this implies that the bigger the size of a firm the higher the earnings.
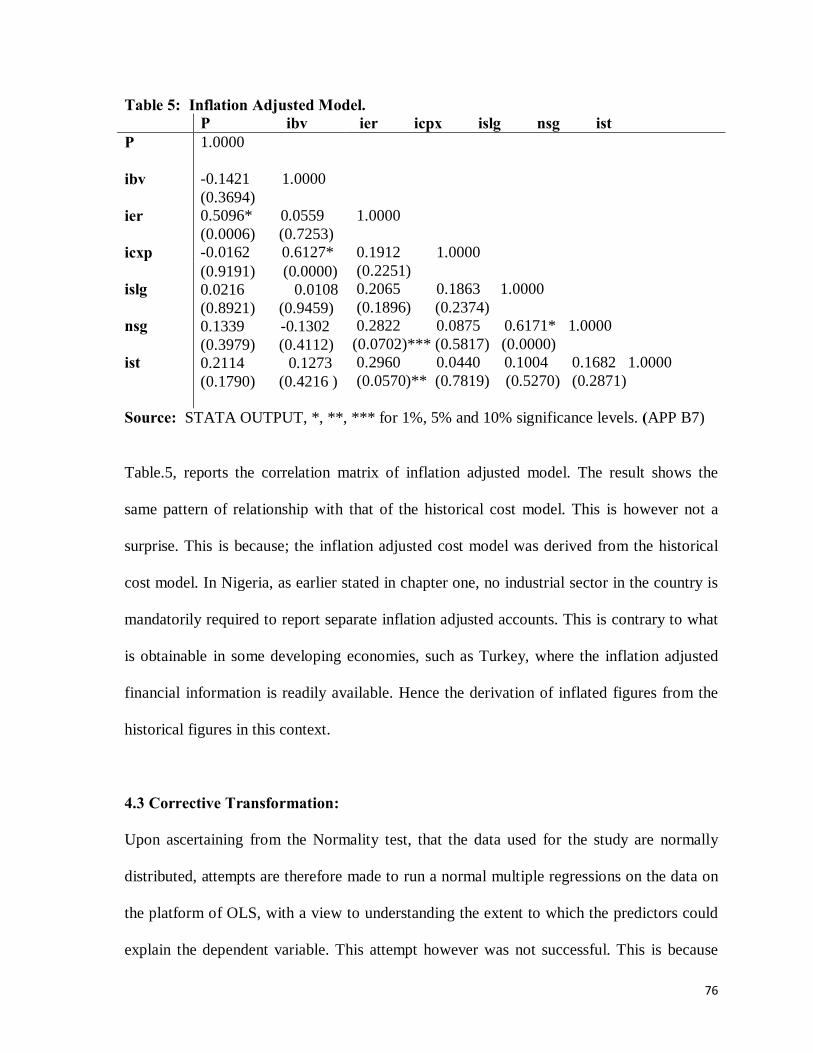
76
Table 5: Inflation Adjusted Model. P ibv ier icpx islg nsg ist P ibv ier icxp islg nsg ist
1.0000 -0.1421 1.0000 (0.3694) 0.5096* 0.0559 (0.0006) (0.7253) -0.0162 0.6127*
1.0000 0.1912 1.0000 (0.2251) 0.2065 0.1863 1.0000 (0.1896) (0.2374) 0.2822 0.0875 0.6171* 1.0000 (0.0702)*** (0.5817) (0.0000) 0.2960 0.0440 0.1004 0.1682 1.0000 (0.0570)** (0.7819) (0.5270) (0.2871)
(0.9191) (0.0000) 0.0216 0.0108 (0.8921) (0.9459) 0.1339 -0.1302 (0.3979) (0.4112) 0.2114 0.1273 (0.1790) (0.4216 )
Source: STATA OUTPUT, *, **, *** for 1%, 5% and 10% significance levels. (APP B7)
Table.5, reports the correlation matrix of inflation adjusted model. The result shows the
same pattern of relationship with that of the historical cost model. This is however not a
surprise. This is because; the inflation adjusted cost model was derived from the historical
cost model. In Nigeria, as earlier stated in chapter one, no industrial sector in the country is
mandatorily required to report separate inflation adjusted accounts. This is contrary to what
is obtainable in some developing economies, such as Turkey, where the inflation adjusted
financial information is readily available. Hence the derivation of inflated figures from the
historical figures in this context.
4.3 Corrective Transformation:
Upon ascertaining from the Normality test, that the data used for the study are normally
distributed, attempts are therefore made to run a normal multiple regressions on the data on
the platform of OLS, with a view to understanding the extent to which the predictors could
explain the dependent variable. This attempt however was not successful. This is because
77
the best linear unbiased estimates of the coefficients could not be arrived at with the
exception of earnings. Upon subjecting the result to collenearity and heteroskedasticity test
using Tolerance Value (TV), Variance Inflation Factor (VIF) for collenearity and the
Breusch-Pagan/Cook-Weisberg test for heteroskedasticity. The result indicates the absence
of collenearity. This is because, the VIF and TV are within acceptable region of not less than
0.1 and more than ten (10) for the VIF and TV respectively, for all variables in the dataset,
the result is supported by the correlation matrix tables, in tables 4 and 5 above for historical
and inflation adjusted cost model respectively, as non of the predictors was excessively
correlated with one and other.
The Breusch-Pagan/Cook-Weisberg Test, tests the null hypothesis that there exist a constant
variance among the residuals, we found that the variance is heteroskedastic as the chi2 of the
test was not significant. We therefore reject the null hypothesis, of constant variance among
the error terms. The result of the regression and the test could be referred to on the
appendices (A11, A12, B11, B12, C9 and C11), as it is not our intension to report it in the
study. Heteroskedasticity often occurs in a dataset in which there is wide disparity between
the largest and the smallest observed values, this is evidenced from table 2 above, where we
observed wide disparity among the distribution; this was however expected, because of the
nature of the dataset. A panel data set possess some of the features of cross sectional data,
which makes it easy to have large disparity between the largest and smallest observations
owing to firm peculiarities in terms of managerial capacity and profit generation drive.

78
When the error terms of distributions are heteroskedastic, it affects the minimum variance
property of the Gauss-Markov theorem. The heteroskedastic error term causes the dependent
variable to fluctuate in way that the OLS estimation procedure attributes to the independent
Variables such that OLS is more likely to misestimate the true betas. This is because
heteroskedasticity tend to underestimates the variances of the coefficients, and as a result,
neither the t-statistics or the F- statistics could be relied upon, at the presence of uncorrected
heteroskedasticity.
In view of the foregoing, we therefore look into the possibility that some unobserved
phenomena which could be time invariant in nature (fixed in time) and also entity specific
could have influence on the independent variables and therefore, could bias the coefficients
estimated through the Multiple Regression Model. We therefore controlled for these
unobserved phenomena by running the Fixed Effects models (FE); on the assumption that
the intercept vary over individual units, and that the predictors for each panel are correlated
with the error terms within their respective panels. In addition, and that the error terms plus
the constant term in each panel are not correlated among the panels. The result from this
model was therefore kept for comparison. The result on this could be located in the
appendices (A13, and B13).
Furthermore, we run the Random Effects (RE) Model assuming that, all correlation of the
error terms over time is attributed to the individual effects. And that at the intercepts are
random factors, independently and identically distributed over individuals, and thus
variations of the coefficients have nothing to do with the individual panel’s fixed
characteristic. On the basis of this therefore, run the Hausman specification test, to enable us
79
select a particular model that would give us the best result. Hausman specification Test, test
the null hypothesis that, “the difference in the model coefficients are not systematic”
However, we failed in our test, as the Hausman test is insignificant, because the models
fitted into the Hausman test failed to meet the asymptotic assumptions. However, this is an
exception to the Joint Reporting Model (equation 14), on which the asymptotic assumption
was met. Upon our failure to select a particular model based on the Hausman test, we are
therefore required to run a different estimation model, the Seeming Unrelated Estimation or
Regression (SUR). The SUR model is a generalization of multivariate regression using a
vectorized parameter model, (Beasley,2008), Thus, this SUR estimator, sometimes referred
to as Zellner’s two-stage Aitken estimator, is an application of Generalized Least Squares
(GLS). In fact, because the residual covariance matrix is unknown and must be estimated
from the data, this application is often called feasible generalized least squares (FGLS),
(Timm, 2002 as cited in Beasley, 2008).
The SUR Model, yields coefficient estimators that are at least asymptotically more efficient
than single-equation least-squares estimator or the OLS, ( Zellner, 1962). The model is very
much useful if the independent variables in different equations are not highly correlated, as
is the case in this study, (See Correlation Matrix Table). Secondly, if disturbance terms in
different equations are highly correlated; this is evidenced in our heteroskedasticity test,
mentioned earlier. And thirdly, if a subset of right hand side variables are the same,
(Beasley, 2008). This is the case in this study, where the inflation adjusted variables are
derived from the historical cost variable, Moreover; the SUR model could best fit a small or
medium sample (Moon, 2006).
80
From the foregoing therefore, the study runs the SUR model in order to deal with the
problems of heteroskedasticity in the individual models and as collenearity in the joint
model, this will enable us obtain the best linear unbiased estimates as professed by Zellner
(1962). However, in the event, the best linear unbiased estimates of the variables are not
obtained after running the SUR, as is the case in the study after running the SUR, correlation
contemporaneous diagnosis brought some improvement to the estimates. The correlation
contemporaneous test fits the coefficients into a Generalized lest Square Model, (GLS) and
then generate the best linear unbiased estimates (BLUE) of the variables in form of feasible
generalized least square,(FGLS). The result of this SUR model and the correlation
contemporaneous test are what will be presented and discussed in the next section,
Presentation of Regression Results.
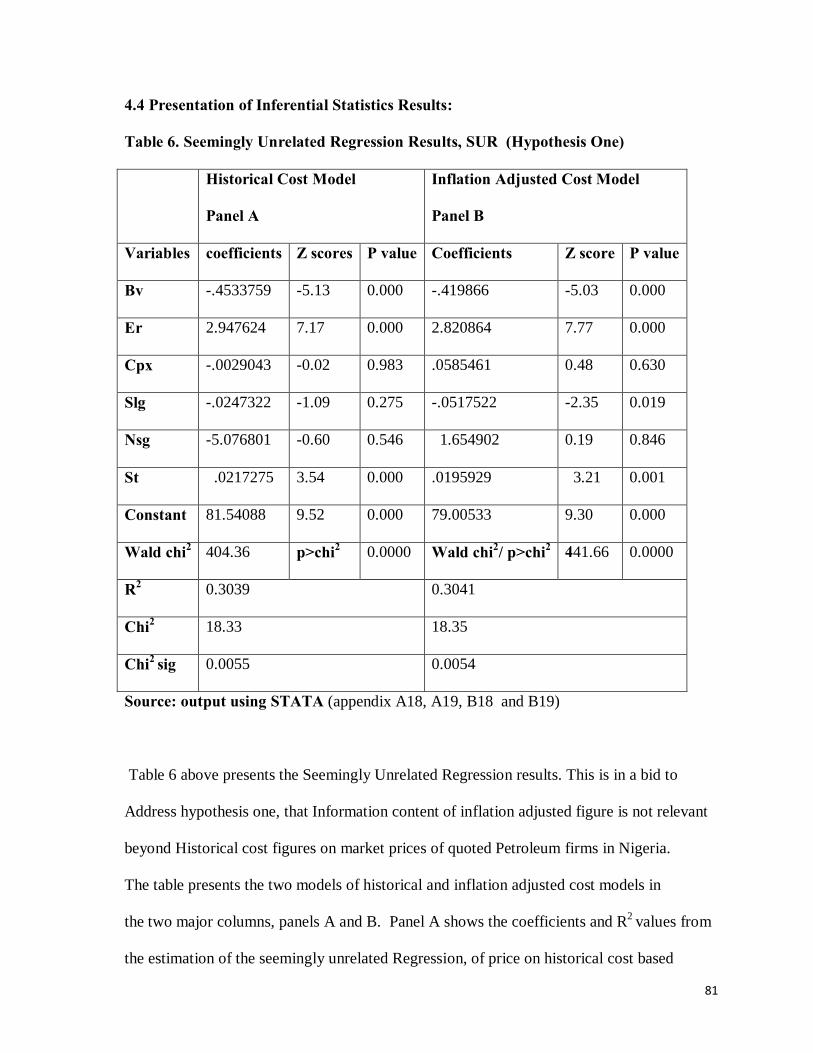
81
4.4 Presentation of Inferential Statistics Results:
Table 6. Seemingly Unrelated Regression Results, SUR (Hypothesis One)
Historical Cost Model
Panel A
Inflation Adjusted Cost Model
Panel B
Variables coefficients Z scores P value Coefficients Z score P value
Bv -.4533759 -5.13 0.000 -.419866 -5.03 0.000
Er 2.947624 7.17 0.000 2.820864 7.77 0.000
Cpx -.0029043 -0.02 0.983 .0585461 0.48 0.630
Slg -.0247322 -1.09 0.275 -.0517522 -2.35 0.019
Nsg -5.076801 -0.60 0.546 1.654902 0.19 0.846
St .0217275 3.54 0.000 .0195929 3.21 0.001
Constant 81.54088 9.52 0.000 79.00533 9.30 0.000
Wald chi2 404.36 p>chi2 0.0000 Wald chi2/ p>chi2 441.66 0.0000
R2 0.3039 0.3041
Chi2 18.33 18.35
Chi2 sig 0.0055 0.0054
Source: output using STATA (appendix A18, A19, B18 and B19)
Table 6 above presents the Seemingly Unrelated Regression results. This is in a bid to
Address hypothesis one, that Information content of inflation adjusted figure is not relevant
beyond Historical cost figures on market prices of quoted Petroleum firms in Nigeria.
The table presents the two models of historical and inflation adjusted cost models in
the two major columns, panels A and B. Panel A shows the coefficients and R2 values from
the estimation of the seemingly unrelated Regression, of price on historical cost based
82
variables, while panel B shows the that of inflation adjusted cost variables. The coefficient
of determination R2 stood at 0.3039 for historical cost model and 0.3041 for the inflation
adjusted cost model these show the extent to which the variables include in the dual model
Could impact on the dependent variable, market price.
Book value has a negative impact on price, showing a Z score (t-value) of -5.13 and -5.03
for historical and inflation adjusted cost model respectively; which are all significant at 1%
level; this is an unexpected result as the book value contributes negatively to the market
prices of the firms. The result here indicates that the higher the price the lower the book
values of the firms. This might also not be unconnected with the fact that the industry is
purely service oriented in the Nigerian settings, hence the negative impact. This corroborates
the findings of Abubakar (2011) where he studies the value relevance of Accounting
Information of Listed New Economy Firms in Nigeria, using Ohlson Model. He found that
that book values of the firms negatively impacts on the market price of the firms under
study, this is because of the service-oriented nature of the firms.
Earnings gave the highest significant positive impact on price as the Z scores for the
historical model stands at 7.17, and 7.77 for the inflation adjusted model , all are significant
at 1% level, this shows that earnings is one of the major determinants of price in the
petroleum industry. The results on earnings is however expected, this is because of the
unceremonious increases in fuel prices the petroleum companies embark upon in most of the
years covered by the study. These dramatic increases consequently reflect in the market
prices of the companies.
83
Capital expenditure as the next variable shows a mixed result for the two models. The
historical cost model records a negative impact from this variable, though highly
insignificant, while the inflation adjusted model records a positive impact from the same
variable, also at an insignificant level. What this indicates is that, the inflation adjusted
model gets a little contribution from this variable, capital expenditure, than the historical
cost model. On the same vein, Sales Growth, shows another mixed impact, where the
historical cost model shows, a negative impact on the price of the firms while it is
contributing positively to the dependent variable under the inflation adjusted model, in both
cases however, the impact are insignificant. This is indeed additional evidence, that the
variable is impacting more to the inflation adjusted model than the historical cost model.
Negative sale growth, a dichotomous variable was included in the models cater for possible
non linearity in sales growth as a result of negative sales from subsequent years of a firm.
A lagged total sales used as a control variable for firm sizes, play a significant role in the
models, as it shows a positively significant Z Score of 3.54 and 3.21 for the historical cost
model and inflation adjusted model respectively. This is an indication that the sizes of
petroleum firms play an important role in their market price determination. Thus, the higher
the sales figure of a firm in a preceding accounting year the better the market price of that
particular firm in the following year.
The findings, shows that only earnings, book value and size have statistically and
significantly impacted on price under the historical cost model; while earnings, book value,
sales growth and size impacted on the inflation adjusted model. This further indicates that
inflation adjustment changes to the earnings, book values, sales growth and size are value
84
relevant; which implies that the market adjusted itself, in response to financial information
for inflation, by using the price index and by incorporating it into market pricing decision,
beyond the historical cost model.
On the overall, the two models are fitted, as the Wald chi2 for the two models are significant
at 1% level of significance, however, the inflation adjusted model is inferred to be more
fitted than the historical cost model, this is because the Wald chi2 of the inflation model is
higher than that of the historical cost model. In addition, studies on inflation use the R2 or
the adjusted R2 to ascertain the model with higher explanatory power. In this study however,
the tool of analysis used does not display the adjusted R2 , thus, we hereby use the R2 and the
Wald Chi2 to select a model with a higher explanatory power. As presented in Table 6, the
R2 and Wald Chi2 for the Historical Cost model are 0.3039 and 404.36 respectively while
that of the Inflation Model are 0.3041 and 441.66, thus, putting the R2 into consideration we
can therefore infer that, the Inflation Adjusted Cost Model is as value relevant as the
historical cost model, while the Wald Chi2 shows higher value in favor of Inflation Adjusted
Cost Model, thus indicating that the model is more fitted than the Historical Cost Model. In
view of the foregoing therefore, we failed to accept our null hypothesis. Our findings
therefore, supports that of Thies and Sturrock (1989), contradicts that of Brayshaw and Miro
(1981), kirkulak and Balsari (2009), and Bello (2009) that could not establish explanatory
power in absolute terms.
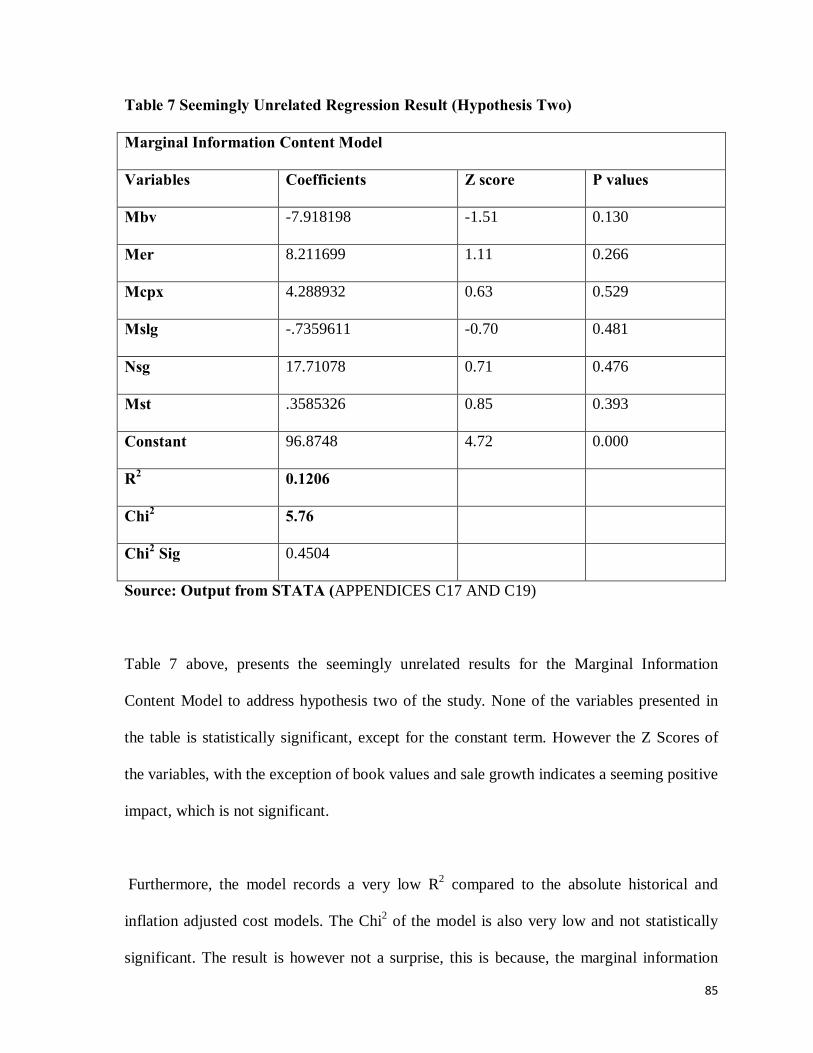
85
Table 7 Seemingly Unrelated Regression Result (Hypothesis Two)
Marginal Information Content Model
Variables Coefficients Z score P values
Mbv -7.918198 -1.51 0.130
Mer 8.211699 1.11 0.266
Mcpx 4.288932 0.63 0.529
Mslg -.7359611 -0.70 0.481
Nsg 17.71078 0.71 0.476
Mst .3585326 0.85 0.393
Constant 96.8748 4.72 0.000
R2 0.1206
Chi2 5.76
Chi2 Sig 0.4504
Source: Output from STATA (APPENDICES C17 AND C19)
Table 7 above, presents the seemingly unrelated results for the Marginal Information
Content Model to address hypothesis two of the study. None of the variables presented in
the table is statistically significant, except for the constant term. However the Z Scores of
the variables, with the exception of book values and sale growth indicates a seeming positive
impact, which is not significant.
Furthermore, the model records a very low R2 compared to the absolute historical and
inflation adjusted cost models. The Chi2 of the model is also very low and not statistically
significant. The result is however not a surprise, this is because, the marginal information
86
content model was derived as a result of deducting the historical cost model from inflation
adjusted model, bearing in mind that Marginal information content, is the information
content of that signal beyond the information content of all other simultaneously recognized
signals. Further, the two models were earlier diagnosed to be heteroskedastic; as Such the
impact of the variables might have been hidden in the residuals, so that the impact of the
explanatory variables could not be transferred to the dependent.
In view of the results above therefore, the model is not fitted and does not indicate an
explanatory power of the marginal information of inflation adjusted figures to financial
decisions in the petroleum firms in Nigeria, on a standalone basis. The finding is hereby
consistent with that of Matolcosy (1984) and Bello (2009) that could not gather evidence to
prove for the explanatory power of marginal information content of inflation accounting
model. It however, contradicts the findings of Bernard and Ruland (1987) and Gordon
(2001), whose result established that price level adjustments accounting figures are
incrementally value relevant beyond historical cost measures. On the basis of the above, the
study fails to reject the null the hypothesis, that Marginal information content of inflation
adjusted is not significant to users of financial information of quoted petroleum firms in
Nigeria.
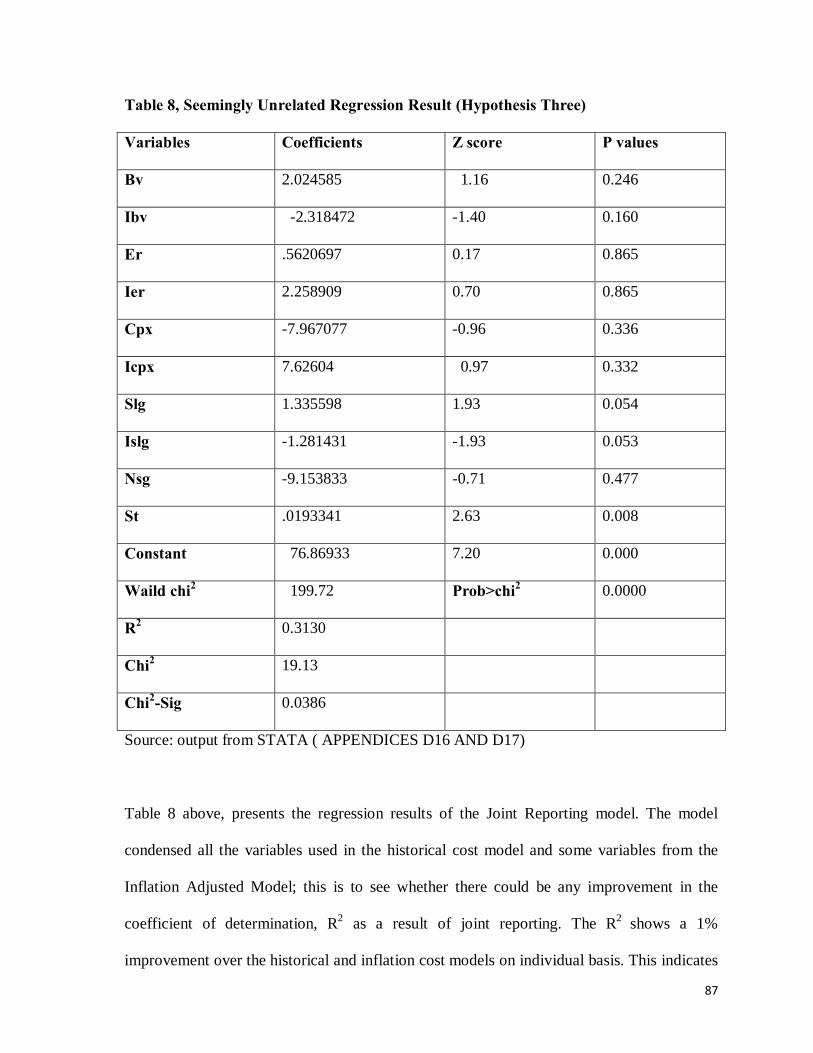
87
Table 8, Seemingly Unrelated Regression Result (Hypothesis Three)
Variables Coefficients Z score P values
Bv 2.024585 1.16 0.246
Ibv -2.318472 -1.40 0.160
Er .5620697 0.17 0.865
Ier 2.258909 0.70 0.865
Cpx -7.967077 -0.96 0.336
Icpx 7.62604 0.97 0.332
Slg 1.335598 1.93 0.054
Islg -1.281431 -1.93 0.053
Nsg -9.153833 -0.71 0.477
St .0193341 2.63 0.008
Constant 76.86933 7.20 0.000
Waild chi2 199.72 Prob>chi2 0.0000
R2 0.3130
Chi2 19.13
Chi2-Sig 0.0386
Source: output from STATA ( APPENDICES D16 AND D17)
Table 8 above, presents the regression results of the Joint Reporting model. The model
condensed all the variables used in the historical cost model and some variables from the
Inflation Adjusted Model; this is to see whether there could be any improvement in the
coefficient of determination, R2 as a result of joint reporting. The R2 shows a 1%
improvement over the historical and inflation cost models on individual basis. This indicates
88
that if the historical and the inflation cost model are reported jointly, a simultaneously
recognized signals would be achieved, hence impacting on the dependent variable. This in
other words, implies that the market price of quoted petroleum firms could further be
explained by reporting simultaneously, the historical cost financial information alongside the
inflation adjusted ones by 1%, better than the stand alone reporting basis.
Of all the variables, only Sales Growth, “slg” from both the Historical and Inflation
Adjusted Model Cost Model and size are statistically significant at 5% and 1% respectively.
This indicates that sales growth has significantly impacted on the model, while size is of
relevance to the model as it contributes positively. What this implies is that, the market
participant would only take into consideration the growth in Sales of petroleum firms which
could be influenced further by the firm sizes, when the joint reporting is applied, hence
valuing the firms a bit higher. As indicated by the results, the model is fitted by the
significance of the Chi2 at 5% level. While the correlation contemporaneous test for the
coefficient is significant at 1% level, the contemporaneous test shows the best linear
unbiased estimates of the coefficients as explained above. On the overall, the findings from
the results are consistent with that of Matolcsy (1984) and Bello (2009). Where, they both
showed the relevance of joint information content in financial reporting.
4.5 Implication of Findings.
The findings from the results as presented above is a validation and at the same time
invalidation of findings of some studies conducted previously. Firstly, the findings indicates
that the market adjusted itself, in response to financial information adjusted for inflation
purposes, more than the historical cost financial information, though by a little increase, that
89
hovers around 0.5 to 1. Also implying that the financial information users would relatively
take into consideration the sales growth and merely capital expenditure when valuing firm
that engage in petroleum operations. In both cases, the size of the firms and earnings is taken
seriously for any meaningful price valuation to take place as demonstrated by the results. On
the overall, the results indicate that inflation adjusted financial information are as predictive
as historical cost financial information.
Secondly, the findings indicate that, though, the inflation adjusted model is as explanatory as
the historical cost model, the marginal information provided by the inflation model is not
significant on a standalone basis. This implies that taking inflation cost model in isolation
does not purely inform the users decisions beyond what the historical cost model would
provide.
Thirdly, the findings from joint reporting model indicates that when the two models are
reported simultaneously, there would be an improvement in the explanatory power of the
variables by at least 1%. This implies that historical financial information and inflation
adjusted financial information reported together could inform users decision more than when
a single reporting model is adopted. And when this happens, the financial information users
would focus more on firm sizes and growth in sales to be able to price firms appropriately.
4.6 Summary
This chapter discusses and analysis the results of the study. The chapter begins with
descriptive statistics and normality test where adequate description of the data was made;
thereafter, the correlation matrices table was also presented and analyzed. The chapter goes
ahead to present the seemingly unrelated regression results for the three hypotheses, after
undertaking some corrective transformation.
90
CHAPTER FIVE
SUMMARY, CONCLUSION AND RECOMMENDATION
5.1 Summary
The debate about inflation accounting has been ongoing for many years. This study try to
shift attention to inflation accounting application and test the value relevance of accounting
information adjusted for inflation purpose beyond the historical cost model. The study also
attempted to see whether marginal information, if any, provided by the inflation adjusted
financial information is of relevance to financial information users and as well, if a joint
reporting of the two models would mean something different to the users. In view of these,
three hypotheses were formulated in pursuance of the objectives.
To further meet the objectives of the study, several literatures were reviewed, ranging from
the conceptualization of inflation, it methods, and forms. The trend of inflation in the
Nigeria was not left out in the review. Another important section in this chapter was the
review of relevant empirical works that were conducted by prominent scholars in the same
area. Studies such as that of Matolcsy (1984), Bernard and Ruland (1987), Gordon (2001)
kirkulak and Balsari (2009) and Bello (2009), a local study formed the review. Furthermore,
the normative school of thought provided us with the theoretical framework on whose
authority the study was conducted, that is the Decision Usefulness Accounting theory as
propounded by the Trueblood Report of 1973 and formalized by Staubus (1999). Thus, it
was the theory that was instrumental to the development of the conceptual frameworks of
the Financial Accounting Standard Board (FASB). In addition to this, cleans Surplus
Accounting Relation or theory provide us with the operational base upon which the model
used for the study rest, as put forward by Olhson (1995).
91
The study collected the data for the study from the annual reports and accounts, as well as
Nigerian Stock Exchange (NSE) Fact book for the firms that that constitute the sample of
the study. Correlational research design with a multiple regression technique of analysis was
employed. The study transformed the historical cost figures into inflation adjusted cost
figures using the price indexes as obtained from the Central Bank of Nigeria (CBN)
websites. Thus, substituting the data into the variables of the various models as specified in
chapter three of the study.
When conducting the test of the hypotheses, the study firstly run a normal multiple
regression using OLS estimation method, from which time invariants effects such as fixed
and random effects were taken into consideration, considering the panel nature of the data.
However, we are obliged to run a different estimation method, the seeming unrelated
regression (SUR) model, upon, some of the test conducted, such as the Hausman test that
indicates the failure of our results to meet the asymptotic assumptions of the Gauss-Markov
theorem. The findings of the study were obtained from the results arrived at via the SUR
model, to which correlation contemporaneous diagnosis was conducted to obtain the best
linear unbiased estimates of the Regressors. The findings, indicates the relevance of the
inflation adjusted financial information model on the overall, but fail to establish any
relevance of the marginal information derived there from.
5.2 Conclusion
In view of the findings of the study, the following conclusions were made: firstly, inflation
adjusted financial information is as explanatory as historical cost financial information in the
downstream sector of the Nigerian petroleum industry. The little improvement indicated by

92
the coefficient determination, R2, of 1% increase from the inflation adjusted model was not
of significant concern, as the test of marginal information content did not provide any
significant positive result; hence the model was not fitted.
Secondly, marginal information content from the inflation adjusted account, on a standalone
basis, does not provide any additional information to the financial information users, thus it
could not be relevant in forming an opinion on the activities of firms operating in the
downstream sector of the Nigerian economy.
Thirdly, joint reporting of the inflation adjusted financial information and historical cost
information provides a broader opportunity for financial information users to focus on other
financial statements variables such as sales growth and size other than book value and
earnings
.
5.3 Recommendations
In view of the conclusion above, the study therefore, recommend as follows:
a. Policymakers in the financial reporting cycle, especially the Financial Reporting
Council of Nigeria (FRC) should require Firms in this industry to provide financial
information users with an additional disclosure on inflation adjusted financial
information, so that users could have all the necessary information they require for
an informed decision
b. Financial information users should use Inflation adjusted financial information as
complementary to historical cost financial information rather than an alternative.
93
5.4 Limitations of the Study
This study is faced with some limitations as follows:
a. Sectoral and survivorship Bias: The study is restricted to the downstream sector of
the Nigerian petroleum industry, and as such only firms that have up-to-date data
needed for the study could be enlisted for the study. Further, the sector is categorized
as Petroleum Marketing by the Nigerian Stock Exchange, thus grouping as a service
Oriented setting. In view of this, caution need to be made in making generalization
on the basis of the research findings.
b. Period covered: The study covers a period of seven years, starting from 2005 to
2011, thus excluding 2012, which is one of the years in which government policies is
believed to aggravate prices instability in the country.
5.6 Areas of Further Study
From the foregoing therefore, future studies could improve this work by
a. Conducting a study that will cover all sectors of the Nigerian economy, taking into
consideration, the industry specifics.
b. Employing a return model as a different technique of analysis on the basis of “a”
above, as against the price valuation model used in this study.
c. Future researchers could also use either Weighted Least Square (WLS) or the two
stage Generalized Least Square (GLS) as an estimation technique.
94
Bibliography
Abubakar, S (2011). Value Relevance of Accounting Information of Listed New Economy
Firms in Nigeria: An Empirical Investigation using Ohlson Model. 1st African
Accounting and Finance Conference, 7-9
Agrawal, S.A. (1977). Accounting for the Impact of Inflation on Business Enterprise. The
Accounting Review,52( 4):789-809.
Albrecht, W.D and Richardson, F.M. (1990). Income Smoothening by Economic Sector.
Journal of Business and Accounting. 17(4)
Alexander, S.S. (1950). Income Measurement in Dynamic Economy.in Five Monographs
on Business Income, Study Group on Business income. Macmillan Company, New
York.
Aktaş, R and Karğın, M. (2011). Timeliness of Reporting and the Quality of Financial
Information. International Research Journal of Finance And Economics.
Akinbobola. T. O and Oladipo, S. O. (2011). Budget Deficit and Inflation in Nigeria: A
Causal Relationship. Journal of Emerging Trends in Economics and Management
Sciences, 2 (1): 1-8
Anderson, M.C; Banker, R.D and Ravindran, S (2006). Value Implications of Investments
In Information Technology. Management Science, 52(9 )
Anyanwu, J.C .(1992). President Babangida's Structural Adjustment Programme and
Inflation in Nigeria. Journal Of Social Development In Africa, 7(1):5-24
Barniv,R.(1999). The Value Relevance of Inflation-Adjusted and Historical-Cost
Earnings During Hyperinflation. Journal of International Accounting, Auditing &
Taxation, 8(2):269–287.
Basu, S. (1977). Inflation Accounting, Capital Market Efficiency and Security
Prices.Toronto Society of Management Accountant of Canada.
Bello, A. (2009). Financial Information Quality and Inflation Accounting Disclosure
in Nigerian Cemet Industry. An unpublished PhD Dissertation presented at
Department of Accounting, Ahamdu Bello University, Zaria.
Bello , A. (2009). The Fallacy of Income and Income Measurement in Accounting.
Retrieved 15th September, 2011, http/www.ssrn.com
Beasley, T.M, (2008), Seemingly Unrelated Regression (SUR) Models as a Solution to Path
Analytic Models with Correlated Errors, Multiple Linear Regression Viewpoints. 34(1)
95
Bedford, N, M. (1951).A critical analysis of accounting concept of income. The
Accounting Review.26(4)
Bernard, V.L and Ruland,R.G. (1987). The Incremental Information Content of
Historical Cost and Current Cost Income Numbers: Time-Series Analyses for 1962-
1980. The Accounting Review. 62 (4):707-722
Beaver, W. H and Landsman, W.R. (1983). Incremental information content of
Statement No.33 Disclosures. Research Report, FASB, Stanford.
Belkoui, A. R. (2010). Accounting Theory, 4th ed. T.J International
Brauer, S. (2010). Do Fair Value and Historical Cost Accounting Matter for
Conditional Conservatism? Evidence from German Firms. University of Osnabruck.
Brayshaw, R.E. and Miro, A.R. (1985).The Information Content Of Inflation-Adjusted
Financial Statements. Journal of Business Finance& Accounting,12(2),
Carl, T. D. (1966).Some Conceptual Problems in Accounting Measurement. In: Yuji
Ijiri. Research in Accounting Measurement (A.A.A)
Cambell, P. (1963). What is science? Dover publication incorporation.110
Chang, E.C. (1962). Business Income in Accounting and Economics. The Accounting
Review, 37(4): 636-644.
Cañibano, L; Covarsí, M.G and Sánchez, M.P.(1999). The value Relevance and
Managerial Implications of Intangibles: A Literature Review. Autonomous
University of Madrid.
Collins, D.; Kothari, S.P.; Shanken, J. and Sloan, R. (1994). Lack of Timeliness and Noise
as Explanations for The Low Contemporaneous Return-Earnings Association.
Journal of Accounting and Economics 18,
Collins,D.; Maydew,E.; and Weiss,I.(1997). Changes in the Value-Relevance of Earnings
and book values Over the Past Forty Years. Journal of Accounting and Economics.
24: 39–67
Core, J.E; Guay, W.R & Buskirk, A.V (2003). Market valuations in the New Economy:
An Investigation of what has changed. Journal of Accounting and Economics. Vol.
34
Darrough, M and Ye, J (2007). Valuation of loss firms in a knowledge-based economy.
Review of Accounting Studies, 12(1): 61-93.
Davis- Friday, P (2001). Equity Valuation and Current Cost Disclosure: The Case of
96
Mexico. Journal of Financial Management. 6(12)
Daines, H. C., (1929). The Changing Objectives of Accounting” The Accounting
Review., 14: 94-11.
Dechow,P.; Hutton,A. and Sloan,R.(1999).An Empirical Assessment of the Residual
Income Valuation Model. Journal of Accounting and Economics. 26,
DeCarlo, L,T (1992) On the Meaning and Use of Kurtosis, Psychological Method. 2,(3)
292-307
Diewert, W.E (2005).The Measurement of Business Capital, Income and
Performance.Tutorial Presented at the University of Autonoma of Barcelona, Spain,
Dyckman, T.R. and Abbie, J.S.(1979). Financial Accounting and Reporting by Oil and
Gas Production Companies: A Study of Information Effects. Journal of Accounting
and Economics.
Dung, N.V.(2008).Value-Relevance of Financial Statement Information: A Flexible
Application of Modern Theories to the Vietnamese Stock Market. Vietnam, Foreign
Trade, university.
Edwards, E. O.(1975). The state of current value Accounting. The Accounting Review.
Edward, E. and Bell, P. (1961).The Theory of and Measurement of Income.University
Of California Press.
Filip, A. and Raffournier, B. (2010).The Value Relevance of Earnings in a Transition
Economy: The case Of Romania. International Journal of Accounting, 45(1).
Financial Accounting Standard Board (1985).Concepts of Financial Reporting by Business
Enterprise.
Fisher, I. (1927). The Nature of Capital and Income. New York: the Macmillan Company.
Friedman, M. (1963). Inflation, Causes and consequences. Asia Publishing House.
New York
Fernandez, P. (2002). Three Residual Income Valuation methods and Discounted
Cash Flow Valuation. IESE Business School, Madrid Spain.
Fernandez, P. (2001). EVA and Cash value added do NOT measure shareholder value
Creation. IESE Business School, Madrid Spain
Geoff, R.(2006). Cause of inflation, Essential Guidance On Economic Exam
Technique. Eton College, Retrieved 12th December, 2011 http/www.tutor2u.com
Gonedes, N.J. (1975). Information Production and Capital Market Equilibrium.

97
Journal of finance.
Glautier, M.W.E and Underdown, B. (1986). Accounting Theory and Practice. London:
Pitman Pub.
Gordon, E.A. (2001).Accounting for Changing Prices: The Value Relevance of
Historical Cost, Price Level, and Replacement Cost Accounting in Mexico. Journal
of Accounting Research.39(1):177-200.
Gupta, J .B.(1998).Inflation and Financial Management. J. B Gupta Class note.
www.jbguptaclasses.com, (Accessed on 30th December, 2011)
Hassan, O.A.G; Romilly, P; Giorgioni, G and Power, D.(2009).The value relevance of
Disclosure: Evidence from the emerging capital market of Egypt. The International
Journal of Accounting. 44:79–102.
Hayes,H.V. (1913). Original Cost vs Replacement Cost as Basis for Rate Regulation.
Quarterly Journal of Economics, 27.
Hibbert, J.(1983). Measuring the Effects of Inflation on Income, Saving and Wealth.
Paris, OECD.
Hicks, J.R. (1946). Value and Capital. New York: Oxford University Press.
Hill,P. (1993). Inflation Accounting: A Manual On National Accounting Under
Conditions of High Inflation. Organisation for Economic Co-Operation and
Development.
Holthausen,R.W and Watts,R.L.(2001).The Relevance of the Value-Relevance
Literature for financial Accounting Standard Setting. Journal of Accounting and
Economics 31, 3–75.
Hughes, J; Liu, L and Zhang, M. (2003). Inflation, Foreign Exchange, and Parsimonious
Equity Valuation. Los Angeles, Anderson School of Management University of
California.
Ijiri, y. (1966). Reliability and objectivity of Measurement. The Accounting Review.
Institute of Chartered Accountants of Nigeria, ICAN, (2009). Financial Accounting
Fundamentals. Lagos, VI Publishers.
Kang, S.H and Zhao,Y. (2010). Information Content And Value relevance Of
Depreciation :A Cross-Industry Analysis. The Accounting Review. 85(1)
Kannadhasan, M. (n.d).Effects Of Inflation On Capital Budgeting Decisions-An

98
Analytical Study.
Keynesian Economics retrieved 10th Octomber, 2011. http/www.tutor2u.com
Kimberly, A (N.d), what causes inflation? Retrieved on 30th july, 2012 from
www.about.com- US economy.
Kothari, S.P and Shanken, J. (2003). Time-series Coefficient Variation in Value-
Relevance Regressions: A Discussion of Core, Guay, and Van Buskirk and new
evidence. Journal of Accounting and Economics, 34 69–87
Konchitchki, Y (2009). Inflation and Nominal Financial Reporting:Implications for
Performance and Stock Prices, Leventhal School of Accounting, University of
Southern California
Kuijs, l. (1998). Determinants of Inflation, Foreign Exchange and Output in Nigeria.
International Monetary Fund Working Paper . African department,
Kirkulak,B and Balsari,C.K (2009). Value Relevance of Inflation-Adjusted Equity and
Income. The International Journal of Accounting 44,
lamberg, E. (n.d). Income Measurement : some comments. Estonia business school
Lebow, D.E and Rudd, J.B (2006). Inflation Measurement, Finance and Economics
Discussion Series. Divisions of Research & Statistics and Monetary Affairs Federal
Reserve Board. Washington, D.C.
Lev, B. and Ohlson, J.A. (1982). Market-Based Empirical Research in Accounting , A
Review, Interpretation, and Extension. Journal of Accounting Research. Vol. 20
Littleton, A.C. (1956). Choice Among Accounting Alternatives. The Accounting
Review, 31,:363-370
Masha, I. (2000). New Perspectives On Inflation In Nigeria. CBN Economic &
Financial Review.Vol. 38(2).:34-56.
Maximillian, S. and Max, G. (2011). The value Relevance of Accounting Figures in the
European Market Reconsidered. AFAANZ Conference poceedings, Australia.
Retrieved on 30th September, 2011
http://www.afaanz.org/openconf/2011/modules/request.php.
Matolcsy,Z.P. (1984). Evidence on the Joint and Marginal Information Content of
Inflation-Adjusted Accounting Income Numbers. Journal of Accounting Research.
22(2):555-569.
Marshall, A. (1952). Principles of Economics: An Introductory. Macmillan Company. New
99
York.
McDonald,B. and Morris, M. H. (1984).The Relevance of SFAS 33 Inflation Accounting
Disclosures in the Adjustment of Stock Prices to Inflation.The Accounting Review.
Vol. 59(3): 432-446
Morck, R.; Shleifer, A. and Vishny, R.(1988). Management Ownership and Market
Valuation, an Empirical Analysis. Journal of Financial Economics 20,:293–315
Milgrom, P.R. (1981).Good News and Bad News: Representation Theorems and
Applications, The Bell journal of Economics, 12(2).
Mills, G.T. (1996).The Impact of Inflation on Capital Budgeting and Working Capital.
Journal Of Financial and Strategic Decisions.9(1)
Miller, H.M and Modigliani, F. (1961). Dividend Policy, Growth, and the Valuation of
Shares. The Journal of Business. 34(4).
Muhanna, W.A and Stoel, M.D. (2008). How Do Investors Value IT? An Empirical
Investigation of the Value Relevance of IT Capability and IT Spending Across
Industries.Fisher college of Business, the Ohio State University, Columbus.
Moon, H.R and Perron, B (2006), Seemingly Unrelated Regression, Department of
Economics, University of Southern California.
Nwaobi, G.C (N.D). Inflation, Unemployment and Nigerian Families: an empirical
investigation. Quantitative Economic Research Bureau, Abia, Nigeria (accessed
from www.quanterb.org)
Olhson, J.A. (1995). Earnings, Book Value and Dividend in Equity Valuation.
Contemporary Accounting Research. 11(2)
Paton, W.A. (1920). Depreciation, Appreciation and Productive Capacity. The Journal
Of Accountancy.
Park, H.M (2008), Univariate Analysis and Normality Test Using SAS, Stata, and SPSS,
University Information Technology Services Center for Statistical and Mathematical
Computing Indiana University
Powell, J. L (N,D), Zellner’s Seemingly Unrelated Regressions Model, Department of
Economics, University of California, Berkeley.
Quah, D. and Vahey, S. (1995). Measuring core inflation. The Economic Journal. vol.
105: 1130-44
Rajgopal, S.; Venkatachalam, M. & Kothari, S. (2003). The Value Relevance of
100
Network Advantages: The Case of E–Commerce Firms. Journal of Accounting
Research, 41(2),:135 162.
Roger, S. (1998). Core Inflation: Concepts, Uses and Measurement. Retrieved 2nd
September, 2011 www.rbnz.gov.nz/research /discussion papers/g98-9pd.
Roberts, B. (2008). Inflation: Measurement Techniques and current issues: Federal
Reserve Bank of Dallas.
Ravenscroft, S and Williams, P.F (2009). Rethinking Decision Usefulness. Department of
Accounting 2330 Gerdin Building Iowa State University
Samuelson, P. A. (1948).Economics: An Introductory Analysis: McGraw-Hill.
Salehi, M. (2009b).Tobin's Q Model and Cash Flows from Operating and Investing
Activities Evaluating In Listed Companies in Iran. Zagreb Int. RevI. Econ. Bus.,
7(2): 71-82.
Samy,B.N and Mohamed, G. (2000 ). The Impact of Dividends, Debt, And Investment
on Valuation Models”, university le Tunis.
Schinider, W.B., Inanga, E.L.and Rod, J. (2000). Price Level Changes and Financial
Reporting: a discussion paper series, California state university of Los Angeles.
Sorter, G.H. (1969). An “Events” Approach to Basic Accounting Theory. University of
kansas
Smith, A. (1937). The wealth of Nation. London: J. M Dent & Sons Ltd.
Stanford, J. (2008). A “How-To” Guide: Understanding and Measuring Inflation.
Canadian Centre for Policy Alternatives
Staubus, G. J. (1961). A Theory of Accounting to Investors. Berkeley. Los
Angeles: University of California Press.
Staubus, G. J. (1976). The effect of price level Re-statement on Earnings, the
Accounting Review. 3(3).
Staubus, GJ. (1999). The Decision-Usefulness Theory of Accounting. A Limited
History. New York; London: Garland Publishing Company.
Stern Stewart & Co (1991). The Quest for Value:The EVA Management Guide.
Standard No. 29: Financial Reporting in Hyperinflationary Economies
Standard No. 33: Financial Reporting and Changing Prices.
Sweeny, H.W. (1936). Stabilized Accounting New York: Harper & Brothers.
101
Sutton, D. (2009). The Foundations FOR a General Theory of General Purpose Financial
Reporting for Business. A published M.sc thesis submitted to the
Department of Accounting, Victoria University of Wellington,
Talebnia, G; Salehi, M; and Kangarluei,J.S.(2010).A study of the impact of collapse on
financial Reporting quality of listed companies: Some Iranian evidence. African
Journal of Business Management .5 (10).:3858-3865
This, C.F. and Sturrock, T. (1989). Inflation-Adjusted Accounting Data and The
Prediction Of Bond Ratings. The Southern Business And Economic Journal ,12
(4),:162-171.
Velury, U. and Jenkins, D.S. (2006).Institutional Ownership and the Quality of Earnings.
Journal of Business Research, 59:1043– 1051
Watts, l. R and Zimmerman, J.I. (1990). Positive Accounting Theory: A Ten Year
Perspective. The Accounting Review, 65(1):131-156
Weintraub, S. (1960). Keynesian Theory of Inflation: The Faces of Janus.International
Economic Review.1(2):143-182.
Whittington, G; Saporta, V and Singh, A. (n.d). The Effects of Hyper-Inflation on
Accounting Ratios Financing Corporate Growth in Industrializing Economies. IFC
Technical Paper Number 3.
White, H.(1980). A Heteroscedasticity Consistent Covariance Matrix Estimator and a
direct Test for Heteroscedasticity. Econometrica 48:817–838.
Williams,T. (1967). Income Definition and Measurement: A structural Approach.
The Accounting Review 42(4).
Wooldridge, J. M. (2002).Econometric Analysis of Cross Section and Panel Data.
Cambridge MA: MIT Press.
Wood, F and Sangster, A .(2005). Business Accounting. Prentice Hall. United Kingdom:
Wu, H; Fargher, N and Wright, S. (2010). Accounting for investments and the
relevance of losses to firm Value. The International Journal of Accounting, Vol 45.
Zellner, A (1962), An Efficient Method of Estimating Seemingly Unrelated Regressions and
Tests for Aggregation Bias, Journal of the American Statistical Association, 57,
(298): 348- 368.

102