Embed Size (px)
Citation preview

Case4 The US Airline Industry in 2012
The year 2011 wa s ano ther dismal one for US airlines in terms of financial performance. Despite an increase in both passenger numbers and revenues for the year, profits were down on 2010. In total , US airlines earned net profits o f about $0.4 billion, representing a net margin of less than 1%. The dire financial state of the industry was underlined by AMH (the parent of American Airlines) entering Chapter 11 bankruptcy in November 2011. This ended AMR's d istinguished record of being the only one o f the major legacy airlines to have avoided bankruptcy. In 2005, Delta, United , o rthwest. and US Airways had all fi led for bankruptcy protection .
The early months o f 2012 offered little hope of improvement. Airline revenues were up by 8 .2% during the first quarter o f 2012 compared to the same quarter of 2011. However. as a result of higher costs, net income was clown by 73.6%: net mar-gins had deteriorated from -3.2% to -5.2%.1
The woes o f the US airline industry during the 21st century were typically attrib-uted co the triple-whammy o f the September 11 , 2001 terrorist attacks, the high price of crude o il , and the 2008 financia l crash . Certainly, each of these was a powerful force in boosting costs and depressing demand. Yet, the financial problems of the US airline industry predated these events. Even during the generally prosperous 1990s, the US airline industry had been barely profitable. Outside the US, the state of the airline business was little better. The IATA, the worldwide association o f airlines, showed chat the global airline industry had consistently failed co earn returns that covered its cost o f capital (Figure l ; see Table 1 ).
However, amidst rhe gloom , several airline executives expressed optimism about the future. At a Meffill Lynch conference on May 17, 201 2, the CFO of United Continental Holdings Inc. , j ohn Hainey, observed that, compared to the past, the airline companies had become more disciplined :incl financially oriented . Instead of competing for market share through capacity growth, the major airlines were cutting capacity. Between the fourth quarter of 2006 and the first quarter of 2012, the major airlines would each cue capacity by berween 3% and 10%. Southwest was the exception-its capacity would increase by 15%.! ln addition, the consol idation o f the indusuy would reduce the number of competitors w hich would help support fares. Revenue generation would also be assisted by the unbundling of fares: the growing practice of charging separately for eat reservations, baggage se1vices, and onboard refreshments. According to US Bureau of Transportation Statistics, airline yield5 ( revenue per occupied seat per mile) increased from 14.4 cents in the fourth quarter of 2010 co 16.8 cents a year later.·1
The airlines had also made progress in cost reduction. Competition from low-cost carriers (LCCs) such as Southwest and JetBlue, had forced the " legacy carriers'' into an endless quest for cost efficiencies and a reexamination of their business models. In particular, they had confronted the labo r unions and gained substantial
This case was rreraretl by Hobert M. ©2012 Robert M. Gran!.

CASE 4 THE US AIRLINE INDUSTRY IN 2012 473
concessio ns on pay. hL'nefits, and working practices. Chapter 11 bankruptcy had given thL' airlines a nL'W nL'xibility in addressing some Of the rigidities of thL'ir legacy systems-in particular pruning employee and retiree benefits and introducing more nexible \\·orking practicL'S.
FIGURE 1 Hcturn on c1pit:tl :md cust of c1pital fi:,r thv world :1irl inc industry. )l)<):)--2010
12 -.------ ----- ------------------, Cost (WACC)
0 "' .,. "' '° " 00 0\ 0 0 "' "' 8 "' 8 " 00 0\ 0 0\ 0\ 0\ 0\ 0\ 0\ 0\ 0 0 0 0 g 0 0 0 0\ 0\ 0\ 0\ 0 0 0 0 0 0 0 0
"' "' "' "' "' "' "' "' "' "' "' Source: Airlines for America. based on data from IATA and Deutsche Bank.
TABLE 1 lk\'L'l1LIL'.''. profns. and L·mploym<.:nt o f the flyc l:1rgl'st LiS
United Delta
Revenues ($ billion) 2007 19.l 19.2 2008 19.3 22.7 2009 16.3 28. l 2010 23.3 31.8 201 1 37.1 35.1 Net margin(%) 2007 2.0 8.4 2008 (27.1) (12.2) 2009 (4 0) (4.4) 2010 1.1 1.9 201 1 2.7 2.4 ROA(%)·' 2007 2.6 0.3 2008 (24 2) (100) 2009 (3.5) (2.8) 2010 0.6 1.4 201 1 2.2 2.0 Employees 2002 72.000 76, 100 2008 53,000 83,822 2011 87,000 78,400
Note: •ROA: Return on assets= ner income/total assets. Source: 10-K reports of companies.
American Southwest US Airways
22.9 9.9 11.7 23.8 11.0 12.1 19.9 10.4 10.5 22.2 15.6 11.9 24.0 12.1 13. l
2.3 6.5 6.1 (9.3) 1.6 (26.4) (7.4) 1.0 (2.0) (2. l) 38 4.2 (8.2) 1.1 0.5
2.5 7.0 6. 1 (9.7) 3.8 (26.4) (5.8) 0.7 (2.8) (2.1) 3.0 0.9 (8.3) 1.0 6.4
109,500 33.700 46,600 84,100 35.512 32,691 66,533 45,392 31,500

474 CASES TO ACCOMPANY CONTE!ltPORARY STRATEGY ANALYSIS
Orders for new aircraft from the US airlines also po inted toward confidence in the future. In July 2011 , AMR had placed an o rder for 460 planes-the largest in its history-with Boeing and Airbus. In May 2012. ii made a progress payment o f S1 62 million to the plane-makers. despite its bankniptcy filing. During the early part of 2012, nited Continental was negotiating with Boeing and Airbus for 180 new planes, an o rder worth up to S 15 billion.
Was it possible that the new climate of realism and financial pnidence in the industry and the willingness of the airlines to reduce capacity w hen demand was w eak would usher in a new era of prosperity for the industry? For many airline executives. consolidation supported by steadily growing demand for airline travel could offer a way out of the fierce price competition, low margins, poor labor rela-tions, and frequent encounters with bankniptcy that had characterized the industry.
Others were less optimistic. The problems of the airline industry could not be attributed to the specific circumstances of the time: international terrorism , high fuel prices, o r the financial crisis and its aftermath. Disma l profitability had been a near constant feature of the US airline industry since deregulation. And the situation was little different in other countries: almost all European airl ines were losing money.
or could poor industry perfo rmance be attributed to inept management. Despile criticism of the managerial effectiveness of the legacy carriers. the LCCs were also weak financial performers. Even the much-lauded outhwest Airlines had failed 10 cover its cost of capital during 2008-2011 . "We've been here before. many times," observed one industry veteran. 'Just w hen the industry seems to be cl imbing out o f the mire, che industry's dire economics reasserr themst:lves ...
From Regulation to Competition
The history of the US airline industry comprises two eras: the period o f regulation up until 1978 and the period of deregulation thereafter.
The Airlines under Regulation (Pre -1978) The first scheduled airline ·ervices began in the 1920s: mail rather than passengers was the primary business. In the early 1930s, a transcontinental route stnicture was built around United Airl ines in the north. American Airlines in the south, and TWA through the middle. To councc r the threat of instabil ity from growing competi-tion (notably from Delta and Continental). in 1938 Congress established che Civil Aeronautics Hoard (CAB) w ith the authority 10 administer the scnicture of the indus-try and competition w ithin it. The CAB awarded incerstate routes to the existing 23 ai rlines; established safety guidelines; approved m<.:rgers, acquisitions, and inter-firm agreements; and set fares and ai rmail rates (on the basis of cost p lus a reason-able rate of return). Industry strucrure ossified: despite more than 80 applications, no! a sin git' new carrier was a pp roved between 1938 and 1978.
During 1he 1970s, the impetus grew for less government regulation and greater reli-ance on market forces. Political arguments for deregulation were supported by new developments in economics. The case for regulation had been based traditionally on arguments abo uc natural markets were impossible in industries w here scale economies and network effects were important. During the early 1970s, the theory of contestable markets was developed . The main argument was that industries

CASE 4 THE USAlRLlNE INDUSTRY IN 2012 475
did not need to be competitively stnictured in order to result in competitive outcomes. So long as harriers to entry and exit were low then the potential for hit-and-nm entry would cause established firms to charge competitive prices and earn competitive rates of return. The outcome was the Airline Deregulation Act, which, in October 1978. abolished the CAR and inaugurated a new era of competition in the airline indust1y!
The Impact of Deregulation The abolition of controls over entry, route allocations, and fares resulted in a wave of new e ntrants and an upsurge in price competition. By 1980, 20 new Gtrriers-including People Express, Air Florida , and Midway-had set up.
De regulation \vas also accompanied by increased turbulence in the industry: the o il shock of 1979, recession, and the air-traffic controllers' strike of 1981. During 1979-1985. the industry incurred \Yidespread losses that triggered bankruptcies (between 1978 and 1984 over JOO carriers went bust ) and a wave of mergers and acquisitions. Despite strong expansio n from 1982 onward, the industry experie nced a profit slump in 1990-1994. Figure 2 shows industry profitability since deregulatio n . Profitability is acutely sensitive to the balance between demand and capacity: losses result from industry load factors falling below the hreakeven level (Figure 3). The role of competition in driving efficiency is evident from the near-continuous decline in rea 1 prices over the period (Figure 4 ).
FIGURE 2 of till· l 'S :tirlilw J <FH- 2008
- Operating margin (%)
- Net margin (%)
Source: Bureau ofTransportation Statistics.

FIGURE 3 Lo.id l.t\'tor in tlw 1 S .1i rli1w industry. 197 8- 200-
- Load factor(%)
- Breakeven load factor(%)
Source: Air Transport annual ernnomic reports (various years): Bureau ofTransportation Statistics.
FIGURE 4 .\H:r.tµL· t":trL·.., 111 tlw l '> :1irlinL· l'N"i- 20 11
1995 1996 1997 1998 1999 2000 2001 2002 2003 2004 2005 2006 2007 2008 2009 2010 201 1
l - Average Fare ] - Average Fare • 1995 Dollari
Source: Bureau of Statrsucs
476

CASE 4 THE US AIRLINE INDUSTRY IN 2012 477
Firm Strategy and Industry Evolution
Changc:s in the structure of the a irline industry during the 1980s and 1990s were primarily a result of the strategies of the airlines as rhey sought to adjust to the new conditions o f competition in the industry and to gain competitive advantage.
Route Strategies: The Hub-and-Spoke Syste m During the 1980s, the ma jo r airlines reorganized the ir ro ute maps. A system of pre-dominantly po int-to-po int ro utes was re placed by o ne whe re each airl ine concen-trated its routes on a few majo r a irports linked by freque nt services using large aircraft , w ith sma lle r. nearby airpo rts connected to these hubs by sho rte r routes using sma ller aircraft. This hub-and-spoke system offered rwo ma jor benefits:
• It a llowed g reater effi ciency through re ducing the to ta l number of routes needed to link a finite number o f cities w ithin a network and concentrat-ing tra\'L'ler a nd mainte nance facilities in fe\Ye r locatio ns . It pe rmitted the use o f la rger, more cost-effi c ie nt aircraft for in ter-hub travel. The efficiency benefits o f the hub-and-spo ke system were re inforced hy scheduling flights so that incoming sho rt-haul arrivals were concentra ted at particular times to allow passengers to be pooled for the longer-haul flights on la rge a ircraft.
• It allmved major carrie rs to estab lish dominance in regional markets and on particular rou tc:s. Table 2 shO\vs cities w he re a sing le airli ne he ld a dominant local market share . The huh-and-spoke system also created a harrier to the e ntry of new ca rrie rs. w ho o fte n found it d iffi cult to obta in gates and landing slots a t the ma jo r huhs.
TABLE 2 1.oc:d m :trkL·t sli:trl' or :tirlim· for SL0 ln·tecl l ':-; citiL·s (hy p:t:o-SL' llgLT nu rnhl'rsl. 20 11
City Airline
Dallas/Fort Worth American Miami American Atlanta Delta Baltimore Southwest Charlotte US Airways Houston Continenta l Minneapolis-St. Paul Delta Newark Continenta l Detroit Delta Cincinnati Delta San Francisco United Denver United
Source: Bureau ofTransportation Statistics.
Sha re of p assengers (% )
71.83 69.56 63.74 57.57 56.75 55.06 50.00 45.88 44.17 37.74 33.18 23.93

478 CASES TO ACCOMPANY CONTEMPORARY STRATEGY ANALYSIS
TABLE 3 vnt r;111on in tilt" l indu-.tn
Year CR4(%) Year CR4(%)
1935 88 1987 64.8 1939 82 1990 61.5 1949 70 1999 66.4 1954 71 2002 71.0 1977 56.2 2005 55.4 1982 54.2 201 1 54.3
Note: The four-firm concentra1ion ratio (CR4) measures the share of the industry's passenger miles accounted for by the four largest companies. During 1935- 1954, the four biggest companies were United, Amencan. l WA. and Eastern. During 1982-2005, the four biggest companies were American. United. Delta. and Northwest The 2011 data relate to American. United. Delta, and Southwest Source: US Department ofTransportation.
The hub-and-spoke networks o f the majo r airlines were reinforced by alli-ances with local commuter airlines. Thus American Eagle, nited Express, and Delta Shuttle were franchise systems established by AMH. United Airlines, and Delta , respectivl.!ly. wherc.:by regional airlines used the reservation and ticketing systems o f the majo r airlines and coordinated thei r operations and marketing poli-cies with those of their bigger partners.
Merger s New entry during the period of deregulalion had reduced seller concentration in the industry (Table :n. However. the desire of the leading companies to build national (and international) mule ne!\vorks encouraged a w ave of mergers and acquisitions in the industry. some 1riggered by 1he financial lroubles tha1 beset several leading airlines. Had ii not bec.:n for government intervention on anlitrusl grounds, consoli-dation would have gone further; however, Department of .Justice approval of the Delta- o rthwcst and llnilc.:d-Continental mergers during 2009-2010 suggested a more lenienl approach 10 airline mergers. Figure 5 sho" ·s some o f the main mergers and acquisi1io ns. During 2002- 20 11. despite several majo r mt!rgers. concentration declined as a result o f capacity reduction by the biggest airlines and marke1 share gains by LCCs.
P r ices a n d Costs Intensifica tion o f compclition following deregulation was most evident in the pric-ing o f air tickets. Price cutting was typically led either by establ ished airlines suffer-ing from weak rt:venues and excess capacity or by LCCs. Tht: new, low -cos1 entrants played a critical role in stimulating the price wars that Gtme to characterize compe-tition after deregulation. l'cople Express, Braniff, New York Air. and Southwest all sought aggressive expansion through rock-bottom fares made possible by highly effic ient cost struc:Itm.:s and a bare-bones service ( the LCCs economized on in-flight mea ls, entertainment. and baggage handling). Although most of the low-cost

CASE 4 THE US AIRLINE INDUSTRY IN 2012 479
FIGURE 5 \ ll'rgL'r)> :111d .ll'qUi'-i l ion-.. :11nong 111.1jor l p:bSL'ngcr airl ines. 11)8 1- 20 12
American -==================::•:------., TWA _ ., --_____.. Mwnritn JOOl
American
Ozark __.-Acquired by TWA 1986
United United
Pan American Continental Eastern Texas International People Express Delta
...... --:--:::-:--------==-!----•1> USAirways Piedmont --America west
Southwestl ===============-:::::;-;::-----=::::::::-1,._,., MorrisAir- .,,!.,.,, •Southwest ValuJet ------------+Airtran_-;,,_..,.,......_.,.,,
... 1991
Source: Updated from 5. Borenstein. "The Evolution of U.S. Airline Compernion; Journal ofEw nomic Perspecrives 6(2). 1992. p. 48.
newcomers failed during the early years of airline deregulation, they were soon replan:d by new entrepreneurs cager to start up their own airlines.
Price cutting by the major carriers \Yas highly sele<.:tive. Fare stm<.:tures became in<.:reasingly complex as airlines sought to separate price-sensitive leisure customers from price-inelastic business travelers. As a result. fare bands widened: advanced-purd1ased economy fares with Saturday night stays were as little as one-tenth of the first-class fart· for the samt· journey.
Price cuts were also selective by rou1e. Typictlly. 1he major airlines offered low prices on those routes when: they faced compet ition from low-cost rivals. Southwest, the biggest and most succl'ssful of the LCCs. complained continually o f predatory price nils by its larger rivals. However, the ability of the major airlines to compete againsl the budget airlines was limited by the majors· cost stmctures. including infra-stmcture, restrictive labo r agreements. old airplanes. and commitments to extensive route ncrworks. To meet the competition of low-cost newcomers, several of the majors set up new suhsidiaril's to replicate the strategies and t ·ost stmctures o f tlw budget airlines. These included Continental's Continental Lite ( 1994), UAL's Shuttle by United ( 1995). Delta's Song ( 199j). and Uni1ed's Ted ( 1994) and were all expensive failures.
The legacy airlines were more successful in cutting their own costs: during 2001-2011, union contracts were renegotiated, inefficient working practices terminated, unprofitable routes abandoned, and staffi ng reduced . I lowever. higher fuel prices hit the major airlines mo re heavily than they did the LCCs. Not only did the LCCs have newer. more fuel-e fficient planes hut their stronger financial positions allowed them to hedge through forward contracts.

480 CASES TO ACCOMPANY CONTEMPORARY STRATEGY ANALYSIS
The Quest for Differentiation Under regulation. pricl:' contro ls resulted in airline competition shifting to non-price dimensions: customer sen ·ice and in-flight food and entertainment. Deregulation brutally expos<:d th<: myth o f customer loyalty: most travelers found little discernible difference among the offerings of different major airlines and were becoming more indifferent as to v.·hich airline they used on a particular route. As airlines increasingly cut back on customer amenities, efforts at differentiation became primarily focused upon business and first-class travelers. The high margins on first- and business-class tickets provided a strong incentive to actract these customers by means o f spacious seats and intensive in-flight pampering. For leisure travelers it was unclear w hether their choice o f carrier \Vas responsive to anything other than price, and the low margins on these tickets limited the w illingness of the airlines to increase costs by providing additional services.
The most widespread and successful initiative to bui ld customer loyalty was the introduction of freq uent -flyer schemes. Am erican·s frequent-fl yer p rogram was launched in 1981 and was soon followed by all the other majo r airlines. By offering free tickets and upgrades on the basis o f miles flown, and setting thresh-o ld levels for rewards, the airlines encouraged customers to concentrate their air travel on <1 single airline. Ry the end of 2006, airlines· unred eemed frequent-fl yer distance had surged to over 10 trillion miles. By involYing other compan ies as partners-car-rental companies, horel chains, credi t card issuers-frequent-flyer programs became an important source o f additional revenue for the airlines, being wort h over SI 0 billion annually.
The Industry in 2012
The Airlines At the beginning of 20 12, the US airline industry (including air cargo firms) com-prised 151 companies. many of them local operators. Table 4 lists those w ith annual revenues c:xceeding Sl OO million. The industry was dominated by five major pas-senger airlines: United. American. Delta. US Airways. and Southwest. The impor-tance of the leading group was enhanced by its nerworks of all iances w ith smaller airlines. In addition, domestic alliances w ith regio nal airlines. the Big 3, were also core members of international alliances: United with Star Alliance, American w ith the oneworld alliance. and Delta \Vith SkyTeam.
Market for Air Trave l Ajrlines were the dominant mode of long-distance travel in 1he US. For shorter jour-neys, cars rrovided the major alternative. Alternative fo rms of public transpo rtation-bus and ra il-accounted for a small propo rtio n o f journeys in excess o f a hundred miles. Only on a few routes (notably Washington-New York- Hoston) did trains pro-v ide a v iable alternative to air.
Most forecasts pointed to continued growth in the demand for air travel. but at a much slower rate than in earlier decades. During the 1980s and 1990s, passenger miles flown grew at :t rate o f 5% per annum and then slowed during the next decade. Boeing predicted that annual growth in air travel (in terms o f revenue passenger

CASE 4 THE US AIRLINE INDUSTRY IN 2012 481
TABLE 4 TliL· 1 ·s ;J i r1i11(:' crn 11rx111 iL· . ., i 11 2011"
Airline Employees Airline Employees
Major Carriers AirTran 7}04 Hawaiian 4,438 Alaska 9,635 JetBlue 14,362 American 69.810 Kalitta Air 1,174 American Eagle 10,887 SkyWest 10,378 Atlas Air 1,529 Southwest 38,945 Delta 82, 181 US Airways 32,257 Federal Express 151,308 United 87,440 Frontier 5,073 United Parcel Service 5.592tl National Carriers ABX Air 480 Miami Air International 380 Air Transport Intl 409 North American 638 Air Wisconsin 2,81 4 Omni Air Express 830 Allegiant Air 1,760 PSA Airlines 1,057 Amerijet Intl 608 Pinnacle 5,492 ASTAR USA 269 Polar Air Cargo 145 Centurion Cargo 226 Republic 2,011 Colgan Air 1,826 Ryan International 465 Comair 1,709 Shuttle America 1,844 Compass 1,076 Southern Air 713 Evergreen International 378 Spirit 2,850 Executive 2,01 4 Sun Country Airlines 968 ExpressJet 9,699 USA Jet 306 GoJet Airlines 769 Virgin America 2,421 Horizon Air 3,062 Vision 444 Mesa Ai rlines 1,820 World 888 Large Regional Carriers Aerodynamics Inc. 195 Ka litta Charters II 84 Aloha Air Cargo 347 Lynden Air Cargo 171 Asia Pacific 42 National Air Cargo Group 219 Avjet 161 Northern Air Cargo 230 Capi ta l Cargo Intl 178 Tatonduk Outfitters Lid 299 Florida West 90 Tradewinds 154 Gulf and Caribbean Cargo 94 Medium Regional Carriers Ameristar Air Cargo 47 Kaiser Air 144 Caribbean Sun Airlines 81 Prescott Support Company 46 Dynamic 49 Sierra Pacific 28 Falcon Air Expre5s 162 Swift Air 105
Note: ' The list includes both passenger and freight-carrying air lines. "UPS Airlines only. Source: Bureau ofTranspona 11on Statisti.cs.
m iles) wou ld grow by an average annual rate o f 2.9% during 2010- 50. the slowest o f any of thL' world 's major markets.' Some observers thought this overoptimistic, citing not just depressed consumer spend ing but also the upsurge in v ideo conferencing that suggL'sted that the long-anticipated shift from fan:-to-face to virtual business meetings had finally arrived.

482 CASES TO ACCOMPANY CONTEMPORARY STRATEGY ANALYSIS
Changes were occurring within the strucrure of demand. O f particular concern to the airl ines w:.is evidence that the segmentation between business and leisure customers was breaking dow n. Conventional w isdom dictated that the demand for air tickets among leisure travelers was fa irly price elastic; that of business travelers was highly inelastic. Hence. the primary source of airline profit was high-margin business fares. During 2008-2009. increasing numbers of companies changed their travel policies to limit o r eliminate em ployee access to premjum-class air travel.6
Changes in the distribution of airline tickets contributed co increased price com-petition . The advent of the internet had decimated cradicional travel agencies-retail-ers that specialized in the sa le of travel tickets, hotel reservations. and vacation packages. Airl ine tickets were increasingly sold by o nline travel agents such as Expedia and Travelocity, o r through airlines' own websites. However, the airlines were slower than e-commerce start-ups in explo iting the opportunities of the inter-net. A key impact of the internet was providing consumers w ith unparalleled price transparency. permitting the 10\vest price deals to be qu ick ly sponed.
The dt:cl ine of the traditional travel-agent sector was hastened by the elimination of commissions paid to travel agents. By 2008. commjssions paid by airline com-panies to resellers fell to 1% of operating expenses (Table 5). down from 6.2% in 1991. By 2012. the traditional travel agency industry was dominated by a few global leaders such as American Express and Thomas Cook.
TABLE 5 <>pl'r:11 ing n>"l:-- in tl u..· l ':-- :tirl inl' indu-.tn . 200(1 and 2008
Increase in cost(%) Percentage of total operating expenses
Cost it em
Labor Fuel Professional services Food and beverage Landing fees Maintenance material Insurance Passenger commissions Communication Advertising and promotion Transport-related and other operating expenses
Notes: 'Compensation per employee, "cost per gallon, per available seat mile;
dper revenue seat mile; •per ton landed. 'per aircraft block hour; iarrcraft and non-arrcraft. "as% of passenger revenue; per enplanement. to 3rd quarter.
2000- 2011
39" 268"
17 (38)0
70" (9)' 62"
(73)" (19)' (45) 346
Source: Arrhnes for America. Cost Index for US Passenger Airlines
2006
23.8 25.5
7.8 1 5 2 14 0.1 1.3 0.9 0.8
22.3
2008 20111
24.4 22.1 35.9 30.7 8.1 7.3 1.3 1.5 1.9 2.0 2.3 1.7 0.5 0.4 1.0 1.1 1.0 0.9 0.6 0.6
23.1 21.6

CASE 4 THE US AIRLINE lNDUSTRY IN 2012 483
Airline Cost Conditions Lahor and fuel costs Wl'rc: by far the biggest indiYidual cosl items <Table 5 ). A key feature of the industr)' s cost s1ruc1ure was the very high proportion of fixed costs. For example , becausl' of union contracts, it was difficult IO reducl' employment and hours worked during downturns. The majo rs' need to maintain lhl'ir route netwo rks and flight schedules mL·an1 1ha1 planes flew even w hen occupancy was very low. The clcsirl' 10 rl'tain thl' intl'grity of the entire network made thl' airlines reluctant 10 shed unpro fitable routes during downn1rns. An impor1an1 implication o f the indus-try"s cost structure was thal. al limes of excess capacity, lhe marginal costs o f filling empty seats on s1.:heduled flights \vas extremely low.
Labor The indus1ry·s labor costs were boosted by high levels of L'mployee remuner-ation: average pay in the scheduk·d airline sector was S55.MO in 20 11 (a slight decline since 2007). In private L'lllployment as a w hole, average remuneration was S38.300>. Pilo ts, co-pilo t-;, and flight engineers earned an averagL' o f S 119, 180; flight atlenc.lants S-1 l.6-10.- Laho r costs for the major network airlinl's were boosted by lo\\' labor pnx luc1i\"ity resulting from rigid \\'Orking practices that \\'l'rL' part o f the employ-ment contracts agrel'd \\'ilh unions. Their employees lx:longL·d to one of a dozen majo r unions: thl' Association of Flight Attendants, the Air Line Pilots Association , and th<: In1erna1ional Association of Machinists and Aerospace Workl'rs 1-x:ing the most impo rtant. Despite these unions· tradition of militancy and pasl success in negotiating pay incn.:ases well a hove !Ill' ralt.' or inflation, since 200 l the rrecarious financial state o f the airlines and the lkxihili1y o ffered by Chapter J I bankruptcy had enabled the airlines to impose pay rc.:slril'rions and more flexible working practices.
Fuel How much a carrier srL'nl on fuel was dependent on the ag<: o f its aircraft and its average flight length. Newer planes and longer flights lee.I 10 higher fuel efficiency. Fuel-dfic iency considerations had encouraged plane manufacturers 10 de,·elop long-distance. wide-body planes \Yith l\Yo rallJL•r than four engines. Fuel represented the most volatile and unpredictable cost item for lhl' airlines dut: to fluc-tuations in the price o f crude oil. fktween January 2002 and June 2008. ew Yo rk spot crud<: prices re>SL' from Sl9 10 a barrel before falling to S-10 in December 2008. O il pric<:s \Vere on a rising trend during 2009 and 20IO. thl'n during 20 11 and the first five months of 20 12 traded in a range hetween SHO and S 1 I 0.
An airline's fud costs also c.l<:pended upon l\vo oth<:r facwrs: lhL· changing rela-tionship hetweL·n crude prices and jet fuel prices and thL' airli11l's· procurement strategies:
• During 2010 lo 20 12, the effects of high crude o il prices were exacerbated by a widening margin IK·tween the price o f jel fuel and the pric<: or crud<:.>. Histo ric;1lly, jel fuel ha<l sold at a 15-20% premium over crude oil. During 20 12, the margin widL'ned 10 33%."
• High, volatile fuel prices encouraged the airlines 10 hedge using options and futurt:s con1r;1c1s and make forwa rd contacts. The extent of hedging varied between airlines according 10 their expectations about lhl' future direc-tion o f prices and whether they had the financial resources for hedging. In March 20 12. hedging of 20 12 fuel requirements varied from almost l OOo/o (Southwest ) 10 0% < l S Airways): United was at 52'* • _letBIUL' 27%.'1

484 CASES TO ACCOMPANY CONTEMPORARY STRATEGY ANALYSIS
Della Airline." took its fuel hedging one step furth<.: r by becoming an active trader of jet fuel and crnde o il. In 2011 , it moved its jet fuel procurement unit into its treasury services department and hired oil traders fro m Wall Street, including Jo n Ruggles from Merrill Lynch. Howt!ver, its most audacious move was buying the 185,000 barrel/day Trainer oil refinery in Pennsylvania from ConocoPhillips for $180 million. Delta estimated that the purchase would allow it to cut S300 mmion annu-ally from its S 12 billion jet fuel bill. The refine1y would be supplied w ith crude by BP, which would also exchange refined products from the refinery for jet fuel. As a result. the refinery wou ld provide 80% of Delta's S fuel needs. In addition, it believed that its fuel-trading activities \Yould benefit from having a physical product to trade and access to detailed information on production costs. 10
Equipment Aircraft were the biggest capital expendirurt· item for the airlines. In 2012, w ith list prices for commercial jetliners ranging from S75 mi llion for a Boeing 737 to $390 million for an Airbus A380. the purchase of new planes represented a major source of financial strain for the airlines. While Boeing and Airbus competed fiercely for new business (especially w hen their order book was low, as in 2002- 2004), aggressive dis-counts and generous financing tem1s for the purchase of ne\\· p lanes disguised the fact that a major source of profiL<; for the aircratt manufacturers was aftermarket sales. Over the past 20 years. the number of manufacturers of large jets declined from four to two. Lockh eed ceased civilian jet manufacture in 1984; McDonnell Douglas was acquired by Boeing in 1997. l11e leading suppliers of regional jets were Bombardier of Canada and Embraer of Rrazil. During 2005-201 l , Boeing's rerurn on equity averaged 36%.
Increasingly, airlines were leasing rather than purchasing planes. The world's two biggest aircraft owners were both leasing companies: GECAS (a subsidiary of General Electric) with l ,7.i2 planes and lLFC (a subsidiary of AlG) w ith 1,031. The attraction of leasing was that, first. many US airl ines lackcd the financial resources to purchase planes and, second. thei r borrowing costs were higher than those of leasing from companies. 11
Airport Facilities Airpons play a critical role in the US aviation industry. They are hugely complex, expensi,·c facilities and few in number. Only the largest cities are served by more than one airpo rt. Despite the rapid , sustained growth in ai r transport since deregulatio n, Denver International Airport is the only major new airport to have been built since 1978. Most airports are owned by municipalities; they typically generate substantial revenue flows for the cities. Landing fees are set by contracts between the airport and the airl ines and are typically based on aircra ft weight. ew York's La Guardia airpo rt has the highest landing fees in che US, charg-ing over S6.000 fo r a Boeing 747 to land. In 201 1, the airl ines paid over S2 billion to US airpo rts in landing fees and a further S3 billion in passenger facility charges.
Four US airports-JFK and La Guardia in ew York. 1ewark, and Washington's Reagan Tationa l-are officially '·congested ,. and takeoffs and landings there are reg-ulated by the government. At these airports, slots were allocated to individual air-lines. w ho subsequently assumed de facro ownership and engaged in trading them. According to Jeff Breen of Cambridge Aviation Research. '"Slots are a lot like baseball franchises. Once you hav<:: one. you have it for life." 1l
Cost Differences between Airlines One of the arguments for deregulation had been that there were few majo r economies of scale in air transport; hence large

CASE 4 THE US AIRLINE INDUSTRY IN 2012 485
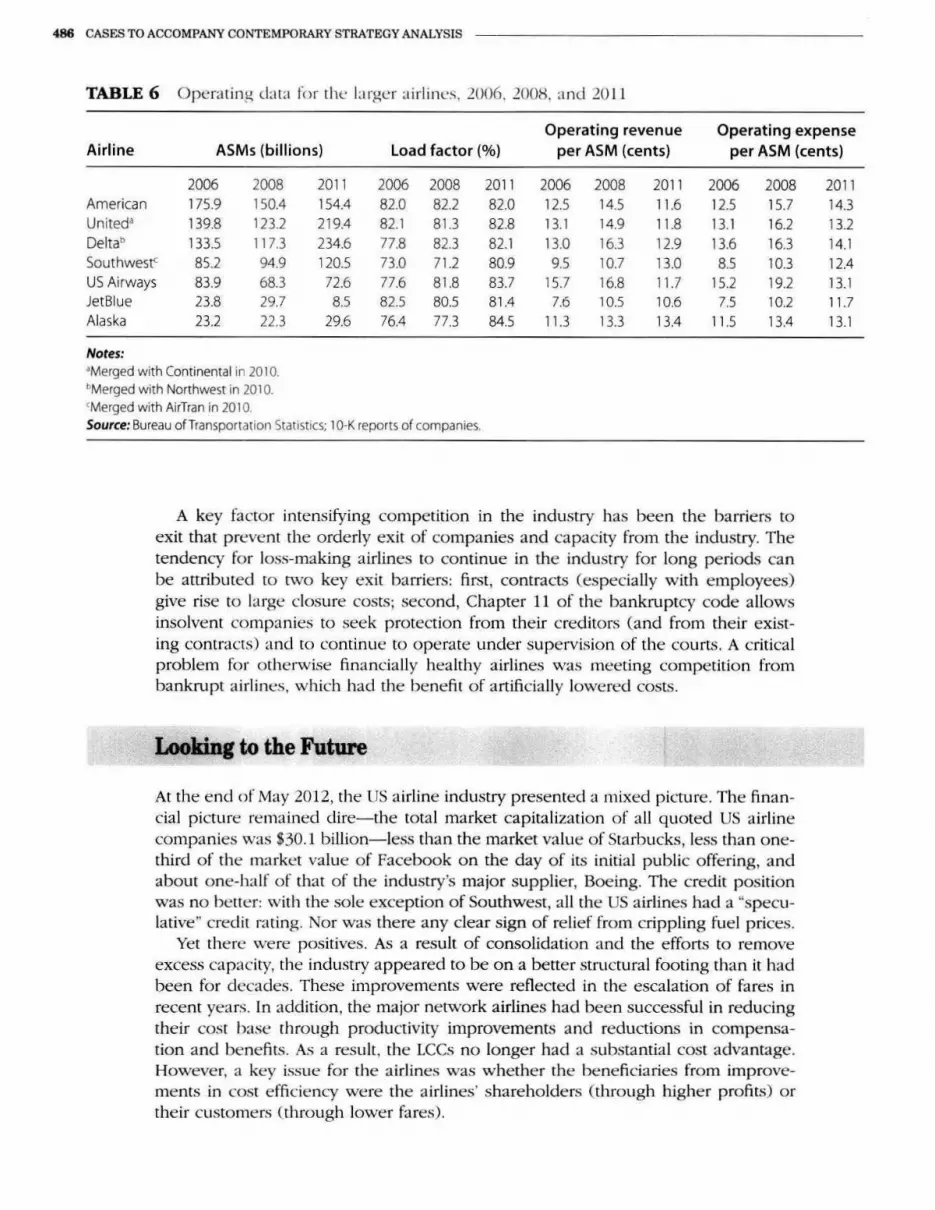
and small airlines could coexist. Subseque ntly. little: evidence has emerged of large: :1irlines gaining syste matic cost advantages m·er their smalle r rivals. However. the re are economic:s :1ssociated w ith network density: the g reater the numbe r of routes within a regio n, the easier it is for an airline: to gain economies of utilization of aircraft . crews, and passenger and mainte nance facilities . In practice, cost d if-fe renn.·s between airl ines are d ue more to manageria l. inst itutional. and historical facto rs tha n to the innuence of econo mies of scale. scope. o r dens ity. The indust ry·s cost leadc:r. Southwest. built its strategy and manage ment systems around the: goal of low costs. By offe ri ng services from mino r airpo n s, with limit l'd custo mer service, a sing le type of airplane. job-sharing amo ng e mployees, a nd s:1bry levels substantia lly less th:in those pa id by other major carriers. Southw<.:st. jet Blue:. :ind o ther LCCs had the ind ustry's lowest o pe rating costs pe r available: seat mile ( AS1\ I ), despitt• nying rela tively sho rt routes. Hmvever. the ga p has narrowed: in 200(>. LIS Airways (tradi-tio nally the highest-cost a irline:) had cost pe r ASM that was double that o f Jet Blue; in 2011. the differe nce: was tiny (Table 6).
Capacity ut il iza tion (load factor) is a key determinant o f 011L'rating cost r e r ASM . Profitability depends on achieYing hreake, ·en levels o f capaciry o pe ration. O pe rating below hre:1keYen cap:1city means not o nly that fi xed costs are sprc::1d over a smaller numhc:r o f passengers hut also that the re a re big incentives to cut p rices in o rder to attract additional business. The industry's periodic price wars te nded to occur dur-ing pe riods of slack de mand and on routes whe re the re \Vere sc:vt:ral competitors and conside rable t'Xcess capacity. The: industry's rising average load factor d uring 2011 :inti early 20 12 was taken as a ravorahle indicato r o f mode ra ting competitive pr<.:ssu res.
Achieving high load facto rs while avoiding ruinous ly low prices was a major preoccupation for the: airlines. All the: ma jo r airlines adopted y ield-ma11age111e11t
sophisticated com puter mode ls that combint· l·aracity. purchasing data. a nd fo recasts to continua lly adjust pricing. The goal is to maximize revenue for each flight.
Entry and Exit Hopes hy the deregulators that the US airline business would he: a case study of competitio n in a "contestable markvt" were thw:1rtl'd hy two fa cto rs: significant har-riers to both entry and e xit and evide nce that potential competition ("contestahi lity") \Vas no substitute for the real thing. 1' The capital require me nts for setting up an a irline c 111 he IO\v (a single leased pl:ine will suffice), hut o ffe ring :1 scheduled airline service n:qui res setting up a who k syste m comprising gates. :lirline , and aircraft certification, takeoff and landing slo ts, baggage handling services, and the markt:ting and distribution of tickets. At several a irports. th L· dominance of gates and landi ng slo ts by a fe\\' ma jo r carriers madl· 1.: ntry into particular routc:s tlifficult a nd fo rced sta n -up airlines to use secondary :1irpo rts . DespitL' the challe nges of entry harri-ers and the d ismal fmancial o f the industry. airlinl'S seemed to o ffe r a strnngc: attraction to e ntrepre ne urs. The most n.:n:nt majo r entrant was Hichard Branson 's Virgin America, w hich began service in August 2007. Inte rnational a irlines were also potential e nt rants into the: LIS domestic market. The second stage of the l lS- EI · O pl'l1 Skies agreement lifted the 25% ownership limit on US airlines and offe red g reater po te ntial fo r Eu ropean airlines to o ffer sel\·ices between US cit ies.
486 CASES TO ACCOMPANY CONTEMPORARY STRATEGY ANALYSIS
TABLE 6 Operatinl{ data for the larger airlines, .2006 . .2008. and 20 11
Operating revenue Operating expense Airline ASMs (billions) Load factor (%) per ASM (cents) per ASM (cents)
2006 2008 201 1 2006 2008 2011 2006 2008 2011 2006 2008 American 175.9 150.4 154.4 82.0 82.2 82.0 12.S 14.S 11.6 12.5 15.7 United• 139.8 123.2 219.4 82.1 81.3 82.8 13.1 14.9 11.8 13.1 16.2 Delta0 133.S 117.3 234.6 77.8 82.3 82.1 13.0 16.3 12.9 13.6 16.3 Southwest< 85.2 94.9 120.S 73.0 71.2 80.9 9.5 10.7 13.0 8.5 10.3 US Airways 83.9 68.3 72.6 77.6 81.8 83.7 15.7 16.8 11.7 15.2 19.2 JetBlue 23.8 29.7 8.5 82.S 80.S 81.4 7.6 10.S 10.6 7.5 10.2 Alaska 23.2 22.3 29.6 76.4 77.3 84.S 11 .3 13.3 13.4 11 .5 13.4
Notes: •Merged with Continental in 2010. bMerged with Northwest in 2010. 'Merged with AirTran in 2010. Source: Bureau ofTransportation Statistics; 10-K reports of companies.
A key factor intensifying competitio n in the industry has been the barriers to exit that prevent the orde rly exit of companies and capacity from the industry. The tendency for loss-making airlines to continue in the industry for long periods can be attributed to two key exit barriers: first, contracts (especialJy w ith employees) give rise to large closure costs; second, Chapter 11 of the bankruptcy code allows insolvent companies to seek protection from rheir creditors (and from the ir exist-ing contracts) and to continue to o perate under supervision of the courts. A critical problem for otherwise financia lly healthy airlines was meeting competition fro m bankrupt ai rlines, which had rhe benefit of artificia lly lowered costs.
Looking to the Future
At the end of May 2012, the US a irline industry presented a mixed picture. The finan-cial picture remained dire- the total market capitalization of all quoted US airline companies was $30.1 billio n- less than the market value of Starbucks, less than one-third of the market value of Facebook on the day of its initial public offering, and about one-half o f that of the industry's major supplie r, Boeing. The credit position was no better: with the sole exception of Southwest, a ll the US a irlines had a "specu-lative" credit rating. Nor was there any clear sign o f re lief from crippling fuel prices.
Yet the rt: were positives. As a resu lt of consolidatio n and the efforts to remove excess capacity, the industry appeared to be on a better structural footing than it had been for decades. These improvements were reflected in the escalatio n of fares in recent years. In addition, the major network airlines had been successful in reducing the ir cost base through productivity improvements and reductions in compensa-tion and bene fits. As a result , the LCCs no longer had a substantial cost advantage. However, a key issue for the airlines was whether the beneficiaries from improve-ments in cost e fficie ncy were the airlines' shareholde rs (through higher profits) or the ir customers (through lower fa res).
201 1 14.3 13.2 14.1 12.4 13.1 11.7 13.1

CASE 4 THE US AIRLINE INDUSTRY IN 2012 487
The evidence of previous revivals in the industry suggested that they came to an e nd either as a result of external events or by the industry's own propensity to over-invest. In the case of the two previous upturns 0996-1999 and 2006-2008) external events were the critical factors (the September 11 terrorist attacks and the financial crisis of 2008). The eagerness of the airlines to order new planes suggested that the newfound financial prudence and capacity discipline might evaporate once the industry's fortunes improved.
Notes
I. Airlines liir America. 'fhwanl (,'Jubal l :'nmv111ic h'111pv1remu•111 and S11stai11ed Profita/JiWl'. \ 1:ty IH. 2012. hnp:/ / \\"\\ '\\'.slidesh:1re.net/a·tamediard:11iuns/ :l'l-a-indy-revicw- 1288487:1. accessed September 12, 2012.
2 . .John Hainey. Pn:senl:Hion lo !lank of America Lynch (;Johal Transportation Conk•rl'nn:. i\lay 17. 20 12.
5. l IS Department of Transport:tlion, B11rt·:1u of Transpor1a1ion S1:11is1ic.:s. 4th Quarter 201 1 Airlinl' Finandal Data. !\lay 17. 20 12.
' I. Abolition of the CAii mcam 1ha1 !he primary rt·sponsi-hility for airline regul:Hion was with thl' Fede ral Aviation :\dmini., tr:Hion. whkh was rt'SJ>0nsihlc for airlinl' s::ik1y. l\("'ing Current Markel Outlook. -1.ong-Term .'V1arkt·I. .. hit p://acl ive. hoeing.cc >m/ commcrcia l/f< >rccas1_ da1:1/ index.dm. accessed Septemhl'r 27. 20 12.
6. "l\usinl'.' ·' Tra,·el lllul',, ... \1'{1sbi11g to11 /'ust. March 17. .WC)<). http://www.w:1shing1onpost.com/wp-dyn/n>111ent/ artide/ 2009/ 03/ 17/ AR2009031701280.html. al'CCSSt:d October 20. 1009.
7. l IS Bureau uf Labor Statistics. 1'a1innal Industry-Specific OtTupational Employme nt and Wage Estimalt:s fi1r NAICS ·IHIOOO. Air Transport:llion.
H. Airlines for America. Tmrarrl (,'/ubal Ci1111JX•filin•1wss. l:'cono111ic 1:'111po1.11en11<mt a11d S11stai11ed Pnyitaililill'.
May 18, 20 I 2. http://www.slidl'sharc.ne1/ a4:unl'dian:la li<lns/ :14-a-indy-rc'' ie\\'- 1288-1873. accessed Septl'mher 12. 2012.
9. llloombl'.rg, "Jet Fud I lcdging Positions for U.S .. C111:1di:111 Airlines ... 1\1arch 26. 2012. hnp://w,vw.hloo m ht· rg.com/ nl'ws/10 12-03-26/ iet-fuel-hedging-rosit ic ms-f< >r-u-s-cmadia n-a irl i ncs-ta ble-. html, accessed Sl'ptemher 12. 2012.
10. lkute rs. "Do:lta buys refinery. becoming first airline to make own fuel." April 30. 2012, http://www . rcuters.e< »n/ artide/ 20 12/05/ 0 l/ delra-id USL 11' 8FllED720 1.W'iO I. an·e1<sed September 12. 20 12: "Delta ups the antt· in war ag:tinst Wall Strl't'I," Furltllll'. April 12. 2012.
11. "Aircraft lt·a,ing: Buy or rent>" /:'co110111ist . .January 21. 21) 12.
12. "Should Airlines lk Allowed 10 Trade Airport Slots?'' 'fi'ih1111e .lf<'dia Serl'iu"'· October 18. 20 10. hnp:// www. fn >mmers.nnn/a rtidl's/7023.html. accessed September I I. 2012.
13. On the prindples of n•nles1abili1y and its application lo the L'S airline industry. St'l' S. Martin. "The Theo!'\· of Conlestahk .\farkt·t.<. discussiCln paper. Dt:pannwnt of Eco nomiL·s. Purdue· l lniVl'rs it y, .July 2000.
A video clip relating to this case is available in your interactive e-book at www.wlleyopenpage.com


![Airline] Figftte - DigitalOcean](https://img.dokumen.tips/doc/110x75/631ef92517cd32be4e0475a5/airline-figftte-digitalocean.jpg)
