Embed Size (px)
Citation preview

The Promise of Forward Osmosis
Department of Chemical Engineering
Menachem Elimelech
Department of Chemical EngineeringEnvironmental Engineering Program
Yale University
World Class University Program
School of Civil, Environmental & Architectural Engineering
Korea University
Waterworks Research Institute Seoul Metropolitan Government
August 13, 2009

Motivation: Augment Water
Supply
� Droughts and water shortages
� Need to increase water supply
by producing new water
� Viable options for new water:
� Wastewater reuse
� Desalination of sea/brackish
water

Need for Sustainable
Technologies
� Develop water/wastewater
treatment technologies that
• Use less energy
• Require less chemicals• Require less chemicals
• Have lower impact on the
environment
� Osmotically-driven membrane
processes, or forward osmosis
(FO), may be a promising option

What is Forward Osmosis?
Reverse Osmosis
Hydraulic
Pressure
Feed
Permeate
M
E
M
B
R
water
( )mw PAJ ∆Π−∆=
Pressure
water
PermeateR
A
N
E

What is Forward Osmosis?
Reverse Osmosis
Hydraulic
Pressure
Feed
Permeate
M
E
M
B
R
water
Forward Osmosis
M
E
M
B
R
water
Permeate
Draw
Solution
Feed
( )mw PAJ ∆Π−∆=
Pressure
water
PermeateR
A
N
E
mw AJ ∆Π=
R
A
N
E water
Solution
Permeate

Forward
Osmosis
Osmosis
Reverse
Osmosis
p=π p>π
π
OsmosisOsmosis
Seawater or
brackish water
FreshwaterMembrane
Draw
Solution
Forward Osmosis

Forward Osmosis Process
Membrane
Draw
Solution
Feed water
Diluted Draw solution
Solution
Recovery
Process
Product
waterConcentrate Concentrated
Draw Solution

Applications of
Forward OsmosisForward Osmosis

Hydration Bags

Wastewater Treatment with
Forward Osmosis
Feed
water
Draw Solution (Salt)
Forward
Membrane Membrane
Reverse
water
Clean
WaterConcentrate
Disposal
watersaltForward
Osmosis
water
Reverse
Osmosis
Diluted Draw Solution

Membrane Bioreactor (MBR) for
Wastewater Treatment

Wastewater Reuse: Membrane
Bioreactor (MBR)-RO System

Osmotic MBR-RO: Multiple
Barrier Wastewater Treatment
Osmotic MBR
DisinfectionWastewater
RO
Draw
Concentrated
Draw Solution
(Salt)
Achilli et al., Desalination, 2008
Potable
water
Sludge
Solution
Recovery
Process
Diluted
Draw Solution
M1

슬라이드 13슬라이드 13슬라이드 13슬라이드 13
M1 M1 M1 M1 This you can modifu as you wish. See original paper...
May use similar style as previous slideMeny Elimelech, 2009-07-31

Desalination by Forward Osmosis:
The Ideal Draw Solution
� Highly soluble solution to generate high
osmotic pressure gradient
� Recoverable and recyclable� Recoverable and recyclable
� Soluble species should not pass through
the membrane

NH3/CO2 Draw Solution
NH3(g) CO2(g)
NH3(g) CO2(g)
NH4HCO3(aq)
(NH4)2CO3(aq)
NH4COONH2(aq)
HEAT

The Ammonia-Carbon Dioxide FO
Desalination Process
Energy
Input
Nature, 452, (2008) 260
Desalination, 174 (2005) 1-11.

High Water Recovery with FO
RO FO
250
300
350
400
450
π (atm)
Seawater π
0 10 20 30 40 50 60 70 80 90 1000
50
100
150
200π (atm)
Recovery (%)

Osmotic Heat Engine
Q in
Heat Engine Work
Q out
Heat Engine Work

NH3/CO2 Osmotic Heat Engine:
Closed Loop PRO
JMS, 305 (2007) 13-19; ES&T, 42 (2008) 8625-8629.

Water Flux in Forward
OsmosisOsmosis

Effect of Membrane Design on
FO Water Flux
12
16CA
Flux (
µm/s)
Flux (gfd)
4
6
8
0
4
8
6M Draw/0.5M Feed, 50˚C
CEAG
Flux (
Flux (gfd)
0
2
4
Desalination, 174 (2005) 1-11.

SEM Cross Sections
CE
(RO)
Red lines indicate 50 µµµµm
AG
(RO)
CA (FO)

Forward Osmosis Membrane
50 µµµµm
10 µµµµm10 µµµµm

Forward Osmosis Membrane
Active Layer Backing Layer
– Asymmetry observed at high magnification
300 nm 300 nm

ππππD,b
Active
Layer
Draw
Solution
Crossflow
Internal CP
Major Challenge: Internal
Concentration Polarization
∆πTheo
Water flux
ππππF,b
∆πeff
External CP
Feed
Crossflow
Crossflow
Diffusion
theoeff ππ ∆<<∆

( )FW
bF
mFkJ /exp
,
, =π
π( )KJWbD
mD −= exp,
,
π
π
Modeling Internal CP
Draw Side Feed Side ππππD,b
∆πTheo
∆π
ππππD,m
)( ,, mFmDW AJ ππ −=
( )
−−=
F
WbFWbDW k
JKJAJ expexp ,, ππ
ππππF,b
∆πeff ππππF,m

Characterizing the Support Layer
ετD
tK =
K solute resistance to diffusion
t support layer thickness
τ tortuosity
ε porosity
D draw solute diffusivity
6
8
10
Flux (gfd)
40 C
30 C
20 C
m/s) 15
20
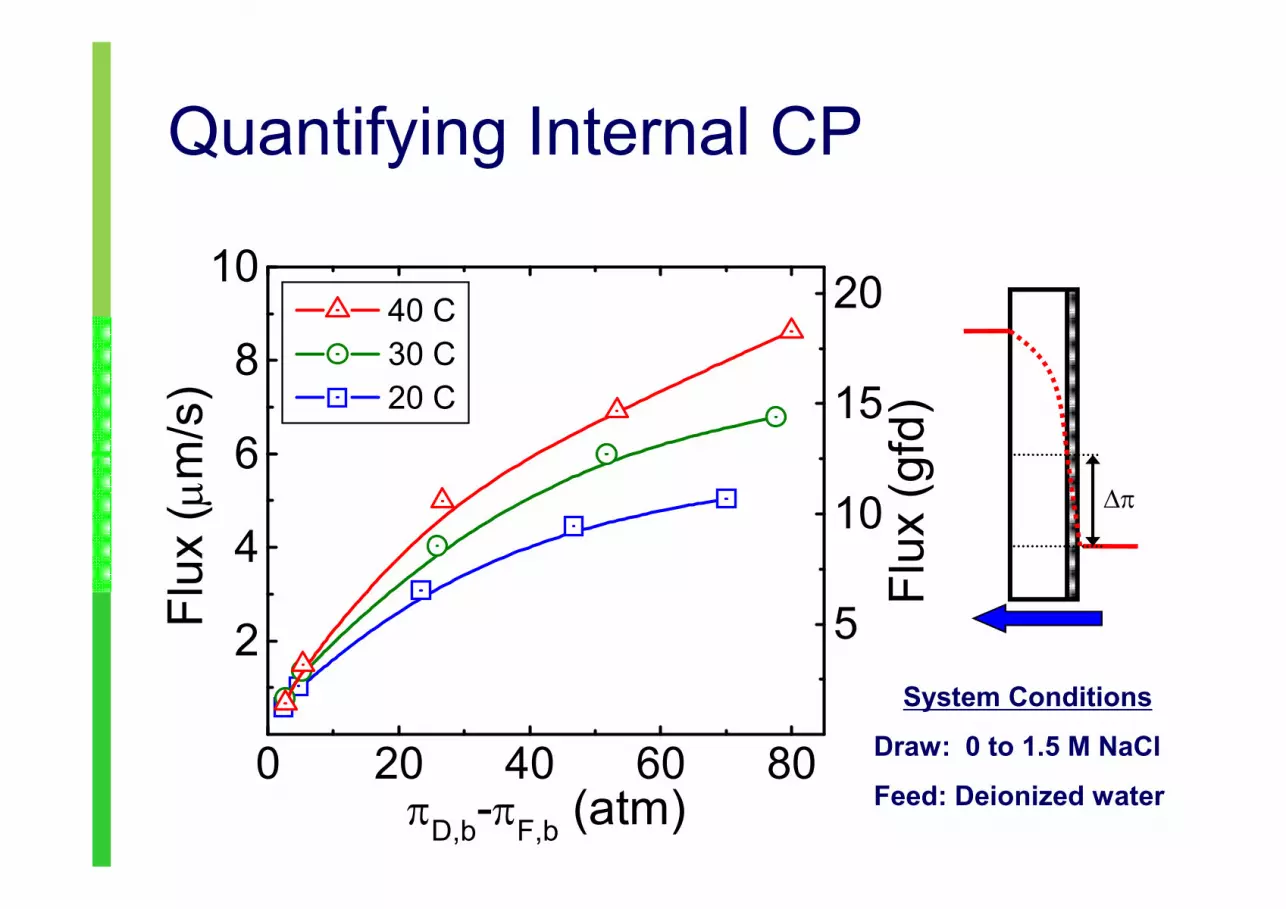
Quantifying Internal CP
0 20 40 60 80
2
4
6
Flux (gfd)
Flux (
µm/s)
πD,b-π
F,b (atm)
5
10
System Conditions
Draw: 0 to 1.5 M NaCl
Feed: Deionized water
∆π

6
8
10
Flux (gfd)
40 C
30 C
20 C
m/s) 15
20
Quantifying Internal CP
0 20 40 60 80
2
4
6
Flux (gfd)
Flux (
µm/s)
πD,b-π
F,b (atm)
5
10
System Conditions
Draw: 1.5 M NaCl
Feed: 0 ���� 1 M NaCl
∆π

Modeling Internal CP
( )
−−=
F
WbFWbDW k
JKJAJ expexp ,, ππ
τtε
τD
tK =

6
8
10
Flux (gfd)
Experimental
Model
Flux (
µm/s)
12
16
20
6
8
10
Flux (gfd)
Experimental
Model
Flux (
µm/s)
10
15
20
30 oC 40 oC
Modeling Internal CP
0 20 40 60 80
2
4
Flux (gfd)
Flux (
πD,b-π
F,b (atm)
4
8
0 20 40 60 80
2
4
Flux (gfd)
Flux (
πD,b-π
F,b (atm)
5
10

Thickness, t
thin film (active layer)
Support
layer
Characterizing the Support Layer
Tortuosity, τ Porosity, ε
Red lines indicate 50 µµµµm
CE
AG
CA
ετD
tK =

ππππDraw
∆π
∆πeff
Convection
Diffusion
Porous
support
Active
layer
τεS
eff
DD =
Driving Force in the NH3/CO2 OHE
Draw
crossflow
∆πTheo
Water
flux
ππππFeed
Dilutive ECP
Negligible
Concentrative
ICP
τ
Working Fluid
(Deionized
water)
Salt flux
P
)( effW AJ π∆=

Very High Water Fluxes
40
50
60
2-s)
20
25
50 100 150 200 250
0
10
20
30
40
Flux (
10−6
m3/m
2
Pure water (40 oC)
Pure water (20 oC)
40 oC
20 oC
Flux (gfd)
Driving Force (atm)
0
5
10
15
20

Very High Membrane Power Density
250
300
5.5 M (257 atm)
5.0 M (224 atm)
4.6 M (197 atm)
3.7 M (148 atm)
3.2 M (128 atm)
Energy Production (W/m
2)
50 100 150 2000
50
100
150
200
250
Energy Production (W/m
Hydraulic Pressure (atm)
3.2 M
3.7 M 4.6 M
5.0 M
5.5 M

Fouling and Fouling
ReversibilityReversibility

Organic Fouling Reversibility in
Forward Osmosis
6
8
10
22
29
36Flux of clean membrane
Flux (l/m
2/h)
m/s) � FO membrane: CA
(Hydration Tech)
� Organic foulant (200
0 500 1000 1500 20000
2
4
6
0
7
14
22Flux after
cleaning
Flux (l/m
Flux (
µm/s)
Time (min)
Fouling Cleaning
� Organic foulant (200
mg/L alginate); 50 mM
NaCl; 0.5 mM Ca2+
� Cleaning: 50 mM
NaCl, 15 min

Organic Fouling Reversibility
0.4
0.6
0.8
1.0
Flux recovery by cleaning
Flux after fouling
Norm
alized Flux
8.5 cm/s, NaCl, 1hr
8.5 cm/s, NaCl, 5hr
8.5 cm/s, NaCl, 24hr
21 cm/s, NaCl, 15 mins
21 cm/s, DI, 15 mins
21 cm/s, bubble DI, 1 mins
21 cm/s, bubble DI, 5 mins
0.0
0.2
Norm
alized Flux
Cleaning Conditions

Organic Fouling Reversibility:
FO versus RO
6
8
10
12
22
29
36
43
FO- CA
RO- CA
RO- PA
Flux (l/m
2/h)
µm/s)
0.6
0.8
1.0
Flux recovery by cleaning
Flux after alginate fouling
Norm
alized Flux
0 500 1000 15000
2
4
6
0
7
14
22
Fouling solution: 200 mg/L alginate,
50 mM NaCl, 0.5 mM CaCl2
Flux (l/m
Flux (
µ
Time (min)FO-CA RO-CA RO-PA
0.0
0.2
0.4
Norm
alized Flux
� FO – CA: CA membrane in FO mode
� RO – CA: CA membrane in RO mode (hydraulic pressure)
� RO – PA: Polyamide TFC membrane in RO mode

FO Exhibits Fouling Reversibility
with a Wide Range of Foulants
0.8
1.0
Flux recovery by rinsing
Flux after fouling Norm
alized Flux
Alginate BSA GypsumSilica0.0
0.2
0.4
0.6
Norm
alized Flux
Foulant Type

Concluding RemarksForward osmosis can be used as a
standalone process or as part of an hybrid
system (e.g. FO-RO)
Forward osmosis is less prone to fouling; may Forward osmosis is less prone to fouling; may
use less prime (electric) energy
Need to develop an appropriate membrane
with low internal concentration polarization

Acknowledgments
Graduate Students/Postdocs: Jeffrey McCutcheon, Robert
McGinnis, Baoxia Mi, Sangyoup Lee
World Class University (WCU) project (No. R33-2008-000-
10046-0)
The Ministry Education, Science, and Technology, KoreaThe Ministry Education, Science, and Technology, Korea
Korea Science and Education Foundation (KOSEF)
US Office of Naval Research; NSF through WaterCAMPWS


