Embed Size (px)
Citation preview

C
Sa
b
a
ARRA
KFRCF
1
as(waocRa[
ogspt
0d
Journal of Membrane Science 365 (2010) 34–39
Contents lists available at ScienceDirect
Journal of Membrane Science
journa l homepage: www.e lsev ier .com/ locate /memsci
omparison of fouling behavior in forward osmosis (FO) and reverse osmosis (RO)
angyoup Leea, Chanhee Booa, Menachem Elimelechb, Seungkwan Honga,∗
Department of Civil, Environmental & Architectural Engineering, Korea University, 1-5 Ga, Anam-Dong, Sungbuk-Gu, Seoul 136-713, Republic of KoreaDepartment of Chemical Engineering, Environmental Engineering Program, Yale University, New Haven, CT 06520-8286, USA
r t i c l e i n f o
rticle history:eceived 7 June 2010eceived in revised form 17 August 2010ccepted 22 August 2010
eywords:orward osmosiseverse osmosisake-enhanced osmotic pressure (CEOP)ouling reversibility
a b s t r a c t
Fouling behaviors during forward osmosis (FO) and reverse osmosis (RO) are compared. Alginate, humicacid, and bovine serum albumin (BSA) are used as model organic foulants, and two suspensions of silicacolloids of different sizes are chosen as model particulate foulants. To allow meaningful comparison offouling behavior, identical hydrodynamic operating conditions (i.e., initial permeate flux and cross-flowvelocity) and feed water chemistries (i.e., pH, ionic strength, and calcium concentration) are employedduring FO and RO fouling runs. The observed flux-decline behavior in FO changed dramatically with thetype of organic foulant, size of colloidal foulant, and the type of the draw solution employed to generatethe osmotic driving force. Based on these experimental data and the systematic comparisons of foulingbehaviors of FO and RO, we provide new insights into the mechanisms governing FO fouling. In FO, reversediffusion of salt from the draw solution to the feed side exacerbates the cake-enhanced osmotic pressurewithin the fouling layer. The elevated osmotic pressure near the membrane surface on the feed side leadsto a substantial drop in the net osmotic driving force and, thus, significant decline of permeate flux. Our
results further suggest that the structure (i.e., thickness and compactness) of the fouling layers of FO andRO is quite different. By varying the cross-flow velocity during the organic fouling runs, we were able toexamine the fouling reversibility in FO and RO. The permeate flux during organic fouling in FO recoveredalmost completely with increasing cross-flow velocity, while no noticeable change was observed for theRO system. Our results suggest that organic fouling in FO could be controlled effectively by optimizingfeed
the hydrodynamics in the. Introduction
Membrane-based seawater desalination and wastewater reusere widely considered as promising solutions to augment waterupply and alleviate water scarcity. At present, reverse osmosisRO) is one of the most effective and robust technologies for sea-ater desalination and wastewater reuse. However, RO uses an
verage of 4 kW prime (electric) energy to produce one cubic meterf product water [1,2], which results in emission of 1.8 kg CO2 perubic meter of product water [3]. In addition, fouling is inevitable inO systems, thereby requiring the use of chemical cleaning agentsnd increasing the cost of water production by RO technology4–6].
In recent years, there has been a growing interest in forwardsmosis (FO). Recent studies have shown that FO could be of strate-
ic importance in several applications where RO has dominated foreveral decades as well as in other applications such as liquid foodrocessing and material recycling [7–10]. The distinguishing fea-ure of FO compared to RO is the use of osmotic pressure gradient∗ Corresponding author. Tel.: +82 2 3290 3322; fax: +82 2 928 7656.E-mail address: [email protected] (S. Hong).
376-7388/$ – see front matter © 2010 Elsevier B.V. All rights reserved.oi:10.1016/j.memsci.2010.08.036
stream without employing chemical cleaning.© 2010 Elsevier B.V. All rights reserved.
as the driving force for water permeation across a semi-permeablemembrane. The main advantages of using FO are that it operates atlow or no hydraulic pressure, it can achieve high rejection of a widerange of contaminants, and it may have lower irreversible foul-ing than pressure-driven membrane processes because of the lackof applied hydraulic pressure. Among these advantages, the latteris quite attractive, especially in the area of water and wastewatertreatment as well as sea and brackish water desalination.
However, to date, no work has been done to directly compareFO and RO fouling behaviors in fouling runs performed under iden-tical physicochemical conditions. In addition, studies investigatingthe mechanisms of fouling in FO are rather scarce [11,12]. Hence,delineating the differences between FO and RO fouling behaviorand elucidating the mechanisms and factors governing FO foulingare of paramount importance.
The objectives of this study are to systematically compare thefouling behaviors in FO and RO and to further elucidate the foulingmechanisms in FO. To do so we employed identical hydrodynamic
operating conditions and feed water chemistries as well as plate-and-frame cells with identical channel dimensions. Various organicmacromolecules and colloidal particles of different sizes were usedas model foulants. We also examined the reversibility of foulingin FO by altering the hydrodynamic conditions during fouling. Our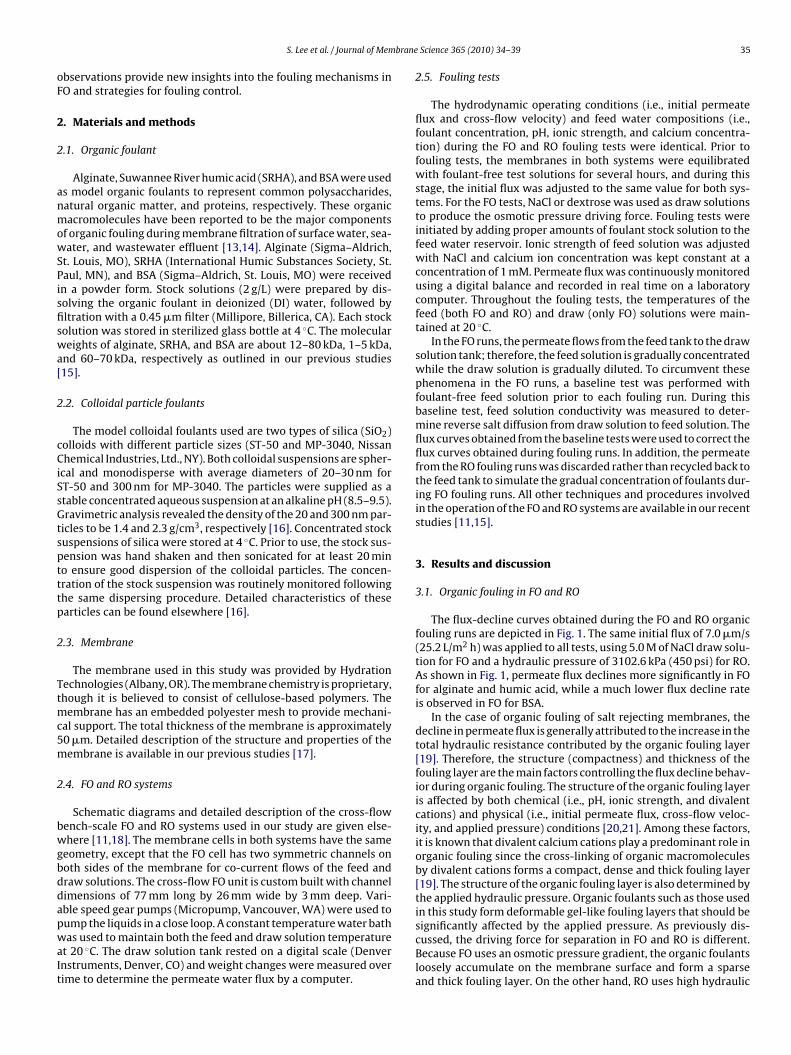
brane
oF
2
2
anmowSPisfiswa[
2
cCiSsGtsptttp
2
Ttmc5m
2
bwgbddapwaIt
S. Lee et al. / Journal of Mem
bservations provide new insights into the fouling mechanisms inO and strategies for fouling control.
. Materials and methods
.1. Organic foulant
Alginate, Suwannee River humic acid (SRHA), and BSA were useds model organic foulants to represent common polysaccharides,atural organic matter, and proteins, respectively. These organicacromolecules have been reported to be the major components
f organic fouling during membrane filtration of surface water, sea-ater, and wastewater effluent [13,14]. Alginate (Sigma–Aldrich,
t. Louis, MO), SRHA (International Humic Substances Society, St.aul, MN), and BSA (Sigma–Aldrich, St. Louis, MO) were receivedn a powder form. Stock solutions (2 g/L) were prepared by dis-olving the organic foulant in deionized (DI) water, followed byltration with a 0.45 �m filter (Millipore, Billerica, CA). Each stockolution was stored in sterilized glass bottle at 4 ◦C. The moleculareights of alginate, SRHA, and BSA are about 12–80 kDa, 1–5 kDa,
nd 60–70 kDa, respectively as outlined in our previous studies15].
.2. Colloidal particle foulants
The model colloidal foulants used are two types of silica (SiO2)olloids with different particle sizes (ST-50 and MP-3040, Nissanhemical Industries, Ltd., NY). Both colloidal suspensions are spher-
cal and monodisperse with average diameters of 20–30 nm forT-50 and 300 nm for MP-3040. The particles were supplied as atable concentrated aqueous suspension at an alkaline pH (8.5–9.5).ravimetric analysis revealed the density of the 20 and 300 nm par-
icles to be 1.4 and 2.3 g/cm3, respectively [16]. Concentrated stockuspensions of silica were stored at 4 ◦C. Prior to use, the stock sus-ension was hand shaken and then sonicated for at least 20 mino ensure good dispersion of the colloidal particles. The concen-ration of the stock suspension was routinely monitored followinghe same dispersing procedure. Detailed characteristics of thesearticles can be found elsewhere [16].
.3. Membrane
The membrane used in this study was provided by Hydrationechnologies (Albany, OR). The membrane chemistry is proprietary,hough it is believed to consist of cellulose-based polymers. The
embrane has an embedded polyester mesh to provide mechani-al support. The total thickness of the membrane is approximately0 �m. Detailed description of the structure and properties of theembrane is available in our previous studies [17].
.4. FO and RO systems
Schematic diagrams and detailed description of the cross-flowench-scale FO and RO systems used in our study are given else-here [11,18]. The membrane cells in both systems have the same
eometry, except that the FO cell has two symmetric channels onoth sides of the membrane for co-current flows of the feed andraw solutions. The cross-flow FO unit is custom built with channelimensions of 77 mm long by 26 mm wide by 3 mm deep. Vari-ble speed gear pumps (Micropump, Vancouver, WA) were used to
ump the liquids in a close loop. A constant temperature water bathas used to maintain both the feed and draw solution temperaturet 20 ◦C. The draw solution tank rested on a digital scale (Denvernstruments, Denver, CO) and weight changes were measured overime to determine the permeate water flux by a computer.
Science 365 (2010) 34–39 35
2.5. Fouling tests
The hydrodynamic operating conditions (i.e., initial permeateflux and cross-flow velocity) and feed water compositions (i.e.,foulant concentration, pH, ionic strength, and calcium concentra-tion) during the FO and RO fouling tests were identical. Prior tofouling tests, the membranes in both systems were equilibratedwith foulant-free test solutions for several hours, and during thisstage, the initial flux was adjusted to the same value for both sys-tems. For the FO tests, NaCl or dextrose was used as draw solutionsto produce the osmotic pressure driving force. Fouling tests wereinitiated by adding proper amounts of foulant stock solution to thefeed water reservoir. Ionic strength of feed solution was adjustedwith NaCl and calcium ion concentration was kept constant at aconcentration of 1 mM. Permeate flux was continuously monitoredusing a digital balance and recorded in real time on a laboratorycomputer. Throughout the fouling tests, the temperatures of thefeed (both FO and RO) and draw (only FO) solutions were main-tained at 20 ◦C.
In the FO runs, the permeate flows from the feed tank to the drawsolution tank; therefore, the feed solution is gradually concentratedwhile the draw solution is gradually diluted. To circumvent thesephenomena in the FO runs, a baseline test was performed withfoulant-free feed solution prior to each fouling run. During thisbaseline test, feed solution conductivity was measured to deter-mine reverse salt diffusion from draw solution to feed solution. Theflux curves obtained from the baseline tests were used to correct theflux curves obtained during fouling runs. In addition, the permeatefrom the RO fouling runs was discarded rather than recycled back tothe feed tank to simulate the gradual concentration of foulants dur-ing FO fouling runs. All other techniques and procedures involvedin the operation of the FO and RO systems are available in our recentstudies [11,15].
3. Results and discussion
3.1. Organic fouling in FO and RO
The flux-decline curves obtained during the FO and RO organicfouling runs are depicted in Fig. 1. The same initial flux of 7.0 �m/s(25.2 L/m2 h) was applied to all tests, using 5.0 M of NaCl draw solu-tion for FO and a hydraulic pressure of 3102.6 kPa (450 psi) for RO.As shown in Fig. 1, permeate flux declines more significantly in FOfor alginate and humic acid, while a much lower flux decline rateis observed in FO for BSA.
In the case of organic fouling of salt rejecting membranes, thedecline in permeate flux is generally attributed to the increase in thetotal hydraulic resistance contributed by the organic fouling layer[19]. Therefore, the structure (compactness) and thickness of thefouling layer are the main factors controlling the flux decline behav-ior during organic fouling. The structure of the organic fouling layeris affected by both chemical (i.e., pH, ionic strength, and divalentcations) and physical (i.e., initial permeate flux, cross-flow veloc-ity, and applied pressure) conditions [20,21]. Among these factors,it is known that divalent calcium cations play a predominant role inorganic fouling since the cross-linking of organic macromoleculesby divalent cations forms a compact, dense and thick fouling layer[19]. The structure of the organic fouling layer is also determined bythe applied hydraulic pressure. Organic foulants such as those usedin this study form deformable gel-like fouling layers that should be
significantly affected by the applied pressure. As previously dis-cussed, the driving force for separation in FO and RO is different.Because FO uses an osmotic pressure gradient, the organic foulantsloosely accumulate on the membrane surface and form a sparseand thick fouling layer. On the other hand, RO uses high hydraulic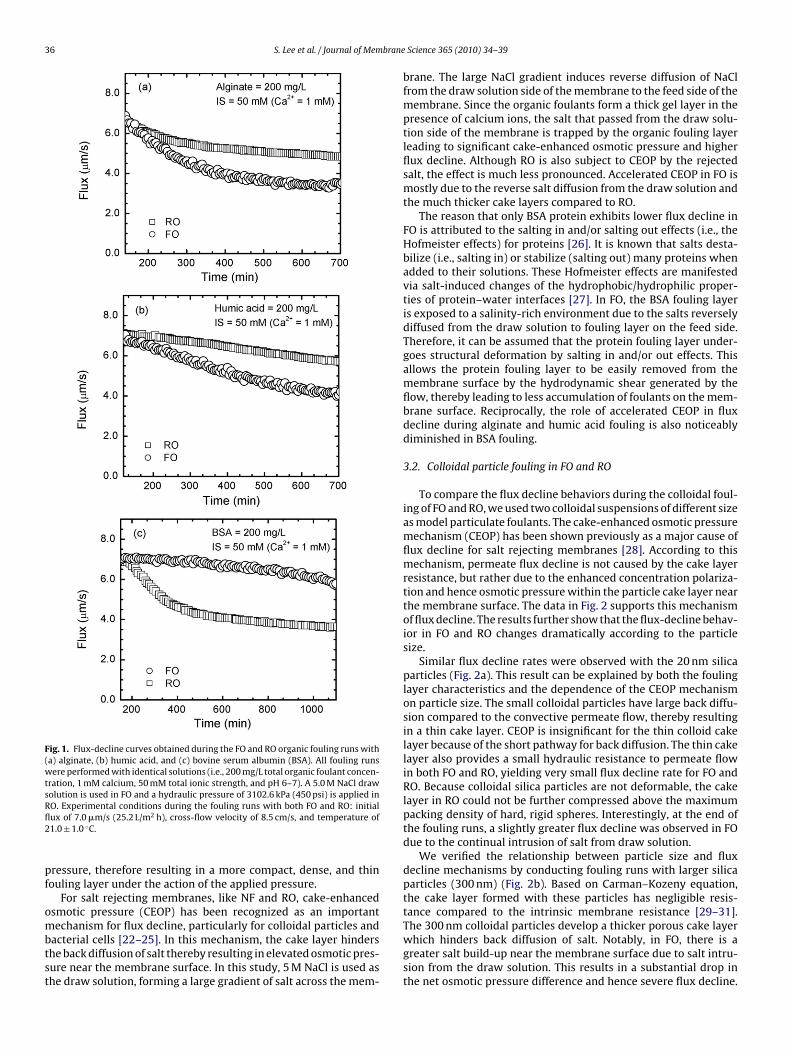
36 S. Lee et al. / Journal of Membrane
Fig. 1. Flux-decline curves obtained during the FO and RO organic fouling runs with(a) alginate, (b) humic acid, and (c) bovine serum albumin (BSA). All fouling runswere performed with identical solutions (i.e., 200 mg/L total organic foulant concen-tration, 1 mM calcium, 50 mM total ionic strength, and pH 6–7). A 5.0 M NaCl drawsolution is used in FO and a hydraulic pressure of 3102.6 kPa (450 psi) is applied inRfl2
pf
ombtst
The 300 nm colloidal particles develop a thicker porous cake layer
O. Experimental conditions during the fouling runs with both FO and RO: initialux of 7.0 �m/s (25.2 L/m2 h), cross-flow velocity of 8.5 cm/s, and temperature of1.0 ± 1.0 ◦C.
ressure, therefore resulting in a more compact, dense, and thinouling layer under the action of the applied pressure.
For salt rejecting membranes, like NF and RO, cake-enhancedsmotic pressure (CEOP) has been recognized as an importantechanism for flux decline, particularly for colloidal particles and
acterial cells [22–25]. In this mechanism, the cake layer hindershe back diffusion of salt thereby resulting in elevated osmotic pres-ure near the membrane surface. In this study, 5 M NaCl is used ashe draw solution, forming a large gradient of salt across the mem-
Science 365 (2010) 34–39
brane. The large NaCl gradient induces reverse diffusion of NaClfrom the draw solution side of the membrane to the feed side of themembrane. Since the organic foulants form a thick gel layer in thepresence of calcium ions, the salt that passed from the draw solu-tion side of the membrane is trapped by the organic fouling layerleading to significant cake-enhanced osmotic pressure and higherflux decline. Although RO is also subject to CEOP by the rejectedsalt, the effect is much less pronounced. Accelerated CEOP in FO ismostly due to the reverse salt diffusion from the draw solution andthe much thicker cake layers compared to RO.
The reason that only BSA protein exhibits lower flux decline inFO is attributed to the salting in and/or salting out effects (i.e., theHofmeister effects) for proteins [26]. It is known that salts desta-bilize (i.e., salting in) or stabilize (salting out) many proteins whenadded to their solutions. These Hofmeister effects are manifestedvia salt-induced changes of the hydrophobic/hydrophilic proper-ties of protein–water interfaces [27]. In FO, the BSA fouling layeris exposed to a salinity-rich environment due to the salts reverselydiffused from the draw solution to fouling layer on the feed side.Therefore, it can be assumed that the protein fouling layer under-goes structural deformation by salting in and/or out effects. Thisallows the protein fouling layer to be easily removed from themembrane surface by the hydrodynamic shear generated by theflow, thereby leading to less accumulation of foulants on the mem-brane surface. Reciprocally, the role of accelerated CEOP in fluxdecline during alginate and humic acid fouling is also noticeablydiminished in BSA fouling.
3.2. Colloidal particle fouling in FO and RO
To compare the flux decline behaviors during the colloidal foul-ing of FO and RO, we used two colloidal suspensions of different sizeas model particulate foulants. The cake-enhanced osmotic pressuremechanism (CEOP) has been shown previously as a major cause offlux decline for salt rejecting membranes [28]. According to thismechanism, permeate flux decline is not caused by the cake layerresistance, but rather due to the enhanced concentration polariza-tion and hence osmotic pressure within the particle cake layer nearthe membrane surface. The data in Fig. 2 supports this mechanismof flux decline. The results further show that the flux-decline behav-ior in FO and RO changes dramatically according to the particlesize.
Similar flux decline rates were observed with the 20 nm silicaparticles (Fig. 2a). This result can be explained by both the foulinglayer characteristics and the dependence of the CEOP mechanismon particle size. The small colloidal particles have large back diffu-sion compared to the convective permeate flow, thereby resultingin a thin cake layer. CEOP is insignificant for the thin colloid cakelayer because of the short pathway for back diffusion. The thin cakelayer also provides a small hydraulic resistance to permeate flowin both FO and RO, yielding very small flux decline rate for FO andRO. Because colloidal silica particles are not deformable, the cakelayer in RO could not be further compressed above the maximumpacking density of hard, rigid spheres. Interestingly, at the end ofthe fouling runs, a slightly greater flux decline was observed in FOdue to the continual intrusion of salt from draw solution.
We verified the relationship between particle size and fluxdecline mechanisms by conducting fouling runs with larger silicaparticles (300 nm) (Fig. 2b). Based on Carman–Kozeny equation,the cake layer formed with these particles has negligible resis-tance compared to the intrinsic membrane resistance [29–31].
which hinders back diffusion of salt. Notably, in FO, there is agreater salt build-up near the membrane surface due to salt intru-sion from the draw solution. This results in a substantial drop inthe net osmotic pressure difference and hence severe flux decline.
S. Lee et al. / Journal of Membrane Science 365 (2010) 34–39 37
Fig. 2. Flux-decline curves obtained during the FO and RO colloidal fouling runswith silica colloids: (a) 5 g/L of 20 nm silica colloids and (b) 400 mg/L of 300 nmsof
Ofle
3m
tdwp‘tiaIoo
safmNd
Fig. 3. Effect of salt reverse diffusion from the draw solution to the feed side on FOalginate fouling by cake-enhanced osmotic pressure (CEOP). Dextrose was used as
the cross-flow. This implies that foulant accumulation on the mem-
ilica colloids. A 3.0 M NaCl draw solution is used in FO and a hydraulic pressuref 2068.4 kPa (300 psi) is applied in RO. Other experimental conditions during theouling runs were identical to those in Fig. 1.
ur results in Fig. 2b demonstrate a remarkable difference betweenux decline rates of two systems due to the predominance of cake-nhanced osmotic pressure in FO.
.3. Cake-enhanced osmotic pressure is an important foulingechanism in FO
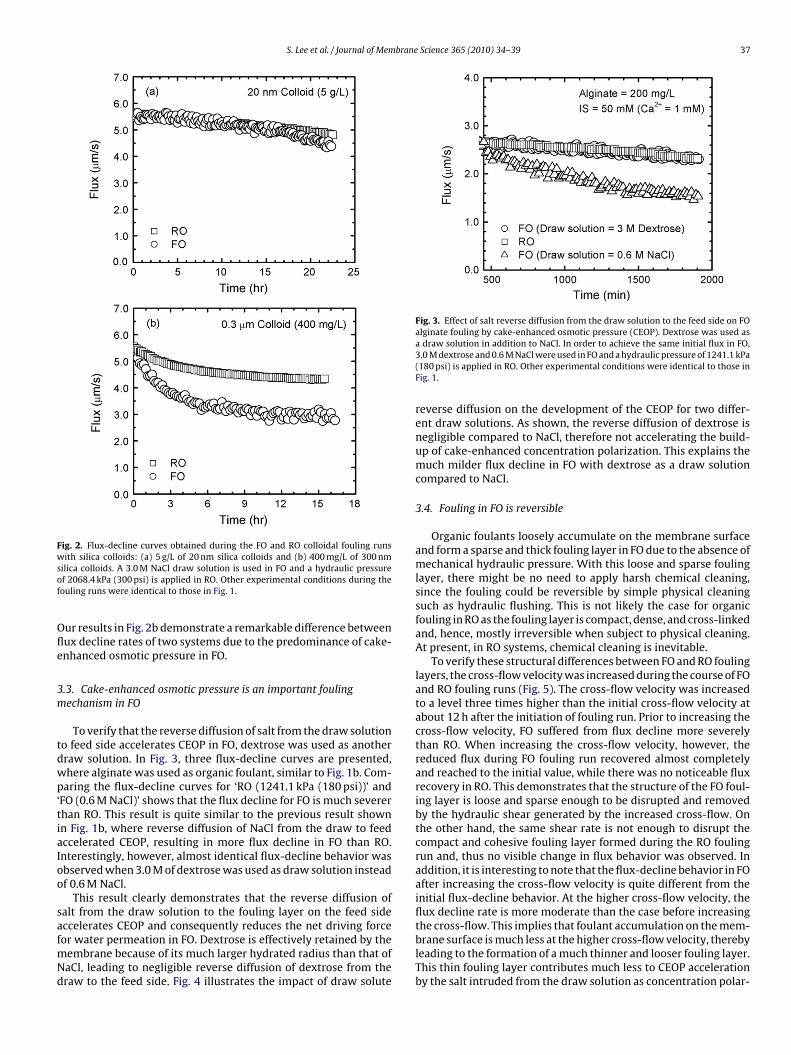
To verify that the reverse diffusion of salt from the draw solutiono feed side accelerates CEOP in FO, dextrose was used as anotherraw solution. In Fig. 3, three flux-decline curves are presented,here alginate was used as organic foulant, similar to Fig. 1b. Com-aring the flux-decline curves for ‘RO (1241.1 kPa (180 psi))’ and
FO (0.6 M NaCl)’ shows that the flux decline for FO is much severerhan RO. This result is quite similar to the previous result shownn Fig. 1b, where reverse diffusion of NaCl from the draw to feedccelerated CEOP, resulting in more flux decline in FO than RO.nterestingly, however, almost identical flux-decline behavior wasbserved when 3.0 M of dextrose was used as draw solution insteadf 0.6 M NaCl.
This result clearly demonstrates that the reverse diffusion ofalt from the draw solution to the fouling layer on the feed sideccelerates CEOP and consequently reduces the net driving force
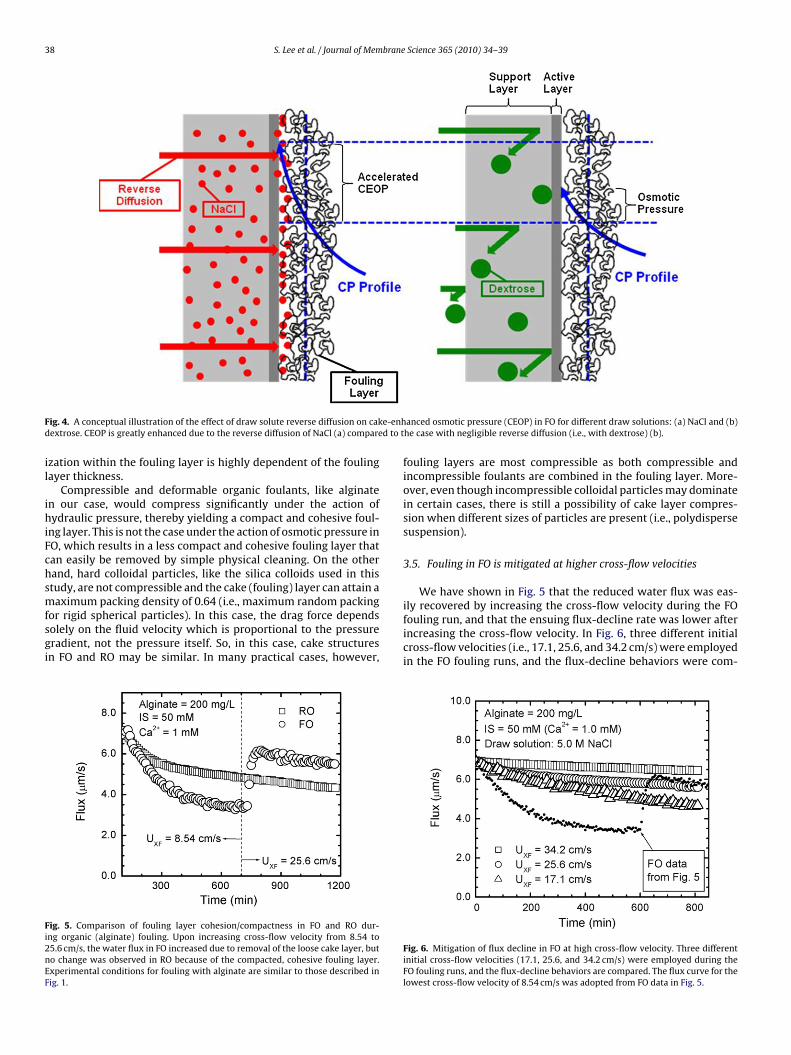
or water permeation in FO. Dextrose is effectively retained by theembrane because of its much larger hydrated radius than that ofaCl, leading to negligible reverse diffusion of dextrose from theraw to the feed side. Fig. 4 illustrates the impact of draw solute
a draw solution in addition to NaCl. In order to achieve the same initial flux in FO,3.0 M dextrose and 0.6 M NaCl were used in FO and a hydraulic pressure of 1241.1 kPa(180 psi) is applied in RO. Other experimental conditions were identical to those inFig. 1.
reverse diffusion on the development of the CEOP for two differ-ent draw solutions. As shown, the reverse diffusion of dextrose isnegligible compared to NaCl, therefore not accelerating the build-up of cake-enhanced concentration polarization. This explains themuch milder flux decline in FO with dextrose as a draw solutioncompared to NaCl.
3.4. Fouling in FO is reversible
Organic foulants loosely accumulate on the membrane surfaceand form a sparse and thick fouling layer in FO due to the absence ofmechanical hydraulic pressure. With this loose and sparse foulinglayer, there might be no need to apply harsh chemical cleaning,since the fouling could be reversible by simple physical cleaningsuch as hydraulic flushing. This is not likely the case for organicfouling in RO as the fouling layer is compact, dense, and cross-linkedand, hence, mostly irreversible when subject to physical cleaning.At present, in RO systems, chemical cleaning is inevitable.
To verify these structural differences between FO and RO foulinglayers, the cross-flow velocity was increased during the course of FOand RO fouling runs (Fig. 5). The cross-flow velocity was increasedto a level three times higher than the initial cross-flow velocity atabout 12 h after the initiation of fouling run. Prior to increasing thecross-flow velocity, FO suffered from flux decline more severelythan RO. When increasing the cross-flow velocity, however, thereduced flux during FO fouling run recovered almost completelyand reached to the initial value, while there was no noticeable fluxrecovery in RO. This demonstrates that the structure of the FO foul-ing layer is loose and sparse enough to be disrupted and removedby the hydraulic shear generated by the increased cross-flow. Onthe other hand, the same shear rate is not enough to disrupt thecompact and cohesive fouling layer formed during the RO foulingrun and, thus no visible change in flux behavior was observed. Inaddition, it is interesting to note that the flux-decline behavior in FOafter increasing the cross-flow velocity is quite different from theinitial flux-decline behavior. At the higher cross-flow velocity, theflux decline rate is more moderate than the case before increasing
brane surface is much less at the higher cross-flow velocity, therebyleading to the formation of a much thinner and looser fouling layer.This thin fouling layer contributes much less to CEOP accelerationby the salt intruded from the draw solution as concentration polar-
38 S. Lee et al. / Journal of Membrane Science 365 (2010) 34–39
F e-enhd d to t
il
ihiFchsmfsgi
Fi2nEF
ig. 4. A conceptual illustration of the effect of draw solute reverse diffusion on cakextrose. CEOP is greatly enhanced due to the reverse diffusion of NaCl (a) compare
zation within the fouling layer is highly dependent of the foulingayer thickness.
Compressible and deformable organic foulants, like alginaten our case, would compress significantly under the action ofydraulic pressure, thereby yielding a compact and cohesive foul-
ng layer. This is not the case under the action of osmotic pressure inO, which results in a less compact and cohesive fouling layer thatan easily be removed by simple physical cleaning. On the otherand, hard colloidal particles, like the silica colloids used in thistudy, are not compressible and the cake (fouling) layer can attain aaximum packing density of 0.64 (i.e., maximum random packing
or rigid spherical particles). In this case, the drag force dependsolely on the fluid velocity which is proportional to the pressureradient, not the pressure itself. So, in this case, cake structuresn FO and RO may be similar. In many practical cases, however,
ig. 5. Comparison of fouling layer cohesion/compactness in FO and RO dur-ng organic (alginate) fouling. Upon increasing cross-flow velocity from 8.54 to5.6 cm/s, the water flux in FO increased due to removal of the loose cake layer, buto change was observed in RO because of the compacted, cohesive fouling layer.xperimental conditions for fouling with alginate are similar to those described inig. 1.
anced osmotic pressure (CEOP) in FO for different draw solutions: (a) NaCl and (b)he case with negligible reverse diffusion (i.e., with dextrose) (b).
fouling layers are most compressible as both compressible andincompressible foulants are combined in the fouling layer. More-over, even though incompressible colloidal particles may dominatein certain cases, there is still a possibility of cake layer compres-sion when different sizes of particles are present (i.e., polydispersesuspension).
3.5. Fouling in FO is mitigated at higher cross-flow velocities
We have shown in Fig. 5 that the reduced water flux was eas-ily recovered by increasing the cross-flow velocity during the FO
fouling run, and that the ensuing flux-decline rate was lower afterincreasing the cross-flow velocity. In Fig. 6, three different initialcross-flow velocities (i.e., 17.1, 25.6, and 34.2 cm/s) were employedin the FO fouling runs, and the flux-decline behaviors were com-Fig. 6. Mitigation of flux decline in FO at high cross-flow velocity. Three differentinitial cross-flow velocities (17.1, 25.6, and 34.2 cm/s) were employed during theFO fouling runs, and the flux-decline behaviors are compared. The flux curve for thelowest cross-flow velocity of 8.54 cm/s was adopted from FO data in Fig. 5.
brane
pvsm33tiFflrms
4
iFitfsperwl
(kmrcimmaf
A
pK(Ht
R
[
[
[
[
[
[
[
[
[
[
[
[
[
[
[
[
[
[
[
[
S. Lee et al. / Journal of Mem
ared with each other. The flux curve for the lowest cross-flowelocity of 8.54 (from data in Fig. 5) is also included for compari-on. It is clearly shown that flux decline (or fouling) is effectivelyitigated with increasing cross-flow velocity (i.e., from 8.54 to
4.2 cm/s). Interestingly, at the highest cross-flow velocity (i.e.,4.2 cm/s), almost no flux decline was observed. It should be notedhat this effective fouling control by increasing cross-flow veloc-ty is not possible with RO fouling. As we have shown earlier inig. 5, there was no flux recovery even after increasing the cross-ow velocity by three times (i.e., from 8.54 to 25.6 cm/s). Theseesults imply that FO fouling can be effectively controlled by opti-izing hydrodynamic operating conditions and cleaned easily by
imple physical cleaning methods without harsh chemical cleaning.
. Conclusions
In this study, we systematically compared the fouling behav-ors in FO and RO and further elucidated the fouling mechanisms inO. It has been found that the key mechanism of flux decline in FOs rather accelerated cake-enhanced osmotic pressure (CEOP) dueo reverse salt diffusion from the draw to feed than the increase inouling layer resistance. This implies that selecting the proper drawolution (i.e., less back diffusion) and/or improving the membraneroperty (i.e., higher selectivity) are of paramount importance infficient operation of FO. Interestingly, fouling in FO is almosteversible while irreversible in RO. Deformable organic foulantithout hydraulic pressure (i.e., FO) makes loose and sparse fouling
ayer that can easily be removed by simple physical cleaning.The fact that accelerated cake-enhanced osmotic pressure
CEOP) due to reverse salt diffusion from the draw solution is aey mechanism of FO fouling implies that FO fouling could beinimized by selecting proper draw solution and/or improving
everse salt rejection by membrane. Fouling control and membraneleaning in FO are much more feasible than RO since FO foulings reversible to simple physical cleaning. For example, fouling in
embrane bioreactors (MBR) in advanced wastewater treatmentay be reduced significantly when FO-hybrid MBR system is used
s the continuous bubble aeration in MBR could efficiently preventoulant accumulation on the membrane surface.
cknowledgements
This research was supported by World Class University (WCU)rogram (Case III) through the National Research Foundation oforea funded by the Ministry of Education, Science and Technology
R33-10046) and partly by Seawater Engineering & Architecture ofigh Efficiency Reverse Osmosis (SEAHERO) program supported by
he Ministry of Land, Transport and Maritime Affairs (MLTM).
eferences
[1] R. Semiat, Energy issues in desalination processes, Environ. Eng. Sci. 42 (2008)
8193–8201.[2] S. Liang, C. Liu, L.F. Song, Two-step optimization of pressure and recoveryof reverse osmosis desalination process, Environ. Eng. Sci. 43 (2009) 3272–3277.
[3] G. Raluy, L. Serra, J. Uche, Life cycle assessment of MSF, MED and RO desalinationtechnologies, Energy 31 (2006) 2361–2372.
[
[
Science 365 (2010) 34–39 39
[4] S.M. Mylon, K.L. Chen, M. Elimelech, Influence of natural organic matter andionic composition on the kinetics and structure of hematite colloid aggregation:implications to iron depletion in estuaries, Langmuir 20 (2004) 9000–9006.
[5] V.T. Lahoussine, M.R. Wiesner, J.Y. Bottero, Fouling in tangential-flow ultrafil-tration: the effect of colloid size and coagulation pretreatment, J. Membr. Sci.52 (1990) 173–190.
[6] M. Herzberg, S. Kang, M. Elimelech, Role of extracellular polymeric substances(EPS) in biofouling of reverse osmosis membranes, Environ. Sci. Technol. 43(2009) 4393–4398.
[7] T.Y. Cath, A.E. Childress, M. Elimelech, Forward osmosis: principles, applica-tions, and recent developments, J. Membr. Sci. 281 (2006) 70–87.
[8] M.I. Dova, K.B. Petrotos, H.N. Lazarides, On the direct osmotic concentration ofliquid foods. Part I. Impact of process parameters on process performance, J.Food Eng. 78 (2007) 422–430.
[9] B. Jiao, A. Cassano, E. Drioli, Recent advances on membrane processes for theconcentration of fruit juices: a review, J. Food Eng. 63 (2004) 303–324.
10] M.A. Shannon, P.W. Bohn, M. Elimelech, J.G. Georgiadis, B.J. Marinas, A.M.Mayes, Science and technology for water purification in the coming decades,Nature 452 (2008) 301–310.
11] B. Mi, M. Elimelech, Chemical and physical aspects of organic fouling of forwardosmosis membranes, J. Membr. Sci. 320 (2008) 292–302.
12] B. Mi, M. Elimelech, Organic fouling of forward osmosis membranes: foulingreversibility and cleaning without chemical reagents, J. Membr. Sci. 348 (2010)337–345.
13] G.T. Grant, E.R. Morris, D.A. Rees, J.C. Smith, D. Thom, Biological interactionbetween polysaccharides and divalent cations: the egg-box model, FEBS Lett.32 (1973) 195–198.
14] H. Ma, H.E. Allen, Y. Yin, Characterization of isolated fractions of dissolvedorganic matter from natural waters and a wastewater effluent, Water Res. 35(2001) 985–996.
15] S. Lee, M. Elimelech, Relating organic fouling of reverse osmosis membranes tointermolecular adhesion forces, Environ. Sci. Technol. 40 (2006) 980–987.
16] S. Lee, J. Cho, M. Elimelech, Combined influence of natural organic matter (NOM)and colloidal particles on nanofiltration membrane fouling, J. Membr. Sci. 262(2005) 27–41.
17] J.R. McCutcheon, M. Elimelech, Influence of membrane support layer hydropho-bicity on water flux in osmotically driven membrane processes, J. Membr. Sci.318 (2008) 458–466.
18] W.S. Ang, S. Lee, M. Elimelech, Chemical and physical aspects of cleaning oforganic-fouled reverse osmosis membranes, J. Membr. Sci. 272 (2006) 198–210.
19] S. Hong, M. Elimelech, Chemical and physical aspects of natural organic matter(NOM) fouling of nanofiltration membranes, J. Membr. Sci. 132 (1997) 159–181.
20] J. Cho, G. Amy, J. Pellegrino, Membrane filtration of natural organic matter:factors and mechanisms affecting rejection and flux decline with charged ultra-filtration (UF) membrane, J. Membr. Sci. 164 (2000) 89–110.
21] A. Braghetta, F.A. DiGiano, W.P. Ball, Nanofiltration of natural organic matter:pH and ionic strength effects, J. Environ. Eng. ASCE 132 (1997) 628–641.
22] E.M.V. Hoek, A.S. Kim, M. Elimelech, Influence of crossflow membrane filtergeometry and shear rate on colloidal fouling in reverse osmosis and nanofil-tration separations, Environ. Eng. Sci. 19 (2002) 357–372.
23] E.M.V. Hoek, M. Elimelech, Cake-enhanced concentration polarization: a newfouling mechanism for salt-rejecting membranes, Environ. Sci. Technol. 37(2003) 5581–5588.
24] S. Lee, J. Cho, M. Elimelech, Influence of colloidal fouling and feed water recoveryon salt rejection of RO and NF membranes, Desalination 160 (2004) 1–12.
25] M. Herzberg, M. Elimelech, Biofouling of reverse osmosis membranes: role ofbiofilm-enhanced osmotic pressure, J. Membr. Sci. 295 (2007) 11–20.
26] S. Wang, N. Amornwittawat, J. Banatlao, M. Chung, Yu. Kao, X. Wen, Hofmeistereffects of common monovalent slats on the beetle antifreeze protein activity,J. Phys. Chem. B 113 (2009) 13891–13894.
27] A. Dér, L. Kelemen, L. Fábián, S.G. Taneva, E. Fodor, T. Páli, A. Cupane, M.G. Cacace,J.J. Ramsden, Interfacial water structure controls protein conformation, J. Phys.Chem. B 111 (2007) 5344–5350.
28] S. Lee, J. Cho, M. Elimelech, A novel method for investigating the influence offeed water recovery on colloidal and NOM fouling of RO and NF membranes,Environ. Eng. Sci. 22 (2005) 496–509.
29] R.S. Faibish, M. Elimelech, Y. Cohen, Effect of interparticle electrostatic doublelayer interactions on permeate flux decline in crossflow membrane filtration
of colloidal suspensions: an experimental investigation, J. Colloid Interface Sci.204 (1998) 77–86.30] M. Mulder, Basic Principles of Membrane Technology, Kluwer Academic Pub-lishers, Dordrecht/Boston/London, 1996.
31] P.C. Carmen, Fluid flow through a granular bed, Trans. Inst. Chem. Eng. 15 (1937)150–156.


