Embed Size (px)
Citation preview
The Origins of Eukaryotic Gene Structure
Michael LynchDepartment of Biology, Indiana University, Bloomington
Most of the phenotypic diversity that we perceive in the natural world is directly attributable to the peculiar structure of theeukaryotic gene, which harbors numerous embellishments relative to the situation in prokaryotes. The most profoundchanges include introns that must be spliced out of precursor mRNAs, transcribed but untranslated leader and trailersequences (untranslated regions), modular regulatory elements that drive patterns of gene expression, and expansive inter-genic regions that harbor additional diffuse control mechanisms. Explaining the origins of these features is difficult becausethey each impose an intrinsic disadvantage by increasing the genic mutation rate to defective alleles. To address theseissues, a general hypothesis for the emergence of eukaryotic gene structure is provided here. Extensive information onabsolute population sizes, recombination rates, and mutation rates strongly supports the view that eukaryotes have reducedgenetic effective population sizes relative to prokaryotes, with especially extreme reductions being the rule in multicellularlineages. The resultant increase in the power of random genetic drift appears to be sufficient to overwhelm the weakmutational disadvantages associated with most novel aspects of the eukaryotic gene, supporting the idea that most suchchanges are simple outcomes of semi-neutral processes rather than direct products of natural selection. However, by estab-lishing an essentially permanent change in the population-genetic environment permissive to the genome-wide repattern-ing of gene structure, the eukaryotic condition also promoted a reliable resource from which natural selection couldsecondarily build novel forms of organismal complexity. Under this hypothesis, arguments based on molecular, cellular,and/or physiological constraints are insufficient to explain the disparities in gene, genomic, and phenotypic complexitybetween prokaryotes and eukaryotes.
Introduction
Although full-genome sequencing has revealed nu-merous patterns of variation in genomic architecture amongmajor taxonomic groups, a formidable, remaining chal-lenge is to transform the descriptive field of comparativegenomics into a more mechanistic theory of evolutionarygenomics. Such an enterprise does not have to start fromscratch. Nearly a century of mathematical derivation hasresulted in a formal theory for evolution based on theexpected dynamics of gene-frequency changes. Initiallydubbed the Modern Synthesis by Huxley in 1942 andhaving experienced further enhancements since then, thistheory has survived so much empirical scrutiny that thecredibility of any proposed scenario for genome evolutionmust remain in doubt until shown to be consistent with ba-sic population-genetic principles. In turn, if a mechanisticunderstanding of genome evolution is to be achieved,population-genetic theory will need to go beyond itsreliance on algebraic formulations involving selection,mutation, recombination, and random genetic drift to incor-porate the DNA-level constraints that are now known todefine the evolutionary playing field.
Ever since Darwin, the vast majority of biologists haveinvoked natural selection as the primary, and in many casesthe only, explanation for observed patterns of variation atmost levels of organization. This greatly oversimplifies theevolutionary process. For example, Kimura, Ohta, and sev-eral contemporaries showed why numerous aspects of DNAsequence evolution cannot be explained entirely in terms ofadaptive processes (reviewed in Kimura 1983; Ohta 1997).The neutral (or nearly neutral) theory that emerged from
this work still enjoys a central place in the field of molecularevolution and has been applied to some aspects of evolu-tionary genomics (Force et al. 1999, 2005; Lynch et al.2001, Lynch 2002; Lynch and Conery 2003; Lynch,Scofield, and Hong 2005b). The goal of this paper is to ex-pand on these previous results to demonstrate the plausibil-ity of the hypothesis that many of the unique complexitiesof the eukaryotic gene arose by semi-neutral processes withlittle, if any, direct involvement of positive selection.
Although eukaryotes share many basic aspects of tran-scription, translation, and replication with their prokaryoticancestors, there are profound differences at the level ofgene architecture. Prokaryotic genes are often organizedinto operons that are transcribed into polycistronic units,whereas with few exceptions, eukaryotic genes are tran-scribed as single-gene units. Unlike prokaryotic genes,eukaryotic genes often have complex regulatory regions,and in multicellular species such regions often have a mod-ular structure that helps facilitate tissue-specific expression.Eukaryotic protein-coding genes also often contain introns,whereas prokaryotic genes do not, and eukaryotic tran-scripts generally contain longer untranslated leader andterminal sequences (untranslated regions [UTRs]) thando those of prokaryotes.
Three general observations have encouraged the viewthat that these kinds of increases in gene complexity werenecessary prerequisites to the origin of organisms with mul-tiple cell types: (i) most aspects of gene architecture aremuch more elaborate in multicellular than unicellulareukaryotes; (ii) similar forms of genomic architecture arefound in the two major and independently evolved multi-cellular lineages, animals and land plants; and (iii) morecomplex genes can often carry out more complex sets oftasks (Raff 1996; Gerhart and Kirschner 1997; Davidson2001; Carroll, Grenier, and Weatherbee 2001). However,despite these clear associations, the direction of causalityin the link between genome and organismal complexityis far from certain. There is no direct evidence that
Key words: complexity, gene networks, gene regulation, genestructure, genome evolution, genetic draft, introns, modularity, mutation,natural selection, population size, pleiotropy, random genetic drift,recombination, subfunctionalization, transcription factors, UTR.
E-mail: [email protected].
Mol. Biol. Evol. 23(2):450–468. 2006doi:10.1093/molbev/msj050Advance Access publication November 9, 2005
� The Author 2005. Published by Oxford University Press on behalf ofthe Society for Molecular Biology and Evolution. All rights reserved.For permissions, please e-mail: [email protected]

multicellularity itself was promoted by adaptive processes,and the fact that many prokaryotes are capable of cell dif-ferentiation reminds us that the evolution of multicellularityneed not have awaited the emergence of eukaryotes.
The key point to be made below is that the types ofgenomic evolution that can occur within a species arenot so much dependent on aspects of cell biology as onthe constraints imposed by population-level processes,most notably by population size itself. The arguments un-derlying this hypothesis will be laid out in three sections.First, I will review the role that chance plays in evolutionand why this depends on population size. Second, I willsummarize several sets of empirical data that show thatthe efficiency of natural selection declines dramatically be-tween prokaryotes, unicellular eukaryotes, and multicellu-lar eukaryotes. Third, I will demonstrate that theory andempirical observations are mutually consistent in pointingto a central role for nonadaptive processes in the origins ofmany of aspects of eukaryotic gene structure.
The Role of Chance in Evolution
Evolution is an inherently stochastic process, startingfrom the chance events that produce single mutations andproceeding through a series of fortuitous steps that gradu-ally lead to the spread of some mutations to every memberof the descendant population. The usual conceptual point ofdeparture here is the classic Wright-Fisher model, whichassumes a population of diploid individuals, each contrib-uting equally and synchronously to an effectively infinitegamete pool. The idealized mating system consists of ran-domly mating hermaphrodites and ignores complexitiesassociated with overlapping generations, separate sexes,spatial structure, nonrandom variation in family sizes,and so on. However, most of these complications can bedealt with by equating the genetic ‘‘effective’’ size of a pop-ulation (Ne) to the size of an ideal Wright-Fisher populationyielding equivalent gene-frequency dynamics. The effec-tive size of a population is a fundamental determinant ofnearly all aspects of evolution as it determines the proba-bility of (and times to) fixation or removal of mutant alleles.
Most deviations from the assumptions of the Wright-Fisher model cause Ne to be less than the total number ofadult individuals (N) (Caballero 1994; Whitlock and Barton1997; Rousset 2003). For example, if adults differ in thenumber of gametes produced, either because of selectionor chance ecological events, Ne will be reduced simply be-cause some individuals contribute little or nothing to thefollowing generation. A sex ratio that deviates from 1:1 re-duces Ne because the rarer sex (which necessarily con-tributes half of the genes to the next generation) acts asa population bottleneck. Population-size fluctuations re-duce long-termNe relative to the arithmetic average becausethe losses of variation during population bottlenecks exceedthe preservational effects of equal population-size expan-sions. A number of procedures have been developed toestimate Ne from pedigree data or by relating tempo-ral fluctuations in allele frequencies to the expectationsfrom sampling 2Ne gametes. Studies of this sort, mostlyconfined to vertebrates, suggest an average Ne/N of ;0.1(Frankham 1995).
To see how population size influences the long-termrate of evolution, consider a newly arisen mutation in a dip-loid population containing 2N gene copies at each locus. Ifthe mutation is neutral, with no external forces favoring oneallele over another, the probability of eventual fixation isalways equal to the initial frequency, p0 5 1/(2N). Becausethis fraction is inversely proportional toN, one might expectneutral changes to accumulate more slowly in larger pop-ulations. However, the expected number of new mutationsarising at a locus per generation is 2Nl, where l is the rateof origin of neutral mutations per gene, and the long-termrate of evolution is equal to the product of the rate of originof mutations and their probability of fixation. Thus, the rateof neutral evolution reduces to the genic mutation rate l,which is entirely independent of the effective and absolutepopulation size (Kimura 1983).
Intuition suggests that the fixation probability of a ben-eficial allele must exceed the neutral expectation 1/(2N),whereas that of a detrimental allele must be ,1/(2N),but how much so? To see that a beneficial mutation is neverguaranteed to go to fixation, no matter how favorable, con-sider a new mutation that improves the fitness of its initialcarrier by a fraction s (the selection coefficient). Such anallele has expected frequency p05 (11 s)/(2N) in the gam-ete pool leading to the next generation, and the probabilitythat it is not successfully inherited by at least one offspring,(1 � p0)
2N, is closely approximated by (1� s)e�1 for smalls. Thus, relative to the situation for a neutral allele (s 5 0),selection only reduces the probability of a rapid initial exitfor a beneficial allele by a fraction s. This shows that untila favorable mutation has avoided chance elimination in thefirst few generations and increased its frequency in doingso, there is little assurance that it will successfully go tofixation. For mutations with additive effects on fitness (in-creasing homozygote fitness by 2s), the probability of fix-ation is pf’ð2sNe=NÞ=ð1� e�4NesÞ (Kimura 1962). Thus,even in very large populations (Ne / N), the high degreeof stochasticity in the early phase of mutation establishmentstill restricts the probability of fixation to an upper limit of2sNe/N. Given the arguments presented above, this meansthat the probability of fixation of a favorable mutation isalmost always ,2s.
Letting lb be the beneficial-mutation rate per gene and2Nlb be the rate at the population level, the above resultsimply that the upper limit to the rate of incorporation ofbeneficial mutations is 4Nelbs, which unlike the situationfor neutral mutations increases with Ne. In contrast, becausedetrimental mutations with�0.3, Nes, 0.0 have fixationprobabilities at least half as great as the neutral expectation,if the rate of origin of mutations in this range of effects issufficiently high, a considerable load of mildly deleteriousmutations can accumulate in populations of sufficientlysmall size (Ohta 1973, 1974). Modifications to this theoryfor situations in which populations are subdivided or chang-ing in size do not change these basic scaling properties(Otto and Whitlock 1997; Whitlock 2003).
These results yield the robust prediction that the abilityof a population to incorporate beneficial mutations and topurge deleterious mutations should scale positively withpopulation size, assuming that Ne scales positively withN. However, something beyond the demographic features
Origins of Eukaryotic Gene Structure 451

of a population, the physical structure of the genome itself,will generally limit the growth of Ne with N in the largest ofpopulations. Because tightly linked nucleotide sites aretransmitted across generations as a unit, to a degree that de-pends on the rate of recombination, the fate of any new mu-tation depends on the selective forces operating on alllinked loci. On average, this causes the fixation rates of ben-eficial mutations to be lower and detrimental mutations tobe higher than the single-locus predictions suggested above(Hill and Robertson 1966). For example, a beneficial mu-tation that rapidly sweeps through a population will neces-sarily drag along any deleterious alleles at tightly linked lociwith which it is associated at the time of origin, whereas theselective removal of deleterious alleles can impede adaptiveevolution at linked loci. Even mutually advantageous al-leles will interfere with each other’s fixation when linked.Consider a beneficial allele A segregating at one locus, witha second beneficial mutation B arising at a tightly linkedlocus on an a-bearing chromosome. If the advantages ofeach mutation were the same, then the Ab and aB linkagegroups would compete with each other in the fixation pro-cess, with one eventually excluding the other. Linkage neednot be absolute for these effects to be important, but thestronger the degree of linkage the greater the degree ofselective interference.
Gillespie (2000) presented an elegant argument relat-ing the influence of linkage to the effective population sizeof a chromosomal region. The key issue is that the effectivesize of a population defines the variance of allele-frequencychange from generation to generation, which for a neutrallocus is p(1 � p)/(2Ne), where p is the current allele fre-quency, and 2Ne is the effective number of genes sampledper locus. Now imagine a neutrally evolving site com-pletely linked to another site that is experiencing selectivesweeps at rate d. On average, selective sweeps do not in-fluence which alleles go to fixation at linked neutral sitesbecause the probability that a beneficial mutation destinedto fixation will arise in association with a particular allele issimply equal to that allele’s frequency. However, selectivesweeps do magnify the fluctuations of allele frequencies atlinked neutral sites. Assuming as a first approximation thatsweeps cleanse a population of linked variation essentiallyinstantaneously, then conditional on a sweep occurring, thevariance in allele-frequency change at the neutral locus isp(1 � p). Thus, for a neutral locus in an ideal randomlymating population, the average variance of allele-frequencychange is approximately p(1 � p)f[(1 � d)/(2Ne)] 1 dg.Equating the right-hand quantity to 1/(2Nl), the long-termeffective population size is Nl ’ Ne/(1 1 2Ned), where Ne
is now defined to be the short-term effective size duringphases free of selective sweeps. (Maruyama and Birky[1991] obtained essentially the same result by a differentmethod.) Recombination reduces the likelihood that a selec-tive sweep will completely purge the variation at a linkedlocus, but Gillespie (2000) showed that this simply modifiesthe preceding expression to Nl ’ Ne/(11 2NeCd), where Cis the average squared frequency of the neutral hitchhikingallele after the completion of a sweep (previously assumedto be equal to one).
An unresolved issue is the way in which the rate ofselective sweeps in a tightly linked region, Cd, scales with
population size. If Cdwere completely independent of pop-ulation size, then Nl would increase with Ne at a decreasingrate, eventually reaching an upper limit of 1/(2Cd). Becauselarger populations contain more targets for rare beneficialmutations and also experience more recombination events,the rate of sweeps (d) is expected to increase and the breadthof sweeps (C) to decrease with increasing Ne, so in princi-ple, these opposite patterns of scaling might fortuitouslybalance such that the product Cd is indeed independentof Ne. However, in the absence of any direct observationson this matter, a more general approximation is to treat Cdas a power function of Ne, yielding a relationship of theform Nl 5 Ne/(1 1 aNe
b). Here, b 5 1 describes the casein which Cd is independent of Ne, whereas with b 5 2 therate of selective sweeps is proportional to Ne, as in the sin-gle-locus result described above. The latter condition isclearly too high to be biologically realistic as the rate ofselective sweeps per locus eventually exceeds one per gen-eration at large Ne. Thus, b is likely to fall in the range of1–2, although this remains to be formally demonstrated.Assuming that short-term Ne scales linearly with absolutepopulation size (N), these qualitative arguments suggestthat long-term Nl will also scale linearly with N for smallto moderate N where random genetic drift is the predomi-nant stochastic force. However, the degree of scaling isexpected to be progressively reduced at larger N, with anasymptotic limit to Nl possibly being reached at very largeN where stochastic fluctuations in allele frequencies are pri-marily a function of the chromosomal nature of the genome(Gillespie’s genetic draft).
To gain an appreciation of the power of random ge-netic drift and draft to compromise the efficiency of naturalselection, it is useful to consider the ratio of the single-locusfixation probability, pf, and the neutral expectation, 1/(2N).This is a simple function of 4Nls; hf ffi 4Nls=ð1� e�NlsÞ;where Nl is defined by the function in the preceding para-graph (fig. 1). If the strength of selection is sufficiently largerelative to the power of random genetic drift (4Nls. 1), thefixation probability for an advantageous allele is inflated bya factor of 4Nls relative to the neutral expectation, whereasthe fixation probability of a deleterious allele asymptoti-cally approaches zero as 4Nls / �N. However, if j4Nlsj, 0.2, the probability of fixation is within 10% of the neu-tral expectation, and if j4Nlsj , 0.02, the deviation fromneutrality is no more than 1%. Thus, for any long-term ef-fective population size, there exists a range of deleteriousmutations whose selective disadvantages are overwhelmedby stochastic forces. Such alleles are said to be effectivelyneutral.
The Three Genomic Perils of Increased Organism Size
A central premise of this paper is that there is a generalreduction in the efficiency of selection between prokar-yotes, unicellular eukaryotes, and multicellular species.We now take a more empirical look at this issue, showingthat all three major factors responsible for reductions inNl—small population size, tight linkage, and high back-ground mutational activity—are jointly exacerbated as or-ganisms increase in size, producing a synergism that causessubstantial reductions in the efficiency of natural selection.
452 Lynch

Body Size and Population Size
A typical prokaryote is five to seven orders of magni-tude smaller than the average single-celled eukaryote, witha similar disparity existing between unicellular and multi-cellular eukaryotes (Bonner 1988). Such massive differen-ces in size impose numerous ecological and physiologicalconstraints and opportunities, but the implications for thepopulation-genetic environment are equally pronounced.All other things being equal, the genetic effective sizeof a population should generally increase with the actualnumber of breeding adults (N), and one of the few well-established laws in ecology is that a primary determinantof N is the average size of members of the population. Eu-karyotes generally show an inverse relationship betweenpopulation density per unit area and average individualbody mass within a species, with the extreme values rang-ing from ;10�7 individuals/M2 for the largest vertebratesto ;1011 individuals/M2 for the smallest unicellular eukar-yotes (Damuth 1981; Schmid, Tokeshi, and Schmid-Araya2000; Enquist and Niklas 2001; Carbone and Gittleman2002; Finlay 2002).
Ecological factors unique to individual species cancause local deviations around this pattern, and an inversescaling between population density and organism size neednot reflect the pattern for total population size as it does notaccount for total species ranges. However, the geographicarea occupied by vertebrate species is negligibly to weaklypositively correlated with average body size (Gaston andBlackburn 1996; Diniz and Torres 2002; Housworth,Martins, and Lynch 2003), and the geographic ranges ofunicellular species appear to be substantially greater thanthose for multicellular taxa (Finlay et al. 2001; Finlay,
Monaghan, and Maberly 2002; Green et al. 2004; Horner-Devine et al. 2004). Thus, in a broad phylogenetic sense,there is little doubt that the total number of individualswithin a species declines with increasing organism size,and the total range in N over all species certainly exceeds20 orders of magnitude. Assuming;1030 prokaryotic cellsinhabiting the earth (Whitman, Coleman, and Wiebe 1998)and 107 being an upper-bound estimate for the number ofprokaryotic species (Hammond 1995), N for an averageprokaryote would be ;1023.
Reduced Recombination in Large Genomes
High-density genetic maps allow the estimation of theaverage amount of meiotic crossing over for numerouseukaryotes. The magnitude of recombination per physicaldistance scales negatively with genome size, ranging from33 10�10/bp/generation in Pinus sylvestris to 33 10�6/bp/generation in Saccharomyces cerevisiae (fig. 2). Such scal-ing is due mostly to the simple fact that most species ex-perience between one and two meiotic crossover eventsper chromosome. Because chromosome number is un-correlated with genome size, the intensity of recombina-tion per nucleotide position naturally increases in smallergenomes (with smaller average chromosome lengths). Lessclear is why the recombination rate declines with increasinggenome size twice as rapidly in unicellular as in multicel-lular species (fig. 2). In any event, because genome sizeincreases with organism size, these results imply that in-creases in organism size are accompanied by decreasesin the intensity of recombination. Not only can a selectivesweep in a multicellular eukaryote drag along up to10,000-fold more linked nucleotide sites than is likely in
FIG. 1.—The probability of fixation of a new mutant allele relative tothe neutral expectation of 1/(2N), given as a function of the product of theshort-term (drift determining) effective population size (Ne) and the selec-tion coefficient (s). For the dashed and dotted curves, the long-term ef-fective population size (Nl) is defined by the function in the text witha 5 10�9, whereas the solid line denotes Nl 5 Ne, which assumes an ab-sence of selective sweeps (a 5 0). The horizontal dotted line denotes theneutral expectation. Negative values of Nes denote deleterious mutations.
FIG. 2.—The negative relationship between recombination rate perphysical distance (c) and total genome size (G) in eukaryotes, scalingas c5 0.0019G�0.71 for animals and land plants, with the exponent havinga standard error (SE) of 0.06, and as c 5 0.045G�1.32 for fungi and otherunicellular/oligocellular species, with the exponent having a SE of 0.12.In the two respective cases, genome size accounts for 70% and 80% ofthe variance in recombination rate. (For further details, see SupplementaryTable 1, Supplementary Material online).
Origins of Eukaryotic Gene Structure 453
a unicellular species, but species with small genomes alsoexperience increased levels of recombination on a per-genebasis. For example, the rate of recombination over the entirephysical distance associated with an average gene (includ-ing intergenic DNA) is ;0.007 in S. cerevisiae versus;0.001 in Homo sapiens, and the discrepancy is greaterif one considers just coding exons and introns, 0.005 versus0.0005. The consequences of reduced recombination ratesare particularly clear in the human population, which har-bors numerous haplotype blocks, tens to hundreds ofkilobases in length, with little evidence of internal recom-bination (Daly et al. 2001; Reich et al. 2001; Dawson et al.2002; Gabriel et al. 2002; Greenwood, Rana, and Schork2004; McVean et al. 2004).
The Rate of Mutation
Because of the rarity of mutations at individual nucleo-tides sites, there are enormous challenges to estimating therate at which mutations arise at the molecular level. Mostestimates are derived either from surveys of visible muta-tions at reporter loci or of dominant genetic disorders, fol-lowed by sequence analysis of individuals exhibitinga phenotype. These approaches are not without problems,as corrections must be made for the incidence of undetect-able mutations. More indirect attempts to estimate the mu-tation rate are based on comparisons of distantly relatedspecies, using DNA sequences thought to be free of naturalselection and making assumptions about times of interspe-cific divergence and species-specific generation times (e.g.,Keightley and Eyre-Walker 2000; Kumar and Subramanian2002). Only a single attempt has been made to estimate theper-nucleotide mutation directly by brute-force assays ofrandom sequences in unselected lines (Denver et al.2004). To minimize the assumptions involved, the follow-ing survey largely relies on data derived from the moredirect approaches.
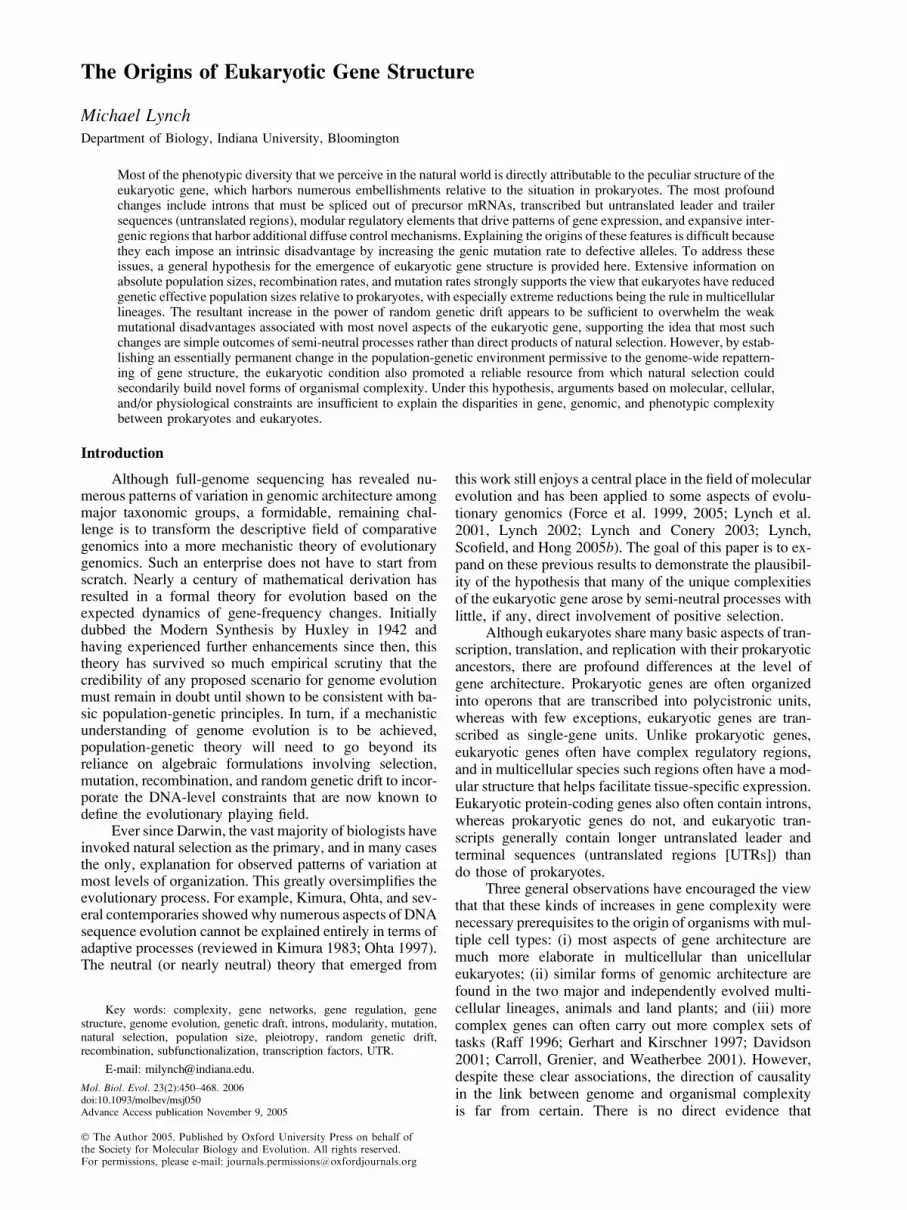
Across a phylogenetically diverse set of a species,there is a strong correlation between the mutation rateper generation and genome size (fig. 3). The range forthe base-substitution mutation rate is approximately twoorders of magnitude, and again exhibits a gradient with or-ganism size, the extremes being 5.0 3 10�10 and 5.4 310�8/bp/generation for prokaryotes and vertebrates, respec-tively. Despite the uncertainties in each estimate contribut-ing to this pattern, the validity of the overall relationshipis supported by two observations. First, the estimate forthe nematode Caenorhabditis elegans obtained by directsequence analysis (highest red point in the plot) is consis-tent with the remaining data obtained via reporter con-structs. Second, estimates of the human mutation rateobtained from observations on dominant genetic disorders(Kondrashov 2003) are very similar to those obtained fromcomparisons of pseudogene sequences in humans andchimpanzees (Nachman and Crowell 2000), 2.6 3 10�8
and 2.23 10�8/bp/generation, respectively. Based on morelimited data, Drake (1991) concluded that the mutation rateper nucleotide per generation is inversely related with ge-nome size in microbial species, but the results in figure 3suggest the opposite pattern, even within the subset ofunicellular species.
The Global Effective Population Sizes of Species
The preceding results show that three factors (low pop-ulation sizes, low recombination rates, and high mutationrates) conspire to reduce the efficiency of natural selectionwith increasing organism size, although it is difficult to pre-dict the magnitude of decline in Nl from these three factorsalone. For example, fluctuations in population size can re-sult in a substantial depression ofNl below average N, and itis unclear whether the magnitude of such fluctuations varieswith organism size. In addition, as discussed above, hitch-hiking effects should depress the Nl/N ratio much more inlarge populations, but because the recombination rate (permeiosis) is substantially greater and the mutation rate issubstantially lower in species with large N, this declinecould be weaker than otherwise expected. Given the manyadditional factors that can influence Nl, the degree to whichNl varies with organism size is best resolved by directempirical observation.
One way to accomplish this task is to consider theamount of nucleotide-sequence variation at silent sites inprotein-coding genes within natural populations. Underthe assumption that mutations at such sites escape the eyesof natural selection, the amount of silent-site variation hasa simple interpretation. The rate of introduction of new var-iation per nucleotide site in two randomly compared allelesis 2u (twice the base-substitution mutation rate per nucle-otide), while the expected rate of loss of variation by geneticdrift is 1/(2Nl). At equilibrium, the average number of nu-cleotide substitutions separating individual neutral sites intwo randomly sampled alleles is the ratio of these two rates,4Nlu. For a haploid species, the rate of random genetic driftis 1/Nl, and the equilibrium divergence among neutral nu-cleotide sites becomes 2Nlu. Both results have the samemeaning—at mutation-drift equilibrium, the amount ofwithin-species nucleotide variation at silent sites is equal
FIG. 3.—The relationship between the mutation rate for base substi-tutions per nucleotide site per generation (u) and genome size (G) scales asu5 0.14G0.78 (310�9), with the exponent having a SE of 0.10 and genomesize accounting for 79% of the variance in the mutation rate. (For furtherdetails, see Supplementary Table 2, Supplementary Material online).
454 Lynch

to twice the effective number of gene copies at the locustimes the per nucleotide mutation rate. An estimate of thiscomposite parameter is provided by the observed level ofsilent-site variation within a species (hereafter ps). Al-though the complex nature of the definition of Nl introducessome interpretive issues with ps (Laporte and Charlesworth2002), a fully general definition can be described in terms ofallelic ancestry. ps is equal to the average age of randompairs of sequences times twice the base-substitutional mu-tation rate per nucleotide site. As will be seen below, thefact that ps is a function of the product of Nl and u is veryuseful because many aspects of genome evolution dependdirectly on this product.
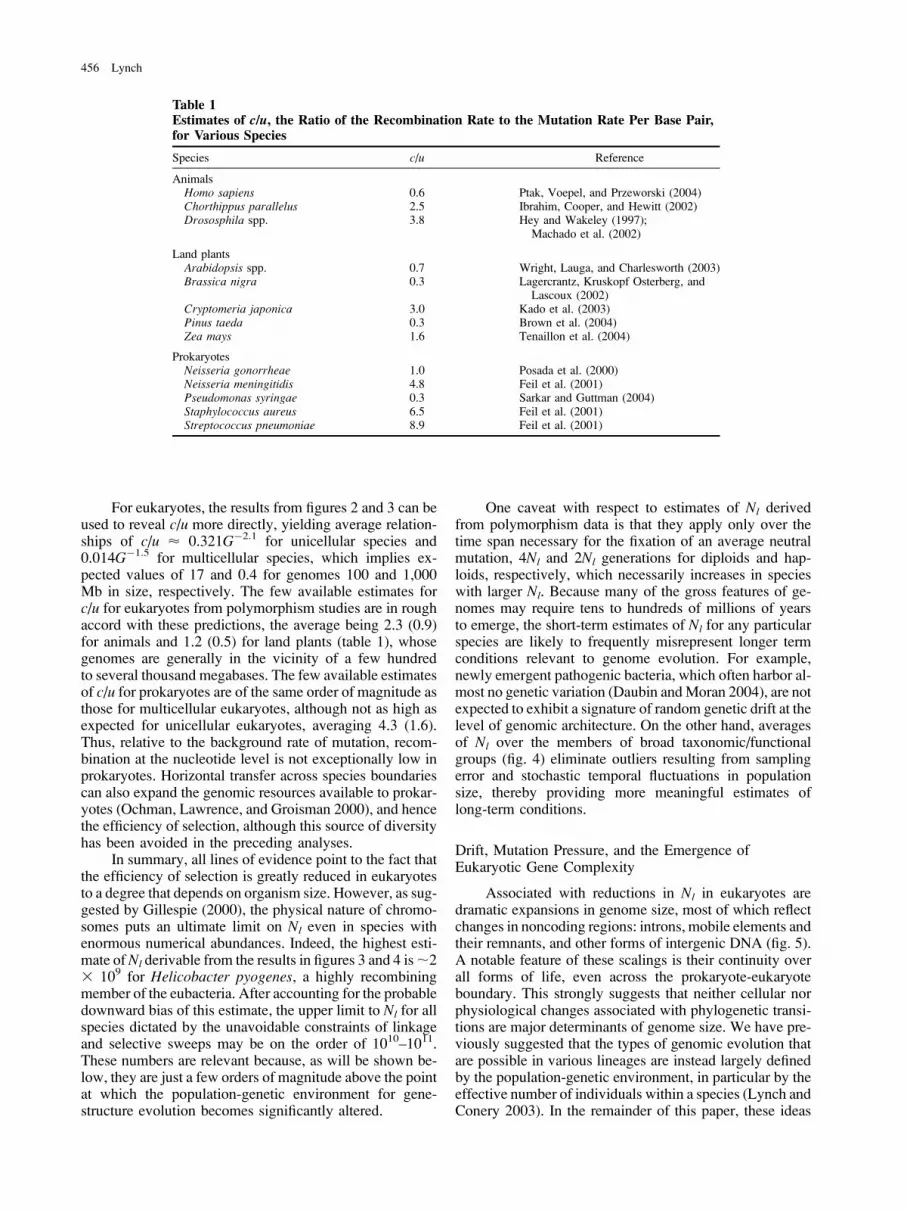
Information on ps now exists for a wide enough phy-logenetic range of species that some general statements canbe made. Drawing from a substantially larger database thanpresented in the earlier survey of Lynch and Conery (2003),there is a striking inverse relationship between organismsize and silent-site variation (fig. 4). For prokaryotes, ps liesin the broad range of 0.0071–0.3881, with an average valueof 0.1044. This is nearly twice the average value for uni-cellular eukaryotes (0.0573), although the range of valuesamong the latter taxa is again very high (0.0103–0.2522).For the still larger invertebrates, there is a further reductionin average ps to 0.0265, with a range of 0.0090–0.0473. Theaverage value of ps for plants (0.0152) is still lower and thatfor vertebrates (0.0038) is even lower.
A significant caveat with respect to these data is thatthe bulk of existing surveys on nuclear variation in unicel-lular species have focused on pathogens, which because ofthe demographic dependence on their host species, proba-bly have lower Ne than free-living species (Hartl et al.2002). Two of the three prokaryotes with ps , 0.01 are
Serratia (a human pathogen) and Buchnera (an obligate en-dosymbiont of aphids). The six lowest estimates of psfor unicellular eukaryotes are all derived from pathogens(Candida, Coccidioides, Encephalitozoon, Fusarium,Phytophthora, and Plasmodium), all other taxa (includingsome pathogens) having ps . 0.02.
From these estimates of ps, Nl can be disentangledfrom u by applying the mutation-rate estimates describedabove. For example, using the average observed value ofu ’ 5.0 3 10�10 for prokaryotes to factor u out of 2Nlu,the estimated average Nl for prokaryotes is ;108. After re-moval of the six lowest values of ps for eukaryotic parasites,application of the average mutation rate for unicellular eu-karyotes (1.63 10�9) yields an average Nl of;107 for thisgroup. Similar analyses for invertebrates and vertebratesyield average Nl estimates of 106 and 104, respectively. Fi-nally, a phylogenetically based mutation-rate estimate forplants of 7.33 10�9/bp/year for plants (Lynch 1997) yieldsan average Nl estimate of ;106 for annual species and as-suming a generation time of 20 years, ;104 for trees.
Given the rough nature of the preceding calculations,they are intentionally reported to just an order of magnitude.Nevertheless, it is likely that the range in Nl from prokar-yotes to multicellular eukaryotes exceeds the four orders ofmagnitude just noted. Any selection on silent sites associ-ated with codon-usage bias and/or mRNA processing fea-tures will bias ps below the neutral expectation, and themagnitude of bias will be greatest in large populationswhere selection is most efficient. Several observations sug-gest that this issue is of significance (Bustamante, Nielsen,and Hartl 2002; Hellmann et al. 2003; Chamary and Hurst2004; Desai et al. 2004; Halligan et al. 2004; Sharp et al.2005), and because the divergence rate of silent sites in pro-karyotes may be at least ten times lower than the mutationrate (Ochman 2003), the prokaryotic Nl estimates givenabove could be underestimated by at least tenfold. Despitethese uncertainties, it is clear that the disparity in Nl acrossall domains of life is nearly 20 orders of magnitude less thanthe disparity in absolute numbers, a pattern that is consistentwith a significant stochastic role of genetic draft in largepopulations.
Because of their potential for considerable clonalstructure, prokaryotic species may be particularly vulnera-ble to selective sweeps, but the breadth of such sweepsremains unclear. Moreover, because prokaryotes havea number of mechanisms for uptake and exchange of exog-enous DNA, the absence of meiosis need not imply excep-tionally low levels of recombination. Some insight into thismatter can be acquired by considering the statistical asso-ciations between locus-specific allelic variants that developstochastically as a consequence of random genetic drift. Atdrift-recombination balance, the amount of linkage disequi-librium in a population is a function of the product Nlc,where c is the rate of recombination per nucleotide site(Ohta and Kimura 1971; Hill 1975). This quantity canbe estimated by evaluating the rate at which the level ofdisequilibrium declines with the physical distance betweennucleotide sites in samples of gene sequences. When jointestimates of Nlu and Nlc are available, their ratio eliminatesNl, providing an estimate of the relative rates of recombi-nation and mutation (c/u).
FIG. 4.—Average levels of within-species nucleotide variation (mea-sured as the number of substitutions per site) for silent sites in protein-coding genes from a phylogenetically diverse assemblage of eukaryoticand prokaryotic species. The sampling unit is the average estimate formembers of a genus, where information for multiple species was available.Means, standard deviations, and number of genera are given in parenthe-ses; horizontal bars provide estimates of the observed ranges of values,using 5% and 95% limits to reduce the effects of outliers resulting fromsampling error. Almost all data are derived from geographically wide sur-veys of multiple protein-coding genes. (For further details, see Supplemen-tary Tables 3 and 4, Supplementary Material online).
Origins of Eukaryotic Gene Structure 455
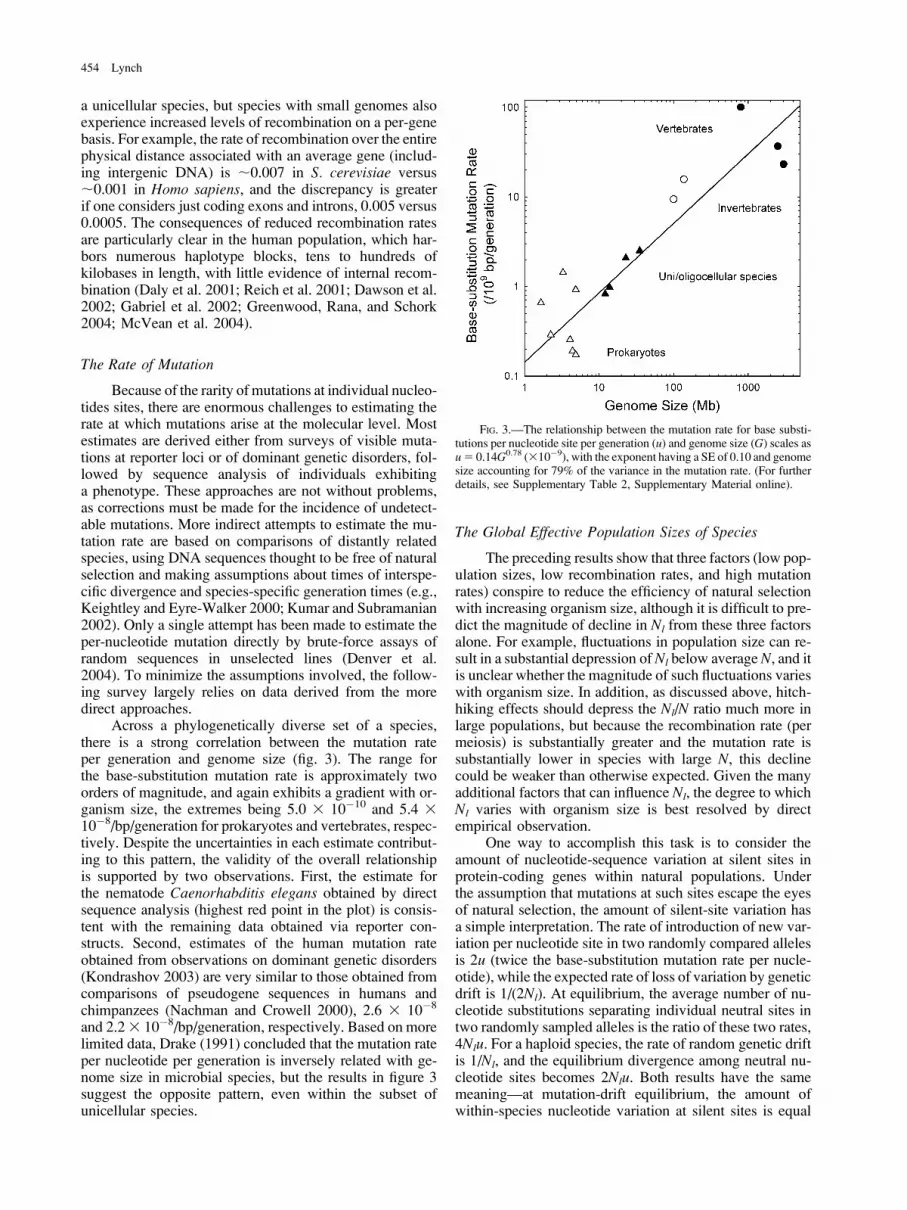
For eukaryotes, the results from figures 2 and 3 can beused to reveal c/u more directly, yielding average relation-ships of c/u ’ 0.321G�2.1 for unicellular species and0.014G�1.5 for multicellular species, which implies ex-pected values of 17 and 0.4 for genomes 100 and 1,000Mb in size, respectively. The few available estimates forc/u for eukaryotes from polymorphism studies are in roughaccord with these predictions, the average being 2.3 (0.9)for animals and 1.2 (0.5) for land plants (table 1), whosegenomes are generally in the vicinity of a few hundredto several thousand megabases. The few available estimatesof c/u for prokaryotes are of the same order of magnitude asthose for multicellular eukaryotes, although not as high asexpected for unicellular eukaryotes, averaging 4.3 (1.6).Thus, relative to the background rate of mutation, recom-bination at the nucleotide level is not exceptionally low inprokaryotes. Horizontal transfer across species boundariescan also expand the genomic resources available to prokar-yotes (Ochman, Lawrence, and Groisman 2000), and hencethe efficiency of selection, although this source of diversityhas been avoided in the preceding analyses.
In summary, all lines of evidence point to the fact thatthe efficiency of selection is greatly reduced in eukaryotesto a degree that depends on organism size. However, as sug-gested by Gillespie (2000), the physical nature of chromo-somes puts an ultimate limit on Nl even in species withenormous numerical abundances. Indeed, the highest esti-mate ofNl derivable from the results in figures 3 and 4 is;23 109 for Helicobacter pyogenes, a highly recombiningmember of the eubacteria. After accounting for the probabledownward bias of this estimate, the upper limit to Nl for allspecies dictated by the unavoidable constraints of linkageand selective sweeps may be on the order of 1010–1011.These numbers are relevant because, as will be shown be-low, they are just a few orders of magnitude above the pointat which the population-genetic environment for gene-structure evolution becomes significantly altered.
One caveat with respect to estimates of Nl derivedfrom polymorphism data is that they apply only over thetime span necessary for the fixation of an average neutralmutation, 4Nl and 2Nl generations for diploids and hap-loids, respectively, which necessarily increases in specieswith larger Nl. Because many of the gross features of ge-nomes may require tens to hundreds of millions of yearsto emerge, the short-term estimates of Nl for any particularspecies are likely to frequently misrepresent longer termconditions relevant to genome evolution. For example,newly emergent pathogenic bacteria, which often harbor al-most no genetic variation (Daubin andMoran 2004), are notexpected to exhibit a signature of random genetic drift at thelevel of genomic architecture. On the other hand, averagesof Nl over the members of broad taxonomic/functionalgroups (fig. 4) eliminate outliers resulting from samplingerror and stochastic temporal fluctuations in populationsize, thereby providing more meaningful estimates oflong-term conditions.
Drift, Mutation Pressure, and the Emergence ofEukaryotic Gene Complexity
Associated with reductions in Nl in eukaryotes aredramatic expansions in genome size, most of which reflectchanges in noncoding regions: introns, mobile elements andtheir remnants, and other forms of intergenic DNA (fig. 5).A notable feature of these scalings is their continuity overall forms of life, even across the prokaryote-eukaryoteboundary. This strongly suggests that neither cellular norphysiological changes associated with phylogenetic transi-tions are major determinants of genome size. We have pre-viously suggested that the types of genomic evolution thatare possible in various lineages are instead largely definedby the population-genetic environment, in particular by theeffective number of individuals within a species (Lynch andConery 2003). In the remainder of this paper, these ideas
Table 1Estimates of c/u, the Ratio of the Recombination Rate to the Mutation Rate Per Base Pair,for Various Species
Species c/u Reference
AnimalsHomo sapiens 0.6 Ptak, Voepel, and Przeworski (2004)Chorthippus parallelus 2.5 Ibrahim, Cooper, and Hewitt (2002)Drososphila spp. 3.8 Hey and Wakeley (1997);
Machado et al. (2002)
Land plantsArabidopsis spp. 0.7 Wright, Lauga, and Charlesworth (2003)Brassica nigra 0.3 Lagercrantz, Kruskopf Osterberg, and
Lascoux (2002)Cryptomeria japonica 3.0 Kado et al. (2003)Pinus taeda 0.3 Brown et al. (2004)Zea mays 1.6 Tenaillon et al. (2004)
ProkaryotesNeisseria gonorrheae 1.0 Posada et al. (2000)Neisseria meningitidis 4.8 Feil et al. (2001)Pseudomonas syringae 0.3 Sarkar and Guttman (2004)Staphylococcus aureus 6.5 Feil et al. (2001)Streptococcus pneumoniae 8.9 Feil et al. (2001)
456 Lynch

will be extended to show how many aspects of eukaryoticgene structure may have arisen by nonadaptive processes.
Prokaryotic genes generally have remarkably simplestructures—a single continuous coding region with oneor two transcription-factor binding (TFB) sites residing justa few nucleotides upstream. Often, a single transcription-initiation site services several downstream prokaryoticgenes, which are jointly transformed into a single polycis-tronic mRNA (an operon). In contrast, the coding regions ofeukaryotic genes are often dissected by introns, which aretranscribed into precursor mRNAs and then subsequentlyeliminated by splicing (fig. 6). In multicellular species, doz-ens of introns may occupy a single gene, and each introncan be many times longer than its surrounding exons.Eukaryotic genes also often have complex sets of regulatoryelements distributed over large distances upstream (and
sometimes internally or downstream) of the coding region,and with few exceptions, eukaryotic genes are transcribedas single monocistronic units. Finally, eukaryotic gene tran-scripts are generally flanked by extensive UTRs, whichmayharbor additional introns. Understanding how such modifi-cations of gene structure emerged is a major challenge forevolutionary genomics because each additional layer ofgene complexity entails a cost in terms of mutationalvulnerability.
Population geneticists have historically treated selec-tion and mutation as separate forces in the dynamics of evo-lutionary change, with mutation producing the variationupon which natural selection acts but having no further in-fluence on the fates of alleles. However, in the context ofgene architectural features, there are numerous ways inwhich mutation can act indirectly as a selective agent. Con-sider a pair of alleles with different forms of gene architec-ture but otherwise identical functions. Aside from anyenergetic burden associated with the maintenance of largernumbers of nucleotides, as a larger mutational target, themore complex allele will experience a greater rate of trans-formation to defective copies. For example, intergenicDNA has the potential to incur mutations that produce spu-rious TFB sites that cause inappropriate patterns of geneexpression; introns necessitate the maintenance of localiza-tion signals at the nucleotide level to insure proper mRNAsplicing; and 5# UTRs can acquire premature translation-initiation codons that cause downstream frameshifts. In thissense, most aspects of gene-architectural complexity im-pose an intrinsic mutational burden. The selective disadvan-tage associated with any single aspect of gene complexityneed not be very large, as it is roughly equivalent to theproduct of the mutation rate per nucleotide per generation(u) and the excess number of nucleotide sites in the morecomplex allele critical to gene function (n) (Lynch 2002),and arguments presented below suggest that n often falls inthe approximate range of 1–50. This implies that expan-sions of gene-architectural complexity are unusually vul-nerable to fixation by random genetic drift in populationswith small genetic effective sizes.
As noted above, if a costly modification of gene archi-tecture is to evolve in an effectively neutral manner, 4Nlsmust be smaller than;1.0. Because s5 nu and ps is a func-tion of Nlu, this criterion is equivalent to psn , 1.0. Thus,recalling the average estimate of ps for prokaryotes (fig. 4)and its likely downward bias, the population-geneticenvironment of prokaryotic species may only rarely beconducive to expansions in gene-architectural complexity.In contrast, the extremely low levels of ps for multicellulareukaryotes create situations that are highly permissive tothe accumulation of gene architectural changes with weakmutational disadvantages, which are easily overwhelmedby the power of random genetic drift. With their wideranges of Nl, the various lineages of unicellular eukaryotesare expected to fall between these two extremes. It shouldbe noted, however, that although organism size appearsto be the primary determinant of Nl, it is the latter thatultimately governs the genetic properties of populations.It is conceivable that some unicellular species may resideat a sufficiently low Nl for long enough periods to promotegenomic expansion but exceedingly unlikely that any
FIG. 5.—Scaling of genome content with genome size in prokaryotes(inverted triangles) and various eukaryotic groupings: unicellular and oli-gocellular species (diamonds), invertebrates (squares), vertebrates(circles), and land plants (triangles). Diagonal dashed lines denote pointsof equal proportional contributions to total genome content. Note thatmobile-element associated DNA (which includes retrotransposons andDNA-based transposons) may be found in introns as well as intergenicregions and that the intronic DNA depicted here does not include intronsin noncoding exons (UTRs). The data were obtained from the variouswhole-genome sequencing projects.
Origins of Eukaryotic Gene Structure 457

multicellular species ever achieves prokaryote-like levelsof Nl.
It is clear that the emergence of the complexities ofeukaryotic gene structure offered novel opportunities forthe evolution of organismal diversity, many of which havebeen exploited by multicellular eukaryotes, for example, in-creased regulatory-region complexity and alternative splic-ing associated with introns. Less certain is whether multiplecell types and mechanisms of cell signaling are advanta-geous in a formal fitness sense. In any event, becauseany such adaptive modifications are highly unlikely to havearisen de novo, alternative explanations are needed for thefirst steps in the retailoring of the eukaryotic genome. Spe-cific examples are now given on how three aspects ofeukaryotic gene complexity may have emerged despitetheir initial intrinsic disadvantages. Each scenario discussedis quantitatively consistent with the theory presented aboveand shows how a reduction in Nl can passively promote theevolution of gene architectural changes that ultimately fa-cilitate the evolution of organismal complexity by descentwith modification.
Introns
As noted above, introns impose a burden on their hostgenes, in that specific nucleotide signatures must be re-served to insure precise recognition of each exon-intronjunction by the spliceosome. The most conserved nucleo-tide sites are located at the ends of introns and at internalintronic branch points (Burge, Tuschl, and Sharp 1999;Lorkovic et al. 2000; Bon et al. 2003). However, this infor-mation is often insufficient for proper spliceosomal recog-nition, particularly in the case of large introns containingnumerous spurious recognition sites (Mount et al. 1992;
Burge, Tuschl, and Sharp 1999; Long and Deutsch1999). Supplemental information often resides within thesurrounding exons in the form of exon splicing enhancersand exon splicing silencers (ESSs), each typically four toten nucleotides in length (Liu, Zhang, Krainer 1998; Schaaland Maniatis 1999; Blencowe 2000). In mammals, ;2%–4% of exonic sequences match the signatures of knownESSs, with ;5 such clumps per exon (Fairbrother et al.2002), and the maintenance of such motifs by transcrip-tion-related processes is supported by the significantly dif-ferent frequencies of various oligomers in intron-containingversus intron-free genes (Federov et al. 2001). The mostdirect evidence for the increased mutational vulnerabilityassociated with introns derives from the observation thatabout a third of human genetic disorders is attributableto mutations causing defective splice-site recognition(Culbertson 1999; Frischmeyer and Dietz 1999; Philipsand Cooper 2000), many of which are located in exons (in-cluding substitutions at synonymous sites) (Cooper andMattox 1997; Nissim-Rafinia and Kerem 2002).
Based on the known molecular requirements for spli-ceosomal recognition, one may surmise that the equivalentof n5 20 to 40 nucleotide sites are required for the preciseremoval of each intron (Lynch 2002), and indirect estimatesbased on the incidence of splicing-defective alleles amongnew mutations are consistent with this prediction (Lynch,Hong, and Scofield 2005a). Recalling the theory presentedabove, a permissive environment for intron colonization re-quires that Nls 5 Nlnu be smaller than ;0.25, or equiva-lently ps , 1/n. Thus, as a first-order approximation,populations with silent-site nucleotide diversities greaterthan ;0.05 are expected to be nearly immune to introncolonization. Essentially, the full range of variation in ob-served ps for animals and land plants is well below this
FIG. 6.—Generalized structures of prokaryotic and eukaryotic genes and transcription units. Note that the lengths of various gene parts are notnecessarily to scale, for example, eukaryotic genes can harbor as many as several dozens of introns, each of which greatly exceeds the length of itssurrounding exons, and TFB sites (small ovals) can be much more numerous and widely distributed than illustrated. TATA denotes one of the possibleeukaryotic core promoter elements, to which transcription factors convey information, and poly(A) denotes the posttranscriptional addition of a poly(A)tail. Black bars denote coding DNA, open bars denote transcribed but untranslated DNA, and thin lines within transcribed regions denote introns.
458 Lynch
threshold value (fig. 4), and all members of these groupshave an average of four to seven introns per protein-codinggene (Lynch and Conery 2003). In contrast, the averagevalue of ps for unicellular species (0.06) slightly exceedsthe expected threshold, yielding the prediction that the de-mographic features of such species often place them inclose proximity to the barrier to intron colonization (andmaintenance). Consistent with this prediction is the broadrange of variation in intron numbers in unicellular eukar-yotes, ranging from a few dozen or less in the entiregenomes of some species (e.g., trypanosomes, the diplomo-nad Giardia, the red alga Cyanidioschyzon, and somefungi) to numbers approaching those in animals and landplants in other fungi (fig. 5). For prokaryotes, which are de-void of spliceosomal introns, average ps is more than twicethe threshold for intron colonization.
The phylogenetic distribution of introns and the com-ponents of the spliceosome make it quite clear that the stemeukaryote harbored introns (Lynch and Richardson 2002;Collins and Penny 2005), and perhaps a substantial numberof them (an average of up to three per protein-coding genebeing plausible) (Rogozin et al. 2003; Roy and Gilbert2005a; see Qiu, Schisler, and Stoltzfus 2004 for an alter-native view). Thus, because there is no evidence of theprior existence of a spliceosome in any prokaryote, the stemeukaryote must have provided a highly permissive envi-ronment for intron colonization, with some subsequentlineages then experiencing conditions that favored intronloss and others favoring further intron gain. Could the stemeukaryote have had a sufficiently small population size toallow the accumulation of a substantial intron populationvia effectively neutral processes alone? Two different ap-proaches have led to the conclusion that the birth rate ofintrons within the past ;100 Myr is ;0.001/nucleotidesite/Byr in invertebrates (Lynch and Richardson 2002;Roy and Gilbert 2005b). At this rate, ;1.0 Byr wouldbe required since the origin of the spliceosome for the pro-tein-coding genes of the stem eukaryote to acquire anaverage of ;1.0 introns, assuming an average codinglength of ;1.0 kb as in common in today’s eukaryotes.Thus, because the time span between the origin of lifeand the origin of eukaryotes is ;1.0 Byr (Knoll 1992;Furnes et al. 2004), the passive acquisition of more thanone intron per protein-coding gene in the stem eukaryoteis just barely plausible, unless the physical rate of intronbirth was substantially higher than in today’s species.
A more rapid early proliferation of introns could haveoccurred if some form of positive selection offset the intrin-sic disadvantages associated with elevated mutational vul-nerability as this would increase the rate of fixation beyondthe neutral expectation. One possibility involves thenonsense-mediated decay (NMD) pathway, an mRNA sur-veillance mechanism for detecting and eradicating tran-scripts harboring premature termination codons (PTCs).The details of this process have been worked out in onlya few organisms, but at least in mammals NMD often usesa protein complex laid down at splicing junctions (the exonjunction complex [EJC]) to discriminate PTCs from propertermination codons. If a termination codon is detectedupstream of an EJC, the transcript is generally targetedfor destruction, a process that works so long as the true
termination codon generally resides in the final exon, asis usually the case in mammals (Maquat 2004). Aside fromthe transcription of mutant alleles, there are many differentroutes to the stochastic production of PTC-containing tran-scripts, including base misincorporation, sloppy points oftranscription initiation, and erroneous splicing (reviewedin Lynch, Hong, and Scofield 2005a). Thus, most cellsare regularly confronted with the need to eliminate tran-scripts that could lead to harmful truncated proteins, andthe benefits of doing so via NMD are well documented(Hodgkin et al. 1989; Leeds et al. 1992; Dahlseid et al.1998; Mendell et al. 2000; Medghalchi et al. 2001).
Phylogenetic analysis suggests that both NMD and theEJC were present in the stem eukaryote (Lynch, Hong, andScofield 2005a). Thus, an early functional association ofNMD with introns could have elevated the rate of intronproliferation beyond the neutral expectation (Lynch andKewalramani 2003). Under this hypothesis, the first intronto colonize a gene would provide a basis for eliminatingtranscripts with the subset of upstream PTCs. However, be-cause the spatial locations of initially colonizing intronsmust be largely random, because introns themselves en-courage the production of erroneous transcripts via splicingerrors, and because some PTCs may be unable to elicitNMD if the nearest EJC is too far downstream, once thiscoevolutionary process initiated, further colonization of in-trons would be encouraged. In this manner, some of the ear-liest colonizing introns (those in locations that allowedsufficient PTC detection) may have had a selective advan-tage that offset the cost of increased mutational susceptibil-ity. The overdispersed distributions of introns in the genesof multicellular species support the hypothesis that selec-tion favors a uniform coverage of coding regions withintrons (Lynch and Kewalramani 2003). Other factorsmay encourage the colonization of introns (Lynch andRichardson 2002), but the central point here is that onceintrons became a reliable aspect of a substantial fractionof eukaryotic genes, they served as a natural substrate forsecondary adaptive evolution.
Despite the obvious benefits of an mRNA surveillancesystem, a few species appear to have lost the NMD pathway(Lynch, Hong, and Scofield 2005a). These include the ki-netoplastids Trypanosoma and Leishmania, the unicellularred alga Cyanidioschyzon, the microsporidian Encephalito-zoon, and the diplomonad Giardia. Remarkably, each ofthese lineages is almost entirely devoid of introns, and withthe exception of Leishmania, they all appear to have lost theEJC apparatus. It is tempting to conclude that the loss ofintrons and NMD must go hand in hand simply becauseof the latter’s functional requirement for an EJC. However,because NMD operates on some genes in an intron-independent manner in a phylogenetically broad group ofspecies (Ruiz-Echevarria, Gonzalez, and Peltz 1998; Hillerenand Parker 1999; Gatfield et al. 2003; Amrani et al. 2004), itis not clear that introns are an absolute requirement for themaintenance of NMD. An alternative explanation for NMDlosses is that the species involved have had very largehistorical effective sizes, which facilitated the elimina-tion of all forms of extraneous DNA, including mobileelements and most intergenic DNA. As the degree of geno-mic streamlining increases, the production of erroneous
Origins of Eukaryotic Gene Structure 459
transcripts may eventually decline to the point at which theselective advantage of an intron-based NMD system is nolonger sufficient to insure its evolutionary stability (Lynch,Hong, and Scofield 2005a).
A central unresolved issue with respect to introns iswhether intron numbers have reached a steady-state equi-librium, and if so, what prevents runaway intron coloniza-tion. The equilibrium occupancy of introns is a function ofthe ratio of birth (b) to death (d) rates per coding nucleotidesite (Lynch 2002), but no equilibrium is possible if b .d for all levels of occupancy. The NMD hypothesis pro-vides a potential density-dependent mechanism that couldstabilize intron numbers. As a sufficiently well-distributedpopulation of introns is established, the NMD-associatedadvantages of additional introns will progressively declineuntil a point is eventually reached at which further introncolonization imposes a net disadvantage. Such a scenariowould provide a natural barrier to runaway intron coloni-zation only if the net selective disadvantage of each addi-tional intron exceeded the power of random genetic drift orif the physical rate of intron removal somehow increasedwith intron number. The average number of introns per pro-tein-coding gene in vertebrates ranges from 5.2 (Fugu) to7.9 (Gallus), whereas the range for invertebrates is nearlynonoverlapping, 3.1 (Drosophila) to 5.5 (Bombyx). Thus, itis clear that the animal lineage experienced a basal increasein intron number, although it is an open question as towhether the numbers in vertebrates continued to expand(perhaps even today) as a consequence of the reducedefficiency of selection associated with low Nl. One analysisis consistent with the latter interpretation (Rogozin et al.2003).
Finally, it is worth considering the origin of the com-plex molecular machine that makes introns possible, thespliceosome. The most credible hypothesis involvesdescent from a group II intron (Sharp 1985; Cech 1986;Lambowitz and Zimmerly 2004). Although these ‘‘self-splicing’’ introns have never been found in nuclear genes,their presence in eubacteria, archaea, and the organelles ofplants, fungi, and numerous protists (Bonen and Vogel2001; Dai and Zimmerly 2002, 2003; Rest and Mindell2003) makes plausible the idea that they were present inthe stem eukaryote. Deriving further support from the nu-merous structural and functional similarities between theexcision mechanisms for group II introns and spliceo-some-dependent introns (Michel and Ferat 1995; Hetzeret al. 1997; Burge, Tuschl, and Sharp 1999; Sontheimer,Gordon, and Piccirilli 1999; Shukla and Padgett 2002;Valadkhan and Manley 2002), the group II seed hypothesispostulates that the five small RNAs at the heart of the spli-ceosome are direct descendants of the major subunits of thecatalytic core of a group II intron. However, the transitionfrom a self-splicing group II intron to a large population ofeukaryotic spliceosome-dependent introns would have in-volved a number of evolutionary challenges (Stoltzfus1999; Lynch and Richardson 2002), not the least of whichis the reassignment of functional fragments from group IIintrons associated with specific genes to a more generalizedsplicing mechanism servicing hundreds to perhaps thou-sands of genes. The proposed evolutionary pathway togroup II intron fragmentation involves a series of effec-
tively neutral steps (Cavalier-Smith 1991; Stoltzfus1999) that are intrinsic to the subfunctionalization process(Force et al. 1999). However, subfunctionalization is ex-ceedingly unlikely in large populations, which impose dif-ficulties for the establishment of functional fragmentswithout mutational deterioration during the long time re-quired for fixation (Lynch and Richardson 2002). Thus,if the group II seed hypothesis is correct, it reinforcesthe view that the emergence of eukaryotes was accompa-nied by a reduction in Nl.
5# UTRs
Like introns, the 5#-untranslated leader sequences ofmRNAs are liabilities for genes because they increasethe size of the mutational target. Most notably, the 5#UTR serves as substrate for the mutational appearance ofpremature translation start codons (PSCs), which becauseof the scanning mechanism for translation initiation ineukaryotes (Kozak 1994) can lead to N-terminal expansionof the protein product (in ;1/3 of cases) and a shift in thereading frame and protein truncation (in ;2/3 of cases). Adeficit of ATG triplets in the exons of 5# UTRs but muchless so in their introns provides compelling evidence of thenegative translation-associated consequences of such muta-tions (Rogozin et al. 2001; Lynch, Scofield, and Hong2005b), as does the incidence of human genetic disordersassociated with the appearance of PSCs (Kozak 2002). Thisraises questions not only as to why 5#UTRs are present, butwhy they are so long. Contrary to the situation for introns,which vary in average size by over two orders of magnitudein different phylogenetic groups, the average 5#-UTRlengths of most eukaryotic lineages are remarkably con-stant, falling in the narrow range of 100–200 bp (Lynch,Scofield, and Hong 2005b).
Messenger RNAs are unlikely to require leadersequences as physical landing pads for the ribosome. Forexample, although archaebacteria employ transcriptionalmechanisms similar to those of eukaryotes (Bell andJackson 2001), their 5# UTRs are generally no more thana dozen nucleotides in length and in some cases are com-pletely absent (Slupska et al. 2001). Similar situations areobserved in eubacteria (Weiner, Herrmann, and Browning2000; Moll et al. 2002) and in mitochondria (Gillham 1994;Taanman 1999). Moreover, 5# UTRs in the diplomonadGiardia often consist of just a single nucleotide (Iwabeand Miyata 2001), and a substantial fraction of those ina variety of other unicellular eukaryotes are,25 bp, includ-ing those in the ciliate Euplotes crassus (Ghosh et al. 1994),the amoeba Entamoeba histolytica (Singh et al. 1997),and the trichomonad Trichomonas vaginalis (Liston andJohnson 1999). Experimental evidence suggests that suchdiminutive leader sequences are sufficient to support trans-lation in mammals and yeast, although the efficiency oftranslation can be reduced with UTRs shorter than ;30bp (van den Heuvel et al. 1989; Maicas, Shago, and Friesen1990; Hughes and Andrews 1997).
To evaluate whether the expansion of eukaryotic 5#-UTR lengths might be a simple consequence of the reducedefficiency of selection associated with small Nl, a simplenull model for the stochastic growth and contraction of
460 Lynch

UTRs based on mutational gains and losses of PSCs andtranscription-initiation signals (TISs, e.g., the TATAbox) has been developed (Lynch, Scofield, and Hong2005b). Under this model, all alleles are assumed to be ef-fectively neutral with respect to each other, with the excep-tion of two defective classes: alleles containing a harmfulPSC between the TIS and the true translation start codon,and alleles for which the TIS has moved so close to the cod-ing region that transcription initiates beyond the translation-start point. As ATG triplets are free to accumulate upstreamof currently utilized transcription-initiation sites, this pro-cess results in a natural barrier to excessive growth of 5#UTRs, which can only expand in a 5# direction if the ex-tension is devoid of harmful PSCs. Over time, the stochasticwinking on and off of PSCs and TISs upstream of the truetranslation-start site results in an equilibrium L-shaped dis-tribution of 5#-UTR lengths with a mean and variance thatare quite similar to those observed within a wide variety ofspecies, largely independent of the assumed length of theTIS (Lynch, Scofield, and Hong 2005b). This result sug-gests that the reduced mutational burden of short 5# UTRsmay be inconsequential in comparison to the power of ran-dom genetic drift in most eukaryotes.
To understand the mechanistic underpinnings of sucha condition, it is necessary to consider the long-term excessmutation rate to defective alleles for an allelic lineage inwhich UTR lengths simply stochastically grow and contract(as in the above model) without selective discriminationamong functional alleles, in contrast to the situation inwhich minimal length UTRs are maintained by positive se-lection. The mutational disadvantage of stochastically gen-erated 5# UTRs increases with the length of the TIS (n) notonly because of the larger target size of the TIS itself, butalso because a larger n implies that in the event of a TISloss, the nearest upstream alternative TIS will be increas-ingly likely to reside beyond a harmful PSC (because ofthe rarity of complex sequences). This is a potential concernbecause of the limited information available on the length ofcore promoter sequences. However, the key result is fairlyrobust to the length of the TIS—for n in the range of 4 (e.g.,TATA) to 8 (which is beyond the complexity of knownTISs), the long-term mutational advantage of a minimal-length 5# UTR is in the narrow range of u to 4u (Lynch,Scofield, and Hong 2005b), substantially smaller thanthe mutational penalty associated with an intron.
Again following the logic outlined above, this resultimplies that a permissive environment for the stochastic ex-pansion of 5# UTRs is ps , 0.25. Thus, because all esti-mates of ps for multicellular eukaryotes are well below0.10 (fig. 4), the power of genetic drift in all such speciesis far too great for the maintenance of minimal-length 5#UTRs by positive selection. The estimates of ps for essen-tially all unicellular eukaryotes are also below the thresholdvalue of 0.25, although as discussed above, some of theseestimates are likely to be downwardly biased, raising thepossibility that the long-term Nl, of some microbial eukar-yotes and certainly many prokaryotes is adequate to allowthe selective promotion of alleles with 5# UTRs of minimallength. Although the data are limited, a few protist lineagesdo appear to have average 5#-UTR lengths too small to beaccommodated by the null model (Ghosh et al. 1994; Singh
et al. 1997; Liston and Johnson 1999; Yee et al. 2000;Adam 2001).
If the preceding hypothesis is correct, then selectionfor gene-specific regulatory features need not be invokedto explain either the expansion of eukaryotic 5# UTRs rel-ative to the situation in prokaryotes or the thousandfoldrange of 5#-UTR lengths among genes within species. Nev-ertheless, once permanently established, expanded 5#UTRs may have provided novel substrate for the evolutionof posttranscriptional mechanisms for regulating gene ex-pression. For example, numerous features of 5# UTRs (in-cluding their lengths) in today’s eukaryotes can influencethe rate of protein synthesis by modifying the efficiencyof translation (de Moor and Richter 2001; Pickering andWillis 2005), and some have argued that upstream openreading frames (uORFs) serve an adaptive function by caus-ing the ribosome to terminate and/or reinitiate, therebyslowing the rate of translation (Morris and Geballe 2000;Meijer and Thomas 2002; Vilela and McCarthy 2003).However, the extent to which any features of 5# UTRsare adaptive remains an open question. For example,uORFs are generally ;20 codons in length, approximatelywhat is expected by chance, and these may simply exist be-cause their stop codons have neutralized the effects ofa PSC, enabling the downstream coding domain to performat normal levels.
Modularization of Regulatory Regions
The ability to regulate the expression of genes intissue-, developmental stage-, and/or environment-specificmanners is the hallmark of organisms with multiple celltypes. To accomplish such tasks, genes generally harbor nu-merous cis-acting regulatory elements that cooperativelyinteract with multiple trans-acting factors to finely tune lev-els of transcription. These regulatory elements are often or-ganized into modular units such that mutations to individualgene subfunctions have restricted phenotypic effects (Forceet al. 1999; Prince and Pickett 2002). It has often been ar-gued that this particulate form of gene regulation was a fun-damental prerequisite for the origin of developmentalmodules capable of independent evolutionary trajectories,and some have suggested that such organization enhancesthe evolvability of lineages (Raff 1996; Wagner 1996;Wagner and Altenberg 1996; Gerhart and Kirschner1997; Hartwell et al. 1999; Niehrs and Pollet 1999; Carroll,Grenier, and Weatherbee 2001; Davidson 2001). However,it is an open question as to whether evolvability, a population-level phenomenon, is ever promoted by natural selection.
Each essential regulatory element elevates a gene’ssusceptibility to inactivating mutations, and it is unclearwhether adaptive processes are sufficient to explain theorigin of modular gene structure and regulatory logic.Therefore, an essential first step in understanding the initialestablishment of modular gene-regulatory structure is a con-sideration of the situation in which selection is a negligibleforce (Zuckerkandl 2001; Force et al. 2005). The followingdiscussion outlines how the modular organization ofregulatory regions can arise passively in response to driftand mutation processes alone. To simplify the presentation,new subfunctions will be assumed to be defined by TFB
Origins of Eukaryotic Gene Structure 461

sites (or integrated regions of such sites) that are potentiallyseparable from other such sites, both mutationally and func-tionally (Yuh, Bolouri, and Davidson 1998; Force et al.1999; Arnosti 2003). However, the principles outlined be-low are broadly generalizable, as a gene subfunction mayalso correspond to alternative splice sites, transcription-initiation sites, polyadenylation signals, etc.
Before exploring the population-genetic issues, a briefoverview of eukaryotic transcriptional control will be use-ful. Transcription-factor genes are generally expressed atspecific stages of development at a hierarchy of levels oforganization. Some transcription factors are organ specific,some are specific to individual tissues within an organ, andstill others are expressed in specific cell types within a tis-sue. By virtue of their ability to bind DNA and/or to act ascofactors in binding each other together in functionally sig-nificant ways, the full suite of transcription factors and theircombinatorial expression provides a heterogeneous infor-mational network within the organism. A gene’s patternof expression is then defined by the match between itsTFB sites and the local transcription-factor environment.Although the entire regulatory domain of a gene can some-times rival the length of the coding region and individualgenes can harbor dozens of regulatory elements, individualTFB sites are usually no more than a dozen base pairs inlength, and such sites are often partially overlapping or en-tirely embedded. Because small regulatory elements canarise by a fortuitous series of de novo base substitutionsand/or by segmental insertions, there are many potentialways in which the numbers, locations, and types of TFBsites for a gene can become modified (Brosius 1999; vonDassow and Monro 1999; Edelman et al. 2000, Stoneand Wray 2001; Rockman and Wray 2002; Jordan et al.2003; Wray et al. 2003; MacArthur and Brookfield2004). However, the evolution of a new form of gene reg-ulatory architecture will generally require a period of redun-dancy, as this will allow the modification of one set of TFBsites before the other is abandoned, thereby insuring overallconstancy of gene expression during the transition phase.Because the origin of tandem duplicated stretches ofDNA is quite high, especially for small segments (Lynchand Conery 2000; Katju and Lynch 2003), such situationsappear to be very common in eukaryotes, and various per-mutations of TFB sites often yield functionally equivalentpatterns of gene expression (Bonneton et al. 1997; Hancocket al. 1999; Ludwig et al. 2000; Dermitzakis and Clark2002; Shaw et al. 2002; Arnosti 2003; Dermitzakis,Bergman, and Clark 2003).
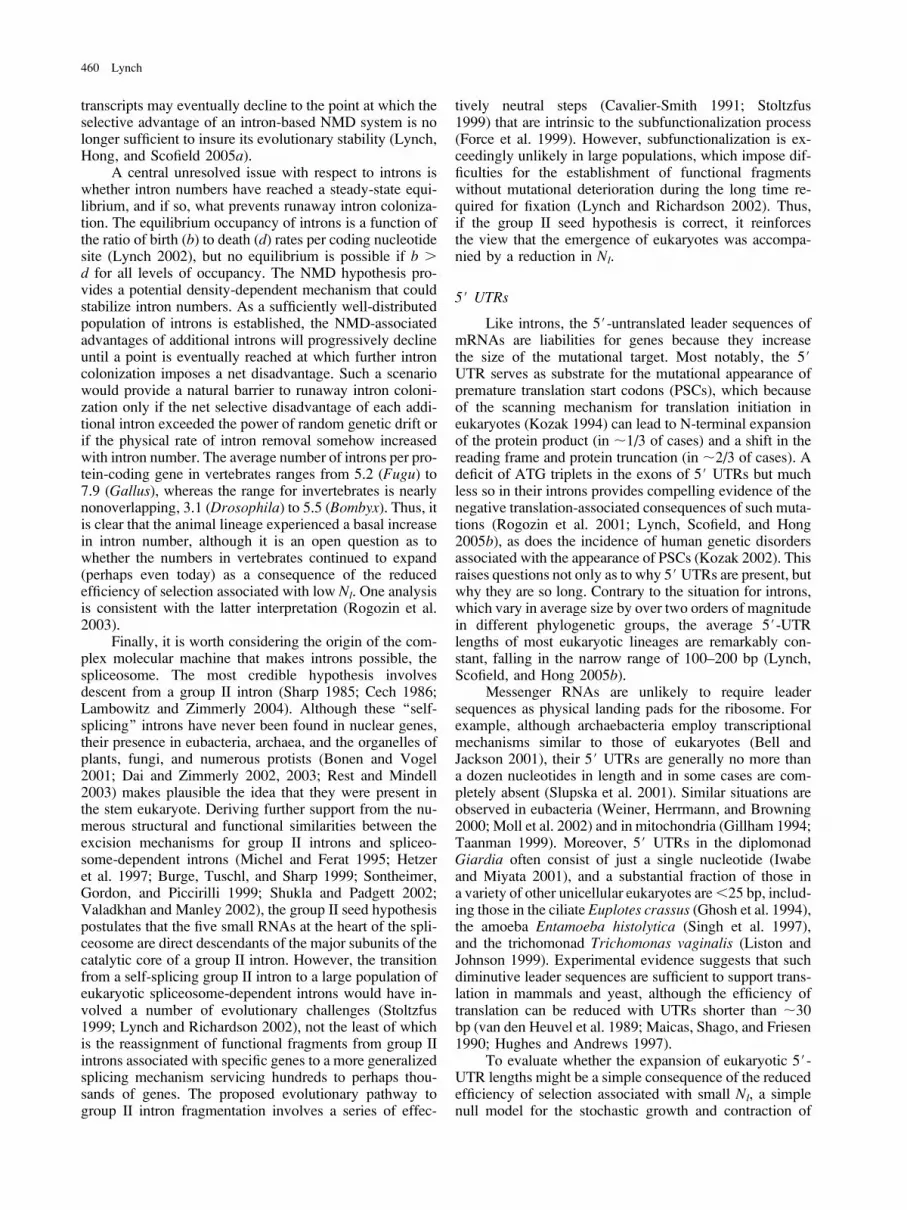
Before proceeding, it is worth emphasizing that thegoal here is not to explain the expression of a gene ina new temporal or spatial context, but to understand howa gene that is initially under control of a ubiquitouslyexpressed transcription factor comes to be regulated by spa-tially and/or temporally restricted transcription factorswhile initially retaining the same overall expression pattern.The process envisioned, subfunction fission, invokes grad-ual structural modifications of preexisting enhancers withina gene (descent with modification) rather than the saltatoryappearance of entirely new regulatory modules (Force et al.2005). Subfunction fission involves consecutive phases ofregulatory-region expansion and contraction (fig. 7).
The first step toward the modularization of a gene’sregulatory apparatus, accretion and degeneration, involvesthe acquisition of new semi-redundant TFB sites combinedwith the degeneration of one or more ancestral sites. Thisconverts a universally used set of TFB sites to a semi-independent enhancer with a pair of partially overlappingregulatory elements (series a–d, upper left of fig. 7). Ifthe alternative TFB sites are subject to both mutational gainand loss, there is not necessarily a permanent allelic stateunder this model, as the alternative alleles are free to mutateback and forth (hence, the two-way arrows in fig. 7). Nev-ertheless, it is instructive to know the population-geneticconditions under which the semi-independently regulatedallele (d) is most likely to accumulate as this is an essentialfirst step in the transition to an allele with two entirely in-dependent subfunctions. Letting lb and ld, respectively,denote the rates of birth and loss of individual TFB sites,it is possible to estimate the average time that transpires be-tween a transient state fixed for an allele with shared reg-ulatory sites (a) and an allele with a semi-independentenhancer (d) (Force et al. 2005). Provided 4Nlld � 1,the transition time to the semi-independently regulated stateis independent of population size because the waiting timesfor mutational changes, 1/lb and 1/ld, are much greaterthan the time to drift to fixation, 4Nl. In contrast, as Nl ap-proaches the point at which 4Nlld5 1, the transition time tothe semi-independently regulated allele begins to scale lin-early with Nl. Thus, as in the case of introns and 5# UTRs,the key condition for maximizing the likelihood of a transi-tion from a simple to more complex (semi-independentlyregulated) regulatory region, 4Nlld � 1, is a function ofthe ratio of the power of a mutational force (2ld beingthe rate of loss of TFB sites per individual) and the powerof drift (1/2Nl).
Although the net addition of a regulatory element toa gene imposes a weak selective disadvantage by increasingthe mutation rate to defective alleles, selection is ineffectiveexcept in very large populations. Given the small size oftypical TFB sites, 4Nlld is expected to be on the orderof 10ps (or perhaps somewhat higher, after accountingfor bias and also allowing for inactivation by insertion/deletion mutations). In any event, again recalling the resultsin figure 4, the condition for accretion and degeneration isprobably fulfilled in all multicellular eukaryotes as wellas in numerous unicellular eukaryotes and probably vio-lated in most prokaryotes. This implies that that as soonas transcription factors with spatially and/or temporally re-stricted patterns of expression evolved, large numbers ofbroadly expressed genes in eukaryotes would have becomesubject to the passive accumulation of alleles with semi-independent regulation.
In the second step toward complete modularization(duplication, degeneration, and complementation), the localduplication of a semi-independent enhancer provides an op-portunity for the formation of two entirely independent reg-ulatory elements (lower left of fig. 7). The events during thisphase are conceptually identical to those underlying thesubfunctionalization model for the preservation of duplicategenes (Force et al. 1999; Lynch et al. 2001), although in thiscase the process involves smaller regulatory elements.Progression to the modularized state during this phase
462 Lynch
requires that each semi-independent enhancer incurs a com-plementary loss of tissue-specific function prior to one ofthe enhancers being entirely silenced. The probabilitiesof these alternative outcomes depend on the relative ratesof loss of tissue-specific (two shades of grey) and shared(black) TFB sites, but regardless of these mutational prop-erties, large Nl can impose a complete barrier to enhancersubfunctionalization. This population-size dependence isagain a consequence of a modularized allele serving asa larger mutational target (four black binding sites at thebottom left of fig. 7, as opposed to two for allele d) (Lynchet al. 2001; Force et al. 2005).
These results have several implications. First, a modu-lar, tissue-specific gene regulatory structure can emergespontaneously from an initial state in which the full expres-sion breadth of a gene is under unified control. Not onlydoes this process proceed via entirely nonadaptive pro-cesses (random genetic drift and mutation), but becausealleles with more complex regulatory architectures havean excess mutation rate to nulls, it is less likely to occurin situations where the power of natural selection exceedsthat of drift. Thus, contrary to popular belief, not only maynatural selection be an insufficient mechanism for the originof genotypic modularity, but conditions where selection is
most likely to be efficient (large populations) promote theopposite situation—alleles under unified transcriptionalcontrol. In this sense, the reduction in Nl that accompaniedthe origin of eukaryotes may have paved the way for theemergence of modular gene architecture without any directinvolvement of positive selection. The process will be evenmore powerful in multicellular species because a widerrange of regulatory-region structures with mildly deleteri-ous fitness effects (beyond the mutational disadvantage)will be effectively neutral, providing additional routesfor the colonization of new TFB sites.
Second, the transition to modular gene structure maynot always require the accretion of new regulatory ele-ments. Due to the recurrent mutational production of alter-native TFB sites, large populations can be expected toharbor high frequencies of semi-modular alleles (of theform c in fig. 7), which owing to the presence of redundantTFB sites (white and grey elements) have a weak mutation-ally induced selective advantage relative to alleles of typea (Wagner 1999, 2001). This implies that a population thathas experienced a prolonged phase of large effective size,which inhibits the evolution of modularity, can neverthelessbe poised to make a transition to allelic state d followinga population-size reduction and the subsequent neutral loss
FIG. 7.—A hypothetical scenario in which an allele with two independently mutable subfunctions can arise from an allele with a single generalizedexpression mechanism. Regulatory regions are depicted on the left, with each regulatory element color coded according to the transcription factor thatbinds to it. On the right, the allele-specific utilizations of transcription factors are depicted. Transcription factors denoted by black and white are ubiq-uitously expressed, whereas those denoted by two shades of grey are each expressed in single, nonoverlapping tissues. In the first phase of allelic evolution(accretion and degeneration), the regulatory region undergoes sequential accretion of the dark and light grey elements, which together are redundant withrespect to the white (but not the black) element. The redundant white element is then lost, yielding a descendant allele will a semi-independent mode ofexpression, as the black element is still essential to expression in both tissues. In the second phase (duplication, degeneration, and complementation), theentire enhancer region is tandemly duplicated, with each component then losing a complementary (light/dark grey) element. The resultant allele has twoindependently mutable subfunctions denoted by the dark and light grey open boxes, as a mutation in either region has effects that are confined to a singletissue. Note that throughout these transitions, there has been no change in the pattern of deployment of the gene, which is always expressed in both tissues;only the mechanism of achieving expression is altered.
Origins of Eukaryotic Gene Structure 463
of the shared redundant (white) TFB site from its precursorallele (c).
Finally, although the pattern of tissue-specific gene ex-pression remains unaltered throughout the process of sub-function fission, the underlying molecular mechanisms forachieving the pattern are modified in ways that can elimi-nate pleiotropic constraints associated with shared regula-tory elements, thereby opening up previously inaccessibleevolutionary pathways. Moreover, the spontaneous emer-gence of modular gene organization by random drift andmutation processes has a powerful secondary effect. Whena modularized gene is duplicated in a small population,which occurs frequently (Lynch and Conery 2000), thetwo members of the duplicate pair will have a high prob-ability of experiencing complementary degenerative muta-tions that result in gene specialization (Force et al. 1999;Lynch and Force 2000; Lynch et al. 2001), eliminating stillanother layer of pleiotropic constraints. This joint operationof subfunction formation at the gene level and subfunction-alization at the genome level provides a passive mechanismfor the gradual remodeling of entire developmental geneticpathways without any direct initial involvement of naturalselection. In this sense, multicellular species may be cruci-bles for the origin of complex patterns of cellular anddevelopmental patterning, not because such features aredirectly advantageous but because they are unavoidableconsequences of small population size environments.
Concluding Remarks
Despite the enormous progress in molecular geneticsover the past 50 years, no general theory for the evolution ofthe basic architectural features of genes has been formu-lated. Many attempts have been made to explain the fea-tures of genes, genomes, and genetic networks in thecontext of putatively adaptive cellular and/or developmen-tal features, but few of these efforts have been accompaniedby a formal evolutionary analysis. Because evolution isa population-level process, any theory for the origins ofthe genetic machinery must ultimately be consistent withbasic population-genetic mechanisms. However, becausenatural selection is just one of several forces contributingto the evolutionary process, an uncritical reliance on adap-tive Darwinian mechanisms to explain all aspects of organ-ismal diversity is not greatly different than invoking anintelligent designer.
This paper represents a first step toward the formal de-velopment of a general theory for the evolution of the genethat incorporates the universal properties of random geneticdrift and mutation pressure. Although the ideas presentedare unlikely to be correct in every detail, at a minimum theyserve as a null model. For if verbal adaptive arguments areto provide confident explanations for any aspect of gene orgenomic structure, something must be known about pat-terns expected in the absence of selection. This is a signif-icant challenge because at this point it is difficult to rejectthe hypothesis that the basic embellishments of the eukary-otic gene originated largely as a consequence of nonadap-tive processes operating contrary to the expected directionof natural selection. A significant area of future researchwill be to take these observations on gene and genome com-
plexity to the next level, to evaluate whether natural selec-tion is a necessary and/or sufficient force to explain theevolution of the cellular and developmental complexitiesof eukaryotes.
Finally, an issue not considered above is the potentialenergetic consequences of the expansion of eukaryoticgenes. It is commonly argued that a significant metabolicburden associated with excess DNA is responsible forthe streamlining of prokaryotic genomes by natural selec-tion (Cavalier-Smith 2005; Giovannoni et al. 2005). How-ever, no direct estimate of the contribution of DNAreplication to a cell’s total energy budget has ever beenmade, and the lack of correlation between prokaryotic celldivision rate and genome size does not inspire confidence inthe metabolic-cost hypothesis (Mira, Ochman, and Moran2001). Castillo-Davis et al. (2002) have suggested that thenegative correlation between intron size and the level of ex-pression of genes in nematodes and humans reflects anadaptive response to the costs of transcription, althoughintrons in highly transcribed genes might simply experiencehigher levels of deletion. In the only attempt to calculatethe costs of transcription, Wagner (2005) concluded thata doubling of the transcription of a yeast gene might causea fractional reduction of fitness of ;10�5. Numerous as-sumptions had to be made to arrive at this conclusion, andincremental modifications to the complexity of transcribedportionsofgenesmaygenerallyonlybe;1%ofthe total tran-script length, which would imply an incremental transcrip-tional cost of ;10�7 or perhaps lower, depending on therelationship between energetic cost and fitness. A welcomeaddition to this areawould be a formal evaluation of the costsof DNA andmRNAproduction relative to the total energeticrequirements of cell maintenance and replication. If suchcosts can be translated into a selection coefficient, the abilityof natural selection to resist themcan then be evaluated usingthe same procedures discussed above.
Supplementary Materials
Supplementary Tables 1–4 are available at Molec-ular Biology and Evolution online (http://www.mbe.oxfordjournals.org/).
Acknowledgments
I am very grateful to E. Koonin and F. Kondrashov forimportant comments that led to significant improvement ofthis presentation. J. Conery helped in procuring the pro-karyotic genome content data. The work has been sup-ported by National Institutes of Health grant GM36827and National Science Foundation grant MCB-0342431.
Literature Cited
Adam, R. D. 2001. Biology of Giardia lamblia. Clin. Microbiol.Rev. 14:447–475.
Amrani, N., R. Ganesan, S. Kervestin, D. A. Mangus, S. Ghosh,and A. Jacobson. 2004. A faux 3#-UTR promotes aberranttermination and triggers nonsense-mediated mRNA decay.Nature 432:112–118.
464 Lynch
Arnosti, D. N. 2003. Analysis and function of transcriptionalregulatory elements: insights from Drosophila. Ann. Rev.Entomol. 48:579–602.
Bell, S. D., and S. P. Jackson. 2001. Mechanism and regulation oftranscription in Archaea. Curr. Opin. Microbiol. 4:208–213.
Blencowe, B. J. 2000. Exonic splicing enhancers: mechanism ofaction, diversity and role in human genetic diseases. TrendsBiochem. Sci. 25:106–110.
Bon, E., S. Casaregola, G. Blandin et al. (11 co-authors). 2003.Molecular evolution of eukaryotic genomes: hemiascomyce-tous yeast spliceosomal introns. Nucleic Acids Res. 31:1121–1135.
Bonen, L., and J. Vogel. 2001. The ins and outs of group II introns.Trends Genet. 17:322–331.
Bonner, J. T. 1988. The evolution of complexity. Princeton Uni-versity Press, Princeton, N.J.
Bonneton, F., P. J. Shaw, C. Fazakerley, M. Shi, and G. A. Dover.1997. Comparison of bicoid-dependent regulation of hunch-back betweenMusca domestica andDrosophila melanogaster.Mech. Dev. 66:143–156.
Brosius, J. 1999. Genomes were forged bymassive bombardmentswith retroelements and retrosequences. Genetica 107:209–238.
Brown, G. R., G. P. Gill, R. J. Kuntz, C. H. Langley, and D. B.Neale. 2004. Nucleotide diversity and linkage disequilibriumin loblolly pine. Proc. Natl. Acad. Sci. USA 101:15255–15260.
Burge, C. B., T. Tuschl, and P. A. Sharp. 1999. Splicing of pre-cursors to mRNAs by the spliceosomes, Pp. 525–560 in R. F.Gesteland, T. R. Cech, and J. F. Atkins, eds. The RNA world,2nd edition. Cold Spring Harbor Laboratory Press, Cold SpringHarbor, N.Y.
Bustamante, C. D., R. Nielsen, and D. L. Hartl. 2002. A maximumlikelihood method for analyzing pseudogene evolution: impli-cations for silent site evolution in humans and rodents. Mol.Biol. Evol. 19:110–117.
Caballero, A. 1994. Developments in the prediction of effectivepopulation size. Heredity 73:657–679.
Carbone, C., and J. L. Gittleman. 2002. A common rule for thescaling of carnivore density. Science 295:2273–2276.
Carroll, S. B., J. K. Grenier, and S. D. Weatherbee. 2001. FromDNA to diversity. Blackwell Science, Malden, Mass.
Castillo-Davis, C. I., S. L. Mekhedov, D. L. Hartl, E. V. Koonin,and F. A. Kondrashov. 2002. Selection for short introns inhighly expressed genes. Nat. Genet. 31:415–418.
Cavalier-Smith, T. 1991. Intron phylogeny: a new hypothesis.Trends Genet. 7:145–148.
———. 2005. Economy, speed and size matter: evolutionaryforces driving nuclear genome miniaturization and expansion.Ann. Bot. 95:147–175.
Cech, T. R. 1986. The generality of self-splicing RNA: relation-ship to nuclear mRNA splicing. Cell 44:207–210.
Chamary, J. V., and L. D. Hurst. 2004. Similar rates but differentmodes of sequence evolution in introns and at exonic silentsites in rodents: evidence for selectively driven codon usage.Mol. Biol. Evol. 21:1014–1023.
Collins, L., and D. Penny. 2005. Complex spliceosomal organi-zation ancestral to extant eukaryotes. Mol. Biol. Evol. 22:1053–1066.
Cooper, T. A., and W. Mattox. 1997. The regulation of splice-siteselection, and its role in human disease. Am. J. Hum. Genet.61:259–266.
Culbertson, M. R. 1999. RNA surveillance: unforeseen conse-quences for gene expression, inherited genetic disorders andcancer. Trends Genet. 15:74–80.
Dahlseid, J. N., J. Puziss, R. L. Shirley, A. L. Atkin, P. Hieter, andM. R. Culbertson. 1998. Accumulation of mRNA coding forthe ctf13p kinetochore subunit of Saccharomyces cerevisiae
depends on the same factors that promote rapid decay of non-sense mRNAs. Genetics 150:1019–1035.
Dai, L., and S. Zimmerly. 2002. Compilation and analysis ofgroup II intron insertions in bacterial genomes: evidence forretroelement behavior. Nucleic Acids Res. 30:1091–1102.
———. 2003. ORF-less and reverse-transcriptase-encodinggroup II introns in Archaebacteria, with a pattern of hominginto related group II intron ORFs. RNA 9:14–19.
Daly, M. J., J. D. Rioux, S. F. Schaffner, T. J. Hudson, andE. S. Lander. 2001. High-resolution haplotype structure inthe human genome. Nature Genet. 29:229–232.
Damuth, J. 1981. Population density and body size in mammals.Nature 290:699–700.
Daubin, V., and N. A. Moran. 2004. Comment on ‘‘the origins ofgenome complexity’’. Science 306:978.
Davidson, E. H. 2001. Genomic regulatory systems: developmentand evolution. Academic Press, San Diego, Calif.
Dawson, E., G. R. Abecasis, S. Bumpstead et al. (29 co-authors).2002. A first-generation linkage disequilibrium map of humanchromosome 22. Nature 418:544–548.
de Moor, C. H., and J. D. Richter. 2001. Translational control invertebrate development. Int. Rev. Cytol. 203:567–608.
Denver, D. R., K. Morris, M. Lynch, and W. K. Thomas. 2004.High mutation rate and dominance of length change mutationsin the nuclear genome of Caenorhabditis elegans. Nature430:679–682.
Dermitzakis, E. T., C. M. Bergman, and A. G. Clark. 2003. Trac-ing the evolutionary history of Drosophila regulatory regionswith models that identify transcription factor binding sites.Mol. Biol. Evol. 20:703–714.
Dermitzakis, E. T., and A. G. Clark. 2002. Evolution of transcrip-tion factor binding sites in Mammalian gene regulatoryregions: conservation and turnover. Mol. Biol. Evol. 19:1114–1121.
Desai, D., K. Zhang, S. Barik, A. Srivastava, M. E. Bolander, andG. Sarkar. 2004. Intragenic codon bias in a set of mouse andhuman genes. J. Theor. Biol. 230:215–225.
Diniz, J. A. F., and N. M. Torres. 2002. Phylogenetic comparativemethods and the geographic range size—body size relationshipin new world terrestrial Carnivora. Evol. Ecol. 16:351–367.
Drake, J. W. 1991. A constant rate of spontaneous mutationin DNA-based microbes. Proc. Natl. Acad. Sci. USA 88:7160–7164.
Edelman, G. M., R. Meech, G. C. Owens, and F. S. Jones. 2000.Synthetic promoter elements obtained by nucleotide sequencevariation and selection for activity. Proc. Natl. Acad. Sci. USA97:3038–3043.
Enquist, B. J., and K. J. Niklas. 2001. Invariant scaling relationsacross tree-dominated communities. Nature 410:655–660.
Fairbrother, W. G., R. F. Yeh, P. A. Sharp, and C. B. Burge. 2002.Predictive identification of exonic splicing enhancers in humangenes. Science 297:1007–1013.
Fedorov, A., X. Cao, S. Saxonov, S. J. de Souza, S. W. Roy, andW. Gilbert. 2001. Intron distribution difference for 276 ancientand 131 modern genes suggests the existence of ancientintrons. Proc. Natl. Acad. Sci. USA 98:13177–13182.
Feil, E. J., E. C. Holmes, D. E. Bessen et al. (12 co-authors). 2001.Recombination within natural populations of pathogenic bac-teria: short-term empirical estimates and long-term phyloge-netic consequences. Proc. Natl. Acad. Sci. USA 98:182–187.
Finlay, B. J. 2002. Global dispersal of free-living microbialeukaryote species. Science 296:1061–1063.
Finlay, B. J., G. F. Esteban, K. J. Clarke, and J. L. Olmo.2001. Biodiversity of terrestrial protozoa appears homoge-neous across local and global spatial scales. Protist 152:355–366.
Origins of Eukaryotic Gene Structure 465
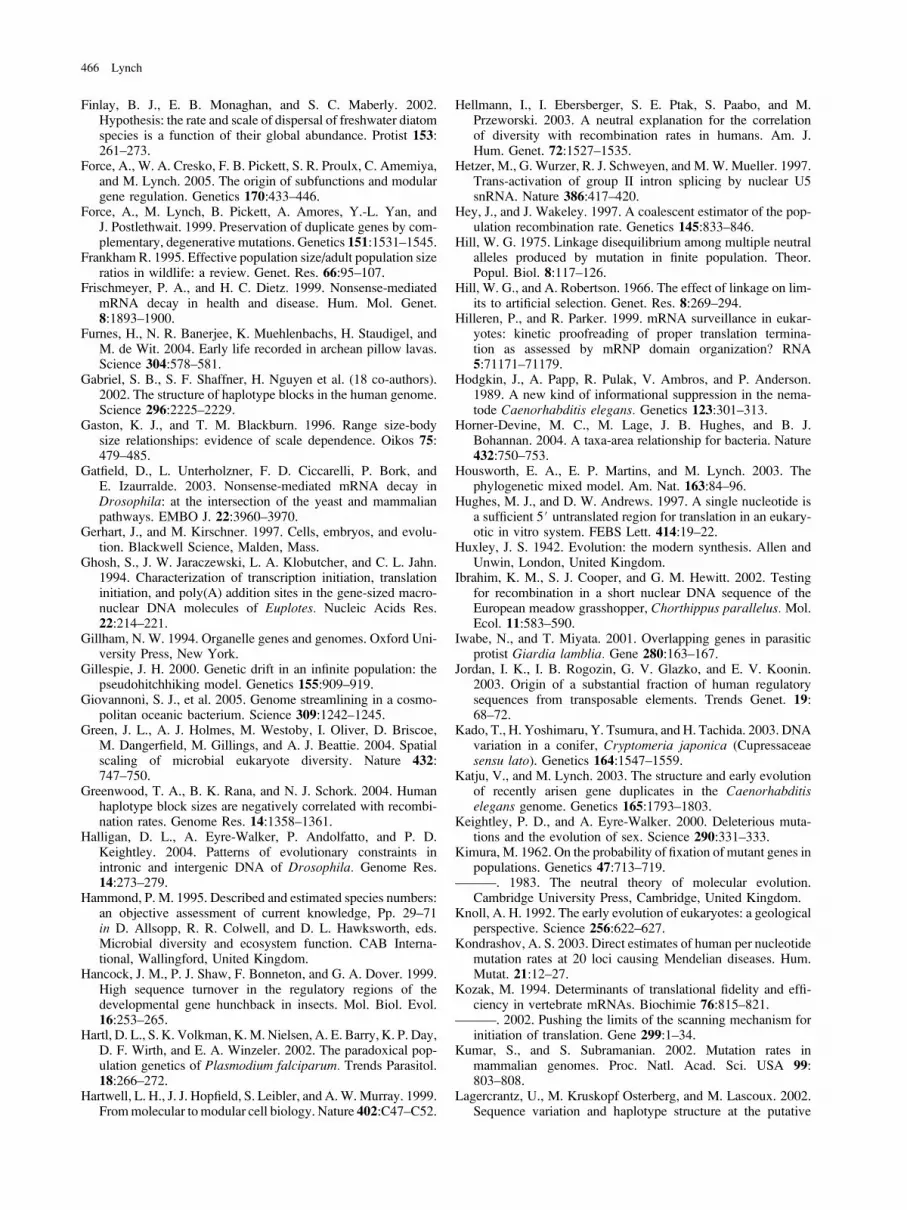
Finlay, B. J., E. B. Monaghan, and S. C. Maberly. 2002.Hypothesis: the rate and scale of dispersal of freshwater diatomspecies is a function of their global abundance. Protist 153:261–273.
Force, A., W. A. Cresko, F. B. Pickett, S. R. Proulx, C. Amemiya,and M. Lynch. 2005. The origin of subfunctions and modulargene regulation. Genetics 170:433–446.
Force, A., M. Lynch, B. Pickett, A. Amores, Y.-L. Yan, andJ. Postlethwait. 1999. Preservation of duplicate genes by com-plementary, degenerative mutations. Genetics 151:1531–1545.
Frankham R. 1995. Effective population size/adult population sizeratios in wildlife: a review. Genet. Res. 66:95–107.
Frischmeyer, P. A., and H. C. Dietz. 1999. Nonsense-mediatedmRNA decay in health and disease. Hum. Mol. Genet.8:1893–1900.
Furnes, H., N. R. Banerjee, K. Muehlenbachs, H. Staudigel, andM. de Wit. 2004. Early life recorded in archean pillow lavas.Science 304:578–581.
Gabriel, S. B., S. F. Shaffner, H. Nguyen et al. (18 co-authors).2002. The structure of haplotype blocks in the human genome.Science 296:2225–2229.
Gaston, K. J., and T. M. Blackburn. 1996. Range size-bodysize relationships: evidence of scale dependence. Oikos 75:479–485.
Gatfield, D., L. Unterholzner, F. D. Ciccarelli, P. Bork, andE. Izaurralde. 2003. Nonsense-mediated mRNA decay inDrosophila: at the intersection of the yeast and mammalianpathways. EMBO J. 22:3960–3970.
Gerhart, J., and M. Kirschner. 1997. Cells, embryos, and evolu-tion. Blackwell Science, Malden, Mass.
Ghosh, S., J. W. Jaraczewski, L. A. Klobutcher, and C. L. Jahn.1994. Characterization of transcription initiation, translationinitiation, and poly(A) addition sites in the gene-sized macro-nuclear DNA molecules of Euplotes. Nucleic Acids Res.22:214–221.
Gillham, N. W. 1994. Organelle genes and genomes. Oxford Uni-versity Press, New York.
Gillespie, J. H. 2000. Genetic drift in an infinite population: thepseudohitchhiking model. Genetics 155:909–919.
Giovannoni, S. J., et al. 2005. Genome streamlining in a cosmo-politan oceanic bacterium. Science 309:1242–1245.
Green, J. L., A. J. Holmes, M. Westoby, I. Oliver, D. Briscoe,M. Dangerfield, M. Gillings, and A. J. Beattie. 2004. Spatialscaling of microbial eukaryote diversity. Nature 432:747–750.
Greenwood, T. A., B. K. Rana, and N. J. Schork. 2004. Humanhaplotype block sizes are negatively correlated with recombi-nation rates. Genome Res. 14:1358–1361.
Halligan, D. L., A. Eyre-Walker, P. Andolfatto, and P. D.Keightley. 2004. Patterns of evolutionary constraints inintronic and intergenic DNA of Drosophila. Genome Res.14:273–279.
Hammond, P. M. 1995. Described and estimated species numbers:an objective assessment of current knowledge, Pp. 29–71in D. Allsopp, R. R. Colwell, and D. L. Hawksworth, eds.Microbial diversity and ecosystem function. CAB Interna-tional, Wallingford, United Kingdom.
Hancock, J. M., P. J. Shaw, F. Bonneton, and G. A. Dover. 1999.High sequence turnover in the regulatory regions of thedevelopmental gene hunchback in insects. Mol. Biol. Evol.16:253–265.
Hartl, D. L., S. K. Volkman, K.M. Nielsen, A. E. Barry, K. P. Day,D. F. Wirth, and E. A. Winzeler. 2002. The paradoxical pop-ulation genetics of Plasmodium falciparum. Trends Parasitol.18:266–272.
Hartwell, L. H., J. J. Hopfield, S. Leibler, and A.W.Murray. 1999.Frommolecular to modular cell biology. Nature 402:C47–C52.
Hellmann, I., I. Ebersberger, S. E. Ptak, S. Paabo, and M.Przeworski. 2003. A neutral explanation for the correlationof diversity with recombination rates in humans. Am. J.Hum. Genet. 72:1527–1535.
Hetzer, M., G. Wurzer, R. J. Schweyen, and M.W. Mueller. 1997.Trans-activation of group II intron splicing by nuclear U5snRNA. Nature 386:417–420.
Hey, J., and J. Wakeley. 1997. A coalescent estimator of the pop-ulation recombination rate. Genetics 145:833–846.
Hill, W. G. 1975. Linkage disequilibrium among multiple neutralalleles produced by mutation in finite population. Theor.Popul. Biol. 8:117–126.
Hill, W. G., and A. Robertson. 1966. The effect of linkage on lim-its to artificial selection. Genet. Res. 8:269–294.
Hilleren, P., and R. Parker. 1999. mRNA surveillance in eukar-yotes: kinetic proofreading of proper translation termina-tion as assessed by mRNP domain organization? RNA5:71171–71179.
Hodgkin, J., A. Papp, R. Pulak, V. Ambros, and P. Anderson.1989. A new kind of informational suppression in the nema-tode Caenorhabditis elegans. Genetics 123:301–313.
Horner-Devine, M. C., M. Lage, J. B. Hughes, and B. J.Bohannan. 2004. A taxa-area relationship for bacteria. Nature432:750–753.
Housworth, E. A., E. P. Martins, and M. Lynch. 2003. Thephylogenetic mixed model. Am. Nat. 163:84–96.
Hughes, M. J., and D. W. Andrews. 1997. A single nucleotide isa sufficient 5# untranslated region for translation in an eukary-otic in vitro system. FEBS Lett. 414:19–22.
Huxley, J. S. 1942. Evolution: the modern synthesis. Allen andUnwin, London, United Kingdom.
Ibrahim, K. M., S. J. Cooper, and G. M. Hewitt. 2002. Testingfor recombination in a short nuclear DNA sequence of theEuropean meadow grasshopper, Chorthippus parallelus. Mol.Ecol. 11:583–590.
Iwabe, N., and T. Miyata. 2001. Overlapping genes in parasiticprotist Giardia lamblia. Gene 280:163–167.
Jordan, I. K., I. B. Rogozin, G. V. Glazko, and E. V. Koonin.2003. Origin of a substantial fraction of human regulatorysequences from transposable elements. Trends Genet. 19:68–72.
Kado, T., H. Yoshimaru, Y. Tsumura, and H. Tachida. 2003. DNAvariation in a conifer, Cryptomeria japonica (Cupressaceaesensu lato). Genetics 164:1547–1559.
Katju, V., and M. Lynch. 2003. The structure and early evolutionof recently arisen gene duplicates in the Caenorhabditiselegans genome. Genetics 165:1793–1803.
Keightley, P. D., and A. Eyre-Walker. 2000. Deleterious muta-tions and the evolution of sex. Science 290:331–333.
Kimura, M. 1962. On the probability of fixation of mutant genes inpopulations. Genetics 47:713–719.
———. 1983. The neutral theory of molecular evolution.Cambridge University Press, Cambridge, United Kingdom.
Knoll, A. H. 1992. The early evolution of eukaryotes: a geologicalperspective. Science 256:622–627.
Kondrashov, A. S. 2003. Direct estimates of human per nucleotidemutation rates at 20 loci causing Mendelian diseases. Hum.Mutat. 21:12–27.
Kozak, M. 1994. Determinants of translational fidelity and effi-ciency in vertebrate mRNAs. Biochimie 76:815–821.
———. 2002. Pushing the limits of the scanning mechanism forinitiation of translation. Gene 299:1–34.
Kumar, S., and S. Subramanian. 2002. Mutation rates inmammalian genomes. Proc. Natl. Acad. Sci. USA 99:803–808.
Lagercrantz, U., M. Kruskopf Osterberg, and M. Lascoux. 2002.Sequence variation and haplotype structure at the putative
466 Lynch
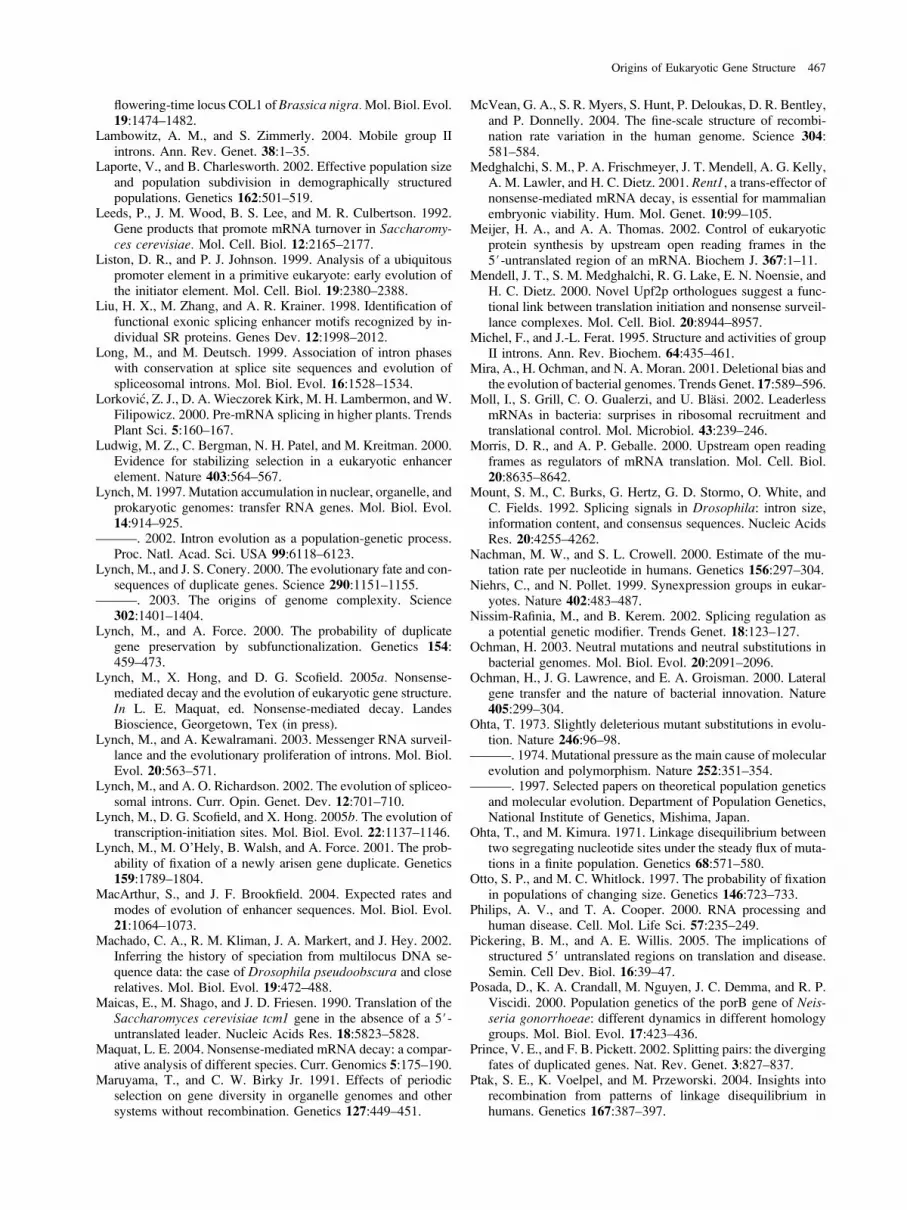
flowering-time locus COL1 of Brassica nigra.Mol. Biol. Evol.19:1474–1482.
Lambowitz, A. M., and S. Zimmerly. 2004. Mobile group IIintrons. Ann. Rev. Genet. 38:1–35.
Laporte, V., and B. Charlesworth. 2002. Effective population sizeand population subdivision in demographically structuredpopulations. Genetics 162:501–519.
Leeds, P., J. M. Wood, B. S. Lee, and M. R. Culbertson. 1992.Gene products that promote mRNA turnover in Saccharomy-ces cerevisiae. Mol. Cell. Biol. 12:2165–2177.
Liston, D. R., and P. J. Johnson. 1999. Analysis of a ubiquitouspromoter element in a primitive eukaryote: early evolution ofthe initiator element. Mol. Cell. Biol. 19:2380–2388.
Liu, H. X., M. Zhang, and A. R. Krainer. 1998. Identification offunctional exonic splicing enhancer motifs recognized by in-dividual SR proteins. Genes Dev. 12:1998–2012.
Long, M., and M. Deutsch. 1999. Association of intron phaseswith conservation at splice site sequences and evolution ofspliceosomal introns. Mol. Biol. Evol. 16:1528–1534.
Lorkovic, Z. J., D. A. Wieczorek Kirk, M. H. Lambermon, andW.Filipowicz. 2000. Pre-mRNA splicing in higher plants. TrendsPlant Sci. 5:160–167.
Ludwig, M. Z., C. Bergman, N. H. Patel, and M. Kreitman. 2000.Evidence for stabilizing selection in a eukaryotic enhancerelement. Nature 403:564–567.
Lynch, M. 1997. Mutation accumulation in nuclear, organelle, andprokaryotic genomes: transfer RNA genes. Mol. Biol. Evol.14:914–925.
———. 2002. Intron evolution as a population-genetic process.Proc. Natl. Acad. Sci. USA 99:6118–6123.
Lynch, M., and J. S. Conery. 2000. The evolutionary fate and con-sequences of duplicate genes. Science 290:1151–1155.
———. 2003. The origins of genome complexity. Science302:1401–1404.
Lynch, M., and A. Force. 2000. The probability of duplicategene preservation by subfunctionalization. Genetics 154:459–473.
Lynch, M., X. Hong, and D. G. Scofield. 2005a. Nonsense-mediated decay and the evolution of eukaryotic gene structure.In L. E. Maquat, ed. Nonsense-mediated decay. LandesBioscience, Georgetown, Tex (in press).
Lynch, M., and A. Kewalramani. 2003. Messenger RNA surveil-lance and the evolutionary proliferation of introns. Mol. Biol.Evol. 20:563–571.
Lynch, M., and A. O. Richardson. 2002. The evolution of spliceo-somal introns. Curr. Opin. Genet. Dev. 12:701–710.
Lynch, M., D. G. Scofield, and X. Hong. 2005b. The evolution oftranscription-initiation sites. Mol. Biol. Evol. 22:1137–1146.
Lynch, M., M. O’Hely, B. Walsh, and A. Force. 2001. The prob-ability of fixation of a newly arisen gene duplicate. Genetics159:1789–1804.
MacArthur, S., and J. F. Brookfield. 2004. Expected rates andmodes of evolution of enhancer sequences. Mol. Biol. Evol.21:1064–1073.
Machado, C. A., R. M. Kliman, J. A. Markert, and J. Hey. 2002.Inferring the history of speciation from multilocus DNA se-quence data: the case of Drosophila pseudoobscura and closerelatives. Mol. Biol. Evol. 19:472–488.
Maicas, E., M. Shago, and J. D. Friesen. 1990. Translation of theSaccharomyces cerevisiae tcm1 gene in the absence of a 5#-untranslated leader. Nucleic Acids Res. 18:5823–5828.
Maquat, L. E. 2004. Nonsense-mediated mRNA decay: a compar-ative analysis of different species. Curr. Genomics 5:175–190.
Maruyama, T., and C. W. Birky Jr. 1991. Effects of periodicselection on gene diversity in organelle genomes and othersystems without recombination. Genetics 127:449–451.
McVean, G. A., S. R. Myers, S. Hunt, P. Deloukas, D. R. Bentley,and P. Donnelly. 2004. The fine-scale structure of recombi-nation rate variation in the human genome. Science 304:581–584.
Medghalchi, S. M., P. A. Frischmeyer, J. T. Mendell, A. G. Kelly,A. M. Lawler, and H. C. Dietz. 2001. Rent1, a trans-effector ofnonsense-mediated mRNA decay, is essential for mammalianembryonic viability. Hum. Mol. Genet. 10:99–105.
Meijer, H. A., and A. A. Thomas. 2002. Control of eukaryoticprotein synthesis by upstream open reading frames in the5#-untranslated region of an mRNA. Biochem J. 367:1–11.
Mendell, J. T., S. M. Medghalchi, R. G. Lake, E. N. Noensie, andH. C. Dietz. 2000. Novel Upf2p orthologues suggest a func-tional link between translation initiation and nonsense surveil-lance complexes. Mol. Cell. Biol. 20:8944–8957.
Michel, F., and J.-L. Ferat. 1995. Structure and activities of groupII introns. Ann. Rev. Biochem. 64:435–461.
Mira, A., H. Ochman, and N. A. Moran. 2001. Deletional bias andthe evolution of bacterial genomes. Trends Genet. 17:589–596.
Moll, I., S. Grill, C. O. Gualerzi, and U. Blasi. 2002. LeaderlessmRNAs in bacteria: surprises in ribosomal recruitment andtranslational control. Mol. Microbiol. 43:239–246.
Morris, D. R., and A. P. Geballe. 2000. Upstream open readingframes as regulators of mRNA translation. Mol. Cell. Biol.20:8635–8642.
Mount, S. M., C. Burks, G. Hertz, G. D. Stormo, O. White, andC. Fields. 1992. Splicing signals in Drosophila: intron size,information content, and consensus sequences. Nucleic AcidsRes. 20:4255–4262.
Nachman, M. W., and S. L. Crowell. 2000. Estimate of the mu-tation rate per nucleotide in humans. Genetics 156:297–304.
Niehrs, C., and N. Pollet. 1999. Synexpression groups in eukar-yotes. Nature 402:483–487.
Nissim-Rafinia, M., and B. Kerem. 2002. Splicing regulation asa potential genetic modifier. Trends Genet. 18:123–127.
Ochman, H. 2003. Neutral mutations and neutral substitutions inbacterial genomes. Mol. Biol. Evol. 20:2091–2096.
Ochman, H., J. G. Lawrence, and E. A. Groisman. 2000. Lateralgene transfer and the nature of bacterial innovation. Nature405:299–304.
Ohta, T. 1973. Slightly deleterious mutant substitutions in evolu-tion. Nature 246:96–98.
———. 1974. Mutational pressure as the main cause of molecularevolution and polymorphism. Nature 252:351–354.
———. 1997. Selected papers on theoretical population geneticsand molecular evolution. Department of Population Genetics,National Institute of Genetics, Mishima, Japan.
Ohta, T., and M. Kimura. 1971. Linkage disequilibrium betweentwo segregating nucleotide sites under the steady flux of muta-tions in a finite population. Genetics 68:571–580.
Otto, S. P., and M. C. Whitlock. 1997. The probability of fixationin populations of changing size. Genetics 146:723–733.
Philips, A. V., and T. A. Cooper. 2000. RNA processing andhuman disease. Cell. Mol. Life Sci. 57:235–249.
Pickering, B. M., and A. E. Willis. 2005. The implications ofstructured 5# untranslated regions on translation and disease.Semin. Cell Dev. Biol. 16:39–47.
Posada, D., K. A. Crandall, M. Nguyen, J. C. Demma, and R. P.Viscidi. 2000. Population genetics of the porB gene of Neis-seria gonorrhoeae: different dynamics in different homologygroups. Mol. Biol. Evol. 17:423–436.
Prince, V. E., and F. B. Pickett. 2002. Splitting pairs: the divergingfates of duplicated genes. Nat. Rev. Genet. 3:827–837.
Ptak, S. E., K. Voelpel, and M. Przeworski. 2004. Insights intorecombination from patterns of linkage disequilibrium inhumans. Genetics 167:387–397.
Origins of Eukaryotic Gene Structure 467

Qiu, W. G., N. Schisler, and A. Stoltzfus. 2004. The evolutionarygain of spliceosomal introns: sequence and phase preferences.Mol. Biol. Evol. 21:1252–1263.
Raff, R. A. 1996. The shape of life. University Chicago Press,Chicago, Ill.
Reich, D. E., et al. 2001. Linkage disequilibrium in the humangenome. Nature 411:199–204.
Rest, J. S., and D. P. Mindell. 2003. Retroids in Archaea: phylog-eny and lateral origins. Mol. Biol. Evol. 20:1134–1142.
Rockman, M. V., and G. A. Wray. 2002. Abundant raw materialfor cis-regulatory evolution in humans. Mol. Biol. Evol.19:1991–2004.
Rogozin, I. B., A. V. Kochetov, F. A. Kondrashov, E. V. Koonin,and L. Milanesi. 2001. Presence of ATG triplets in 5# untrans-lated regions of eukaryotic cDNAs correlates with a �weak�context of the start codon. Bioinformatics 17:890–900.
Rogozin, I. B., Y. I. Wolf, A. V. Sorokin, B. G. Mirkin,and E. V. Koonin. 2003. Remarkable interkingdom con-servation of intron positions and massive, lineage-specificintron loss and gain in eukaryotic evolution. Curr. Biol.13:1512–1517.
Rousset, F. 2003. Effective size in simple metapopulation models.Heredity 91:107–111.
Roy, S. W., and W. Gilbert. 2005a. Complex early genes. Proc.Natl. Acad. Sci. USA 102:1986–1991.
———. 2005b. Rates of intron loss and gain: implications forearly eukaryotic evolution. Proc. Natl. Acad. Sci. USA102:5773–5778.
Ruiz-Echevarria, M. J., C. I. Gonzalez, and S. W. Peltz. 1998.Identifying the right stop: determining how the surveillancecomplex recognizes and degrades an aberrant mRNA. EMBOJ. 17:575–589.
Sarkar, S. F., and D. S. Guttman. 2004. Evolution of the core ge-nome of Pseudomonas syringae, a highly clonal, endemicplant pathogen. Appl. Environ. Microbiol. 70:1999–2012.
Schaal, T. D., and T. Maniatis. 1999. Selection and characteriza-tion of pre-mRNA splicing enhancers: identification of novelSR protein-specific enhancer sequences. Mol. Cell. Biol.19:1705–1719.
Schmid, P. E., M. Tokeshi, and J. M. Schmid-Araya. 2000.Relation between population density and body size in streamcommunities. Science 289:1557–1560.
Sharp, P. A. 1985. On the origin of RNA splicing and introns.Cell 42:397–400.
Sharp, P. M., E. Bailes, R. J. Grocock, J. F. Peden, and R. E.Sockett. 2005. Variation in the strength of selected codonusage bias among bacteria. Nucleic Acids Res. 33:1141–1153.
Shaw, P. J., N. S. Wratten, A. P. McGregor, and G. A. Dover.2002. Coevolution in bicoid-dependent promoters and the in-ception of regulatory incompatibilities among species of higherDiptera. Evol. Dev. 4:265–277.
Shukla, G. C., and R. A. Padgett. 2002. A catalytically activegroup II intron domain 5 can function in the U12-dependentspliceosome. Mol. Cell 9:1145–1150.
Singh, U., J. B. Rogers, B. J. Mann, and W. A. Petri Jr. 1997.Transcription initiation is controlled by three core pro-moter elements in the hgl5 gene of the protozoan parasiteEntamoeba histolytica. Proc. Natl. Acad. Sci. USA 94:8812–8817.
Slupska, M. M., A. G. King, S. Fitz-Gibbon, J. Besemer, M.Borodovsky, and J. H. Miller. 2001. Leaderless transcriptsof the crenarchaeal hyperthermophile Pyrobaculum aerophi-lum. J. Mol. Biol. 309:347–360.
Sontheimer, E. J., P. M. Gordon, and J. A. Piccirilli. 1999. Metalion catalysis during group II intron self-splicing: parallels withthe spliceosome. Genes Dev. 13:1729–1741.
Stoltzfus, A. 1999. On the possibility of constructive neutral evo-lution. J. Mol. Evol. 49:169–181.
Stone, J. R., and G. A. Wray. 2001. Rapid evolution of cis-regulatory sequences via local point mutations. Mol. Biol.Evol. 18:1764–1770.
Taanman, J. W. 1999. The mitochondrial genome: structure, tran-scription, translation and replication. Biochim. Biophys. Acta1410:103–123.
Tenaillon, M. I., J. U’Ren, O. Tenaillon, and B. S. Gaut. 2004.Selection versus demography: a multilocus investigation ofthe domestication process in maize. Mol. Biol. Evol.21:1214–1225.
Valadkhan, B., and J. L. Manley. 2002. Intrinsic metal binding bya spliceosomal RNA. Nat. Struct. Biol. 9:498–499.
van den Heuvel, J. J., R. J. Bergkamp, R. J. Planta, and H. A. Raue.1989. Effect of deletions in the 5#-noncoding region on thetranslational efficiency of phosphoglycerate kinase mRNAin yeast. Gene 79:83–95.
Vilela, C., and J. E. McCarthy. 2003. Regulation of fungal geneexpression via short open reading frames in the mRNA 5# un-translated region. Mol. Microbiol. 49:859–867.
von Dassow, G., and E. Monro. 1999. Modularity in animal de-velopment and evolution: elements of a conceptual frameworkfor evo-devo. J. Exp. Zool. 285:307–325.
Wagner, A. 1999. Redundant gene functions and natural selection.J. Evol. Biol. 12:1–16.
———. 2001. Birth and death of duplicated genes in completelysequenced eukaryotes. Trends Genet. 17:237–239.
———. 2005. Energy constraints on the evolution of gene expres-sion. Mol. Biol. Evol. 22:1365–1374.
Wagner, G. P. 1996. Homologues, natural kinds and the evolutionof modularity. Am. Zool. 36:36–43.
Wagner, G. P., and L. Altenberg. 1996. Complex adaptations andthe evolution of evolvability. Evolution 50:967–976.
Weiner, J. III., R. Herrmann, and G. F. Browning. 2000. Tran-scription in Mycoplasma pneumoniae. Nucleic Acids Res.28:4488–4496.
Whitlock, M. C. 2003. Fixation probability and time in subdividedpopulations. Genetics 164:767–779.
Whitlock, M. C., and N. H. Barton. 1997. The effective size ofa subdivided population. Genetics 146:427–441.
Whitman, W. B., D. C. Coleman, and W. J. Wiebe. 1998. Prokar-yotes: the unseen majority. Proc. Natl. Acad. Sci. USA95:6578–6583.
Wray, G. A., M. W. Hahn, E. Abouheif, J. P. Balhoff, M. Pizer,M. V. Rockman, and L. A. Romano. 2003. The evolution oftranscriptional regulation in eukaryotes. Mol. Biol. Evol. 20:1377–1419.
Wright, S. I., B. Lauga, and D. Charlesworth. 2003. Subdivisionand haplotype structure in natural populations of Arabidopsislyrata. Mol. Ecol. 12:1247–1263.
Yee, J., M. R. Mowatt, P. P. Dennis, and T. E. Nash. 2000. Tran-scriptional analysis of the glutamate dehydrogenase gene in theprimitive eukaryote, Giardia lamblia. Identification of a pri-mordial gene promoter. J. Biol. Chem. 275:11432–11439.
Yuh, C. H., H. Bolouri, and E. H. Davidson. 1998. Genomic cis-regulatory logic: experimental and computational analysis ofa sea urchin gene. Science 279:1896–1902.
Zuckerkandl, E. 2001. Intrinsically driven changes in gene inter-action complexity. I. Growth of regulatory complexes andincrease in number of genes. J. Mol. Evol. 53:539–554.
William Martin, Associate Editor
Accepted October 19, 2005
468 Lynch


