Embed Size (px)
Citation preview

405
Mohan C. Vemuri et al. (eds.), Mesenchymal Stem Cell Assays and Applications, Methods in Molecular Biology, vol. 698,DOI 10.1007/978-1-60761-999-4_29, © Springer Science+Business Media, LLC 2011
Chapter 29
Transcriptome Analysis of Common Gene Expression in Human Mesenchymal Stem Cells Derived from Four Different Origins
Tzu-Hao Wang, Yun-Shien Lee, and Shiaw-Min Hwang
Abstract
We have used Affymetrix oligonucleotide microarrays to analyze common transcriptomes and thereby learn about the core gene expression profile in human mesenchymal stem cells (MSC) from different tissues, including fetal amniotic fluid-derived MSC, term pregnancy amniotic membrane-derived MSC, term pregnancy umbilical cord blood-derived MSC, and adult bone marrow-derived MSC. The beauty of microarray analysis of gene expression (MAGE) is that it can be used to discover associating genes that were previously thought to be unrelated to a physiological or pathological event. However, interpreting complex biological processes from gene expression profiles often requires extensive knowledge mining in biomedical literature. In this chapter, we describe, step-by-step, how to use a commercially available biological database and software program, MetaCore (GeneGo Inc.), for functional network analysis.
Key words: Mesenchymal stem cells, Amniotic fluid, Amniotic membrane, Cord blood, Bone marrow, Functional network analysis, Metacore (GeneGo)
Multipotent mesenchymal stem cells (MSC) found in many adult and fetal tissues are a promising source of cells for tissue engineering and cell-based therapeutics due to their extensive capability of self-renewal and multi-lineage differentiation potential. However, the characteristics of MSC are still not equivocal, especially in their differentiation tendencies and plasticity (1, 2). The increasing interest in MSC for biological and clinical application has prompted the International Society for Cellular Therapy (ISCT) to propose the minimal criteria for defining human MSC as follows: MSC should (a) be plastic-adherent, (b) express CD73, CD90, and CD105, and lack expression of CD45, CD34, CD14 or
1. Introduction

406 Wang, Lee, and Hwang
CD11bm CD79a or CD19, and HLA-DR surface molecules, and (c) differentiate to osteoblasts, adipocytes, and chondroblasts in vitro (3). The molecular level of characterization for MSC is in need of further clarification. In this study, we focused on the core gene expression profiles of MSC from different tissues, including fetal amniotic fluid-derived MSC, termed amniotic membrane-derived MSC, termed umbilical cord blood-derived MSC, and adult bone marrow-derived MSC.
One major benefit of microarray analysis of gene expression (MAGE) is that it can be used to discover associating genes that were previously thought to be unrelated to a physiological or pathological event (4). On the other hand, it is a daunting chal-lenge to interpret complex biological processes from such a long list of genes, of which their known functions may be seemingly unrelated to one another. To deal with these difficulties, knowl-edge mining throughout biomedical literature is essential and database-dependent bioinformatics research has proved instru-mental (5–7). More recently, we have used this type of approach to gain insight into individual and common gene expression pro-files of various human mesenchymal stem cells derived from amni-otic fluid, amniotic membrane, cord blood, and bone marrow (8) as well as gene expression response in cervical cancer patients undergoing concurrent chemoradiation therapy (9).
In the following sections, we describe, step-by-step, how to use a commercially available biological database and software, MetaCore (GeneGo, Inc.), for functional network analysis. In the demonstrated example (8), we have learned that a set of core gene expression profiles was preserved in four kinds of MSCs. The core signature transcriptomes of all MSCs, when compared with those of 6-week-old fetal organs, included genes that were mainly involved in the regulation of extracellular matrix and adhe-sion, whereas the genes common to all MSC were the least involved in cell division and system development.
1. Mesenchymal stem cells were obtained from the Bioresource Collection and Research Center (BCRC, http://www.bcrc.firdi.org.tw/wwwbcrc/index.jsp), Taiwan. The samples included human amniotic fluid-derived (AF) MSC, amniotic membrane-derived (AM) MSC, umbilical cord blood-derived (CB) MSC, and bone marrow-derived (BM) MSC.
2. Culture medium: a-modified minimum essential medium (a-MEM, Hyclone, Logan, UT, USA) supplemented with 20% fetal bovine serum (FBS, Hyclone) and 4 ng/ml basic
2. Materials
2.1. Culture of Mesenchymal Stem Cells

407Transcriptome Analysis in MSC
fibroblast growth factor (bFGF, R&D System, Minneapolis, MN, USA).
3. Trypsin–EDTA (Invitrogen, Carlsbad, CA, USA). 4. Tissue culture flasks, 75 cm2 (Corning, Corning, NY, USA).
1. TRIZOL reagent (Invitrogen, Carlsbad, CA). 2. RNeasy purification kit (Qiagen, Valencia, CA). 3. Total RNA from human fetal tissues (ViroGen, Watertown,
MA). 4. Bioanalyzer 2100 (Agilent Technologies, Palo Alto, CA). 5. Human U133A GeneChip (Affymetrix, Santa Clara, CA).
1. Download (http://www.genego.com/productTrials.php) and complete the trial paperwork agreement to obtain a free 2-week trial.
2. List MetaCore as the one to be tried and fax the paperwork to the United States phone number: (760) 479 2059.
3. Once GeneGo, Inc., receives your paperwork, it will be processed and an URL and access passwords will be emailed to you. All trials are fully supported by customer support.
1. Frozen MSC of four different tissues were obtained from the cell bank of BCRC, including AF MSC, AM MSC, CB MSC, and BM MSC. These cells were characterized as MSC following the criteria of ISCT (1, 8).
2. All MSC were cultured in 75 cm2 flasks with a-MEM plus 20% FBS, 4 ng/ml bFGF, and incubated at 37°C in a humid-ified atmosphere with 5% CO2. Cells were kept at 90% conflu-ence before passage or RNA extraction.
1. At 90% confluence, the MSCs were briefly rinsed with ice-cold PBS and lysed in TRIZOL reagent for RNA extraction.
2. Total RNA was further purified using the RNeasy purification kit.
3. Total RNA specimens of human fetal brain, heart, lung, liver, kidney, and muscle at the sixth gestational week were obtained from ViroGen, Inc.
4. RNA quality and quantity were confirmed using the Bioanalyzer 2100.
2.2. RNA Extraction, Quality Analysis, and Microarray Analysis
2.3. MetaCore (http://www.genego.com/metacore.php)
3. Methods
3.1. Culture of Multipotent Mesenchymal Stem Cells
3.2. RNA Extraction and Affymetrix Microarray Analysis for Gene Expression

408 Wang, Lee, and Hwang
5. Gene expression profiles in MSCs and early fetal tissues were analyzed with the human U133A GeneChip and the manu-facturer’s protocol was strictly followed.
6. The GeneChip data were analyzed using the GeneChip Operating Software (GCOS) version 4.1.
1. Normalize all Affymetrix data and save the results in Excel files. In this example, we compared twenty MSC samples and six 6-week-old fetal organs, as previously reported (see Note 1) (8).
2. Do an appropriate statistical analysis to compare the two groups of genes (see Note 2).
3. Apply a nonstringent P value (P < 0.05) to select the differ-ently expressed genes between two groups.
4. Rank the list of genes according to fold changes, from large to small.
5. Select the top ranked gene number of appropriate size (see Note 3). For example, select and copy 100 top-ranked Affymetrix probe sets, displayed as “202627_s_at,” to be pasted into the MetaCore text data space (see Subheading 3.4, step 3).
6. Similarly, select the bottom ranked genes of appropriate size, representing those were least expressed in MSC than in dif-ferentiated fetal organs (see Note 4).
1. Following the instructions provided by GeneGo’s technical support, connect to the MetaCore website.
2. Activate “Signaling networks” in MetaCore. In the example, we used MetaCore (version 4.5, build 11165) for functional network visualization and analysis.
3. Select “Draw from the list,” and paste the copied list of Affymetrix probe sets into the “Create list manually” text data space, and select “Parse.”
4. Check to make sure that all Affymetrix probe sets correspond to a gene (network object), then activate “Add selected objects.”
5. Activate “Select all” of network objects, and then “Build network for selected objects.”
6. Select “Analyze network,” and “Build network.” 7. On the page of Network list, examine how many networks
are derived. 8. Double click “Target,” and the list will be ranked with the
network that contains the highest number of targets (i.e., the genes in your input list) on the top.
9. Activate “Open” the first network on top of the list. 10. Click the “Show” tab, select “Root Object” to show target
objects in the network and “Loc line.”
3.3. Identification of MSC Unique Gene Expression Profiles
3.4. Database-Dependent Analysis of Potential Functional Networks
409Transcriptome Analysis in MSC
11. Click “View Options” and select “Loc mode” to rearrange the network according to the localization of each genes in extracellular membrane, cytoplasm, nucleus, or unspecified compartments.
12. Drag the genes around to visualize all genes clearly. Be careful not to drag them out of their original compartment.
13. When “Hint” is selected under the “Show” tab, place the cursor at the gene of interest to show its description in a balloon.
14. When “Effect” is selected under the “Show” tab, just place the cursor at the effect marker to show the interactions (such as activation or inhibition) between two objects in a balloon.
15. Click an “Effect” icon of specific interest, a new window of references (Link) appears. This can be used to directly con-nect to the PubMed database for viewing summaries of refer-ence papers.
16. After examining the interaction using the “Effect” option, deselect “Effect” for a clearer view of the network.
17. Click “Processes” to see the main functions that genes in this network are involved in.
1. To avoid generating biased weight by the same MSC sample, data from three samples of the same MSC at different passage times were averaged and considered as one, resulting in a total of 12 MSC samples from four different origin (8). Nonparametric Mann–Whitney U test was performed between 12 MSC samples and six fetal organ samples (8).
2. A fold-change ranking method with a P-value cutoff <0.05 has been shown to be reproducible in selecting the signature gene list from results using different microarray platforms (10). These selecting criteria have been shown to be more reproducible than t-test P value or significance analysis of microarrays (SAM) (10). We applied a nonstringent P value (P < 0.05) to select genes of significant different expression levels between MSC and fetal organs. Then we ranked the list of genes, from large to small, by the fold changes between MSC and fetal organs (8).
3. In the demonstration example (8), we selected the top 100 ranked genes, which represented the upregulated expression in MSC, to be analyzed using MetaCore. Among 100 probe sets, 72 genes (see Table 1) were found to participate in signaling networks of that build by MetaCore. All of them were selected
4. Notes

410 Wang, Lee, and Hwang
Table 1 Upregulated genes in mesenchymal stem cells compared with fetal tissues
5¢-NTD ENO1 PBR
PHLDA1
Activin FHL2 PLAT (TPA)
Activin A Fibronectin PLAU (UPA)
Activin beta A FoxD1 PLAUR (uPAR)
ADAM9 PLOD2
Alpha-actinin 1 Galectin-1 PTRF
AMIGO2 GLIPR PTX3
Annexin I Gremlin
Annexin II RGS4
IEX1
Beta-IG-H3 IL-6 Serglycin
IL-8 SERPINE2
Calcyclin SH3BGRL3
Caldesmon KDELR Stanniocalcin 2
Calgizzarin LIF TAGLN2
Calumenin LOXL1 TFPI-2
Caveolin-1 LOXL2 Thrombospondin 1
Caveolin-2 Lysyl oxidase TIMP1
CCL2 TM4SF1 (TAAL6)
CD44 MafF Transgelin
CD59 MCFD2
CLIC4 MICAL2 Tropomyosin-2
CTGF MMP-1 Tropomyosin-4
Cyr61 Myoferlin TSSC3
DKK1 NNMT UDP-N-acetylhexosamine pyrophosphorylase
NQO1
EMP3 VEGF-C
ENO PAI1
411Transcriptome Analysis in MSC
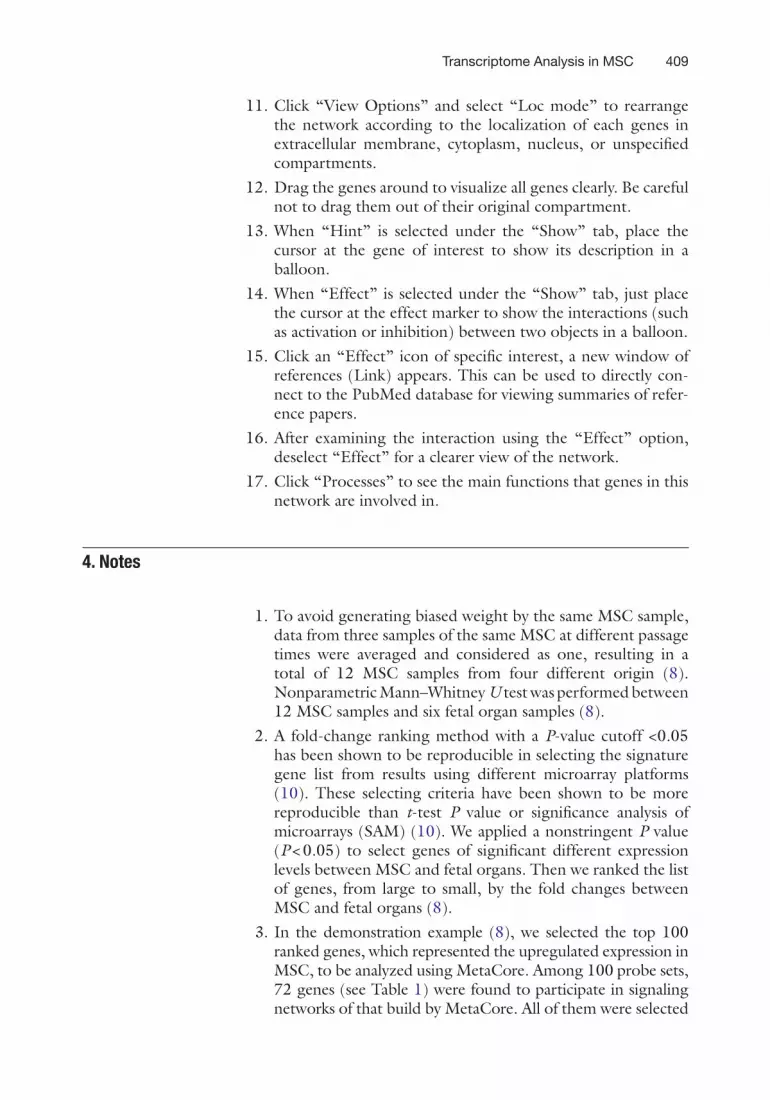
to build networks. Using the “Analyze network” function, 25 networks were built. The top network, represented by fibronec-tin, MMP-1, CD44, TIMP1, CCL2, etc., contained 15 target objects (root genes) in a 50-gene network, with the least P value being 4.71 × 10⁻²⁷, and the highest z-score of 38.78 (see Note 5). Notably, 13 genes from the original list were local-ized in the extracellular compartment of this network (see Fig. 1). The main processes of the top network were as follows: response to external stimuli, chemotaxis, response to wound-ing, biological adhesion, cell adhesion, cell motility, and local-ization of cell (see Table 2). The second network, containing 13 root objects (i.e., genes from the input list), was repre-sented with PAI1, Gremlin, activin beta A, PLAU, and ENO1 (see Fig. 2). This network, which contained 5 genes in the extracellular compartment and 5 genes in the cytosolic com-partment, was involved in biological processes such as signal transduction, differentiation, and development (see Table 3).
4. To detect what genes were least expressed in mesenchymal stem cells, we selected bottom 100 ranked genes to be analyzed using MetaCore. Among the 100 Affymetrix probe sets, 75 genes (see Table 4) were found in signaling networks of
Fig. 1. Functional network of 15 genes (marked with solid grey circles) that were upregulated in all four types of MSCs, when compared with six 6-week-old fetal organs.

412 Wang, Lee, and Hwang
Table 2 Biological processes that might be related to the 15 genes displayed in Fig. 1
Process % P value (↓)
Response to external stimulus 41.30 9.066e-10
Taxis 21.74 4.844e-09
Chemotaxis 21.74 4.844e-09
Response to wounding 32.61 8.064e-09
Biological adhesion 32.61 3.989e-08
Cell adhesion 32.61 3.989e-08
Cell mobility 32.61 4.515e-08
Localization of cell 32.61 4.515e-08
Proteolysis 26.09 1.283e-07
Blood vessel development 21.74 3.100e-07
Locomotory behavior 21.74 3.479e-07
Vasculature development 21.74 3.614e-07
Fig. 2. Functional network of 13 genes (marked with solid grey circles) that were upregulated in all four types of MSCs, when compared with six 6-week-old fetal organs.

413Transcriptome Analysis in MSC
Table 3 Biological processes that might be related to the 13 genes displayed in Fig. 2
Process % P value (↓)
Transmembrane receptor protein serine/threonine kinase signaling pathway
25.64 1.049e-11
Organ development 58.97 1.198e-08
Negative regulation of biological process 51.28 3.066e-08
Regulation of cell differentiation 25.64 3.096e-08
Negative regulation of cellular process 48.72 7.671e-08
Regulation of developmental differentiation 28.21 9.284e-08
Tissue development 30.77 9.946e-08
Enzyme linked receptor protein signaling pathway 28.21 1.189e-07
Anatomical structure development 66.67 1.298e-07
System development 61.54 2.216e-07
Anatomical structure morphogenesis 48.72 2.412e-07
Transforming growth factor beta receptor signaling pathway 15.38 3.683e-07
the build 11165 of MetaCore version 4.5. Using “Analyze network” function, 17 networks were built. The top network (see Fig. 3), represented by DAPK1, IGF-2, Reelin, Glypican-3, selenoprotein-P, etc., contained nine target objects (root genes) in a 50-gene network, with the lowest P value being 4.10 × 10⁻¹⁵, and the highest z-score of 25.28 (see Note 5). The main processes of this network were as follows: multicellular organismal development, cell division, system development, and others (see Fig. 3).
5. The P value is used to initially rank the subnetworks. The P values throughout MetaCore – for maps, networks, and pro-cesses – are all calculated using the same basic formula: a hypergeometric distribution where the P value essentially rep-resents the probability of any particular mapping arising by chance, given the numbers of genes in the set of all genes on maps/networks/processes, genes on a particular map/network/process and genes in your experiment. This function uses the same variables as the z-score.
min( , )
max( , )
! !( )!( )! value
!1
!( )!( !)( )!.
n R
r R n N
R n N R N nP
N
i R i n N R n i
i
+ =
− −=
∑− − − − +

414 Wang, Lee, and Hwang
Table 4 Downregulated genes in mesenchymal stem cells compared with fetal tissues
A2M DLK NCAM1
ABLIM1 NFIB
Adult hemoglobin E-cadherin Non-A beta of AD amyloid
AFP
AFP-cyclopeptide FGF13 OGT (GlcNAc transferase)
Albumin FGFR2 Osteoglycin
Alpha1-globin FGFR3
Alpha-synuclein FXYD6 P311
Alpha-synuclein filaments p57
Ankyrin-B GABT Peg10
Asporin Glypican-3 PEG3
Golgin-67 Pleiotrophin
PLGF
BChE HBB PTCH1
BCKD-E2 HBE PTPR-delta
BEX1 HBG1
HBGA
C1qRp HBZ RBP1
C6orf111 HMGCS1 Reelin
Calgranulin A HNRPA3 Reep1
Carboxypeptidase H RNase 1
CD24
COL9A3 IGF-2
Collagen II ITM2A Selenoprotein P
Collagen IX SPARCL
Collagen XI KLC1 SULT1E1
Collagen XXI, alpha 1 M6B TK2
CXADR MEG3 TSLC1
Cyclin D2 MTSS1 WSB1
MYL4
DAPK1 Myosin II XIST

415Transcriptome Analysis in MSC
Variables:
●● N – total number of nodes in MetaCore database.●● R – number of the network’s objects corresponding to the
genes and proteins in your list.●● n – total number of nodes in each small network generated
from your list.●● r – number of nodes with data in each small network gener-
ated from your list.
The z-score ranks the Analyze Network algorithm’s subnet-works with regard to their saturation with genes from your exper-iments (Table 5). A high z-score means the network is highly saturated with genes from your experiments.
score .1
1 11
−=
− − − −
Rr n
NzR R n
nN N N
Fig. 3. Functional networks of nine genes (marked with solid grey circles) that were downregulated in all four types of MSCs, when compared with six 6-week-old fetal organs.

416 Wang, Lee, and Hwang
Acknowledgments
The authors like to thank Li-Wen Hsu (BCRC), Ching-Ling Wang, Hsiao-Wen Lu, Yu-Chi Lin (Chang Gung Memorial Hospital), and George Hsu (Tri-I Biotech, Inc. Taiwan) for their excellent technical help, and Shih-Yee Mimi Wang (University of Illinois College of Medicine) for editing. This study was sup-ported in part by NSC95-2314-B-182A-156 (to Wang TH), NSC 95-2311-B-130-001 (to Lee YS), and 98-EC-17-A-17-R7-0525 (to Hwang SM).
References
Table 5 Biological processes that might be related to the nine genes displayed in Fig. 3
Process % P value (↓)
Multicellular organismal process 68.75 2.698e-04
Somatic stem cell division 6.25 3.503e-04
Generation of neurons 21.88 3.610e-04
Neurogenesis 21.88 5.444e-04
Postembryonic development 6.25 5.604e-04
Nervous system development 31.25 5.641e-04
System development 50.00 6.699e-04
Stem cell division 6.25 6.834e-04
Multicellular organismal development 53.12 8.215e-04
Cell division 9.38 1.280e-03
Protein oligomerization 9.38 2.166e-03
Cell communication 59.38 2.395e-03
1. Chang, Y.J., Shih, D., Tseng, C.P., Hseih, T.B., Lee, D.C., and Hwang, S.M. (2006) Disparate mesenchyme-lineage tendencies in mesenchymal stem cells from human bone marrow and umbilical cord blood. Stem Cells 24, 679–685.
2. Wagner, W., Wein, F., Seckinger, A., Schwager, C., Wirkner, U., Krause, U., et al. (2005) Comparative characteristics of mesenchymal stem cells from human bone marrow, adipose
tissue, and umbilical cord blood. Exp. Hematol. 33, 1402–1416.
3. Dominici, M., Le Blanc, K., Mueller, I., Slaper-Cortenbach, I., Marini, F.C., Krause, D.S., et al. (2006) Minimal criteria for defin-ing multipotent mesenchymal stromal cells. The International Society for Cellular Therapy position statement. Cytotherapy 8, 315–317.
4. Wang, T.H. and Chao, A. (2007) Micro array analysis of gene expression of cancer to guide

417Transcriptome Analysis in MSC
the use of chemotherapeutics. Taiwan J. Obstet. Gynecol. 46, 222–229.
5. Nikolsky, Y., Ekins, S., Nikolskaya, T., and Bugrim, A. (2005) A novel method for gen-eration of signature networks as biomarkers from complex high throughput data. Toxicol. Lett. 158, 20–29.
6. Nikolsky, Y., Nikolskaya, T., and Bugrim, A. (2005) Biological networks and analysis of experimental data in drug discovery. Drug Discov. Today 10, 653–662.
7. Mason, C.W., Swaan, P.W., and Weiner, C.P. (2006) Identification of interactive gene networks: a novel approach in gene array profiling of myometrial events during guinea pig pregnancy. Am. J. Obstet. Gynecol. 194, 1513–1523.
8. Tsai, M.S., Hwang, S.M., Chen, K.D., Lee, Y.S., Hsu, L.W., Chang, Y.J., et al. (2007) Functional network analysis on the transcrip-tomes of mesenchymal stem cells derived from amniotic fluid, amniotic membrane, cord blood, and bone marrow. Stem Cells 25, 2511–2523.
9. Chao, A., Wang, T.H., Lee, Y.S., Hong, J.H., Tsai, C.N., Chen, M.H., et al. (2008) analysis of functional groups of differentially expressed genes in the peripheral blood of patients with cervical cancer undergoing concurrent chemo-radiation. Radiat. Res. 169, 76–86.
10. Guo, L., Lobenhofer, E.K., Wang, C., Shippy, R., Harris, S.C., Zhang, L., et al. (2006) Rat toxicogenomic study reveals analytical consis-tency across microarray platforms. Nat. Biotechnol. 24, 1162–1169.


