Embed Size (px)
Citation preview
agronomy
Article
De Novo Transcriptome Sequencing in Kiwifruit (Actinidiachinensis var. deliciosa (A Chev) Liang et Ferguson) andDevelopment of Tissue-Specific Transcriptomic Resources
Juan Alfonso Salazar 1,* , Cristian Vergara-Pulgar 2,3, Claudia Jorquera 4, Patricio Zapata 4 , David Ruiz 1,Pedro Martínez-Gómez 1 , Rodrigo Infante 4 and Claudio Meneses 2,3
�����������������
Citation: Salazar, J.A.;
Vergara-Pulgar, C.; Jorquera, C.;
Zapata, P.; Ruiz, D.; Martínez-Gómez,
P.; Infante, R.; Meneses, C. De Novo
Transcriptome Sequencing in
Kiwifruit (Actinidia chinensis var.
deliciosa (A Chev) Liang et Ferguson)
and Development of Tissue-Specific
Transcriptomic Resources. Agronomy
2021, 11, 919. https://doi.org/
10.3390/agronomy11050919
Academic Editor: Rafael A. Cañas
Received: 7 April 2021
Accepted: 4 May 2021
Published: 7 May 2021
Publisher’s Note: MDPI stays neutral
with regard to jurisdictional claims in
published maps and institutional affil-
iations.
Copyright: © 2021 by the authors.
Licensee MDPI, Basel, Switzerland.
This article is an open access article
distributed under the terms and
conditions of the Creative Commons
Attribution (CC BY) license (https://
creativecommons.org/licenses/by/
4.0/).
1 Department of Plant Breeding, CEBAS-CSIC, P.O. Box 164, E-30100 Murcia, Espinardo, Spain;[email protected] (D.R.); [email protected] (P.M.-G.)
2 Centro de Biotecnología Vegetal, Facultad Ciencias Biológicas, Universidad Andrés Bello, República 217,Santiago 8370146, Chile; [email protected] (C.V.-P.); [email protected] (C.M.)
3 FONDAP Center for Genome Regulation, República 217, Santiago 8370371, Chile4 Departamento de Producción Agrícola, Universidad de Chile, Santiago 8820000, Chile;
[email protected] (C.J.); [email protected] (P.Z.); [email protected] (R.I.)* Correspondence: [email protected]
Abstract: Kiwifruit (Actinidia chinensis var. deliciosa (A Chev) Liang et Ferguson) is a sub-tropicalvine species from the Actinidiaceae family native to China. This species has an allohexaploid genome(from diploid and autotetraploid parents), contained in 174 chromosomes producing a climactericand fleshy fruit called kiwifruit. Currently, only a small body of transcriptomic and proteomicdata are available for A. chinensis var. deliciosa. In this low molecular knowledge context, themain goal of this study is to construct a tissue-specific de novo transcriptome assembly, generatingdifferential expression analysis among these specific tissues, to obtain new useful transcriptomicinformation for a better knowledge of vegetative, floral and fruit growth in this species. In thisstudy, we have analyzed different whole transcriptomes from shoot, leaf, flower bud, flower andfruit at four development stages (7, 50, 120 and 160 days after flowering; DAF) in kiwifruit obtainedthrough RNA-seq sequencing. The first version of the developed A. chinensis var. deliciosa de novotranscriptome contained 142,025 contigs (x = 1044 bp, N50 = 1133 bp). Annotation was performedwith BLASTX against the TAIR10 protein database, and we found an annotation proportion of 35.6%(50,508), leaving 64.4% (91,517) of the contigs without annotation. These results represent a referencetranscriptome for allohexaploid kiwifruit generating a database of A. chinensis var. deliciosa genesrelated to leaf, flower and fruit development. These results provided highly valuable informationidentifying over 20,000 exclusive genes including all tissue comparisons, which were associated withthe proteins involved in different biological processes and molecular functions.
Keywords: Actinidia; breeding; de novo transcriptome; kiwifruit leaf; flower; fruit development
1. Introduction
Actinidia chinensis var. deliciosa is an allohexaploid species (2n = 6x) with an estimatedgenome size of 4.4 Gbp and 174 chromosomes [1–3]. It is a species that originated in south-western China and belongs to the genus Actinidia, which includes at least 76 species [4].This species has an important economic role due to its edible fruit known as kiwifruit,being also a species of nutritional importance due to its high level of vitamin C [5]. Thekiwifruit worldwide production in 2019 reached about 4.35 million tons, China beingthe most important producer, followed by New Zealand, Italy, Iran, Greece and Chile.However, most of the Chinese kiwifruit are locally consumed, with less than 0.2% of thetotal being exported (http://faostat.fao.org (accessed on 4 January 2021)).
The Actinidia genus is mainly composed of dioecious plants. The flowers are axialwith five petals, usually white colored, and sepals that can be fused with the base or not.
Agronomy 2021, 11, 919. https://doi.org/10.3390/agronomy11050919 https://www.mdpi.com/journal/agronomy
Agronomy 2021, 11, 919 2 of 19
The fruit is a berry and has black seeds embedded within the flesh where the colors andmorphology vary depending on the cultivar. Actinidia chinensis var. deliciosa cv. ‘Hay-ward’ is one of the most widely distributed cultivars, and bears fruits with green fleshand a fuzzy appearance. The characteristic flavor of the kiwifruit is one of the importantaspects for consumer acceptance and its commercial potential. The balance of sweetnessand acidity is given by the sugars such as glucose, fructose, sucrose and myo-inositol insmall quantities, and the acids found in the mature fruit including quinic acid, citric acidand in less proportion, malic acid [6]. From a molecular point of view, at the genomiclevel, the whole-genome sequencing of the heterozygous ‘Hongyang’ cultivar [7] and the‘Red5′ genotype [8] has been reported. In addition, at this moment the most recent worksare those corresponding to the genome assembly of Actinidia eriantha [9], the high-qualityActinidia chinensis genome [10] and the current kiwifruit genome database [11], which willundoubtedly provide valuable information at the genomic level. However, the informationat the transcriptomic, proteomic or metabolomic levels is scarcer, mainly in the case ofimportant kiwi commercial cultivars such as ‘Hayward’ taking in account its ploidy level.Transcriptomic analyses are relatively recent in kiwifruit species, focused on physiologyand fruit ripening studies or resistance to diseases. These transcriptomic studies includedthe sequencing of whole male and female transcriptomes of A. arguta flower buds [12], thestudy of fruit development in the cultivar “Hongyang” based on long noncoding RNA ex-pression and alternative splicing [13], the premature bud break dormancy analysis [14], thegenome-wide gene expression profiles in male and female plants using high-throughputRNA sequencing (RNA-seq) [15], or transcriptomic analysis studies about bacterial andfungal diseases such as Pseudomonas syringae pv. actinidiae (Psa) [16,17] and Botryosphaeriadothidea, which produce important losses in kiwifruit [18]. More recently, new studies havebeen focused on the study of post-harvest behavior after the application of ethylene-relatedphytohormones such as 1-MCP (ethylene inhibitor) and Ethrel (ethylene precursor), whichprovides more knowledge about the kiwifruit shelf-life extension [19]. In addition, sometranscriptomic studies have been reported showing new findings on anthocyanin biosyn-thesis in A. chinensis [20,21] and A. arguta [22]. Finally, from the proteomic and metabolomicpoint of view, we can highlight the study in Actinidia arguta by using iTRAQ-based quanti-tative proteomic which is providing a new approach according to flesh development colorin kiwifruit [23] or the current metabolomic study about A. arguta leaves with nutraceuticalvalues [24]. All these transcriptomic, proteomic and metabolomic studies were focused onthe specific areas that deal with the most important problems of kiwifruit and that supposeimportant agronomic and economic impact. According to plant tissue development at thephysiological level, gibberellins are a large family of isoprenoid phytohormones whichact as growth regulators in higher plants [25]. Thus, gibberellins stimulate cell elongationor cell division being involved in the seed germination, maturation or flowering of manyvascular species [26]. The synthesis of these isoprenoids can be mediated by the meval-onate or methylerythritol phosphate pathways [25]. Therefore, the role of both of thesepathways could be an interesting approach in order to discern the mechanisms involved inthe tissue-specific development process.
The objective of this work was the development of a de novo transcriptome in green-fleshed kiwifruit ‘Hayward’ using RNA-seq analysis from the leaf, flower and fruit tissuesin different development phases, including a differential gene expression analysis togenerate a database of genes related to the leaf, flower and fruit development and to identifythe most important proteins involved in these development processes. Additionally, themost important kiwifruit genes linked to these processes were identified, illustrating thepowerfulness and usefulness of this transcriptomic resource.
2. Materials and Methods2.1. Plant Material and RNA Sequencing
Sample tissues of Actinidia chinensis var. deliciosa cv. ’Hayward’ including shoots,leaves, flower buds, flowers and fruits at 7, 50, 120 and 160 days after full bloom (DAFB)
Agronomy 2021, 11, 919 3 of 19
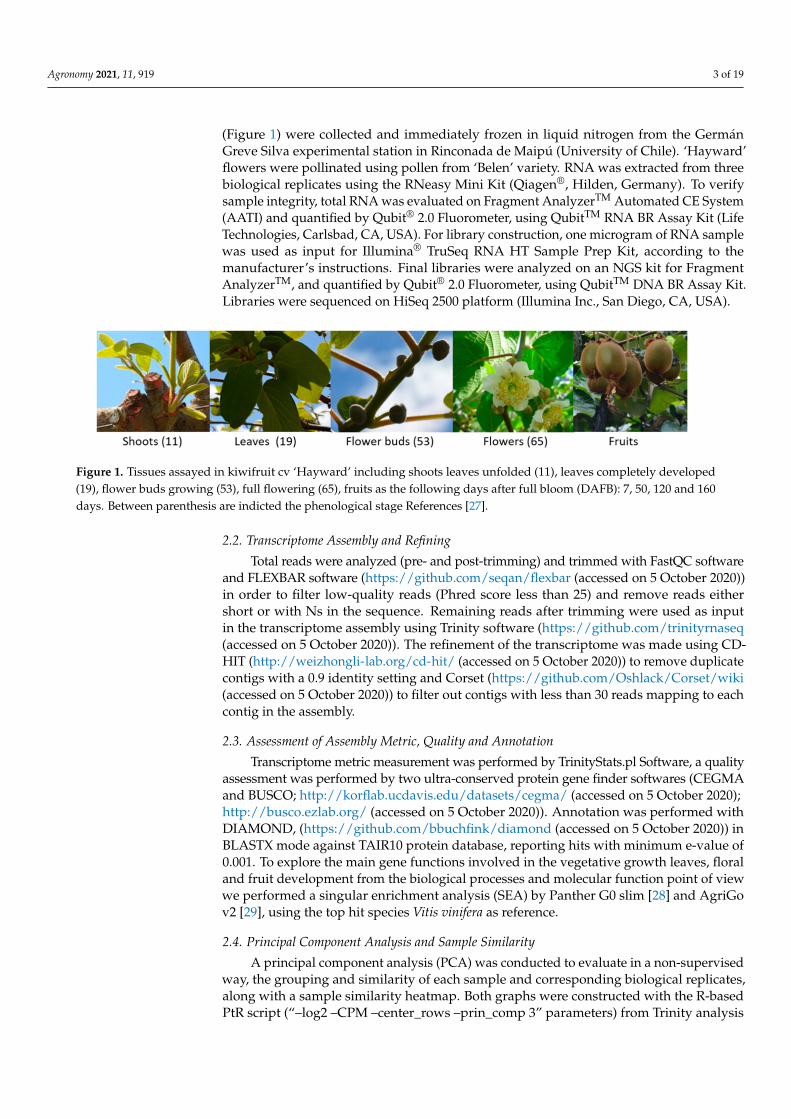
(Figure 1) were collected and immediately frozen in liquid nitrogen from the GermánGreve Silva experimental station in Rinconada de Maipú (University of Chile). ‘Hayward’flowers were pollinated using pollen from ‘Belen’ variety. RNA was extracted from threebiological replicates using the RNeasy Mini Kit (Qiagen®, Hilden, Germany). To verifysample integrity, total RNA was evaluated on Fragment AnalyzerTM Automated CE System(AATI) and quantified by Qubit® 2.0 Fluorometer, using QubitTM RNA BR Assay Kit (LifeTechnologies, Carlsbad, CA, USA). For library construction, one microgram of RNA samplewas used as input for Illumina® TruSeq RNA HT Sample Prep Kit, according to themanufacturer’s instructions. Final libraries were analyzed on an NGS kit for FragmentAnalyzerTM, and quantified by Qubit® 2.0 Fluorometer, using QubitTM DNA BR Assay Kit.Libraries were sequenced on HiSeq 2500 platform (Illumina Inc., San Diego, CA, USA).
Figure 1. Tissues assayed in kiwifruit cv ‘Hayward’ including shoots leaves unfolded (11), leaves completely developed(19), flower buds growing (53), full flowering (65), fruits as the following days after full bloom (DAFB): 7, 50, 120 and 160days. Between parenthesis are indicted the phenological stage References [27].
2.2. Transcriptome Assembly and Refining
Total reads were analyzed (pre- and post-trimming) and trimmed with FastQC softwareand FLEXBAR software (https://github.com/seqan/flexbar (accessed on 5 October 2020))in order to filter low-quality reads (Phred score less than 25) and remove reads eithershort or with Ns in the sequence. Remaining reads after trimming were used as inputin the transcriptome assembly using Trinity software (https://github.com/trinityrnaseq(accessed on 5 October 2020)). The refinement of the transcriptome was made using CD-HIT (http://weizhongli-lab.org/cd-hit/ (accessed on 5 October 2020)) to remove duplicatecontigs with a 0.9 identity setting and Corset (https://github.com/Oshlack/Corset/wiki(accessed on 5 October 2020)) to filter out contigs with less than 30 reads mapping to eachcontig in the assembly.
2.3. Assessment of Assembly Metric, Quality and Annotation
Transcriptome metric measurement was performed by TrinityStats.pl Software, a qualityassessment was performed by two ultra-conserved protein gene finder softwares (CEGMAand BUSCO; http://korflab.ucdavis.edu/datasets/cegma/ (accessed on 5 October 2020);http://busco.ezlab.org/ (accessed on 5 October 2020)). Annotation was performed withDIAMOND, (https://github.com/bbuchfink/diamond (accessed on 5 October 2020)) inBLASTX mode against TAIR10 protein database, reporting hits with minimum e-value of0.001. To explore the main gene functions involved in the vegetative growth leaves, floraland fruit development from the biological processes and molecular function point of viewwe performed a singular enrichment analysis (SEA) by Panther G0 slim [28] and AgriGov2 [29], using the top hit species Vitis vinifera as reference.
2.4. Principal Component Analysis and Sample Similarity
A principal component analysis (PCA) was conducted to evaluate in a non-supervisedway, the grouping and similarity of each sample and corresponding biological replicates,along with a sample similarity heatmap. Both graphs were constructed with the R-basedPtR script (“–log2 –CPM –center_rows –prin_comp 3” parameters) from Trinity analysis
Agronomy 2021, 11, 919 4 of 19
utilities using the counts matrix containing every sample and its replicates as an input. Forsample similarity, Spearman’s correlation coefficient was used.
2.5. Differential Expression Analysis and Protein-Protein Interaction Network
Raw counts of each contig were obtained with RSEM (https://deweylab.github.io/RSEM/ (accessed on 5 October 2020)) using Bowtie2 aligner (http://bowtie-bio.sourceforge.net/bowtie2/index.shtml (accessed on 5 October 2020)) to align all the input reads to thede novo assembled transcriptome. Then all counts and replicates per tissue were usedto develop a raw counts’ matrix. From this raw count, a TPM–TMM normalized ma-trix was calculated and used for the study alongside the raw counts’ matrix. Differentialexpression analysis was performed by using the R’s package edgeR from Bioconductor(http://bioconductor.org/packages/release/bioc/html/edgeR.html (accessed on 5 Octo-ber 2020)). Differentially expressed genes (DEGs) were used for further comparisons anddownstream analyses. Finally, a protein–protein interaction network was developed inorder to associate DEGs with metabolic processes by using the STRING database [30],considering a score >0.400 for the assayed DEGs.
3. Results3.1. Refined De Novo Transcriptome Assembly
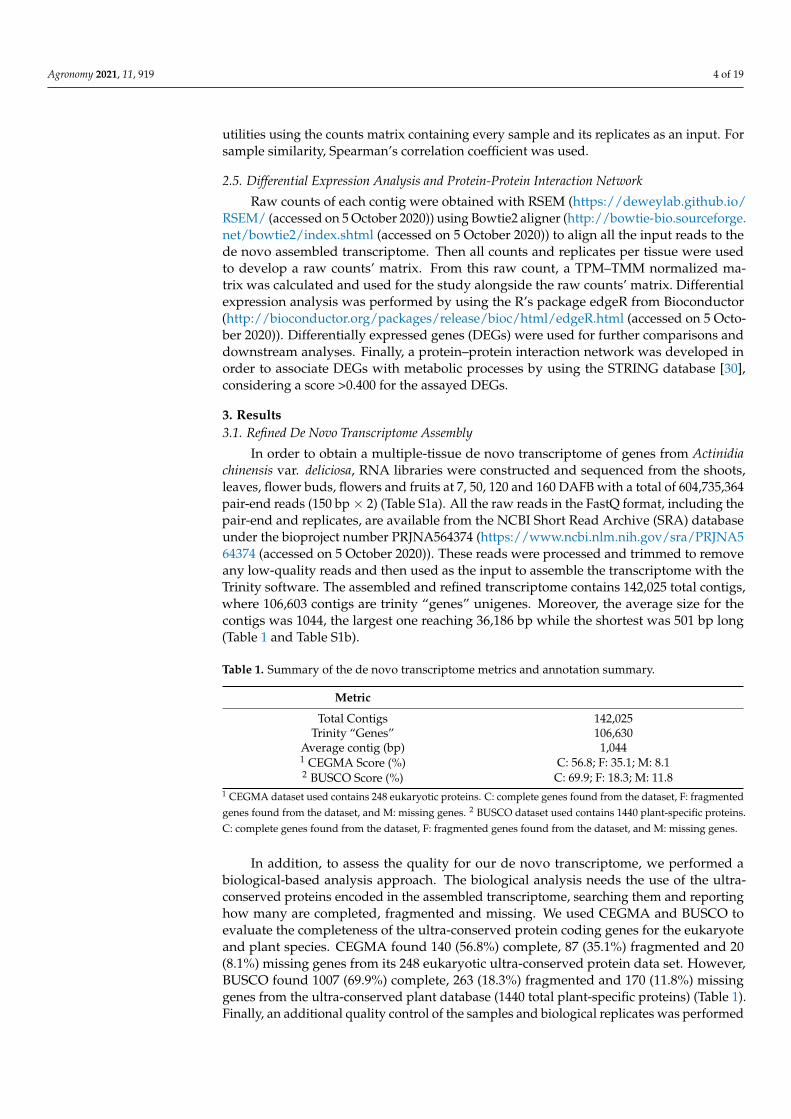
In order to obtain a multiple-tissue de novo transcriptome of genes from Actinidiachinensis var. deliciosa, RNA libraries were constructed and sequenced from the shoots,leaves, flower buds, flowers and fruits at 7, 50, 120 and 160 DAFB with a total of 604,735,364pair-end reads (150 bp× 2) (Table S1a). All the raw reads in the FastQ format, including thepair-end and replicates, are available from the NCBI Short Read Archive (SRA) databaseunder the bioproject number PRJNA564374 (https://www.ncbi.nlm.nih.gov/sra/PRJNA564374 (accessed on 5 October 2020)). These reads were processed and trimmed to removeany low-quality reads and then used as the input to assemble the transcriptome with theTrinity software. The assembled and refined transcriptome contains 142,025 total contigs,where 106,603 contigs are trinity “genes” unigenes. Moreover, the average size for thecontigs was 1044, the largest one reaching 36,186 bp while the shortest was 501 bp long(Table 1 and Table S1b).
Table 1. Summary of the de novo transcriptome metrics and annotation summary.
Metric
Total Contigs 142,025Trinity “Genes” 106,630
Average contig (bp) 1,0441 CEGMA Score (%) C: 56.8; F: 35.1; M: 8.12 BUSCO Score (%) C: 69.9; F: 18.3; M: 11.8
1 CEGMA dataset used contains 248 eukaryotic proteins. C: complete genes found from the dataset, F: fragmentedgenes found from the dataset, and M: missing genes. 2 BUSCO dataset used contains 1440 plant-specific proteins.C: complete genes found from the dataset, F: fragmented genes found from the dataset, and M: missing genes.
In addition, to assess the quality for our de novo transcriptome, we performed abiological-based analysis approach. The biological analysis needs the use of the ultra-conserved proteins encoded in the assembled transcriptome, searching them and reportinghow many are completed, fragmented and missing. We used CEGMA and BUSCO toevaluate the completeness of the ultra-conserved protein coding genes for the eukaryoteand plant species. CEGMA found 140 (56.8%) complete, 87 (35.1%) fragmented and 20(8.1%) missing genes from its 248 eukaryotic ultra-conserved protein data set. However,BUSCO found 1007 (69.9%) complete, 263 (18.3%) fragmented and 170 (11.8%) missinggenes from the ultra-conserved plant database (1440 total plant-specific proteins) (Table 1).Finally, an additional quality control of the samples and biological replicates was performed
Agronomy 2021, 11, 919 5 of 19
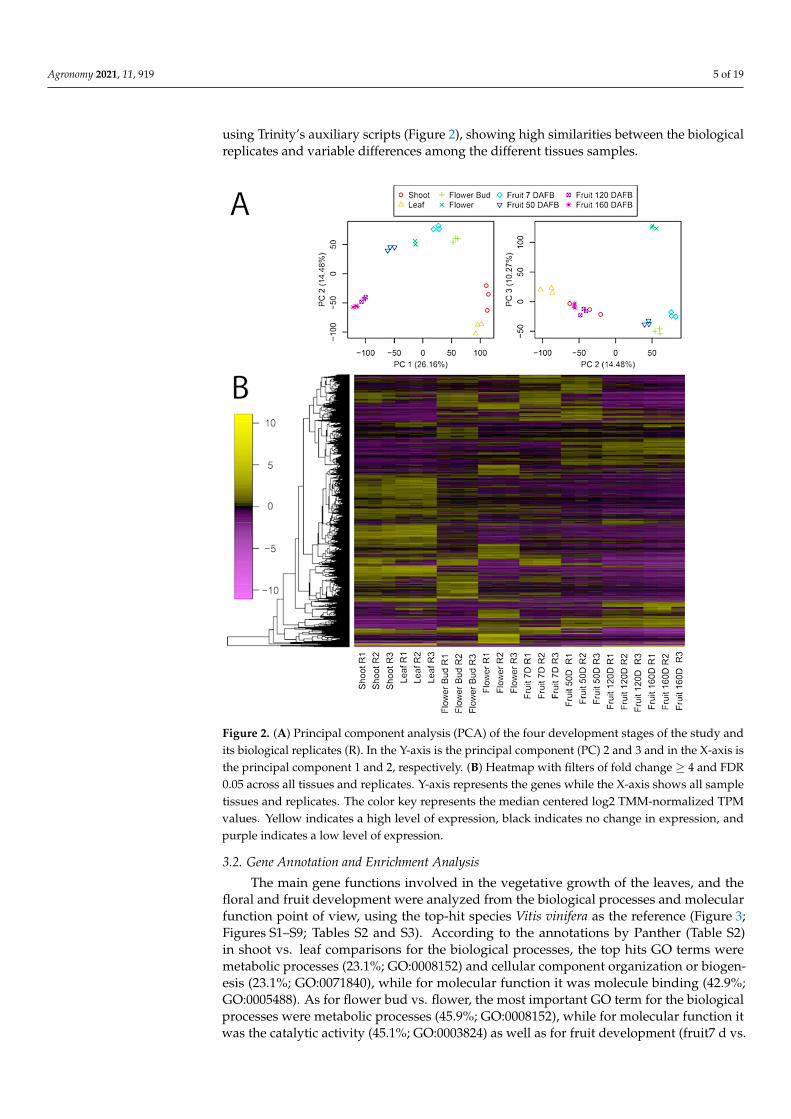
using Trinity’s auxiliary scripts (Figure 2), showing high similarities between the biologicalreplicates and variable differences among the different tissues samples.
Figure 2. (A) Principal component analysis (PCA) of the four development stages of the study andits biological replicates (R). In the Y-axis is the principal component (PC) 2 and 3 and in the X-axis isthe principal component 1 and 2, respectively. (B) Heatmap with filters of fold change ≥ 4 and FDR0.05 across all tissues and replicates. Y-axis represents the genes while the X-axis shows all sampletissues and replicates. The color key represents the median centered log2 TMM-normalized TPMvalues. Yellow indicates a high level of expression, black indicates no change in expression, andpurple indicates a low level of expression.
3.2. Gene Annotation and Enrichment Analysis
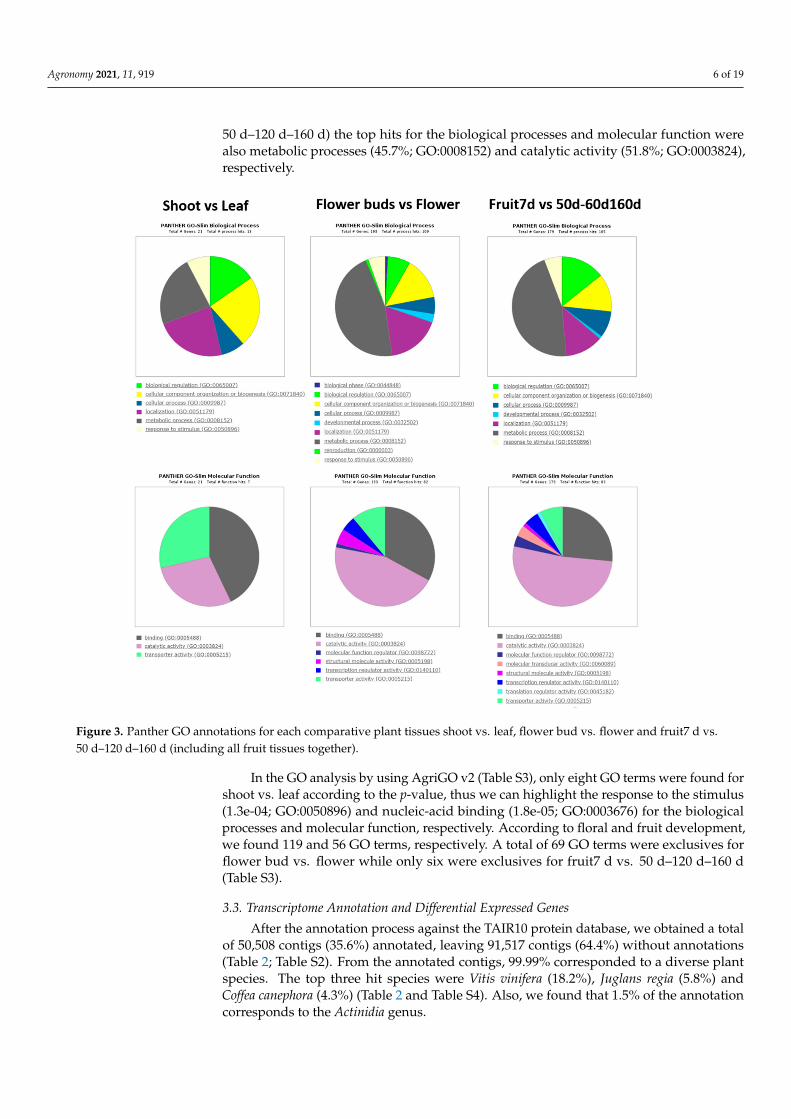
The main gene functions involved in the vegetative growth of the leaves, and thefloral and fruit development were analyzed from the biological processes and molecularfunction point of view, using the top-hit species Vitis vinifera as the reference (Figure 3;Figures S1–S9; Tables S2 and S3). According to the annotations by Panther (Table S2)in shoot vs. leaf comparisons for the biological processes, the top hits GO terms weremetabolic processes (23.1%; GO:0008152) and cellular component organization or biogen-esis (23.1%; GO:0071840), while for molecular function it was molecule binding (42.9%;GO:0005488). As for flower bud vs. flower, the most important GO term for the biologicalprocesses were metabolic processes (45.9%; GO:0008152), while for molecular function itwas the catalytic activity (45.1%; GO:0003824) as well as for fruit development (fruit7 d vs.
Agronomy 2021, 11, 919 6 of 19
50 d–120 d–160 d) the top hits for the biological processes and molecular function werealso metabolic processes (45.7%; GO:0008152) and catalytic activity (51.8%; GO:0003824),respectively.
Figure 3. Panther GO annotations for each comparative plant tissues shoot vs. leaf, flower bud vs. flower and fruit7 d vs.50 d–120 d–160 d (including all fruit tissues together).
In the GO analysis by using AgriGO v2 (Table S3), only eight GO terms were found forshoot vs. leaf according to the p-value, thus we can highlight the response to the stimulus(1.3e-04; GO:0050896) and nucleic-acid binding (1.8e-05; GO:0003676) for the biologicalprocesses and molecular function, respectively. According to floral and fruit development,we found 119 and 56 GO terms, respectively. A total of 69 GO terms were exclusives forflower bud vs. flower while only six were exclusives for fruit7 d vs. 50 d–120 d–160 d(Table S3).
3.3. Transcriptome Annotation and Differential Expressed Genes
After the annotation process against the TAIR10 protein database, we obtained a totalof 50,508 contigs (35.6%) annotated, leaving 91,517 contigs (64.4%) without annotations(Table 2; Table S2). From the annotated contigs, 99.99% corresponded to a diverse plantspecies. The top three hit species were Vitis vinifera (18.2%), Juglans regia (5.8%) andCoffea canephora (4.3%) (Table 2 and Table S4). Also, we found that 1.5% of the annotationcorresponds to the Actinidia genus.
Agronomy 2021, 11, 919 7 of 19
Table 2. Functional annotations and top-hit species summary.
Functional Annotation
Total contigs annotated 50,508Total contigs unannotated 91,517
Top-hit species (%)
Vitis vinifera 18.2%Juglans regia 5.8%
Coffea canephora 4.3%Actinidia genus 1.5%
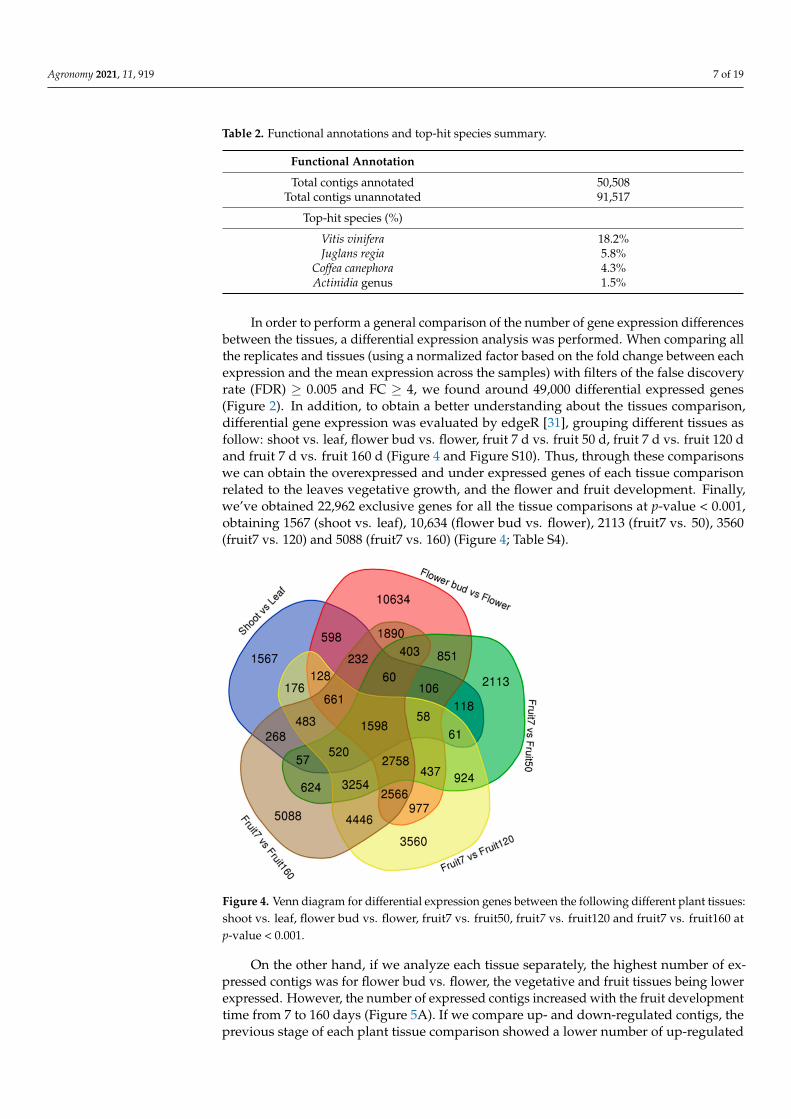
In order to perform a general comparison of the number of gene expression differencesbetween the tissues, a differential expression analysis was performed. When comparing allthe replicates and tissues (using a normalized factor based on the fold change between eachexpression and the mean expression across the samples) with filters of the false discoveryrate (FDR) ≥ 0.005 and FC ≥ 4, we found around 49,000 differential expressed genes(Figure 2). In addition, to obtain a better understanding about the tissues comparison,differential gene expression was evaluated by edgeR [31], grouping different tissues asfollow: shoot vs. leaf, flower bud vs. flower, fruit 7 d vs. fruit 50 d, fruit 7 d vs. fruit 120 dand fruit 7 d vs. fruit 160 d (Figure 4 and Figure S10). Thus, through these comparisonswe can obtain the overexpressed and under expressed genes of each tissue comparisonrelated to the leaves vegetative growth, and the flower and fruit development. Finally,we’ve obtained 22,962 exclusive genes for all the tissue comparisons at p-value < 0.001,obtaining 1567 (shoot vs. leaf), 10,634 (flower bud vs. flower), 2113 (fruit7 vs. 50), 3560(fruit7 vs. 120) and 5088 (fruit7 vs. 160) (Figure 4; Table S4).
Figure 4. Venn diagram for differential expression genes between the following different plant tissues:shoot vs. leaf, flower bud vs. flower, fruit7 vs. fruit50, fruit7 vs. fruit120 and fruit7 vs. fruit160 atp-value < 0.001.
On the other hand, if we analyze each tissue separately, the highest number of ex-pressed contigs was for flower bud vs. flower, the vegetative and fruit tissues being lowerexpressed. However, the number of expressed contigs increased with the fruit developmenttime from 7 to 160 days (Figure 5A). If we compare up- and down-regulated contigs, theprevious stage of each plant tissue comparison showed a lower number of up-regulated

Agronomy 2021, 11, 919 8 of 19
contigs, except in the case of the fruit at 7 vs. 160 days where a higher number of up-regulated contigs for fruit at 7 vs. 160 days was appreciated (Figure 5B). This event waspresumably due to the fact that fruits after 160 days reached their maximum development,giving a greater number of up regulated contigs in favor of day 7 contrary to day 160.A summary of the main genes involved in each tissue comparison is shown (Table S5),obtaining a total of 120 genes with a logFC over 2.
Figure 5. (A) Number of expressed contigs by plant tissue (above). Contig expression is shown in white color (10–20), grey(20–200) and dark grey (>200). (B) Number of expressed contigs by tissue comparison (below). Up-regulated (grey color)and down-regulated (white color) contigs.
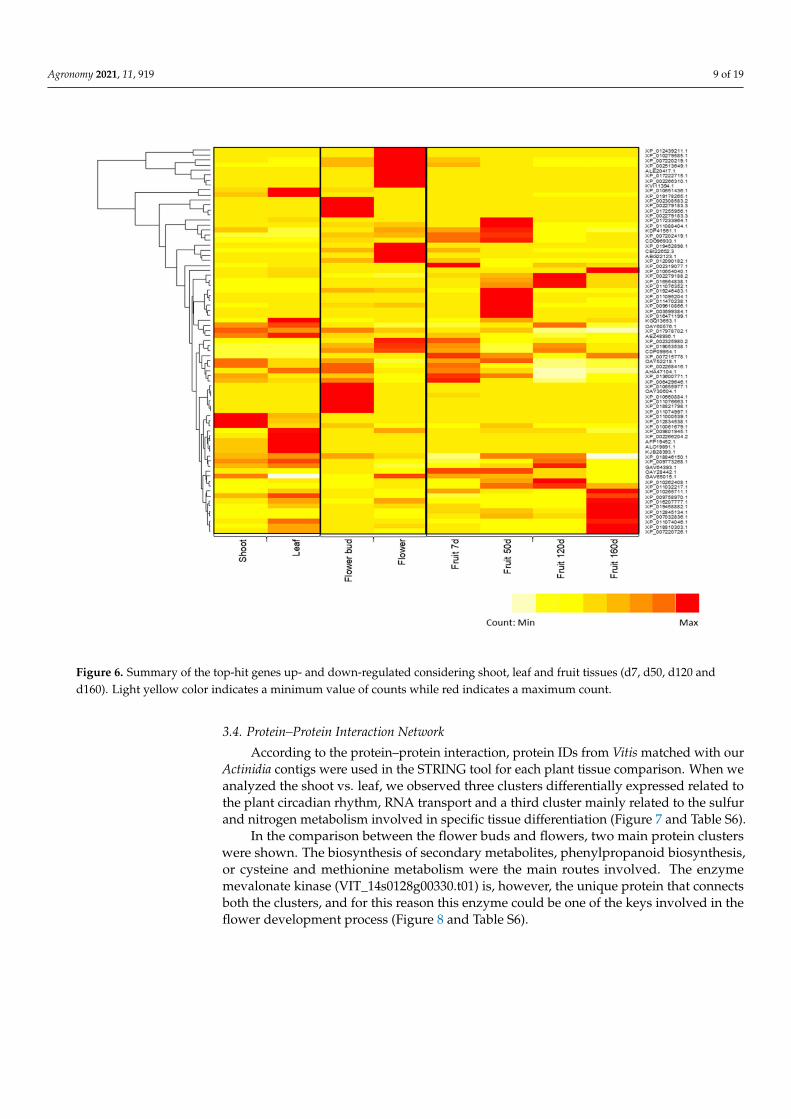
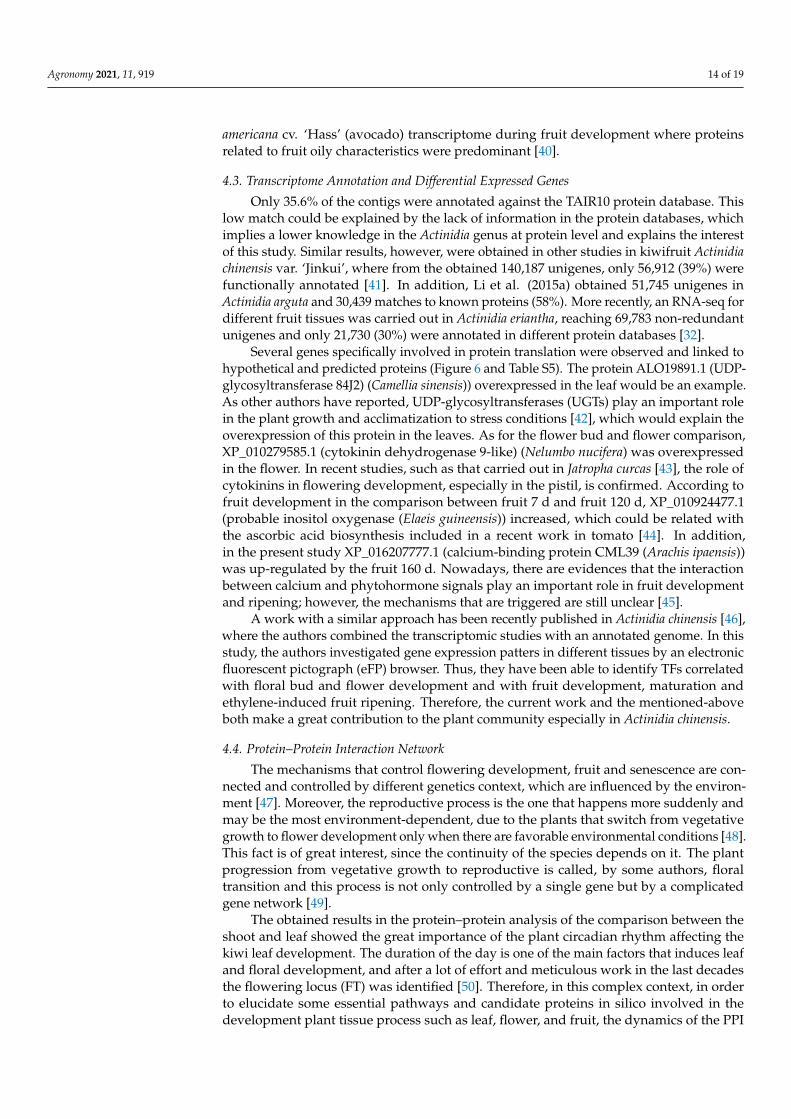
If we pay attention to the most significant contigs according to the logFC over 2, someexamples of DEGs were shown in the heatmap (Figure 6). As for shoot vs. leaf comparison,the protein KDP41561.1 (hypothetical protein JCGZ_15968 (Jatropha curcas)) was overex-pressed in the shoots while the protein XP_010651436.1 (type 2 DNA topoisomerase 6subunit B-like isoform X1 (Vitis vinifera)) was overexpressed in the leaves. In addition, acontig linked to the protein ALO19891.1 (UDP-glycosyltransferase 84J2) (Camellia sinensis))was overexpressed in the leaf (Table S5). According to flower bud vs. flower compari-son, XP_002308583.2 (hypothetical protein POPTR_0006s24990g (Populus trichocarpa) andXP_010279585.1 (cytokinin dehydrogenase 9-like) (Nelumbo nucifera) were overexpressed inthe flower buds and flower, respectively (Table S6). As for the fruit comparison betweenfruit 7 d vs. fruit 120 d, we can highlight XP_010924477.1 (probable inositol oxygenase(Elaeis guineensis)), which was overexpressed in fruit 120 d while in the comparison betweenfruit 7 d and fruit 160 d XP_016207777.1 (calcium-binding protein CML39 (Arachis ipaensis))as well as XP_010654040.1 (heat stress transcription factor A-2e isoform X2 (Vitis vinifera))were both overexpressed in fruit 160d (Table S5).
Agronomy 2021, 11, 919 9 of 19
Figure 6. Summary of the top-hit genes up- and down-regulated considering shoot, leaf and fruit tissues (d7, d50, d120 andd160). Light yellow color indicates a minimum value of counts while red indicates a maximum count.
3.4. Protein–Protein Interaction Network
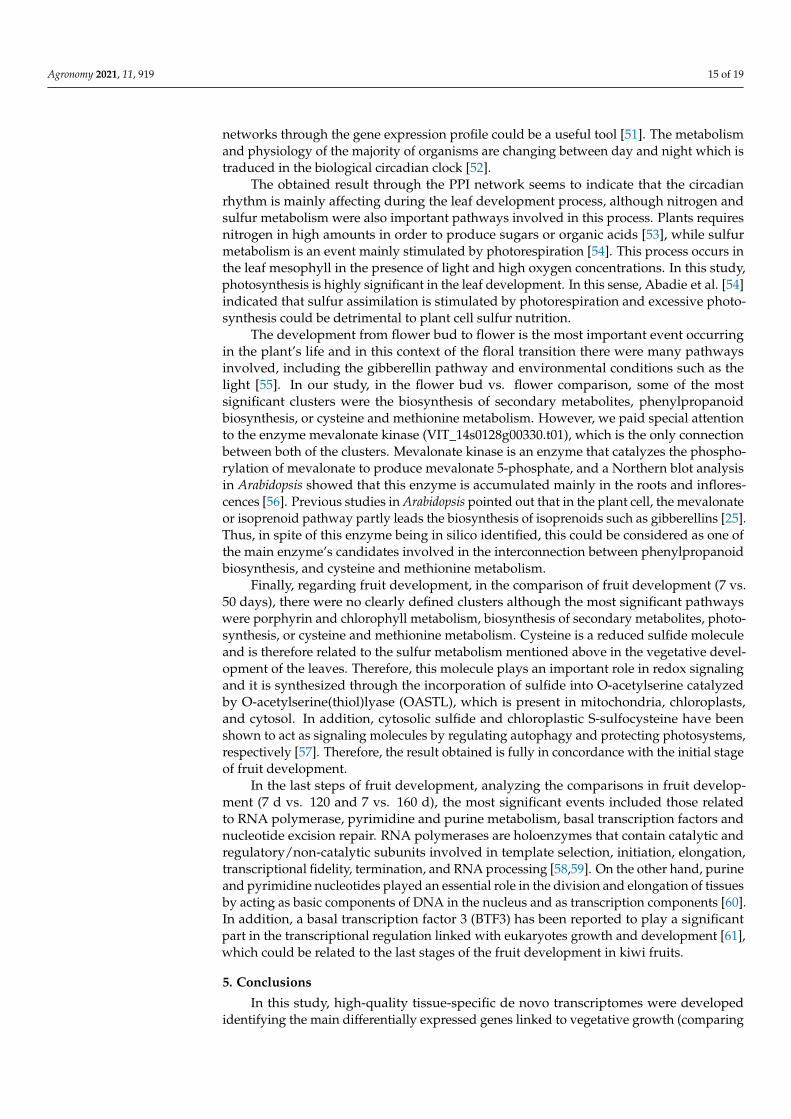
According to the protein–protein interaction, protein IDs from Vitis matched with ourActinidia contigs were used in the STRING tool for each plant tissue comparison. When weanalyzed the shoot vs. leaf, we observed three clusters differentially expressed related tothe plant circadian rhythm, RNA transport and a third cluster mainly related to the sulfurand nitrogen metabolism involved in specific tissue differentiation (Figure 7 and Table S6).
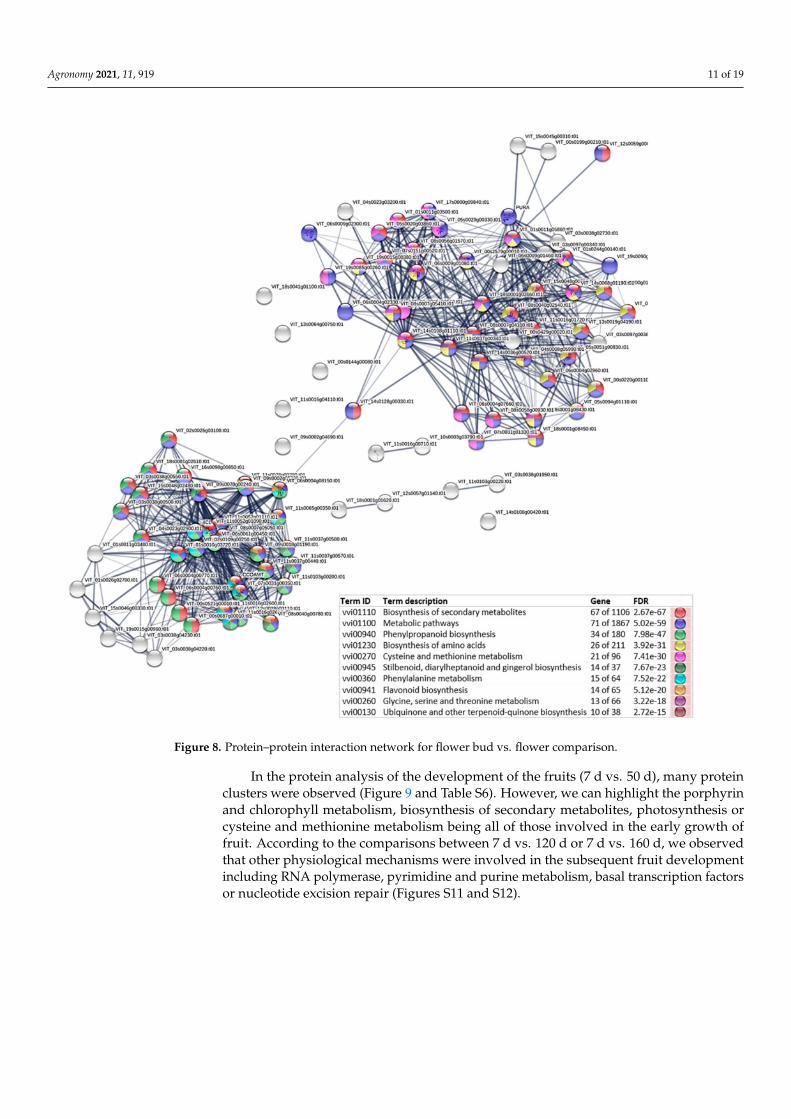
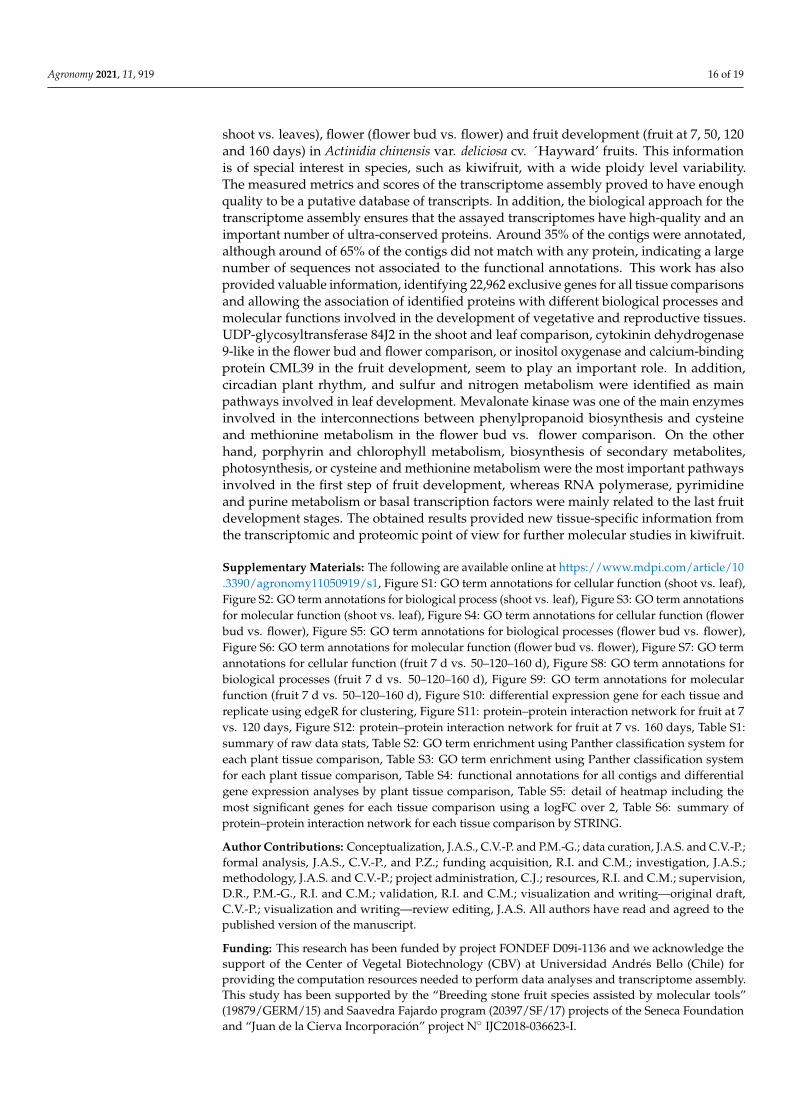
In the comparison between the flower buds and flowers, two main protein clusterswere shown. The biosynthesis of secondary metabolites, phenylpropanoid biosynthesis,or cysteine and methionine metabolism were the main routes involved. The enzymemevalonate kinase (VIT_14s0128g00330.t01) is, however, the unique protein that connectsboth the clusters, and for this reason this enzyme could be one of the keys involved in theflower development process (Figure 8 and Table S6).
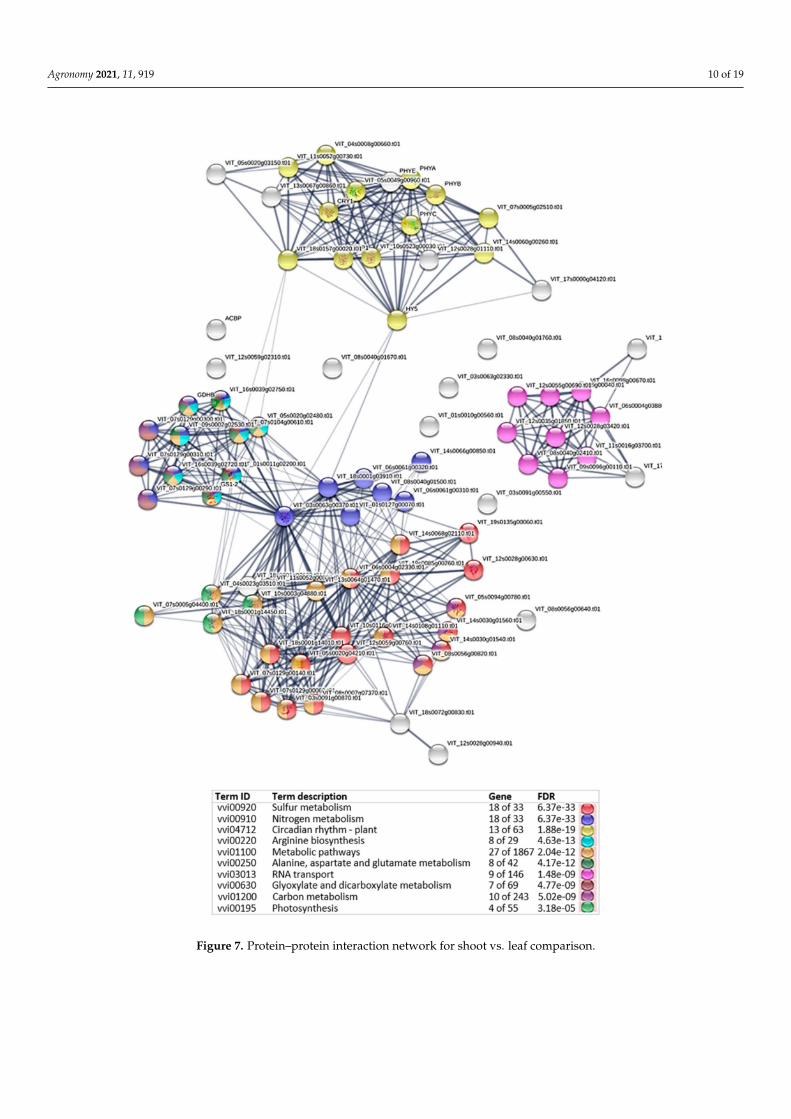
Agronomy 2021, 11, 919 10 of 19
Figure 7. Protein–protein interaction network for shoot vs. leaf comparison.
Agronomy 2021, 11, 919 11 of 19
Figure 8. Protein–protein interaction network for flower bud vs. flower comparison.
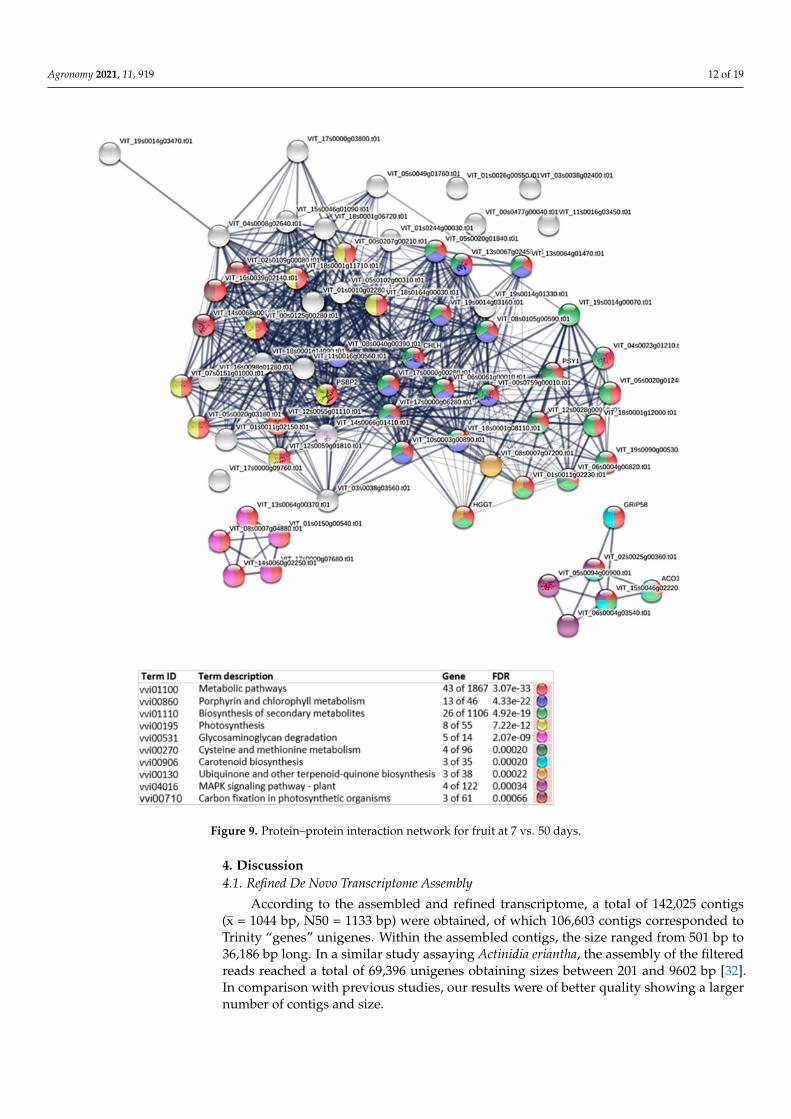
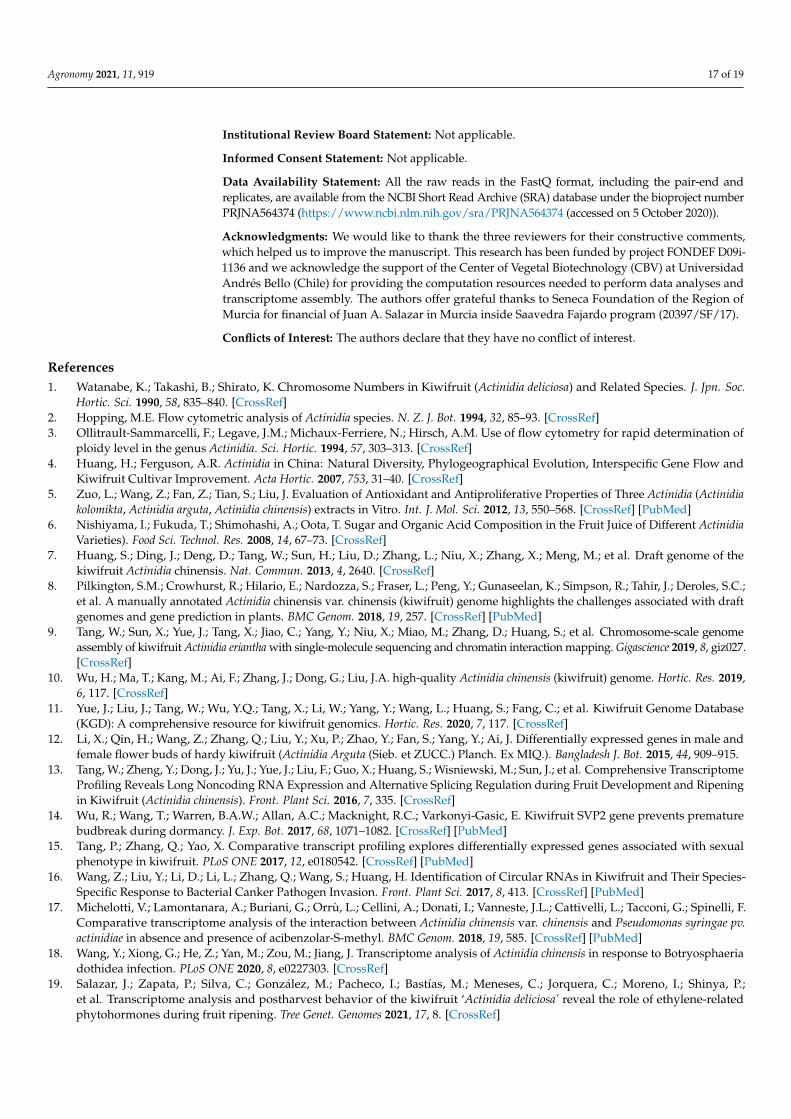
In the protein analysis of the development of the fruits (7 d vs. 50 d), many proteinclusters were observed (Figure 9 and Table S6). However, we can highlight the porphyrinand chlorophyll metabolism, biosynthesis of secondary metabolites, photosynthesis orcysteine and methionine metabolism being all of those involved in the early growth offruit. According to the comparisons between 7 d vs. 120 d or 7 d vs. 160 d, we observedthat other physiological mechanisms were involved in the subsequent fruit developmentincluding RNA polymerase, pyrimidine and purine metabolism, basal transcription factorsor nucleotide excision repair (Figures S11 and S12).
Agronomy 2021, 11, 919 12 of 19
Figure 9. Protein–protein interaction network for fruit at 7 vs. 50 days.
4. Discussion4.1. Refined De Novo Transcriptome Assembly
According to the assembled and refined transcriptome, a total of 142,025 contigs(x = 1044 bp, N50 = 1133 bp) were obtained, of which 106,603 contigs corresponded toTrinity “genes” unigenes. Within the assembled contigs, the size ranged from 501 bp to36,186 bp long. In a similar study assaying Actinidia eriantha, the assembly of the filteredreads reached a total of 69,396 unigenes obtaining sizes between 201 and 9602 bp [32].In comparison with previous studies, our results were of better quality showing a largernumber of contigs and size.
Agronomy 2021, 11, 919 13 of 19
On the other hand, regarding the completeness of the ultra-conserved protein evalua-tion by CEGMA and BUSCO, the obtained scores suggested that the assembled transcrip-tome contains an important number of ultra-conserved proteins complete or fragmented,indicating the high-quality standard transcriptome in terms of completeness. This biologi-cal approach indicated the high-quality score especially for BUSCO which reached almost70% of the complete genes found in the different datasets. This 70% from the BUSCO scoreseems to be lower against the quality scores reported above in different plant genomes,but the construction of the de novo transcriptome from three different plant tissues mayexplain this difference. CEGMA and BUSCO complete scores over 95% were reported fortwelve plant genomes including the model plant Arabidopsis thaliana and the fruit tree Pyruscommunis L. var ‘Bartlett’ [33]. In agreement with these previous results, the sum of thevalues of the completed and fragmented genes obtained in our study was close to 90%,which was quite high considering the construction of a de novo transcriptome. In addition,a specific tissue de novo transcriptome assembly of Ilex paraguariensis [34] obtained similardata with around 73% of complete genes reaching close to 85%.
4.2. Gene Annotation and Enrichment Analysis
In the gene annotation and enrichment analysis, we obtained significant functionalannotations from each tissue comparison, including shoot vs. leaf, flower bud vs. flowerand for fruit development. In the case of the shoot vs. leaf comparison, the top hitsfor the biological processes were related to metabolic processes (GO:0008152) or cellularcomponent organization (GO:0071840), while for molecular function it was moleculebinding (GO:0005488). Therefore, these processes may be involved in the biosynthesis ofconstituent macromolecules and plant cells related to leaf development and growth. When wecompared bud vs. flower and fruit development (fruit 7 d vs. 50 d–120 d–160 d), the top hitfor biological processes was metabolic processes (GO:0008152), while for molecular functionthe catalytic activity (GO:0003824) was the most significant for both tissue comparisonsindicating an increase in the chemical reactions linked to flowering and fruit development.
In addition, only eight GO terms were found for shoot vs. leaf, probably due tothe lack of protein annotations related to these tissues. However, flower bud vs. flowerand fruit development comparisons showed 119 and 56 GO terms, respectively. Thus, forflower bud vs. flower, some significant protein IDs were related to the anatomical structuredevelopment (p-value of 6.5e-27; GO:0048856), reproductive process (3.4e-12; GO:0022414),aromatic compound biosynthesis process (7.4e-07; GO:0019438) or response to abioticstimulus (100e-07; GO:0009628). Therefore, GO:0048856 is related to the progression ofanatomical structures including the flower bud to a mature flower. The protein network in-volved in GO:0022414 was described as responsible for the inheritance of cytoplasmic malesterility in soybeans during flower development [35]. The aromatic compound biosynthesisprocess (GO:0019438) includes all of the chemical reactions and pathways related to theformation of aromatic compounds which can be happening during flower development, sothe aromatic composition of the kiwifruit could be forming during flower developmentas has been described in Eucalyptus grandis floral tissues [36]. For the proteins networkrelated to the response to abiotic stimulus (GO:0009628), recent studies in flower buds fromtransgenic blueberry evidenced its relation to flower development [37].
Finally, in the case of fruit development (fruit 7 d vs. 50 d–120 d–160 d), someprotein IDs were associated with protein metabolic processes (4.1e-3; GO:0019538), DNApolymerase activity (3.9e-10; GO:0034061), transferase activity (6.1e-06; GO:0016740) orcatalytic activity (1.6e-03; GO:0003824). In other plant species including cucumber, someof the main proteins linked to fruit development were involved in the process of proteinmetabolism (GO:0019538) [38]. In addition, some of the most important proteins involved inthe fruit development stage in peaches (cell enlargement) were involved in transferase andcatalytic activities [39]. Therefore, a major catalysis reaction and an increase in enzymaticactivity seem to be more related to fruit development (GO:0034061, GO:0016740 andGO:0003824). A similar approach was implemented in a de novo assembly of the Persea
Agronomy 2021, 11, 919 14 of 19
americana cv. ‘Hass’ (avocado) transcriptome during fruit development where proteinsrelated to fruit oily characteristics were predominant [40].
4.3. Transcriptome Annotation and Differential Expressed Genes
Only 35.6% of the contigs were annotated against the TAIR10 protein database. Thislow match could be explained by the lack of information in the protein databases, whichimplies a lower knowledge in the Actinidia genus at protein level and explains the interestof this study. Similar results, however, were obtained in other studies in kiwifruit Actinidiachinensis var. ‘Jinkui’, where from the obtained 140,187 unigenes, only 56,912 (39%) werefunctionally annotated [41]. In addition, Li et al. (2015a) obtained 51,745 unigenes inActinidia arguta and 30,439 matches to known proteins (58%). More recently, an RNA-seq fordifferent fruit tissues was carried out in Actinidia eriantha, reaching 69,783 non-redundantunigenes and only 21,730 (30%) were annotated in different protein databases [32].
Several genes specifically involved in protein translation were observed and linked tohypothetical and predicted proteins (Figure 6 and Table S5). The protein ALO19891.1 (UDP-glycosyltransferase 84J2) (Camellia sinensis)) overexpressed in the leaf would be an example.As other authors have reported, UDP-glycosyltransferases (UGTs) play an important rolein the plant growth and acclimatization to stress conditions [42], which would explain theoverexpression of this protein in the leaves. As for the flower bud and flower comparison,XP_010279585.1 (cytokinin dehydrogenase 9-like) (Nelumbo nucifera) was overexpressedin the flower. In recent studies, such as that carried out in Jatropha curcas [43], the role ofcytokinins in flowering development, especially in the pistil, is confirmed. According tofruit development in the comparison between fruit 7 d and fruit 120 d, XP_010924477.1(probable inositol oxygenase (Elaeis guineensis)) increased, which could be related withthe ascorbic acid biosynthesis included in a recent work in tomato [44]. In addition,in the present study XP_016207777.1 (calcium-binding protein CML39 (Arachis ipaensis))was up-regulated by the fruit 160 d. Nowadays, there are evidences that the interactionbetween calcium and phytohormone signals play an important role in fruit developmentand ripening; however, the mechanisms that are triggered are still unclear [45].
A work with a similar approach has been recently published in Actinidia chinensis [46],where the authors combined the transcriptomic studies with an annotated genome. In thisstudy, the authors investigated gene expression patters in different tissues by an electronicfluorescent pictograph (eFP) browser. Thus, they have been able to identify TFs correlatedwith floral bud and flower development and with fruit development, maturation andethylene-induced fruit ripening. Therefore, the current work and the mentioned-aboveboth make a great contribution to the plant community especially in Actinidia chinensis.
4.4. Protein–Protein Interaction Network
The mechanisms that control flowering development, fruit and senescence are con-nected and controlled by different genetics context, which are influenced by the environ-ment [47]. Moreover, the reproductive process is the one that happens more suddenly andmay be the most environment-dependent, due to the plants that switch from vegetativegrowth to flower development only when there are favorable environmental conditions [48].This fact is of great interest, since the continuity of the species depends on it. The plantprogression from vegetative growth to reproductive is called, by some authors, floraltransition and this process is not only controlled by a single gene but by a complicatedgene network [49].
The obtained results in the protein–protein analysis of the comparison between theshoot and leaf showed the great importance of the plant circadian rhythm affecting thekiwi leaf development. The duration of the day is one of the main factors that induces leafand floral development, and after a lot of effort and meticulous work in the last decadesthe flowering locus (FT) was identified [50]. Therefore, in this complex context, in orderto elucidate some essential pathways and candidate proteins in silico involved in thedevelopment plant tissue process such as leaf, flower, and fruit, the dynamics of the PPI
Agronomy 2021, 11, 919 15 of 19
networks through the gene expression profile could be a useful tool [51]. The metabolismand physiology of the majority of organisms are changing between day and night which istraduced in the biological circadian clock [52].
The obtained result through the PPI network seems to indicate that the circadianrhythm is mainly affecting during the leaf development process, although nitrogen andsulfur metabolism were also important pathways involved in this process. Plants requiresnitrogen in high amounts in order to produce sugars or organic acids [53], while sulfurmetabolism is an event mainly stimulated by photorespiration [54]. This process occurs inthe leaf mesophyll in the presence of light and high oxygen concentrations. In this study,photosynthesis is highly significant in the leaf development. In this sense, Abadie et al. [54]indicated that sulfur assimilation is stimulated by photorespiration and excessive photo-synthesis could be detrimental to plant cell sulfur nutrition.
The development from flower bud to flower is the most important event occurringin the plant’s life and in this context of the floral transition there were many pathwaysinvolved, including the gibberellin pathway and environmental conditions such as thelight [55]. In our study, in the flower bud vs. flower comparison, some of the mostsignificant clusters were the biosynthesis of secondary metabolites, phenylpropanoidbiosynthesis, or cysteine and methionine metabolism. However, we paid special attentionto the enzyme mevalonate kinase (VIT_14s0128g00330.t01), which is the only connectionbetween both of the clusters. Mevalonate kinase is an enzyme that catalyzes the phospho-rylation of mevalonate to produce mevalonate 5-phosphate, and a Northern blot analysisin Arabidopsis showed that this enzyme is accumulated mainly in the roots and inflores-cences [56]. Previous studies in Arabidopsis pointed out that in the plant cell, the mevalonateor isoprenoid pathway partly leads the biosynthesis of isoprenoids such as gibberellins [25].Thus, in spite of this enzyme being in silico identified, this could be considered as one ofthe main enzyme’s candidates involved in the interconnection between phenylpropanoidbiosynthesis, and cysteine and methionine metabolism.
Finally, regarding fruit development, in the comparison of fruit development (7 vs.50 days), there were no clearly defined clusters although the most significant pathwayswere porphyrin and chlorophyll metabolism, biosynthesis of secondary metabolites, photo-synthesis, or cysteine and methionine metabolism. Cysteine is a reduced sulfide moleculeand is therefore related to the sulfur metabolism mentioned above in the vegetative devel-opment of the leaves. Therefore, this molecule plays an important role in redox signalingand it is synthesized through the incorporation of sulfide into O-acetylserine catalyzedby O-acetylserine(thiol)lyase (OASTL), which is present in mitochondria, chloroplasts,and cytosol. In addition, cytosolic sulfide and chloroplastic S-sulfocysteine have beenshown to act as signaling molecules by regulating autophagy and protecting photosystems,respectively [57]. Therefore, the result obtained is fully in concordance with the initial stageof fruit development.
In the last steps of fruit development, analyzing the comparisons in fruit develop-ment (7 d vs. 120 and 7 vs. 160 d), the most significant events included those relatedto RNA polymerase, pyrimidine and purine metabolism, basal transcription factors andnucleotide excision repair. RNA polymerases are holoenzymes that contain catalytic andregulatory/non-catalytic subunits involved in template selection, initiation, elongation,transcriptional fidelity, termination, and RNA processing [58,59]. On the other hand, purineand pyrimidine nucleotides played an essential role in the division and elongation of tissuesby acting as basic components of DNA in the nucleus and as transcription components [60].In addition, a basal transcription factor 3 (BTF3) has been reported to play a significantpart in the transcriptional regulation linked with eukaryotes growth and development [61],which could be related to the last stages of the fruit development in kiwi fruits.
5. Conclusions
In this study, high-quality tissue-specific de novo transcriptomes were developedidentifying the main differentially expressed genes linked to vegetative growth (comparing
Agronomy 2021, 11, 919 16 of 19
shoot vs. leaves), flower (flower bud vs. flower) and fruit development (fruit at 7, 50, 120and 160 days) in Actinidia chinensis var. deliciosa cv. ´Hayward’ fruits. This informationis of special interest in species, such as kiwifruit, with a wide ploidy level variability.The measured metrics and scores of the transcriptome assembly proved to have enoughquality to be a putative database of transcripts. In addition, the biological approach for thetranscriptome assembly ensures that the assayed transcriptomes have high-quality and animportant number of ultra-conserved proteins. Around 35% of the contigs were annotated,although around of 65% of the contigs did not match with any protein, indicating a largenumber of sequences not associated to the functional annotations. This work has alsoprovided valuable information, identifying 22,962 exclusive genes for all tissue comparisonsand allowing the association of identified proteins with different biological processes andmolecular functions involved in the development of vegetative and reproductive tissues.UDP-glycosyltransferase 84J2 in the shoot and leaf comparison, cytokinin dehydrogenase9-like in the flower bud and flower comparison, or inositol oxygenase and calcium-bindingprotein CML39 in the fruit development, seem to play an important role. In addition,circadian plant rhythm, and sulfur and nitrogen metabolism were identified as mainpathways involved in leaf development. Mevalonate kinase was one of the main enzymesinvolved in the interconnections between phenylpropanoid biosynthesis and cysteineand methionine metabolism in the flower bud vs. flower comparison. On the otherhand, porphyrin and chlorophyll metabolism, biosynthesis of secondary metabolites,photosynthesis, or cysteine and methionine metabolism were the most important pathwaysinvolved in the first step of fruit development, whereas RNA polymerase, pyrimidineand purine metabolism or basal transcription factors were mainly related to the last fruitdevelopment stages. The obtained results provided new tissue-specific information fromthe transcriptomic and proteomic point of view for further molecular studies in kiwifruit.
Supplementary Materials: The following are available online at https://www.mdpi.com/article/10.3390/agronomy11050919/s1, Figure S1: GO term annotations for cellular function (shoot vs. leaf),Figure S2: GO term annotations for biological process (shoot vs. leaf), Figure S3: GO term annotationsfor molecular function (shoot vs. leaf), Figure S4: GO term annotations for cellular function (flowerbud vs. flower), Figure S5: GO term annotations for biological processes (flower bud vs. flower),Figure S6: GO term annotations for molecular function (flower bud vs. flower), Figure S7: GO termannotations for cellular function (fruit 7 d vs. 50–120–160 d), Figure S8: GO term annotations forbiological processes (fruit 7 d vs. 50–120–160 d), Figure S9: GO term annotations for molecularfunction (fruit 7 d vs. 50–120–160 d), Figure S10: differential expression gene for each tissue andreplicate using edgeR for clustering, Figure S11: protein–protein interaction network for fruit at 7vs. 120 days, Figure S12: protein–protein interaction network for fruit at 7 vs. 160 days, Table S1:summary of raw data stats, Table S2: GO term enrichment using Panther classification system foreach plant tissue comparison, Table S3: GO term enrichment using Panther classification systemfor each plant tissue comparison, Table S4: functional annotations for all contigs and differentialgene expression analyses by plant tissue comparison, Table S5: detail of heatmap including themost significant genes for each tissue comparison using a logFC over 2, Table S6: summary ofprotein–protein interaction network for each tissue comparison by STRING.
Author Contributions: Conceptualization, J.A.S., C.V.-P. and P.M.-G.; data curation, J.A.S. and C.V.-P.;formal analysis, J.A.S., C.V.-P., and P.Z.; funding acquisition, R.I. and C.M.; investigation, J.A.S.;methodology, J.A.S. and C.V.-P.; project administration, C.J.; resources, R.I. and C.M.; supervision,D.R., P.M.-G., R.I. and C.M.; validation, R.I. and C.M.; visualization and writing—original draft,C.V.-P.; visualization and writing—review editing, J.A.S. All authors have read and agreed to thepublished version of the manuscript.
Funding: This research has been funded by project FONDEF D09i-1136 and we acknowledge thesupport of the Center of Vegetal Biotechnology (CBV) at Universidad Andrés Bello (Chile) forproviding the computation resources needed to perform data analyses and transcriptome assembly.This study has been supported by the “Breeding stone fruit species assisted by molecular tools”(19879/GERM/15) and Saavedra Fajardo program (20397/SF/17) projects of the Seneca Foundationand “Juan de la Cierva Incorporación” project N◦ IJC2018-036623-I.
Agronomy 2021, 11, 919 17 of 19
Institutional Review Board Statement: Not applicable.
Informed Consent Statement: Not applicable.
Data Availability Statement: All the raw reads in the FastQ format, including the pair-end andreplicates, are available from the NCBI Short Read Archive (SRA) database under the bioproject numberPRJNA564374 (https://www.ncbi.nlm.nih.gov/sra/PRJNA564374 (accessed on 5 October 2020)).
Acknowledgments: We would like to thank the three reviewers for their constructive comments,which helped us to improve the manuscript. This research has been funded by project FONDEF D09i-1136 and we acknowledge the support of the Center of Vegetal Biotechnology (CBV) at UniversidadAndrés Bello (Chile) for providing the computation resources needed to perform data analyses andtranscriptome assembly. The authors offer grateful thanks to Seneca Foundation of the Region ofMurcia for financial of Juan A. Salazar in Murcia inside Saavedra Fajardo program (20397/SF/17).
Conflicts of Interest: The authors declare that they have no conflict of interest.
References1. Watanabe, K.; Takashi, B.; Shirato, K. Chromosome Numbers in Kiwifruit (Actinidia deliciosa) and Related Species. J. Jpn. Soc.
Hortic. Sci. 1990, 58, 835–840. [CrossRef]2. Hopping, M.E. Flow cytometric analysis of Actinidia species. N. Z. J. Bot. 1994, 32, 85–93. [CrossRef]3. Ollitrault-Sammarcelli, F.; Legave, J.M.; Michaux-Ferriere, N.; Hirsch, A.M. Use of flow cytometry for rapid determination of
ploidy level in the genus Actinidia. Sci. Hortic. 1994, 57, 303–313. [CrossRef]4. Huang, H.; Ferguson, A.R. Actinidia in China: Natural Diversity, Phylogeographical Evolution, Interspecific Gene Flow and
Kiwifruit Cultivar Improvement. Acta Hortic. 2007, 753, 31–40. [CrossRef]5. Zuo, L.; Wang, Z.; Fan, Z.; Tian, S.; Liu, J. Evaluation of Antioxidant and Antiproliferative Properties of Three Actinidia (Actinidia
kolomikta, Actinidia arguta, Actinidia chinensis) extracts in Vitro. Int. J. Mol. Sci. 2012, 13, 550–568. [CrossRef] [PubMed]6. Nishiyama, I.; Fukuda, T.; Shimohashi, A.; Oota, T. Sugar and Organic Acid Composition in the Fruit Juice of Different Actinidia
Varieties). Food Sci. Technol. Res. 2008, 14, 67–73. [CrossRef]7. Huang, S.; Ding, J.; Deng, D.; Tang, W.; Sun, H.; Liu, D.; Zhang, L.; Niu, X.; Zhang, X.; Meng, M.; et al. Draft genome of the
kiwifruit Actinidia chinensis. Nat. Commun. 2013, 4, 2640. [CrossRef]8. Pilkington, S.M.; Crowhurst, R.; Hilario, E.; Nardozza, S.; Fraser, L.; Peng, Y.; Gunaseelan, K.; Simpson, R.; Tahir, J.; Deroles, S.C.;
et al. A manually annotated Actinidia chinensis var. chinensis (kiwifruit) genome highlights the challenges associated with draftgenomes and gene prediction in plants. BMC Genom. 2018, 19, 257. [CrossRef] [PubMed]
9. Tang, W.; Sun, X.; Yue, J.; Tang, X.; Jiao, C.; Yang, Y.; Niu, X.; Miao, M.; Zhang, D.; Huang, S.; et al. Chromosome-scale genomeassembly of kiwifruit Actinidia eriantha with single-molecule sequencing and chromatin interaction mapping. Gigascience 2019, 8, giz027.[CrossRef]
10. Wu, H.; Ma, T.; Kang, M.; Ai, F.; Zhang, J.; Dong, G.; Liu, J.A. high-quality Actinidia chinensis (kiwifruit) genome. Hortic. Res. 2019,6, 117. [CrossRef]
11. Yue, J.; Liu, J.; Tang, W.; Wu, Y.Q.; Tang, X.; Li, W.; Yang, Y.; Wang, L.; Huang, S.; Fang, C.; et al. Kiwifruit Genome Database(KGD): A comprehensive resource for kiwifruit genomics. Hortic. Res. 2020, 7, 117. [CrossRef]
12. Li, X.; Qin, H.; Wang, Z.; Zhang, Q.; Liu, Y.; Xu, P.; Zhao, Y.; Fan, S.; Yang, Y.; Ai, J. Differentially expressed genes in male andfemale flower buds of hardy kiwifruit (Actinidia Arguta (Sieb. et ZUCC.) Planch. Ex MIQ.). Bangladesh J. Bot. 2015, 44, 909–915.
13. Tang, W.; Zheng, Y.; Dong, J.; Yu, J.; Yue, J.; Liu, F.; Guo, X.; Huang, S.; Wisniewski, M.; Sun, J.; et al. Comprehensive TranscriptomeProfiling Reveals Long Noncoding RNA Expression and Alternative Splicing Regulation during Fruit Development and Ripeningin Kiwifruit (Actinidia chinensis). Front. Plant Sci. 2016, 7, 335. [CrossRef]
14. Wu, R.; Wang, T.; Warren, B.A.W.; Allan, A.C.; Macknight, R.C.; Varkonyi-Gasic, E. Kiwifruit SVP2 gene prevents prematurebudbreak during dormancy. J. Exp. Bot. 2017, 68, 1071–1082. [CrossRef] [PubMed]
15. Tang, P.; Zhang, Q.; Yao, X. Comparative transcript profiling explores differentially expressed genes associated with sexualphenotype in kiwifruit. PLoS ONE 2017, 12, e0180542. [CrossRef] [PubMed]
16. Wang, Z.; Liu, Y.; Li, D.; Li, L.; Zhang, Q.; Wang, S.; Huang, H. Identification of Circular RNAs in Kiwifruit and Their Species-Specific Response to Bacterial Canker Pathogen Invasion. Front. Plant Sci. 2017, 8, 413. [CrossRef] [PubMed]
17. Michelotti, V.; Lamontanara, A.; Buriani, G.; Orrù, L.; Cellini, A.; Donati, I.; Vanneste, J.L.; Cattivelli, L.; Tacconi, G.; Spinelli, F.Comparative transcriptome analysis of the interaction between Actinidia chinensis var. chinensis and Pseudomonas syringae pv.actinidiae in absence and presence of acibenzolar-S-methyl. BMC Genom. 2018, 19, 585. [CrossRef] [PubMed]
18. Wang, Y.; Xiong, G.; He, Z.; Yan, M.; Zou, M.; Jiang, J. Transcriptome analysis of Actinidia chinensis in response to Botryosphaeriadothidea infection. PLoS ONE 2020, 8, e0227303. [CrossRef]
19. Salazar, J.; Zapata, P.; Silva, C.; González, M.; Pacheco, I.; Bastías, M.; Meneses, C.; Jorquera, C.; Moreno, I.; Shinya, P.;et al. Transcriptome analysis and postharvest behavior of the kiwifruit ‘Actinidia deliciosa’ reveal the role of ethylene-relatedphytohormones during fruit ripening. Tree Genet. Genomes 2021, 17, 8. [CrossRef]
Agronomy 2021, 11, 919 18 of 19
20. Man, Y.P.; Wang, Y.C.; Jiang, Z.W.; Gong, J.J. Transcriptomic analysis of pigmented inner pericarp of red-fleshed kiwifruit inresponse to high temperature. Acta Hortric. 2015, 1096, 215–219. [CrossRef]
21. Li, W.; Liu, Y.; Zeng, S.; Xiao, G.; Wang, G.; Wang, Y.; Peng, M.; Huang, H. Gene Expression Profiling of Development andAnthocyanin Accumulation in Kiwifruit (Actinidia chinensis) Based on Transcriptome Sequencing. PLoS ONE 2015, 10, e0136439.
22. Li, Y.; Fang, J.; Qi, X.; Lin, M.; Zhong, Y.; Sun, L. A key structural gene, AaLDOX, is involved in anthocyanin biosynthesis in allred-fleshed kiwifruit (Actinidia arguta) based on transcriptome analysis. Gene 2018, 648, 31–41. [CrossRef] [PubMed]
23. Lin, M.; Fang, J.; Qi, X.; Li, Y.; Chen, J.; Sun, L.; Zhong, Y. iTRAQ-based quantitative proteomic analysis reveals alterations in themetabolism of Actinidia arguta. Sci. Rep. 2017, 7, 5670. [CrossRef]
24. Kim, G.D.; Lee, J.Y.; Auh, J.H. Metabolomic Screening of Anti-Inflammatory Compounds from the Leaves of Actinidia arguta(Hardy Kiwi). Foods 2019, 8, 47. [CrossRef]
25. Kasahara, H.; Hanada, A.; Kuzuyama, T.; Takagi, M.; Kamiya, Y.; Yamaguchi, S. Contribution of the Mevalonate and Methylery-thritol Phosphate Pathways to the Biosynthesis of Gibberellins in Arabidopsis. J. Biol. Chem. 2002, 277, 45188–45194. [CrossRef]
26. Sponsel, V.M. Signal achievements in gibberellin research: The second half-century. Annu. Plant Rev. 2016, 49, 1–36.27. Salinero, M.C.; Vela, P.; Sainz, M.J. Phenological growth stages of kiwifruit (Actinidia deliciosa “Hayward”). Sci. Hortic. 2009, 121,
27–31. [CrossRef]28. Mi, H.; Muruganujan, A.; Casagrande, J.T.; Thomas, P.D. Large-scale gene function analysis with the PANTHER classification
system. Nat. Protoc. 2013, 8, 1551–1566. [CrossRef]29. Tian, T.; Liu, Y.; Yan, H.; You, Q.; Yi, X.; Du, Z.; Xu, W.; Su, Z. agriGO v2. 0: A GO analysis toolkit for the agricultural community.
Nucleic Acid Res. 2017, 45, W122–W129. [CrossRef] [PubMed]30. Szklarczyk, D.; Morris, J.H.; Cook, H.; Kuhn, M.; Wyder, S.; Simonovic, M.; Santos, A.; Doncheva, N.T.; Roth, A.; Bork, P.; et al.
The STRING database in 2017: Quality-controlled protein-protein association networks, made broadly accessible. Nucleic AcidsRes. 2017, 45, D362–D368. [CrossRef] [PubMed]
31. Robinson, M.D.; McCarthy, D.J.; Smyth, G.K. edgeR: A Bioconductor package for differential expression analysis of digital geneexpression data. Bioinformatics 2010, 26, 139–140. [CrossRef]
32. Guo, R.; Landis, J.B.; Moore, M.J.; Meng, A.; Jian, S.; Yao, X.; Wang, H. Development and Application of Transcriptome-DerivedMicrosatellites in Actinidia eriantha (Actinidiaceae). Front. Plant Sci. 2017, 8, 1383. [CrossRef] [PubMed]
33. Veeckman, E.; Ruttink, T.; Vandepoele, K. Are We There Yet? Reliably Estimating the Completeness of Plant Genome Sequences.Plant Cell 2016, 28, 1759–1768. [CrossRef]
34. Fay, J.V.; Watkins, C.J.; Shrestha, R.K.; Litwiñiuk, S.L.; Talavera Stefani, L.N.; Rojas, C.A.; Argüelles, C.F.; Ferreras, J.A.;Caccamo, M.; Miretti, M.M. Yerba mate (Ilex paraguariensis, A. St.-Hil.) de novo transcriptome assembly based on tissue specificgenomic expression profiles. BMC Genom. 2018, 19, 891. [CrossRef]
35. Chen, L.; Ding, X.; Zhang, H.; He, T.; Li, Y.; Wang, T.; Li, X.; Jin, L.; Song, Q.; Yang, S.; et al. Comparative analysis of circularRNAs between soybean cytoplasmic male-sterile line NJCMS1A and its maintainer NJCMS1B by high-throughput sequencing.BMC Genom. 2018, 19, 663. [CrossRef]
36. Vining, K.J.; Romanel, E.; Jones, R.C.; Klocko, A.; Alves-Ferreira, M.; Hefer, C.A.; Amarasinghe, V.; Dharmawardhana, P.;Naithani, S.; Ranik, M.; et al. The floral transcriptome of Eucalyptus grandis. New Phytol. 2014, 206, 1406–1422. [CrossRef]
37. Song, G.Q.; Gao, X. Transcriptomic changes reveal gene networks responding to the overexpression of a blueberry DWARF ANDDELAYED FLOWERING 1 gene in transgenic blueberry plants. BMC Plant Biol. 2017, 17, 106. [CrossRef] [PubMed]
38. Li, J.; Xu, J.; Guo, Q.W.; Wu, Z.; Zhang, T.; Zhang, K.J.; Cheng, C.Y.; Zhu, P.Y.; Lou, Q.F.; Chen, J.F. Proteomic insight into fruitset of cucumber (Cucumis sativus L.) suggests the cues of hormone-independent parthenocarpy. BMC Genom. 2017, 18, 896.[CrossRef]
39. Guidarelli, M.; Zubini, P.; Nanni, V.; Bonghi, C.; Rasori, A.; Bertolini, P.; Baraldi, E. Gene expression analysis of peach fruit atdifferent growth stages and with different susceptibility to Monilinia laxa. Eur. J. Plant Pathol. 2014, 140, 503–513. [CrossRef]
40. Vergara-Pulgar, C.; Rothkegel, K.; González-Agüero, M.; Pedreschi, R.; Campos-Vargas, R.; Defilippi, B.G.; Meneses, C. De novoassembly of Persea americana cv. “Hass” transcriptome during fruit development. BMC Genom. 2019, 20, 108. [CrossRef] [PubMed]
41. Zhang, J.Y.; Huang, S.N.; Mo, Z.H.; Xuan, J.P.; Jia, X.D.; Wang, G.; Guo, Z.R. De novo transcriptome sequencing and comparativeanalysis of differentially expressed genes in kiwifruit under waterlogging stress. Mol. Breed. 2015, 35, 208. [CrossRef]
42. Zhang, Z.; Zhuo, X.; Yan, X.; Zhang, Q. Comparative Genomic and Transcriptomic Analyses of Family-1 UDP Glycosyltransferasein Prunus Mume. Int. J. Mol. Sci. 2018, 19, 3382. [CrossRef] [PubMed]
43. Ming, X.; Tao, Y.-B.; Fu, Q.; Tang, M.; He, H.; Chen, M.S.; Pan, B.Z.; Xu, Z.F. Flower-Specific Overproduction of Cytokinins AlteredFlower Development and Sex Expression in the Perennial Woody Plant Jatropha curcas L. Int. J. Mol. Sci. 2020, 21, 640. [CrossRef]
44. Munir, S.; Mumtaz, M.A.; Ahiakpa, J.K.; Liu, G.; Chen, W.; Zhou, G.; Zheng, W.; Ye, Z.; Zhang, Y. Genome-wide analysis of Myo-inositoloxygenase gene family in tomato reveals their involvement in ascorbic acid accumulation. BMC Genom. 2020, 21, 284. [CrossRef][PubMed]
45. Gao, Q.; Xiong, T.; Li, X.; Chen, W.; Zhu, X. Calcium and calcium sensors in fruit development and ripening. Sci. Hortic. 2019, 253,412–421. [CrossRef]
46. Brian, L.; Warren, B.; McAtee, P.; Rodrigues, J.; Nieuwenhuizen, N.; Pasha, A.; David, K.M.; Richardson, A.; Provart, N.J.;Allan, A.C.; et al. A gene expression atlas for kiwifruit (Actinidia chinensis) and network analysis of transcription factors. BMCPlant Biol. 2021, 21, 121. [CrossRef]

Agronomy 2021, 11, 919 19 of 19
47. Huijser, P.; Schmid, M. The control of developmental phase transitions in plants. Development 2011, 138, 4117–4129. [CrossRef][PubMed]
48. Baurle, I.; Dean, C. The timing of developmental transitions in plants. Cell 2006, 125, 655–664. [CrossRef] [PubMed]49. He, F.; Zhou, Y.; Zhang, Z. Deciphering the Arabidopsis floral transition process by integrating a protein-protein interaction
network and gene expression data. Plant Physiol. 2010, 153, 1492–1505. [CrossRef]50. Turck, F.; Fornara, F.; Coupland, G. Regulation and identity of florigen: FLOWERING LOCUS T moves center stage. Annu. Rev.
Plant Biol. 2008, 59, 573–594. [CrossRef]51. Han, J.D.; Bertin, N.; Hao, T.; Goldberg, D.S.; Berriz, G.F.; Zhang, L.V.; Dupuy, D.; Walhout, A.J.; Cusick, M.E.; Roth, F.P.;
et al. Evidence for dynamically organized modularity in the yeast protein-protein interaction network. Nature 2004, 430, 88–93.[CrossRef]
52. McClung, C.R. Plant Circadian Rhythms. Plant Cell 2006, 18, 792–803. [CrossRef]53. Nunes-Nesi, A.; Fernie, A.R.; Stitt, M. Metabolic and Signaling Aspects Underpinning the Regulation of Plant Carbon Nitrogen
Interactions. Mol. Plant 2010, 3, 973–996. [CrossRef]54. Abadie, C.; Tcherkez, G. Plant sulphur metabolism is stimulated by photorespiration. Commun. Biol. 2019, 2, 379. [CrossRef]
[PubMed]55. Henderson, I.R.; Dean, C. Control of Arabidopsis flowering: The chill before the bloom. Development 2004, 131, 3829–3838.
[CrossRef]56. Lluch, M.A.; Masferrer, A.; Arró, M.; Boronat, A.; Ferrer, A. Molecular cloning and expression analysis of the mevalonate kinase
gene from Arabidopsis thaliana. Plant Mol. Biol. 2000, 42, 365–376. [CrossRef]57. Romero, L.C.; Aroca, M.A.; Laureano-Marín, A.M.; Moreno, I.; García, I.; Gotor, C. Cysteine and Cysteine-Related Signaling
Pathways in Arabidopsis thaliana. Mol. Plant 2014, 7, 264–276. [CrossRef] [PubMed]58. Werner, F.; Grohmann, D. Evolution of multisubunit RNA polymerases in the three domains of life. Nat. Rev. Microbiol. 2011, 9,
85–98. [CrossRef]59. Cramer, P.; Armache, K.J.; Baumli, S.; Benkert, S.; Brueckner, F.; Buchen, C.; Damsma, G.E.; Dengl, S.; Geiger, S.R.; Jasiak, A.J.;
et al. Structure of eukaryotic RNA polymerases. Annu. Rev. Biophys. 2008, 37, 337–352. [CrossRef]60. Zrenner, R.; Stitt, M.; Sonnewald, U.; Boldt, R. Pyrimidine and purine biosynthesis and degradation in plants. Annu. Rev. Plant
Biol. 2006, 57, 805–836. [CrossRef] [PubMed]61. Jamil, M.; Wang, W.; Xu, M.; Tu, J. Exploring the roles of basal transcription factor 3 in eukaryotic growth and development.
Biotechnol. Genet. Eng. Rev. 2015, 31, 21–45. [CrossRef] [PubMed]


