Embed Size (px)
Citation preview
Specificity and Evolvability in Eukaryotic ProteinInteraction NetworksPedro Beltrao
*, Luis Serrano
European Molecular Biology Laboratory, Structures and Computational Biology Program, Heidelberg, Germany
Progress in uncovering the protein interaction networks of several species has led to questions of what underlyingprinciples might govern their organization. Few studies have tried to determine the impact of protein interactionnetwork evolution on the observed physiological differences between species. Using comparative genomics andstructural information, we show here that eukaryotic species have rewired their interactomes at a fast rate ofapproximately 10�5 interactions changed per protein pair, per million years of divergence. For Homo sapiens thiscorresponds to 103 interactions changed per million years. Additionally we find that the specificity of binding stronglydetermines the interaction turnover and that different biological processes show significantly different link dynamics.In particular, human proteins involved in immune response, transport, and establishment of localization show signs ofpositive selection for change of interactions. Our analysis suggests that a small degree of molecular divergence cangive rise to important changes at the network level. We propose that the power law distribution observed in proteininteraction networks could be partly explained by the cell’s requirement for different degrees of protein bindingspecificity.
Citation: Beltrao P, Serrano L (2007) Specificity and evolvability in eukaryotic protein interaction networks. PLoS Comput Biol 3(2): e25. doi:10.1371/journal.pcbi.0030025
Introduction
Many partial protein interaction maps for several eukary-otic species have now been published [1–9], and severalstudies have tried to analyse the structure and evolution ofsuch networks on a topological level [10–16]. The massivedata produced by sequencing efforts has allowed forcomparison of different genomes, giving us much moreinformation about their organization and evolution thanwhat would be possible by the analysis of individual genomes[17–21]. By analogy, to obtain a similar insight into thestructure and evolution of interactomes, different proteinnetworks would need to be compared, a procedure one couldcall ‘‘comparative interactomics.’’ This could be achieved bystudying the conserved interactions between groups ofortholog proteins in different species, defined as interologs[1,22,23]. Recent attempts to compare protein interactionsnetworks of different species [24,25] suggested that, at themoment, the current data are poorly suited for directcomparison; the overlap between datasets is small and thisis most likely due to insufficient data quantity and quality. Analternative approach has been to look for conservation ofnetwork modules between species [26,27]. This has lead to thedevelopment of several network alignment tools and haslargely been more successful at finding conserved interac-tions [26,28].
These studies have not, however, taken into account thelarge evolutionary distance separating the species understudy. In fact, the four eukaryotic species for which wecurrently have the most interaction data (Saccharomycescerevisiae, Drosophila melanogaster, Caenorhabditis elegans, andHomo sapiens) shared a common ancestor more than 900million years (My) ago [29]. This raises the intriguinghypothesis that this evolutionary distance is too large forthese species to have retained many similarities in theirinteraction networks. In fact, the relative success of thenetwork alignment approaches hints that evolutionary
pressures do not constrain the exact cellular interactions,but instead constrain the required functional complexes thatemerge. Hence, the lack of overlap would correspond in partto divergence and not merely to poor coverage.Even without the ability to compare interactomes directly,
one could try to obtain estimates for the rate of change ininteractomes by mining existing data with comparativegenomics. Previously, Wagner [13,30] used paralogous proteinpairs from S. cerevisiae to estimate that 2 3 10�6 newinteractions are added to the yeast interactome per proteinpair per My, suggesting that, on average, about 50 to 100 newinteractions have arisen every 1 My. The method relied onvery few interactions between paralogous protein pairs,making it impossible to dissect the different contributionsto the average value. Also, in the last three years, we havemore data available from a greater number of species,allowing us to compare how interactomes have changed inmore recent evolutionary time and to draw more generalconclusions about these processes.We have attempted to evaluate the rate of change of
interactions in the interactomes of several eukaryotic species(S. cerevisiae, D. melanogaster, H. sapiens, and C. elegans). We havedetermined that, in all species tested, interactions change at arate on the order of 1310�5 interactions per protein pair perMy. The approach used allowed us to explore different
Editor: Alfonso Valencia, Spanish National Cancer Research Centre, Spain
Received July 5, 2006; Accepted December 27, 2006; Published February 16, 2007
A previous version of this article appeared as an Early Online Release on December28, 2006 (doi:10.1371/journal.pcbi.0030025.eor).
Copyright: � 2007 Beltrao and Serrano. This is an open-access article distributedunder the terms of the Creative Commons Attribution License, which permitsunrestricted use, distribution, and reproduction in any medium, provided theoriginal author and source are credited.
Abbreviations: My, million years; UBA, ubiquitin-associated
* To whom correspondence should be addressed. E-mail: [email protected]
PLoS Computational Biology | www.ploscompbiol.org February 2007 | Volume 3 | Issue 2 | e250258
protein properties influencing interaction turnover. We haveobserved that specificity in protein binding and proteinfunction can determine link dynamics during the evolution ofcellular networks.
Results
Recently Duplicated Proteins of Eukaryotic Species Have aFast Rate of Interaction Change
To calculate the rate of interaction change, we haveestablished for each protein, in all species studied here, anapproximate age of origin, according to the presence orabsence of an identifiable ortholog in several other referencespecies (see Materials and Methods). We assumed that anyinteraction observed today with a recently duplicated proteinwas either inherited in the process of duplication or createdafter the process of gene duplication. It has been estimatedthat for S. cerevisiae the fraction of gene duplicates with atleast one shared interaction is below 20% after 50 My [13].For each species, we calculated the fraction of interactionsthat were also observed with the closest homolog of therecently duplicated protein. Within the time frame studied(20 to 100 My), the fraction of observed conserved inter-actions after gene duplication was low (1% to 20%, see Tables
1 and S1). Eliminating the interactions likely inherited byduplication, we were left with protein interactions that wereeither gained in the copy we are considering or they wereinherited by duplication and subsequently lost in thehomolog. Either of these cases represents an event ofinteraction change that occurred after gene duplication,and we can thus calculate the rate at which interactionschange (see Materials and Methods). This rate for all specieswas approximately on the order of 1 3 10�5 interactionschanged per protein pair per My (see Table 1) and rangedfrom 5.36 3 10�6 in H. sapiens to 2.45 3 10�5 in S. cerevisiae.Considering the possible protein pairs in the different species(about 1.83107 in S. cerevisiae and 2.33108 in H. sapiens, whenexcluding splicing alternatives), this estimate would corre-spond to a change of approximately 100 to 1,000 interactionsevery My.Due to the low coverage of the current interactomes, it is
quite possible that these values might change as new data ismade available. To study the impact of coverage on the valuesmentioned above, we have mimicked the effect of loweringthe coverage of the current datasets by randomly samplingthe interactomes in two ways: randomly removing proteininteractions or randomly removing proteins (and theirinteractions).The percentage of inherited interactions increased with
increasing coverage; approximately linearly in the case ofrandom node removal and nonlinearly in the case of randomprotein removal (see Figure S1). Therefore, the percentage ofinherited interactions is a measure that depends on the sizeof the network and is therefore likely to change as more datais added.The rate of change of interactions, on the other hand,
appears to be independent of network size. There was nosignificant change in the rate in the case of random removalof proteins. In the case of random removal of interactions,only when more than 80% of the interactions were removedwas there a significant increase of the rate (see Figure S1). It isimportant to note that the trend points to a stabilization ofthe value, indicating that further increases in coverage willnot likely change it. We deduce from this result that the rateof change of interactions is a measure that is mostlyindependent of network size and can be used to study theevolution of protein interaction networks.To test the robustness of our method for variations in
accuracy of the data, the human interactome was separatedinto three subsets, as defined in the Human Protein
Table 1. Eukaryotic Species Had in the Recent Evolutionary Past a Fast Rate of Change of Interactions
Species Studied D. melanogaster C. elegans S. cerevisiae H. sapiens
Approximate divergence from reference species (My) 40 100 20 70
Older proteins with interactions 5,761 1,774 4,190 6,111
Recently duplicated proteins with interactions 788 412 514 266
Interactions to a new protein 3,721 892 1,207 729
Interactions gained or lost 3,615 854 1,120 623
Percentage of interactions conserved after duplication (percent) 3 4 7 15
Rate for change of interactions (per protein pair per My) 1.86E-05 1.05E-05 2.45E-05 5.36E-06
Using estimated times of origin for all the proteins and the currently available protein interaction data, we have calculated the rate of change of interactions and the percentage of theseinteractions conserved after the process of gene duplication (see Materials and Methods).doi:10.1371/journal.pcbi.0030025.t001
PLoS Computational Biology | www.ploscompbiol.org February 2007 | Volume 3 | Issue 2 | e250259
Author Summary
To understand how the cell performs the required biologicalfunctions and reacts to changes in the environment, scientists havebeen studying how cellular components interact. In recent years,new experimental methods have immensely increased our ability tomap out these connections. However, it is important to keep inmind that biological systems are constantly evolving to cope withenvironmental changes. What then is the impact of the genomicvariability brought by point mutations, segmental duplications, etc.,on these interaction networks? We have tried here to quantify therate by which protein interactions changed during the evolution ofeukaryotic cells. According to the authors, about 0.5% to 3% of theinteractions can change every million years. Also, protein properties,such as binding specificity (defined as the number of bindingsurfaces or binding partners) and protein function, help determinethe rate of interaction turnover. This work suggests that proteininteractions are evolutionarily plastic and the fact that a group ofproteins has been conserved in different genomes does not meanthat their interaction repertoire and functions are necessarilyconserved. This work emphasizes the importance of studyingbiological systems in the context of evolutionary change.
Specificity and Evolvability in Protein Networks
Reference Database: (1) yeast two-hybrid (including the tworecent high-throughput studies [3,4]); (2) in vitro studies, suchas GST pull-down; and (3) in vivo studies, such as co-immunoprecipitation. The in vivo and in vitro subsetscontain only literature-derived interactions and shouldtherefore be of higher accuracy. The rate of change ofinteractions for these three datasets was 1.09 3 10�5, 7.23 3
10�6, and 7.12 3 10�6, respectively (see Table S1). Thecalculated rate using the high accuracy datasets was verysimilar to the values from the human yeast two-hybrid dataand the data from the other species. We conclude that theorder of magnitude reported is a good approximation for therate of change of eukaryotic protein interactions networks.
The Rate of Change of Interactions Correlates with theNumber of Binding Partners of a Protein in All EukaryoticSpecies Studied
Topological analysis of protein interaction networks hasshown previously that the distribution of the number ofinteractions follows a power law, such that the frequency ofproteins with n interactions falls off as n�a (where alpha is theexponent of the power law) [15]. It has been proposed thatthe observed power law distributions could arise by networkgrowth and preferential attachment, where newly creatednodes would preferentially link to already highly connectednodes [31]. Two independent studies have shown, for S.cerevisiae, preferential attachment in the protein interactionnetwork [11,30], supporting the model proposed for theemergence of the power law distribution (at least in the caseof protein interaction networks).
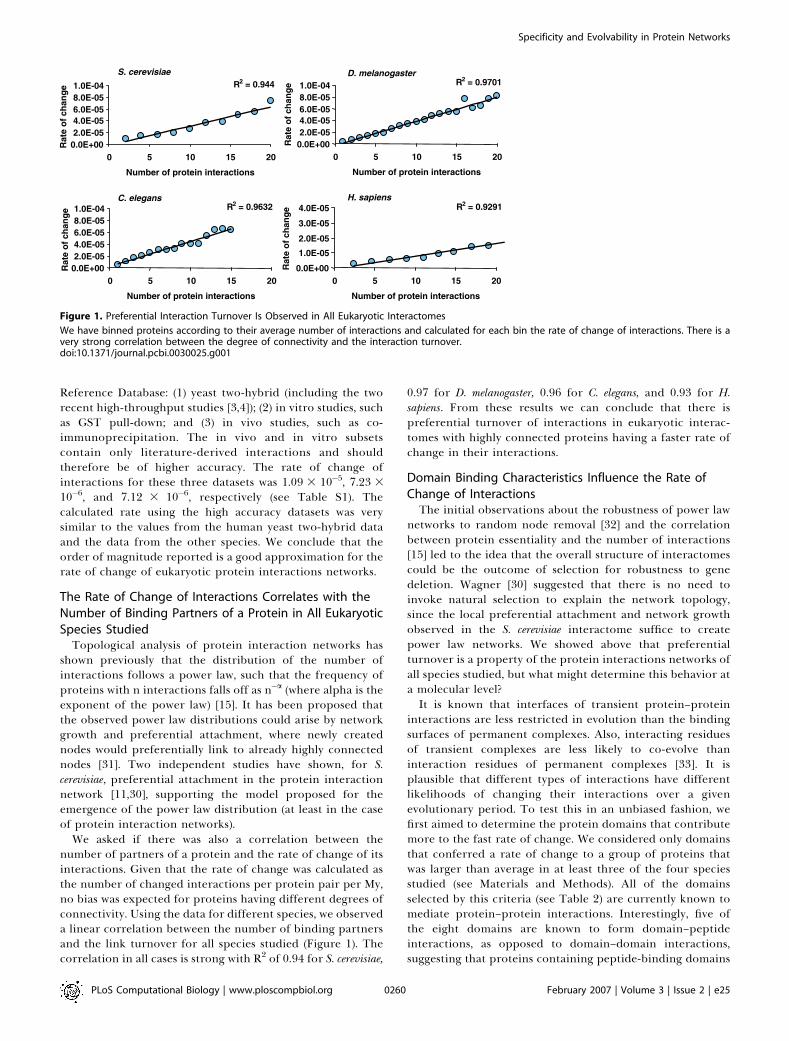
We asked if there was also a correlation between thenumber of partners of a protein and the rate of change of itsinteractions. Given that the rate of change was calculated asthe number of changed interactions per protein pair per My,no bias was expected for proteins having different degrees ofconnectivity. Using the data for different species, we observeda linear correlation between the number of binding partnersand the link turnover for all species studied (Figure 1). Thecorrelation in all cases is strong with R2 of 0.94 for S. cerevisiae,
0.97 for D. melanogaster, 0.96 for C. elegans, and 0.93 for H.sapiens. From these results we can conclude that there ispreferential turnover of interactions in eukaryotic interac-tomes with highly connected proteins having a faster rate ofchange in their interactions.
Domain Binding Characteristics Influence the Rate ofChange of InteractionsThe initial observations about the robustness of power law
networks to random node removal [32] and the correlationbetween protein essentiality and the number of interactions[15] led to the idea that the overall structure of interactomescould be the outcome of selection for robustness to genedeletion. Wagner [30] suggested that there is no need toinvoke natural selection to explain the network topology,since the local preferential attachment and network growthobserved in the S. cerevisiae interactome suffice to createpower law networks. We showed above that preferentialturnover is a property of the protein interactions networks ofall species studied, but what might determine this behavior ata molecular level?It is known that interfaces of transient protein–protein
interactions are less restricted in evolution than the bindingsurfaces of permanent complexes. Also, interacting residuesof transient complexes are less likely to co-evolve thaninteraction residues of permanent complexes [33]. It isplausible that different types of interactions have differentlikelihoods of changing their interactions over a givenevolutionary period. To test this in an unbiased fashion, wefirst aimed to determine the protein domains that contributemore to the fast rate of change. We considered only domainsthat conferred a rate of change to a group of proteins thatwas larger than average in at least three of the four speciesstudied (see Materials and Methods). All of the domainsselected by this criteria (see Table 2) are currently known tomediate protein–protein interactions. Interestingly, five ofthe eight domains are known to form domain–peptideinteractions, as opposed to domain–domain interactions,suggesting that proteins containing peptide-binding domains
Figure 1. Preferential Interaction Turnover Is Observed in All Eukaryotic Interactomes
We have binned proteins according to their average number of interactions and calculated for each bin the rate of change of interactions. There is avery strong correlation between the degree of connectivity and the interaction turnover.doi:10.1371/journal.pcbi.0030025.g001
PLoS Computational Biology | www.ploscompbiol.org February 2007 | Volume 3 | Issue 2 | e250260
Specificity and Evolvability in Protein Networks
are more likely to change their interactions faster over thesame evolutionary time than other types of domains [34].
Many domain–peptide interactions involved a globulardomain binding to a peptide that does not adopt a regularsecondary structure and that is not part of the globularregion of the target protein [35]. Since the interaction area is
small, changes in the critical residues can easily abolishbinding. Also, random point mutations in the proteome canmore easily create new binding sites for these domains. Thiscould explain their fast link turnover.To test this hypothesis further, we analyzed a database
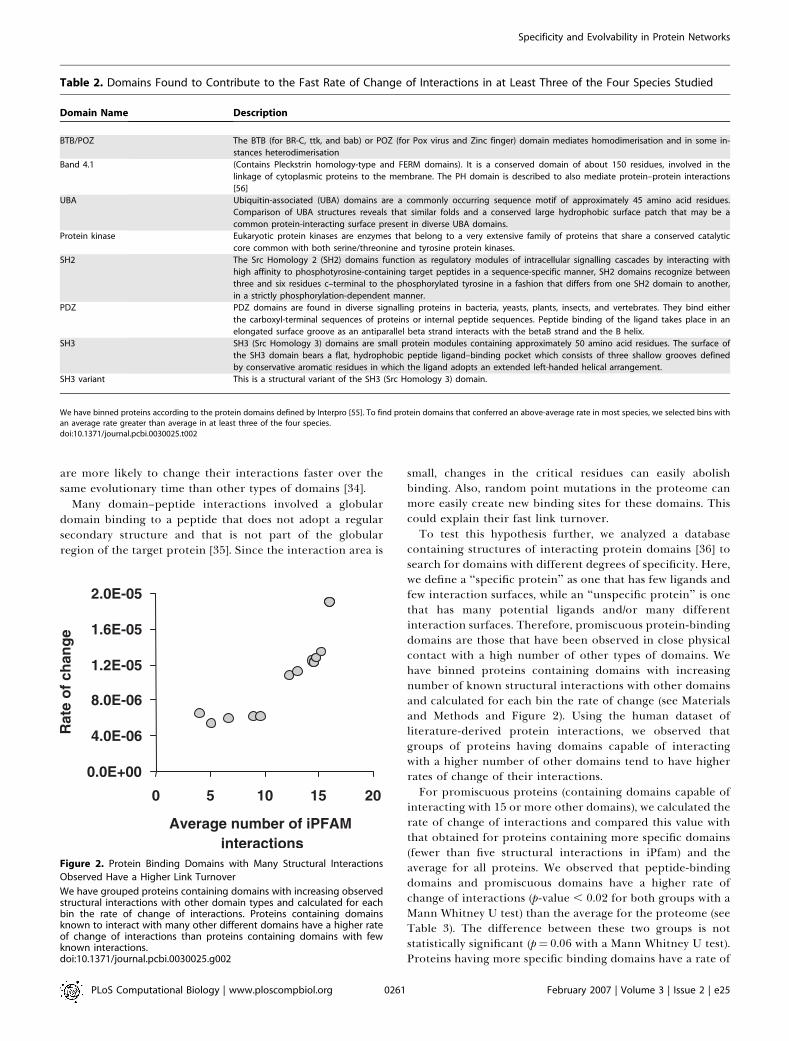
containing structures of interacting protein domains [36] tosearch for domains with different degrees of specificity. Here,we define a ‘‘specific protein’’ as one that has few ligands andfew interaction surfaces, while an ‘‘unspecific protein’’ is onethat has many potential ligands and/or many differentinteraction surfaces. Therefore, promiscuous protein-bindingdomains are those that have been observed in close physicalcontact with a high number of other types of domains. Wehave binned proteins containing domains with increasingnumber of known structural interactions with other domainsand calculated for each bin the rate of change (see Materialsand Methods and Figure 2). Using the human dataset ofliterature-derived protein interactions, we observed thatgroups of proteins having domains capable of interactingwith a higher number of other domains tend to have higherrates of change of their interactions.For promiscuous proteins (containing domains capable of
interacting with 15 or more other domains), we calculated therate of change of interactions and compared this value withthat obtained for proteins containing more specific domains(fewer than five structural interactions in iPfam) and theaverage for all proteins. We observed that peptide-bindingdomains and promiscuous domains have a higher rate ofchange of interactions (p-value , 0.02 for both groups with aMann Whitney U test) than the average for the proteome (seeTable 3). The difference between these two groups is notstatistically significant (p¼ 0.06 with a Mann Whitney U test).Proteins having more specific binding domains have a rate of
Table 2. Domains Found to Contribute to the Fast Rate of Change of Interactions in at Least Three of the Four Species Studied
Domain Name Description
BTB/POZ The BTB (for BR-C, ttk, and bab) or POZ (for Pox virus and Zinc finger) domain mediates homodimerisation and in some in-
stances heterodimerisation
Band 4.1 (Contains Pleckstrin homology-type and FERM domains). It is a conserved domain of about 150 residues, involved in the
linkage of cytoplasmic proteins to the membrane. The PH domain is described to also mediate protein–protein interactions
[56]
UBA Ubiquitin-associated (UBA) domains are a commonly occurring sequence motif of approximately 45 amino acid residues.
Comparison of UBA structures reveals that similar folds and a conserved large hydrophobic surface patch that may be a
common protein-interacting surface present in diverse UBA domains.
Protein kinase Eukaryotic protein kinases are enzymes that belong to a very extensive family of proteins that share a conserved catalytic
core common with both serine/threonine and tyrosine protein kinases.
SH2 The Src Homology 2 (SH2) domains function as regulatory modules of intracellular signalling cascades by interacting with
high affinity to phosphotyrosine-containing target peptides in a sequence-specific manner, SH2 domains recognize between
three and six residues c–terminal to the phosphorylated tyrosine in a fashion that differs from one SH2 domain to another,
in a strictly phosphorylation-dependent manner.
PDZ PDZ domains are found in diverse signalling proteins in bacteria, yeasts, plants, insects, and vertebrates. They bind either
the carboxyl-terminal sequences of proteins or internal peptide sequences. Peptide binding of the ligand takes place in an
elongated surface groove as an antiparallel beta strand interacts with the betaB strand and the B helix.
SH3 SH3 (Src Homology 3) domains are small protein modules containing approximately 50 amino acid residues. The surface of
the SH3 domain bears a flat, hydrophobic peptide ligand–binding pocket which consists of three shallow grooves defined
by conservative aromatic residues in which the ligand adopts an extended left-handed helical arrangement.
SH3 variant This is a structural variant of the SH3 (Src Homology 3) domain.
We have binned proteins according to the protein domains defined by Interpro [55]. To find protein domains that conferred an above-average rate in most species, we selected bins withan average rate greater than average in at least three of the four species.doi:10.1371/journal.pcbi.0030025.t002
Figure 2. Protein Binding Domains with Many Structural Interactions
Observed Have a Higher Link Turnover
We have grouped proteins containing domains with increasing observedstructural interactions with other domain types and calculated for eachbin the rate of change of interactions. Proteins containing domainsknown to interact with many other different domains have a higher rateof change of interactions than proteins containing domains with fewknown interactions.doi:10.1371/journal.pcbi.0030025.g002
PLoS Computational Biology | www.ploscompbiol.org February 2007 | Volume 3 | Issue 2 | e250261
Specificity and Evolvability in Protein Networks
change of interactions not significantly different from theaverage value (p ¼ 0.86 with a Mann Whitney U test).
We have also studied domains with different bindingspecificities as defined by their number of observed physicalinteractions. Using the iPfam [36] database, we were able toassign plausible binding interfaces to roughly 20% of humaninteractome (see Materials and Methods). We then searchedfor proteins that had multiple interactions occurring throughthe same domain, and we compared this group to anotherhaving proteins with a similar number of interactionsthrough more than one domain (see Figure S2). Given thesame number of interactions, proteins that preferentiallybind through one domain (more promiscuous) have onaverage a higher rate of change of interactions than proteinsinteracting through multiple domains. For protein hubshaving 10 to 50 interactions, the rate is 2.2 times higher forthe promiscuous domains (p-value ¼ 0.0089 with a MannWhitney U test) than the more selective domains with thesame average number of interactions.
We conclude from these results that the specificity, asdefined by the number of binding surfaces or physical
interactions, of a binding domain is a strong determinantof the rate of change of interactions, with more promiscuousbinding correlating with higher rates of evolution.
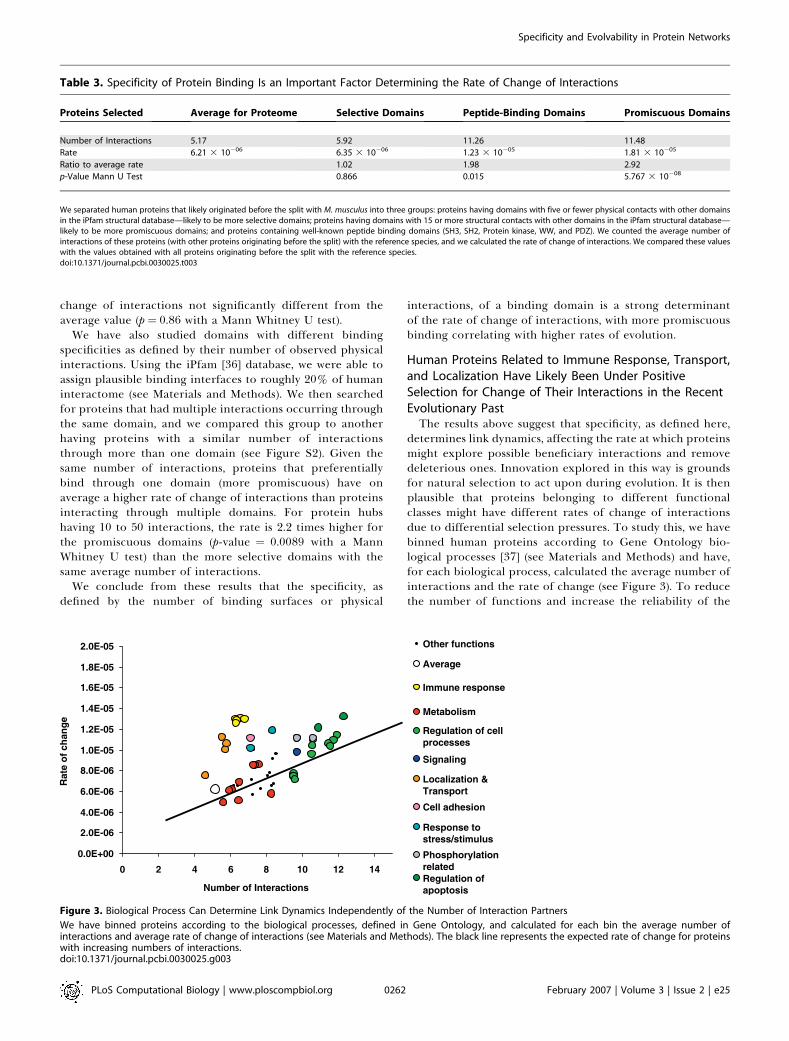
Human Proteins Related to Immune Response, Transport,and Localization Have Likely Been Under PositiveSelection for Change of Their Interactions in the RecentEvolutionary PastThe results above suggest that specificity, as defined here,
determines link dynamics, affecting the rate at which proteinsmight explore possible beneficiary interactions and removedeleterious ones. Innovation explored in this way is groundsfor natural selection to act upon during evolution. It is thenplausible that proteins belonging to different functionalclasses might have different rates of change of interactionsdue to differential selection pressures. To study this, we havebinned human proteins according to Gene Ontology bio-logical processes [37] (see Materials and Methods) and have,for each biological process, calculated the average number ofinteractions and the rate of change (see Figure 3). To reducethe number of functions and increase the reliability of the
Table 3. Specificity of Protein Binding Is an Important Factor Determining the Rate of Change of Interactions
Proteins Selected Average for Proteome Selective Domains Peptide-Binding Domains Promiscuous Domains
Number of Interactions 5.17 5.92 11.26 11.48
Rate 6.21 3 10�06 6.35 3 10�06 1.23 3 10�05 1.81 3 10�05
Ratio to average rate 1.02 1.98 2.92
p-Value Mann U Test 0.866 0.015 5.767 3 10�08
We separated human proteins that likely originated before the split with M. musculus into three groups: proteins having domains with five or fewer physical contacts with other domainsin the iPfam structural database—likely to be more selective domains; proteins having domains with 15 or more structural contacts with other domains in the iPfam structural database—likely to be more promiscuous domains; and proteins containing well-known peptide binding domains (SH3, SH2, Protein kinase, WW, and PDZ). We counted the average number ofinteractions of these proteins (with other proteins originating before the split) with the reference species, and we calculated the rate of change of interactions. We compared these valueswith the values obtained with all proteins originating before the split with the reference species.doi:10.1371/journal.pcbi.0030025.t003
Figure 3. Biological Process Can Determine Link Dynamics Independently of the Number of Interaction Partners
We have binned proteins according to the biological processes, defined in Gene Ontology, and calculated for each bin the average number ofinteractions and average rate of change of interactions (see Materials and Methods). The black line represents the expected rate of change for proteinswith increasing numbers of interactions.doi:10.1371/journal.pcbi.0030025.g003
PLoS Computational Biology | www.ploscompbiol.org February 2007 | Volume 3 | Issue 2 | e250262
Specificity and Evolvability in Protein Networks
calculated rates, we have considered only GO processes withat least 150 proteins present in the current humaninteractome (excluding yeast two-hybrid interactions). Wecompared the values obtained with the expected rates forproteins with increasing average connectivity (black line inFigure 3).
Most groups of proteins had average rates of change thatwere not much different than groups of proteins with asimilar connectivity. Within these groups we could distin-guish between processes that have proteins with similar orlower-than-average rates (such as metabolism) and biologicalprocesses that have above-average rates (such as intracellularsignaling, phosphorylation, regulation of cellular processes,and regulation of apoptosis). These results confirm thesuggestion of Kunin et al. [38] that the functional role ofproteins poses constraints on the evolution of new inter-actions. We suggest this is due to differential usage of proteinbinding specificity in the different cellular processes.
More interestingly, we found some biological processes(immune response, transport and localization, cell adhesion,and response to stress/stimulus) that showed higher linkdynamics than one would expect from their average numberof interactions. On Table 4 we list the biological processesthat have a rate significantly higher (p-value , 0.05 with aMann Whitney U test) than expected from their averageconnectivity.
We redid this analysis removing GO annotations inferredelectronically. Although roughly 50% of the annotations werelost, most of the results remain qualitatively the same(unpublished data). Importantly, we still see GO functionsthat have a rate significantly higher than expected from theiraverage connectivity (organismal physiological process, de-fense response, immune response, and response to bioticstimuli). We hypothesize that the groups of proteins deviatingfrom the linear preferential turnover have been underparticularly strong positive selection for the change of theirinteractions.
Discussion
In the seminal work of King and Wilson [39] (‘‘Evolution attwo levels in humans and chimpanzees’’), it was proposedthat, given the small differences observed between the
proteins in both species, the most likely mechanism thatcould account for the differences between humans andchimpanzees would be changes in gene expression. In fact,in the 30 years following, a considerable amount of evidencehas surfaced to support this view (for a review see [40]).However, as we have shown above, it is quite possible that inthe time since the divergence of these two species, asignificant change in protein interactions could have takenplace, and, therefore, changes in protein interaction net-works can have a similar important role in species evolution.
Calculation of the Rate of Change and Potential CaveatsExtending on the work of Wagner [13,30] for S. cerevisiae, we
have shown here that the interactomes of several eukaryoticspecies have high rates of change of their interactions.According to our calculations, 100 to 1,000 interactions mightchange every My in eukaryotic interactomes. Estimating thatin the current interactomes proteins have on average four toten interactions, then the link turnover would change 0.5% to3% of the interactions every My. This estimate clearly pointsto an important effect of link dynamics in the evolution ofcellular interactions.Some caveats to our estimated rate should be noted.
Namely, we have focused our attention on the evolution ofprotein interactions of single gene duplicates. The effects ofsingle gene duplication could be considerably different fromlarge segment or whole-genome duplication events [41]. If aprotein that is part of a complex duplicates, the changes ingene dosage might unbalance the complex stoichiometry andcause a reduction in fitness to the species [42]. On thecontrary, if the whole complex is duplicated, as would occurin a full-genome duplication event, the balance between thecomplex components would be maintained. We can speculatethat a single-gene duplicate might have a stronger pressure todiverge in its interactions to avoid a gene imbalance effect,when compared with proteins originated from a full-complexduplication. However, it is also known that living systemshave mechanisms to guarantee the right expression levelwhen dealing with important complexes. A good example isthe case of tubulin where the stability of the mRNA dependson the existence of unpaired a or b subunits [43]. In fact, it isalmost impossible to keep the right stoichiometry in acomplex simply due to noise fluctuations, unless there are
Table 4. Biological Processes with Above-Average Rate of Change of Interactions
Biological Process Number of Proteins Rate of Change of Interactions p-Value Mann U Test
Protein transport 272 1.12E-05 0.000627
Establishment of localization 705 8.78E-06 0.000731
Intracellular transport 284 1.01E-05 0.000755
Response to external stimulus 171 1.34E-05 0.001371
Organismal physiological process 619 8.62E-06 0.001461
Response to other organism 211 1.31E-05 0.004489
Response to pest, pathogen, or parasite 206 1.29E-05 0.005542
Response to biotic stimulus 375 1.30E-05 0.011637
Defense response 350 1.28E-05 0.016926
Immune response 327 1.25E-05 0.027447
We have binned proteins according to the biological processes defined in Gene Ontology and selected bins with an average rate that was significantly higher than the expected rate forgroups of proteins with the same average number of interactions.doi:10.1371/journal.pcbi.0030025.t004
PLoS Computational Biology | www.ploscompbiol.org February 2007 | Volume 3 | Issue 2 | e250263
Specificity and Evolvability in Protein Networks
mechanisms that control possible imbalances. Thus, althoughit is intuitive that whole-genome duplication could exert lesspressure for divergence, this does not necessarily need to betrue.
Also, it has been proposed that duplicate genes passthrough a period of relaxed selection after gene duplication[21] possibly accompanied by a relaxation in the selection formaintenance of their interactions. As a result of this, the linkdynamics are likely higher for recently duplicated genes thanfor proteins with established functions. However, experimen-tal studies estimated that 69% to 84% of interactionsbetween ancient proteins have diverged when comparing S.cerevisiae with C. elegans [22]. The authors tested 216interactions that were known from S. cerevisiae among 282 C.elegans proteins (that are conserved in S. cerevisiae). Of these,35 interactions were experimentally observed in C. elegans. Wecan estimate that approximately 5 3 10�6 interactions havechanged per protein pair per My among these ancientproteins. This is roughly half of what we proposed as anestimate for the rate of change for eukaryotic interactomes,but it considers only removal of interactions and notaddition. Due to the reasons mentioned above, we think thatthe rate that we have calculated might be an overestimate ofthe rate for the whole interactome, but currently availabledata suggests that even among ancient proteins there isconsiderable change of their interactions.
Other studies also point to the importance of change ofinteractions after gene duplication. In studies of S. cerevisiaecomplexes, it was observed that 7% to 20% of thosecomplexes arose by duplication [44,45]. However, in most ofthe instances (67% to 90%), only partial duplication wasobserved. Detailed studies of some of the duplicated com-plexes have shown that even in the case where generalfunction and localization is maintained, it is possible that thespecific activity of the complex has changed. These resultssuggest that, at least in the case of protein complexes, there isa very significant gain and loss of single interactions that canlead to the formation of new complexes with differentspecificities.
Binding Properties and Function Determine the Rate ofChange
In a recent review [34], Neduva and Russell postulated thatlinear motifs might act as ‘‘evolutionary interactionsswitches.’’ The authors claimed that, due to binding to alinear peptide stretch and due to the small number ofdeterminants for binding, a random mutation in theproteome can easily create or destroy such binding sites.We have shown that specificity of binding is a key factordetermining the evolvability of the interaction networks.More promiscuous domains, such as peptide binding domainsand domains able to interact with common structuralelements, are more likely to change interactions faster overa given evolutionary period. This implies that some biologicalprocesses where these binding domains are involved (such assignal transduction) will also have a higher link turnover thanothers (such as metabolism). In fact, proteins related tointracellular signaling cascades are two times more likely tointeract with recently duplicated proteins than proteinsinvolved in primary metabolism. If protein properties impacton how they add and lose interactions, then the power lawdistribution observed in protein interaction networks is in
part determined by the cell’s use of different degrees ofbinding specificity.We reported that proteins involved in the immune
response, responses to external stimuli, transport, establish-ment of localization, and organismal physiological processesshow signs of such positive selection for new interactions.Interestingly, most of these biological processes are known tohave an excess of proteins under positive selection as shownby sequence studies [46,47]. Our results suggest that positiveselection for sequence change in proteins is propagated tofaster rates of change at the network level. Alternatively, it ispossible that the preferential fixation of duplicated proteinsinvolved in these biological functions might partly explainthis observation.
Link Dynamics and Cellular EvolutionThis study opens up interesting questions regarding the
evolution of cellular functions. Some challenges faced by thecells require the interaction of several components tointegrate information and provide a solution. One examplewould be the decision to divide or differentiate given a set ofexternal conditions. It could be said that these challengesrequire a network solution as opposed to some metabolicproblems, such as adapting an enzyme to do a requiredmetabolic step.In network challenges as defined above, selection forces
would not restrain the exact binary interactions, but ratherthe functional complexes arising from them. It is plausiblethat the fast link dynamics are then advantageous to the cell,given that it allows for exploration of different networkconformations from where innovation might arise.If there is indeed a fast turnover of interactions that are
material for selection to act upon, then we expect to seeconvergent network motifs that are optimal for solvingparticular cellular problems. An example of what might bean optimal network solution is the coupling of slow and fastpositive feedbacks in cell decision processes [48].If fast link dynamics is important for the cell to search for
optimal solutions to network problems, then is it also likelythat the rate of change itself might be under constraint andtherefore under natural selection. Hence, during cellularevolution, the selection of different degrees of specificity isnot only important for the functional role of the proteins butit also has direct consequences with regard to the evolvabilityof the whole cellular network.Further work on protein interaction maps will help us
understand to what extent evolvability constrains the differ-ential usage of protein domains in cellular networks. As wasthe case for comparative genomics, the availability of moreand complete interactomes for different species will vastlyincrease our understanding of how the cell’s complexityarises from the interactions of its components and evolves tocope with changing environments.
Materials and Methods
Estimating protein time of origin. For each protein of S. cerevisiae,D. melanogaster, C elegans, and H. sapiens, we have established a likelytime of origin by looking for putative orthologs in several other fullysequenced genomes (that we refer to here as reference species) usingthe orthologs defined in the Inparanoid database (http://inparanoid.sbc.su.se [49]). For the species not covered in the Inparanoiddatabase, we have used the reciprocal BLAST best-hit method.Succinctly, we considered that if two proteins were the reciprocal
PLoS Computational Biology | www.ploscompbiol.org February 2007 | Volume 3 | Issue 2 | e250264
Specificity and Evolvability in Protein Networks
best blast hit between two species, then these proteins are likelyorthologs.
We established putative orthologs between S. cerevisiae and thefollowing species: S. bayanus, Candida glabrata, Kluyveromyces lactis, Asphisgossypii, C. albicans, Debaryomyces hansenii, Yarrowiya lipolytica, Neurosporacrassa, Schizosaccharomyces pombe. For D. melanogaster, we used asreference species D. pseudoobscura, Anolpheles gambiae, C. elegans, andS. cerevisiae. For H. sapiens proteins we have looked for putativeorthologs in Mus musculus, Fugu rubripes, D. melanogaster, and S.cerevisiae. For C. elegans proteins, we have searched for putativeorthologs in C. briggsae, D. melanogaster, and S. cerevisiae.
We considered that proteins with no apparent ortholog in any ofthe reference species likely originated after the divergence of themost recently diverged reference species. S. cerevisiae proteins with noputative ortholog in any of the reference species most likelyoriginated after the divergence of S. cerevisiae and S. bayanus, ;20My ago [50]. D. melanogaster proteins with no apparent ortholog areyounger than the split with D. pseudoobscura (;40 My ago) [51]. C.elegans proteins with no apparent ortholog are younger than the splitwith C. briggsae (;100 My ago) [52]. H. sapiens proteins with noapparent ortholog is younger than the split with M. musculus (;70 Myago) [53].
Calculating the rate of change of interactions. The interactomesused for C. elegans, S. cerevisiae, and D. melanogaster were extracted fromBIND (http://bind.ca [54]), including only direct protein–proteininteractions. To create the human interactome used here, we addedprotein interactions from two recent studies of yeast two-hybridstudies [3,4] to the literature-derived interactions compiled in thehuman protein reference database (taking only direct protein–protein interactions) [2].
We considered that an interaction was inherited in the process ofduplication when an interaction to a recently duplicated protein wasalso observed with its closest homolog. Removing these interactionswe were left with protein interactions that were either gained in thecopy we are considering or were inherited by duplication andsubsequently lost in the homolog. Either of these cases represents anevent of interaction change that occurred after the gene duplicationevent.
The rate of change of interactions can be calculated by: rate ¼changed interactions/(possible protein pairs * divergence time).Designating the recently duplicated proteins as Pnew and proteinsoriginated before the split with the most recently diverged referencespecies as Pold, then: changed interactions ¼ changed interactionsamong Pnew þ changed interactions between Pnew and Pold. Possibleprotein pairs¼ Pnew * Pold þ (Pnew * (Pnew� 1)/2). Divergence time¼divergence time of the most recently diverged reference species (seeabove).
Preferential interaction change, protein domains, and biologicalprocesses. To determine if the number of interaction partners of aprotein correlates with the rate of change of interactions, we havebinned all proteins in Pold according to the number of interactions toother proteins in Pold. We considered bins of proteins with i to iþ 5interactions, with i ranging from one to 20. For each of these bins,Pold(bin), the rate of change of interactions was considered to be: rateof change (bin) ¼ changed interactions between Pnew and Pold(bin)/(Pold(bin) 3 Pnew 3 divergence time).
We observed a very strong preferential turnover in all species suchthat proteins with a higher degree of connectivity have a higher rateof change. For proteins with k interactions, the rate of change, r, canbe calculated by:
rðH:sapiensÞ ¼ 93 10�7 � k� 93 10�7
rðD:melanogasterÞ ¼ 43 10�6k� 23 10�6
rðC:elegansÞ ¼ 43 10�6 � k� 73 10�7
rðS:cerevisiaeÞ ¼ 33 10�6k� 23 100�6
rðC:elegansÞ ¼ 43 10�6 � k� 73 10�6
To determine which domains correlated with higher rates of changeof interactions, we binned proteins in Pold according to the proteindomains defined by Interpro [55]. For each protein domain, weretrieved all proteins in Pold where this domain was observed andcalculated the rate of change of interactions as above. To selectprotein domains that conferred an above-average rate in most
species, we selected bins with at least 20 proteins (to increase thereliability of the calculated rate) and with a rate greater than averagein at least three of the four species. There are 96 protein domainsthat are represented by 20 or more proteins in at least three species.Of these, eight have an above average rate of change in at least threeof the four species studied. The effect of both constrains (number ofproteins and average rate) is detailed in Table S2.
To study protein domains with different binding specificity, webinned proteins containing domains with increasing number ofinteractions with other domains (extracted from the iPfam database)and calculated for each bin the rate of change. We considered bins ofproteins in Pold having proteins domains with i to i þ 10 iPfaminteractions with i ranging from one to 15. We calculated the rate ofchange (bin) as above.
We have used the iPfam database to search for plausible bindinginterfaces in all human interactions derived from the human proteinreference database. We could assign a possible binding interface to;20% of the human interactome. We then built two groups ofproteins according to the number of binding interactions perdomain. We selected a group of proteins that had three or moreinteractions through one domain (likely more promiscuous domains),and a second group of proteins that interacted with three or morepartners via multiple domains (likely more selective domains). Wethen further subdivided the two groups into bins protein with i to iþ5 interactions with i ranging from five to 15 and calculated the rate(bin) as above (see Figure S1).
To study the different biological processes, we have binnedproteins in Pold according to the biological processes defined inGene Ontology [37] (downloaded from http://www.geneontology.orgon 29 January 2006). For each Gene Ontology biological process, wehave selected all proteins defined as participating in that biologicalprocess or any of its GO term children processes. For all such bins ofproteins, we have calculated the rate of change of interactions asabove.
Supporting Information
Figure S1. Dependence of the Calculated Rate of Change andFraction of Conserved Interactions After Duplication on NetworkSize
(A,B) Sampling of S. cerevisiae interactome. (C,D) Sampling of D.melanogaster interactome. (E,F) Sampling of H. sapiens interactome.(G,H) Sampling of C. elegans interactome.(A,C,E,G) Sampling was done by randomly removing interactions.Any protein with no interaction is no longer considered as part ofinteractome.(B,D,F,H) Sampling was done by randomly removing proteins andtheir interactions. Any protein with no interaction is no longerconsidered as part of interactome. Filled squares (&), rate of change ofinteractions. Open squares (&), fraction of interactions conservedafter duplication.
Found at doi:10.1371/journal.pcbi.0030025.sg001 (48 KB PDF).
Figure S2. Specificity of Binding Can Determine the Rate Change ofInteractions in Groups of Proteins with the Same Connectivity
(A) We binned all proteins according to the number of interactionswith proteins originated before the split with the reference speciesand calculated the rates of change of interactions with recentlyduplicated proteins.(B) We mapped the most likely interacting domains in the humaninteractome using the database of interacting motifs. We selected twogroups of proteins: blue circles (�), proteins having three or moreinteractions through at least two or more domains; red circles (�),proteins having three or more interactions through the same domain.We binned both groups according to the number of interactionsoccurring in the full interactome with proteins originated before thesplit with the reference species and calculated the rates of change ofinteractions with recently duplicated proteins.
Found at doi:10.1371/journal.pcbi.0030025.sg002 (36 KB PDF).
Table S1. The Estimated Rate Calculated Is Robust to Variation inAccuracy of the Datasets Used
To test for a possible bias of the experimental method used indetermining protein interactions, we divided the interactions of thehuman dataset into three subsets, as defined in the Human ProteinReference Database: yeast two-hybrid, in vitro studies such as GSTpull-down, and in vivo studies such as co-immunoprecipitation. The
PLoS Computational Biology | www.ploscompbiol.org February 2007 | Volume 3 | Issue 2 | e250265
Specificity and Evolvability in Protein Networks
estimated rate of change of interactions calculated with the yeast two-hybrid method (including human high-throughput studies) was onlymarginally higher than those observed with the other two datasets(obtained exclusively from literature-derived protein interactions).
Found at doi:10.1371/journal.pcbi.0030025.st001 (31 KB DOC).
Table S2. Impact of Constraining the List of Domains by Represen-tation in the Difference Species and by the Average Rate of Change
To increase the reliability of the rate of change for each domain, wehave selected only domains that were represented in most species byat least 20 domains. Of all Interpro domains, 96 observe thiscondition. Of these 96 domains, eight have an above average rateof change for at least three species studied. We can say that theseeight domains consistently contribute to the fast rate of change inmost species.
Found at doi:10.1371/journal.pcbi.0030025.st002 (26 KB DOC).
Acknowledgments
We are grateful to Martin Lercher, Ignacio Enrique Sanchez, MarkIsalan, Caroline Lemerle, and Silvia Santos for useful criticism anddiscussion. Pedro Beltrao is supported by a grant from Fundacao paraa Ciencia e Tecnologia through the Graduate Programme in Areas ofBasic and Applied Biology.
Author contributions. PB and LS analyzed the data and wrote thepaper. PB contributed reagents/materials/analysis tools.
Funding. The authors received no specific funding for this study.Competing interests. The authors have declared that no competing
interests exist.
References1. Walhout AJ, Sordella R, Lu X, Hartley JL, Temple GF, et al. (2000) Protein
interaction mapping in C. elegans using proteins involved in vulvaldevelopment. Science 287: 116–122.
2. Peri S, Navarro JD, Amanchy R, Kristiansen TZ, Jonnalagadda CK, et al.(2003) Development of human protein reference database as an initialplatform for approaching systems biology in humans. Genome Res 13:2363–2371.
3. Stelzl U, Worm U, Lalowski M, Haenig C, Brembeck FH, et al. (2005) Ahuman protein–protein interaction network: A resource for annotating theproteome. Cell 122: 957–968.
4. Rual JF, Venkatesan K, Hao T, Hirozane-Kishikawa T, Dricot A, et al. (2005)Towards a proteome-scale map of the human protein–protein interactionnetwork. Nature 437: 1173–1178.
5. Giot L, Bader JS, Brouwer C, Chaudhuri A, Kuang B, et al. (2003) A proteininteraction map of Drosophila melanogaster. Science 302: 1727–1736.
6. Ho Y, Gruhler A, Heilbut A, Bader GD, Moore L, et al. (2002) Systematicidentification of protein complexes in Saccharomyces cerevisiae by massspectrometry. Nature 415: 180–183.
7. Gavin AC, Bosche M, Krause R, Grandi P, Marzioch M, et al. (2002)Functional organization of the yeast proteome by systematic analysis ofprotein complexes. Nature 415: 141–147.
8. Uetz P, Giot L, Cagney G, Mansfield TA, Judson RS, et al. (2000) Acomprehensive analysis of protein–protein interactions in Saccharomycescerevisiae. Nature 403: 623–627.
9. Ito T, Chiba T, Ozawa R, Yoshida M, Hattori M, et al. (2001) Acomprehensive two-hybrid analysis to explore the yeast protein inter-actome. Proc Natl Acad Sci U S A 98: 4569–4574.
10. Fraser HB, Hirsh AE, Steinmetz LM, Scharfe C, Feldman MW (2002)Evolutionary rate in the protein interaction network. Science 296: 750–752.
11. Eisenberg E, Levanon EY (2003) Preferential attachment in the proteinnetwork evolution. Phys Rev Lett 91: 138701.
12. Berg J, Lassig M, Wagner A (2004) Structure and evolution of proteininteraction networks: A statistical model for link dynamics and geneduplications. BMC Evol Biol 4: 51.
13. Wagner A (2001) The yeast protein interaction network evolves rapidly andcontains few redundant duplicate genes. Mol Biol Evol 18: 1283–1292.
14. Yeger-Lotem E, Sattath S, Kashtan N, Itzkovitz S, Milo R, et al. (2004)Network motifs in integrated cellular networks of transcription–regulationand protein–protein interaction. Proc Natl Acad Sci U S A 101: 5934–5939.
15. Jeong H, Mason SP, Barabasi AL, Oltvai ZN (2001) Lethality and centralityin protein networks. Nature 411: 41–42.
16. Qin H, Lu HH, Wu WB, Li WH (2003) Evolution of the yeast proteininteraction network. Proc Natl Acad Sci U S A 100: 12820–12824.
17. Dujon B, Sherman D, Fischer G, Durrens P, Casaregola S, et al. (2004)Genome evolution in yeasts. Nature 430: 35–44.
18. Dietrich FS, Voegeli S, Brachat S, Lerch A, Gates K, et al. (2004) The Ashbyagossypii genome as a tool for mapping the ancient Saccharomyces cerevisiaegenome. Science 304: 304–307.
19. Kellis M, Birren BW, Lander ES (2004) Proof and evolutionary analysis ofancient genome duplication in the yeast Saccharomyces cerevisiae. Nature 428:617–624.
20. Gao LZ, Innan H (2004) Very low gene duplication rate in the yeastgenome. Science 306: 1367–1370.
21. Lynch M, Conery JS (2000) The evolutionary fate and consequences ofduplicate genes. Science 290: 1151–1155.
22. Matthews LR, Vaglio P, Reboul J, Ge H, Davis BP, et al. (2001) Identificationof potential interaction networks using sequence-based searches forconserved protein–protein interactions or ‘‘interologs.’’ Genome Res 11:2120–2126.
23. Yu H, Luscombe NM, Lu HX, Zhu X, Xia Y, et al. (2004) Annotation transferbetween genomes: Protein–protein interologs and protein–DNA regulogs.Genome Res 14: 1107–1118.
24. Cesareni G, Ceol A, Gavrila C, Palazzi LM, Persico M, et al. (2005)Comparative interactomics. FEBS Lett 579: 1828–1833.
25. Gandhi TK, Zhong J, Mathivanan S, Karthick L, Chandrika KN, et al. (2006)
Analysis of the human protein interactome and comparison with yeast,worm and fly interaction datasets. Nat Genet 38: 285–293.
26. Kelley BP, Yuan B, Lewitter F, Sharan R, Stockwell BR, et al. (2004)PathBLAST: A tool for alignment of protein interaction networks. NucleicAcids Res 32: W83–W88.
27. Sharan R, Suthram S, Kelley RM, Kuhn T, McCuine S, et al. (2005)Conserved patterns of protein interaction in multiple species. Proc NatlAcad Sci U S A 102: 1974–1979.
28. Flannick J, Novak A, Srinivasan BS, McAdams HH, Batzoglou S (2006)Graemlin: General and robust alignment of multiple large interactionnetworks. Genome Res 16: 1169–1181.
29. Hedges SB (2002) The origin and evolution of model organisms. Nat RevGenet 3: 838–849.
30. Wagner A (2003) How the global structure of protein interaction networksevolves. Proc Biol Sci 270: 457–466.
31. Barabasi AL, Albert R (1999) Emergence of scaling in random networks.Science 286: 509–512.
32. Albert R, Jeong H, Barabasi AL (2000) Error and attack tolerance ofcomplex networks. Nature 406: 378–382.
33. Mintseris J, Weng Z (2005) Structure, function, and evolution of transientand obligate protein–protein interactions. Proc Natl Acad Sci U S A 102:10930–10935.
34. Neduva V, Russell RB (2005) Linear motifs: Evolutionary interactionswitches. FEBS Lett 579: 3342–3345.
35. Cesareni G, Gimona M, Sudol M, Yaffe Meditors (2004) Modular proteindomains. Weinheim: Wiley InterScience. 524 p.
36. Finn RD, Marshall M, Bateman A (2005) iPfam: Visualization of protein–protein interactions in PDB at domain and amino acid resolutions.Bioinformatics 21: 410–412.
37. Ashburner M, Ball CA, Blake JA, Botstein D, Butler H, et al. (2000) Geneontology: Tool for the unification of biology. The Gene OntologyConsortium. Nat Genet 25: 25–29.
38. Kunin V, Pereira-Leal JB, Ouzounis CA (2004) Functional evolution of theyeast protein interaction network. Mol Biol Evol 21: 1171–1176.
39. King MC, Wilson AC (1975) Evolution at two levels in humans andchimpanzees. Science 188: 107–116.
40. Carroll SB (2005) Evolution at two levels: On genes and form. PLoS Biol 3:e245.
41. Conant GC, Wolfe KH (2006) Functional partitioning of yeast co-expression networks after genome duplication. PLoS Biol 4: e109.
42. Papp B, Pal C, Hurst LD (2003) Dosage sensitivity and the evolution of genefamilies in yeast. Nature 424: 194–197.
43. Cleveland DW, Lopata MA, Sherline P, Kirschner MW (1981) Unpolymer-ized tubulin modulates the level of tubulin mRNAs. Cell 25: 537–546.
44. Pereira-Leal JB, Levy ED, Teichmann SA (2006) The origins and evolutionof functional modules: Lessons from protein complexes. Philos Trans R SocLond B Biol Sci 361: 507–517.
45. Pereira-Leal JB, Teichmann SA (2005) Novel specificities emerge bystepwise duplication of functional modules. Genome Res 15: 552–559.
46. Clark AG, Glanowski S, Nielsen R, Thomas PD, Kejariwal A, et al. (2003)Inferring nonneutral evolution from human–chimp–mouse orthologousgene trios. Science 302: 1960–1963.
47. Nielsen R, Bustamante C, Clark AG, Glanowski S, Sackton TB, et al. (2005) Ascan for positively selected genes in the genomes of humans andchimpanzees. PLoS Biol 3: e170.
48. Brandman O, Ferrell JE Jr, Li R, Meyer T (2005) Interlinked fast and slowpositive feedback loops drive reliable cell decisions. Science 310: 496–498.
49. O’Brien KP, Remm M, Sonnhammer EL (2005) Inparanoid: A comprehen-sive database of eukaryotic orthologs. Nucleic Acids Res 33: D476–D480.
50. Kellis M, Patterson N, Endrizzi M, Birren B, Lander ES (2003) Sequencingand comparison of yeast species to identify genes and regulatory elements.Nature 423: 241–254.
51. Richards S, Liu Y, Bettencourt BR, Hradecky P, Letovsky S, et al. (2005)Comparative genome sequencing of Drosophila pseudoobscura: Chromosomal,gene, and cis-element evolution. Genome Res 15: 1–18.
PLoS Computational Biology | www.ploscompbiol.org February 2007 | Volume 3 | Issue 2 | e250266
Specificity and Evolvability in Protein Networks
52. Coghlan A, Wolfe KH (2002) Fourfold faster rate of genome rearrangementin nematodes than in Drosophila. Genome Res 12: 857–867.
53. Murphy WJ, Eizirik E, O’Brien SJ, Madsen O, Scally M, et al. (2001)Resolution of the early placental mammal radiation using Bayesianphylogenetics. Science 294: 2348–2351.
54. Alfarano C, Andrade CE, Anthony K, Bahroos N, Bajec M, et al. (2005) The
Biomolecular Interaction Network Database and related tools 2005 update.Nucleic Acids Res 33: D418–D424.
55. Mulder NJ, Apweiler R, Attwood TK, Bairoch A, Bateman A, et al. (2005)InterPro, progress and status in 2005. Nucleic Acids Res 33: D201–D205.
56. Lemmon MA (2003) Phosphoinositide recognition domains. Traffic 4: 201–213.
PLoS Computational Biology | www.ploscompbiol.org February 2007 | Volume 3 | Issue 2 | e250267
Specificity and Evolvability in Protein Networks


