Embed Size (px)
Citation preview
The Ontogeny of Holocene and Late PleistoceneHuman Postcranial Strength
Libby W. Cowgill*
Department of Anthropology, University of Central Florida, Orlando, FL 32816-1361
KEY WORDS growth; Neandertal; humerus; femur
ABSTRACT While a wide variety of studies havefocused on population variation in adult cross-sectionalproperties, relatively little is known about populationvariation in postcranial robusticity in immature individ-uals. Furthermore, the age at which the population dif-ferences readily detected in adults manifest duringgrowth is also unknown. This research addresses thesegaps in our current understanding through the analysisof immature humeral and femoral long bone strength.Cross-sectional geometry was used to compare the devel-opmental trajectories of diaphyseal strength in LatePleistocene Neandertal and modern human subadults toa sample of immature humans from seven geographi-cally diverse Holocene populations. Population differ-ences in size-standardized cross-sectional properties appear
to be systemic and develop very early in ontogeny in theHolocene sample. In many cases, these differences arepresent before one year of age. In general, the Late Pleis-tocene fossil samples fit within the range of recent humanvariation in long bone strength. Population differencesdetected here are likely related to a combination of factorsincluding activity patterns, genetic propensities, andnutritional status. These results highlight the complexmosaic of processes that result in adult postcranial robus-ticity, and suggest that further exploration of the develop-mental interplay between intrinsic and extrinsic influ-ences on skeletal robusticity will likely enhance ourunderstanding of adult postcranial morphology. Am JPhys Anthropol 141:16–37, 2010. VVC 2009 Wiley-Liss, Inc.
Cross-sectional geometry has proven to be a valuabletool for reconstructing the activity patterns of botharchaeological and paleontological human groups forover 30 years. Holocene and Late Pleistocene skeletalrobusticity has been frequently investigated, and therange of variation of adult postcranial strength duringthese time periods is reasonably well established. Stud-ies of adult remains have identified several consistenttrends in postcranial strength that vary both temporallyand spatially (Kimura and Takahashi, 1982; Ruff et al.,1993; Trinkaus, 1997; Churchill et al., 2000; Shackelford,2005). These analyses have highlighted biobehavioralcontrasts and similarities among Neandertals, earlymodern humans, and recent human populations in bothhabitual limb use and levels of populational mobility.Although the body of research exploring ontogenetic
acquisition of postcranial robusticity is relatively smallerthan that focusing on adults, this slowly growing area ofinquiry has contributed much to current understandingof the developmental processes underlying adult longbone strength (Van Gerven et al., 1985; Ruff et al., 1994;Sumner and Andriacchi, 1996; Trinkaus and Ruff, 1996;Nelson and Thompson, 2000; Kondo and Dodo, 2002a,b;Trinkaus et al., 2002a,b; Ruff, 2003a,b; Ramsay et al.,2005; Thompson and Nelson, 2005; Cowgill and Hagar,2007; Cowgill et al., 2007; Robbins, 2007). While severalstudies have explored long bone strength in recenthuman children with important results (Van Gerven etal., 1985; Sumner and Andriacchi, 1996; Ruff, 2003a,b),few have looked at developmental variation in long bonestrength in multiple populations. In addition, analyses ofimmature Late Pleistocene individuals have frequentlybeen hampered by small sample sizes or limited to theanalysis of a single individual. Nonetheless, Late Pleisto-cene immature postcrania follow patterns similar to
those of adults: in general, many are relatively robust,with large cross-sectional areas and/or great torsionalstrength, but they tend to fall well within the range ofrecent human variation (Ruff et al., 1994; Trinkaus andRuff, 1996; Odwak, 2000; Kondo and Dodo, 2002a;Trinkaus et al., 2002a,b; Cowgill et al., 2007).These studies are of particular interest, as recently
several researchers have suggested that mechanicalloading before maturity may have a disproportionateeffect on levels of adult postcranial strength (Liebermanet al., 2001; Lovejoy et al., 2002, 2003; Pearson and Lie-berman, 2004). In an experimental study of diaphsysealresponse to mechanical loading in sheep, Leibermanet al. (2001) detected significant differences in cross-sec-tional properties between exercised and control animals,but found that these differences occurred primarily injuveniles. In addition, Lovejoy et al. (2003) has sug-gested that adult bone structure is primarily a productof genetic background and subadult activities.These critiques are certainly not without merit, given
that human growth does not occur in a biomechanical
Grant sponsor: Leakey Foundation, Wenner-Gren Foundation.Grant sponsor: NSF; Grant number: BCS-0549925.
*Correspondence to: Libby W. Cowgill, Department of Anthropol-ogy, University of Central Florida, 4000 Central Florida Blvd.,Howard Phillips Hall, 309 Orlando, FL 32816-1361, USA.E-mail: [email protected]
Received 17 December 2008; accepted 23 April 2009
DOI 10.1002/ajpa.21107Published online 15 June 2009 in Wiley InterScience
(www.interscience.wiley.com).
VVC 2009 WILEY-LISS, INC.
AMERICAN JOURNAL OF PHYSICAL ANTHROPOLOGY 141:16–37 (2010)
vacuum. It is unlikely that there is a developmentalrubicon before which mechanical forces are not influen-tial in shaping skeletal morphology, and they may evenplay a role in the earliest phases of limb morphogenesis(Henderson and Carter, 2002). Several studies havedocumented the effects of fetal immobilization on longbone growth, and suggested that normal osteological de-velopment is dependent on intermittent muscular con-tractions in utero (Hall, 1972; Rodrıguez et al., 1988). Fi-nite element models of ossification patterns in the carti-laginous fetal femur imply that diaphyseal shear stressis essential for the regulation of ossification duringgrowth (Carter et al., 1987; Carter and Wong, 1988; Car-ter and Beaupre, 2001), further highlighting the factthat the relationship between bone and its mechanicalenvironment is critical even prior to birth.A variety of research on animal and human models
supports the idea that elevated levels of mechanicalloading in growing bone result in increased bone mate-rial and geometric properties (Woo et al., 1981; Bieweneret al., 1986; McCulloch et al., 1992; Conroy et al., 1993;Grimston et al., 1993; Slemenda and Johnston, 1993;Biewener and Bertram, 1994; Kanuus et al., 1995; Mos-ley et al., 1997; Haapasalo, 1998; Haapasalo et al., 1998;Nordstrom et al., 1998; Schonau, 1998; Pettersson et al.,2000a,b; Soderman et al., 2000; Bass et al., 2002; Kontu-lainen et al., 2003). In fact, the combination of hormonalfactors unique to the growth period may serve to makeimmature bone even more sensitive to mechanical load-ing than adult bone (Steinberg and Trueta, 1981; Raabet al., 1990). Steinberg and Trueta (1981) compared boneresponse to treadmill running in young and mature ratsand found that while the bones of young rats had signifi-cantly greater bone density and cortical thickness asearly as 1 week after the start of the experiment, thebone of mature rats showed no alterations. In clinicalstudies of human children, only very moderate levels ofexercise were found necessary to elicit an osteogenicresponse (Bradney et al., 1998; McKay et al., 2000).Lastly, the positive effects of exercise on bone mass
during growth are long-lasting. In a study of retireddancers, self-reported hours of ballet class between theages of 10 and 12 were positively correlated with bonemineral density in adults (Khan et al., 1998). Retiredgymnasts, soccer players, weightlifters, and even recrea-tional exercisers show similar benefits (Kriska et al.,1988; Teegarden et al., 1996; Bass et al., 1998; Mickles-field et al., 2003). The osteological benefits of mechanicalloading during growth can be detected in retired adultsfor up to 20 years (Karlsson et al., 1995).Despite the wealth of evidence that mechanical load-
ing is instrumental in directing diaphyseal modeling
during growth, it is highly unlikely that this single fac-tor acts alone. Both genetic propensities and systemicnutritional factors likely play a complex role in corticalbone growth and maintenance by affecting bone metabo-lism and turnover and may alter mechanosensitivity tobiomechanical stimulation (Adams, 1968; Kodama et al.,2000). The examination of the development of popula-tion-level differences in long bone strength over thecourse of growth may permit the exploration of the com-plex interchange among loading, genetics, and nutrition,providing further information about the intrinsic andextrinsic factors that influence cortical bone geometryover the life history of an individual.
RESEARCH OBJECTIVES
The goal of this research is to compare the develop-ment of femoral and humeral robusticity in a diversesample of immature Holocene and Late Pleistoceneremains in order to establish when population-level dif-ferences in postcranial strength develop during growth.Three research questions will be addressed:
1. Do populations differ in femoral and humeralstrength before maturity?
2. If so, when do these differences emerge during ontog-eny?
3. Do immature Late Pleistocene Neandertals and earlymodern humans differ from Holocene groups in theirlevels of humeral and femoral robusticity?
MATERIALS
The primary data for this analysis consist of righthumeral and femoral cross-sectional properties fromseven Holocene samples and a sample of Late Pleisto-cene Neandertals and early modern humans, all lessthan eighteen years of age.
Holocene samples
Cross-sectional properties from a total of 522 femoraand 424 right humeri were collected from immature Hol-ocene individuals. The seven Holocene samples wereselected to represent the broadest possible range of timeperiods, geographic locations, and subsistence strategies.As such, these sampled populations vary in genetic back-ground, daily activity levels, body proportions, and otherintrinsic and extrinsic factors that may play a role inpostcranial strength. In addition, diet and health waslikely highly variable, with at least one sample (Kulub-
TABLE 1. Sample description, size, and subsistance strategy
Sample LocationApprox. time
period SubsistanceHumeri
sample sizeFemora
sample size
CaliforniaAmerindian
Northern California 500–4600 BP Hunters and gatherers(semisedentary)
63 92
Dart Johannesburg, South Africa 20th century Mixed urban and rural 72 73Indian Knoll Green River, Kentucky 4143–6415 BP Hunters and gatherers
(semisedentary)88 95
Kulubnarti Batn el Hajar, Upper Nubia Medieval Agriculturalist 92 98Luis Lopes Lisbon, Portugal 20th century Urban 27 47Mistihalj Bosnia-Herzegovina Medieval (15th
century)Pastoralists 45 52
Point Hope Point Hope, Alaska 300–2100 BP Arctic hunters and gatherers 37 65
17ONTOGENY OF POSTCRANIAL STRENGTH
American Journal of Physical Anthropology
narti) showing clear indications of persistent nutritionaldeprivation (Van Gerven et al., 1995). Detailed descrip-tions of all of the Holocene samples are provided in theappendix. Table 1 includes samples sizes, locations, timeperiods, general subsistence strategies.
Late Pleistocene samples
The 75 immature Late Pleistocene specimens used inthis analysis are presented in Table 2. While I collectedthe majority of the Late Pleistocene data from the origi-nal fossil specimens, data for this analysis were collectedfrom plastic casts in three instances (Amud 7, TeshikTash 1, and Balla 1, limited to measurements of totalarea only); from published sources for six individuals(Dederiyeh 1 and 2, Arene Candide 1, Dolnı Vestonice14, Lagar Velho 1, Yamashita-cho 1); and from previ-ously unpublished data provided by Erik Trinkaus forsix individuals (Kiik Koba 2, Krapina 168 and 177,Skhul 1, Sunghir 2 and 3).While fetal material was generally excluded from the
comparative sample, less stringent criteria wereemployed in the Late Pleistocene fossil group. At 68 and63 mm, respectively, La Ferrassie 5 and Cro-Magnon 5Dpossess estimated femoral lengths that are small for afull-term infant (Fazekas and Kosa, 1978). However,given modern human variation in long bone length atbirth and the difficulty with directly applying modernhuman standards to Late Pleistocene infants, La Ferras-sie 5 and Cro-Magnon 5D are included in this analysis.
Late Pleistocene archaic humans. The geographicrange for this sample spans sites in France (La Ferras-sie, Le Moustier, Roc de Marsal), Germany (Ehrings-dorf), Spain (Cova Negra), Italy (Buca del Tasso), Croatia(Krapina), Israel (Amud), Syria (Dederiyeh), Ukraine(Kiik Koba), and Uzbekistan (Teshik Tash). While thedegree of precision with which this sample has beendated varies widely, the geological time frame of the ar-chaic fossil group ranges from �40,000 BP to 200,000 BPyears.
Late Pleistocene early modern humans. The majorityof the early modern human sample is from Europe andthe Near East, although multiple individuals from NorthAfrica (Taforalt) and one from east Asia (Yamashita-cho)are included. This sample includes sites from France(Abri Pataud, Cro-Magnon, Le Figuier, La Madeleine),Italy (Arene Candide, Barma Grande, Maritza, Roma-nelli), Portugal (Lagar Velho), Hungary (Balla), CzechRepublic (Dolnı Vestonice), Israel (El Wad, Skhul, Qaf-zeh), Russia (Sunghir), Japan (Yamashito-cha), and Mo-rocco (Taforalt). The Taforalt sample is the only largeimmature Late Pleistocene sample, and includes the pri-marily isolated remains of 44 immature individuals froma Moroccan ossuary (Ferembach et al., 1962).Early modern humans in this sample date between
�130,000 BP and 10,000 BP years. The sample of LatePleistocene early modern humans has been divided intothree temporal and cultural categories: Middle Paleo-lithic, Early Upper Paleolithic (�35–20 ky BP) and LateUpper Paleolithic (20–10 ky BP), following the approachof Shackelford (2005) and maintaining the distinctionbetween Upper Paleolithic preglacial and postglacialmaximum samples. While this division results in a smallanatomically modern Middle Paleolithic sample, and aLate Upper Paleolithic sample dominated by individualsfrom Taforalt, it best preserves the behavioral and tech-
nological differences that are likely to affect postcranialstrength.
METHODS
Aging
The ages for all Late Pleistocene remains are shown inTable 2. Although these ages are likely to be inexact,these are the best point estimates that were used for the
TABLE 2. List of Late Pleistocene specimens includedin this analysis
Femur Humerus Age (years)
NeandertalsUndescribed Amuda X neonatalb
Amud 7 X 0.34Buco del Tasso 2a X 7.8b
Cova Negra femur 1 X 3.7b
Dederiyeh 1 X X 1.25Dederiyeh 2 X 1.67Ehringsdorf G X 12.2b
Kiik-Koba 2 X 0.41b
Krapina 168 X 3.1b
Krapina 177 X 7.1b
La Ferrassie 4b X 0.15La Ferrassie 5 X neonatalb
La Ferrassie 6 X 2.4b
Le Moustier 2 X X neonatalRoc de Marsal 1a X X 2.5b
Teshik Tash 1 X 9.9MP AMHQafzeh 10 X X 5.3Skhul 1 X 3.3Skhul 8 X 8.5b
Early UP AMHAbri Pataud 26.234A X 13.3b
Arene Candide 1 X 16.4Balla 1 X X 1.5b
Barma Grande 3a X 13.5Cro-Magnon 5A X 1.6b
Cro-Magnon 5B X neonatalb
Cro-Magnon 5Ca X neonatalb
Cro-Magnon 5Da X neonatalb
Cro-Magnon 5Ea X neonatalb
Dolnı Vestonice 14 X X 17.5Lagar Velho 1 X 4.7Sunghir 2 X X 11.7Sunghir 3 X 9.9Yamashita-cho 1 X 6b
Late UP AMHArene Candide 5ba X X 2.8Arene Candide 8a X X 5.5Arene Candide 11a X X 2.4b
Arene Candide 15 X X 15.9El Wad 10252 X X 17.6El Wad 10257 X 14.1El Wad 10311 X X 10.7El Wad 10312 X neonatalb
El Wad 10313 X X 9.7b
El Wad 10314 X 6.3El Wad 10315 X X 10.0Le Figuier 1 X 2.1La Madeleine 4a X X 3.3Maritza 1 X 7.0Romanelli 3 X 0.9Taforalt 26 14 N/A
a Indicates cross-sections reconstructed used the eliptical modelmethod.b Ages predicted from long bone length.
18 L.W. COWGILL
American Journal of Physical Anthropology
purposes of this analysis. While reliable ages have previ-ously been determined for many of the Late Pleistoceneindividuals used in this study, the following aging proto-col was used to determine age in this analysis in orderto maintain internally consistent ages.
Age estimation from dentition. With the exception ofthe Luis Lopes sample, age was unknown for all thesamples used in this study, and crown and root forma-tion evaluated from lateral mandibular radiographs wasused whenever dental and postcranial remains were reli-ably associated. Crown and root formation was assessedfollowing the developmental standards set by Smith(1991) for permanent dentition and Liversidge and Mol-leson (2004) for deciduous dentition. Each set of denti-tion was scored twice on two consecutive days, and indi-vidual teeth that produced different dental stage scoreswere evaluated a third time to resolve inconsistencies.While several studies of tooth formation rates have
suggested that Neandertal dental development wasaccelerated relative to both Upper Paleolithic and recenthuman populations (Ramerez Rossi and Bermudez deCastro, 2004; Smith et al., 2007), other analyses have
found that Neandertal tooth formation rates are similarto those of modern humans (Guatelli-Steinberg et al.,2005; Macchiarelli et al., 2006). The lack of consensus onthis issue necessitates that this study assume immatureNeandertal and modern human development are approx-imately equivalent, and that they can be dentally agedbased on the same criterion.
Age estimation from long bone length. When no den-tition was directly associated with the postcranialremains, developmental age was predicted from withinsample Least Squares regression of femoral, tibial, orhumeral length on age for each of the comparative sam-ples in order to maximize sample size (Table 3). Bydeveloping age-prediction equations specific to each sam-ple, difficulties arising from the application of a formuladeveloped on individuals differing in body size or propor-tions to an archaeological target sample are partiallymitigated. The comparative samples were divided intotwo age categories to preserve linearity of the regressionline.Prediction of age in Late Pleistocene specimens using
long bone length was necessary in order to include the
TABLE 3. Comparative sample age prediction regression formulae by sample, and the percentageof each sample aged based on long bone length
Sample Independant Constant Slope R2 SEE % of sample
Dart 132 years and younger (n534) Femur 22.5044 0.0299 0.918 0.261
Tibia 22.6999 0.0379 0.902 0.286Humerus 23.2195 0.0452 0.895 0.296
3 years and older (n542) Femur 25.2839 0.0513 0.892 1.328Tibia 24.3335 0.0572 0.824 1.627Humerus 25.4632 0.0741 0.865 1.433
Kulubnarti 42 years and younger (n534) Femur 23.7339 0.0360 0.850 0.491
Tibia 23.7180 0.0427 0.828 0.520Humerus 24.3860 0.0526 0.822 0.535
3 years and older (n561) Femur 25.8857 0.0526 0.807 1.622Tibia 25.9737 0.0620 0.796 1.621Humerus 27.2532 0.0811 0.820 1.569
Mistihalj 82 years and younger (n526) Femur 22.1673 0.0247 0.888 0.299
Tibia 22.3164 0.0316 0.892 0.308Humerus 22.4260 0.0332 0.829 0.330
3 years and older (n529) Femur 29.2075 0.0613 0.871 1.569Tibia 28.8494 0.0744 0.877 1.558Humerus 210.5049 0.0918 0.882 1.554
Indian Knoll 202 years and younger (n519) Femur 23.0986 0.0312 0.662 0.545
Tibia 22.8966 0.0355 0.579 0.602Humerus 23.7621 0.0462 0.556 0.626
3 years and older (n572) Femur 28.3439 0.0610 0.901 1.501Tibia 27.3568 0.0690 0.922 1.343Humerus 28.7387 0.0868 0.920 1.337
California 502 years and younger (n552) Femur 22.5538 0.0299 0.479 0.717
Tibia 21.9406 0.0283 0.633 0.410Humerus 23.0874 0.0424 0.743 0.416
3 years and older (n570) Femur 27.6619 0.0583 0.928 1.241Tibia 26.1320 0.0642 0.906 1.396Humerus 27.9375 0.0833 0.926 1.248
Point Hope 292 years and younger (n58) Femur 22.9823 0.0308 0.903 0.279
Tibia 23.0705 0.0396 0.843 0.350Humerus 23.9345 0.0470 0.819 0.480
3 years and older (n561) Femur 26.7552 0.0574 0.849 1.540Tibia 25.9412 0.0681 0.830 1.651Humerus 27.6418 0.0844 0.888 1.311
19ONTOGENY OF POSTCRANIAL STRENGTH
American Journal of Physical Anthropology
numerous isolated elements in this sample. However,achieving accurate ages was methodologically challeng-ing, given that, in most cases, Late Pleistocene samplesize was not sufficiently large to generate sample-specificage prediction regression formulae. In these cases, for-mulae generated from the comparative sample wereused to predict age. The appropriate regression formulaewere selected primarily on the basis of possessing bodysize and body proportion characteristics analogous to thetarget Late Pleistocene sample. For individuals where
dental age was known, age predicted from long bonelength was compared to dental age to check for consis-tency.The specific fossil individuals for which age was esti-
mated from long bone length are marked with asterisksin Table 2. The Point Hope age prediction regressionwas used to predict age of immature Neandertals. Com-parisons between dental ages and ages predicted fromlong bone length in the cases where both were availablerevealed that in all cases except one (Dederiyeh 1), the
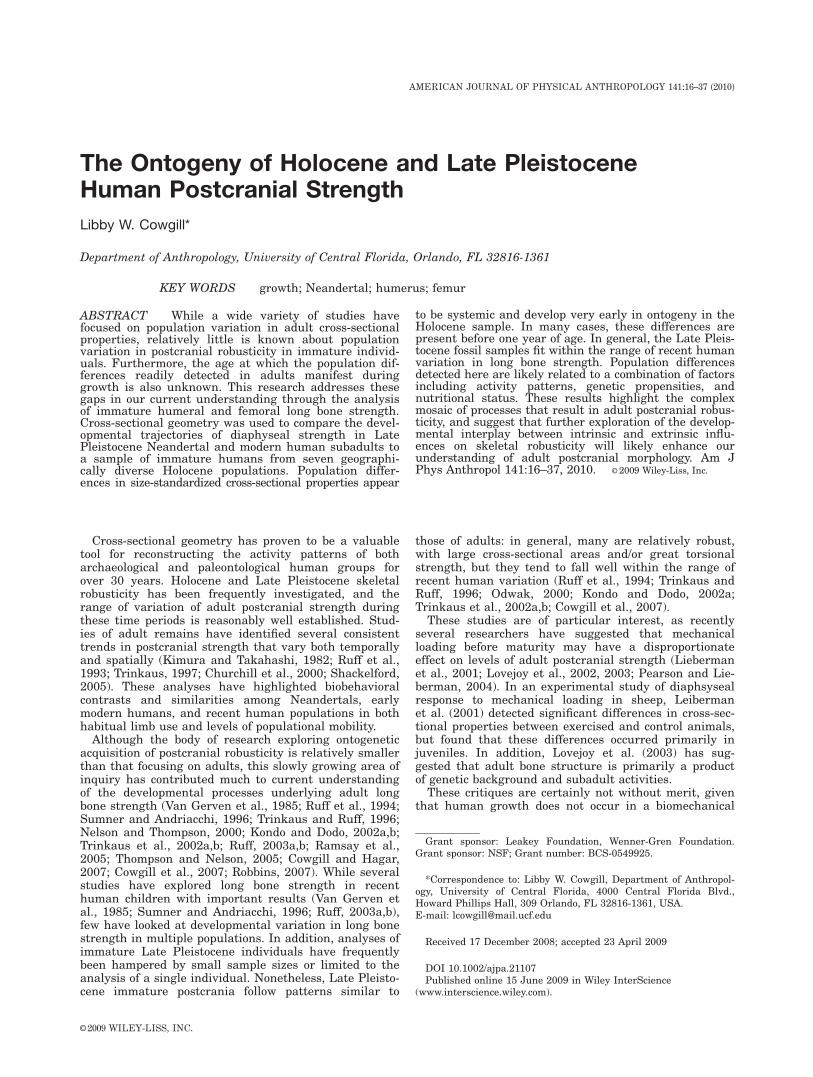
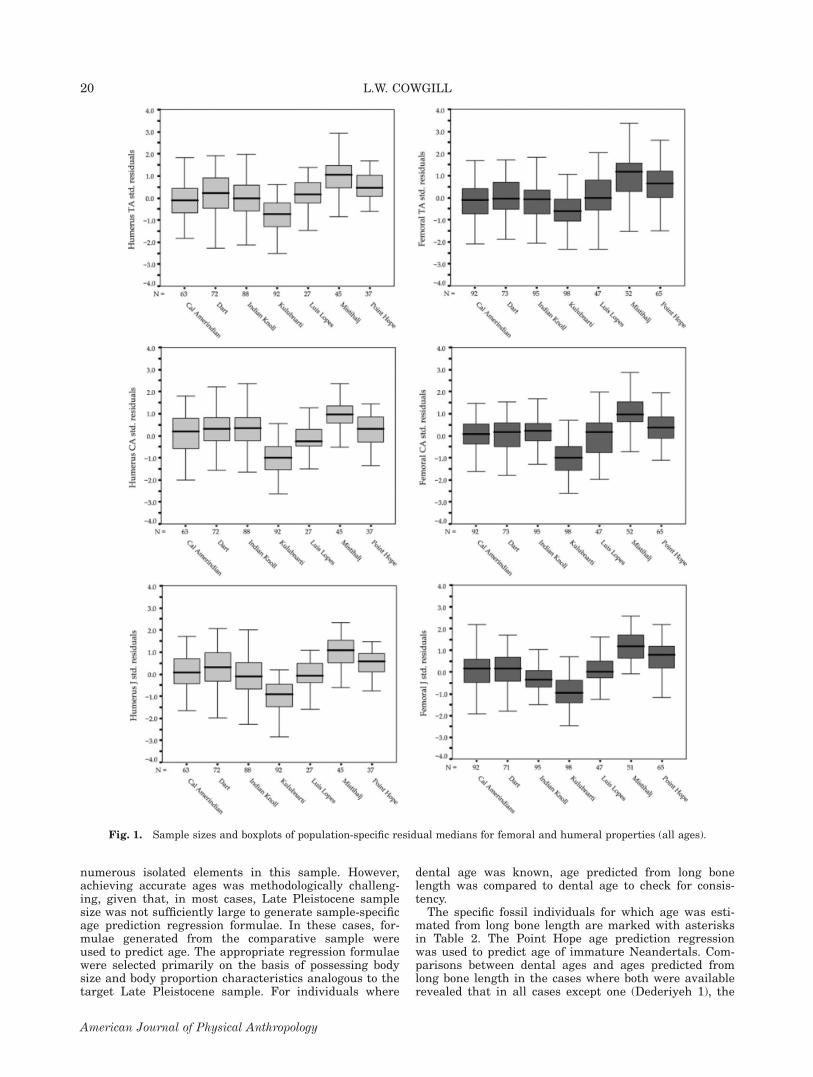
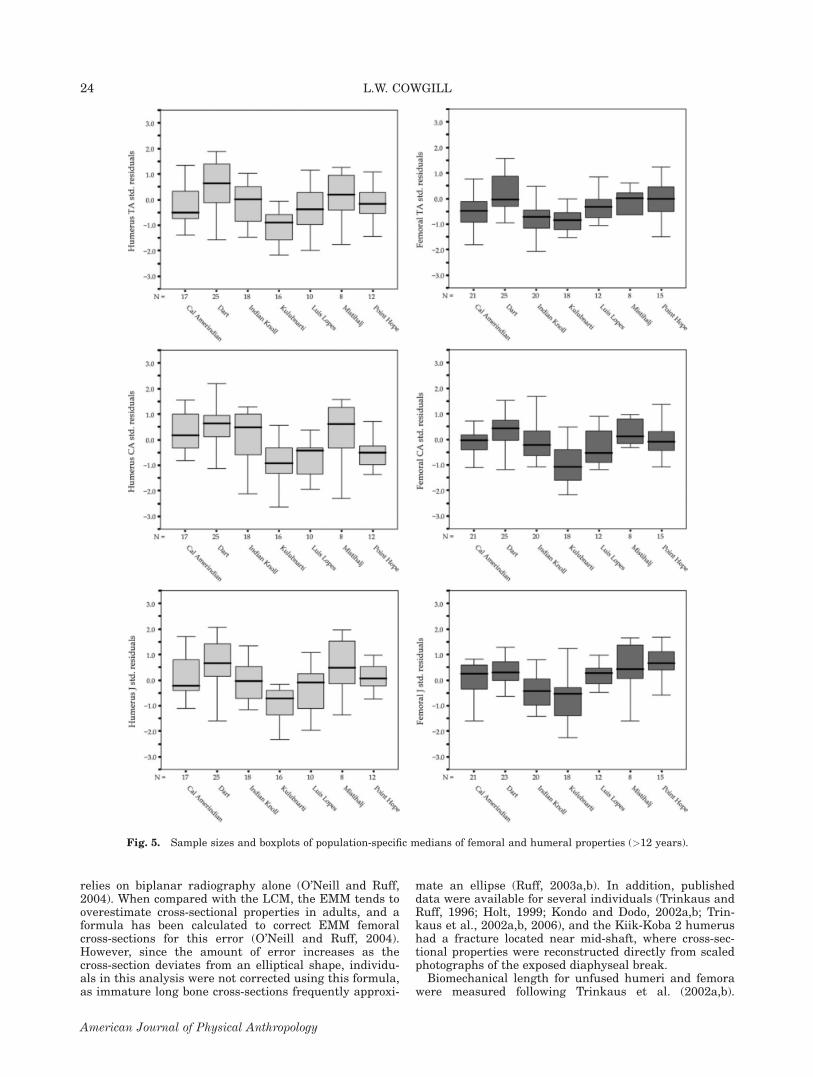
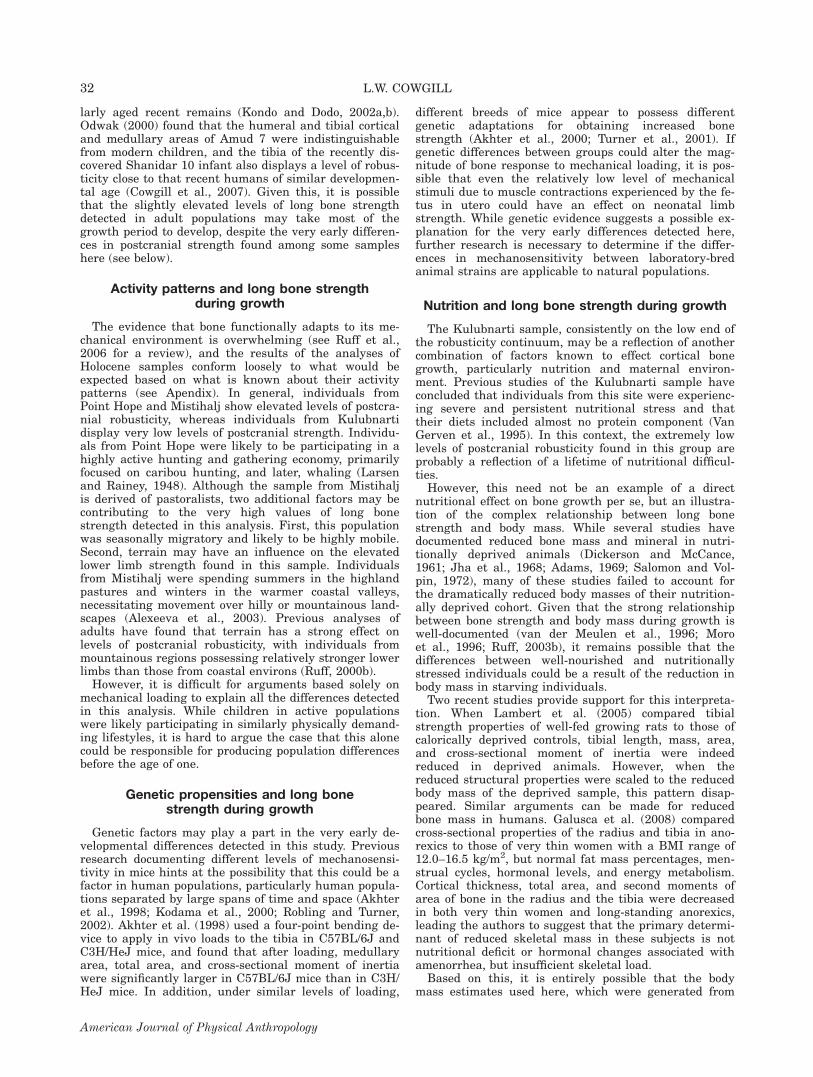
Fig. 1. Sample sizes and boxplots of population-specific residual medians for femoral and humeral properties (all ages).
20 L.W. COWGILL
American Journal of Physical Anthropology
Point Hope regression formulae underestimated the den-tal age. Therefore, a correction factor of 6 months wasadded to the Neandertal ages estimated using the PointHope regression formulae. The fact that this was neces-sary suggests that Neandertals, even relative to a cold-adapted population of short stature such as Point Hope,were very small bodied for their age during growth (or,perhaps, that dental development was relativelyadvanced).
Given the relatively tall statures and Nilotic body pro-portions from Middle Paleolithic and Early Upper Paleo-lithic modern human populations (Formicola and Gian-necchini, 1999; Holliday, 1999), an ideal developmentalreference sample would possess both these characteris-tics. However, comparison of the known dental ages toages predicted from long bone length indicates that noneof the comparative sample regression formulae are a par-ticularly good match for these fossil groups, due to the
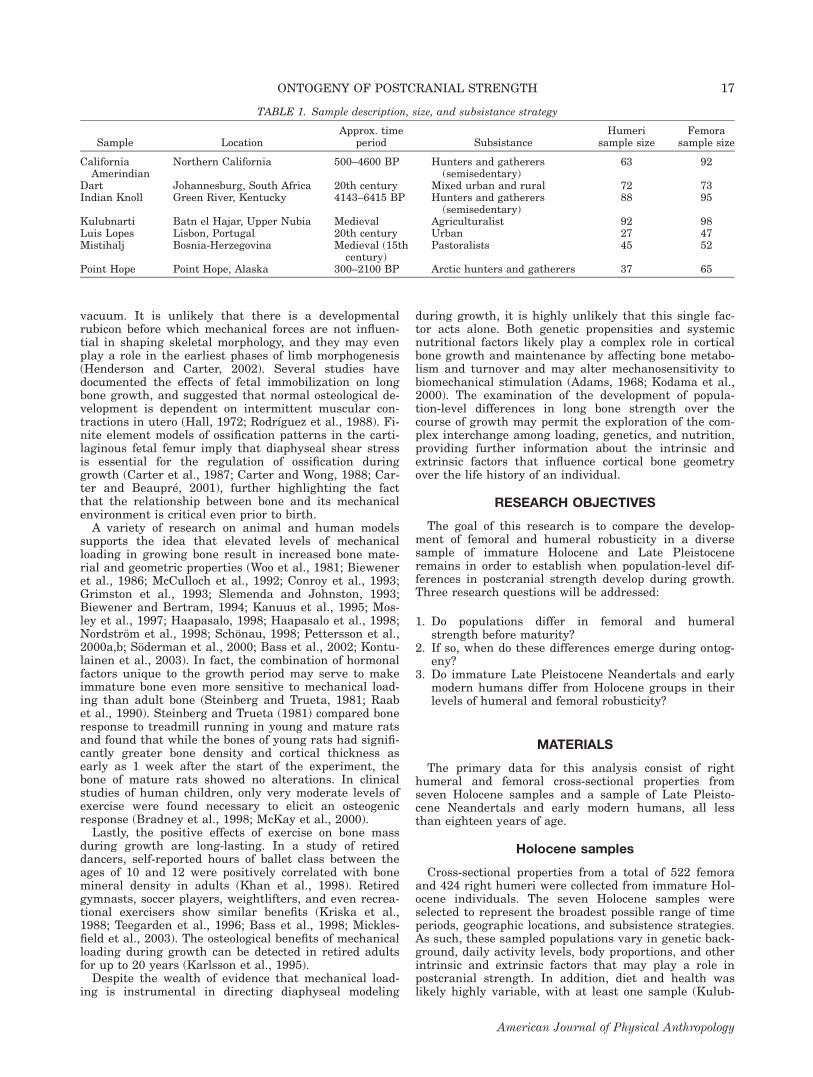
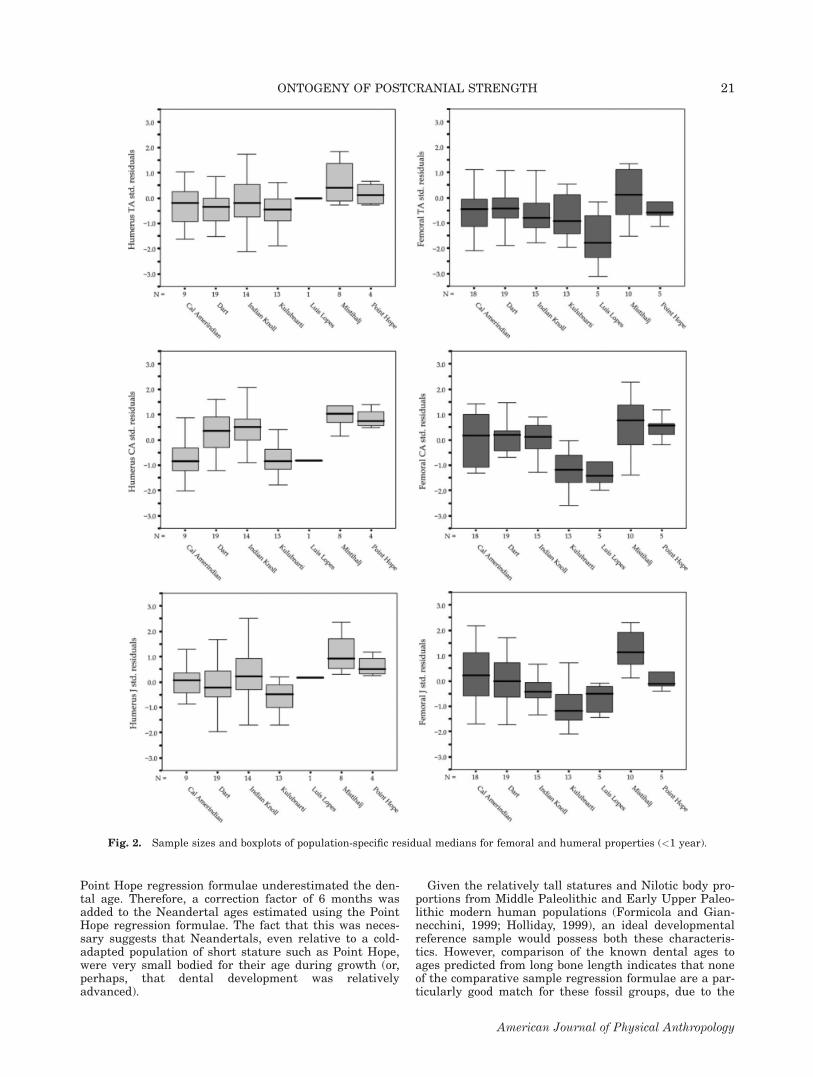
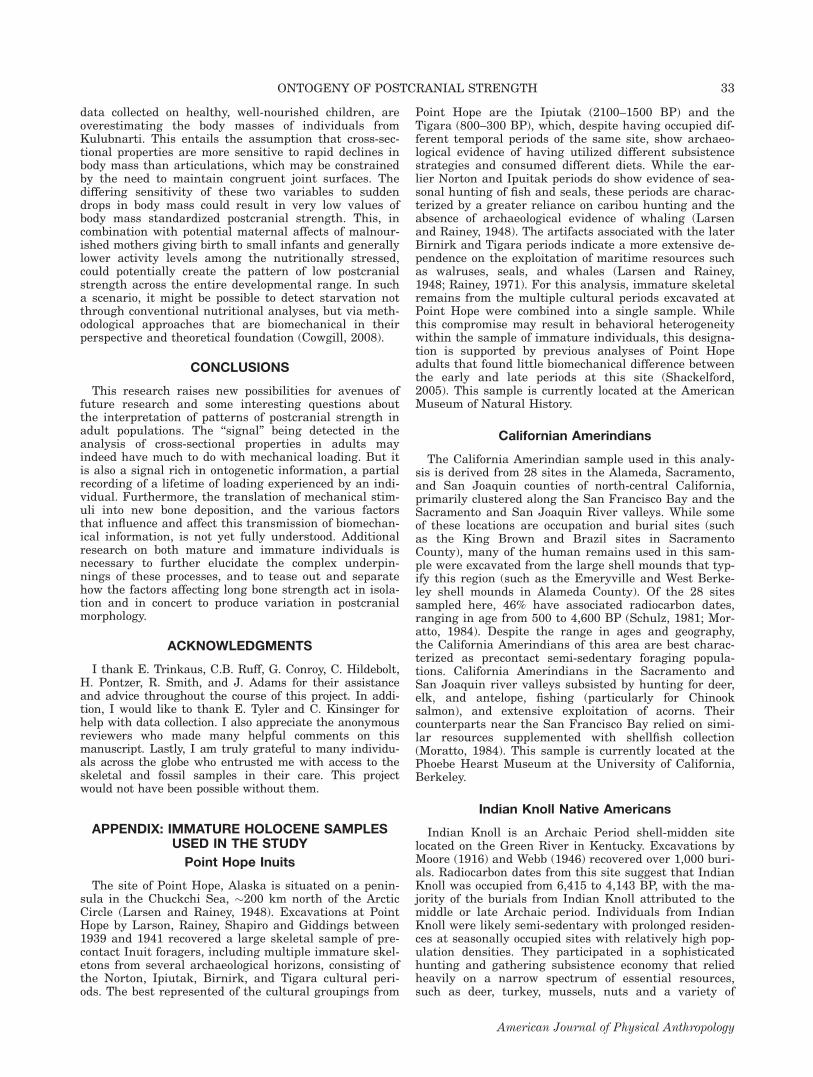
Fig. 2. Sample sizes and boxplots of population-specific residual medians for femoral and humeral properties (<1 year).
21ONTOGENY OF POSTCRANIAL STRENGTH
American Journal of Physical Anthropology
relatively greater stature of the Middle and early UpperPaleolithic immature individuals. Therefore, despitesmall sample sizes, the best solution was to predict agefor the earliest modern humans based on a regression oflong bone biomechanical length on dental age withinthis group. Age was estimated for individuals in theLate Upper Paleolithic using formulae from the Mistihaljsample, which provided the best ‘‘match’’ in terms ofmoderate body size and temperate body proportions(Churchill et al., 2000).
Age categories. The samples were analyzed in four agegroups: birth to 0.9 years, 1.0–5.9 years, 6.0–11.9 years,and 12.0–17.9 years. The first age category is restrictedto the first year of life in order to explore very early dif-ferences in long bone strength; subsequent categoriesare somewhat broader, but are sufficiently narrow todetermine if the patterns detected in the first age cate-gory are maintained consistently throughout growth.Population-specific sample sizes for each age group areincluded with Figures 1–6.
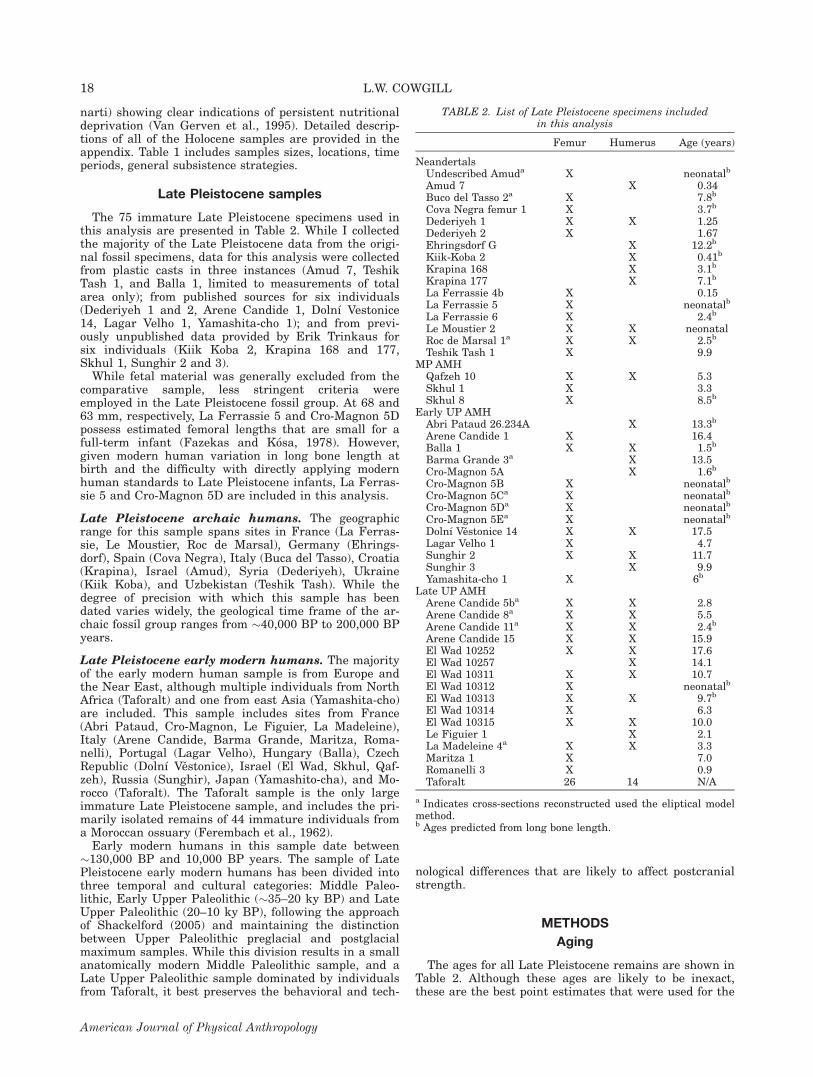
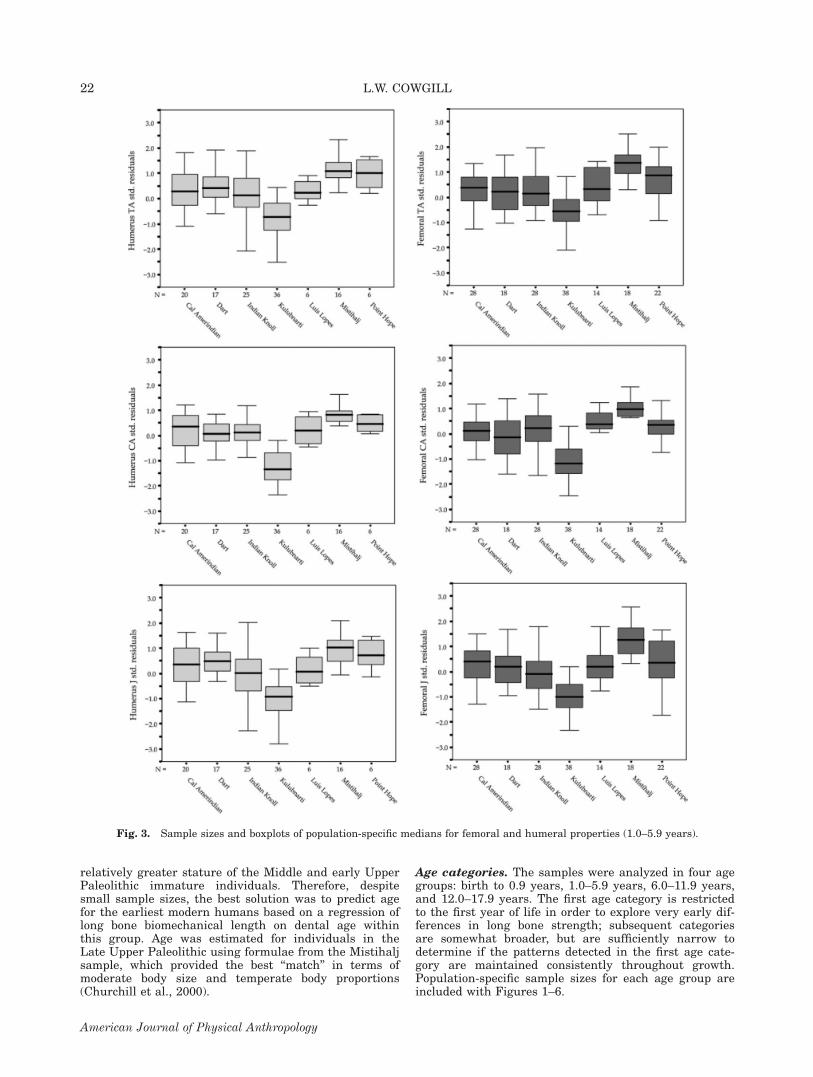
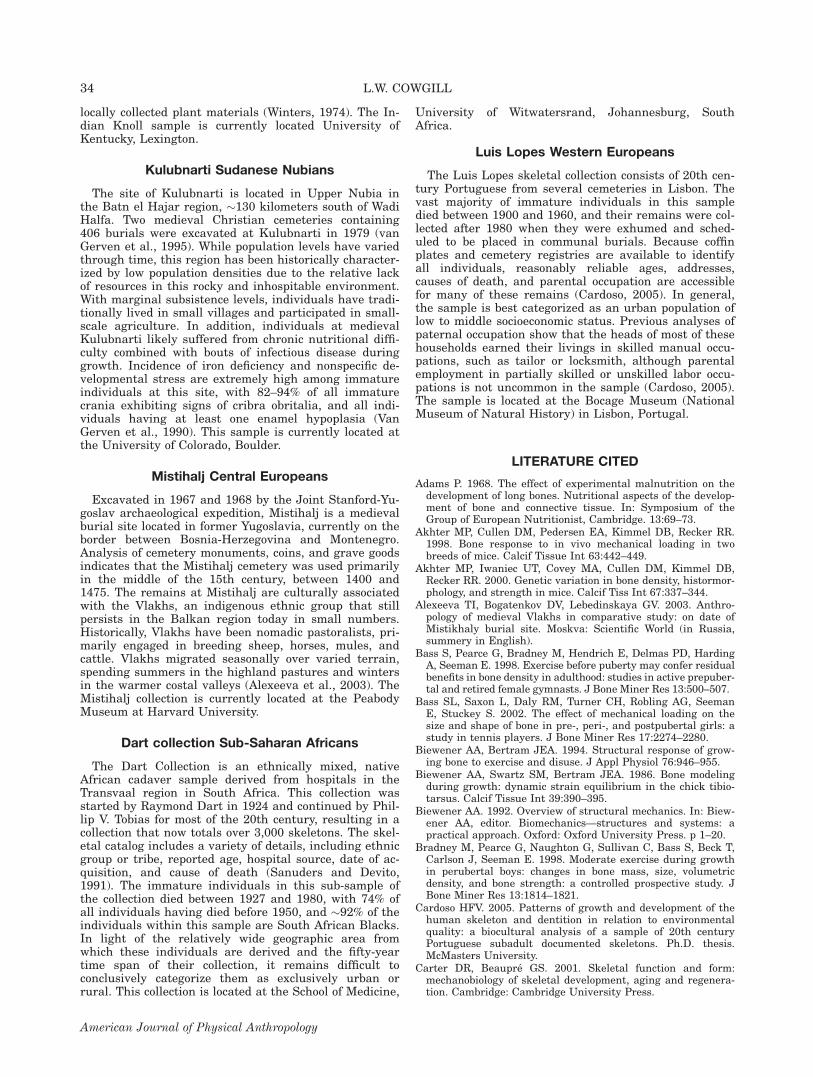
Fig. 3. Sample sizes and boxplots of population-specific medians for femoral and humeral properties (1.0–5.9 years).
22 L.W. COWGILL
American Journal of Physical Anthropology
Reconstruction of cross-sectional properties
The primary data for this analysis consist of the mid-shaft total areas, cortical areas, and polar secondmoment of areas of immature femora and right humeri.All cross-sectional properties in the comparative collec-tion and the vast majority of the fossil sample were col-lected using a method similar to O’Neill and Ruff ’s
(2004) ‘‘latex cast method’’ (LCM) and the method usedby Sakaue (1998), which rely on anteroposterior andmediolateral radiographs and silicone molding putty.However, external contour molds were not possible in 11cases due to fossil fragility, museum protocol, orextremely small long bone diaphyses (see Table 2). Forthese individuals, cross-sectional properties were calcu-lated using the ‘‘ellipse model method’’ (EMM), which
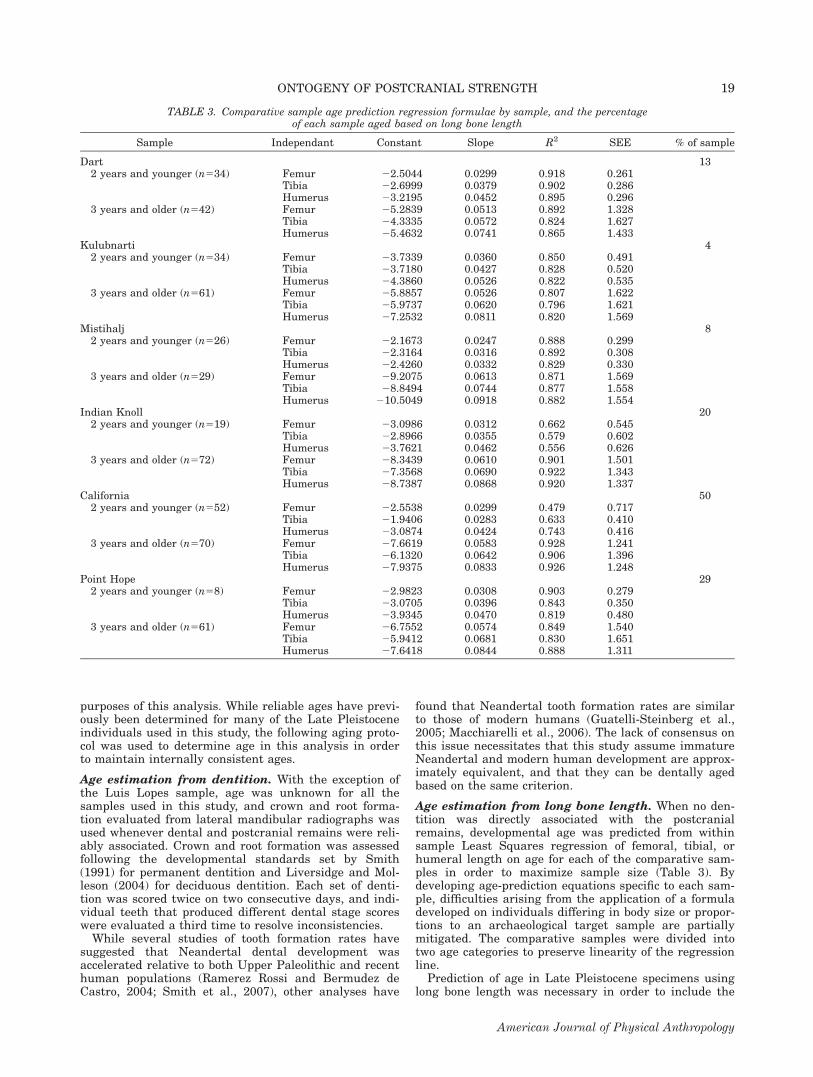
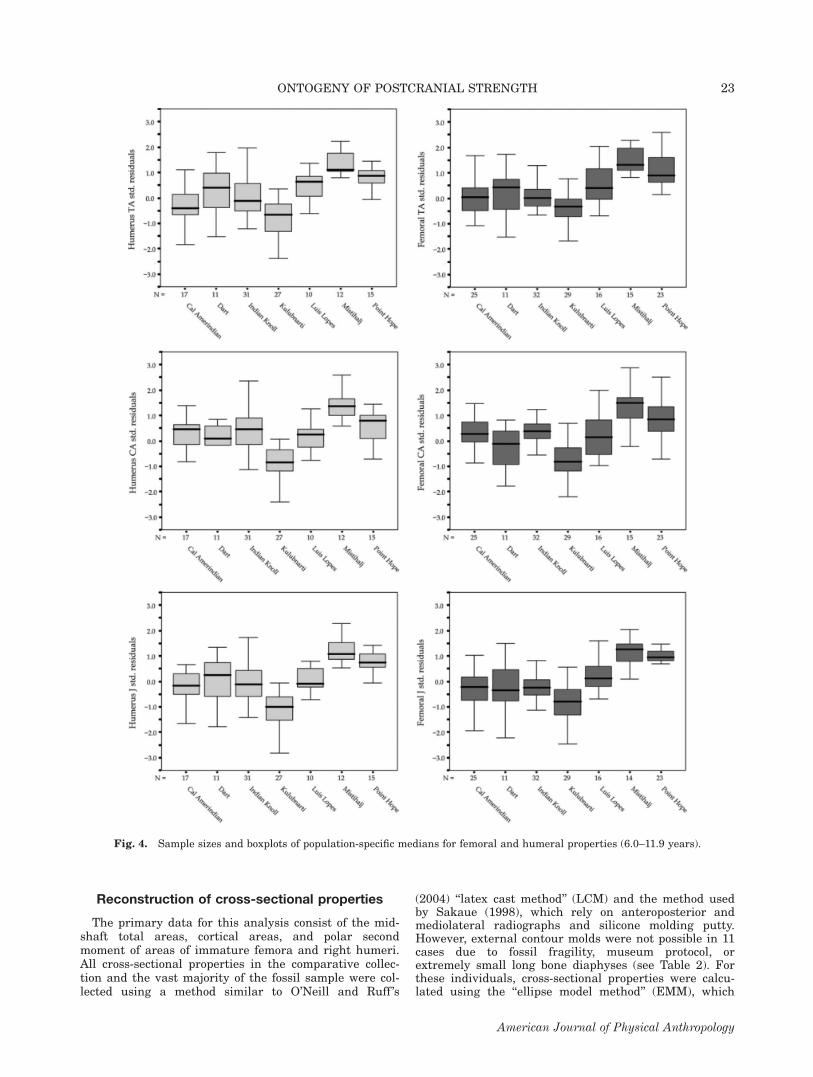
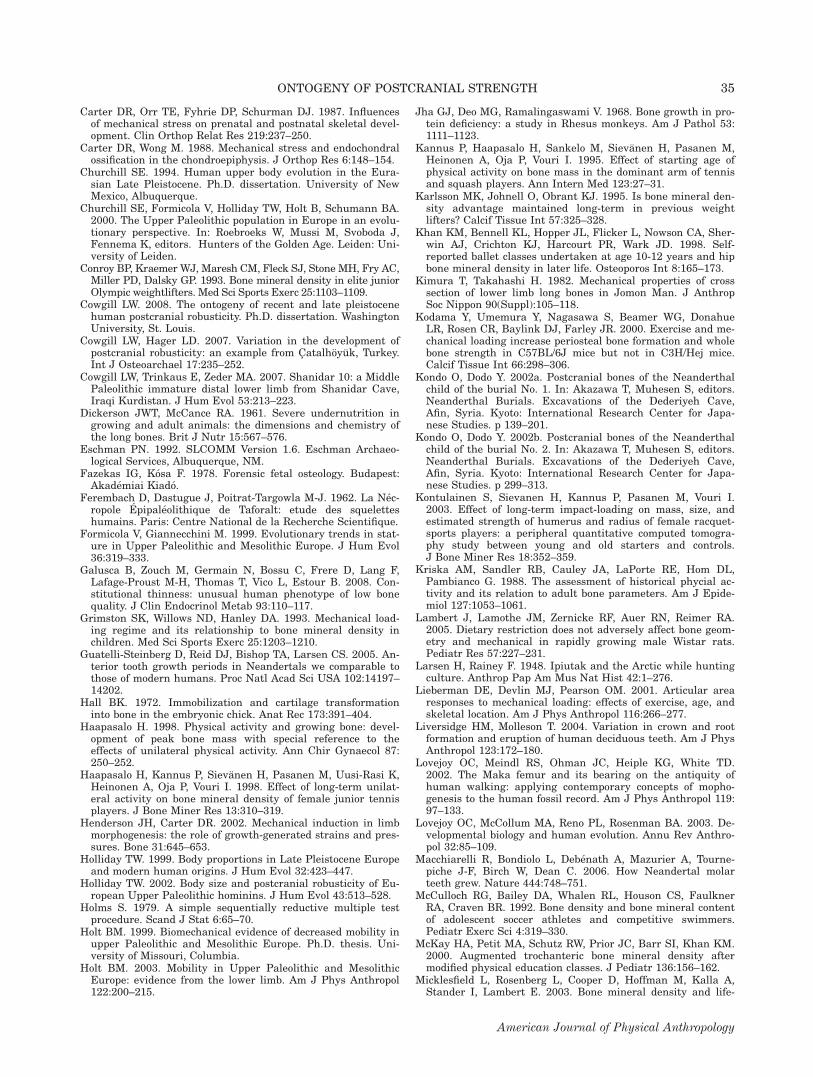
Fig. 4. Sample sizes and boxplots of population-specific medians for femoral and humeral properties (6.0–11.9 years).
23ONTOGENY OF POSTCRANIAL STRENGTH
American Journal of Physical Anthropology
relies on biplanar radiography alone (O’Neill and Ruff,2004). When compared with the LCM, the EMM tends tooverestimate cross-sectional properties in adults, and aformula has been calculated to correct EMM femoralcross-sections for this error (O’Neill and Ruff, 2004).However, since the amount of error increases as thecross-section deviates from an elliptical shape, individu-als in this analysis were not corrected using this formula,as immature long bone cross-sections frequently approxi-
mate an ellipse (Ruff, 2003a,b). In addition, publisheddata were available for several individuals (Trinkaus andRuff, 1996; Holt, 1999; Kondo and Dodo, 2002a,b; Trin-kaus et al., 2002a,b, 2006), and the Kiik-Koba 2 humerushad a fracture located near mid-shaft, where cross-sec-tional properties were reconstructed directly from scaledphotographs of the exposed diaphyseal break.Biomechanical length for unfused humeri and femora
were measured following Trinkaus et al. (2002a,b).
Fig. 5. Sample sizes and boxplots of population-specific medians of femoral and humeral properties (>12 years).
24 L.W. COWGILL
American Journal of Physical Anthropology
Cross-sectional levels were chosen to best approximatethe 50% section level in fused elements. For humeri,50% of intermetaphyseal biomechanical length was used,as the proximal and distal epiphyses contribute aboutequally in length to the measurement of biomechanicallength in fused elements (Ruff, personal communication).In immature femora, however, the 50% level was calcu-lated as 45.5% of femoral intermetaphyseal length, asthis measurement best corresponds to the location of the50% level in individuals with fused distal femoral epi-physes due to the relatively larger contribution of the
distal epiphysis to biomechanical length in fused femora(Ruff, 2003b).To reconstruct the femoral and humeral cross-sectional
properties, the external surface of the diaphysis wasmolded with Cuttersil Putty PlusTM silicone moldingputty. Anterior, posterior, medial and lateral corticalbone widths were measured with digital calipers, andmeasurements were corrected for parallax distortion bycomparing external breadths measured on the radio-graph with external breaths measured on the element ateach section level. Once corrected for parallax, the four
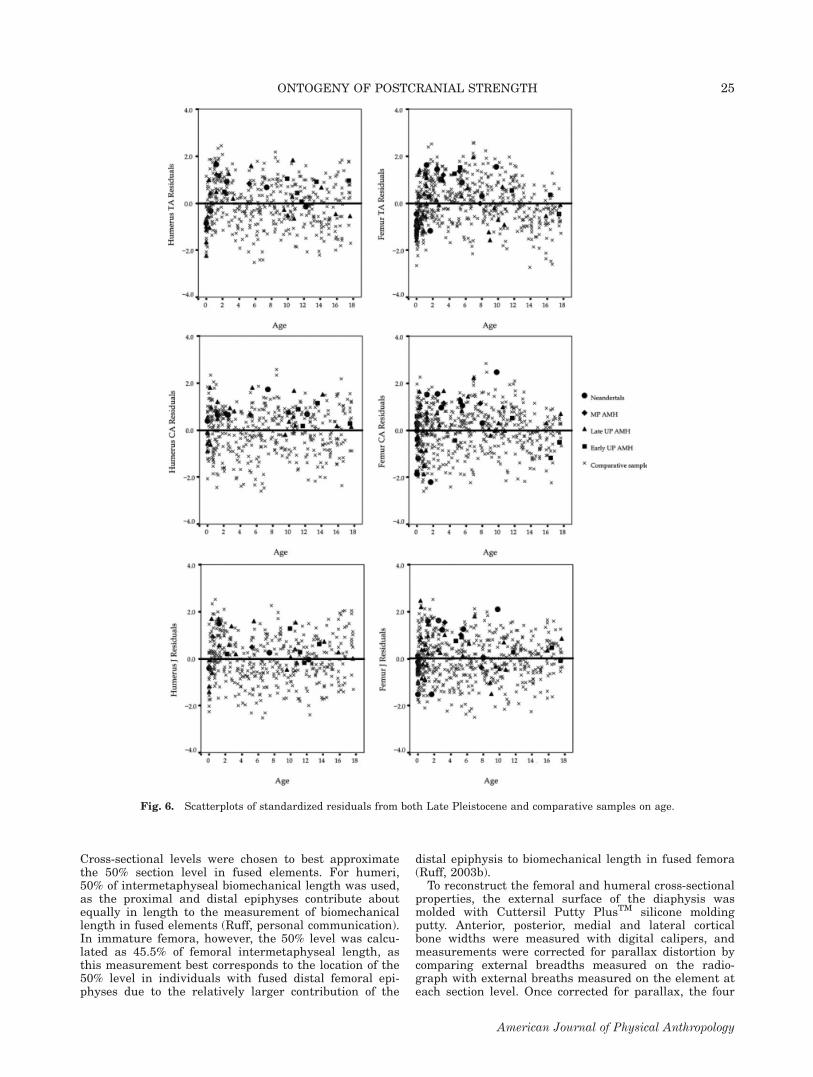
Fig. 6. Scatterplots of standardized residuals from both Late Pleistocene and comparative samples on age.
25ONTOGENY OF POSTCRANIAL STRENGTH
American Journal of Physical Anthropology
cortical bone measurements were plotted onto the two-dimensional copy of the original mold, and the endostealcontours were interpolated by using the subperiostealoutline as a guide. The resultant sections were enlargedon a digitizing tablet, and the endosteal and periostealcontours digitized. Cross-sectional properties were com-puted from the sections in a PC-DOS version of SLICE(Nagurka and Hayes, 1980; Eschman, 1992). All ele-ments in the fossil sample were digitized twice and aver-aged in order to minimize tracing error.
Size standardization
Body mass prediction. Despite continued discussion ofappropriate scaling factors for humeral diaphysealrobusticity (Churchill, 1994; Ruff, 2000a), both humeraland femoral cross-sectional properties were standardizedby body mass or body mass and beam length2 in thisanalysis. Body mass was predicted based on formulaedeveloped specifically for immature individuals, whichpredict body mass from femoral distal metaphyseal M-Lbreadth and femoral head size (Ruff, 2007; personal com-munication). Within the comparative sample, the femoralmetaphyseal breadth measurement was not available for�17% of younger individuals possessing one lower limbelement, and in these cases femoral metaphysealbreadth was predicted from proximal tibial metaphysealM-L breadth (r2 5 0.925, all comparative samples under13.5 years). In addition, body mass prediction regressionformulae in Ruff ’s original study (2007) did not attainsignificance for infants under 4 months of age or 15-year-old. Therefore, within sample interpolation andextrapolation was necessary to provide body masses forthese age groups in this analysis.In the 2007 paper, where Ruff developed the regres-
sion formulae for body mass prediction in juveniles, hecautioned that his formulae had not been tested onimmature individuals from different populations. Whilethese formulae have since been used on other samples(Sciulli and Blatt, 2008), it is still not entirely clear ifthese formulae are capable of producing body mass esti-mates which reflect ecogeographic differences in bodyshape. As body mass varies with latitude and has astrong effect of postcranial robusticity, it is necessary tobriefly investigate whether the body mass estimatesused to standardize cross-sectional properties in thisanalysis are reasonably congruent with what would bepredicted based on the original geographic location ofthe sample populations.To fully explore this issue is beyond the scope of this
study. However, to provide a rough estimate of bodymass versus height, body mass values were divided bymaximum femoral 1 tibial length. This ratio was thenregressed on age using a quadratic equation (Body mass/
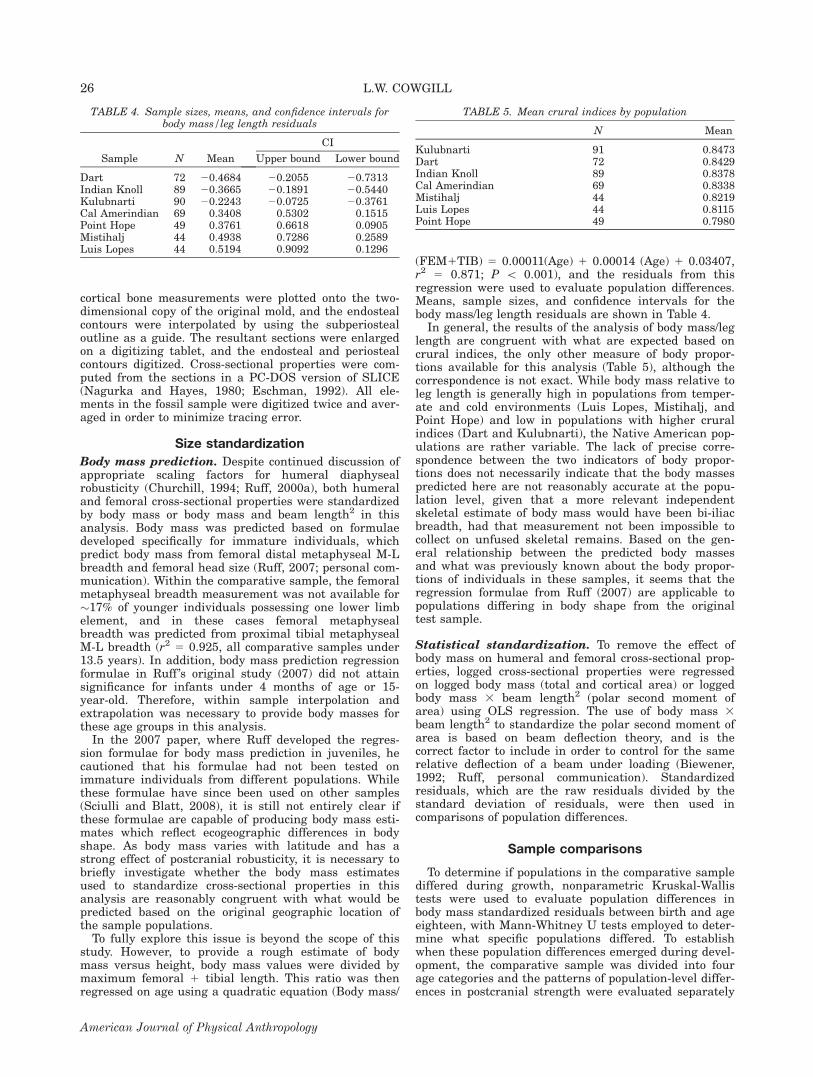
(FEM1TIB) 5 0.00011(Age) 1 0.00014 (Age) 1 0.03407,r2 5 0.871; P \ 0.001), and the residuals from thisregression were used to evaluate population differences.Means, sample sizes, and confidence intervals for thebody mass/leg length residuals are shown in Table 4.In general, the results of the analysis of body mass/leg
length are congruent with what are expected based oncrural indices, the only other measure of body propor-tions available for this analysis (Table 5), although thecorrespondence is not exact. While body mass relative toleg length is generally high in populations from temper-ate and cold environments (Luis Lopes, Mistihalj, andPoint Hope) and low in populations with higher cruralindices (Dart and Kulubnarti), the Native American pop-ulations are rather variable. The lack of precise corre-spondence between the two indicators of body propor-tions does not necessarily indicate that the body massespredicted here are not reasonably accurate at the popu-lation level, given that a more relevant independentskeletal estimate of body mass would have been bi-iliacbreadth, had that measurement not been impossible tocollect on unfused skeletal remains. Based on the gen-eral relationship between the predicted body massesand what was previously known about the body propor-tions of individuals in these samples, it seems that theregression formulae from Ruff (2007) are applicable topopulations differing in body shape from the originaltest sample.
Statistical standardization. To remove the effect ofbody mass on humeral and femoral cross-sectional prop-erties, logged cross-sectional properties were regressedon logged body mass (total and cortical area) or loggedbody mass 3 beam length2 (polar second moment ofarea) using OLS regression. The use of body mass 3beam length2 to standardize the polar second moment ofarea is based on beam deflection theory, and is thecorrect factor to include in order to control for the samerelative deflection of a beam under loading (Biewener,1992; Ruff, personal communication). Standardizedresiduals, which are the raw residuals divided by thestandard deviation of residuals, were then used incomparisons of population differences.
Sample comparisons
To determine if populations in the comparative samplediffered during growth, nonparametric Kruskal-Wallistests were used to evaluate population differences inbody mass standardized residuals between birth and ageeighteen, with Mann-Whitney U tests employed to deter-mine what specific populations differed. To establishwhen these population differences emerged during devel-opment, the comparative sample was divided into fourage categories and the patterns of population-level differ-ences in postcranial strength were evaluated separately
TABLE 4. Sample sizes, means, and confidence intervals forbody mass/leg length residuals
Sample N Mean
CI
Upper bound Lower bound
Dart 72 20.4684 20.2055 20.7313Indian Knoll 89 20.3665 20.1891 20.5440Kulubnarti 90 20.2243 20.0725 20.3761Cal Amerindian 69 0.3408 0.5302 0.1515Point Hope 49 0.3761 0.6618 0.0905Mistihalj 44 0.4938 0.7286 0.2589Luis Lopes 44 0.5194 0.9092 0.1296
TABLE 5. Mean crural indices by population
N Mean
Kulubnarti 91 0.8473Dart 72 0.8429Indian Knoll 89 0.8378Cal Amerindian 69 0.8338Mistihalj 44 0.8219Luis Lopes 44 0.8115Point Hope 49 0.7980
26 L.W. COWGILL
American Journal of Physical Anthropology
in each age sub-sample. When comparing the level ofhumeral and femoral robusticity in the fossil samples tothat found in the comparative sample, it was generallypossible to treat the temporally-divided Late Pleistocenesub-samples as small samples, and avoid evaluatingeach specimen as an individual datum point. However,in some analyses, the available fossil sample was simplytoo small for this to be statistically feasible. When thiswas the case, adjusted z-scores were calculated in orderto evaluate the likelihood of a given fossil specimenbeing a member of the recent human population of age-appropriate subadults (Sokal and Rohlf, 1995).Bonferroni corrections are frequently employed to
reduce the probability of spurious positive results whenmultiple analyses are conducted. However, with thesecorrections comes a serious loss of statistical power, lead-ing some researchers to question their widespread useand raise several issues with the procedure (Perneger,1998; Moran, 2003; Nakagawa, 2004). Moran (2003)argues that while the possibility of finding one signifi-cant result due to chance is quite high, the likelihood offinding several is dramatically lower. In addition, it isdifficult to decide how and when to apply Bonferroni cor-rections, as there are no well established standards.Lastly, the practical ramifications of the use of Bonfer-roni corrections may actually act to discourage complex,detailed analyses: the more samples and variablesincluded in the analysis, the lower the probability ofdetection of significant results (Moran, 2003; Nakagawa,2004). Because of the large number of comparative sam-ples, initial alpha levels with multiple comparison cor-rections in this analysis are less than 0.002. Like Moranand others, I would argue that careful, logical evaluationof the results of these analyses is preferable to the wide-spread rejection of nonsignificant results out of hand,particularly when sample differences present clear andreasonable patterns. Therefore, while sequentially reduc-tive Bonferroni adjustments (Holms, 1979; Rice, 1989)are made and reported in this study’s statistical tables,
priority is given to results that indicate plausible biologi-cal patterns in the discussion of these results.
RESULTS
Comparative sample
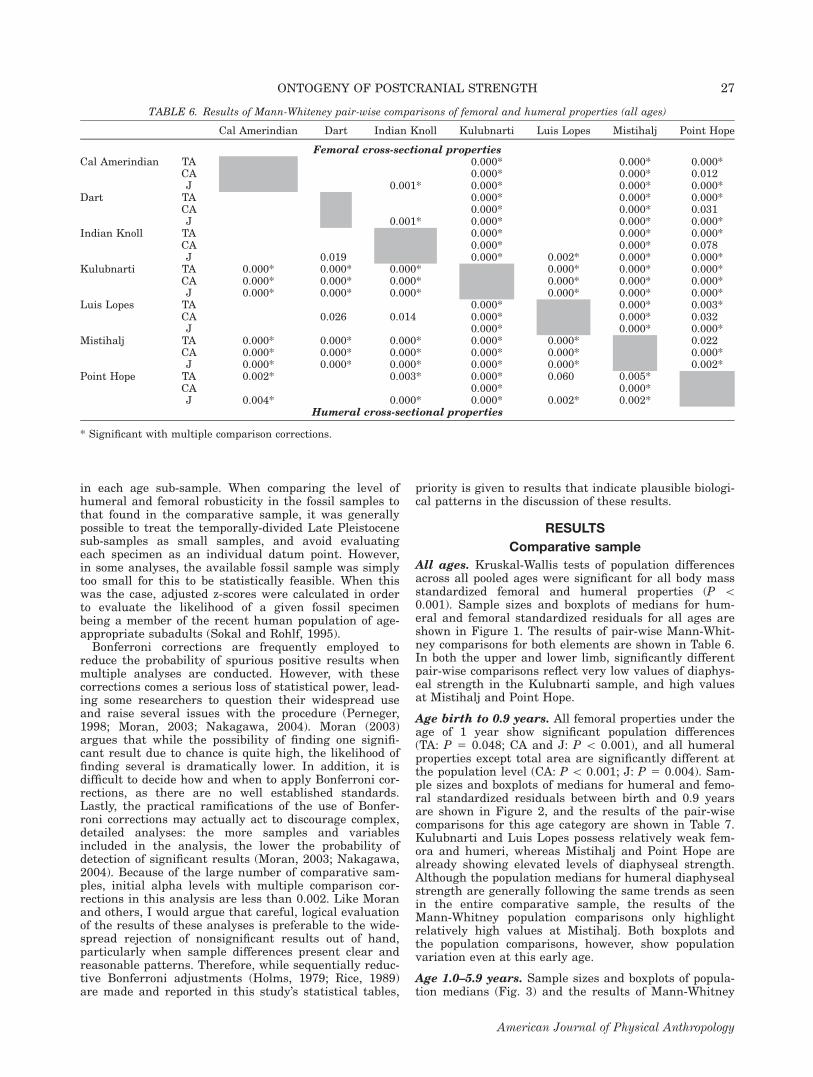
All ages. Kruskal-Wallis tests of population differencesacross all pooled ages were significant for all body massstandardized femoral and humeral properties (P \0.001). Sample sizes and boxplots of medians for hum-eral and femoral standardized residuals for all ages areshown in Figure 1. The results of pair-wise Mann-Whit-ney comparisons for both elements are shown in Table 6.In both the upper and lower limb, significantly differentpair-wise comparisons reflect very low values of diaphys-eal strength in the Kulubnarti sample, and high valuesat Mistihalj and Point Hope.
Age birth to 0.9 years. All femoral properties under theage of 1 year show significant population differences(TA: P 5 0.048; CA and J: P \ 0.001), and all humeralproperties except total area are significantly different atthe population level (CA: P \ 0.001; J: P 5 0.004). Sam-ple sizes and boxplots of medians for humeral and femo-ral standardized residuals between birth and 0.9 yearsare shown in Figure 2, and the results of the pair-wisecomparisons for this age category are shown in Table 7.Kulubnarti and Luis Lopes possess relatively weak fem-ora and humeri, whereas Mistihalj and Point Hope arealready showing elevated levels of diaphyseal strength.Although the population medians for humeral diaphysealstrength are generally following the same trends as seenin the entire comparative sample, the results of theMann-Whitney population comparisons only highlightrelatively high values at Mistihalj. Both boxplots andthe population comparisons, however, show populationvariation even at this early age.
Age 1.0–5.9 years. Sample sizes and boxplots of popula-tion medians (Fig. 3) and the results of Mann-Whitney
TABLE 6. Results of Mann-Whiteney pair-wise comparisons of femoral and humeral properties (all ages)
Cal Amerindian Dart Indian Knoll Kulubnarti Luis Lopes Mistihalj Point Hope
Femoral cross-sectional propertiesCal Amerindian TA 0.000* 0.000* 0.000*
CA 0.000* 0.000* 0.012J 0.001* 0.000* 0.000* 0.000*
Dart TA 0.000* 0.000* 0.000*CA 0.000* 0.000* 0.031J 0.001* 0.000* 0.000* 0.000*
Indian Knoll TA 0.000* 0.000* 0.000*CA 0.000* 0.000* 0.078J 0.019 0.000* 0.002* 0.000* 0.000*
Kulubnarti TA 0.000* 0.000* 0.000* 0.000* 0.000* 0.000*CA 0.000* 0.000* 0.000* 0.000* 0.000* 0.000*J 0.000* 0.000* 0.000* 0.000* 0.000* 0.000*
Luis Lopes TA 0.000* 0.000* 0.003*CA 0.026 0.014 0.000* 0.000* 0.032J 0.000* 0.000* 0.000*
Mistihalj TA 0.000* 0.000* 0.000* 0.000* 0.000* 0.022CA 0.000* 0.000* 0.000* 0.000* 0.000* 0.000*J 0.000* 0.000* 0.000* 0.000* 0.000* 0.002*
Point Hope TA 0.002* 0.003* 0.000* 0.060 0.005*CA 0.000* 0.000*J 0.004* 0.000* 0.000* 0.002* 0.002*
Humeral cross-sectional properties
* Significant with multiple comparison corrections.
27ONTOGENY OF POSTCRANIAL STRENGTH
American Journal of Physical Anthropology
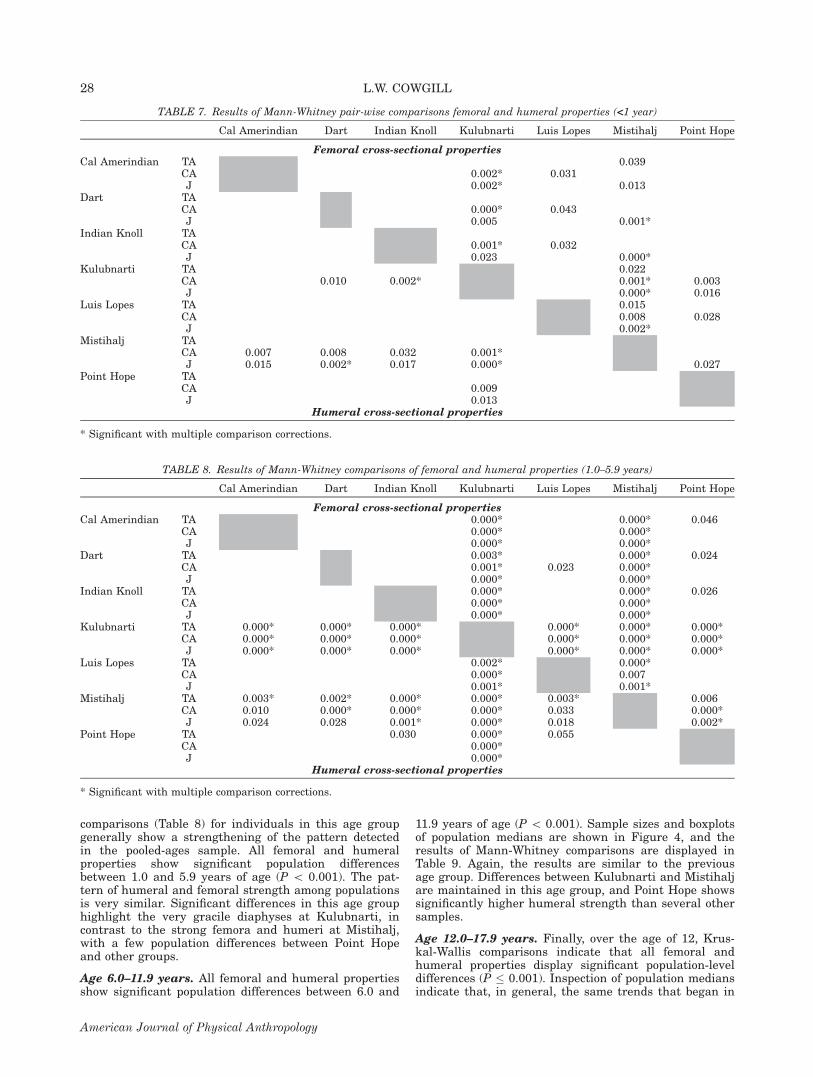
comparisons (Table 8) for individuals in this age groupgenerally show a strengthening of the pattern detectedin the pooled-ages sample. All femoral and humeralproperties show significant population differencesbetween 1.0 and 5.9 years of age (P \ 0.001). The pat-tern of humeral and femoral strength among populationsis very similar. Significant differences in this age grouphighlight the very gracile diaphyses at Kulubnarti, incontrast to the strong femora and humeri at Mistihalj,with a few population differences between Point Hopeand other groups.
Age 6.0–11.9 years. All femoral and humeral propertiesshow significant population differences between 6.0 and
11.9 years of age (P \ 0.001). Sample sizes and boxplotsof population medians are shown in Figure 4, and theresults of Mann-Whitney comparisons are displayed inTable 9. Again, the results are similar to the previousage group. Differences between Kulubnarti and Mistihaljare maintained in this age group, and Point Hope showssignificantly higher humeral strength than several othersamples.
Age 12.0–17.9 years. Finally, over the age of 12, Krus-kal-Wallis comparisons indicate that all femoral andhumeral properties display significant population-leveldifferences (P � 0.001). Inspection of population mediansindicate that, in general, the same trends that began in
TABLE 8. Results of Mann-Whitney comparisons of femoral and humeral properties (1.0–5.9 years)
Cal Amerindian Dart Indian Knoll Kulubnarti Luis Lopes Mistihalj Point Hope
Femoral cross-sectional propertiesCal Amerindian TA 0.000* 0.000* 0.046
CA 0.000* 0.000*J 0.000* 0.000*
Dart TA 0.003* 0.000* 0.024CA 0.001* 0.023 0.000*J 0.000* 0.000*
Indian Knoll TA 0.000* 0.000* 0.026CA 0.000* 0.000*J 0.000* 0.000*
Kulubnarti TA 0.000* 0.000* 0.000* 0.000* 0.000* 0.000*CA 0.000* 0.000* 0.000* 0.000* 0.000* 0.000*J 0.000* 0.000* 0.000* 0.000* 0.000* 0.000*
Luis Lopes TA 0.002* 0.000*CA 0.000* 0.007J 0.001* 0.001*
Mistihalj TA 0.003* 0.002* 0.000* 0.000* 0.003* 0.006CA 0.010 0.000* 0.000* 0.000* 0.033 0.000*J 0.024 0.028 0.001* 0.000* 0.018 0.002*
Point Hope TA 0.030 0.000* 0.055CA 0.000*J 0.000*
Humeral cross-sectional properties
* Significant with multiple comparison corrections.
TABLE 7. Results of Mann-Whitney pair-wise comparisons femoral and humeral properties (<1 year)
Cal Amerindian Dart Indian Knoll Kulubnarti Luis Lopes Mistihalj Point Hope
Femoral cross-sectional propertiesCal Amerindian TA 0.039
CA 0.002* 0.031J 0.002* 0.013
Dart TACA 0.000* 0.043J 0.005 0.001*
Indian Knoll TACA 0.001* 0.032J 0.023 0.000*
Kulubnarti TA 0.022CA 0.010 0.002* 0.001* 0.003J 0.000* 0.016
Luis Lopes TA 0.015CA 0.008 0.028J 0.002*
Mistihalj TACA 0.007 0.008 0.032 0.001*J 0.015 0.002* 0.017 0.000* 0.027
Point Hope TACA 0.009J 0.013
Humeral cross-sectional properties
* Significant with multiple comparison corrections.
28 L.W. COWGILL
American Journal of Physical Anthropology
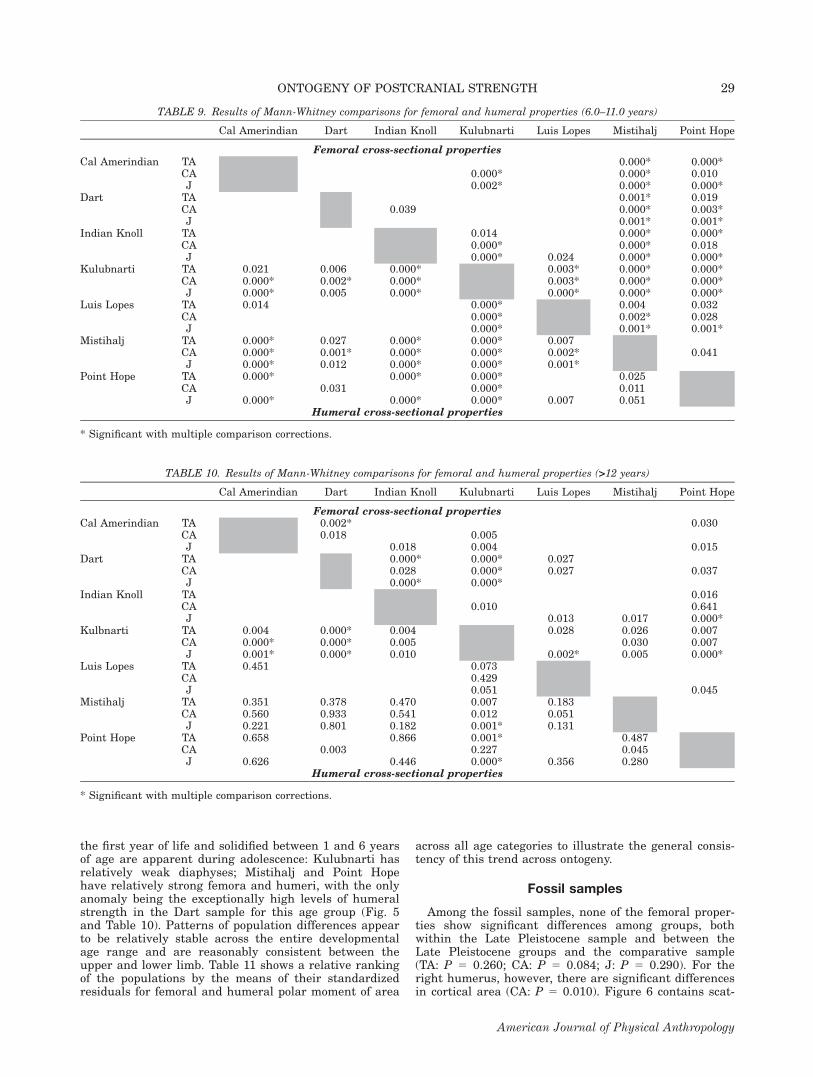
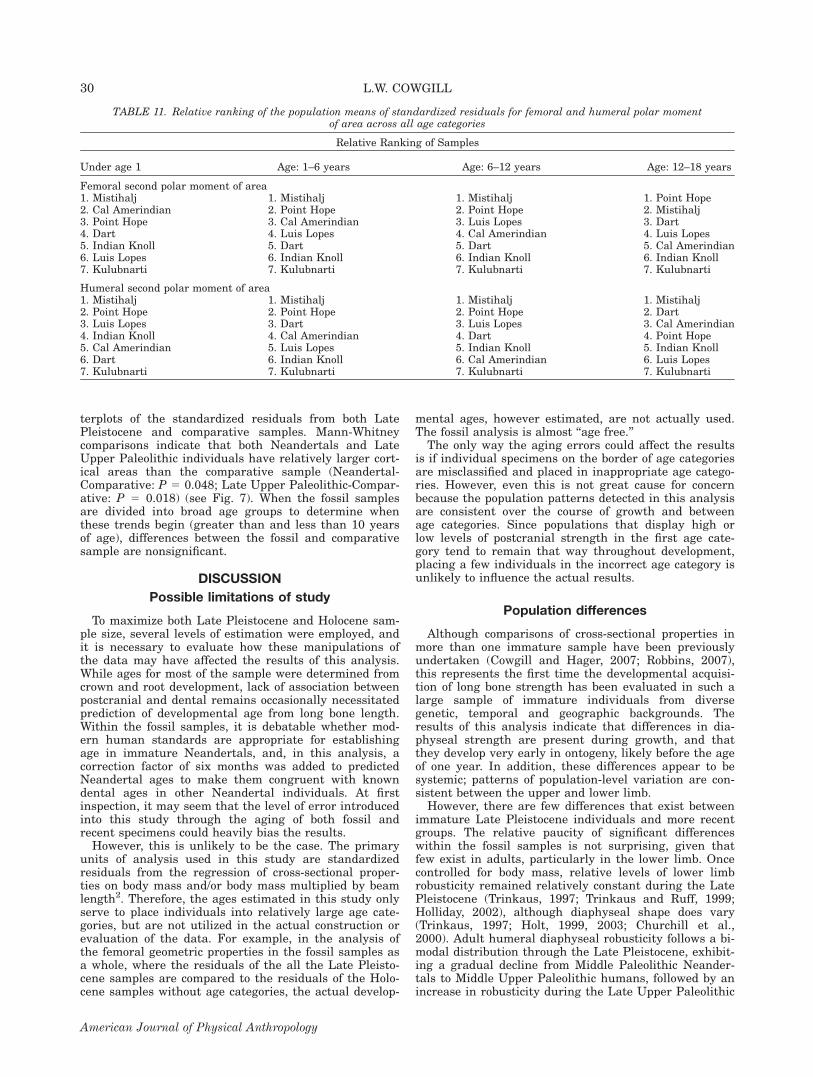
the first year of life and solidified between 1 and 6 yearsof age are apparent during adolescence: Kulubnarti hasrelatively weak diaphyses; Mistihalj and Point Hopehave relatively strong femora and humeri, with the onlyanomaly being the exceptionally high levels of humeralstrength in the Dart sample for this age group (Fig. 5and Table 10). Patterns of population differences appearto be relatively stable across the entire developmentalage range and are reasonably consistent between theupper and lower limb. Table 11 shows a relative rankingof the populations by the means of their standardizedresiduals for femoral and humeral polar moment of area
across all age categories to illustrate the general consis-tency of this trend across ontogeny.
Fossil samples
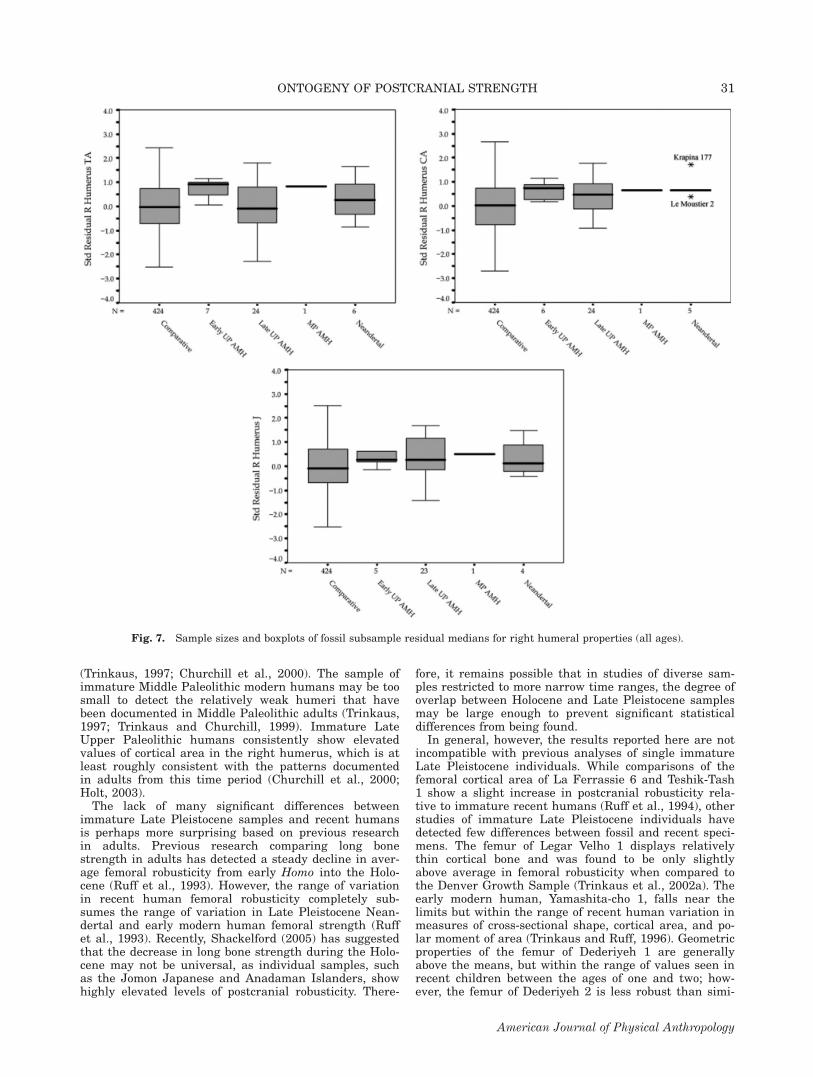
Among the fossil samples, none of the femoral proper-ties show significant differences among groups, bothwithin the Late Pleistocene sample and between theLate Pleistocene groups and the comparative sample(TA: P 5 0.260; CA: P 5 0.084; J: P 5 0.290). For theright humerus, however, there are significant differencesin cortical area (CA: P 5 0.010). Figure 6 contains scat-
TABLE 10. Results of Mann-Whitney comparisons for femoral and humeral properties (>12 years)
Cal Amerindian Dart Indian Knoll Kulubnarti Luis Lopes Mistihalj Point Hope
Femoral cross-sectional propertiesCal Amerindian TA 0.002* 0.030
CA 0.018 0.005J 0.018 0.004 0.015
Dart TA 0.000* 0.000* 0.027CA 0.028 0.000* 0.027 0.037J 0.000* 0.000*
Indian Knoll TA 0.016CA 0.010 0.641J 0.013 0.017 0.000*
Kulbnarti TA 0.004 0.000* 0.004 0.028 0.026 0.007CA 0.000* 0.000* 0.005 0.030 0.007J 0.001* 0.000* 0.010 0.002* 0.005 0.000*
Luis Lopes TA 0.451 0.073CA 0.429J 0.051 0.045
Mistihalj TA 0.351 0.378 0.470 0.007 0.183CA 0.560 0.933 0.541 0.012 0.051J 0.221 0.801 0.182 0.001* 0.131
Point Hope TA 0.658 0.866 0.001* 0.487CA 0.003 0.227 0.045J 0.626 0.446 0.000* 0.356 0.280
Humeral cross-sectional properties
* Significant with multiple comparison corrections.
TABLE 9. Results of Mann-Whitney comparisons for femoral and humeral properties (6.0–11.0 years)
Cal Amerindian Dart Indian Knoll Kulubnarti Luis Lopes Mistihalj Point Hope
Femoral cross-sectional propertiesCal Amerindian TA 0.000* 0.000*
CA 0.000* 0.000* 0.010J 0.002* 0.000* 0.000*
Dart TA 0.001* 0.019CA 0.039 0.000* 0.003*J 0.001* 0.001*
Indian Knoll TA 0.014 0.000* 0.000*CA 0.000* 0.000* 0.018J 0.000* 0.024 0.000* 0.000*
Kulubnarti TA 0.021 0.006 0.000* 0.003* 0.000* 0.000*CA 0.000* 0.002* 0.000* 0.003* 0.000* 0.000*J 0.000* 0.005 0.000* 0.000* 0.000* 0.000*
Luis Lopes TA 0.014 0.000* 0.004 0.032CA 0.000* 0.002* 0.028J 0.000* 0.001* 0.001*
Mistihalj TA 0.000* 0.027 0.000* 0.000* 0.007CA 0.000* 0.001* 0.000* 0.000* 0.002* 0.041J 0.000* 0.012 0.000* 0.000* 0.001*
Point Hope TA 0.000* 0.000* 0.000* 0.025CA 0.031 0.000* 0.011J 0.000* 0.000* 0.000* 0.007 0.051
Humeral cross-sectional properties
* Significant with multiple comparison corrections.
29ONTOGENY OF POSTCRANIAL STRENGTH
American Journal of Physical Anthropology
terplots of the standardized residuals from both LatePleistocene and comparative samples. Mann-Whitneycomparisons indicate that both Neandertals and LateUpper Paleolithic individuals have relatively larger cort-ical areas than the comparative sample (Neandertal-Comparative: P 5 0.048; Late Upper Paleolithic-Compar-ative: P 5 0.018) (see Fig. 7). When the fossil samplesare divided into broad age groups to determine whenthese trends begin (greater than and less than 10 yearsof age), differences between the fossil and comparativesample are nonsignificant.
DISCUSSION
Possible limitations of study
To maximize both Late Pleistocene and Holocene sam-ple size, several levels of estimation were employed, andit is necessary to evaluate how these manipulations ofthe data may have affected the results of this analysis.While ages for most of the sample were determined fromcrown and root development, lack of association betweenpostcranial and dental remains occasionally necessitatedprediction of developmental age from long bone length.Within the fossil samples, it is debatable whether mod-ern human standards are appropriate for establishingage in immature Neandertals, and, in this analysis, acorrection factor of six months was added to predictedNeandertal ages to make them congruent with knowndental ages in other Neandertal individuals. At firstinspection, it may seem that the level of error introducedinto this study through the aging of both fossil andrecent specimens could heavily bias the results.However, this is unlikely to be the case. The primary
units of analysis used in this study are standardizedresiduals from the regression of cross-sectional proper-ties on body mass and/or body mass multiplied by beamlength2. Therefore, the ages estimated in this study onlyserve to place individuals into relatively large age cate-gories, but are not utilized in the actual construction orevaluation of the data. For example, in the analysis ofthe femoral geometric properties in the fossil samples asa whole, where the residuals of the all the Late Pleisto-cene samples are compared to the residuals of the Holo-cene samples without age categories, the actual develop-
mental ages, however estimated, are not actually used.The fossil analysis is almost ‘‘age free.’’The only way the aging errors could affect the results
is if individual specimens on the border of age categoriesare misclassified and placed in inappropriate age catego-ries. However, even this is not great cause for concernbecause the population patterns detected in this analysisare consistent over the course of growth and betweenage categories. Since populations that display high orlow levels of postcranial strength in the first age cate-gory tend to remain that way throughout development,placing a few individuals in the incorrect age category isunlikely to influence the actual results.
Population differences
Although comparisons of cross-sectional properties inmore than one immature sample have been previouslyundertaken (Cowgill and Hager, 2007; Robbins, 2007),this represents the first time the developmental acquisi-tion of long bone strength has been evaluated in such alarge sample of immature individuals from diversegenetic, temporal and geographic backgrounds. Theresults of this analysis indicate that differences in dia-physeal strength are present during growth, and thatthey develop very early in ontogeny, likely before the ageof one year. In addition, these differences appear to besystemic; patterns of population-level variation are con-sistent between the upper and lower limb.However, there are few differences that exist between
immature Late Pleistocene individuals and more recentgroups. The relative paucity of significant differenceswithin the fossil samples is not surprising, given thatfew exist in adults, particularly in the lower limb. Oncecontrolled for body mass, relative levels of lower limbrobusticity remained relatively constant during the LatePleistocene (Trinkaus, 1997; Trinkaus and Ruff, 1999;Holliday, 2002), although diaphyseal shape does vary(Trinkaus, 1997; Holt, 1999, 2003; Churchill et al.,2000). Adult humeral diaphyseal robusticity follows a bi-modal distribution through the Late Pleistocene, exhibit-ing a gradual decline from Middle Paleolithic Neander-tals to Middle Upper Paleolithic humans, followed by anincrease in robusticity during the Late Upper Paleolithic
TABLE 11. Relative ranking of the population means of standardized residuals for femoral and humeral polar momentof area across all age categories
Relative Ranking of Samples
Under age 1 Age: 1–6 years Age: 6–12 years Age: 12–18 years
Femoral second polar moment of area1. Mistihalj 1. Mistihalj 1. Mistihalj 1. Point Hope2. Cal Amerindian 2. Point Hope 2. Point Hope 2. Mistihalj3. Point Hope 3. Cal Amerindian 3. Luis Lopes 3. Dart4. Dart 4. Luis Lopes 4. Cal Amerindian 4. Luis Lopes5. Indian Knoll 5. Dart 5. Dart 5. Cal Amerindian6. Luis Lopes 6. Indian Knoll 6. Indian Knoll 6. Indian Knoll7. Kulubnarti 7. Kulubnarti 7. Kulubnarti 7. Kulubnarti
Humeral second polar moment of area1. Mistihalj 1. Mistihalj 1. Mistihalj 1. Mistihalj2. Point Hope 2. Point Hope 2. Point Hope 2. Dart3. Luis Lopes 3. Dart 3. Luis Lopes 3. Cal Amerindian4. Indian Knoll 4. Cal Amerindian 4. Dart 4. Point Hope5. Cal Amerindian 5. Luis Lopes 5. Indian Knoll 5. Indian Knoll6. Dart 6. Indian Knoll 6. Cal Amerindian 6. Luis Lopes7. Kulubnarti 7. Kulubnarti 7. Kulubnarti 7. Kulubnarti
30 L.W. COWGILL
American Journal of Physical Anthropology
(Trinkaus, 1997; Churchill et al., 2000). The sample ofimmature Middle Paleolithic modern humans may be toosmall to detect the relatively weak humeri that havebeen documented in Middle Paleolithic adults (Trinkaus,1997; Trinkaus and Churchill, 1999). Immature LateUpper Paleolithic humans consistently show elevatedvalues of cortical area in the right humerus, which is atleast roughly consistent with the patterns documentedin adults from this time period (Churchill et al., 2000;Holt, 2003).The lack of many significant differences between
immature Late Pleistocene samples and recent humansis perhaps more surprising based on previous researchin adults. Previous research comparing long bonestrength in adults has detected a steady decline in aver-age femoral robusticity from early Homo into the Holo-cene (Ruff et al., 1993). However, the range of variationin recent human femoral robusticity completely sub-sumes the range of variation in Late Pleistocene Nean-dertal and early modern human femoral strength (Ruffet al., 1993). Recently, Shackelford (2005) has suggestedthat the decrease in long bone strength during the Holo-cene may not be universal, as individual samples, suchas the Jomon Japanese and Anadaman Islanders, showhighly elevated levels of postcranial robusticity. There-
fore, it remains possible that in studies of diverse sam-ples restricted to more narrow time ranges, the degree ofoverlap between Holocene and Late Pleistocene samplesmay be large enough to prevent significant statisticaldifferences from being found.In general, however, the results reported here are not
incompatible with previous analyses of single immatureLate Pleistocene individuals. While comparisons of thefemoral cortical area of La Ferrassie 6 and Teshik-Tash1 show a slight increase in postcranial robusticity rela-tive to immature recent humans (Ruff et al., 1994), otherstudies of immature Late Pleistocene individuals havedetected few differences between fossil and recent speci-mens. The femur of Legar Velho 1 displays relativelythin cortical bone and was found to be only slightlyabove average in femoral robusticity when compared tothe Denver Growth Sample (Trinkaus et al., 2002a). Theearly modern human, Yamashita-cho 1, falls near thelimits but within the range of recent human variation inmeasures of cross-sectional shape, cortical area, and po-lar moment of area (Trinkaus and Ruff, 1996). Geometricproperties of the femur of Dederiyeh 1 are generallyabove the means, but within the range of values seen inrecent children between the ages of one and two; how-ever, the femur of Dederiyeh 2 is less robust than simi-
Fig. 7. Sample sizes and boxplots of fossil subsample residual medians for right humeral properties (all ages).
31ONTOGENY OF POSTCRANIAL STRENGTH
American Journal of Physical Anthropology
larly aged recent remains (Kondo and Dodo, 2002a,b).Odwak (2000) found that the humeral and tibial corticaland medullary areas of Amud 7 were indistinguishablefrom modern children, and the tibia of the recently dis-covered Shanidar 10 infant also displays a level of robus-ticity close to that recent humans of similar developmen-tal age (Cowgill et al., 2007). Given this, it is possiblethat the slightly elevated levels of long bone strengthdetected in adult populations may take most of thegrowth period to develop, despite the very early differen-ces in postcranial strength found among some sampleshere (see below).
Activity patterns and long bone strengthduring growth
The evidence that bone functionally adapts to its me-chanical environment is overwhelming (see Ruff et al.,2006 for a review), and the results of the analyses ofHolocene samples conform loosely to what would beexpected based on what is known about their activitypatterns (see Apendix). In general, individuals fromPoint Hope and Mistihalj show elevated levels of postcra-nial robusticity, whereas individuals from Kulubnartidisplay very low levels of postcranial strength. Individu-als from Point Hope were likely to be participating in ahighly active hunting and gathering economy, primarilyfocused on caribou hunting, and later, whaling (Larsenand Rainey, 1948). Although the sample from Mistihaljis derived of pastoralists, two additional factors may becontributing to the very high values of long bonestrength detected in this analysis. First, this populationwas seasonally migratory and likely to be highly mobile.Second, terrain may have an influence on the elevatedlower limb strength found in this sample. Individualsfrom Mistihalj were spending summers in the highlandpastures and winters in the warmer coastal valleys,necessitating movement over hilly or mountainous land-scapes (Alexeeva et al., 2003). Previous analyses ofadults have found that terrain has a strong effect onlevels of postcranial robusticity, with individuals frommountainous regions possessing relatively stronger lowerlimbs than those from coastal environs (Ruff, 2000b).However, it is difficult for arguments based solely on
mechanical loading to explain all the differences detectedin this analysis. While children in active populationswere likely participating in similarly physically demand-ing lifestyles, it is hard to argue the case that this alonecould be responsible for producing population differencesbefore the age of one.
Genetic propensities and long bonestrength during growth
Genetic factors may play a part in the very early de-velopmental differences detected in this study. Previousresearch documenting different levels of mechanosensi-tivity in mice hints at the possibility that this could be afactor in human populations, particularly human popula-tions separated by large spans of time and space (Akhteret al., 1998; Kodama et al., 2000; Robling and Turner,2002). Akhter et al. (1998) used a four-point bending de-vice to apply in vivo loads to the tibia in C57BL/6J andC3H/HeJ mice, and found that after loading, medullaryarea, total area, and cross-sectional moment of inertiawere significantly larger in C57BL/6J mice than in C3H/HeJ mice. In addition, under similar levels of loading,
different breeds of mice appear to possess differentgenetic adaptations for obtaining increased bonestrength (Akhter et al., 2000; Turner et al., 2001). Ifgenetic differences between groups could alter the mag-nitude of bone response to mechanical loading, it is pos-sible that even the relatively low level of mechanicalstimuli due to muscle contractions experienced by the fe-tus in utero could have an effect on neonatal limbstrength. While genetic evidence suggests a possible ex-planation for the very early differences detected here,further research is necessary to determine if the differ-ences in mechanosensitivity between laboratory-bredanimal strains are applicable to natural populations.
Nutrition and long bone strength during growth
The Kulubnarti sample, consistently on the low end ofthe robusticity continuum, may be a reflection of anothercombination of factors known to effect cortical bonegrowth, particularly nutrition and maternal environ-ment. Previous studies of the Kulubnarti sample haveconcluded that individuals from this site were experienc-ing severe and persistent nutritional stress and thattheir diets included almost no protein component (VanGerven et al., 1995). In this context, the extremely lowlevels of postcranial robusticity found in this group areprobably a reflection of a lifetime of nutritional difficul-ties.However, this need not be an example of a direct
nutritional effect on bone growth per se, but an illustra-tion of the complex relationship between long bonestrength and body mass. While several studies havedocumented reduced bone mass and mineral in nutri-tionally deprived animals (Dickerson and McCance,1961; Jha et al., 1968; Adams, 1969; Salomon and Vol-pin, 1972), many of these studies failed to account forthe dramatically reduced body masses of their nutrition-ally deprived cohort. Given that the strong relationshipbetween bone strength and body mass during growth iswell-documented (van der Meulen et al., 1996; Moroet al., 1996; Ruff, 2003b), it remains possible that thedifferences between well-nourished and nutritionallystressed individuals could be a result of the reduction inbody mass in starving individuals.Two recent studies provide support for this interpreta-
tion. When Lambert et al. (2005) compared tibialstrength properties of well-fed growing rats to those ofcalorically deprived controls, tibial length, mass, area,and cross-sectional moment of inertia were indeedreduced in deprived animals. However, when thereduced structural properties were scaled to the reducedbody mass of the deprived sample, this pattern disap-peared. Similar arguments can be made for reducedbone mass in humans. Galusca et al. (2008) comparedcross-sectional properties of the radius and tibia in ano-rexics to those of very thin women with a BMI range of12.0–16.5 kg/m2, but normal fat mass percentages, men-strual cycles, hormonal levels, and energy metabolism.Cortical thickness, total area, and second moments ofarea of bone in the radius and the tibia were decreasedin both very thin women and long-standing anorexics,leading the authors to suggest that the primary determi-nant of reduced skeletal mass in these subjects is notnutritional deficit or hormonal changes associated withamenorrhea, but insufficient skeletal load.Based on this, it is entirely possible that the body
mass estimates used here, which were generated from
32 L.W. COWGILL
American Journal of Physical Anthropology
data collected on healthy, well-nourished children, areoverestimating the body masses of individuals fromKulubnarti. This entails the assumption that cross-sec-tional properties are more sensitive to rapid declines inbody mass than articulations, which may be constrainedby the need to maintain congruent joint surfaces. Thediffering sensitivity of these two variables to suddendrops in body mass could result in very low values ofbody mass standardized postcranial strength. This, incombination with potential maternal affects of malnour-ished mothers giving birth to small infants and generallylower activity levels among the nutritionally stressed,could potentially create the pattern of low postcranialstrength across the entire developmental range. In sucha scenario, it might be possible to detect starvation notthrough conventional nutritional analyses, but via meth-odological approaches that are biomechanical in theirperspective and theoretical foundation (Cowgill, 2008).
CONCLUSIONS
This research raises new possibilities for avenues offuture research and some interesting questions aboutthe interpretation of patterns of postcranial strength inadult populations. The ‘‘signal’’ being detected in theanalysis of cross-sectional properties in adults mayindeed have much to do with mechanical loading. But itis also a signal rich in ontogenetic information, a partialrecording of a lifetime of loading experienced by an indi-vidual. Furthermore, the translation of mechanical stim-uli into new bone deposition, and the various factorsthat influence and affect this transmission of biomechan-ical information, is not yet fully understood. Additionalresearch on both mature and immature individuals isnecessary to further elucidate the complex underpin-nings of these processes, and to tease out and separatehow the factors affecting long bone strength act in isola-tion and in concert to produce variation in postcranialmorphology.
ACKNOWLEDGMENTS
I thank E. Trinkaus, C.B. Ruff, G. Conroy, C. Hildebolt,H. Pontzer, R. Smith, and J. Adams for their assistanceand advice throughout the course of this project. In addi-tion, I would like to thank E. Tyler and C. Kinsinger forhelp with data collection. I also appreciate the anonymousreviewers who made many helpful comments on thismanuscript. Lastly, I am truly grateful to many individu-als across the globe who entrusted me with access to theskeletal and fossil samples in their care. This projectwould not have been possible without them.
APPENDIX: IMMATURE HOLOCENE SAMPLESUSED IN THE STUDY
Point Hope Inuits
The site of Point Hope, Alaska is situated on a penin-sula in the Chuckchi Sea, �200 km north of the ArcticCircle (Larsen and Rainey, 1948). Excavations at PointHope by Larson, Rainey, Shapiro and Giddings between1939 and 1941 recovered a large skeletal sample of pre-contact Inuit foragers, including multiple immature skel-etons from several archaeological horizons, consisting ofthe Norton, Ipiutak, Birnirk, and Tigara cultural peri-ods. The best represented of the cultural groupings from
Point Hope are the Ipiutak (2100–1500 BP) and theTigara (800–300 BP), which, despite having occupied dif-ferent temporal periods of the same site, show archaeo-logical evidence of having utilized different subsistencestrategies and consumed different diets. While the ear-lier Norton and Ipuitak periods do show evidence of sea-sonal hunting of fish and seals, these periods are charac-terized by a greater reliance on caribou hunting and theabsence of archaeological evidence of whaling (Larsenand Rainey, 1948). The artifacts associated with the laterBirnirk and Tigara periods indicate a more extensive de-pendence on the exploitation of maritime resources suchas walruses, seals, and whales (Larsen and Rainey,1948; Rainey, 1971). For this analysis, immature skeletalremains from the multiple cultural periods excavated atPoint Hope were combined into a single sample. Whilethis compromise may result in behavioral heterogeneitywithin the sample of immature individuals, this designa-tion is supported by previous analyses of Point Hopeadults that found little biomechanical difference betweenthe early and late periods at this site (Shackelford,2005). This sample is currently located at the AmericanMuseum of Natural History.
Californian Amerindians
The California Amerindian sample used in this analy-sis is derived from 28 sites in the Alameda, Sacramento,and San Joaquin counties of north-central California,primarily clustered along the San Francisco Bay and theSacramento and San Joaquin River valleys. While someof these locations are occupation and burial sites (suchas the King Brown and Brazil sites in SacramentoCounty), many of the human remains used in this sam-ple were excavated from the large shell mounds that typ-ify this region (such as the Emeryville and West Berke-ley shell mounds in Alameda County). Of the 28 sitessampled here, 46% have associated radiocarbon dates,ranging in age from 500 to 4,600 BP (Schulz, 1981; Mor-atto, 1984). Despite the range in ages and geography,the California Amerindians of this area are best charac-terized as precontact semi-sedentary foraging popula-tions. California Amerindians in the Sacramento andSan Joaquin river valleys subsisted by hunting for deer,elk, and antelope, fishing (particularly for Chinooksalmon), and extensive exploitation of acorns. Theircounterparts near the San Francisco Bay relied on simi-lar resources supplemented with shellfish collection(Moratto, 1984). This sample is currently located at thePhoebe Hearst Museum at the University of California,Berkeley.
Indian Knoll Native Americans
Indian Knoll is an Archaic Period shell-midden sitelocated on the Green River in Kentucky. Excavations byMoore (1916) and Webb (1946) recovered over 1,000 buri-als. Radiocarbon dates from this site suggest that IndianKnoll was occupied from 6,415 to 4,143 BP, with the ma-jority of the burials from Indian Knoll attributed to themiddle or late Archaic period. Individuals from IndianKnoll were likely semi-sedentary with prolonged residen-ces at seasonally occupied sites with relatively high pop-ulation densities. They participated in a sophisticatedhunting and gathering subsistence economy that reliedheavily on a narrow spectrum of essential resources,such as deer, turkey, mussels, nuts and a variety of
33ONTOGENY OF POSTCRANIAL STRENGTH
American Journal of Physical Anthropology
locally collected plant materials (Winters, 1974). The In-dian Knoll sample is currently located University ofKentucky, Lexington.
Kulubnarti Sudanese Nubians
The site of Kulubnarti is located in Upper Nubia inthe Batn el Hajar region, �130 kilometers south of WadiHalfa. Two medieval Christian cemeteries containing406 burials were excavated at Kulubnarti in 1979 (vanGerven et al., 1995). While population levels have variedthrough time, this region has been historically character-ized by low population densities due to the relative lackof resources in this rocky and inhospitable environment.With marginal subsistence levels, individuals have tradi-tionally lived in small villages and participated in small-scale agriculture. In addition, individuals at medievalKulubnarti likely suffered from chronic nutritional diffi-culty combined with bouts of infectious disease duringgrowth. Incidence of iron deficiency and nonspecific de-velopmental stress are extremely high among immatureindividuals at this site, with 82–94% of all immaturecrania exhibiting signs of cribra obritalia, and all indi-viduals having at least one enamel hypoplasia (VanGerven et al., 1990). This sample is currently located atthe University of Colorado, Boulder.
Mistihalj Central Europeans
Excavated in 1967 and 1968 by the Joint Stanford-Yu-goslav archaeological expedition, Mistihalj is a medievalburial site located in former Yugoslavia, currently on theborder between Bosnia-Herzegovina and Montenegro.Analysis of cemetery monuments, coins, and grave goodsindicates that the Mistihalj cemetery was used primarilyin the middle of the 15th century, between 1400 and1475. The remains at Mistihalj are culturally associatedwith the Vlakhs, an indigenous ethnic group that stillpersists in the Balkan region today in small numbers.Historically, Vlakhs have been nomadic pastoralists, pri-marily engaged in breeding sheep, horses, mules, andcattle. Vlakhs migrated seasonally over varied terrain,spending summers in the highland pastures and wintersin the warmer costal valleys (Alexeeva et al., 2003). TheMistihalj collection is currently located at the PeabodyMuseum at Harvard University.
Dart collection Sub-Saharan Africans
The Dart Collection is an ethnically mixed, nativeAfrican cadaver sample derived from hospitals in theTransvaal region in South Africa. This collection wasstarted by Raymond Dart in 1924 and continued by Phil-lip V. Tobias for most of the 20th century, resulting in acollection that now totals over 3,000 skeletons. The skel-etal catalog includes a variety of details, including ethnicgroup or tribe, reported age, hospital source, date of ac-quisition, and cause of death (Sanuders and Devito,1991). The immature individuals in this sub-sample ofthe collection died between 1927 and 1980, with 74% ofall individuals having died before 1950, and �92% of theindividuals within this sample are South African Blacks.In light of the relatively wide geographic area fromwhich these individuals are derived and the fifty-yeartime span of their collection, it remains difficult toconclusively categorize them as exclusively urban orrural. This collection is located at the School of Medicine,
University of Witwatersrand, Johannesburg, SouthAfrica.
Luis Lopes Western Europeans
The Luis Lopes skeletal collection consists of 20th cen-tury Portuguese from several cemeteries in Lisbon. Thevast majority of immature individuals in this sampledied between 1900 and 1960, and their remains were col-lected after 1980 when they were exhumed and sched-uled to be placed in communal burials. Because coffinplates and cemetery registries are available to identifyall individuals, reasonably reliable ages, addresses,causes of death, and parental occupation are accessiblefor many of these remains (Cardoso, 2005). In general,the sample is best categorized as an urban population oflow to middle socioeconomic status. Previous analyses ofpaternal occupation show that the heads of most of thesehouseholds earned their livings in skilled manual occu-pations, such as tailor or locksmith, although parentalemployment in partially skilled or unskilled labor occu-pations is not uncommon in the sample (Cardoso, 2005).The sample is located at the Bocage Museum (NationalMuseum of Natural History) in Lisbon, Portugal.
LITERATURE CITED
Adams P. 1968. The effect of experimental malnutrition on thedevelopment of long bones. Nutritional aspects of the develop-ment of bone and connective tissue. In: Symposium of theGroup of European Nutritionist, Cambridge. 13:69–73.
Akhter MP, Cullen DM, Pedersen EA, Kimmel DB, Recker RR.1998. Bone response to in vivo mechanical loading in twobreeds of mice. Calcif Tissue Int 63:442–449.
Akhter MP, Iwaniec UT, Covey MA, Cullen DM, Kimmel DB,Recker RR. 2000. Genetic variation in bone density, histormor-phology, and strength in mice. Calcif Tiss Int 67:337–344.
Alexeeva TI, Bogatenkov DV, Lebedinskaya GV. 2003. Anthro-pology of medieval Vlakhs in comparative study: on date ofMistikhaly burial site. Moskva: Scientific World (in Russia,summery in English).
Bass S, Pearce G, Bradney M, Hendrich E, Delmas PD, HardingA, Seeman E. 1998. Exercise before puberty may confer residualbenefits in bone density in adulthood: studies in active prepuber-tal and retired female gymnasts. J Bone Miner Res 13:500–507.
Bass SL, Saxon L, Daly RM, Turner CH, Robling AG, SeemanE, Stuckey S. 2002. The effect of mechanical loading on thesize and shape of bone in pre-, peri-, and postpubertal girls: astudy in tennis players. J Bone Miner Res 17:2274–2280.
Biewener AA, Bertram JEA. 1994. Structural response of grow-ing bone to exercise and disuse. J Appl Physiol 76:946–955.
Biewener AA, Swartz SM, Bertram JEA. 1986. Bone modelingduring growth: dynamic strain equilibrium in the chick tibio-tarsus. Calcif Tissue Int 39:390–395.
Biewener AA. 1992. Overview of structural mechanics. In: Biew-ener AA, editor. Biomechanics—structures and systems: apractical approach. Oxford: Oxford University Press. p 1–20.
Bradney M, Pearce G, Naughton G, Sullivan C, Bass S, Beck T,Carlson J, Seeman E. 1998. Moderate exercise during growthin perubertal boys: changes in bone mass, size, volumetricdensity, and bone strength: a controlled prospective study. JBone Miner Res 13:1814–1821.
Cardoso HFV. 2005. Patterns of growth and development of thehuman skeleton and dentition in relation to environmentalquality: a biocultural analysis of a sample of 20th centuryPortuguese subadult documented skeletons. Ph.D. thesis.McMasters University.
Carter DR, Beaupre GS. 2001. Skeletal function and form:mechanobiology of skeletal development, aging and regenera-tion. Cambridge: Cambridge University Press.
34 L.W. COWGILL
American Journal of Physical Anthropology
Carter DR, Orr TE, Fyhrie DP, Schurman DJ. 1987. Influencesof mechanical stress on prenatal and postnatal skeletal devel-opment. Clin Orthop Relat Res 219:237–250.
Carter DR, Wong M. 1988. Mechanical stress and endochondralossification in the chondroepiphysis. J Orthop Res 6:148–154.
Churchill SE. 1994. Human upper body evolution in the Eura-sian Late Pleistocene. Ph.D. dissertation. University of NewMexico, Albuquerque.
Churchill SE, Formicola V, Holliday TW, Holt B, Schumann BA.2000. The Upper Paleolithic population in Europe in an evolu-tionary perspective. In: Roebroeks W, Mussi M, Svoboda J,Fennema K, editors. Hunters of the Golden Age. Leiden: Uni-versity of Leiden.
Conroy BP, Kraemer WJ, Maresh CM, Fleck SJ, Stone MH, Fry AC,Miller PD, Dalsky GP. 1993. Bone mineral density in elite juniorOlympic weightlifters. Med Sci Sports Exerc 25:1103–1109.
Cowgill LW. 2008. The ontogeny of recent and late pleistocenehuman postcranial robusticity. Ph.D. dissertation. WashingtonUniversity, St. Louis.
Cowgill LW, Hager LD. 2007. Variation in the development ofpostcranial robusticity: an example from Catalhoyuk, Turkey.Int J Osteoarchael 17:235–252.
Cowgill LW, Trinkaus E, Zeder MA. 2007. Shanidar 10: a MiddlePaleolithic immature distal lower limb from Shanidar Cave,Iraqi Kurdistan. J Hum Evol 53:213–223.
Dickerson JWT, McCance RA. 1961. Severe undernutrition ingrowing and adult animals: the dimensions and chemistry ofthe long bones. Brit J Nutr 15:567–576.
Eschman PN. 1992. SLCOMM Version 1.6. Eschman Archaeo-logical Services, Albuquerque, NM.
Fazekas IG, Kosa F. 1978. Forensic fetal osteology. Budapest:Akademiai Kiado.
Ferembach D, Dastugue J, Poitrat-Targowla M-J. 1962. La Nec-ropole Epipaleolithique de Taforalt: etude des squeletteshumains. Paris: Centre National de la Recherche Scientifique.
Formicola V, Giannecchini M. 1999. Evolutionary trends in stat-ure in Upper Paleolithic and Mesolithic Europe. J Hum Evol36:319–333.
Galusca B, Zouch M, Germain N, Bossu C, Frere D, Lang F,Lafage-Proust M-H, Thomas T, Vico L, Estour B. 2008. Con-stitutional thinness: unusual human phenotype of low bonequality. J Clin Endocrinol Metab 93:110–117.
Grimston SK, Willows ND, Hanley DA. 1993. Mechanical load-ing regime and its relationship to bone mineral density inchildren. Med Sci Sports Exerc 25:1203–1210.
Guatelli-Steinberg D, Reid DJ, Bishop TA, Larsen CS. 2005. An-terior tooth growth periods in Neandertals we comparable tothose of modern humans. Proc Natl Acad Sci USA 102:14197–14202.
Hall BK. 1972. Immobilization and cartilage transformationinto bone in the embryonic chick. Anat Rec 173:391–404.
Haapasalo H. 1998. Physical activity and growing bone: devel-opment of peak bone mass with special reference to theeffects of unilateral physical activity. Ann Chir Gynaecol 87:250–252.
Haapasalo H, Kannus P, Sievanen H, Pasanen M, Uusi-Rasi K,Heinonen A, Oja P, Vouri I. 1998. Effect of long-term unilat-eral activity on bone mineral density of female junior tennisplayers. J Bone Miner Res 13:310–319.
Henderson JH, Carter DR. 2002. Mechanical induction in limbmorphogenesis: the role of growth-generated strains and pres-sures. Bone 31:645–653.
Holliday TW. 1999. Body proportions in Late Pleistocene Europeand modern human origins. J Hum Evol 32:423–447.
Holliday TW. 2002. Body size and postcranial robusticity of Eu-ropean Upper Paleolithic hominins. J Hum Evol 43:513–528.
Holms S. 1979. A simple sequentially reductive multiple testprocedure. Scand J Stat 6:65–70.
Holt BM. 1999. Biomechanical evidence of decreased mobility inupper Paleolithic and Mesolithic Europe. Ph.D. thesis. Uni-versity of Missouri, Columbia.
Holt BM. 2003. Mobility in Upper Paleolithic and MesolithicEurope: evidence from the lower limb. Am J Phys Anthropol122:200–215.
Jha GJ, Deo MG, Ramalingaswami V. 1968. Bone growth in pro-tein deficiency: a study in Rhesus monkeys. Am J Pathol 53:1111–1123.
Kannus P, Haapasalo H, Sankelo M, Sievanen H, Pasanen M,Heinonen A, Oja P, Vouri I. 1995. Effect of starting age ofphysical activity on bone mass in the dominant arm of tennisand squash players. Ann Intern Med 123:27–31.
Karlsson MK, Johnell O, Obrant KJ. 1995. Is bone mineral den-sity advantage maintained long-term in previous weightlifters? Calcif Tissue Int 57:325–328.
Khan KM, Bennell KL, Hopper JL, Flicker L, Nowson CA, Sher-win AJ, Crichton KJ, Harcourt PR, Wark JD. 1998. Self-reported ballet classes undertaken at age 10-12 years and hipbone mineral density in later life. Osteoporos Int 8:165–173.
Kimura T, Takahashi H. 1982. Mechanical properties of crosssection of lower limb long bones in Jomon Man. J AnthropSoc Nippon 90(Suppl):105–118.
Kodama Y, Umemura Y, Nagasawa S, Beamer WG, DonahueLR, Rosen CR, Baylink DJ, Farley JR. 2000. Exercise and me-chanical loading increase periosteal bone formation and wholebone strength in C57BL/6J mice but not in C3H/Hej mice.Calcif Tissue Int 66:298–306.
Kondo O, Dodo Y. 2002a. Postcranial bones of the Neanderthalchild of the burial No. 1. In: Akazawa T, Muhesen S, editors.Neanderthal Burials. Excavations of the Dederiyeh Cave,Afin, Syria. Kyoto: International Research Center for Japa-nese Studies. p 139–201.
Kondo O, Dodo Y. 2002b. Postcranial bones of the Neanderthalchild of the burial No. 2. In: Akazawa T, Muhesen S, editors.Neanderthal Burials. Excavations of the Dederiyeh Cave,Afin, Syria. Kyoto: International Research Center for Japa-nese Studies. p 299–313.
Kontulainen S, Sievanen H, Kannus P, Pasanen M, Vouri I.2003. Effect of long-term impact-loading on mass, size, andestimated strength of humerus and radius of female racquet-sports players: a peripheral quantitative computed tomogra-phy study between young and old starters and controls.J Bone Miner Res 18:352–359.
Kriska AM, Sandler RB, Cauley JA, LaPorte RE, Hom DL,Pambianco G. 1988. The assessment of historical phycial ac-tivity and its relation to adult bone parameters. Am J Epide-miol 127:1053–1061.
Lambert J, Lamothe JM, Zernicke RF, Auer RN, Reimer RA.2005. Dietary restriction does not adversely affect bone geom-etry and mechanical in rapidly growing male Wistar rats.Pediatr Res 57:227–231.
Larsen H, Rainey F. 1948. Ipiutak and the Arctic while huntingculture. Anthrop Pap Am Mus Nat Hist 42:1–276.
Lieberman DE, Devlin MJ, Pearson OM. 2001. Articular arearesponses to mechanical loading: effects of exercise, age, andskeletal location. Am J Phys Anthropol 116:266–277.
Liversidge HM, Molleson T. 2004. Variation in crown and rootformation and eruption of human deciduous teeth. Am J PhysAnthropol 123:172–180.
Lovejoy OC, Meindl RS, Ohman JC, Heiple KG, White TD.2002. The Maka femur and its bearing on the antiquity ofhuman walking: applying contemporary concepts of mopho-genesis to the human fossil record. Am J Phys Anthropol 119:97–133.
Lovejoy OC, McCollum MA, Reno PL, Rosenman BA. 2003. De-velopmental biology and human evolution. Annu Rev Anthro-pol 32:85–109.
Macchiarelli R, Bondiolo L, Debenath A, Mazurier A, Tourne-piche J-F, Birch W, Dean C. 2006. How Neandertal molarteeth grew. Nature 444:748–751.
McCulloch RG, Bailey DA, Whalen RL, Houson CS, FaulknerRA, Craven BR. 1992. Bone density and bone mineral contentof adolescent soccer athletes and competitive swimmers.Pediatr Exerc Sci 4:319–330.
McKay HA, Petit MA, Schutz RW, Prior JC, Barr SI, Khan KM.2000. Augmented trochanteric bone mineral density aftermodified physical education classes. J Pediatr 136:156–162.
Micklesfield L, Rosenberg L, Cooper D, Hoffman M, Kalla A,Stander I, Lambert E. 2003. Bone mineral density and life-
35ONTOGENY OF POSTCRANIAL STRENGTH
American Journal of Physical Anthropology
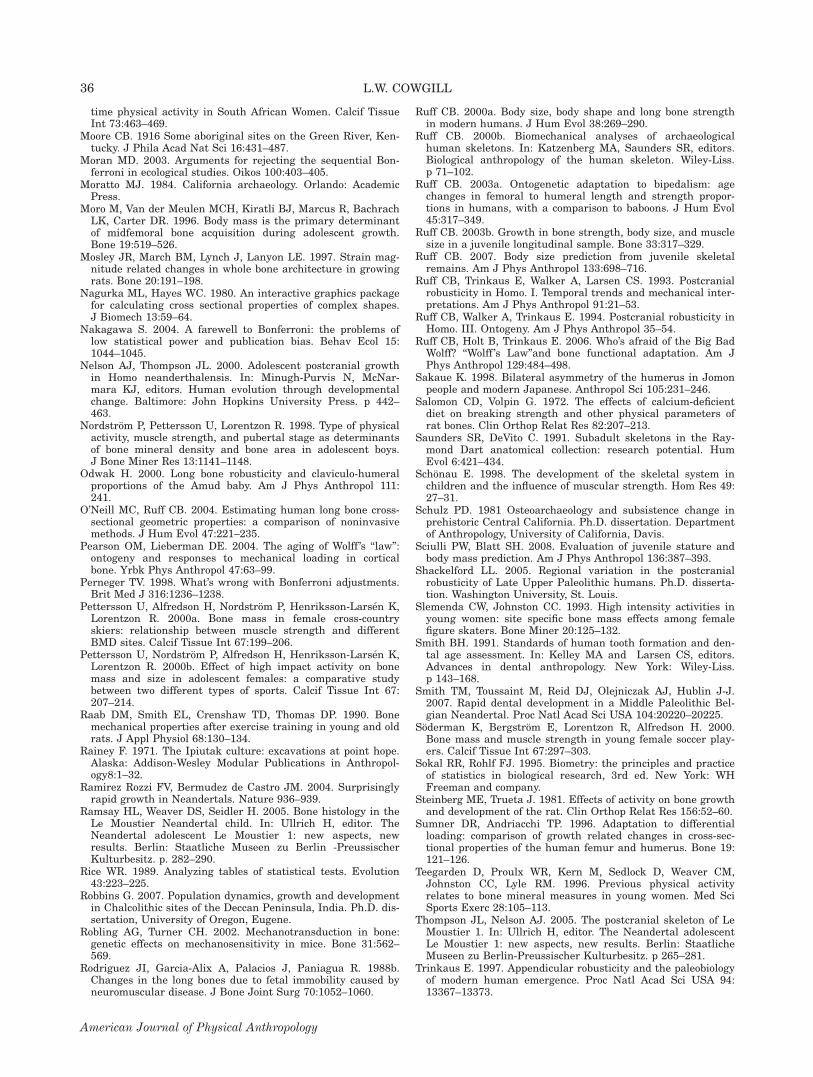
time physical activity in South African Women. Calcif TissueInt 73:463–469.
Moore CB. 1916 Some aboriginal sites on the Green River, Ken-tucky. J Phila Acad Nat Sci 16:431–487.
Moran MD. 2003. Arguments for rejecting the sequential Bon-ferroni in ecological studies. Oikos 100:403–405.
Moratto MJ. 1984. California archaeology. Orlando: AcademicPress.
Moro M, Van der Meulen MCH, Kiratli BJ, Marcus R, BachrachLK, Carter DR. 1996. Body mass is the primary determinantof midfemoral bone acquisition during adolescent growth.Bone 19:519–526.
Mosley JR, March BM, Lynch J, Lanyon LE. 1997. Strain mag-nitude related changes in whole bone architecture in growingrats. Bone 20:191–198.
Nagurka ML, Hayes WC. 1980. An interactive graphics packagefor calculating cross sectional properties of complex shapes.J Biomech 13:59–64.
Nakagawa S. 2004. A farewell to Bonferroni: the problems oflow statistical power and publication bias. Behav Ecol 15:1044–1045.
Nelson AJ, Thompson JL. 2000. Adolescent postcranial growthin Homo neanderthalensis. In: Minugh-Purvis N, McNar-mara KJ, editors. Human evolution through developmentalchange. Baltimore: John Hopkins University Press. p 442–463.
Nordstrom P, Pettersson U, Lorentzon R. 1998. Type of physicalactivity, muscle strength, and pubertal stage as determinantsof bone mineral density and bone area in adolescent boys.J Bone Miner Res 13:1141–1148.
Odwak H. 2000. Long bone robusticity and claviculo-humeralproportions of the Amud baby. Am J Phys Anthropol 111:241.
O’Neill MC, Ruff CB. 2004. Estimating human long bone cross-sectional geometric properties: a comparison of noninvasivemethods. J Hum Evol 47:221–235.
Pearson OM, Lieberman DE. 2004. The aging of Wolff ’s ‘‘law’’:ontogeny and responses to mechanical loading in corticalbone. Yrbk Phys Anthropol 47:63–99.
Perneger TV. 1998. What’s wrong with Bonferroni adjustments.Brit Med J 316:1236–1238.
Pettersson U, Alfredson H, Nordstrom P, Henriksson-Larsen K,Lorentzon R. 2000a. Bone mass in female cross-countryskiers: relationship between muscle strength and differentBMD sites. Calcif Tissue Int 67:199–206.
Pettersson U, Nordstrom P, Alfredson H, Henriksson-Larsen K,Lorentzon R. 2000b. Effect of high impact activity on bonemass and size in adolescent females: a comparative studybetween two different types of sports. Calcif Tissue Int 67:207–214.
Raab DM, Smith EL, Crenshaw TD, Thomas DP. 1990. Bonemechanical properties after exercise training in young and oldrats. J Appl Physiol 68:130–134.
Rainey F. 1971. The Ipiutak culture: excavations at point hope.Alaska: Addison-Wesley Modular Publications in Anthropol-ogy8:1–32.
Ramirez Rozzi FV, Bermudez de Castro JM. 2004. Surprisinglyrapid growth in Neandertals. Nature 936–939.
Ramsay HL, Weaver DS, Seidler H. 2005. Bone histology in theLe Moustier Neandertal child. In: Ullrich H, editor. TheNeandertal adolescent Le Moustier 1: new aspects, newresults. Berlin: Staatliche Museen zu Berlin -PreussischerKulturbesitz. p. 282–290.
Rice WR. 1989. Analyzing tables of statistical tests. Evolution43:223–225.
Robbins G. 2007. Population dynamics, growth and developmentin Chalcolithic sites of the Deccan Peninsula, India. Ph.D. dis-sertation, University of Oregon, Eugene.
Robling AG, Turner CH. 2002. Mechanotransduction in bone:genetic effects on mechanosensitivity in mice. Bone 31:562–569.
Rodriguez JI, Garcia-Alix A, Palacios J, Paniagua R. 1988b.Changes in the long bones due to fetal immobility caused byneuromuscular disease. J Bone Joint Surg 70:1052–1060.
Ruff CB. 2000a. Body size, body shape and long bone strengthin modern humans. J Hum Evol 38:269–290.
Ruff CB. 2000b. Biomechanical analyses of archaeologicalhuman skeletons. In: Katzenberg MA, Saunders SR, editors.Biological anthropology of the human skeleton. Wiley-Liss.p 71–102.
Ruff CB. 2003a. Ontogenetic adaptation to bipedalism: agechanges in femoral to humeral length and strength propor-tions in humans, with a comparison to baboons. J Hum Evol45:317–349.
Ruff CB. 2003b. Growth in bone strength, body size, and musclesize in a juvenile longitudinal sample. Bone 33:317–329.
Ruff CB. 2007. Body size prediction from juvenile skeletalremains. Am J Phys Anthropol 133:698–716.
Ruff CB, Trinkaus E, Walker A, Larsen CS. 1993. Postcranialrobusticity in Homo. I. Temporal trends and mechanical inter-pretations. Am J Phys Anthropol 91:21–53.
Ruff CB, Walker A, Trinkaus E. 1994. Postcranial robusticity inHomo. III. Ontogeny. Am J Phys Anthropol 35–54.
Ruff CB, Holt B, Trinkaus E. 2006. Who’s afraid of the Big BadWolff? ‘‘Wolff ’s Law’’and bone functional adaptation. Am JPhys Anthropol 129:484–498.
Sakaue K. 1998. Bilateral asymmetry of the humerus in Jomonpeople and modern Japanese. Anthropol Sci 105:231–246.
Salomon CD, Volpin G. 1972. The effects of calcium-deficientdiet on breaking strength and other physical parameters ofrat bones. Clin Orthop Relat Res 82:207–213.
Saunders SR, DeVito C. 1991. Subadult skeletons in the Ray-mond Dart anatomical collection: research potential. HumEvol 6:421–434.
Schonau E. 1998. The development of the skeletal system inchildren and the influence of muscular strength. Hom Res 49:27–31.
Schulz PD. 1981 Osteoarchaeology and subsistence change inprehistoric Central California. Ph.D. dissertation. Departmentof Anthropology, University of California, Davis.
Sciulli PW, Blatt SH. 2008. Evaluation of juvenile stature andbody mass prediction. Am J Phys Anthropol 136:387–393.
Shackelford LL. 2005. Regional variation in the postcranialrobusticity of Late Upper Paleolithic humans. Ph.D. disserta-tion. Washington University, St. Louis.
Slemenda CW, Johnston CC. 1993. High intensity activities inyoung women: site specific bone mass effects among femalefigure skaters. Bone Miner 20:125–132.
Smith BH. 1991. Standards of human tooth formation and den-tal age assessment. In: Kelley MA and Larsen CS, editors.Advances in dental anthropology. New York: Wiley-Liss.p 143–168.
Smith TM, Toussaint M, Reid DJ, Olejniczak AJ, Hublin J-J.2007. Rapid dental development in a Middle Paleolithic Bel-gian Neandertal. Proc Natl Acad Sci USA 104:20220–20225.
Soderman K, Bergstrom E, Lorentzon R, Alfredson H. 2000.Bone mass and muscle strength in young female soccer play-ers. Calcif Tissue Int 67:297–303.
Sokal RR, Rohlf FJ. 1995. Biometry: the principles and practiceof statistics in biological research, 3rd ed. New York: WHFreeman and company.
Steinberg ME, Trueta J. 1981. Effects of activity on bone growthand development of the rat. Clin Orthop Relat Res 156:52–60.
Sumner DR, Andriacchi TP. 1996. Adaptation to differentialloading: comparison of growth related changes in cross-sec-tional properties of the human femur and humerus. Bone 19:121–126.
Teegarden D, Proulx WR, Kern M, Sedlock D, Weaver CM,Johnston CC, Lyle RM. 1996. Previous physical activityrelates to bone mineral measures in young women. Med SciSports Exerc 28:105–113.
Thompson JL, Nelson AJ. 2005. The postcranial skeleton of LeMoustier 1. In: Ullrich H, editor. The Neandertal adolescentLe Moustier 1: new aspects, new results. Berlin: StaatlicheMuseen zu Berlin-Preussischer Kulturbesitz. p 265–281.
Trinkaus E. 1997. Appendicular robusticity and the paleobiologyof modern human emergence. Proc Natl Acad Sci USA 94:13367–13373.
36 L.W. COWGILL
American Journal of Physical Anthropology
Trinkaus E, Churchill S. 1999. Diaphyseal cross-sectional geom-etry of the near eastern Middle Paleolithic humans: the hu-merus. J Archaeol Sci 26:173–184.
Trinkaus E, Ruff CB. 1999. Diaphyseal cross-sectional geometryof Near Eastern Middle Paleolithic humans: the femur.J Archaeol Sci 26:409–424.
Trinkaus E, Ruff CB. 1996. Early modern human remains fromeastern Asia: the Yamashita-cho 1 immature postcrania.J Hum Evol 30:299–314.
Trinkaus E, Ruff CB, Esteves F, Coelho JMS, Silva M, MendovaM. 2002a. The lower limb remains. In: Zilhao J, Trinkaus E,editors. Portrait of the artist as a child. Lisbon: Intituto Por-tuguos de Arqueologia. p 435–465.
Trinkaus E, Ruff CB, Esteves F, Coelho JMS, Silva M, MendovaM. 2002b. The upper limb remains. In: Zilhao J, Trinkaus E,editors. Portrait of the artist as a child. Lisbon: Intituto Por-tuguos de Arqueologia. p 466–488.
Trinkaus E, Smith FH, Stockton TC, Shackelford LL. 2006. Thehuman postcranial remains from Mladec. In: Teschler-NicolaM, editor. Early modern humans at the Moravian gate: theMladec Caves and their remains. New York: SpringerWien.p 385–446.
Turner CH, Hsieh Y-F, Muller R, Bouxsein ML, Rosen CJ,McCrann ME, Donahue LR, Beamer WG. 2001. Variation in
bone biomechanical properties, microstructure, and density inBXH recombinant inbred mice. J Bone Miner Res 16:206–213.
Van Gerven DP, Hummert JR, Burr DB. 1985. Cortical bonemaintenance and geometry of the tibia in Prehistoric childrenfrom Nubia’s Batn et Hajar. Am J Phys Anthropol 66:275–280.
Van Gerven DP, Beck R, Hummert JR. 1990. Patterns of enamelhypoplasia in two medieval populations from Nubia’s Batn elHajar. Am J Phys Anthropol 82:413–420.
van Gerven DP, Sheridan SG; Adams WY. 1995. The Healthand nutrition of a medieval nubian population: the impact ofpolitical and economic change. Am Anthropol 97:468–480.
Van der Meulen MC, Ashford MWJ, Kiratli BJ, Backrach LK,Carter DR. 1996. Determinates of femoral geometry andstructure during adolescent growth. J Orthop Res 14:22–29.
Webb WS. 1946. Indian Knoll, Site Oh 2, Ohio County, Kentucky:the University of Kentucky Reports in anthropology and archae-ology. Lexington: Department of Anthropology. p 111–365.
Winters HD. 1974. Introduction to the new edition. In: WebbWS, editor. Indian knoll. Knoxville: University the TennesseePress.
Woo SL-Y, Kuei SC, Amiel D, Gomez MA, Hayes WC, White FC,Akeson WH. 1981. The effect of prolonged physical trainingon the properties of long bone. J Bone Joint Surg 63:780–787.
37ONTOGENY OF POSTCRANIAL STRENGTH
American Journal of Physical Anthropology


