Embed Size (px)
Citation preview
The Modification of an EstuaryAuthor(s): Frederic H. Nichols, James E. Cloern, Samuel N. Luoma, David H. PetersonSource: Science, New Series, Vol. 231, No. 4738 (Feb. 7, 1986), pp. 567-573Published by: American Association for the Advancement of ScienceStable URL: http://www.jstor.org/stable/1696456Accessed: 24/11/2008 13:47
Your use of the JSTOR archive indicates your acceptance of JSTOR's Terms and Conditions of Use, available athttp://www.jstor.org/page/info/about/policies/terms.jsp. JSTOR's Terms and Conditions of Use provides, in part, that unlessyou have obtained prior permission, you may not download an entire issue of a journal or multiple copies of articles, and youmay use content in the JSTOR archive only for your personal, non-commercial use.
Please contact the publisher regarding any further use of this work. Publisher contact information may be obtained athttp://www.jstor.org/action/showPublisher?publisherCode=aaas.
Each copy of any part of a JSTOR transmission must contain the same copyright notice that appears on the screen or printedpage of such transmission.
JSTOR is a not-for-profit organization founded in 1995 to build trusted digital archives for scholarship. We work with thescholarly community to preserve their work and the materials they rely upon, and to build a common research platform thatpromotes the discovery and use of these resources. For more information about JSTOR, please contact [email protected].
American Association for the Advancement of Science is collaborating with JSTOR to digitize, preserve andextend access to Science.
http://www.jstor.org

The Modification of an Estuary
FREDERIC H. NICHOLS, JAMES E. CLOERN, SAMUEL N. LUOMA, DAVID H. PETERSON
The San Francisco Bay estuary has been rapidly modified by human activity. Diking and filling of most of its wetlands have eliminated habitats for fish and waterfowl; the introduction of exotic species has transformed the composition of its aquatic communities; reduction of freshwater inflow by more than half has changed the dynamics of its plant and animal communities; and wastes have contaminated its sediments and organisms. Contin- ued disposal of toxic wastes, the probable further reduc- tion in freshwater inflow, and the possible synergy be- tween the two provide the potential for further alteration of the estuary's water quality and biotic communities.
STUARIES HAVE LONG BEEN A FOCUS OF HUMAN SETTLE- ment and activity because of their wide array of living and
nonliving resources. They have also been susceptible to
change: their tributary rivers have been dammed and diverted, shorelines modified, fish populations reduced or eliminated, and water quality altered by wastes (1). The San Francisco Bay estuary is no exception.
San Francisco Bay is located at the mouth of the Sacramento-San Joaquin river system, which carries runofffrom 40 percent (153,000 km2) of California's surface area (Fig. 1). Spanish soldiers and missionaries, first arriving in 1769, found here a complex of bays and marshes where an estimated 10,000 to 20,000 aboriginals lived and harvested food (2, 3). The Spanish settlement (now San Francisco) remained an isolated trading outpost until gold was discovered in the Sierra Nevada foothills (Fig. 1) in 1848. Within 2
years, San Francisco's population grew from 400 to 25,000, begin- ning the California population boom.
The estuary changed as well. By 1900 the surface area and depth of the bay had decreased, marshes were nearly gone, fresh water was
being diverted for irrigation, many exotic plants and animals
(including pest species) had been introduced, and the effects of
sewage were already apparent. With respect to diversity of change, San Francisco Bay is today considered the major estuary in the United States most modified by human activity (4).
In this article we describe some of the human activities occurring in the San Francisco Bay estuary and its watershed since 1850 that have resulted in physical, chemical, and biological changes.
Early Ecological Changes Fish and wildlife. The best documented change that occurred in
San Francisco Bay after the Gold Rush was a decline in fish abundances (5). Early immigrants exploited the waterfowl, fish, and shellfish of the bay and the Delta-the low-lying region of marshes,
7 FEBRUARY 1986
islands, and channels surrounding the confluence of the Sacramento and San Joaquin rivers (Figs. 1 and 2).
Commercial fisheries in salmon, sturgeon, sardines, flatfish, crabs, and shrimp were quickly established. However, by 1900 catches of larger, longer lived species at upper trophic levels, such as salmon, sturgeon, and the introduced striped bass, had declined; gradually, these commercial fisheries were halted to protect the stocks for sports fishing (5). Declining abundance of the Dungeness crab (Cancer magister) in the bay forced that fishery to move offshore in the 1880's, although the bay remained a nursery ground until the 1960's, when the nearby offshore fishery collapsed (6). Today's commercial fishing is restricted to herring and anchovies (7, 8), species representative of the smaller, more rapid reproducers at lower trophic levels that dominate the fisheries of disturbed environ- ments elsewhere (9). The shifts in San Francisco Bay fisheries presumably have resulted from a combination of overfishing, elimi- nation of essential habitats, and changes in water quality (5), whereas the decline of the offshore crab fishery since 1960 is attributed variously to increased ocean temperature, predation by hatchery-reared salmon, and pollution (6). The specific contribution of any of these factors to the decline of individual species has not been quantitatively determined.
Introduced species. A less obvious but equally important change occurred within the communities of plants and animals representing the lower levels of the estuarine food web. Upon completion of the transcontinental railroad in 1869, large quantities (up to 100 carloads per year) of live eastern oysters (Crassostrea virginica) were shipped from the East Coast to California for maturing on coastal bay mud flats. By the late 1890's the imported oyster was Califor- nia's most valuable fishery product (10).
Although the eastern oyster never became naturalized in San Francisco Bay (transplanted adults failed to produce young), other East Coast invertebrates, unintentionally shipped with the oyster, became fully established (Fig. 3). Additional species that had'bored into ship hulls or were carried in ship ballast were also released into the bay (7). In total, approximately 100 invertebrate species were introduced, including the only two mollusk species in today's bay sports fishery [the eastern soft-shelled clam (Mya arenaria) and the Japanese little-neck clam (Tapes japonica)] and pest species [such as the oyster drill (Urosalpinx cinerea) and the shipworm (Teredo navalis), the latter causing large-scale destruction of piers and bridges soon after its introduction (11)]. Now, nearly all common macroinvertebrates present on the inner shallows of the bay, and some planktonic invertebrates and algae, are introduced species (7, 12, 13). The remarkable success of the introduced invertebrates has been attributed to (i) the lack of a diverse native fauna because of the estuary's geologic youth and geographic isolation (7) and (ii) the
The authors are research scientists with the U.S. Geological Survey, 345 Middlefield Road (MS-999), Menlo Park, CA 94025.
ARTICLES 567
m

opportunistic characteristics of many of the introduced species that made them well suited to rapidly colonize the bay's underexploited habitats (12).
Fish species were intentionally introduced beginning in the 1870's (5). Of the 42 fish species now inhabiting the sloughs of Suisun Bay marshes (Fig. 2), for example, 20 are introduced (14). The striped bass (Morone saxatilis), introduced from the East Coast in 1879, yielded annual catches exceeding 450 tons between 1889 and 1915. Catches declined thereafter, and commercial fishing was prohibited in 1935. The striped bass remains the primary sports fishery in San Francisco Bay (5, 7).
CenSan F ran r alley Poject-
': '
: '~
oville I
\ Auburn
. i! \ (u.c.) -
-
San Francisco iaClramento
San Francisco ay
Kesterson eroir
\ ( \
'i~.: ii
Central !3
Project ^ ^Prject e \
Water
Project ) ?:i~i::~iiiii[:i i ,
uisDra4 \
" Drainage divide
Fig. 1. Major features of California's natural and man-made water systems, including the drainage basin and major tributaries (fine lines) of the Sacramento and San Joaquin river system, major storage reservoirs (black areas), aqueducts (bold lines), the Central Valley (shaded area), the Delta, and the San Francisco Bay estuary.
568
t Physiographic Alterations The character of the central California landscape changed during
the late 1800's as a result of the gold mining, farming, and land F development that accompanied the explosive growth of population
centers. Hydraulic gold mining and land reclamation resulted in t particularly marked physical changes to San Francisco Bay.
Hydraulic mining debris. Hydraulic mining (the use of water under high pressure to expose ore deposits, employed from 1853 to 1884) greatly accelerated the recovery of gold from the Sierra Nevada. In the process, tens of millions of cubic meters of rock and earth were excavated annually. This debris choked creeks and rivers, silted or blocked salmon spawning streams, and obstructed navigation throughout the drainage basin (15). The obstructed river channels could not contain winter and spring runoff, and periodic massive flooding resulted (15, 16). Hydraulic mining was stopped by court injunction in 1884, but decades of winter floods and dredging were required to flush the sediments from the river channels. The Sacramento River channel did not return to its pre-mining depths until the late 1920's (11).
Although most damage from hydraulic mining debris occurred in the drainage basin of the Sacramento and San Joaquin rivers, much of the mud and sand reached San Francisco Bay. By the end of the 19th century, 1.0, 0.75, and 0.25 m of sediment was deposited in Suisun, San Pablo, and central San Francisco bays (Fig. 2), respec- tively (15). Acceleration of the natural sedimentation process con- tributed to both a permanent reduction in the open-water area of the bay through shoaling and an expansion of marshland across some of the newly formed mudflats (7). The reformed bottom topography reduced the water volume of the bay and altered tidal circulation patterns (15). No record exists of short- or long-term effects of these changes on the bay's biological communities, although oyster beds were reported to have been harmed by heavy siltation during the mining period (10).
Land reclamation. Before 1850, 1400 km2 of freshwater marsh surrounded the confluence of the Sacramento and San Joaquin rivers, and another 800 km2 of saltwater marsh fringed the bay's shores (Fig. 2) (15). As population increased, tidal marshes were diked to create farmland (primarily in the delta), evaporation ponds for salt, and, later, residential and industrial land. Reclamation of freshwater marshlands in the Delta was essentially complete by the early 1920's, but filling of the bay's saltwater marshes continued into the early 1970's (8). Of the original 2200 km2 of tidal marsh, only about 125 km2 of undiked marsh remains today (Fig. 2) (7). Long- term effects of marshland elimination on estuarine water chemistry and productivity are possible (17), but, again, no appropriate records predating these changes exist. Nonetheless, because half of the migratory birds on the Pacific Flyway winter on or near San Francisco Bay (18), we assume that the loss of food and habitat provided by the bay's former marshes has been detrimental to these bird populations.
Water Development and Altered Freshwater Inflow
California's climate consists of a wet winter (November through April) and a dry summer (May through October). The absence of summer rainfall necessitates irrigation of Central Valley farmlands with water diverted from the Sacramento or San Joaquin rivers and their tributaries. Further, because about 70 percent of the state's annual runoff occurs north of Sacramento (Fig. 1) and 80 percent of water consumption occurs south of that city (19), increased manage- ment of the water that flows toward San Francisco Bay has
SCIENCE, VOL. 231

accompanied the state's growth (16). One result has been a greatly reduced freshwater flow into the estuary.
The Sacramento and San Joaquin rivers discharged about 34 km3 of fresh water into San Francisco Bay annually before 1850 (20). As California's population grew (Fig. 4A), the area under irrigation increased by about 30,000 ha per year (Fig. 4B), creating demands for both flood protection and reliable water supplies. In response, state and federal agencies built dams, reservoirs, and canals to increase storage capacity (Fig. 4C) and annual export rates (Fig. 4D). These facilities represent the world's largest man-made water system (Fig. 1), with a water-storage capacity of about 20 km3 (16). At present, nearly 40 percent of the historic (1850) flow of the Sacramento-San Joaquin river system is removed for local consump- tion upstream and within the Delta. Another 24 percent is pumped from the Delta and exported in aqueducts for agricultural and municipal consumption in central and southern California (Fig. 5). Now, the flow into San Francisco Bay is less than 40 percent of historic levels. To minimize up-estuary salt intrusion that results from lowered freshwater flows (and that is exacerbated by dredged channel deepening between San Pablo Bay and the Delta) (11), inflow during summer has been increasingly augmented (Fig. 6).
Nearly 86 percent of California's managed water supply is used in agriculture (21). If the state's reservoir capacity increases as project- ed (Fig. 4C) and conversion of arid land to new farmland through irrigation continues to be profitable, demands for water export will increase (Fig. 4D). As a result, average freshwater inflow to the bay in the year 2000 is projected to drop to 30 percent of the historic average (Fig. 5).
Ecological consequences of reduced river inflow. Both the physical process of diverting water and the changes in flow patterns resulting from water management have affected biological communities of the San Francisco Bay estuary. Disruption of the natural flow of water has most noticeably affected migratory fish-species dependent on the rivers for spawning. Construction of Shasta Dam (Fig. 1) in 1944 eliminated half of the salmonid spawning habitat in the Sacramento River system (5), requiring the augmentation of natural stocks with hatchery-reared fish. The operation of water diversion pumps at the southern end of the Delta during summer periods of low river flow causes water in Delta channels to flow upstream. Thus, hundreds of millions of juvenile salmon and striped bass (31 and 25 percent of typical year classes, respectively) are drawn into the water diversion pumps each year (22). Equal numbers are lost to numerous small siphons and pumps that collect irrigation water for local consumption in the Delta (23). These losses have contributed to a decline in the abundance of adult striped bass to less than 25 percent of that in the mid-1960's (24).
Effects of water diversions on the biology of the bay itself, although more difficult to identify or quantify because of simulta- neous changes due to land reclamation, fishing, and waste disposal, can be deduced from observations made during two consecutive years of naturally low flows (1976 and 1977). Normally, fresh water is released during summer at a controlled rate between 100 and 400 m3/sec (Fig. 6). Under these conditions, the downstream-flowing river currents are balanced, in Suisun Bay, by the upstream-flowing bottom currents carrying salt water (Fig. 7). This convergence, or null zone, is a point where suspended particles, including sediment and planktonic diatoms, accumulate (7, 25, 26). Associated with this phytoplankton maximum are high abundances of pelagic herbivores (copepods and the mysid shrimp Neomysis mercedis) that are impor- tant food sources for larval or juvenile fish (27). During 1977, when Sacramento-San Joaquin river discharge in summer dropped below 100 m3/sec (Fig. 6), phytoplankton biomass in the upper estuary was reduced to 20 percent of normal levels (26), zooplankton abundance was significantly reduced, and both Neomysis abundance
7 FEBRUARY 1986
and striped bass recruitment fell to their lowest recorded levels (27, 28). Suppression of the pelagic food web during this natural occurrence of extremely low flow suggests that (i) production of some pelagic fishes in the upper estuary may depend on a high biomass of primary producers and (ii) high phytoplankton biomass develops only when freshwater inflow exceeds 100 m3/sec (26).
Two theories have been proposed to explain the absence of a summer phytoplankton bloom in northern San Francisco Bay during extremely low inflows. The first theory (26) holds that the typical summer biomass maximum is dependent on a circulation pattern that positions the null zone adjacent to the productive shallows of Suisun Bay, where light availability is sufficient to sustain algal growth. When river discharge falls below 100 m3/sec, the null zone moves upstream into the deeper Sacramento River, where light availability is insufficient to sustain net photosynthesis and phytoplankton biomass remains low. The second theory (29) holds that reduced phytoplankton biomass during periods of persist- ent low river flow and high salinity results from increased grazing losses to immigrant benthic suspension feeders that are normally excluded from this region by winter freshets.
Both mechanisms, direct consequences of reduced freshwater inflow, probably contributed to the absence of a summer bloom during the 1977 drought. These findings illustrate the sensitivity of northern San Francisco Bay biological communities to persistent low river flow and suggest that further reductions in freshwater inflow (Fig. 5) could permanently alter the pelagic food web and fisheries yield there.
Other consequences of reduced inflow. Reduced freshwater inflow from the Sacramento-San Joaquin river system may also reduce the estuary's capacity to dilute, transform, or flush contaminants that are discharged into San Francisco Bay. Estimated residence time of water in northern San Francisco Bay ranges from a minimum of 1
Fig. 2. Distribution of undiked tidal marshes around San Francisco Bay before 1850 and at present (7).
ARTICLES 569
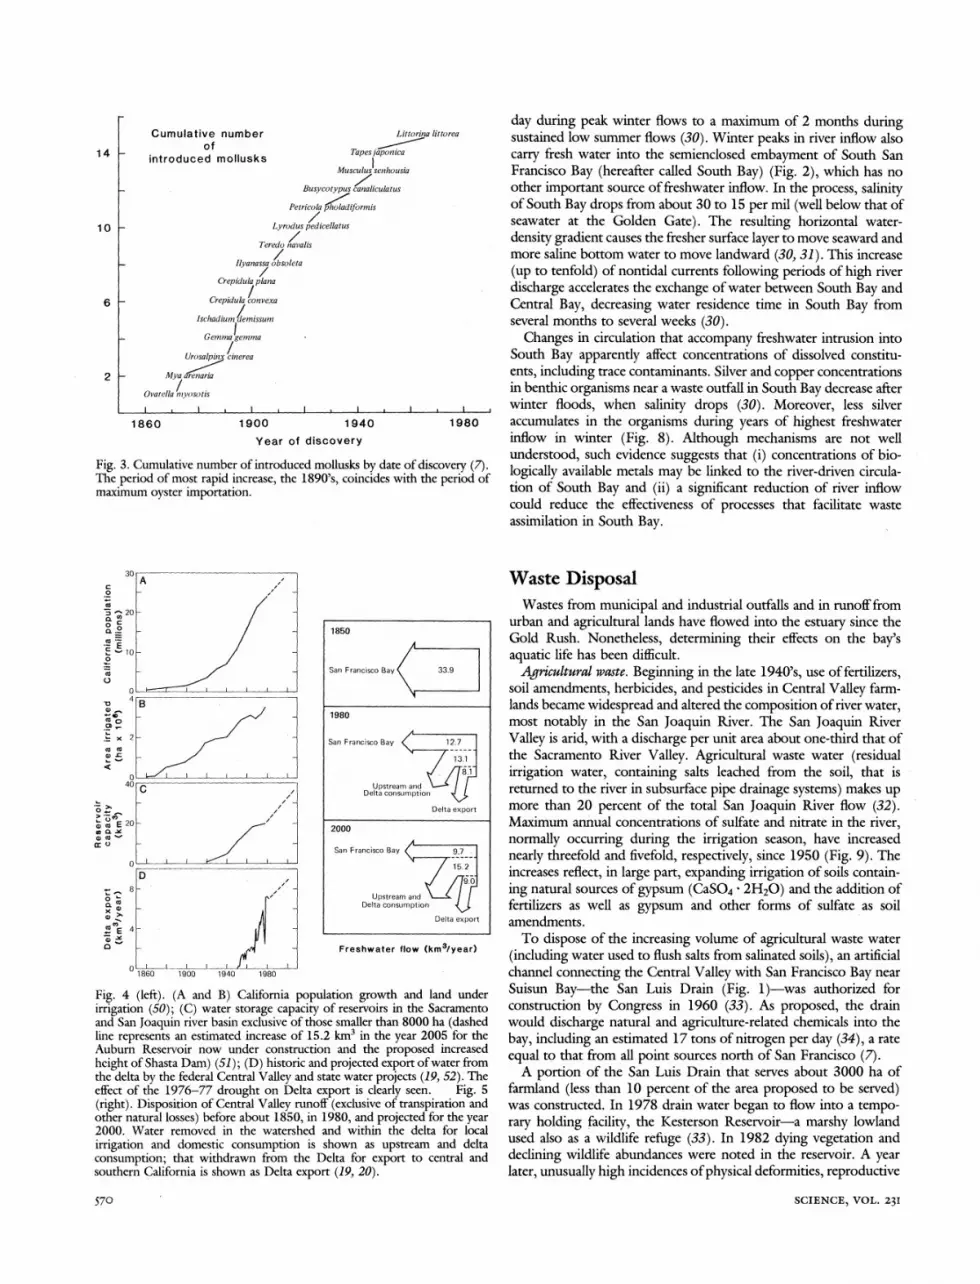
Cumulative number Littorina litto of
Tapes japonica introduced mollusks Tapesapoca Musculus senhousia
Busycotypus canaliculatus
Petricola pholadiformis
Lyrodus pedicellatus
Teredo navalis
Ilyanassa obsoleta
Crepidula plana
Crepidula convexa
Ischadium demissumn
Gemma gemma
Urosalpinx cinerea
Mya renaria
Ovatella nmyosotis
I , I , I , I , I , I ,
1860 1900 1940
Year of discovery
Fig. 3. Cumulative number of introduced mollusks by date of disco) The period of most rapid increase, the 1890's, coincides with the p maximum oyster importation.
day during peak winter flows to a maximum of 2 months during )rea sustained low summer flows (30). Winter peaks in river inflow also
carry fresh water into the semienclosed embayment of South San Francisco Bay (hereafter called South Bay) (Fig. 2), which has no other important source of freshwater inflow. In the process, salinity of South Bay drops from about 30 to 15 per mil (well below that of seawater at the Golden Gate). The resulting horizontal water- density gradient causes the fresher surface layer to move seaward and more saline bottom water to move landward (30, 31). This increase (up to tenfold) of nontidal currents following periods of high river discharge accelerates the exchange of water between South Bay and Central Bay, decreasing water residence time in South Bay from several months to several weeks (30).
Changes in circulation that accompany freshwater intrusion into South Bay apparently affect concentrations of dissolved constitu- ents, including trace contaminants. Silver and copper concentrations in benthic organisms near a waste outfall in South Bay decrease after
,winter floods, when salinity drops (30). Moreover, less silver 1980 accumulates in the organisms during years of highest freshwater
inflow in winter (Fig. 8). Although mechanisms are not well understood, such evidence suggests that (i) concentrations of bio-
eryd 7)f logically available metals may be linked to the river-driven circula- tion of South Bay and (ii) a significant reduction of river inflow could reduce the effectiveness of processes that facilitate waste assimilation in South Bay.
c 0
1d :3 - 20 - OC
U
0c~. a.
E 5 to- 0
0 0
-0 4
x 2- cat
0 40
0.. - 2-
co co!
0 0
Ott
40
1.0 , co E 20 - 0 CL A
0) to -
cr0
o -
CL (
xa 0'
B
I I
i_1 1 i , 1 i
C
I _
0 _'
D 8- /"
- 8- -
4-
o 0 t I I I I I
1850
San Francisco Bay 33.9
1980
San Francisco Bay 12.7
13.1
Upstream and Delta consumption
Delta export
2000
San Francisco Bay < 9.7
15.2
9.0
Upstream and Delta consumption
Delta export
Freshwater flow (km3/year)
1860 1900 1940 1980
Fig. 4 (left). (A and B) California population growth and land under irrigation (50); (C) water storage capacity of reservoirs in the Sacramento and San Joaquin river basin exclusive of those smaller than 8000 ha (dashed line represents an estimated increase of 15.2 km3 in the year 2005 for the Auburn Reservoir now under construction and the proposed increased height of Shasta Dam) (51); (D) historic and projected export of water from the delta by the federal Central Valley and state water projects (19, 52). The effect of the 1976-77 drought on Delta export is clearly seen. Fig. 5 (right). Disposition of Central Valley runoff (exclusive of transpiration and other natural losses) before about 1850, in 1980, and projected for the year 2000. Water removed in the watershed and within the delta for local irrigation and domestic consumption is shown as upstream and delta consumption; that withdrawn from the Delta for export to central and southern California is shown as Delta export (19, 20).
Waste Disposal Wastes from municipal and industrial outfalls and in runoff from
urban and agricultural lands have flowed into the estuary since the Gold Rush. Nonetheless, determining their effects on the bay's aquatic life has been difficult.
Agricultural waste. Beginning in the late 1940's, use of fertilizers, soil amendments, herbicides, and pesticides in Central Valley farm- lands became widespread and altered the composition of river water, most notably in the San Joaquin River. The San Joaquin River
Valley is arid, with a discharge per unit area about one-third that of the Sacramento River Valley. Agricultural waste water (residual irrigation water, containing salts leached from the soil, that is returned to the river in subsurface pipe drainage systems) makes up more than 20 percent of the total San Joaquin River flow (32). Maximum annual concentrations of sulfate and nitrate in the river, normally occurring during the irrigation season, have increased
nearly threefold and fivefold, respectively, since 1950 (Fig. 9). The increases reflect, in large part, expanding irrigation of soils contain-
ing natural sources of gypsum (CaSO4 ? 2H20) and the addition of fertilizers as well as gypsum and other forms of sulfate as soil amendments.
To dispose of the increasing volume of agricultural waste water
(including water used to flush salts from salinated soils), an artificial channel connecting the Central Valley with San Francisco Bay near Suisun Bay-the San Luis Drain (Fig. 1)-was authorized for construction by Congress in 1960 (33). As proposed, the drain would discharge natural and agriculture-related chemicals into the
bay, including an estimated 17 tons of nitrogen per day (34), a rate
equal to that from all point sources north of San Francisco (7). A portion of the San Luis Drain that serves about 3000 ha of
farmland (less than 10 percent of the area proposed to be served) was constructed. In 1978 drain water began to flow into a tempo- rary holding facility, the Kesterson Reservoir-a marshy lowland used also as a wildlife refuge (33). In 1982 dying vegetation and
declining wildlife abundances were noted in the reservoir. A year later, unusually high incidences of physical deformities, reproductive
SCIENCE, VOL. 231
14 -
10 -
6 -
2 -
I
570

failure, and mortality were observed in aquatic birds using the bay organisms, when compared with averages in organisms from reservoir: greater than 40 percent of nests contained at least one other estuaries, are not especially high, reflecting the many locations dead embryo and 20 percent contained at least one embiyo with in the bay unaffected by local discharges and the rapid dilution of obvious external abnormalities (35). Subsequent chemical analyses those wastes discharged by the major cities near the mouth of the of animal and plant tissues taken from reservoir populations showed estuary. On the other hand, localized patches of metal contamina- mean selenium concentrations ranging from 22 to 175 p.g/g (dry tion, with concentrations as high as those observed anywhere in the weight), or up to 130 times those found at a nearby control site world, occur near past and present waste disposal sites (8, 41). (35). Samples of waste water from the San Luis Drain and the Kesterson Reservoir also contained very high selenium levels (140 to 1400 ng/liter) (36).
Selenium, occurring naturally in alluvial soils of the arid western - r i i San Joaquin Valley, is leached by irrigation water and concentrated, 2000- with other salts, in the topsoil by evaporation. The selenium is I mobilized when the soils are drained to remove all accumulated salts1 and is carried into the reservoir. There, it causes the reproductive ;io 1000
failures and deformities in resident birds (33, 35) WE The discovery of bird mortalities and deformities in the Kesterson , , -
Reservoir has resulted in recent state and federal decisions to halt 1940 '
1950 1960 1970 1980 work on the Sal Luis Dra in projct andtoclose the reservoir im work on the Sani uis Drain project and to close the reseroir p Fig. 6. Mean monthly freshwater flow in the Sacramento River at Sacramen- 1986. In the meantime, agricultural waste water from west San to since 1938. Note theprogressive increase in the summer flow rate and the Joaquin Valley farmlands not served by the existing San Luis Drain major anomaly associated with the 1976-77 drought [from T. J. Conomos continues to flow into the San Joaquin River. High concentrations e a,d. fig ̂e 9A, in (30)] of selenium have recently been found in ducks in South Bay (37). Whether the seleniumn originates in the San Joaquin River or from local sources in the bay area remains to be determined.
Domestic and industrial waste. Significant changes in the composi-Sa Pa B Su Ba
tion of bay waters have occurred because of the urbanization and industrialization of the bay's shore. At present, industrial and domestic wastes, as well as urban runoff, enter the bay at more than i
- sacrame to 100 locations. The known point sources of waste include more than / i Rier
30 municipal and 40 industrial waste treatment facilities and an /> Freshwater Nulizone
additional 100 smaller industrial dischargers. Together, these facili- / E Brackish water
ties discharged 0.7 km3 of waste water in 1978, or nearly 4 percent of the average annual freshwater inflow to the bay. The annual waste hcific Ocel
input contains, among numerous constituents, 300 metric tons of Fig. 7. Nontidal estuarine circulation and the null zone in norther San trace metals (38). The ratio of wastewater to freshwater inflow is Francisco Bay. Suspended particles (stippled area) accumulate in the null expected to double by the year 2000 (8). Untreated urban runoff zone where the upstream flow of salt water at the bottom meets the also enters the bay through more than 50 small local streams because downstrcam flow of fresh water and net movement is minimal. This zone most runoff and sewage systems are separated. Additional contami- vs upad downtheestuary in responsetoriverdischarge. nation results from daily accidental spills of industrial chemicals and oil; small oil spills alone account for 200 to 300 spills annually (8).
Adverse ecological effects of waste discharge have been suspected 26 - since the early 1900's, when industrial wastes were implicated in the A
gradual failure of the oyster industry (2, 5). A detailed analysis of 3 I 3000-
pollution effects was not undertaken until 1951, when a study 220- -
showed that (i) few or no benthic invertebrates were present f 2000- .
inmlediately adjacent to several waste outfalls, (ii) the number of 3 180 - 7 / . 1000- * wastes (39).
0 14 K 79 /80
species nearby was depressed below area averages, and (iii) industri- a 779
al wastes suppressed the number of species more than did domestic I 7 80 so/. X r ' 76 wastes (39). > 140 -
Improvements in sewage treatment facilities beginning in the X - 30 1960's reduced some of the adverse effects ofwastes. Concentrations <10
7 200 -? of oxygen-consuming organic matter and ammonia in South Bay E 200- *
have been reduced to the point that the summer depletion of 81/82 - -
dissolved oxygen, typical two to three decades ago, no longer occurs 60 *
(8). Summer concentrations of enteric bacteria have declined in - 82/831 z __ South Bay from 800 per 100 ml of water in 1964 to 4 per 100 ml in I 20 _ i 1950 1960 1970 1980
1977 (38, 40). Collection of shellfish for hunan consumption, c o i 15002000
~~bann~~Fred for decades, has recently been pershitated drg sr inflow in December (m3/sec) banned for decades, has recently been pernufitted during suraner on selected mud flats well removed from outfalls or other sources of Fig. 8 (left). Maximm concentrations of silver found in the clam Macoma hazardous waste. balthica living in a metal-enriched mud flat in South San Francisco Bay as a
fun,ction ofifeshwater inflow in December [from S. N. Luoma et al., figure Despite greatly upgraded sewage treatment, bay sedimlents and ^ offrshwa ntmflv December from S. N. Luoma et
. figre . , 'i ( 30)]. Fig. 9 (right). Maximumn annual concentrations of dissolved
organisms are contaminated to various degrees with trace organic sulfate (A) and nitrate (B) in the San Joaquin River near its mouth (53). and inorganic materials. Average concentrations of trace metals in Lines are least-squares regressions.
7 FEBRUARY 1986 ARTICLES 571

Phosphate E 0-3 1 6-10 > 20 (pmole/liter)E 3 - 6 10 - 20
Fig. 10. Dissolved phosphate distributions in South San Francisco Bay at four times of year (54).
Distributions of toxic organic materials [polychlorinated biphenyls (PCB's) and petroleum hydrocarbons] are also patchy, with concen- trations in some organisms reaching levels comparable to those in
highly contaminated estuaries. For example, PCB concentrations observed in the blubber of bay harbor seals (Phoca vitulina richardii) in 1977 (42) equaled those concentrations thought to cause repro- ductive failure in Baltic Sea gray seals (43). Concentrations of
petroleum hydrocarbons in mussels collected in central San Francis- co Bay nearly equal those in Los Angeles and San Diego harbors, which are subjected to frequent petroleum contamination (8).
Although no studies have clearly linked trace contaminants to the
permanent elimination of any species population, elevated toler- ances to trace metals have been observed in the clam Macoma balthica and the copepodAcartia clausi from contaminated locations in the bay (44). These results imply an importance of adaptive flexibility to the survival of some populations. Studies near a South
Bay sewage outfall also indicate that physiological stress caused by trace metal contamination occurs even in highly adaptable bivalves when metal availability is highest (30). High incidences of skin lesions, tumors, and increased parasitism in the bay's striped bass
may be consequences of exposure to synthetic organic compounds; moreover, the concentrations of petroleum-derived hydrocarbons found in striped bass are as high as those that adversely affect the
hatching success of eggs in the laboratory (45). Physiological indicators of stress in mussels transplanted along a transect in South
Bay increased coincident with a gradient of increasing trace metal concentrations in water, sediment, and organisms (46).
Nutrient enrichment of the bay. Stimulation of plant growth through nutrient enrichment, with subsequent declines in oxygen content of the water as the plant material decomposes, is another
potentially important result of waste discharge. Sewage-derived nutrient inputs in northern San Francisco Bay are not easily distinguished from the large riverine inputs. Waste-derived nutri-
572
ents are more apparent in South Bay, where storm drains and waste treatment plants are the principal sources of freshwater inflow (7). During the winter-spring period of high river runoff, levels of nutrients [for example, phosphate (Fig. 10A); nitrate concentra- tions vary similarly] in South Bay are low because of dilution with low-salinity water in central San Francisco Bay (7). During the rest of the year, when runoff is low and dilution and mixing with central bay water diminish, nutrient levels increase (Fig. 10, B to D) to a summer-autumn maximum that is often the highest level found in San Francisco Bay.
Although nutrient concentrations are periodically high, the bay does not exhibit symptoms of eutrophication-nuisance phyto- plankton blooms and associated depletion of oxygen [although localized, episodic blooms of drift macroalgae occur in some years (30)]. Benthic filter feeders in South Bay are apparently sufficiently abundant to reduce the standing crop of phytoplankton well below
expected levels (47). Thus the benthos may act as a natural biological control on eutrophication-a process employed in aquaculture (48)-by converting sewage-derived nutrients to animal biomass. It follows, therefore, that events that selectively disturb the benthos (for example, exposure to contaminants) could promote the devel-
opment of noxious blooms.
In Perspective Few of the changes we have described are unique to San Francisco
Bay. Many estuaries, such as those of the Delaware, Hudson, Potomac, Rhine, Susquehanna (Chesapeake Bay), and, until recent-
ly, Thames rivers, have seasonal or permanent oxygen depletion resulting from high organic waste loading or nutrient enrichment as well as contamination by toxic wastes (49). Other estuaries in arid
regions around the world are also affected by river water impound- ment and diversion (4).
Measured in terms of concerns that attract public attention or interfere with commerce, the problems of San Francisco Bay appear less severe than those of other large urbanized estuaries. This
appearance results, in part, because (i) much of the urban and industrial development in the bay area has occurred near the estuary mouth, where dilution and dispersal of wastes are greatest, rather than on the tributary rivers; (ii) corrective actions taken since the 1960's have eliminated oxygen depletion and greatly reduced patho- genic bacteria; and (iii) many of the major changes (such as the
disappearance of wetlands, introduction of exotic species, and loss of
many commercial and sports fisheries) occurred decades ago and have been forgotten.
Despite the difficulties in measuring ongoing, human-induced
changes, it is clear that San Francisco Bay is sensitive to diverse human activities. Toxic wastes derived from agricultural and indus- trial activities have been locally detrimental to birds and bottom-
dwelling invertebrates. Suggested links between the striped bass decline and contamination with synthetic organic compounds or between physiological stress in bivalves and trace metals, although largely circumstantial, indicate that chronic regional effects of contamination exist in San Francisco Bay. There is also evidence that decreased freshwater inflow can contribute to altered balances
among plant and animal communities that may lead, for example, to decreases in some fish stocks. In addition, there is an apparent link between river flow and the capacity of the estuary to assimilate wastes.
The future well-being of this estuary (like that of other urbanized
estuaries) lies in achieving an increased understanding of its interact-
ing physical, chemical, and biological processes and how these
processes are affected by specific human activities. The effects of
SCIENCE, VOL. 231

increased toxic waste inputs and further reductions in freshwater inflow, and particularly the possible synergy between the two, are among the critical topics requiring increased research and manage- ment efforts. Meanwhile, economically important issues, such as changes in the treatment and disposal of industrial and agricultural wastes, deepening of channels to accommodate larger ships, and increasing river water diversion, are being considered without sufficient quantitative understanding of the effects of these actions on the estuary.
REFERENCES AND NOTES
i. G. H. Lauff, Ed., Estuaries (American Association for the Advancement of Science, Washington, DC, 1967).
2. N. C. Nelson, Univ. Calif. Publ. Am. Archaeol. Ethnol. 7, 309 (I909). 3. H. E. Bolton, Fray Juan Crespi: Missionary Explorer on the Pacific Coast 1769-1774
(Univ. of California Press, Berkeley, 1927). 4. R. Cross and D. Williams, Eds., Proceedings of the National Symposium on Freshwater
Inflow to Estuaries (FWS/OBS-8i/o4, U.S. Fish and Wildlife Service Office of Biological Services, Washington, DC, 1981).
5. J. E. Skinner. Calif Dep. Fish Game Water Proj. Branch Rep. i (1962). 6. P. W. Wild and R. N. Tasto, Eds., Calif. Dep. Fish Game Fish Bull. i72 (1983). 7. T. J. Conomos, Ed., San Francisco Bay: The Urbanized Estuary (American
Association for the Advancement of Science, San Francisco, 1979). 8. W. J. Kockelman, T. J. Conomos, A. E. Leviton, Eds., San Francisco Bay: Use and
Protection (American Association for the Advancement of Science, San Francisco, 1982).
9. W. I. Aron and S. H. Smith, Science 174, I3 (1971). io. E. M. Barrett, Calif Dep. Fish Game Fish Bull. I23 (1963). ii. C. L. Hill and C. A. Kofoid, Marine Borers and Their Relation to Marine
Construction on the Pacific Coast (San Francisco Bay Marine Piling Committee, San Francisco, 1927).
12. F. H. Nichols and J. K. Thompson, Mar. Ecol. Prog. Ser. 24, 83 (1985). 13. J. J. Orsi, T. E. Bowman, D. C. Marelli, A. Hutchinson, J. Plankton Res. 5, 357
(1983). 14. P. B. Moyle, R. A. Daniels, B. L. Herbold, D. M. Baltz, Fish. Bull., in press. I5. G. K. Gilbert, U.S. Geol. Surv. Prof. Pap. ios (I917). 16. W. L. Kahrl, Ed., The California WaterAtlas (Kaufnan, Los Altos, CA, 1978). I7. S. W. Nixon, in Estuarine and Wetland Processes, P. Hamilton and K. B.
MacDonald, Eds. (Plenum, New York, 1980), p. 437. 18. National Estuary Study (U.S. Fish and Wildlife Service, Washington, DC, 1970),
vol. 5. 19. Calif. Dep. of Water Resour. Bull. 76 (1978). 20. This flow was computed from estimates of the natural annual waterflow in all
streams in the Sacramento-San Joaquin river system before 1850, less estimated natural evapotranspiration losses (E. Hills, personal communication; S. William- son, personal communication). Flows for I980 and 2000 were taken from figures o5 and 51 in Calif. Dep. Water Resour. Bull. 160 (1983), with flow for an average year being computed as San Francisco Bay inflow = delta inflow - (delta export + delta consumption), and upstream and delta consumption = 1850 flow - (San Francisco Bay inflow + delta export).
21. Calif. Resour. Agency Bull. 2I0 (I980), table 3. 22. J. E. Skinner, Johns Hopkins Univ. Cooling Water Res. Proj. Rep. is (1974), p. 225. 23. R. Brown, personal communication. 24. D. E. Stevens, D. W. Kohlhorst, L. W. Miller, D. W. Kelley, Trans. Am. Fish. Soc.
114, 12 (1985).
25. D. H. Peterson, T. J. Conomos, W. W. Broenkow, P. C. Doherty, Estuarine Coastal Mar. Sci. 3, (1975).
26. J. E. Cloern, A. E. Alpine, B. E. Cole, R. L. J. Wong, J. F. Arthur, M. D. Ball, Estuarine Coastal ShelfSci. i6, 415 (1983).
27. W. R. Heubach, R. J. Toth, A. M. McCready, Calif. Fish Game 49, 224 (1963); A. L. B. Kost and A. W. Knight, ibid. 61, 35 (1975).
28. Interagency Ecological Study Program for the Sacramento-San Joaquin Estuary (California Department of Fish and Game, California Department of Water Resource, U.S. Fish and Wildlife Service, U.S. Bureau of Reclamation, Sacramen- to, 1978); A. C. Knutson, Jr., and J. J. Orsi, Trans. Am. Fish. Soc. II2, 476 (1983).
29. F. H. Nichols, Estuarine Coastal Shelf Sci. 21, 379 (1985). 30. J. E. Cloern and F. H. Nichols, Eds., Temporal Dynamics of an Estuary: San
Francisco Bay (Junk, Dordrecht, Netherlands, 1985). 31. D. S. McCulloch, D. H. Peterson, P. R. Carlson, T. J. Conomos, U. S. Geol. Surv.
Circ. 637A (1970). 32. R. E. Merrill, R. M. Van De Pol, W. E. Ryley,Am. Soc. Civil Eng. J. Irg. Drain.
o05, 137 (1979). 33. U.S. Bur. Reclam. San Luis Unit Cent. Val. Proj. Calif. Inf. Bull. I; 2; 4 (1984); E.
Marshall, Science 229, I44 (1985). 34. R. L. Brown, Water Res. 9, 529 (I975), tables I and 2. The calculations assume a
mean annual drain flow of about io m3/sec and a nitrogen concentration of 20 mg/liter.
35. H. M. Ohlendorf, D. J. Hoffman, M. K. Saiki, T. W. Aldrich, Sci. Total Environ., in press.
36. T. S. Presser and I. Bares, U. S. Geol. Surv. Water Resour. Invest. Rep. 84-4122 (1984).
37. H. M. Ohlendorf, R. W. Lowe, P. R. Kelly, T. E. Harvey, C. J. Stafford,J. Wildl. Manage., in press.
38. Toxics in the Bay: An Assessment of the Discharge of Toxic Pollutants to San Francisco Bay by Municipal and Industrial Point Sources (Citizens for a Better Environment, San Francisco, 1983).
39. F. P. Filice, WassmanJ. Biol. I7, i (1959). 40. E. A. Pearson, P. N. Storrs, R. E. Selleck, Univ. Calif. Sanitary Eng. Res. Lab. Rep.
67-5 (1970); R. C. Cooper, K. M. Johnson, D. C. Stranbe, D. Koyama, Univ. Calif. Sanitary Eng. Environ. Health Res. Lab. Rep. 81-I (1981).
41. E. A. Thomson, S. N. Luoma, C. E. Johansson, D. J. Cain, Water Res. 18, 755 (I984).
42. R. W. Risebrough, J. W. Chapman, R. K. Okazaki, T. T. Schmidt, Toxicants in San Francisco Bay and Estuary (Association of Bay Area Governments, Berkeley, CA, 1978).
43. E. Helle, M. Olsson, S. Jensen, Ambio 5, 188 (1976). 44. S. N. Luoma,J. Fish. Res. Board Can. 34,436 (1977); , D. J. Cain, K. Ho, A.
Hutchinson, Mar. Environ. Res. o0, 209 (1983). 45. M. Jung, J. A. Whipple, M. Moser, Summary Report of the Cooperative Striped Bass
Study (Institute of Aquatic Resources, Santa Cruz, CA, 1984); P. E. Benville, Jr., J. A. Whipple, M. E. Eldridge, Calif. Fish Game 71, 132 (1985).
46. M. Martin, G. Ichikawa, J. Goetzl, M. de los Reyes, M. D. Stephenson, Mar. Environ. Res. ii, 9I (I984).
47. J. E. Cloern, Mar. Ecol. Prog. Ser. 9, 191 (1982). 48. R. Mann and J. H. Ryther, Aquaculture iI, 231 (I977). 49. C. B. Officer et al., Science 223, 22 (1984). 50. U.S. Bureau of Census, Census of Agriculture. 5I. G. Porterfield, U.S. Geol. Surv. WaterResour. Invest. Rep. 80-4 (1980), p. 18; table
Io in (I9), excluding Auburn Reservoir. 52. Unpublished report. 53. U.S. Geological Survey Water Resources data for California. 54. D. D. Harmon, personal communication. 55. We thank many colleagues for helpful discussions and access to unpublished
manuscripts, J. W. Hedgpeth for sharing much knowledge about San Francisco Bay, and J. D. Bredehoeft, H. E. Clifton, and D. S. McCulloch for comments on the manuscript.
7 FEBRUARY 1986 ARTICLES 573