Embed Size (px)
Citation preview
Accepted Manuscript
Title: Impact of climate variability on ichthyoplankton communities: an example of asmall temperate estuary
Authors: Ana Lígia Primo, Ulisses Miranda Azeiteiro, Sónia Cotrim Marques, MiguelÂngelo Pardal
PII: S0272-7714(10)00399-9
DOI: 10.1016/j.ecss.2010.11.009
Reference: YECSS 3419
To appear in: Estuarine, Coastal and Shelf Science
Received Date: 10 February 2010
Revised Date: 28 September 2010
Accepted Date: 30 November 2010
Please cite this article as: Primo, A.L., Azeiteiro, U.M., Marques, C., Pardal, Miguel Ângelo. Impact ofclimate variability on ichthyoplankton communities: an example of a small temperate estuary, Estuarine,Coastal and Shelf Science (2010), doi: 10.1016/j.ecss.2010.11.009
This is a PDF file of an unedited manuscript that has been accepted for publication. As a service toour customers we are providing this early version of the manuscript. The manuscript will undergocopyediting, typesetting, and review of the resulting proof before it is published in its final form. Pleasenote that during the production process errors may be discovered which could affect the content, and alllegal disclaimers that apply to the journal pertain.
MANUSCRIP
T
ACCEPTED
ACCEPTED MANUSCRIPT
1 2 3 4 5 6 7 8 9 10 11 12 13 14 15 16 17 18 19 20 21 22 23 24 25 26 27 28 29 30 31 32 33 34 35 36 37 38 39 40 41 42 43 44 45 46 47 48 49 50 51 52 53 54 55 56 57 58 59 60 61 62 63 64 65
1
Impact of climate variability on ichthyoplankton communities: an 1
example of a small temperate estuary 2
3
Ana Lígia Primoa, *
, Ulisses Miranda Azeiteiroa,b
, Sónia Cotrim Marquesa and Miguel Ângelo 4
Pardala
5
6
a CEF – Centre for Functional Ecology, Department of Life Sciences, University of Coimbra, 7
Apartado 3046, 3001-401 Coimbra, Portugal. 8
b Department of Science and Technology, Universidade Aberta, 4200-055 Porto, Portugal 9
10
Ulisses Miranda Azeiteiro - [email protected] 11
Sónia Cotrim Marques - [email protected] 12
Miguel Ângelo Pardal - [email protected] 13
14
*Corresponding author 15
Ana Lígia Primo 16
e-mail address: [email protected] 17
18
CEF – Centre for Functional Ecology, Department of Life Sciences, University of Coimbra, 19
Apartado 3046, 3001-401 Coimbra, Portugal 20
Tel.: + 351 239 855780 21
Fax: + 351 239 823603 22
23
24
MANUSCRIP
T
ACCEPTED
ACCEPTED MANUSCRIPT
1 2 3 4 5 6 7 8 9 10 11 12 13 14 15 16 17 18 19 20 21 22 23 24 25 26 27 28 29 30 31 32 33 34 35 36 37 38 39 40 41 42 43 44 45 46 47 48 49 50 51 52 53 54 55 56 57 58 59 60 61 62 63 64 65
2
ABSTRACT 25
Recent variations in the precipitation regime across southern Europe have led to changes in river 26
fluxes and salinity gradients affecting biological communities in most rivers and estuaries. A 27
sampling programme was developed in the Mondego estuary, Portugal, from January 2003 to 28
December 2008 at five distinct sampling stations to evaluate spatial, seasonal and interannual 29
distributions of fish larvae. Gobiidae was the most abundant family representing 80% of total catch 30
and Pomatoschistus spp. was the most important taxon. The fish larval community presented a clear 31
seasonality with higher abundances and diversities during spring and summer seasons. Multivariate 32
analysis reinforced differences among seasons but not between years or sampling stations. The taxa 33
Atherina presbyter, Solea solea, Syngnathus abaster, Crystallogobius linearis and Platichthys flesus 34
were more abundant during spring/summer period while Ammodytes tobianus, Callionymus sp., 35
Echiichthys vipera and Liza ramada were more abundant in autumn/winter. Temperature, 36
chlorophyll a and river flow were the main variation drivers observed although extreme drought 37
events (year 2005) seemed not to affect ichthyoplankton community structure. Main changes were 38
related to a spatial displacement of salinity gradient along the estuarine system which produced 39
changes in marine species distribution. 40
41
Key words: Ichthyoplankton; seasonality; environmental factors; drought; Mondego estuary 42
43
MANUSCRIP
T
ACCEPTED
ACCEPTED MANUSCRIPT
1 2 3 4 5 6 7 8 9 10 11 12 13 14 15 16 17 18 19 20 21 22 23 24 25 26 27 28 29 30 31 32 33 34 35 36 37 38 39 40 41 42 43 44 45 46 47 48 49 50 51 52 53 54 55 56 57 58 59 60 61 62 63 64 65
3
1. Introduction 44
45
Nearshore estuarine and marine ecosystems serve many important functions in coastal waters. Often 46
referred to as nurseries, estuaries play an important role in many species lifecycles, including fish 47
(Beck et al., 2001; Elliott and McLusky, 2002; Martinho et al., 2007a) providing food abundance 48
and shelter to marine fish larvae and juveniles and therefore maximizing their survival (Whitfield, 49
1999; Elliott and McLusky, 2002). Larval fish dynamics contribute significantly to understanding 50
the ecology of fish populations (Doyle et al., 2002) as they can indicate the spawning-stock biomass 51
and recruitment in adult fish stocks (Hsieh et al., 2005). Initial development stages of fishes are 52
particularly vulnerable and are influenced by physical and biological processes. Indeed, several 53
factors have already been related to survival and distribution of ichthyoplankton (e.g. hydrological 54
conditions, transport processes, seasonal variability, spawning patterns of adults, food availability) 55
(Franco-Gordo et al., 2002; Alemany et al., 2006; Sabatés et al., 2007; Isari et al., 2008). The 56
effects of climate on fish populations can also be shown by long term trends in ichthyoplankton 57
populations. Lower trophic level organisms should be more sensitive in reflecting environmental 58
perturbations more quickly than higher trophic levels but early life stages may be environmentally 59
sensitive prior to buffering through density-dependent mechanisms and community effects (Boeing 60
and Duffy-Anderson, 2008). Thus a knowledge of the ichthyoplankton community dynamics are 61
important in understanding changes in fish communities. 62
Recent studies indicate that the Mondego estuary (40º 08’ N, 8º 50’ W), Portugal, is an important 63
nursery ground for several commercial fish species (e.g. Dicentrarchus labrax, Platichthys flesus 64
and Solea solea) (Leitão et al., 2007; Martinho et al., 2007a). Studies on ichthyoplankton started 65
with Ribeiro (1991) but recently only Marques et al. (2006) referred to these communities. Previous 66
works focused on community assemblages but information of the way environmental factors force 67
community structure is still limited. In addition, Portugal recently has been under varying 68
precipitation regimes with values of 45–60% below average in the hydrological year 2004/2005 69
producing the biggest drought in a century (Portuguese Weather Institute: 70
http://www.meteo.pt/en/index.html) and thus providing a unique opportunity to investigate 71
ichthyoplankton responses to extreme events. Hence this study aimed to characterize 72
ichthyoplankton assemblages, to evaluate environmental influence in its structure and establish the 73
consequences of extreme events, such as droughts, on estuarine fish larvae communities. The 74
hypothesis tested was that reduced river flow resulted from the decrease of precipitation mean 75
levels lead to changes on community structure and longitudinal displacement of species according 76
to salinity gradients. 77
2. Material and Methods 78
MANUSCRIP
T
ACCEPTED
ACCEPTED MANUSCRIPT
1 2 3 4 5 6 7 8 9 10 11 12 13 14 15 16 17 18 19 20 21 22 23 24 25 26 27 28 29 30 31 32 33 34 35 36 37 38 39 40 41 42 43 44 45 46 47 48 49 50 51 52 53 54 55 56 57 58 59 60 61 62 63 64 65
4
79
2.1. Study area 80
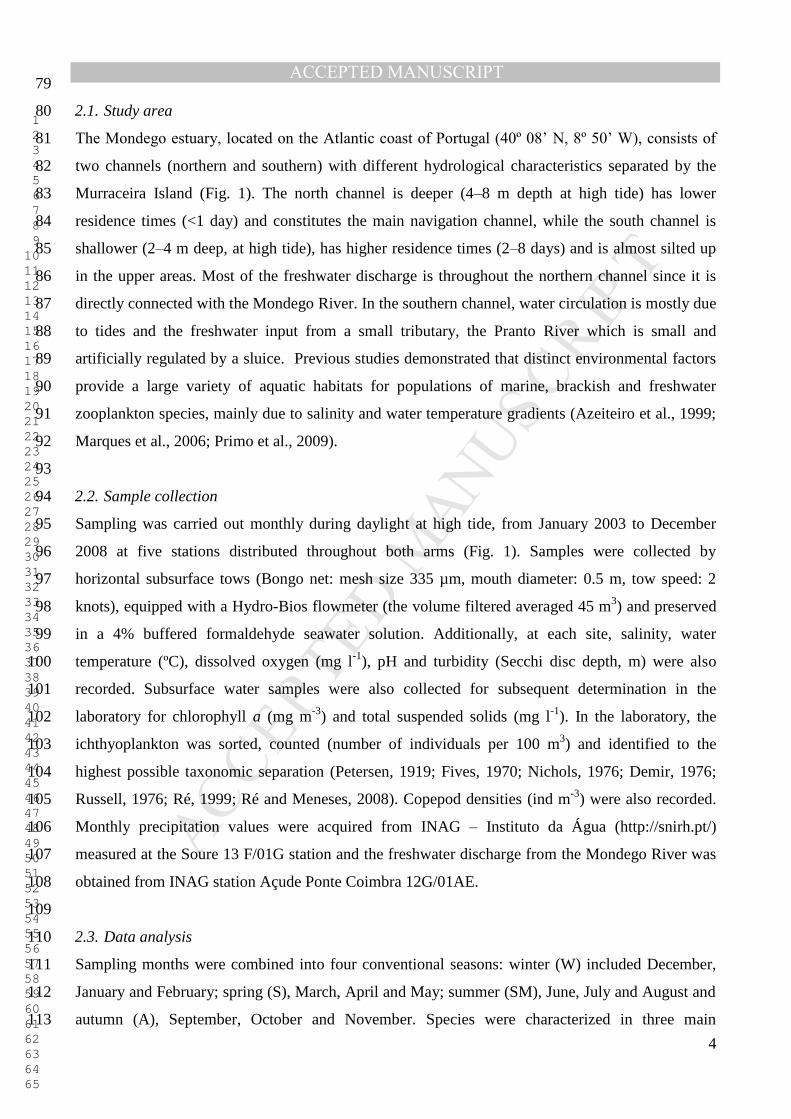
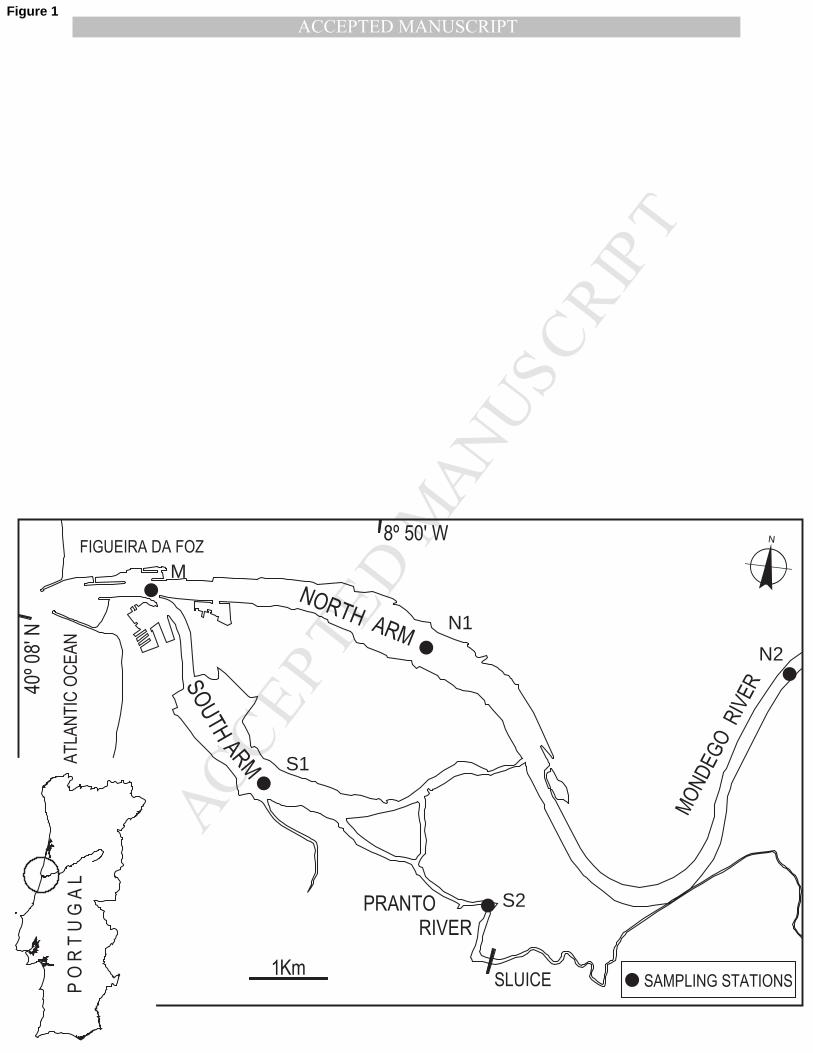
The Mondego estuary, located on the Atlantic coast of Portugal (40º 08’ N, 8º 50’ W), consists of 81
two channels (northern and southern) with different hydrological characteristics separated by the 82
Murraceira Island (Fig. 1). The north channel is deeper (4–8 m depth at high tide) has lower 83
residence times (<1 day) and constitutes the main navigation channel, while the south channel is 84
shallower (2–4 m deep, at high tide), has higher residence times (2–8 days) and is almost silted up 85
in the upper areas. Most of the freshwater discharge is throughout the northern channel since it is 86
directly connected with the Mondego River. In the southern channel, water circulation is mostly due 87
to tides and the freshwater input from a small tributary, the Pranto River which is small and 88
artificially regulated by a sluice. Previous studies demonstrated that distinct environmental factors 89
provide a large variety of aquatic habitats for populations of marine, brackish and freshwater 90
zooplankton species, mainly due to salinity and water temperature gradients (Azeiteiro et al., 1999; 91
Marques et al., 2006; Primo et al., 2009). 92
93
2.2. Sample collection 94
Sampling was carried out monthly during daylight at high tide, from January 2003 to December 95
2008 at five stations distributed throughout both arms (Fig. 1). Samples were collected by 96
horizontal subsurface tows (Bongo net: mesh size 335 µm, mouth diameter: 0.5 m, tow speed: 2 97
knots), equipped with a Hydro-Bios flowmeter (the volume filtered averaged 45 m3) and preserved 98
in a 4% buffered formaldehyde seawater solution. Additionally, at each site, salinity, water 99
temperature (ºC), dissolved oxygen (mg l-1
), pH and turbidity (Secchi disc depth, m) were also 100
recorded. Subsurface water samples were also collected for subsequent determination in the 101
laboratory for chlorophyll a (mg m-3
) and total suspended solids (mg l-1
). In the laboratory, the 102
ichthyoplankton was sorted, counted (number of individuals per 100 m3) and identified to the 103
highest possible taxonomic separation (Petersen, 1919; Fives, 1970; Nichols, 1976; Demir, 1976; 104
Russell, 1976; Ré, 1999; Ré and Meneses, 2008). Copepod densities (ind m-3
) were also recorded. 105
Monthly precipitation values were acquired from INAG – Instituto da Água (http://snirh.pt/) 106
measured at the Soure 13 F/01G station and the freshwater discharge from the Mondego River was 107
obtained from INAG station Açude Ponte Coimbra 12G/01AE. 108
109
2.3. Data analysis 110
Sampling months were combined into four conventional seasons: winter (W) included December, 111
January and February; spring (S), March, April and May; summer (SM), June, July and August and 112
autumn (A), September, October and November. Species were characterized in three main 113
MANUSCRIP
T
ACCEPTED
ACCEPTED MANUSCRIPT
1 2 3 4 5 6 7 8 9 10 11 12 13 14 15 16 17 18 19 20 21 22 23 24 25 26 27 28 29 30 31 32 33 34 35 36 37 38 39 40 41 42 43 44 45 46 47 48 49 50 51 52 53 54 55 56 57 58 59 60 61 62 63 64 65
5
ecological guilds (adapted from Elliott et al., 2007): marine stragglers (MS - Species that spawn at 114
sea and typically enter estuaries in low numbers occurring frequently in the lower reaches), marine 115
migrants (MM - Species that spawn at sea and often enter estuaries in large numbers) and estuarine 116
species (ES – including estuarine species capable of completing their entire life cycle within the 117
estuarine environment and those with stages of their life cycle completed outside the estuary). 118
Salinity anomalies were calculated by subtracting the mean seasonal value from the mean value of 119
the given time period. The differences between seasons and years in each sampling station were 120
tested by Analysis of Variance (ANOVA) for environmental factors. Log (x+1) transformation was 121
performed and for pairwise multiple comparisons the Holm-Sidak method was applied. Temporal 122
and spatial ichthyoplankton distribution maps were obtained by Sigmaplot software as well as 123
diversity, expressed by Shannon-Wiener Index (log2). 124
PERMANOVA+ for PRIMER software (PRIMER v6 & PERMANOVA+ v1, PRIMER-E Ltd.) was 125
used to perform a non-parametric permutational multivariate analysis of variance (PERMANOVA) 126
to test for differences in the assemblage structure between years, seasons and sampling stations. The 127
analysis was based on Bray-Curtis similarities between samples, after a fourth root transformation 128
of abundance data, considering all the factors (year, season, station) as fixed and unrestricted 129
permutations of raw data. When necessary, a posteriori multiple comparisons were used to test for 130
differences between/within groups for pairs of levels of factors. 131
The effects of environmental variables on the larval fish assemblage were analyzed with canonical 132
correspondence analysis (CCA) using software CANOCO (version 4.5, Microcomputer Power). 133
Environmental variables included salinity (Sal), water temperature (T) dissolved oxygen (O2), pH, 134
turbidity (Secchi), chlorophyll a (Chl a), total suspended solids (TSS), copepod densities (Cop), 135
freshwater discharge (Runoff) and precipitation (PP). Seasons were also included as nominal 136
variables. All species were used and a new category coded as “no fish” was created to prevent 137
CANOCO from eliminating samples containing no fish. “No fish” was assigned the minimum 138
possible weight (density=0.001) to prevent an otherwise uniform concentration in samples from 139
driving the ordination (Grothues and Cowen, 1999). Larval abundances were ln(2x+1) transformed 140
and environmental variables were standardized by subtracting the mean and dividing by the 141
standard deviation. A forward stepwise selection procedure of explanatory variables was applied 142
and a CCA triplot scaling with focus interspecies distances was performed. 143
144
145
MANUSCRIP
T
ACCEPTED
ACCEPTED MANUSCRIPT
1 2 3 4 5 6 7 8 9 10 11 12 13 14 15 16 17 18 19 20 21 22 23 24 25 26 27 28 29 30 31 32 33 34 35 36 37 38 39 40 41 42 43 44 45 46 47 48 49 50 51 52 53 54 55 56 57 58 59 60 61 62 63 64 65
6
3. Results 146
147
3.1. Environmental conditions 148
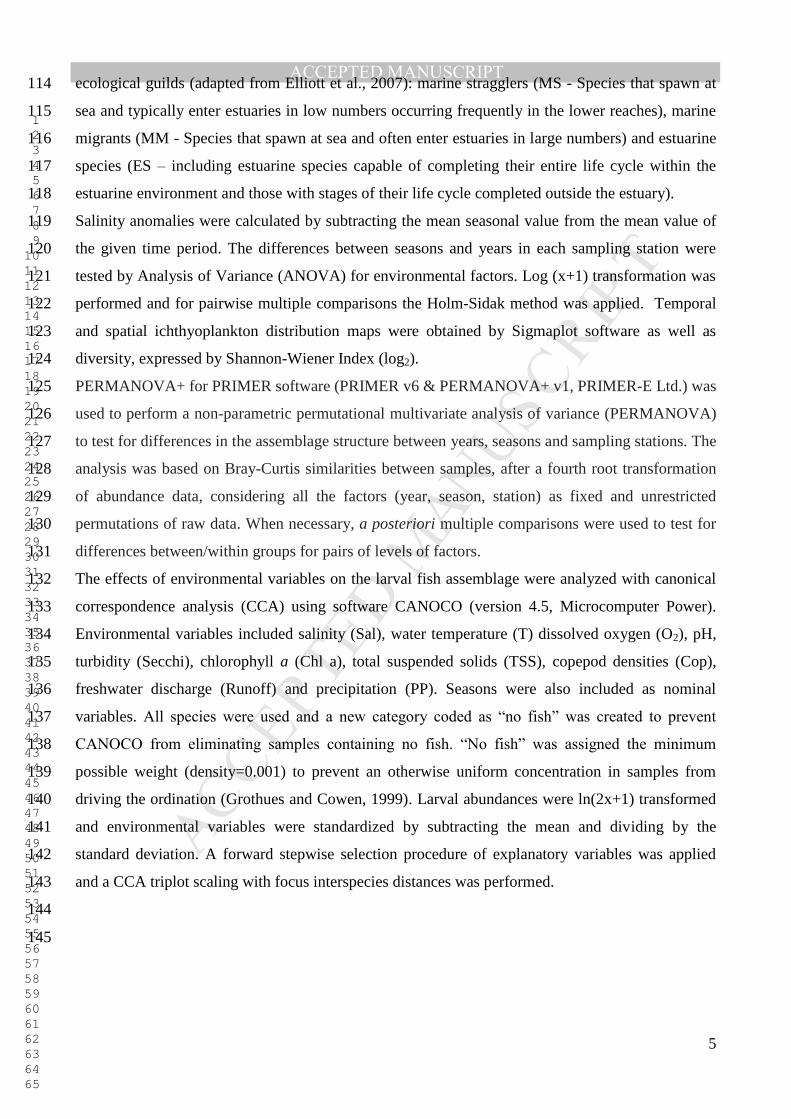
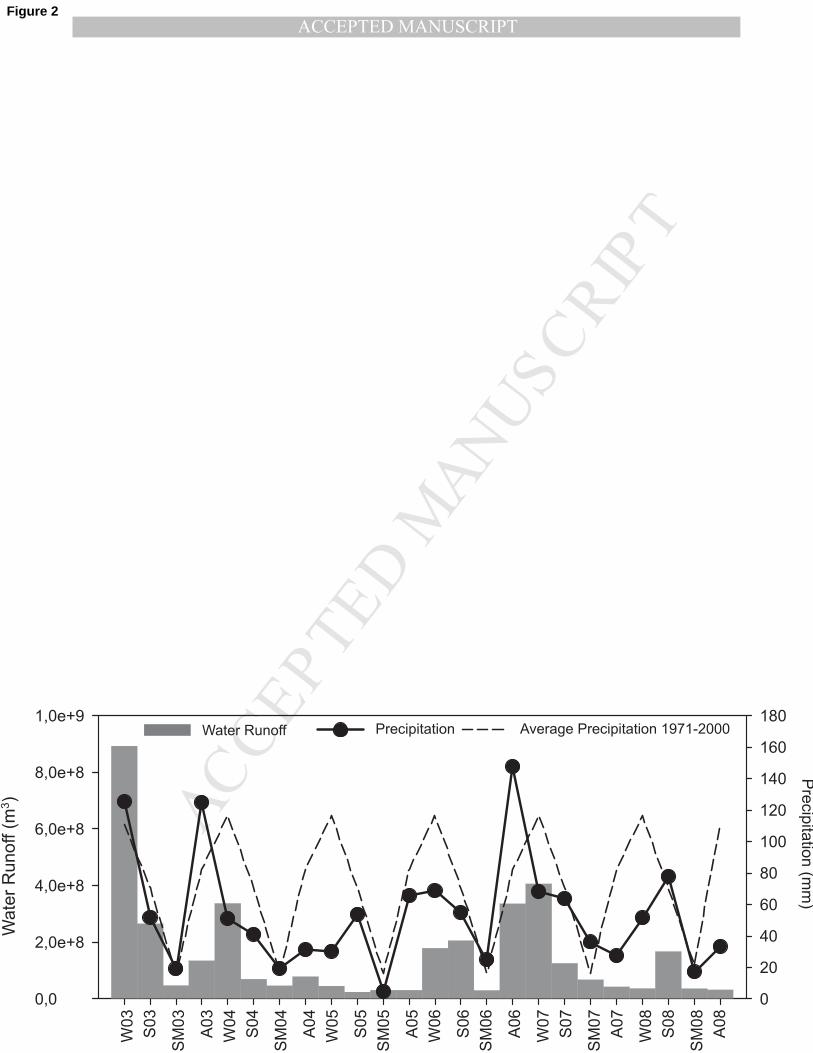
The Mondego estuary has a typical seasonal pattern of precipitation and freshwater discharge 149
throughout the six-year period with higher values during winter and lower during summer. 150
However, 2004, 2005 and 2008 showed below-average precipitation and a low freshwater 151
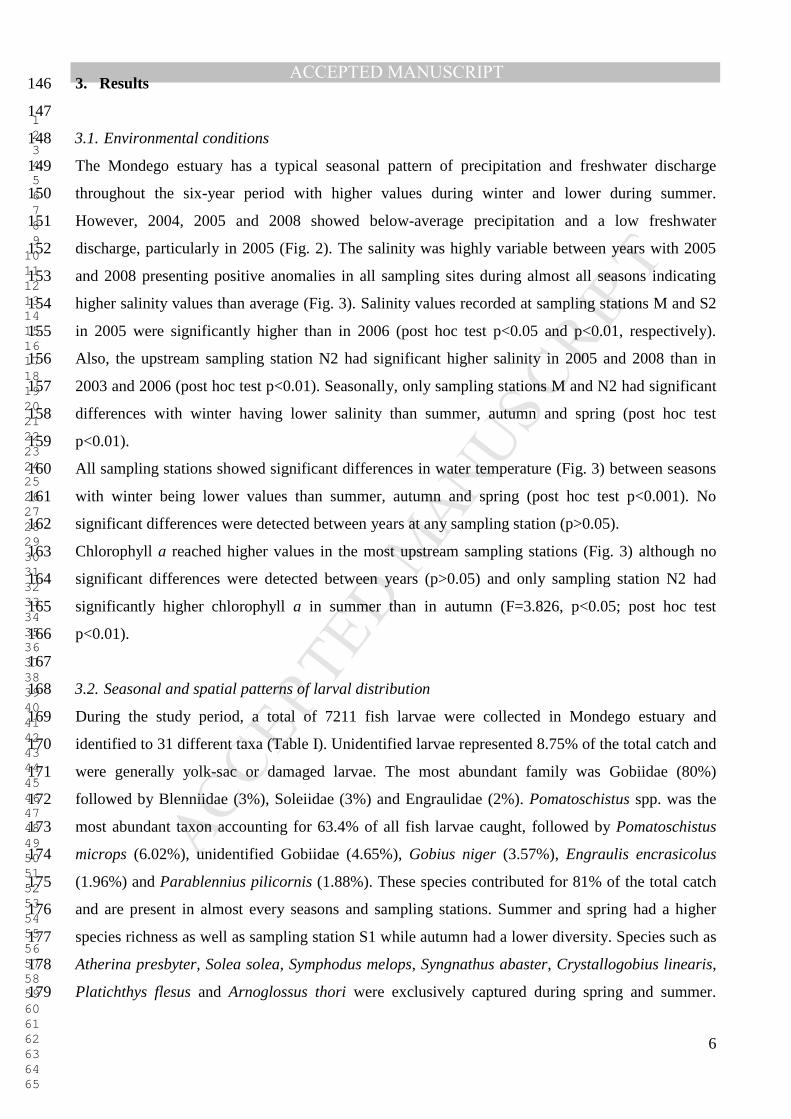
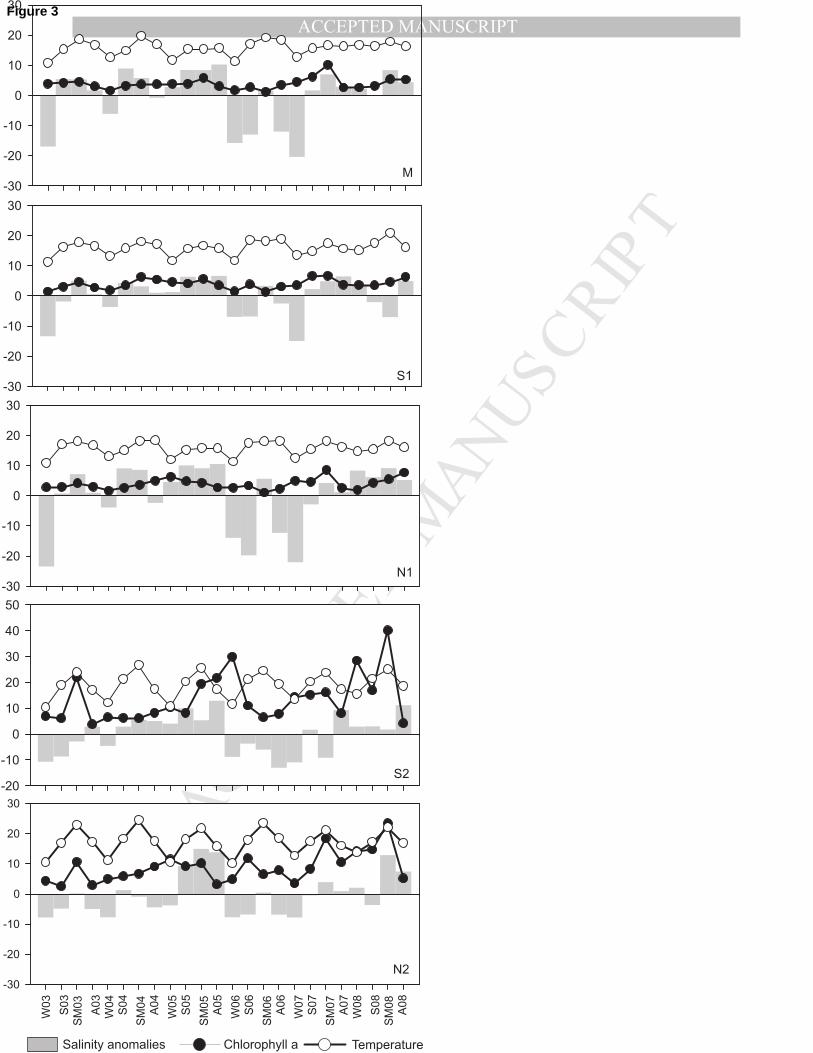
discharge, particularly in 2005 (Fig. 2). The salinity was highly variable between years with 2005 152
and 2008 presenting positive anomalies in all sampling sites during almost all seasons indicating 153
higher salinity values than average (Fig. 3). Salinity values recorded at sampling stations M and S2 154
in 2005 were significantly higher than in 2006 (post hoc test p<0.05 and p<0.01, respectively). 155
Also, the upstream sampling station N2 had significant higher salinity in 2005 and 2008 than in 156
2003 and 2006 (post hoc test p<0.01). Seasonally, only sampling stations M and N2 had significant 157
differences with winter having lower salinity than summer, autumn and spring (post hoc test 158
p<0.01). 159
All sampling stations showed significant differences in water temperature (Fig. 3) between seasons 160
with winter being lower values than summer, autumn and spring (post hoc test p<0.001). No 161
significant differences were detected between years at any sampling station (p>0.05). 162
Chlorophyll a reached higher values in the most upstream sampling stations (Fig. 3) although no 163
significant differences were detected between years (p>0.05) and only sampling station N2 had 164
significantly higher chlorophyll a in summer than in autumn (F=3.826, p<0.05; post hoc test 165
p<0.01). 166
167
3.2. Seasonal and spatial patterns of larval distribution 168
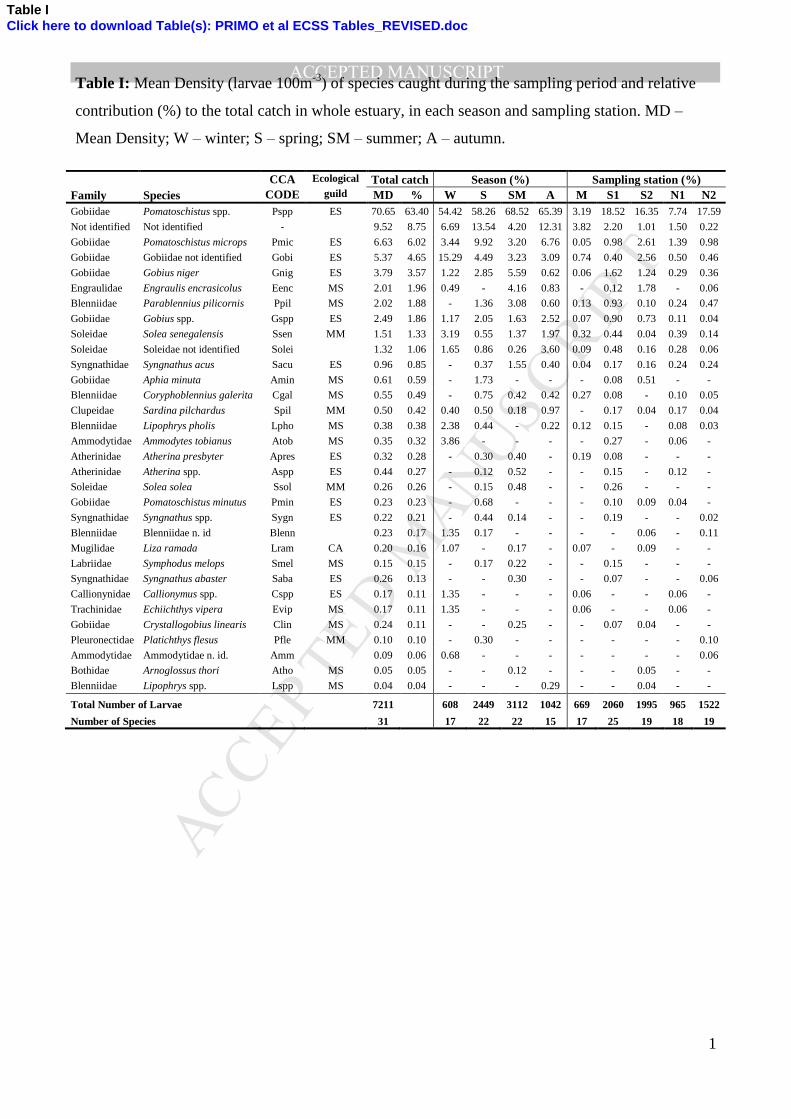
During the study period, a total of 7211 fish larvae were collected in Mondego estuary and 169
identified to 31 different taxa (Table I). Unidentified larvae represented 8.75% of the total catch and 170
were generally yolk-sac or damaged larvae. The most abundant family was Gobiidae (80%) 171
followed by Blenniidae (3%), Soleiidae (3%) and Engraulidae (2%). Pomatoschistus spp. was the 172
most abundant taxon accounting for 63.4% of all fish larvae caught, followed by Pomatoschistus 173
microps (6.02%), unidentified Gobiidae (4.65%), Gobius niger (3.57%), Engraulis encrasicolus 174
(1.96%) and Parablennius pilicornis (1.88%). These species contributed for 81% of the total catch 175
and are present in almost every seasons and sampling stations. Summer and spring had a higher 176
species richness as well as sampling station S1 while autumn had a lower diversity. Species such as 177
Atherina presbyter, Solea solea, Symphodus melops, Syngnathus abaster, Crystallogobius linearis, 178
Platichthys flesus and Arnoglossus thori were exclusively captured during spring and summer. 179
MANUSCRIP
T
ACCEPTED
ACCEPTED MANUSCRIPT
1 2 3 4 5 6 7 8 9 10 11 12 13 14 15 16 17 18 19 20 21 22 23 24 25 26 27 28 29 30 31 32 33 34 35 36 37 38 39 40 41 42 43 44 45 46 47 48 49 50 51 52 53 54 55 56 57 58 59 60 61 62 63 64 65
7
Conversely, Solea senegalensis, Ammodytes tobianus, Callionymus spp., Echiichthys vipera and 180
unidentified Ammodytidae were more abundant in winter. 181
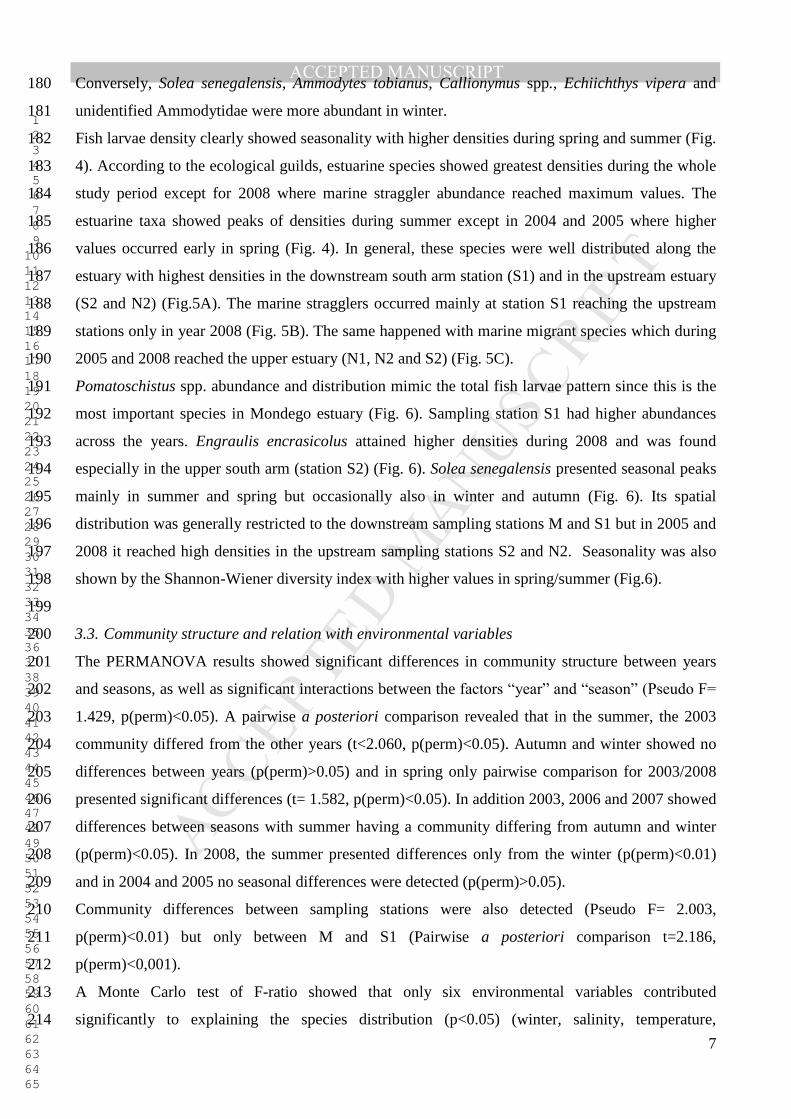
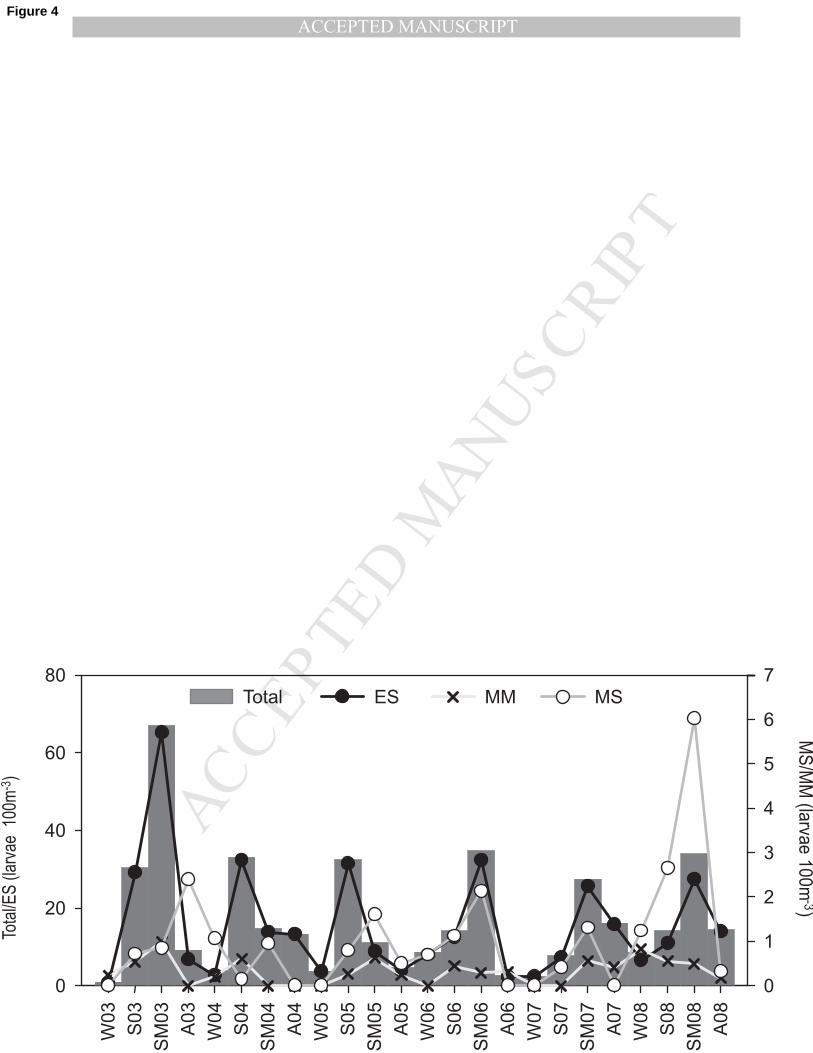
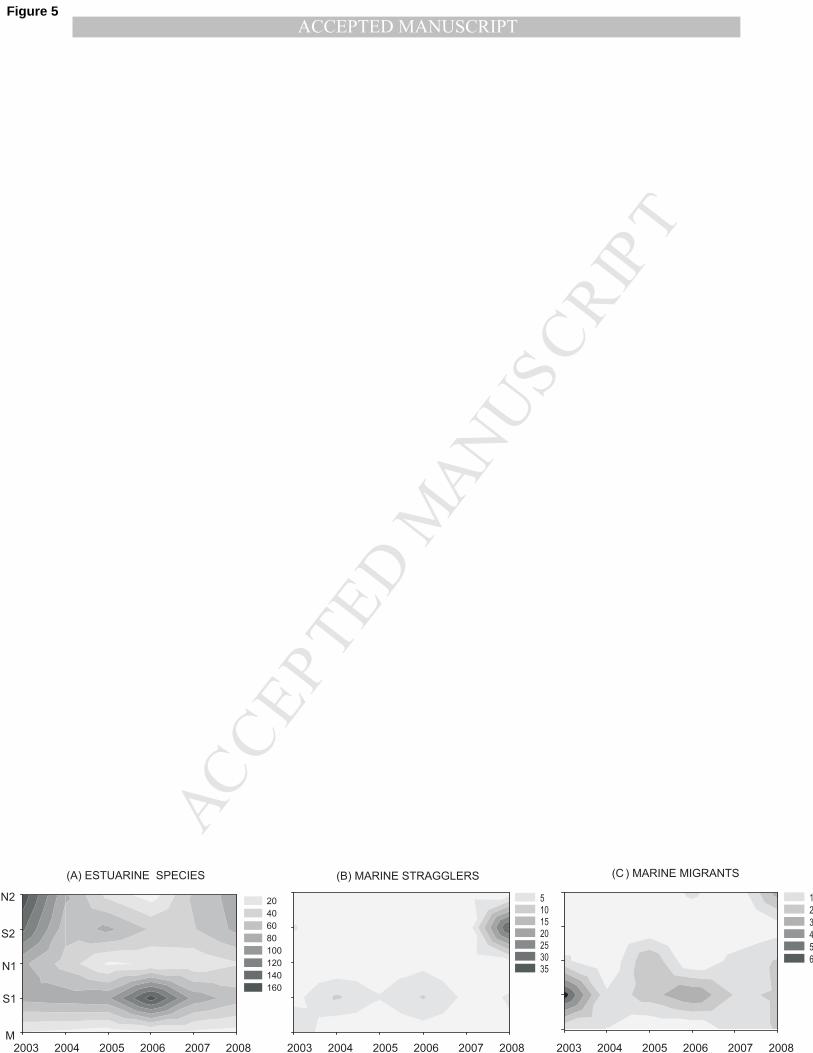
Fish larvae density clearly showed seasonality with higher densities during spring and summer (Fig. 182
4). According to the ecological guilds, estuarine species showed greatest densities during the whole 183
study period except for 2008 where marine straggler abundance reached maximum values. The 184
estuarine taxa showed peaks of densities during summer except in 2004 and 2005 where higher 185
values occurred early in spring (Fig. 4). In general, these species were well distributed along the 186
estuary with highest densities in the downstream south arm station (S1) and in the upstream estuary 187
(S2 and N2) (Fig.5A). The marine stragglers occurred mainly at station S1 reaching the upstream 188
stations only in year 2008 (Fig. 5B). The same happened with marine migrant species which during 189
2005 and 2008 reached the upper estuary (N1, N2 and S2) (Fig. 5C). 190
Pomatoschistus spp. abundance and distribution mimic the total fish larvae pattern since this is the 191
most important species in Mondego estuary (Fig. 6). Sampling station S1 had higher abundances 192
across the years. Engraulis encrasicolus attained higher densities during 2008 and was found 193
especially in the upper south arm (station S2) (Fig. 6). Solea senegalensis presented seasonal peaks 194
mainly in summer and spring but occasionally also in winter and autumn (Fig. 6). Its spatial 195
distribution was generally restricted to the downstream sampling stations M and S1 but in 2005 and 196
2008 it reached high densities in the upstream sampling stations S2 and N2. Seasonality was also 197
shown by the Shannon-Wiener diversity index with higher values in spring/summer (Fig.6). 198
199
3.3. Community structure and relation with environmental variables 200
The PERMANOVA results showed significant differences in community structure between years 201
and seasons, as well as significant interactions between the factors “year” and “season” (Pseudo F= 202
1.429, p(perm)<0.05). A pairwise a posteriori comparison revealed that in the summer, the 2003 203
community differed from the other years (t<2.060, p(perm)<0.05). Autumn and winter showed no 204
differences between years (p(perm)>0.05) and in spring only pairwise comparison for 2003/2008 205
presented significant differences (t= 1.582, p(perm)<0.05). In addition 2003, 2006 and 2007 showed 206
differences between seasons with summer having a community differing from autumn and winter 207
(p(perm)<0.05). In 2008, the summer presented differences only from the winter (p(perm)<0.01) 208
and in 2004 and 2005 no seasonal differences were detected (p(perm)>0.05). 209
Community differences between sampling stations were also detected (Pseudo F= 2.003, 210
p(perm)<0.01) but only between M and S1 (Pairwise a posteriori comparison t=2.186, 211
p(perm)<0,001). 212
A Monte Carlo test of F-ratio showed that only six environmental variables contributed 213
significantly to explaining the species distribution (p<0.05) (winter, salinity, temperature, 214
MANUSCRIP
T
ACCEPTED
ACCEPTED MANUSCRIPT
1 2 3 4 5 6 7 8 9 10 11 12 13 14 15 16 17 18 19 20 21 22 23 24 25 26 27 28 29 30 31 32 33 34 35 36 37 38 39 40 41 42 43 44 45 46 47 48 49 50 51 52 53 54 55 56 57 58 59 60 61 62 63 64 65
8
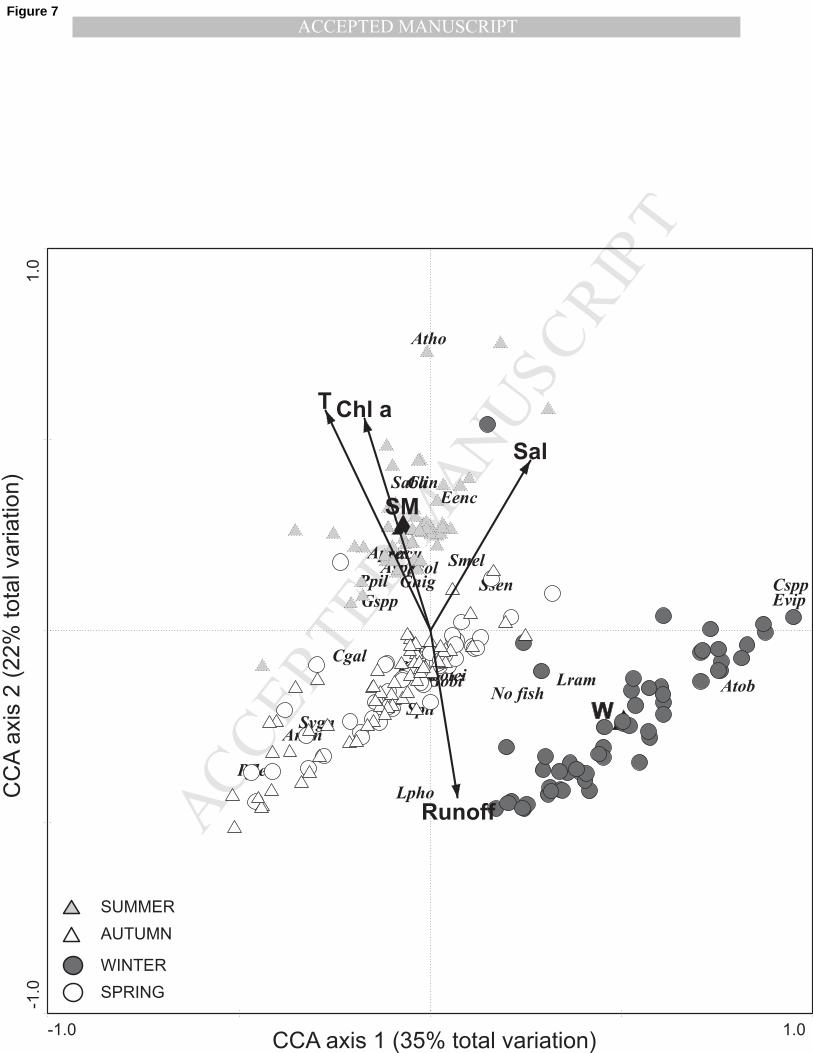
chlorophyll a, summer and runoff). Taken together, the environmental variables considered in the 215
final CCA explained 8% of the total variation in fish larvae assemblages. The first two CCA axes 216
accounted for 57% of the variability explained. The first axis is correlated with winter while the 217
second axis is positively correlated with summer, temperature, chlorophyll a and salinity and 218
negatively with runoff. The right hand side of ordination diagram of the first two axes grouped 219
winter samples characterized by low temperatures and high river flow (Fig. 7). Species such as 220
Echiichthys vipera, Callionymus spp. and Liza ramada were more prevalent in winter whereas 221
summer samples clustered in the upper left side and are more related to Atherina presbyter, 222
Crystallogobius linearis, Syngnathus abaster, Syngnathus acus or Solea solea (Fig. 7). 223
224
4. Discussion 225
226
The larval fish assemblages of the Mondego estuary supported 31 taxa dominated by 227
Pomatoschistus spp. Dominance by few species and presence of a high number of rare species is a 228
common feature observed in estuaries around the world either in larval or juvenile fish populations 229
(e.g. Barletta-Bergan et al., 2002; Strydom et al., 2003; Selleslagh et al., 2009). Pomatoschistus spp. 230
larvae dominance has been encountered in other Portuguese estuaries (e.g. Faria et al., 2006; Ramos 231
et al., 2006) and the success of gobies in estuarine environment may be related to their benthic 232
reproductive strategy ensuring that eggs are not flushed out from the estuary and are less exposed to 233
salinity and temperature fluctuations, which are more pronounced in surface waters (Ribeiro et al., 234
1996). Mazzoldi and Rasotto (2001) also suggested that in highly productive habitats with warm 235
summers, the long breeding season of short-lived species (such as P. microps) can give rise to more 236
than one spawning peak in the breeding period, which may be the case of P. microps in the 237
Mondego estuary as already been noticed by Dolbeth et al. (2007). In the Mondego estuary, 238
Pomatoschistus microps and P. minutus are amongst the most abundant species in estuarine fish 239
assemblages (Leitão et al., 2007; Martinho et al., 2007a) but, unfortunately, during early life stages 240
these species cannot be easily differentiated. 241
Ribeiro and Gonçalves (1993) found that Engraulis encrasicolus captures in the Mondego estuary 242
accounted for 44% of total fish larvae while in the present study the species only represents 2% of 243
the total capture. This reduction was also recently recorded in the Guadiana estuary (Faria et al., 244
2006) and in the Lima estuary where this species was present occasionally and in low numbers 245
(<1%) (Ramos et al., 2006). The abundance and distribution of anchovy is closely related with 246
environmental factors as temperature, turbidity, salinity or prey availability (Ribeiro et al., 1996, 247
Chícharo et al., 2001; Drake et al., 2007) and salinity gradient changes due to dry periods may have 248
stimulated anchovy to spawn in inner parts since E. encrasicolus can modify its spatial position in 249
MANUSCRIP
T
ACCEPTED
ACCEPTED MANUSCRIPT
1 2 3 4 5 6 7 8 9 10 11 12 13 14 15 16 17 18 19 20 21 22 23 24 25 26 27 28 29 30 31 32 33 34 35 36 37 38 39 40 41 42 43 44 45 46 47 48 49 50 51 52 53 54 55 56 57 58 59 60 61 62 63 64 65
9
order to remain within limited salinity bands (Drake et al., 2007). Anchovy abundances increased in 250
coastal areas adjacent to the Guadiana estuary during high river flow periods and it is suggested that 251
a reduction of inflow may have more negative consequences for eggs and larval stages that are more 252
susceptible (Chícharo et al., 2001). 253
Most taxa displayed a seasonal pattern presenting higher abundances during spring and summer and 254
the multivariate analysis confirmed distinct seasonal communities. However, this seasonal sign 255
decreases during years with low freshwater discharges and consequent higher salinity anomalies. 256
Indeed differences among seasons were higher than across years or sampling stations. Several 257
studies have already shown that temporal changes in composition and abundance are mostly related 258
to spawning patterns of adult fishes (e.g. Barletta-Bergan et al., 2002; Ramos et al., 2006; Sabatés et 259
al., 2007). Hence, Atherina presbyter, Solea solea, Syngnathus abaster, Crystallogobius linearis 260
and Platichthys flesus were more abundant during spring/summer period while Ammodytes 261
tobianus, Callionymus sp., Echiichthys vipera and Liza ramada were more abundant in 262
autumn/winter. The spatial distribution indicated that fish larvae predominated in inner areas of 263
estuary, mainly in the south arm probably due to the higher residence time thus avoiding being 264
washed out by river flux. Conversely, station M, at the mouth of the estuary, had a different fish 265
larval assemblage with fewer species and abundances. 266
Seasonal changes in temperature, chlorophyll a and runoff were found to be the main factors 267
forcing larval fish assemblage distributions leading to a decrease in abundance and diversity in fish 268
larval communities during colder months. Seasonal variations in environmental parameters seemed 269
to influence the assemblage structure but there was not a similar set of inter-annual changes in the 270
last six years. The Mondego estuary has recently experienced periods of low precipitation resulting 271
in reduced freshwater runoff and consequently changes in salinity gradients; this has influenced 272
estuarine communities at different trophic levels (e.g. Marques et al., 2007; Martinho et al., 2007b; 273
Cardoso et al., 2008). In the 2004/2005 dry years there was an increase in zooplankton density, a 274
higher abundance and prevalence of marine species throughout the year and a replacement of the 275
freshwater community by one predominantly dominated by estuarine organisms in the most 276
upstream areas (Marques et al., 2007; Primo et al., 2009). However, the main drought-induced 277
effects detected on juvenile fish assemblages were related to a depletion of freshwater species and 278
an increase in marine straggler species (Martinho et al., 2007b). The absence of a close correlation 279
between fish populations and environmental signals is a sign that species might show nonlinear 280
responses to external forcing (Hsieh et al., 2005) and the incidence of droughts may have a similar 281
impact on larval fish assemblages. Despite the community structure remaining relatively 282
unchanged, as indicated by multivariate analysis, the main effects detected were observed in the 283
species distribution. During years with positive salinity anomalies (mainly 2005 and 2008), marine 284
MANUSCRIP
T
ACCEPTED
ACCEPTED MANUSCRIPT
1 2 3 4 5 6 7 8 9 10 11 12 13 14 15 16 17 18 19 20 21 22 23 24 25 26 27 28 29 30 31 32 33 34 35 36 37 38 39 40 41 42 43 44 45 46 47 48 49 50 51 52 53 54 55 56 57 58 59 60 61 62 63 64 65
10
species (both stragglers and migrants) were able to reach the upper estuary in higher densities. Short 285
term fluctuations in larval abundances are mostly related to reproductive output or geographic shifts 286
(Hsieh et al., 2005) and Fernández-Delgado et al. (2007) suggest that temporal changes in 287
freshwater discharge cause longitudinal displacement of the estuarine salinity gradient leading to 288
related changes in marine species distribution. Also, during 2004 and 2005 the seasonal peak 289
occurred in spring regardless of summer conditions, as recorded during all the other years. The 290
early timing of seasonal peaks is an important response to climate change since it can influence 291
trophic interactions eventually leading to ecosystem-level changes (Edwards and Richardson, 292
2004). Short-term drought events seem to have a little influence on fish communities probably 293
because fish species are characterized by a slow response time to disturbance (Cabral et al., 2001). 294
Also, the number of influencing factors is too large and individual species may differ very widely in 295
their response. Nevertheless longer time-series are necessary to detect more significant impacts and 296
long term effects of climate change on larval fish assemblages in contrast to other trophic levels. 297
298
5. Conclusions 299
Mondego estuary fish larvae assemblages displayed a clear seasonal pattern presenting higher 300
abundances and diversities during warmer months. The main effects of dry events apparently did 301
not affect fish larval community structure but changes in estuarine salinity gradient appear to lead to 302
related changes in marine species distribution. Therefore, river flow played a key role in structuring 303
the ichthyoplankton assemblage thus representing also an important retention mechanism 304
responsible for a successful larval development and recruitment. 305
306
Acknowledgments 307
The present work was supported by FCT (Portuguese Foundation for Science and Technology) 308
through a PhD grant awarded to AL Primo (SFRH/BD/42351/2007). The authors are indebted to all 309
the colleagues that assisted in the field and lab work. The authors would also like to acknowledge to 310
Dr Rita Borges for her help with fish larvae identification and Susana Mendes for her suggestions in 311
statistical analysis. 312
313
References 314
Alemany, F., Deudero, S., Morales-Nin, B., López-Jurado, J.L., Jansà, J., Palmer, M., Palomera, I., 315
2006. Influence of physical environmental factors on the composition and horizontal distribution of 316
summer larval fish assemblages off Mallorca Island (Balearic archipelago, western Mediterranean). 317
Journal of Plankton Research 28(5), 473-487. 318
MANUSCRIP
T
ACCEPTED
ACCEPTED MANUSCRIPT
1 2 3 4 5 6 7 8 9 10 11 12 13 14 15 16 17 18 19 20 21 22 23 24 25 26 27 28 29 30 31 32 33 34 35 36 37 38 39 40 41 42 43 44 45 46 47 48 49 50 51 52 53 54 55 56 57 58 59 60 61 62 63 64 65
11
Azeiteiro, U.M., Marques, J.C., Ré, P., 1999. Zooplankton annual cycle in the Mondego river 319
estuary (Portugal). Arquivos do Museu Bocage 3, 239–263. 320
Barletta-Bergan, A., Barletta, M., Saint-Paula, U., 2002. Structure and seasonal dynamics of larval 321
fish in the Caeté river estuary in North Brazil. Estuarine, Coastal and Shelf Science 54, 193–206. 322
Beck, M.W., Heck, K.L., Able, K.W., Childers, D.L., Eggleston, D. B., Gillanders, B. M., Halpern, 323
B., Hays, C. G., Hoshino, K., Minello, T. J., Orth, R. J., Sheridan, P. F., Weinstein, M. R., 2001. 324
The identification, conservation, and management of estuarine and marine nurseries for fish and 325
invertebrates. BioScience 51, 633–641. 326
Blaber, S.J.M., 1987. Factors affecting recruitment and survival of mugilids in estuaries and coastal 327
waters of Southeastern Africa. American Fisheries Society Symposium 1, 507–518. 328
Boeing, W.J., Duffy-Anderson, J.T., 2008. Ichthyoplankton dynamics and biodiversity in the Gulf 329
of Alaska: Responses to environmental change. Ecological Indicators 8, 292–302. 330
Cabral, H.N., Costa, M.J., Salgado, P., 2001. Does the Tagus estuary fish community reflect 331
environmental changes? Climate Research 18, 119-126. 332
Cardoso, P.G., Raffaelli, D., Pardal, M.A., 2008. The impact of extreme weather events on the 333
seagrass Zostera noltii and related Hydrobia ulvae population. Marine Pollution Bulletin 56, 483-334
492. 335
Chícharo, L., Chícharo, M.A., Esteves, E., Andrade, J.P., Morais, P., 2001. Effects of alterations in 336
freshwater supply on the abundance and distribution of Engraulis encrasicolus in the Guadiana 337
Estuary and adjacent coastal areas of south Portugal. Ecohydrology Hydrobiology 1, 341–345. 338
Clarke, K.R. and Warwick, R.M., 2001. Changes in Marine Communities: An Approach to 339
Statistical Analysis and Interpretation. Plymouth Marine Laboratory, Plymouth, 172 pp. 340
Demir, N., 1976. Callionymidae of the northeastern Atlantic. Fiches d’Identification du 341
Zooplankton 148, 1-5. 342
Dolbeth, M., Martinho, F., Leitão, R., Cabral, H., Pardal, M.A., 2007. Strategies of Pomatoschistus 343
minutus and Pomatoschistus microps to cope with environmental instability. Estuarine, Coastal and 344
Shelf Science 74, 263–273. 345
Doyle, M.J., Mier, K.L., Busby, M.S., Brodeur, R.D., 2002. Regional variation in springtime 346
ichthyoplankton assemblages in the northeast Pacific Ocean. Progress in Oceanography 53, 247–347
281. 348
Drake, P., Borlán, A., González-Ortegón, E., Baldó, F., Vilas, C., Férnandez-Delgado, C., 2007. 349
Spatio-temporal distribution of early life stages of the European anchovy Engraulis encrasicolus L. 350
within a European temperate estuary with regulated freshwater inflow: effects of environmental 351
variables. Journal of Fish Biology 70, 1689–1709. 352
MANUSCRIP
T
ACCEPTED
ACCEPTED MANUSCRIPT
1 2 3 4 5 6 7 8 9 10 11 12 13 14 15 16 17 18 19 20 21 22 23 24 25 26 27 28 29 30 31 32 33 34 35 36 37 38 39 40 41 42 43 44 45 46 47 48 49 50 51 52 53 54 55 56 57 58 59 60 61 62 63 64 65
12
Edwards, M., Richardson, A.J., 2004. Impact of climate change on marine pelagic phenology and 353
trophic mismatch. Nature 430, 881–884. 354
Elliott, M., McLusky, D.S., 2002. The need for definitions in understanding estuaries. Estuarine, 355
Coastal and Shelf Science 55, 815–827. 356
Elliott, M., Whitfield, A.K., Potter, I.C., Blaber, S.J.M., Cyrus, D.P., Nordlie, F.G., Harrison, T.D., 357
2007. The guild approach to categorizing estuarine fish assemblages: a global review. Fish and 358
Fisheries 8, 241–268. 359
Faria, A., Morais, P., Chícharo, M.A., 2006. Ichthyoplankton dynamics in the Guadiana estuary and 360
adjacent coastal area, South-East Portugal. Estuarine, Coastal and Shelf Science 70, 85–97. 361
Fernandez-Delgado, C., Baldo, F., Vilas, C., Garcia-Gonzalez, D., Cuesta, J.A., Gonzalez-Ortegon, 362
E., Drake, P., 2007. Effects of the river discharge management on the nursery function of the 363
Guadalquivir river estuary (SW Spain). Hydrobiologia 587, 125–136. 364
Fives, J.M., 1970. Blenniidae of the North Atlantic. Fiches d’Identification du Zooplancton, 3, 1–4. 365
Franco-Gordo, C., Godinez-Dominguez, E., Suarez-Morales, E., 2002. Larval fish assemblages in 366
waters off the central Pacific coast of Mexico. Journal of Plankton Research 24, 775–784. 367
Hsieh, C., Reiss, C., Watson, W., Allen, M.J., Hunter, J. R., Lea, R. N., Rosenblatt, R. H., Smith, P. 368
E., Sugihara, G., 2005. A comparison of long-term trends and variability in populations of larvae of 369
exploited and unexploited fishes in the Southern California region: a community approach. Progress 370
in Oceanography 67, 160–185. 371
INAG – Instituto Nacional da Água. Portuguese Water Institute. http://snirh.pt/. (Accessed 372
08.01.10) 373
Isari, S., Fragopoulu, N., Somarakis, S., 2008. Interranual variability in horizontal patterns of larval 374
fish assemblages in the northeastern Aegean Sea (eastern Mediterranean) during early summer. 375
Estuarine, Coastal and Shelf Science 79, 607–619. 376
Leitão, R., Martinho, F., Cabral, H., Jorge, I., Marques, J.C., Pardal, M.A., 2007. The fish 377
assemblage of the Mondego estuary: Composition, structure and trends over the past two decades. 378
Hydrobiologia 587, 269–279. 379
Marques, S.C., Azeiteiro, U.M., Marques, J.C., Neto, J.M., Pardal, M.A., 2006. Zooplankton and 380
ichthyoplankton communities in a temperate estuary: spatial and temporal patterns. Journal of 381
Plankton Research 28, 297–312. 382
Marques, S.C., Azeiteiro, U.M., Martinho, F., Pardal, M.A., 2007. Climate variability and 383
planktonic communities: the effect of an extreme event (severe drought) in a southern European 384
estuary. Estuarine, Coastal and Shelf Science 73, 725-734. 385
Martinho, F., Leitão, R., Neto, J.M., Cabral, H., Marques, J.C., Pardal, M.A., 2007a. The use of 386
nursery areas by juvenile fish in a temperate estuary, Portugal. Hydrobiologia 587, 281-290. 387
MANUSCRIP
T
ACCEPTED
ACCEPTED MANUSCRIPT
1 2 3 4 5 6 7 8 9 10 11 12 13 14 15 16 17 18 19 20 21 22 23 24 25 26 27 28 29 30 31 32 33 34 35 36 37 38 39 40 41 42 43 44 45 46 47 48 49 50 51 52 53 54 55 56 57 58 59 60 61 62 63 64 65
13
Martinho, F., Leitão, R., Viegas, I., Dolbeth, M., Neto, J.M., Cabral, H.N., Pardal M.A., 2007b. The 388
influence of an extreme drought event in the fish community of a southern Europe temperate 389
estuary. Estuarine, Coastal and Shelf Science 75, 537-546. 390
Mazzoldi, C., Rasotto, M.B., 2001. Extended breeding season in the marbled goby, Pomatoschistus 391
marmoratus (Teleostei: Gobiidae), in the Venetian Lagoon. Environmental Biology of Fishes 61, 392
175-183. 393
Nichols, J.H., 1976. Soleidae of the Eastern North Atlantic. Fiches d’Identification du Zooplankton 394
150-151, 1-10. 395
Petersen, C.G.J., 1919. Our gobies (Gobiidae). From the egg to the adult stages. Rep. Dan. biol. 396
Stn., 26, 45-66. 397
Portuguese Weather Institute. http://www.meteo.pt/en/index.html (Accessed 08.01.07). 398
Primo, A.L., Azeiteiro, U.M., Marques, S.C., Martinho, F., Pardal, M.A., 2009. Changes in 399
zooplankton diversity and distribution pattern under varying precipitation regimes in a southern 400
temperate estuary. Estuarine, Coastal and Shelf Science 82, 341–347. 401
Ramos, S., Cowen, R.K., Ré, P., Bordalo, A.A., 2006. Temporal and spatial distribution of larval 402
fish assemblages in the Lima estuary (Portugal). Estuarine, Coastal and Shelf Science 66, 303-313. 403
Ré, P., 1999. Ictioplâncton estuarino da Península Ibérica. Guia de identificação dos ovos e estados 404
larvares planctónicos. Câmara Municipal de Cascais, Cascais, 163 pp. 405
Ré, P., Meneses, I., 2009. Early stages of marine fishes occurring in the Iberian Peninsula. 406
IPIMAR/IMAR, Lisboa, 282 pp. 407
Ribeiro, R., 1991. Ictioplâncton do estuário do Mondego e Resultados. Revista de Biologia: Actas 408
do I Encontro de Planctologistas Portugueses 4, 233-244. 409
Ribeiro, R., Gonçalves, F., 1993. Padrões espacio-temporais na diversidade da comunidade larvar 410
de teleósteos no estuário do Mondego. Boletim Uca 1, 490-506. 411
Ribeiro, R., Reis, J., Santos, C., Gonçalves, F., Soares, A.M.V.M., 1996. Spawning of anchovy 412
Engraulis encrasicolus in the Mondego estuary, Portugal. Estuarine, Coastal and Shelf Science 42, 413
467-482. 414
Russell, F.S., 1976. The Eggs and Planktonic Stages of British Marine Fishes. Academic Press, 415
London, 539 pp. 416
Sabatés, A., Olivar, M.P., Salat, J., Palomera, I., Alemany, F., 2007. Physical and biological 417
processes controlling the distribution of fish larvae in the NW Mediterranean. Progress in 418
Oceanography 74, 355-376. 419
Selleslagh, J., Amara, R., Laffargue, P., Lesourd, S., Lepage, M., Girardin, M., 2009. Fish 420
composition and assemblage structure in three Eastern English Channel macrotidal estuaries: A 421
comparison with other French estuaries. Estuarine, Coastal and Shelf Science 81, 149–159. 422
MANUSCRIP
T
ACCEPTED
ACCEPTED MANUSCRIPT
1 2 3 4 5 6 7 8 9 10 11 12 13 14 15 16 17 18 19 20 21 22 23 24 25 26 27 28 29 30 31 32 33 34 35 36 37 38 39 40 41 42 43 44 45 46 47 48 49 50 51 52 53 54 55 56 57 58 59 60 61 62 63 64 65
14
Strydom, N.A., Whitfield, A.K., Wooldridge, T.H., 2003. The role of estuarine type in 423
characterizing early stage fish assemblages in warm temperature estuaries, South Africa. African 424
Zoology 38, 29–43. 425
Whitfield , A.K., 1999. Ichthyofaunal assemblages in estuaries: a South African case study. 426
Reviews in Fish Biology and Fisheries 9, 151-186. 427
428
MANUSCRIP
T
ACCEPTED
ACCEPTED MANUSCRIPT
1 2 3 4 5 6 7 8 9 10 11 12 13 14 15 16 17 18 19 20 21 22 23 24 25 26 27 28 29 30 31 32 33 34 35 36 37 38 39 40 41 42 43 44 45 46 47 48 49 50 51 52 53 54 55 56 57 58 59 60 61 62 63 64 65
15
FIGURE CAPTIONS 429
430
Fig. 1 – Map of the Mondego estuary, located on the western coast of Portugal. Sampling stations 431
surveyed in this study are indicated (M, mouth station; S1 and S2, southern arm stations; N1 and 432
N2, northern arm stations). 433
Fig. 2 – Seasonal water runoff (m3) and average of precipitation (mm) in Mondego estuary during 434
the study period. 435
Fig. 3 – Seasonal average water temperature (ºC), chlorophyll a (mg/m-3
) and salinity anomalies in 436
Mondego estuary during the study period. 437
Fig. 4 – Seasonal density (larvae 100m-3
) of total fish larvae and of each main ecological guild. ES 438
– Estuarine species; MS – Marine Stragglers; MM – Marine Migrants. 439
Fig. 5 – Interannual and spatial density (larvae 100m-3
) distribution of the three main ecological 440
guilds. (A) Estuarine Species; (B) Marine Stragglers; (C) Marine Migrants. 441
Fig. 6 – Temporal and spatial density (larvae 100m-3
) distributions of Pomatoschistus spp., 442
Engraulis encrasicolus, Solea senegalensis and Shannon Wiener index (log2) in the Mondego 443
estuary. 444
Fig. 7 – Triplot ordination diagram of the larval fish assemblages in Mondego estuary using the first 445
two canonical correspondence axes. Samples were classified in winter, spring, summer and autumn. 446
Significant environmental variables are plotted as arrows (T – temperature; Chl a – chlorophyll a; 447
Sal – salinity; Runoff – river discharge) or nominal variables (W – winter; SM – summer). Species 448
codes are presented in Table I. 449
MANUSCRIP
T
ACCEPTED
ACCEPTED MANUSCRIPT
!
!
!
!
!N2
S2
N1
S1
M oFIGUEIRA DA FOZ
PRANTO RIVER
MOND
EGO
RIVE
RSOUTHNORTH ARM
P O
R T
U G
A L
SLUICE
ATLA
NTIC
OCE
AN
8º 50' W
40º 0
8' N
SAMPLING STATIONS!Km1
ARM
Figure 1
MANUSCRIP
T
ACCEPTED
ACCEPTED MANUSCRIPTW
ate
r R
unoff (
m)
3
0,0
2,0e+8
4,0e+8
6,0e+8
8,0e+8
1,0e+9Water Runoff Precipitation Average Precipitation 1971-2000
0
20
40
60
80
100
120
140
160
180
Pre
cip
itatio
n (m
m)
A08
SM
08
S08
W08
A07
SM
07
S07
W07
A06
SM
06
S06
W06
A05
SM
05
S05
W05
A04
SM
04
S04
W04
A03
SM
03
S03
W03
Figure 2
MANUSCRIP
T
ACCEPTED
ACCEPTED MANUSCRIPT
-30
-20
-10
0
10
20
30
-30
-20
-10
0
10
20
30
-30
-20
-10
0
10
20
30
-20
-10
0
10
20
30
40
50
-30
-20
-10
0
10
20
30
M
S1
S2
N2
N1
Salinity anomalies Chlorophyll a Temperature
A08
SM
08
S08
W08
A07
SM
07
S07
W07
A06
SM
06
S06
W06
A05
SM
05
S05
W05
A04
SM
04
S04
W04
A03
SM
03
S03
W03
Figure 3
MANUSCRIP
T
ACCEPTED
ACCEPTED MANUSCRIPT
A0
8
SM
08
S0
8
W0
8
A0
7
SM
07
S0
7
W0
7
A0
6
SM
06
S0
6
W0
6
A0
5
SM
05
S0
5
W0
5
A0
4
SM
04
S0
4
W0
4
A0
3
SM
03
S0
3
W0
3
0
20
40
60
80
Tota
l/ES
(la
rvae
100
m)
-3M
S/M
M (la
rvae 1
00m
)-3
0
1
2
3
4
5
6
7Total MM MSES
Figure 4
MANUSCRIP
T
ACCEPTED
ACCEPTED MANUSCRIPT
20
40
60
80
100
120
140
160
1
2
3
4
5
6
5101520253035
(B) MARINE STRAGGLERS(A) ESTUARINE SPECIES
M
(C ) MARINE MIGRANTS
S1
N1
S2
N2
2003 2004 2005 2006 2007 2008 2003 2004 2005 2006 2007 2008 2003 2004 2005 2006 2007 2008
Figure 5

MANUSCRIP
T
ACCEPTED
ACCEPTED MANUSCRIPT
1
4
7
10
13
16
19
22
20
40
60
80
100
120
140
160
0.0
0.5
1.0
1.5
2.0
0.2
0.7
1.2
1.7
2.2
2.7
Pom
ato
schis
tus
spp.
Engra
ulis
encra
sic
olu
sS
ole
a s
enegale
nsis
Shannon W
iener
Index
M
S1
N1
S2
N2
M
S1
N1
S2
N2
M
S1
N1
S2
N2
M
S1
N1
S2
N2
A08
SM
08
S08
W08
A07
SM
07
S07
W07
A06
SM
06
S06
W06
A05
SM
05
S05
W05
A04
SM
04
S04
W04
A03
SM
03
S03
W03
Figure 6
MANUSCRIP
T
ACCEPTED
ACCEPTED MANUSCRIPT
-1.0 1.0
-1.0
1.0
Eenc
Gnig
Gobi
Gspp
Amin
CgalPmic
Ppil
Pspp
Spil
Ssen
Solei
Sacu
Atob
Atho
ApresAspp
Cspp
Clin
Evip
Lpho
LramPmin
Pfle
Ssol Smel
Saba
Sygn
No fish
T
Sal
Chl a
W
SUMMER
AUTUMN
WINTER
SPRING
Runoff
SM
CCA axis 1 (35% total variation)
CC
Aaxis
2 (
22%
tota
l variation)
Figure 7
MANUSCRIP
T
ACCEPTED
ACCEPTED MANUSCRIPT
1
Table I: Mean Density (larvae 100m-3
) of species caught during the sampling period and relative
contribution (%) to the total catch in whole estuary, in each season and sampling station. MD –
Mean Density; W – winter; S – spring; SM – summer; A – autumn.
Family Species
CCA Ecological Total catch Season (%) Sampling station (%)
CODE guild MD % W S SM A M S1 S2 N1 N2
Gobiidae Pomatoschistus spp. Pspp ES 70.65 63.40 54.42 58.26 68.52 65.39 3.19 18.52 16.35 7.74 17.59
Not identified Not identified - 9.52 8.75 6.69 13.54 4.20 12.31 3.82 2.20 1.01 1.50 0.22
Gobiidae Pomatoschistus microps Pmic ES 6.63 6.02 3.44 9.92 3.20 6.76 0.05 0.98 2.61 1.39 0.98
Gobiidae Gobiidae not identified Gobi ES 5.37 4.65 15.29 4.49 3.23 3.09 0.74 0.40 2.56 0.50 0.46
Gobiidae Gobius niger Gnig ES 3.79 3.57 1.22 2.85 5.59 0.62 0.06 1.62 1.24 0.29 0.36
Engraulidae Engraulis encrasicolus Eenc MS 2.01 1.96 0.49 - 4.16 0.83 - 0.12 1.78 - 0.06
Blenniidae Parablennius pilicornis Ppil MS 2.02 1.88 - 1.36 3.08 0.60 0.13 0.93 0.10 0.24 0.47
Gobiidae Gobius spp. Gspp ES 2.49 1.86 1.17 2.05 1.63 2.52 0.07 0.90 0.73 0.11 0.04
Soleidae Solea senegalensis Ssen MM 1.51 1.33 3.19 0.55 1.37 1.97 0.32 0.44 0.04 0.39 0.14
Soleidae Soleidae not identified Solei 1.32 1.06 1.65 0.86 0.26 3.60 0.09 0.48 0.16 0.28 0.06
Syngnathidae Syngnathus acus Sacu ES 0.96 0.85 - 0.37 1.55 0.40 0.04 0.17 0.16 0.24 0.24
Gobiidae Aphia minuta Amin MS 0.61 0.59 - 1.73 - - - 0.08 0.51 - -
Blenniidae Coryphoblennius galerita Cgal MS 0.55 0.49 - 0.75 0.42 0.42 0.27 0.08 - 0.10 0.05
Clupeidae Sardina pilchardus Spil MM 0.50 0.42 0.40 0.50 0.18 0.97 - 0.17 0.04 0.17 0.04
Blenniidae Lipophrys pholis Lpho MS 0.38 0.38 2.38 0.44 - 0.22 0.12 0.15 - 0.08 0.03
Ammodytidae Ammodytes tobianus Atob MS 0.35 0.32 3.86 - - - - 0.27 - 0.06 -
Atherinidae Atherina presbyter Apres ES 0.32 0.28 - 0.30 0.40 - 0.19 0.08 - - -
Atherinidae Atherina spp. Aspp ES 0.44 0.27 - 0.12 0.52 - - 0.15 - 0.12 -
Soleidae Solea solea Ssol MM 0.26 0.26 - 0.15 0.48 - - 0.26 - - -
Gobiidae Pomatoschistus minutus Pmin ES 0.23 0.23 - 0.68 - - - 0.10 0.09 0.04 -
Syngnathidae Syngnathus spp. Sygn ES 0.22 0.21 - 0.44 0.14 - - 0.19 - - 0.02
Blenniidae Blenniidae n. id Blenn 0.23 0.17 1.35 0.17 - - - - 0.06 - 0.11
Mugilidae Liza ramada Lram CA 0.20 0.16 1.07 - 0.17 - 0.07 - 0.09 - -
Labriidae Symphodus melops Smel MS 0.15 0.15 - 0.17 0.22 - - 0.15 - - -
Syngnathidae Syngnathus abaster Saba ES 0.26 0.13 - - 0.30 - - 0.07 - - 0.06
Callionynidae Callionymus spp. Cspp ES 0.17 0.11 1.35 - - - 0.06 - - 0.06 -
Trachinidae Echiichthys vipera Evip MS 0.17 0.11 1.35 - - - 0.06 - - 0.06 -
Gobiidae Crystallogobius linearis Clin MS 0.24 0.11 - - 0.25 - - 0.07 0.04 - -
Pleuronectidae Platichthys flesus Pfle MM 0.10 0.10 - 0.30 - - - - - - 0.10
Ammodytidae Ammodytidae n. id. Amm 0.09 0.06 0.68 - - - - - - - 0.06
Bothidae Arnoglossus thori Atho MS 0.05 0.05 - - 0.12 - - - 0.05 - -
Blenniidae Lipophrys spp. Lspp MS 0.04 0.04 - - - 0.29 - - 0.04 - -
Total Number of Larvae 7211 608 2449 3112 1042 669 2060 1995 965 1522
Number of Species 31 17 22 22 15 17 25 19 18 19
Table IClick here to download Table(s): PRIMO et al ECSS Tables_REVISED.doc


