Embed Size (px)
Citation preview

HEID Working Paper No 122008
The Market Driven Trade Liberalization
and East Asian Regional Integration
Lurong CHEN Graduate Institute of International Studies and UNU-CRIS
Abstract
This paper creates a new index (ldquoindex of bilateral trade relationrdquo) to quantitatively evaluate the degree of regional economic integration based on countriesrsquo de facto bilateral trade relations It concludes that a fundamental arrangement of East Asian regionalism should involve at least one of the two ldquohubrdquo candidates ndash Japan and China It also suggests that the China-ASEAN FTA (CAFTA) may trigger domino effects of regionalism in East Asia
copy The Authors All rights reserved No part of this paper may be reproduced without
the permission of the authors
1
THE MARKET DRIVEN TRADE LIBERALIZATION AND EAST ASIAN REGIONAL INTEGRATION
Lurong Chen
Abstract This paper creates a new index (ldquoindex of bilateral trade relationrdquo) to
quantitatively evaluate the degree of regional economic integration based on countriesrsquo de facto bilateral trade relations It concludes that a fundamental arrangement of East Asian regionalism should involve at least one of the two ldquohubrdquo candidates ndash Japan and China It also suggests that the China-ASEAN FTA (CAFTA) may trigger domino effects of regionalism in East Asia
JEL classification F15 R11 Keywords trade liberalization regional integration East Asian regionalism
The author wants to thank Richard Baldwin Henryk Kierzkowski John Cuddy Fukunari Kimura Peter Drysdale Jong-Kil Kim and participants at SSRC international conference on Inter-Asian connections (Dubai 2008) for useful comments and suggestions
1
1 Introduction
East Asian countries have been said to be on their way towards regionalism for many years
Just as many other regional trade agreements that are mainly involved in developing
countries the institutional progress of East Asian regional integration seemed to be a topic in
the papers until the last decade The participation of Japan Korea China and ASEAN has
made it feasible that East Asian countries come together to create the third largest regional
economic entity in the world following EU and NAFTA
More than eighty regional and bilateral free trade agreements (FTAs) have been
implemented in Asia (Kuroda 2006) over half of which are signed by East Asian countries
The various degrees of liberalization and the different paces in the negotiations have made up
a dazzling network which prevents us from having a comprehensive picture on the real
process of East Asian regionalism In contrary to the EU and NAFTA it is popularly believed
that the integration in East Asia is indeed driven by the cross border connection within its
business sector instead of the formatted integration It would be an alternative for us to
understand the process and the structure of East Asian regional integration more easily based
on the observation on the de facto integration of East Asian economies rather than the one-
by-one interpretation and comparison of legal terms in agreements
However if East Asian regional integration is initiated by the market mechanism to
what extent has the market driver influenced the bilateral trade flow between East Asian
countries Is it possible to measure and compare their de facto bilateral trade relations
quantitatively Suppose the prospective institutional building in East Asia would mostly base
on this market-initiated regional integration what could be a possible arrangement of East
Asian regionalism To investigate the de facto trade liberalization in East Asia this paper
regards bilateral trade relations as parts of the policy frictions that may influence trade flows
via their impacts on trade cost and introduces a new method to measure countriesrsquo de facto
2
bilateral trade relations in relative terms by calculating BTR index (ldquoindex of bilateral trade
relationrdquo) In combination with HM index (ldquoindex of Hubness-Measurerdquo) it plans to outline
the structure of East Asian regional integration and suggest a possible approach towards East
Asian regionalism from pure economic perspectives
This paper is structured as follows Section 2 introduces method to calculate the BTR
index and the ldquoeconomic distancerdquo between countries Section 3 reviews some policy debates
on East Asian regional integration Section 4 investigates the formation of East Asian regional
integration It evaluates the relative intensity of intra-regional trade and calculates BTR index
and HM index based on which it will also image an ldquoeconomic maprdquo of East Asia Moreover
it will also evaluate the influence of China-ASEAN FTA (CAFTA) in the progress of East
Asian regional integration Section 5 concludes
2 To measure the de facto Bilateral Trade Relations
21 The logic and methodology
The basic idea to get the BTR index is to decompose the policy frictions from the gravity
model This is based on two considerations first bilateral trade between countries increases
with the expansion of economic size and contracts with the growth of the costs of trade1
Second policy frictions can play a much more decisive role on trade than natural frictions
Suppose two countries A and B hold the a priori advantages needed for opening trade with
each other (ie both of them are big economies they are adjacent they have a similar cultural
background a similar language and so on) this does not necessarily mean that they would
become close trade partners For instance if the government of country A implements extra
restrictions on trade with country B then it is very unlikely that the two countries will end up
trading at the level that a priori natural factors would suggest In this case even though
1 Since the distance between countries seems to be the primary determinant of the cost of transportation the geographic measurements are used for simplification
3
natural conditions would encourage the two countries to trade freely we may fail to observe
substantial trade flows between them because the government of country A artificially
undermined natural trading preference
Basically the determinants of bilateral trade between countries (or regions) can be
classified into two categories trade cost and partner countriesrsquo properties such as GDP
population and GDP per capita Lowering trade costs will encourage bilateral trade between
countries while increasing costs may discourage it Trade costs could be roughly grouped into
two categories One is the natural frictions typically transportation costs that are induced by
the geographic distance technology and trade infrastructure The other is the policy frictions
such as technical barriers and trade facilities Because of the non-discrimination of
multilateral trade liberalization one may regard the policy frictions as the mirror of the de
facto bilateral trade relations when comparing the relative closeness of trade partnership
between economies Since the regional integration in East Asia is market-led the policy
frictions existing in bilateral trade between East Asian countries may reflect how close the
two economies are driven by the market In the short run the policy frictions could be
regarded as the ldquofixed effectsrdquo that exist between countries on the level of bilateral trade The
estimation based on the time series could be seen as the average effects of the policy frictions
during the period under investigation
It is worthwhile to mention that just like many other empirical studies the method
presented in this paper is not totally neutral from critiques theoretically Besides those flaws
that are inherited from the gravity model the calculation of the BTR ignores the fact that the
exclusion of other factors that could affect the bilateral trade flows (such as common language
effects common border effects etc) from the estimation will lower the precision of the index
Moreover since the elasticity of economic size on international trade has been assumed to be
identical throughout the sample it is very likely that the index is biased in favor of those
4
countries whose development depends more on international trade In principle for those
countries whose trade policies are freer the value of BTR should be relatively lower than
those whose bilateral trade is more restricted by governments
22 The gravity equation
The gravity equation is chosen to pool all these trade determinants It may be one of the
most popular models used in empirical studies of international trade and migration in the last
fifteen years Historically Tinbergen (1962) and Poumlyhoumlnen (1963) independently developed it
first in a series of econometric models of bilateral trade flows (Deardorff 1984) Since then
various versions of gravity-type models were widely applied in the empirical studies Taken
from the famous Newtonian Gravity theory the equation can explain the relationship of trade
flows between countries and their geographic and economic properties quite well Similar to
the result obtained in physics which tells us that the gravity between two objects is positively
related to their masses and inversely related to the distance between them the gravity model
shows that the larger the economic size of the trade partners the higher the possible bilateral
trade flow between them while the higher the trade cost the lower the bilateral trade flow
may occur
It has been very successful empirically in fields such as the examination of bilateral
trade patterns and ldquonaturalrdquo regional trading blocs (Frankel Stein and Wei 1996) the
estimation of trade creation and trade diversion effects from regional integration (eg
Mendez and Brada 1985 Hamilton and Winters 1992 Baldwin 1994) The high degree of
flexibility of the model allows for many ldquoversionsrdquo of approaches In the study of trade blocs
there are two commonly used approaches One is the ldquodummy variablerdquo approach which was
especially popular in the last decade The simplicity of the procedure and the straightforward
results are the key advantages of the method even if it is constrained by the use of dummy
variables The other approach is called the ldquofactor endowment-based gravity equationrdquo
5
approach which essentially uses instrumental variable methods to solve a ldquomultivariate
multiplicative error-in-variable problemrdquo (Saxonhouse 1993) With a constructed tolerance
interval indicator and a given probability one can consider those observations falling outside
the tolerance intervals as signs of regional bias The large number of extreme observations
suggests that there is significant internal trade bias and the existence of a trading bloc This
method provides us with a quantitative approach to the study of trading blocs However the
conclusion may depend closely upon the tolerance interval chosen Moreover since different
factor endowments must be classified and the estimation for each sector in turn must be
performed it is relatively complex in application
Though the gravity equation is initially ldquodiscoveredrdquo in empirical studies its theoretical
foundation has also been shown by economists based on various assumption and models
After Andersonrsquos (1979) first formal attempt to derive the gravity equation under the
assumption of product differentiation many economists also tried to prove the model
theoretically via different approaches such as Bergstrand (1989) who explored the model
associated with monopolistic competition Helpman and Krugman (1985) who justified the
model based on an IRS type of model Most recently Deardorff (1995) found the gravity
model to be consistent with a wide range of trade models including the H-O model either
with frictionless or with impeded trade The differences in these theories help to explain the
various specifications and the diversity in the results of the empirical applications Anderson
and Wincoop (2003) derive a theoretical gravity equation based on the assumption of
differentiated goods from different country of original and CES utility function in which they
show that trade barriers are determinants of inter regional trade Their model also shows that
in the gravity model the effects of trade barriers are various according to the economic sizes
of trading partners
6
The gravity equation simplifies the determinants of bilateral trade between countries (or
regions) into two categories partner countriesrsquo properties such as GDP population GDP per
capita etc and trade cost of trade between partners such as transport costs tariff barriers
quotas etc Lower trade costs will encourage bilateral trade between countries while higher
costs will discourage it Loosely speaking there are two types of trade costs One is related to
ldquonatural frictionsrdquo such as the geographical distance level of technology etc and the other
is related to ldquopolicy frictionsrdquo primarily the degree of bilateral liberalization
As normal GDP and GDP per capita are used to describe a countriesrsquo economy and the
distance between the capitals of the two countries is employed to approximate ldquonaturalrdquo trade
costs It is assumed that the marginal effect of either GDP or GDP per capita on bilateral trade
is identical and that the marginal effect of distance can be magnified or shrunk by individual
bilateral trade relations
The marginal effect of each trade determinant on bilateral trade can be represented in a
gravity equation as follows
( ) ( )j ji i
ij
i j i jij
ij
GDP GDP K KTrade
Dist
α βα β
γ
sdot sdot sdot= (1)
where α β and ijγ represent the marginal effect of GDP GDP per capita(K) and distance
respectively It is assumed that α and β are identical while ijγ could vary related to countriesrsquo
bilateral trade relations That is the bilateral trade relation can influence bilateral trade flows
via its impacts on the elasticity of the geographical distance In practice equation (1) is
estimated in a logarithm form as equation (2) expresses
log( ) log log log log log( )ij t i i t j j t i i t j j t ij ij ij tTrade C GDP GDP K K Dist uα α β β γ= + sdot + sdot + sdot + sdot + sdot + (2)
where ( )log ij tTrade denotes the logarithm of total bilateral trade flow at time t log i tGDP
and log j tGDP denote the logarithm of countries annual GDP log i tK and log j tK denote the
7
logarithm of countriesrsquo annual per Capita GDP log(Distij) denotes the logarithm of the
geographic distance between the trade partnersrsquo capitals uijt is the disturbance
The lower value of ijγ will be interpreted as the closer bilateral trade relation between
the two countries If the average value of ijγ is smaller than the average world level the
bilateral trade between the two economies is said to be ldquointensiverdquo That is they have
relatively closer bilateral trade relations with each other Besides the technological progress
that directly affect on reducing the transportation cost the progress of trade liberalization
tends to improve countriesrsquo trade relations and therefore lower the value of ijγ over time
When countries fully relax their restrictions on trade (as the situation would be with respect to
trade within the same country) bilateral trade may only be constrained by the transportation
cost related to the geographic distance
23 The panel data framework
The term ldquopanel datardquo refers to the pooling of observations on a cross-section of
households countries firms etc over time periods Econometrically a panel data regression
is different from either cross-sectional regression or time series regression Variables in a
regression equation of panel data normally have two subscripts one denotes the time period
while the other denotes the different objects (countries individuals) of analysis We can write
this as
acutei t i t i tY C X uβ= + sdot + i = 1 sdotsdotsdotsdotsdotsdot N t = 1 sdotsdotsdotsdotsdotsdot T (3)
where the subscript i denotes the section t denotes the time period Furthermore in order to
use a one-way error component model for the disturbances we need to decompose the last
term uit as
i t i i tu vmicro= + (4)
8
where imicro denotes the unobservable individual specific effect and i tv varies with individuals
and time which can be thought of as white noise The most significant advantage of this
formulation is that we are able to capture the individual propensity on trade for each pair of
trading partners
The two most popular models of panel data are fixed-effect model and random-effect model
Eisenhart (1947) distinguished the two models into ldquoclass Irdquo and ldquoclass IIrdquo Scheffeacute (1956) defines
ldquoclass Irdquo as fixed-effect model and ldquoclass IIrdquo as random-effect model Theoretically ldquofixed-effectrdquo
model applies to determine the existence of true differences among the estimated mean of section-
specific errors while the latter is used for the analysis on variant components since all effects are
assumed to have zero mean The ldquorandom-effectrdquo is therefore a more restrictive model than the ldquofixed-
effectrdquo In practice we normally apply Hausman-type specification test to evaluate the consistency of
the estimates from random effects models and therefore to select fixed-effect versus random-effect
model Briefly speaking the Hausman test is essentially a test of the hypothesis that random effects
would be consistent and efficient Under the null hypothesis the random-effect estimators are
consistent and efficient otherwise it is inconsistent the fixed-effect estimators are always consistent
but only efficient when the null hypothesis is rejected
24 To derivate BTR index from bilateral trade flows
Imaging that policy frictions can affect a countryrsquos bilateral trade flow through their
impacts on the geographic distance the economic distance (EDij) can be defined as
geographic distance (Distij) multiplied by a parameter A which essentially reflects the relative
degree of bilateral trade liberalization
EDij=ADistij (5)
Accordingly a revised version of gravity equation looks like
( ) ( )( )
j ji i
ij
i j i jij t
ij ij
GDP GDP K KTrade
A Dist
α βα β
χ
sdot sdot sdot=
times (6)
9
To estimate equation (6) in the logarithm form using the fixed effect model as equation (7)
illustrates one can get
^
ij ij^
ijijij
exp vBTR = A
Dist
⎛ ⎞χ⎜ ⎟⎝ ⎠= when combining it with equation (2)
^
ij
log( ) log log log log
log( ) log(A )
ij t i i t j j t i i t j j t
ij ij ij ij ij t
Trade C GDP GDP K K
Dist v u
α α β β
χ χ
= + sdot + sdot + sdot + sdot
+ sdot + sdot + + (7)
The smaller value of BTRij hints the higher degree of market openness of country i to country
j Furthermore BTRij lt1 can be interpreted as a signal of ldquopro-traderdquo effects of bilateral trade
policy that encourage country i to import more from country j while BTRij gt1 is a signal of
ldquoanti-traderdquo effects showing the additional cost of country irsquos import from country j due to
political frictions
3 Debates on East Asian regional integration
Fujita (2005) argues that Asian regionalism as well as that in America and Europe seems to
be part of the recent globalization of the world economy Due to the continual reduction in
transportation costs the world economic activity is relatively concentrated into these three
regions Of these East Asia is indeed the fastest growing East Asian ldquohighly integrated
manufacturing systemrdquo allows the region to play as an ldquoexport platformrdquo in the global
economy He points out that the neutral integration in East Asia has reached such a ldquocritical
stagerdquo that a region-wide institutional scheme might be necessary to promote further
integration in Asia This is agreed by Watanabe (2006) who believes that East Asian
countries are working to setup more government-level agreements to enforce their de facto
market-driven integration founded on a common production bases across the region Kuroda
(2006) shares this opinion but extends it to pan-Asian integration He expects to see a ldquomulti-
track and multi-speed approachrdquo to pan-Asian integration of which some countries would
ldquoplay a leadership rolerdquo
10
Kawai (2004) tries to explain the logics behind various initiatives for institutional
cooperation from three aspects First of all he points out East Asian countries have long
enjoyed ldquomarket-drivenrdquo integration through trade and foreign direct investment On one
hand intra-regional trade as a share of East Asiarsquos total trade has reached 54 percent in 2003
which has exceeded that of NAFTA On the other hand mainly via foreign direct investment
regional production networks and supply chains have been set up by locating different sub-
processes in various countries in Asia Secondly Asian countries are now facing challenge
from the EU and NAFTA in global market It is more urgent to secure an integrated market in
a regional scope especially when multilateral trade negotiation is at an extremely slow pace
Finally the Asian financial crisis gave Asian countries a lesson on the importance of regional
monetary and financial cooperation It made many East Asian countries realize the lack of
capacities to meet global challenges individually (Kim 2004) Because of the slow pace of
multilateral trade liberalization they move toward regionalism as an alternative to
synchronize regional economy in global competition These three drivers are summarized by
Stubbs (2002) into three terms - the ldquolong term regional trendsrdquo ldquocompetitive regionalismrdquo
and ldquothe Asian economic crisisrdquo
Yamazawa (2001) emphasizes that Chinarsquos entry to WTO and emerging move toward
regional free trade agreements might motivate other Asian countries to go for deeper
integration China is currently the second biggest economy in the region behind Japan As one
can see it has established close trade relations with its neighbors especially Korea and some
key member states of ASEAN who are also important trade partners with Japan Historically
Japan seemed to be reluctant in leading the progress of East Asia regionalism It may be when
China showed its interest in the regional integration did Japan adjust its strategy and turn in an
active negotiator on free trade agreements To some extent the term ldquocompetitive
11
regionalismrdquo may refer to not only the competitiveness among the three big blocs but also
that within East Asia
As Fujita (2005) comments hellip the economic integration of East Asia has been attained
mostly through market mechanismshellip However now East Asia has reached a critical stage
such that for a further promotion of regional integration developing region-wide political
institutions is indispensable As East Asian regionalism seems to be initiated by the market
itself rather than any top-to-bottom arrangement one important reason for East Asian
countries to accelerate their paces of trade liberalization might come from the appreciation of
a deeper integrated economy that is desired by the market Consequently it is possible that the
community building of Asian regionalism would be closely related to those intra-regional
linkages that already play the fundamental role on shaping the ldquoneutralrdquo integration of the
regional economy
Different from NAFTA where the US could be an is unambiguous leader and from
EU which is well institute-constructed the situation in East Asia is rather intricate partially
because of economic gaps among member nations plus the lack of an effective super-national
institution or an overwhelming leader in the region The existence of two big economies in the
region Japan and China makes it hard to predict the direction of the regional integration in
East Asia It seems that neither the experience of EU nor that of NAFTA could be directly
cloned in East Asia First a well-organized intergovernmental structure is one of the
significant characteristics of EU-type integration which is almost impossible to be repeated in
Asia East Asian countries are so different from each other in their stages of development For
instance their GDPs range from 26 billion US dollars per year (Lao PDR) to about 5 trillion
US dollars per year (Japan) 2 and their populations range from 04 million (Brunei) to 13
2 The data is statistics of year 2005 Data source The World Bank online WDI database httpwebworldbankorgWBSITEEXTERNALDATASTATISTICS
12
billion (China) It might not be an easy task to bring East Asian countries together under an
intergovernmental institution such as that of EU where there is one vote per nation
Second the NAFTA type of integration might be applicable but needs to be employed
by East Asia under preconditions Though a balanced situation without hegemony in the
region seems to be more welcome by most Asian countries there are at least thirteen
countries (ASEAN+three) in the region that might be included into the integrated regional
circle That means a network composed of at least 78 bilateral FTAs is necessary if trade
liberalization is done bilaterally The modest condition to make the NAFTA type available is
that the ten ASEAN countries should speak in one voice like an integrated economic unit In
that case maybe only six bilateral trade agreements (between Japan Korea China and
ASEAN) are enough to cover an integrated network of East Asian economies Therefore one
precondition to transplant NAFTArsquos experience will be the deeper integration of ASEAN
countries Another ldquohard-to-deal-withrdquo issue might be to harmonize Japan and China
Probably that is why the initiative of ldquoASEAN plus threerdquo3 (ASEAN plus Japan Korea and
China) has received so much attention since its first summit
Indeed since the geopolitics of East Asia is quite different from that in Europe or North
America it is quite reasonable to see that East Asia will find its unique approach to
regionalism based on its de facto region-wide integrated economy that is generated by the
market mechanism Basically any approach to the community building of East Asia would be
ldquoacceptablerdquo as far as it could meet three principles - openness equality and evolution4
3 It is an informal group whose formation was motivated by the East Asian crisis It does not have its own secretariat but meets at the invitation of ASEAN The first meeting of the group occurred in December 1997 4 It is so called ldquoopen regionalismrdquo (Bergsten 1997 and Drysdale et al 1998) Openness required non-discrimination and transparency in trade and economic policy as well as in diplomatic stance Equality implied that activities needed to be of mutual benefit to all participants and recognized the rapid transformation in the structure of economic and political power taking place in the region And the evolution of the process of regional cooperation recognized the importance to success of a gradual step-by step pragmatic and sustained approach to economic cooperation based on consensus building and voluntary participation
13
In a series of papers Baldwin (2003a 2003b 2005 2006) comprehensively analyzes
regionalism in a ldquohub-and-spokerdquo framework and suggests East Asian regional integration to
be in the ldquobicyclerdquo formation He concerns about the underlying connection between trade
liberalization and industrial relocation that is theoretically founded on New Economic
Geography (NEG)5 NEG discovers interactions between trade policy and industry relocation
across country borders in theory Briefly speaking though trade liberalization can increase the
overall welfare it is not guaranteed that all the participant countries can be better off because
the consequential cross border industry relocation might bring about long term impacts on the
economy Throughout the process of the market integration policy makers from each party
might be required to choose appropriate trade policies and implement the appropriate
strategies when shaping the picture of trade liberalization Even a temporarily inappropriate
policy might lead to the unrecoverable welfare loss at the end
One reason is that trade liberalization will allow producers to reconsider their business
under the circumstance of an integrated market instead of several fragmental markets The
markets can be easily fragmented when trade barriers are high Some producers choose to
produce in big markets simply because of the larger demands while some others choose small
markets where competition is relatively less intense The removal of trade barriers will
however make big markets more attractive to producers because industries may find it more
profitable to base their productions in big markets From these they supply to the host market
directly and export to markets that are relatively small under free trade There are three key
advantages of locating in big market First given demands from the whole free trade zone
sales to the domestic market can bring about higher markups than exports to foreign countries
because of the existence of transport costs Second to be located close to upstream and
downstream partners will help firms increase their efficiency Third though the competition
5 The theory of NEG is initially raised by Krugman (1991) and later enriched by others such as Fujita et al (1999) and Baldwin et al (2003)
14
effect in big markets will reduce firmsrsquo profits by lowering the industry price index in the
long term the equity of real wages decreases nominal wages in big markets as price declines
Baldwin (2003a) refers the lsquohub-and-spokersquo pattern as a possible outcome of regional
trade liberalization where one or few nation(s) become the center of the regional economy
because the relatively bigger market size(s) or the better initial conditions of trade facilities at
the starting point might be able to attract more industries to move in at the cost that the
markets of other economies in the region will shrink when eliminating the border barriers
Intuitively one may define the core economy in the regional free trade zone as lsquohubrsquo and title
the others lsquospokesrsquo Moreover the formation of the ldquohub-and-spokerdquo pattern will be a self-
enforced process It will be hard to be revised once it gets started in forming driven by the
market mechanism Because of this possible outcome of free trade policymakers need to set
up their policies carefully lest domestic economies be marginalized as a result of regional
trade liberalization Generally speaking there will be at least three advantages to be a ldquohubrdquo
rather than a ldquospokerdquo in the integrated regional economy First as many industries will
agglomerate into the hub nation the hub-based firms could be more efficient and more
competitive A ldquohub-and-spokerdquo formation might favor industries in the hub nation at the cost
of industries in the spoke nations Second most new investments will choose to flow into the
hub nation because the investors would normally find more potential in the big market(s)
Such decisions may meanwhile re-enforce the advantages of the big market(s) Last but not
the least the self-enforced agglomeration will lead to a one-way process of industry
reallocation in the region - lsquoOnce a particular location gets a head start it may be extremely
difficult for other regions to catch up as investment deterring effects of the current hub and
spoke system may have consequences that last far beyond the termination of that systemrsquo6
6 See httpwwwrietigojpeneventsbbl03013101html
15
East Asian economies seem to be looking for institutional scheme to deepen the initial
market-led regional integration in the last decade For most of them it might not be a good
idea to apply the laissez- faire policy as trade liberalization that is purely directed by the
market mechanism might drive them to the ldquospoke traprdquo Instead the analysis of the possible
ldquohub-and-spokerdquo formation might be helpful for them to better design their approach towards
a more integrated region
4 To picture the pattern of East Asian regional integration
41 The intensity of intra-regional trade in East Asia
A starting point is to demonstrate the existence of the intensive intra-regional trade among
East Asian economies using the gravity model containing augmented with dummy variables
The regressions are based on 87 countriesrsquo bilateral trade data in year 2001
log( ) log log log log log( )ij t i i t j j t i i t j j t ij ij ij tTrade C GDP GDP K K Dist Dummy uα α β β γ η= + sdot + sdot + sdot + sdot + sdot + sdot + (8)
The definitions of dummies used in the estimation are listed below
Variable Definition DUMMY_East Asian countries as the importers
The value equals 1 if the importer is from East Asia otherwise the value is 0
DUMMY East Asian countries import from non-East Asian countries
The value equals 1 only if the importer is from East Asia but the exporter is outside the region otherwise the value is 0
DUMMY_East Asian countries as the exporters
The value equals 1 if the exporter is from East Asia otherwise the value is 0
DUMMY East Asian countries export to non-East Asian countries
The value equals 1 only if the exporter is from East Asia but the importer is outside the region otherwise the value is 0
DUMMY_ East Asian countries trade with each other
The value equals 1 only if both the importer and the exporter are from East Asia otherwise the value is 0
[Table 1 about here]
Each coefficient in the logarithmic function essentially represents the elasticity of the
corresponding independent variable on the bilateral trade flow We first run the OLS
regressions All the coefficients have the expected signs and at high level of significance in
statistics Column (1) shows the estimators of the basic equation while the estimation shown
16
in columns (2) to (5) include the dummy variable(s) to measure the specific effect on trade of
East Asian countries As that the gravity model suggests both the export countryrsquos and the
import countryrsquos GDPs have significantly positive impacts on the bilateral trade flow which
is at the same time discouraged by geographic distance The effect from the countriesrsquo GDP
per capita is not always significant and stable however The coefficient of the dummy in
column (2) equals 057 showing that East Asian countries are more open to imports in
comparison to most of the countries in the world given the assumption that the other factors
have the identical impact on cross border trade In 2001 East Asian countries import about
77 more than the volume predicted by gravity equations On the other hand East Asian
countriesrsquo export almost three times as much as the worldrsquos average level given the same
factors These findings reflect that East Asian economies in general rely much more on
international trade than other countries worldwide Given the similar economic and
geographic conditions trade between two East Asian countries is around 23 times higher
than the trade flow between two countries outside East Asia The net trade ldquobiasrdquo within the
region listed in Column (5) measures the real intra-regional trade preference more precisely It
shows that given the same trade conditions the import between two East Asian countries is
about twice as great as the average import from a country outside the region On the other
side East Asian countries also export more (25 more) to each other than their exports to
those partners outside the region
However the OLS regression (whether or not considering fixed effects) on the gravity
equation has been criticized for its inconsistent estimators due to the presence of
heteroskedasticity One possible solution is to follow Santos Silva and Tenreyrorsquos (2005)
approach to apply Poisson pseudo-Maximum Likelihood method to obtain the consistent
estimators of the gravity model
17
One could see the inconsistence of OLS estimation from some basic algorithms In the
traditional logarithmic form of the gravity equation we have ln(Yij)=β0ln(A)+βiln(Xi)
+βjln(Xj) +β1ln(Xij) where Yij denotes bilateral trade between country i and j Xi and Xj
denotes country specific factors of i and j respectively and Xij denotes the ldquocommonrdquo factors
between them such as geographic distance Transforming the equation above we have
Yij=exp[β0ln(A)+βiln(Xi) +βjln(Xj) +β1ln(Xij)] (9)
The corresponding conditional expectation in general term is E(Yij brvbar Xi Xj Xij) The
individual observation can therefore be presented as yi=E[yibrvbarxi]+εi = exp[xiβ]+εi More
precisely the logarithmic function for the regression is
ln(yi)= xi β + ln(ηi) where ηi=1+ εi exp(xi β) (10)
The OLS estimators on this equation are consistent only when the second term on the
right hand side ln(ηi) is statistically independent from xi In order to eliminate xi from the
function of ηi we need to find a random variable vi that is independent from xi and meets the
condition vi=εi exp(xi β) which implies a very specific condition on the error term
Furthermore when the error term and explanatory variables are independent the conditional
variance of yi should be proportional to exp(xi β) However because of yi isin[1infin ) the
variance of yi tends to be closer to zero as the value of yi approaches its lower bound while
the deviations from the conditional mean of yi will go up when yi is moving to the opposite
direction It is therefore not realistic to assume that the conditional variance V[yibrvbarxi] in the
OLS estimation is proportional to exp(xi β) Therefore the OLS estimators on the log-linear
model tend to be inconsistent
Though the alternative non-linear least squares (NLS) method could be used to resolve
the problem of inconsistence Santos Silva and Tenreyro (2005) shows that the NLS
estimators are normally inefficient In NLS β =arg 2i ib
min [y - exp(x b)]sdotsum which implies
the first order condition sum ˆ ˆi i i i[y - exp(x )] exp(x ) xβ βsdot sdot sdot sdot =0 The inefficiency comes from the
18
fact that the equations might be weighted more on those observations with larger value of the
second term ˆiexp(x )βsdot To improve the efficiency of NLS estimators one needs to
identifyassume the specific form of the conditional variance instead of assuming the
conditional variance to be constant The beauty of the Poisson pseudo-Maximum likelihood
(PML) estimation is that it assumes the conditional variance as proportional to the conditional
mean and takes into account the non-negative feature of yi The disturbance from the large
conditional mean ˆiexp(x )βsdot will be offset by corresponding larger conditional variance
Holding the assumption that the conditional variance V[yibrvbarxi] is proportional to the conditional
mean E[yibrvbarxi]= exp(xi β) we estimate the parameter β by solving the first order condition
sum ˆi i i[y - exp(x )] xβsdot sdot =0 Moreover Gourieroux Monfort and Trognon (1984) shows that the
function does not even have to be Poisson distributed or to be an integer As long as the
appropriate function of E[yibrvbarxi] is defined the estimators of PML will be consistent and
efficient
The second part of Table 1 prints down the results based on PML regressions The
coefficients of the dummy variables in all regressions are positive and significant in statistics
It shows that East Asian economies trade much more than the worldrsquos average level (around
60 more in imports and double in exports) Under the same conditions trade between two
East Asian countries is much more intensive than that between an East Asian country and its
trade partner outside the region (95 higher in imports and 43 higher in exports) In short
either OLS or PML estimation show the existence of a de facto regional trading bloc within
East Asia Intra-regional trade between East Asian countries is more intensive than the
worldrsquos average level from either the aspect of imports or that of exports
At the first glance all coefficients in the estimations on Equation (8) have the expected
signs Most of them are at high level of significant in statistics As that Gravity model
suggests both the export countryrsquos and the import countryrsquos GDPs have significantly positive
19
impacts on the bilateral trade flow which is on the other side discouraged by geographic
distance The effect from the countriesrsquo GDP per capita is also positive but not always at high
level of significant in statistics The coefficient of the dummy in column (2) equals to 046
which means East Asian countries are in general more open to imports in comparison to most
of countries in the rest of world given that the other factors have the identical impact on cross
border trade In 2001 East Asian countries import about 58 more than the volume predicted
by gravity equations The exports from East Asian economies are also more intensive ndash as it is
shown in column (3) they export almost double as the worldrsquos average level The ldquonetrdquo
relative intra-regional trade intensity of East Asian economies is evaluated by the estimation
that present in Column (5) Given the same trade conditions the imports of one East Asian
economy from another East Asian economy will be about twice as much as the imports from
its extra-regional partner country meanwhile the exports between the two East Asian
economies will also be over 40 more than the average exports from one East Asian
economy to another country that is outside the region
42 The de facto bilateral trade relations and the economic distance between East Asian economies
It is further assumed that countries i and j will normally treat each other reciprocally
and therefore the bilateral trade relation between them could be symmetric That is
BTRij=BTRji Since one countryrsquos import from country j is not only affected by its own import
policy but also by its trading partner country jrsquos export policy one might image the bilateral
trade relations are the ldquopoolrdquo of both countriesrsquo import and export policy In practice it might
not be easy to distinguish their different effects on the bilateral trade Accordingly the
economic distance is calculated based on the definition ij jiED ED= = ij ij ji jiBTL Dist BTL Distsdot = sdot
[Table 2 about here]
[Table 3 about here]
20
Table 2 and Table 3 show the symmetric BTR index and ldquoeconomic distancerdquo between
major Asia-Pacific economies As expected BTR index could either ldquoprolongrdquo or ldquoshortenrdquo
the geographic distance between countries Since BTR index measures the de facto bilateral
trade relations in relative terms the comparison of countriesrsquo bilateral trade relations across
different pairs of countries would not be affected by the functionrsquos specification although it
might be systematically affected by the accuracy of the geographic distance7 The results
shown in Table 2 reaffirm trade orientation of East Asian countries The generally low value
of BTR index reflects a rather freer intra-regional trade environment in East Asia in
comparison to the worldrsquos average level Taking the fact that there is so far no formal
institutional integration in the region it is also evident of the de facto regional integration that
is driven by the private sectors East Asian economies might have strengthened their
interdependence via intensive intra-regional trade facing the global competition
Table 3 shows the observed economic distance between each country taking into
account both natural and political factors In combination of Table 2 and Table 3 one could
have four key observations First the six major ASEAN member statesmdashIndonesia Malaysia
Philippines Singapore Thailand and Viet Nam are not only geographically but also
economically close to each other In addition to the short geographic distance that facilitates
their bilateral trade the political interests of economic integration might also have shown the
influences on tightening their economic connections via the cross-border exchanges of
commodity and services
Second the observed economic distance between China and Korea is just about 15 of
either that between Japan and China or that between Japan and Korea The bilateral trade
7 The estimate of BTR might be lower (or higher) than its real value when the geographic distance used is over (or under) estimated Generally speaking it might be less accurate for those countries with big geographic size than for small countries For instance in reality most of the exports from China to Malaysia should be shipped out from GuangZhou harbor which is much closer to Malaysia than that of its capital However in this dataset the distance between Beijing (the capital of China) and Kuala Lumpur (the capital of Malaysia) was still used to proxy the transportation between the two countries The artificial magnification of the transportation distance leads to an estimator of BTR index that is under-estimated
21
between China and Korea has been going rapidly since 1990s China has overtaken the US
and Japan to be the biggest trading partner of Korea while 15years before China was just the
seventh biggest export market of Korea Besides the fast growth of both countriesrsquo economic
sizes the facilitation of bilateral trade seems to be one of the significant factors in explaining
such an expansion of bilateral trade
Third trade costs between China and the main ASEAN countries seem to be quite low
generally In history the main economies in ASEAN have played significant roles in the start-
up phase of the development of Chinese economy There were a large number of Chinese that
immigrated into Indonesia Malaysia (Singapore) and Philippines in the late 1800s and early
1900s These people and their offspring are often called ldquoNanyang Huaqiaordquo (ldquooverseas
Chinese in Southeast Asiardquo) Based on the statistics as compiled by the Overseas Chinese
Affairs Commission of the Republic of China there are in total about 40 million Overseas
Chinese worldwide Sixty percent of them are living in ASEAN countries Indonesia (19)
Thailand (18) Malaysia (16) Singapore (7) and Philippines (3)8 Though Overseas
Chinese is still minority population in most of these countries (except in Singapore) their
economic influences are quite significant in the local economies It is generally believed that
Overseas Chinese are the bridges between China and most of Southeast Asian countries
Indeed the majority of foreign investments came from Overseas Chinese in Southeast Asia in
the first 10-15 years after China implemented its ldquoopen doorrdquo policy in 1979 It would be
quite reasonable to say Overseas Chinese have played some fundamental roles in
strengthening connection between China and most of ASEAN countries
Albeit the value of BTR index between Japan and its partners is on average higher in
comparison to that between other East Asian countries it is generally9 less than one meaning
Japan still applies ldquotrade-promotingrdquo rather than ldquotrade-resistingrdquo policy to its neighbor
8 The percentages in the brackets represent the share of the total population of Overseas Chinese in the world 9 It is except that with New Zealand and that with Vietnams
22
countries in Asia Even though it seems that trade cost with Japan is relatively high Japan is
undoubtedly one of the most important trading partners to most East Asian economies The
gravity equation shows that international trade is not only determined by trade cost but also
the participantsrsquo economic sizes As the biggest economy in the region the GDP of Japan is
still about four times of that of China the second biggest country To some extent one might
image the ldquomega-sizerdquo of Japanese market could compensate its relatively closed economy
and thus the relatively ldquolongrdquo economic distance between Japan and other Asian countries
43 The relative market importance
Besides the comparison of the bilateral trade relations and the economic distance
between East Asian economies one might also need to evaluate the relative market
interdependence when filtering the individual ldquohubrdquo candidate(s) from the economic
perspective One may set up two criteria of the ldquohubrdquo candidate(s) first its market size is big
enough second it is open enough to allow other countries to access to its market To some
extent these two conditions are allowed to compensate with each other In practice Baldwin
(2003a) applies the HM index (ldquoindex of Hubness-Measurerdquo) to describe the ldquoEast Asian
bicyclerdquo of which Japan plays as the hub of the bigger wheel while China is the center of the
smaller wheel The formula to calculate this index is
HMB = XAB middot (1-MBA) (12)
where HMB measures the lsquohub-nessrsquo of country B to country A XAB denotes the exports from
A to B as a share of country Arsquos total exports MBA denotes country Brsquos imports from A as a
share of its total imports The value of HM ranges from zero to one of which the closer the
value to one the deeper the relative dependence of country Arsquos exports on country Brsquos market
[Table 4 about here]
In Table 4 the number in the bracket ranks the importance of the markets The number
ldquo1rdquo means the most important market to the country the number ldquo2rdquo means the second most
23
important market while the number ldquo9rdquo means the most ldquoignorablerdquo market For instance the
HM index of China to Japan is 768 percent the number ldquo1rdquo between the brackets indicates
that to Japan Chinese market is generally more important than that of any other East Asian
economies while from Chinarsquos standing point the HM index of Japan is 1272 percent
meaning Japan is also the most important market to China within the region For each
individual country the ldquooverall rankrdquo is calculated by simply summing up their ranks in each
row The country with the lowest value of ldquooverall rankrdquo will be concluded as the most
important market in the region In this case Japan and China are the two most markets in the
regional to most of Asia-Pacific countries
44 Japan and China as the two individual ldquohubrdquo candidates
Based on the both HM index and BTR index the first argument of this paper is that
Japan could be an individual ldquohubrdquo candidate in Asian regionalism It might not be rational
for other Asian economies to be alleviated from Japanese market which is so big in either the
absolute term or the relative term even though the values of BTR indexes hint that the
negotiation with Japan might not be as easy as that with some other more open economies
(Singapore for instance) In other words the benefits from accessing the Japanese market may
drive other countries to input more resources into the free trade negotiation with Japan
However unlike the US in North America Japan is not yet the overwhelmingly dominant
economy in the region from the aspect of market independence The US and EU are very
important external markets to East Asian countries Economically they might be able to affect
the process of East Asian regionalism to some degree despite that their roles in East Asia are
far less significant than that in the western hemisphere (Baldwin 2005) Fujita (2005) points
out that East Asia seems to be a multi-cored economy from the dimension of economic
geography Although Japan is still the most important market in the region for most of its
Asian neighbors it faces challenges from China who has grown so fast to compete for the
24
leadership of the regional economy Moreover China seems to have made much more
progress in regional trade liberalization than Japan since its entry to WTO It might be quite
questionable that Japan could keep its position without actively participating in the process of
regional integration
[Table 5 about here]
Second China might be a second ldquohubrdquo candidate in the region In relative terms China
is already the most important market in Asia for the other two big economies Japan (the
worldrsquos second biggest economy) and Korea (the worldrsquos eleventh biggest economy) In
particular China provides a most important market for the exports from Korea meaning that
Korea might give China more weight than Japan (or at least as much as that Japan has) when
considering to liberalize bilateral trade relations Furthermore in addition to its close relation
with ASEAN as that BTR index shows HM index illustrates the high degree of ASEAN
countriesrsquo reliance on Chinese market especially Singapore and Malaysia
Third the role of ASEAN may be outstanding when considered as a de facto sub-
regional integrated economic unity From Korearsquos standing point the whole market of
ASEAN is slightly more important than that of Japan while on the side of Japan the market
of ASEAN is indeed far more weighed than that of Korea In comparison to the minor
position in the case that they play individually it might be more beneficial for ASEAN
members to move synchronically as a group when liberalizing trade relations with other
countries Furthermore the indicators suggest Singapore and Malaysia to be a ldquounitedrdquo sub-
regional hub within ASEAN Singapore has a very open economy the free trade policy and
advanced trade infrastructure ensures its position as one of the major hubs of ocean
transportation Malaysia and Singapore and Malaysia are geographically close to each other
They have long historical connections (as Singapore used to be part of Malaysia before
25
WWII) Malaysia plus Singapore will give them a total GDP that is larger than Indonesia the
biggest economy in ASEAN
Forth on the level of aggregate trade the two Oceania countries are closely related to
East Asian economies especially Japan About 20 percent of exports from Australia go to
Japan which is double the overall flow to the US and 50 percent more than the total exports
to the EU For both of them Japan may be the first country in East Asia they consider about
when liberalizing trade bilaterally
45 The ldquoeconomic maprdquo of East Asian regionalism
To sum up one can image an ldquoeconomic maprdquo of the market-led integration in East Asia
where Japan may stay in the center of the regional trading bloc in terms of the market
importance and the economic distance Singapore plus Malaysia might play as the hub
connecting all the other ASEAN members Figure 1 shows that Japan holds a vital position in
Asian regional trading bloc Even though China is catching up as the second biggest market in
the region it seems that Japan is undoubtedly the biggest open market in the region and in
consequence one of the greatest exports destinations to most of the Asian countries
[Figure 1 about here]
46 The fundamental arrangement(s) of East Asian regionalism
Generally speaking there is so far not a single FTA or FTA under negotiation seems to
have grasped the lsquouniversal gravitationrsquo to all the countries in the region The lsquowild firersquo of
Asian regionalism may refer to a situation where countries are running out to initialize their
own FTA but no one is willing to join those agreements set up by others It is well
understood that ASEAN members are relatively too small in economic size individually It
may be better for them to move together to negotiate free trade with other countries They still
26
need to seek either China or Japan as their initial ally in order to generate a united market
large enough to persuade other countries to join the agreement
China seemed to have moved from a passive participant in regionalism to an active
promoter of regional trade liberalization after its entry to WTO China signed a FTA with
ASEAN in late 2004 (CAFTA) which is supposed to create the most populous FTA in the
world ndash with over 17 billion consumers and a total GDP of nearly 2 trillion US dollars
Compared to the progress of Japan-Korea free trade negotiation the negotiation between
China and ASEAN started later but reached the agreement earlier This may make the
Japanese government feel under pressure to participate into the process of regional trade
liberalization Indeed Japan accelerated a series of FTA negotiations with individual ASEAN
members when CAFTA was publicly announced It has signed agreements (or has started
formal negotiations) with main ASEAN members (Philippines Malaysia Thailand and
Indonesia) In the context all these FTA or FTA under negotiations will be loosely called the
Japan-ASEAN FTA (JAFTA) for the simplicity
In principle it seems either the CAFTA or the JAFTA seems to be capable of giving
birth to a market that is big enough to marginalize the economies outside the arrangement
Though it might still be difficult to predict which one of the arrangements would be more
appealing the fact that the former is already in its position plus Korearsquos de facto trade
reliance on China may persuade more weigh to be put on CAFTA The substantive
provisions of the China-ASEAN FTA will implement zero tariffs on bilateral trade in ten
years As one can witness Japan Korea Australia and New Zealand are now talking to either
China orand ASEAN for an FTA The rationale behind the scene is that once there is a
dominant market generated by FTA in the region the risk to be an ldquooutsiderrdquo would be more
and more costly along with the progress of regional trade liberalization
27
From the perspective of Japan the CAFTA seems to be last FTA that it would like to
see The complementarities of Japan and China are rather apparent the former is capital
abundant labor expensive but resource scare while the latter has the largest population and
the third largest territory in the world Historically Japan might have ldquoenjoyedrdquo treating
China as one of its ldquoproduction basesrdquo in East Asia As Japan is shifting its economy to high
value-added service-focused industry it outsources more and more fragmented
manufacturing processes to China One of the typical routines is that it exports high-tech
intensive or capital-intensive parts and components to China and finishes those labor-
intensive procedures there The cheap labor cost in China may guarantee the competitiveness
of Japanese products in the global market Japan has been Chinarsquos biggest trade partner for
ten years while China is currently Japanrsquos biggest partner as well An FTA between China and
some other nations would probably pose negative impacts on Japanrsquos exports either via the
direct trade diversification effect or by weakening its competitiveness because China will not
only import more final goods from those countries having FTA with it but also buy more
intermediate goods from those preferential partners
However Japan may receive supports from the two Oceania economies -Australia and
New Zealand who are strongly Asia-oriented and depend on East Asian markets deeply
Being excluded from East Asian regional integration may cost them much In comparison
with the other participants Australia and New Zealand are at an inferior position
geographically but they try to compensate this disadvantage by unilaterally lowering trade
barriers It has been for a long time that Japan provides them the biggest market in East Asia
To either of them a joint deal with Japan may be an ideal choice to engage more deeply into
Asian regional integration
Similarly Korea will not be happy to see an FTA between China and another nation
party without its participation typically CAFTA As seen above Korearsquos export industries
28
depend on the Chinese economy (195 percent) much more deeply than on the Japanese
market (88 percent) China is currently the largest market for Korea while ASEAN is the fifth
The implementation of the CAFTA will generate the worldrsquos most populous market The
preferential treatment between China and ASEAN would very likely diversify Korearsquos
original exports to either of the markets More seriously effects of market agglomeration will
not only force more industries to relocate in China-ASEAN free trade zone but also diversify
foreign investments away from Korea In order to avoid these negative effects Seoul might
choose either to join the agreement early or to contend with it by initiating for instance its
own FTA with Japan
After concluding an agreement with China in 2004 ASEAN seems to be a focus of East
Asian regionalism as Japan Korea Australia and New Zealand rush in for an FTA By early
2005 all of them announced that they were going to open free trade negotiations with
ASEAN (Asia Monthly 2004) In order to play a role as a real nucleus of Asian regionalism
ASEAN must first of all realize a single market or at least a highly integrated market among
its ten member nations The integration is not easily achievable however due to the wide
difference in economic development among its members
5 Concluding remarks
This paper explores a new approach to evaluate the de facto trade liberalization in quantitative
by producing the BTR index In combination with the HM index that measures the relative
market importance the calculation of the BTR index and the ldquoeconomic distancerdquo makes it
possible to quantitatively compare the de facto bilateral trade relation between East Asian
countries in relative terms It opens another door to monitor the progress of economic
integration from the aspect of international trade in an intuitive way
Applying the BTR index into the study on East Asian regionalism the study from the
economic perspective suggests Japan and China to be the two individual ldquohubrdquo candidates
29
who may play determinant role in the regional integration ndash any fundamental arrangement of
East Asian regionalism should involve at least one of them Currently CAFTA seems to be an
agreement that may trigger domino effects of regionalism in East Asia Once it is fully
implemented it would be very difficult for the others such as Japan and Korea to keep away
from that arrangement The fear of being fall into the ldquospoke traprdquo may drive other nations to
be more active in trade liberalization which could effectively spur regional integration in East
Asia From this prospective CAFTA might be a milestone of East Asian regional integration
30
Table 1 Estimations of the de facto intra-regional trade bias in East Asia
OLS PML
_constant -2122 (0377)
-2060 (0382)
-2015 (0375)
-2114 (0377)
-1940 (0382)
-1631 (04)
-1576 (28)
-1538 (096)
-1619 (12)
-1523 (05)
GDP importer 088 (0011)
086 (0011)
098 (0011)
088 (0011)
087 (0011)
082 (0034)
080 (0042)
081 (0034)
079 (0033)
079 (0040)
GDP exporter 102 (0011)
102 (0011)
098 (0011)
102 (0011)
098 (0011)
084 (0032)
083 (0033)
079 (0030)
081 (0041)
079 (0031)
GDP per Capita importer 003 (0016)
004 (0016)
002 (0015)
003 (0015)
003 (0015)
003 (0034)
006 (0038)
005 (0035)
008 (0041)
008 (0042)
GDP per Capita exporter 002 (0015)
002 (0015)
006 (0015)
003 (0015)
006 (0015)
-012 (0055)
-011 (0055)
-006 (0045)
-007 (0054)
-005 (0047)
Distance -115 (0021)
-118 (0021)
-122 (0021)
-113 (0021)
-126 (0022)
-071 (0034)
-073 (0038)
-075 (0034)
-067 (0034)
-075 (0036)
DUMMY_East Asian countries as the importers 057
(0063) 046 (0148)
DUMMY East Asian countries import from
non-East Asian countries 066
(0067)
031 (0122)
DUMMY_East Asian countries as the exporters 102
(0058) 071 (0116)
DUMMY East Asian countries export to non-
East Asian countries 109
(0062)
062 (0131)
DUMMY_ East Asian countries trade with each
other 120
(0171) 131
(0168)
087 (0231)
098 (0236)
R2 069 070 071 070 071 087 087 088 088 088
N 8671 8671 8671 8671 8671 8671 8671 8671 8671 8671 Notes plt001 plt005 plt01 Sources Data from year 1990 to 2002 The data of GDP and GDP per capita comes from WDI 2004 the data of distance comes from CEP II geography database the bilateral trade in intermediate goods is from the calculation based on UN COMTRADE database 2004
31
Table 2 The BTR matrix for the selected Asian countries
Korea China Australia New Zealand Indonesia Malaysia Philippines Singapore Thailand VietNam
Japan 085 045 036 103 034 027 069 029 027 238
Korea 020 017 050 006 008 014 012 011 017
China 014 039 001 005 004 013 004 005
Australia 034 017 017 024 017 017 068
New Zealand 030 016 022 040 026 056
Indonesia 012 003 027 006 002
Malaysia 005 028 007 011
Philippines 023 006 009
Singapore 014 015
Thailand 015
Source Authorrsquos calculation based on UN COMTRADE database 2004
32
Table 3 The estimated economic distance between countries
Korea China Australia New
Zealand Indonesia Malaysia Philippines Singapore Thailand VietNam
Japan 980 938 2770 9836 1975 1435 2032 1520 1239 8651
Korea 188 1443 5126 296 364 372 558 403 461
China 1215 4303 73 215 120 568 133 111
Australia 784 922 1137 1494 1036 1240 5240
New Zealand 2353 1412 1846 3407 2573 5616
Indonesia 135 83 233 127 70
Malaysia 117 88 81 220
Philippines 530 130 149
Singapore 195 325
Thailand 144
Source Authorrsquos calculation based on UN COMTRADE database 2004
33
Table 4 HM matrix for the selected Asian countries
Japan China Korea Indonesia Malaysia Philippines Singapore Thailand Australia New ZealandJapan 1272 489 104 210 146 289 222 164 028
(1) (2) (8) (5) (7) (3) (4) (6) (9)China 768 316 073 117 075 185 074 114 015
(1) (2) (8) (4) (6) (3) (7) (5) (9)Korea 877 1945 186 185 166 249 110 139 019
(2) (1) (4) (5) (6) (3) (8) (7) (9)Indonesia 2071 722 714 355 135 935 182 333 026
(1) (3) (4) (5) (8) (2) (7) (6) (9)Malaysia 1067 1089 320 186 139 1314 339 220 034
(3) (2) (5) (7) (8) (1) (4) (6) (9)Philippines 1451 1036 371 058 447 681 379 100 006
(1) (2) (6) (8) (4) (3) (5) (7) (9)Singapore 697 1406 399 na 1543 227 403 261 033
(3) (2) (5) (9) (1) (7) (4) (6) (8)Thailand 1411 916 183 186 392 169 754 201 027
(1) (2) (7) (6) (4) (8) (3) (5) (9)Australia 1850 997 830 251 191 096 412 178 576
(1) (2) (3) (6) (7) (9) (5) (8) (4)New Zealand 1158 672 446 148 192 152 126 121 1983
(2) (3) (4) (7) (5) (6) (8) (9) (1)Overall ranking 15 18 38 63 40 65 31 56 49 75
Source Authorrsquos calculation based on UN COMTRADE database 2004
34
Table 5 HM index of East Asian economies on the selected markets ()
Japan China Korea ASEAN5 USA EU(a) aggregate trade
Japan 1272 489 990 2458 1395China 768 316 526 1784 1335Korea 877 1945 900 1941 1316Indonesia 2071 722 714 1601 1310 1378Malaysia 1067 1089 320 2155 2008 1217Philippines 1451 1036 371 1572 2433 1801Thailand 1411 916 183 1537 1981 1591Australia 185 997 830 1128 967 1237New Zealand 1158 672 446 738 1544 1500
Source Authorrsquos calculation based on UN COMTRADE database 2004
35
Figure 1 The ldquoeconomic maprdquo of East Asian regional integration
36
References
ADB (2006) Asian Development Outlook 2006 HongKong China Asian Development Bank
Anderson J E (1979) A theoretical foundation for the gravity equation American Economic Review volume 69 pp106-116
________ and Eric van Wincoop (2003) Gravity with gravitas a solution to the border puzzle American Economic Review 93 pp170-192
________ and ________ (2004) Trade costs Journal of Economic Literature Volume XLII pp 691-751
Balassa B (1965) Trade liberalization and revealed comparative advantage Manchester School of Economic and Social Studies 33 (May) 99-123
Baldwin R E (1994a) A domino theory of regionalism CEPR discussion paper 857
________ (1994b) Towards an Integrated Europe CEPR August 1994
________ (2003a) The Spoke Trap hub and spoke bilateralism in East Asia KIEP Discussion Paper 04-02
________ (2003b) East Asian regionalism a comparison with Europe present at ldquoStudy Group on China rdquo Policy Research Institute MOF Japan
________ (2005) Asian regionalism promises and pitfalls in Ahn CY R Baldwin and I Cheong (Eds) East Asian Economic Regionalism Feasibilities and Challenges Springer
________ (2006) Multilateralising regionalism spaghetti bowls as building blocs on the path to global free Trade NBER Working Papers No 12545
Bergstrand J H (1989) The generalised gravity equation monopolistic competition and the factor-proportions theory in international trade The Review of Economics and Statistics 67 474-481
Bergsten C F (2007a) Towards a free trade area of the Asia Pacific Policy Briefs in International Economics NoPB07-2 Peter G Peterson Institute for International Economics
Bergsten C F (2007b) China and economic integration in East Asia Implications for the United States Policy Briefs in International Economics NoPB07-2 Peter G Peterson Institute for International Economics
Bora B and C Findlay (1998) Regional integration and the Asia-Pacific Australia Oxford University Press
Bruny J C Carrere P Guillaumontx and J DeMelo (2002) Has distance died Evidence from a panel gravity model CEPR discussion paper No 3500
Carrillo C and A Carmen (2002) Trade blocks and the gravity model evidence from Latin American countries Economics Discussion Papers No 542 University of Essex Department of Economics
Cheng L K and S F Leung (1999) Aspects of Market Integration in APEC Trade Foreign Direct Investment and Labor Migration APEC Secretariat Singapore
37
________ ________ and Z Ma (2002) Revealed comparative advantages and intra-regional trade of the worldrsquos three major regions 1985-1995 International Conference on China and the World Economy City University of Hong Kong
Deardorff A V (1984) Testing trade theories and predicting trade flows in Ronald W J and P B Kenen (eds) Handbook of International Economics Amsterdam North-Holland
________ (1995) Determinants of bilateral trade does gravity model work in a neoclassical world NBER Working Paper 5377
Drysdale P A Elek and H Soesastro (1998) Open regionalism the nature of Asia Pacific integration in Drysdale P and D Vines (eds) Europe East Asia and APEC Australia Cambridge University Press
Edmonds C and J Verbiest (2002) The role of preferential trading arrangements in Asia ADB ERD Policy Brief Series
Engel C and J Rogers (1996) How wide is the border American Economic Review 86 pp 1112-1125
Ernst C (2005) Trade liberalization export orientation and employment in Argentina Brazil and Mexico Employment Strategy Papers 200515 Employment Strategy Department
Evenett S J and W Keller (1998) On theories explaining the success of the gravity equation NBER Working Paper 6529
Frankel J A D Romer and T Cyrus (1996) Trade and growth in East Asian countries cause and effect NBER Working Paper 5732
________ E Stein and S Wei (1996) Regional Trade Agreement natural or super-natural NBER Working Paper 5431
Freenstra R C J Markusen and A K Rose (1998) Understanding the home market effect and the gravity equation the role of differentiating goods NBER Working Paper 6804
Fujita M (2005) Regional integration in Asia How to be further promoted in harmony Dynamism and Uncertainty in Asia The Science Council of Japan Conference on Sustainability 2005
________ P Krugman and A J Venables (1999) The Spatial Economy Cities Regions and International Trade Cambridge and London The MIT Press
Gourieroux C A Monfort and A Trognon (1984) Pseudo Maximum Likelihood methods applications to Poisson models Econometrica 52 pp701-720
Eisenhart C (1947) Inverse sine transformation of proportions in Techniques of Statistical Analysis Paper 16 New York McGraw-Hill
Harris MN and L Matyas (1998) The econometrics of gravity models Melbourne Institute Working Paper Series no 598
Kawai M (2004) Regional economic integration and cooperation in East Asia Seminar on the ldquoImpact and Coherence of OECD Country Policies on Asian Developing Economiesrdquo OECD Paris
Kawasaki K (2003) The impact of Free Trade Agreements in Asia RIETI Discussion Paper Series 03-E-018
38
Kierzkowski H (1987) Recent advances in international trade theory a selective survey Oxford Review of Economic Policy Volume 3 1987 Oxford University Press
Krugman P (1991) Geography and Trade Cambridge MIT Press
________ (1993a) The hub effect or threeness in interregional trade in Ethier W J E Helpman and J P Neary (eds) TheroryPolicy and Dynamics in International Trade New York Cambridge University Press
________ (1993b) Regionalism versus multilateralism analytical notes in DeMelo Jaime and Panagariya Arvind (eds) New Dimensions in Regional Integration Australia Cambridge University Press
Kuroda H (2006) the statement at the IMF-World Bank Seminar on the Association of Southeast Asian Nations (ASEAN) and Pan-Asian Integration Singapore
Matyas L L Konya and MN Harris (2000) Modelling export activity of eleven APEC countries Melbourne Institute Of Applied Economics And Social Research Working Paper No 52000
Midelfart-Knarvik KH HG Overman and T Venables (2000) The location of European industry European Commission DG for Economic and Financial Affairs Economic Papers No 142
________ and ________ (2002) Delocation and European integration Economic Policy 35
Nerlove M (2002) Essays in Panel Data Econometrics New York Cambridge University Press
Porojan A (2000) Trade flows and spatial effects the gravity model revisited Discussion Papers No 0004 University of Exeter School of Business and Economics
Portes R and H Rey (1999) The determinants of cross-border equity flows NBER Working Paper 7336
Poumlyhoumlnen P (1963) A tentative model for the volume of trade between countries Welwirtschaftliches Archives 90 pp 93-99
Santos Silva J and S Tenreyro (2005) The log of gravity CEPR discussion paper No 5311
Scheffe H (1956) The analysis of variance Mimeographed Lectures University of California Berkeley
Stubbs R (2002) ASEAN plus three emerging East Asian regionalism Asian Survey Vol42 No3 pp 440-455
Tinbergen J (1962) Shaping the World Economy Suggestions for an International Policy New York The Twentieth Century Fund
Watanabe O (2006) Economic integration in East Asia and the roles of ASEAN and Japan Seminar on A New Stage of East Asian Economic Integration Singapore
Yamazawa I (2001) Assessing a Japan-Korea Free Trade Agreement The Developing Economies 39 No1

1
1 Introduction
East Asian countries have been said to be on their way towards regionalism for many years
Just as many other regional trade agreements that are mainly involved in developing
countries the institutional progress of East Asian regional integration seemed to be a topic in
the papers until the last decade The participation of Japan Korea China and ASEAN has
made it feasible that East Asian countries come together to create the third largest regional
economic entity in the world following EU and NAFTA
More than eighty regional and bilateral free trade agreements (FTAs) have been
implemented in Asia (Kuroda 2006) over half of which are signed by East Asian countries
The various degrees of liberalization and the different paces in the negotiations have made up
a dazzling network which prevents us from having a comprehensive picture on the real
process of East Asian regionalism In contrary to the EU and NAFTA it is popularly believed
that the integration in East Asia is indeed driven by the cross border connection within its
business sector instead of the formatted integration It would be an alternative for us to
understand the process and the structure of East Asian regional integration more easily based
on the observation on the de facto integration of East Asian economies rather than the one-
by-one interpretation and comparison of legal terms in agreements
However if East Asian regional integration is initiated by the market mechanism to
what extent has the market driver influenced the bilateral trade flow between East Asian
countries Is it possible to measure and compare their de facto bilateral trade relations
quantitatively Suppose the prospective institutional building in East Asia would mostly base
on this market-initiated regional integration what could be a possible arrangement of East
Asian regionalism To investigate the de facto trade liberalization in East Asia this paper
regards bilateral trade relations as parts of the policy frictions that may influence trade flows
via their impacts on trade cost and introduces a new method to measure countriesrsquo de facto
2
bilateral trade relations in relative terms by calculating BTR index (ldquoindex of bilateral trade
relationrdquo) In combination with HM index (ldquoindex of Hubness-Measurerdquo) it plans to outline
the structure of East Asian regional integration and suggest a possible approach towards East
Asian regionalism from pure economic perspectives
This paper is structured as follows Section 2 introduces method to calculate the BTR
index and the ldquoeconomic distancerdquo between countries Section 3 reviews some policy debates
on East Asian regional integration Section 4 investigates the formation of East Asian regional
integration It evaluates the relative intensity of intra-regional trade and calculates BTR index
and HM index based on which it will also image an ldquoeconomic maprdquo of East Asia Moreover
it will also evaluate the influence of China-ASEAN FTA (CAFTA) in the progress of East
Asian regional integration Section 5 concludes
2 To measure the de facto Bilateral Trade Relations
21 The logic and methodology
The basic idea to get the BTR index is to decompose the policy frictions from the gravity
model This is based on two considerations first bilateral trade between countries increases
with the expansion of economic size and contracts with the growth of the costs of trade1
Second policy frictions can play a much more decisive role on trade than natural frictions
Suppose two countries A and B hold the a priori advantages needed for opening trade with
each other (ie both of them are big economies they are adjacent they have a similar cultural
background a similar language and so on) this does not necessarily mean that they would
become close trade partners For instance if the government of country A implements extra
restrictions on trade with country B then it is very unlikely that the two countries will end up
trading at the level that a priori natural factors would suggest In this case even though
1 Since the distance between countries seems to be the primary determinant of the cost of transportation the geographic measurements are used for simplification
3
natural conditions would encourage the two countries to trade freely we may fail to observe
substantial trade flows between them because the government of country A artificially
undermined natural trading preference
Basically the determinants of bilateral trade between countries (or regions) can be
classified into two categories trade cost and partner countriesrsquo properties such as GDP
population and GDP per capita Lowering trade costs will encourage bilateral trade between
countries while increasing costs may discourage it Trade costs could be roughly grouped into
two categories One is the natural frictions typically transportation costs that are induced by
the geographic distance technology and trade infrastructure The other is the policy frictions
such as technical barriers and trade facilities Because of the non-discrimination of
multilateral trade liberalization one may regard the policy frictions as the mirror of the de
facto bilateral trade relations when comparing the relative closeness of trade partnership
between economies Since the regional integration in East Asia is market-led the policy
frictions existing in bilateral trade between East Asian countries may reflect how close the
two economies are driven by the market In the short run the policy frictions could be
regarded as the ldquofixed effectsrdquo that exist between countries on the level of bilateral trade The
estimation based on the time series could be seen as the average effects of the policy frictions
during the period under investigation
It is worthwhile to mention that just like many other empirical studies the method
presented in this paper is not totally neutral from critiques theoretically Besides those flaws
that are inherited from the gravity model the calculation of the BTR ignores the fact that the
exclusion of other factors that could affect the bilateral trade flows (such as common language
effects common border effects etc) from the estimation will lower the precision of the index
Moreover since the elasticity of economic size on international trade has been assumed to be
identical throughout the sample it is very likely that the index is biased in favor of those
4
countries whose development depends more on international trade In principle for those
countries whose trade policies are freer the value of BTR should be relatively lower than
those whose bilateral trade is more restricted by governments
22 The gravity equation
The gravity equation is chosen to pool all these trade determinants It may be one of the
most popular models used in empirical studies of international trade and migration in the last
fifteen years Historically Tinbergen (1962) and Poumlyhoumlnen (1963) independently developed it
first in a series of econometric models of bilateral trade flows (Deardorff 1984) Since then
various versions of gravity-type models were widely applied in the empirical studies Taken
from the famous Newtonian Gravity theory the equation can explain the relationship of trade
flows between countries and their geographic and economic properties quite well Similar to
the result obtained in physics which tells us that the gravity between two objects is positively
related to their masses and inversely related to the distance between them the gravity model
shows that the larger the economic size of the trade partners the higher the possible bilateral
trade flow between them while the higher the trade cost the lower the bilateral trade flow
may occur
It has been very successful empirically in fields such as the examination of bilateral
trade patterns and ldquonaturalrdquo regional trading blocs (Frankel Stein and Wei 1996) the
estimation of trade creation and trade diversion effects from regional integration (eg
Mendez and Brada 1985 Hamilton and Winters 1992 Baldwin 1994) The high degree of
flexibility of the model allows for many ldquoversionsrdquo of approaches In the study of trade blocs
there are two commonly used approaches One is the ldquodummy variablerdquo approach which was
especially popular in the last decade The simplicity of the procedure and the straightforward
results are the key advantages of the method even if it is constrained by the use of dummy
variables The other approach is called the ldquofactor endowment-based gravity equationrdquo
5
approach which essentially uses instrumental variable methods to solve a ldquomultivariate
multiplicative error-in-variable problemrdquo (Saxonhouse 1993) With a constructed tolerance
interval indicator and a given probability one can consider those observations falling outside
the tolerance intervals as signs of regional bias The large number of extreme observations
suggests that there is significant internal trade bias and the existence of a trading bloc This
method provides us with a quantitative approach to the study of trading blocs However the
conclusion may depend closely upon the tolerance interval chosen Moreover since different
factor endowments must be classified and the estimation for each sector in turn must be
performed it is relatively complex in application
Though the gravity equation is initially ldquodiscoveredrdquo in empirical studies its theoretical
foundation has also been shown by economists based on various assumption and models
After Andersonrsquos (1979) first formal attempt to derive the gravity equation under the
assumption of product differentiation many economists also tried to prove the model
theoretically via different approaches such as Bergstrand (1989) who explored the model
associated with monopolistic competition Helpman and Krugman (1985) who justified the
model based on an IRS type of model Most recently Deardorff (1995) found the gravity
model to be consistent with a wide range of trade models including the H-O model either
with frictionless or with impeded trade The differences in these theories help to explain the
various specifications and the diversity in the results of the empirical applications Anderson
and Wincoop (2003) derive a theoretical gravity equation based on the assumption of
differentiated goods from different country of original and CES utility function in which they
show that trade barriers are determinants of inter regional trade Their model also shows that
in the gravity model the effects of trade barriers are various according to the economic sizes
of trading partners
6
The gravity equation simplifies the determinants of bilateral trade between countries (or
regions) into two categories partner countriesrsquo properties such as GDP population GDP per
capita etc and trade cost of trade between partners such as transport costs tariff barriers
quotas etc Lower trade costs will encourage bilateral trade between countries while higher
costs will discourage it Loosely speaking there are two types of trade costs One is related to
ldquonatural frictionsrdquo such as the geographical distance level of technology etc and the other
is related to ldquopolicy frictionsrdquo primarily the degree of bilateral liberalization
As normal GDP and GDP per capita are used to describe a countriesrsquo economy and the
distance between the capitals of the two countries is employed to approximate ldquonaturalrdquo trade
costs It is assumed that the marginal effect of either GDP or GDP per capita on bilateral trade
is identical and that the marginal effect of distance can be magnified or shrunk by individual
bilateral trade relations
The marginal effect of each trade determinant on bilateral trade can be represented in a
gravity equation as follows
( ) ( )j ji i
ij
i j i jij
ij
GDP GDP K KTrade
Dist
α βα β
γ
sdot sdot sdot= (1)
where α β and ijγ represent the marginal effect of GDP GDP per capita(K) and distance
respectively It is assumed that α and β are identical while ijγ could vary related to countriesrsquo
bilateral trade relations That is the bilateral trade relation can influence bilateral trade flows
via its impacts on the elasticity of the geographical distance In practice equation (1) is
estimated in a logarithm form as equation (2) expresses
log( ) log log log log log( )ij t i i t j j t i i t j j t ij ij ij tTrade C GDP GDP K K Dist uα α β β γ= + sdot + sdot + sdot + sdot + sdot + (2)
where ( )log ij tTrade denotes the logarithm of total bilateral trade flow at time t log i tGDP
and log j tGDP denote the logarithm of countries annual GDP log i tK and log j tK denote the
7
logarithm of countriesrsquo annual per Capita GDP log(Distij) denotes the logarithm of the
geographic distance between the trade partnersrsquo capitals uijt is the disturbance
The lower value of ijγ will be interpreted as the closer bilateral trade relation between
the two countries If the average value of ijγ is smaller than the average world level the
bilateral trade between the two economies is said to be ldquointensiverdquo That is they have
relatively closer bilateral trade relations with each other Besides the technological progress
that directly affect on reducing the transportation cost the progress of trade liberalization
tends to improve countriesrsquo trade relations and therefore lower the value of ijγ over time
When countries fully relax their restrictions on trade (as the situation would be with respect to
trade within the same country) bilateral trade may only be constrained by the transportation
cost related to the geographic distance
23 The panel data framework
The term ldquopanel datardquo refers to the pooling of observations on a cross-section of
households countries firms etc over time periods Econometrically a panel data regression
is different from either cross-sectional regression or time series regression Variables in a
regression equation of panel data normally have two subscripts one denotes the time period
while the other denotes the different objects (countries individuals) of analysis We can write
this as
acutei t i t i tY C X uβ= + sdot + i = 1 sdotsdotsdotsdotsdotsdot N t = 1 sdotsdotsdotsdotsdotsdot T (3)
where the subscript i denotes the section t denotes the time period Furthermore in order to
use a one-way error component model for the disturbances we need to decompose the last
term uit as
i t i i tu vmicro= + (4)
8
where imicro denotes the unobservable individual specific effect and i tv varies with individuals
and time which can be thought of as white noise The most significant advantage of this
formulation is that we are able to capture the individual propensity on trade for each pair of
trading partners
The two most popular models of panel data are fixed-effect model and random-effect model
Eisenhart (1947) distinguished the two models into ldquoclass Irdquo and ldquoclass IIrdquo Scheffeacute (1956) defines
ldquoclass Irdquo as fixed-effect model and ldquoclass IIrdquo as random-effect model Theoretically ldquofixed-effectrdquo
model applies to determine the existence of true differences among the estimated mean of section-
specific errors while the latter is used for the analysis on variant components since all effects are
assumed to have zero mean The ldquorandom-effectrdquo is therefore a more restrictive model than the ldquofixed-
effectrdquo In practice we normally apply Hausman-type specification test to evaluate the consistency of
the estimates from random effects models and therefore to select fixed-effect versus random-effect
model Briefly speaking the Hausman test is essentially a test of the hypothesis that random effects
would be consistent and efficient Under the null hypothesis the random-effect estimators are
consistent and efficient otherwise it is inconsistent the fixed-effect estimators are always consistent
but only efficient when the null hypothesis is rejected
24 To derivate BTR index from bilateral trade flows
Imaging that policy frictions can affect a countryrsquos bilateral trade flow through their
impacts on the geographic distance the economic distance (EDij) can be defined as
geographic distance (Distij) multiplied by a parameter A which essentially reflects the relative
degree of bilateral trade liberalization
EDij=ADistij (5)
Accordingly a revised version of gravity equation looks like
( ) ( )( )
j ji i
ij
i j i jij t
ij ij
GDP GDP K KTrade
A Dist
α βα β
χ
sdot sdot sdot=
times (6)
9
To estimate equation (6) in the logarithm form using the fixed effect model as equation (7)
illustrates one can get
^
ij ij^
ijijij
exp vBTR = A
Dist
⎛ ⎞χ⎜ ⎟⎝ ⎠= when combining it with equation (2)
^
ij
log( ) log log log log
log( ) log(A )
ij t i i t j j t i i t j j t
ij ij ij ij ij t
Trade C GDP GDP K K
Dist v u
α α β β
χ χ
= + sdot + sdot + sdot + sdot
+ sdot + sdot + + (7)
The smaller value of BTRij hints the higher degree of market openness of country i to country
j Furthermore BTRij lt1 can be interpreted as a signal of ldquopro-traderdquo effects of bilateral trade
policy that encourage country i to import more from country j while BTRij gt1 is a signal of
ldquoanti-traderdquo effects showing the additional cost of country irsquos import from country j due to
political frictions
3 Debates on East Asian regional integration
Fujita (2005) argues that Asian regionalism as well as that in America and Europe seems to
be part of the recent globalization of the world economy Due to the continual reduction in
transportation costs the world economic activity is relatively concentrated into these three
regions Of these East Asia is indeed the fastest growing East Asian ldquohighly integrated
manufacturing systemrdquo allows the region to play as an ldquoexport platformrdquo in the global
economy He points out that the neutral integration in East Asia has reached such a ldquocritical
stagerdquo that a region-wide institutional scheme might be necessary to promote further
integration in Asia This is agreed by Watanabe (2006) who believes that East Asian
countries are working to setup more government-level agreements to enforce their de facto
market-driven integration founded on a common production bases across the region Kuroda
(2006) shares this opinion but extends it to pan-Asian integration He expects to see a ldquomulti-
track and multi-speed approachrdquo to pan-Asian integration of which some countries would
ldquoplay a leadership rolerdquo
10
Kawai (2004) tries to explain the logics behind various initiatives for institutional
cooperation from three aspects First of all he points out East Asian countries have long
enjoyed ldquomarket-drivenrdquo integration through trade and foreign direct investment On one
hand intra-regional trade as a share of East Asiarsquos total trade has reached 54 percent in 2003
which has exceeded that of NAFTA On the other hand mainly via foreign direct investment
regional production networks and supply chains have been set up by locating different sub-
processes in various countries in Asia Secondly Asian countries are now facing challenge
from the EU and NAFTA in global market It is more urgent to secure an integrated market in
a regional scope especially when multilateral trade negotiation is at an extremely slow pace
Finally the Asian financial crisis gave Asian countries a lesson on the importance of regional
monetary and financial cooperation It made many East Asian countries realize the lack of
capacities to meet global challenges individually (Kim 2004) Because of the slow pace of
multilateral trade liberalization they move toward regionalism as an alternative to
synchronize regional economy in global competition These three drivers are summarized by
Stubbs (2002) into three terms - the ldquolong term regional trendsrdquo ldquocompetitive regionalismrdquo
and ldquothe Asian economic crisisrdquo
Yamazawa (2001) emphasizes that Chinarsquos entry to WTO and emerging move toward
regional free trade agreements might motivate other Asian countries to go for deeper
integration China is currently the second biggest economy in the region behind Japan As one
can see it has established close trade relations with its neighbors especially Korea and some
key member states of ASEAN who are also important trade partners with Japan Historically
Japan seemed to be reluctant in leading the progress of East Asia regionalism It may be when
China showed its interest in the regional integration did Japan adjust its strategy and turn in an
active negotiator on free trade agreements To some extent the term ldquocompetitive
11
regionalismrdquo may refer to not only the competitiveness among the three big blocs but also
that within East Asia
As Fujita (2005) comments hellip the economic integration of East Asia has been attained
mostly through market mechanismshellip However now East Asia has reached a critical stage
such that for a further promotion of regional integration developing region-wide political
institutions is indispensable As East Asian regionalism seems to be initiated by the market
itself rather than any top-to-bottom arrangement one important reason for East Asian
countries to accelerate their paces of trade liberalization might come from the appreciation of
a deeper integrated economy that is desired by the market Consequently it is possible that the
community building of Asian regionalism would be closely related to those intra-regional
linkages that already play the fundamental role on shaping the ldquoneutralrdquo integration of the
regional economy
Different from NAFTA where the US could be an is unambiguous leader and from
EU which is well institute-constructed the situation in East Asia is rather intricate partially
because of economic gaps among member nations plus the lack of an effective super-national
institution or an overwhelming leader in the region The existence of two big economies in the
region Japan and China makes it hard to predict the direction of the regional integration in
East Asia It seems that neither the experience of EU nor that of NAFTA could be directly
cloned in East Asia First a well-organized intergovernmental structure is one of the
significant characteristics of EU-type integration which is almost impossible to be repeated in
Asia East Asian countries are so different from each other in their stages of development For
instance their GDPs range from 26 billion US dollars per year (Lao PDR) to about 5 trillion
US dollars per year (Japan) 2 and their populations range from 04 million (Brunei) to 13
2 The data is statistics of year 2005 Data source The World Bank online WDI database httpwebworldbankorgWBSITEEXTERNALDATASTATISTICS
12
billion (China) It might not be an easy task to bring East Asian countries together under an
intergovernmental institution such as that of EU where there is one vote per nation
Second the NAFTA type of integration might be applicable but needs to be employed
by East Asia under preconditions Though a balanced situation without hegemony in the
region seems to be more welcome by most Asian countries there are at least thirteen
countries (ASEAN+three) in the region that might be included into the integrated regional
circle That means a network composed of at least 78 bilateral FTAs is necessary if trade
liberalization is done bilaterally The modest condition to make the NAFTA type available is
that the ten ASEAN countries should speak in one voice like an integrated economic unit In
that case maybe only six bilateral trade agreements (between Japan Korea China and
ASEAN) are enough to cover an integrated network of East Asian economies Therefore one
precondition to transplant NAFTArsquos experience will be the deeper integration of ASEAN
countries Another ldquohard-to-deal-withrdquo issue might be to harmonize Japan and China
Probably that is why the initiative of ldquoASEAN plus threerdquo3 (ASEAN plus Japan Korea and
China) has received so much attention since its first summit
Indeed since the geopolitics of East Asia is quite different from that in Europe or North
America it is quite reasonable to see that East Asia will find its unique approach to
regionalism based on its de facto region-wide integrated economy that is generated by the
market mechanism Basically any approach to the community building of East Asia would be
ldquoacceptablerdquo as far as it could meet three principles - openness equality and evolution4
3 It is an informal group whose formation was motivated by the East Asian crisis It does not have its own secretariat but meets at the invitation of ASEAN The first meeting of the group occurred in December 1997 4 It is so called ldquoopen regionalismrdquo (Bergsten 1997 and Drysdale et al 1998) Openness required non-discrimination and transparency in trade and economic policy as well as in diplomatic stance Equality implied that activities needed to be of mutual benefit to all participants and recognized the rapid transformation in the structure of economic and political power taking place in the region And the evolution of the process of regional cooperation recognized the importance to success of a gradual step-by step pragmatic and sustained approach to economic cooperation based on consensus building and voluntary participation
13
In a series of papers Baldwin (2003a 2003b 2005 2006) comprehensively analyzes
regionalism in a ldquohub-and-spokerdquo framework and suggests East Asian regional integration to
be in the ldquobicyclerdquo formation He concerns about the underlying connection between trade
liberalization and industrial relocation that is theoretically founded on New Economic
Geography (NEG)5 NEG discovers interactions between trade policy and industry relocation
across country borders in theory Briefly speaking though trade liberalization can increase the
overall welfare it is not guaranteed that all the participant countries can be better off because
the consequential cross border industry relocation might bring about long term impacts on the
economy Throughout the process of the market integration policy makers from each party
might be required to choose appropriate trade policies and implement the appropriate
strategies when shaping the picture of trade liberalization Even a temporarily inappropriate
policy might lead to the unrecoverable welfare loss at the end
One reason is that trade liberalization will allow producers to reconsider their business
under the circumstance of an integrated market instead of several fragmental markets The
markets can be easily fragmented when trade barriers are high Some producers choose to
produce in big markets simply because of the larger demands while some others choose small
markets where competition is relatively less intense The removal of trade barriers will
however make big markets more attractive to producers because industries may find it more
profitable to base their productions in big markets From these they supply to the host market
directly and export to markets that are relatively small under free trade There are three key
advantages of locating in big market First given demands from the whole free trade zone
sales to the domestic market can bring about higher markups than exports to foreign countries
because of the existence of transport costs Second to be located close to upstream and
downstream partners will help firms increase their efficiency Third though the competition
5 The theory of NEG is initially raised by Krugman (1991) and later enriched by others such as Fujita et al (1999) and Baldwin et al (2003)
14
effect in big markets will reduce firmsrsquo profits by lowering the industry price index in the
long term the equity of real wages decreases nominal wages in big markets as price declines
Baldwin (2003a) refers the lsquohub-and-spokersquo pattern as a possible outcome of regional
trade liberalization where one or few nation(s) become the center of the regional economy
because the relatively bigger market size(s) or the better initial conditions of trade facilities at
the starting point might be able to attract more industries to move in at the cost that the
markets of other economies in the region will shrink when eliminating the border barriers
Intuitively one may define the core economy in the regional free trade zone as lsquohubrsquo and title
the others lsquospokesrsquo Moreover the formation of the ldquohub-and-spokerdquo pattern will be a self-
enforced process It will be hard to be revised once it gets started in forming driven by the
market mechanism Because of this possible outcome of free trade policymakers need to set
up their policies carefully lest domestic economies be marginalized as a result of regional
trade liberalization Generally speaking there will be at least three advantages to be a ldquohubrdquo
rather than a ldquospokerdquo in the integrated regional economy First as many industries will
agglomerate into the hub nation the hub-based firms could be more efficient and more
competitive A ldquohub-and-spokerdquo formation might favor industries in the hub nation at the cost
of industries in the spoke nations Second most new investments will choose to flow into the
hub nation because the investors would normally find more potential in the big market(s)
Such decisions may meanwhile re-enforce the advantages of the big market(s) Last but not
the least the self-enforced agglomeration will lead to a one-way process of industry
reallocation in the region - lsquoOnce a particular location gets a head start it may be extremely
difficult for other regions to catch up as investment deterring effects of the current hub and
spoke system may have consequences that last far beyond the termination of that systemrsquo6
6 See httpwwwrietigojpeneventsbbl03013101html
15
East Asian economies seem to be looking for institutional scheme to deepen the initial
market-led regional integration in the last decade For most of them it might not be a good
idea to apply the laissez- faire policy as trade liberalization that is purely directed by the
market mechanism might drive them to the ldquospoke traprdquo Instead the analysis of the possible
ldquohub-and-spokerdquo formation might be helpful for them to better design their approach towards
a more integrated region
4 To picture the pattern of East Asian regional integration
41 The intensity of intra-regional trade in East Asia
A starting point is to demonstrate the existence of the intensive intra-regional trade among
East Asian economies using the gravity model containing augmented with dummy variables
The regressions are based on 87 countriesrsquo bilateral trade data in year 2001
log( ) log log log log log( )ij t i i t j j t i i t j j t ij ij ij tTrade C GDP GDP K K Dist Dummy uα α β β γ η= + sdot + sdot + sdot + sdot + sdot + sdot + (8)
The definitions of dummies used in the estimation are listed below
Variable Definition DUMMY_East Asian countries as the importers
The value equals 1 if the importer is from East Asia otherwise the value is 0
DUMMY East Asian countries import from non-East Asian countries
The value equals 1 only if the importer is from East Asia but the exporter is outside the region otherwise the value is 0
DUMMY_East Asian countries as the exporters
The value equals 1 if the exporter is from East Asia otherwise the value is 0
DUMMY East Asian countries export to non-East Asian countries
The value equals 1 only if the exporter is from East Asia but the importer is outside the region otherwise the value is 0
DUMMY_ East Asian countries trade with each other
The value equals 1 only if both the importer and the exporter are from East Asia otherwise the value is 0
[Table 1 about here]
Each coefficient in the logarithmic function essentially represents the elasticity of the
corresponding independent variable on the bilateral trade flow We first run the OLS
regressions All the coefficients have the expected signs and at high level of significance in
statistics Column (1) shows the estimators of the basic equation while the estimation shown
16
in columns (2) to (5) include the dummy variable(s) to measure the specific effect on trade of
East Asian countries As that the gravity model suggests both the export countryrsquos and the
import countryrsquos GDPs have significantly positive impacts on the bilateral trade flow which
is at the same time discouraged by geographic distance The effect from the countriesrsquo GDP
per capita is not always significant and stable however The coefficient of the dummy in
column (2) equals 057 showing that East Asian countries are more open to imports in
comparison to most of the countries in the world given the assumption that the other factors
have the identical impact on cross border trade In 2001 East Asian countries import about
77 more than the volume predicted by gravity equations On the other hand East Asian
countriesrsquo export almost three times as much as the worldrsquos average level given the same
factors These findings reflect that East Asian economies in general rely much more on
international trade than other countries worldwide Given the similar economic and
geographic conditions trade between two East Asian countries is around 23 times higher
than the trade flow between two countries outside East Asia The net trade ldquobiasrdquo within the
region listed in Column (5) measures the real intra-regional trade preference more precisely It
shows that given the same trade conditions the import between two East Asian countries is
about twice as great as the average import from a country outside the region On the other
side East Asian countries also export more (25 more) to each other than their exports to
those partners outside the region
However the OLS regression (whether or not considering fixed effects) on the gravity
equation has been criticized for its inconsistent estimators due to the presence of
heteroskedasticity One possible solution is to follow Santos Silva and Tenreyrorsquos (2005)
approach to apply Poisson pseudo-Maximum Likelihood method to obtain the consistent
estimators of the gravity model
17
One could see the inconsistence of OLS estimation from some basic algorithms In the
traditional logarithmic form of the gravity equation we have ln(Yij)=β0ln(A)+βiln(Xi)
+βjln(Xj) +β1ln(Xij) where Yij denotes bilateral trade between country i and j Xi and Xj
denotes country specific factors of i and j respectively and Xij denotes the ldquocommonrdquo factors
between them such as geographic distance Transforming the equation above we have
Yij=exp[β0ln(A)+βiln(Xi) +βjln(Xj) +β1ln(Xij)] (9)
The corresponding conditional expectation in general term is E(Yij brvbar Xi Xj Xij) The
individual observation can therefore be presented as yi=E[yibrvbarxi]+εi = exp[xiβ]+εi More
precisely the logarithmic function for the regression is
ln(yi)= xi β + ln(ηi) where ηi=1+ εi exp(xi β) (10)
The OLS estimators on this equation are consistent only when the second term on the
right hand side ln(ηi) is statistically independent from xi In order to eliminate xi from the
function of ηi we need to find a random variable vi that is independent from xi and meets the
condition vi=εi exp(xi β) which implies a very specific condition on the error term
Furthermore when the error term and explanatory variables are independent the conditional
variance of yi should be proportional to exp(xi β) However because of yi isin[1infin ) the
variance of yi tends to be closer to zero as the value of yi approaches its lower bound while
the deviations from the conditional mean of yi will go up when yi is moving to the opposite
direction It is therefore not realistic to assume that the conditional variance V[yibrvbarxi] in the
OLS estimation is proportional to exp(xi β) Therefore the OLS estimators on the log-linear
model tend to be inconsistent
Though the alternative non-linear least squares (NLS) method could be used to resolve
the problem of inconsistence Santos Silva and Tenreyro (2005) shows that the NLS
estimators are normally inefficient In NLS β =arg 2i ib
min [y - exp(x b)]sdotsum which implies
the first order condition sum ˆ ˆi i i i[y - exp(x )] exp(x ) xβ βsdot sdot sdot sdot =0 The inefficiency comes from the
18
fact that the equations might be weighted more on those observations with larger value of the
second term ˆiexp(x )βsdot To improve the efficiency of NLS estimators one needs to
identifyassume the specific form of the conditional variance instead of assuming the
conditional variance to be constant The beauty of the Poisson pseudo-Maximum likelihood
(PML) estimation is that it assumes the conditional variance as proportional to the conditional
mean and takes into account the non-negative feature of yi The disturbance from the large
conditional mean ˆiexp(x )βsdot will be offset by corresponding larger conditional variance
Holding the assumption that the conditional variance V[yibrvbarxi] is proportional to the conditional
mean E[yibrvbarxi]= exp(xi β) we estimate the parameter β by solving the first order condition
sum ˆi i i[y - exp(x )] xβsdot sdot =0 Moreover Gourieroux Monfort and Trognon (1984) shows that the
function does not even have to be Poisson distributed or to be an integer As long as the
appropriate function of E[yibrvbarxi] is defined the estimators of PML will be consistent and
efficient
The second part of Table 1 prints down the results based on PML regressions The
coefficients of the dummy variables in all regressions are positive and significant in statistics
It shows that East Asian economies trade much more than the worldrsquos average level (around
60 more in imports and double in exports) Under the same conditions trade between two
East Asian countries is much more intensive than that between an East Asian country and its
trade partner outside the region (95 higher in imports and 43 higher in exports) In short
either OLS or PML estimation show the existence of a de facto regional trading bloc within
East Asia Intra-regional trade between East Asian countries is more intensive than the
worldrsquos average level from either the aspect of imports or that of exports
At the first glance all coefficients in the estimations on Equation (8) have the expected
signs Most of them are at high level of significant in statistics As that Gravity model
suggests both the export countryrsquos and the import countryrsquos GDPs have significantly positive
19
impacts on the bilateral trade flow which is on the other side discouraged by geographic
distance The effect from the countriesrsquo GDP per capita is also positive but not always at high
level of significant in statistics The coefficient of the dummy in column (2) equals to 046
which means East Asian countries are in general more open to imports in comparison to most
of countries in the rest of world given that the other factors have the identical impact on cross
border trade In 2001 East Asian countries import about 58 more than the volume predicted
by gravity equations The exports from East Asian economies are also more intensive ndash as it is
shown in column (3) they export almost double as the worldrsquos average level The ldquonetrdquo
relative intra-regional trade intensity of East Asian economies is evaluated by the estimation
that present in Column (5) Given the same trade conditions the imports of one East Asian
economy from another East Asian economy will be about twice as much as the imports from
its extra-regional partner country meanwhile the exports between the two East Asian
economies will also be over 40 more than the average exports from one East Asian
economy to another country that is outside the region
42 The de facto bilateral trade relations and the economic distance between East Asian economies
It is further assumed that countries i and j will normally treat each other reciprocally
and therefore the bilateral trade relation between them could be symmetric That is
BTRij=BTRji Since one countryrsquos import from country j is not only affected by its own import
policy but also by its trading partner country jrsquos export policy one might image the bilateral
trade relations are the ldquopoolrdquo of both countriesrsquo import and export policy In practice it might
not be easy to distinguish their different effects on the bilateral trade Accordingly the
economic distance is calculated based on the definition ij jiED ED= = ij ij ji jiBTL Dist BTL Distsdot = sdot
[Table 2 about here]
[Table 3 about here]
20
Table 2 and Table 3 show the symmetric BTR index and ldquoeconomic distancerdquo between
major Asia-Pacific economies As expected BTR index could either ldquoprolongrdquo or ldquoshortenrdquo
the geographic distance between countries Since BTR index measures the de facto bilateral
trade relations in relative terms the comparison of countriesrsquo bilateral trade relations across
different pairs of countries would not be affected by the functionrsquos specification although it
might be systematically affected by the accuracy of the geographic distance7 The results
shown in Table 2 reaffirm trade orientation of East Asian countries The generally low value
of BTR index reflects a rather freer intra-regional trade environment in East Asia in
comparison to the worldrsquos average level Taking the fact that there is so far no formal
institutional integration in the region it is also evident of the de facto regional integration that
is driven by the private sectors East Asian economies might have strengthened their
interdependence via intensive intra-regional trade facing the global competition
Table 3 shows the observed economic distance between each country taking into
account both natural and political factors In combination of Table 2 and Table 3 one could
have four key observations First the six major ASEAN member statesmdashIndonesia Malaysia
Philippines Singapore Thailand and Viet Nam are not only geographically but also
economically close to each other In addition to the short geographic distance that facilitates
their bilateral trade the political interests of economic integration might also have shown the
influences on tightening their economic connections via the cross-border exchanges of
commodity and services
Second the observed economic distance between China and Korea is just about 15 of
either that between Japan and China or that between Japan and Korea The bilateral trade
7 The estimate of BTR might be lower (or higher) than its real value when the geographic distance used is over (or under) estimated Generally speaking it might be less accurate for those countries with big geographic size than for small countries For instance in reality most of the exports from China to Malaysia should be shipped out from GuangZhou harbor which is much closer to Malaysia than that of its capital However in this dataset the distance between Beijing (the capital of China) and Kuala Lumpur (the capital of Malaysia) was still used to proxy the transportation between the two countries The artificial magnification of the transportation distance leads to an estimator of BTR index that is under-estimated
21
between China and Korea has been going rapidly since 1990s China has overtaken the US
and Japan to be the biggest trading partner of Korea while 15years before China was just the
seventh biggest export market of Korea Besides the fast growth of both countriesrsquo economic
sizes the facilitation of bilateral trade seems to be one of the significant factors in explaining
such an expansion of bilateral trade
Third trade costs between China and the main ASEAN countries seem to be quite low
generally In history the main economies in ASEAN have played significant roles in the start-
up phase of the development of Chinese economy There were a large number of Chinese that
immigrated into Indonesia Malaysia (Singapore) and Philippines in the late 1800s and early
1900s These people and their offspring are often called ldquoNanyang Huaqiaordquo (ldquooverseas
Chinese in Southeast Asiardquo) Based on the statistics as compiled by the Overseas Chinese
Affairs Commission of the Republic of China there are in total about 40 million Overseas
Chinese worldwide Sixty percent of them are living in ASEAN countries Indonesia (19)
Thailand (18) Malaysia (16) Singapore (7) and Philippines (3)8 Though Overseas
Chinese is still minority population in most of these countries (except in Singapore) their
economic influences are quite significant in the local economies It is generally believed that
Overseas Chinese are the bridges between China and most of Southeast Asian countries
Indeed the majority of foreign investments came from Overseas Chinese in Southeast Asia in
the first 10-15 years after China implemented its ldquoopen doorrdquo policy in 1979 It would be
quite reasonable to say Overseas Chinese have played some fundamental roles in
strengthening connection between China and most of ASEAN countries
Albeit the value of BTR index between Japan and its partners is on average higher in
comparison to that between other East Asian countries it is generally9 less than one meaning
Japan still applies ldquotrade-promotingrdquo rather than ldquotrade-resistingrdquo policy to its neighbor
8 The percentages in the brackets represent the share of the total population of Overseas Chinese in the world 9 It is except that with New Zealand and that with Vietnams
22
countries in Asia Even though it seems that trade cost with Japan is relatively high Japan is
undoubtedly one of the most important trading partners to most East Asian economies The
gravity equation shows that international trade is not only determined by trade cost but also
the participantsrsquo economic sizes As the biggest economy in the region the GDP of Japan is
still about four times of that of China the second biggest country To some extent one might
image the ldquomega-sizerdquo of Japanese market could compensate its relatively closed economy
and thus the relatively ldquolongrdquo economic distance between Japan and other Asian countries
43 The relative market importance
Besides the comparison of the bilateral trade relations and the economic distance
between East Asian economies one might also need to evaluate the relative market
interdependence when filtering the individual ldquohubrdquo candidate(s) from the economic
perspective One may set up two criteria of the ldquohubrdquo candidate(s) first its market size is big
enough second it is open enough to allow other countries to access to its market To some
extent these two conditions are allowed to compensate with each other In practice Baldwin
(2003a) applies the HM index (ldquoindex of Hubness-Measurerdquo) to describe the ldquoEast Asian
bicyclerdquo of which Japan plays as the hub of the bigger wheel while China is the center of the
smaller wheel The formula to calculate this index is
HMB = XAB middot (1-MBA) (12)
where HMB measures the lsquohub-nessrsquo of country B to country A XAB denotes the exports from
A to B as a share of country Arsquos total exports MBA denotes country Brsquos imports from A as a
share of its total imports The value of HM ranges from zero to one of which the closer the
value to one the deeper the relative dependence of country Arsquos exports on country Brsquos market
[Table 4 about here]
In Table 4 the number in the bracket ranks the importance of the markets The number
ldquo1rdquo means the most important market to the country the number ldquo2rdquo means the second most
23
important market while the number ldquo9rdquo means the most ldquoignorablerdquo market For instance the
HM index of China to Japan is 768 percent the number ldquo1rdquo between the brackets indicates
that to Japan Chinese market is generally more important than that of any other East Asian
economies while from Chinarsquos standing point the HM index of Japan is 1272 percent
meaning Japan is also the most important market to China within the region For each
individual country the ldquooverall rankrdquo is calculated by simply summing up their ranks in each
row The country with the lowest value of ldquooverall rankrdquo will be concluded as the most
important market in the region In this case Japan and China are the two most markets in the
regional to most of Asia-Pacific countries
44 Japan and China as the two individual ldquohubrdquo candidates
Based on the both HM index and BTR index the first argument of this paper is that
Japan could be an individual ldquohubrdquo candidate in Asian regionalism It might not be rational
for other Asian economies to be alleviated from Japanese market which is so big in either the
absolute term or the relative term even though the values of BTR indexes hint that the
negotiation with Japan might not be as easy as that with some other more open economies
(Singapore for instance) In other words the benefits from accessing the Japanese market may
drive other countries to input more resources into the free trade negotiation with Japan
However unlike the US in North America Japan is not yet the overwhelmingly dominant
economy in the region from the aspect of market independence The US and EU are very
important external markets to East Asian countries Economically they might be able to affect
the process of East Asian regionalism to some degree despite that their roles in East Asia are
far less significant than that in the western hemisphere (Baldwin 2005) Fujita (2005) points
out that East Asia seems to be a multi-cored economy from the dimension of economic
geography Although Japan is still the most important market in the region for most of its
Asian neighbors it faces challenges from China who has grown so fast to compete for the
24
leadership of the regional economy Moreover China seems to have made much more
progress in regional trade liberalization than Japan since its entry to WTO It might be quite
questionable that Japan could keep its position without actively participating in the process of
regional integration
[Table 5 about here]
Second China might be a second ldquohubrdquo candidate in the region In relative terms China
is already the most important market in Asia for the other two big economies Japan (the
worldrsquos second biggest economy) and Korea (the worldrsquos eleventh biggest economy) In
particular China provides a most important market for the exports from Korea meaning that
Korea might give China more weight than Japan (or at least as much as that Japan has) when
considering to liberalize bilateral trade relations Furthermore in addition to its close relation
with ASEAN as that BTR index shows HM index illustrates the high degree of ASEAN
countriesrsquo reliance on Chinese market especially Singapore and Malaysia
Third the role of ASEAN may be outstanding when considered as a de facto sub-
regional integrated economic unity From Korearsquos standing point the whole market of
ASEAN is slightly more important than that of Japan while on the side of Japan the market
of ASEAN is indeed far more weighed than that of Korea In comparison to the minor
position in the case that they play individually it might be more beneficial for ASEAN
members to move synchronically as a group when liberalizing trade relations with other
countries Furthermore the indicators suggest Singapore and Malaysia to be a ldquounitedrdquo sub-
regional hub within ASEAN Singapore has a very open economy the free trade policy and
advanced trade infrastructure ensures its position as one of the major hubs of ocean
transportation Malaysia and Singapore and Malaysia are geographically close to each other
They have long historical connections (as Singapore used to be part of Malaysia before
25
WWII) Malaysia plus Singapore will give them a total GDP that is larger than Indonesia the
biggest economy in ASEAN
Forth on the level of aggregate trade the two Oceania countries are closely related to
East Asian economies especially Japan About 20 percent of exports from Australia go to
Japan which is double the overall flow to the US and 50 percent more than the total exports
to the EU For both of them Japan may be the first country in East Asia they consider about
when liberalizing trade bilaterally
45 The ldquoeconomic maprdquo of East Asian regionalism
To sum up one can image an ldquoeconomic maprdquo of the market-led integration in East Asia
where Japan may stay in the center of the regional trading bloc in terms of the market
importance and the economic distance Singapore plus Malaysia might play as the hub
connecting all the other ASEAN members Figure 1 shows that Japan holds a vital position in
Asian regional trading bloc Even though China is catching up as the second biggest market in
the region it seems that Japan is undoubtedly the biggest open market in the region and in
consequence one of the greatest exports destinations to most of the Asian countries
[Figure 1 about here]
46 The fundamental arrangement(s) of East Asian regionalism
Generally speaking there is so far not a single FTA or FTA under negotiation seems to
have grasped the lsquouniversal gravitationrsquo to all the countries in the region The lsquowild firersquo of
Asian regionalism may refer to a situation where countries are running out to initialize their
own FTA but no one is willing to join those agreements set up by others It is well
understood that ASEAN members are relatively too small in economic size individually It
may be better for them to move together to negotiate free trade with other countries They still
26
need to seek either China or Japan as their initial ally in order to generate a united market
large enough to persuade other countries to join the agreement
China seemed to have moved from a passive participant in regionalism to an active
promoter of regional trade liberalization after its entry to WTO China signed a FTA with
ASEAN in late 2004 (CAFTA) which is supposed to create the most populous FTA in the
world ndash with over 17 billion consumers and a total GDP of nearly 2 trillion US dollars
Compared to the progress of Japan-Korea free trade negotiation the negotiation between
China and ASEAN started later but reached the agreement earlier This may make the
Japanese government feel under pressure to participate into the process of regional trade
liberalization Indeed Japan accelerated a series of FTA negotiations with individual ASEAN
members when CAFTA was publicly announced It has signed agreements (or has started
formal negotiations) with main ASEAN members (Philippines Malaysia Thailand and
Indonesia) In the context all these FTA or FTA under negotiations will be loosely called the
Japan-ASEAN FTA (JAFTA) for the simplicity
In principle it seems either the CAFTA or the JAFTA seems to be capable of giving
birth to a market that is big enough to marginalize the economies outside the arrangement
Though it might still be difficult to predict which one of the arrangements would be more
appealing the fact that the former is already in its position plus Korearsquos de facto trade
reliance on China may persuade more weigh to be put on CAFTA The substantive
provisions of the China-ASEAN FTA will implement zero tariffs on bilateral trade in ten
years As one can witness Japan Korea Australia and New Zealand are now talking to either
China orand ASEAN for an FTA The rationale behind the scene is that once there is a
dominant market generated by FTA in the region the risk to be an ldquooutsiderrdquo would be more
and more costly along with the progress of regional trade liberalization
27
From the perspective of Japan the CAFTA seems to be last FTA that it would like to
see The complementarities of Japan and China are rather apparent the former is capital
abundant labor expensive but resource scare while the latter has the largest population and
the third largest territory in the world Historically Japan might have ldquoenjoyedrdquo treating
China as one of its ldquoproduction basesrdquo in East Asia As Japan is shifting its economy to high
value-added service-focused industry it outsources more and more fragmented
manufacturing processes to China One of the typical routines is that it exports high-tech
intensive or capital-intensive parts and components to China and finishes those labor-
intensive procedures there The cheap labor cost in China may guarantee the competitiveness
of Japanese products in the global market Japan has been Chinarsquos biggest trade partner for
ten years while China is currently Japanrsquos biggest partner as well An FTA between China and
some other nations would probably pose negative impacts on Japanrsquos exports either via the
direct trade diversification effect or by weakening its competitiveness because China will not
only import more final goods from those countries having FTA with it but also buy more
intermediate goods from those preferential partners
However Japan may receive supports from the two Oceania economies -Australia and
New Zealand who are strongly Asia-oriented and depend on East Asian markets deeply
Being excluded from East Asian regional integration may cost them much In comparison
with the other participants Australia and New Zealand are at an inferior position
geographically but they try to compensate this disadvantage by unilaterally lowering trade
barriers It has been for a long time that Japan provides them the biggest market in East Asia
To either of them a joint deal with Japan may be an ideal choice to engage more deeply into
Asian regional integration
Similarly Korea will not be happy to see an FTA between China and another nation
party without its participation typically CAFTA As seen above Korearsquos export industries
28
depend on the Chinese economy (195 percent) much more deeply than on the Japanese
market (88 percent) China is currently the largest market for Korea while ASEAN is the fifth
The implementation of the CAFTA will generate the worldrsquos most populous market The
preferential treatment between China and ASEAN would very likely diversify Korearsquos
original exports to either of the markets More seriously effects of market agglomeration will
not only force more industries to relocate in China-ASEAN free trade zone but also diversify
foreign investments away from Korea In order to avoid these negative effects Seoul might
choose either to join the agreement early or to contend with it by initiating for instance its
own FTA with Japan
After concluding an agreement with China in 2004 ASEAN seems to be a focus of East
Asian regionalism as Japan Korea Australia and New Zealand rush in for an FTA By early
2005 all of them announced that they were going to open free trade negotiations with
ASEAN (Asia Monthly 2004) In order to play a role as a real nucleus of Asian regionalism
ASEAN must first of all realize a single market or at least a highly integrated market among
its ten member nations The integration is not easily achievable however due to the wide
difference in economic development among its members
5 Concluding remarks
This paper explores a new approach to evaluate the de facto trade liberalization in quantitative
by producing the BTR index In combination with the HM index that measures the relative
market importance the calculation of the BTR index and the ldquoeconomic distancerdquo makes it
possible to quantitatively compare the de facto bilateral trade relation between East Asian
countries in relative terms It opens another door to monitor the progress of economic
integration from the aspect of international trade in an intuitive way
Applying the BTR index into the study on East Asian regionalism the study from the
economic perspective suggests Japan and China to be the two individual ldquohubrdquo candidates
29
who may play determinant role in the regional integration ndash any fundamental arrangement of
East Asian regionalism should involve at least one of them Currently CAFTA seems to be an
agreement that may trigger domino effects of regionalism in East Asia Once it is fully
implemented it would be very difficult for the others such as Japan and Korea to keep away
from that arrangement The fear of being fall into the ldquospoke traprdquo may drive other nations to
be more active in trade liberalization which could effectively spur regional integration in East
Asia From this prospective CAFTA might be a milestone of East Asian regional integration
30
Table 1 Estimations of the de facto intra-regional trade bias in East Asia
OLS PML
_constant -2122 (0377)
-2060 (0382)
-2015 (0375)
-2114 (0377)
-1940 (0382)
-1631 (04)
-1576 (28)
-1538 (096)
-1619 (12)
-1523 (05)
GDP importer 088 (0011)
086 (0011)
098 (0011)
088 (0011)
087 (0011)
082 (0034)
080 (0042)
081 (0034)
079 (0033)
079 (0040)
GDP exporter 102 (0011)
102 (0011)
098 (0011)
102 (0011)
098 (0011)
084 (0032)
083 (0033)
079 (0030)
081 (0041)
079 (0031)
GDP per Capita importer 003 (0016)
004 (0016)
002 (0015)
003 (0015)
003 (0015)
003 (0034)
006 (0038)
005 (0035)
008 (0041)
008 (0042)
GDP per Capita exporter 002 (0015)
002 (0015)
006 (0015)
003 (0015)
006 (0015)
-012 (0055)
-011 (0055)
-006 (0045)
-007 (0054)
-005 (0047)
Distance -115 (0021)
-118 (0021)
-122 (0021)
-113 (0021)
-126 (0022)
-071 (0034)
-073 (0038)
-075 (0034)
-067 (0034)
-075 (0036)
DUMMY_East Asian countries as the importers 057
(0063) 046 (0148)
DUMMY East Asian countries import from
non-East Asian countries 066
(0067)
031 (0122)
DUMMY_East Asian countries as the exporters 102
(0058) 071 (0116)
DUMMY East Asian countries export to non-
East Asian countries 109
(0062)
062 (0131)
DUMMY_ East Asian countries trade with each
other 120
(0171) 131
(0168)
087 (0231)
098 (0236)
R2 069 070 071 070 071 087 087 088 088 088
N 8671 8671 8671 8671 8671 8671 8671 8671 8671 8671 Notes plt001 plt005 plt01 Sources Data from year 1990 to 2002 The data of GDP and GDP per capita comes from WDI 2004 the data of distance comes from CEP II geography database the bilateral trade in intermediate goods is from the calculation based on UN COMTRADE database 2004
31
Table 2 The BTR matrix for the selected Asian countries
Korea China Australia New Zealand Indonesia Malaysia Philippines Singapore Thailand VietNam
Japan 085 045 036 103 034 027 069 029 027 238
Korea 020 017 050 006 008 014 012 011 017
China 014 039 001 005 004 013 004 005
Australia 034 017 017 024 017 017 068
New Zealand 030 016 022 040 026 056
Indonesia 012 003 027 006 002
Malaysia 005 028 007 011
Philippines 023 006 009
Singapore 014 015
Thailand 015
Source Authorrsquos calculation based on UN COMTRADE database 2004
32
Table 3 The estimated economic distance between countries
Korea China Australia New
Zealand Indonesia Malaysia Philippines Singapore Thailand VietNam
Japan 980 938 2770 9836 1975 1435 2032 1520 1239 8651
Korea 188 1443 5126 296 364 372 558 403 461
China 1215 4303 73 215 120 568 133 111
Australia 784 922 1137 1494 1036 1240 5240
New Zealand 2353 1412 1846 3407 2573 5616
Indonesia 135 83 233 127 70
Malaysia 117 88 81 220
Philippines 530 130 149
Singapore 195 325
Thailand 144
Source Authorrsquos calculation based on UN COMTRADE database 2004
33
Table 4 HM matrix for the selected Asian countries
Japan China Korea Indonesia Malaysia Philippines Singapore Thailand Australia New ZealandJapan 1272 489 104 210 146 289 222 164 028
(1) (2) (8) (5) (7) (3) (4) (6) (9)China 768 316 073 117 075 185 074 114 015
(1) (2) (8) (4) (6) (3) (7) (5) (9)Korea 877 1945 186 185 166 249 110 139 019
(2) (1) (4) (5) (6) (3) (8) (7) (9)Indonesia 2071 722 714 355 135 935 182 333 026
(1) (3) (4) (5) (8) (2) (7) (6) (9)Malaysia 1067 1089 320 186 139 1314 339 220 034
(3) (2) (5) (7) (8) (1) (4) (6) (9)Philippines 1451 1036 371 058 447 681 379 100 006
(1) (2) (6) (8) (4) (3) (5) (7) (9)Singapore 697 1406 399 na 1543 227 403 261 033
(3) (2) (5) (9) (1) (7) (4) (6) (8)Thailand 1411 916 183 186 392 169 754 201 027
(1) (2) (7) (6) (4) (8) (3) (5) (9)Australia 1850 997 830 251 191 096 412 178 576
(1) (2) (3) (6) (7) (9) (5) (8) (4)New Zealand 1158 672 446 148 192 152 126 121 1983
(2) (3) (4) (7) (5) (6) (8) (9) (1)Overall ranking 15 18 38 63 40 65 31 56 49 75
Source Authorrsquos calculation based on UN COMTRADE database 2004
34
Table 5 HM index of East Asian economies on the selected markets ()
Japan China Korea ASEAN5 USA EU(a) aggregate trade
Japan 1272 489 990 2458 1395China 768 316 526 1784 1335Korea 877 1945 900 1941 1316Indonesia 2071 722 714 1601 1310 1378Malaysia 1067 1089 320 2155 2008 1217Philippines 1451 1036 371 1572 2433 1801Thailand 1411 916 183 1537 1981 1591Australia 185 997 830 1128 967 1237New Zealand 1158 672 446 738 1544 1500
Source Authorrsquos calculation based on UN COMTRADE database 2004
35
Figure 1 The ldquoeconomic maprdquo of East Asian regional integration
36
References
ADB (2006) Asian Development Outlook 2006 HongKong China Asian Development Bank
Anderson J E (1979) A theoretical foundation for the gravity equation American Economic Review volume 69 pp106-116
________ and Eric van Wincoop (2003) Gravity with gravitas a solution to the border puzzle American Economic Review 93 pp170-192
________ and ________ (2004) Trade costs Journal of Economic Literature Volume XLII pp 691-751
Balassa B (1965) Trade liberalization and revealed comparative advantage Manchester School of Economic and Social Studies 33 (May) 99-123
Baldwin R E (1994a) A domino theory of regionalism CEPR discussion paper 857
________ (1994b) Towards an Integrated Europe CEPR August 1994
________ (2003a) The Spoke Trap hub and spoke bilateralism in East Asia KIEP Discussion Paper 04-02
________ (2003b) East Asian regionalism a comparison with Europe present at ldquoStudy Group on China rdquo Policy Research Institute MOF Japan
________ (2005) Asian regionalism promises and pitfalls in Ahn CY R Baldwin and I Cheong (Eds) East Asian Economic Regionalism Feasibilities and Challenges Springer
________ (2006) Multilateralising regionalism spaghetti bowls as building blocs on the path to global free Trade NBER Working Papers No 12545
Bergstrand J H (1989) The generalised gravity equation monopolistic competition and the factor-proportions theory in international trade The Review of Economics and Statistics 67 474-481
Bergsten C F (2007a) Towards a free trade area of the Asia Pacific Policy Briefs in International Economics NoPB07-2 Peter G Peterson Institute for International Economics
Bergsten C F (2007b) China and economic integration in East Asia Implications for the United States Policy Briefs in International Economics NoPB07-2 Peter G Peterson Institute for International Economics
Bora B and C Findlay (1998) Regional integration and the Asia-Pacific Australia Oxford University Press
Bruny J C Carrere P Guillaumontx and J DeMelo (2002) Has distance died Evidence from a panel gravity model CEPR discussion paper No 3500
Carrillo C and A Carmen (2002) Trade blocks and the gravity model evidence from Latin American countries Economics Discussion Papers No 542 University of Essex Department of Economics
Cheng L K and S F Leung (1999) Aspects of Market Integration in APEC Trade Foreign Direct Investment and Labor Migration APEC Secretariat Singapore
37
________ ________ and Z Ma (2002) Revealed comparative advantages and intra-regional trade of the worldrsquos three major regions 1985-1995 International Conference on China and the World Economy City University of Hong Kong
Deardorff A V (1984) Testing trade theories and predicting trade flows in Ronald W J and P B Kenen (eds) Handbook of International Economics Amsterdam North-Holland
________ (1995) Determinants of bilateral trade does gravity model work in a neoclassical world NBER Working Paper 5377
Drysdale P A Elek and H Soesastro (1998) Open regionalism the nature of Asia Pacific integration in Drysdale P and D Vines (eds) Europe East Asia and APEC Australia Cambridge University Press
Edmonds C and J Verbiest (2002) The role of preferential trading arrangements in Asia ADB ERD Policy Brief Series
Engel C and J Rogers (1996) How wide is the border American Economic Review 86 pp 1112-1125
Ernst C (2005) Trade liberalization export orientation and employment in Argentina Brazil and Mexico Employment Strategy Papers 200515 Employment Strategy Department
Evenett S J and W Keller (1998) On theories explaining the success of the gravity equation NBER Working Paper 6529
Frankel J A D Romer and T Cyrus (1996) Trade and growth in East Asian countries cause and effect NBER Working Paper 5732
________ E Stein and S Wei (1996) Regional Trade Agreement natural or super-natural NBER Working Paper 5431
Freenstra R C J Markusen and A K Rose (1998) Understanding the home market effect and the gravity equation the role of differentiating goods NBER Working Paper 6804
Fujita M (2005) Regional integration in Asia How to be further promoted in harmony Dynamism and Uncertainty in Asia The Science Council of Japan Conference on Sustainability 2005
________ P Krugman and A J Venables (1999) The Spatial Economy Cities Regions and International Trade Cambridge and London The MIT Press
Gourieroux C A Monfort and A Trognon (1984) Pseudo Maximum Likelihood methods applications to Poisson models Econometrica 52 pp701-720
Eisenhart C (1947) Inverse sine transformation of proportions in Techniques of Statistical Analysis Paper 16 New York McGraw-Hill
Harris MN and L Matyas (1998) The econometrics of gravity models Melbourne Institute Working Paper Series no 598
Kawai M (2004) Regional economic integration and cooperation in East Asia Seminar on the ldquoImpact and Coherence of OECD Country Policies on Asian Developing Economiesrdquo OECD Paris
Kawasaki K (2003) The impact of Free Trade Agreements in Asia RIETI Discussion Paper Series 03-E-018
38
Kierzkowski H (1987) Recent advances in international trade theory a selective survey Oxford Review of Economic Policy Volume 3 1987 Oxford University Press
Krugman P (1991) Geography and Trade Cambridge MIT Press
________ (1993a) The hub effect or threeness in interregional trade in Ethier W J E Helpman and J P Neary (eds) TheroryPolicy and Dynamics in International Trade New York Cambridge University Press
________ (1993b) Regionalism versus multilateralism analytical notes in DeMelo Jaime and Panagariya Arvind (eds) New Dimensions in Regional Integration Australia Cambridge University Press
Kuroda H (2006) the statement at the IMF-World Bank Seminar on the Association of Southeast Asian Nations (ASEAN) and Pan-Asian Integration Singapore
Matyas L L Konya and MN Harris (2000) Modelling export activity of eleven APEC countries Melbourne Institute Of Applied Economics And Social Research Working Paper No 52000
Midelfart-Knarvik KH HG Overman and T Venables (2000) The location of European industry European Commission DG for Economic and Financial Affairs Economic Papers No 142
________ and ________ (2002) Delocation and European integration Economic Policy 35
Nerlove M (2002) Essays in Panel Data Econometrics New York Cambridge University Press
Porojan A (2000) Trade flows and spatial effects the gravity model revisited Discussion Papers No 0004 University of Exeter School of Business and Economics
Portes R and H Rey (1999) The determinants of cross-border equity flows NBER Working Paper 7336
Poumlyhoumlnen P (1963) A tentative model for the volume of trade between countries Welwirtschaftliches Archives 90 pp 93-99
Santos Silva J and S Tenreyro (2005) The log of gravity CEPR discussion paper No 5311
Scheffe H (1956) The analysis of variance Mimeographed Lectures University of California Berkeley
Stubbs R (2002) ASEAN plus three emerging East Asian regionalism Asian Survey Vol42 No3 pp 440-455
Tinbergen J (1962) Shaping the World Economy Suggestions for an International Policy New York The Twentieth Century Fund
Watanabe O (2006) Economic integration in East Asia and the roles of ASEAN and Japan Seminar on A New Stage of East Asian Economic Integration Singapore
Yamazawa I (2001) Assessing a Japan-Korea Free Trade Agreement The Developing Economies 39 No1
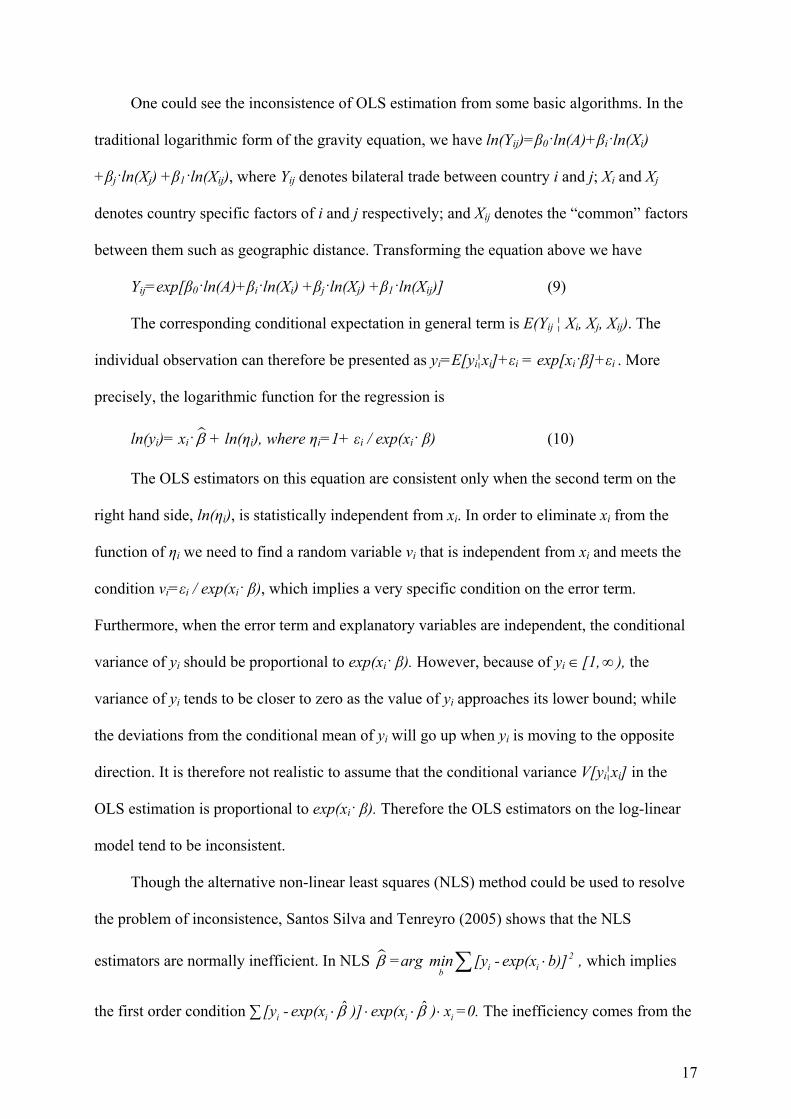
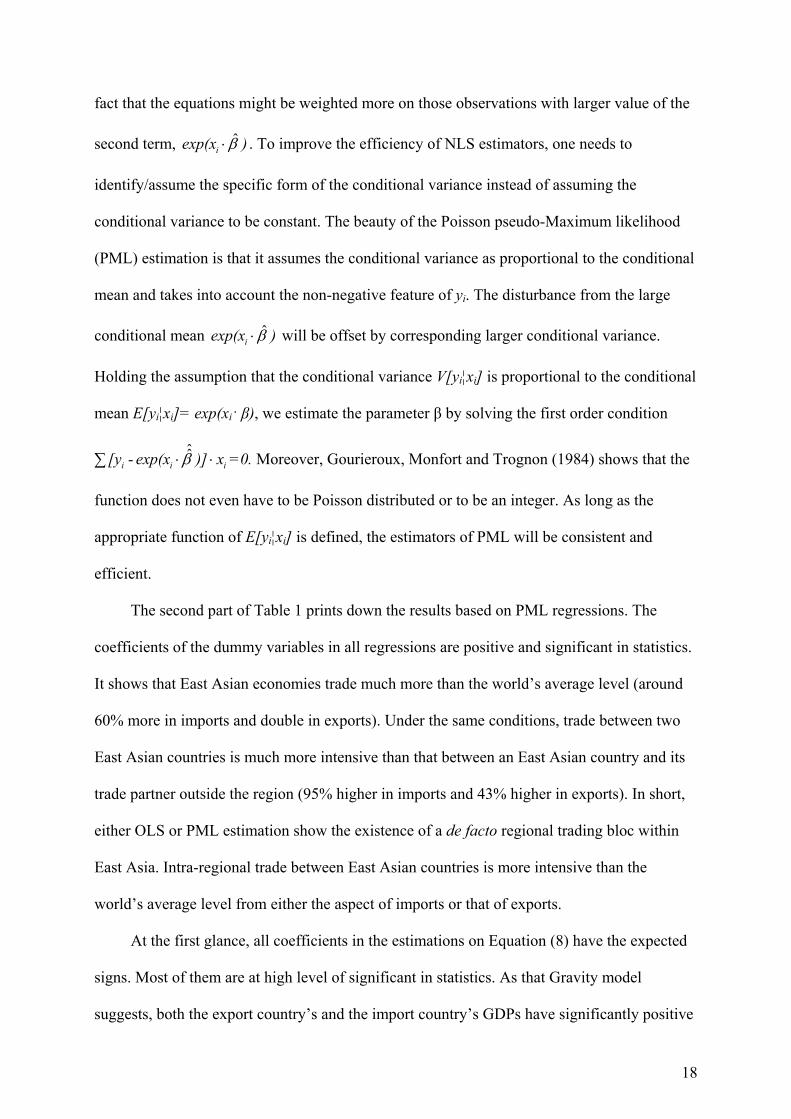
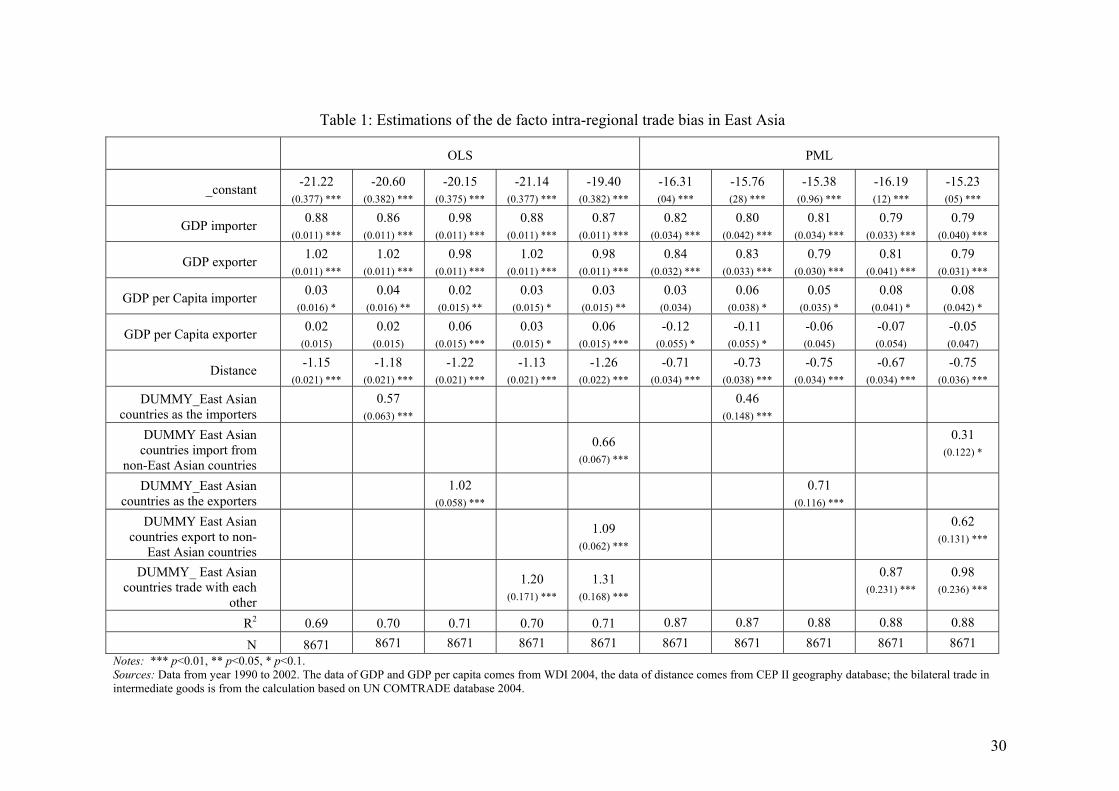
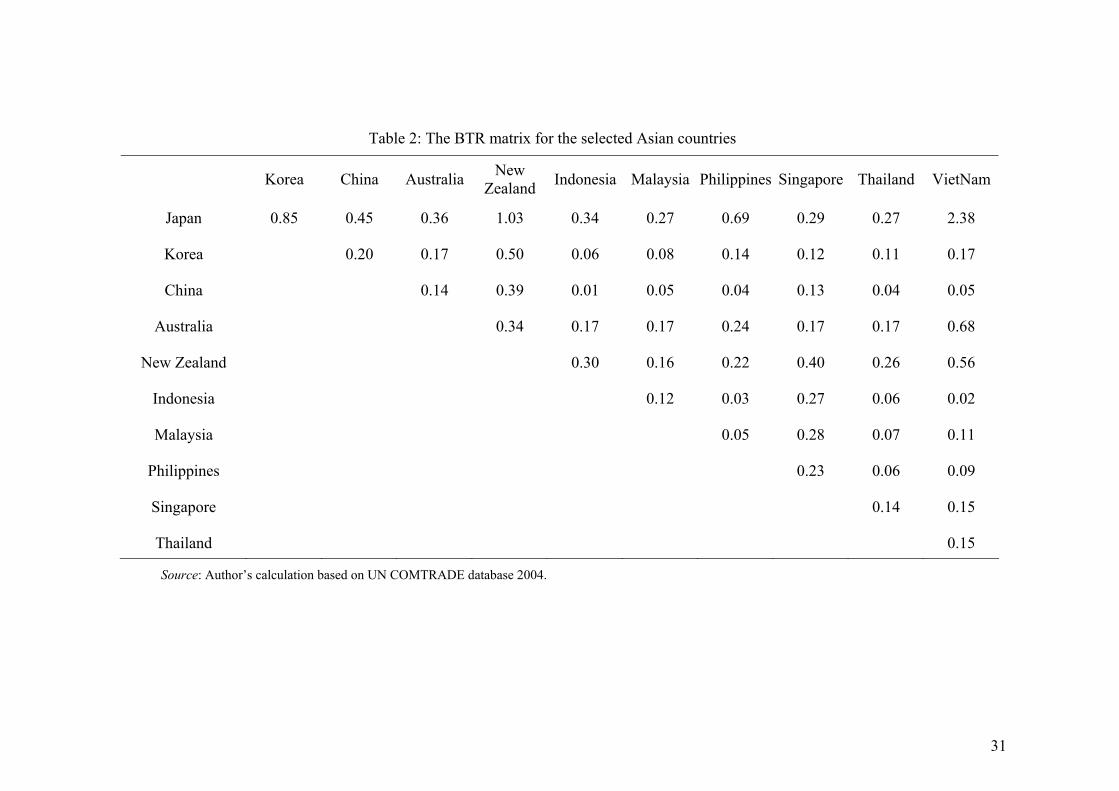


