Embed Size (px)
Citation preview
The impact of monetary policy on the yield curve in the Brazilian economy
Marcel Z. Aranha
Marcelo L. Moura
Insper Working PaperWPE: 167/2009

Copyright Insper. Todos os direitos reservados.
É proibida a reprodução parcial ou integral do conteúdo deste documento por qualquer meio de distribuição, digital ou im-
presso, sem a expressa autorização doInsper ou de seu autor.
A reprodução para fins didáticos é permitida observando-sea citação completa do documento
1
THE IMPACT OF MONETARY POLICY ON THE YIELD CURVE IN THE BRAZILIAN ECONOMY
MARCEL Z. ARANHA IBMEC SÃO PAULO
Rua Quatá 300, Vila Olímpia, São Paulo, SP, CEP: 04546-042, Brazil.
Tel.: + 55 11 45042435; fax: + 55 11 45042350. E-mail address: [email protected].
MARCELO L. MOURA IBMEC SÃO PAULO
Rua Quatá 300, Vila Olímpia, São Paulo, SP, CEP: 04546-042, Brazil.
Tel.: + 55 11 45042435; fax: + 55 11 45042350. E-mail address: [email protected].
Abstract The main contribution of this study is to understand how episodes of restrictive monetary
policy have different impacts on long-term interest rates. These impacts are decomposed
into changes in real neutral interest rates, long-run expected inflation and risk premium. For
a sub-sample, the latter is further decomposed into inflationary risks and other
macroeconomic risks. More specifically, this study aims at analyzing periods of recent
restrictive monetary policies, such as those of September 2002, June 2004 and April 2008.
The results show that changes in the risk premium are the major factor driving long-run
forward rates and that real neutral interest rates play a secondary role.
Key words: Term structure of interest rates; Forward rates decomposition, Financial markets and the macroeconomy; Monetary policy JEL: E43, E44, E52, G12.
2
1 - Introduction
The relation between short- and long-term interest rates has been the focus of interest for
academics and practitioners. Some of this importance is due to the capacity of the term
structure to capture possible rates of reinvestment, and the fact that relevant information on
macroeconomic variables is embedded in it. Many studies approach this topic and try to
analyze such implicit information: see, for example, Estrella (2005) and Carlstrom and
Fuerst (2004). In those articles, the authors claim that the term structure has the ability to
predict some macroeconomic variables, mainly future output growth and inflation.
Conversely, other studies try to analyze the impact of macroeconomic shocks on the
term structure. Wu (2003) shows that the contractionary monetary policy has a significant
but short-term effect on the term structure. The term structure flattens in response to a
restrictive monetary policy. A positive shock of the output raises bond returns, and its
magnitude is similar across different maturities; however, the scale is smaller if compared
with monetary policy.
This study aims to describe the impact of monetary policy on the term structure of
interest rates in different episodes of monetary policy tightening in the Brazilian economy.
It uses as a methodological basis the contribution of Kozicki and Sellon (2005), who
investigate the yield curve responses of monetary policy tightening over some decades in
the United States. Specifically, it attempts to elucidate the uncommon result of a long-term
interest rate fall to an increase in rates between 2004 and 2005, known as a conundrum. For
this purpose, a comparison is made with another period of monetary tightening that has not
presented such an effect, that is, the episode of monetary contraction between 2002 and
2003. The analysis aims at identifying what has in fact motivated such a fall in interest
rates: a variation in the expected inflation, a variation in the expected real interest rates or
other sources of alteration of the perceived risk by economic agents.
Many other studies relate monetary policy and the yield curve of emerging
economies. By comparing some countries, Garcia and Lowenkron (2005) find that Brazil is
one of the few countries in which short-term inflationary surprises affect medium-term
expectations. In the light of the theory of systemic risk developed by De La Torre and
3
Schmukler (2004) analyze the experience of three emerging countries (Mexico, Israel and
Poland) that achieved success in their stabilization process, and the study concludes that the
inflation reduction was linked to a fall in the real interest rate, which resulted in a
significant fall in the nominal interest rates. These facts led not only to lengthening debt
maturity but also to a changing debt profile, which became pre-fixed.
Besides this section, the article is organized as follows. Section 2 describes the
methodology used, as well as the data, and shows the preliminary results. Section 3
displays a brief explanation of the episodes of monetary tightening in the period studied.
Section 4 aims at highlighting the determinant factors of the variations in the long part of
the term structure. Section 5 presents the conclusion of this study.
2 – Decomposition methodology
The main instrument for analysis will be the decomposition of the term rate into one
and two years. The variation of this rate will then be decomposed into several components
with a direct economic interpretation. The methodology presented here closely follows the
one adopted by Sellon and Kozicki (2005), in which the analysis of impacts of monetary
policies on the long-term changes is based on the decomposition of the interest rate into its
principal components. The first decomposition occurs with the use of spot rates from
different periods to obtain the term rate. Mathematically speaking, we can decompose the
two-year yield as follows:
2 1 ,1 2fi i i →= + (1.1)
where 2i is the log of one plus the two-year interest rate, 1i is the log of one plus the one-
year interest rate and ,1 2fi → is the log of one plus the forward interest rate from years one to
two.
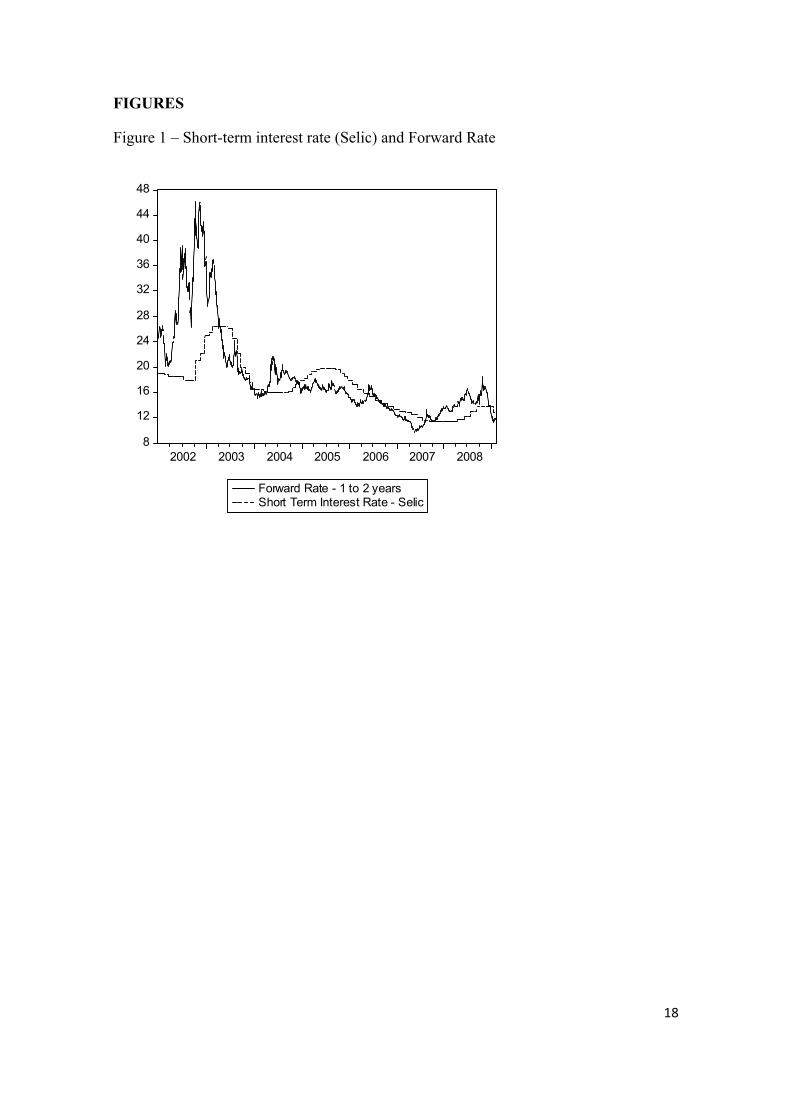
Figure 1 plots the short-term interest rate (Selic) and the forward rate from years one
to two. The graph shows that, in principle, there is no direct relationship between these two
rates but forward rates tend to anticipate the increases in the short-term rates. This idea
comes from the idea that forward rates reflect the market expectation for future short-term
4
rates, an idea explored in many studies (see for instance Fama, 2006 and Campbell, 1995).
However, instead of exploring the direct relationship between the short-term interest rate
and the forward rate, we take an alternative approach using Sellon and Kozicki’s (2005)
method to understand what the main components of the forward rate are.
[ FIGURE 1 ABOUT HERE ]
We further break down the forward rate found in the previous process. It is the sum
of a rate called the neutral interest rate and a risk premium associated with the bond
because the longer-term rates should not be influenced by short-term cycles. The forward
rate can be decomposed into:
,1 2f ni i ρ→ = + (1.2)
where ni is the neutral nominal interest rate, though as a long-term equilibrium nominal
rate, and ρ is the risk premium.
Further, the neutral nominal interest rate can be broken into the real interest rate, nr ,
and the expected long-term inflation rate, eπ . Similarly, we split the risk premium into two
parts, inflationary risk, πρ , and other macroeconomic fundamental risks, fρ :
,1 2e
f n fi r ππ ρ ρ→ = + + + (1.3).
The economic interpretation of equation (1.3) is quite intuitive. Thinking of the
forward rate as the expected short-term interest rate in the future, it is explained by four
main economic sources: the real interest rate, which is the economy’s long-term return on
capital; the expected inflation and inflation risk, which will crucially depend on the
monetary policy credibility; and, finally, other fundamental risks, such as liquidity,
economic crisis and default among others not related to monetary policy.
As a proxy for the long-term nominal interest rate and the expected inflation rate,
we used the longest expectations available respectively for the monetary policy short-term
5
interest rate and inflation. The source for these pieces of information was the “Focus”
survey, which is a market expectations survey conducted by the Central Bank of Brazil.
Real neutral interest rates are just the difference between neutral nominal interest rates and
inflation expectations.
Using equation (1.2), the risk premium is computed as the difference between the
forward rate and the nominal neutral interest rate. The risk premium is further decomposed
into inflationary and fundamental risks. The first is the difference between the yield of
zero-coupon government nominal bonds and non-indexed bonds, where we added to the
latter the corresponding expected inflation for that maturity. The indexed bond utilized was
the NTB-B because of its greater data availability; we used the Nelson and Siegel (1987)
method to interpolate the NTN-B curve to determine fixed one- and two-year maturities.
The fundamental risks part of the risk premium can be obtained by subtracting the risk
premium from the inflationary risk.
Using the method just described, we decompose the forward rates, ,1 2fi → , as
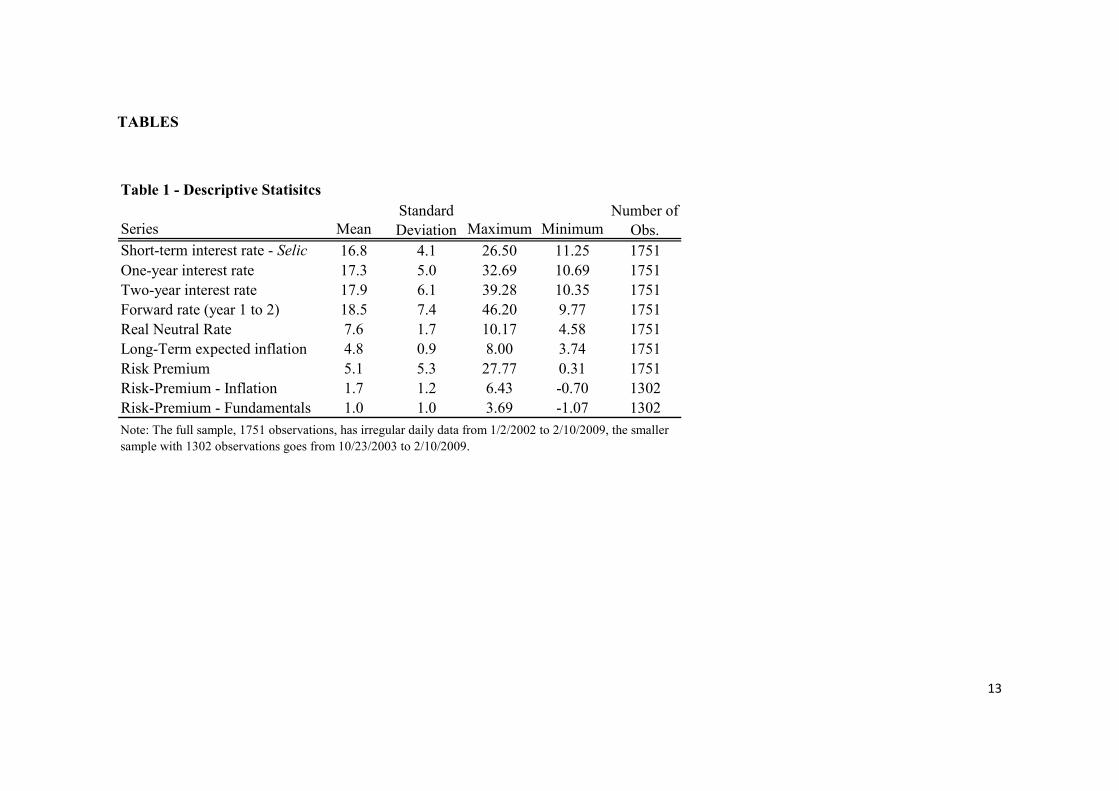
illustrated in equation (1.3). Table 1 shows the descriptive statistics for the short-term, one-
year and two-year interest rates, the forward rate from one to two years and its respective
decomposition into real neutral rate, long-term expected inflation and risk premium. Notice
that the decomposition of the risk premium into inflationary and fundamentals risk is
performed for just a sample, for the reason of a lack of data.
[TABLE 1 ABOUT HERE]
We can see some interesting facts in Table 1. First, regarding the short-term, one
year and two-year interest rates, yields and volatility increase with maturity. Second, the
forward rate is the most volatile of all and, looking at it is decomposition, most of its
volatility comes from the risk premium.1 Third, the presence of high interest rates in Brazil
for the 2002–2009 period does not seem to rely on high expected inflation rates, but has
1 Volatilities for the inflation risk premium and the fundamentals risk premium are much lower due to the fact that their sub-sample excludes the year of 2002 and most of 2003, periods of very high volatility in the Brazilian economy.
6
much more to do with high real neutral rates and a high risk premium, a fact that deserves
further investigation.2
3 – Episodes of monetary policy tightening
We define as monetary tightening episodes periods where the monetary policy
interest rate increased by at least 100 basis points. Given this definition, we found three
tightening episodes in our sample: October 2002 to February 2003, with a total increase of
850 basis points; September 2004 to May 2005, with a total increase of 375 basis points;
and April 2008 to September 2008, with a total increase of 250 basis points.
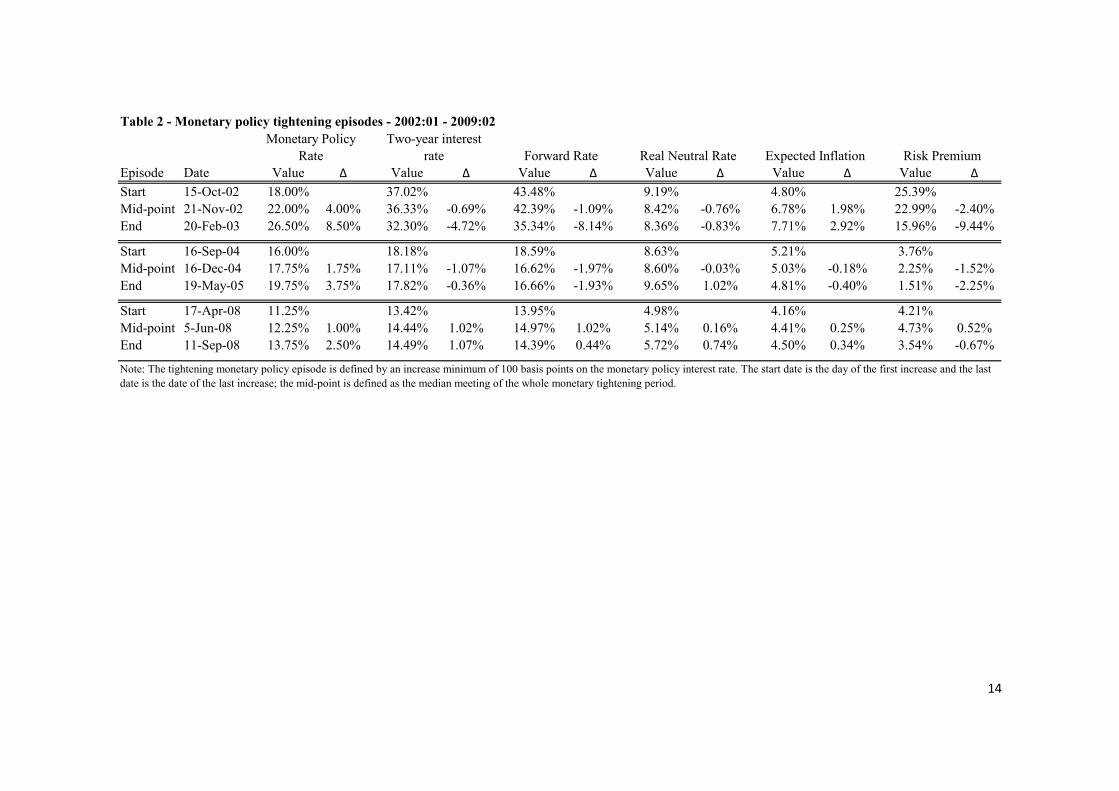
[TABLE 2 ABOUT HERE]
Table 2 shows the monetary policy episodes in detail. Each episode is divided into three
dates according to the dates of the monetary policy committee meeting: the initial date, the
day before the first meeting at which interest rates were increased; the mid-point, the
median consecutive increase of interest rates; and the date of the final meeting with an
increase in interest rates.
The 2002–2003 monetary policy tightening
In the 2002–2003 episode, the tough monetary tightening of 850 points caused a
sharp decrease in the two-year interest rates and forward rates, respectively 472 and 814
basis points. Looking at the forward rate decomposition, we see that this fall was caused by
a sharp decrease in the risk premium. Interestingly, the monetary policy was not tough
enough to decrease the market expected long-run inflation, which actually increased by 292
basis points.
This event may be explained by the fact that the credibility of the Brazilian
authorities was being tested, that is, there was still some suspicion on the part of the market
agents of the Brazilian Central Bank’s commitment to maintaining monetary orthodoxy.
After the monetary policy had remained highly restrictive for nearly four months, the 2 For instance, one hypothesis could be the presence of high government expenditure depressing private consumption; however, we leave this theme for further research.
7
“market” started believing that the maintenance of high interest rates would restrain
inflation pressures at the time, even at a high political cost and low economic growth. From
June 2003 to the end of 2003, short-term interest rates began a huge drop of 1,000 basis
points. Contemporaneously, long-run expected inflation decreased almost continuously
from February 2003 to December 2003, finishing the year at 5%.
In the same period, a very significant fall in the embedded risk premium in the term
rate is observed, which also reflects that the policy adopted by the monetary authorities was
in fact on “the right path,” in the vision of the market agents, because they were willing to
accept a smaller risk premium in relation to the period prior to the beginning of the policy
tightening. Finally, at the end of the tightening period, there was a revision of the neutral
real rate with an increase more than proportional to the previous fall.
The 2004 – 2005 monetary policy tightening
Similarly to the previous episode, the increase in interest rates caused a decrease in
the two-year interest rates and the forward rates. However, with a striking difference, we
observed a conundrum effect with the full rotation of the term structure: short-term interest
rates started lower and finished higher than the long-run two-year interest rates. Everything
points to an increase in the credibility of policies adopted by the Central Bank, which may
have happened due to the successful containment of inflation rates in the previous monetary
policy tightening.
There was a fall in the expected inflation of 0.40% – reaffirming the market’s
confidence in the Central Bank’s capability of restraining the price level. The risk premium
decreased by 225 basis points and the risk real neutral rate increased by 102 basis points.
We interpret this result as the market starting to expect higher real rates in relation to the
Central Bank’s more orthodox policy.
The 2008 monetary policy tightening
In the 2008 monetary tightening, the Brazilian economy was in a quite different
scenario from the two other episodes. The country had just had four consecutive years with
8
strong growth rates averaging 4.5%, the highest in the last 20 years, and the short-term
interest rates were at their lowest historical value since the beginning of the inflation-
targeting regime in mid-1999. However, inflation rates started to increase due to signs of
the economy over-heating and external price shocks on commodities.
In response to increasing inflation rates, the Central Bank started to increase interest
rates in April and had its last increase in September. The response of the two-year interest
rates and the forward rates was opposite to the past two other episodes, with an increase in
the two-year interest rates and forward rates. The risk premium fell by 67 basis points;
however, real neutral rates and expected inflation rates increased.
Our interpretation is that this episode did not have the full effect of a monetary
policy tightening episode. The reason for this is the fact that the movement was interrupted
by the deepening of the international financial crises that started in the U.S. mortgage
market in mid-2008. The last month, September, was the month of the deepening of the
global stock-exchange crashes around the world with the bankruptcy of the Lehman
Brothers investment bank.
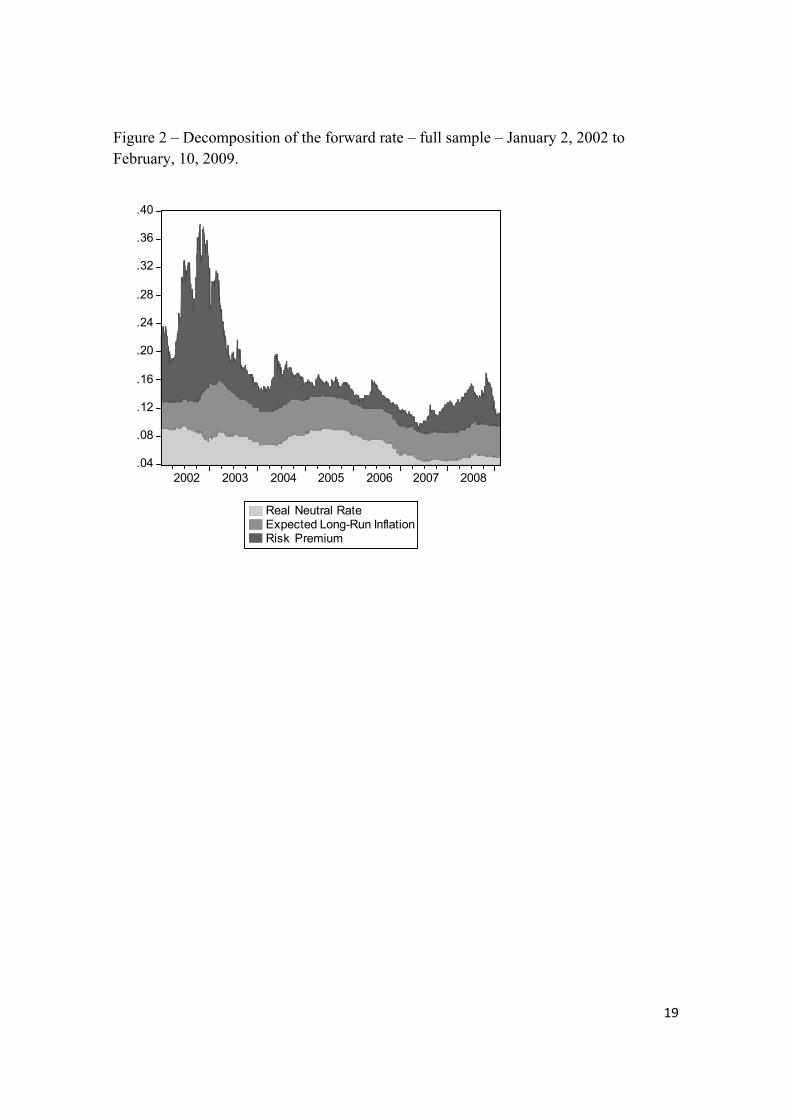
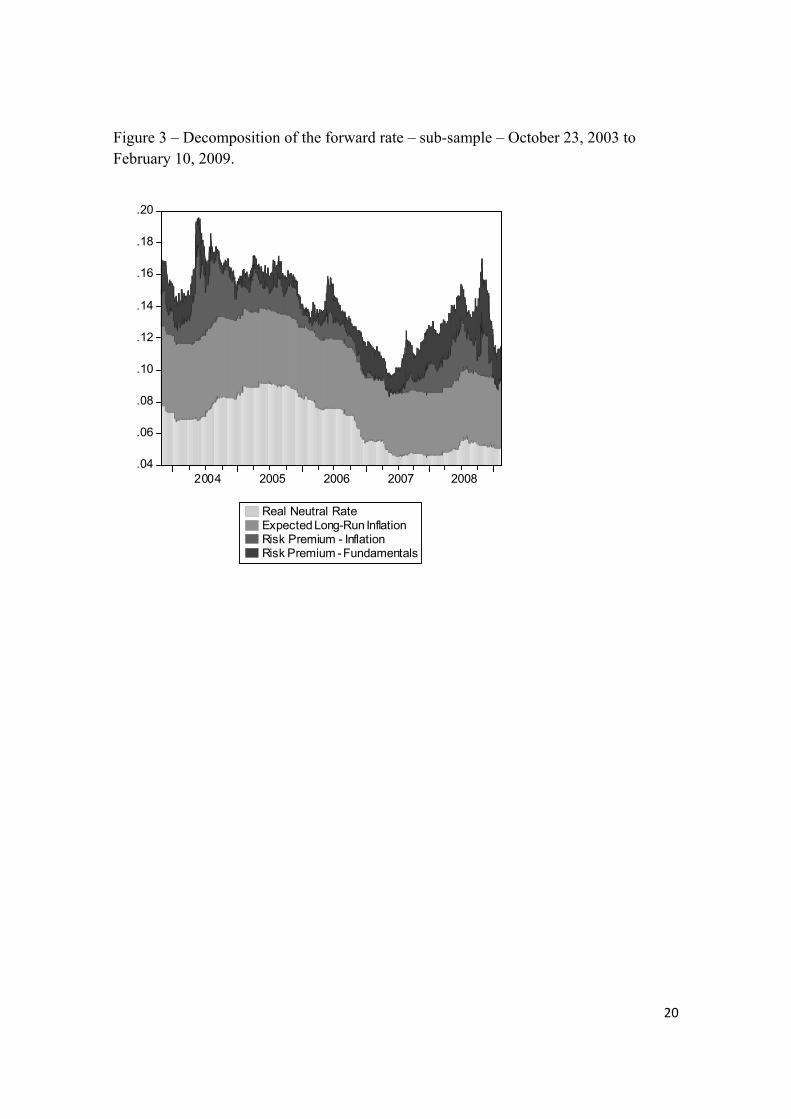
4 - Determinant factors of the forward rate
The decomposition of the term rate allows us to observe its evolution and the
evolution of its components, the neutral real rate, expected inflation and risk premium. In
Figure 2, the decomposition is plotted for the full sample. Figure 3 uses our sub-sample and
breaks the risk premium into the inflationary risk and the macroeconomic fundamentals
risk. The complete decomposition, illustrated by Figure 3, uses data starting on October 21,
2003, due to the lack of enough information to estimate post-fixed rates for previous
periods.
[INSERT FIGURES 2 AND 3 ABOUT HERE ]
As it stands out in Figures 2 and 3, the risk premium and the real neutral rate seem
to be the main factors to explain the forward rate oscillations. However, in order to obtain
more precise evidence for this, we proceed to some formal statistical analysis. For this
9
purpose, we study the statistical properties of each factor by running diagnostic tests.
Namely, we first test for the stationarity of the series and then look for cointegration
relationships of each series with the forward rate. Finally, we run individual regressions of
each factor to the forward rate in order to identify which one best describes the evolution of
forward rates.
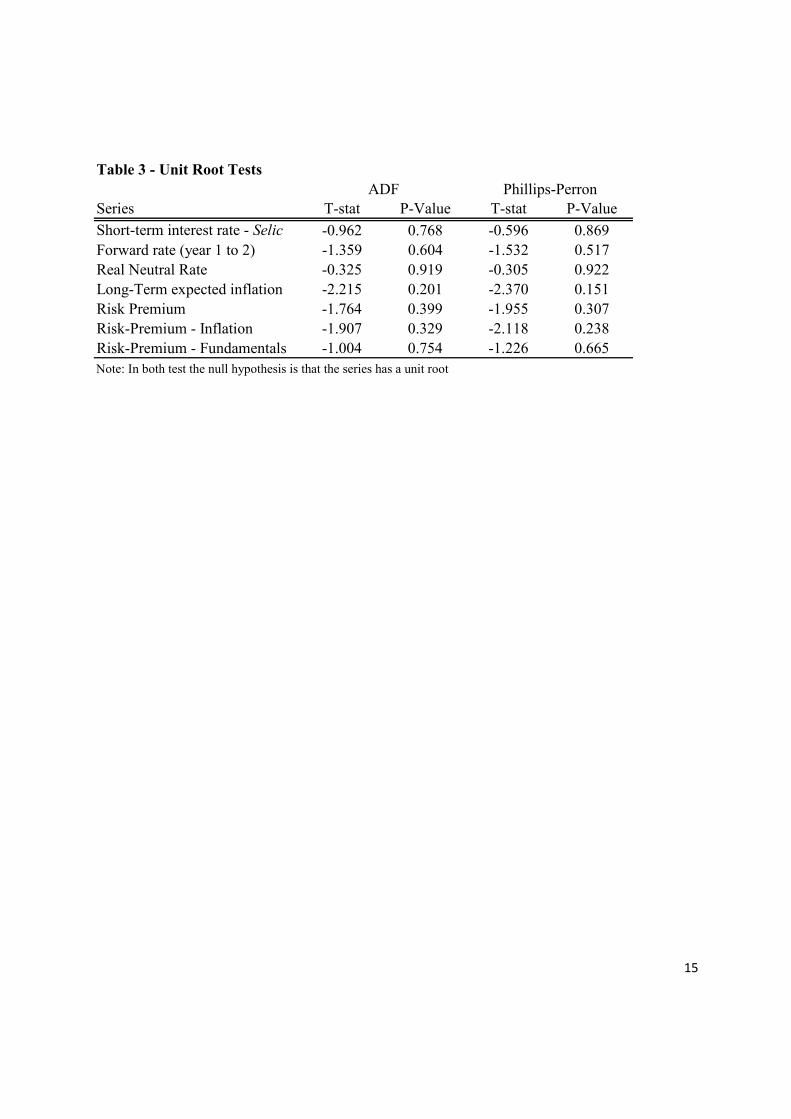
To perform the regressions of the components, it is first necessary to analyze
whether the term rate series and their components have unit roots. The tests to check the
presence of a unit root in all the series are presented in Table 3. Thus, using up to the 10%
significance level, we fail to reject the null of unit root in each series.
[TABLE 3 ABOUT HERE]
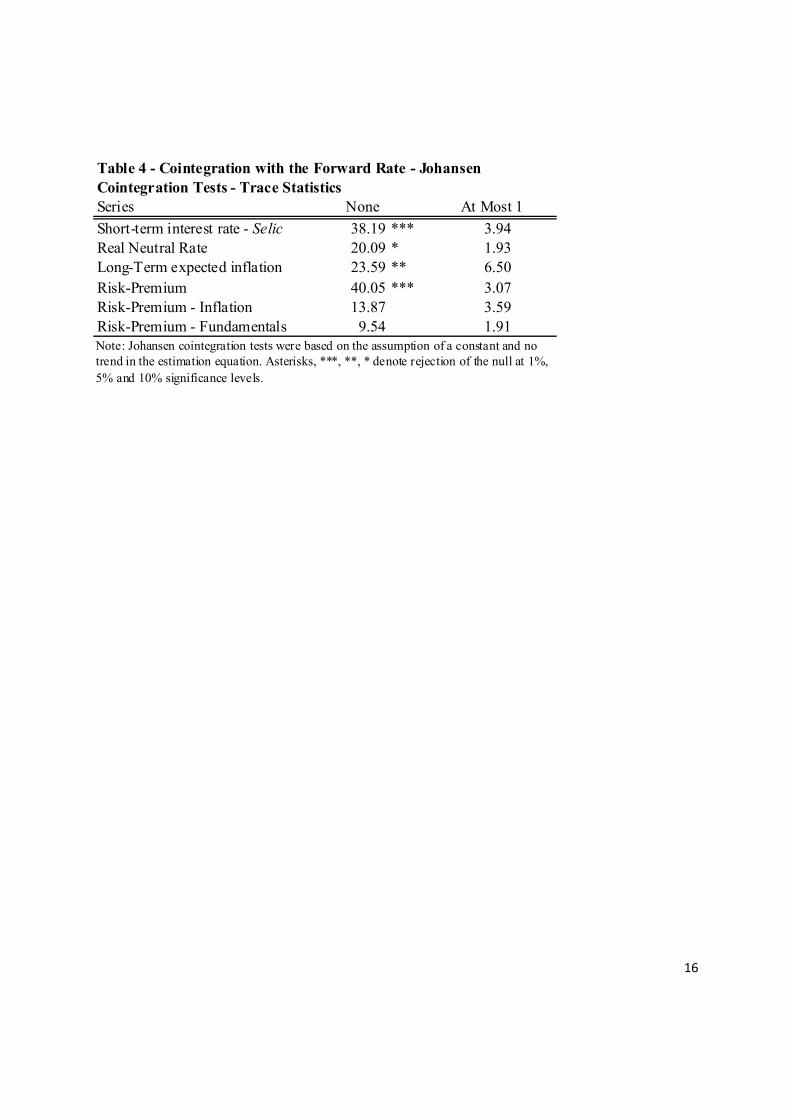
Given the presence of unitary roots on the level in all the series, we proceed to test
for the presence of a cointegration relation between the short-term and each component of
the forward rate. Using Johnasen’s (1991) cointegration tests, we find in Table 4 that the
forward rate cointegrates with the short-term interest rate and each of the components, the
real neutral rate, the long-term expected inflation and the aggregated risk premium.3 The
hypothesis that there is a relation of cointegration is rejected individually in relation to all
the components.
[TABLE 4 ABOUT HERE]
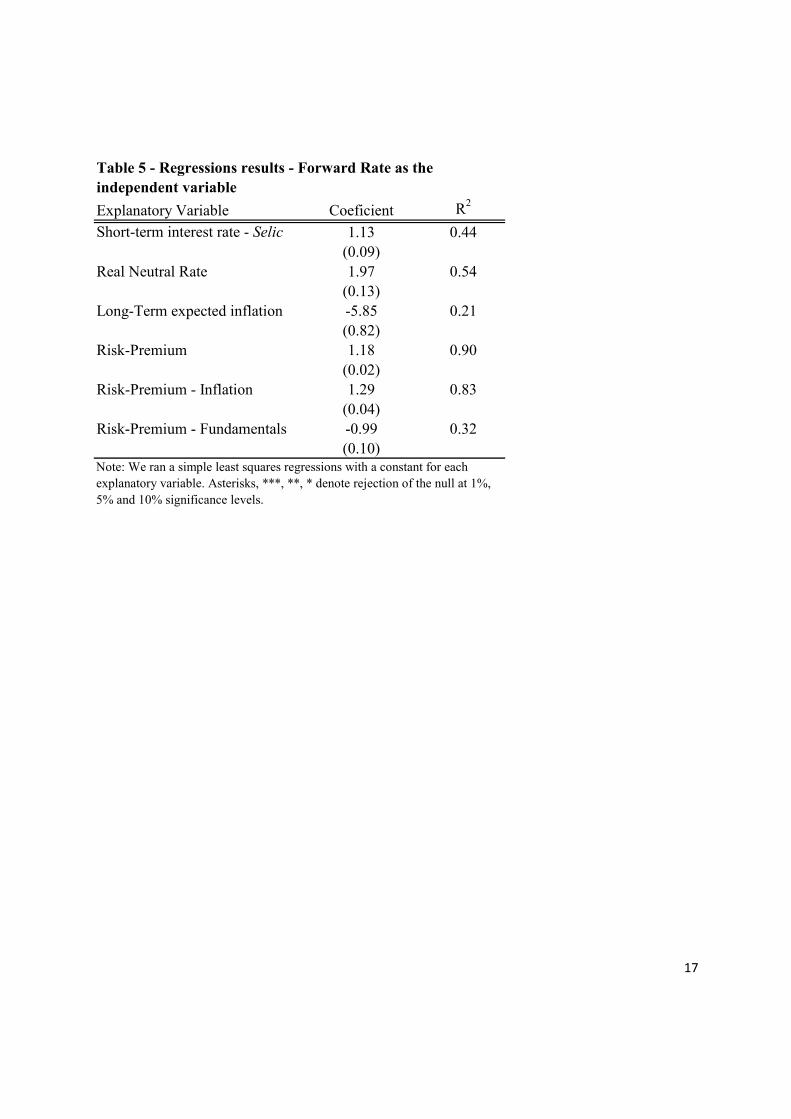
Taking into consideration the above results, regressions were estimated in levels
using as an independent variable the forward rates and the short-term interest rate and each
factor component of the forward rate individually as explanatory variables. The results are
displayed in Table 5. Looking at the R2 values, and considering only the variables that
cointegrate with the forward rate, the results point to the high explanatory power of the risk
premium. Real neutral rates seems to play a secondary role in explaining forward rates,
while expected inflation rates do not have an important role. Finally, we find evidence of a
positive relationship between short-term interest rates and forward rates. As expected, the 3 One possibility for finding no cointegration relationship with the inflationary risk premium and the macroeconomic fundamentals risk premium may be due to the fact that we have a shorter sample for these two series.
10
conundrum effect observed in the 2003–2004 tightening monetary policy episode, where
this relationship is negative, is the exception not the common case.
[TABLE 5 ABOUT HERE]
5 – Conclusion
This article has analyzed the impacts of monetary policies on the Brazilian term
structure by focusing on three episodes of monetary policy tightening, 2002/2003,
2004/2005 and 2008, with the continuous increase in the short-term monetary policy
interest rate, the Selic. The decomposition of long-term rates has allowed us to explain how
these three episodes had an impact on the various components of the long-term rates.
The results show that, in all the events of policy tightening, increasing interest rates
implied a fall in the risk premium. Regarding the final effect of two-year interest rates and
forward rates, we had different results in each episode: a sharp decrease in the first episode,
the conundrum effect in the second and an increase in the last one. Concerning the analysis
of the determinant factors of the term rates, the almost-total importance of the risk premium
to explain the variations in the term rates in Brazil was clear. Real neutral interest rates
present a secondary contribution.
In a final thought, we conclude that this paper contributes to understanding links
between the monetary policy and the determinants of long-term interest rates. In our
application to the Brazilian economy, we observe that monetary policy episodes were
successful in reducing the risk premium and the real neutral interest rate from 2002 to the
beginning of 2009, improving the credibility of Brazil’s Central Bank to control inflation.
In spite of this, the hypothesis that this improved credibility is strongly biased cannot be
excluded because it happened in a period of relative macroeconomic stability. In the future,
longer databases with periods of relative turbulence will help to shed further light on this
question.
11
References
Campbell, J. Y., 1995, Some lessons from the yield curve, Journal of Economic
Perspectives 9(3), 129-152.
Carlstrom, C. and T. Fuerst, 2004, Expected inflation and TIPS, Federal Reserve Bank of
Cleveland, Economic Commentary, November.
De La Torre, A. and S. Schmukler, 2004, Coping with risks through mismatches: Domestic
and international financial contracts for emerging economies, International Finance, 7(3),
349-390.
Estrella, A., 2005, Why does the yield curve predict output and inflation?, Economic
Journal 115(505), 722-44.
Fama, E. F., 2006, The behaviour of interest rates, The Review of Financial Studies 19(2),
359-379.
Garcia, M. and A. Lowenkron, 2005, Medium run effects of short run inflation surprises:
monetary policy credibility and inflation risk premium, PUC-Rio, Texto para discussão, nº
508.
Johansen, S., 1991, Estimation and Hypothesis Testing of Cointegration Vectors in
Gaussian Vector Autoregressive Models. Econometrica, v. 59, p.1551–1580.
Kozicki, S. and G. Sellon, 2005, Longer-term perspectives on the yield curve and monetary
policy, Federal Reserve Bank of Kansas City Economic Review, 4th quarter, 90(4), 5-33.
Nelson, C.R. and A.F. Siegel, 1987, Parsimonious modeling of yield curve, Journal of
Business 60, 473-489.
12
Wu, T., 2003, Stylized facts on nominal term structure and business cycles: An empirical
VAR study, Applied Economics 35(8), 901-06.
13
TABLES
Table 1 - Descriptive Statisitcs
Series Mean Maximum MinimumShort-term interest rate - Selic 16.8 4.1 26.50 11.25 1751One-year interest rate 17.3 5.0 32.69 10.69 1751Two-year interest rate 17.9 6.1 39.28 10.35 1751Forward rate (year 1 to 2) 18.5 7.4 46.20 9.77 1751Real Neutral Rate 7.6 1.7 10.17 4.58 1751Long-Term expected inflation 4.8 0.9 8.00 3.74 1751Risk Premium 5.1 5.3 27.77 0.31 1751Risk-Premium - Inflation 1.7 1.2 6.43 -0.70 1302Risk-Premium - Fundamentals 1.0 1.0 3.69 -1.07 1302
Standard Deviation
Number of Obs.
Note: The full sample, 1751 observations, has irregular daily data from 1/2/2002 to 2/10/2009, the smaller sample with 1302 observations goes from 10/23/2003 to 2/10/2009.
14
Table 2 - Monetary policy tightening episodes - 2002:01 - 2009:02
Episode Date Value ∆ Value ∆ Value ∆ Value ∆ Value ∆ Value ∆Start 15-Oct-02 18.00% 37.02% 43.48% 9.19% 4.80% 25.39%Mid-point 21-Nov-02 22.00% 4.00% 36.33% -0.69% 42.39% -1.09% 8.42% -0.76% 6.78% 1.98% 22.99% -2.40%End 20-Feb-03 26.50% 8.50% 32.30% -4.72% 35.34% -8.14% 8.36% -0.83% 7.71% 2.92% 15.96% -9.44%
Start 16-Sep-04 16.00% 18.18% 18.59% 8.63% 5.21% 3.76%Mid-point 16-Dec-04 17.75% 1.75% 17.11% -1.07% 16.62% -1.97% 8.60% -0.03% 5.03% -0.18% 2.25% -1.52%End 19-May-05 19.75% 3.75% 17.82% -0.36% 16.66% -1.93% 9.65% 1.02% 4.81% -0.40% 1.51% -2.25%
Start 17-Apr-08 11.25% 13.42% 13.95% 4.98% 4.16% 4.21%Mid-point 5-Jun-08 12.25% 1.00% 14.44% 1.02% 14.97% 1.02% 5.14% 0.16% 4.41% 0.25% 4.73% 0.52%End 11-Sep-08 13.75% 2.50% 14.49% 1.07% 14.39% 0.44% 5.72% 0.74% 4.50% 0.34% 3.54% -0.67%
Monetary Policy Rate Forward Rate Expected Inflation Risk PremiumReal Neutral Rate
Two-year interest rate
Note: The tightening monetary policy episode is defined by an increase minimum of 100 basis points on the monetary policy interest rate. The start date is the day of the first increase and the last date is the date of the last increase; the mid-point is defined as the median meeting of the whole monetary tightening period.
15
Table 3 - Unit Root Tests
Series T-stat P-Value T-stat P-ValueShort-term interest rate - Selic -0.962 0.768 -0.596 0.869Forward rate (year 1 to 2) -1.359 0.604 -1.532 0.517Real Neutral Rate -0.325 0.919 -0.305 0.922Long-Term expected inflation -2.215 0.201 -2.370 0.151Risk Premium -1.764 0.399 -1.955 0.307Risk-Premium - Inflation -1.907 0.329 -2.118 0.238Risk-Premium - Fundamentals -1.004 0.754 -1.226 0.665Note: In both test the null hypothesis is that the series has a unit root
ADF Phillips-Perron
16
Series Short-term interest rate - Selic 38.19 *** 3.94 Real Neutral Rate 20.09 * 1.93 Long-Term expected inflation 23.59 ** 6.50 Risk-Premium 40.05 *** 3.07 Risk-Premium - Inflation 13.87 3.59 Risk-Premium - Fundamentals 9.54 1.91
None At Most 1
Note: Johansen cointegration tests were based on the assumption of a constant and no trend in the estimation equation. Asterisks, ***, **, * denote rejection of the null at 1%, 5% and 10% significance levels.
Table 4 - Cointegration with the Forward Rate - Johansen Cointegration Tests - Trace Statistics
17
Explanatory Variable Coeficient R2
Short-term interest rate - Selic 1.13 0.44(0.09)
Real Neutral Rate 1.97 0.54(0.13)
Long-Term expected inflation -5.85 0.21(0.82)
Risk-Premium 1.18 0.90(0.02)
Risk-Premium - Inflation 1.29 0.83(0.04)
Risk-Premium - Fundamentals -0.99 0.32(0.10)
Note: We ran a simple least squares regressions with a constant for each explanatory variable. Asterisks, ***, **, * denote rejection of the null at 1%, 5% and 10% significance levels.
Table 5 - Regressions results - Forward Rate as the independent variable
18
FIGURES
Figure 1 – Short-term interest rate (Selic) and Forward Rate
8
12
16
20
24
28
32
36
40
44
48
2002 2003 2004 2005 2006 2007 2008
Forward Rate - 1 to 2 yearsShort Term Interest Rate - Selic
19
Figure 2 – Decomposition of the forward rate – full sample – January 2, 2002 to February, 10, 2009.
.04
.08
.12
.16
.20
.24
.28
.32
.36
.40
2002 2003 2004 2005 2006 2007 2008
Real Neutral RateExpected Long-Run InflationRisk Premium
20
Figure 3 – Decomposition of the forward rate – sub-sample – October 23, 2003 to February 10, 2009.
.04
.06
.08
.10
.12
.14
.16
.18
.20
2004 2005 2006 2007 2008
Real Neutral RateExpected Long-Run InflationRisk Premium - InflationRisk Premium - Fundamentals


