Embed Size (px)
Citation preview
The Impact of Earnings on the Pricing of Credit Default Swaps
Jeffrey L. Callen*, Joshua Livnat** and Dan Segal*
ABSTRACT This study evaluates the impact of earnings on firm credit risk as captured by Credit Default Swaps (CDS). We find that earnings (changes) are negatively correlated with one-year swap premia (changes) after controlling for equity returns but not with longer term premia (changes). We also find that earnings surprises are significantly correlated with one-year CDS premia changes in the short window surrounding preliminary earnings dates and that absolute earnings surprises are significantly correlated with absolute one-year CDS premia changes in the short window surrounding SEC filing dates. These results suggest that high earnings convey favorable information about the short-term default risk of firms but not about the long term default risk. We further document that accruals/cash flow information conveyed by SEC filings provides information about long-term credit risk. Furthermore, the empirical results are consistent with structural and hybrid model-driven implications of CDS pricing. * Rotman School of Management University of Toronto 105 St. George St. Toronto Ontario Canada M5S 3E6 e-mail Callen: callen @rotman.utoronto.ca e-mail Segal: [email protected] ** Stern School of Business New York University New York, NY USA 10012 e-mail: [email protected]
JEL: G12, G14, M41
Keywords: Credit Default Swaps, Credit Risk, Earnings
The Impact of Earnings on the Pricing of Credit Default Swaps
ABSTRACT
This study evaluates the impact of earnings on firm credit risk as captured by
Credit Default Swaps (CDS). We find that earnings (changes) are negatively correlated
with one-year swap premia (changes) after controlling for equity returns but not with
longer term premia (changes). We also find that earnings surprises are significantly
correlated with one-year CDS premia changes in the short window surrounding
preliminary earnings dates and that absolute earnings surprises are significantly
correlated with absolute one-year CDS premia changes in the short window surrounding
SEC filing dates. These results suggest that high earnings convey favorable information
about the short-term default risk of firms but not about the long term default risk. We
further document that accruals/cash flow information conveyed by SEC filings provides
information about long-term credit risk. Furthermore, the empirical results are consistent
with structural and hybrid model-driven implications of CDS pricing.
1
1. Introduction
There is voluminous evidence regarding the impact of earnings and accounting
information generally on equity investors. By contrast, very little is known about how
earnings and other accounting information impact on other stakeholders of the firm. This
lacuna is especially troubling since from the perspective of the FASB’s conceptual
framework, corporate financial reports are general purpose statements that serve as
potential inputs into the decision making calculus of all of the firm’s stakeholders. The
paucity of evidence regarding the impact of accounting information generally and
earnings in particular on non-equity capital markets likely stems from the limited
liquidity of these markets. Corporate bonds, for example, do not trade very often by
comparison to equities, and short-term changes in published bond prices are often
insensitive to small changes in the default risk, which is precisely what earnings and
balance sheet information (such as leverage and liquidity) can be most useful in
measuring. Proxies for bond risk such as credit ratings are also very sticky so that impact
of accounting information on short-window changes in bond risk is equally difficult to
ascertain from ratings data.
The purpose of this paper is to evaluate the impact of earnings on short- and long-
window changes in firm credit risk, as captured by Credit Default Swaps (CDS). Credit
risk is of concern to many of the firm’s stakeholders including stockholders, bondholders,
bank lenders, customers, employees and regulators. In particular, we investigate whether
earnings and other balance sheet information (using preliminary earnings announcements
and SEC filings) impact on the price of credit risk as reflected in CDS premia (spreads).
2
Our results show that the levels of one-year, but not five- or ten-year, CDS premia
are inversely related to quarterly earnings, implying that higher profits signify lower
default risk in the short-run but not the long-run. We also show that changes in one and
five-year CDS premia over the quarter are inversely related to earnings changes over the
quarter, and that short-window one-year CDS premia changes around preliminary
earnings announcements are inversely related to earnings surprises, further indicating that
higher earnings are interpreted by market participants as evidence of lower short-run
default risk. Absolute values of short-window changes in one-year CDS premia around
SEC filing dates are found to be associated with the absolute value of earnings surprises,
indicating that the additional information in SEC filings are used by market participants
in reinterpreting the effects of preliminary earnings surprises on CDS premia. Finally, we
show that the changes in ten-year CDS premia around SEC filing dates are positively
(negatively) associated with the accruals (cash flows) components of earnings. This
finding is consistent with the notion that higher accruals (cash flows) are indicative of
lower (higher) quality earnings, and therefore of higher (lower) risk of default. All of
these enumerated results hold even controlling for the earnings information contained in
equity returns
In what follows, Section 2 briefly describes the CDS market. Section 3 develops
the hypotheses to be tested. Section 4 describes the sample. Section 5 presents the
empirical analysis. Section 6 concludes.
2. The CDS Market

3
Financial innovation has led to the creation of credit derivatives to manage credit
risk. Surveys indicate that the outstanding notional amount of credit derivatives reached
$8.42 trillion by the end of 2004, more than double the size of the total equity derivatives
market of $4.15 trillion at the same date. The growth in credit derivatives can be
attributed to four market participants. The largest group in the credit derivatives market is
comprised of large commercial banks, who are net buyers of credit derivative protection.1
Traditionally, a bank’s business involves credit risk if only because of corporate loan
originations. Unlike securitizations, credit derivatives offer banks an attractive way to
transfer credit risk without removing the loans from their balance sheets and without
directly involving borrowers. In addition, credit derivative contracts allow banks to
diversify their portfolios, which often are concentrated in certain industries or geographic
areas. Insurance companies comprise the second largest group. They are increasingly
becoming dominant participants in the credit derivative market as they attempt to
enhance investment yields. Globally, insurance companies have net sold positions in the
credit derivative market since they primarily sell insurance protection. Other participants
include financial guarantors, who are also net protection sellers, and global hedge funds.
The most common credit derivative is the single-name credit default swap (CDS).
The CDS market has grown rapidly in no small part due to the standardization of CDS
contract definitions in 1998 by the International Swaps and Derivatives Association,
since amended a number of times. A CDS is an over-the-counter contract that provides
protection against credit risk. Not unlike a common insurance contract, the protection
1 See Minton et al. (2006).

4
buyer pays a fixed premium, the spread, to the protection seller for a period of time.2 If a
certain pre-specified credit event occurs to a specific company, called the reference
entity, the protection seller pays compensation to the protection buyer. A credit event can
be the bankruptcy of the reference entity or a bond default by the reference entity. If the
protection buyer does not hold the reference bond, then compensation is in the form of a
lump sum payment equal to the difference between the value of the reference entity’s
bond and its face value. Alternatively, if the protection buyer holds the bond, the
compensation can be either in the form of a lump-sum payment or the protection buyer
can deliver the reference entity’s bond to the protection seller for its face value. If no
credit event occurs during the term of the swap, the protection buyer continues to pay the
swap premia until maturity.
The premium paid by the protection buyer to the seller is quoted in basis points
per annum of the contract’s notional value--typically $10 million--and is usually paid
quarterly. For example, suppose that the CDS spread for a five-year $10 million contract
on the Siemmens Corporation is 200 basis points and the credit event is defined to be
default of Siemmens’ bonds. This means that the protection buyer pays $50,000 (two
percent of $10M) per quarter to the protection seller for 5 years or until Siemmens
defaults on its bonds. In the event that Siemmens defaults on its bonds, the protection
buyer, in turn, has the right to sell Siemmens’ bonds to the protection seller for their face
value of $10 million. Maturities typically range from one to ten years, with the five-year
maturity being the most common.
2 Unlike standard insurance, it is not necessary to hold an insured asset (e.g., the underlying bond or loan) in order to claim ‘compensation’ with a CDS. Speculators can take long (short) positions in credit risk by selling (buying) protection without having to trade the cash instrument.
5
Although the credit risk profile of a CDS is similar to that of a corporate bond of
the reference entity, CDS premia offer many advantages over corporate bond yield
spreads for analyzing the pricing determinants of credit risk.3 First, as shown by Elton et
al. (2001), as much as 85 per cent of corporate bond yield spreads can be explained as a
reward for bearing systematic risk unrelated to default. Second, unlike CDS spreads that
reflect pure credit risk, bond yields are a function of many factors, such as interest rate
risk. As a consequence, small changes in profitability or leverage that affect default risk
are unlikely to cause significant enough changes in bond yield spreads by comparison to
CDS premia. Third, unlike bond yield spreads, no benchmark risk-free rate need be
specified for CDS premia. Fourth, CDS premia are not distorted by embedded options
features such as calls and covenants as are bond yields.4
In addition, there are a number of institutional differences in the market for bonds
and CDS which contributed to the phenomenal growth in CDS trading. First, a CDS does
not require initial funding, which allows for leveraged positions. Second, a CDS
transaction can be entered into even if a cash bond of the reference entity at a particular
maturity is not available. Finally, by entering a CDS contract as a protection seller, an
investor can easily create a short position in the reference entity’s credit.
Although the CDS premium is related to credit ratings by rating agencies, there is
quite a variation in CDS spreads that are observed for firms with a given credit rating.
Unlike credit ratings which tend to be “sticky” and are a function of many factors other
3 The corporate bond yield spread is usually defined as the yield differential between the corporate bond yield and a AAA or US Treasury Bond of similar maturity. 4 Other disadvantages of bond yield spreads include tax differentials in bond pricing and evidence that the bond market lags the CDS market in incorporating timely credit risk information. On the latter issue, see Blanco et al. (2005) and Zhu (2004).

6
than credit risk, CDS rates tend to lead changes to the credit profile of the reference entity
and reflect only the credit risk of the reference entity.5
Overall, the superiority of CDS prices over bond yield spreads and credit ratings
allows for a more rigorous empirical analysis of the relation between financial
information and credit risk.
3. Literature and Hypotheses Development
The finance literature proposes two model types to explain the pricing of credit
derivates, structural models and reduced form models. Structural models are based upon
the seminal paper by Merton (1974). The structural modeling approach links the prices of
credit risky instruments directly to the economic determinants of financial distress and of
loss given default, conditional on knowing the firm’s asset value process.6 These models
imply that the main determinants of the likelihood and severity of default are financial
leverage, the value and volatility of the firm’s assets, and the risk-free rate of interest.
Despite the intuitive appeal of structural models and their strong theoretical
underpinnings, the direct use of structural models to price credit derivatives typically
yields poor results, probably because the parameters of the firm’s asset value process are
difficult to observe.7
Reduced form models such as those by Das (1995), Das and Sundaram (1998) and
Hull and White (2000a, 2000b) do a better job at directly pricing credit derivatives. The
5 See Hull et al. (2004) regarding the relationship between credit rating changes, CDS premia and bond prices. A number of paper examine the impact of credit rating changes, as measures of default risk changes, on equity returns including Dichev and Piotroski (2001), Vassalou and Xing (2003), and Jorion and Zhang (2005). 6 See for example Black and Cox (1976), Leland and Toft (1996), Longstaff and Schwartz (1995) and Collin-Dufresne and Goldstein (2001) 7 See most recently Eom, Helwege and Huang (2004).
7
firm’s asset value process is abandoned. Instead, reduced form models exogenously
postulate the dynamics of default probabilities. However, reduced form models tend to be
“black boxes” that are silent about the underlying determinants of the price of credit risky
instruments. Somewhat better economic insights are provided by hybrid models that
feature both structural and reduced form elements, such as those by Duffie and Lando
(2001) and Buhler and Thabe (2006)
Rather then trying to directly price credit derivatives using structural models, we
follow the more recent regression approach of Collin-Dufresne, Goldstein, and Martin
(2001) (CGM).8 They “borrow” from the structural approach to identify the theoretical
determinants of credit risk. These determinants are then used as independent variables to
explain corporate credit spreads, rather than inputs to a particular structural model.
Although CGM themselves estimate bond yield spreads,9 a similar approach using CDS
premia is taken by Cossin and Hricko (2001), Aunon-Nerin et al (2002), Abid and Naifar
(2005), and Ericsson et al (2005).
Based on a sample of 393 multi-country CDS transactions, Cossin and Hricko
(2001) and Aunon-Nerin et al. (2002) estimate levels regressions to examine whether
leverage, credit ratings, US and other national risk-free interest rates, the slope of the
(US) yield curve, stock prices, time to maturity, stock volatility, market capitalization
(liquidity), and country stock index returns explain CDS spreads. Depending upon the
specific levels regression10, they find that a number of these factors significantly explain
8 One can think of the linear regressions in this paper as a first-order approximation to a structural model. 9 The relationship between bond yield spreads and CDS premia is a topic of active research in the finance literature. See, for example, Blanco et al. (2005) and Longstaff et al. (2005). Another related active area of research is the relationship between equity returns and credit risk as reflected in credit derivative prices. See most recently Chan-Lau (2006). 10 Interestingly, they do not regress CDS premia on all of the explanatory variables simultaneously, possibly because of multicollinearity.
8
CDS spreads in the hypothesized direction, most crucially credit ratings, leverage, stock
prices and the slope of the yield curve.
Using a sample of 207 multi-country CDS transactions, Abid and Naifar (2005)
analyze the relation between credit swap rates and such determinants as credit rating,
time to maturity, the riskless interest rate, the slope of the yield curve, and the volatility
of equities. In a series of (essentially bivariate) levels regressions involving credit ratings
and one other determinant, they find that most of the determinants that they investigate
are significant.
Erricson et al. (2005) employ a far more comprehensive sample of approximately
10,000 daily bid and offer quotes on US corporations with an approximate five-year
maturity to analyze the relation between credit spreads and its determinants. Various
(panel data and time series) levels and difference regressions are estimated with
explanatory variables including leverage, long and short term risk-free interest rates, the
slope of the yield curve, the smirk slope, stock volatility, and the S&P index return.
Separate regressions are run for high and low rating firms and for bid and offer quotes.
Not surprisingly they find that the levels regressions are far more significant than the
difference regressions. Overall, they find that leverage, stock volatility and the interest
rate are significant and of the hypothesized sign.
It bears emphasizing that none of these empirical papers investigate the impact of
earnings on credit swap spreads. One can offer two reasons as to why the literature has
failed until now to incorporate earnings as a determinant of credit derivative pricing.
First, earnings per se are not a direct determinant of premia in “pure” structural and
reduced form credit derivative pricing models. Second, earnings may be subsumed by
9
equity returns which are in turn a function of earnings (Ball and Brown (1968)). Neither
reason is compelling. In structural models, the price of credit derivates is a function of the
likelihood and severity of financial distress (the credit event), and the more profitable is
the firm, the less likely it is to suffer from financial distress. Furthermore, earnings play a
role (as do other types of accounting information) in estimating the true asset dynamics
and the default probability of the firm in hybrid models where there is imperfect
information about the asset dynamics.11 Moreover, the extent to which earnings are
subsumed by equity returns in the pricing of credit derivatives can be dealt with by
controlling for equity returns in the regressions.
Increased profitability of the reference entity, as measured by current accounting
earnings, should reduce its credit risk since, with increased profitability, the reference
entity is less likely to go bankrupt or to default on a bond payment. Furthermore, the
shorter the maturity of the CDS, the more likely is an increase (decrease) in profitability
to provide positive (negative) information about the reference entity’s ability to repay
bondholders within the maturity period. Contrariwise, longer term maturities are less
likely to be affected by current earnings since what matters for longer maturities is the
firms’ ability to pay bondholders in the long run. These considerations yield the
following set of hypotheses stated in the alternative:
H1: The quarter-end CDS premium is inversely related to the reference entities’ quarterly
earnings. The relation between the CDS premium and the reference entities’ earnings is a
decreasing function of CDS maturity.
11 See Duffie and Lando (2001) and Buhler and Thabe (2006). These models are sufficiently abstract that they rationalize the use of accounting information generally, in contrast to earnings per se.
10
H2: The percent change in the CDS premium over the quarter is inversely related to the
change in the reference entities’ quarterly earnings. The relation between the percent
change in the CDS premium and the change in the reference entities’ earnings over the
quarter is a decreasing function of CDS maturity.
H3: The percent change in the CDS premium in the short window centered on the
preliminary earnings announcement is inversely related to the reference entities’ earnings
surprise. The relation between the percent change in the CDS premium around the
preliminary earnings announcement and the reference entities’ earnings surprise is a
decreasing function of CDS maturity.
All three hypotheses are similar but expressed at different levels of timing
aggregation. H1 refers to the relation between the level of the CDS premium and the level
of the reference entity’s quarterly earnings. H2 refers to the relation between the change
in the CDS premium and the change in the reference entity’s earnings over the quarter.
H3 refers to the short-window relation between the CDS premium and preliminary
earnings announcements.
The relationship between the price of credit risk and SEC filings announcements
is bound to be more complex than that of the price of credit risk and preliminary earnings
announcements. First, since SEC filings typically come after the preliminary earnings
announcement, it is unclear whether the SEC filing represents good or bad news a priori.
Rather, as far as the earnings number is concerned, the SEC filing potentially provides
11
new information that revises the information content of the preliminary earnings. One
possible reason for the reinterpretation of the preliminary earnings number is the
additional information, if any, conveyed by the breakdown of earnings into cash flows
and accruals. Second, the SEC filing potentially provides new information about the
firms’ assets and liabilities that may be more germane for evaluating credit risk than the
information contained in the income statement. Again, we should expect that the
information contained in SEC filings should be more relevant for evaluating the firm’s
more immediate credit risk than longer term credit risk. These considerations lead to our
next two hypotheses:
H4: The absolute value of the percent change in the CDS premium in the short window
centered on the SEC filing date is inversely related to the reference entities’ absolute
earnings surprise. The relation between the percent change in CDS spread around the
SEC filing and the reference entities’ absolute earnings surprise is a decreasing function
of CDS maturity.
H5: The percent change in the CDS premium in the short window centered on the SEC
filing is inversely (positively) related to the reference entities’ cash flow (accruals). The
relation between the change in the CDS spread around the SEC filing date and the
reference entities’ cash flow/accruals is a decreasing function of CDS maturity.
The empirical testing of the hypotheses in this paper is based primarily upon
cross-sectional analyses. Thus, it is crucial to control for factors other than earnings that

12
are known to affect swap spreads. The structural modeling approach links the prices of
credit risky instruments directly to the economic determinants of financial distress and to
the severity of loss given default. These determinants can be divided into (i) factors that
are specific to the reference entity and (ii) macroeconomic factors. These models imply
that the main firm-level determinants of the likelihood and severity of default are
financial leverage, the value of the firm’s assets, and the volatility of those assets. More
specifically, the higher the leverage, the lower the asset value and the more volatile the
assets of the reference entity, the higher is the probability of a credit event and so the
higher is the swap premium. In addition, since ratings provide a noisy measure of credit
risk, we control for credit ratings. We expect that the lower the credit rating, the higher is
the swap premium. Furthermore, since the equity market may lead the CDS market in
incorporating earnings, we also control for firm level equity returns.
The model-driven macroeconomic factors include the riskless rate of interest and
the slope of the yield curve (as proxied by the difference between the riskless long-term
and short-term interest rates). Intuitively, a higher rate of interest increases the drift rate
for the firm’s assets, thereby increasing the firm’s wealth and making bankruptcy less
likely. The slope of the yield curve controls for market expectations about future interest
rate changes. Since the probability of default is likely dependent upon on the business
environment, we also control for the information about future business conditions
contained in aggregate equity returns. Therefore, we expect to find that the higher the
risk-free rate, the greater the yield curve slope and the higher aggregate equity returns,
the smaller is the swap premium.
13
4. Data
The CDS data for 2002 through 2004 are provided by Lombard Risk.12 The data
include sporadic CDS premia quotes in 2002, and daily mid-market mean CDS premia
obtained from market makers in 2003 and 2004. In addition to the CDS premia, the data
contain information about the maturity of the CDS, the currency in which it is
denominated, reference firm identifiers (primarily ticker symbol) and various additional
contract characteristics.13 Given that daily information is available from 2003, we restrict
the CDS data to 2003 and 2004 (2,280,891 daily observations of the various CDS
contracts for 786 firms).
Using the Preliminary Compustat database available to us through Charter Oak
(and now available also on WRDS), we identify for each firm on Compustat the quarterly
preliminary earnings release date and the financial information that was actually
disclosed to market participants in the quarterly preliminary earnings announcements
(e.g., operating cash flows) of 2003 and 2004. In addition, we obtain SEC filing dates for
our sample firms from S&P’s Compustat (but not through the regular Compustat
database).
Merging the two datasets using ticker symbols, and requiring CDS data around
the preliminary earnings release date or the financial statement filing date, results in a
sample of 476 (2,211) firms (firm-quarters) and 26,021 CDS contracts.14 We then
categorize the CDS contracts into one-year, five-year and ten- year maturities, in order to
12 http://www.lombardrisk.com/ 13 The CDS contract data include maturity, seniority rank, currency, recoverability clauses, restructuring clauses and other factors. For example, on Nov. 30, 2004, the data include quotes on 16 CDS contracts of Bristol Myers Sqibb (ticker = BMY), the reference firm. These contracts differ in their maturity, recoverability clause, restructuring clause, and currency. 14 The matching is done by using the historical ticker symbols available to us through the Charter Oak Point In Time database.
14
investigate whether the impact of the financial information on CDS premia depends on
the maturity of the contract. In addition, we require that the sample CDS contracts have
similar characteristics other than maturities. Specifically, all CDS contracts in our sample
are dominated in US dollars, classified as senior, and have identical recoverability and
restructuring clauses. These restrictions reduce the sample to 4,143 CDS contracts (1,214,
1,596 and 1,333 for one-year, five-year, and ten-year maturities, respectively), and 1,634
firm-quarters (401 firms).
Stock returns and financial information for the sample firms are obtained from
CRSP and Compustat, respectively.
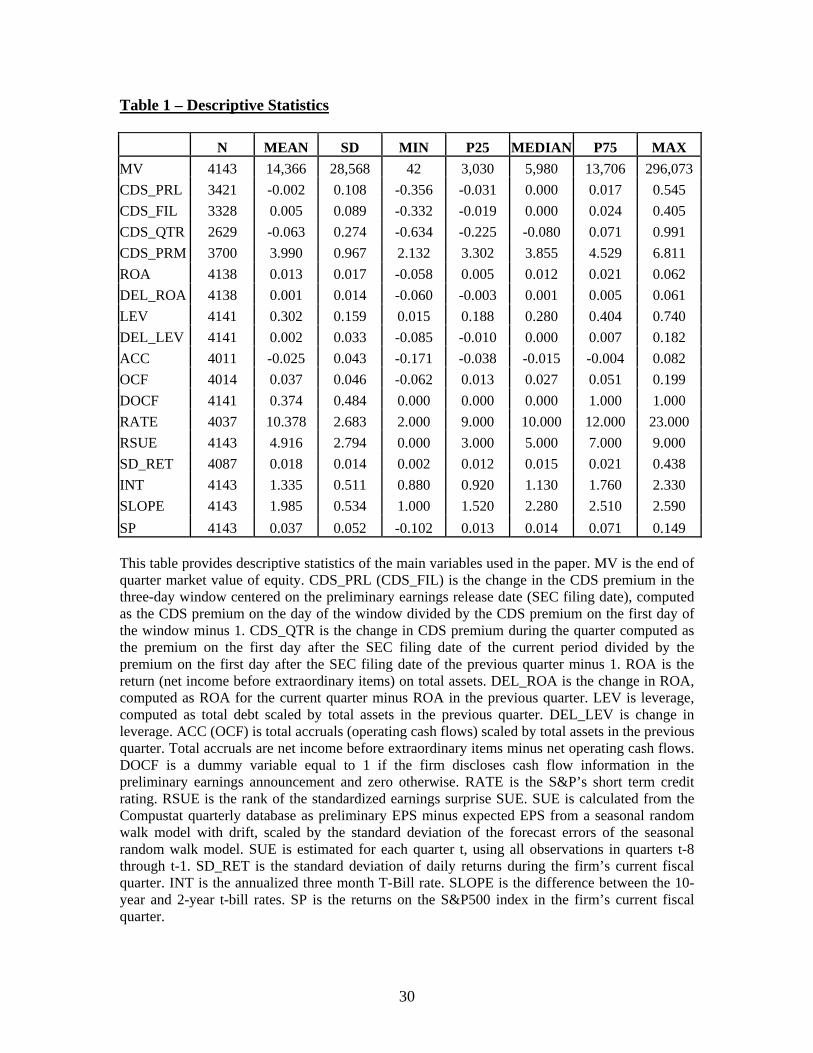
Table 1 presents descriptive statistics for our sample observations. The firms
covered in the database are large; the mean (median) firm has a market value of 14.366
(5.98) billion dollars. Thus, the results reported in this study are likely not generalizable
to smaller firms. The percentage change of the CDS premium in the 3-day window
centered on the preliminary earnings announcement date, CDS_PRL, has a mean
(median) of -0.002 (0.000), or -0.2% of the CDS premium at the beginning of the
window. Similarly, the percentage change of the CDS premium in the 3-day window
around the SEC filing has a mean of 0.5% and a median of 0.0%. The percentage change
in the CDS premium from one day after the SEC filing date of the previous quarter
through one day after the SEC filing date of the current quarter, CDS_QTR, has a mean
(median) of -6.3% (-8%), implying that CDS premia tend to decrease with the additional
information learned throughout the quarter. The log of the CDS premium on the first day
after the financial statement filing date, CDS_PRM, has an average (median) value of
3.99 (3.86) basis points, and varies between 2.1 and 6.8 basis points.
15
(Insert Table 1 about here)
The mean quarterly return on assets (ROA), which is income before extraordinary
items and discontinued operations scaled by total assets at the end of the quarter, is 1.3%,
which is reasonable considering the large firm bias in the sample. The change in ROA
from the previous quarter has a mean (median) of 0.001 (0.001), indicating that most
firms had positive earnings growth, which is consistent with the negative percentage
change in the mean CDS premium over the quarter. Leverage, estimated as total debt
divided by total assets at quarter end, has a mean (median) of 0.302 (0.280). The change
in leverage over the quarter has a mean of 0.002 and a median of 0.000, suggesting a
slight increase in leverage. The quarterly net operating cash flow (accrual) scaled by total
assets at the previous quarter-end has a mean of 3.7% (-2.5%), which is in line with prior
studies. As indicated by the Charter Oak database, about 37% of the firms in our sample
reported (net) operating cash flows in the preliminary earnings announcement. The S&P
senior debt rating for the sample observations (RATE) shows considerable variation with
ratings of AAA (code 2) through CC (Code 23). RSUE is the rank (0 is the lowest rank and 9
is the highest) of the standardized earnings surprise (SUE). SUE is calculated from the Compustat
quarterly database as preliminary EPS minus expected EPS, where the latter is computed from a
seasonal random walk model with a drift scaled by the standard deviation of the forecast errors of
the model. SUE is estimated for each quarter t, using all observations in quarters t-8 through t-1.
The ranking of the earnings surprise is with reference to all firms in Compustat. The table
shows that the earnings surprises of our sample firms are distributed evenly from the
most negative surprise (lowest rank) to the most positive surprise (highest rank). The
other variables that are important in determining CDS premia (the volatility of returns,
16
the interest rate slope, and the return on the S&P 500 Index) show considerable variation
as well during our sample period.
5. Empirical Results
To test our hypotheses, we use all sample observations with maturities of one,
five and ten years. Our tests involve regression analysis where the dependent variables
are levels or changes in CDS premia and the independent variables are earnings, other
model-driven and control variables specified above that are potentially important in
explaining CDS premia. To control for different maturities, we interact all of the
independent variables with two dummy variables, D5 (D10), that equal “1” if the
maturity is five (ten) years. To control for firm and time effects and to reduce potential
multicollinearity in the pooled regression, we use demeaned independent variables and
allow for firm and year fixed effects in our analyses. The tables below report the
estimated coefficients in three columns: the base case with no interaction terms
corresponds to the one year maturity CDS contract (CDS_1), the estimated coefficients of
the interactive terms with D5 (CDS_5), and the estimated coefficients of the interactive
terms with D10 (CDS_10). Thus, the table coefficients for the columns headed CDS_5
and CDS_10 measure the incremental association of the variable with CDS premia
beyond that of the one-year maturity. We also report at the bottom of the tables, certain
tests of significance involving the sum of the tabulated coefficients of CDS_1 and CDS_5
and of CDS_1 and CDS_10.
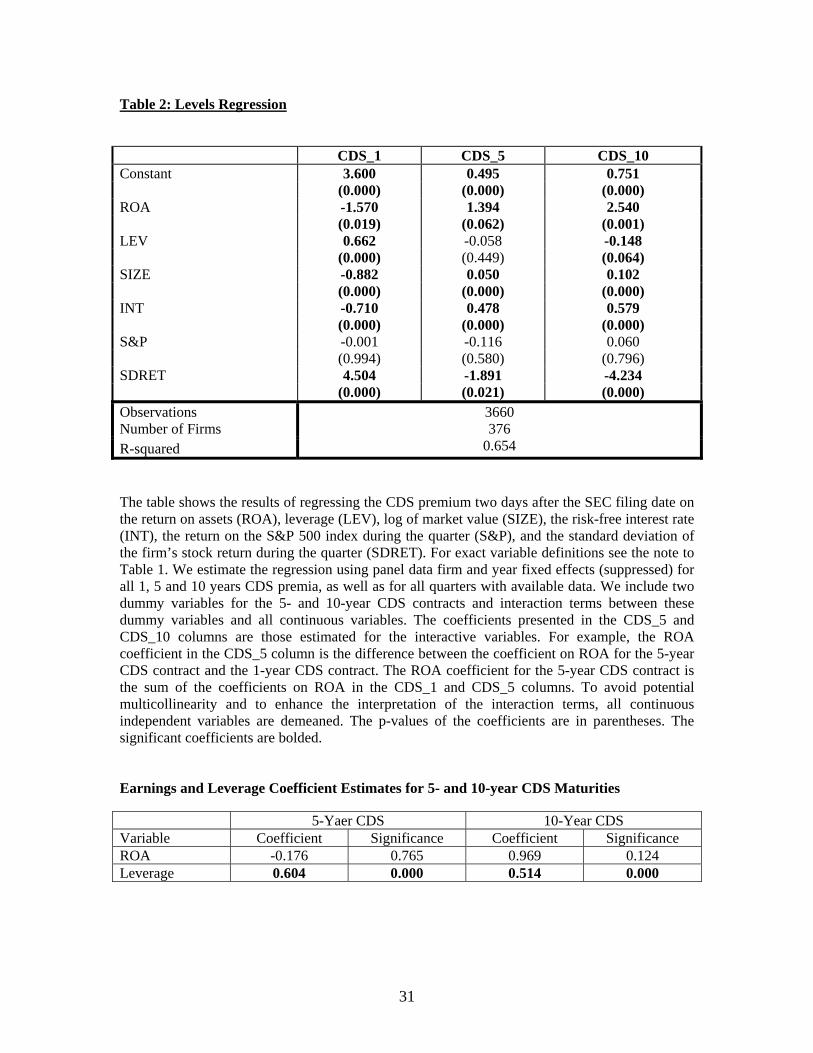
The levels analysis (Hypothesis H1) is described in Table 2. CDS premia one day
after the SEC filing date are regressed on the reference entity’s normalized quarterly
17
earnings (ROA), financial leverage (LEV), size (SIZE), the interest rate (INT), the return
on the S&P 500 index (S&P), and firm return volatility (SDRET). The results strongly
confirm H1. The spread is significantly and inversely related to earnings (p=0.019, two-
tailed) for the one-year maturity consistent with increased profitability, as expressed by
earnings, reducing the price of short-term credit risk. By contrast, the longer CDS
maturities have significantly positive incremental associations with earnings, indicating
that earnings are likely to have less of an impact on CDS premium of mid-term and long-
term maturities. Indeed, the tests at the bottom of the table indicate that ROA has an
insignificant association with the 5-year (p=0.765, two-tailed), and 10-year (p=0.124,
two-tailed) CDS premia.
(Insert Table 2 about here)
Table 2 also reveals that CDS premia are positively and significantly (p=0.000,
two-tailed) associated with the firm’s leverage for the one-year maturity, and that these
associations are lower for the five- and ten-year maturities as indicated by the negative
coefficient on the leverage interaction terms. Thus, leverage levels affect CDS premiums,
but more so for short-term maturities than mid-term or long-term maturities. As reported
at the bottom of Table 2, the total effect of leverage on CDS premia for maturities of five
and ten years are positive and significant (p=0.000, two-tailed), and there is a
monotonically declining relationship between the effect of leverage on CDS premia and
CDS maturity.
Table 2 shows that the coefficient estimates of the remaining variables conform to
expectations. The premium increases significantly (p=0.000, two-tailed) with firm
volatility, for the one-year maturity, but the association is attenuated for longer
18
maturities. The premium is negatively and significantly (p= 0.000, two-tailed) associated
with size for the one-year maturity, with monotonically declining associations for the
longer maturities. The interest rate is negatively and significantly (p=0.000, two-tailed)
associated with CDS premia for the one-year maturity, and with monotonically declining
associations for longer maturities. The S&P 500 return during the firm’s fiscal quarter is
not significantly associated with CDS premia.15 The credit rating is not used as a control
variable in this regression because it is highly correlated with size and leverage
(correlations exceed 80%). Substituting the credit rating for size and leverage, yields
(untabulated) a significantly negative coefficient estimate for the credit rating (p=0.000,
two-tailed), so that the higher the credit rating the lower is the CDS premium, and
qualitatively similar results for the other estimated coefficients.16
Overall, the results in Table 2 are consistent with Hypothesis 1. Earnings are
significantly and inversely related to one-year maturity CDS premia but not with 5 and 10
year CDS premia. The lack of significance for the longer maturities likely reflects the fact
that short-term earnings do not provide sufficient information about long-term default
probabilities and/or default losses. Furthermore, the results are consistent with the
predictions of the structural models regarding the other determinants of CDS pricing.
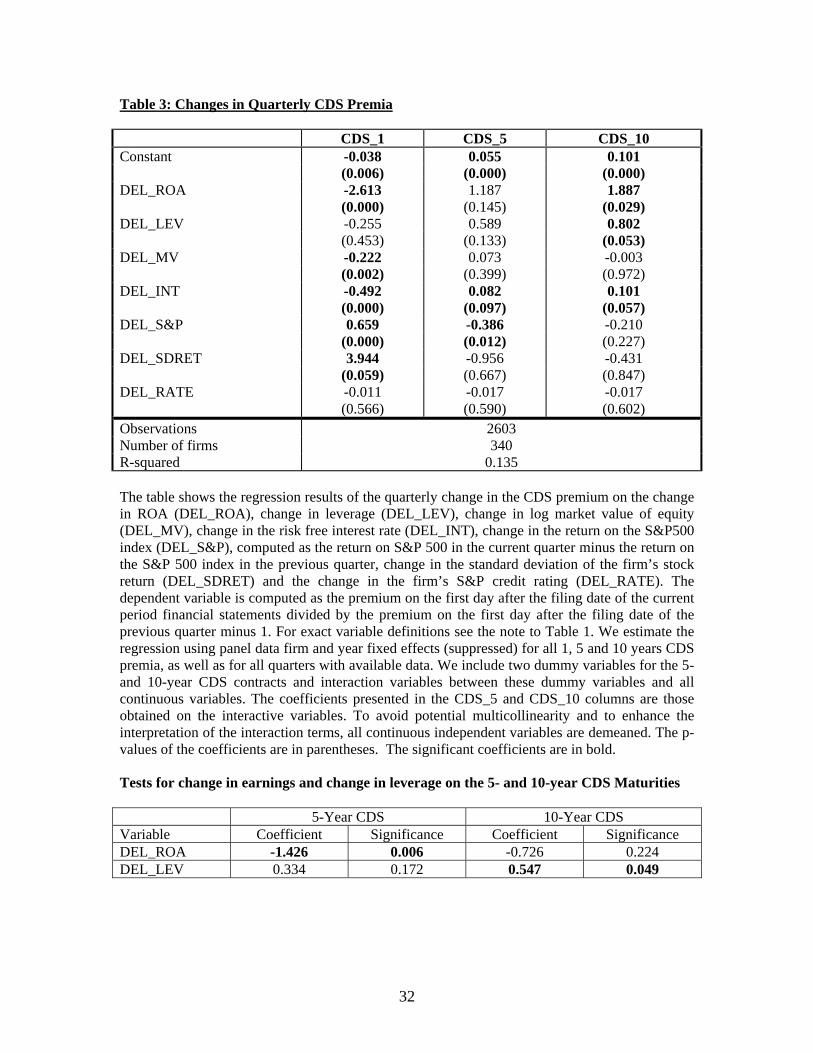
Hypothesis H2 regarding quarterly changes in CDS premia is tested in Table 3.
The dependent variable is the percentage change of the premium as computed from one
day after the prior quarter’s SEC filing date to one day after the current quarter’s SEC
filing date. This window is chosen because all quarterly financial statement information
15 Similar results obtain if we replace the contemporaneous quarter S&P return with the prior quarter S&P return. 16 Using longer term rates instead of the (annualized) 3-month rate yields qualitatively similar results. It proved impossible to control for the slope of the yield curve (SLOPE) because INT and SLOPE are too highly correlated.
19
becomes available to the market on the SEC filing date. The independent variables in
Table 3 are the quarterly changes in the independent variables of the levels analysis
(Table 2) including one additional control variable, namely, the change in the credit
rating. The results in Table 3 are consistent with H2. The change in the premium is
inversely and significantly (p= 0.000, two-tailed) related to the change in earnings
(DEL_ROA) for the one-year CDS, with monotonically declining associations for the
longer maturities. At the bottom of the table, we report that the change in earnings is
inversely and statistically significant for the 5-year CDS (significance level of 0.006), and
is insignificantly different from zero for the 10-year CDS. This is consistent with
quarterly earnings changes affecting short and medium term credit risk, but not long-term
credit risk.
(Insert Table 3 about here)
Surprisingly, Table 3 also shows that quarterly changes in leverage have no
significant association with CDS premium changes for the one- and five-year maturities,
but are positively and significantly (p=0.049, two-tailed) associated with the premium
changes for the ten-year CDS. This implies that changes in leverage are incrementally
more informative (beyond earnings) about the default risk of long-term maturities but not
short-term or even medium-term maturities.
The premium also increases significantly (p= 0.059, two-tailed) with increases in
firm volatility and with changes in the economic environment as captured by the return
on the S&P 500 Index during the firm’s fiscal quarter (p= 0.000, two-tailed) for the one-
year CDS. The spread decreases significantly with increases in the interest rate (p=0.000,
two-tailed) and with firm size (p= 0.006, two-tailed) for the one-year maturity. Since firm
20
size is measured by market value, the latter result also indicates that equity returns do not
swamp earnings changes as an explanatory variable of changes in the CDS premium. In
an untabulated sensitivity analysis, we added the firm’s equity return during the quarter
as an additional control variable to examine whether the change in earnings is significant
over and above the change in equity, since equity returns incorporate earnings changes
(e.g. Ball and Brown (1968) and many other studies). The results indicate that changes in
profitability are still significant in explaining changes in CDS premia after controlling for
equity returns. Thus, earnings include relevant information for the pricing of CDS premia
over and above the information contained in equity returns.
Similar to the findings in Table 2, the coefficients on the interactive terms with
DEL_INT, DEL_S&P and DEL_SDRET indicate weaker effects on the five- and ten-
year CDS premium changes by comparison to the one-year premium. Note further that
the changes in debt ratings do not have significant associations with CDS premium
changes (p= 0.566 for the one-year CDS, two-tailed), possibly because ratings do not
change significantly over the quarter17, or even when they do, the information contained
in earnings and leverage changes subsume the information contained in credit rating
changes.
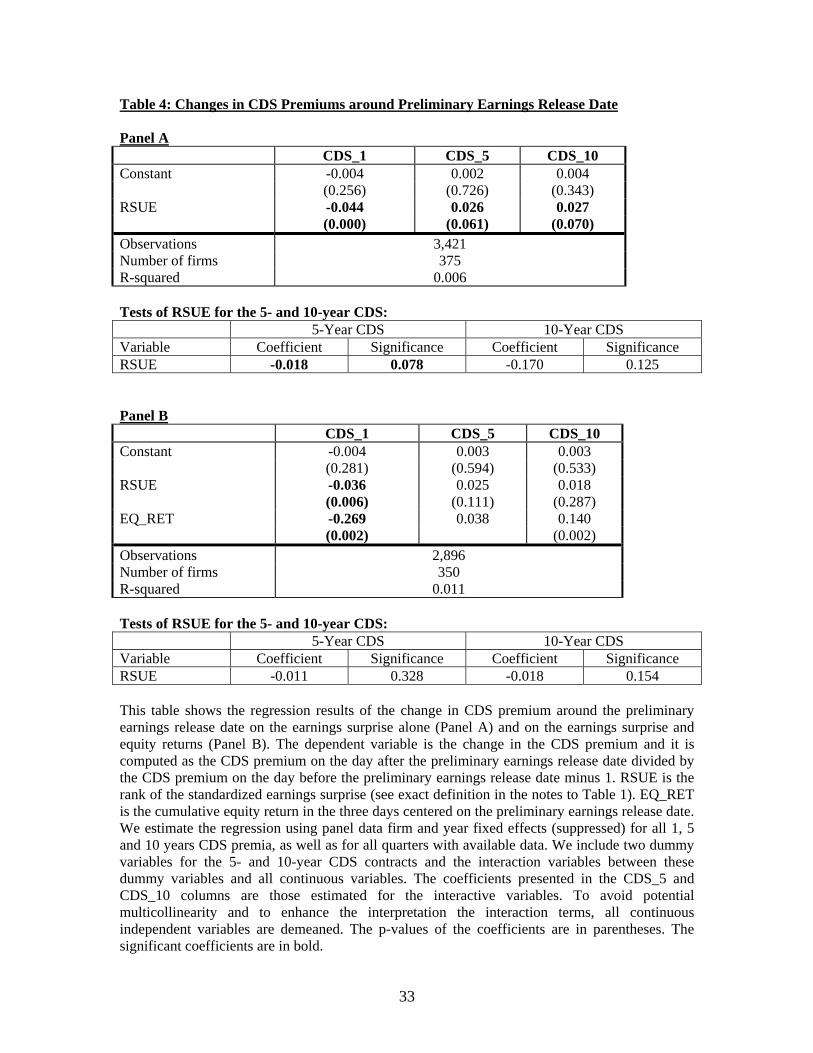
Hypothesis H3, regarding short-window changes in CDS premia around
preliminary earnings announcements, is tested in Table 4. The window is the three days
centered on the preliminary earnings announcement or, if there are no CDS data during
this three-day period, the window is extended up to a maximum of 10 days surrounding
the preliminary earnings announcement. Panel A of Table 4 regresses the percentage
17 For close to 90% of the observations there is no change in rating. When we drop the change in rating from the analysis we obtain similar results.
21
change of the CDS premium during the short window on the rank of the standardized
unexpected earnings (RSUE), where SUE is estimated as earnings for quarter t minus
earnings for quarter t-4 less a drift term, scaled by the standard deviation of earnings
surprises in the previous eight quarters. The drift in earnings changes is also estimated
based on the previous eight quarters. The SUE is ranked into deciles (from 0, the lowest,
to 9, the highest), and RSUE is the decile rank scaled by nine, minus 0.5.18 Consistent
with H3, there is a significant inverse relation between the ranked earnings surprise and
the changes in the CDS premium over this short window for default swaps with a
maturity of one year (p= 0.000, two-tailed). Similar to the findings above, the coefficients
on the interactive terms for RSUE and CDS maturities of five and ten years show a
weakening association between profitability and CDS premium changes; the changes in
five-year (ten-year) CDS premia and RSUE are inversely related at the two-tailed
significance level of 0.079 (0.121). Thus, Panel A of Table 4 shows that there is a
significant negative association between earnings surprises and CDS premia changes in
the short window around the preliminary earnings announcement, indicating that
favorable earnings news is interpreted in the CDS market as a signal of reduced
likelihood of default. In addition, the negative association is weaker for longer CDS
maturities, likely because quarterly earnings surprises have weaker associations with
long-term probabilities of default.
(Insert Table 4 about here)
Panel B of Table 4 shows the regression results controlling for the cumulative
return on the firm’s equity during the preliminary announcement window. The negative
and significant association between earnings surprises and changes in one-year CDS 18 Again, the ranking of the earnings surprise is with reference to all firms in Compustat.
22
premia remains robust, indicating that earnings conveys information about the firm’s
short-term credit risk beyond the earnings information contained in equity returns. In
contrast, the relation between five-year CDS premium and the earnings surprise becomes
insignificant after controlling for equity returns, suggesting once more that the earnings
surprise conveys less long-term credit risk information.
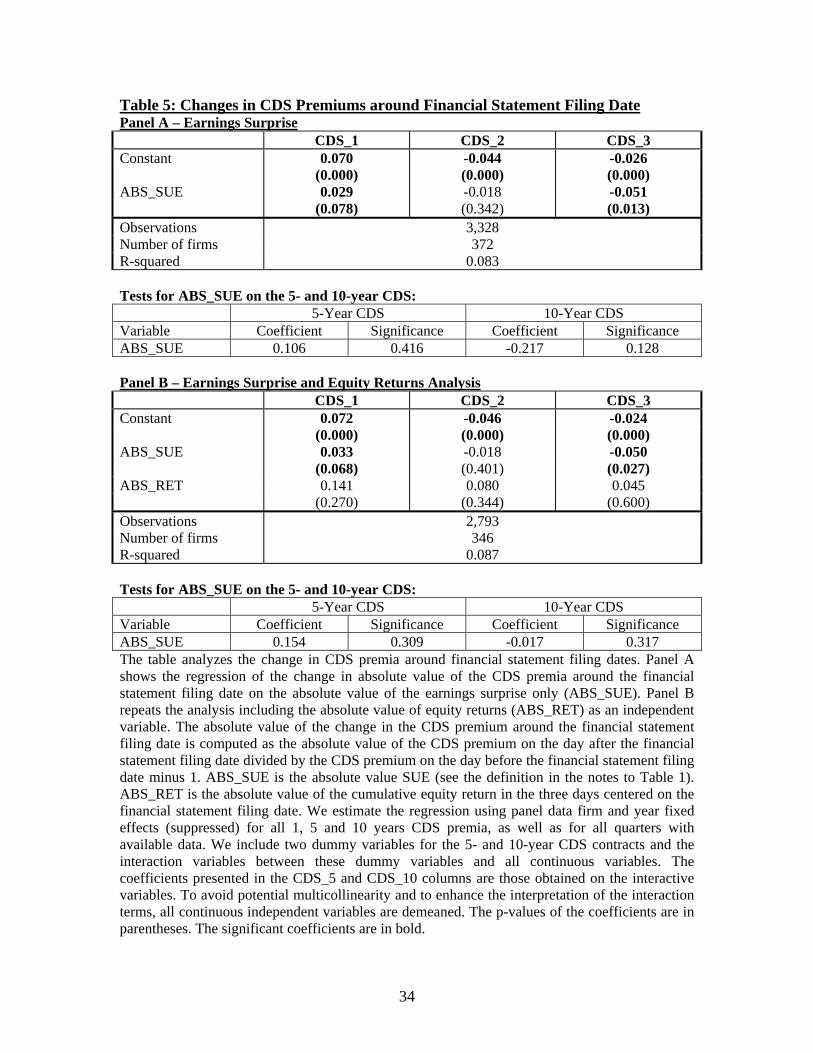
The short-window hypothesis H4 surrounding the SEC filing date is tested in
Table 5. The SEC filing date window is defined similarly to that of the preliminary
earnings window, namely, three days centered on the SEC filing if CDS premia are
available, and up to a maximum of 10 days otherwise. Since the SEC filings include
information beyond the preliminary earnings surprise, the relation between the earnings
surprise and the change in CDS premia surrounding the filing cannot be signed a priori.19
For example, the cash flow-accruals breakdown provided at the filing date may signal a
decline (increase) in earnings quality causing investors to require a higher (lower) CDS
premium. Therefore, we follow Griffin (2004), Callen et al. (2006) and others and use an
unsigned measure of the earnings surprise to evaluate the relation. Specifically, Panel A
of Table 5 shows the regression of the absolute value of the change in CDS premia during
the short SEC filing window on the absolute value of RSUE (ABSSUE).20 The estimated
coefficient on the absolute value of the rank of earnings surprise is positive and
significant (p=0.078, two-tailed) for the one-year maturity, indicating that the greater the
earnings surprise (in absolute value) the more informative are the SEC filings to market
19 Although the earnings surprise is already known from the preliminary earnings announcement, the interpretation of the earnings surprise may change given the additional information contained in the financial reports. The results are unchanged even when we control for firms that do not provide preliminary earnings and for firms that have different financial statement earnings than their preliminary earnings. 20 Recall that RSUE ranges from -0.5 to 0.5, where -0.5 (0.5) indicates the most negative (positive) earnings surprise.
23
participants when assessing the short-term default risk of the firm. Similar to the finding
described above, the association between the absolute value of the earnings surprise and
the absolute value of the change in CDS premium around the SEC filing is weaker and
not significantly different from zero for default swaps with medium or long-term
maturities.
(Insert Table 5 about here)
Panels B of Table 5 shows that the association between the absolute value of the
earnings surprise and the change in CDS premium around the SEC filing remains positive
and statistically significant (p= 0.068, two-tailed) for the one-year CDS after controlling
for the absolute value of the equity return in that short window, and not significantly
different from zero for longer CDS maturities.
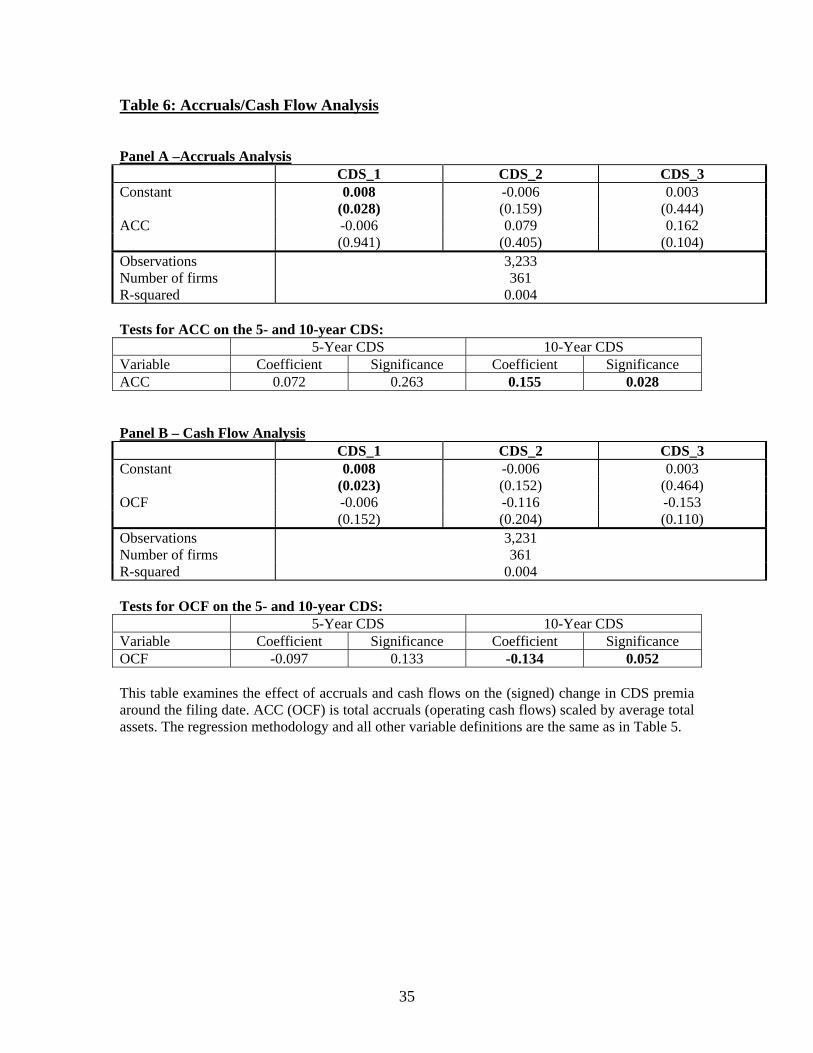
Panels A and B of Table 6 test Hypothesis H5 regarding the impact of accruals
and cash flows on changes in CDS premia around SEC filing dates, respectively.21 Callen
et al (2006) show that the volatility of unexpected stock returns is associated with net
operating cash flows and accruals news, and that these two components of earnings are
also associated with risk changes around SEC filings. Given that accruals are associated
with changes in risk, we examine in Panel A whether the signed CDS premium is
positively associated with the level of accruals. The results reveal that the association of
the one-year CDS premium changes with accruals is not significantly different from zero,
indicating that these two components are likely unimportant for reinterpreting the firm’s
default risk, beyond the information contained in earnings. However, somewhat
surprisingly, the reported tests at the bottom of the panel show that accruals and changes
21 We conduct separate analyses for accruals and cash flows because the correlation between accruals and cash flows exceeds 0.9.
24
in ten-year maturity (five-year) CDS premia are positively and significantly
(insignificantly) associated, suggesting that high-accrual earnings are interpreted by the
market as indicators of greater long-term default risk, perhaps because accruals indicate
investments in net operating assets that can be used to postpone short-term default, but
not long-term default.
Panel B show the cash flow regression results. Although the incremental
coefficients are not significantly different from zero, again we find that the overall
coefficient on the ten-year CDS contract is negative and significant indicating that the
higher the cash component of earnings the lower is the long-run risk of default, possibly
because higher cash flows signal higher quality earnings and lower long-term credit risk
to the CDS market.
Overall, the results are consistent with H5 with respect to long-term maturities but
not medium or short-term maturities. Indeed, the hypothesized relation between maturity
and the impact of cash flow/accruals on CDS premia is rejected by the data.
In order to test the robustness of our results, we undertook the following
(untabulated) analyses:
1. In the changes regression of Table 3, we include the cumulative return on the
stock during the period as an independent variable. We further include earnings
levels as well earnings changes during the quarter. The results remain
qualitatively unchanged.
2. We include a dummy variable in the short-window regressions around the
preliminary and SEC filing dates for firms that reported net operating cash flows
in their preliminary earnings announcements. The main results for these short-
25
term windows are qualitatively the same after the inclusion of this dummy
variable.
3. We also test the association of CDS premium changes around the SEC filings
with changes in leverage reported in the SEC filings. Our results did not show any
significant associations, possibly because changes in leverage that significantly
affect the firm’s default risk are disseminated earlier to the market in the period
between the SEC filing dates of the previous and the current quarter through other
disclosure media.
4. We replaced accrual and cash flow earnings levels with quarterly changes in
accrual and cash flow earnings and obtained results similar to those of Table 6.
6. Conclusion
This study evaluates the impact of earnings on short- and long-window changes in
firm credit risk, as captured by Credit Default Swaps (CDS) with one-, five- and ten-year
maturities. Using levels, quarterly changes and short-window event study methodologies,
we find that earnings levels (changes) are significantly and negatively correlated with the
level of (changes in) one-year CDS premia even after controlling for equity returns. In
contrast, earnings information is not significantly correlated with medium and long term
CDS maturities after controlling for equity returns. These results suggest that positive
(negative) earnings signals convey favorable (unfavorable) information primarily about
short-term default risk. Our empirical results are also consistent with the implications of
structural and hybrid models regarding the determinants of CDS pricing. In particular, we
find that CDS premia are increasing in (changes in) leverage and asset volatilities, and
26
decreasing in (changes in) the interest rate, and asset values. Although the firm’s credit
rating is significantly and negatively correlated with CDS premia in the levels analysis,
the relationship is insignificant in the changes analysis, possibly because credit ratings
are sticky.
We also find that absolute earnings surprises are significantly correlated with one-
year CDS premia changes in the short window surrounding SEC filing date, suggesting
that financial statement information at the SEC filing revises the information about short-
term credit risk contained in preliminary earnings. We further find that short-window
one-year and 5-year CDS premia changes around the SEC filing date are not significantly
related to the accrual/cash flow (changes) breakdown but, surprisingly, short-window 10-
year CDS premia changes are positively related to accruals (changes) and negatively
related to cash flows (changes). These results suggest that the quality of earnings as
captured by the accrual/cash flow breakdown provides information about long-term credit
risk but not short term credit risk, perhaps because accruals indicate investments in net
operating assets that can be used to postpone short-term default, but not long-term
default.
27
References
Abid, F. and N. Naifar. 2005. “The Determinants of Credit Default Swap Rates: An Explanatory Study” Working Paper, May, University of Sfax, Tunisia Aunon-Nerin, D., D. Cossin, T. Hricko and Z. Huang. 2002. “Exploring for the Determinants of Credit Risk in Credit Default Swap Transaction Data: Is Fixed-Income Markets Information Sufficient to Evaluate Credit risk?” Research Paper No. 65, December, FAME, Geneva, Switzerland. Ball, R. and P. Brown. 1968. "An Empirical Evaluation of Accounting Income Numbers," Journal of Accounting Research 6: 159-178. Black, F. and J.C. Cox. 1976. "Valuing Corporate Securities: Some Effects of Bond Indenture Provisions," Journal of Finance 31: 351-367. Blanco, R., S. Brennan and I. W. Marsh. 2005. "An Empirical Analysis of the Dynamic Relation Between Investment-Grade Bonds and Credit Default Swaps," Journal of Finance 60: 2255-2281. Callen, J.L., J. Livnat and D. Segal. 2006. “The Value Relevance and Information Environment of SEC Filings: A Variance Decomposition Analysis,” Accounting Review 81:1017-1043. Chan-Lau, J.A. 2006. “Is Systematic Default Risk Priced in Equity returns? A Cross-Sectional Analysis Using Credit Derivatives,” IMF Working Paper, June. Collin-Dufresne, P. and R.S. Goldstein. 2001. "Do Credit Spreads Reflect Stationary Leverage Ratios?," Journal of Finance 56: 1929-1957. Collin-Dufresne, P., R.S. Goldstein, and S. Martin. 2001. “The Determinants of Credit Spread Changes,” Journal of Finance 56: 2177—2207. Cossin, D. and T. Hricko. 2001. “Exploring for the Determinants of Credit Risk in Credit Default Swap Transaction Data,” Working Paper, May, HEC, University of Lausanne. Das, S. R. 1995. “Credit Risk Derivatives,” The Journal of Derivatives 2: 7—23. Das, S. R. and R. Sundaram. 1998. “A Direct Approach to Arbitrage-free Pricing of Credit Derivatives,” NBER working paper no. 6635. Dichev, I.D. and J.D. Piotroski. 2001. "The Long-Run Stock Returns Following Bond Ratings Changes," Journal of Finance 56: 183-203.
28
Duffie, D. and D. Lando. 2001. “Term Structures of Credit Spreads with Incomplete Accounting Information,” Econometrica 69: 633-644. Elton, E. J., M. J. Gruber, D. Agrawal and C. Mann. 2001. "Explaining the Rate of Spread on Corporate Bonds," Journal of Finance 56: 247-277. Eom, Y. H., J. Helwege, and J. Huang. 2004, “Structural Models of Corporate Bond Pricing: An Empirical Analysis,” Review of Financial Studies 17: 499—544. Ericsson, J., K. Jacobs and R. Oviedo. 2005. “The Determinants of Credit Default Swap Premia,” Working Paper, January, Faculty of Management, University of McGill. Griffin, P. 2003. “Got Information? Investor response to form 10-K and form 10-Q EDGAR filings,” Review of Accounting Studies 8: 433-460. Houweling, P. and T. Vorst. 2005. “Pricing Default Swaps: Empirical Evidence," Journal of International Money and Finance 24: 1200-1225. Hull, J., M. Predescu and A. White. 2004. "Relationship Between Credit Default Swap Spreads, Bond Yields, and Credit Rating Announcements," Journal of Banking and Finance 28: 2789-2811 Hull, J. and A. White. 2000a. “Valuing Credit Default Swaps I: No Counterparty Default Risk,” Journal of Derivatives 8: 29—40. Hull, J. and A. White. 2000b. “Valuing Credit Default Swaps II: Including Counterparty Default Risk,” Journal of Derivatives 8: 29—40. Jorion P. and G. Zhang. 2005. Nonlinear Effects of Bond Rate Changes,” Working Paper, March, University of California at Irvine. Jorion P. and G. Zhang. 2006. “Intra-industry Credit Contagion: Evidence from The Credit Default Swap and Stock Markets,” Working Paper, February, University of California at Irvine. Leland, H. E. and K.B. Toft. 1996. "Optimal Capital Structure, Endogenous Bankruptcy, and the Term Structure Of Credit Spreads," Journal of Finance 51: 987-1019. Longstaff, F. A. and E.S. Schwartz. 1995. "A Simple Approach to Valuing Risky Fixed and Floating Rate Debt," Journal of Finance 50: 789-819. Longstaff, F. A., S. Mithal and E. Neis. 2005. "Corporate Yield Spreads: Default Risk or Liquidity? New Evidence From The Credit Default Swap Market," Journal of Finance 60: 2213-2253.

29
Merton, R. C. 1974. “On the Pricing of Corporate Debt: The Risk Structure of Interest Rates,” Journal of Finance 29: 449—470. Minton, B.A., R. Stultz, and R. Williamson. 2006. How Much Do Banks Use Credit Derivatives to Reduce Risk,” Working Paper, The Ohio State University. Pena, J.I. and S. Forte. 2006. “Credit Spreads: Theory and Evidence about the Information Content of Stocks, Bonds and CDSs,” Working Paper Departmento de Economia, Universidad Carlos III de Madrid. Vassalou, M. and Y. Xing. 2003. “Equity Returns Following Changes in Default Risk,” Working Paper Columbia University. Zhu, H. 2004. “An Empirical Comparison of Credit Spreads between the Bond Market and the Credit Default Swap Market,” Working Paper, BIS.
30
Table 1 – Descriptive Statistics N MEAN SD MIN P25 MEDIAN P75 MAX MV 4143 14,366 28,568 42 3,030 5,980 13,706 296,073 CDS_PRL 3421 -0.002 0.108 -0.356 -0.031 0.000 0.017 0.545 CDS_FIL 3328 0.005 0.089 -0.332 -0.019 0.000 0.024 0.405 CDS_QTR 2629 -0.063 0.274 -0.634 -0.225 -0.080 0.071 0.991 CDS_PRM 3700 3.990 0.967 2.132 3.302 3.855 4.529 6.811 ROA 4138 0.013 0.017 -0.058 0.005 0.012 0.021 0.062 DEL_ROA 4138 0.001 0.014 -0.060 -0.003 0.001 0.005 0.061 LEV 4141 0.302 0.159 0.015 0.188 0.280 0.404 0.740 DEL_LEV 4141 0.002 0.033 -0.085 -0.010 0.000 0.007 0.182 ACC 4011 -0.025 0.043 -0.171 -0.038 -0.015 -0.004 0.082 OCF 4014 0.037 0.046 -0.062 0.013 0.027 0.051 0.199 DOCF 4141 0.374 0.484 0.000 0.000 0.000 1.000 1.000 RATE 4037 10.378 2.683 2.000 9.000 10.000 12.000 23.000 RSUE 4143 4.916 2.794 0.000 3.000 5.000 7.000 9.000 SD_RET 4087 0.018 0.014 0.002 0.012 0.015 0.021 0.438 INT 4143 1.335 0.511 0.880 0.920 1.130 1.760 2.330 SLOPE 4143 1.985 0.534 1.000 1.520 2.280 2.510 2.590 SP 4143 0.037 0.052 -0.102 0.013 0.014 0.071 0.149 This table provides descriptive statistics of the main variables used in the paper. MV is the end of quarter market value of equity. CDS_PRL (CDS_FIL) is the change in the CDS premium in the three-day window centered on the preliminary earnings release date (SEC filing date), computed as the CDS premium on the day of the window divided by the CDS premium on the first day of the window minus 1. CDS_QTR is the change in CDS premium during the quarter computed as the premium on the first day after the SEC filing date of the current period divided by the premium on the first day after the SEC filing date of the previous quarter minus 1. ROA is the return (net income before extraordinary items) on total assets. DEL_ROA is the change in ROA, computed as ROA for the current quarter minus ROA in the previous quarter. LEV is leverage, computed as total debt scaled by total assets in the previous quarter. DEL_LEV is change in leverage. ACC (OCF) is total accruals (operating cash flows) scaled by total assets in the previous quarter. Total accruals are net income before extraordinary items minus net operating cash flows. DOCF is a dummy variable equal to 1 if the firm discloses cash flow information in the preliminary earnings announcement and zero otherwise. RATE is the S&P’s short term credit rating. RSUE is the rank of the standardized earnings surprise SUE. SUE is calculated from the Compustat quarterly database as preliminary EPS minus expected EPS from a seasonal random walk model with drift, scaled by the standard deviation of the forecast errors of the seasonal random walk model. SUE is estimated for each quarter t, using all observations in quarters t-8 through t-1. SD_RET is the standard deviation of daily returns during the firm’s current fiscal quarter. INT is the annualized three month T-Bill rate. SLOPE is the difference between the 10-year and 2-year t-bill rates. SP is the returns on the S&P500 index in the firm’s current fiscal quarter.
31
Table 2: Levels Regression CDS_1 CDS_5 CDS_10 Constant 3.600 0.495 0.751 (0.000) (0.000) (0.000) ROA -1.570 1.394 2.540 (0.019) (0.062) (0.001) LEV 0.662 -0.058 -0.148 (0.000) (0.449) (0.064) SIZE -0.882 0.050 0.102 (0.000) (0.000) (0.000) INT -0.710 0.478 0.579 (0.000) (0.000) (0.000) S&P -0.001 -0.116 0.060 (0.994) (0.580) (0.796) SDRET 4.504 -1.891 -4.234 (0.000) (0.021) (0.000) Observations Number of Firms R-squared
3660 376
0.654 The table shows the results of regressing the CDS premium two days after the SEC filing date on the return on assets (ROA), leverage (LEV), log of market value (SIZE), the risk-free interest rate (INT), the return on the S&P 500 index during the quarter (S&P), and the standard deviation of the firm’s stock return during the quarter (SDRET). For exact variable definitions see the note to Table 1. We estimate the regression using panel data firm and year fixed effects (suppressed) for all 1, 5 and 10 years CDS premia, as well as for all quarters with available data. We include two dummy variables for the 5- and 10-year CDS contracts and interaction terms between these dummy variables and all continuous variables. The coefficients presented in the CDS_5 and CDS_10 columns are those estimated for the interactive variables. For example, the ROA coefficient in the CDS_5 column is the difference between the coefficient on ROA for the 5-year CDS contract and the 1-year CDS contract. The ROA coefficient for the 5-year CDS contract is the sum of the coefficients on ROA in the CDS_1 and CDS_5 columns. To avoid potential multicollinearity and to enhance the interpretation of the interaction terms, all continuous independent variables are demeaned. The p-values of the coefficients are in parentheses. The significant coefficients are bolded. Earnings and Leverage Coefficient Estimates for 5- and 10-year CDS Maturities 5-Yaer CDS 10-Year CDS Variable Coefficient Significance Coefficient Significance ROA -0.176 0.765 0.969 0.124 Leverage 0.604 0.000 0.514 0.000
32
Table 3: Changes in Quarterly CDS Premia
CDS_1 CDS_5 CDS_10 Constant -0.038 0.055 0.101 (0.006) (0.000) (0.000) DEL_ROA -2.613 1.187 1.887 (0.000) (0.145) (0.029) DEL_LEV -0.255 0.589 0.802 (0.453) (0.133) (0.053) DEL_MV -0.222 0.073 -0.003 (0.002) (0.399) (0.972) DEL_INT -0.492 0.082 0.101 (0.000) (0.097) (0.057) DEL_S&P 0.659 -0.386 -0.210 (0.000) (0.012) (0.227) DEL_SDRET 3.944 -0.956 -0.431 (0.059) (0.667) (0.847) DEL_RATE -0.011 -0.017 -0.017 (0.566) (0.590) (0.602) Observations Number of firms R-squared
2603 340
0.135 The table shows the regression results of the quarterly change in the CDS premium on the change in ROA (DEL_ROA), change in leverage (DEL_LEV), change in log market value of equity (DEL_MV), change in the risk free interest rate (DEL_INT), change in the return on the S&P500 index (DEL_S&P), computed as the return on S&P 500 in the current quarter minus the return on the S&P 500 index in the previous quarter, change in the standard deviation of the firm’s stock return (DEL_SDRET) and the change in the firm’s S&P credit rating (DEL_RATE). The dependent variable is computed as the premium on the first day after the filing date of the current period financial statements divided by the premium on the first day after the filing date of the previous quarter minus 1. For exact variable definitions see the note to Table 1. We estimate the regression using panel data firm and year fixed effects (suppressed) for all 1, 5 and 10 years CDS premia, as well as for all quarters with available data. We include two dummy variables for the 5- and 10-year CDS contracts and interaction variables between these dummy variables and all continuous variables. The coefficients presented in the CDS_5 and CDS_10 columns are those obtained on the interactive variables. To avoid potential multicollinearity and to enhance the interpretation of the interaction terms, all continuous independent variables are demeaned. The p-values of the coefficients are in parentheses. The significant coefficients are in bold. Tests for change in earnings and change in leverage on the 5- and 10-year CDS Maturities 5-Year CDS 10-Year CDS Variable Coefficient Significance Coefficient Significance DEL_ROA -1.426 0.006 -0.726 0.224 DEL_LEV 0.334 0.172 0.547 0.049
33
Table 4: Changes in CDS Premiums around Preliminary Earnings Release Date Panel A
CDS_1 CDS_5 CDS_10 Constant -0.004 0.002 0.004 (0.256) (0.726) (0.343) RSUE -0.044 0.026 0.027 (0.000) (0.061) (0.070) Observations Number of firms R-squared
3,421 375
0.006 Tests of RSUE for the 5- and 10-year CDS: 5-Year CDS 10-Year CDS Variable Coefficient Significance Coefficient Significance RSUE -0.018 0.078 -0.170 0.125 Panel B
CDS_1 CDS_5 CDS_10 Constant -0.004 0.003 0.003 (0.281) (0.594) (0.533) RSUE -0.036 0.025 0.018 (0.006) (0.111) (0.287) EQ_RET -0.269 0.038 0.140 (0.002) (0.002) Observations Number of firms R-squared
2,896 350
0.011
Tests of RSUE for the 5- and 10-year CDS: 5-Year CDS 10-Year CDS Variable Coefficient Significance Coefficient Significance RSUE -0.011 0.328 -0.018 0.154 This table shows the regression results of the change in CDS premium around the preliminary earnings release date on the earnings surprise alone (Panel A) and on the earnings surprise and equity returns (Panel B). The dependent variable is the change in the CDS premium and it is computed as the CDS premium on the day after the preliminary earnings release date divided by the CDS premium on the day before the preliminary earnings release date minus 1. RSUE is the rank of the standardized earnings surprise (see exact definition in the notes to Table 1). EQ_RET is the cumulative equity return in the three days centered on the preliminary earnings release date. We estimate the regression using panel data firm and year fixed effects (suppressed) for all 1, 5 and 10 years CDS premia, as well as for all quarters with available data. We include two dummy variables for the 5- and 10-year CDS contracts and the interaction variables between these dummy variables and all continuous variables. The coefficients presented in the CDS_5 and CDS_10 columns are those estimated for the interactive variables. To avoid potential multicollinearity and to enhance the interpretation the interaction terms, all continuous independent variables are demeaned. The p-values of the coefficients are in parentheses. The significant coefficients are in bold.
34
Table 5: Changes in CDS Premiums around Financial Statement Filing Date Panel A – Earnings Surprise
CDS_1 CDS_2 CDS_3 Constant 0.070 -0.044 -0.026 (0.000) (0.000) (0.000) ABS_SUE 0.029 -0.018 -0.051 (0.078) (0.342) (0.013) Observations Number of firms R-squared
3,328 372
0.083 Tests for ABS_SUE on the 5- and 10-year CDS: 5-Year CDS 10-Year CDS Variable Coefficient Significance Coefficient Significance ABS_SUE 0.106 0.416 -0.217 0.128 Panel B – Earnings Surprise and Equity Returns Analysis
CDS_1 CDS_2 CDS_3 Constant 0.072 -0.046 -0.024 (0.000) (0.000) (0.000) ABS_SUE 0.033 -0.018 -0.050 (0.068) (0.401) (0.027) ABS_RET 0.141 0.080 0.045 (0.270) (0.344) (0.600) Observations Number of firms R-squared
2,793 346
0.087 Tests for ABS_SUE on the 5- and 10-year CDS: 5-Year CDS 10-Year CDS Variable Coefficient Significance Coefficient Significance ABS_SUE 0.154 0.309 -0.017 0.317 The table analyzes the change in CDS premia around financial statement filing dates. Panel A shows the regression of the change in absolute value of the CDS premia around the financial statement filing date on the absolute value of the earnings surprise only (ABS_SUE). Panel B repeats the analysis including the absolute value of equity returns (ABS_RET) as an independent variable. The absolute value of the change in the CDS premium around the financial statement filing date is computed as the absolute value of the CDS premium on the day after the financial statement filing date divided by the CDS premium on the day before the financial statement filing date minus 1. ABS_SUE is the absolute value SUE (see the definition in the notes to Table 1). ABS_RET is the absolute value of the cumulative equity return in the three days centered on the financial statement filing date. We estimate the regression using panel data firm and year fixed effects (suppressed) for all 1, 5 and 10 years CDS premia, as well as for all quarters with available data. We include two dummy variables for the 5- and 10-year CDS contracts and the interaction variables between these dummy variables and all continuous variables. The coefficients presented in the CDS_5 and CDS_10 columns are those obtained on the interactive variables. To avoid potential multicollinearity and to enhance the interpretation of the interaction terms, all continuous independent variables are demeaned. The p-values of the coefficients are in parentheses. The significant coefficients are in bold.
35
Table 6: Accruals/Cash Flow Analysis Panel A –Accruals Analysis
CDS_1 CDS_2 CDS_3 Constant 0.008 -0.006 0.003 (0.028) (0.159) (0.444) ACC -0.006 0.079 0.162 (0.941) (0.405) (0.104) Observations Number of firms R-squared
3,233 361
0.004 Tests for ACC on the 5- and 10-year CDS: 5-Year CDS 10-Year CDS Variable Coefficient Significance Coefficient Significance ACC 0.072 0.263 0.155 0.028 Panel B – Cash Flow Analysis
CDS_1 CDS_2 CDS_3 Constant 0.008 -0.006 0.003 (0.023) (0.152) (0.464) OCF -0.006 -0.116 -0.153 (0.152) (0.204) (0.110) Observations Number of firms R-squared
3,231 361
0.004 Tests for OCF on the 5- and 10-year CDS: 5-Year CDS 10-Year CDS Variable Coefficient Significance Coefficient Significance OCF -0.097 0.133 -0.134 0.052 This table examines the effect of accruals and cash flows on the (signed) change in CDS premia around the filing date. ACC (OCF) is total accruals (operating cash flows) scaled by average total assets. The regression methodology and all other variable definitions are the same as in Table 5.


