Embed Size (px)
Citation preview
Finance and Economics Discussion Series
Federal Reserve Board, Washington, D.C.ISSN 1936-2854 (Print)
ISSN 2767-3898 (Online)
Credit Default Swaps
Antulio N. Bomfim
2022-023
Please cite this paper as:Bomfim, Antulio N. (2022). “Credit Default Swaps,” Finance and Economics Discus-sion Series 2022-023. Washington: Board of Governors of the Federal Reserve System,https://doi.org/10.17016/FEDS.2022.023.
NOTE: Staff working papers in the Finance and Economics Discussion Series (FEDS) are preliminarymaterials circulated to stimulate discussion and critical comment. The analysis and conclusions set forthare those of the authors and do not indicate concurrence by other members of the research staff or theBoard of Governors. References in publications to the Finance and Economics Discussion Series (other thanacknowledgement) should be cleared with the author(s) to protect the tentative character of these papers.
Credit Default Swaps1
Antulio N. Bomfim
Federal Reserve Board
First Draft: October 15, 2021 This Draft: March 4, 2022
Abstract: Credit default swaps (CDS) are the most common type of credit derivative. This
paper provides a brief history of the CDS market and discusses its main characteristics.
After describing the basic mechanics of a CDS, I present a simple valuation framework that
focuses on the relationship between conditions in the cash and CDS markets as well as an
approach to mark to market existing CDS positions. The discussion highlights how the 2008
global financial crisis helped shape current practices and conventions in the CDS market,
including the widespread adoption of standardized coupons and upfront premiums and the
increased reliance on centralized counterparties. I also address CDS indexes--focusing on
their growing role as key indicators of investors’ attitudes toward credit risk--and briefly
examine their behavior during periods of acute financial or economic dislocations, including
those associated with the COVID-19 pandemic.
Keywords: credit derivatives, credit default swaps, credit risk, CDX, credit curves, CDS-cash
basis, CDS valuation
JEL: G1 (Asset Markets and Pricing), G2 (Financial Institutions and Services)
1 The analysis and conclusions set forth are those of the author and do not indicate concurrence by other members of the Federal Reserve Board research staff or the Board of Governors. This paper, which is partly based on Bomfim (2016), was prepared as a chapter in the forthcoming Research Handbook of Financial Markets. I am grateful for insightful comments provided by Refet Gurkaynak and Jonathan Wright.
1
1. Introduction and History
Credit default swaps (CDS) are, by far, the most common type of credit derivative. They are financial
instruments that allow the transfer of credit risk among market participants, potentially facilitating greater
efficiency in the pricing and distribution of credit risk. In its most basic form, a CDS is a contract where a
“protection buyer” agrees to make periodic payments (the CDS “spread” or premium) over a predetermined
number of years (the maturity or term of the CDS) to a “protection seller” in exchange for a payment from
the protection seller in the event of default by a “reference entity.” CDS premiums tend to be paid quarterly
and are set as a percentage of the total amount of protection bought (the “notional amount” of the contract).
CDS maturities generally range from one to ten years, with the five-year maturity being particularly common.
Major dealers regularly disseminate quotes for credit default swaps. Along with risk spreads in the
corporate bond market, CDS quotes are now commonly relied upon as indicators of investors’ perceptions of
credit risk regarding individual borrowers and investors’ willingness to bear this risk. In addition, quotes from
the CDS market are used as inputs in the pricing of other traditional credit products such as bank loans and
corporate bonds, potentially helping promote greater integration of the various segments of the credit market.
Broadly speaking, there are two types of CDS: Single-name CDS are contracts that name a single
reference entity, such as a corporation or a sovereign borrower, whereas multiname CDS reference more than
one borrower. For instance, a multiname contract could be written to cover defaults in a reference portfolio
(such as in the case of a basket credit default swap) or, as has been increasingly common over the past couple
of decades, be based on an index of commonly negotiated single-name CDS. The latter are generally called
CDS indexes.
Historically, credit default swaps have been mostly negotiated in a decentralized over-the-counter
market. As a result, unlike exchanged-based markets, there are no readily available historical aggregate
volume or notional amount statistics that one can draw upon. Instead, most discussions of the evolution of
the market, its size, and activity tend to center on results of surveys of market participants and on anecdotal
accounts by key market players. For instance, the Bank for International Settlements (BIS) conducts a
semiannual survey of dealers’ derivatives activities around the world, and that survey has included information
on credit default swaps since 2004. Other surveys, some of which have been discontinued, go a little further
back in the past, but the credit default swap market is relatively young; it was virtually non-existent in the early
1990s.2
2 See, for instance, the surveys run by the British Bankers Association (2006) and the International Swaps and Derivatives Association (2010).

2
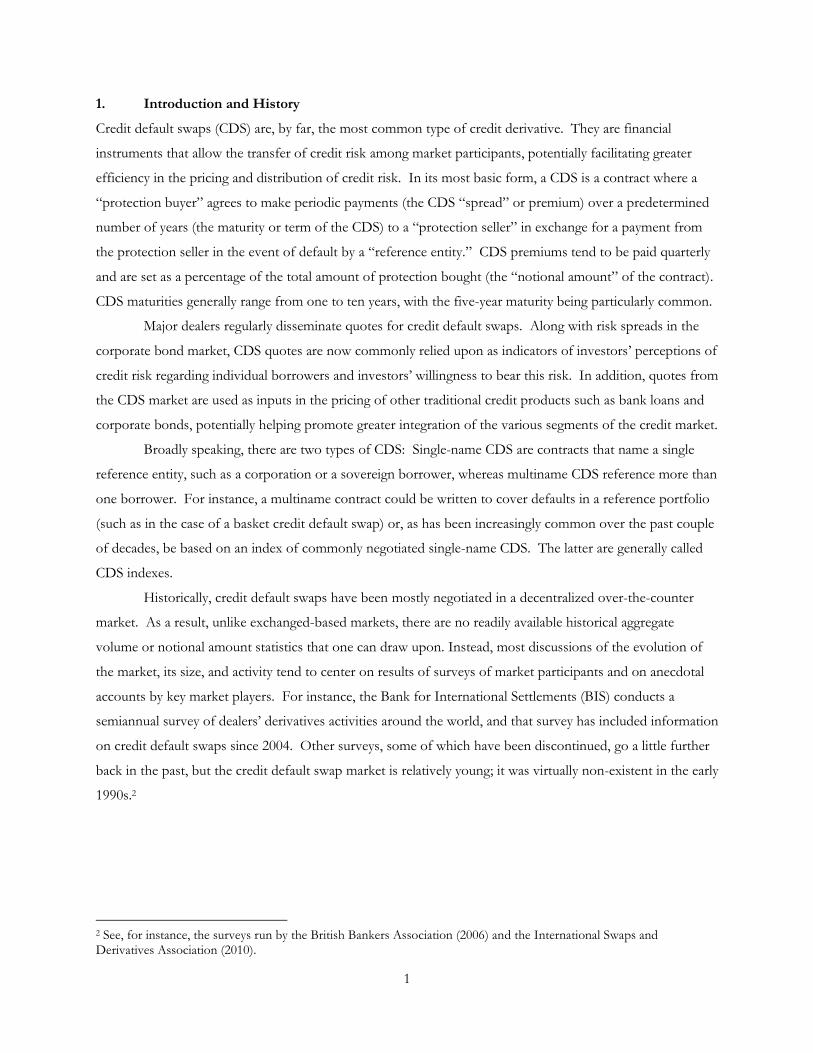
Source: Bank for International Settlements (2021) and author’s calculations. Note: “End Users” refers to non-dealer end users. List of abbreviations used in Figure 1:
Other MN: Other multi-name CDS (non-index product) Spec purp: Special-purpose vehicle, special-purpose corporation, or special-purpose entity Sec prod: Securitized products Ref Entity: Reference Entity
Based on data collected by the BIS (2021), notional amounts outstanding in the global credit default
swap market totaled close to $8.5 trillion at the end of 2020, with a little more than half corresponding to
index products—first bar in Figure 1. That said, the credit default swap market is still small relative to the
overall global derivatives market: Notional amounts outstanding in credit default swaps accounted for
approximately 1.5 percent of notional amounts in the global derivatives market in late 2020. The CDS market
would likely be larger today, were it not for the 2008 global financial crisis (GFC). Underlying factors
contributing to the decline in notional amounts outstanding since the crisis include, initially, heightened
uncertainty about the regulatory environment, risk aversion, and increased use of netting/trade compression
arrangements (Fitch Ratings, 2011, and Wooldridge, 2019) and, especially over the past several years, greater
reliance on central clearing (Aldasoro and Ehlers, 2018).3
2. Main Market Participants
3 Trade compression entails closing out ‘‘redundant contracts,’’ i.e., contracts where a market participant has offsetting exposures to a given reference entity (or entities). For instance, suppose that market participant A has entered into offsetting CDS contracts with counterparties B and C. In that case, provided B and C agree, A could close out its contracts with B and C, replacing these two contracts with a single contract between B and C directly. This would show up as a decline in notional amounts outstanding.
Singlename, 42%
Nonfinancial firms, 16%
Multi-sector,
34%
Investmentgrade, 58%
Other MN, 4%Other
financial firms, 38%
Sec prod, 4%
Non-invest.grade, 21%
Indexproduct,
54%
Spec purp, 3% Nonfinancialfirm, 28%
Non-rated, 21%
Insurers, 6%
Financialfirm, 20%Hedge
funds, 15%
Sovereign,14%
Banks & securities
firms, 22%
0%
10%
20%
30%
40%
50%
60%
70%
80%
90%
100%
CDS Type End Users at Dealers Ref Entity Type Ref Entity Rating
FIGURE 1: GLOBAL CDS MARKET AT A GLANCE, 2020:H2
3
Approximately 62 percent of the notional amounts outstanding of credit default swaps at the major
derivatives dealers surveyed by the BIS in 2020 corresponded to contracts with central counterparties, which
are exchange-like entities that act as a protection buyer to every participating seller and a protection seller to
every participating buyer. It is quite remarkable that central counterparties are now such important
participants in the global credit default swap market. These entities essentially came about as a response to
widespread counterparty credit risk concerns that emerged during and after the GFC. Interdealer contracts
are also common and include CDS entered as part of a dealer’s market-making activities as well as contracts
where a dealer is an end user of credit derivatives. For instance, a dealer that is also a commercial bank might
enter into a contract as a way to hedge part of the credit risk in its loan book.
Excluding interdealer contracts and contracts between dealers and central counterparties, provides a
glimpse into the main (non-dealer) end users of credit default swaps (or at least those non-dealer end users
who entered contracts with dealers, as opposed to central counterparties). As shown in the second bar in
Figure 1, the main non-dealer end users include smaller (though still large) banks or securities firms that do
not participate in the BIS surveys, hedge funds, insurance firms, and other financial customers (a category
that includes mutual funds) as well as non-financial customers. Hedge funds, in particular, have become
increasingly important participants in the global credit default swap market over the past several years, both in
relative and absolute terms.
As a group, non-dealer end users of credit default swaps have tended to be net sellers of default
protection in their transactions with dealers. The main net sellers have been banks and securities firms,
insurers, and mutual funds. Special-purpose vehicles were important sellers before the GFC, but they have
been less active in the CDS market since (see Figure1). Historically, many of these have tended to view
selling default protection as a way to increase the yield on their portfolios, though, especially for some
insurance companies, this view backfired very badly during the GFC. For instance, risk exposures in
protection-selling positions in credit default swaps were widely seen as having contributed to the near-
collapse of American insurer AIG at the height of the 2008 crisis. The AIG experience was a stark reminder
of the different risks associated with protection-selling positions in the CDS market. Reportedly, AIG was a
significant seller of protection in AAA-rated tranches of securities backed by subprime residential mortgages
and other assets. But the bulk of AIG’s CDS-related woes did not stem from actual defaults in those
tranches. Instead, the company came under intense financial pressure in part as a result of recurring calls by
its CDS counterparties for additional collateral as the credit quality of the referenced tranches was
deteriorating rapidly amid the broader financial crisis (Stulz, 2010).
3. Types of Reference Entities
Credit default swaps are written on both sovereign and non-sovereign entities. In practice, however,
data from the BIS (2021) suggest that most contracts reference non-sovereign entities (approximately 86
4
percent of the notional amount outstanding in 2020, as shown in the third bar in Figure 1). Considering only
CDS written on non-sovereigns, approximately one-third of the notional amounts outstanding at year-end
2020 corresponded to contracts that referenced only nonfinancial firms. Contracts that referenced only
financial firms accounted for roughly 23 percent of the notional amounts outstanding in contracts referencing
non-sovereign entities, with multiname contracts that reference both financial and nonfinancial firms
accounting for most of the remainder.
The share of CDS written on sovereigns rose in the years after the GFC, from less than 4 percent of
the notional amounts outstanding in the global CDS market in 2007 to around 14 percent in 2020. For
single-name credit default swaps, the share of the sovereign sector went from around 6 percent in 2007 to
close to one-third in 2020. Indeed, despite the GFC’s adverse impact on the market, notional amounts
outstanding in the sovereign segment of the single-name CDS market managed to nearly double between
2007 and 2013. In contrast, notional amounts outstanding in the overall single-name CDS market shrunk by
almost half over the same period (BIS, 2013).
CDS contracts written on emerging-market government debt remain a dominant segment of the
sovereign CDS market. Indeed, contracts that reference the sovereign debt of key emerging-market
countries--such as Brazil, Mexico, and Turkey--are often cited as being among the most frequently negotiated
in the sovereign sector of the global CDS market. Still, rising concern about debt-to-GDP ratios and fiscal
deficits in the aftermath of the GFC--related in part to the economic downturn that followed the crisis and
the high budgetary costs of repairing national financial systems--likely contributed to increased investor
interest in CDS written on the sovereign debt of a much broader set of countries, including some advanced
economies (Mahadevan, Naraparju, and Musfeldt, 2010).
The sovereign debt crisis in Europe also played an important factor in a notable expansion of the
sovereign CDS market to contracts that covered more than just the usual set of key emerging-market
countries. Italy, for instance, was reported as one of the most frequently negotiated contracts during the
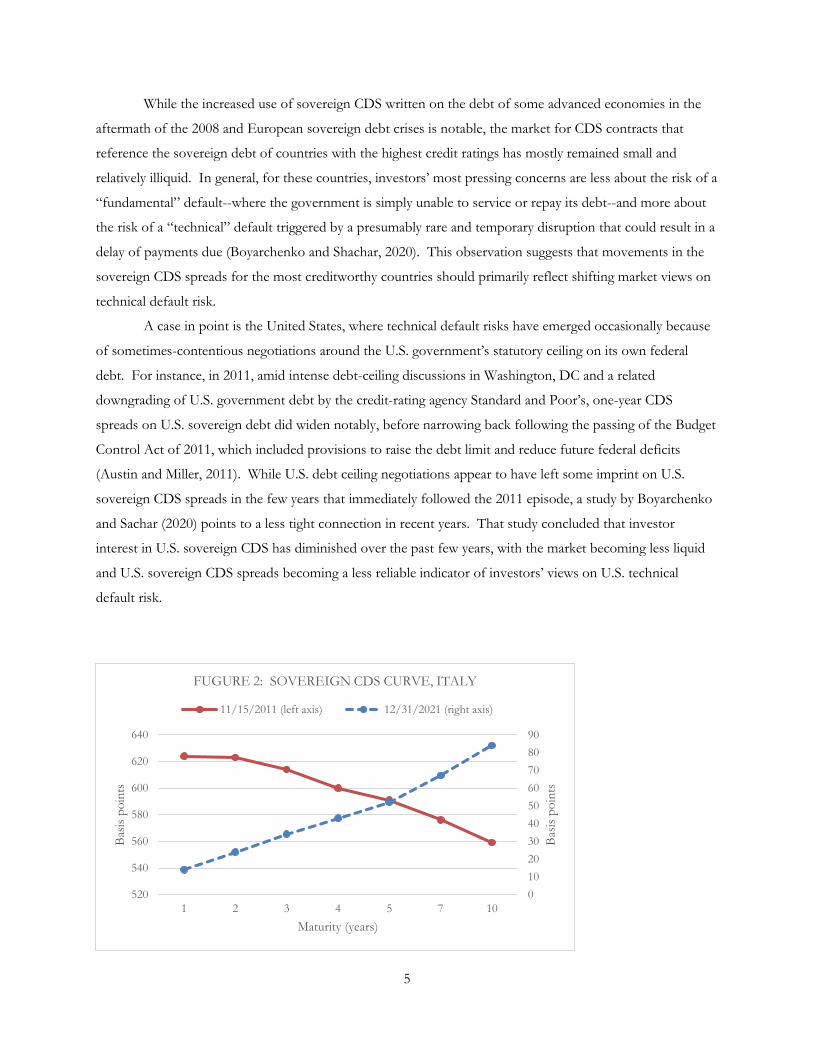
height of the European crisis (Fitch Ratings, 2011). In fact, the CDS curve for sovereign Italian debt widened
dramatically during the European sovereign debt crisis and--as shown in Figure 2--became inverted in late
2011, with the one-year CDS spread significantly wider than the five- and ten-year spreads.
An inverted CDS curve typically signals heightened concern by market participants about the near-
term prospects of the reference entity. Abstracting from market frictions that might have otherwise distorted
the shape of the Italian CDS curve in late 2011, an inverted curve suggests that market participants believed
at the time that the Italian government was facing formidable near-term challenges but that, if those
immediate hurdles could be overcome, Italy would fare better down the road. In the end, Italy’s most
pressing challenges were indeed overcome. Its sovereign CDS spreads have narrowed considerably since, and
its sovereign CDS curve has returned to its normal upward-sloping pattern (dashed curve in Figure 2).
5
While the increased use of sovereign CDS written on the debt of some advanced economies in the
aftermath of the 2008 and European sovereign debt crises is notable, the market for CDS contracts that
reference the sovereign debt of countries with the highest credit ratings has mostly remained small and
relatively illiquid. In general, for these countries, investors’ most pressing concerns are less about the risk of a
“fundamental” default--where the government is simply unable to service or repay its debt--and more about
the risk of a “technical” default triggered by a presumably rare and temporary disruption that could result in a
delay of payments due (Boyarchenko and Shachar, 2020). This observation suggests that movements in the
sovereign CDS spreads for the most creditworthy countries should primarily reflect shifting market views on
technical default risk.
A case in point is the United States, where technical default risks have emerged occasionally because
of sometimes-contentious negotiations around the U.S. government’s statutory ceiling on its own federal
debt. For instance, in 2011, amid intense debt-ceiling discussions in Washington, DC and a related
downgrading of U.S. government debt by the credit-rating agency Standard and Poor’s, one-year CDS
spreads on U.S. sovereign debt did widen notably, before narrowing back following the passing of the Budget
Control Act of 2011, which included provisions to raise the debt limit and reduce future federal deficits
(Austin and Miller, 2011). While U.S. debt ceiling negotiations appear to have left some imprint on U.S.
sovereign CDS spreads in the few years that immediately followed the 2011 episode, a study by Boyarchenko
and Sachar (2020) points to a less tight connection in recent years. That study concluded that investor
interest in U.S. sovereign CDS has diminished over the past few years, with the market becoming less liquid
and U.S. sovereign CDS spreads becoming a less reliable indicator of investors’ views on U.S. technical
default risk.
0
10
20
30
40
50
60
70
80
90
520
540
560
580
600
620
640
1 2 3 4 5 7 10
Bas
is p
oin
ts
Bas
is p
oin
ts
Maturity (years)
FUGURE 2: SOVEREIGN CDS CURVE, ITALY
11/15/2011 (left axis) 12/31/2021 (right axis)

6
Source: IHS Markit
3.1. Credit Quality of Reference Entities
Credit default swaps are written on investment-grade (rated BBB or higher), speculative-grade (rated BB or
below), as well as unrated debt instruments, but contracts written on investment-grade instruments
correspond to the majority of the notional amounts outstanding in the global credit default swap market. For
instance, as shown in the last bar in Figure 1, notional amounts outstanding in credit default swaps written on
investment-grade entities accounted for roughly 58 percent of the notional amounts in global CDS market in
2020, with the remainder being about evenly split between contracts written on speculative-grade instruments
and instruments that either had an unknown credit rating or no credit rating (BIS, 2021).
The larger share of contracts written on investment-grade entities may seem counterintuitive. After
all, one might have expected that protection buyers would be more interested in protecting themselves from
their riskier debtors, rather than from highly-rated borrowers. In part, the preponderance of contracts written
on investment-grade instruments traces its roots to the early days of the credit derivatives market, when bank
capital requirements set by regulators tended not to differentiate between lending to investment- and
speculative-grade borrowers. For instance, the terms of the 1988 Basel Accord called on financial regulators
to require banks to hold the same amount of capital in reserve for monies lent to, say, an investment-grade,
A-rated borrower as they would for a speculative-grade borrower. Nonetheless, lending to the former yielded
a lower expected return, giving banks an incentive to free up the regulatory capital associated with loans to
investment-grade borrowers by buying protection in the CDS market.
But the treatment of bank regulatory capital and banks’ use of credit default swaps has changed
dramatically since the 1988 Basel Accord, especially after the GFC. Indeed, even before the crisis, the terms
of the Basel II Accord provided for greater discrimination among differently rated borrowers for the
purposes of setting regulatory capital requirements. This and other regulatory changes partly explain why, as
large as the market share of contracts written on investment-grade instruments is today, it is much smaller
than it was in earlier times. For instance, a survey run by FitchRatings (2003) reported that contracts written
on investment-grade instruments accounted for 92 percent of the credit derivatives market in 2003
(compared to about 58 percent in 2020).
Issues unrelated to regulatory capital also help explain the rising share of contracts written on
speculative-grade entities. Indeed, respondents to a survey run by the British Bankers Association (2002)
reported that they expected credit derivative uses directly related to regulatory capital management to
eventually play a less prominent role in the evolution of the market. In part, that view reflected the
expectation that market participants would become more focused on using credit derivatives as tools for
overall portfolio management. In addition, protection buyers’ attention was expected to continue to shift
7
from regulatory to economic capital. As a result, some market participants expected (correctly, it turned out)
that the market share of credit default swaps written on speculative-grade entities would increase.
4. Basic Mechanics of a Credit Default Swap
As an illustration, consider a credit default swap where the two parties agree on a notional amount of
$100 million, a reference entity, a term (the period covered by the contract), and a CDS spread of 40 basis
points. In this case, the protection buyer will pay $100,000 every quarter to the protection seller. If no
default by the reference entity occurs during the life of the CDS, the protection seller simply pockets the
premium payments. Should a default event occur, however, the protection seller becomes liable for the
difference between the face value of the debt obligations issued by the reference entity and their recovery
value. For instance, assuming that the reference entities’ obligations are worth 20 cents on the dollar after
default, the protection seller's liability to the protection buyer in the event of default would be $80 million.
The contract is terminated once the seller fulfills its default-related obligation.
In the event of default by the reference entity, a CDS can be settled physically or in cash, with the
settlement choice determined upfront when entering the contract. In a physically settled swap, the protection
buyer has the right to sell (deliver) a range of defaulted assets to the protection seller, receiving as payment
the full face value of the assets. The types of deliverable assets are also prespecified in the contract. For
instance, the contract may determine that any form of senior unsecured debt issued by the reference entity is
a deliverable asset, and thus any bank loan or bond that meets this criterion is a deliverable asset.
In a cash settled swap, the counterparties may agree to poll market participants to determine the
recovery value of the defaulted assets, and the protection seller is liable for the difference between face and
recovery values. The asset or types of assets that will be used in the poll are prespecified in the contract. In
the earlier days of the CDS market, cash settlement was more common in Europe than in the United States,
where, by far, the majority of CDS were physically settled. Since 2009, however, settlements in both the U.S.
and Europe have increasingly happened through auctions involving the relevant defaulted instruments, where
the auctions generally determine a common recovery rate for cash settling the contract. Auctions have
become the standard settlement method in the global CDS market.
The legal terms of credit default swap agreements are highly standardized and have been so for a
long time. Indeed, the adoption of standardized documentation for CDS agreements has played an important
role in the development and increasing liquidity of the CDS market. The use of master agreements
sponsored by the International Swaps and Derivatives Association (ISDA) is a common market practice,
significantly reducing setup and negotiation costs. The standard contract specifies all the obligations and
rights of the parties as well as key definitions, such as which situations constitute a “credit event”—a default
by the reference entity—and how a default can be verified. Regarding the former, CDS contracts generally
allow for the following types of default events:
8
• Bankruptcy
• failure to pay
• debt moratorium
• debt repudiation
• restructuring of debt
• acceleration or default
Some of these events are more common in contracts involving certain types of reference names. For
instance, moratorium and repudiation are typically covered in contracts referencing sovereign borrowers. In
addition, CDS contracts have historically been negotiated both with and without restructuring included in the
list of credit events.
The maturity of a credit default swap does not have to match that of any particular debt instrument
issued by the reference entity. The five-year maturity is especially common, although it is possible, and
increasingly easier, to terminate or unwind a credit default swap before its maturity (and this is commonly
done) in order to extract or monetize the market value of the position. Typically, unwinding a CDS position
requires both parties in the contract to agree on the market value of the position. The party for whom the
position has negative market value then compensates the other accordingly. Alternatively, a party may be able
to close out its position by assigning it to a third party, but this generally requires the approval of both new
counterparties.
5. Main Uses
As with any other derivative instrument, credit default swaps can be used to either avoid or take on risk, in
this case credit risk. Protection buyers are credit risk avoiders; protection sellers are credit risk takers, and, of
course, the market would not exist without either of them. At the most basic level, protection buyers use
credit default swaps to buy default insurance, and protection sellers use CDS contracts as a source of income.
In practice, however, market participants’ uses of credit default swaps go well beyond this simple insurance
analogy.
5.1. Protection Buyers
Credit default swaps allow banks and other holders of credit instruments to hedge anonymously their
exposure to the credit risk associated with particular debtors. Thus, while the credit instruments may remain
in the protection buyer’s balance sheet—which may be important particularly to banks for client-relationship
reasons—the associated credit risk is transferred to the protection seller under the CDS contract.
9
Some market participants, however, may want to buy protection through credit default swaps even if
they have no exposure to the reference entity in question. Buying protection is akin to shorting the reference
entity's debt—in that the market value of the protection buyer’s position would increase in the event of a
subsequent deterioration in the credit quality of the reference entity.
5.2. Protection Sellers
For protection sellers, the credit default swap market offers an opportunity to increase the yield on their
portfolios or diversify their credit risk exposure. Here again there is a straightforward analogy to selling
traditional insurance policies. For as long as the events covered in the contract do not occur, protection
sellers receive a steady stream of payments that essentially amount to default insurance premiums.
Of course, prospective protection sellers could, in principle, simply buy debt instruments issued by
the desired reference entities directly in the marketplace in order to earn a potentially higher yield or to
benefit from greater portfolio diversification. Furthermore, buying credit risk through outright long positions
in, say, corporate bonds and loans, has the advantage of not exposing one to counterparty credit risk in the
CDS contract. This begs the question of what motivates someone to sell protection in the CDS market.
The largely unfunded nature of credit default swaps distinguishes them importantly from cash market
instruments such as bonds and bank loans. For instance, credit default swaps allow an investor to obtain, say,
exposure to $10 million worth of debt issued by the reference entity with essentially no initial capital outlay or
at an upfront cost that is much smaller than the notional amount of protection provided by the contract. In
contrast, that same exposure would have required a sizable initial cash outlay by the investor if the exposure
were obtained in the form of a direct purchase of the reference entity’s bonds or loans.
Of course, if the investor could finance the cost of the outright purchase in the repo market for
bonds or loans issued by the reference entity, the transaction could also be characterized as one requiring little
or no initial net cash outlay. In particular, the investor would buy the bond or loan for its market price of,
say, Y and immediately repo it out, essentially using the bond or loan as collateral for a loan in the amount of
Y. This repo-financed transaction may not work well in practice, however, because the repo market for
corporate debt is typically not that liquid.
Credit default swaps can also be used to create synthetic long positions in corporate debt: Instead of
holding the credit risk assets outright, one can simply sell protection in a CDS contract. This use of credit
default swaps highlights the fact that, in addition to their largely unfunded nature, credit default swaps might
be particularly attractive to investors when outright positions in debt instruments issued by the reference
entity are difficult to establish. Consider, for instance, a firm whose debt is closely held by a small number of
investors. For an investor who wants to obtain credit risk exposure to that firm, but who cannot buy its debt
instruments directly in the cash market, selling protection via a CDS contract becomes a potentially appealing
alternative. Our financial intuition should tell us that, at least in theory, the income that the investor will
10
receive under the CDS contract will be closely linked to the cash flow that it would have received if buying
the reference entity's debt directly.
5.3. CDS Spreads as Market Indicators
We have thus far focused on the main uses of credit default swaps strictly from the standpoint of those who
participate in the credit derivatives market. Not so obvious, but potentially very important, is the growing use
by market participants and non-participants alike of pricing information from credit default swaps as
indicators of market sentiment regarding specific reference entities and credit risk in general. Credit default
swap indexes, in particular, have become common barometers of conditions in the overall credit market--
please see section 8.
Indeed, some market observers have even suggested that prices in the credit default swap market
have a tendency to incorporate information more quickly than prices in the corporate bond market given that,
at times, it may be easier to enter into swap positions than to buy or sell certain corporate bonds and loans.
Whether information truly is reflected first in the credit derivatives or cash markets remains a point of
empirical debate, but the fact is that both investors and regulators have started to pay closer attention to
signals sent out by the credit default swap.
6. Valuation Considerations
Valuing a CDS can be thought of as arriving at the value of the CDS spread that would result in no money
changing hands at the inception of the CDS contract. This spread is commonly called the “par CDS spread.”
We can use a simple, static replication approach to arrive at the par CDS spread. That approach tells us that if
we can devise a portfolio made up of simple securities that replicates the cash flows and risk characteristics of
the contract we want to price, the price of that contract is, in the absence of arbitrage opportunities, simply
the price of setting up the replicating portfolio.4
Following Bomfim (2002), we will consider two stylized examples that provide some basic insights
regarding the valuation of credit default swaps.
Example 1: Let Rf denote the current coupon rate for a floating-rate note that is not subject to default risk,
and Rf+S denote the coupon rate for an otherwise identical floating-rate note that is subject to default risk (S
is the credit spread). An investor who is offered the choice of one of two portfolios:
4 There are other technical conditions that the replicating portfolio must satisfy, such as the requirement that it must
constitute a self-financing investment strategy, but we will just assume that all these conditions are satisfied here. Baxter and Rennie (2001) provide an intuitive discussion of this topic. For a more rigorous, but still accessible exposition of replicating strategies, see, e.g., Bjork (2009).
11
• a long position in this risky floater combined with a short position in the riskless floater;
• a protection-selling position in a CDS written on the issuer of the risky floater.
We assume that both floaters have the same maturity, coupon dates, and face values ($1 each), and
that they sell at par immediately after their coupon payment dates. To keep things even simpler, assume
further that the recovery rate on the risky floater is zero and that default can only occur immediately after the
coupon payment dates. In addition, we assume that the CDS position involves no upfront payments.
What are the cash flows associated with each portfolio? For as long as the issuer of the risky floater
does not default, the first portfolio yields S every period. As for the second portfolio, the CDS has a cash
flow of Scds every period, where Scds is the CDS premium.
In the event of default, the holder of the portfolio of floaters ends up with a short position in the
riskfree floater, which translates into a liability of $1, given that the floater is valued at par on its coupon
payment dates. The protection seller in the CDS is liable for the CDS payoff, which is also worth $1. Thus,
when there is a default, both portfolios have the same payoff.
Let’s pause here to make two key points:
• With time-varying interest rates, the static replication argument outlined above would generally
fail if, instead of using floating-rate notes to replicate the CDS cash flows, we had used fixed-rate
notes. This is so because a fixed-rate note is not generally valued at par after it is issued and thus
the liability of the short seller in the event of default could well be different from $1.
• Neither portfolio required a cash outlay when they were set up: The proceeds of the short sale of
the riskless floater were used to finance the purchase of the risky floater, and it costed nothing to
enter into the CDS.
Given the same initial cost, the same payoffs in the event of default, and the same risk exposure of
the CDS transaction and the portfolio of floaters, it must be the case that the CDS and the floater portfolio
have the same cash flow in the absence of a default by the reference entity. This requires that Scds=S. Thus,
under the conditions set out above, the premium that should be specified in a CDS written on a given
reference entity is the same as the risk spread associated with a par floater issued by that entity.
Let’s now try to make our example a little more realistic. We have thus far ignored the fact that the
first portfolio ultimately has to be funded on the balance sheet, whereas the CDS does not. This is where
example 2 comes in.
Example 2: Using the same notation and assumptions of example 1, consider the following two scenarios:
12
• The investor finances the purchase of the risky floater, by repoing it out, paying the repo rate
Rf+F. (Alternatively, we can think of Rf+F as the rate at which the investor can obtain
financing for the portfolio.) Assuming no default by the issuer of the risky floater, the investor
receives Rf+S every period and pays out Rf+F to its repo counterparty. In the event of default,
the risky floater becomes worthless, and the investor ends up owing $1 to its repo counterparty.
To sum up, the investor's cash flows are: S-F (no default) and -$1 (default).
• The investor sells $1 worth of protection in a CDS written on the issuer of the same risky floater
considered in the previous scenario. The cash flows associated with such a CDS position are:
Scds (no default) and -$1 (default).
Again, notice that neither strategy required an initial cash outlay and both have the same payoff in the
event of default. Thus, in the absence of arbitrage opportunities and market frictions, it must be the case that
they have the same payoff in the absence of default, i.e., the CDS premium, Scds, must be the equal to the
difference between the risky floater spread, S, and the investor's funding cost, F:
Scds = S – F (1)
where the above differs from the result obtained from example 1 because we are now explicitly taking into
account the fact that the first portfolio has to be funded on the balance sheet of a leveraged investor whereas
the CDS is an unfunded instrument.
To bring the discussion of the above examples even closer to the real world, we should note the
following: Although the above approach for pricing a CDS relied on rates on par floaters issued by the
reference entity, most corporate debt issued in the United States are fixed-rate liabilities. In practice,
however, one can circumvent this problem by resorting to the asset swap market.5 In particular, the above
examples can be made more realistic as illustrations of how to obtain an (approximate) value for the CDS
premium if we (i) substitute the par floater spread, S, with the par asset swap spread associated with the
reference entity and (ii) redefine Rf as a short-term LIBOR rate in order to conform with the quoting
convention for asset swaps. This would lead to the following version of equation (1):
Scds = Sa (2)
5 Asset swaps are a common form of derivative contract written on fixed-rate debt instruments. The end result of an asset swap is to separate the credit and interest rate risks embedded in the fixed-rate instrument. Effectively, one of the parties in an asset swap transfers the interest rate risk in a fixed-rate note or loan to the other party, retaining only the credit risk component. As such, asset swaps are mainly used to create positions that closely mimic the cash flows and risk exposure of floating-rate notes (Bomfim 2016).
13
where Sa is the asset swap spread associated with the reference entity.
6.1. CDS vs. Cash Spreads in Practice
In practice, CDS spreads can vary substantially from the corresponding reference entity’s asset swap or
floater spread. For instance, when Scds > Sa, market participants say that there is a positive “CDS-cash
basis” for that reference entity.
(CDS-cash basis) = (CDS spread) - (par asset swap spread) (3)
CDS and asset swap spreads can diverge for a number of reasons, including market segmentation
and idiosyncratic supply and demand factors. For example, in the earlier days of the CDS market, instances of
substantial positive bias were sometimes associated with strong demand by convertible bond investors for
buying default protection against the issuers of those bonds. Those investors were focusing primarily on the
cheapness of convertible bonds’ embedded equity call options while using the CDS market to shed the credit
risk associated with the bonds.
Another factor that contributes to positive bias is the fact that participation in the CDS market is
limited either by some investors’ lack of familiarity with credit derivatives or by regulatory restrictions and
internal investment policies of certain institutional investors. In addition, for some reference entities, a CDS
liquidity premium, reflecting the poorer liquidity of the CDS market relative to the cash (corporate bond)
market for those entities, may also be a factor leading to positive bias.
Other factors that could contribute to a nonzero CDS-cash basis include
• cheapest-to-deliver feature of CDS contracts (for physically settled contracts),
• default-contingent exposure in asset swaps,
• accrued premiums in CDS contracts,
• funding risk in asset swaps,
• counterparty credit risk,
• liquidity risk differentials.
6.2. Counterparty Credit Risk
In principle, a significant consideration for purchasers of protection in the credit default swaps market is the
credit quality of the protection seller. The protection seller may itself go bankrupt either before or at the same
time as the reference entity. This is, of course, what is meant by counterparty credit risk. As noted below,
market participants commonly use credit-enhancement mechanisms—such as the posting of collateral—to
14
mitigate the effects of counterparty credit risk in the pricing of CDS contracts. In the absence of these
mechanisms, however, and other things being equal, the higher the credit quality of a given protection seller
relative to other protection sellers, the more it can charge for the protection it provides.
Regarding its credit default swap counterparty, the protection buyer is subject to two types of risk:
Should the protection seller become insolvent before the reference entity, the protection buyer is exposed to
“replacement risk” or the risk that the price of default insurance on the reference entity might have risen
since the original default swap was negotiated. The protection buyer's greatest loss, however, would occur
when both the protection seller and the reference entity default at the same time, and hence the importance
of assessing the extent of default correlation between the reference entity and the protection seller.
6.3. Collateralization and Netting
As the credit default swap market has grown, so have market participants' exposures to one another. An
important step that market participants took early on to reduce counterparty credit risk is to require the
posting of collateral against the net exposures resulting from CDS positions. Collateral, primarily cash, is
commonly adjusted daily to reflect the net marked-to-market value of the CDS positions between two
counterparties (see section 6.5 for a discussion of a simple marking-to-market approach). Typically, when
both counterparties are dealers--or even for a non-dealer counterparty that is active in many sectors of the
derivatives market--collateral arrangements tend to be more complex, in that they will cover net exposures on
all over-the-counter derivative positions, not just CDS.
Note that the focus is on “net” exposures between counterparties, and, indeed, this netting of
counterparty credit risk exposures is an important feature of market functioning. Consider a simple example.
AZZ Bank and XYZ Bank have a large number of credit default swaps between the two of them. AZZ's
total exposure to XYZ amounts to $100 billion, whereas XYZ's exposure to AZZ is $90 billion. Netting
means that the exposures of the two banks to one another are offset before any collateral is posted so that
what matters in the end is the $10 billion net exposure of AZZ to XYZ. This would be the only amount
against which any collateral would be calculated, and this would be the claim that AZZ would have on XYZ
in the event of a default by XYZ.
Taken together, early adoption of collateralization and netting practices, along with standardized
documentation, have had the effect of helping overcome some of the “growing pains” of the credit default
swap market. While standardized documentation has helped reduce legal risk and transaction costs,
collateralization and netting have eased concerns about counterparty credit risk, especially as potential risk
exposures through credit derivatives have grown.
6.4. CDS-Implied Credit Curves

15
Thus far, our main input for determining the fair value of a CDS spread has been pricing information from
other credit instruments, such as par asset swap spreads and par floater spreads. Certain reference entities,
however, may not have marketable debt outstanding, or the market for their debt may be very illiquid and
available quotes may be uninformative.
An alternative approach to valuing credit default swaps that is especially useful when reliable market
prices on related instruments are not available is the one based on credit risk models.6 Suppose we have a
model that gives us the default probabilities associated with a given reference entity. Consider now the simple
case of a one-year CDS with a $1 notional amount and a single premium payment, Scds, due at the end of the
contract. Assume further that a default by the reference entity, if any, occurs only at the maturity date of the
contract. (To keep things even simpler, assume no counterparty credit risk and no market frictions such as
illiquidity or market segmentation.)
Let’s start with a credit default swap that has zero market value at its inception, which means that the
CDS spread is such that the value of the “protection leg”—defined as the present value of the expected
payment made by the protection seller in the event of default by the reference entity—is equal to the value of
the “premium leg”—defined as the present value of the premium payments made by the protection buyer.
The current value of the protection leg is simply the present value of the premium:
PV(premiums) = PV(Scds) (4)
where PV(.) denotes the present value of the variable in parenthesis.
To arrive at an expression for the protection leg, define w as the probability that the reference entity
will default in one year's time. The protection seller will have to pay (1-X) with probability w and 0 otherwise,
where X is the recovery rate associated with the defaulted instrument. Thus, we can write the present value
of the protection leg as:
PV(protection) = PV(w [1-X]) (5)
If the CDS is to have zero market value at its inception, the present values in equations (4) and (5) must be
equal, and that will happen when
Scds = w [1-X] (6)
6 See, for instance, Bomfim (2016) for a basic introduction to credit risk modeling.
16
and we get the result that the cost of protection, Scds, is increasing in the probability of default and
decreasing in the recovery rate associated with the reference entity. In particular, in the limiting case of no
recovery, the CDS premium is equal to the probability of default. Thus, if we have a theoretical model that
gives us the default probabilities associated with the reference entity, we can price a CDS written on that
entity accordingly.
The above results can be easily generalized, with a few modifications, for more realistic cases, such as
multi-period credit default swaps. In particular, let Q(t,Tj) denote the risk-neutral probability, as of time t,
that the reference entity will not default by a future time Tj, where Q(t,Tj) is conditional on all information
available at time t and, naturally, on the issuer not having defaulted by time t. More generally, for any given
issuer or reference entity, one can imagine an entire term structure of survival probabilities, which is one way
of thinking of that entity’s credit curve.
Consider now a CDS with a notional amount of $1, written at time t on this reference entity, and
with premium payment dates at [T1, T2 …, Tn]. Let Sn be the corresponding annualized CDS premium. For
simplicity, assume that, in the event of default, the protection seller will pay (1-X) at the premium payment
date immediately following the default, where X, restricted to be between 0 and 1, is the reference entity’s
recovery rate.
As noted above, we can think of a CDS as having two “legs:” The premium leg is made up of the
periodic payments made by the protection buyer; the protection leg is the default-contingent payment made
by the protection seller. Assuming that the occurrence of defaults is independent of the riskfree interest rate
embedded in the prices of riskless bonds, the present discounted value of the premium leg can be written as:
PV(premiums) = ∑ 𝑍𝑛𝑗=1 (t,Tj) Q(t,Tj) 𝛿j Sn (7)
where Z(t,Tj) is the time-t price of a riskless zero-coupon bond that matures at Tj with a face value of $1, and
𝛿j is the accrual factor for the jth premium payment (the number of days between the (j-1)th and jth premium
payment dates divided by the number of days in the year, based on the appropriate day-count convention).
Equation (7) shows that there are two elements to discounting future premiums. When computing
the present value of a future payment, first, there is the time-value of money, captured by Z(t,Tj), and, second,
one must take account of the fact that a future premium due, say, at Tj will only be received if the reference
entity has not defaulted by then, and, conditional on all information available at time t, the risk-neutral
probability of that happening is Q(t,Tj).7
The present value of the protection leg can be written in a similar way:
7 Equation (7) can be modified to account for the premium accrued between the last premium payment date and the date of default—see, for instance, Bomfim (2016).
17
PV(protection) = ∑ 𝑍𝑛𝑗=1 (t,Tj) Prob[Tj-1 < 𝜏 ≤ Tj] [1-X] (8)
where 𝜏 is the time of default, and Prob[Tj-1 < 𝜏 ≤ Tj] denotes the probability, conditional on information
available at time t, that the reference entity will default between Tj-1 and Tj. The intuition behind (8) is
straightforward: One does not know whether and when a default will occur, but there is some probability
Prob[Tj-1 < 𝜏 ≤ Tj] that the reference entity will default during the interval [Tj-1, Tj], in which case the
protection seller would have to pay (1-X) at Tj, which is worth Z(t, Tj) (1-X) in today's dollars. As a result, the
present value of the protection leg of the CDS is the probability-weighted sum of all possible default
scenarios. We can then write:
PV(protection) = ∑ 𝑍𝑛𝑗=1 (t,Tj) [Q(t,Tj-1)-Q(t,Tj)] [1-X] (9)
Equations (7) and (9) allow us to write an expression for the par CDS spread:
Sn ={∑ 𝑍𝑛𝑗=1 (t,Tj) [Q(t,Tj-1)-Q(t,Tj)] [1-X]} / {∑ 𝑍𝑛
𝑗=1 (t,Tj) Q(t,Tj) 𝛿j} (10)
Our starting point for arriving at equation (10) was model-based estimates of the default probabilities
of the reference entity. But we can turn this process the other way around. In particular, suppose we see
quotes for CDS spreads for a given reference entity for contracts with maturities ranging from T1 and Tn. In
this case, and assuming we know the risk-free discount factors Z(t,Tj), for j = 1 to n, we can use (10) to
“bootstrap” the CDS-implied risk-neutral survival probabilities of the reference entity. For, instance, starting
with j=1, Q(t,T1) is easily computed as (1-X)/(1-X+ 𝛿1 S1), which can then be used to compute Q(t,T2), and
so on.
6.5. Marking to Market a CDS Position
The market value of a CDS position varies over time, mostly reflecting changes in how the market assesses
the creditworthiness of the reference entity. Marking a CDS position to market is the act of determining
today’s value of a CDS agreement that was entered into at some time in the past.
Consider, for instance, a credit default swap that was written one year ago, with an original maturity
of five years. Suppose that the reference entity is a corporation that was perceived to have a substantially
more favorable profit outlook one year ago (and hence higher survival probabilities) than today. As a result,
we assume that the CDS premium that was written into the year-old contract is substantially lower than the
one that would be written into a brand-new contract today. Under these circumstances, the protection seller
18
in the year-old contract is collecting a premium that is well below the going market rate. This contract then
has negative market value to the seller of protection. The protection buyer, on the other hand, is holding a
contract with positive market value as she is paying well below the premium she would pay if setting up a
brand-new contract today.
How can we value the year-old contract? One simple approach is to think of the problem of valuing
the year-old contract as that of computing its “replacement cost.” To put it simply,
replacement cost = value of new contract - value of old contract (11)
Assuming that the newly minted four-year contract was negotiated such that it has no market value at
its inception---that is, the new contract calls for a CDS spread, S4, that is equal to the reference entity’s par
CDS spread. Given the above expression, this means that the replacement cost of the old contract is simply
the negative of its current market value. After some simple manipulations, and assuming (for simplicity) that
the premiums are paid annually, we can write the value (to a protection buyer) of the year-old contract (which
had an original maturity of 5 years) as:
Time-t value of year-old contract = ∑ 𝑍4𝑗=1 (t,Tj) Q(t,Tj) 𝛿j [S4 -S5,old ] (12)
where S5,old is the CDS spread written into the year-old contract, which now has a remaining maturity of four
years.
7. Effects of the Global Financial Crisis on CDS Market Conventions
In many ways, the GFC left a lasting imprint on the CDS market. We have already mentioned the growing
importance of central counterparties in the global CDS market in the post-crisis environment. We discuss
below two additional post-crisis innovations: the widespread use of standardized coupons and upfront
premiums (which also had the effect of facilitating the rise of central counterparties) and the growing
popularity of CDS indexes.
7.1. Upfront Payments and Standardized Coupons
The simple examples addressed thus far assumed that the CDS contract had no market value at its inception.
As we discussed above, the CDS spread for such a contract is such that, at the time of the contract’s
inception, the present value of the protection leg of the swap is equal to the present value of the premiums
leg.

19
Contracts with zero market value at inception were the norm in the years before the 2008 crisis. Back
then, it was generally the case that only contracts written on reference entities that were viewed as potentially
headed for trouble in the near term required upfront payment of a portion of the protection premiums. The
upfront payments helped attract protection sellers to a market that could otherwise be severely one-sided,
especially if the entities referenced in those contracts were perceived as being subject to “jump-to-default
risk.”8
Since the 2008 crisis, however, contracts involving upfront payments have become standard, and not
just because of jump-to-default considerations. Indeed, a major driver of the shift to upfront payments was a
push for further standardization of contract terms and practices in the global CDS market. An important part
of that push was the adoption of a fixed CDS spread and predetermined payment dates for all reference
entities in a given class. For instance, in North America, standard CDS contracts written on high-grade
corporates generally specify a fixed spread of 100 basis points, regardless of the characteristics of the
reference entity. Contracts written on corporates in the high-yield sector generally specify a spread of 500
basis points.
To see how upfront payments relate to coupon standardization, consider the case of a high-yield
corporate that is perceived to be sufficiently risky that its par CDS spread is significantly higher than the
standard 500 basis points specified in the contract. In this case, a CDS contract with the standard premium
would require an upfront payment from the protection buyer to the protection seller in order to compensate
the latter for a contract-specified spread that is essentially too low. (The upfront payment would flow in the
opposite direction if the par CDS spread were perceived as being lower than the standardized spread
specified in the contract.)
7.2. Valuing Upfront Payments
At its most basic level, valuing an upfront payment comes down to marking to market a CDS contract whose
premium is set to a predetermined (standardized) value, instead of the reference entity’s par CDS spread. To
make the point a little more concrete, let Sstd denote the standardized spread written into the contract. Using
the same logic followed above to mark to market an old CDS position, we can write the market value (to the
protection buyer) of this brand-new CDS contract with a standardized spread of Sstd and a par spread of
Spar as
Market Value to Protection Buyer = ∑ 𝑍𝑛𝑗=1 (t,Tj) Q(t,Tj) 𝛿j [Spar -Sstd ] (12)
8 The rationale for requiring upfront payment for contracts where jump-to-default risk was perceived as being high was (and remains) simple: Without an upfront payment, the protection seller might be called upon to cover a default event before it has had the opportunity to earn much of the protection premiums.
20
Equation (12) says that the upfront payment from the protection buyer to the protection buyer is equal to the
present value of the difference between two premium payment streams, one associated with the reference
entity’s par CDS spread, Spar, the other with the standardized coupon written into the contract, Sstd. Again,
if the standardized coupon happened to be above the par CDS spread, in which case the market value to the
buyer would be negative, the upfront payment would flow from the protection seller to the protection buyer.
7.3. Standardized Coupons and Central Clearing
Standardized coupons have facilitated the central clearing of CDS trades and made it easier (less costly) for
market participants to close or unwind existing CDS positions. As such, they have enhanced the overall
liquidity of the CDS market.
For instance, from a dealer’s perspective, the unwinding of a CDS position by an end user generally
results in transferring (assigning) that position to the dealer, with the dealer seeking to hedge the risks in its
newly acquired position by entering into at least one offsetting position on the same reference entity with
another counterparty. With standardized spreads, the dealer’s cost of hedging the position acquired from the
end user is generally lower than with non-standardized spreads. In particular, there is no cash flow mismatch
for the dealer between the old and new contracts, which helps limit the dealer’s exposure to risks associated
with the timing of an eventual default by the reference entity. Ultimately, the lower cost of hedging for the
dealer translates into a lower cost of unwinding the position for the end user, with the end result being
enhanced market liquidity.
Without standardized spreads, the hedging position sought by the dealer would typically involve a
very different spread from the one in the contract acquired from the end user. For instance, if position
acquired from the end user involves a coupon that is substantially lower than the one received in the newly
entered hedging position, the dealer would be exposed to the risk of a sudden default by the reference entity,
which would cut short the stream of higher CDS payments embedded in the hedging position.
8. CDS Indexes
Credit default swap indexes are a relatively recent addition to the credit derivatives market. The earliest
versions of CDS indexes were introduced in 2001. Since then, especially after the 2008 financial crisis, index
products have become an increasingly important segment of the credit derivatives market, reaching close to
42 percent of the global notional amount outstanding by mid-2013—Bank for International Settlements
(2013).
In its simplest form, a CDS index can be thought of as a portfolio of the most actively transacted
single-name CDS contracts in each segment of the market. Indeed, for an equal-weighted index, the index par
spread should be sufficiently close to the average of the individual par spreads associated with the index’s
21
constituents. In practice, however, liquidity and demand and supply factors can drive a wedge between the
valuation of the index and that of its components.
8.1. The Mechanics of the CDX.NA.IG Index
We will use the Markit North American CDX Investment Grade Index—CDX.NA.IG—to illustrate how
CDS indexes generally work.9 CDX.NA.IG is one of the most actively traded CDS indexes. It is an equal-
weighted index that tracks the 125 most liquid single-name CDS contracts transacted in North America,
provided the credit rating of the constituent reference entities is at least “BBB-“ or “Baa3.” Once the
constituents of a given vintage (“series”) of the index are chosen, the composition of that series remains
fixed, as long as there are no defaults among the constituents. Buying and selling the CDX.NA.IG index is
akin to selling and buying a portfolio of debt instruments issued by the reference entities included in the
index. Coupon conventions for an index generally are the same as for its constituent single-name contracts.
The composition of CDX.NA.IG is refreshed every six months, at which point a new index “series’’
is generated. For instance, in late 2014, series 23 of CDX.NA.IG—or CDX.NA.IG.23—was the on-the-run
index. Older series—CDX.NA.IG.22, CDX.NA.IG.21, etc.—continue to trade until their maturity date, but
liquidity tends to migrate to the on-the-run series.
Credit events related to a given index generally follow the definitions and procedures specified in the
single-name CDS contracts that make up the index. For instance, for CDX.NA.IG, the relevant credit events
are bankruptcy and failure to pay. We will use a simple numerical example to illustrate how a default by an
index constituent is handled. Let’s start with a position in CDX.NA.IG with a total notional amount of $10
million. As noted above, CDX.NA.IG is an equal-weight index, which means that each constituent
corresponds to 1/125 of the position, or a notional amount of $80,000 per constituent in this case. A default
by one of the index components would trigger the following changes:
• The weight of the defaulted entity in the index falls to zero.
• The total notional amount of the position in the index falls by 1/125, to $9.92 million.
• The index weight of each remaining constituent increases to 1/124, reflecting the fact that each
non-defaulted constituent still corresponds to a notional amount of $80,000.
9 Detailed information on the CDX.NA.IG index, as well as several other CDS indexes, can be obtained at the markit.com website. Markit owns, manages, and compiles the CDX family of indexes, as well as other indexes. Markit (2014) provides a useful overview of its indexes.

22
Source: IHS Markit
A default by an index constituent would also trigger a payment from the protection seller in the index
position to the protection buyer, just as it would be the case in a single-name CDS. Suppose the recovery rate
associated with the defaulted reference entity is 45 percent. Assuming that the position is cash settled, the
protection seller would have to pay $44,000 to the protection buyer, or (1-.45) x 80,000. The newly re-
weighted index continues to trade until its maturity date, though it would still be subject a further adjustments
in the event of additional defaults among its constituents.
8.2. CDS Indexes as Market Indicators
CDS indexes make it easier for investors and market observers to obtain exposure to, or simply track, a
specific sector of the credit market. Focusing on the North American investment-grade sector, Figure 3
shows the evolution of the CDX.NA.IG index since 2004, highlighting a few key episodes of financial and
macroeconomic stress. Not surprisingly, the GFC had a profound effect on CDS market pricing in the
United States, resulting in a broad, steep, and persistent widening in spreads that was first particularly
noticeable in early 2008, around the time of the collapse of the investment bank Bear Stearns and its
immediate acquisition by J.P. Morgan Chase.
It would not be until mid-2014 when the CDX.NA.IG index narrowed to levels close to its pre-GFC
range, although the European sovereign debt crisis did play a significant role in slowing the U.S. investment-
grade sector’s recovery from the GFC. In particular, by the spring of 2010, investors were becoming
increasingly worried that problems associated with a worsening fiscal picture in Europe--mostly focused on
Greece and a few other so-called peripheral EU countries at the time--could eventually hurt global growth
prospects, with negative spillover effects for the U.S. corporate sector. The fiscal outlook for Europe
Mar'08: Bear Stearns
May'10: concerns about Europe
Nov'11: Italian CDS curve inverts Jan'16: Chinese
market turmoil
Mar'20: Covid pandemic
0
50
100
150
200
250
300
8-J
ul-
04
8-J
ul-
05
8-J
ul-
06
8-J
ul-
07
8-J
ul-
08
8-J
ul-
09
8-J
ul-
10
8-J
ul-
11
8-J
ul-
12
8-J
ul-
13
8-J
ul-
14
8-J
ul-
15
8-J
ul-
16
8-J
ul-
17
8-J
ul-
18
8-J
ul-
19
8-J
ul-
20
8-J
ul-
21
Bas
is P
oin
ts
FIGURE 3: CDX.NA.IG INDEX
23
darkened further in 2011, spreading beyond the periphery--as illustrated by the inversion of the Italian
sovereign CDS curve later that year (Figure 2)--and the cost of buying default protection in the U.S. corporate
sector rose markedly in late 2011.
Following the resolution of the European sovereign debt crisis, the U.S. corporate debt market
enjoyed a period of relatively calm that was only briefly interrupted by a bout of financial market turmoil in
China around early 2016 and rising global trade frictions in late 2018. It took the onset of the Covid-19
pandemic in early 2020 for CDS spreads in the U.S. investment-grade sector to really spike again, but that
spike was short lived. One interesting aspect of the CDS market reaction to the economic effects of the
pandemic was the different behavior of the costs of buying default protection in contracts that referenced
consumer-facing businesses, such as airlines, relative to those that referenced producers of consumer goods.
For instance, while CDS spreads in both the consumer-goods and consumer-services sectors widened
markedly in the earliest stage of the pandemic, CDS spreads for consumer-facing reference entities took
longer to recover, consistent with changes in consumer spending patterns at the time that resulted in a shift
towards goods consumption and away from services consumption.
9. Concluding Remarks and the Use of CDS in the Literature
The market for credit default swaps is still relatively young but has already become an integral part of the
global credit market. Market participants actively use CDS to adjust their risk exposures as well as to infer
evolving market views on credit risk. In addition, there is a growing academic and practitioner literature on
credit default swaps. That literature has examined a range of CDS-specific issues, including the role of
counterparty credit risk in the determination of par CDS spreads (Hull and White, 2000); how quickly new
information is reflected in the CDS pricing, relative to other markets (Tolikas and Topaloglou , 2017), and the
degree of integration between the cash and CDS markets in developing economies (Chan-Lau and Kim,
2005). These are just a few of the topics that are ripe for further investigation in the professional literature.
Other paths for further research include the use of pricing data from the CDS market to examine broader
questions, such as the cost of sovereign defaults (Hebert and Schreger, 2017) and the systemic and country-
specific nature of credit risk in the U.S. and Europe (Ang and Longstaff, 2013).
24
References
Aldasoro, I. and T. Ehlers (2018). The Credit Default Swap Market: What a Difference a Decade Makes. BIS
Quarterly Review June, 1:14.
Ang, A. and F. A. Longstaff (2013). Systemic sovereign credit risk: Lessons from the U.S. and Europe. Journal
of Monetary Economics 60:493-510.
Austin, D. and R. Miller (2011). Treasury Securities and the U.S. Sovereign Credit Default Swap Market.
Congressional Research Service Report or Congress, August 15, 2011.
Bank for International Settlements (2013). OTC Derivatives Statistics at End-June 2013.
Bank for International Settlements (2021). OTC Derivatives Statistics at End-December 2020.
Baxter, M. and A. Rennie (2001). Financial Calculus: An Introduction to Derivative Pricing. Cambridge University
Press.
Bjork, T. (2009). Arbitrage Theory in Continuous Time. Third Edition, Oxford University Press.
Bomfim, A. N. (2002). Credit Derivatives and their Potential to Synthesize Riskless Assets. Journal of Fixed
Income December: 6-16.
Bomfim, A. N. (2016). Understanding Credit Derivates and Related Instruments. Second Edition. Academic Press.
Boyarchenko, N. and O. Shachar (2020). The Evolving Market for U.S. Sovereign Credit Risk. Liberty Street
Economics, Federal Reserve Bank of New York, January 6, 2020.
British Bankers Association (2006). Credit Derivatives Report 2006.
Chan-Lau, J. A. and Y. S. Kim (2008). Equity Prices, Bond Spreads, and Credit Default Swaps in Emerging
Markets. ICFAI Journal of Derivatives Markets 2:7-26.
Fitch Ratings (2011). Credit derivatives Survey: Focus on Sovereigns and Regulatory Issues, Special Report,
FitchRatings, September.
Hebert, B. and J. Schreger (2017). The Costs of Sovereign Default: Evidence from Argentina. American
Economic Review 107:3119-45.
Hull, J. C. and A. D. White (2001). Valuing Credit Default Swaps II: Modeling Default Correlations. The
Journal of Derivatives 8 (3) 12-21.
International Swaps and Derivatives Association (2010). ISDA Market Survey Summaries 2010-1995.
International Swaps and Derivatives Association.
Mahadevan, S., P. Naraparaju, and A. Musfeldt (2011). Sovereign CDS Markets, A Corporate Perspective.
Credit Derivatives Insights, Morgan Stanley.
Markit (2014). Markit Credit Indices: A Primer. Markit.
Stulz, R. M. (2010). Credit Default Swaps and the Credit Crisis. Journal of Economic Perspectives, Winter, 73-92.
25
Tolikas, K. and N. Topaloglu (2017). Is default risk priced equally fast in the credit default swap and the
stock markets? An empirical investigation. Journal of International Financial Markets Institutions and Money
51:39-57.
Wooldridge, P. (2019). FX and OTC Derivatives Markets through the Lens of the Triennial Survey. BIS
Quarterly Review December, 15:19.


![CIVIL CASES] [DEFAULT / OTHER MATTERS] - Supreme](https://img.dokumen.tips/doc/110x75/63199bb91e5d335f8d0b3a5a/civil-cases-default-other-matters-supreme-.jpg)


