Embed Size (px)
Citation preview

May 2008 examination session
The IB Diploma Programme statistical bulletin
1
The IB Diploma Programme statistical bulletin, May 2008 examination session
Published in November 2008
International Baccalaureate Peterson House, Malthouse Avenue, Cardiff Gate
Cardiff, Wales CF23 8GL United Kingdom
Phone: + 44 29 2954 7777 Fax: + 44 29 2054 7778 Website: www.ibo.org
© International Baccalaureate Organization 2008
Statistical queries should be directed to the management information coordinator:
Phone: +44 29 2054 7657 Fax: +44 29 2054 7778
Email: [email protected]

2
Contents
Tables and graphs Page Index: key to abbreviations
4
PART A: general school statistics
5–7
1 Number of schools following the Diploma Programme 2004–2008
5
2 Number and percentage of schools following the Diploma Programme by working language 2004–2008
6
3 Number and percentage of schools following the Diploma Programme by IB region 2004–2008
7
PART B: registration statistics
8–27
4 Number of schools registering candidates May 2004–May 2008
8
5 Number of May session schools registering candidates May 2004–May 2008
8
6 Number of schools registering candidates by working language May 2004–May 2008
9
7 Number and percentage of schools registering candidates by IB region May 2004–May 2008
10
8 Number of candidates registered by category May 2004–May 2008
11
9 Number of candidates registered by gender May 2004–May 2008
13
10 Number of candidates registered by IB region May 2004–May 2008
14
11 Number of candidates registered by category, gender and IB region May 2008
15
12 Summary of Diploma Programme examination entries: schools with registered candidates May 1975–May 2008
16
13 Number of schools that registered a particular number of candidates May 2004–May 2008
18
14 Subject registration summary May 2008
19
15 Subject group registrations May 2004–May 2008
19
16 Additional Diploma Programme requirements: extended essay and theory of knowledge May 2008
20
17 Subject registration summary: extended essay by subject group May 2008
20
18 Subject registration summary: theory of knowledge by language May 2008
21
19 Nationalities of candidates registered May 2008
22
20 Number of countries represented by examination session May 2004–May 2008
25
21 Number of candidates registered by country May 2008 26

3
PART C: results statistics
28–42
22 Analysis of examination results by subject and level May 2008
28
23 Diploma and retake candidates (D+R): distribution of points totals May 2008
36
24 Retake candidates only (R): distribution of points totals May 2008
37
25 Diploma score distribution: diploma and retake candidates (D+R) and retake candidates only (R) May 2008
38
26 Extended essay results May 2008
39
27 Theory of knowledge results May 2008
40
28 Distribution of additional points May 2004–May 2008
41
29 Mean points score worldwide May 2004–May 2008
42
30 Mean grade worldwide May 2004–May 2008
42
31 Pass rate worldwide May 2004–May 2008
42
32 Number of diplomas and bilingual diplomas awarded May 2004–May 2008
42
33 Number of diplomas awarded by IB region May 2008
42

4
Index: key to abbreviations
Categories of registration Diploma Programme candidates must register in one of four categories. These are identified by one of the following letters.
D Diploma: candidates intending to complete the requirements for the award of an IB diploma.
R Retake: previous IB diploma candidates who are seeking to improve their results.
The highest grade obtained for a subject will contribute towards the IB diploma. C Certificate: candidates taking one or more subjects who are not seeking the award
of the IB diploma.
A Anticipated: candidates intending to complete the requirements for one or two standard level subjects (excluding languages ab initio and pilot subjects) at the end of their first year of the Diploma Programme. They must complete all remaining IB diploma requirements in the corresponding examination session in the following year.
IB regions Schools that are authorized to offer the IB Diploma Programme are grouped by geographical region. The abbreviations used in the tables are the codes describing the following geographical regions:
IBAEM IB Africa, Europe and the Middle East IBAP IB Asia-Pacific IBLA IB Latin America IBNA IB North America and the Caribbean
Other abbreviations HL Higher level SL Standard level EE Extended essay TOK Theory of knowledge PS Pilot subjects SBS School-based syllabuses

5
PART A: general school statistics
1 Number of schools following the Diploma Programme 2004–2008
Number of schools following the
Diploma Programme* 2004 2005 2006 2007 2008
May session schools 1,067 1,179 1,298 1,428 1,601
November session schools
132 135 143 160 169
Total 1,199 1,314 1,441 1,588 1,770
*as of 31 May each year
Graph 1.1 Number of schools following the Diploma Programme 2004–2008
0
200
400
600
800
1,000
1,200
1,400
1,600
1,800
2,000
2004 2005 2006 2007 2008
Year
Nu
mb
er
of
sc
ho
ols
Number of Novembersession schoolsfollowing the DiplomaProgramme
Number of May sessionschools following theDiploma Programme
6
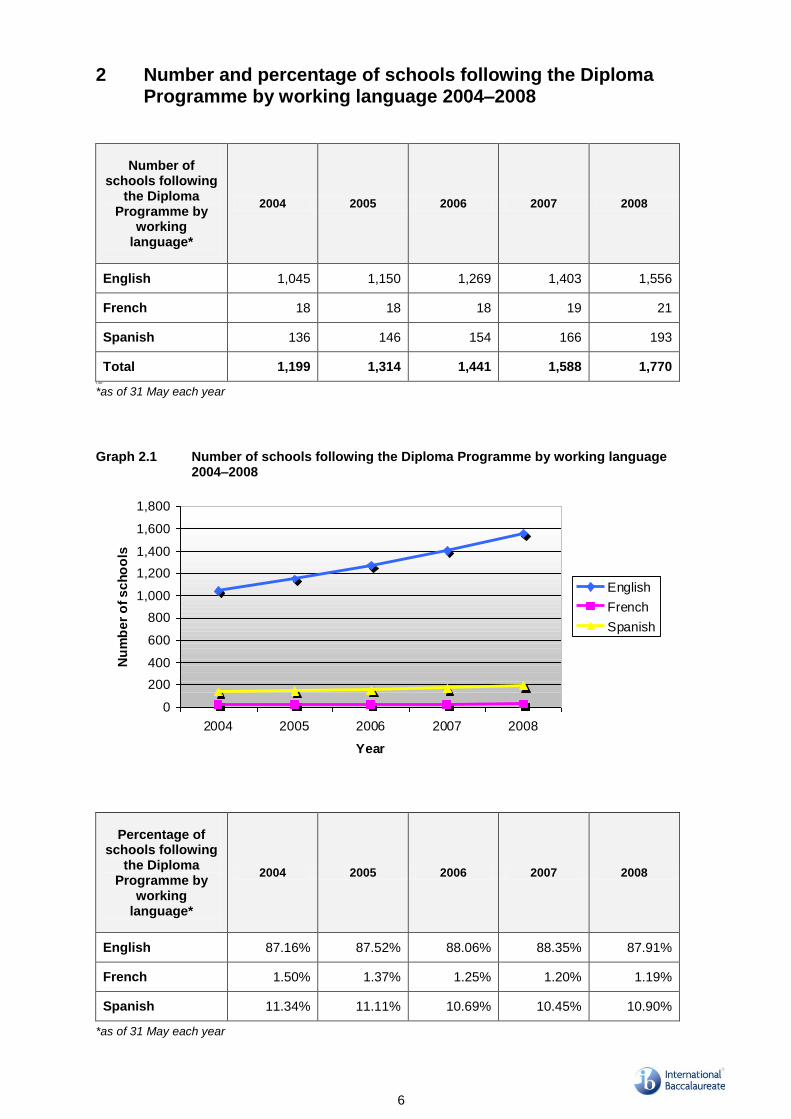
2 Number and percentage of schools following the Diploma Programme by working language 2004–2008
Number of schools following
the Diploma Programme by
working language*
2004 2005 2006 2007 2008
English 1,045 1,150 1,269 1,403 1,556
French 18 18 18 19 21
Spanish 136 146 154 166 193
Total 1,199 1,314 1,441 1,588 1,770 1,092
*as of 31 May each year
Graph 2.1 Number of schools following the Diploma Programme by working language
2004–2008
0
200
400
600
800
1,000
1,200
1,400
1,600
1,800
2004 2005 2006 2007 2008
Year
Nu
mb
er
of
sc
ho
ols
English
French
Spanish
Percentage of schools following
the Diploma Programme by
working language*
2004 2005 2006 2007 2008
English 87.16% 87.52% 88.06% 88.35% 87.91%
French 1.50% 1.37% 1.25% 1.20% 1.19%
Spanish 11.34% 11.11% 10.69% 10.45% 10.90%
*as of 31 May each year
7
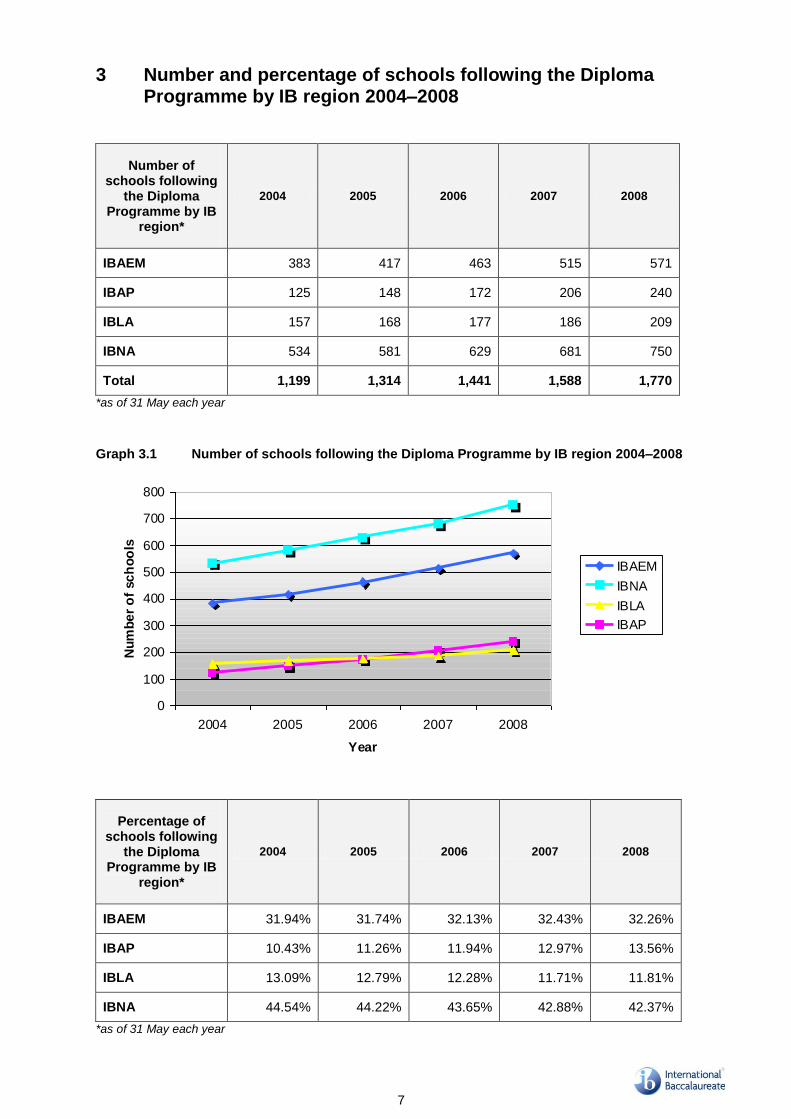
3 Number and percentage of schools following the Diploma Programme by IB region 2004–2008
Number of schools following
the Diploma Programme by IB
region*
2004 2005 2006 2007 2008
IBAEM 383 417 463 515 571
IBAP 125 148 172 206 240
IBLA 157 168 177 186 209
IBNA 534 581 629 681 750
Total 1,199 1,314 1,441 1,588 1,770
*as of 31 May each year
Graph 3.1 Number of schools following the Diploma Programme by IB region 2004–2008
0
100
200
300
400
500
600
700
800
2004 2005 2006 2007 2008
Year
Nu
mb
er
of
sc
ho
ols
IBAEM
IBNA
IBLA
IBAP
Percentage of schools following
the Diploma Programme by IB
region*
2004 2005 2006 2007 2008
IBAEM 31.94% 31.74% 32.13% 32.43% 32.26%
IBAP 10.43% 11.26% 11.94% 12.97% 13.56%
IBLA 13.09% 12.79% 12.28% 11.71% 11.81%
IBNA 44.54% 44.22% 43.65% 42.88% 42.37%
*as of 31 May each year
8
PART B: registration statistics
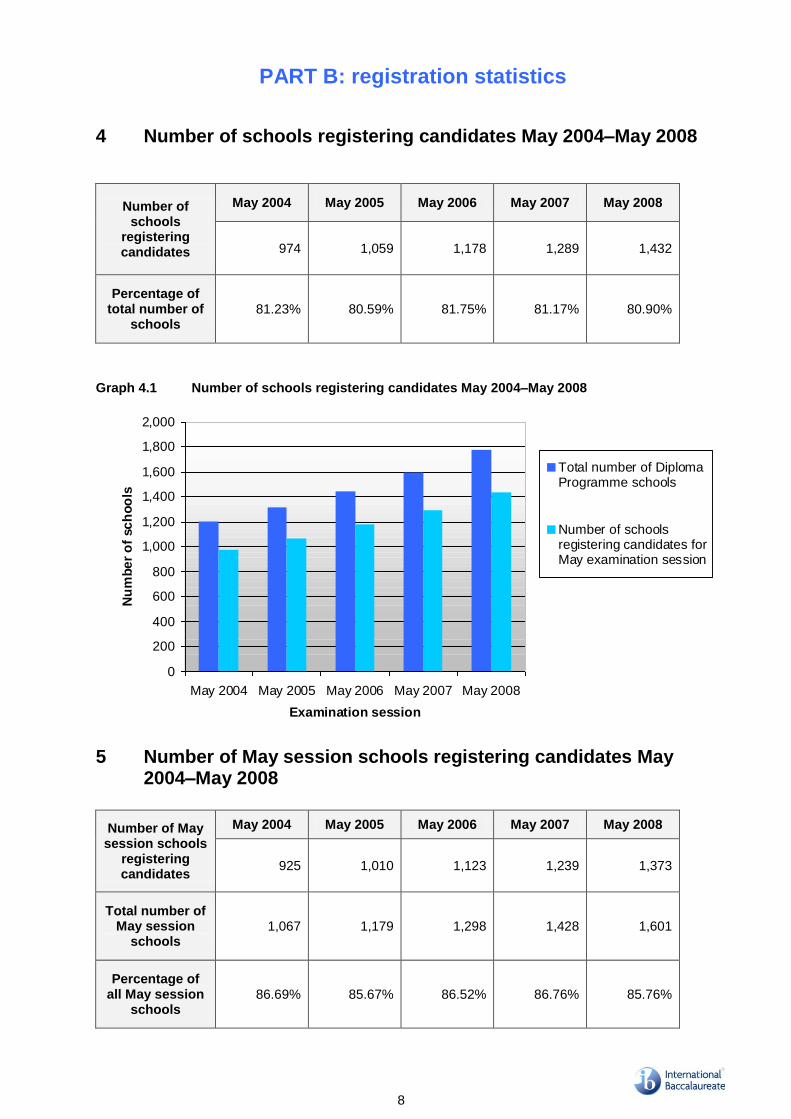
4 Number of schools registering candidates May 2004–May 2008
Number of schools
registering candidates
May 2004 May 2005 May 2006 May 2007 May 2008
974 1,059 1,178 1,289 1,432
Percentage of total number of
schools 81.23% 80.59% 81.75% 81.17% 80.90%
Graph 4.1 Number of schools registering candidates May 2004–May 2008
0
200
400
600
800
1,000
1,200
1,400
1,600
1,800
2,000
May 2004 May 2005 May 2006 May 2007 May 2008
Examination session
Nu
mb
er
of
sc
ho
ols
Total number of DiplomaProgramme schools
Number of schoolsregistering candidates forMay examination session
5 Number of May session schools registering candidates May
2004–May 2008
Number of May session schools
registering candidates
May 2004 May 2005 May 2006 May 2007 May 2008
925 1,010 1,123 1,239 1,373
Total number of May session
schools 1,067 1,179 1,298 1,428 1,601
Percentage of all May session
schools 86.69% 85.67% 86.52% 86.76% 85.76%
9
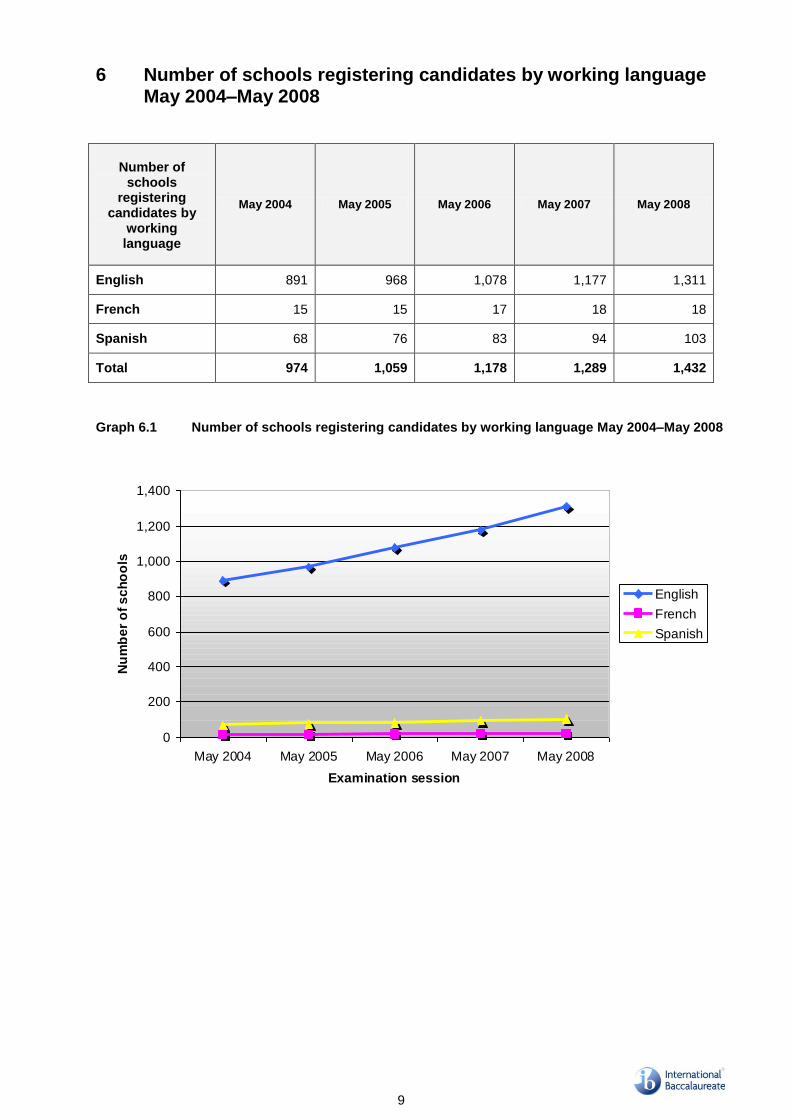
6 Number of schools registering candidates by working language May 2004–May 2008
Number of schools
registering candidates by
working language
May 2004 May 2005 May 2006 May 2007 May 2008
English 891 968 1,078 1,177 1,311
French 15 15 17 18 18
Spanish 68 76 83 94 103
Total 974 1,059 1,178 1,289 1,432
Graph 6.1 Number of schools registering candidates by working language May 2004–May 2008
0
200
400
600
800
1,000
1,200
1,400
May 2004 May 2005 May 2006 May 2007 May 2008
Examination session
Nu
mb
er
of
sc
ho
ols
English
French
Spanish
10
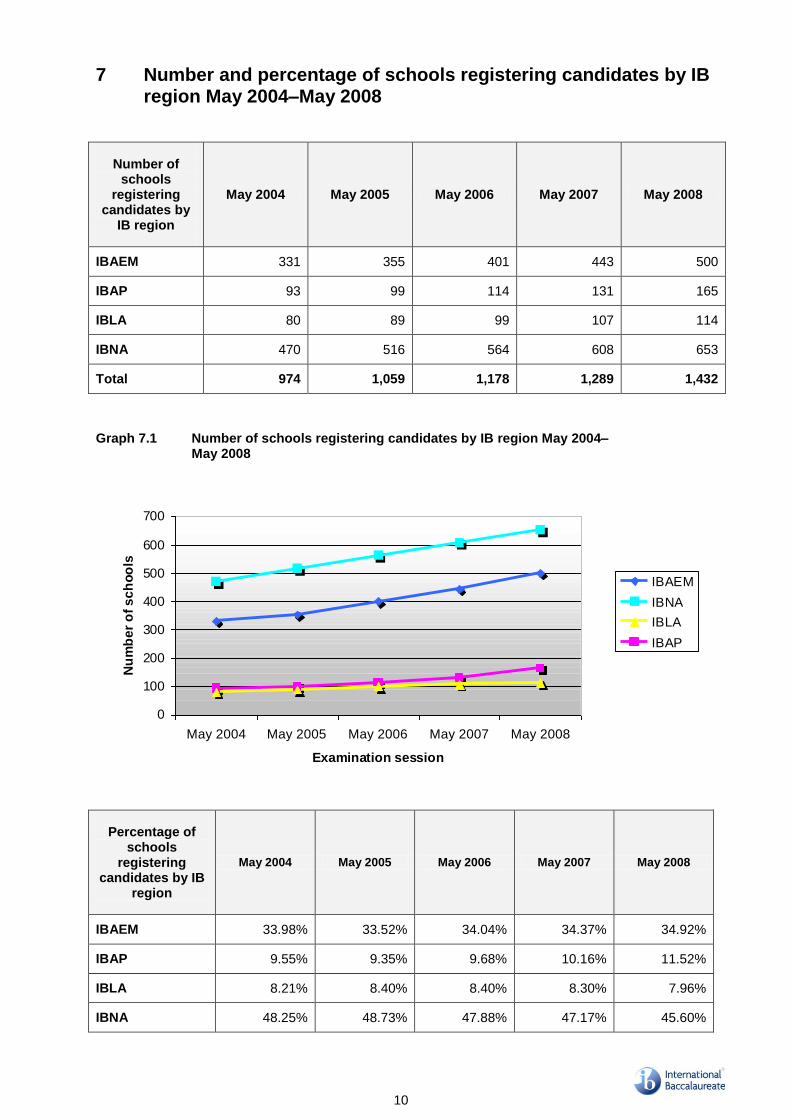
7 Number and percentage of schools registering candidates by IB region May 2004–May 2008
Number of schools
registering candidates by
IB region
May 2004 May 2005 May 2006 May 2007 May 2008
IBAEM 331 355 401 443 500
IBAP 93 99 114 131 165
IBLA 80 89 99 107 114
IBNA 470 516 564 608 653
Total 974 1,059 1,178 1,289 1,432
Graph 7.1 Number of schools registering candidates by IB region May 2004–
May 2008
0
100
200
300
400
500
600
700
May 2004 May 2005 May 2006 May 2007 May 2008
Examination session
Nu
mb
er
of
sc
ho
ols
IBAEM
IBNA
IBLA
IBAP
Percentage of schools
registering candidates by IB
region
May 2004 May 2005 May 2006 May 2007 May 2008
IBAEM 33.98% 33.52% 34.04% 34.37% 34.92%
IBAP 9.55% 9.35% 9.68% 10.16% 11.52%
IBLA 8.21% 8.40% 8.40% 8.30% 7.96%
IBNA 48.25% 48.73% 47.88% 47.17% 45.60%
11
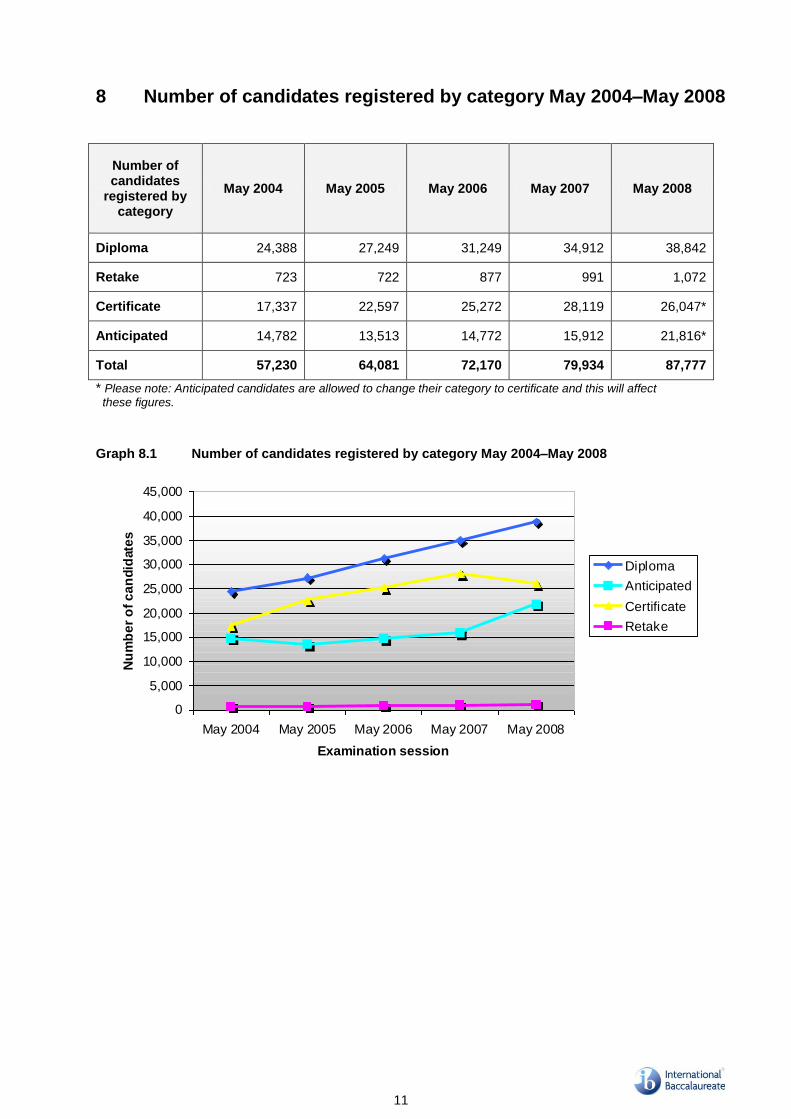
8 Number of candidates registered by category May 2004–May 2008
Number of candidates
registered by category
May 2004 May 2005 May 2006 May 2007 May 2008
Diploma 24,388 27,249 31,249 34,912 38,842
Retake 723 722 877 991 1,072
Certificate 17,337 22,597 25,272 28,119 26,047*
Anticipated 14,782 13,513 14,772 15,912 21,816*
Total 57,230 64,081 72,170 79,934 87,777
* Please note: Anticipated candidates are allowed to change their category to certificate and this will affect these figures.
Graph 8.1 Number of candidates registered by category May 2004–May 2008
0
5,000
10,000
15,000
20,000
25,000
30,000
35,000
40,000
45,000
May 2004 May 2005 May 2006 May 2007 May 2008
Examination session
Nu
mb
er
of
ca
nd
idate
s
Diploma
Anticipated
Certificate
Retake

12
Graph 8.2 Number of candidates registered May 2004–May 2008
0
10,000
20,000
30,000
40,000
50,000
60,000
70,000
80,000
90,000
100,000
May 2004 May 2005 May 2006 May 2007 May 2008
Examination session
Nu
mb
er
of
ca
nd
idate
s
Number of
candidatesregistered
Percentage of
candidates registered by
category
May 2004 May 2005 May 2006 May 2007 May 2008
Diploma 42.61% 42.52% 43.30% 43.68% 44.25%
Retake 1.26% 1.13% 1.22% 1.24% 1.22%
Certificate 30.29% 35.26% 35.02% 35.18% 29.67%*
Anticipated 25.83% 21.09% 20.47% 19.91% 24.85%*
* Please note: Anticipated candidates are allowed to change their category to certificate and this will affect
these figures.
Graph 8.3 Percentages of candidates registered May 2004–May 2008
0%
10%
20%
30%
40%
50%
60%
70%
80%
90%
100%
May 2004 May 2005 May 2006 May 2007 May 2008
Examination session
Pe
rce
nta
ge
of
can
did
ate
s
Anticipated
Certificate
Retake
Diploma
13
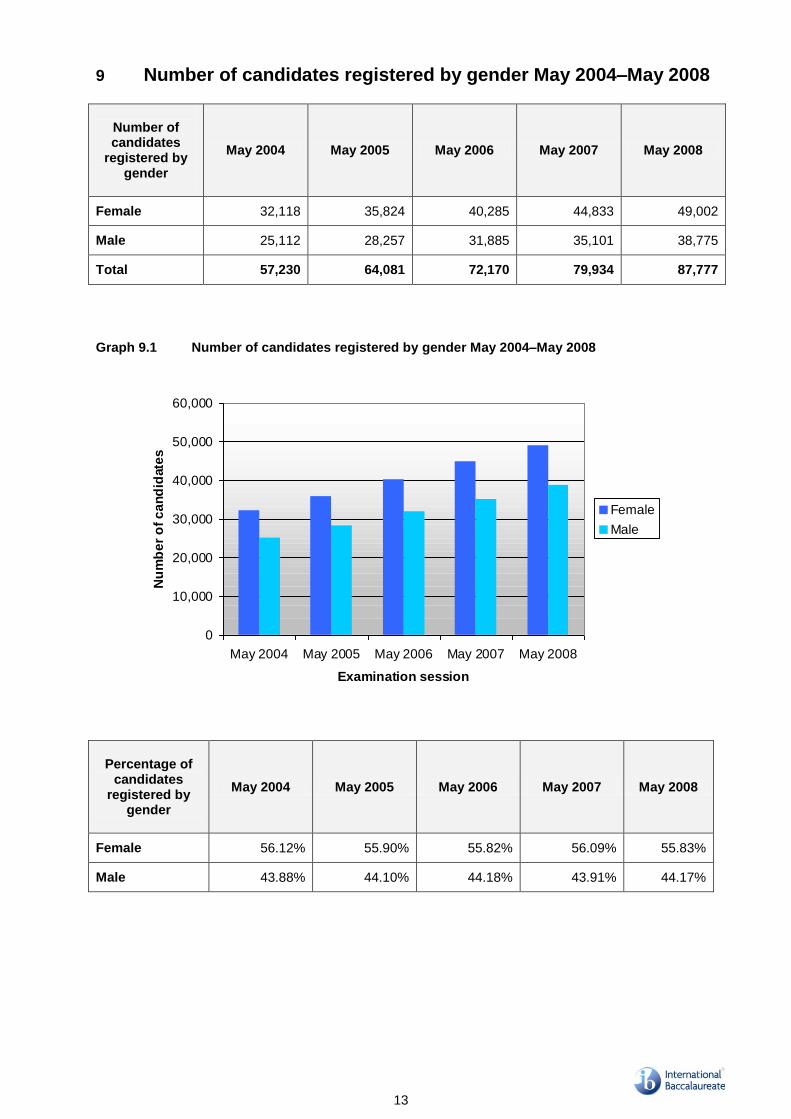
9 Number of candidates registered by gender May 2004–May 2008
Number of candidates
registered by gender
May 2004 May 2005 May 2006 May 2007 May 2008
Female 32,118 35,824 40,285 44,833 49,002
Male 25,112 28,257 31,885 35,101 38,775
Total 57,230 64,081 72,170 79,934 87,777
Graph 9.1 Number of candidates registered by gender May 2004–May 2008
0
10,000
20,000
30,000
40,000
50,000
60,000
May 2004 May 2005 May 2006 May 2007 May 2008
Examination session
Nu
mb
er
of
ca
nd
idate
s
Female
Male
Percentage of
candidates registered by
gender
May 2004 May 2005 May 2006 May 2007 May 2008
Female 56.12% 55.90% 55.82% 56.09% 55.83%
Male 43.88% 44.10% 44.18% 43.91% 44.17%
14
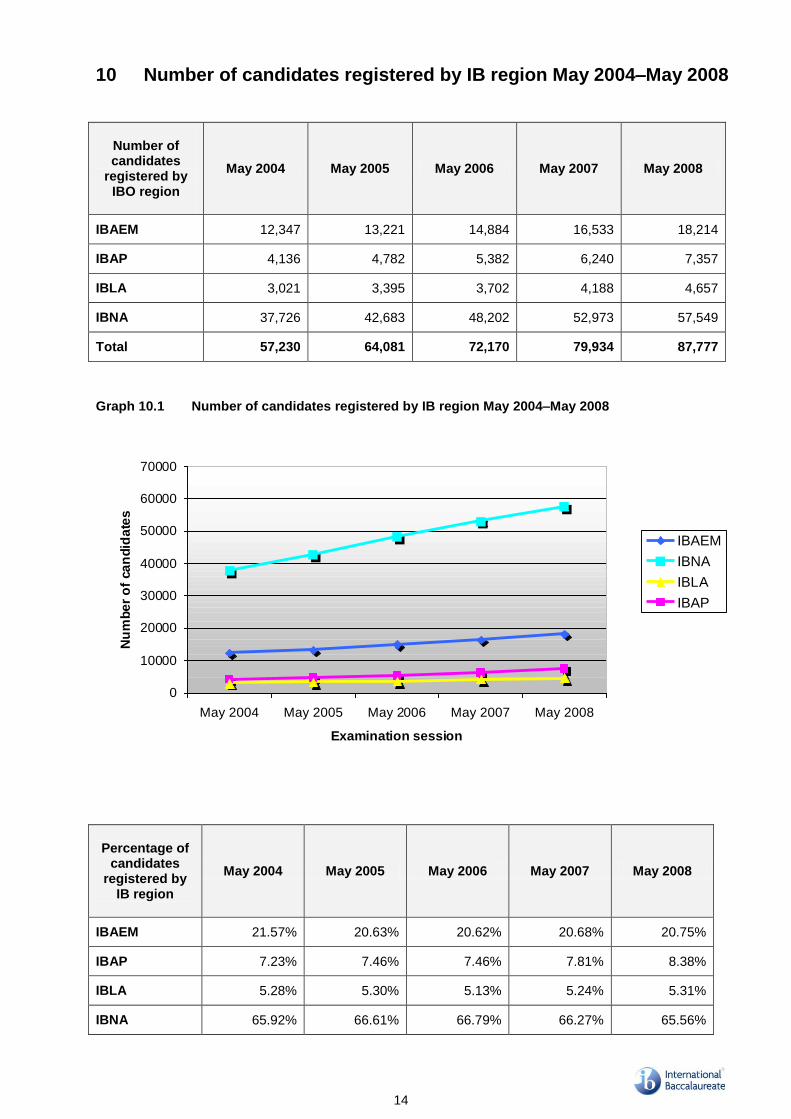
10 Number of candidates registered by IB region May 2004–May 2008
Number of candidates
registered by IBO region
May 2004 May 2005 May 2006 May 2007 May 2008
IBAEM 12,347 13,221 14,884 16,533 18,214
IBAP 4,136 4,782 5,382 6,240 7,357
IBLA 3,021 3,395 3,702 4,188 4,657
IBNA 37,726 42,683 48,202 52,973 57,549
Total 57,230 64,081 72,170 79,934 87,777
Graph 10.1 Number of candidates registered by IB region May 2004–May 2008
0
10000
20000
30000
40000
50000
60000
70000
May 2004 May 2005 May 2006 May 2007 May 2008
Examination session
Nu
mb
er
of
ca
nd
ida
tes
IBAEM
IBNA
IBLA
IBAP
Percentage of
candidates registered by
IB region
May 2004 May 2005 May 2006 May 2007 May 2008
IBAEM 21.57% 20.63% 20.62% 20.68% 20.75%
IBAP 7.23% 7.46% 7.46% 7.81% 8.38%
IBLA 5.28% 5.30% 5.13% 5.24% 5.31%
IBNA 65.92% 66.61% 66.79% 66.27% 65.56%

15
11 Number of candidates registered by category, gender and IB region May 2008
IB region Category
Number of candidates registered Total number of candidates registered
Number of female candidates
Number of male candidates
IBAEM
Diploma 6,870 5,922 12,792
Retake 407 422 829
Certificate 1,592 1,716 3,308
Anticipated 664 621 1,285
IBAP
Diploma 2,416 2,439 4,855
Retake 31 51 82
Certificate 762 795 1,557
Anticipated 384 479 863
IBLA
Diploma 1,265 1,172 2,437
Retake 26 25 51
Certificate 767 662 1,429
Anticipated 351 389 740
IBNA
Diploma 10,961 7,797 18,758
Retake 51 59 110
Certificate 11,341 8,411 19,752
Anticipated 11,114 7,815 18,929
Total 49,002 38,775 87,777
Graph 11.1 Number of candidates registered by category and IB region May 2008
0
2,000
4,000
6,000
8,000
10,000
12,000
14,000
16,000
18,000
20,000
IBAEM IBAP IBLA IBNA
IB region
Nu
mb
er
of
ca
nd
idate
s
Diploma candidates
Retake candidates
Certificate candidates
Anticipated candidates

16
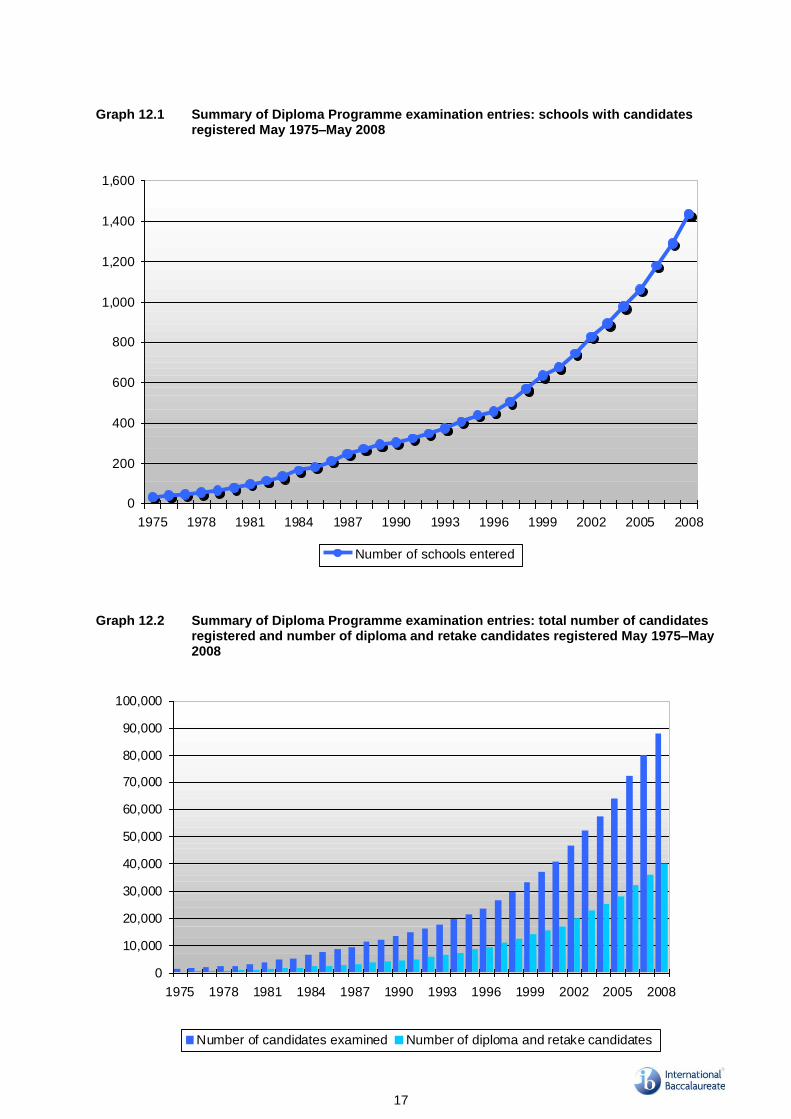
12 Summary of Diploma Programme examination entries: schools with registered candidates May 1975–May 2008
Year Number of
schools entered
Percentage of increase
Number of candidates examined
Percentage of increase
Average number of candidates per school
Number of diploma and
retake candidates
Average number of diploma
and retake candidates per school
1975 30 30% 1,217 19% 40.6 377 12.6
1976 37 23% 1,600 31% 43.2 567 15.3
1977 44 19% 1,966 23% 44.7 644 14.6
1978 52 18% 2,222 13% 42.7 680 13.1
1979 61 17% 2,479 12% 40.6 835 13.7
1980 76 25% 2,845 15% 37.4 1,005 13.2
1981 96 26% 3,719 31% 38.7 1,244 13.0
1982 111 16% 4,644 25% 41.8 1,505 13.6
1983 131 18% 5,021 8% 38.3 1,603 12.2
1984 163 24% 6,385 27% 39.2 2,183 13.4
1985 180 10% 7,606 19% 42.3 2,440 13.6
1986 209 16% 8,389 10% 40.1 2,679 12.8
1987 246 18% 9,387 12% 38.2 2,942 12.0
1988 270 10% 11,233 20% 41.6 3,564 13.2
1989 291 8% 11,946 6% 41.1 3,904 13.4
1990 301 3% 13,321 12% 44.3 4,287 14.2
1991 322 7% 14,749 11% 45.8 4,811 14.9
1992 346 7% 16,078 9% 46.5 5,693 16.5
1993 370 7% 17,552 9% 47.4 6,432 17.4
1994 405 9% 19,509 11% 48.2 7,331 18.1
1995 437 8% 21,361 9% 48.9 8,403 19.2
1996 455 4% 23,448 10% 51.5 9,396 20.7
1997 502 10% 26,570 13% 52.9 10,868 21.6
1998 568 13% 29,505 11% 51.9 12,476 22.0
1999 631 11% 33,143 12% 52.5 14,001 22.2
2000 678 7% 36,758 11% 54.2 15,592 23.0
2001 743 10% 40,579 10% 54.6 16,880 22.7
2002 825 11% 46,659 15% 56.6 19,796 24.0
2003 890 8% 52,110 12% 58.6 22,662 25.5
2004 974 9% 57,230 10% 58.8 25,111 25.8
2005 1,059 9% 64,081 12% 60.5 27,971 26.4
2006 1,178 11% 72,170 13% 61.3 32,126 27.3
2007 1,289 9% 79,934 11% 62.0 35,903 30.2
2008 1,432 11% 87,777 10% 61.3 39,914 30.4
17
Graph 12.1 Summary of Diploma Programme examination entries: schools with candidates registered May 1975–May 2008
Graph 12.2 Summary of Diploma Programme examination entries: total number of candidates registered and number of diploma and retake candidates registered May 1975–May 2008
0
200
400
600
800
1,000
1,200
1,400
1,600
1975 1978 1981 1984 1987 1990 1993 1996 1999 2002 2005 2008
Number of schools entered
0
10,000
20,000
30,000
40,000
50,000
60,000
70,000
80,000
90,000
100,000
1975 1978 1981 1984 1987 1990 1993 1996 1999 2002 2005 2008
Number of candidates examined Number of diploma and retake candidates
18
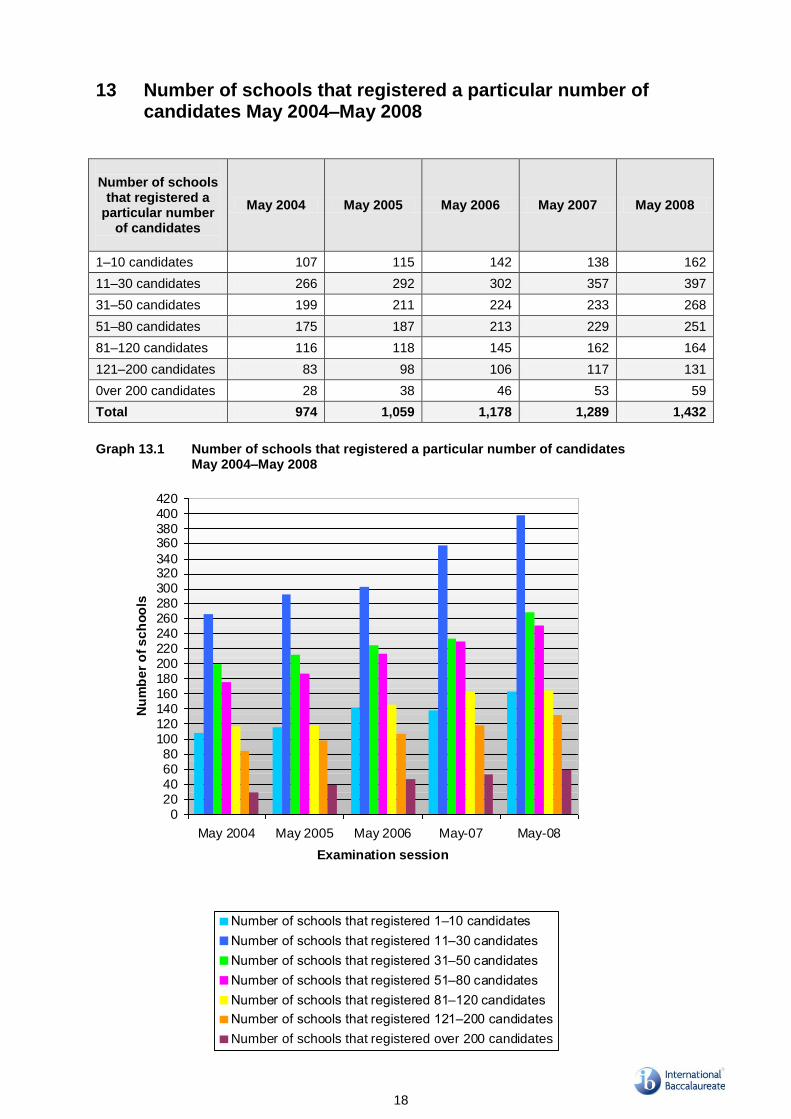
13 Number of schools that registered a particular number of candidates May 2004–May 2008
Graph 13.1 Number of schools that registered a particular number of candidates
May 2004–May 2008
020406080
100120140160180200220240260280300320340
360380400420
May 2004 May 2005 May 2006 May-07 May-08
Examination session
Nu
mb
er
of
sc
ho
ols
Number of schools that registered 1–10 candidates
Number of schools that registered 11–30 candidates
Number of schools that registered 31–50 candidates
Number of schools that registered 51–80 candidates
Number of schools that registered 81–120 candidates
Number of schools that registered 121–200 candidates
Number of schools that registered over 200 candidates
Number of schools
that registered a particular number
of candidates
May 2004 May 2005 May 2006 May 2007 May 2008
1–10 candidates 107 115 142 138 162
11–30 candidates 266 292 302 357 397
31–50 candidates 199 211 224 233 268
51–80 candidates 175 187 213 229 251
81–120 candidates 116 118 145 162 164
121–200 candidates 83 98 106 117 131
0ver 200 candidates 28 38 46 53 59
Total 974 1,059 1,178 1,289 1,432
19
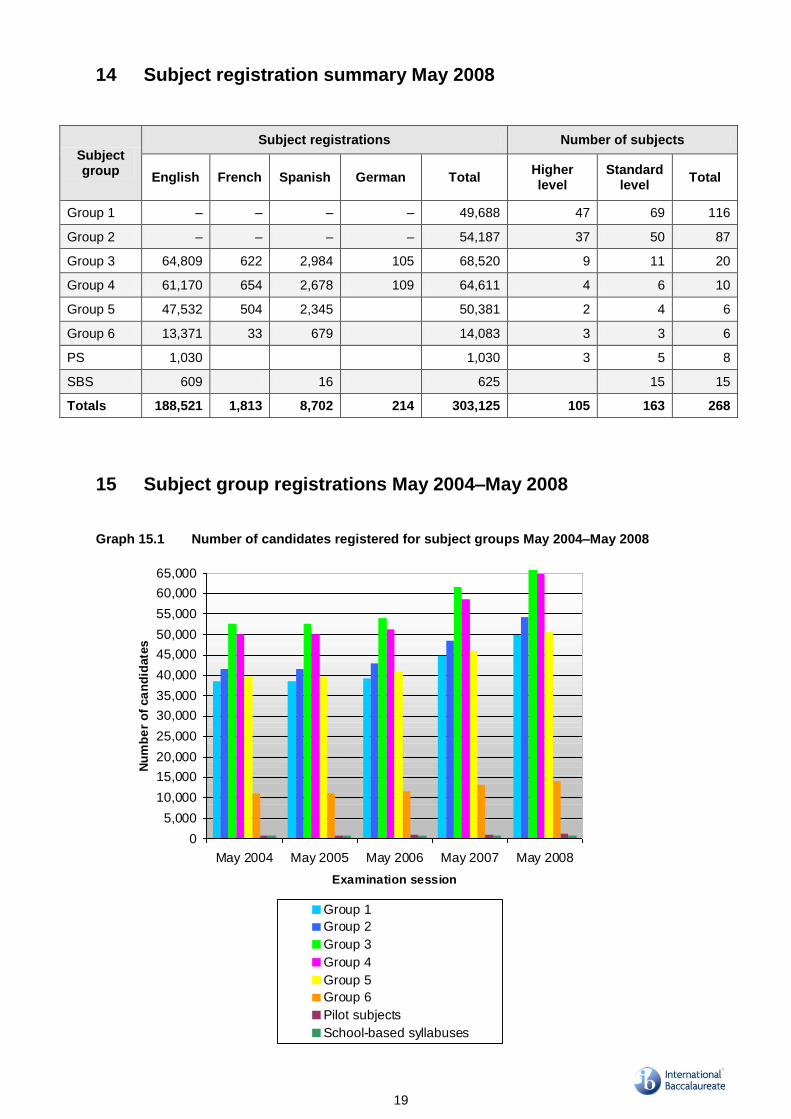
14 Subject registration summary May 2008
Subject group
Subject registrations Number of subjects
English French Spanish German Total Higher level
Standard level
Total
Group 1 – – – – 49,688 47 69 116
Group 2 – – – – 54,187 37 50 87
Group 3 64,809 622 2,984 105 68,520 9 11 20
Group 4 61,170 654 2,678 109 64,611 4 6 10
Group 5 47,532 504 2,345 50,381 2 4 6
Group 6 13,371 33 679 14,083 3 3 6
PS 1,030 1,030 3 5 8
SBS 609 16 625 15 15
Totals 188,521 1,813 8,702 214 303,125 105 163 268
15 Subject group registrations May 2004–May 2008 Graph 15.1 Number of candidates registered for subject groups May 2004–May 2008
0
5,000
10,000
15,000
20,000
25,000
30,000
35,000
40,000
45,000
50,000
55,000
60,000
65,000
May 2004 May 2005 May 2006 May 2007 May 2008
Examination session
Nu
mb
er
of
ca
nd
idate
s
Group 1
Group 2
Group 3
Group 4
Group 5
Group 6
Pilot subjects
School-based syllabuses
20
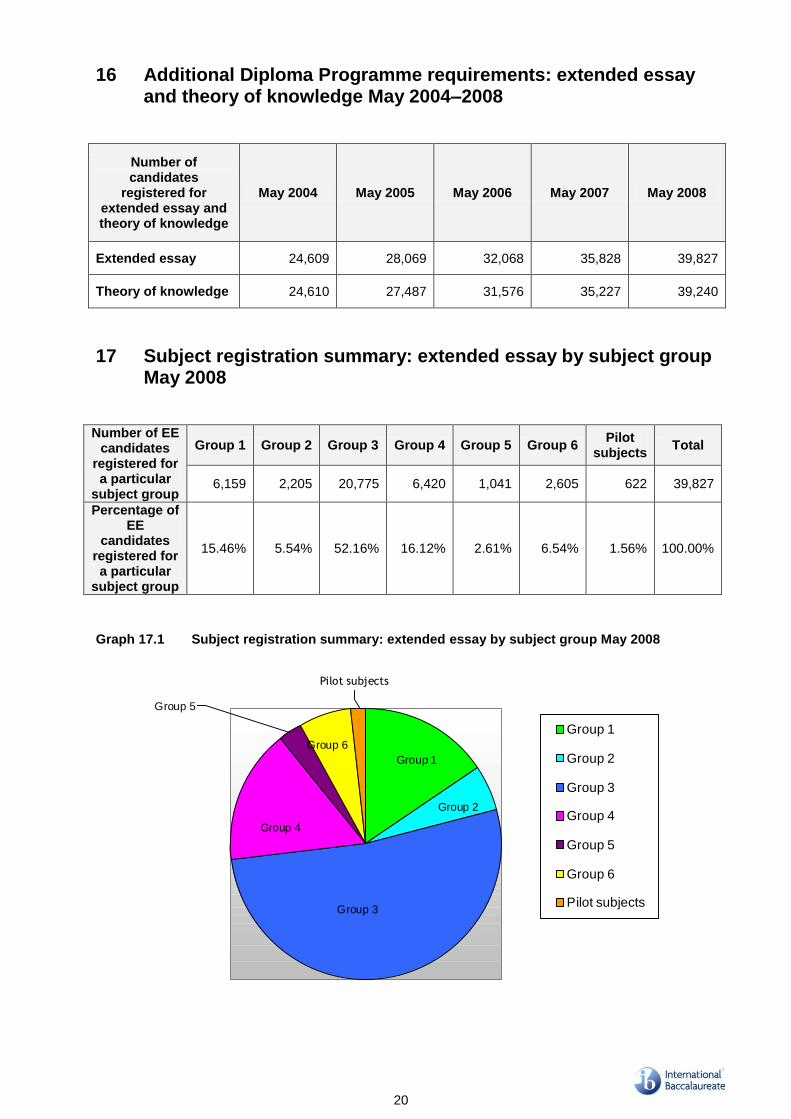
16 Additional Diploma Programme requirements: extended essay and theory of knowledge May 2004–2008
Number of candidates
registered for extended essay and theory of knowledge
May 2004 May 2005 May 2006 May 2007 May 2008
Extended essay 24,609 28,069 32,068 35,828 39,827
Theory of knowledge 24,610 27,487 31,576 35,227 39,240
17 Subject registration summary: extended essay by subject group May 2008
Number of EE candidates
registered for a particular
subject group
Group 1 Group 2 Group 3 Group 4 Group 5 Group 6 Pilot
subjects Total
6,159 2,205 20,775 6,420 1,041 2,605 622 39,827
Percentage of EE
candidates registered for a particular
subject group
15.46% 5.54% 52.16% 16.12% 2.61% 6.54% 1.56% 100.00%
Graph 17.1 Subject registration summary: extended essay by subject group May 2008
Pilot subjects
Group 5
Group 6
Group 1
Group 2
Group 4
Group 3
Group 1
Group 2
Group 3
Group 4
Group 5
Group 6
Pilot subjects
21
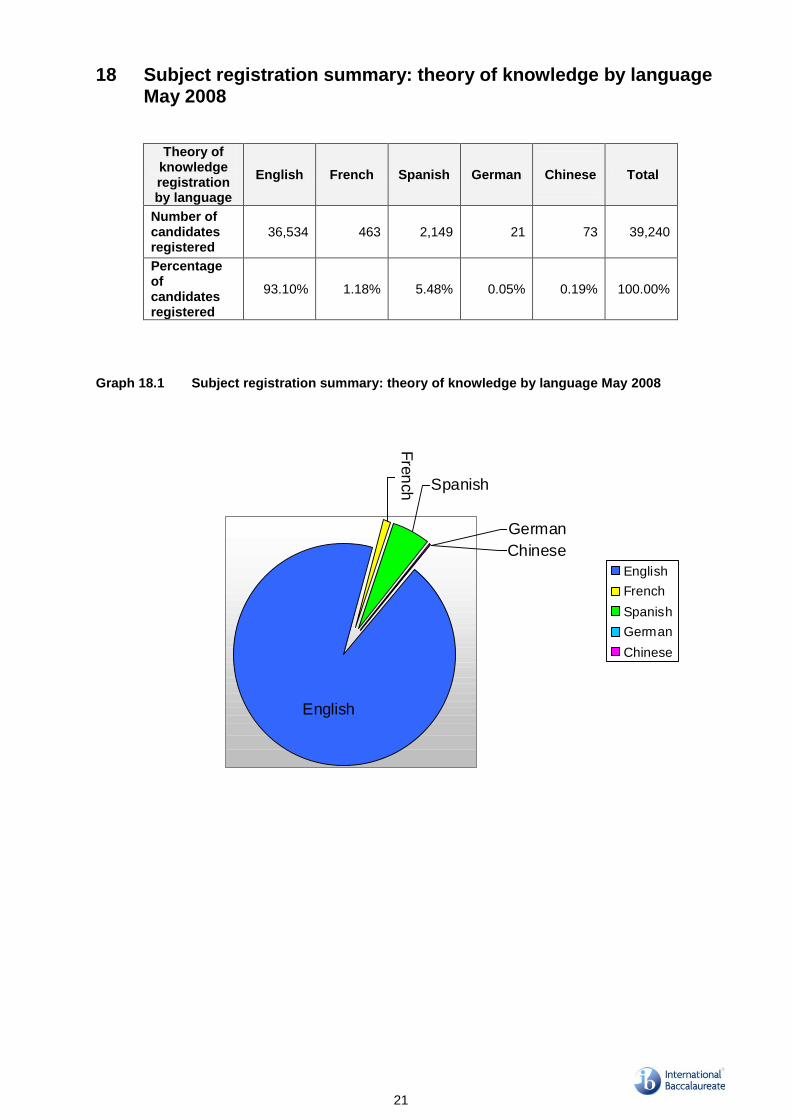
18 Subject registration summary: theory of knowledge by language May 2008
Theory of knowledge registration by language
English French Spanish German
Chinese
Total
Number of candidates registered
36,534 463 2,149 21 73 39,240
Percentage of candidates registered
93.10% 1.18% 5.48% 0.05% 0.19% 100.00%
Graph 18.1 Subject registration summary: theory of knowledge by language May 2008
Spanish
German
Fre
nch
Chinese
English
English
French
Spanish
German
Chinese
22
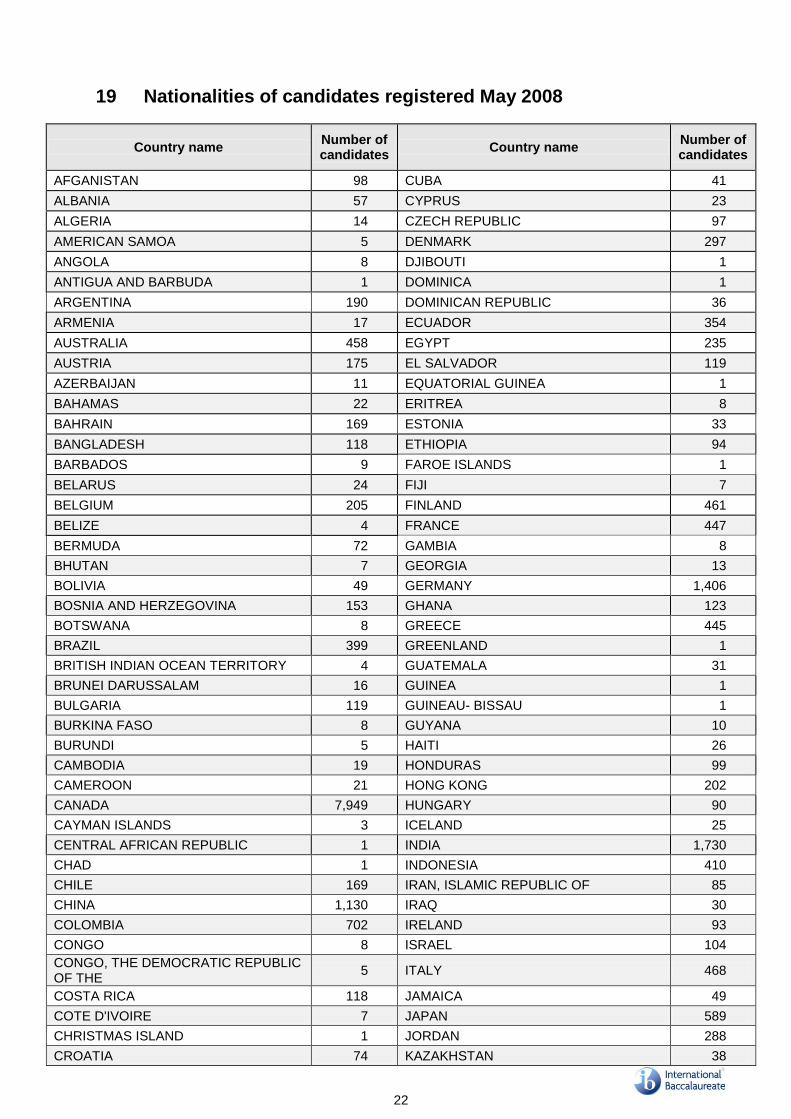
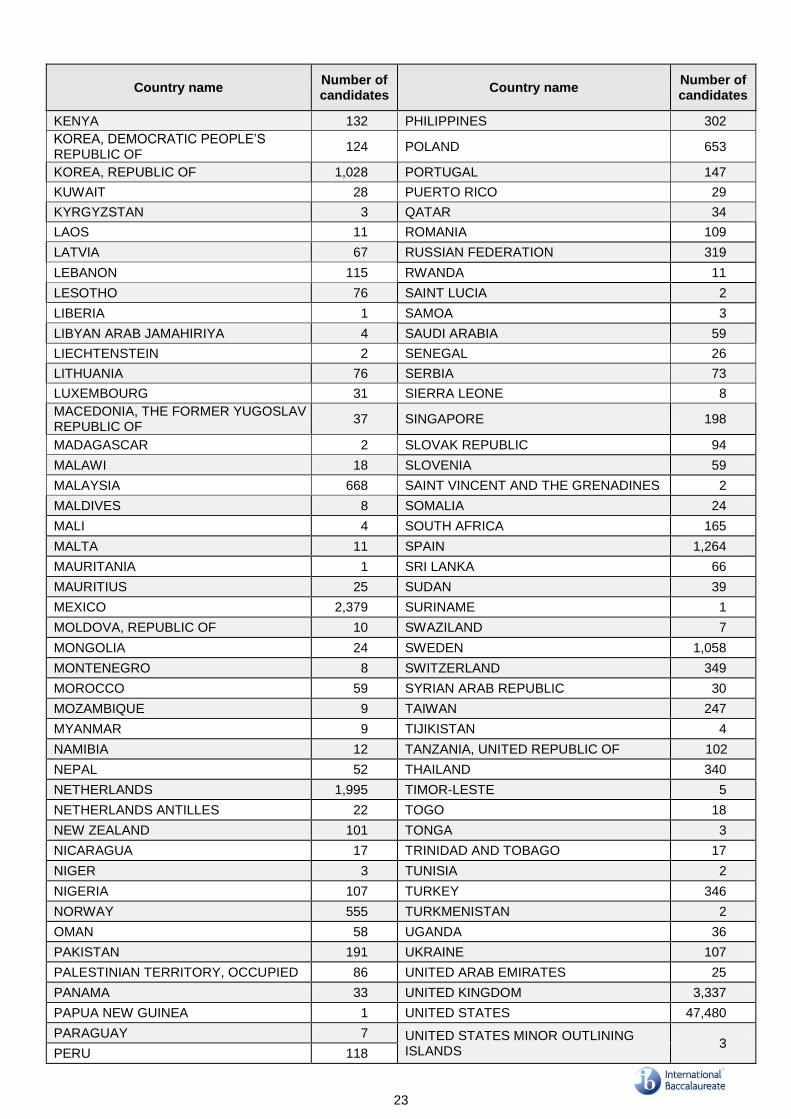
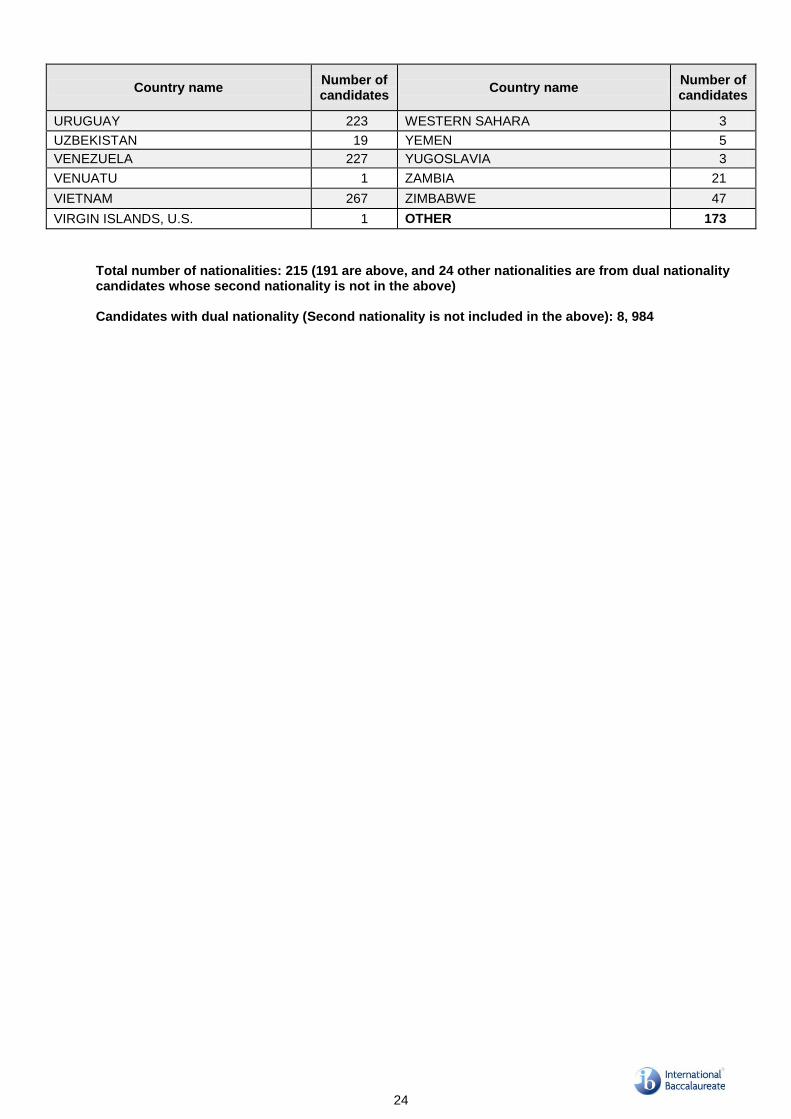
19 Nationalities of candidates registered May 2008
Country name Number of candidates
Country name Number of candidates
AFGANISTAN 98 CUBA 41
ALBANIA 57 CYPRUS 23
ALGERIA 14 CZECH REPUBLIC 97
AMERICAN SAMOA 5 DENMARK 297
ANGOLA 8 DJIBOUTI 1
ANTIGUA AND BARBUDA 1 DOMINICA 1
ARGENTINA 190 DOMINICAN REPUBLIC 36
ARMENIA 17 ECUADOR 354
AUSTRALIA 458 EGYPT 235
AUSTRIA 175 EL SALVADOR 119
AZERBAIJAN 11 EQUATORIAL GUINEA 1
BAHAMAS 22 ERITREA 8
BAHRAIN 169 ESTONIA 33
BANGLADESH 118 ETHIOPIA 94
BARBADOS 9 FAROE ISLANDS 1
BELARUS 24 FIJI 7
BELGIUM 205 FINLAND 461
BELIZE 4 FRANCE 447
BERMUDA 72 GAMBIA 8
BHUTAN 7 GEORGIA 13
BOLIVIA 49 GERMANY 1,406
BOSNIA AND HERZEGOVINA 153 GHANA 123
BOTSWANA 8 GREECE 445
BRAZIL 399 GREENLAND 1
BRITISH INDIAN OCEAN TERRITORY 4 GUATEMALA 31
BRUNEI DARUSSALAM 16 GUINEA 1
BULGARIA 119 GUINEAU- BISSAU 1
BURKINA FASO 8 GUYANA 10
BURUNDI 5 HAITI 26
CAMBODIA 19 HONDURAS 99
CAMEROON 21 HONG KONG 202
CANADA 7,949 HUNGARY 90
CAYMAN ISLANDS 3 ICELAND 25
CENTRAL AFRICAN REPUBLIC 1 INDIA 1,730
CHAD 1 INDONESIA 410
CHILE 169 IRAN, ISLAMIC REPUBLIC OF 85
CHINA 1,130 IRAQ 30
COLOMBIA 702 IRELAND 93
CONGO 8 ISRAEL 104
CONGO, THE DEMOCRATIC REPUBLIC OF THE
5 ITALY 468
COSTA RICA 118 JAMAICA 49
COTE D'IVOIRE 7 JAPAN 589
CHRISTMAS ISLAND 1 JORDAN 288
CROATIA 74 KAZAKHSTAN 38
23
Country name Number of candidates
Country name Number of candidates
KENYA 132 PHILIPPINES 302
KOREA, DEMOCRATIC PEOPLE’S REPUBLIC OF
124 POLAND 653
KOREA, REPUBLIC OF 1,028 PORTUGAL 147
KUWAIT 28 PUERTO RICO 29
KYRGYZSTAN 3 QATAR 34
LAOS 11 ROMANIA 109
LATVIA 67 RUSSIAN FEDERATION 319
LEBANON 115 RWANDA 11
LESOTHO 76 SAINT LUCIA 2
LIBERIA 1 SAMOA 3
LIBYAN ARAB JAMAHIRIYA 4 SAUDI ARABIA 59
LIECHTENSTEIN 2 SENEGAL 26
LITHUANIA 76 SERBIA 73
LUXEMBOURG 31 SIERRA LEONE 8
MACEDONIA, THE FORMER YUGOSLAV REPUBLIC OF
37 SINGAPORE 198
MADAGASCAR 2 SLOVAK REPUBLIC 94
MALAWI 18 SLOVENIA 59
MALAYSIA 668 SAINT VINCENT AND THE GRENADINES 2
MALDIVES 8 SOMALIA 24
MALI 4 SOUTH AFRICA 165
MALTA 11 SPAIN 1,264
MAURITANIA 1 SRI LANKA 66
MAURITIUS 25 SUDAN 39
MEXICO 2,379 SURINAME 1
MOLDOVA, REPUBLIC OF 10 SWAZILAND 7
MONGOLIA 24 SWEDEN 1,058
MONTENEGRO 8 SWITZERLAND 349
MOROCCO 59 SYRIAN ARAB REPUBLIC 30
MOZAMBIQUE 9 TAIWAN 247
MYANMAR 9 TIJIKISTAN 4
NAMIBIA 12 TANZANIA, UNITED REPUBLIC OF 102
NEPAL 52 THAILAND 340
NETHERLANDS 1,995 TIMOR-LESTE 5
NETHERLANDS ANTILLES 22 TOGO 18
NEW ZEALAND 101 TONGA 3
NICARAGUA 17 TRINIDAD AND TOBAGO 17
NIGER 3 TUNISIA 2
NIGERIA 107 TURKEY 346
NORWAY 555 TURKMENISTAN 2
OMAN 58 UGANDA 36
PAKISTAN 191 UKRAINE 107
PALESTINIAN TERRITORY, OCCUPIED 86 UNITED ARAB EMIRATES 25
PANAMA 33 UNITED KINGDOM 3,337
PAPUA NEW GUINEA 1 UNITED STATES 47,480
PARAGUAY 7 UNITED STATES MINOR OUTLINING ISLANDS
3 PERU 118
24
Country name Number of candidates
Country name Number of candidates
URUGUAY 223 WESTERN SAHARA 3
UZBEKISTAN 19 YEMEN 5
VENEZUELA 227 YUGOSLAVIA 3
VENUATU 1 ZAMBIA 21
VIETNAM 267 ZIMBABWE 47
VIRGIN ISLANDS, U.S. 1 OTHER 173
Total number of nationalities: 215 (191 are above, and 24 other nationalities are from dual nationality candidates whose second nationality is not in the above) Candidates with dual nationality (Second nationality is not included in the above): 8, 984
25
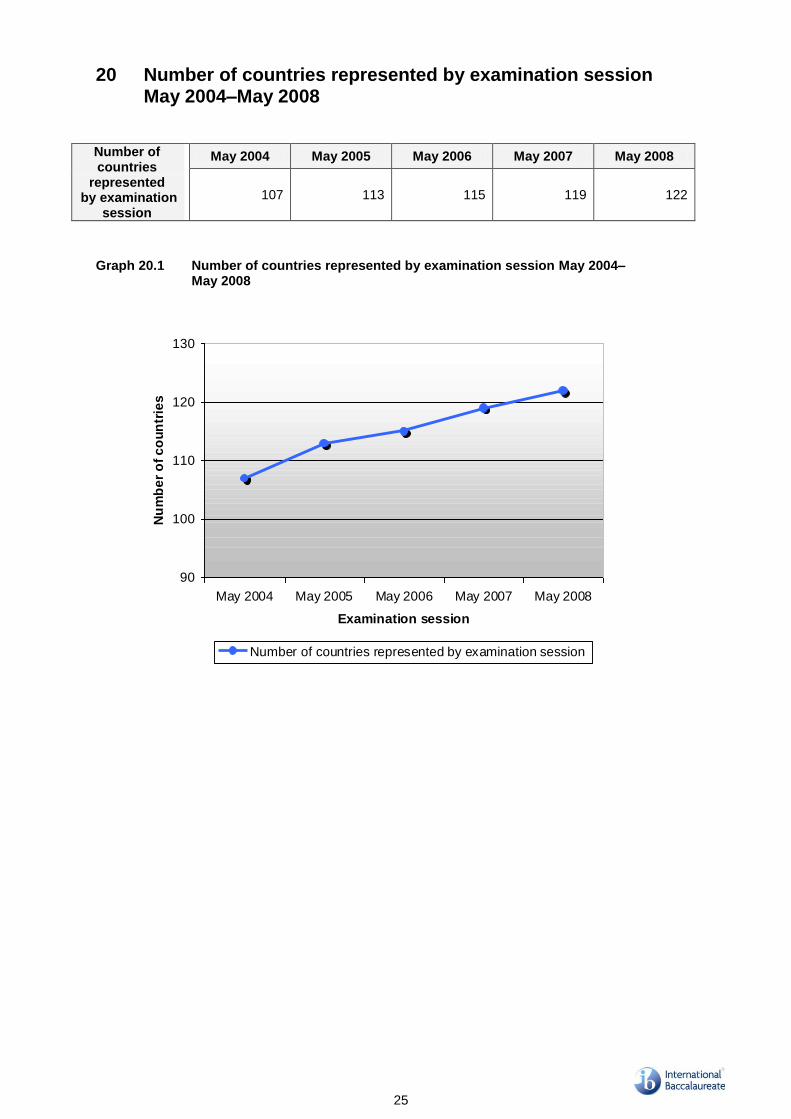
20 Number of countries represented by examination session May 2004–May 2008
Number of countries
represented by examination
session
May 2004 May 2005 May 2006 May 2007 May 2008
107 113 115 119 122
Graph 20.1 Number of countries represented by examination session May 2004–
May 2008
90
100
110
120
130
May 2004 May 2005 May 2006 May 2007 May 2008
Examination session
Nu
mb
er
of
co
un
trie
s
Number of countries represented by examination session

26
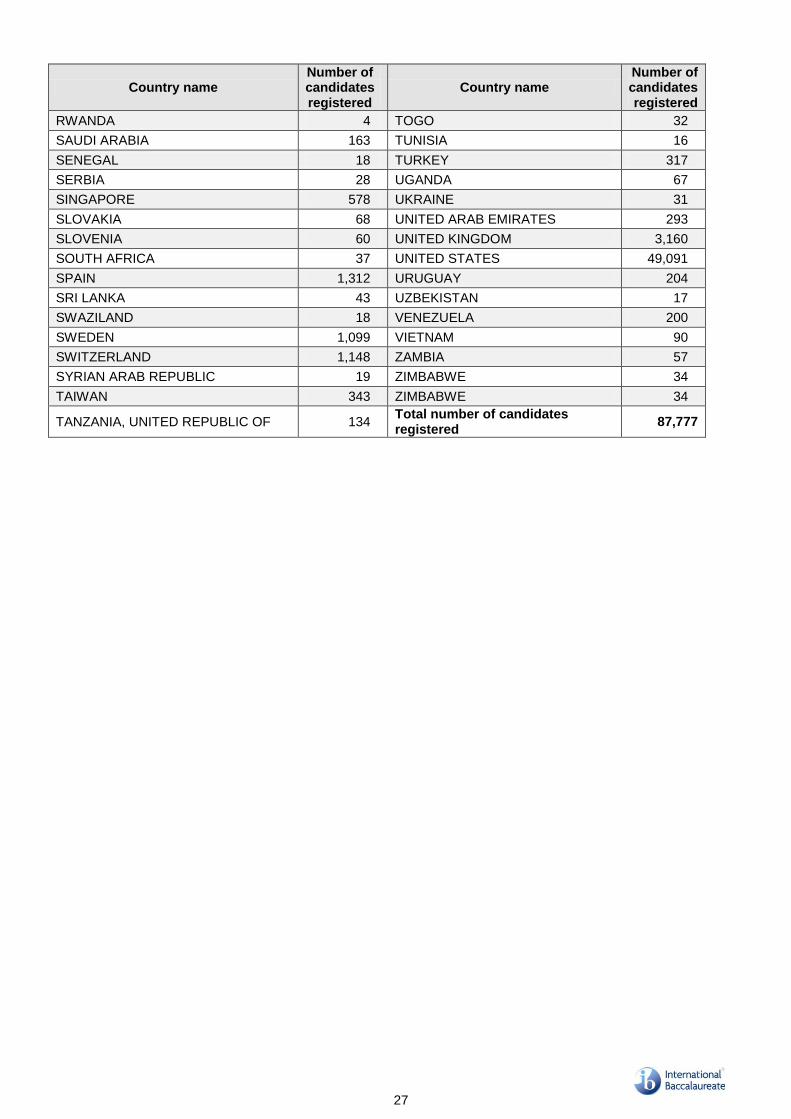
21 Number of candidates registered by country May 2008
Country name Number of candidates registered
Country name Number of candidates registered
ANGOLA 3 INDIA 1,294
ARGENTINA 137 INDONESIA 676
AUSTRALIA 189 IRAN, ISLAMIC REPUBLIC OF 26
AUSTRIA 326 IRELAND 31
AZERBAIJAN 13 ISLE OF MAN 47
BAHAMAS 32 ISRAEL 16
BAHRAIN 237 ITALY 522
BANGLADESH 70 JAPAN 389
BELGIUM 288 JORDAN 264
BERMUDA 85 KAZAKHSTAN 7
BOLIVIA 9 KENYA 173
BOSNIA AND HERZEGOVINA 133 KOREA, REPUBLIC OF 255
BOTSWANA 9 KUWAIT 57
BRAZIL 403 LATVIA 40
BRUNEI DARUSSALAM 37 LEBANON 177
BULGARIA 43 LESOTHO 78
CAMBODIA 24 LITHUANIA 46
CANADA 8,289 LUXEMBOURG 79
CHILE 192 MACEDONIA 26
CHINA 1,125 MALAWI 31
COLOMBIA 578 MALAYSIA 686
COSTA RICA 178 MALTA 23
CROATIA 50 MAURITIUS 12
CUBA 5 MEXICO 2,105
CYPRUS 26 MONACO 27
CZECH REPUBLIC 134 MONGOLIA 7
DENMARK 312 MOROCCO 78
DOMINICAN REPUBLIC 20 MOZAMBIQUE 12
ECUADOR 360 NAMIBIA 14
EGYPT 273 NETHERLANDS 1,992
EL SALVADOR 85 NETHERLANDS ANTILLES 32
ESTONIA 5 NEW ZEALAND 80
ETHIOPIA 95 NICARAGUA 8
FIJI 3 NIGERIA 7
FINLAND 418 NORWAY 685
FRANCE 458 OMAN 122
GERMANY 857 PAKISTAN 11
GHANA 151 PALESTINIAN TERRITORY, OCCUPIED
72
GREECE 513 PANAMA 41
GUAM 45 PERU 65
GUATEMALA 3 PHILIPPINES 304
HONDURAS 89 POLAND 591
HONG KONG 477 PORTUGAL 173
HUNGARY 95 QATAR 63
ICELAND 29 ROMANIA 48
RUSSIAN FEDERATION 130 THAILAND 631
27
Country name Number of candidates registered
Country name Number of candidates registered
RWANDA 4 TOGO 32
SAUDI ARABIA 163 TUNISIA 16
SENEGAL 18 TURKEY 317
SERBIA 28 UGANDA 67
SINGAPORE 578 UKRAINE 31
SLOVAKIA 68 UNITED ARAB EMIRATES 293
SLOVENIA 60 UNITED KINGDOM 3,160
SOUTH AFRICA 37 UNITED STATES 49,091
SPAIN 1,312 URUGUAY 204
SRI LANKA 43 UZBEKISTAN 17
SWAZILAND 18 VENEZUELA 200
SWEDEN 1,099 VIETNAM 90
SWITZERLAND 1,148 ZAMBIA 57
SYRIAN ARAB REPUBLIC 19 ZIMBABWE 34
TAIWAN 343 ZIMBABWE 34
TANZANIA, UNITED REPUBLIC OF 134 Total number of candidates registered
87,777
28
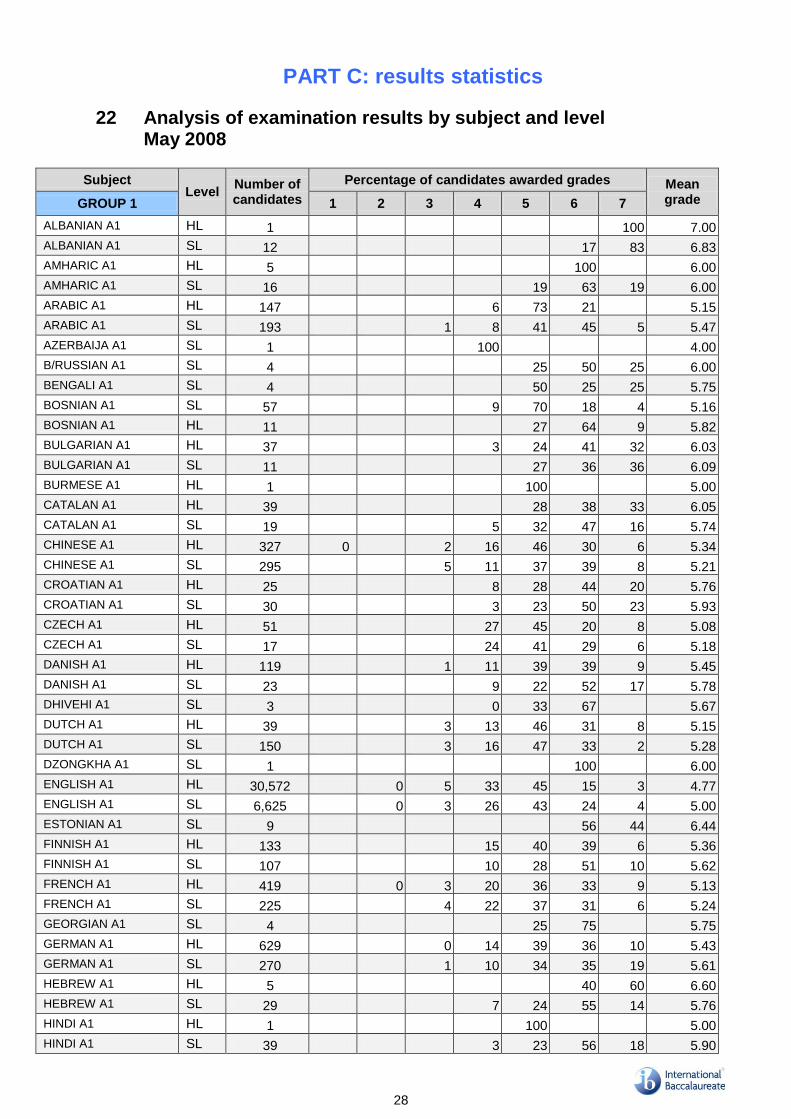
PART C: results statistics
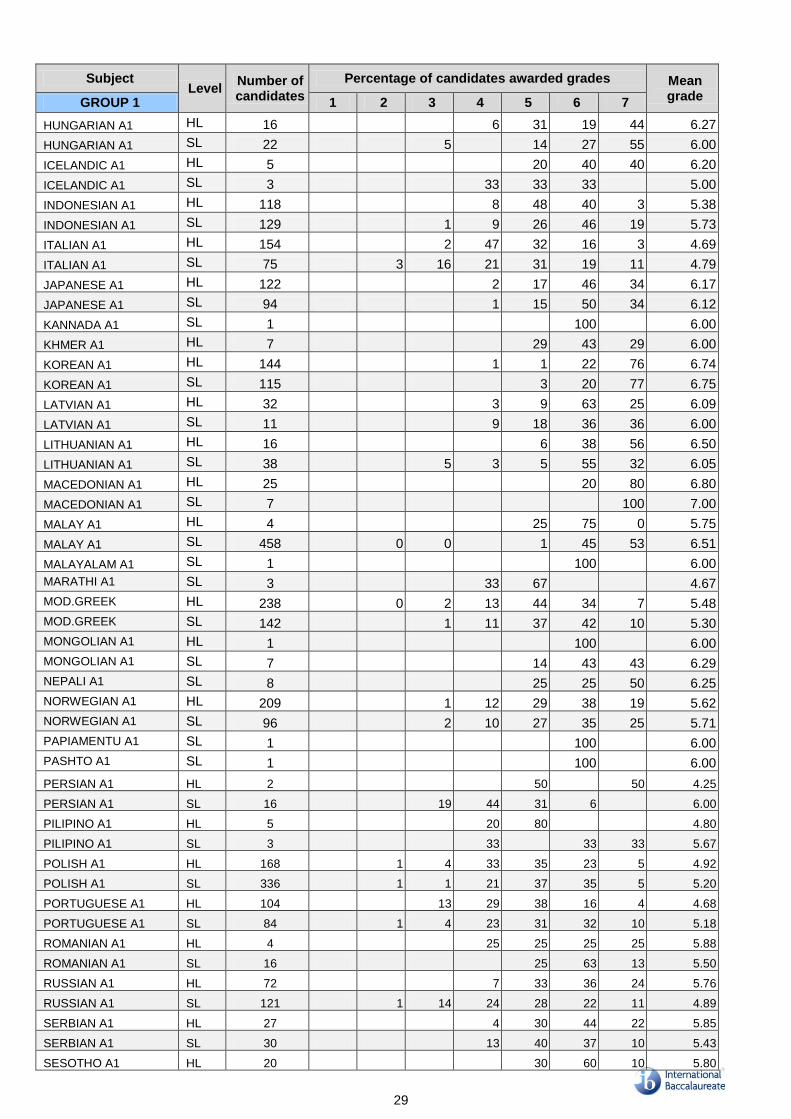
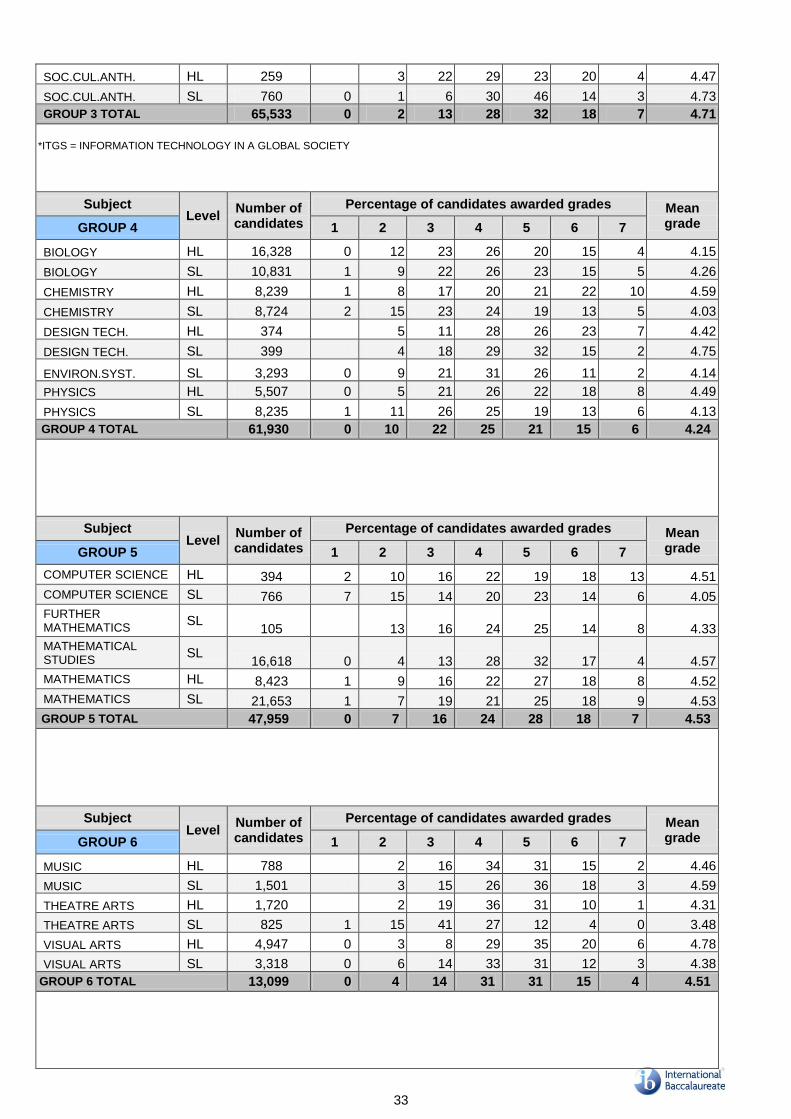
22 Analysis of examination results by subject and level May 2008
Subject Level
Number of candidates
Percentage of candidates awarded grades Mean grade GROUP 1 1 2 3 4 5 6 7
ALBANIAN A1 HL 1 100 7.00
ALBANIAN A1 SL 12 17 83 6.83
AMHARIC A1 HL 5 100 6.00
AMHARIC A1 SL 16 19 63 19 6.00
ARABIC A1 HL 147 6 73 21 5.15
ARABIC A1 SL 193 1 8 41 45 5 5.47
AZERBAIJA A1 SL 1 100 4.00
B/RUSSIAN A1 SL 4 25 50 25 6.00
BENGALI A1 SL 4 50 25 25 5.75
BOSNIAN A1 SL 57 9 70 18 4 5.16
BOSNIAN A1 HL 11 27 64 9 5.82
BULGARIAN A1 HL 37 3 24 41 32 6.03
BULGARIAN A1 SL 11 27 36 36 6.09
BURMESE A1 HL 1 100 5.00
CATALAN A1 HL 39 28 38 33 6.05
CATALAN A1 SL 19 5 32 47 16 5.74
CHINESE A1 HL 327 0 2 16 46 30 6 5.34
CHINESE A1 SL 295 5 11 37 39 8 5.21
CROATIAN A1 HL 25 8 28 44 20 5.76
CROATIAN A1 SL 30 3 23 50 23 5.93
CZECH A1 HL 51 27 45 20 8 5.08
CZECH A1 SL 17 24 41 29 6 5.18
DANISH A1 HL 119 1 11 39 39 9 5.45
DANISH A1 SL 23 9 22 52 17 5.78
DHIVEHI A1 SL 3 0 33 67 5.67
DUTCH A1 HL 39 3 13 46 31 8 5.15
DUTCH A1 SL 150 3 16 47 33 2 5.28
DZONGKHA A1 SL 1 100 6.00
ENGLISH A1 HL 30,572 0 5 33 45 15 3 4.77
ENGLISH A1 SL 6,625 0 3 26 43 24 4 5.00
ESTONIAN A1 SL 9 56 44 6.44
FINNISH A1 HL 133 15 40 39 6 5.36
FINNISH A1 SL 107 10 28 51 10 5.62
FRENCH A1 HL 419 0 3 20 36 33 9 5.13
FRENCH A1 SL 225 4 22 37 31 6 5.24
GEORGIAN A1 SL 4 25 75 5.75
GERMAN A1 HL 629 0 14 39 36 10 5.43
GERMAN A1 SL 270 1 10 34 35 19 5.61
HEBREW A1 HL 5 40 60 6.60
HEBREW A1 SL 29 7 24 55 14 5.76
HINDI A1 HL 1 100 5.00
HINDI A1 SL 39 3 23 56 18 5.90
29
Subject Level
Number of candidates
Percentage of candidates awarded grades Mean grade
GROUP 1 1 2 3 4 5 6 7
HUNGARIAN A1 HL 16 6 31 19 44 6.27
HUNGARIAN A1 SL 22 5 14 27 55 6.00
ICELANDIC A1 HL 5 20 40 40 6.20
ICELANDIC A1 SL 3 33 33 33 5.00
INDONESIAN A1 HL 118 8 48 40 3 5.38
INDONESIAN A1 SL 129 1 9 26 46 19 5.73
ITALIAN A1 HL 154 2 47 32 16 3 4.69
ITALIAN A1 SL 75 3 16 21 31 19 11 4.79
JAPANESE A1 HL 122 2 17 46 34 6.17
JAPANESE A1 SL 94 1 15 50 34 6.12
KANNADA A1 SL 1 100 6.00
KHMER A1 HL 7 29 43 29 6.00
KOREAN A1 HL 144 1 1 22 76 6.74
KOREAN A1 SL 115 3 20 77 6.75
LATVIAN A1 HL 32 3 9 63 25 6.09
LATVIAN A1 SL 11 9 18 36 36 6.00
LITHUANIAN A1 HL 16 6 38 56 6.50
LITHUANIAN A1 SL 38 5 3 5 55 32 6.05
MACEDONIAN A1 HL 25 20 80 6.80
MACEDONIAN A1 SL 7 100 7.00
MALAY A1 HL 4 25 75 0 5.75
MALAY A1 SL 458 0 0 1 45 53 6.51
MALAYALAM A1 SL 1 100 6.00
MARATHI A1 SL 3 33 67 4.67
MOD.GREEK HL 238 0 2 13 44 34 7 5.48
MOD.GREEK SL 142 1 11 37 42 10 5.30
MONGOLIAN A1 HL 1 100 6.00
MONGOLIAN A1 SL 7 14 43 43 6.29
NEPALI A1 SL 8 25 25 50 6.25
NORWEGIAN A1 HL 209 1 12 29 38 19 5.62
NORWEGIAN A1 SL 96 2 10 27 35 25 5.71
PAPIAMENTU A1 SL 1 100 6.00
PASHTO A1 SL 1 100 6.00
PERSIAN A1 HL 2 50 50 4.25
PERSIAN A1 SL 16 19 44 31 6 6.00
PILIPINO A1 HL 5 20 80 4.80
PILIPINO A1 SL 3 33 33 33 5.67
POLISH A1 HL 168 1 4 33 35 23 5 4.92
POLISH A1 SL 336 1 1 21 37 35 5 5.20
PORTUGUESE A1 HL 104 13 29 38 16 4 4.68
PORTUGUESE A1 SL 84 1 4 23 31 32 10 5.18
ROMANIAN A1 HL 4 25 25 25 25 5.88
ROMANIAN A1 SL 16 25 63 13 5.50
RUSSIAN A1 HL 72 7 33 36 24 5.76
RUSSIAN A1 SL 121 1 14 24 28 22 11 4.89
SERBIAN A1 HL 27 4 30 44 22 5.85
SERBIAN A1 SL 30 13 40 37 10 5.43
SESOTHO A1 HL 20 30 60 10 5.80
30
Subject Level
Number of candidates
Percentage of candidates awarded grades Mean grade GROUP 1 1 2 3 4 5 6 7
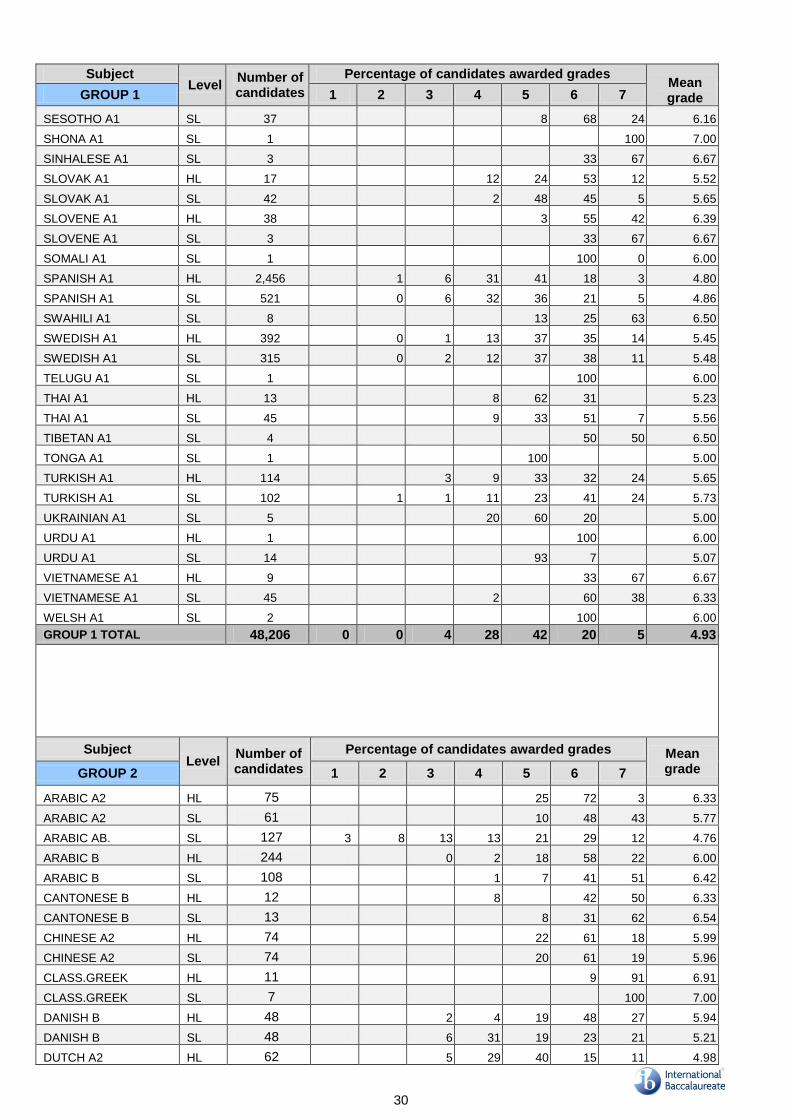
SESOTHO A1 SL 37 8 68 24 6.16
SHONA A1 SL 1 100 7.00
SINHALESE A1 SL 3 33 67 6.67
SLOVAK A1 HL 17 12 24 53 12 5.52
SLOVAK A1 SL 42 2 48 45 5 5.65
SLOVENE A1 HL 38 3 55 42 6.39
SLOVENE A1 SL 3 33 67 6.67
SOMALI A1 SL 1 100 0 6.00
SPANISH A1 HL 2,456 1 6 31 41 18 3 4.80
SPANISH A1 SL 521 0 6 32 36 21 5 4.86
SWAHILI A1 SL 8 13 25 63 6.50
SWEDISH A1 HL 392 0 1 13 37 35 14 5.45
SWEDISH A1 SL 315 0 2 12 37 38 11 5.48
TELUGU A1 SL 1 100 6.00
THAI A1 HL 13 8 62 31 5.23
THAI A1 SL 45 9 33 51 7 5.56
TIBETAN A1 SL 4 50 50 6.50
TONGA A1 SL 1 100 5.00
TURKISH A1 HL 114 3 9 33 32 24 5.65
TURKISH A1 SL 102 1 1 11 23 41 24 5.73
UKRAINIAN A1 SL 5 20 60 20 5.00
URDU A1 HL 1 100 6.00
URDU A1 SL 14 93 7 5.07
VIETNAMESE A1 HL 9 33 67 6.67
VIETNAMESE A1 SL 45 2 60 38 6.33
WELSH A1 SL 2 100 6.00
GROUP 1 TOTAL 48,206 0 0 4 28 42 20 5 4.93
Subject Level
Number of candidates
Percentage of candidates awarded grades Mean grade GROUP 2 1 2 3 4 5 6 7
ARABIC A2 HL 75 25 72 3 6.33
ARABIC A2 SL 61 10 48 43 5.77
ARABIC AB. SL 127 3 8 13 13 21 29 12 4.76
ARABIC B HL 244 0 2 18 58 22 6.00
ARABIC B SL 108 1 7 41 51 6.42
CANTONESE B HL 12 8 42 50 6.33
CANTONESE B SL 13 8 31 62 6.54
CHINESE A2 HL 74 22 61 18 5.99
CHINESE A2 SL 74 20 61 19 5.96
CLASS.GREEK HL 11 9 91 6.91
CLASS.GREEK SL 7 100 7.00
DANISH B HL 48 2 4 19 48 27 5.94
DANISH B SL 48 6 31 19 23 21 5.21
DUTCH A2 HL 62 5 29 40 15 11 4.98
31
Subject Level
Number of candidates
Percentage of candidates awarded grades Mean grade
GROUP 2 1 2 3 4 5 6 7
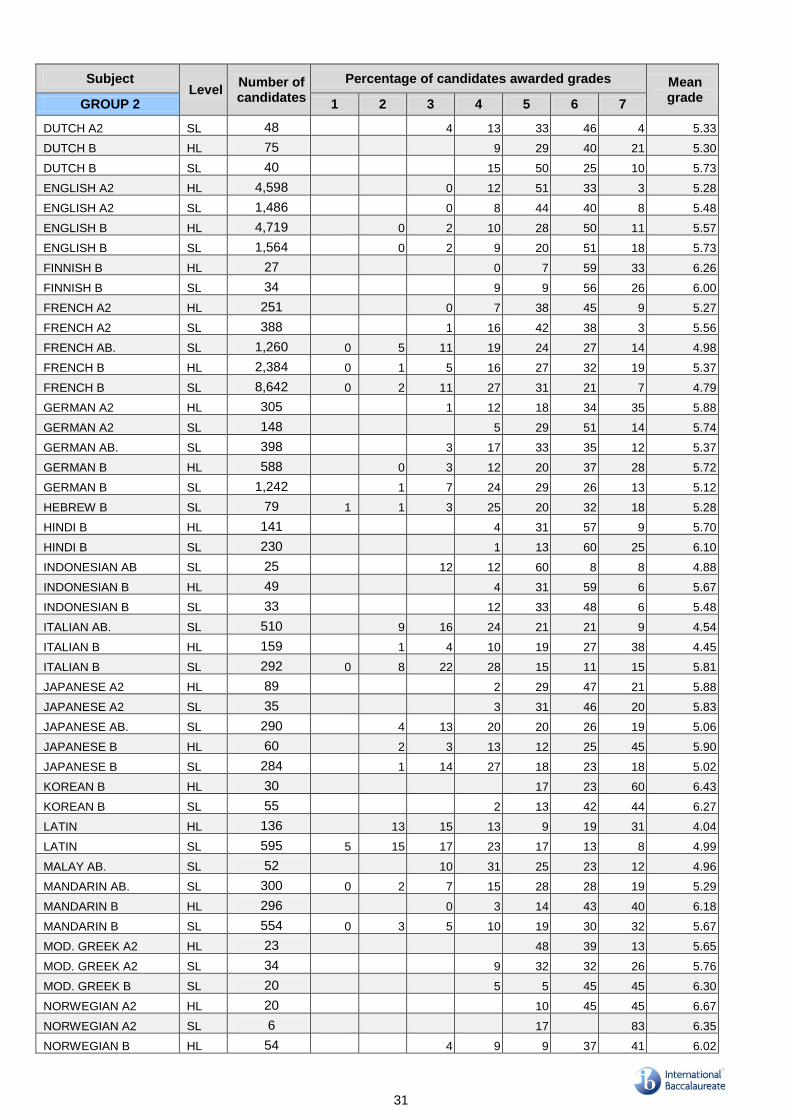
DUTCH A2 SL 48 4 13 33 46 4 5.33
DUTCH B HL 75 9 29 40 21 5.30
DUTCH B SL 40 15 50 25 10 5.73
ENGLISH A2 HL 4,598 0 12 51 33 3 5.28
ENGLISH A2 SL 1,486 0 8 44 40 8 5.48
ENGLISH B HL 4,719 0 2 10 28 50 11 5.57
ENGLISH B SL 1,564 0 2 9 20 51 18 5.73
FINNISH B HL 27 0 7 59 33 6.26
FINNISH B SL 34 9 9 56 26 6.00
FRENCH A2 HL 251 0 7 38 45 9 5.27
FRENCH A2 SL 388 1 16 42 38 3 5.56
FRENCH AB. SL 1,260 0 5 11 19 24 27 14 4.98
FRENCH B HL 2,384 0 1 5 16 27 32 19 5.37
FRENCH B SL 8,642 0 2 11 27 31 21 7 4.79
GERMAN A2 HL 305 1 12 18 34 35 5.88
GERMAN A2 SL 148 5 29 51 14 5.74
GERMAN AB. SL 398 3 17 33 35 12 5.37
GERMAN B HL 588 0 3 12 20 37 28 5.72
GERMAN B SL 1,242 1 7 24 29 26 13 5.12
HEBREW B SL 79 1 1 3 25 20 32 18 5.28
HINDI B HL 141 4 31 57 9 5.70
HINDI B SL 230 1 13 60 25 6.10
INDONESIAN AB SL 25 12 12 60 8 8 4.88
INDONESIAN B HL 49 4 31 59 6 5.67
INDONESIAN B SL 33 12 33 48 6 5.48
ITALIAN AB. SL 510 9 16 24 21 21 9 4.54
ITALIAN B HL 159 1 4 10 19 27 38 4.45
ITALIAN B SL 292 0 8 22 28 15 11 15 5.81
JAPANESE A2 HL 89 2 29 47 21 5.88
JAPANESE A2 SL 35 3 31 46 20 5.83
JAPANESE AB. SL 290 4 13 20 20 26 19 5.06
JAPANESE B HL 60 2 3 13 12 25 45 5.90
JAPANESE B SL 284 1 14 27 18 23 18 5.02
KOREAN B HL 30 17 23 60 6.43
KOREAN B SL 55 2 13 42 44 6.27
LATIN HL 136 13 15 13 9 19 31 4.04
LATIN SL 595 5 15 17 23 17 13 8 4.99
MALAY AB. SL 52 10 31 25 23 12 4.96
MANDARIN AB. SL 300 0 2 7 15 28 28 19 5.29
MANDARIN B HL 296 0 3 14 43 40 6.18
MANDARIN B SL 554 0 3 5 10 19 30 32 5.67
MOD. GREEK A2 HL 23 48 39 13 5.65
MOD. GREEK A2 SL 34 9 32 32 26 5.76
MOD. GREEK B SL 20 5 5 45 45 6.30
NORWEGIAN A2 HL 20 10 45 45 6.67
NORWEGIAN A2 SL 6 17 83 6.35
NORWEGIAN B HL 54 4 9 9 37 41 6.02
32
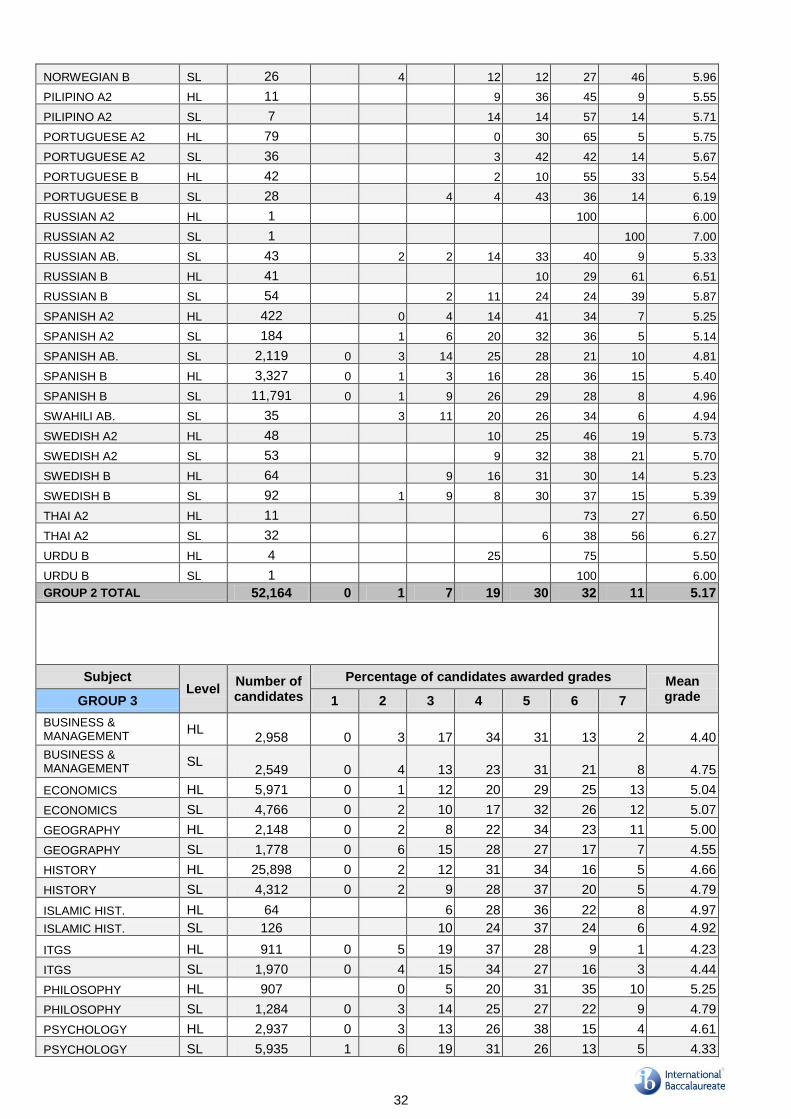
NORWEGIAN B SL 26 4 12 12 27 46 5.96
PILIPINO A2 HL 11 9 36 45 9 5.55
PILIPINO A2 SL 7 14 14 57 14 5.71
PORTUGUESE A2 HL 79 0 30 65 5 5.75
PORTUGUESE A2 SL 36 3 42 42 14 5.67
PORTUGUESE B HL 42 2 10 55 33 5.54
PORTUGUESE B SL 28 4 4 43 36 14 6.19
RUSSIAN A2 HL 1 100 6.00
RUSSIAN A2 SL 1 100 7.00
RUSSIAN AB. SL 43 2 2 14 33 40 9 5.33
RUSSIAN B HL 41 10 29 61 6.51
RUSSIAN B SL 54 2 11 24 24 39 5.87
SPANISH A2 HL 422 0 4 14 41 34 7 5.25
SPANISH A2 SL 184 1 6 20 32 36 5 5.14
SPANISH AB. SL 2,119 0 3 14 25 28 21 10 4.81
SPANISH B HL 3,327 0 1 3 16 28 36 15 5.40
SPANISH B SL 11,791 0 1 9 26 29 28 8 4.96
SWAHILI AB. SL 35 3 11 20 26 34 6 4.94
SWEDISH A2 HL 48 10 25 46 19 5.73
SWEDISH A2 SL 53 9 32 38 21 5.70
SWEDISH B HL 64 9 16 31 30 14 5.23
SWEDISH B SL 92 1 9 8 30 37 15 5.39
THAI A2 HL 11 73 27 6.50
THAI A2 SL 32 6 38 56 6.27
URDU B HL 4 25 75 5.50
URDU B SL 1 100 6.00
GROUP 2 TOTAL 52,164 0 1 7 19 30 32 11 5.17
Subject Level
Number of candidates
Percentage of candidates awarded grades Mean grade GROUP 3 1 2 3 4 5 6 7
BUSINESS & MANAGEMENT
HL 2,958 0 3 17 34 31 13 2 4.40
BUSINESS & MANAGEMENT
SL 2,549 0 4 13 23 31 21 8 4.75
ECONOMICS HL 5,971 0 1 12 20 29 25 13 5.04
ECONOMICS SL 4,766 0 2 10 17 32 26 12 5.07
GEOGRAPHY HL 2,148 0 2 8 22 34 23 11 5.00
GEOGRAPHY SL 1,778 0 6 15 28 27 17 7 4.55
HISTORY HL 25,898 0 2 12 31 34 16 5 4.66
HISTORY SL 4,312 0 2 9 28 37 20 5 4.79
ISLAMIC HIST. HL 64 6 28 36 22 8 4.97
ISLAMIC HIST. SL 126 10 24 37 24 6 4.92
ITGS HL 911 0 5 19 37 28 9 1 4.23
ITGS SL 1,970 0 4 15 34 27 16 3 4.44
PHILOSOPHY HL 907 0 5 20 31 35 10 5.25
PHILOSOPHY SL 1,284 0 3 14 25 27 22 9 4.79
PSYCHOLOGY HL 2,937 0 3 13 26 38 15 4 4.61
PSYCHOLOGY SL 5,935 1 6 19 31 26 13 5 4.33
33
SOC.CUL.ANTH. HL 259 3 22 29 23 20 4 4.47
SOC.CUL.ANTH. SL 760 0 1 6 30 46 14 3 4.73
GROUP 3 TOTAL 65,533 0 2 13 28 32 18 7 4.71
*ITGS = INFORMATION TECHNOLOGY IN A GLOBAL SOCIETY
Subject Level
Number of candidates
Percentage of candidates awarded grades Mean grade GROUP 4 1 2 3 4 5 6 7
BIOLOGY HL 16,328 0 12 23 26 20 15 4 4.15
BIOLOGY SL 10,831 1 9 22 26 23 15 5 4.26
CHEMISTRY HL 8,239 1 8 17 20 21 22 10 4.59
CHEMISTRY SL 8,724 2 15 23 24 19 13 5 4.03
DESIGN TECH. HL 374 5 11 28 26 23 7 4.42
DESIGN TECH. SL 399 4 18 29 32 15 2 4.75
ENVIRON.SYST. SL 3,293 0 9 21 31 26 11 2 4.14
PHYSICS HL 5,507 0 5 21 26 22 18 8 4.49
PHYSICS SL 8,235 1 11 26 25 19 13 6 4.13
GROUP 4 TOTAL 61,930 0 10 22 25 21 15 6 4.24
Subject Level
Number of candidates
Percentage of candidates awarded grades Mean grade GROUP 5 1 2 3 4 5 6 7
COMPUTER SCIENCE HL 394 2 10 16 22 19 18 13 4.51
COMPUTER SCIENCE SL 766 7 15 14 20 23 14 6 4.05
FURTHER MATHEMATICS
SL 105 13 16 24 25 14 8 4.33
MATHEMATICAL STUDIES
SL 16,618 0 4 13 28 32 17 4 4.57
MATHEMATICS HL 8,423 1 9 16 22 27 18 8 4.52
MATHEMATICS SL 21,653 1 7 19 21 25 18 9 4.53
GROUP 5 TOTAL 47,959 0 7 16 24 28 18 7 4.53
Subject Level
Number of candidates
Percentage of candidates awarded grades Mean grade GROUP 6 1 2 3 4 5 6 7
MUSIC HL 788 2 16 34 31 15 2 4.46
MUSIC SL 1,501 3 15 26 36 18 3 4.59
THEATRE ARTS HL 1,720 2 19 36 31 10 1 4.31
THEATRE ARTS SL 825 1 15 41 27 12 4 0 3.48
VISUAL ARTS HL 4,947 0 3 8 29 35 20 6 4.78
VISUAL ARTS SL 3,318 0 6 14 33 31 12 3 4.38
GROUP 6 TOTAL 13,099 0 4 14 31 31 15 4 4.51
34
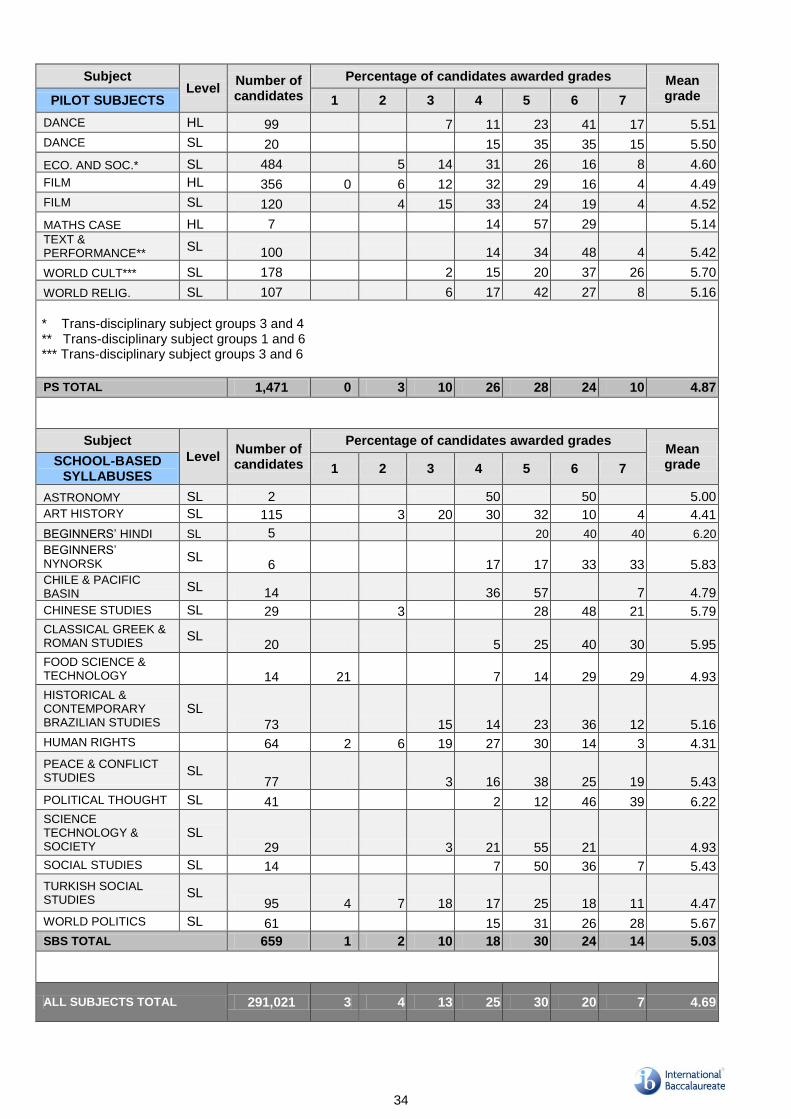
Subject Level
Number of candidates
Percentage of candidates awarded grades Mean grade PILOT SUBJECTS 1 2 3 4 5 6 7
DANCE HL 99 7 11 23 41 17 5.51
DANCE SL 20 15 35 35 15 5.50
ECO. AND SOC.* SL 484 5 14 31 26 16 8 4.60
FILM HL 356 0 6 12 32 29 16 4 4.49
FILM SL 120 4 15 33 24 19 4 4.52
MATHS CASE HL 7 14 57 29 5.14 TEXT & PERFORMANCE**
SL 100 14 34 48 4 5.42
WORLD CULT*** SL 178 2 15 20 37 26 5.70
WORLD RELIG. SL 107 6 17 42 27 8 5.16
* Trans-disciplinary subject groups 3 and 4 ** Trans-disciplinary subject groups 1 and 6 *** Trans-disciplinary subject groups 3 and 6
PS TOTAL 1,471 0 3 10 26 28 24 10 4.87
Subject
Level Number of candidates
Percentage of candidates awarded grades Mean grade SCHOOL-BASED
SYLLABUSES 1 2 3 4 5 6 7
ASTRONOMY SL 2 50 50 5.00
ART HISTORY SL 115 3 20 30 32 10 4 4.41
BEGINNERS’ HINDI SL 5 20 40 40 6.20
BEGINNERS’ NYNORSK
SL 6 17 17 33 33 5.83
CHILE & PACIFIC BASIN
SL 14 36 57 7 4.79
CHINESE STUDIES SL 29 3 28 48 21 5.79
CLASSICAL GREEK & ROMAN STUDIES
SL 20 5 25 40 30 5.95
FOOD SCIENCE & TECHNOLOGY
14 21 7 14 29 29 4.93
HISTORICAL & CONTEMPORARY BRAZILIAN STUDIES
SL
73 15 14 23 36 12 5.16
HUMAN RIGHTS 64 2 6 19 27 30 14 3 4.31
PEACE & CONFLICT STUDIES
SL 77 3 16 38 25 19 5.43
POLITICAL THOUGHT SL 41 2 12 46 39 6.22
SCIENCE TECHNOLOGY & SOCIETY
SL 29 3 21 55 21 4.93
SOCIAL STUDIES SL 14 7 50 36 7 5.43
TURKISH SOCIAL STUDIES
SL 95 4 7 18 17 25 18 11 4.47
WORLD POLITICS SL 61 15 31 26 28 5.67
SBS TOTAL 659 1 2 10 18 30 24 14 5.03
ALL SUBJECTS TOTAL 291,021 3 4 13 25 30 20 7 4.69
35
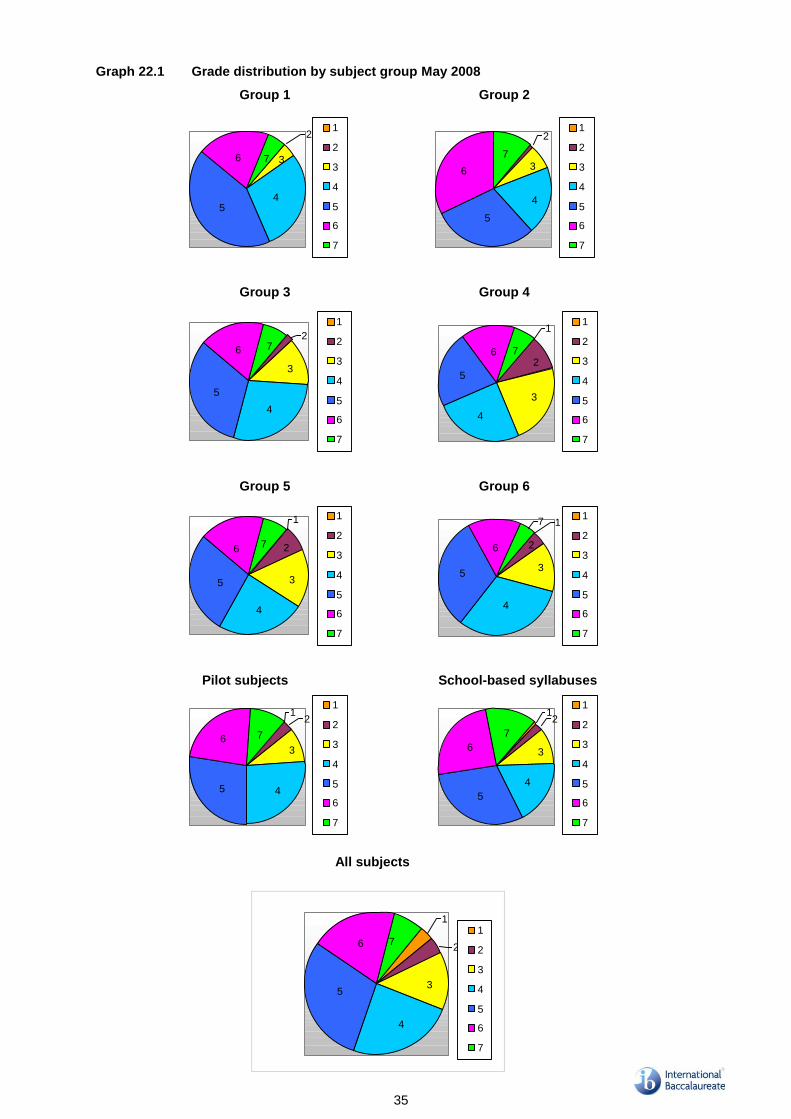
Graph 22.1 Grade distribution by subject group May 2008
Group 1 Group 2
45
6 7 3
21
2
3
4
5
6
7
5
3
4
2
7
6
1
2
3
4
5
6
7
Group 3 Group 4
3
5
6 72
4
1
2
3
4
5
6
7
1
4
3
276
5
1
2
3
4
5
6
7
Group 5 Group 6
4
3
2
1
7
5
6
1
2
3
4
5
6
7
4
3
2
17
6
5
1
2
3
4
5
6
7
Pilot subjects School-based syllabuses
5 4
3
12
76
1
2
3
4
5
6
7
5
4
3
12
7
6
1
2
3
4
5
6
7
All subjects
1
2
3
76
5
4
1
2
3
4
5
6
7
36
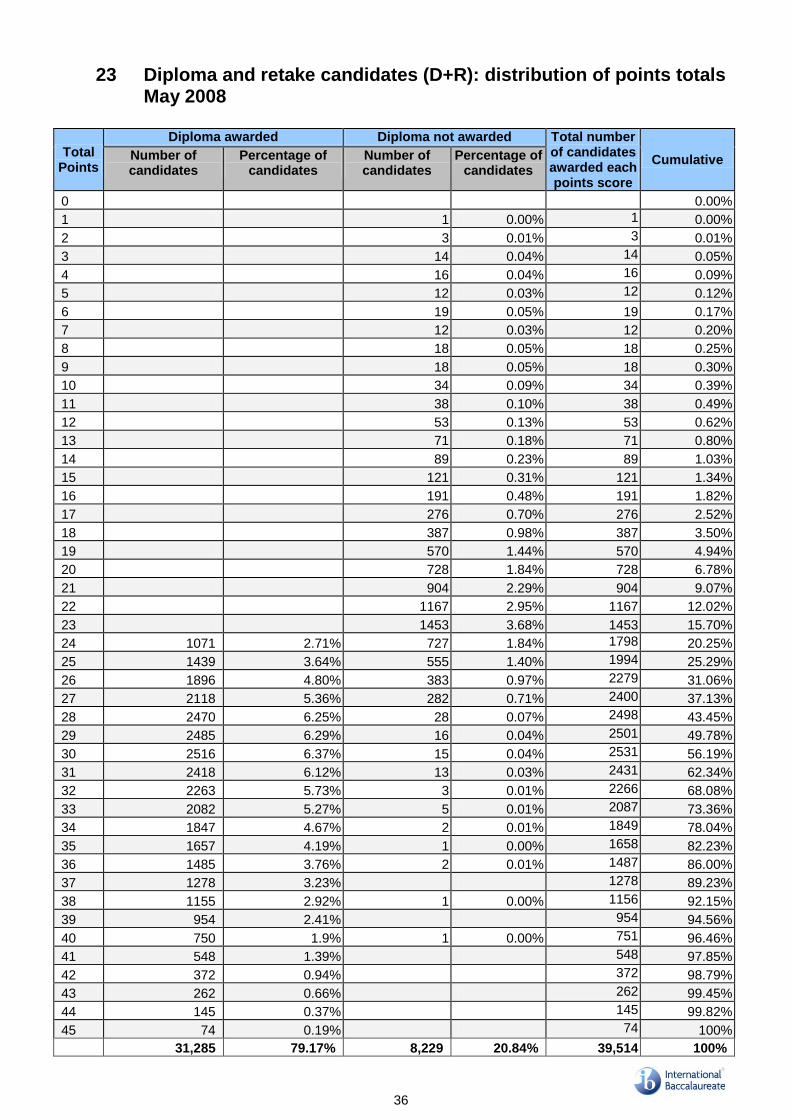
23 Diploma and retake candidates (D+R): distribution of points totals May 2008
Total Points
Diploma awarded Diploma not awarded Total number of candidates awarded each points score
Cumulative Number of candidates
Percentage of candidates
Number of candidates
Percentage of candidates
0 0.00%
1 1 0.00% 1 0.00%
2 3 0.01% 3 0.01%
3 14 0.04% 14 0.05%
4 16 0.04% 16 0.09%
5 12 0.03% 12 0.12%
6 19 0.05% 19 0.17%
7 12 0.03% 12 0.20%
8 18 0.05% 18 0.25%
9 18 0.05% 18 0.30%
10 34 0.09% 34 0.39%
11 38 0.10% 38 0.49%
12 53 0.13% 53 0.62%
13 71 0.18% 71 0.80%
14 89 0.23% 89 1.03%
15 121 0.31% 121 1.34%
16 191 0.48% 191 1.82%
17 276 0.70% 276 2.52%
18 387 0.98% 387 3.50%
19 570 1.44% 570 4.94%
20 728 1.84% 728 6.78%
21 904 2.29% 904 9.07%
22 1167 2.95% 1167 12.02%
23 1453 3.68% 1453 15.70%
24 1071 2.71% 727 1.84% 1798 20.25%
25 1439 3.64% 555 1.40% 1994 25.29%
26 1896 4.80% 383 0.97% 2279 31.06%
27 2118 5.36% 282 0.71% 2400 37.13%
28 2470 6.25% 28 0.07% 2498 43.45%
29 2485 6.29% 16 0.04% 2501 49.78%
30 2516 6.37% 15 0.04% 2531 56.19%
31 2418 6.12% 13 0.03% 2431 62.34%
32 2263 5.73% 3 0.01% 2266 68.08%
33 2082 5.27% 5 0.01% 2087 73.36%
34 1847 4.67% 2 0.01% 1849 78.04%
35 1657 4.19% 1 0.00% 1658 82.23%
36 1485 3.76% 2 0.01% 1487 86.00%
37 1278 3.23% 1278 89.23%
38 1155 2.92% 1 0.00% 1156 92.15%
39 954 2.41% 954 94.56%
40 750 1.9% 1 0.00% 751 96.46%
41 548 1.39% 548 97.85%
42 372 0.94% 372 98.79%
43 262 0.66% 262 99.45%
44 145 0.37% 145 99.82%
45 74 0.19% 74 100%
31,285 79.17% 8,229 20.84% 39,514 100%
37
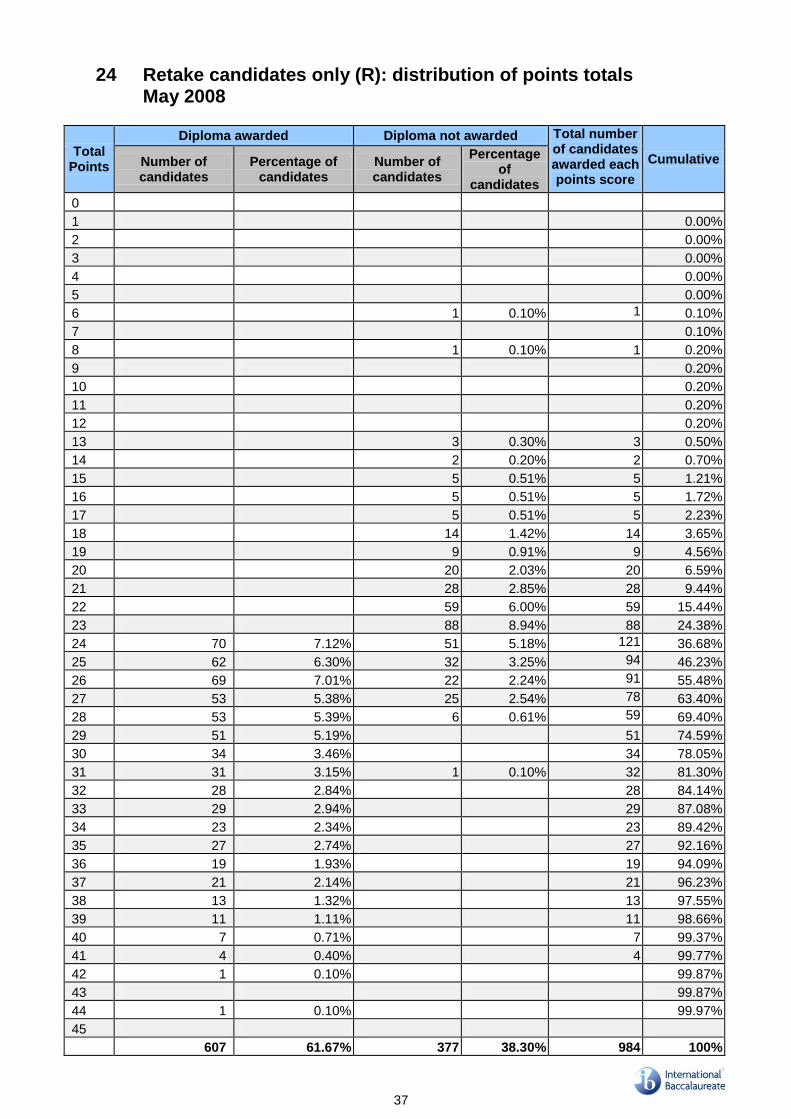
24 Retake candidates only (R): distribution of points totals May 2008
Total Points
Diploma awarded Diploma not awarded Total number of candidates awarded each points score
Cumulative Number of candidates
Percentage of candidates
Number of candidates
Percentage of
candidates
0
1 0.00%
2 0.00%
3 0.00%
4 0.00%
5 0.00%
6 1 0.10% 1 0.10%
7 0.10%
8 1 0.10% 1 0.20%
9 0.20%
10 0.20%
11 0.20%
12 0.20%
13 3 0.30% 3 0.50%
14 2 0.20% 2 0.70%
15 5 0.51% 5 1.21%
16 5 0.51% 5 1.72%
17 5 0.51% 5 2.23%
18 14 1.42% 14 3.65%
19 9 0.91% 9 4.56%
20 20 2.03% 20 6.59%
21 28 2.85% 28 9.44%
22 59 6.00% 59 15.44%
23 88 8.94% 88 24.38%
24 70 7.12% 51 5.18% 121 36.68%
25 62 6.30% 32 3.25% 94 46.23%
26 69 7.01% 22 2.24% 91 55.48%
27 53 5.38% 25 2.54% 78 63.40%
28 53 5.39% 6 0.61% 59 69.40%
29 51 5.19% 51 74.59%
30 34 3.46% 34 78.05%
31 31 3.15% 1 0.10% 32 81.30%
32 28 2.84% 28 84.14%
33 29 2.94% 29 87.08%
34 23 2.34% 23 89.42%
35 27 2.74% 27 92.16%
36 19 1.93% 19 94.09%
37 21 2.14% 21 96.23%
38 13 1.32% 13 97.55%
39 11 1.11% 11 98.66%
40 7 0.71% 7 99.37%
41 4 0.40% 4 99.77%
42 1 0.10% 99.87%
43 99.87%
44 1 0.10% 99.97%
45
607 61.67% 377 38.30% 984 100%
38
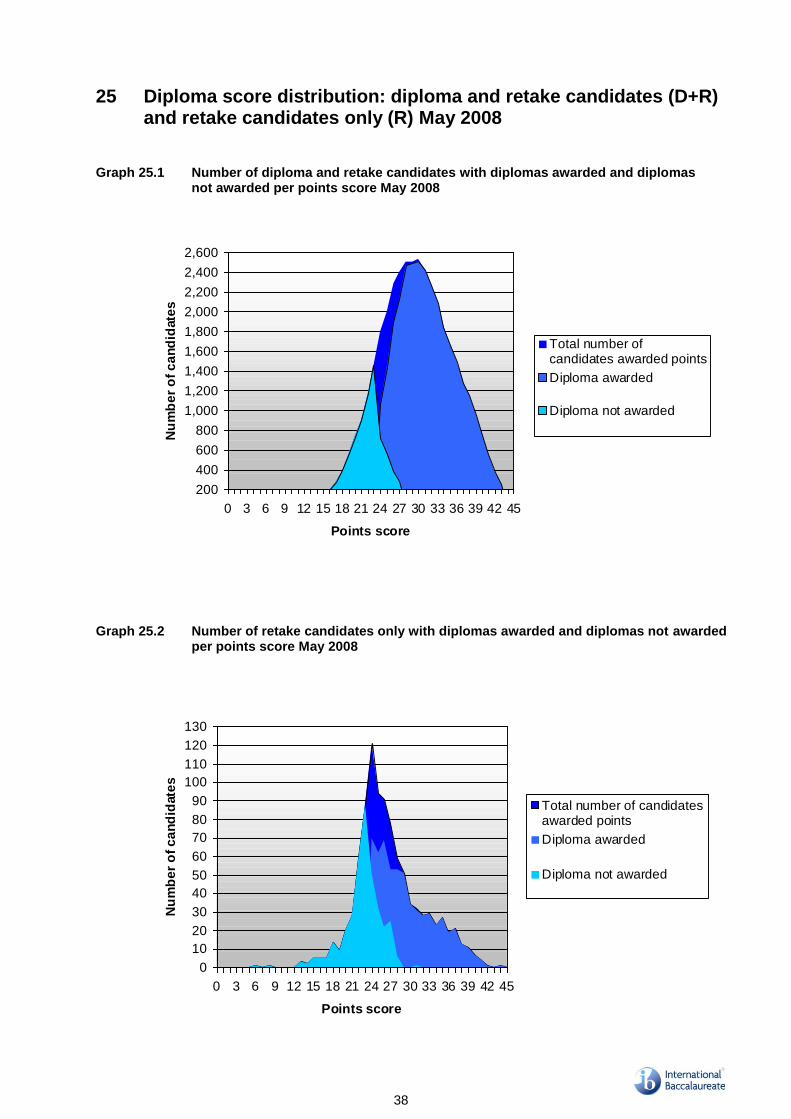
25 Diploma score distribution: diploma and retake candidates (D+R)
and retake candidates only (R) May 2008 Graph 25.1 Number of diploma and retake candidates with diplomas awarded and diplomas not awarded per points score May 2008
200
400
600
800
1,000
1,200
1,400
1,600
1,800
2,000
2,200
2,400
2,600
0 3 6 9 12 15 18 21 24 27 30 33 36 39 42 45
Points score
Nu
mb
er
of
ca
nd
idate
s
Total number ofcandidates awarded points
Diploma awarded
Diploma not awarded
Graph 25.2 Number of retake candidates only with diplomas awarded and diplomas not awarded
per points score May 2008
0
10
20
30
40
50
60
70
80
90
100
110
120
130
0 3 6 9 12 15 18 21 24 27 30 33 36 39 42 45
Points score
Nu
mb
er
of
ca
nd
idate
s
Total number of candidatesawarded points
Diploma awarded
Diploma not awarded
39
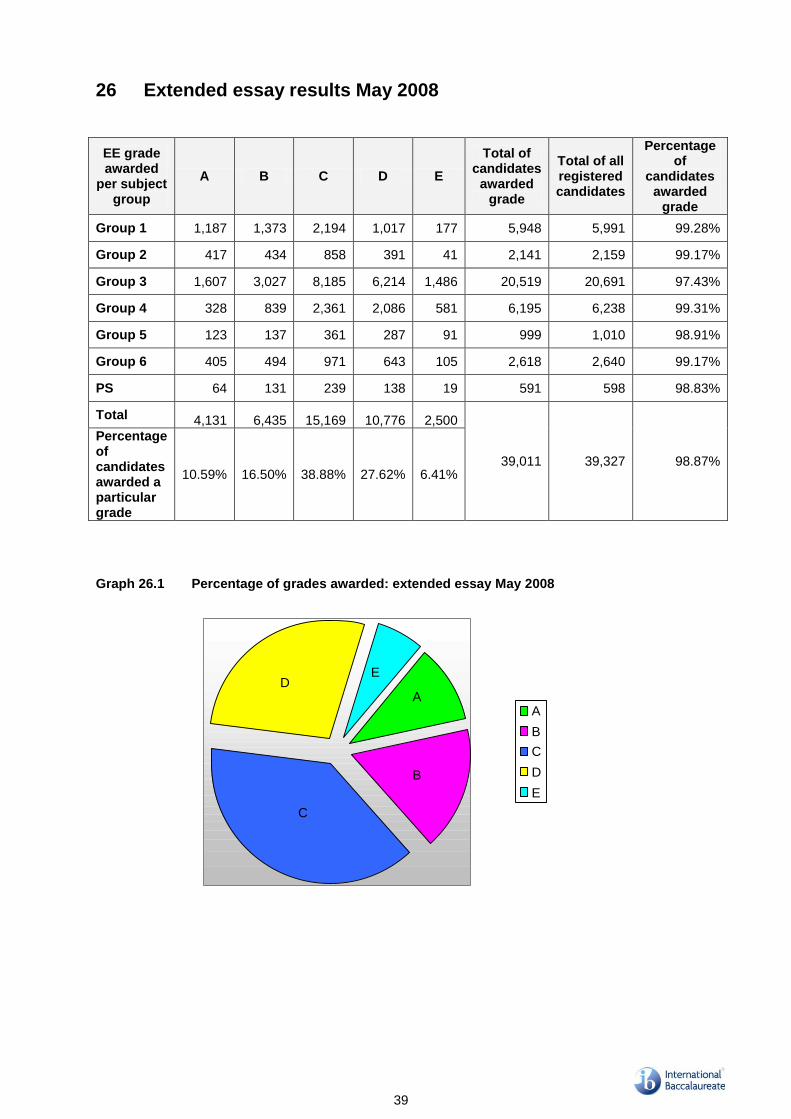
26 Extended essay results May 2008
EE grade awarded
per subject group
A B C D E
Total of candidates
awarded grade
Total of all registered candidates
Percentage of
candidates awarded
grade
Group 1 1,187 1,373 2,194 1,017 177 5,948 5,991 99.28%
Group 2 417 434 858 391 41 2,141 2,159 99.17%
Group 3 1,607 3,027 8,185 6,214 1,486 20,519 20,691 97.43%
Group 4 328 839 2,361 2,086 581 6,195 6,238 99.31%
Group 5 123 137 361 287 91 999 1,010 98.91%
Group 6 405 494 971 643 105 2,618 2,640 99.17%
PS 64 131 239 138 19 591 598 98.83%
Total 4,131 6,435 15,169 10,776 2,500
39,011 39,327 98.87%
Percentage of candidates awarded a particular grade
10.59% 16.50% 38.88% 27.62% 6.41%
Graph 26.1 Percentage of grades awarded: extended essay May 2008
A
B
C
DE
A
B
C
D
E
40
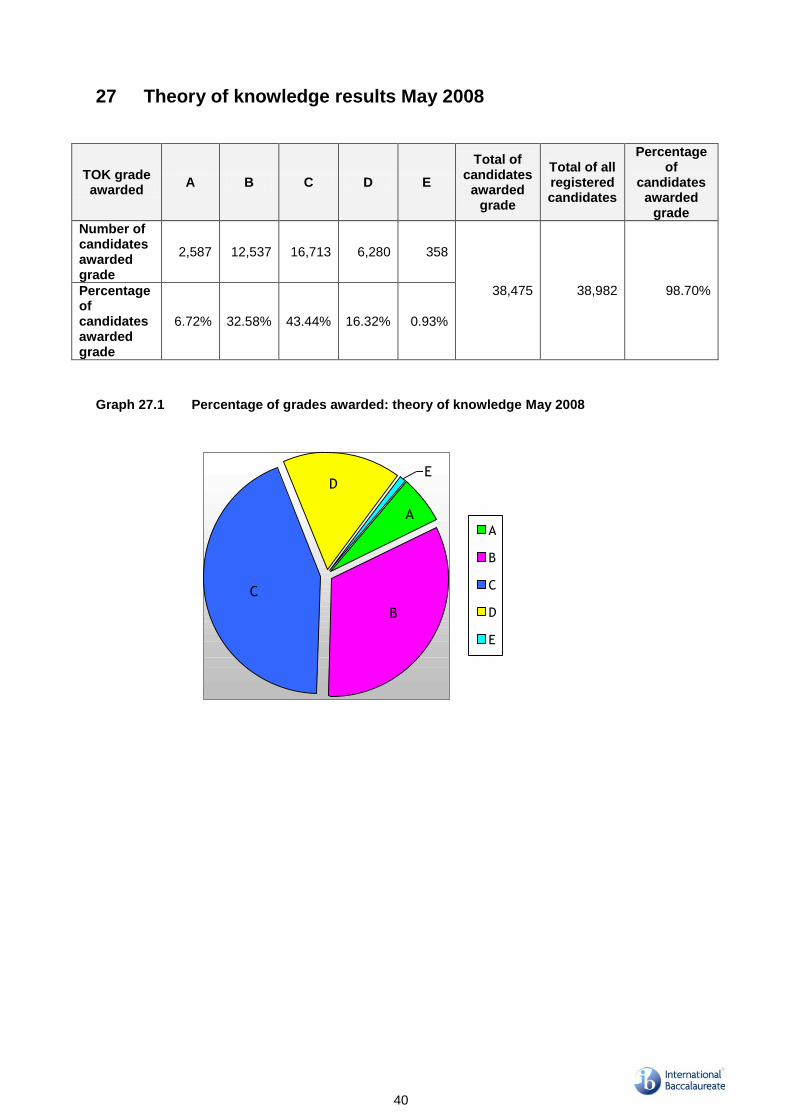
27 Theory of knowledge results May 2008
TOK grade awarded
A B C D E
Total of candidates
awarded grade
Total of all registered candidates
Percentage of
candidates awarded
grade
Number of candidates awarded grade
2,587 12,537 16,713 6,280 358
38,475 38,982 98.70% Percentage of candidates awarded grade
6.72% 32.58% 43.44% 16.32% 0.93%
Graph 27.1 Percentage of grades awarded: theory of knowledge May 2008
ED
C
B
AA
B
C
D
E
41
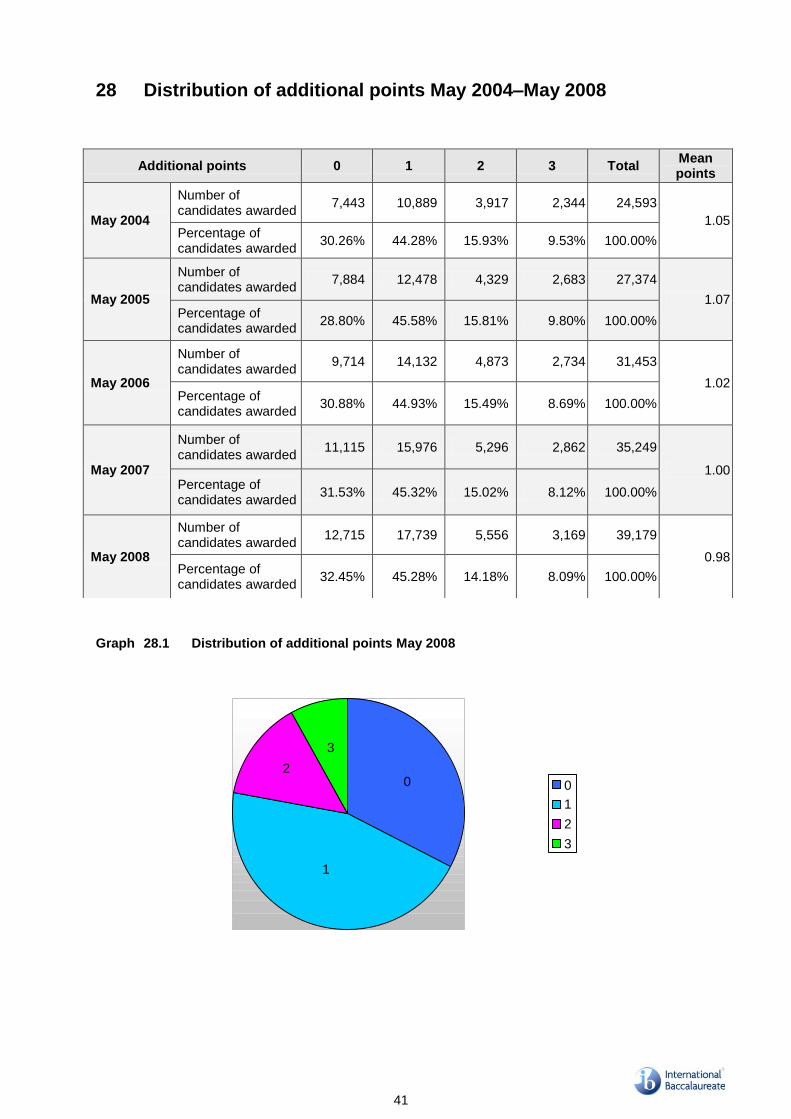
28 Distribution of additional points May 2004–May 2008
Graph 28.1 Distribution of additional points May 2008
1
2
3
0 0
1
2
3
Additional points 0 1 2 3 Total Mean points
May 2004
Number of candidates awarded
7,443 10,889 3,917 2,344 24,593
1.05 Percentage of candidates awarded
30.26% 44.28% 15.93% 9.53% 100.00%
May 2005
Number of candidates awarded
7,884 12,478 4,329 2,683 27,374
1.07 Percentage of candidates awarded
28.80% 45.58% 15.81% 9.80% 100.00%
May 2006
Number of candidates awarded
9,714 14,132 4,873 2,734 31,453
1.02 Percentage of candidates awarded
30.88% 44.93% 15.49% 8.69% 100.00%
May 2007
Number of candidates awarded
11,115 15,976 5,296 2,862 35,249
1.00 Percentage of candidates awarded
31.53% 45.32% 15.02% 8.12% 100.00%
May 2008
Number of candidates awarded
12,715 17,739 5,556 3,169 39,179
0.98 Percentage of candidates awarded
32.45% 45.28% 14.18% 8.09% 100.00%
42
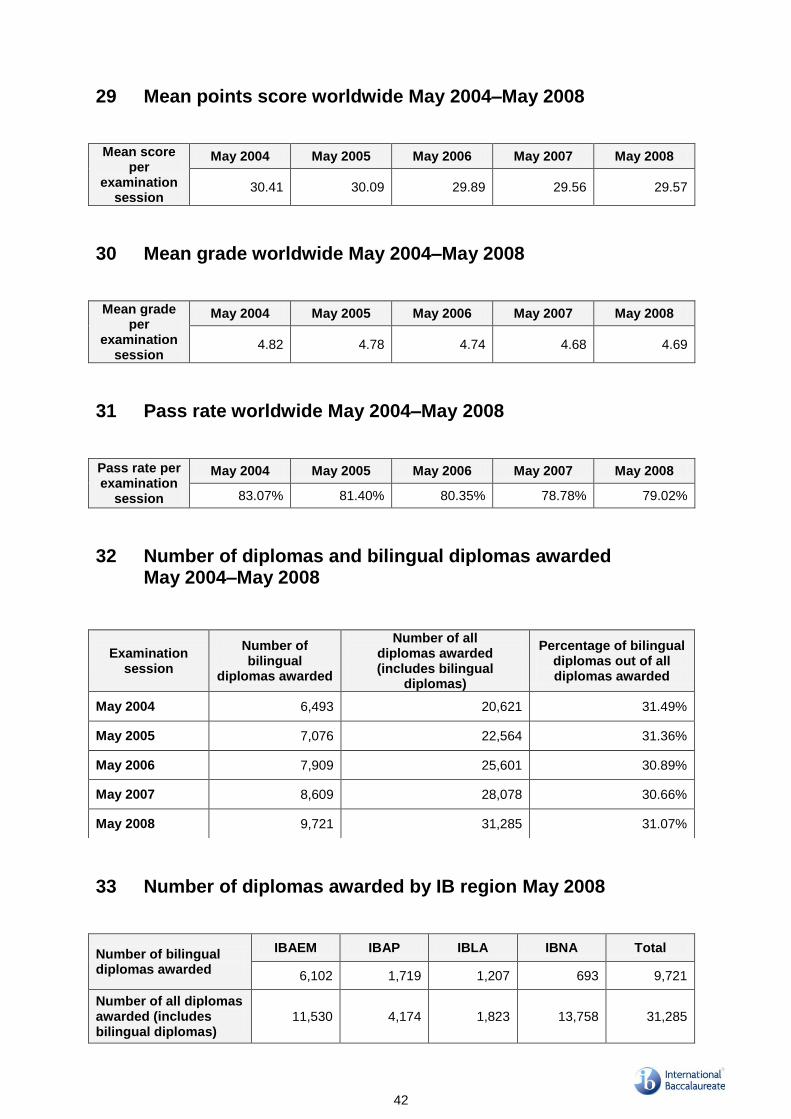
29 Mean points score worldwide May 2004–May 2008 Mean score
per examination
session
May 2004 May 2005 May 2006 May 2007 May 2008
30.41 30.09 29.89 29.56 29.57
30 Mean grade worldwide May 2004–May 2008 Mean grade
per examination
session
May 2004 May 2005 May 2006 May 2007 May 2008
4.82 4.78 4.74 4.68 4.69
31 Pass rate worldwide May 2004–May 2008 Pass rate per examination
session
May 2004 May 2005 May 2006 May 2007 May 2008
83.07% 81.40% 80.35% 78.78% 79.02%
32 Number of diplomas and bilingual diplomas awarded May 2004–May 2008
33 Number of diplomas awarded by IB region May 2008
Number of bilingual diplomas awarded
IBAEM IBAP IBLA IBNA Total
6,102 1,719 1,207 693 9,721
Number of all diplomas awarded (includes bilingual diplomas)
11,530 4,174 1,823 13,758 31,285
Examination session
Number of bilingual
diplomas awarded
Number of all diplomas awarded (includes bilingual
diplomas)
Percentage of bilingual diplomas out of all diplomas awarded
May 2004 6,493 20,621 31.49%
May 2005 7,076 22,564 31.36%
May 2006 7,909 25,601 30.89%
May 2007 8,609 28,078 30.66%
May 2008 9,721 31,285 31.07%


