Embed Size (px)
Citation preview
The energy costs of biological insulators
John Barton1,2,∗and Eduardo D. Sontag3
1 Department of Chemical Engineering, MIT,
Cambridge, MA 02139 USA2 Ragon Institute of Massachusetts General Hospital,
MIT, and Harvard University, Boston, MA 02129 USA2 Department of Mathematics, Rutgers University,
Piscataway, NJ 08854-8019 USA
January 8, 2014
Abstract
Biochemical signaling pathways can be insulated from impedance andcompetition effects through enzymatic “futile cycles” which consume energy,typically in the form of ATP. We hypothesize that better insulation neces-sarily requires higher energy consumption, and provide evidence, throughthe computational analysis of a simplified physical model, to support thishypothesis.
1 Introduction
An important theme in the current molecular biology literature is the attempt tounderstand cell behavior in terms of cascades and feedback interconnections ofmore elementary “modules,” which may be re-used in different pathways [1, 2].Modular thinking plays a fundamental role in the prediction of the behavior of asystem from the behavior of its components, guaranteeing that the properties ofindividual components do not change upon interconnection. Intracellular signaltransduction networks are often thought of as modular interconnections, passingalong information while also amplifying or performing other signal-processingtasks. It is assumed that their operation does not depend upon the presence orabsence of downstream targets to which they convey information. However, justas electrical, hydraulic, and other physical systems often do not display true mod-ularity, one may expect that biochemical systems, and specifically, intracellularprotein signaling pathways and genetic networks, do not always “connect” in anideal modular fashion.
∗Work done at: Department of Physics, Rutgers University, Piscataway, NJ 08854 USA
1
arX
iv:1
210.
3809
v2 [
q-bi
o.M
N]
16
Oct
201
2

Motivated by this observation, the paper [3] dealt with a systematic study ofthe effect of interconnections on the input/output dynamic characteristics of sig-naling cascades. Following [4], the term retroactivity was introduced in orderto generically refer to such effects, which constitute an analog of non-zero out-put impedance in electrical and mechanical systems, and retroactivity in severalsimple models was quantified. It was shown how downstream targets of a signal-ing system (“loads”) can produce changes in signaling, thus “propagating back-wards” (and “sideways”) information about targets. Further theoretical workalong these lines was reported in [5, 6]. Experimental verifications were reportedin [7] and in [8], using a covalent modification cycle based on a reconstituteduridylyltransferase/uridylyl-removing enzyme PII cycle, which is a model systemderived from the nitrogen assimilation control network of Escherichia coli.
The key reason for retroactivity is that signal transmission in biological systemsinvolves chemical reactions between signaling molecules. These reactions take afinite time to occur, and during the process, while reactants are bound together,they generally cannot take part in the other dynamical processes that they wouldtypically be involved in when unbound. One consequence of this “sequestering”effect is that influences are also indirectly transmitted “laterally,” in that for asingle input - multiple output system, the output to a given downstream systemis influenced by other outputs.
In order to attenuate the effect of retroactivity, the paper [3] proposed a negativefeedback mechanism inspired by the design of operational amplifiers (“OpAmps”)in electronics, employing a mechanism implemented through a covalent modifica-tion cycle based on phosphorylation/dephosphorylation reactions. For appropri-ate parameter ranges, this mechanism enjoys a remarkable insulation property,having an an inherent capacity to shield upstream components from the influ-ence of downstream systems and hence to increase the modularity of the systemin which it is placed. One may speculate whether this is indeed one reason thatsuch mechanisms are so ubiquitous in cell signaling pathways. Leaving aside spec-ulation, however, one major potential disadvantage of insulating systems basedon “OpAmp” ideas is that they impose a metabolic load, ultimately becauseamplification requires energy expenditure.
Thus, a natural question to ask from a purely physical standpoint is: does betterinsulation require more energy consumption? This is the subject of the presentwork. We provide a qualified positive answer: for a specific (but generic) modelof covalent cycles, natural notions of insulation and energy consumption, and aPareto-like view of multi-objective optimization, we find, using a numerical pa-rameter sweep in our models, that better insulation indeed requires more energy.
In addition to this positive answer in itself, two major contributions of this workare:
(a) we introduce two innovative measures of retroactivity, and dually insulation,in terms of two competing goals: (1) the minimization of the differencebetween the output of the insulator and the “ideal” behavior, and (2) theattenuation of the competition effect, the change in output when a newdownstream target is added;
2

(b) we introduce a new way to characterize optimality through balancing ofthese goals in a Pareto sense.
These contributions should be of interest even in other studies of insulation thatdo not involve energy use.
We remark that the recent paper by Lan et al. [9] dealt with the need for en-ergy dissipation when improving adaptation speed and accuracy, in the contextof perfect adaptation. Although we also ask about energy costs, our technicalquantification of energy use, and also the problem that we consider, are verydifferent. Also somewhat related is the recent paper by Shoval et al. [10], whichalso considers Pareto optimality in a biological context of balancing competingphenotype objectives. Again, our work is different, since a very different type ofproblem is analyzed.
2 Statement of the problem
We are interested in biological pathways which transmit a single, time-dependentinput signal to one or more downstream targets. A prototypical example is atranscription factor Z which regulates the production of one or more proteins bybinding directly to their promoters, forming a protein-promoter complex. As-suming a single promoter target for simplicity, this system is represented by theset of reactions
∅ k(t)→ Zδ→ ∅,
Z+pkonkoff
C,(2.1)
where p stands for the promoter and C denotes the protein-promoter complex.An analogous set of chemical reactions can be used to describe a signaling systemin which Z denotes the active form of a kinase, and p is a protein target, whichcan be reversibly phosphorylated to give a modified form C. For our analysis, theparticular interpretation of Z, p, and C will not be important. One thinks of Zas describing an “upstream” system that regulates the “downstream” target C.Although mathematically the distinction between “upstream” and “downstream”is somewhat artificial, the roles of transcription factors as controllers of geneexpression, or of enzymes on substrate conversions, and not the converse, arebiologically natural and accepted.
Mathematical model of the basic reaction
We adopt the convention that the (generally time-dependent) concentration ofeach species is denoted by the respective italics symbol; for example, X = X(t)is the concentration of X at time t. We assume that the transcription factorZ is produced or otherwise activated at a time-dependent rate k(t), and decaysat a rate proportional to a constant δ, and that the total concentration of the
3

promoter ptot is fixed. This leads to a set of ordinary differential equations(ODEs) describing the dynamics of the system,
dZ
dt= k(t)− δZ − konZ (ptot − C) + koff C,
dC
dt= kon (ptot − C)Z − koff C.
(2.2)
The generalization of these equations to the case of multiple output targets isstraightforward. Protein synthesis and degradation take place on time scalesthat are orders of magnitude larger than the typical time scales of small moleculesbinding to proteins, or of transcription factors binding to DNA [11]. Thus we willtake the rates k(t) and δ to be much smaller than other interaction rates such askon and koff . In (2.1) Z represents the input, and C the output.
The ideal system and the distortion measure
Sequestration of the input Z by its target p affects the dynamics of the system as awhole, distorting the output to C as well as to other potential downstream targets.In an “ideal” version of (2.2), where sequestration effects could be ignored, thedynamics would instead be given by
dZ
dt= k(t)− δZ,
dC
dt= kon (ptot − C)Z − koff C.
(2.3)
The term −konZ (ptot − C)+koff C that was removed from the first equation rep-resents a retroactivity term, in the language of [3]. This is the term that quantifieshow the dynamics of the “upstream” species Z is affected by its “downstream”target C. In the “ideal” system (2.3), the transmission of the signal from inputto output is undisturbed by retroactivity effects. We thus use the (relative) dif-ference between the output signal in a system with realistic dynamics and theideal output, as given by the solution of (2.3), as a measure of the output signaldistortion, and define the distortion D to be
D =1
σCideal
〈|Cideal(t)− Creal(t)|〉, (2.4)
where 〈·〉 denotes a long time average. Here we normalize by dividing by thestandard deviation of the ideal signal,
σCideal=√〈(Cideal(t)− 〈Cideal(t)〉)2〉. (2.5)
Thus (2.4) measures the difference between the output in the real and idealsystems, in units of the typical size of the time-dependent fluctuations in theideal output signal.
4

Fan-out: multiple targets
Another consequence of sequestration effects is the interdependence of the outputsignals to different downstream targets connected in parallel. Each molecule ofZ may only bind to a single promoter at a time, thus introducing a competitionbetween the promoters to bind with the limited amount of Z in the system.This is a question of practical interest, as transcription factors typically controla large number of target genes. For example, the tumor suppressor protein p53has well over a hundred targets [12]. A similar issue appears in biochemistry,where promiscuous enzymes may affect even hundreds of substrates. For example,alcohol dehydrogenases (ADH) target about a hundred different substrates tobreak down toxic alcohols and to generate useful aldehyde, ketone, or alcoholgroups during biosynthesis of various metabolites [13].
We quantify the size of this competition effect by the change in an output signal toa given target in response to an infinitesimal change in the abundance of anotherparallel target. For definiteness, consider (2.1) with an additional promoter p′,which bonds to Z to form a complex C′ with the same on/off rates as p:
Z+p′konkoff
C′ ,
and the corresponding equation added to (2.2),
dC ′
dt= kon
(p′tot − C ′
)Z − koff C
′.
We then define the competition effect of the system (2.2) as
C =1
σC
⟨(∂ C(t)
∂p′tot
)∣∣∣∣p′tot=0
⟩. (2.6)
Again we normalize by the standard deviation of the output signal C(t),
σC =√〈(C(t)− 〈C(t)〉)2〉, (2.7)
computed with p′tot = 0, so that (2.6) measures the change in the output signalwhen an additional target is introduced relative to the size of the fluctuations ofthe output in the unperturbed system.
Design of an insulator
As shown in Fig. 1, typical performance of the simple direct coupling systemdefined by (2.2) is poor, assuming, as in [3], that we test the system with asimple sinusoidally varying production rate
k(t) = k (1 + sinωt) , (2.8)
whose frequency ω is similar in magnitude to k and δ. Oscillation of the outputsignal in response to the time-varying input is strongly damped relative to the
5

Out
putc
once
ntra
tion
Sch
emat
icDirect coupling Insulator
0
20
40
60
Com
paris
onw
ithid
eal
0 625 1250time
49
51
Effe
ctof
com
petit
ion
0
20
40
60
0 625 1250time
20
40
60
Figure 1: Retroactivity effects lead to signal distortion, and attenuation of outputsignals when additional targets are added. Comparison of retroactivity effects on a sig-naling system with a direct coupling (DC) architecture (left) and one with an insulator,represented by a phosphorylation/dephosphorylation cycle (right). Top row, a cartoonschematic of the signaling system. In the DC system (2.1), the input binds directly tothe target. With an insulator (2.9), the input drives phosphorylation of an interme-diate signaling molecule, whose phosphorylated form binds to the target. Middle row,illustration of distortion. The “ideal” output signal (blue), see (2.3), with retroactivityeffects neglected, is plotted against the output for each system with nonlinear dynamics(orange), given by (2.2) for the DC system and (2.10) for the insulator. Bottom row,illustration of competition effect. The output signal in a system with a single target(orange) is compared with the output signal when multiple targets are present (green).Note the greatly reduced amplitude of variation of the output in the DC system. Plotsof the output signals in each system are shown in the steady state, over a single period ofk(t). This plot was made using the parameters k(t) = 0.01 (1 + sin (0.005 t)), δ = 0.01,α1 = β1 = 0.01, α2 = β2 = k1 = k2 = 10, kon = koff = 10, ptot = 100, and Xtot = 800,Ytot = 800 for the insulator. Parameters specifying the interaction with the new promoterp′ in the perturbed system are k′on = k′off = 10, and p′tot = 60.
6
ideal. The output is also sensitive to other targets connected in parallel; as thetotal load increases the output signal is noticeably damped in both the transientand steady state. Here the flux of Z into and out of the system is too slow todrive large changes in the output C as the rate of production k(t) varies.
As suggested in [3], the retroactivity effects in this system can be significantlyameliorated by using an intermediate signal processing system, specifically onebased on a phosphorylation/dephosphorylation (PD) “futile cycle,” between theinput and output. Such systems appear often in signaling pathways that mediategene expression responses to the environment [11]. In this system, the input signalZ plays the role of a kinase, facilitating the phosphorylation of a protein X. Thephosphorylated version of the protein X∗ then binds to the target p to transmitthe signal. Dephosphorylation of X∗ is driven by a phosphatase Y. Assuming atwo-step model of the phosphorylation/dephosphorylation reactions, the full setof reactions is
∅ k(t)→ Zδ→ ∅,
Z+Xβ1β2
C1k1→ X∗+Z,
Y+X∗α1α2
C2k2→ X+Y,
X∗+pkonkoff
C.
(2.9)
The total protein concentrations Xtot and Ytot are fixed. The forward and re-verse rates of the phosphorylation/dephosphorylation reaction depend implic-itly on the concentrations of phosphate donors and acceptors, such as ATPand ADP. Metabolic processes ensure that these concentrations are held faraway from equilibrium, biasing the reaction rates and driving the phosphoryla-tion/dephosphorylation cycle out of equilibrium. As routinely done in enzymaticbiochemistry analysis, we have made the simplifying assumption of setting thesmall rates of the reverse processes X∗+Z → C1 and X+Y → C2 to zero. TheODEs governing the dynamics of the system are then
dZ
dt= k(t)− δZ − β1Z (Xtot − C1 − C2 − C) + (β2 + k1)C1,
dC1
dt= β1Z (Xtot − C1 − C2 − C)− (β2 + k1)C1,
dC2
dt= α1X
∗ (Ytot − C2)− (α2 + k2)C2,
dX∗
dt= k1C1 − α1X
∗ (Ytot − C2) + α2C2 − konX∗ (ptot − C) + koff C,
dC
dt= konX
∗ (ptot − C)− koff C.
(2.10)
As shown in Fig. 1, for suitable choices of parameters the output signal in thesystem including the PD cycle is able to match the ideal output much moreclosely than in the direct coupling system. The output signal is also much lesssensitive to changes in other targets connected in parallel than in the system
7

where the input couples directly to the promoter. One can think of this systemwith the insulator as equivalent to the direct coupling system, but with effective“production” and “degradation” rates
keff(t) = k1C1 + α2C2, δeff = α1 (Ytot − C2) , (2.11)
which may be much larger than the original k(t) and δ, thus allowing the systemwith the insulator to adapt much more rapidly to varying input.
The fact that the PD cycle is driven out of equilibrium, therefore consumingenergy, is critical for its signal processing effectiveness. Our focus will be on howthe performance of the PD cycle as an insulator depends upon its rate of energyconsumption.
Our hypothesis is that better insulation requires more energy consumption. Inorder formulate a more precise question, we need to find a proxy for energyconsumption in our simple model.
Energy use and insulation
The free energy consumed in the PD cycle can be expressed in terms of the changein the free energy of the system ∆G resulting from the phosphorylation andsubsequent dephosphorylation of a single molecule of X. One can also measurethe amount of ATP which is converted to ADP, which is proportional to thecurrent through the phosphorylation reaction C1 → X∗+Z. In the steady state,since the phosphorylation and dephosphorylation reactions are assumed to beirreversible and the total concentration Xtot is fixed, the time averages of thesetwo measures are directly proportional. The average free energy consumed perunit time in the steady state is then proportional to the average current
J = 〈k1C1〉. (2.12)
Different choices of the parameters appearing in the phosphorylation and de-phosphorylation reactions, such as k1, k2, and Xtot, will lead to different rates ofenergy use and also different levels of performance in terms of the competitioneffect and distortion. We focus our attention on the concentrations Xtot andYtot as tunable parameters. While the reaction rates such as k1 and k2 dependupon the details of the molecular structure and are harder to directly manipulate,concentrations of stable molecules like X and Y can be experimentally adjusted,and hence the behavior of the PD cycle as a function of Xtot and Ytot is of greatpractical interest.
Comparing different parameters in the insulator: Pareto optimality
In measuring the overall quality of our signaling system, the relative importance offaithful signal transmission, as measured by small distortion, and a small compe-tition effect, will vary. This means that quality is intrinsically a multi-objectiveoptimization problem, with competing objectives. Rather than applying arbi-trary weights to each quantity, we will instead approach the problem of finding
8

ideal parameters for the PD cycle from the point of view of Pareto optimality, astandard approach to optimization problems with multiple competing objectiveswhich was originally introduced in economics [10]. In this view, one seeks todetermine the set of parameters of the system for which any improvement in oneof the objectives necessitates a sacrifice in one of the others. Here, the competingobjectives are the minimization of D and C.A Pareto optimal choice of the parameters is one for which there is no otherchoice of parameters which gives a smaller value of both D and C. Pareto optimalchoices, also called Pareto efficient points, give generically optimum points withrespect to arbitrary positive linear combinations αD + βC, thus eliminating theneed to make an artificial choice of weights.
An informal analysis
A full mathematical analysis of the system (2.10) of nonlinear ODE’s is difficult.In biologically plausible parameter ranges, however, certain simplifications allowone to develop intuition about its behavior. We discuss now this approximateanalysis, in order to set the stage for, and to help interpret the results of, ournumerical computations with the full nonlinear model.
We make the following ansatz: the variables Z(t) and X∗(t) evolve more slowlythan C1(t), C2(t), and C(t). Biochemically, this is justified because phosphoryla-tion and dephosphorylation reactions tend to occur on the time scale of seconds[14, 15], as do transcription factor promoter binding and unbinding events [11],while protein production and decay takes place on the time scale of minutes [11].In addition, we analyze the behavior of the system under the assumption thatthe total concentrations of enzyme and phosphatase, Xtot and Ytot, are large. Interms of the constants appearing in (2.10), we assume:
K1 =β2 + k1
β1� Xtot � 1,
K2 =α2 + k2
α1� Ytot � 1,
1� {k(t), δ} � kon ≈ koff .
Thus, in the time scale of Z(t) and X∗(t), we can make the quasi-steady state(Michaelis-Menten) assumption that C1(t), C2(t), and C(t) are at equilibrium.Setting the right-hand-sides of dC1
dt , dC2dt , and dC
dt to zero, and substituting in theremaining two equations of (2.10), we obtain the following system:
dZ
dt≈ k(t)− δZ,
dX∗
dt≈ k1C1 − k2C2 .
The lack of additional terms in the equation for Z(t) is a consequence of theassumption that K1 � Xtot, which amounts to a low binding affinity of Z toits target X (relative to the concentration of the latter); this follows from a
9

“total” quasi-steady state approximation as in [16, 17]. Observe that such anapproximation is not generally possible for the original system (2.1), and indeedthis is the key reason for the retroactivity effect [3].
With the above assumptions, in the system with the insulator Z(t) evolves ap-proximately as in the ideal system (2.3). In this quasi-steady state approximationC1 ≈ (1/K1)(Xtot − C1 − C2 − C)Z ≈ (1/K1)XtotZ and C2 ≈ (1/K2)(Ytot −C2)X∗ ≈ (1/K2)YtotX
∗, and thus we have
dX∗
dt≈ (k1/K1)XtotZ − (k2/K2)YtotX
∗ .
Finally, let us consider the effect of the following condition:
(k1/K1)Xtot ≈ (k2/K2)Ytot � 1 . (2.13)
If this condition is satisfied, then dX∗
dt ≈ K(Z −X∗), with K � 1, which means
that X∗(t) ≈ Z(t), and thus the equation for dCdt in (2.10) reduces to that for the
ideal system (2.3). In summary, if (2.13) holds, we argue that the system withthe insulator will reproduce the behavior of the ideal system, instead of the realsystem (2.2). Moreover, the energy consumption rate in (2.12) is proportional tok1C1 ≈ (k1/K1)XtotZ, and hence will be large if condition (2.13) holds, whichintuitively leads us to expect high energy costs for insulation.
These informal arguments (or more formal ones based on singular perturbationtheory [3]) justify the sufficiency, but not the necessity, of condition (2.13). Ournumerical results will show that this condition is indeed satisfied for a wide rangeof parameters that lead to good insulation.
3 Results
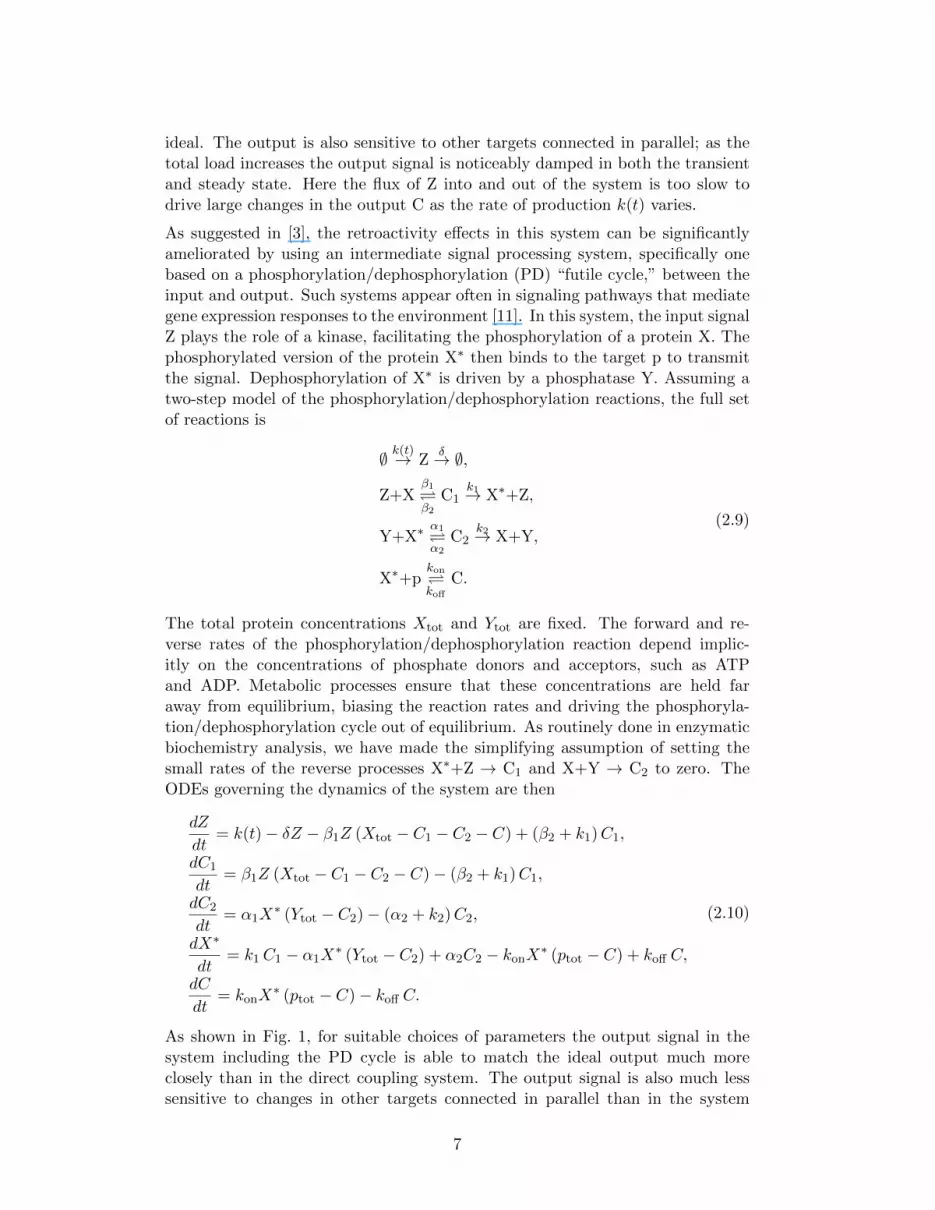
We have explored the performance of the insulating PD cycle over an extensiverange of parameters to test our hypothesis that better insulation requires moreenergy consumption. In Fig. 2 we show a plot of C and D for systems with a rangeof Xtot and Ytot, obtained by numerical integration of the differential equations(2.10)(see also Fig. 3 for a 3d view). Pareto optimal choices of parameters on thetested parameter space are indicated by black points.
Superior performance of the insulator is clearly associated with higher rates ofenergy consumption, as shown in the figure. Typically the rate of energy con-sumption increases as one approaches the set of Pareto optimal points, referredto as the Pareto front. Indeed, choices of parameters on or near the Pareto fronthave some of the highest rates of energy expenditure. Conversely, the parame-ter choices which have the poorest performance also consume the least energy.As shown above, this phenomenon can be understood by noting that the energyconsumption rate (2.12) will be large when the conditions for optimal insulation(2.13) are met.
Note that it is possible for two different choices of the parameters Xtot and Ytot
to yield the same measures of insulation C and D, but with different rates of
10
Com
petit
ion
effe
ct(C
)
100
101
102
103
Distortion (D)100101 100
101
102
103
104
Figure 2: Performance of the insulator measured by the competition effect C and dis-tortion D of the output in the system with an insulator (2.10), tested over a range of Xtot
and Ytot varied independently from 10 to 10000 in logarithmic steps. For simplicity C andD are rescaled such that the smallest (best) values are equal to one. Points are coloredaccording to the logarithm of the rate of the rate of energy consumption of the PD cycle,from blue (lowest) to red (highest). Pareto efficient parameter points are marked byblack dots. Rates of energy consumption increases as one approaches the Pareto front;obtaining small values of the competition effect is particularly costly. For comparison,C and D for the direct coupling system is marked by a white dot. See Section 3 for de-tails. This plot was made using the parameters k(t) = 0.01 (1 + sin (0.005 t)), δ = 0.01,α1 = β1 = 0.01, α2 = β2 = k1 = k2 = 10, kon = koff = 10, and ptot = 100.
11

energy consumption. This results in a “fold” in the sheet in Fig. 2, most clearlyobserved near D = 10 and C = 4. We see then that while better insulationgenerally requires larger amounts of energy consumption, it is not necessarilytrue that systems with high rates of energy consumption always make betterinsulators. See also the three-dimensional plot of C, D, and J shown in Fig. 3 fora clearer picture.
In addition to the general trend of increasing energy consumption as competi-tion effect or distortion decrease, we find that a strong local energy “optimality”property is satisfied. We observe numerically that any small change in the pa-rameters Xtot and Ytot which leads to a decrease in both the competition effectand distortion, must be accompanied by an increase in the rate of energy con-sumption, excluding jumps from one side of the “fold” to the other. This localproperty complements the global observation that Pareto optimal points are as-sociated with the regions of parameter space with the highest rates of energyconsumption.
While we find Pareto optimal choices of the concentrations Xtot and Ytot spanseveral orders of magnitude, the ratio of Xtot to Ytot is close to unity for nearlyall Pareto optima (see Fig. 4). A small number Pareto optimal points are foundwith very different total concentrations of X and Y, but these points appear tobe due to boundary effects from the sampling of a finite region of the parameterspace. Indeed, we have argued that the insulator should perform best when (2.13)is satisfied. For the choice of parameters considered here, this gives Xtot/Ytot =(k2K1)/(k1K2) = 1. Tests with randomized parameters confirm that (2.13) givesa good estimate of the relationship between Xtot and Ytot for Pareto optimalpoints (see Fig. 5 for an example).
We also observe that there is a lower bound on the concentration of Xtot and Ytot
for optimal insulation. Though we tested ranges of concentrations from 10 to10000, the first optimal points only appear when the concentrations are around500, several times larger than the concentration of the target p and much, muchlarger than the concentration of Z. Interestingly, the insulator consumes lessenergy for these first Pareto optimal parameter choices than at higher concentra-tions, and achieves the best measures of distortion with relatively low competitioneffect as well. This suggests that smaller concentrations may be generically fa-vored, particularly when energy constraints are important.
We conclude that the specification of Pareto optimality places few constraints onthe absolute concentrations Xtot and Ytot in the model, save for a finite lowerbound, but the performance of the insulator depends strongly on the ratio of thetwo concentrations. This observation connects with the work of Gutenkunst etal. [18], who noted “sloppy” parameter sensitivity for many variables in systemsbiology models, excepting some “stiff” combinations of variables which determinea model’s behavior.
For comparison, we indicate the values of D and C of the simpler direct couplingarchitecture, with no insulator, by a white dot in Fig. 2. While many choicesof parameters for the insulating PD cycle, including most Pareto optimal points,lead to improvements in the distortion relative to that of the direct coupling sys-
12
Com
petit
ion
effe
ct(C
)
100
101
102
103
Distortion (D)
100
101
Energy
use(J
)
100
101
102
103
104
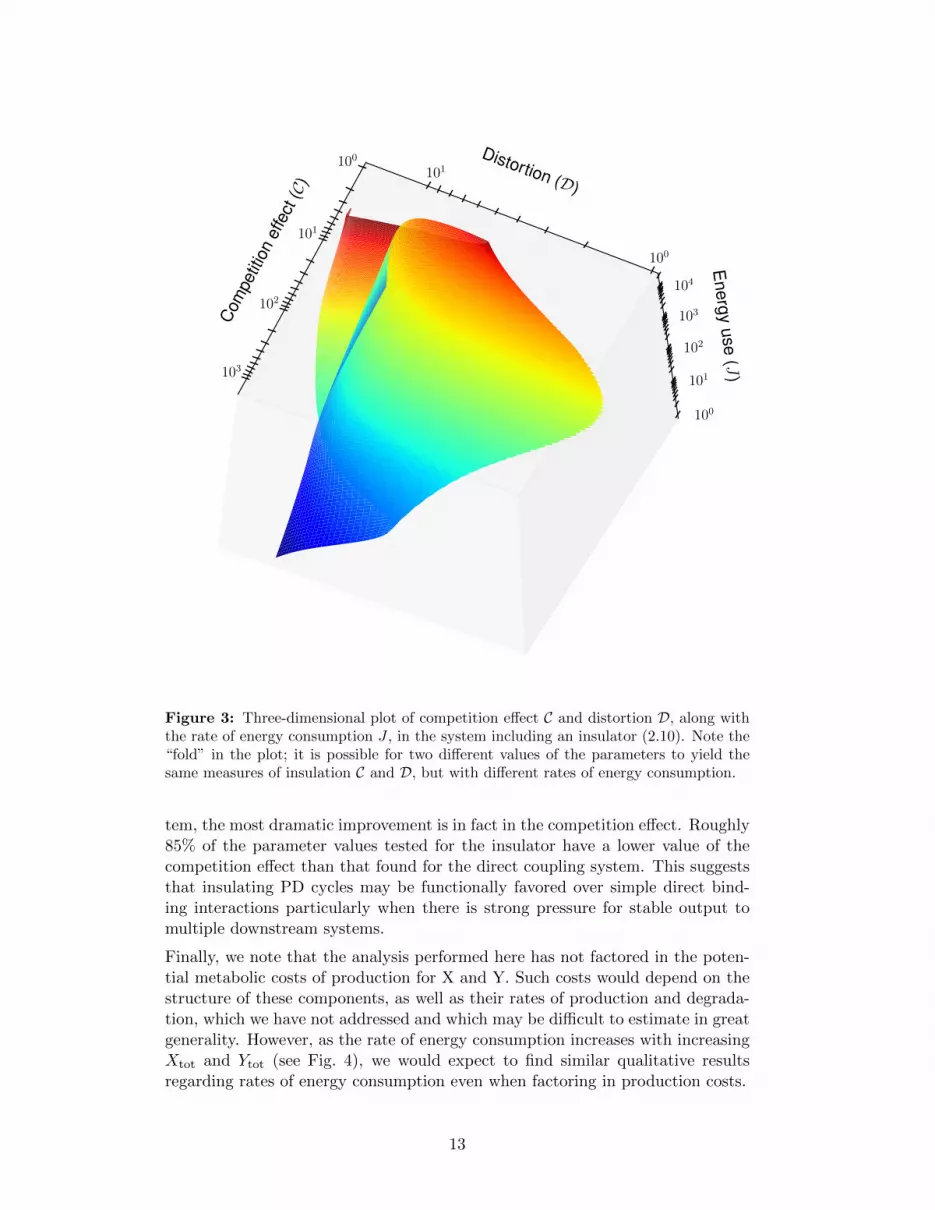
Figure 3: Three-dimensional plot of competition effect C and distortion D, along withthe rate of energy consumption J , in the system including an insulator (2.10). Note the“fold” in the plot; it is possible for two different values of the parameters to yield thesame measures of insulation C and D, but with different rates of energy consumption.
tem, the most dramatic improvement is in fact in the competition effect. Roughly85% of the parameter values tested for the insulator have a lower value of thecompetition effect than that found for the direct coupling system. This suggeststhat insulating PD cycles may be functionally favored over simple direct bind-ing interactions particularly when there is strong pressure for stable output tomultiple downstream systems.
Finally, we note that the analysis performed here has not factored in the poten-tial metabolic costs of production for X and Y. Such costs would depend on thestructure of these components, as well as their rates of production and degrada-tion, which we have not addressed and which may be difficult to estimate in greatgenerality. However, as the rate of energy consumption increases with increasingXtot and Ytot (see Fig. 4), we would expect to find similar qualitative resultsregarding rates of energy consumption even when factoring in production costs.
13

103 104
Xtot
103
104
Yto
t
Figure 4: Pareto optimal points are typically those which strike a balance between thetotal concentrations of X and Y, as indicated in (2.13). Scatter plot of the Pareto optimalsets of parameters Xtot and Ytot corresponding to those in Figs. 2-3. The backgroundline shows (k1/K1)Xtot = (k2/K2)Ytot for comparison. Each point is colored accordingto the rate of energy consumption for that choice of parameters. Increases in either Xtot
or Ytot result in increased energy expenditure. Due to the limited range of parameterswhich could be tested, some Pareto optima lie along the boundaries of the parameterspace (see the “elbow” in the scatter points at the top of the plot).
103 104
Xtot
103
104
Yto
t
Figure 5: Scatter plot of the Pareto optimal sets of parameters Xtot andYtot for an insulator using the randomly shifted parameters. The backgroundline shows (k1/K1)Xtot = (k2/K2)Ytot for comparison. Parameters used arek(t) = 0.0137 (1 + sin (0.005 t)), δ = 0.0188, α1 = 0.0107, β1 = 0.0102, α2 = 5.31,β2 = 16.42, k1 = k2 = 10, kon = 5.19, koff = 12.49, and ptot = 100. Each point is coloredaccording to the rate of energy consumption for that choice of parameters (arbitraryscale, different from that of Figs. 2-4).
14

4 Discussion
A very common motif in cell signaling is that in which a substrate is ultimatelyconverted into a product, in an “activation” reaction triggered or facilitated byan enzyme, and, conversely, the product is transformed back (or “deactivated”)into the original substrate, helped on by the action of a second enzyme. This typeof reaction, often called a futile, substrate, or enzymatic cycle, appears in manysignaling pathways: GTPase cycles [19], bacterial two-component systems andphosphorelays [20, 21] actin treadmilling [22], as well as glucose mobilization [23],metabolic control [24], cell division and apoptosis [25], and cell-cycle checkpointcontrol [26]. See [27] for many more references and discussion.
In this work we explored the connection between the ability of energy con-suming enzymatic futile cycles to insulate biochemical signaling pathways fromimpedance and competition effects, and their rate of energy consumption. Ourhypothesis was that better insulation requires more energy consumption. Wetested this hypothesis through the computational analysis of a simplified physi-cal model of covalent cycles, using two innovative measures of insulation, referredto as competition effect and distortion, as well as a new way to characterize op-timal insulation through the balancing of these two measures in a Pareto sense.Our results indicate that indeed better insulation requires more energy.
Testing a wide range of parameters, we identified Pareto optimal choices whichrepresent the best possible ways to compromise two competing objectives: theminimization of distortion and of the competition effect. The Pareto optimalpoints share several interesting features. First, they consume large amounts ofenergy, consistent with our hypothesis that better insulation requires greater en-ergy consumption. Second, the total substrate and phosphatase concentrationsXtot and Ytot typically satisfy (2.11) (in natural units, this implies Xtot ∼ Ytot).There is also a minimum concentration required to achieve a Pareto optimal solu-tion; arbitrarily low concentrations do not yield optimal solutions. Interestingly,insulators with Pareto optimal choices of parameters close to the minimum con-centration also expend the least amount of energy, compared to other parameterchoices on the Pareto front, and have the least distortion while still achievingsmall competition effect. This suggests that these points near the minimum con-centration might be generically favored, particularly when energy constraints areimportant.
Many reasons have been proposed for the existence of futile cycles in nature, suchas signal amplification, increased sensitivity, and “analog to digital” conversionof help in decision-making. An alternative, or at least complementary, possibleexplanation [3] lies in the capabilities of such cycles to provide insulation, thusenabling a “plug and play” interconnection architecture that might facilitate evo-lution. Our results suggest that better insulation requires a higher energy cost,so that a delicate balance may exist between, on the one hand, the ease of adap-tation through creation of new behaviors by adding targets to existing pathways,and on the other hand, the metabolic costs necessarily incurred in not affectingthe behavior of existing processes.
15

References
[1] D.A. Lauffenburger. Cell signaling pathways as control modules: complexityfor simplicity? Proc Natl Acad Sci USA, 97:5031–5033, 2000.
[2] L.H. Hartwell, J.J. Hopfield, S. Leibler, and A.W. Murray. From molecularto modular cell biology. Nature, 402:47–52, 1999.
[3] D. Del Vecchio, A. J. Ninfa, and E. D Sontag. Modular cell biology: retroac-tivity and insulation. Molecular Systems Biology, 4:161, 2008.
[4] J. Saez-Rodriguez, A. Kremling, and E.D. Gilles. Dissecting the puzzle of life:modularization of signal transduction networks. Computers and ChemicalEngineering, pages 619–629, 2005.
[5] D. Del Vecchio and E.D. Sontag. Engineering principles in bio-molecularsystems: From retroactivity to modularity. European Journal of Control,15:389–397, 2009.
[6] E.D. Sontag. Modularity, retroactivity, and structural identification. InH. Koeppl, G. Setti, M. di Bernardo, and D. Densmore, editors, Design andAnalysis of Biomolecular Circuits, pages 183–202. Springer-Verlag, 2011.
[7] A. C. Ventura, P. Jiang, L. Van Wassenhove, D. Del Vecchio, S. D. Merajver,and A. J. Ninfa. Signaling properties of a covalent modification cycle arealtered by a downstream target. Proc Natl Acad Sci USA, 107:10032–10037,2010.
[8] P. Jiang, A. C. Ventura, E. D. Sontag, S. D. Merajver, A. J. Ninfa, andD. Del Vecchio. Load-induced modulation of signal transduction networks.Science Signaling, 4(194):ra67–ra67, October 2011.
[9] G. Lan, P. Sartori, S. Neumann, V. Sourjik, and Y. Tu. The energy-speed-accuracy tradeoff in sensory adaptation. Nat Phys, 8(5):422–428, May 2012.
[10] O. Shoval, H. Sheftel, G Shinar, Y. Hart, O Ramote, A. Mayo, E Dekel,K Kavanagh, and Uri Alon. Evolutionary trade-offs, Pareto optimality, andthe geometry of phenotype space. Science, 336(6085):1157–1160, 2012.
[11] U. Alon. An Introduction to Systems Biology: Design Principles of BiologicalCircuits. Chapman & Hall, 2006.
[12] T. Riley, E.D. Sontag, P. Chen, and A. Levine. The transcriptional regula-tion of human p53-regulated genes. Nature Reviews Molecular Cell Biology,9:402–412, 2008.
[13] H.W. Adolph, P. Zwart, R. Meijers, I. Hubatsch, M. Kiefer, V. Lamzin,and E. Cedergren-Zeppezauer. Structural basis for substrate specificitydifferences of horse liver alcohol dehydrogenase isozymes. Biochemistry,39(42):12885–12897, 2000.
16

[14] B. N. Kholodenko, G. C. Brown, and J. B. Hoek. Diffusion control of pro-tein phosphorylation in signal transduction pathways. Biochem. J., 350 Pt3:901907, 2000.
[15] J. J. Hornberg, B. Binder, B. Schoeber, F. J. Bruggeman, R. Heinrich, andH. V. Westerhoff. Control of MAPK signalling: from complexity to whatreally matters. Oncogene, 24:55335542, 2005.
[16] A. Ciliberto, F. Capuani, and J. J. Tyson. Modeling networks of coupledenzymatic reactions using the total quasi-steady state approximation. PLoSComput. Biol., 3(3):e45, 2007.
[17] J. A. Borghans, R. J. de Boer, and L. A. Segel. Extending the quasi-steadystate approximation by changing variables. Bull. Math. Biol., 58(1):4363,1996.
[18] R.N. Gutenkunst, J.J. Waterfall, F.P. Casey, K.S. Brown, C.R. Myers, andJ.P. Sethna. Universally sloppy parameter sensitivities in systems biologymodels. PLoS Comput Biol, 3(10):e189, 10 2007.
[19] S. Donovan, K.M. Shannon, and G. Bollag. GTPase activating proteins:critical regulators of intracellular signaling. Biochim. Biophys Acta, 1602:23–45, 2002.
[20] J.J. Bijlsma and E.A. Groisman. Making informed decisions: regulatoryinteractions between two-component systems. Trends Microbiol, 11:359–366,2003.
[21] A.D. Grossman. Genetic networks controlling the initiation of sporulationand the development of genetic competence in bacillus subtilis. Annu RevGenet., 29:477–508, 1995.
[22] H. Chen, B.W. Bernstein, and J.R. Bamburg. Regulating actin filamentdynamics in vivo. Trends Biochem. Sci., 25:19–23, 2000.
[23] G. Karp. Cell and Molecular Biology. Wiley, 2002.
[24] L. Stryer. Biochemistry. Freeman, 1995.
[25] M.L. Sulis and R. Parsons. PTEN: from pathology to biology. Trends CellBiol., 13:478–483, 2003.
[26] D.J. Lew and D.J. Burke. The spindle assembly and spindle position check-points. Annu Rev Genet., 37:251–282, 2003.
[27] M. Samoilov, S. Plyasunov, and A.P. Arkin. Stochastic amplification andsignaling in enzymatic futile cycles through noise-induced bistability withoscillations. Proc Natl Acad Sci USA, 102:2310–2315, 2005.
17