Embed Size (px)
Citation preview
Journal of English Education and Teaching (JEET) Vol.1. No.1.2017 48
THE EFFECT OF USING GRAPHIC ORGANIZER TO STUDENTS’ WRITING ABILITY
Kiki JuniartiUniversity of Bengkulu
Dedi SofyanUniversity of Bengkulu
KasmainiUniversity of Bengkulu
ABSTRACT
This study aimed at investigating the effect of using Graphic Organizer to students’ writing ability. Thisresearch was designed as a quasi-experimental research. The population of this research were all eleventhgrade students at SMA N 1 Bengkulu Utara. The sample of this research was chosen by purposive samplingtechnique, so there were two science classes which consist of 52 students as the sample. Pre-test and post-test were involved as the instrument of this research. The first group was as experimental group taught bygraphic organizer technique and the second group was as control group taught by conventional technique.The pre test was given to both experimental and control groups at the beginning, treatments were given insix meetings, and post test given at the end of the term. The data were analyzed by using t-test formula.From the calculation, the researcher found that the t-test value was 5.00, the degree of freedom value was50, and the t-table was 3.49. Since t-test was higher than t-table (5.00 > 3.49), it meant that alternativehypothesis (H1) was accepted. Thus, it could be concluded that the use of graphic organizer was effective to
students’ writing ability in term of content, organization, and language use.
Keywords: Graphic Organizer, Writing Ability
ABSTRAK
Penelitian ini bertujuan untuk meneliti pengaruh dari penggunaan Organizer Grafis terhadap kemampuanmenulis siswa. Penelitian ini dirancang sebagai penelitian kuasi eksperimen. Populasi penelitian ini adalahseluruh siswa kelas sebelas di SMA N 1 Bengkulu Utara. Sampel dalam penelitian ini dipilih menggunakanteknik sampel berdasarkan tujuan, sehingga terdapat dua kelas IPA yang berjumlah 52 siswa sebagai sampel.Pre-test dan post-test digunakan sebagai instrumen dari penelitian ini. Kelompok pertama dalam penelitianini dijadikan sebagai kelompok eksperimen yang diajar menggunakan teknik organizer grafis dan kelompokkedua dijadikan sebagai kelompok kontrol yang diajar menggunakan teknik biasa. Pre-test diberikan kepadakedua kelompok baik eksperimen maupun kontrol diawal pertemuan, perlakuan yang diberikan sebanyakenam kali, dan post-test yang diberikan diakhir proses penelitian. Data hasil penelitian dianalisa denganmenggunakan rumus t-test. Dari perhitungan tersebut, peneliti memperoleh bahwa nilai t-test adalah 5.00,derajat kebebasan 50, dan nilai tabel distribusi 3.49. Karena hasil t-test lebih tinggi dari tingkat t-tabel (5.00 >3.49), maka hipotesis alternatif (H1) diterima. Oleh karena itu, dapat disimpulkan bahwa penggunaanOrganizer Grafis mempengaruhi kemampuan menulis siswa dalam segi isi, organisasi, dan penggunaanbahasa.
Kata kunci: Organizer Grafis, Kemampuan Menulis
Journal of English Education and Teaching (JEET) Vol.1. No.1.2017 49
INTRODUCTION
One of the important skills in English besidelistening, speaking, and reading is writing.Students should master writing skill if they wantto be successful in education, because it hasimportant role not only in conveyinginformation, but also in expressing theirthoughts or ideas. According to Cohen and Reil(1989), writing is a communicative act, a way ofsharing observation, information, thoughts, orideas with ourselves and others. It means thatby writing students can share their thoughts,ideas, and information to the others.
However, writing is a productive skillwhich is difficult to be mastered. Unzueta (2009)points out that “Students have limited writingabilities and lacked of knowledge to writecompositions that convey their thoughts andideas". It can be seen from the results of writingtasks of the most Indonesian students whichwere still far from the expected goals inteaching (Hestri, 2013).
Teaching writing in Indonesia still usestraditional ways. Some teachers still asked thestudents to memorize tenses, grammar, andgeneric structure of a text (Winda, 2014). Aftermemorizing, the teachers asked the students towrite a short paragraph of the text. If thestudents do not have enough time to write it atthe school, the teachers would ask them tocontinue the test at home as homework. Thesame phenomena often occur in SMA N 1Argamakmur. By applying the same procedures,a teacher hopes that the students will get goodscores of their writing tasks, but in fact thestudents’ score were still far from the expectedgoals. This might happen because the studentsdo not understand how to convey their thoughtsand ideas in the text.
To overcome the difficulties in teachingwriting, teacher can apply some techniques forwriting, for example: free writing, stop and dare,four square, picture series, picture animations,graphic organizers, and so on. Some of thosetechniques have ever been studied in Indonesia.
A study by Juitania (2013) investigated theeffect of using Four Square writing methods onstudents’ writing skill for grade eleven of SMAPLUS PGRI Cibinong. The result of this studyshowed that the technique was effective toimprove the students’ writing skill of analyticalexposition text in term of content, vocabulary,and language use.
Kurniawan (2014) investigated the effectof using stop and dare strategy in teachingwriting hortatory exposition for Senior HighSchool students in Padang. The results of thestudy indicate that the strategy was an effectiveway in teaching writing and helps the studentsto develop hortatory text in a good sequence.
The effect of using graphic organizers onstudents’ writing ability had also been observedby Tayib (2015). The results of this study provedthat the graphic organizers model was useful toincrease the students’ writing ability and hadpositive impacts on their attitudes toward thisskill. The results suggest that graphic organizercan be an effective support in teaching writingfor learners of English as a foreign language.
Graphic organizer is believed to be anappropriate technique which consists of variouspatterns that can help the students to organizetheir ideas in writing. The students can chooseamong the various patterns which suitable tocomprehend the text. Some studies over theworld, such as Brown (2011), Dewi (2013),Juitania (2013), Febridayani (2013), Lanchaster(2013), Noviansari (2014), and Febrianza (2014)state that by using graphic organizer, thestudents can convey their thoughts and ideas inthe correct sequential order. They can developtheir thoughts and ideas by guidance of thetechnique. In general, there are some types ofgraphic organizer, namely: network tree, spidermap, cycle map, fishbone, cloud/cluster, clock,venn diagram, star, vocabulary map, and piechart.
Miller (2011) states that graphic organizeris served as visual display of ideas that helplearners to organize their thoughts and apply
Journal of English Education and Teaching (JEET) Vol.1. No.1.2017 50
their thinking skills to the content in a moreorderly manner. Miller further adds that graphicorganizers "often occur in the form of key wordsand allow students to be more focus on themeaning rather than the format of completesentence structure". The students can be morefocus on the meaning of the key words ratherthan on the form of the graphic that they used.It means that whatever the graphic that is usedby the students, they understand about the keywords’ meaning which they put on the graphic.
According to Kajder (2005), graphicorganizer (GO) can help the students tounderstand and analyze the content of the textbased on the appropriate steps. The organizerscan help the students to identify the main ideaand to support the details of a text, for examplehortatory exposition text. However, theresearcher has not found yet a study about theuse of graphic organizer in teaching writinghortatory text in Indonesia. Therefore, theresearcher tries to conduct this research to findout whether this technique will give effect ornot in students writing hortatory text.
In addition, there are some advantages ofusing graphic organizer. Ellis (2004) argues thatthere are three benefits that students can getfrom graphic organizer. First, graphic organizercan help students to separate what is importantto know from what might be interesting, but notessensial information. Second, students canaddress the content at more sophisticated orcomplex level. Third, students are more likely tobe strategic learners.
Writing is an alternative way to composeour thoughts and ideas in written form. It is acomplex skill because it has some requirementsthat will produce a good paragraph throughthinking and organizing. Boardman (2002) whosays that writing is a continuous process ofthinking and organizing, re-thinking, and re-organizing. Those processes can help a writer toproduce the good paragraph.
Due to the fact that writing is animportant skill which is difficult to be mastered,
this study has been conducted as anexperimental study of students’ writing abilityby giving some treatments used graphicorganizer technique for experimental students.Furthermore, the choosing of the sample of thestudents was by consideration that they havesome problems in writing skill. So that grade XIIPA 1 and XI IPA 5 students were considered asappropriate sample for this study entitled “TheEffect of Using Graphic Organizer to Students’Writing Ability”. At the end, this study arrivedinto the aim of explaining results which answerthe research questions which were laid in thisstudy about whether any effect or not by usinggraphic organizer technique in writing skill.
METHOD
The method which used in this study wasquasi-experimental design which meant thatthere was a condition could not fulfil in doingthe true experiment. Quasi-experiment includesassignment, but not random assignment ofparticipants to groups (Creswell, 2002). Thisstudy fulfilled one condition which was therewere two groups, namely: experimental andcontrol groups (Griffee, 2012). The experimentalgroup taught by applying graphic organizertechnique and the control group taught byapplying conventional technique. In addition,this study applied pre- and post- test approachin this design in order to know whether therewas any effect of this study or not.
Table.1.Pre-Test and Post-Test Design
Select ControlGroup
Pretest NoTreatment
Postest
SelectExperimentalGroup
Pretest ExperimentalTreatment
Postest
The population of this research was allmembers of grade eleven students in SMA N 1Bengkulu Utara. There were 10 classes ofeleventh grade which was divided into 3programs; they were 6 science classes, 3 socialclasses, and 1 language class. The overallpopulation was about 239 students. By
Journal of English Education and Teaching (JEET) Vol.1. No.1.2017 51
conducting purposive sampling technique, 2classes of eleventh grade students were chosenas the sample of this study. The sample waschosen using purposive sampling techniquebecause it was chosen based on particularconsideration (Sugiyono, 2011). It was shown bythe result of a simple writing test which wasgiven in the previous observation. The resultshowed that almost students’ scores of thoseclasses were far from the standard score (75).Further, an English teacher of SMA N 1 BengkuluUtara also recommended for taking thoseclasses as the sample. Therefore, grade XI IPA 1was chosen as experimental group and grade XIIPA 5 was chosen as control group.
The instrument for collecting the data inthis study used a writing test as the maininstrument. The tests were provided into twocategories, pre-test and post-test. The testconsisted of directions, three topics andinformation on how the students’ writing areassessed. From those topics, the students choseone topic which interested for them. The topicsthat were given by the researcher were sometopics which relate with students’ real life. Tocheck validity and reliability, the instrument wasvalidated the content of the test to the expertjudgement then tried out to 20 students whohave same characteristics with the sample ofstudy. They were grade XI IPA 2 students whoalso have difficulties in writing skill. The result oftry out was analyzed through the StasticalPackage for Social Science (SPSS. 21), in order toknow the reliability of the test. The resultshowed that the instrument had high reliabilityin which the value of Cronbach Alfa was morethan 0.8.
This study used an analytical scoring rubricfor scoring. The components in the writing textcould be scored separately by using this rubric,such as Content, Organization, Vocabulary,Language Use, and Mechanics (Weigle, 2009).Because this study focused on the graphicorganizer usage to help students in deliveringtheir ideas through written, thus this study only
focused on three elements. They wereorganization, content, and language use.Further, the scores started from 1 to 4 scales.Then the students’ writing score would becalculated by using this following formula:
N = (S x 8) + 4
Where:N: students’ writing scoreS: students’ writing score in analytical scoring
There were three procedures ofconducting this research: pre-test, treatment,and pos-test. A pre-test was given to theexperimental and control groups before thetreatment in order to know the capability ofthose groups. The treatments were conductedby applying graphic organizer technique inexperimental group, while conventionaltechnique for control group. The post-test wasgiven to both groups after the treatments werecompleted, in order to know whether anyimprovement of students’ ability in writing skillor not.
The data were analyzed using T-Testformula. It was used in order to know thesignificance results between experimental andcontrol groups. The formula was shown asfollows:
t =ெ ௫ିெ ௬
ට൴ೣమశ మ
(ಿೣశಿ)ష మ൸ቘ
భ
ಿೣା
భ
ಿ
where:
Mx: the mean of experimental groupMy = the mean of control groupdx2 = standard deviation of experimental groupdy2 = standard deviation of control groupNx = the total number of experimental groupNy = the total number of control group
Journal of English Education and Teaching (JEET) Vol.1. No.1.2017 52
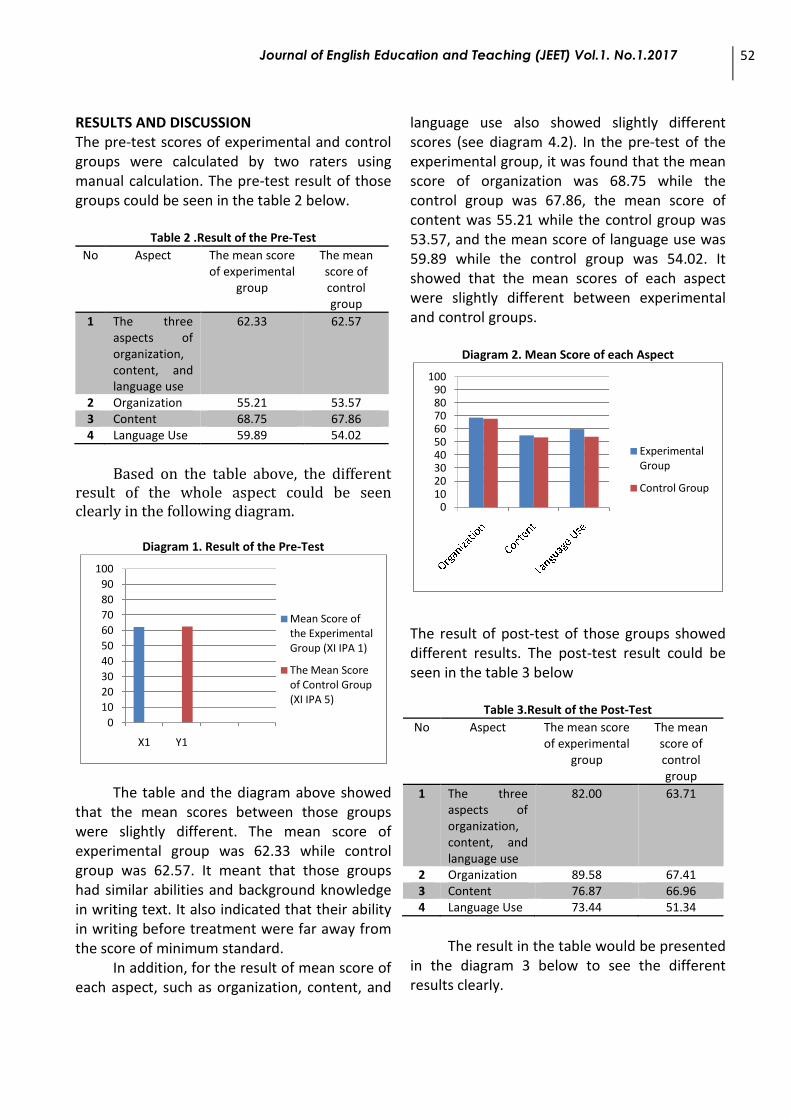
RESULTS AND DISCUSSIONThe pre-test scores of experimental and controlgroups were calculated by two raters usingmanual calculation. The pre-test result of thosegroups could be seen in the table 2 below.
Table 2 .Result of the Pre-Test
No Aspect The mean scoreof experimental
group
The meanscore ofcontrolgroup
1 The threeaspects oforganization,content, andlanguage use
62.33 62.57
2 Organization 55.21 53.573 Content 68.75 67.864 Language Use 59.89 54.02
Based on the table above, the differentresult of the whole aspect could be seenclearly in the following diagram.
Diagram 1. Result of the Pre-Test
The table and the diagram above showedthat the mean scores between those groupswere slightly different. The mean score ofexperimental group was 62.33 while controlgroup was 62.57. It meant that those groupshad similar abilities and background knowledgein writing text. It also indicated that their abilityin writing before treatment were far away fromthe score of minimum standard.
In addition, for the result of mean score ofeach aspect, such as organization, content, and
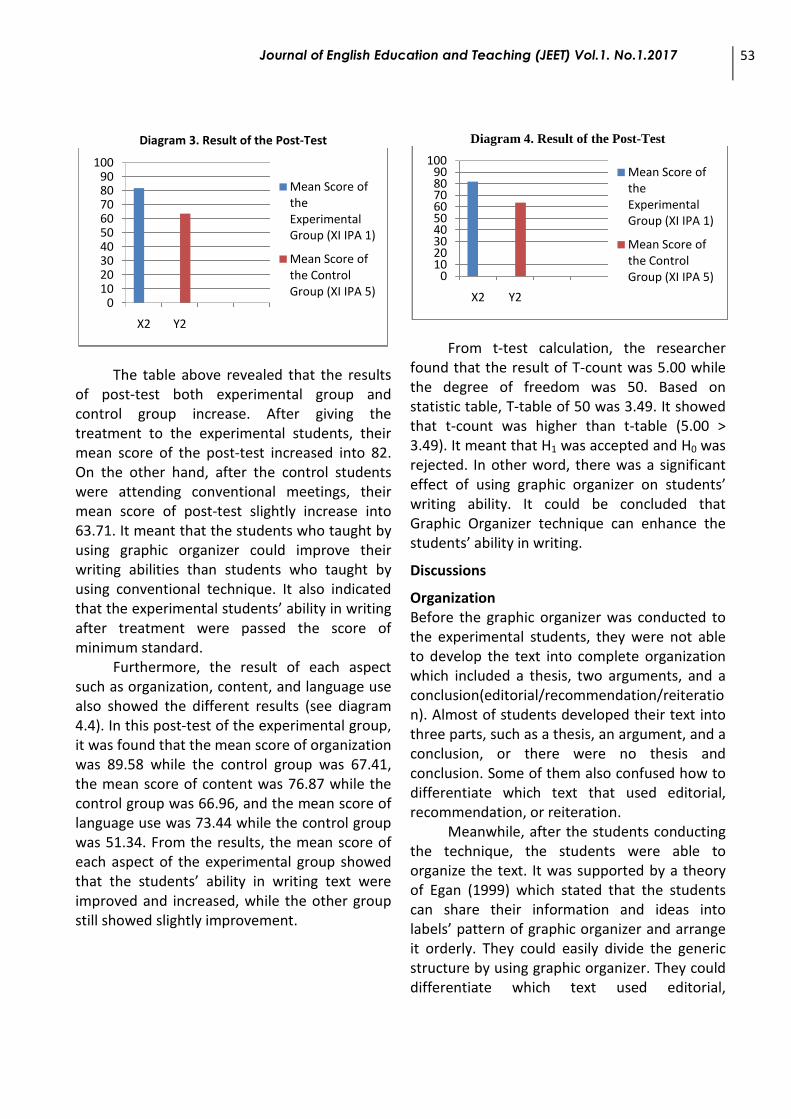
language use also showed slightly differentscores (see diagram 4.2). In the pre-test of theexperimental group, it was found that the meanscore of organization was 68.75 while thecontrol group was 67.86, the mean score ofcontent was 55.21 while the control group was53.57, and the mean score of language use was59.89 while the control group was 54.02. Itshowed that the mean scores of each aspectwere slightly different between experimentaland control groups.
Diagram 2. Mean Score of each Aspect
The result of post-test of those groups showeddifferent results. The post-test result could beseen in the table 3 below
Table 3.Result of the Post-Test
No Aspect The mean scoreof experimental
group
The meanscore ofcontrolgroup
1 The threeaspects oforganization,content, andlanguage use
82.00 63.71
2 Organization 89.58 67.413 Content 76.87 66.964 Language Use 73.44 51.34
The result in the table would be presentedin the diagram 3 below to see the differentresults clearly.
0
10
20
30
40
50
60
70
80
90
100
X1 Y1
Mean Score ofthe ExperimentalGroup (XI IPA 1)
The Mean Scoreof Control Group(XI IPA 5)
0102030405060708090
100
ExperimentalGroup
Control Group
Journal of English Education and Teaching (JEET) Vol.1. No.1.2017 53
Diagram 3. Result of the Post-Test
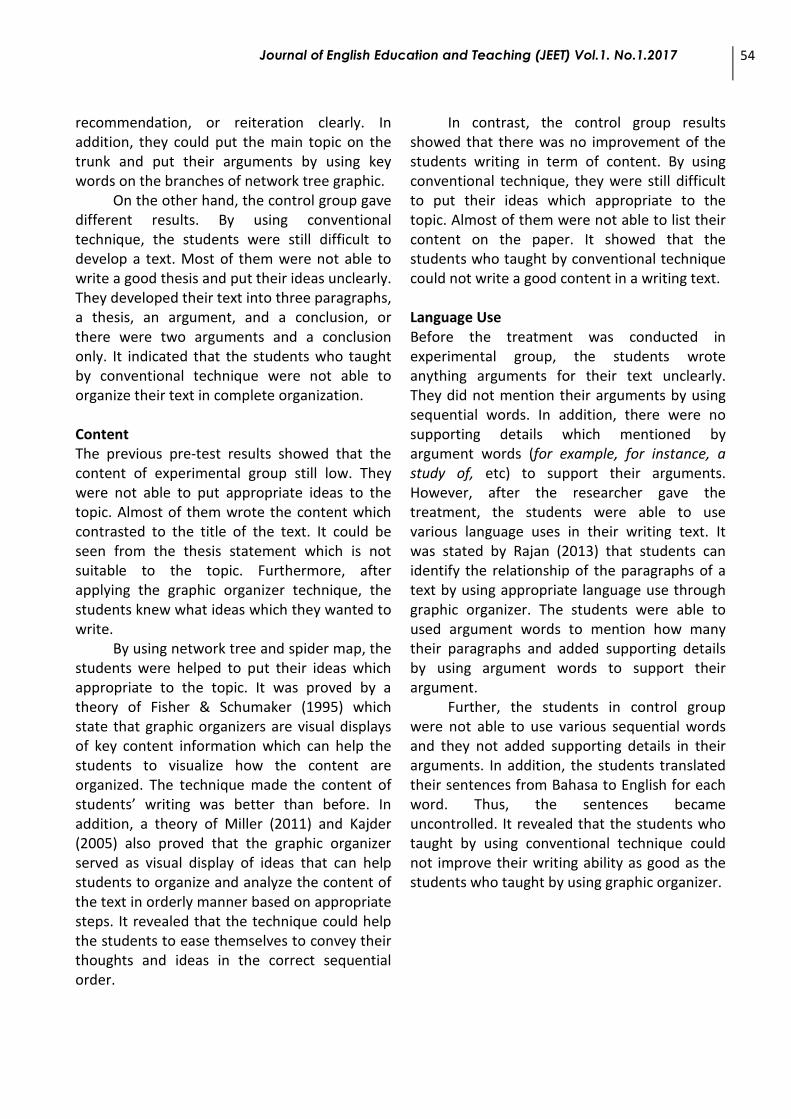
The table above revealed that the resultsof post-test both experimental group andcontrol group increase. After giving thetreatment to the experimental students, theirmean score of the post-test increased into 82.On the other hand, after the control studentswere attending conventional meetings, theirmean score of post-test slightly increase into63.71. It meant that the students who taught byusing graphic organizer could improve theirwriting abilities than students who taught byusing conventional technique. It also indicatedthat the experimental students’ ability in writingafter treatment were passed the score ofminimum standard.
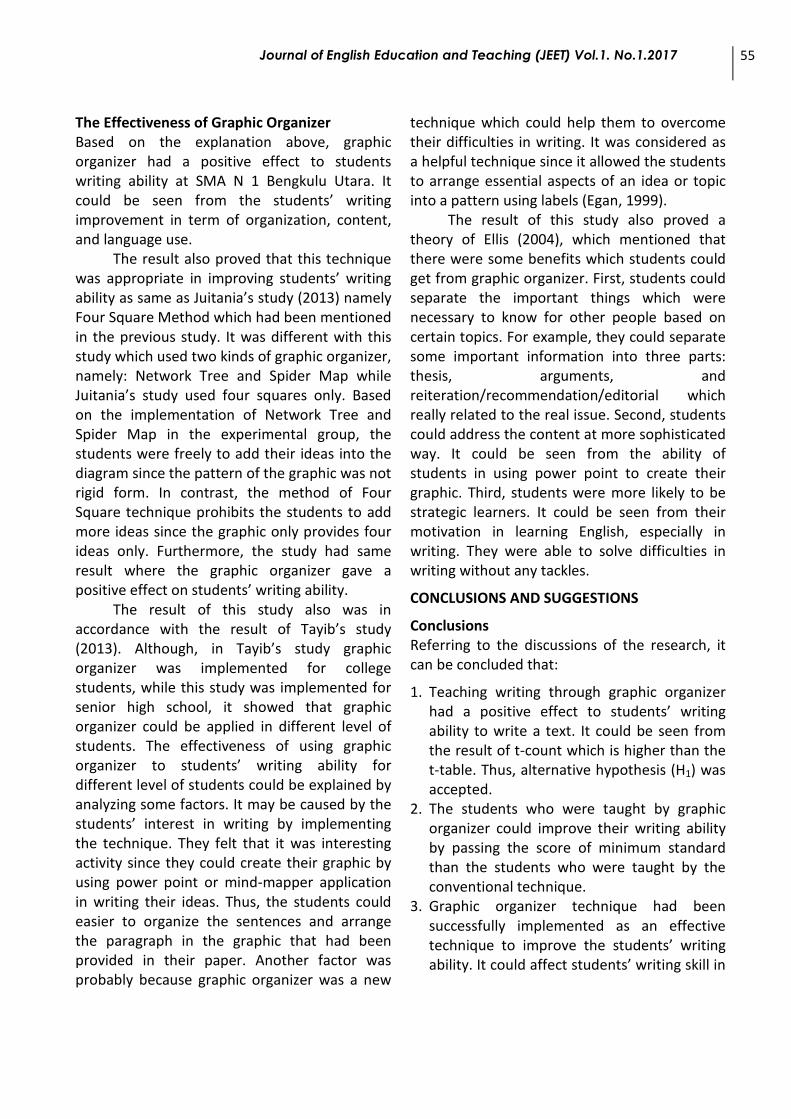
Furthermore, the result of each aspectsuch as organization, content, and language usealso showed the different results (see diagram4.4). In this post-test of the experimental group,it was found that the mean score of organizationwas 89.58 while the control group was 67.41,the mean score of content was 76.87 while thecontrol group was 66.96, and the mean score oflanguage use was 73.44 while the control groupwas 51.34. From the results, the mean score ofeach aspect of the experimental group showedthat the students’ ability in writing text wereimproved and increased, while the other groupstill showed slightly improvement.
Diagram 4. Result of the Post-Test
From t-test calculation, the researcherfound that the result of T-count was 5.00 whilethe degree of freedom was 50. Based onstatistic table, T-table of 50 was 3.49. It showedthat t-count was higher than t-table (5.00 >3.49). It meant that H1 was accepted and H0 wasrejected. In other word, there was a significanteffect of using graphic organizer on students’writing ability. It could be concluded thatGraphic Organizer technique can enhance thestudents’ ability in writing.
Discussions
OrganizationBefore the graphic organizer was conducted tothe experimental students, they were not ableto develop the text into complete organizationwhich included a thesis, two arguments, and aconclusion(editorial/recommendation/reiteration). Almost of students developed their text intothree parts, such as a thesis, an argument, and aconclusion, or there were no thesis andconclusion. Some of them also confused how todifferentiate which text that used editorial,recommendation, or reiteration.
Meanwhile, after the students conductingthe technique, the students were able toorganize the text. It was supported by a theoryof Egan (1999) which stated that the studentscan share their information and ideas intolabels’ pattern of graphic organizer and arrangeit orderly. They could easily divide the genericstructure by using graphic organizer. They coulddifferentiate which text used editorial,
0102030405060708090
100
X2 Y2
Mean Score oftheExperimentalGroup (XI IPA 1)
Mean Score ofthe ControlGroup (XI IPA 5)
0102030405060708090
100
X2 Y2
Mean Score oftheExperimentalGroup (XI IPA 1)
Mean Score ofthe ControlGroup (XI IPA 5)
Journal of English Education and Teaching (JEET) Vol.1. No.1.2017 54
recommendation, or reiteration clearly. Inaddition, they could put the main topic on thetrunk and put their arguments by using keywords on the branches of network tree graphic.
On the other hand, the control group gavedifferent results. By using conventionaltechnique, the students were still difficult todevelop a text. Most of them were not able towrite a good thesis and put their ideas unclearly.They developed their text into three paragraphs,a thesis, an argument, and a conclusion, orthere were two arguments and a conclusiononly. It indicated that the students who taughtby conventional technique were not able toorganize their text in complete organization.
ContentThe previous pre-test results showed that thecontent of experimental group still low. Theywere not able to put appropriate ideas to thetopic. Almost of them wrote the content whichcontrasted to the title of the text. It could beseen from the thesis statement which is notsuitable to the topic. Furthermore, afterapplying the graphic organizer technique, thestudents knew what ideas which they wanted towrite.
By using network tree and spider map, thestudents were helped to put their ideas whichappropriate to the topic. It was proved by atheory of Fisher & Schumaker (1995) whichstate that graphic organizers are visual displaysof key content information which can help thestudents to visualize how the content areorganized. The technique made the content ofstudents’ writing was better than before. Inaddition, a theory of Miller (2011) and Kajder(2005) also proved that the graphic organizerserved as visual display of ideas that can helpstudents to organize and analyze the content ofthe text in orderly manner based on appropriatesteps. It revealed that the technique could helpthe students to ease themselves to convey theirthoughts and ideas in the correct sequentialorder.
In contrast, the control group resultsshowed that there was no improvement of thestudents writing in term of content. By usingconventional technique, they were still difficultto put their ideas which appropriate to thetopic. Almost of them were not able to list theircontent on the paper. It showed that thestudents who taught by conventional techniquecould not write a good content in a writing text.
Language UseBefore the treatment was conducted inexperimental group, the students wroteanything arguments for their text unclearly.They did not mention their arguments by usingsequential words. In addition, there were nosupporting details which mentioned byargument words (for example, for instance, astudy of, etc) to support their arguments.However, after the researcher gave thetreatment, the students were able to usevarious language uses in their writing text. Itwas stated by Rajan (2013) that students canidentify the relationship of the paragraphs of atext by using appropriate language use throughgraphic organizer. The students were able toused argument words to mention how manytheir paragraphs and added supporting detailsby using argument words to support theirargument.
Further, the students in control groupwere not able to use various sequential wordsand they not added supporting details in theirarguments. In addition, the students translatedtheir sentences from Bahasa to English for eachword. Thus, the sentences becameuncontrolled. It revealed that the students whotaught by using conventional technique couldnot improve their writing ability as good as thestudents who taught by using graphic organizer.
Journal of English Education and Teaching (JEET) Vol.1. No.1.2017 55
The Effectiveness of Graphic OrganizerBased on the explanation above, graphicorganizer had a positive effect to studentswriting ability at SMA N 1 Bengkulu Utara. Itcould be seen from the students’ writingimprovement in term of organization, content,and language use.
The result also proved that this techniquewas appropriate in improving students’ writingability as same as Juitania’s study (2013) namelyFour Square Method which had been mentionedin the previous study. It was different with thisstudy which used two kinds of graphic organizer,namely: Network Tree and Spider Map whileJuitania’s study used four squares only. Basedon the implementation of Network Tree andSpider Map in the experimental group, thestudents were freely to add their ideas into thediagram since the pattern of the graphic was notrigid form. In contrast, the method of FourSquare technique prohibits the students to addmore ideas since the graphic only provides fourideas only. Furthermore, the study had sameresult where the graphic organizer gave apositive effect on students’ writing ability.
The result of this study also was inaccordance with the result of Tayib’s study(2013). Although, in Tayib’s study graphicorganizer was implemented for collegestudents, while this study was implemented forsenior high school, it showed that graphicorganizer could be applied in different level ofstudents. The effectiveness of using graphicorganizer to students’ writing ability fordifferent level of students could be explained byanalyzing some factors. It may be caused by thestudents’ interest in writing by implementingthe technique. They felt that it was interestingactivity since they could create their graphic byusing power point or mind-mapper applicationin writing their ideas. Thus, the students couldeasier to organize the sentences and arrangethe paragraph in the graphic that had beenprovided in their paper. Another factor wasprobably because graphic organizer was a new
technique which could help them to overcometheir difficulties in writing. It was considered asa helpful technique since it allowed the studentsto arrange essential aspects of an idea or topicinto a pattern using labels (Egan, 1999).
The result of this study also proved atheory of Ellis (2004), which mentioned thatthere were some benefits which students couldget from graphic organizer. First, students couldseparate the important things which werenecessary to know for other people based oncertain topics. For example, they could separatesome important information into three parts:thesis, arguments, andreiteration/recommendation/editorial whichreally related to the real issue. Second, studentscould address the content at more sophisticatedway. It could be seen from the ability ofstudents in using power point to create theirgraphic. Third, students were more likely to bestrategic learners. It could be seen from theirmotivation in learning English, especially inwriting. They were able to solve difficulties inwriting without any tackles.
CONCLUSIONS AND SUGGESTIONS
ConclusionsReferring to the discussions of the research, itcan be concluded that:
1. Teaching writing through graphic organizerhad a positive effect to students’ writingability to write a text. It could be seen fromthe result of t-count which is higher than thet-table. Thus, alternative hypothesis (H1) wasaccepted.
2. The students who were taught by graphicorganizer could improve their writing abilityby passing the score of minimum standardthan the students who were taught by theconventional technique.
3. Graphic organizer technique had beensuccessfully implemented as an effectivetechnique to improve the students’ writingability. It could affect students’ writing skill in
Journal of English Education and Teaching (JEET) Vol.1. No.1.2017 56
term of organization, content, and languageuse.
SuggestionsBased on the result of this research, somesuggestions are proposed as follow:1. For Writers
The writers can use this study as beneficialinformation as a reference to support themin order to overcome their difficulties indoing the same research, especially in writingskill.
2. For English teachers/ lecturersThe teachers/lecturers can apply thistechnique to help the students to improvetheir writing ability especially in writing skill.In addition, other techniques also can beapplied to help the students to improve theirability in learning English, not only for writingskill but also for other skills.
3. For studentsThe students can use graphic organizertechnique individually to improve theirwriting ability in other kinds of text. They canalso organize their daily activities by usingthis technique.
4. For further researchThe result of this research can givecontribution as a reference for furtherresearchers in doing research on othertechniques for writing improvement.
REFERENCES
Arikunto, S. (2010). Prosedur Penelitian (EdisiRevisi). Jakarta: Rineka Cipta.
Best, J. W. & Kahn, J. V. (2006). Research inEducation (10th edition). USA: PracticeHall.
Boardman, C. A. (2002). Writing toCommunicate: Paragraph and Essay.New York: Longman.
Brown, H. D. (2003). Language Assessment:Principles and Classroom Practices.California: Pearson Longman.
Brown, M. (2011). Effects of graphic organizerson students’ achievement in writingprocess. Online submission to ERIC.
Cohen, M., and M. Reil. “The Effect of DistanceAudience on Students’ Writing”,AmericanEducational ResearchJournal. Summer 1989.
Dewi, Arum Puspita. (2013). Using Four-SquareWriting Method to Improve EleventhGraders’ Ability of Writing HortatoryExposition Text at MAN KebonJombang. Universitas Negeri Malang.
Egan, M. (1999). Reflection on effective useofgraphic organizers. Journal ofAdolescent & Adult Literacy, 42, 641 –645. Retrieved fromhttp://proxy.library.eiu.edu.2052/login.aspx?direct=true&db=a9h&AN=1798553&site=ehost-live
Ellis, Edwin. (2004). Q&A: What’s the Big Dealabout Graphic Organizers?. Retrievedfrom www.GraphicOrganizers.com
Febrianza, Eka Fiddo. (2014). The Use of GraphicOrganizer to Improve the Eight YearsStudents’ Ability in Reading ADescriptive Text at MTs Assyafi’iyahGondang in Academic Year2013/2014.
Febridayani, Rina. (2013). Teaching WritingHortatory Exposition Text byCombining Mind Maps andHamburger Strategy at Senior HighSchool. STKIP PGRI Sumatera Barat.
Fisher, J. B., & Schumaker, J. B. (1995).Searching for validated inclusive
Journal of English Education and Teaching (JEET) Vol.1. No.1.2017 57
practices: A review of the literature.Focus on Exceptional Children, 28, 1 –20.
Graw, Mc. Graphic Organizer Library, HillComphanies. Inc Allright Reserved.Coyright © The McGraw – HillCompanies, Inc.
Griffee, D. T. (2012). An Introduction to SecondLanguage Methods Design and Data.USA: TESL – EJ.
Harmer. (2004). How to Teach Writing. Essex:Longman Pearson Education Limited.
Hestri, Suli. (2013). The Effectiveness of UsingPicture Series to Improve Students’Wriitng Ability in Recount Text at theEight – Grade Students of SMP N 33Purworejo in the Academic Year of2011/2012. MuhammadiyahUniversity of Purworejo.
ITC. (2014). Fishbone Diagram. ITC Publication.
Jayanti, F. G. (2014). The Effects of IntegratedReading – Writing Instruction onStudents Writing Ability AccrossStudents’ Cognitive Styles. UniversitasNegeri Malang.
Juitania. (2013). The Effect of Using Four SquareWriting Method on Students’ WritingSkill. UNPAK.
Kajder, S. (2005). Whole-class enquiry: LanguageArts. Learning &Leading withTechnology, 32, 52-55.
Kurniawan, Vicko. (2014). Teaching WritingHortatory Exposition Text by UsingSTOP and DARE Strategy to SeniorHigh Scholl Students. UniversitasPadang.
Lanchaster, Katie. (2013). Using GraphicOrganizers to Teach Writing. EasternIllinois University.
Microsoft. (2009). Project planning strategies-fishbone analysis microsoft partner inlearning. Microsoft Corporation.
Miller, S. (2011). Using graphic organizers toincrease writing performance.Unpublished MA thesis. StateUniversity of New York at Fredonia.
Noviansari, Dwi. (2014). The Use of GraphicOrganizer Method to Teach NarrativeText in Senior High School.Muhammadiyah University ofPurworejo.
O’Maley, J. M., & Pierce, L. V. 1996.Authenticassessment for English languagelearner.Boston: Addison-Wesley.
Santangelo, T. & Olinghouse, N. (2009). Effectivewriting instruction for students whohave writing difficulties. FocusExceptional Children, 42 (4), 1-2.Retrieved fromhttp:www.highbeam.com/doc/1G1-232814482.html
Sugiyono. (2011). Metode Penelitian Kuantitatif,Kualitatif dan R & D. Bandung,Alfabeta.
Tayib, A.M. (2015). The Effect of Using GraphicOrganizers on Writing. A Case Study ofPreparatory College Students atUmm-Al-Qura University, 3, 15 – 36.
Unzueta, C. (2009). The use of computer graphicorganizer. Unpublished Phd.Dissertation. Florida InternationalUniversity.
Weigle, S. C. (2009). Assessing Writing. UK:Cambridge University Press.
Winda. (2014). Kesalahan Fatal saat MengajarBahasa Inggris. Retrieved fromhttp://cepatbisainggris.com/2014/12/03/hindari-kesalahan-fatal-ini-saat-mengajar-bahasa-inggris/


![[Graphic Medicine] Rhetorics of the Visual: Graphic Medicine, Comics and its Affordances](https://img.dokumen.tips/doc/110x75/6361766940b666b8ec0ded6a/graphic-medicine-rhetorics-of-the-visual-graphic-medicine-comics-and-its-affordances.jpg)


