Embed Size (px)
Citation preview
Tectono-stratigraphic evolution of the
Mesozoic continental margins
of the Central Atlantic
Max Anthony Casson
A thesis submitted to the University of Manchester
for the degree of Doctor of Philosophy (Ph.D.)
in the Faculty of Science and Engineering
2020
School of Earth & Environmental Science

1
TABLE OF CONTENTS
LIST OF FIGURES ...................................................................................................................................................... 5
LIST OF TABLES ...................................................................................................................................................... 12
ABBREVIATIONS ..................................................................................................................................................... 13
ABSTRACT ............................................................................................................................................................ 18
DECLARATION ....................................................................................................................................................... 19
COPYRIGHT STATEMENT .......................................................................................................................................... 19
ACKNOWLEDGEMENTS ............................................................................................................................................ 20
THESIS OUTLINE .................................................................................................................................................... 21
1 INTRODUCTION ........................................................................................................................................... 24
1.1 SCOPE OF THE THESIS ....................................................................................................................................... 25
1.2 BASIN PHYSIOGRAPHY ....................................................................................................................................... 29
1.3 GEOLOGICAL HISTORY OF THE CENTRAL ATLANTIC .................................................................................................. 30
1.4 DATASET ........................................................................................................................................................ 38
1.4.1 Field Campaigns ................................................................................................................................... 39
1.4.2 Well Data ............................................................................................................................................. 39
1.4.3 Seismic Reflection Data ........................................................................................................................ 40
1.5 METHODOLOGY ............................................................................................................................................... 41
1.5.1 Stratigraphic Analysis........................................................................................................................... 41
1.5.2 Seismic Interpretation .......................................................................................................................... 44
1.6 REFERENCES ................................................................................................................................................... 45
2 DEEP SEA ROCK RECORD EXHUMED ON OCEANIC VOLCANIC ISLANDS: THE CRETACEOUS SEDIMENTS OF
MAIO, CAPE VERDE ......................................................................................................................................... 52
2.1 ABSTRACT ...................................................................................................................................................... 53
2.2 INTRODUCTION ................................................................................................................................................ 54
2.3 REGIONAL SETTING AND STRATIGRAPHY ................................................................................................................ 55
2.4 METHODS ...................................................................................................................................................... 57
2.4.1 Sedimentology ..................................................................................................................................... 57
2.4.2 Biostratigraphy .................................................................................................................................... 58
2.5 RESULTS ......................................................................................................................................................... 58
2.5.1 Ribeira do Morro Section (Sample prefix: RDM) ................................................................................... 61
2.5.2 Monte Esgrovere Section (Sample prefix: ESG) .................................................................................... 67
2.5.3 Monte Carquiejo and River Cut Sections (Sample prefix: MC & RC) ..................................................... 69
2.6 DISCUSSION .................................................................................................................................................... 72
2.6.1 Stratigraphy ......................................................................................................................................... 73
2
2.6.2 Regional Correlation ............................................................................................................................ 73
2.6.3 Paleo-Environmental Evolution ............................................................................................................ 75
2.7 CONCLUSIONS ................................................................................................................................................. 76
2.8 ACKNOWLEDGEMENTS ...................................................................................................................................... 77
2.9 SUPPLEMENTARY DATA ..................................................................................................................................... 77
2.10 REFERENCES ................................................................................................................................................. 84
3 AN INTEGRATED STRATIGRAPHIC RE-EVALUATION OF KEY CENTRAL ATLANTIC DSDP SITES ............................ 88
3.1 ABSTRACT ...................................................................................................................................................... 89
3.2 INTRODUCTION ................................................................................................................................................ 90
3.3 REGIONAL SETTING .......................................................................................................................................... 93
3.3.1 Scientific Drilling in the Oceanic Domain .............................................................................................. 94
3.3.2 Proximal Continental Margin Evolution ............................................................................................... 95
3.4 DATASET & METHODS ...................................................................................................................................... 96
3.4.1 Data ..................................................................................................................................................... 96
3.4.2 Methods ............................................................................................................................................... 96
3.5 RESULTS ......................................................................................................................................................... 99
3.5.1 Stratigraphic Revision .......................................................................................................................... 99
3.5.2 Organic Geochemistry ........................................................................................................................ 108
3.5.3 Seismic Stratigraphy .......................................................................................................................... 112
3.6 DISCUSSION .................................................................................................................................................. 117
3.6.1 Stratigraphic Evolution ....................................................................................................................... 117
3.6.2 Regional Extent and Drivers of Major Unconformities ....................................................................... 119
3.6.3 Seaward Dipping Reflector (SDR) Occurrence & Volcanism in the Central Atlantic ............................ 121
3.7 CONCLUSIONS ............................................................................................................................................... 121
3.8 ACKNOWLEDGEMENTS .................................................................................................................................... 124
3.9 SUPPLEMENTARY DATA ................................................................................................................................... 125
3.10 REFERENCES ............................................................................................................................................... 133
4 CRETACEOUS CONTINENTAL MARGIN EVOLUTION REVEALED USING QUANTITATIVE SEISMIC
GEOMORPHOLOGY, OFFSHORE NORTHWEST AFRICA .................................................................................... 139
4.1 ABSTRACT .................................................................................................................................................... 140
4.2 INTRODUCTION .............................................................................................................................................. 141
4.3 REGIONAL SETTING ........................................................................................................................................ 143
4.4. DATASET & METHODS ................................................................................................................................... 145
4.4.1 Data ................................................................................................................................................... 145
4.4.2 Methods ............................................................................................................................................. 145
4.5 RESULTS ....................................................................................................................................................... 147
4.5.1 Lithological & Stratigraphic Control ................................................................................................... 147
3
4.5.2 Margin Structure ................................................................................................................................ 149
4.5.3 Shelf-Edge Delta Evolution ................................................................................................................. 151
4.5.4 Canyon Incision .................................................................................................................................. 154
4.5.5 Quantitative seismic geomorphology ................................................................................................. 154
4.5.6 Canyon Classification ......................................................................................................................... 156
4.5.7 Formation Processes .......................................................................................................................... 156
4.5.8 Base-of-slope to Basin Floor Deposits ................................................................................................ 157
4.5.9 Spatio-temporal evolution ................................................................................................................. 161
4.6 DISCUSSION .................................................................................................................................................. 162
4.6.1 Mixed System Margin Morphology .................................................................................................... 162
4.6.2 Canyon Incision Evolution .................................................................................................................. 163
4.6.3 Sediment Transfer from Shelf to Basin ............................................................................................... 164
4.6.4 Regional Controls on Stratigraphic Evolution ..................................................................................... 166
4.7 CONCLUSIONS ............................................................................................................................................... 167
4.8 ACKNOWLEDGEMENTS .................................................................................................................................... 168
4.9 REFERENCES ................................................................................................................................................. 168
5 EVALUATING THE SEGMENTED POST-RIFT STRATIGRAPHIC ARCHITECTURE OF THE GUYANAS CONTINENTAL
MARGIN ....................................................................................................................................................... 176
5.1 ABSTRACT .................................................................................................................................................... 177
5.2 INTRODUCTION .............................................................................................................................................. 178
5.3 REGIONAL SETTING ........................................................................................................................................ 181
5.3.1 Previous Studies ................................................................................................................................. 182
5.4 DATASET & METHODS .................................................................................................................................... 183
5.4.1 Data ................................................................................................................................................... 183
5.4.2 Methods ............................................................................................................................................. 184
5.5 RESULTS ....................................................................................................................................................... 186
5.5.1 Sedimentological & Stratigraphic Control .......................................................................................... 186
5.5.2 Organic Geochemistry ........................................................................................................................ 200
5.5.3 Margin Architecture ........................................................................................................................... 203
5.5.4 Structural Evolution ........................................................................................................................... 208
5.5.5 Chronostratigraphic Analysis ............................................................................................................. 211
5.5.6 Palaeogeographical Reconstructions ................................................................................................. 214
5.6 DISCUSSION .................................................................................................................................................. 218
5.6.1 Comparison to the Conjugate Margin – Guinea Plateau .................................................................... 218
5.6.2 Margin Heterogeneity Influenced by Structural Inheritance .............................................................. 219
5.7 CONCLUSIONS ............................................................................................................................................... 220
5.8 ACKNOWLEDGEMENTS .................................................................................................................................... 221
4
5.9 SUPPLEMENTARY DATA ................................................................................................................................... 223
5.10 REFERENCES ............................................................................................................................................... 233
6 SYNTHESIS ................................................................................................................................................. 241
6.1 INTRODUCTION .............................................................................................................................................. 242
6.2 PALAEOGEOGRAPHICAL RECONSTRUCTIONS ......................................................................................................... 246
6.2.1 Middle Berriasian unconformity (142 Ma) to Upper Valanginian maximum flooding surface (135 Ma)
.................................................................................................................................................................... 246
6.2.2 Base Aptian unconformity (125 Ma) to base Albian unconformity (113 Ma) ..................................... 248
6.2.3 Base Albian unconformity (113 Ma) to intra Late Albian unconformity (102 Ma).............................. 251
6.2.4 Intra Late Albian unconformity (102 Ma) to Cenomanian-Turonian boundary (94 Ma) ..................... 255
6.2.5 Cenomanian-Turonian boundary (94 Ma) to Middle Campanian unconformity (78 Ma) ................... 258
6.3 SUMMARY .................................................................................................................................................... 260
6.4 ACKNOWLEDGEMENTS .................................................................................................................................... 260
6.5 REFERENCES ................................................................................................................................................. 261
7 CONCLUSIONS ........................................................................................................................................... 264
7.1.1 Central Atlantic Stratigraphic Framework .......................................................................................... 265
7.1.2 Continental Margin Evolution ............................................................................................................ 266
7.1.3. Geochemical Analysis ........................................................................................................................ 268
7.1.4. Unconformity Development .............................................................................................................. 268
7.2 FUTURE RESEARCH ......................................................................................................................................... 269
7.2.1 Sediment provenance of sands in the Senegal basin .......................................................................... 269
7.2.2 Geophysical studies of the MSGBC basin ........................................................................................... 269
7.2.3 Regional megasequence characterisation of the US Atlantic margin ................................................. 270
7.2.4 Re-examination of Mesozoic outcrops at Cap de Naze & Cap Rouge ................................................. 270
5
LIST OF FIGURES
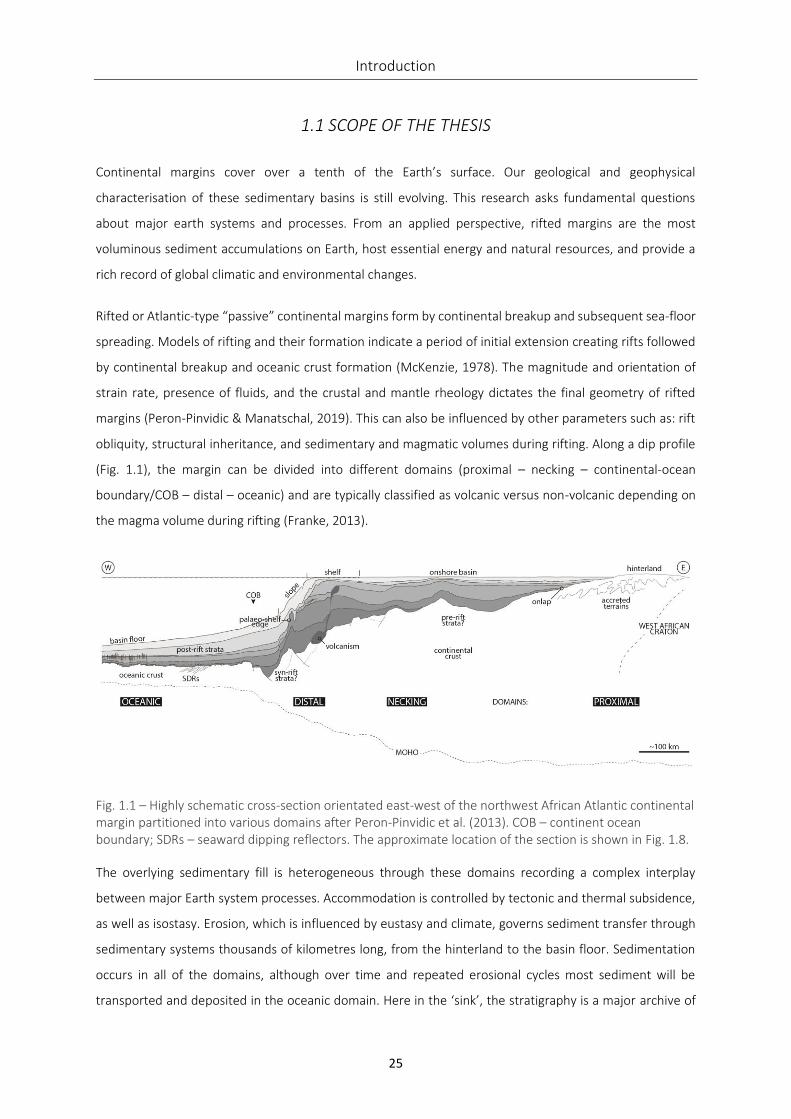
Fig. 1.1 – Highly schematic cross-section orientated east-west of the northwest African Atlantic continental margin partitioned into various domains after Peron-Pinvidic et al. (2013). COB – continent ocean boundary; SDRs – seaward dipping reflectors. The approximate location of the section is shown in Fig. 1.8. .............. 25
Fig. 1.2– Bathymetry and topography maps of northwest Africa (A) and north-eastern South America (B) highlighting the location of data used during the thesis. Additional information on the seismic reflection data is provided in Table 1.1. More detailed maps are presented in each chapter. ............................................ 28
Fig. 1.3 – Chronostratigraphy of northwest Africa, MSGBC basin showing hydrocarbon occurences and DSDP lithostratigraphic units (Jansa et al., 1979). Adapted from Petrosen (2014). ............................................... 30
Fig. 1.4– Paleozoic basement terrane assembly of northwest Africa, South America (Gondwana) and North America (Laurentia). This model is an output from the Geognostics Earth Model (GEM, 2020). Np. – Neoproterozoic. ........................................................................................................................................... 31
Fig. 1.5– Paleogeographic reconstructions to early seafloor spreading in the Central Atlantic (175 Ma), opening of the Equatorial Atlantic (110 Ma) and post-rift / drift configuration (70 Ma) from Scotese (2016). White boxes indicate the conjugated study areas. CA – Central Atlantic; EA – Equatorial Atlantic; SA – South America. ....................................................................................................................................................... 31
Fig. 1.6 – Central Atlantic rift evolution from Late Triassic (205 Ma) to Middle Jurassic (165 Ma). This model is an output from the Geognostics Earth Model (GEM, 2020). Key to the basement terranes is from Fig. 1.4. DR – Demerara Rise; GP – Guinea Plateau. .................................................................................................. 33
Fig. 1.7– Equatorial Atlantic rift evolution from Aptian (124 Ma) to Late Albian (101 Ma). This model is an output from the Geognostics Earth Model (GEM, 2020). Key to the basement terranes is from Fig. 1.4. C.A. – Central Atlantic; CAMP – Central Atlantic Magmatic Province; DR – Demerara Rise; E.A. – Equatorial Atlantic; GP – Guinea Plateau. ...................................................................................................................... 36
Fig. 1.8– A structural synthesis of the northwest African Atlantic continental margin from the hinterland (West African Craton) in the east to the Central Atlantic Ocean in the west. To be used alongside Fig. 2A to reference the location of data used in the thesis. CDN – Cap de Naze (Cretaceous outcrop); CFR – Casamance failed rift; CSM – Casamance salt basin; KAF – Kaolack fault; KKI - Kédougou-Kéniba inlier; MFT – Mauritanide front thrust; MSB – Mauritania salt basin. Complied from Bellion and Crevola (1991), Davison (2005) and GEM (2020). The approximate location of the section in Fig. 1.1 is displayed. ............................................ 38
Fig. 2.1 (A) – Location map of the Cape Verde archipelago with magnetic anomalies (M0 ~125 Ma, Barremian-Aptian boundary; M10 ~130 Ma; M16 ~145 Ma; M21 ~148 Ma; M25 ~154 Ma; Seton et al., 2014), DSDP boreholes and location of Fig. 2.2 displayed. Bathymetric contours every 1000 m. (B) Geological map of Maio after Stillman et al. (1982), with the locations of four studied sections presented in this paper. (C) Schematic cross-section of Maio, location displayed on (B), adapted after Robertson et al. (1984). .......... 55
Fig. 2.2 – Schematic cross-section through the NW African Atlantic passive margin highlighting the main stratigraphic packages and architecture of the basin. Approximate locations of DSDP 367 and magnetic anomalies (Seton et al., 2014) shown. Location of section detailed in Fig. 2.1A. ......................................... 56
Fig. 2.3 – Chronostratigraphic summary chart for the geological evolution of Maio. Inset – references. Kindly provided by Steve Lawrence (pers. comms. 2018). ...................................................................................... 57
Fig. 2.4 (next page) – Detailed sedimentary log with the majority of igneous intrusions removed from Ribeira do Morro, see location in Fig. 2.1B. Samples taken for the calcareous nannofossil biostratigraphy are annotated, five specimens are illustrated: (A) A. youngii, (B) N. steinmannii, (C) C. rothii, (D) E. turriseiffelli,
6
(E) Z. scutula, and the distribution charts are provided in the supplementary data (Table S 2.1). Inset – a sketch geological map highlighting where the section was logged along in the river bank exposures and in subsurface quarries, the lack of surface exposure due to quarrying activities (see supplementary data Fig. S 2.1) and structural data recorded in the field. ............................................................................................. 59
Fig. 2.5 – Reconstructed sedimentary log of the complete Ribeira do Morro section after Stahlecker (1935) with macrofossil horizons (I – XIV) displayed. The approximate stratigraphic location of Fig. 2.4 is shown. A selection of the key ammonites are illustrated: (A) VII – Leptohamulina cf. distans (= Leptoceras aff. sabaudianum in Stahlecker, 1935); (B) VII – Lytocrioceras sp. (= Ancyloceras sp. in Stahlecker, 1935); (C) VII – Mascarellina gr. hamus (= Hamulina cf. hamus in Stahlecker, 1935); (D-E) VII – Eoheteroceras multicostatum (= Heteroceras giraudi in Stahlecker, 1935); (F) VII – Eoheteroceras multicostatum (= Heteroceras aff. heterocostatum in Stahlecker, 1935); (G) VIII – Pulchellia sp. (= Pulchellia rhombocostata in Stahlecker, 1935); (H, I) X – Toxancyloceras gr. vandenheckii (= Ancyloceras matheronianum in Stahlecker, 1935); (J) XI – Heinzia sp. (= Douvilleiceras irregulare in Stahlecker, 1935); (K) XII – Heinzia sp. (= Pulchellia hoplitiformis in Stahlecker, 1935). Location detailed in Fig. 2.1B and key in Fig. 2.4. Note the change in scale, each bar represents 10m. All ammonites are natural size except Fig. J. (x2). .............................................. 63
Fig. 2.6 (next page) – Detailed sedimentary log of the Monte Esgrovere section with photographs of the new collection of ammonites: (A) Neolissoceras (Vergoligeras) sp. juv. gr. salinarium; (B) Bochianites sp.; (C) “Busnardoites” sp.; (D) Kilianella sp. All ammonites are natural size except Fig. A and C (x2). Location detailed in Fig. 2.1B and key in Fig. 2.4. ..................................................................................................................... 65
Fig. 2.7 – Detailed sedimentary log of the Monte Carquiejo and River Cut section, separated by approximately 120 m. Samples taken for the calcareous nannofossil biostratigraphy are annotated and the distribution charts are provided in the supplementary data (Table S 2.1). One belemnite was identified and studied; the location in the stratigraphy is shown supporting the age interpretation from the calcareous nannofossils. Location detailed in Fig. 2.1B and key in Fig. 2.4. ................................................................... 69
Fig. 2.8 – Composite stratigraphic summary log of the Cretaceous succession of Maio integrating all new data from various sections documented (Fig. 2.4; Fig. 2.5; Fig. 2.6; Fig. 2.7), with the calpionellid dating of the Batalha Fm. by Fourcade et al. (1990). UTU – upper transitional unit of the Morro Formation; Dating of sections based on: N. – nannofossils; Am. – ammonites; Ap. – aptychi; C. – calpionellids........................... 72
Fig. 3.1 – Reconstruction of the Central Atlantic to Aptian times (~125 Ma). Location of scientific boreholes and exploration wells (EXP) shown, the three revised wells are highlighted in orange, as well as outcrop studies from Maio, Cape Verde (Casson et al., 2020a) and Cap de Naze, Senegal (CDN). The reconstructed present-day onshore geology maps from the three continents, North America, South America and Africa are displayed highlighting the radial nature of the Central Atlantic Magmatic Province (CAMP) dykes. The onshore geology is clipped at the maximum transgressive coastline during the Cretaceous (Mourlot et al., 2018). Magnetic anomalies, Mx and their corresponding oceanic crust ages from Gradstein et al. (1994) with offsetting fracture zones (FZ). Additional magnetic anomalies (i.e. ABSMA) mapped by Labails et al. (2010) are displayed. The reconstructed location of the seismic data (Fig. 3.9) and estimated line of section for the Wheeler diagram (Fig. 3.11) shown. The conjugate South American study area (Casson et al., 2020b) is displayed as a black dashed box. ABSMA – African Blake Spur magnetic anomaly; BB – Bove Basin; BBB – Blake-Bahama Basin; BP – Blake Plateau; BSMA – Blake Spur magnetic anomaly; DR – Demerara Rise; ECMA – East Coast magnetic anomaly; GP – Guinea Plateau; MSGBC – Mauritania-Senegal-Guinea Bissau-Conarky basin; WACMA – West African Coast magnetic anomaly. ............................................................................ 92
Fig. 3.2 – Litho-stratigraphic summary chart for DSDP wells from the Central Atlantic, and Maio, Cape Verde after Casson et al. (2020a). Displaying litho-stratigraphic units/formations1 defined by Jansa et al. (1979) and events by Müller et al. (1983; 1984), key seismo-stratigraphic markers2 of Tucholke & Mountain (1979), and those defined in this study. Numbers relate to the core number. Black lines between cores indicate core gaps, and no lines indicate a hiatus. BAU – base Albian unconformity; BTU – base Tertiary unconformity;
7
MBU – middle Berriasian unconformity; TC – top Cenomanian; TOC – top oceanic crust; TV – top Valanginian. ..................................................................................................................................................................... 94
Fig. 3.3 (next page) – A re-evaluation of DSDP Leg 41 Site 367 stratigraphy displaying nannofossil events (Table S 3.2) and palynology results (Fig. S 3.1), depth of an ichthyodectiform reported in Casson et al. (2018), total organic carbon (TOC; Table S 3.1) measurements and key stratigraphic surfaces. Palynology abbreviations: ABN – abundant, AOM – amorphous organic matter, FDO – first downhole occurrence, FDCO – first downhole common occurrence, FDAO – first downhole abundant occurrence, FDSAO – first downhole superabundant occurrence, INCR – increase in abundance, PRES - presence, CMN - common, SABN – superabundant, TNS – top not seen. ............................................................................................................ 97
Fig. 3.4 (next page) – A litho-stratigraphic summary of the Mesozoic sediments recovered at DSDP Leg 41 Site 367 displaying key stratigraphic units after Lancelot et al. (1976). Total organic carbon (TOC) maximum and average values per unit displayed from new geochemical analysis (Table S 3.1). ACD – aragonite compensation depth; CCD – calcite compensation depth. .......................................................................... 99
Fig. 3.5 – Photographs of Core 32 from DSDP Leg 41 Site 367 with analysed samples displayed by red arrows, highlighting the middle Berriasian unconformity (MBU) separating Late Tithonian-aged unit 6, reddish brown nannofossil-bearing argillaceous limestone, marl, clays and cherts from the overlying early Berriasian-aged Unit 5B, white grey nannofossil limestone, marl & chert (Lancelot et al., 1976). Tith. – Tithonian; Berr. – Berriasian. Scale in cm. ............................................................................................................................... 101
Fig. 3.6 – A re-evaluation of DSDP Leg 41 Site 368 stratigraphy displaying nannofossil events (Table S 3.2), total organic carbon (TOC; Table S 3.1) measurements, palynology results (Fig. S 3.1) and key stratigraphic surfaces. ..................................................................................................................................................... 104
Fig. 3.7 – A re-evaluation of DSDP Leg 76 Site 534a stratigraphy displaying nannofossil events (Table S 3.2), total organic carbon (TOC; Table S 3.1) measurements and key stratigraphic surfaces. ............................ 106
Fig. 3.8 – Classification of kerogen types using hydrogen and oxygen indices plotted on a modified van Krevelen diagram displaying the results of the Rock-Eval pyrolysis. The symbology reflects the age of each sample analysed, data from DSDP Site 367 and Site 368 is filled white and black respectively. The tabulated data is presented in the supplementary material (Table S 3.1). ................................................................. 108
Fig. 3.9 (next page) – Dip-orientated two-way time seismic sections from the North West African Atlantic margin, Mauritania to Guinea Bissau, displaying megasequence architecture extrapolated from the re-evaluated well stratigraphy. Location displayed on Fig. 3.1 and the inset map. A zoom-in on possible outer seaward dipping reflectors (SDRs) is shown at 2x magnification. M25 magnetic anomaly intersection (~154 Ma = Kimmeridgian) after Labails et al. (2010). COB – Continent ocean boundary. Seismic data courtesy of Spectrum Geo. ........................................................................................................................................... 110
Fig. 3.10 – A correlation between the stratigraphy studied in the DSDP cores of Site 367 (Fig. 3.3) and the two-way time seismic section displayed in Fig. 3.9B, where the location of this zoom is highlighted. DSDP unit numbers are shown on the lithology log. The main seismic markers are coloured and named following the symbology in Fig. 3.9. Note there are no wireline logs from this borehole, therefore a seismic-well tie is not possible. Type II and Type II/III refers to the predominate kerogen type, i.e. marine and mixed, respectively, for those particular intervals. OC – oceanic crust; SF – sea floor; SR – source rock. ............. 113
Fig. 3.11 (next page) – A dip-orientated Wheeler diagram constructed from the oceanic domain (left) to distal and proximal domains of onshore Senegal, northwest Africa Atlantic margin (right) detailing the stratigraphic evolution of the continental margin, from pre-rift to the top of the Cretaceous. The horizontal axis is not accurately to scale. Pin stripe vertical lines indicate hiatus’ corresponding to various regional unconformities dated in the stratigraphic analysis. Dash black and white lines indicate revised wells in this study. The geological time scale (GTS 2018) is non-linear. Hydrocarbon occurrences are shown. Outcrop
8
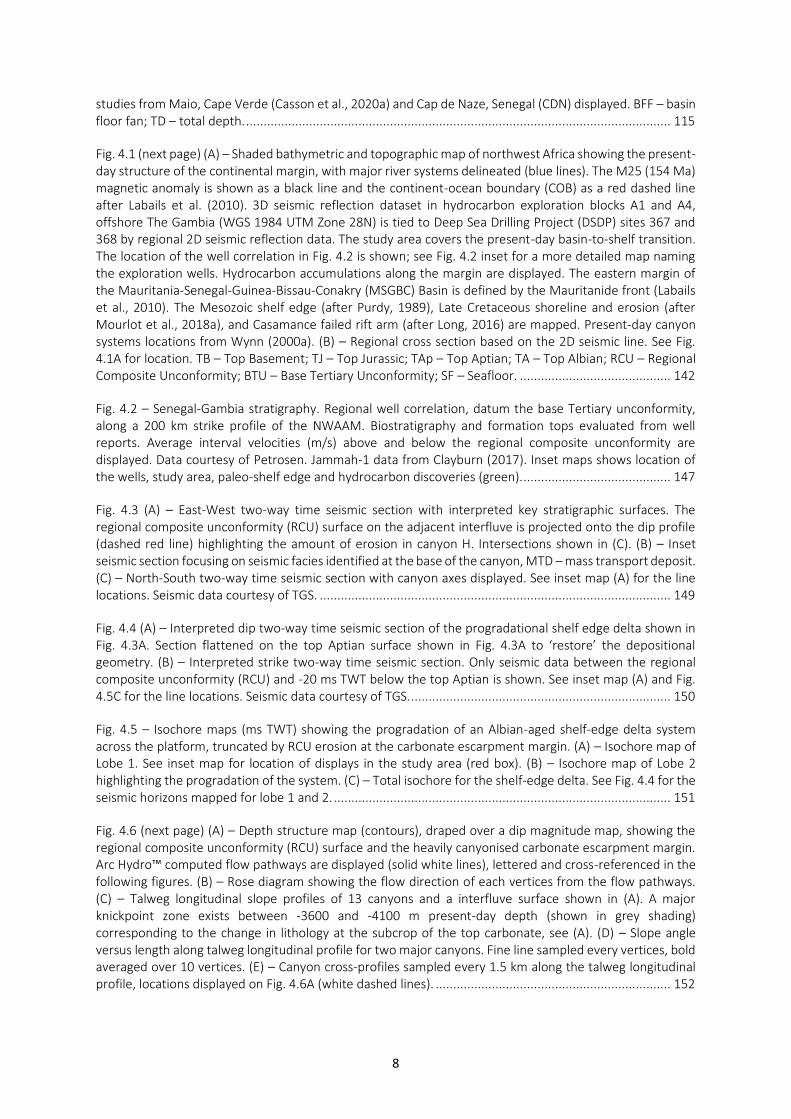
studies from Maio, Cape Verde (Casson et al., 2020a) and Cap de Naze, Senegal (CDN) displayed. BFF – basin floor fan; TD – total depth. ......................................................................................................................... 115
Fig. 4.1 (next page) (A) – Shaded bathymetric and topographic map of northwest Africa showing the present-day structure of the continental margin, with major river systems delineated (blue lines). The M25 (154 Ma) magnetic anomaly is shown as a black line and the continent-ocean boundary (COB) as a red dashed line after Labails et al. (2010). 3D seismic reflection dataset in hydrocarbon exploration blocks A1 and A4, offshore The Gambia (WGS 1984 UTM Zone 28N) is tied to Deep Sea Drilling Project (DSDP) sites 367 and 368 by regional 2D seismic reflection data. The study area covers the present-day basin-to-shelf transition. The location of the well correlation in Fig. 4.2 is shown; see Fig. 4.2 inset for a more detailed map naming the exploration wells. Hydrocarbon accumulations along the margin are displayed. The eastern margin of the Mauritania-Senegal-Guinea-Bissau-Conakry (MSGBC) Basin is defined by the Mauritanide front (Labails et al., 2010). The Mesozoic shelf edge (after Purdy, 1989), Late Cretaceous shoreline and erosion (after Mourlot et al., 2018a), and Casamance failed rift arm (after Long, 2016) are mapped. Present-day canyon systems locations from Wynn (2000a). (B) – Regional cross section based on the 2D seismic line. See Fig. 4.1A for location. TB – Top Basement; TJ – Top Jurassic; TAp – Top Aptian; TA – Top Albian; RCU – Regional Composite Unconformity; BTU – Base Tertiary Unconformity; SF – Seafloor. ........................................... 142
Fig. 4.2 – Senegal-Gambia stratigraphy. Regional well correlation, datum the base Tertiary unconformity, along a 200 km strike profile of the NWAAM. Biostratigraphy and formation tops evaluated from well reports. Average interval velocities (m/s) above and below the regional composite unconformity are displayed. Data courtesy of Petrosen. Jammah-1 data from Clayburn (2017). Inset maps shows location of the wells, study area, paleo-shelf edge and hydrocarbon discoveries (green). .......................................... 147
Fig. 4.3 (A) – East-West two-way time seismic section with interpreted key stratigraphic surfaces. The regional composite unconformity (RCU) surface on the adjacent interfluve is projected onto the dip profile (dashed red line) highlighting the amount of erosion in canyon H. Intersections shown in (C). (B) – Inset seismic section focusing on seismic facies identified at the base of the canyon, MTD – mass transport deposit. (C) – North-South two-way time seismic section with canyon axes displayed. See inset map (A) for the line locations. Seismic data courtesy of TGS. .................................................................................................... 149
Fig. 4.4 (A) – Interpreted dip two-way time seismic section of the progradational shelf edge delta shown in Fig. 4.3A. Section flattened on the top Aptian surface shown in Fig. 4.3A to ‘restore’ the depositional geometry. (B) – Interpreted strike two-way time seismic section. Only seismic data between the regional composite unconformity (RCU) and -20 ms TWT below the top Aptian is shown. See inset map (A) and Fig. 4.5C for the line locations. Seismic data courtesy of TGS. .......................................................................... 150
Fig. 4.5 – Isochore maps (ms TWT) showing the progradation of an Albian-aged shelf-edge delta system across the platform, truncated by RCU erosion at the carbonate escarpment margin. (A) – Isochore map of Lobe 1. See inset map for location of displays in the study area (red box). (B) – Isochore map of Lobe 2 highlighting the progradation of the system. (C) – Total isochore for the shelf-edge delta. See Fig. 4.4 for the seismic horizons mapped for lobe 1 and 2. ................................................................................................ 151
Fig. 4.6 (next page) (A) – Depth structure map (contours), draped over a dip magnitude map, showing the regional composite unconformity (RCU) surface and the heavily canyonised carbonate escarpment margin. Arc Hydro™ computed flow pathways are displayed (solid white lines), lettered and cross-referenced in the following figures. (B) – Rose diagram showing the flow direction of each vertices from the flow pathways. (C) – Talweg longitudinal slope profiles of 13 canyons and a interfluve surface shown in (A). A major knickpoint zone exists between -3600 and -4100 m present-day depth (shown in grey shading) corresponding to the change in lithology at the subcrop of the top carbonate, see (A). (D) – Slope angle versus length along talweg longitudinal profile for two major canyons. Fine line sampled every vertices, bold averaged over 10 vertices. (E) – Canyon cross-profiles sampled every 1.5 km along the talweg longitudinal profile, locations displayed on Fig. 4.6A (white dashed lines). ................................................................... 152
9
Fig. 4.7 – Spectral decomposition at 20, 30 and 40 Hz extracted on two surfaces, Albian-aged T1 (A) and Late Cretaceous-aged T2 (B), see above for the seismic horizons mapped. These images document the two phases of margin evolution. (A) – Inset rose diagram showing the orientation of each vertices from the sediment wave crest polylines. Carbonate escarpment mapped (white line). (B) – Inset zoom in on the basinal area showing glide tracks and carbonate blocks. ............................................................................................... 157
Fig. 4.8 – RMS amplitude maps extracted from a +/- 12 ms window around an intra-Albian horizon (A) and T1 (B), displaying the two end-member types of lobes (debris-poor vs. debris-rich). Location of the maps are shown in Fig. 4.6A. ..................................................................................................................................... 159
Fig. 4.9 – Summary of depositional systems active on the platform and in the basin through time, linked to each canyon system displayed in Fig. 4.6A. The line thickness indicates the volume of each geobody/deposit. Canyon K is omitted as this directly feeds the basin system of canyon L and M. Canyon M is also omitted as the majority of the deposits is beyond the dataset. Created through the interpretation of a 200-surface horizon stack generated in PaleoScan™ between the top Aptian and base Tertiary unconformity. The stratigraphic surfaces T1 and T2 are indicated. This is correlated to the geodynamical events effecting the Central Atlantic, with references shown. BTU – Base Tertiary Unconformity; DP – debris-poor lobes; DR – debris-rich lobes; MTD – mass transport deposit; ORI – organic-rich interval; RCU – regional composite unconformity; RSL – relative sea level. ....................................................................................................... 161
Fig. 4.10 (A) – Volume of deposit (derived from geobody interpretation) plotted with uncertainty against relative time (estimated from the PaleoScan™ horizon stack i.e. horizon 100 to 200 from oldest to youngest), coloured by facies. (B) – Run-out distance plotted against relative time. Trend lines coloured by facies. (C) – Cumulative volumes of sediment transported through each canyon system. ........................................... 162
Fig. 5.1 (A) – Shaded bathymetric and topographic location map of northeast South America showing the structure of the Guyanas continental margin and subsurface dataset. Exploration wells and scientific boreholes used in this study are shown; orange circles highlight where new stratigraphic analysis has been performed. The ION Geophysical GuyanaSPAN 2D seismic reflection survey, the location of the composite seismic section (Fig. 5.11A), dip section SR1-5400 (Fig. 5.11B) and the isochore maps are shown (Fig. 5.12). Dredge samples recovered basalts and rhyolites zircon-dated at 173.4 ± 1.6 Ma (Basile et al., 2020) from the seabed (white star). Onshore, the limit of sedimentary cover and hence the location of the Archean Guiana Shield is mapped (Cordani et al., 2016). Hydrocarbon discoveries and the limits of Cretaceous source kitchens after Kosmos (2018). DR – Demerara Rise; WA – Waini Arch. (B) – Structural framework of the Guyanas continental margin with a top basement depth structure map interpreted from the ION Geophysical GuyanaSPAN 2D seismic reflection survey. The ‘top basement’ map was constructed from a merge between the top oceanic crust and top basement surfaces. The onshore geological map is from the Geological Map of South America (CGMW, CPRM, DNPM, 2003). Structural features are mapped after Gouyet et al. (1994), Yang and Escalona (2011), Reuber et al. (2016), Sapin et al. (2016), crustal thickness modelled from 3D gravity anomaly inversion by Kusznir et al. (2018), predicted Jurassic graben offshore (Griffith, 2017), and volcanics from Gouyet et al. (1994) and Mourlot (2018). .......................................................................... 179
Fig. 5.2 – Tectono-stratigraphic framework for the Guyanas continental margin, offshore Suriname and Guyana. The major sequence stratigraphic surfaces identified in this study are indicated, linked to key biostratigraphy events. Lithostratigraphy is based on seismic profile SR1-5400 (Fig. 5.11B) and adapted from Nemčok et al. (2016), key in Fig. 5.15. The main seismic markers and megasequences used in this study are highlighted. Calculated sedimentation rates (sedi-rates) displayed in metres per million years (m/Myr). Relative sea level curve after Haq (2014). AF – Albian flooding surface; CAMP – Central Atlantic Magmatic Province; CF – Cenomanian flooding surface; OAE – oceanic anoxic event; SDRs – seaward dipping reflectors; TB – top basement. .................................................................................................................................... 182
Fig. 5.3 – A re-evaluation of the Guiana-Maritime GM-ES-3 well stratigraphy displaying nannofossil events (Table S 5.2), total organic carbon (TOC; Table S 5.1) measurements and key stratigraphic surfaces. Location displayed on Fig. 5.1A. ................................................................................................................................ 187
10
Fig. 5.4 – A re-evaluation of the French Guiana 2-1 (FG2-1) well stratigraphy displaying nannofossil events (Table S 5.2), foraminifera and palynology results, total organic carbon (TOC; Table S 5.1) measurements and key stratigraphic surfaces. Location displayed on Fig. 5.1A. ....................................................................... 189
Fig. 5.5 (next page) – A re-evaluation of the Demerara A2-1 well stratigraphy displaying nannofossil events (Table S 5.2), foraminifera and palynology results, total organic carbon (TOC; Table S 5.1) measurements and key stratigraphic surfaces. Oil shows indicated on lithology column as green stars. Palynology abbreviations: CMN – common, FDCO – first downhole common occurrence. Location displayed on Fig. 5.1A. ............. 191
Fig. 5.6 – A re-evaluation of the ODP Leg 207 Site 1258C stratigraphy displaying nannofossil events (Table S 5.2), total organic carbon (TOC; Table S 5.1) data compiled from Meyers et al. (2006) and key stratigraphic surfaces. A 12 m correction has been applied to the gamma ray log, where LD is logger’s depth and DD is driller’s depth. Early Late Albian ammonites identified in cores 30 and 31 by Owen & Mutterlose (2006) are annotated, as well as the cores displayed in Fig. 5.7. Location displayed on Fig. 5.1A. .............................. 195
Fig. 5.7 – Photographs of two cores, 15 and 27 from ODP Leg 207 Site 1258C with analysed samples and interpreted ages displayed by red arrows, highlighting the Cretaceous stratigraphy and unconformities present in the borehole (Erbacher et al., 2004a). Inset – zoom in on the sharp contact between the calcareous nannofossil clay of Unit 3 and black shale of Unit 4 representing the middle Campanian unconformity (MCU) and a ca. 12 Myr hiatus (Erbacher et al., 2004b). Ceno. – Cenomanian; Camp. – Campanian. Scale in cm. ............................................................................................................................. 196
Fig. 5.8 – A re-evaluation of the DSDP Leg 14 Site 144 stratigraphy displaying nannofossil events (Table S 5.2), total organic carbon (TOC; Table S 5.1) measurements and key stratigraphic surfaces. Location displayed on Fig. 5.1A. ................................................................................................................................ 199
Fig. 5.9 – Classification of kerogen types using hydrogen and oxygen indices plotted on a modified van Krevelen diagram displaying the results of the Rock-Eval pyrolysis. The symbology reflects the age of each sample analysed. New data generated in this study from four of the revised wells (A2-1, DSDP Site 144, FG2-1 and GM-ES-3) is amalgamated with data presented in Meyers et al. (2006) from ODP Site 1258C, the ages are updated following the new biostratigraphy results. The tabulated data is presented in the supplementary material (Table S 5.1). ................................................................................................................................ 201
Fig. 5.10 – Synthetic seismogram calculated for two exploration wells, Demerara A2-1 (Fig. 5.5) and French Guiana FG2-1 (Fig. 5.4), providing the well to seismic correlation of key horizons and megasequences identified in this new stratigraphic study. Extracted statistical wavelets presented. Location of the two wells displayed on Fig. 5.1A. ................................................................................................................................ 204
Fig. 5.11 (A) – Composite seismic section in depth displaying megasequence architecture along a >1000 km length of the Guyanas continental margin. Location displayed on Fig. 5.1A. Erosional truncation (red arrows) and onlap (black arrows) marked. BFF – basin floor fan; MFS – maximum flooding surface. (B) – Conjugate dip-orientated seismic depth sections from the Demerara Rise (2D line – SR1-5400, clipped at 20 km depth) and Guinea Plateau (after Edge, 2014) displaying megasequence architecture. Location displayed on Fig. 5.1A and reconstructed location on Fig. 5.16A. Note change of horizontal and vertical scale from (A). COB – continent-ocean boundary. Seismic data courtesy of ION Geophysical. .................................................... 205
Fig. 5.12 (left) – Isochore thickness maps for three megasequences, MS1 – top basement (seaward dipping reflectors, continental and oceanic crust) to upper Valanginian maximum flooding surface (VF); MS2 – VF to base Albian unconformity (BAU); MS3 – BAU to base Tertiary unconformity (BTU). Cont. – continental; GP – Guinea Plateau; TJ – top Jurassic. ............................................................................................................... 205
Fig. 5.13 (right) – A fence diagram constructed from 7 dip-orientated (N-S) seismic depth sections across the Demerara Rise, interpreted with the megasequences, structural domains and underlying basement structure. BAU – Base Albian unconformity; COB – continent-ocean boundary. Seismic data courtesy of ION Geophysical. Location inset. ....................................................................................................................... 205
11
Fig. 5.14 – Sequential restoration by horizon flattening for a segment of the strike seismic profile displayed in Fig 11A, at three key time stages, (D) Valanginian, (C) Aptian and (B) Albian revealing the structural evolution of the continental margin to (A) present day. A zoom in on the seismic around Demerara A2-1 with a projection of the uppermost truncated seismic reflection (black dashed line) revealing approximately a kilometre of erosion at the well location is shown. MFS – maximum flooding surface. Fig. 5.1A for location of the section. ............................................................................................................................................ 209
Fig. 5.15 (next page) – A Wheeler diagram constructed along strike from Guyana (left) to Brazil (right) detailing the stratigraphic evolution of the segmented Guyanas continental margin. Pin stripe vertical lines indicate hiatus’ corresponding to various regional unconformities dated in the stratigraphic analysis. Dash black and white lines indicate revised wells in this study. The geological time scale (GTS 2018) is non-linear. Hydrocarbon occurrences are shown. Average TOC values for the Canje Formation displayed, AR-1 data from Mourlot (2018). .......................................................................................................................................... 211
Fig. 5.16 (next page)– Gross depositional environment (GDE) maps for four key time stages, defined by the stratigraphic analysis, in the evolution of the Guyanas continental margin. (A) Upper Valanginian (135 Ma); (B) Aptian (115 Ma); (C) Latest Albian (101 Ma) and (D) Santonian (85 Ma). The reconstructed location of the conjugate seismic sections (Fig. 5.11B) are displayed in (A). Facies distribution (%) for the interval encountered in each well is shown. Geometries were reconstructed following the Geognostics Earth Model (GEM™). BFF – basin floor fan; DR – Demerara Rise; FZ – fracture zone; GP – Guinea Plateau. ................ 214
Fig. 6.1 (next page) – Chronostratigraphic summary of the key revised DSDP/ODP boreholes, exploration wells and outcrop locality (Maio, Cape Verde) of the Central Atlantic. Total organic carbon (TOC) data produced in this study is averaged over sub-stage intervals. A compilation of tectonic phases and regional events documented during this study, and synthesised from previous work is provided, alongside the relative sea level curve (Haq, 2014). A geological sketch based on regional two-dimensional seismic data profiles from the Central to Equatorial Atlantic, through the Demerara Rise is shown to display the relative positions, depths of penetration for each of the revised wells and stratigraphic architecture. DSDP 368 and Maio are not displayed on the geological section. .................................................................................................... 242
Fig. 6.2 – Palaeogeographical reconstruction to the interval, Middle Berriasian unconformity (142 Ma) to Upper Valanginian maximum flooding surface (MFS; 135 Ma). The map shows the depositional systems at maximum transgression. Facies distribution (%) for the interval encountered in each well is shown. A key is provided for reference in the following maps. ........................................................................................... 246
Fig. 6.3 – Palaeogeographical reconstruction to the interval, base Aptian unconformity (125 Ma) to base Albian unconformity (113 Ma), effectively representing the Aptian stage. ............................................... 248
Fig. 6.4 – Palaeogeographical reconstruction to the interval, base Albian unconformity (113 Ma) to intra Late Albian unconformity (102 Ma), effectively representing the Albian stage. ................................................ 251
Fig. 6.5 – Palaeogeographical reconstruction to the interval, intra Late Albian unconformity (102 Ma) to Cenomanian-Turonian boundary (94 Ma), effectively representing the major organic-rich interval. ........ 255
Fig. 6.6 – Palaeogeographical reconstruction to the interval, Cenomanian-Turonian boundary (94 Ma) to Middle Campanian unconformity (78 Ma). ................................................................................................ 258
12
LIST OF TABLES
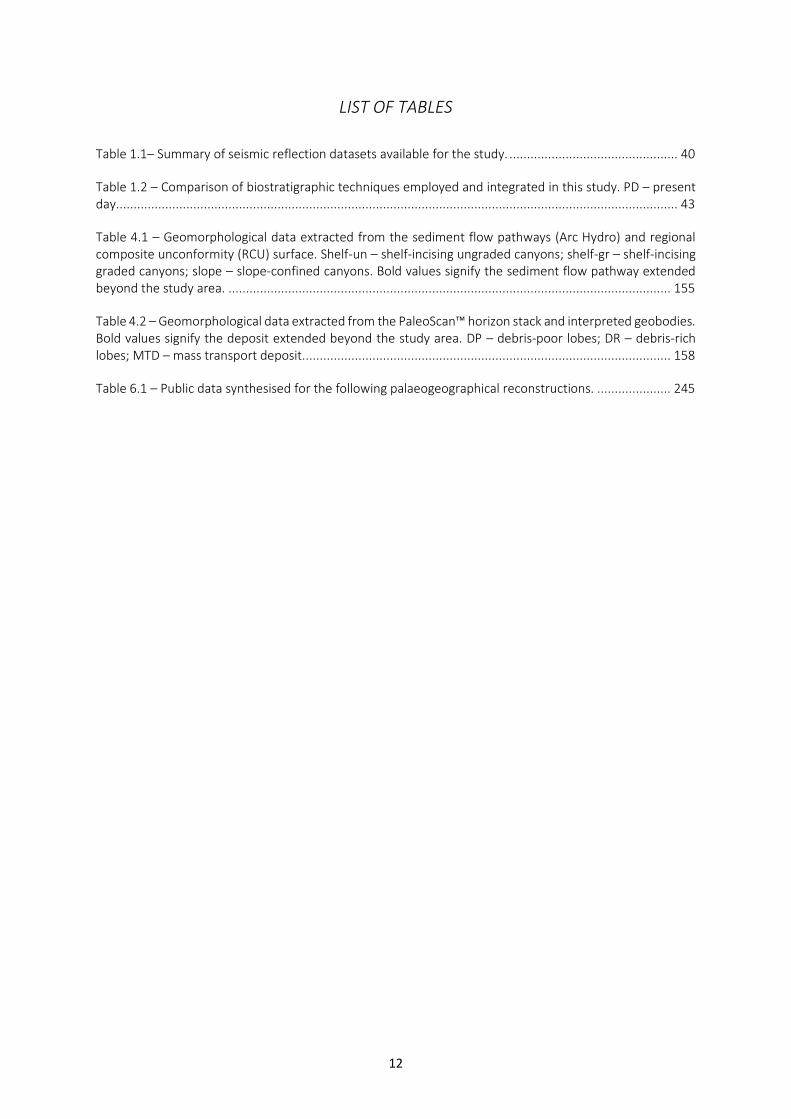
Table 1.1– Summary of seismic reflection datasets available for the study. ................................................ 40
Table 1.2 – Comparison of biostratigraphic techniques employed and integrated in this study. PD – present day. ............................................................................................................................................................... 43
Table 4.1 – Geomorphological data extracted from the sediment flow pathways (Arc Hydro) and regional composite unconformity (RCU) surface. Shelf-un – shelf-incising ungraded canyons; shelf-gr – shelf-incising graded canyons; slope – slope-confined canyons. Bold values signify the sediment flow pathway extended beyond the study area. .............................................................................................................................. 155
Table 4.2 – Geomorphological data extracted from the PaleoScan™ horizon stack and interpreted geobodies. Bold values signify the deposit extended beyond the study area. DP – debris-poor lobes; DR – debris-rich lobes; MTD – mass transport deposit. ........................................................................................................ 158
Table 6.1 – Public data synthesised for the following palaeogeographical reconstructions. ..................... 245
13
ABBREVIATIONS
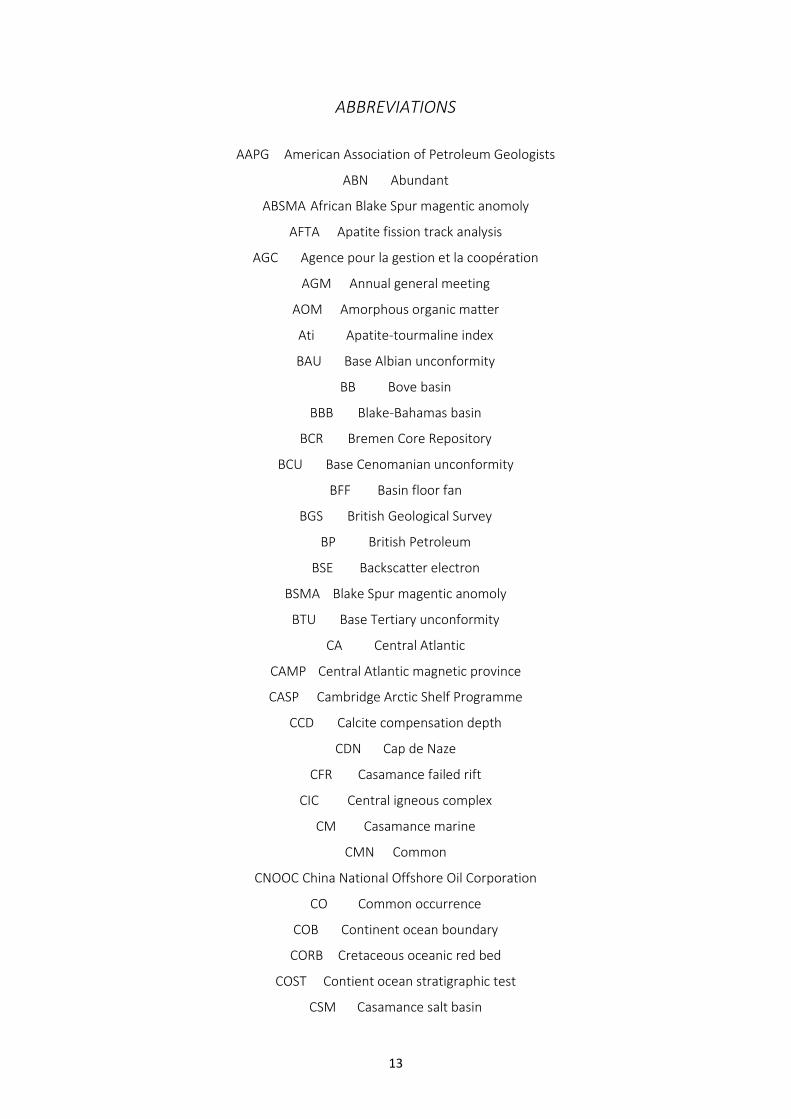
AAPG American Association of Petroleum Geologists
ABN Abundant
ABSMA African Blake Spur magentic anomoly
AFTA Apatite fission track analysis
AGC Agence pour la gestion et la coopération
AGM Annual general meeting
AOM Amorphous organic matter
Ati Apatite-tourmaline index
BAU Base Albian unconformity
BB Bove basin
BBB Blake-Bahamas basin
BCR Bremen Core Repository
BCU Base Cenomanian unconformity
BFF Basin floor fan
BGS British Geological Survey
BP British Petroleum
BSE Backscatter electron
BSMA Blake Spur magentic anomoly
BTU Base Tertiary unconformity
CA Central Atlantic
CAMP Central Atlantic magnetic province
CASP Cambridge Arctic Shelf Programme
CCD Calcite compensation depth
CDN Cap de Naze
CFR Casamance failed rift
CIC Central igneous complex
CM Casamance marine
CMN Common
CNOOC China National Offshore Oil Corporation
CO Common occurrence
COB Continent ocean boundary
CORB Cretaceous oceanic red bed
COST Contient ocean stratigraphic test
CSM Casamance salt basin
14
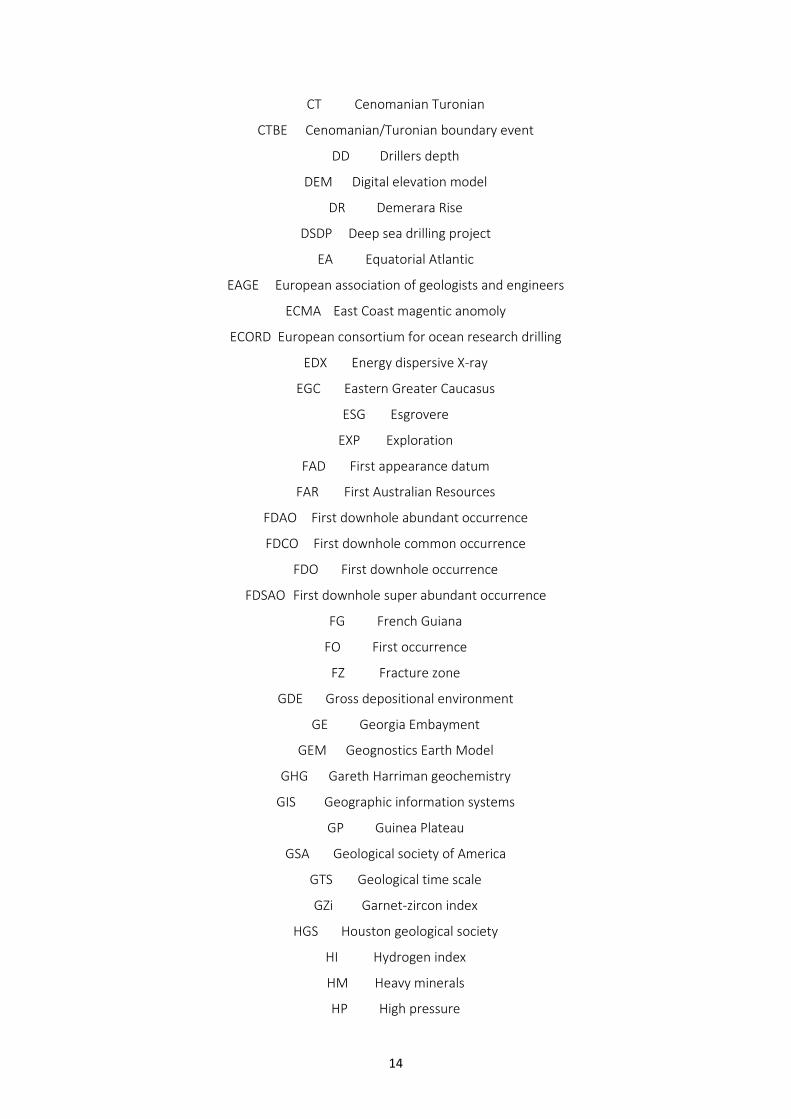
CT Cenomanian Turonian
CTBE Cenomanian/Turonian boundary event
DD Drillers depth
DEM Digital elevation model
DR Demerara Rise
DSDP Deep sea drilling project
EA Equatorial Atlantic
EAGE European association of geologists and engineers
ECMA East Coast magentic anomoly
ECORD European consortium for ocean research drilling
EDX Energy dispersive X-ray
EGC Eastern Greater Caucasus
ESG Esgrovere
EXP Exploration
FAD First appearance datum
FAR First Australian Resources
FDAO First downhole abundant occurrence
FDCO First downhole common occurrence
FDO First downhole occurrence
FDSAO First downhole super abundant occurrence
FG French Guiana
FO First occurrence
FZ Fracture zone
GDE Gross depositional environment
GE Georgia Embayment
GEM Geognostics Earth Model
GHG Gareth Harriman geochemistry
GIS Geographic information systems
GP Guinea Plateau
GSA Geological society of America
GTS Geological time scale
GZi Garnet-zircon index
HGS Houston geological society
HI Hydrogen index
HM Heavy minerals
HP High pressure
15
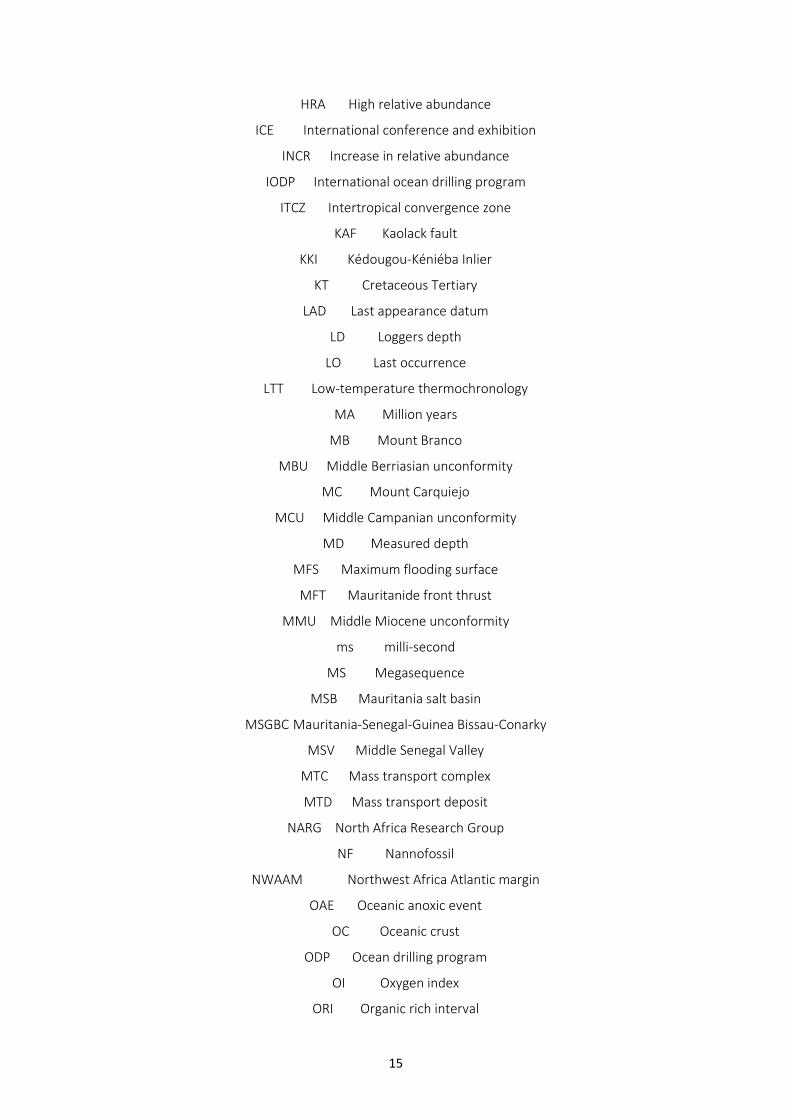
HRA High relative abundance
ICE International conference and exhibition
INCR Increase in relative abundance
IODP International ocean drilling program
ITCZ Intertropical convergence zone
KAF Kaolack fault
KKI Kédougou-Kéniéba Inlier
KT Cretaceous Tertiary
LAD Last appearance datum
LD Loggers depth
LO Last occurrence
LTT Low-temperature thermochronology
MA Million years
MB Mount Branco
MBU Middle Berriasian unconformity
MC Mount Carquiejo
MCU Middle Campanian unconformity
MD Measured depth
MFS Maximum flooding surface
MFT Mauritanide front thrust
MMU Middle Miocene unconformity
ms milli-second
MS Megasequence
MSB Mauritania salt basin
MSGBC Mauritania-Senegal-Guinea Bissau-Conarky
MSV Middle Senegal Valley
MTC Mass transport complex
MTD Mass transport deposit
NARG North Africa Research Group
NF Nannofossil
NWAAM Northwest Africa Atlantic margin
OAE Oceanic anoxic event
OC Oceanic crust
ODP Ocean drilling program
OI Oxygen index
ORI Organic rich interval
16
PD Present day
PESGB Petroleum Exploration Society of Great Britian
PL Picked lithology
PPL Plane polarised light
PRES Presence
PSDM Pre-stack depth migration
PSTM Pre-stack time migration
QFL Quartz lithic feldspar
RC River cut
RCU Regional composite unconformity
RDM Ribiera do Morro
RMS Root mean square
RSL Relative sea level
Rzi Rutile-zircon index
SA South America
SABN Super abundant
SC Slope channels
SDR Seaward dipping reflectors
SEG Society of Exploration Geophysicists
SEM Scanning electron microscope
SEPM Society for Sedimentary Geology
SF Sea floor
SP Shot point
SR Source rock
SWT Seismic well tie
TA Top Albian
TB Top basement
TC Top Cenomanian
TCF Trillion cubic feet
TD Total depth
TJ Top Jurassic
TMP Transform marginal plateau
TNS Top not seen
TOC Top oceanic crust / total organic carbon
TV Top volcanics
TWT Two-way time
17
UCAD Universite Cheikh Anta Diop
UHP Ultra high pressure
UK United Kingdom
US United States
USA United States of America
UTM Universal Transverse Mercator
UTU Upper transitional unit
VF Valanginian flooding surface
WA Waini arch
WAC West African craton
WACMA West African Coast magentic anomoly
WAM West African Monsoon
WGS World Geodetic System
XPL Cross polarised light
XRD X-ray diffraction
18
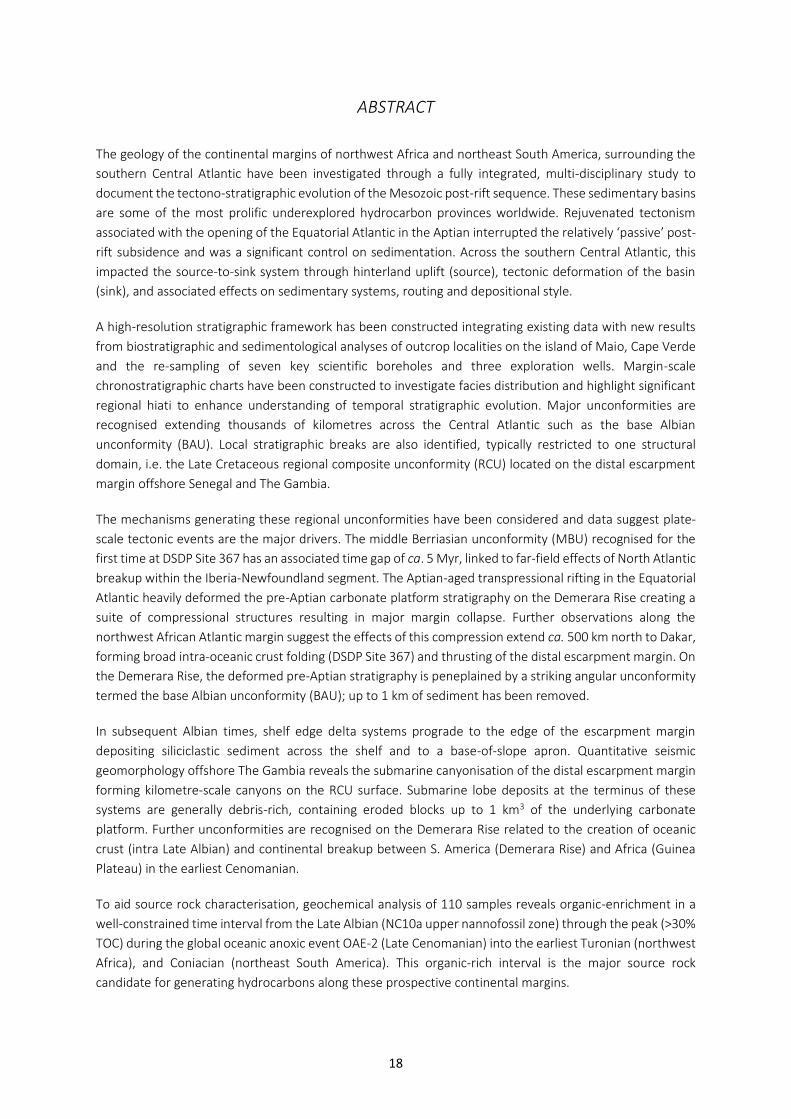
ABSTRACT
The geology of the continental margins of northwest Africa and northeast South America, surrounding the
southern Central Atlantic have been investigated through a fully integrated, multi-disciplinary study to
document the tectono-stratigraphic evolution of the Mesozoic post-rift sequence. These sedimentary basins
are some of the most prolific underexplored hydrocarbon provinces worldwide. Rejuvenated tectonism
associated with the opening of the Equatorial Atlantic in the Aptian interrupted the relatively ‘passive’ post-
rift subsidence and was a significant control on sedimentation. Across the southern Central Atlantic, this
impacted the source-to-sink system through hinterland uplift (source), tectonic deformation of the basin
(sink), and associated effects on sedimentary systems, routing and depositional style.
A high-resolution stratigraphic framework has been constructed integrating existing data with new results
from biostratigraphic and sedimentological analyses of outcrop localities on the island of Maio, Cape Verde
and the re-sampling of seven key scientific boreholes and three exploration wells. Margin-scale
chronostratigraphic charts have been constructed to investigate facies distribution and highlight significant
regional hiati to enhance understanding of temporal stratigraphic evolution. Major unconformities are
recognised extending thousands of kilometres across the Central Atlantic such as the base Albian
unconformity (BAU). Local stratigraphic breaks are also identified, typically restricted to one structural
domain, i.e. the Late Cretaceous regional composite unconformity (RCU) located on the distal escarpment
margin offshore Senegal and The Gambia.
The mechanisms generating these regional unconformities have been considered and data suggest plate-
scale tectonic events are the major drivers. The middle Berriasian unconformity (MBU) recognised for the
first time at DSDP Site 367 has an associated time gap of ca. 5 Myr, linked to far-field effects of North Atlantic
breakup within the Iberia-Newfoundland segment. The Aptian-aged transpressional rifting in the Equatorial
Atlantic heavily deformed the pre-Aptian carbonate platform stratigraphy on the Demerara Rise creating a
suite of compressional structures resulting in major margin collapse. Further observations along the
northwest African Atlantic margin suggest the effects of this compression extend ca. 500 km north to Dakar,
forming broad intra-oceanic crust folding (DSDP Site 367) and thrusting of the distal escarpment margin. On
the Demerara Rise, the deformed pre-Aptian stratigraphy is peneplained by a striking angular unconformity
termed the base Albian unconformity (BAU); up to 1 km of sediment has been removed.
In subsequent Albian times, shelf edge delta systems prograde to the edge of the escarpment margin
depositing siliciclastic sediment across the shelf and to a base-of-slope apron. Quantitative seismic
geomorphology offshore The Gambia reveals the submarine canyonisation of the distal escarpment margin
forming kilometre-scale canyons on the RCU surface. Submarine lobe deposits at the terminus of these
systems are generally debris-rich, containing eroded blocks up to 1 km3 of the underlying carbonate
platform. Further unconformities are recognised on the Demerara Rise related to the creation of oceanic
crust (intra Late Albian) and continental breakup between S. America (Demerara Rise) and Africa (Guinea
Plateau) in the earliest Cenomanian.
To aid source rock characterisation, geochemical analysis of 110 samples reveals organic-enrichment in a
well-constrained time interval from the Late Albian (NC10a upper nannofossil zone) through the peak (>30%
TOC) during the global oceanic anoxic event OAE-2 (Late Cenomanian) into the earliest Turonian (northwest
Africa), and Coniacian (northeast South America). This organic-rich interval is the major source rock
candidate for generating hydrocarbons along these prospective continental margins.
19
DECLARATION
No portion of the work referred to in the thesis has been submitted in support of an application for another
degree or qualification of this or any other university or other institute of learning.
COPYRIGHT STATEMENT
i. The author of this thesis (including any appendices and/or schedules to this thesis) owns certain copyright
or related rights in it (the “Copyright”) and he has given The University of Manchester certain rights to use
such Copyright, including for administrative purposes.
ii. Copies of this thesis, either in full or in extracts and whether in hard or electronic copy, may be made only
in accordance with the Copyright, Designs and Patents Act 1988 (as amended) and regulations issued under
it or, where appropriate, in accordance with licensing agreements which the University has from time to
time. This page must form part of any such copies made.
iii. The ownership of certain Copyright, patents, designs, trademarks and other intellectual property (the
“Intellectual Property”) and any reproductions of copyright works in the thesis, for example graphs and
tables (“Reproductions”), which may be described in this thesis, may not be owned by the author and may
be owned by third parties. Such Intellectual Property and Reproductions cannot and must not be made
available for use without the prior written permission of the owner(s) of the relevant Intellectual Property
and/or Reproductions.
iv. Further information on the conditions under which disclosure, publication and commercialisation of this
thesis, the Copyright and any Intellectual Property and/or Reproductions described in it may take place is
available in the University IP Policy (see http://documents.manchester.ac.uk/DocuInfo.aspx?DocID=24420),
in any relevant Thesis restriction declarations deposited in the University Library, The University Library’s
regulations (see http://www.library.manchester.ac.uk/ about/regulations/) and in The University’s policy on
Presentation of Theses.
20
ACKNOWLEDGEMENTS
The unwavering support of many individuals deserves to be recognised in the completion of my PhD project.
First and foremost, I thank Jonathan Redfern for his encouragement and support to continue exploring over
the last three years. From our escapades on the island of Maio to the dusty core store in Senegal, I have
thoroughly enjoyed your supervision and I gratefully appreciate the opportunities associated with the PhD.
This study was funded by the North Africa Research Group (NARG) and I acknowledge the financial and
scientific support of the consortium sponsors. The University of Manchester was a fantastic host for
conducting this research, I am appreciative of the additional supervision I received. Petrosen, the National
Oil Company of Senegal, and Shell are thanked for data provision. The European Consortium for Ocean
Research Drilling (ECORD) provided a grant to support our re-investigation of the legacy Deep Sea Drilling
Project data.
A few special acknowledgements are extended to the following. Jason Jeremiah, it has been a pleasure to
work with you, your guidance and willingness to contribute from day one is a testament to the gentleman
you are. I will always chuckle at that time you nearly missed the only return boat off Maio. Gérôme Calvès,
our chance meeting at Manchester paved way for a cracking virtual friendship. Volunteering your
supervision was very honourable of you. Thank you for taking me under your wing. The Bulots, I have always
felt very welcome in your family following our field work in Popenguine, and throughout the subsequent
international adventures together, thank you both. Luc Bulot, I raise my beer to you for always being on
hand and teaching me to work critically, ‘cheers mate’!
Last but by no means least, I thank my family and friends. To my mother, father and brother who throughout
the years chasing my aspirations have always been the solid foundation for me to rely upon. You gave me
the platform and encouragement to attain these goals, and despite being unconventional within the family,
you have followed with love and interest throughout. I hope I’ve made you proud. I extend this appreciation
to the remainder of my family, both with us and unfortunately absent. Friends in Manchester, within NARG
and the Basins group are thanked for helping make my PhD experience very pleasant and smooth. Finally, I
acknowledge the support of my friends outside academia and thank them for the lovely times where their
loyal friendship and advice has really helped guide me through my studies.
21
THESIS OUTLINE
The thesis has been prepared in the Journal Format outlined by the University of Manchester, consisting of
six chapters and three additional appendices. Chapter 1 starts with an introduction to continental margins
to provide context for the study, followed by the geological history of the Central Atlantic and by extension,
the surrounding continental margins of northwest Africa, northeast South America and the eastern US. The
approach adopted for the study is presented alongside the studied datasets.
Chapter 2 – ‘Deep sea rock record exhumed on oceanic volcanic islands: the Cretaceous sediments of Maio,
Cape Verde’
Published in Gondwana Research (Casson, M., Bulot, L.G., Jeremiah, J. and Redfern, J., 2020. Deep sea rock
record exhumed on oceanic volcanic islands: the Cretaceous sediments of Maio, Cape Verde. Gondwana
Research, 81, pp.252-264.), this chapter presents the results from one field campaign undertaken in January
2018 by the authors on the island of Maio, Cape Verde. This is supplemented by an extensive revision of the
historical palaeontological collection of Stahlecker (1935) located in the University of Tubingen, Germany. A
high-resolution stratigraphic framework is developed for the exhumed oceanic domain sediments
integrating multiple biostratigraphic techniques with field sedimentology.
Co-author contributions: Luc Bulot (palaeontology investigation, ammonoid identification, manuscript
review); Jason Jeremiah (field associate, calcareous nannofossil identification, manuscript review); Jonathan
Redfern (supervision, field associate, manuscript review).
Chapter 3 – ‘An integrated stratigraphic re-evaluation of key Central Atlantic DSDP sites’
The stratigraphy of three key Deep Sea Drilling Project (DSDP) sites, 367, 368 and 534A in the oceanic domain
of the Central Atlantic are revised following multiple sampling trips to the IODP core repository in Bremen,
Germany. These three wells are fundamental in constraining the Mesozoic stratigraphy within the basin.
New biostratigraphic, sedimentology and organic geochemical results are presented and correlated to
regional two-dimensional seismic profiles.
Co-author contributions: Jason Jeremiah (sampling assistant, calcareous nannofossil identification,
manuscript review); Gérôme Calvès (supervision); Frederic de Ville de Goyet (palynology); Luc Bulot
(manuscript review); Jonathan Redfern (supervision, manuscript review).
22
Chapter 4 – ‘Cretaceous continental margin evolution revealed using quantitative seismic geomorphology,
offshore northwest Africa’
Results from previous chapters establishing the stratigraphic framework are applied to a three-dimensional
seismic dataset, offshore The Gambia in hydrocarbon exploration blocks A1 and A4. This work is published
open access in Basin Research (Casson, M., Calvès, G., Huuse, M., Sayers, B. and Redfern, J., 2020. Cretaceous
continental margin evolution revealed using quantitative seismic geomorphology, offshore northwest Africa.
Basin Research). The location of the dataset allows coeval shelfal and basinal depositional systems to be
investigated revealing a complex tectono-stratigraphic evolution of the distal continental margin.
Co-author contributions: Gérôme Calvès (supervision, manuscript review); Jonathan Redfern (supervision,
manuscript review); Mads Huuse (manuscript review); Ben Sayers (dataset provider, manuscript review).
Chapter 5 – ‘Evaluating the segmented post-rift stratigraphic architecture of the Guyanas continental
margin’
Prepared to be submitted to Petroleum Geoscience, this chapter extends the existing work on the African
margin to the conjugate South American margin, offshore Guyana to French Guiana. Seven key scientific
boreholes and exploration wells are re-evaluated following further sampling in Bremen, and additional
sampling of the exploration wells provided by Shell in Houston, US. Stratigraphic results are incorporated
into a refined tectono-stratigraphic framework and applied to a two-dimensional deep-penetrating seismic
dataset provided by ION Geophysical. This basin-scale dataset is used to construction gross depositional
environment maps and perform structural restorations. Positioned at a crucial location within the Central
Atlantic, the stratigraphic and structural response to the opening of the Equatorial Atlantic is explored.
Co-author contributions: Jason Jeremiah (sampling assistant – Bremen, calcareous nannofossil
identification, GDE mapping guidance; manuscript preparation); Gérôme Calvès (supervision, manuscript
review); Frédéric de Ville de Goyet (palynology); Kyle Reuber (dataset provider, seismic interpretation
supervision, concept discussions); Mike Bidgood (foraminifera dating); Daniela Reháková (calpionellid
dating); Luc Bulot (biostratigraphic review); Jonathan Redfern (supervision, sampling assistant – Houston,
manuscript review).
Chapter 6 – Synthesis
Results from the previous chapters are synthesised into a Central Atlantic tectono-stratigraphic framework.
Five regional palaeogeographic maps are presented for the eastern Central Atlantic (Africa and South
America). The biostratigraphic constraints, organic-enrichment, tectonics and palaeogeography are all
discussed.
23
Chapter 7 – Conclusions
Additional Research
Casson, M., Cavin, L., Jeremiah, J., Bulot, L.G. and Redfern, J., 2018. Fishing in the Central Atlantic, an Earliest
Cenomanian Ichthyodectiform from DSDP Site 367, Cape Verde Basin. Journal of Vertebrate Paleontology,
38(5).
Cumberpatch, Z., Soutter, E., Kane, I.A. and Casson, M., 2020. Evolution of a mixed siliciclastic-carbonate
deep-marine system on an unstable margin: the Cretaceous of the Eastern Greater Caucasus, Azerbaijan.
Basin Research.
Mounteney, I., Casson, M., Ruston, J., Millar, I., Dethie, N. and Redfern, J. 2020. Discerning the provenance
record of fresh detritus versus recycled sediment in Tertiary to modern-day source-to-sink systems of
Senegal. Submitted to the Journal of African Earth Sciences.

24
1 Introduction
Introduction
25
1.1 SCOPE OF THE THESIS
Continental margins cover over a tenth of the Earth’s surface. Our geological and geophysical
characterisation of these sedimentary basins is still evolving. This research asks fundamental questions
about major earth systems and processes. From an applied perspective, rifted margins are the most
voluminous sediment accumulations on Earth, host essential energy and natural resources, and provide a
rich record of global climatic and environmental changes.
Rifted or Atlantic-type “passive” continental margins form by continental breakup and subsequent sea-floor
spreading. Models of rifting and their formation indicate a period of initial extension creating rifts followed
by continental breakup and oceanic crust formation (McKenzie, 1978). The magnitude and orientation of
strain rate, presence of fluids, and the crustal and mantle rheology dictates the final geometry of rifted
margins (Peron-Pinvidic & Manatschal, 2019). This can also be influenced by other parameters such as: rift
obliquity, structural inheritance, and sedimentary and magmatic volumes during rifting. Along a dip profile
(Fig. 1.1), the margin can be divided into different domains (proximal – necking – continental-ocean
boundary/COB – distal – oceanic) and are typically classified as volcanic versus non-volcanic depending on
the magma volume during rifting (Franke, 2013).
Fig. 1.1 – Highly schematic cross-section orientated east-west of the northwest African Atlantic continental margin partitioned into various domains after Peron-Pinvidic et al. (2013). COB – continent ocean boundary; SDRs – seaward dipping reflectors. The approximate location of the section is shown in Fig. 1.8.
The overlying sedimentary fill is heterogeneous through these domains recording a complex interplay
between major Earth system processes. Accommodation is controlled by tectonic and thermal subsidence,
as well as isostasy. Erosion, which is influenced by eustasy and climate, governs sediment transfer through
sedimentary systems thousands of kilometres long, from the hinterland to the basin floor. Sedimentation
occurs in all of the domains, although over time and repeated erosional cycles most sediment will be
transported and deposited in the oceanic domain. Here in the ‘sink’, the stratigraphy is a major archive of
Chapter 1
26
past climates, oceanography and globally significant events (e.g. oceanic anoxic events – OAEs). Studying
the entire length of these sedimentary systems has been coined source-to-sink analysis (Allen, 2008; Clift et
al., 2008; Sømme et al., 2009; Martinsen et al, 2010).
This PhD study falls under a wider source-to-sink project undertaken by the North Africa Research Group
(NARG) that aims to understand the geological evolution of the continental margins of northwest Africa.
Previous work by NARG had focussed on the Moroccan onshore geology due to the abundance of
outcropping Mesozoic strata related to Alpine inversion. Studies targeted the full source-to-sink extent of
the continental margin. Charton (2018) documented kilometre-scale post-rift exhumation of the Moroccan
hinterland using low-temperature thermochronology, this novel dataset has now been expanded southward
along the Mauritanides revealing the whole margin has a dynamic rather than ‘passive’ post-rift uplift history
(Gouiza et al., 2019). To supplement this, multiple projects characterised the Mesozoic shelfal to non-marine
depositional systems from outcrops in the Essaouira-Agadir and North Aaiun-Tarfaya basins (Luber, 2017;
Arantegui, 2018; Duval-Arnould, 2020). Primarily these studies combined two key methods, outcrop
sedimentology and biostratigraphy. Due to the position in the depositional system, i.e. shallow marine, these
outcrops have high macro- and micro-palaeontological recovery and hence make ideal candidates to create
‘type’ sections of the Central Atlantic (i.e. Luber et al., 2019). NARG has been building a high-resolution
Mesozoic stratigraphic framework more applicable to the Central Atlantic than traditional schemes
correlating to the Tethyan and Boreal realms. Muniz-Pichel (2018) was the first NARG PhD to apply this
knowledge to a seismic dataset offshore Morocco to understand how salt tectonics controlled depositional
systems in the sink.
By 2016, hydrocarbon exploration companies and sponsors of NARG had shifted their frontier exploration
campaigns further south to the emerging hydrocarbon province of the Mauritania-Senegal-Guinea Bissau-
Conakry (MSGBC) basin. A report from the United States Geological Survey estimates hydrocarbon volumes
of 2.3 billion barrels of oil and 18.7 billion cubic feet of gas (Brownfield and Charpentier, 2003). Recent
exploration, 2014 to present day, has begun proving up these reserves. Offshore Senegal, Cairn Energy and
partners discovered the Sangomar field (previously SNE) containing 641 million barrels of oil in Albian-aged
reservoirs locaed at the paleo-shelf edge, and additional reserves in the equivalent downdip base-of-slope
fans (FAN and FAN-South; Clayburn, 2017). BP and Kosmos Energy estimate that their acreage offshore
Senegal and Mauritania contains between 50-100 trillion cubic feet of gas, already proving up most of this
volume in the Greater Tortue Ahmeyim field, Yakaar-Teranga discoveries and BirAllah area in basin-floor
turbidite reservoirs (Kosmos Energy, 2019).
Due to these recent successes that demonstrate the world-class nature of the MSGBC basin, NARG, through
the initiation of this study and subsequent PhD projects, aims to expand on and apply the knowledge
generated in North Africa to this prolific area. I was the first student from NARG working in the basin, and
Introduction
27
this thesis documents significant research undertaken to understand existing studies and generate new
datasets. Following a multi-disciplinary approach integrating a variety of datasets, outcrop, wells, seismic
reflection data, the aims were to:
- Apply and build on previous NARG studies to establish a ‘Central Atlantic stratigraphic framework’,
delivering high-resolution, multi-disciplinary biostratigraphy, and leveraging findings from the
reference sections established in Morocco.
- Investigate Mesozoic continental margin evolution across the full length of the basin, from proximal
to oceanic domains, and understand how the depositional sequences change spatially and
temporally.
- Identify and characterise any regional unconformities, determine spatial distribution and
subsequent impact on the evolution of the continental margins.
- Characterise geochemically organic-rich intervals.
- Ascertain the drivers, i.e. tectonics, eustasy, climate, behind continental margin evolution to
construct a tectono-stratigraphic framework.
During the project, the study area was expanded to include the conjugate margins of northeast South
America (Guyanas) and US Atlantic to compare and contrast continental margin evolution and evaluate the
regional aspects of the Central Atlantic geology.
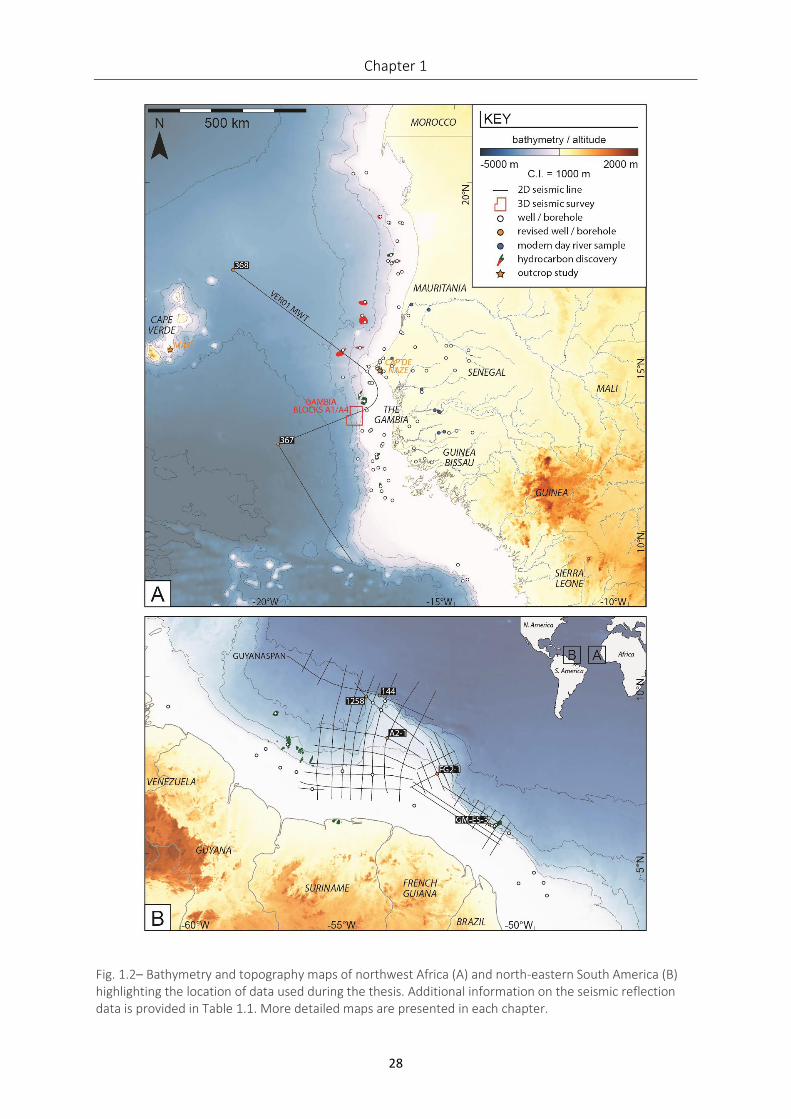
Chapter 1
28
Fig. 1.2– Bathymetry and topography maps of northwest Africa (A) and north-eastern South America (B) highlighting the location of data used during the thesis. Additional information on the seismic reflection data is provided in Table 1.1. More detailed maps are presented in each chapter.
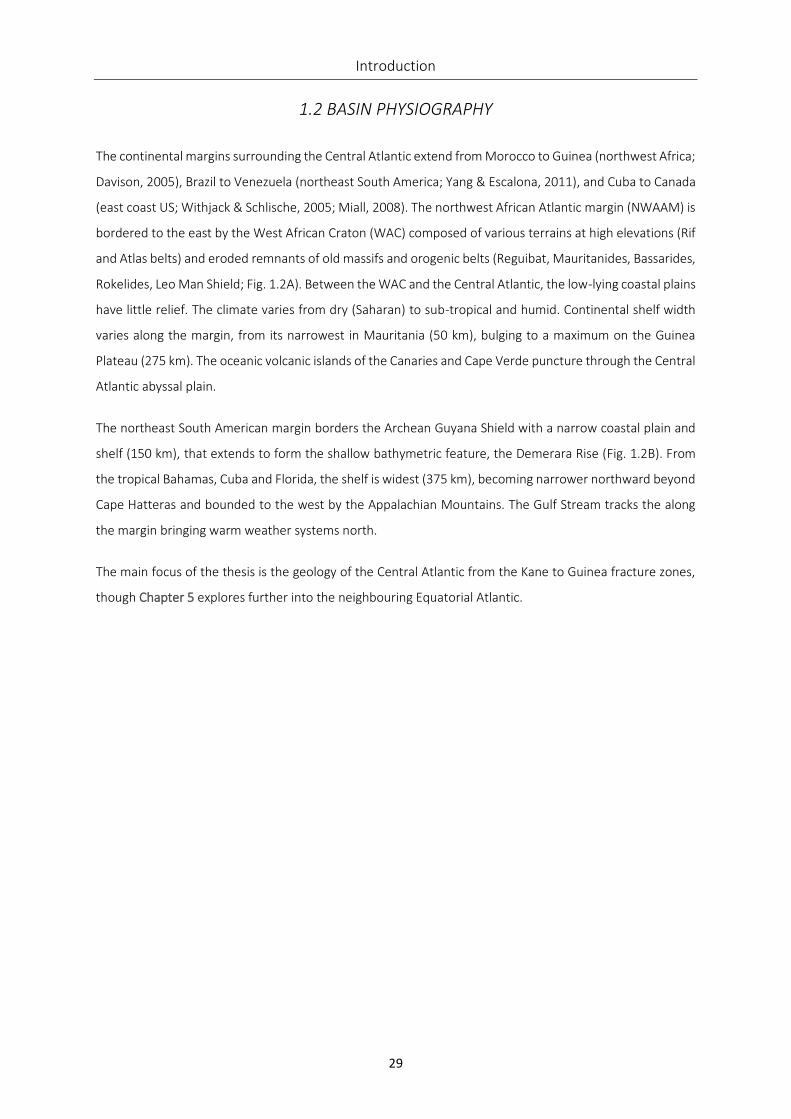
Introduction
29
1.2 BASIN PHYSIOGRAPHY
The continental margins surrounding the Central Atlantic extend from Morocco to Guinea (northwest Africa;
Davison, 2005), Brazil to Venezuela (northeast South America; Yang & Escalona, 2011), and Cuba to Canada
(east coast US; Withjack & Schlische, 2005; Miall, 2008). The northwest African Atlantic margin (NWAAM) is
bordered to the east by the West African Craton (WAC) composed of various terrains at high elevations (Rif
and Atlas belts) and eroded remnants of old massifs and orogenic belts (Reguibat, Mauritanides, Bassarides,
Rokelides, Leo Man Shield; Fig. 1.2A). Between the WAC and the Central Atlantic, the low-lying coastal plains
have little relief. The climate varies from dry (Saharan) to sub-tropical and humid. Continental shelf width
varies along the margin, from its narrowest in Mauritania (50 km), bulging to a maximum on the Guinea
Plateau (275 km). The oceanic volcanic islands of the Canaries and Cape Verde puncture through the Central
Atlantic abyssal plain.
The northeast South American margin borders the Archean Guyana Shield with a narrow coastal plain and
shelf (150 km), that extends to form the shallow bathymetric feature, the Demerara Rise (Fig. 1.2B). From
the tropical Bahamas, Cuba and Florida, the shelf is widest (375 km), becoming narrower northward beyond
Cape Hatteras and bounded to the west by the Appalachian Mountains. The Gulf Stream tracks the along
the margin bringing warm weather systems north.
The main focus of the thesis is the geology of the Central Atlantic from the Kane to Guinea fracture zones,
though Chapter 5 explores further into the neighbouring Equatorial Atlantic.
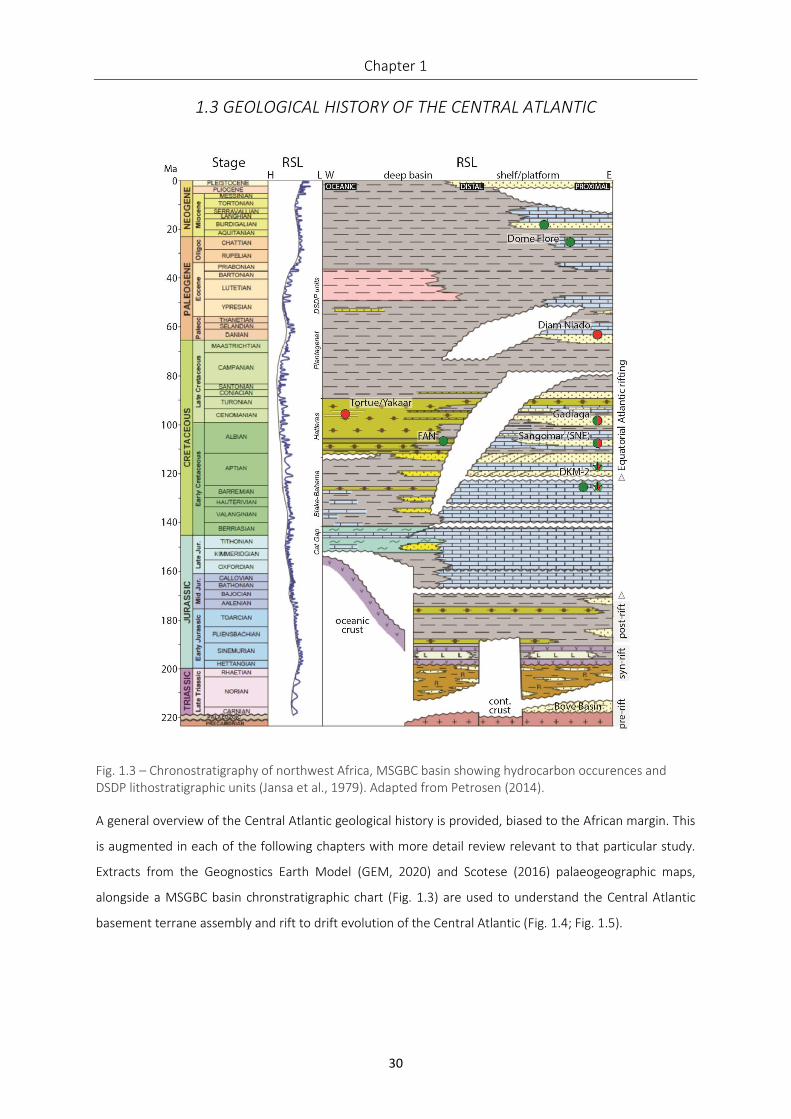
Chapter 1
30
1.3 GEOLOGICAL HISTORY OF THE CENTRAL ATLANTIC
Fig. 1.3 – Chronostratigraphy of northwest Africa, MSGBC basin showing hydrocarbon occurences and DSDP lithostratigraphic units (Jansa et al., 1979). Adapted from Petrosen (2014).
A general overview of the Central Atlantic geological history is provided, biased to the African margin. This
is augmented in each of the following chapters with more detail review relevant to that particular study.
Extracts from the Geognostics Earth Model (GEM, 2020) and Scotese (2016) palaeogeographic maps,
alongside a MSGBC basin chronstratigraphic chart (Fig. 1.3) are used to understand the Central Atlantic
basement terrane assembly and rift to drift evolution of the Central Atlantic (Fig. 1.4; Fig. 1.5).
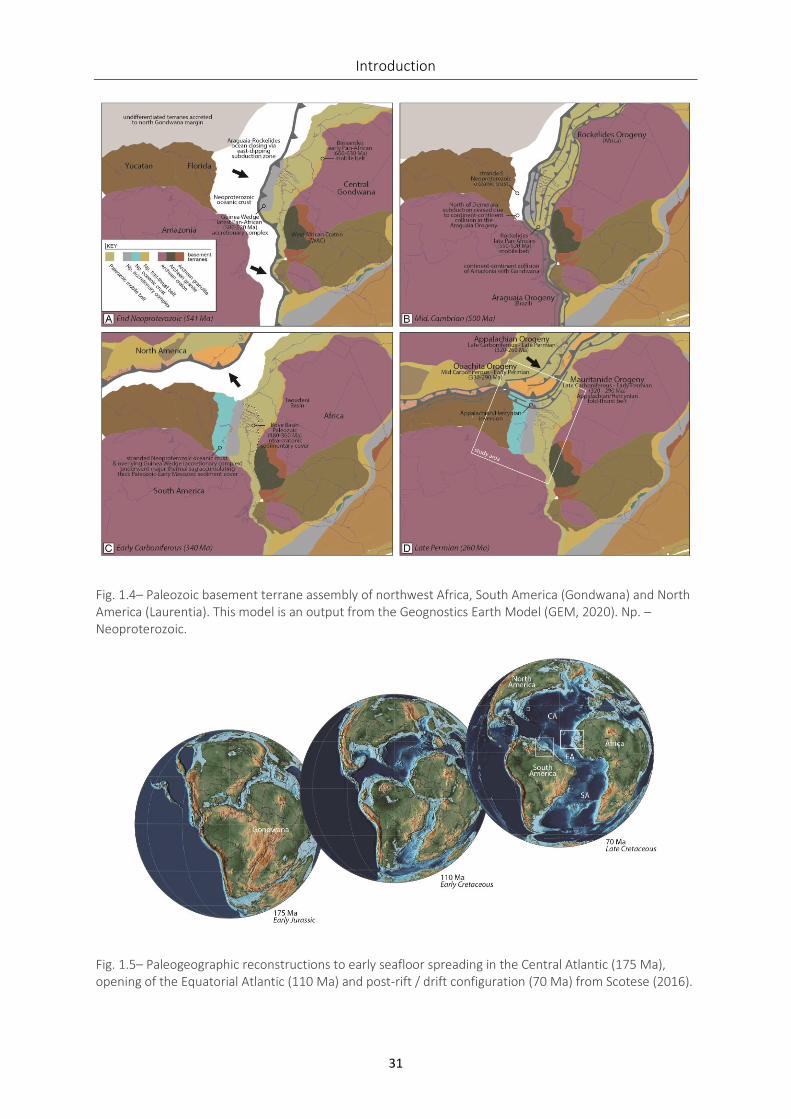
Introduction
31
Fig. 1.4– Paleozoic basement terrane assembly of northwest Africa, South America (Gondwana) and North America (Laurentia). This model is an output from the Geognostics Earth Model (GEM, 2020). Np. – Neoproterozoic.
Fig. 1.5– Paleogeographic reconstructions to early seafloor spreading in the Central Atlantic (175 Ma), opening of the Equatorial Atlantic (110 Ma) and post-rift / drift configuration (70 Ma) from Scotese (2016).
Chapter 1
32
White boxes indicate the conjugated study areas. CA – Central Atlantic; EA – Equatorial Atlantic; SA – South America.
Pre-rift – Prior to Central Atlantic rifting and fragmentation of Gondwana, the pre-Mesozoic geological
history involved numerous orogenic events accreting various terranes to the relatively stable Precambrian
cratons, the WAC and Amazonia Craton (Kennedy, 1964; Binks & Fairhead, 1992). Two Archean shields are
exposed present-day within the WAC, the Reguibat and Leo Man (Gueye et al., 2007; Villeneuve, 2008;
Villeneuve et al., 2015). Smaller exposed inliers also exist, i.e. the Kédougou-Kéniéba inliers (Ledru et al.,
1991; Milési et al., 1992). The Guyana Shield, part of the exposed Amazonia Craton, is built of several
Archean to Proterozoic terrains accreted in multiple orogenic episodes, (1) Trans-Amazonian
(Paleoproterozoic), (2) Late Mesoproterozoic, and (3) Araguaia (Neoproterozoic; Almeida et al., 2000). The
fundamental geological events that formed the basement terrane framework are summarised in Fig. 1.4. At
the end of the Neoproterozoic (Fig. 1.4A), the Florida and Yucatan blocks remained sutured to Amazonia,
which at the time was being subducted via an east-dipping subduction zone. This bordered the WAC, i.e. on
the western boundary of the Guinea Wedge, a latest Pan-African (580-520 Ma) accretionary complex
interpreted south of Dakar (GEM, 2020). Accreted Neoproterozoic oceanic crust was also subducted
between the two cratons. By Middle Cambrian times (500 Ma; Fig. 1.4B) continent-continent collision
between Amazonia and Central Gondwana formed the Araguaia orogenic belt stretching through Brazil
(Almeida et al., 2000). This deformation continued north along the western margin of Gondwana forming
the Rockelides Orogeny; rocks of this age, i.e. late Pan-African (550-520 Ma) are exposed present-day in
Sierra Leone (Villeneuve, 2008). Due to this continental-continental collision and closure in the south,
subduction north of the Demerara Rise ceased, this left stranded Neoproterozoic oceanic crust within the
proto-Central Atlantic south of Dakar (GEM, 2020).
Closure of the Rheic Ocean occurred in the Late Paleozoic as Gondwana and Laurussia (North America)
docked to form the supercontinent Pangea (Fig. 1.4C). Across the Gondwana continent, several Paleozoic
cratonic basins filled with sedimentary cover; the Bove Basin in southern Senegal to Guinea, and the
Taoudeni Basin in Mauritania and Mali (Culver & Hunt, 1991; Boudzoumou et al., 2011). It is interpreted that
the thermal sag extended over the stranded Neoproterozoic oceanic crust and overlying Guinea Wedge
based on deep seismic reflection data; thick Paleozoic-Early Mesozoic oceanic sediment accumulated here
(GEM, 2020). Continental collision between Gondwana and Laurussia from End Carboniferous to Late
Permian (Fig. 1.4D) created a series of orogenic belts along the sutured US continental margin, Ouachita,
Appalachian, Alleghenian, Variscan/Hercynian (Pindell, 1985; Poag & Sevon, 1989). On the African margin,
the older Rokelide and Bassaride Pan-African belts are crosscut by the Hercynian Mauritanide fold-thrust
belt (Deynoux, 2006).
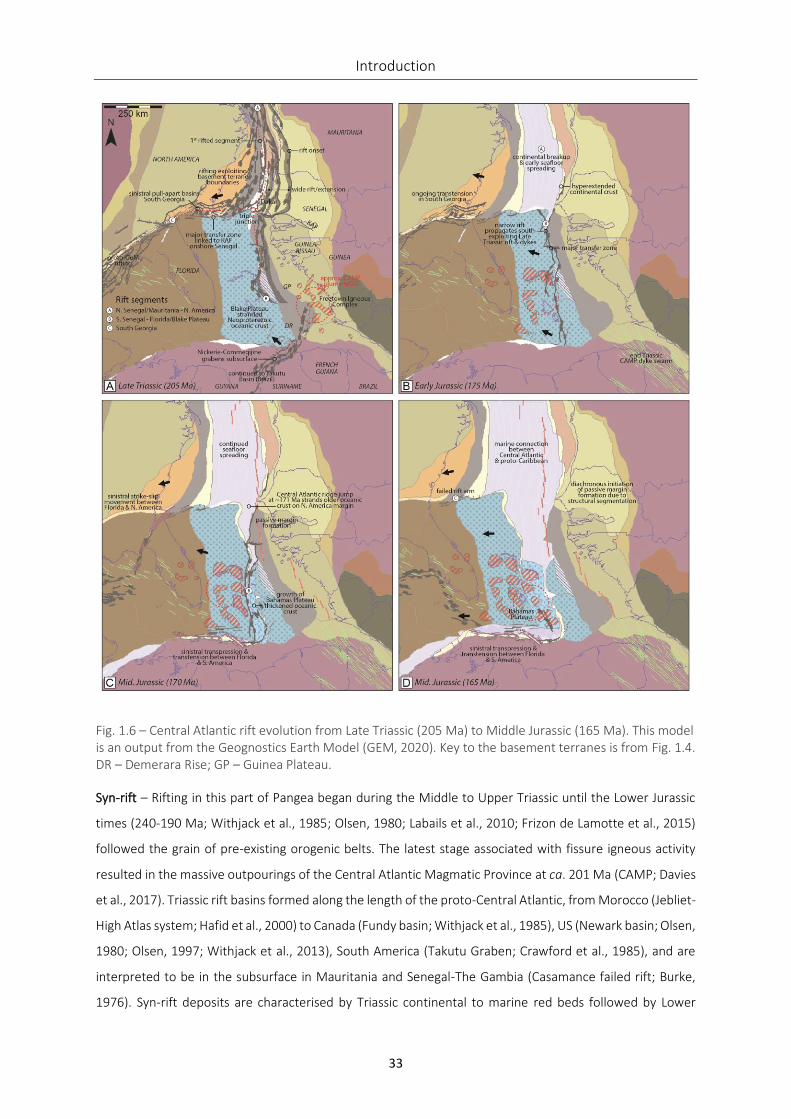
Introduction
33
Fig. 1.6 – Central Atlantic rift evolution from Late Triassic (205 Ma) to Middle Jurassic (165 Ma). This model is an output from the Geognostics Earth Model (GEM, 2020). Key to the basement terranes is from Fig. 1.4. DR – Demerara Rise; GP – Guinea Plateau.
Syn-rift – Rifting in this part of Pangea began during the Middle to Upper Triassic until the Lower Jurassic
times (240-190 Ma; Withjack et al., 1985; Olsen, 1980; Labails et al., 2010; Frizon de Lamotte et al., 2015)
followed the grain of pre-existing orogenic belts. The latest stage associated with fissure igneous activity
resulted in the massive outpourings of the Central Atlantic Magmatic Province at ca. 201 Ma (CAMP; Davies
et al., 2017). Triassic rift basins formed along the length of the proto-Central Atlantic, from Morocco (Jebliet-
High Atlas system; Hafid et al., 2000) to Canada (Fundy basin; Withjack et al., 1985), US (Newark basin; Olsen,
1980; Olsen, 1997; Withjack et al., 2013), South America (Takutu Graben; Crawford et al., 1985), and are
interpreted to be in the subsurface in Mauritania and Senegal-The Gambia (Casamance failed rift; Burke,
1976). Syn-rift deposits are characterised by Triassic continental to marine red beds followed by Lower
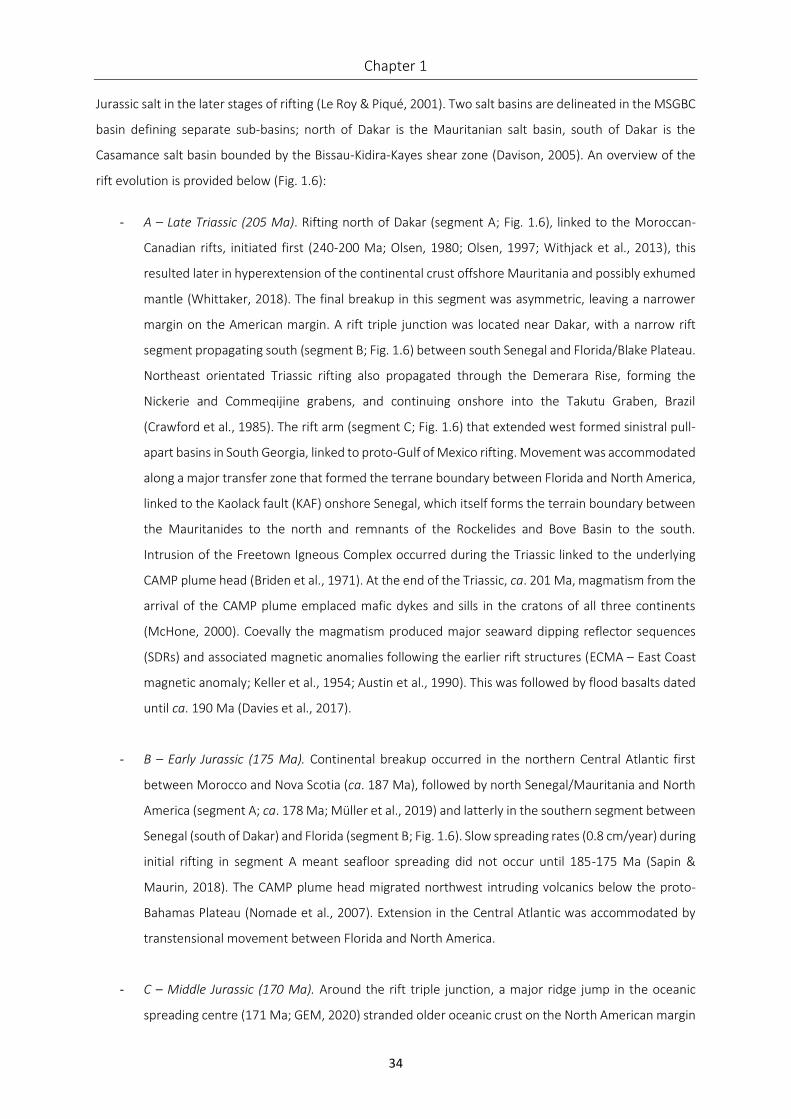
Chapter 1
34
Jurassic salt in the later stages of rifting (Le Roy & Piqué, 2001). Two salt basins are delineated in the MSGBC
basin defining separate sub-basins; north of Dakar is the Mauritanian salt basin, south of Dakar is the
Casamance salt basin bounded by the Bissau-Kidira-Kayes shear zone (Davison, 2005). An overview of the
rift evolution is provided below (Fig. 1.6):
- A – Late Triassic (205 Ma). Rifting north of Dakar (segment A; Fig. 1.6), linked to the Moroccan-
Canadian rifts, initiated first (240-200 Ma; Olsen, 1980; Olsen, 1997; Withjack et al., 2013), this
resulted later in hyperextension of the continental crust offshore Mauritania and possibly exhumed
mantle (Whittaker, 2018). The final breakup in this segment was asymmetric, leaving a narrower
margin on the American margin. A rift triple junction was located near Dakar, with a narrow rift
segment propagating south (segment B; Fig. 1.6) between south Senegal and Florida/Blake Plateau.
Northeast orientated Triassic rifting also propagated through the Demerara Rise, forming the
Nickerie and Commeqijine grabens, and continuing onshore into the Takutu Graben, Brazil
(Crawford et al., 1985). The rift arm (segment C; Fig. 1.6) that extended west formed sinistral pull-
apart basins in South Georgia, linked to proto-Gulf of Mexico rifting. Movement was accommodated
along a major transfer zone that formed the terrane boundary between Florida and North America,
linked to the Kaolack fault (KAF) onshore Senegal, which itself forms the terrain boundary between
the Mauritanides to the north and remnants of the Rockelides and Bove Basin to the south.
Intrusion of the Freetown Igneous Complex occurred during the Triassic linked to the underlying
CAMP plume head (Briden et al., 1971). At the end of the Triassic, ca. 201 Ma, magmatism from the
arrival of the CAMP plume emplaced mafic dykes and sills in the cratons of all three continents
(McHone, 2000). Coevally the magmatism produced major seaward dipping reflector sequences
(SDRs) and associated magnetic anomalies following the earlier rift structures (ECMA – East Coast
magnetic anomaly; Keller et al., 1954; Austin et al., 1990). This was followed by flood basalts dated
until ca. 190 Ma (Davies et al., 2017).
- B – Early Jurassic (175 Ma). Continental breakup occurred in the northern Central Atlantic first
between Morocco and Nova Scotia (ca. 187 Ma), followed by north Senegal/Mauritania and North
America (segment A; ca. 178 Ma; Müller et al., 2019) and latterly in the southern segment between
Senegal (south of Dakar) and Florida (segment B; Fig. 1.6). Slow spreading rates (0.8 cm/year) during
initial rifting in segment A meant seafloor spreading did not occur until 185-175 Ma (Sapin &
Maurin, 2018). The CAMP plume head migrated northwest intruding volcanics below the proto-
Bahamas Plateau (Nomade et al., 2007). Extension in the Central Atlantic was accommodated by
transtensional movement between Florida and North America.
- C – Middle Jurassic (170 Ma). Around the rift triple junction, a major ridge jump in the oceanic
spreading centre (171 Ma; GEM, 2020) stranded older oceanic crust on the North American margin
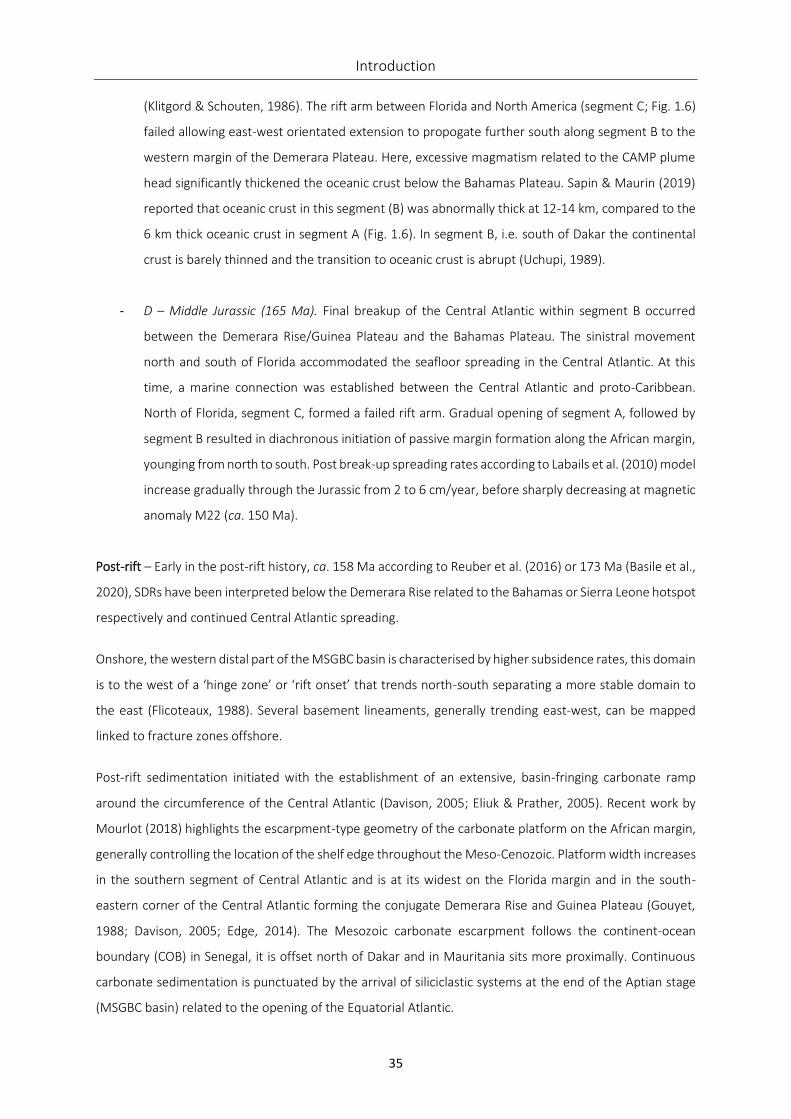
Introduction
35
(Klitgord & Schouten, 1986). The rift arm between Florida and North America (segment C; Fig. 1.6)
failed allowing east-west orientated extension to propogate further south along segment B to the
western margin of the Demerara Plateau. Here, excessive magmatism related to the CAMP plume
head significantly thickened the oceanic crust below the Bahamas Plateau. Sapin & Maurin (2019)
reported that oceanic crust in this segment (B) was abnormally thick at 12-14 km, compared to the
6 km thick oceanic crust in segment A (Fig. 1.6). In segment B, i.e. south of Dakar the continental
crust is barely thinned and the transition to oceanic crust is abrupt (Uchupi, 1989).
- D – Middle Jurassic (165 Ma). Final breakup of the Central Atlantic within segment B occurred
between the Demerara Rise/Guinea Plateau and the Bahamas Plateau. The sinistral movement
north and south of Florida accommodated the seafloor spreading in the Central Atlantic. At this
time, a marine connection was established between the Central Atlantic and proto-Caribbean.
North of Florida, segment C, formed a failed rift arm. Gradual opening of segment A, followed by
segment B resulted in diachronous initiation of passive margin formation along the African margin,
younging from north to south. Post break-up spreading rates according to Labails et al. (2010) model
increase gradually through the Jurassic from 2 to 6 cm/year, before sharply decreasing at magnetic
anomaly M22 (ca. 150 Ma).
Post-rift – Early in the post-rift history, ca. 158 Ma according to Reuber et al. (2016) or 173 Ma (Basile et al.,
2020), SDRs have been interpreted below the Demerara Rise related to the Bahamas or Sierra Leone hotspot
respectively and continued Central Atlantic spreading.
Onshore, the western distal part of the MSGBC basin is characterised by higher subsidence rates, this domain
is to the west of a ‘hinge zone’ or ‘rift onset’ that trends north-south separating a more stable domain to
the east (Flicoteaux, 1988). Several basement lineaments, generally trending east-west, can be mapped
linked to fracture zones offshore.
Post-rift sedimentation initiated with the establishment of an extensive, basin-fringing carbonate ramp
around the circumference of the Central Atlantic (Davison, 2005; Eliuk & Prather, 2005). Recent work by
Mourlot (2018) highlights the escarpment-type geometry of the carbonate platform on the African margin,
generally controlling the location of the shelf edge throughout the Meso-Cenozoic. Platform width increases
in the southern segment of Central Atlantic and is at its widest on the Florida margin and in the south-
eastern corner of the Central Atlantic forming the conjugate Demerara Rise and Guinea Plateau (Gouyet,
1988; Davison, 2005; Edge, 2014). The Mesozoic carbonate escarpment follows the continent-ocean
boundary (COB) in Senegal, it is offset north of Dakar and in Mauritania sits more proximally. Continuous
carbonate sedimentation is punctuated by the arrival of siliciclastic systems at the end of the Aptian stage
(MSGBC basin) related to the opening of the Equatorial Atlantic.
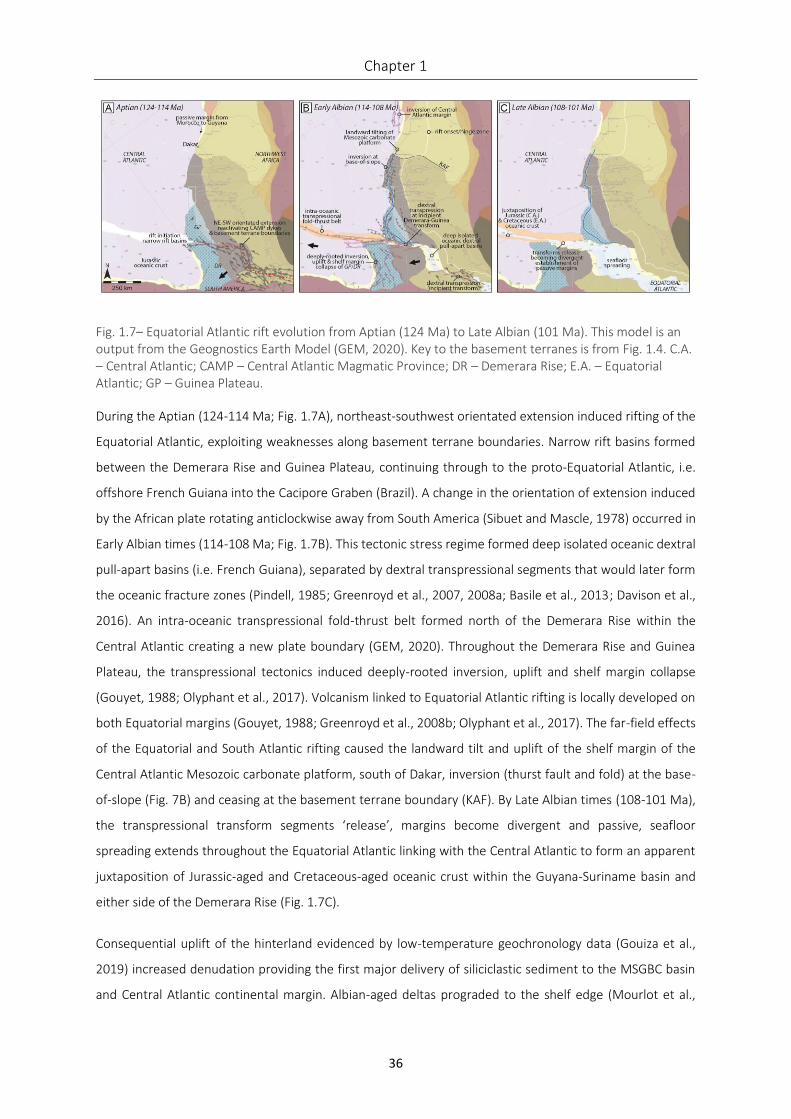
Chapter 1
36
Fig. 1.7– Equatorial Atlantic rift evolution from Aptian (124 Ma) to Late Albian (101 Ma). This model is an output from the Geognostics Earth Model (GEM, 2020). Key to the basement terranes is from Fig. 1.4. C.A. – Central Atlantic; CAMP – Central Atlantic Magmatic Province; DR – Demerara Rise; E.A. – Equatorial Atlantic; GP – Guinea Plateau.
During the Aptian (124-114 Ma; Fig. 1.7A), northeast-southwest orientated extension induced rifting of the
Equatorial Atlantic, exploiting weaknesses along basement terrane boundaries. Narrow rift basins formed
between the Demerara Rise and Guinea Plateau, continuing through to the proto-Equatorial Atlantic, i.e.
offshore French Guiana into the Cacipore Graben (Brazil). A change in the orientation of extension induced
by the African plate rotating anticlockwise away from South America (Sibuet and Mascle, 1978) occurred in
Early Albian times (114-108 Ma; Fig. 1.7B). This tectonic stress regime formed deep isolated oceanic dextral
pull-apart basins (i.e. French Guiana), separated by dextral transpressional segments that would later form
the oceanic fracture zones (Pindell, 1985; Greenroyd et al., 2007, 2008a; Basile et al., 2013; Davison et al.,
2016). An intra-oceanic transpressional fold-thrust belt formed north of the Demerara Rise within the
Central Atlantic creating a new plate boundary (GEM, 2020). Throughout the Demerara Rise and Guinea
Plateau, the transpressional tectonics induced deeply-rooted inversion, uplift and shelf margin collapse
(Gouyet, 1988; Olyphant et al., 2017). Volcanism linked to Equatorial Atlantic rifting is locally developed on
both Equatorial margins (Gouyet, 1988; Greenroyd et al., 2008b; Olyphant et al., 2017). The far-field effects
of the Equatorial and South Atlantic rifting caused the landward tilt and uplift of the shelf margin of the
Central Atlantic Mesozoic carbonate platform, south of Dakar, inversion (thurst fault and fold) at the base-
of-slope (Fig. 7B) and ceasing at the basement terrane boundary (KAF). By Late Albian times (108-101 Ma),
the transpressional transform segments ‘release’, margins become divergent and passive, seafloor
spreading extends throughout the Equatorial Atlantic linking with the Central Atlantic to form an apparent
juxtaposition of Jurassic-aged and Cretaceous-aged oceanic crust within the Guyana-Suriname basin and
either side of the Demerara Rise (Fig. 1.7C).
Consequential uplift of the hinterland evidenced by low-temperature geochronology data (Gouiza et al.,
2019) increased denudation providing the first major delivery of siliciclastic sediment to the MSGBC basin
and Central Atlantic continental margin. Albian-aged deltas prograded to the shelf edge (Mourlot et al.,
Introduction
37
2018a). Subsequent Cenomanian transgression and coeval establishment of coastal upwelling of deep
oceanic water masses resulted in the deposition of a thick organic-rich interval throughout oceanic anoxic
event 2 (OAE-2) and the Cenomanian-Turonian boundary event (Arthur et al., 1984). This transgression
created the Florida Straits and Bahama channels (Sheridan et al., 1983). Far-field tectonic stresses, i.e. the
Santonian compressional event (84-80 Ma) associated with Africa-Europe convergence and a change in the
pole of rotation in the opening Central Atlantic, created the regional Senonian unconformity across the
African continental margin (Martin et al., 2010). During the Maastrichtian, the MSGBC was nearly fully
transgressed to the present-day location of the Mauritanides (Mourlot et al., 2018a). The Cretaceous
sequence is commonly capped by an erosive base Tertiary unconformity across the Central Atlantic (Davison,
2005).
Volcanism and uplift of the Cape Verde archipelago, and an associated basement bulge is postulated to co-
occur in the Late Cretaceous through to emergence in the Miocene (Bellion & Crevola, 1991; Patriat &
Labails, 2006; Hansen et al., 2008; Holm et al., 2008). Seamounts related to the Canaries Island are dated
between 142 and 91 Ma (van den Bogaard, 2013), indicating earlier Lower Cretaceous-aged volcanism along
the African margin. Localised volcanic intrusions are scattered throughout the MSGBC basin exploiting pre-
existing basement lineaments, i.e. the Leona Dome near St. Louis (Maastrichtian; Bellion & Crevola, 1991;
Ritz & Bellion, 1994), extensive subsurface Miocene volcanic intrusions (sills and dykes) offshore Senegal,
and similarly timed intra-plate volcanic events leading to the formation of the Cayar seamount and Cap-Vert
peninsula (Hansen et al., 2008). Cap Vert volcanism likely exploited the structural weaknesses at the paleo-
triple junction of the Central Atlantic located near Dakar (Fig. 1.6). This surface exposure has been dated at
ca. 35 Ma (latest Eocene; Bellion & Crevola, 1991; Lo et al., 1992), and is likely part of a much larger volcanic
province extending to east of Thiès, Senegal. The volcanism is thought to be associated with passage of the
African plate above an active mantle hotspot, as Africa collided with Europe (Lo et al., 1992). Holm et al.
(2008) concluded from 40Ar‐39Ar dating of volcanic rocks exposed on the Cape Verde islands that the Rise
was fully established by early Miocene times with associated alkaline volcanism. This volcanism exhumed
Cretaceous basin floor sediments and underlying pillow basalts representing oceanic crust on the island of
Maio. Further volcanism on the eastern chain of islands (Sal, Bao Vista, Maio) occurred through the Miocene
and Pliocene (Holm et al., 2008). Upwelling shallow mantle associated with the Cape Verde volcanism
resulted in downwelling below the continental margin of Mauritania, creating excess subsidence (Lodhia et
al., 2018). A synthesis of the present-day structural configuration is presented in Fig. 1.8.
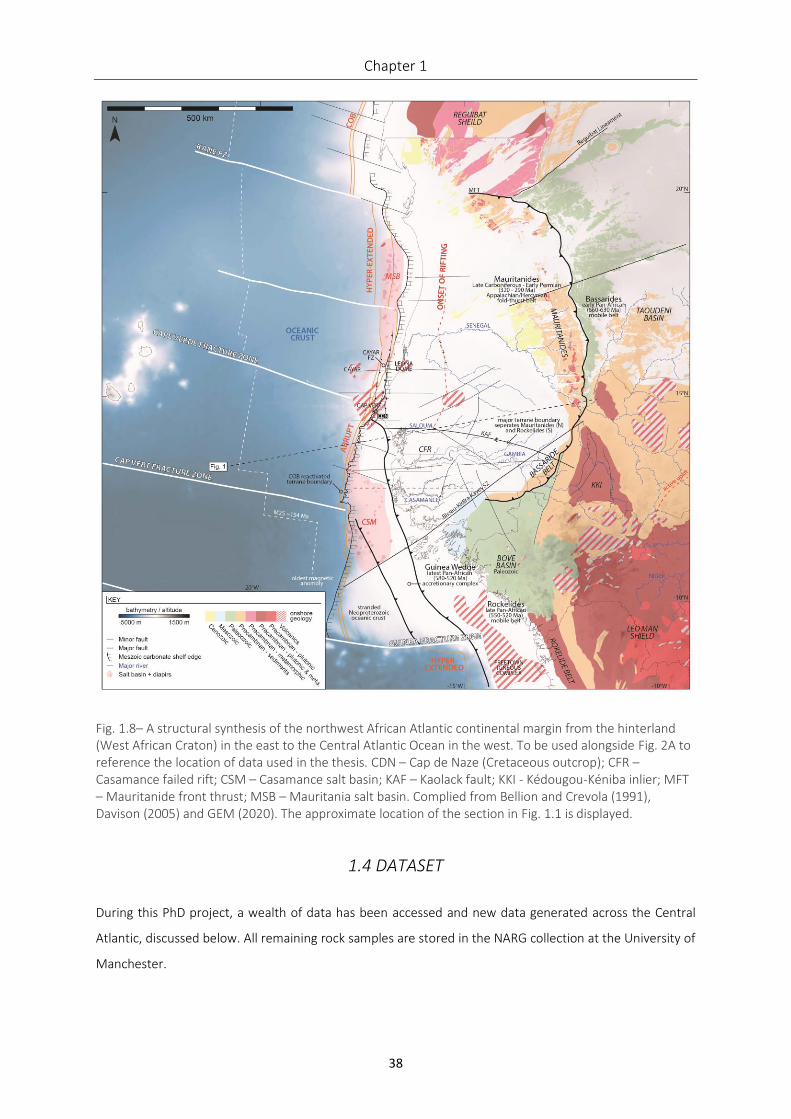
Chapter 1
38
Fig. 1.8– A structural synthesis of the northwest African Atlantic continental margin from the hinterland (West African Craton) in the east to the Central Atlantic Ocean in the west. To be used alongside Fig. 2A to reference the location of data used in the thesis. CDN – Cap de Naze (Cretaceous outcrop); CFR – Casamance failed rift; CSM – Casamance salt basin; KAF – Kaolack fault; KKI - Kédougou-Kéniba inlier; MFT – Mauritanide front thrust; MSB – Mauritania salt basin. Complied from Bellion and Crevola (1991), Davison (2005) and GEM (2020). The approximate location of the section in Fig. 1.1 is displayed.
1.4 DATASET
During this PhD project, a wealth of data has been accessed and new data generated across the Central
Atlantic, discussed below. All remaining rock samples are stored in the NARG collection at the University of
Manchester.
Introduction
39
1.4.1 Field Campaigns
Senegal – Mesozoic sediments in the MSGBC basin rarely outcrop due to Cenozoic cover. Outcrops are
located in the hinterland on the fringes of the Mauritanides and along the Atlantic coastline of Senegal at
Cap de Naze (Popenguine; Fig. 1.8), Cap de Rouge (Nditarh), and in small quarries at Paki. This is due to
Cenozoic uplift of the Ndiass horst (Tessier et al., 1952). Jonathan Redfern and Luc Bulot guided by Petrosen
(Senegalese National Oil Company) and the Université Cheikh Anta Diop de Dakar (UCAD) visited these
outcrops for reconnaissance in June, 2017. This was followed-up with a field campaign in November-
December 2017 with Max Casson, Luc Bulot and Elsa Bulot to collect samples from Cap de Naze for
biostratigraphy, log the sedimentary architecture and capture a photogrammetry dataset. The datasets
captured were worked up by an MSc student, Andreas Bonilla, supervised over summer 2018, the results
are available in his MSc thesis. In November 2018, I led a field course to these outcrops for partners in the
Sangomar field development, Woodside, Cairn Energy, FAR, Petrosen. Additional fieldwork as part of Ian
Mounteney’s PhD project took place in April 2019, sampling sands from the modern river systems of Senegal
and The Gambia.
Maio, Cape Verde – During one field season in January 2018, Prof. Jonathan Redfern and myself completed
a thorough reconnaissance of the island’s geology, supplemented by an extensive literature review. This
highlighted four key sections to log and sample the full extent of the deep-water Mesozoic stratigraphy
brought to surface during the exhumation of the volcanic islands. With Jason Jeremiah, 152 hand specimens
were collected for subsequent analysis. Due to intensive quarrying activities, the collection of new
macrofossils (ammonites) was challenging. Therefore, to complement the analysis of new material collected
during the field season, a visit to the Palaeontological Museum of the University of Tübingen in December
2018 revealed the paleontological collection of Stahlecker (1935), where all remaining specimens were
documented and photographed with Luc Bulot and Elsa Bulot. These four sedimentary logs and detailed
field mapping, plus integration with a reconstruction of Stahlecker’s log (1935), provided a composite
reference section for Maio. These rock samples are recorded in Chapter 2.
1.4.2 Well Data
International Ocean Drilling Project (IODP) Bremen Core Repository BCR – Cores taken during expeditions
of the Deep Sea Drilling Project (DSDP) and Ocean Drilling Project (ODP) within the Central Atlantic are stored
in the MARUM core repository at the University of Bremen, Germany. A wealth of legacy data is hosted here
curated by Holger Kuhlmann. During several visits (August and November, 2017 – Jason Jeremiah; December
2018 – Orrin Bryers) core from seven DSDP/ODP sites were logged and sampled, partially supported by an
European Consortium for Ocean Research Drilling (ECORD) Research Grant awarded in June 2018. These
Chapter 1
40
sampling visits and subsequent requests for infill samples were registered under the following
identifications: 054376IODP, 065859IODP and 077865IODP. Sample tables are provided in Chapter 3.
Senegal Exploration Wells – Through an agreement with Petrosen, samples of drill cuttings and core, as well
as wireline logs and end-of-well reports were provided for the study. Sampling and logging took place in
March 2018 with Jonathan Redfern, collecting samples for biostratigraphy. During an additional visit (April
2019) to the Petrosen office in Dakar, Senegal, Ian Mounteney and myself collected samples of any sands
encountered in these wells for provenance analysis in Ian’s PhD.
Suriname-French Guiana Exploration Wells – Samples of drill cuttings from two exploration wells located
offshore Suriname, Demerara A2-1 and French Guiana, FG2-1 were collected from the CGG storage facility
in Schulenburg, Texas, assisted by Jonathan Redfern during a visit to Houston in September 2018. This data
was provided through an agreement with Shell (NARG sponsor). Tyrone Sigur assisted us with shipping infill
samples following the visit. The Demerara A2-1 is one of the deepest stratigraphic tests to date along the
northeast South American margin, as such is an excellent dataset to extend the stratigraphic framework
across the Central Atlantic. Additionally, drill cutting samples from exploration well GM-ES-3 offshore French
Guiana were shipped in January 2020. All samples are listed in Chapter 5. Peter Osterloff, Shell, provided
wireline data from the three exploration wells to assist with the seismic interpretation.
1.4.3 Seismic Reflection Data
An overview of the seismic reflection datasets available for the PhD is provided in Table 1.1, this is
supplemented in each chapter with the specific configurations of each survey used.
Table 1.1– Summary of seismic reflection datasets available for the study.
Name Location Provider 2D/3D Vintage Time / depth
Total line km / area
km2
Record length
Gambia Blocks A1/A4
The Gambia TGS 3D PSTM
2012 time 2,566 km2
13 secs
GuyanaSPAN Suriname-French Guiana
ION Geophysical
2D PSDM
2013 depth 7970 km 40 km / 25 km
VER01 MWT MSGBC basin Spectrum Geo (now TGS)
2D PSTM
2016-2017
time 1728 km 12.5 secs
Introduction
41
1.5 METHODOLOGY
Various basin analysis techniques outlined in Allen & Allen (2013) have been integrated to understand the
basin evolution and aid paleoenvironmental reconstruction. Primarily this involved revisiting the original
material, wells and outcrop, resampling and reanalysing with updated methodologies and new techniques
previously not applied to these legacy datasets. After an exhaustive literature review including Senegalese
publications in French, the project, and its chapters, typically developed in two overlapping phases beginning
with the analysis of the re-sampled material (outcrop/wells) to build an integrated stratigraphic framework.
Subsequent results were applied to seismic reflection datasets. An overview of these phases is provided
below. During this process, any data captured or generated was added to a personal ArcGIS database,
latterly input into the official NARG Geodatabase.
1.5.1 Stratigraphic Analysis
Through the Mesozoic ammonoids are the primary standard for biochronology with the highest precision
for dating. However, ammonoids are not present and/or preserved in all strata as they are restricted to
specific depositional environments. Recovery is also rare when primarily working with well data
(core/cuttings). Therefore, it is essential to rely on chronometers that are recorded in small quantities (ca.
10 g) of sediment, i.e. microfossils. NARG research in Morocco and across North Africa, where there is
abundant outcrop due to exhumation associated with the Alpine orogeny has focused on establishing
reference sections for the Mesozoic stratigraphy of the Central Atlantic (Luber et al., 2017; 2019; Duval-
Arnold et al., 2020). Typically, these outcrops yield abundant macrofossils, good recovery of microfossils and
carbon isotopes can be measured (δ13C). Thus, key microfossil events can be calibrated against the global
ammonoid scale and chemo-chronological framework to define biozones (Callomon, 1994). A summary of
the biostratigraphic techniques employed in this study are listed in Table 1.2.
Alongside the dating of the sediments, several techniques to further characterise the sedimentology, organic
geochemistry and petrography were used to leverage geological knowledge. Logs recorded in the field and
from core/cuttings recorded the sedimentology, further characterisation of the lithologies was achieved by
analysing thin sections under a light microscope. Additional quantitative data on the lithology was extracted
using x-ray diffraction (XRD) of the whole-rock and clay fraction (Snyder & Bish, 1989). Descriptive
petrographic sandstone classification was performed following the methodology of Garzanti (2016) to
classify the relative percentages of quartz-lithic-feldspar grains (QFL) and determine source provenance. Ian
Mounteney’s PhD will investigate the MSGBC basin sediment provenance in more detail. To quantify the
organic richness of samples, total organic carbon (TOC) was measured. Additional characterisation of the
organic matter, i.e. type and maturity, was conducted using Rock-Eval 6 pyrolysis.

Chapter 1
42
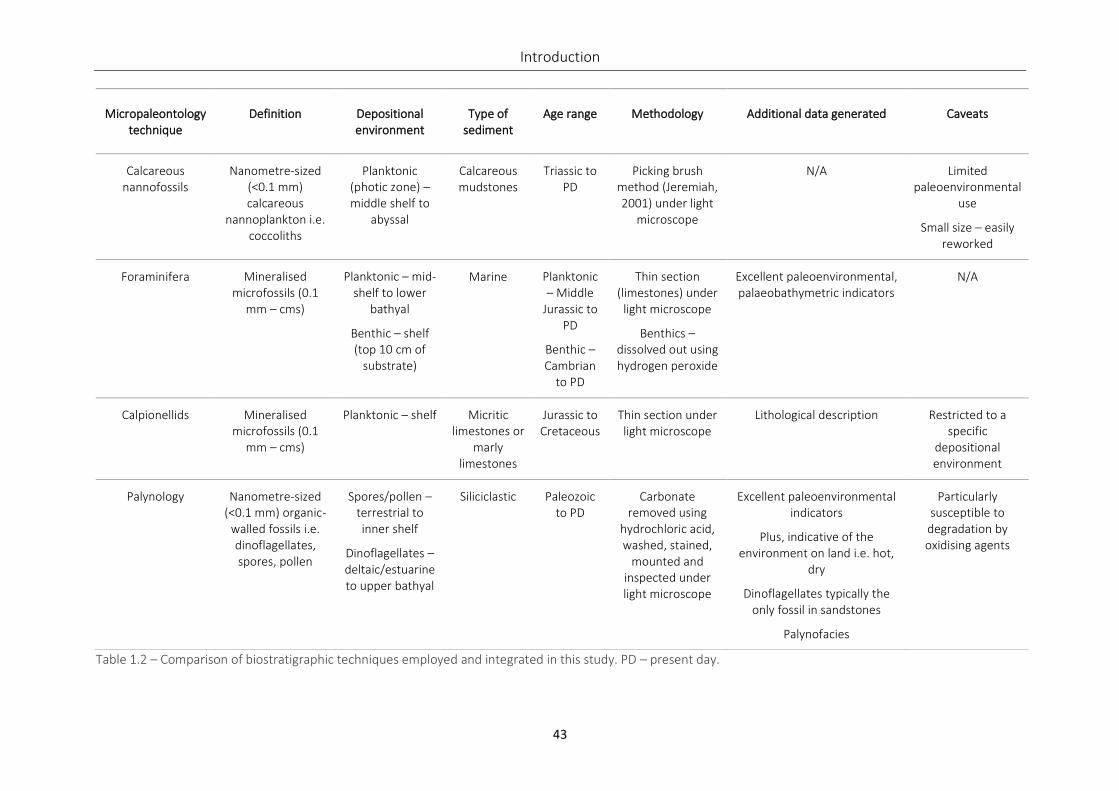
Introduction
43
Table 1.2 – Comparison of biostratigraphic techniques employed and integrated in this study. PD – present day.
Micropaleontology technique
Definition Depositional environment
Type of sediment
Age range Methodology Additional data generated Caveats
Calcareous nannofossils
Nanometre-sized (<0.1 mm) calcareous
nannoplankton i.e. coccoliths
Planktonic (photic zone) – middle shelf to
abyssal
Calcareous mudstones
Triassic to PD
Picking brush method (Jeremiah, 2001) under light
microscope
N/A Limited paleoenvironmental
use
Small size – easily reworked
Foraminifera Mineralised microfossils (0.1
mm – cms)
Planktonic – mid-shelf to lower
bathyal
Benthic – shelf (top 10 cm of
substrate)
Marine Planktonic – Middle
Jurassic to PD
Benthic – Cambrian
to PD
Thin section (limestones) under
light microscope
Benthics – dissolved out using hydrogen peroxide
Excellent paleoenvironmental, palaeobathymetric indicators
N/A
Calpionellids Mineralised microfossils (0.1
mm – cms)
Planktonic – shelf Micritic limestones or
marly limestones
Jurassic to Cretaceous
Thin section under light microscope
Lithological description Restricted to a specific
depositional environment
Palynology Nanometre-sized (<0.1 mm) organic-
walled fossils i.e. dinoflagellates, spores, pollen
Spores/pollen – terrestrial to inner shelf
Dinoflagellates – deltaic/estuarine to upper bathyal
Siliciclastic Paleozoic to PD
Carbonate removed using
hydrochloric acid, washed, stained,
mounted and inspected under light microscope
Excellent paleoenvironmental indicators
Plus, indicative of the environment on land i.e. hot,
dry
Dinoflagellates typically the only fossil in sandstones
Palynofacies
Particularly susceptible to
degradation by oxidising agents
Chapter 1
44
1.5.2 Seismic Interpretation
Seismic imaging of the subsurface provides high-resolution spatial-temporal datasets. Integrated with well
data recorded at a much finer temporal resolution, provides a powerful tool to image the subsurface geology
and perform basin analysis (Cox et al., in press). Several seminal works describe the process of interpreting
seismic reflection data to acquire geological knowledge i.e. Payton (1977), Badley (1985), Avseth (2005) and
Posamentier (2005). These techniques rely on sequence stratigraphic principles defined by Mitchum et al.
(1977); i.e. depositional sequences are stratigraphic units composed of a relatively conformable succession
of genetically related strata bounded by unconformities or their correlative conformities. Different scales of
observations may lead to the assignment of hierarchical orders of depositional sequences and their
bounding surfaces (Catuneanu et al., 2006). First-, second-, and third-order sequences are defined based on
seismic interpretation by Vail et al. (1977) with durations of 200-300 Myr, 10-80 Myr, and 1-10 Myr,
respectively. Sub-third-order sequences and the associated stratal stacking patterns are preserved in rock
data (Catuneanu et al., 2006). Seismic datasets commonly provide knowledge of third-order, maybe fourth-
order systems, documenting basin infill, erosional processes and the interaction of accommodation and
sediment supply.
Schlumberger’s Petrel software was used as the main seismic interpretation package. Cox et al. (in press)
provides an up-to-date review of the seismic interpretation process. Key steps are summarised:
- Data import: Seismic reflection data, 2D and/or 3D, in the time or depth domain is imported into a
project with a suitable co-ordinate reference system. In addition, well data (wireline logs, formation
tops – determined from the stratigraphic analysis) is loaded.
- Seismic-well tie (SWT): If wireline data is available, the SWT bridges the gap between geological
(depth domain) and geophysical (commonly time domain) data. This step provides calibration
between the geological information and different seismic packages, highlighting unconformities
etc. for further investigation.
- Horizon interpretation: Detailed mapping of key reflections, termed ‘horizons’, allows stratal
architecture and facies variations to be understood. Features, such as amplitude, strata
terminations (top lap, down lap, onlap) and geometry are used to describe the seismic stratigraphic
architecture (Payton, 1977). Structure and thickness maps at multiple time intervals can then be
used to understand the spatial-temporal change in depositional and erosional patterns.
- Structural interpretation: Structural features, i.e. faults, intrusions, deformation, are recorded and
integrated with the horizon interpretation to understand the structural controls.
- Seismic attributes: Additional seismic volumes and surface attributes of variance, amplitude, and
coherency etc. can be generated to emphasise structural features and/or depositional system
distribution across a time-equivalent surface.
Introduction
45
Additional advanced techniques are applied and documented in detail in various chapters to extract further
knowledge from the seismic datasets. Depth conversion is used to better constrain the present-day and
palaeo-structure of key surfaces. Spectral decomposition performed in GeoTeric software, of the seismic
data breaks down the seismic signal into frequency bands, colours are assigned to the respective bands and
blended to reveal heterogeneities in the lithology/stratal architecture for better imaging of seismic
geomorphology (Partyka & Gridley, 1999; Posamentier, 2005). Semi-automated seismic interpretation using
PaleoScan™ semi-automates the horizon picking process attempting to pick every possible time-
transgressive horizon to produce ‘horizon stacks’, where it is possible to scroll through depositional surfaces
and extract seismic attributes. Firstly, the model should be constrained by key stratigraphic surfaces
interpreted traditionally to ensure geological accuracy, particular attention is paid to structurally complex
areas i.e. angular unconformities. This methodology is becoming commonplace in seismic geomorphological
studies (i.e. Smit et al., 2017). Data generated from the seismic interpretation process can then be integrated
with GIS software (ArcGIS) to build palaeogeography maps and apply geostatistical and geospatial processing
tools. Structural reconstructions using horizon flattening and sediment decompaction can be carried out in
Petex’s MOVE and/or Petrel to improve understanding of depositional geometries and structural features,
and estimate shortening/extension, by removing sediment overburden. Integrating many techniques from
the micro- to regional-scale provides a comprehensive evaluation of basin evolution.
1.6 REFERENCES
Allen, P. A. 2008. From landscapes into geological history. Nature, 451, pp.274–276.
Allen, P.A. and Allen, J.R., 2013. Basin analysis: Principles and application to petroleum play assessment. John Wiley & Sons.
de Almeida, F.F.M., de Brito Neves, B.B. and Carneiro, C.D.R., 2000. The origin and evolution of the South American Platform. Earth-Science Reviews, 50(1-2), pp.77-111.
Arantegui, A.I., 2018. Characterisation of Mesozoic Depositional Systems along the Atlantic Passive Margin of Morocco. North Aaiun-Tarfaya Basin (Doctoral dissertation). University of Manchester, UK.
Arthur, M.A., Dean, W.E. and Stow, D.A.V., 1984. Models for the deposition of Mesozoic-Cenozoic fine-grained organic-carbon-rich sediment in the deep sea. Geological Society, London, Special Publications, 15(1), pp.527-560.
Austin Jr, J.A., Stoffa, P.L., Phillips, J.D., Oh, J., Sawyer, D.S., Purdy, G.M., Reiter, E. and Makris, J., 1990. Crustal structure of the Southeast Georgia embayment-Carolina trough: Preliminary results of a composite seismic image of a continental suture (?) and a volcanic passive margin. Geology, 18(10), pp.1023-1027.
Avseth, P., Mukerji, T. and Mavko, G., 2005. Quantitative seismic interpretation: Cambridge.
Badley, M.E., 1985. Practical seismic interpretation.
Basile, C., Maillard, A., Patriat, M., Gaullier, V., Loncke, L., Roest, W., De Lepinay, M.M. and Pattier, F., 2013. Structure and evolution of the Demerara Plateau, offshore French Guiana: Rifting, tectonic
Chapter 1
46
inversion and post-rift tilting at transform–divergent margins intersection. Tectonophysics, 591, pp.16-29.
Basile, C., Girault, I., Paquette, J.L., Agranier, A., Loncke, L., Heuret, A. and Poetisi, E., 2020. The Jurassic magmatism of the Demerara Plateau (offshore French Guiana) as a remnant of the Sierra Leone hotspot during the Atlantic rifting. Scientific Reports, 10(1), pp.1-12.
Bellion, Y. and Crevola, G., 1991. Cretaceous and Cainozoic magmatism of the Senegal Basin (West Africa): a review. In Magmatism in extensional structural settings (pp. 189-208). Springer, Berlin, Heidelberg.
Binks, R.M. and Fairhead, J.D., 1992. A plate tectonic setting for Mesozoic rifts of West and Central Africa. Tectonophysics, 213(1-2), pp.141-151.
Boudzoumou, F., Vandamme, D., Affaton, P. and Gattacceca, J., 2011. Neoproterozoic paleomagnetic poles in the Taoudeni basin (West Africa). Comptes Rendus Geoscience, 343(4), pp.284-294.
Briden, J.C., Henthorn, D.I. and Rex, D.C., 1971. Palaeomagnetic and radiometric evidence for the age of the Freetown igneous complex, Sierra Leone. Earth and Planetary Science Letters, 12(4), pp.385-391.
Brownfield, M.E. and Charpentier, R.R., 2003. Assessment of the undiscovered oil and gas of the Senegal Province, Mauritania, Senegal, the Gambia, and Guinea-Bissau, Northwest Africa (Vol. 25). Denver: US Department of the Interior, US Geological Survey.
Burke, K., 1976. Development of graben associated with the initial ruptures of the Atlantic Ocean. In Developments in Geotectonics (Vol. 12, pp. 93-112). Elsevier.
Callomon, J.H., 1994. Palaeontological methods ofstratigraphy and biochronology: Some introductory remarks. Geobios, 27, pp.16-30.
Catuneanu, O., 2006. Principles of sequence stratigraphy. Elsevier.
Charton, R.J.G., 2018. Phanerozoic Vertical Movements in Morocco. (Doctoral dissertation). TUDelft, Netherlands.
Clayburn, J., 2018. Realising the Deep Water Hydrocarbon Potential of Senegal. Search and Discovery, 70345 (1), pp1–54.
Clift, P.D., Hodges, K., Heslop, D., Hannigan, R., Hoang, L.V. and Calvès, G., 2008. Greater Himalayan exhumation triggered by Early Miocene monsoon intensification. Nature Geoscience, 1, pp.875880
Cox, D.R., Newton, A.M.W., Huuse, M., In Press. An introduction to seismic reflection data: acquisition, processing and interpretation, in: Scarselli, N., Adam, J., Chiarella, D. (Eds.), Regional Geology and Tectonics - Principles of Geologic Analysis. Elsevier.
Crawford, F.D., Szelewski, C.E. and Alvey, G.D., 1985. Geology and exploration in the Takutu graben of Guyana Brazil. Journal of Petroleum Geology, 8(1), pp.5-36.
Culver, S.J. and Hunt, D., 1991. Lithostratigraphy of the Precambrain-Cambrian boundary sequence in the southwestern Taoudeni Basin, West Africa. Journal of African Earth Sciences (and the Middle East), 13(3-4), pp.407-413.
Davies, J.H.F.L., Marzoli, A., Bertrand, H., Youbi, N., Ernesto, M. and Schaltegger, U., 2017. End-Triassic mass extinction started by intrusive CAMP activity. Nature communications, 8(1), pp.1-8.
Davison, I., 2005. Central Atlantic margin basins of North West Africa: geology and hydrocarbon potential (Morocco to Guinea). Journal of African Earth Sciences, 43(1-3), pp.254-274.
Introduction
47
Davison, I., Faull, T., Greenhalgh, J., Beirne, E.O. and Steel, I., 2016. Transpressional structures and hydrocarbon potential along the Romanche Fracture Zone: a review. Geological Society, London, Special Publications, 431(1), pp.235-248.
Deynoux, M., Affaton, P., Trompette, R. and Villeneuve, M., 2006. Pan-African tectonic evolution and glacial events registered in Neoproterozoic to Cambrian cratonic and foreland basins of West Africa. Journal of African Earth Sciences, 46(5), pp.397-426.
Duval-Arnold, A., 2020. Controls on stratigraphic development of shelf margin carbonates: Jurassic Atlantic margin - Essaouira-Agadir Basin, Western Morocco (Doctoral dissertation). University of Manchester, UK.
Edge, R., 2014. Rifting of the Guinea Margin in the Equatorial Atlantic from 112 to 84 MA: Implications of Paleo-reconstructions for Structure and Sea-surface Circulation. Ph.D Thesis. Retrieved from. http://hdl.handle.net/10150/321395.
Eliuk, L.S. and Prather, B.E., 2005. Baltimore Canyon Trough Mesozoic Carbonate Margin Cores, Offshore USA Atlantic. In Canadian Society of Petroleum Geologists Core Conference (pp. 75-106).
Flicoteaux, R., Latil-Brun, M.V. and Michaud, L., 1988. Histoire de la subsidence post-rift du bassin côtier mauritano-sénégalo-guinéen. Relation avec l'amincissement crustal pendant la période jurassique à Crétacé inférieur. Comparaison avec l'évolution des marges péri-atlantiques au niveau de l'Atlantique Central et Equatorial (côte est des USA, Sud-Sahara, Côte d'Ivoire et Plateau du Demerara). Journal of African Earth Sciences (and the Middle East), 7(2), pp.345-359.
Franke, D., 2013. Rifting, lithosphere breakup and volcanism: Comparison of magma-poor and volcanic rifted margins. Marine and Petroleum geology, 43, pp.63-87.
Garzanti, E., 2016. From static to dynamic provenance analysis—Sedimentary petrology upgraded. Sedimentary Geology, 336, pp.3-13.
GEM, 2020. Geognostics Earth Model.
Gouiza, M., Bertotti, G., Charton, R., Haimoudane, K., Dunkl, I. and Anczkiewicz, A.A., 2019. New Evidence of ‘Anomalous' Vertical Movements along the Hinterland of the Atlantic NW African Margin. Journal of Geophysical Research: Solid Earth, 124(12), pp.13333-13353.
Gouyet, S., 1988. Evolution tectono-sédimentaire des marges guyanaise et nord-brésilienne au cours de l'ouverture de l'Atlantique Sud (Doctoral dissertation).
Greenroyd, C.J., Peirce, C., Rodger, M., Watts, A.B. and Hobbs, R.W., 2007. Crustal structure of the French Guiana margin, west equatorial Atlantic. Geophysical Journal International, 169(3), pp.964-987.
Greenroyd, C.J., Peirce, C., Rodger, M., Watts, A.B. and Hobbs, R.W., 2008a. Crustal structure and evolution of the Demerara Plateau, French Guiana: Geophysical Journal International, 172, pp.549–564,
Greenroyd, C. J., Peirce, C., Rodger, M., Watts, A.B. and Hobbs, R.W. 2008b. Demerara Plateau — The structure and evolution of a transform passive margin: Geophysical Journal International, 172, pp.549–564.
Gueye, M., Siegesmund, S., Wemmer, K., Pawlig, S., Drobe, M., Nolte, N. and Layer, P., 2007. New evidences for an early Birimian evolution in the West African Craton: An example from the Kedougou-Kenieba inlier, southeast Senegal. South African Journal of Geology, 110(4), pp.511-534.
Hafid, M., Salem, A.A. and Bally, A.W., 2000. The western termination of the Jebilet–high Atlas system (offshore Essaouira Basin, Morocco). Marine and Petroleum Geology, 17(3), pp.431-443.
Chapter 1
48
Hansen, D.M., Redfern, J., Federici, F., Di Biase, D. and Bertozzi, G., 2008. Miocene igneous activity in the Northern Subbasin, offshore Senegal, NW Africa. Marine and Petroleum Geology, 25(1), pp.1-15.
Holm, P.M., Grandvuinet, T., Friis, J., Wilson, J.R., Barker, A.K. and Plesner, S., 2008. An 40Ar‐39Ar study of the Cape Verde hot spot: Temporal evolution in a semistationary plate environment. Journal of Geophysical Research: Solid Earth, 113(B8).
Jeremiah, J., 2001. A Lower Cretaceous nannofossil zonation for the North Sea Basin. Journal of Micropalaeontology, 20(1), pp.45-80.
Keller Jr, F., Meuschke, J.L. and Alldredge, L.R., 1954. Aeromagnetic surveys in the Aleutian, Marshall, and Bermuda islands. Eos, Transactions American Geophysical Union, 35(4), pp.558-572.
Kennedy, W.Q., 1964. The structural differentiation of Africa in the Pan-African (+/-500 my) tectonic episode. University of Leeds, Research Institute of African Geology, annual Report on scientific Results, (8), pp.48-49.
Klitgord, K.D., Schouten, H., 1986. Plate kinematics of the central Atlantic. In: Vogt, P.R., Tucholke, B.E. (Eds.), The Geology of North America, the Western Atlantic Region: Decade of North American Geology, (DNAG) Series. Geological Society of America, v. M., pp.351–378.
Kosmos Energy, 2019. Investor Presentation – Q3 2019 Results. Dallas, Texas. Available from < https://www.kosmosenergy.com/>.
Ledru, P., Pons, J., Milési, J.P., Feybesse, J.L. and Johan, V., 1991. Transcurrent tectonics and polycyclic evolution in the Lower Proterozoic of Senegal-Mali. Precambrian Research, 50(3-4), pp.337-354.
Lodhia, B.H., Roberts, G.G., Fraser, A.J., Fishwick, S., Goes, S. and Jarvis, J., 2018. Continental margin subsidence from shallow mantle convection: Example from West Africa. Earth and Planetary Science Letters, 481, pp.350-361.
Le Roy, P. and Piqué, A., 2001. Triassic–Liassic Western Moroccan synrift basins in relation to the Central Atlantic opening. Marine Geology, 172(3-4), pp.359-381.
Luber, T.L., 2017. Integrated analysis of Lower Cretaceous stratigraphy and depositional systems: the Essaouira-Agadir basin of Morocco (Doctoral dissertation). University of Manchester, UK.
Luber, T.L., Bulot, L.G., Redfern, J., Frau, C., Arantegui, A. and Masrour, M., 2017. A revised ammonoid biostratigraphy for the Aptian of NW Africa: Essaouira-Agadir Basin, Morocco. Cretaceous Research, 79, pp.12-34.
Luber, T.L., Bulot, L.G., Redfern, J., Nahim, M., Jeremiah, J., Simmons, M., Bodin, S., Frau, C., Bidgood, M., Masrour, M., 2019. A revised chronostratigraphic framework for the Aptian of the Essaouira-Agadir Basin, a candidate type section for the NW African Atlantic Margin. Cretaceous Research 93, 292–317.
Martin, L., Effimoff, I., Medou, J. and Laughland, M., 2010 Hydrocarbon Prospectivity of Offshore Senegal-Unlocking the Door to a New Deepwater Petroleum Province. Search and Discovery Article 10278.
Martinsen, O.J., Sømme, T.O., Thurmond, J.B., Helland-Hansen, W. and Lunt, I., 2010. January. Source-to-sink systems on passive margins: theory and practice with an example from the Norwegian continental margin. In Geological Society, London, Petroleum Geology Conference series (Vol. 7, No. 1, pp. 913-920). Geological Society of London.
McHone, J.G., 2000. Non-plume magmatism and rifting during the opening of the central Atlantic Ocean. Tectonophysics, 316(3-4), pp.287-296.
McKenzie, D., 1978. Some remarks on the development of sedimentary basins. Earth and Planetary science letters, 40(1), pp.25-32.
Introduction
49
Miall, A. ed., 2008. Sedimentary Basins of the United States and Canada, The. Sedimentary Basins of the World, Volume 5. Elsevier Science & Technology.
Milési, J.P., Ledru, P., Feybesse, J.L., Dommanget, A. and Marcoux, E., 1992. Early Proterozoic ore deposits and tectonics of the Birimian orogenic belt, West Africa. Precambrian Research, 58(1-4), pp.305-344.
Mitchum, R.M., Vail, P.R. and Thompson, S., 1977. Seismic stratigraphy and global changes of sea level: Part 2. The depositional sequence as a basic unit for stratigraphic analysis: Section 2. Application of seismic reflection configuration to stratigraphic interpretation.
Mourlot, Y., 2018. Contrôles sur la répartition des argiles organiques dans les bassins profonds: cas de l'Atlantique central au Crétacé (Doctoral dissertation, Université de Toulouse, Université Toulouse III-Paul Sabatier).
Mourlot, Y., Calvès, G., Clift, P.D., Baby, G., Chaboureau, A.C. and Raisson, F., 2018a. Seismic stratigraphy of Cretaceous eastern Central Atlantic Ocean: Basin evolution and palaeoceanographic implications. Earth and Planetary Science Letters, 499, pp.107-121.
Müller, R.D., Zahirovic, S., Williams, S.E., Cannon, J., Seton, M., Bower, D.J., Tetley, M.G., Heine, C., Le Breton, E., Liu, S. and Russell, S.H., 2019. A global plate model including lithospheric deformation along major rifts and orogens since the Triassic. Tectonics, 38(6), pp.1884-1907.
Muniz-Pichel, L., 2018. Tectono-Stratigraphic Evolution associated with Salt Tectonics along Atlantic Margins: Effects of Pre-Salt Relief and Regional Events (Doctoral dissertation). University of Manchester, UK.
Nomade, S., Knight, K.B., Beutel, E., Renne, P.R., Verati, C., Féraud, G., Marzoli, A., Youbi, N. and Bertrand, H., 2007. Chronology of the Central Atlantic Magmatic Province: implications for the Central Atlantic rifting processes and the Triassic–Jurassic biotic crisis. Palaeogeography, Palaeoclimatology, Palaeoecology, 244(1-4), pp.326-344.
Olsen, P.E., 1980. Triassic and Jurassic formations of the Newark Basin. In Field studies of New Jersey geology and guide to field trips: 52nd annual meeting of the New York State Geological Association, ed. W. Manspeizer (pp. 2-41).
Olsen, P.E., 1997. Stratigraphic record of the early Mesozoic breakup of Pangea in the Laurasia-Gondwana rift system. Annual Review of Earth and Planetary Sciences, 25(1), pp.337-401.
Olyphant, J.R., Johnson, R.A. and Hughes, A.N., 2017. Evolution of the Southern Guinea Plateau: Implications on Guinea-Demerara Plateau formation using insights from seismic, subsidence, and gravity data. Tectonophysics, 717, pp.358-371.
Partyka, G.A. and Gridley, J.M., BP Corporation North America Inc, 1999. Spectral decomposition for seismic interpretation. U.S. Patent 5,870,691.
Patriat, M. and Labails, C., 2006. Linking the Canary and Cape-Verde hot-spots, northwest Africa. Marine Geophysical Research, 27(3), pp.201-215.
Payton, C.E. ed., 1977. Seismic stratigraphy: applications to hydrocarbon exploration (Vol. 26, pp. 1-516). Tulsa, OK: American Association of Petroleum Geologists.
Peron-Pinvidic, G. and Manatschal, G., 2019. Rifted margins: state of the art and future challenges. Frontiers in Earth Science, 7, p.218.
Peron-Pinvidic, G., Manatschal, G. and Osmundsen, P.T., 2013. Structural comparison of archetypal Atlantic rifted margins: A review of observations and concepts. Marine and Petroleum Geology, 43, pp.21-47.
Chapter 1
50
Pindell, J.L., 1985. Alleghenian reconstruction and subsequent evolution of the Gulf of Mexico, Bahamas, and Proto‐Caribbean. Tectonics, 4(1), pp.1-39.
Poag, C.W. and Sevon, W.D., 1989. A record of Appalachian denudation in postrift Mesozoic and Cenozoic sedimentary deposits of the US middle Atlantic continental margin. Geomorphology, 2(1-3), pp.119-157.
Posamentier, H.W., 2005. Application of 3D seismic visualization techniques for seismic stratigraphy, seismic geomorphology and depositional systems analysis: examples from fluvial to deep-marine depositional environments. In Geological Society, London, Petroleum Geology Conference series (Vol. 6, No. 1, pp. 1565-1576). Geological Society of London.
Reuber, K.R., Pindell, J. and Horn, B.W., 2016. Demerara Rise, offshore Suriname: Magma-rich segment of the Central Atlantic Ocean, and conjugate to the Bahamas hot spot. Interpretation, 4(2), pp.141-155.
Ritz, M. and Bellion, Y., 1989. Geologic sections across the onshore Senegal–Mauritania basin derived from geoelectric studies. Canadian Journal of Earth Sciences, 26(1), pp.65-73.
Sapin, F. and Maurin, T., 2018, April. Southern Central Atlantic Break-up: from continuous to forced break-up. In EGU General Assembly Conference Abstracts, 20, p. 17227.
Scotese, C.R., 2016. PALEOMAP PaleoAtlas for GPlates and the PaleoData Plotter Program, PALEOMAP Project, http://www.earthbyte.org/paleomap- paleoatlas-for-gplates/
Sheridan, R., Gradstein, F., Barnard, L.A., Bliefnick, D.M., Habib, D., Jenden, P.D., Kagami, H., Keenan, E.M., Kostecki, K., Moullade, M., Ogg, J., Roth, P.H. and Shipley, T. 1983. Site 534: Blake Bahama Basin. In Sheridan, R. E., Gradstein, F. M., et al., Initial Reports of the Deep Sea Drilling Project, 76, pp.141-340.
Sibuet, J.C. and Mascle, J., 1978. Plate kinematic implications of Atlantic equatorial fracture zone trends. Journal of Geophysical Research: Solid Earth, 83(B7), pp.3401-3421.
Smit, F., van Buchem, F., Schmidt, I. and Stemmerik, L., 2017. Updated seismic geomorphological workflow applied to the Chalk Group. In SEG Technical Program Expanded Abstracts 2017 (pp. 1976-1981). Society of Exploration Geophysicists.
Snyder, R.L. and Bish, D.L. 1989. Quantitative analysis. In: Bish, D.L., Post, J.E. (Eds), Modern Powder Diffraction, Reviews in Mineralogy, Volume 20, Mineralogical Society of America, USA, pp. 101-144 (Chapter 5).
Sømme T., Helland-Hansen W., Martinsen O. J., Thurmond J. B., 2009. Relationships between morphological and sedimentological parameters in source-to-sink systems: a basis for predicting semi-quantitative characteristics in subsurface systems. Basin Research 21:361–387.
Stahlecker, R., 1935. Neocom auf der Kapverden-Insel Maio. Neues Jahrbuch für Geologie und Palaeontolgie, 73, pp.265-301.
Tessier, F., 1952. Contribution à la stratigraphie et à la paléontologie de la partie ouest du Sénégal. Bull. Dir. Mines Afr. Occ. Fr., Dakar, 14, pp.1-267.
Uchupi, E., 1989. The tectonic style of the Atlantic Mesozoic rift system. Journal of African Earth Sciences (and the Middle East), 8(2-4), pp.143-164.
Vail, P.R. and Mitchum Jr, R.M., 1977. Seismic Stratigraphy and Global Changes of Sea Level: Part 1. Overview: Section 2. Application of Seismic Reflection Configuration to Stratigraphic Interpretation.
van den Bogaard, P., 2013. The origin of the Canary Island Seamount Province-New ages of old seamounts. Scientific Reports, 3, p.2107.
Introduction
51
Villeneuve, M., 2008. Review of the orogenic belts on the western side of the West African craton: the Bassarides, Rokelides and Mauritanides. Geological Society, London, Special Publications, 297(1), pp.169-201.
Villeneuve, M., Fournier, F., Cirilli, S., Spina, A., Ndiaye, M., Zamba, J., Viseur, S., Borgomano, J. and Ngom, P.M., 2015. Structure of the Paleozoic basement in the Senegalo-Mauritanian basin (West Africa). Bulletin de la Société Géologique de France, 186(2-3), pp.193-203.
Whittaker, R.C., 2018. Understanding the characteristics of hyperextended margins to model and predict new hydrocarbon plays in Atlantic deepwater provinces. Atlantic Geology, 54, Conjugate Margins Conference 2018, August 19-22.
Withjack, M.O., Olsen, P.E. and Schlische, R.W., 1995. Tectonic evolution of the Fundy rift basin, Canada: evidence of extension and shortening during passive margin development. Tectonics, 14(2), pp.390-405.
Withjack, M.O. and Schlische, R.W., 2005. A review of tectonic events on the passive margin of eastern North America. In Petroleum Systems of Divergent Continental Margin Basins: 25th Bob S. Perkins Research Conference, Gulf Coast Section of SEPM (pp. 203-235). SEPM.
Withjack, M.O., Schlische, R.W., Malinconico, M.L. and Olsen, P.E., 2013. Rift-basin development: lessons from the Triassic–Jurassic Newark Basin of eastern North America. Geological Society, London, Special Publications, 369(1), pp.301-321.
Yang, W. and Escalona, A., 2011. Tectonostratigraphic evolution of the Guyana Basin. AAPG bulletin, 95(8), pp.1339-1368.
52
2 Deep sea rock record exhumed on oceanic
volcanic islands: the Cretaceous sediments of Maio, Cape Verde
Max Casson1, Luc G. Bulot2,1, Jason Jeremiah3, Jonathan Redfern1
1North Africa Research Group, University of Manchester, Oxford Road, M13 9PL
2Aix-Marseille Université, CNRS, IRD, Collège de France, INRA, Cerege, Site Saint-Charles, Case 67, 3, Place
Victor Hugo, 13331, Marseille Cedex 3, France
3Golden Spike Geosolutions Ltd., 20 Ten Acres Crescent, Stevenage, Hertfordshire, SG2 9U
Casson, M., Bulot, L.G., Jeremiah, J. and Redfern, J., 2020. Deep sea rock record exhumed on oceanic volcanic
islands: the Cretaceous sediments of Maio, Cape Verde. Gondwana Research, 81, pp.252-264.
Chapter 2
53
2.1 ABSTRACT
Revising the deep water stratigraphy exposed on Maio offers a key section recording the sedimentary
evolution in the distal domain of the Central Atlantic and the related North West African Atlantic margin
(NWAAM). The oceanic volcanic island is one of nine islands in the Cape Verde archipelago, and is unique to
the Central Atlantic due to the exposures of ophiolites and the overlying Mesozoic deep water sediments
uplifted during the Cenozoic. This provides the opportunity to assess at outcrop, the exhumed sediments,
stratigraphy and paleo-environments of the early Central Atlantic and contribute towards the knowledge of
passive margin evolution along the NWAAM, part of the largest continental remnant of Gondwana.
Combined with the previous recording of calpionellids, the first collection of lower Valanginian ammonites
from the lowest sedimentary succession provides conclusive evidence that Jurassic sediments are not
present on Maio. Bed-by-bed sampling and ensuing micro-palaeontological analysis of these 71 samples,
together with a re-interpretation of Stahlecker’s remaining historical palaeontological collection providing a
comprehensive dataset to build a high-resolution stratigraphic framework for the Mesozoic sediments. This
reveals pelagic deepwater limestones of the Morro Fm. were deposited until the upper Barremian. A major
lithological change from carbonate- to siliciclastic-dominated facies, corresponding to the Morro-Carquiejo
Fm. boundary is recognised as a regional hiatus spanning part of the Aptian identified across the Central
Atlantic. The overlying Albian and younger Carquiejo Fm. is seen as an equivalent to the Albian-Cenomanian
black shales of DSDP Leg 41, yet organic content is absent due to degradation. Future studies can build on
this multi-disciplinary investigation and rely on the revision of the stratigraphy of Maio.
Key words: distal domain; stratigraphy; Central Atlantic; Maio; exhumed oceanic volcanic islands
Cretaceous sediments of Maio
54
2.2 INTRODUCTION
Exhumed sediments on oceanic volcanic islands offer the opportunity to examine at outcrop deep sea
sediments deposited in passive margin basins that are otherwise only penetrated by the drill bit and/or
imaged using seismic reflection techniques. The fortuitous uplift of these sediments surrounding the igneous
complex allow a comprehensive analysis of deep-water stratigraphy; allowing a stratigraphic framework to
be developed for the distal domain and post-rift sedimentology to be fully examined using conventional
fieldwork and ensuing laboratory analysis.
The study of the island of Maio in the Cape Verde archipelago provides an opportunity to assess the paleo-
environmental evolution of the early Central Atlantic and contribute towards the knowledge of the evolution
of the NWAAM. This margin is part of the largest remnant of early Gondwana, the African continent. New
findings are integrated with results from the Deep Sea Drilling Project (DSDP) and comparisons made with
Mesozoic outcrops of Cuba and more generally with the Maiolica facies across the Central Atlantic to
correlate interpretations regionally.
This multi-disciplinary analysis refines the stratigraphic scheme developed by geologists, palaeontologists
and stratigraphers since the early 20th century (see Fourcade et al., 1990 with references). We also
document the first collection of ammonites from the lowest part of the sedimentary succession, with bed-
by-bed sampling and high-resolution micro-palaeontological analysis, combined with a re-interpretation of
the remainder of the palaeontological collection of Stahlecker (1935). This provides a comprehensive
dataset that allows definition of a high-resolution stratigraphic framework to address uncertainties
surrounding the dating of the Mesozoic stratigraphy of Maio.
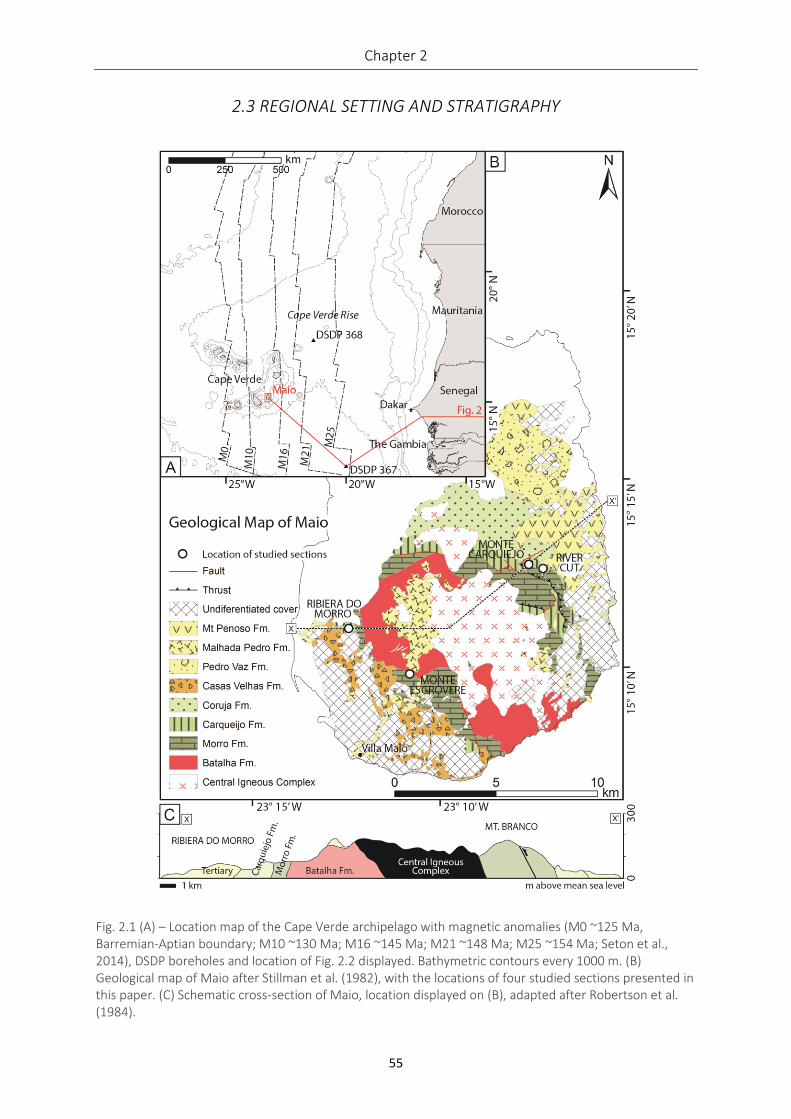
Chapter 2
55
2.3 REGIONAL SETTING AND STRATIGRAPHY
Fig. 2.1 (A) – Location map of the Cape Verde archipelago with magnetic anomalies (M0 ~125 Ma, Barremian-Aptian boundary; M10 ~130 Ma; M16 ~145 Ma; M21 ~148 Ma; M25 ~154 Ma; Seton et al., 2014), DSDP boreholes and location of Fig. 2.2 displayed. Bathymetric contours every 1000 m. (B) Geological map of Maio after Stillman et al. (1982), with the locations of four studied sections presented in this paper. (C) Schematic cross-section of Maio, location displayed on (B), adapted after Robertson et al. (1984).
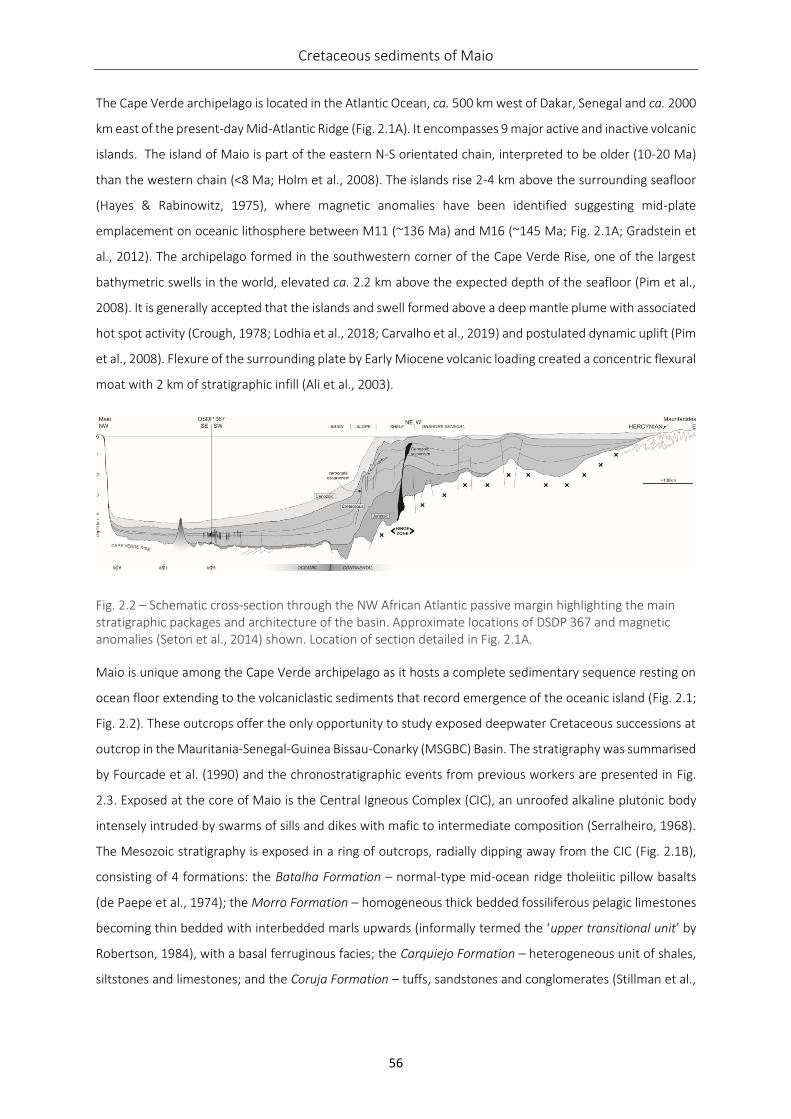
Cretaceous sediments of Maio
56
The Cape Verde archipelago is located in the Atlantic Ocean, ca. 500 km west of Dakar, Senegal and ca. 2000
km east of the present-day Mid-Atlantic Ridge (Fig. 2.1A). It encompasses 9 major active and inactive volcanic
islands. The island of Maio is part of the eastern N-S orientated chain, interpreted to be older (10-20 Ma)
than the western chain (<8 Ma; Holm et al., 2008). The islands rise 2-4 km above the surrounding seafloor
(Hayes & Rabinowitz, 1975), where magnetic anomalies have been identified suggesting mid-plate
emplacement on oceanic lithosphere between M11 (~136 Ma) and M16 (~145 Ma; Fig. 2.1A; Gradstein et
al., 2012). The archipelago formed in the southwestern corner of the Cape Verde Rise, one of the largest
bathymetric swells in the world, elevated ca. 2.2 km above the expected depth of the seafloor (Pim et al.,
2008). It is generally accepted that the islands and swell formed above a deep mantle plume with associated
hot spot activity (Crough, 1978; Lodhia et al., 2018; Carvalho et al., 2019) and postulated dynamic uplift (Pim
et al., 2008). Flexure of the surrounding plate by Early Miocene volcanic loading created a concentric flexural
moat with 2 km of stratigraphic infill (Ali et al., 2003).
Fig. 2.2 – Schematic cross-section through the NW African Atlantic passive margin highlighting the main stratigraphic packages and architecture of the basin. Approximate locations of DSDP 367 and magnetic anomalies (Seton et al., 2014) shown. Location of section detailed in Fig. 2.1A.
Maio is unique among the Cape Verde archipelago as it hosts a complete sedimentary sequence resting on
ocean floor extending to the volcaniclastic sediments that record emergence of the oceanic island (Fig. 2.1;
Fig. 2.2). These outcrops offer the only opportunity to study exposed deepwater Cretaceous successions at
outcrop in the Mauritania-Senegal-Guinea Bissau-Conarky (MSGBC) Basin. The stratigraphy was summarised
by Fourcade et al. (1990) and the chronostratigraphic events from previous workers are presented in Fig.
2.3. Exposed at the core of Maio is the Central Igneous Complex (CIC), an unroofed alkaline plutonic body
intensely intruded by swarms of sills and dikes with mafic to intermediate composition (Serralheiro, 1968).
The Mesozoic stratigraphy is exposed in a ring of outcrops, radially dipping away from the CIC (Fig. 2.1B),
consisting of 4 formations: the Batalha Formation – normal-type mid-ocean ridge tholeiitic pillow basalts
(de Paepe et al., 1974); the Morro Formation – homogeneous thick bedded fossiliferous pelagic limestones
becoming thin bedded with interbedded marls upwards (informally termed the ‘upper transitional unit’ by
Robertson, 1984), with a basal ferruginous facies; the Carquiejo Formation – heterogeneous unit of shales,
siltstones and limestones; and the Coruja Formation – tuffs, sandstones and conglomerates (Stillman et al.,
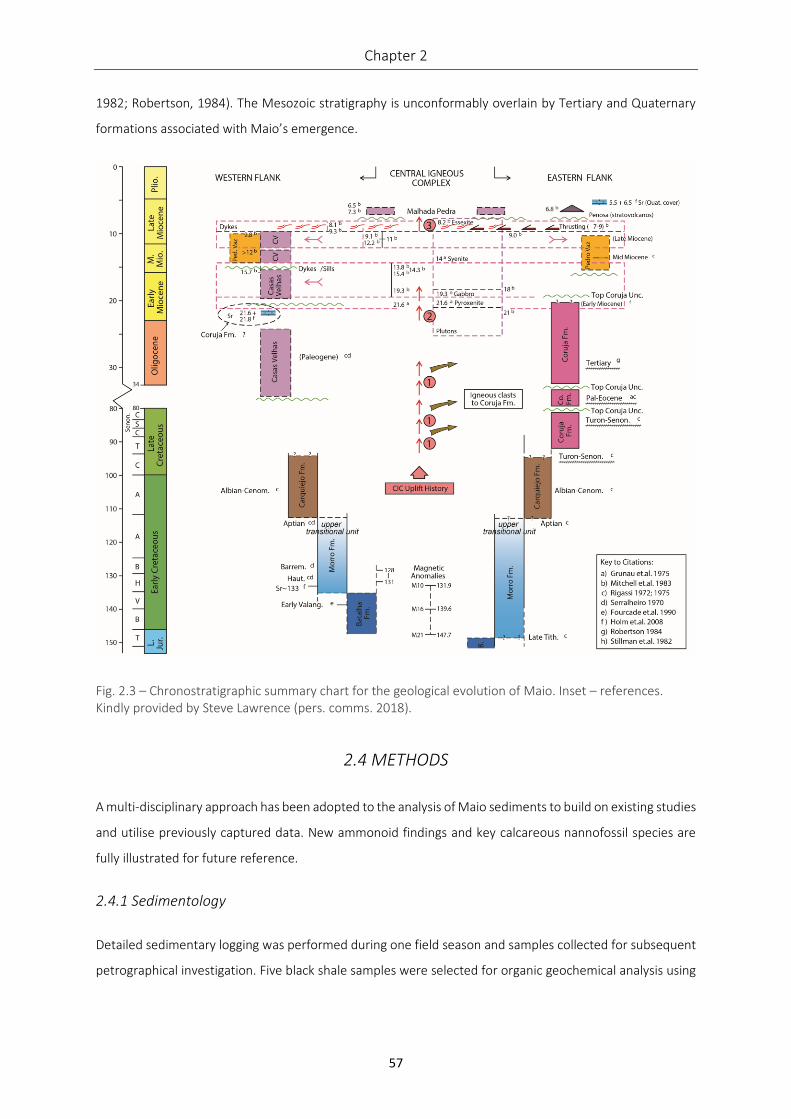
Chapter 2
57
1982; Robertson, 1984). The Mesozoic stratigraphy is unconformably overlain by Tertiary and Quaternary
formations associated with Maio’s emergence.
Fig. 2.3 – Chronostratigraphic summary chart for the geological evolution of Maio. Inset – references. Kindly provided by Steve Lawrence (pers. comms. 2018).
2.4 METHODS
A multi-disciplinary approach has been adopted to the analysis of Maio sediments to build on existing studies
and utilise previously captured data. New ammonoid findings and key calcareous nannofossil species are
fully illustrated for future reference.
2.4.1 Sedimentology
Detailed sedimentary logging was performed during one field season and samples collected for subsequent
petrographical investigation. Five black shale samples were selected for organic geochemical analysis using
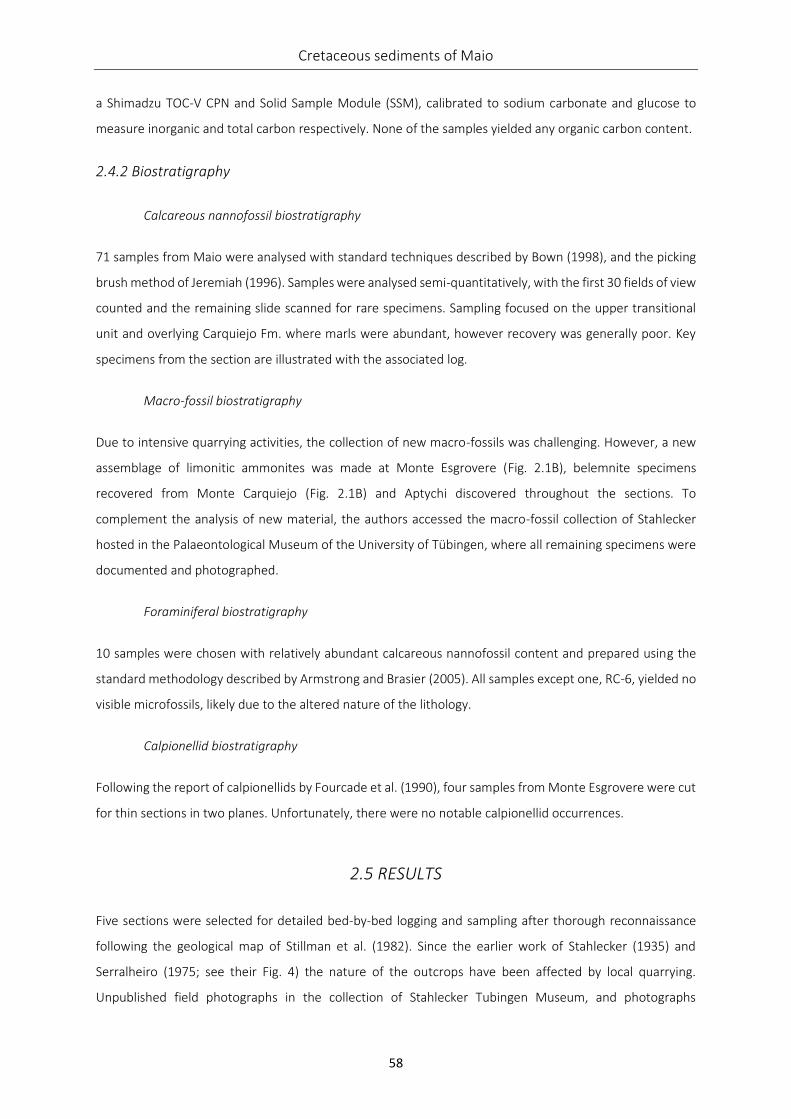
Cretaceous sediments of Maio
58
a Shimadzu TOC-V CPN and Solid Sample Module (SSM), calibrated to sodium carbonate and glucose to
measure inorganic and total carbon respectively. None of the samples yielded any organic carbon content.
2.4.2 Biostratigraphy
Calcareous nannofossil biostratigraphy
71 samples from Maio were analysed with standard techniques described by Bown (1998), and the picking
brush method of Jeremiah (1996). Samples were analysed semi-quantitatively, with the first 30 fields of view
counted and the remaining slide scanned for rare specimens. Sampling focused on the upper transitional
unit and overlying Carquiejo Fm. where marls were abundant, however recovery was generally poor. Key
specimens from the section are illustrated with the associated log.
Macro-fossil biostratigraphy
Due to intensive quarrying activities, the collection of new macro-fossils was challenging. However, a new
assemblage of limonitic ammonites was made at Monte Esgrovere (Fig. 2.1B), belemnite specimens
recovered from Monte Carquiejo (Fig. 2.1B) and Aptychi discovered throughout the sections. To
complement the analysis of new material, the authors accessed the macro-fossil collection of Stahlecker
hosted in the Palaeontological Museum of the University of Tübingen, where all remaining specimens were
documented and photographed.
Foraminiferal biostratigraphy
10 samples were chosen with relatively abundant calcareous nannofossil content and prepared using the
standard methodology described by Armstrong and Brasier (2005). All samples except one, RC-6, yielded no
visible microfossils, likely due to the altered nature of the lithology.
Calpionellid biostratigraphy
Following the report of calpionellids by Fourcade et al. (1990), four samples from Monte Esgrovere were cut
for thin sections in two planes. Unfortunately, there were no notable calpionellid occurrences.
2.5 RESULTS
Five sections were selected for detailed bed-by-bed logging and sampling after thorough reconnaissance
following the geological map of Stillman et al. (1982). Since the earlier work of Stahlecker (1935) and
Serralheiro (1975; see their Fig. 4) the nature of the outcrops have been affected by local quarrying.
Unpublished field photographs in the collection of Stahlecker Tubingen Museum, and photographs
Chapter 2
59
published by Serralheiro (1975) show abundant surface exposure at Ribeira do Morro, but most of this has
now been removed and quarried (see supplementary data Fig. S 2.1). Although more complex, access to the
sections is still possible.
Data was attained from both flanks of the island to provide spatial coverage, with a maximum distance
between sections of ca. 10 km East-West. The definition of the Morro-Carquiejo Fm. boundary by Stillman
et al. (1982) was recognised and followed; this contact is commonly intruded by younger intrusives
exploiting the rheological weakness between the different lithologies. On the eastern flank, the authors are
in agreement with Stillman et al. (1982) that the stratigraphy has been thrusted.
Fig. 2.4 (next page) – Detailed sedimentary log with the majority of igneous intrusions removed from Ribeira do Morro, see location in Fig. 2.1B. Samples taken for the calcareous nannofossil biostratigraphy are annotated, five specimens are illustrated: (A) A. youngii, (B) N. steinmannii, (C) C. rothii, (D) E. turriseiffelli, (E) Z. scutula, and the distribution charts are provided in the supplementary data (Table S 2.1). Inset – a sketch geological map highlighting where the section was logged along in the river bank exposures and in subsurface quarries, the lack of surface exposure due to quarrying activities (see supplementary data Fig. S 2.1) and structural data recorded in the field.
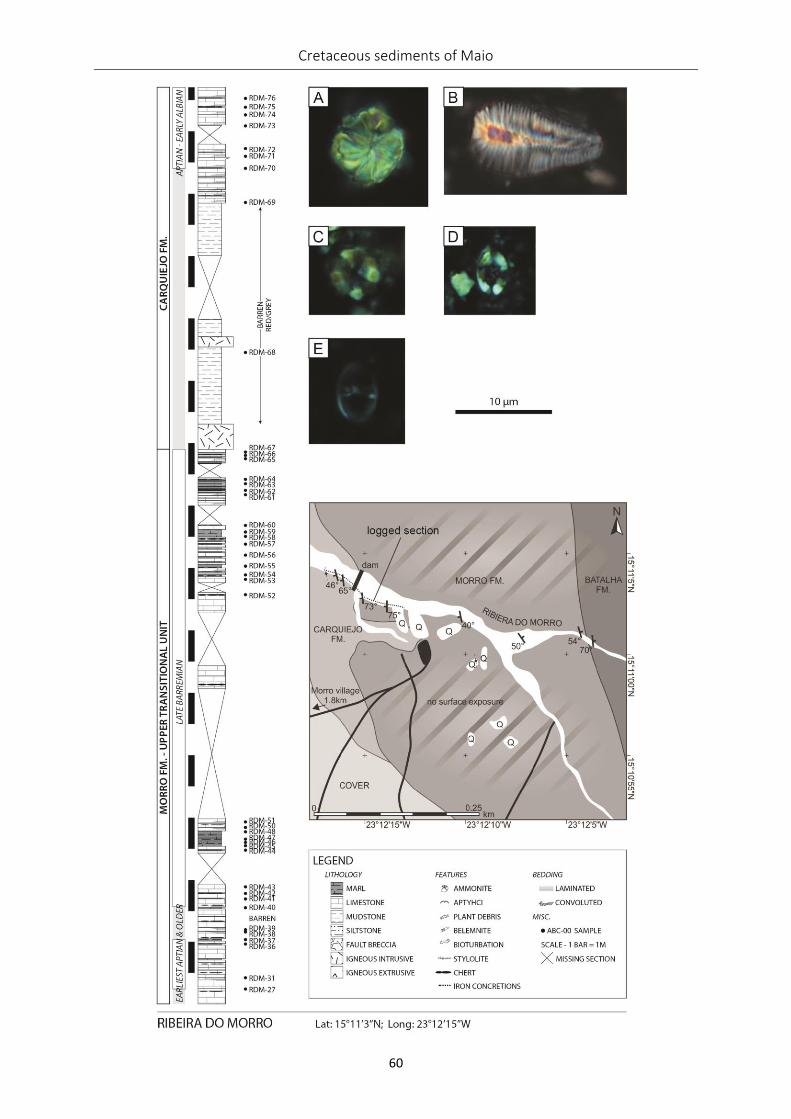
Cretaceous sediments of Maio
60
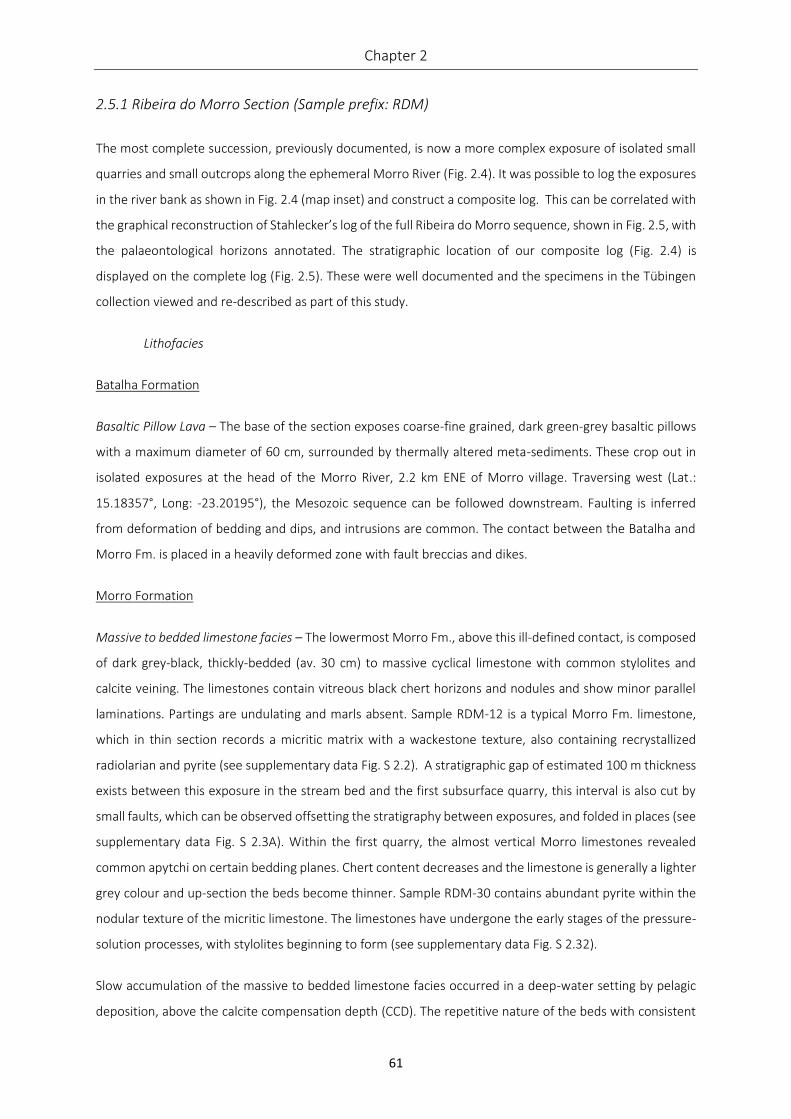
Chapter 2
61
2.5.1 Ribeira do Morro Section (Sample prefix: RDM)
The most complete succession, previously documented, is now a more complex exposure of isolated small
quarries and small outcrops along the ephemeral Morro River (Fig. 2.4). It was possible to log the exposures
in the river bank as shown in Fig. 2.4 (map inset) and construct a composite log. This can be correlated with
the graphical reconstruction of Stahlecker’s log of the full Ribeira do Morro sequence, shown in Fig. 2.5, with
the palaeontological horizons annotated. The stratigraphic location of our composite log (Fig. 2.4) is
displayed on the complete log (Fig. 2.5). These were well documented and the specimens in the Tübingen
collection viewed and re-described as part of this study.
Lithofacies
Batalha Formation
Basaltic Pillow Lava – The base of the section exposes coarse-fine grained, dark green-grey basaltic pillows
with a maximum diameter of 60 cm, surrounded by thermally altered meta-sediments. These crop out in
isolated exposures at the head of the Morro River, 2.2 km ENE of Morro village. Traversing west (Lat.:
15.18357°, Long: -23.20195°), the Mesozoic sequence can be followed downstream. Faulting is inferred
from deformation of bedding and dips, and intrusions are common. The contact between the Batalha and
Morro Fm. is placed in a heavily deformed zone with fault breccias and dikes.
Morro Formation
Massive to bedded limestone facies – The lowermost Morro Fm., above this ill-defined contact, is composed
of dark grey-black, thickly-bedded (av. 30 cm) to massive cyclical limestone with common stylolites and
calcite veining. The limestones contain vitreous black chert horizons and nodules and show minor parallel
laminations. Partings are undulating and marls absent. Sample RDM-12 is a typical Morro Fm. limestone,
which in thin section records a micritic matrix with a wackestone texture, also containing recrystallized
radiolarian and pyrite (see supplementary data Fig. S 2.2). A stratigraphic gap of estimated 100 m thickness
exists between this exposure in the stream bed and the first subsurface quarry, this interval is also cut by
small faults, which can be observed offsetting the stratigraphy between exposures, and folded in places (see
supplementary data Fig. S 2.3A). Within the first quarry, the almost vertical Morro limestones revealed
common apytchi on certain bedding planes. Chert content decreases and the limestone is generally a lighter
grey colour and up-section the beds become thinner. Sample RDM-30 contains abundant pyrite within the
nodular texture of the micritic limestone. The limestones have undergone the early stages of the pressure-
solution processes, with stylolites beginning to form (see supplementary data Fig. S 2.32).
Slow accumulation of the massive to bedded limestone facies occurred in a deep-water setting by pelagic
deposition, above the calcite compensation depth (CCD). The repetitive nature of the beds with consistent
Cretaceous sediments of Maio
62
lateral continuity indicates steady cyclical sedimentation across the sea floor with minor current activity
producing undulating partings (Stillman et al., 1982). Our analysis of thin sections has failed to find any quartz
within this facies; this is in agreement with Robertson’s (1984) interpretation that this part of the basin was
isolated from terrigenous sediment during deposition of this facies.
Upper Transitional Unit
Flaggy limestone facies – Exposure of flaggy limestone beds are observed in the river bank upstream and
downstream of a small dam (Lat.: 15.18429°, Long: -23.20429°). The flaggy limestone beds are generally
thinner bedded (av. 10 cm), increasingly laminated and less silicified. Interbedded bituminous, fissile,
calcareous mudstones were sampled for nannofossil content (RDM-36 to 67, Fig. 2.4). An ichnofacies is
recorded in these sediments at the MC section. Horizons of mm-scale iron concretions occur in the flaggy
limestones. A fairly large number of aptychi, fish remains and ammonites were collected from this part of
the succession, some of which were published by Stahlecker (1935) and revised below.
The contrasting facies of the upper transitional unit to the main Morro Fm. was deposited by distal turbidites
and the thinner bedded nature of the flaggy limestones indicates less continuous pelagic sedimentation
between events. The increasing clay content suggests terrigenous material reached the deep basin. These
depositional conditions favoured the preservation of calcareous nannofossils, trace fossils and ammonites.
Carquiejo Formation
Non-calcareous silicified mudstone facies – The change from calcareous to non-calcareous dominated
sedimentation and the absence of competent limestone beds is taken as the Morro-Carquiejo Fm. boundary.
A regional 70 cm-thick sill is observed at the lithological contact on either flank of Maio that obstructs direct
observation of the sedimentary boundary with the overlying unit of non-calcareous, green-orange
weathered, silicified mudstone of the Carquiejo Fm. This 4-5 m thick mudstone unit is commonly heavily
fractured and has no internal structure, bar a singular 30 cm-thick limestone bed. RDM-68 records a non-
calcareous mudstone of the Carquiejo Fm, with no visible lamination and minor organic matter (see
supplementary data Fig. S 2.2).
Above this unit, the Carquiejo Fm. is typically heterogeneous, composed of thin-bedded shales, siltstones
and laminated limestones. Exposure is absent below a fence crossing the river (Lat.: 15.18430°, Long: -
23.20428°), where the stratigraphy is folded and heavily eroded.
The non-calcareous mudstones are interpreted as being deposited below the CCD with a marked increase
in terrigenous input from the NWAAM. Presence of wood material (see Section 2.5.3) in these deposits
supports this interpretation. During diagenesis, reducing conditions prevailed as the facies has a ferruginous
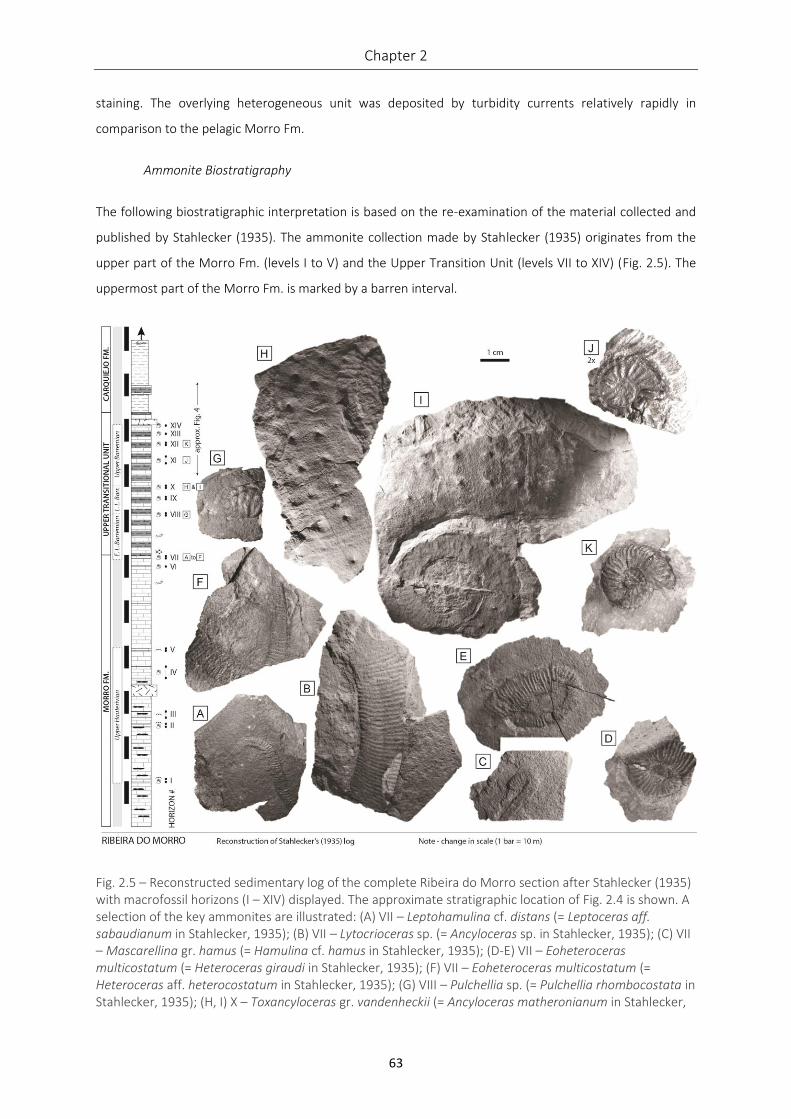
Chapter 2
63
staining. The overlying heterogeneous unit was deposited by turbidity currents relatively rapidly in
comparison to the pelagic Morro Fm.
Ammonite Biostratigraphy
The following biostratigraphic interpretation is based on the re-examination of the material collected and
published by Stahlecker (1935). The ammonite collection made by Stahlecker (1935) originates from the
upper part of the Morro Fm. (levels I to V) and the Upper Transition Unit (levels VII to XIV) (Fig. 2.5). The
uppermost part of the Morro Fm. is marked by a barren interval.
Fig. 2.5 – Reconstructed sedimentary log of the complete Ribeira do Morro section after Stahlecker (1935) with macrofossil horizons (I – XIV) displayed. The approximate stratigraphic location of Fig. 2.4 is shown. A selection of the key ammonites are illustrated: (A) VII – Leptohamulina cf. distans (= Leptoceras aff. sabaudianum in Stahlecker, 1935); (B) VII – Lytocrioceras sp. (= Ancyloceras sp. in Stahlecker, 1935); (C) VII – Mascarellina gr. hamus (= Hamulina cf. hamus in Stahlecker, 1935); (D-E) VII – Eoheteroceras multicostatum (= Heteroceras giraudi in Stahlecker, 1935); (F) VII – Eoheteroceras multicostatum (= Heteroceras aff. heterocostatum in Stahlecker, 1935); (G) VIII – Pulchellia sp. (= Pulchellia rhombocostata in Stahlecker, 1935); (H, I) X – Toxancyloceras gr. vandenheckii (= Ancyloceras matheronianum in Stahlecker,
Cretaceous sediments of Maio
64
1935); (J) XI – Heinzia sp. (= Douvilleiceras irregulare in Stahlecker, 1935); (K) XII – Heinzia sp. (= Pulchellia hoplitiformis in Stahlecker, 1935). Location detailed in Fig. 2.1B and key in Fig. 2.4. Note the change in scale, each bar represents 10m. All ammonites are natural size except Fig. J. (x2).
Stahlecker’s original material is preserved in the Palaeontological collections of the University of Tubingen
(Germany) but most of the specimens that were re-examined in the late 1980’s by the late Robert Busnardo
(Fourcade et al., 1990) from the Morro Fm. are missing.
Based on Busnardo’s interpretation of the fauna, Fourcade et al. (1990) assigned a late Hauterivian age to
this interval. Even so we could not access the material, we support this view since level I to V are
characterized by the occurrence of fairly abundant Didayilamellaptychus of the angulicostatus group,
including the type specimen of Didayilamellaptychus atlanticus (Hennig, 1914). It is clearly established that
these taxa characterise the Upper Hauterivian (Měchová et al., 2010; Vašíček et al., 2016). We also agree
with Fourcade et al. (1990) that the ammonoids from the topmost Morro Fm. (level VI) are not diagnostic.
The overlying level VII is marked by a fairly diverse fauna dominated by heteromorphic ammonoids. The
overall preservation as crushed impressions, is fairly poor, but was thought sufficiently distinctive by
Stahlecker to allow the introduction of new taxa such as Heteroceras multicostatum, Toxoceras filicostatum,
Ancyloceras maioense and Bochianites hennigi.
According to Busnardo in Fourcade et al. (1990), these forms should be re-interpreted as an assemblage of
Sabaudiella (= Eoleptoceras in Fourcade et al., 1990), Acrioceras and Hamulina of late Hauterivian age. In
our opinion this view is to be reconsidered in the light of the extensive recent literature on the upper
Hauterivian and lower Barremian heteromorphic ammonoids (see references in Klein et al., 2007;
Vermeulen, 2010a; Vermeulen et al., 2014; Leroy et al., 2016). The most significant taxa are illustrated on
Fig. 2.5A-F.
In our views, the genus Lytocrioceras as interpreted by Delanoy and Poupon (1992) and Ebbo et al. (1999) is
represented by open spires (such as T. filicostatum) and large proversum fragments (Fig. 5B and A.
maioense). Heteroceras multicostatum has been variously interpreted in the literature (see comments in
Vašíček and Wiedmann, 1994; Vašíček & Klajmon, 1998). In our opinion, it should rather be included in
Eoheteroceras and it is closely allied to E. norteyi (Myczyński and Triff).
The fauna also includes a number of small sized Anahamulinidae that show two distinct morphologies. The
smaller forms (Fig. 2.5C) are close to Mascarellina hamus (Quendstedt). The highly divergent shaft and
proversum of the larger forms (Fig. 2.5A & F) recalls Leptohamulina distans (Vašíček), and to a lesser extent,
Vasicekina autinae (Vermeulen). Due to the state of preservation of the Maio specimens, full identity cannot
be established, but the overall morphology is that of Leptohamulina. It should be noted that a fairly similar
specimen was illustrated by Myczyński and Triff (1986, pl. 3, Fig. 10), and as a whole the assemblage from
Chapter 2
65
level VII is very similar to the fauna from the Polier Fm. of Cuba. Based on the known occurrence of
Lytocrioceras in France and Eoheteroceras in Cuba, we retain an early Barremian age for this assemblage.
The occurrence of Lytocrioceras strongly suggests that the association cannot be any older than the K.
nicklesi ammonite Zone.
The occurrence of Pulchelliidae from level VIII to level XIV is of major biostratigraphic significance. Three
representative specimens are illustrated herein (Fig. 2.5G, J and K). Identification at the species level is
handicapped by the preservation of the material but we are confident that the ornamental features are
those of the late early (level VIII) to early late Barremian (level X to XIV) forms of the genera Pulchellia (Fig.
2.5G) and Heinzia (Fig. 2.5J-K) (Vermeulen, 2003; Patarroyo, 2004). The base of the upper Barremian is
placed at level X based on the occurrence of Toxancyloceras of the vandenheckii group (Fig. 2.5H-I) (Delanoy,
2003; Bert et al., 2018).
Calcareous Nannofossil Biostratigraphy
The basal intercalated mudstones from the Morro Fm. sampled between RDM-27 and RDM-38 are
extremely poor, no age assigned (Fig. 2.4; Table S 2.1). Nannofossil recovery improves from RDM-40 upwards
within the upper part of the Morro Fm. A poorly preserved, moderate diversity assemblage yields
Zeugrhabdotus scutula, Assipetra terebrodentarius youngii and Nannoconus steinmannii. This association is
indicative of a latest Barremian through earliest Aptian age. Above sample RDM-51, nannoconid abundance
drops significantly with N. steinmannii only sporadically identified (RDM-63 & RDM-66). Conusphaera rothii
is not recorded from this section, this probably more of a preservational response than a true stratigraphic
event.
The Carquiejo Fm yields a low diversity assemblage characterised by the continued occurrence of A.
terebrodentarius youngii and the appearance at RDM-70 of Eprolithus floralis (Fig. 2.4; Table S 2.1). The
presence of these two markers indicate a lower Aptian to earliest Albian age range. Preservational bias
affects the actual top/base of nannofossil events, rather than true FO/LO.
Fig. 2.6 (next page) – Detailed sedimentary log of the Monte Esgrovere section with photographs of the new collection of ammonites: (A) Neolissoceras (Vergoligeras) sp. juv. gr. salinarium; (B) Bochianites sp.; (C) “Busnardoites” sp.; (D) Kilianella sp. All ammonites are natural size except Fig. A and C (x2). Location detailed in Fig. 2.1B and key in Fig. 2.4.
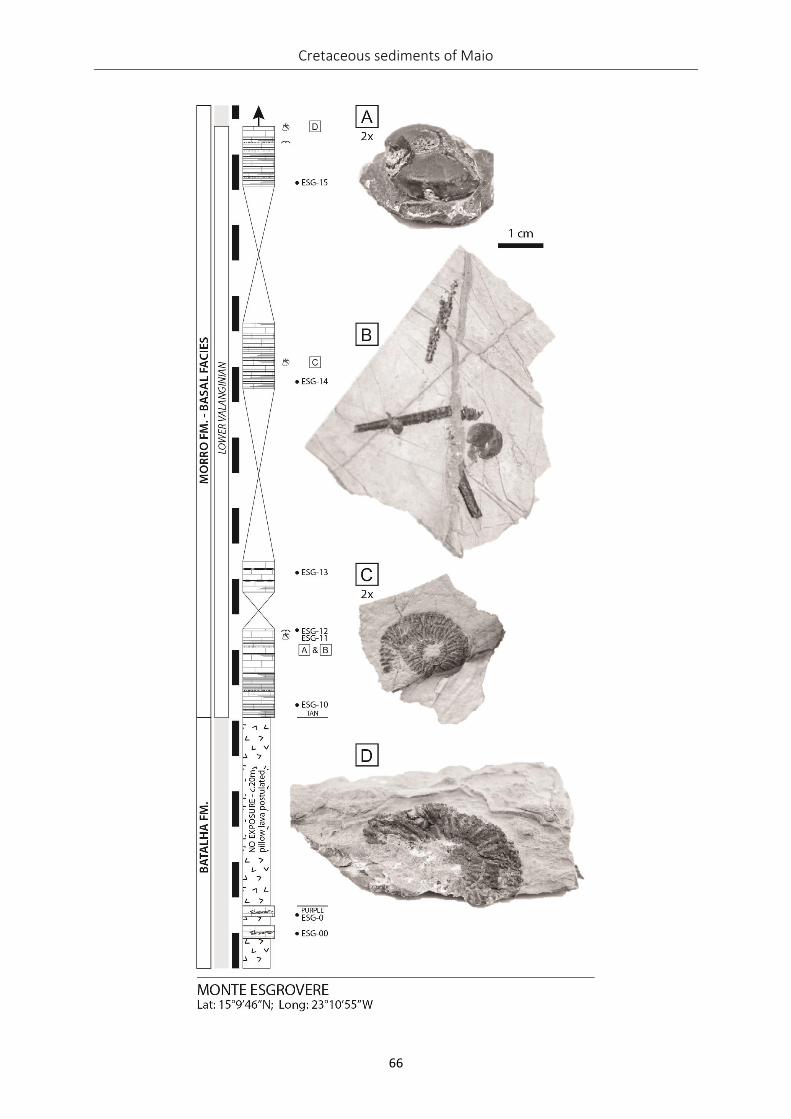
Cretaceous sediments of Maio
66
Chapter 2
67
2.5.2 Monte Esgrovere Section (Sample prefix: ESG)
Patchy exposure across the Monte Esgrovere hillside can be correlated to produce a detailed log (Fig. 2.6),
with the inferred igneous units in Fig. 2.4. At the location defined by Fourcade et al. (1990) there was no
present-day surface exposure, with evidence of quarrying, hence a section was selected 1 km to the ESE
(Lat.: 15.16296°, Long: -23.18191°). This is the only location on the island preserving a complete section
from Batalha Fm. lavas, through the basal ferruginous facies to the main pelagic limestones of the Morro
Fm.
Lithofacies
Batalha Formation
Silicified limestone facies – The inter-lava sediments within the Batalha Fm. comprise red-purple silicified
limestones and chert previously described by Fourcade et al. (1990). These are observed in two outcrops
separated 5 m apart along strike, have a thickness of ca. 1 m, interbedded with inferred pillow lavas (ESG-0,
see supplementary data Fig. S 2.2). The sediments show undulated bedding. Sample ESG-0 is a red
ferruginous mudstone with a banded fabric (see supplementary data Fig. S 2.2). The micritic matrix contains
quartzose silt and calcified radiolarian, with a dark black band of opaque hematite. Above this, isolated
exposure of the interlava sediments is ca. 20 m of poorly exposed pillow lavas. The contact between the
Batalha and Morro Fm. is not directly observable, but is inferred as the break in slope before the more
competent Morro Fm. limestone crops out.
Stillman et al. (1982) assumes that the variolitic texture of the pillow lava indicates eruption of the mid-
ocean ridge basalts between 1000-1500 m water-depth. In the latter episodic stages of pillow lava
formation, silicified limestones accumulated above the CCD and were reworked by current activity during
periods of volcanic quiescence.
Morro Formation
Ferruginous limestone facies – At this location, the basal limestone has weathered to a bright orange colour
due to ferruginous enrichment (Stillman et al., 1982), gradually fading to the typical grey of the Morro Fm.
The limestone is thickly bedded, occasionally with finely laminated, mm-scale, horizons of iron concretions,
containing a diverse macro-fossil assemblage. Thin sections of two samples from this interval show different
characteristics. Sample ESG-12 has a mudstone texture containing thin-shelled bivalve fragments and
recrystallised radiolaria (see supplementary data Fig. S 2.2). This microfacies shows a nodular pseudo-
laminated fabric with abundant dark, wavy seams of organic material. Sample ESG-16 has a similar
microfacies (top and base; see supplementary data Fig. S 2.2) punctuated by a normally-graded bed, where
the boundary appears stylolitized. Micro-faulted calcite veins cross-cut the sample. A thin intraformational
Cretaceous sediments of Maio
68
conglomerate is present within the basal facies containing rounded clasts of altered volcanic glass and pellets
of chlorite in a ferruginous micritic matrix (Robertson, 1984). The transition to typical Morro Fm. limestones
is gradual observed along the exposure as it continues across the hill, where surface mining is currently
active.
The pelagic limestones formed in a hydrothermal field active during and sometime after the latter stages of
volcanism, causing metalliferous enrichment that gradually waned (Stillman et al. 1982). Robertson (1984)
highlights the geochemical similarities between this Fe-enriched and Al-depleted facies and oceanic pelagic
sequences in the Pacific seamount chains, but suggests deposition occurred in a topographic low evidenced
by laminated sedimentation.
Biostratigraphy
The newly collected material from the base of Morro Fm. is preserved as limonitic internal moulds of
juveniles. It includes Vergoliceras of the salinarium group (Fig. 2.6A), Bochianites sp. (Fig. 2.6B), Kilianella sp.
(Fig. 2.6D), olcostephanids, and a poorly preserved neocomitid that is tentatively assigned to “Busnardoites”
sp. (Fig. 2.6C). Co-occurrence of Vergoliceras and Kilianella leaves no doubt about the middle early
Valanginian age of the assemblage (Neocomites neocomiensiformis Zone, see Company and Tavera, 2015
with references).
Re-evaluation of the calpionellid illustrated by Fourcade et al. (1990) by Daniela Reháková (pers. comms.
2019) suggests that the Calpionellites species identified by those authors rather marks the upper part of the
Calpionellites Zone, e.g. the Major Subzone. This subzone indicates the middle to late Lower Valanginian
(Petrova et al., 2011), supporting the age assignment from the ammonite biostratigraphy.
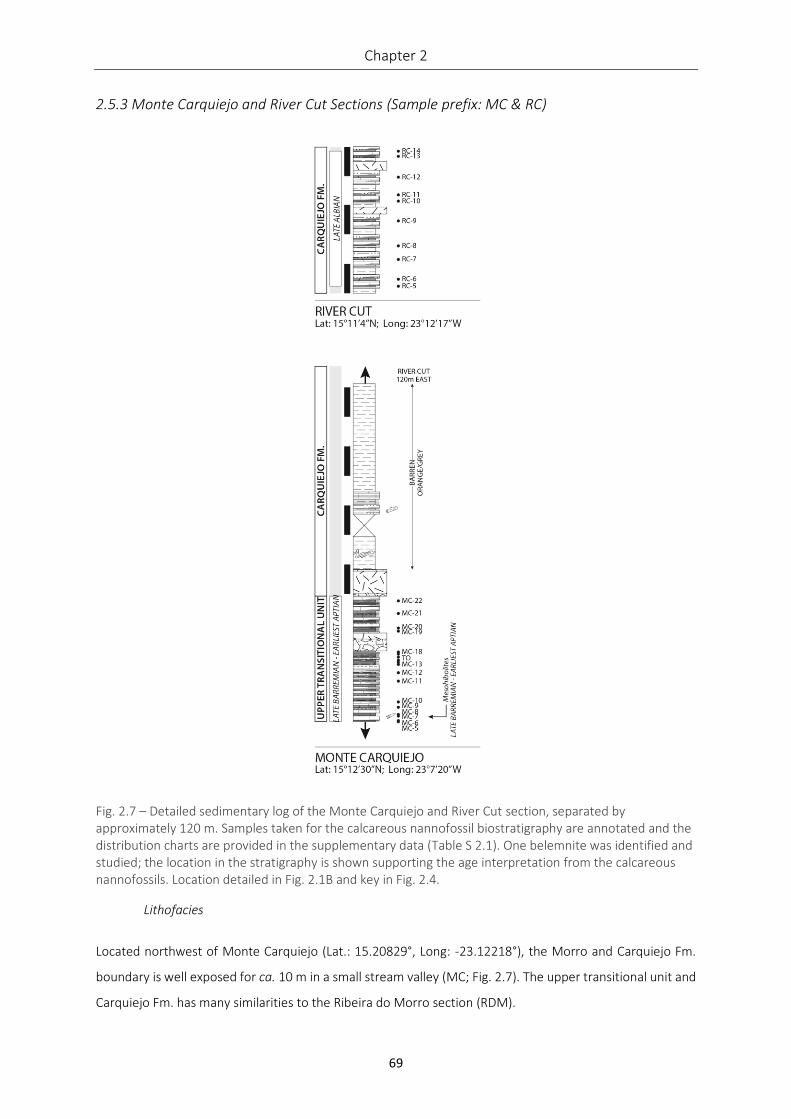
Chapter 2
69
2.5.3 Monte Carquiejo and River Cut Sections (Sample prefix: MC & RC)
Fig. 2.7 – Detailed sedimentary log of the Monte Carquiejo and River Cut section, separated by approximately 120 m. Samples taken for the calcareous nannofossil biostratigraphy are annotated and the distribution charts are provided in the supplementary data (Table S 2.1). One belemnite was identified and studied; the location in the stratigraphy is shown supporting the age interpretation from the calcareous nannofossils. Location detailed in Fig. 2.1B and key in Fig. 2.4.
Lithofacies
Located northwest of Monte Carquiejo (Lat.: 15.20829°, Long: -23.12218°), the Morro and Carquiejo Fm.
boundary is well exposed for ca. 10 m in a small stream valley (MC; Fig. 2.7). The upper transitional unit and
Carquiejo Fm. has many similarities to the Ribeira do Morro section (RDM).
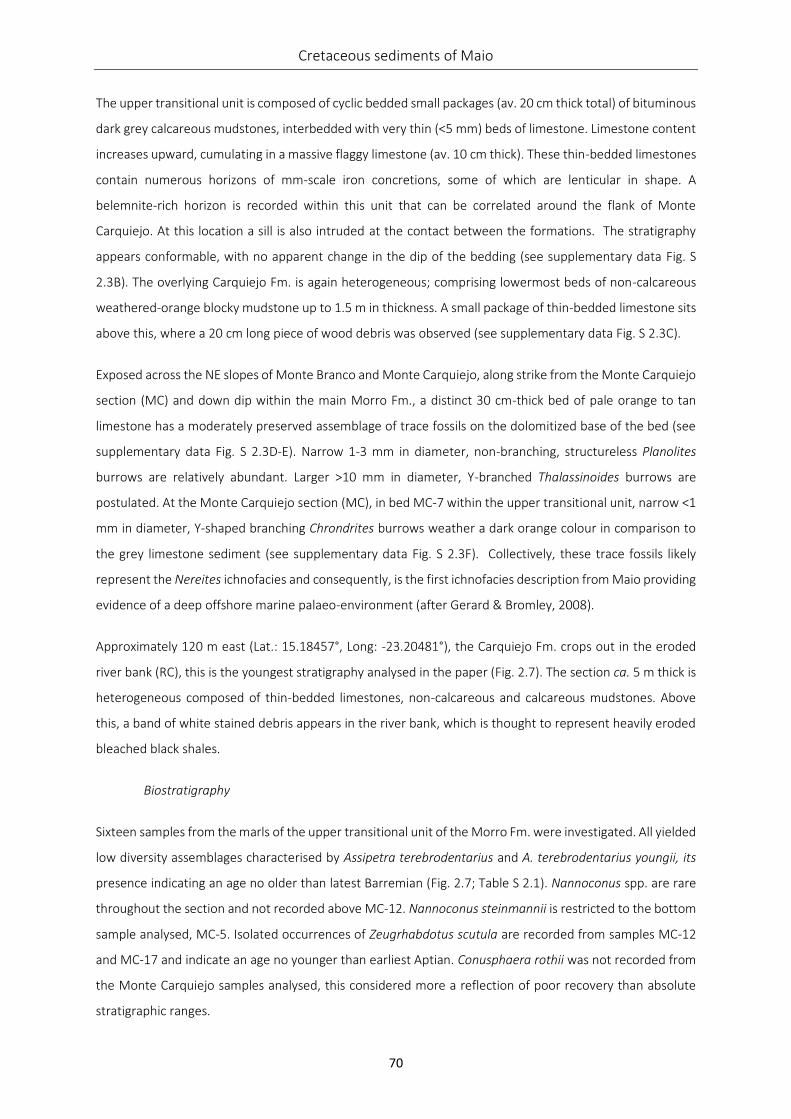
Cretaceous sediments of Maio
70
The upper transitional unit is composed of cyclic bedded small packages (av. 20 cm thick total) of bituminous
dark grey calcareous mudstones, interbedded with very thin (<5 mm) beds of limestone. Limestone content
increases upward, cumulating in a massive flaggy limestone (av. 10 cm thick). These thin-bedded limestones
contain numerous horizons of mm-scale iron concretions, some of which are lenticular in shape. A
belemnite-rich horizon is recorded within this unit that can be correlated around the flank of Monte
Carquiejo. At this location a sill is also intruded at the contact between the formations. The stratigraphy
appears conformable, with no apparent change in the dip of the bedding (see supplementary data Fig. S
2.3B). The overlying Carquiejo Fm. is again heterogeneous; comprising lowermost beds of non-calcareous
weathered-orange blocky mudstone up to 1.5 m in thickness. A small package of thin-bedded limestone sits
above this, where a 20 cm long piece of wood debris was observed (see supplementary data Fig. S 2.3C).
Exposed across the NE slopes of Monte Branco and Monte Carquiejo, along strike from the Monte Carquiejo
section (MC) and down dip within the main Morro Fm., a distinct 30 cm-thick bed of pale orange to tan
limestone has a moderately preserved assemblage of trace fossils on the dolomitized base of the bed (see
supplementary data Fig. S 2.3D-E). Narrow 1-3 mm in diameter, non-branching, structureless Planolites
burrows are relatively abundant. Larger >10 mm in diameter, Y-branched Thalassinoides burrows are
postulated. At the Monte Carquiejo section (MC), in bed MC-7 within the upper transitional unit, narrow <1
mm in diameter, Y-shaped branching Chrondrites burrows weather a dark orange colour in comparison to
the grey limestone sediment (see supplementary data Fig. S 2.3F). Collectively, these trace fossils likely
represent the Nereites ichnofacies and consequently, is the first ichnofacies description from Maio providing
evidence of a deep offshore marine palaeo-environment (after Gerard & Bromley, 2008).
Approximately 120 m east (Lat.: 15.18457°, Long: -23.20481°), the Carquiejo Fm. crops out in the eroded
river bank (RC), this is the youngest stratigraphy analysed in the paper (Fig. 2.7). The section ca. 5 m thick is
heterogeneous composed of thin-bedded limestones, non-calcareous and calcareous mudstones. Above
this, a band of white stained debris appears in the river bank, which is thought to represent heavily eroded
bleached black shales.
Biostratigraphy
Sixteen samples from the marls of the upper transitional unit of the Morro Fm. were investigated. All yielded
low diversity assemblages characterised by Assipetra terebrodentarius and A. terebrodentarius youngii, its
presence indicating an age no older than latest Barremian (Fig. 2.7; Table S 2.1). Nannoconus spp. are rare
throughout the section and not recorded above MC-12. Nannoconus steinmannii is restricted to the bottom
sample analysed, MC-5. Isolated occurrences of Zeugrhabdotus scutula are recorded from samples MC-12
and MC-17 and indicate an age no younger than earliest Aptian. Conusphaera rothii was not recorded from
the Monte Carquiejo samples analysed, this considered more a reflection of poor recovery than absolute
stratigraphic ranges.
Chapter 2
71
The belemnites recovered from the upper transitional unit are juvenile forms most probably Mesohibolites,
although not identifiable at the species level (Fig. 2.7). This genus has an age range from the late Barremian
to earliest Aptian and is supportive of the MC nannofossil datings.
The youngest Cretaceous succession with nannofossil recovery was investigated at the Monte Carquiejo
River Cut (RC). Nine samples were analysed, two samples barren of nannofossils (RC-11 & RC-14), the
remainder yielding a poorly preserved, moderate diversity assemblage (Fig. 2.7; Table S 2.1). The presence
of Eiffelithus turriseiffelii in the absence of Gartnerago nanum / G. theta, Acaenolithus cenomanicus and the
Broinsonia signata / B. enormis plexus indicates a stratigraphic level within the upper part of the late Albian.
Additional support for this age assignment is provided by the presence of Hayesites albiensis in the basal
sample RC-5 and occurrence of Watznaueria britannica (samples RC-7 & RC-10), both species having
documented LAD’s close the top Albian.
Sample RC-6 produced very abundant planktonic foram chambers observed semi-buried in lithic fragments.
Despite lithic material remaining attached to the specimens, Globigerinelloides and Hedbergella are
identified, although unidentifiable at a species level are consistent with the late Albian age assigned. There
is one specimen resembling G. bentonensis which is not older than mid-late Albian. The abundance of the
planktonics (which is high) suggests strong, open ocean, well oxygenated marine conditions within the upper
water column.
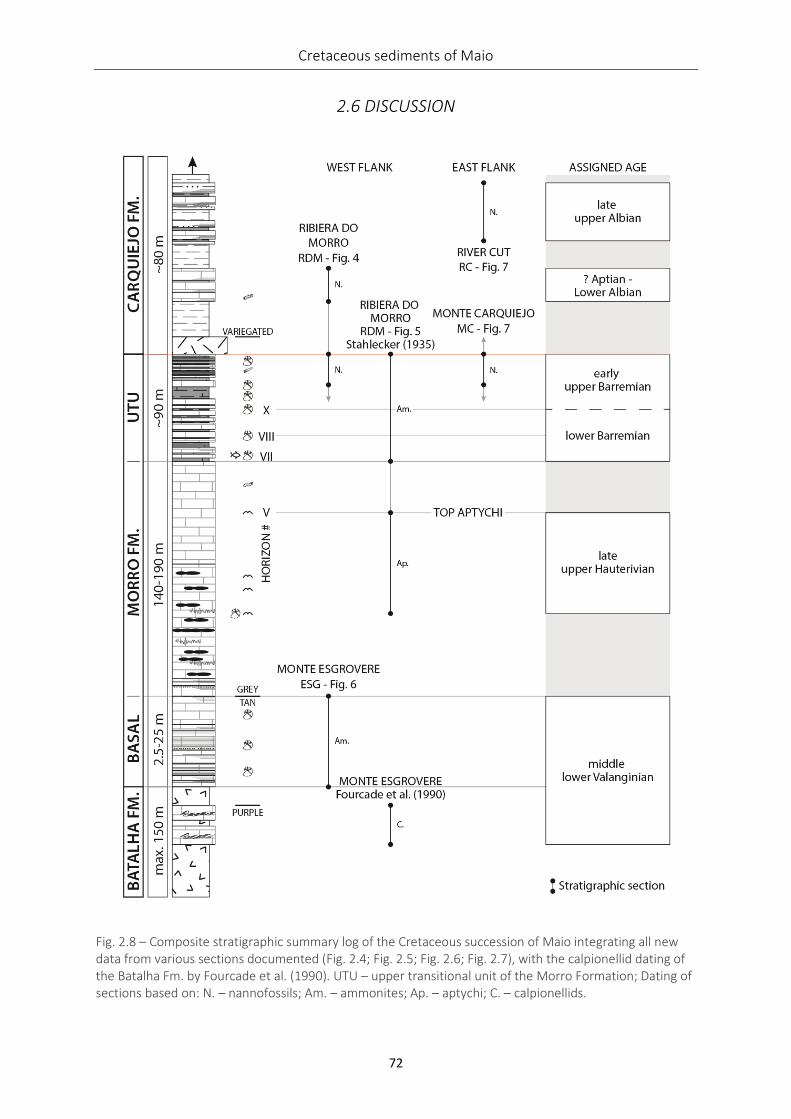
Cretaceous sediments of Maio
72
2.6 DISCUSSION
Fig. 2.8 – Composite stratigraphic summary log of the Cretaceous succession of Maio integrating all new data from various sections documented (Fig. 2.4; Fig. 2.5; Fig. 2.6; Fig. 2.7), with the calpionellid dating of the Batalha Fm. by Fourcade et al. (1990). UTU – upper transitional unit of the Morro Formation; Dating of sections based on: N. – nannofossils; Am. – ammonites; Ap. – aptychi; C. – calpionellids.
Chapter 2
73
2.6.1 Stratigraphy
Despite previous efforts the stratigraphy of Maio has remained poorly dated and significant uncertainties
have persisted throughout publications. Our comprehensive analysis of new fieldwork data complementing
an exhaustive re-interpretation of existing data has contributed towards resolving these issues and
improving the stratigraphic resolution (Fig. 2.8). The unpublished geological report of Rigassi (1972)
underpins the dating of the sedimentary sequence of Maio and was studied as part of our analysis. The ages
assigned to the stratigraphy are not supported by any macro-/micro-fossil plates or sedimentary logs leaving
little scientific value for use in this paper. One of the uncertainties regards the Tithonian age reported in the
literature for the lowermost stratigraphy exposed on the East flank of Maio. Our study joins Robertson and
Bernoulli (1982), Stillman et al. (1982), Robertson (1984) and Fourcade et al. (1990) in recognising the
absence of any Jurassic paleontological evidence to support this interpretation. The new ammonite
assemblage documented at ESG, complementing the calpionellid dating of Fourcade et al. (1990) validates
that the interlava sediments of the Batalha Fm. and overlying basal facies of the Morro Fm. are Lower
Valanginian in age, part of the Neocomites neocomiensiformis Zone. This is in agreement with the positions
of magnetic anomalies M11 and M16 relative to Maio (Fig. 2.1A).
Age definition for the upper transitional unit of the Morro Fm. is now robust; independent palaeontological
analyses of sections on each flank of the island provide strong evidence of a late Barremian age, even so an
early Aptian age cannot be excluded for the top of formation. Our new dating of the Carquiejo Fm. supports
the Albian age interpretation of Fourcade et al. (1990), and as a consequence, the recognition of a hiatus or
discontinuity spanning part of the Aptian and separating the contrasting lithologies of the Morro and
Carquiejo Formations (Stillman et al. 1982). Our youngest age attributed to the Carquiejo Fm. from the RC
section is of Late Albian age. This is not representative of the true youngest age for the formation as
stratigraphy exposed higher up in this formation yielded no age data, and in addition, the overlying
unconformity may have eroded section. Therefore, we are unable to determine the youngest age for the
Carquiejo Fm. and hence, the possible oldest most age for the volcanism on Maio due to the volcanic origin
of the overlying Coruja Fm.
2.6.2 Regional Correlation
By correlating the results from Maio to additional data available in the Central Atlantic (DSDP results,
outcrops in Cuba and more generally to the Maiolica facies of the Western Tethys) allows the Maio
sediments to be considered within a regional context. DSDP Site 367 is the nearest penetration (ca. 450 km
SE, Fig. 2.1B) of the Cretaceous stratigraphy (Lancelot et al. 1976). A comparison of stratigraphic thickness
is not directly proposed due to the imprecision of measurements on Maio. However, Ali et al. (2003)
highlight from seismic reflection data that this package thickens from west to east in response to sediment
Cretaceous sediments of Maio
74
loading and flexure at the West African continental margin. As such a thinning from Site 367 (ca. 225 m) to
Maio is postulated, but may not be representative as DSDP Site 367 was drilled on a structural high (Lancelot
et al. 1976). As discussed by Robertson (1984), red-brown argillaceous limestone facies encountered at Site
367 (Unit 6; “Rosso Ammonitico” sensu Farinacci & Elmi, 1981) below the white nannofossil limestones (Unit
5) were not recognised on Maio (Lancelot et al. 1976). In light of the biostratigraphic results for the
lowermost stratigraphy indicating a Lower Valanginian age (see Section 2.5.2) we would not expect to
encounter these Jurassic sediments on the island.
The pelagic deep water limestones with chert of the Morro Fm. resemble lithologically, paleontologically
and stratigraphically the Maiolica facies of the Western Tethys and Atlantic (Wieczorek, 1988), and are
drilled across the Central Atlantic by the DSDP (Müller et al. 1983). Generally, the Maiolica facies is white to
grey, compact, well stratified, pelagic limestone with dark nodular/layered chert, structured in 5-30 cm thick
beds with little internal bedding due to intense bioturbation (Wieczorek, 1988). Lithological variations exist,
exemplified by the comparison of stratigraphically equivalent Maio sediments to Unit 5 of DSDP Site 367
where marl interbeds are more common, related to the relative proximity to terrigenous supply from the
NWAAM. Aptychi dominate the macro-fossil assemblage of the Maiolica facies and as such are prevalent in
Unit 5 (DSDP Site 367; Renz, 1983) and observed in the Morro Fm. The Polier Fm. exposed on Cuba offers
the nearest outcrop occurrence of a similar sedimentary sequence to the Morro Fm. (Pszczółkowski &
Myczyński, 1999), albeit there is an overprint of clastic turbidite sandstones. There is a strong resemblance
between the facies, ammonite fauna and associated preservation style as once the Central Atlantic is
reconstructed to Lower Cretaceous times, the sediments now exposed on Maio and Cuba would have been
deposited at similar paleo-latitude and water depth (Davison, 2005).
The upper transitional unit records a discernible shift in the sedimentation style from the main Morro Fm.
as more clay is introduced into the Central Atlantic and anoxic conditions commence (Chamley et al. 1988).
This is reflected in the top of Unit 5 (Core 25 to 26, DSDP Site 367; Lancelot et al. 1976) where light grey
limestones interbedded with olive black marl were encountered (see Fig. 3.2 and Fig. 0.1 for a correlation
between the DSDP stratigraphy and Maio). Similarly, this transitional facies is cropping out within the upper
Polier Fm. (Pszczółkowski, 1978), and more widespread across both margins of the Tethys, Alps, Central
Atlantic and Pacific (de Graciansky et al. 1981). On Maio, the Morro-Carquiejo sharp transition between
calcareous and argillaceous dominated facies is clear. This, along with the biostratigraphy results, supports
the interpretation of a regional hiatus recorded in the Western Tethys and Central Atlantic between the
latest Early Aptian into the Late Aptian to Albian interval (Event E1 - Müller et al. 1983). Robertson (1984)
generally links the overlying Carquiejo Fm. stratigraphy to the upper Mid-Cretaceous black shale facies
drilled at DSDP Sites 367 and 368, whilst we agree with this broad interpretation further definition is
possible. The non-calcareous claystones exposed at both the RDM and MC sections are seen as equivalent
to the facies encountered in Core 24, DSDP Site 367 and not penetrated at DSDP Site 368 (Lancelot et al.
Chapter 2
75
1976). The limited exposure of the upper Carqueijo Fm. prevents complete integration with the DSDP
results; however the late Albian RC section is likely to be a distal equivalent of this upper Mid-Cretaceous
black shale facies.
2.6.3 Paleo-Environmental Evolution
Ocean floor formation occurred during the lower Valanginian above the CCD, where interlava sediment was
able to develop in quiescence periods of volcanism. The similarities in age between the interlava sediments
(Fourcade et al. 1990) and basal Morro Fm. suggests that there was no break in sedimentation. A prolonged
period of terrigenous starvation occurred extending from the lower Valanginian to Hauterivian resulting in
the deposition of thick pelagic limestones in a deep water basinal environment. During this period,
aggradational carbonate platforms extending around the circumference of the Central Atlantic were the
focus of sedimentation preventing terrigenous material reaching the deep basin (Mourlot et al. 2018). The
Morro Fm. pelagic limestones and Maiolica facies were deposited above the aragonite compensation depth
(ACD) and above the CCD, due to the occurrence of calcitic aptychi and ammonites, both having aragonitic
shells, in a basin starved of terrigenous input. Wieczorek (1988) highlights that these observations do not
specify paleo-water depths, as suggested by Robertson (1984). Benthic life in the deep water basinal
environment is indicated by the ichnofacies observed within the Morro Fm.
The presence of black shale facies interbedded in the upper transitional unit is not supported by TOC
measurements, however the presence of fish remains and planktonic ammonites hints to dysoxic conditions.
The co-occurrence of ornamented pulchellids and heteromorphic ammonoids is most typical of the shaley
interlayers within the Maiolica facies (Cecca et al. 1995). The faunal assemblages are largely dominated by
small size heteromorphs, a morphology that is known to indicate dysaerobic environments (see discussion
in Frau et al. 2016). Organic geochemical analysis of the equivalent section at DSDP Site 367 reveals a high
TOC content, 4-25% within the marls (Lancelot et al. 1976); as such this anoxic environment is postulated in
the upper transitional unit during the upper Barremian.
The regional hiatus occurs in a variety of depositional settings from carbonate platforms to pelagic
environments, recording a significant facies contrast that is attributed to the raising of the CCD in response
to a sea level-rise (Hancock, 1975; Vail et al., 1980; de Graciansky et al., 1981), and occurs coevally with the
rifting phase in the North Atlantic and Equatorial Atlantic (Sibuet et al., 1980; Olyphantet al., 2017). The
introduction of terrigenous material in the lower Carquiejo Fm. and identified in DSDP Site 367 (Core 24)
corresponds to the increased delivery of argillaceous sediment by shelf edge deltas along the NW African
Atlantic margin (Luber et al., 2019; Mourlot et al., 2018), introducing abundant plant debris. Evidence for
early volcanism in the Cape Verde archipelago was suggested by the presence of tuffs within the Carquiejo
Fm. (Serralheiro, 1968, 1970); however our field work supports Robertson’s (1984) lack of identification of
Cretaceous sediments of Maio
76
volcanic material in the formation. Consequently we follow previous interpretations that volcanism began
in Paleogene to Miocene times. Although, the possibility is not dismissed as Van de Bogaard (2013) dates 4
seamounts of Lower Cretaceous age (142-119Ma) using 40Ar/39Ar ratios within the Canary Island Seamount
Province, and volcanic glass is present in Late Cretaceous to Tertiary succession of DSDP Site 368 (Lancelot
et al. 1976).
2.7 CONCLUSIONS
This multi-disciplinary study has revised the stratigraphy for the Cretaceous sediments exposed on Maio and
provides a key section to define the stratigraphic framework in the distal domain of the Central Atlantic.
Dating of a new collection of ammonites from the basal Morro Fm. definitively indicates a lower Valanginian
age for the oldest sediments on Maio, revising the previous interpretations of a Jurassic age. The ferruginous
limestone facies were deposited by pelagic processes in a metalliferous hydrothermal field resulting in Fe-
enrichment. Re-interpretation of the original collection of macro-fauna collected by Stahlecker was
undertaken, essential to any stratigraphical study of these sediments, as this collection is likely to be
irreplaceable due to intensive quarrying on the island. Combined with the first substantial nanno-fossil study
of 71 samples and integration with new macro-fossils collected as part of this study, a refined stratigraphy
is proposed for the Morro Fm. This suggests the youngest Morro Fm. is of upper Barremian age. The
evolution from the main Morro Fm. massive to bedded limestone facies to the upper transitional unit flaggy
limestone facies is a result of increasing terrigenous supply.
Our new dating of the Morro-Carquiejo boundary and facies observations support the presence of a major
regional hiatus spanning part of the Aptian. This can be recognised widely across the Central Atlantic as it is
proposed to be related to major geodynamic events in the Atlantic and associated changes in oceanic
conditions. The youngest studied stratigraphy, the Carquiejo Fm., correlates well with the middle Upper
Cretaceous black shale facies drilled during DSDP expeditions across the Central Atlantic. These record
bleached black shale facies indicative of anoxic depositional environment. The organic content of the
mudstones on Maio is absent, most probably significantly degraded due to thermal alteration associated
with the volcanic activity and prolonged exposure at outcrop. Future biostratigraphical studies should aim
to date the uppermost Carquiejo Fm. and overlying Coruja Fm. to deduce the earliest possible age for the
volcanism related to the formation of this unique island and the remainder of the archipelago.
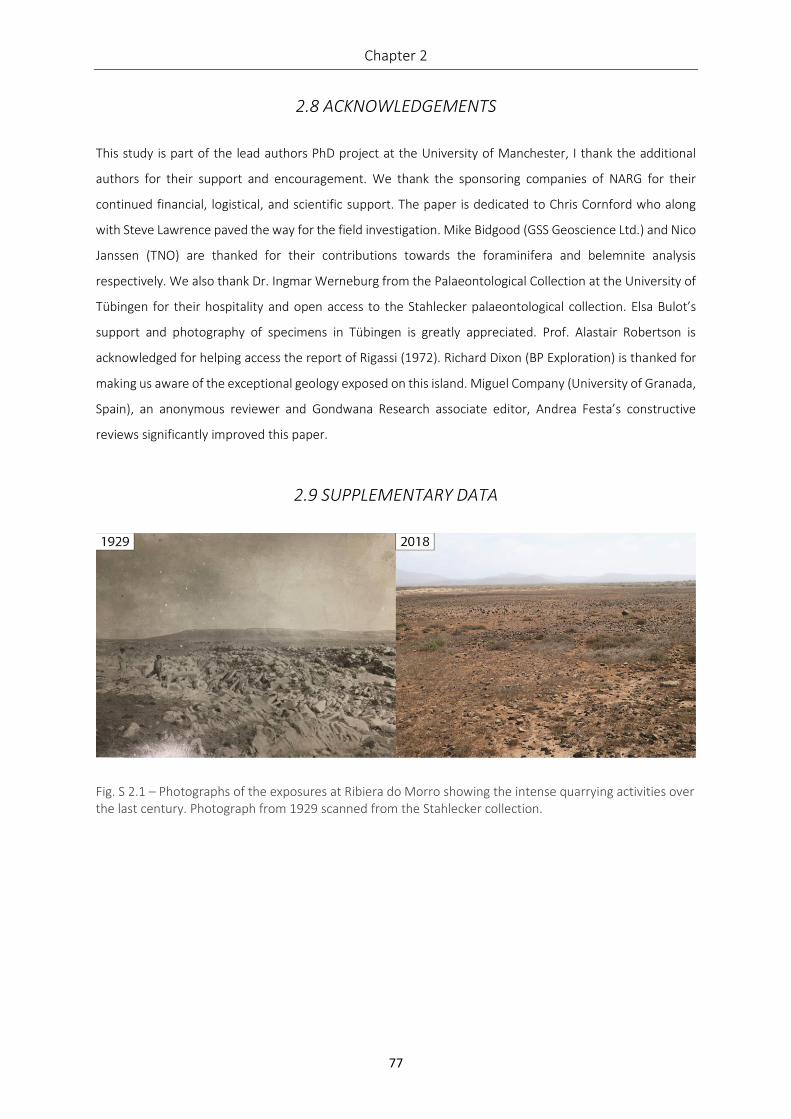
Chapter 2
77
2.8 ACKNOWLEDGEMENTS
This study is part of the lead authors PhD project at the University of Manchester, I thank the additional
authors for their support and encouragement. We thank the sponsoring companies of NARG for their
continued financial, logistical, and scientific support. The paper is dedicated to Chris Cornford who along
with Steve Lawrence paved the way for the field investigation. Mike Bidgood (GSS Geoscience Ltd.) and Nico
Janssen (TNO) are thanked for their contributions towards the foraminifera and belemnite analysis
respectively. We also thank Dr. Ingmar Werneburg from the Palaeontological Collection at the University of
Tübingen for their hospitality and open access to the Stahlecker palaeontological collection. Elsa Bulot’s
support and photography of specimens in Tübingen is greatly appreciated. Prof. Alastair Robertson is
acknowledged for helping access the report of Rigassi (1972). Richard Dixon (BP Exploration) is thanked for
making us aware of the exceptional geology exposed on this island. Miguel Company (University of Granada,
Spain), an anonymous reviewer and Gondwana Research associate editor, Andrea Festa’s constructive
reviews significantly improved this paper.
2.9 SUPPLEMENTARY DATA
Fig. S 2.1 – Photographs of the exposures at Ribiera do Morro showing the intense quarrying activities over the last century. Photograph from 1929 scanned from the Stahlecker collection.
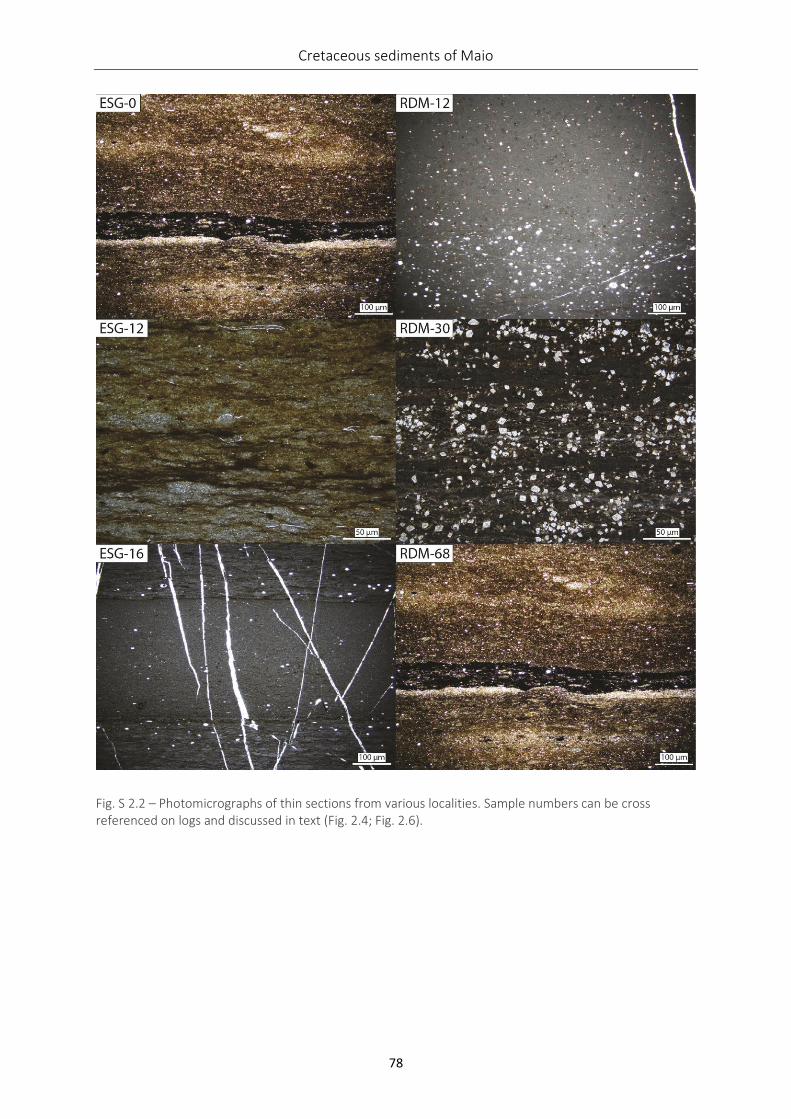
Cretaceous sediments of Maio
78
Fig. S 2.2 – Photomicrographs of thin sections from various localities. Sample numbers can be cross referenced on logs and discussed in text (Fig. 2.4; Fig. 2.6).
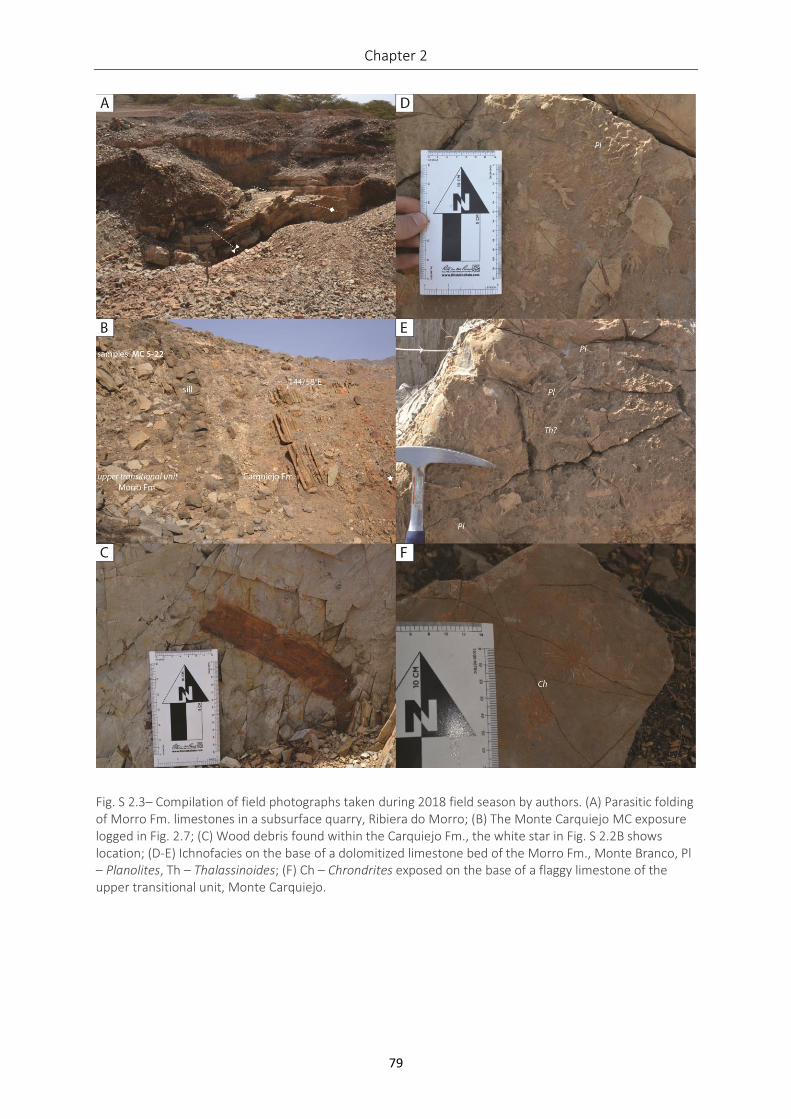
Chapter 2
79
Fig. S 2.3– Compilation of field photographs taken during 2018 field season by authors. (A) Parasitic folding of Morro Fm. limestones in a subsurface quarry, Ribiera do Morro; (B) The Monte Carquiejo MC exposure logged in Fig. 2.7; (C) Wood debris found within the Carquiejo Fm., the white star in Fig. S 2.2B shows location; (D-E) Ichnofacies on the base of a dolomitized limestone bed of the Morro Fm., Monte Branco, Pl – Planolites, Th – Thalassinoides; (F) Ch – Chrondrites exposed on the base of a flaggy limestone of the upper transitional unit, Monte Carquiejo.
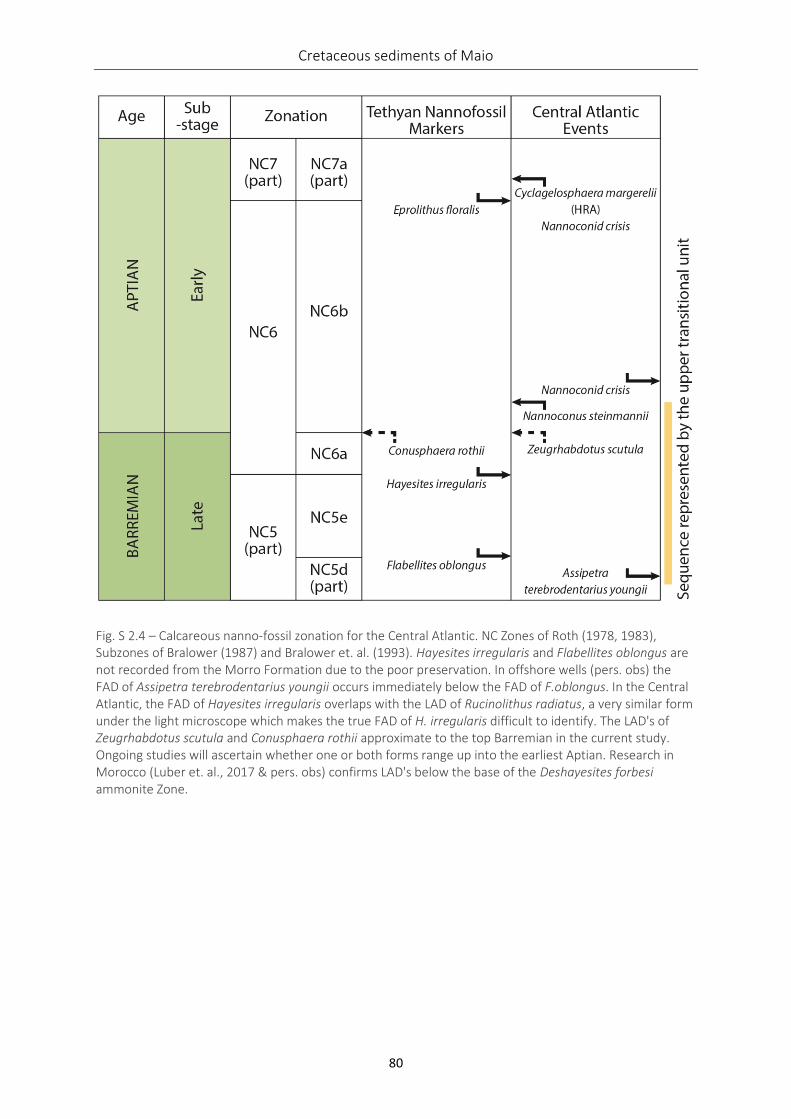
Cretaceous sediments of Maio
80
Fig. S 2.4 – Calcareous nanno-fossil zonation for the Central Atlantic. NC Zones of Roth (1978, 1983), Subzones of Bralower (1987) and Bralower et. al. (1993). Hayesites irregularis and Flabellites oblongus are not recorded from the Morro Formation due to the poor preservation. In offshore wells (pers. obs) the FAD of Assipetra terebrodentarius youngii occurs immediately below the FAD of F.oblongus. In the Central Atlantic, the FAD of Hayesites irregularis overlaps with the LAD of Rucinolithus radiatus, a very similar form under the light microscope which makes the true FAD of H. irregularis difficult to identify. The LAD's of Zeugrhabdotus scutula and Conusphaera rothii approximate to the top Barremian in the current study. Ongoing studies will ascertain whether one or both forms range up into the earliest Aptian. Research in Morocco (Luber et. al., 2017 & pers. obs) confirms LAD's below the base of the Deshayesites forbesi ammonite Zone.
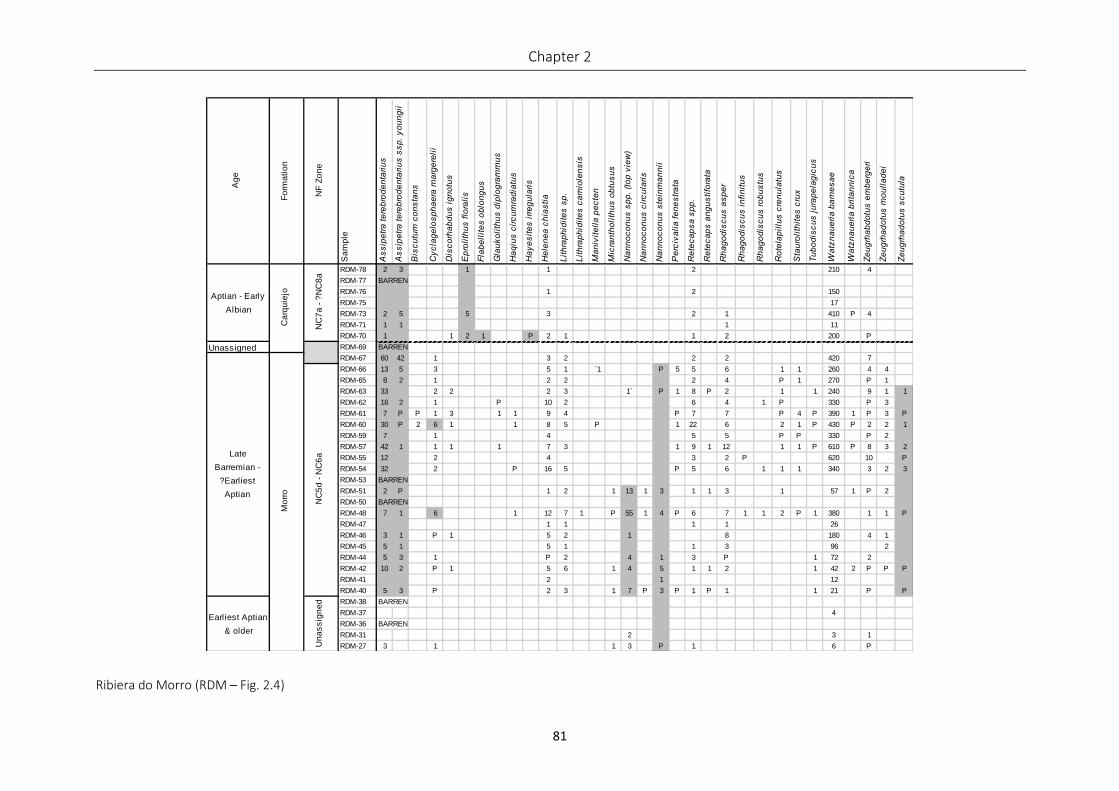
Chapter 2
81
Ribiera do Morro (RDM – Fig. 2.4)
Ag
e
Fo
rma
tio
n
NF
Zo
ne
Sa
mp
le
As
sip
etr
a t
ere
bro
de
nta
riu
s
As
sip
etr
a t
ere
bro
de
nta
riu
s s
sp
. y
ou
ng
ii
Bis
cu
tum
co
ns
tan
s
Cy
cla
ge
los
ph
ae
ra m
arg
ere
lii
Dis
co
rha
bd
us
ig
no
tus
Ep
roli
thu
s f
lora
lis
Fla
be
llit
es
ob
lon
gu
s
Gla
uk
oli
thu
s d
iplo
gra
mm
us
Ha
qiu
s c
irc
um
rad
iatu
s
Ha
ye
sit
es
irr
eg
ula
ris
He
len
ea
ch
ias
tia
Lit
hra
ph
idit
es
sp
.
Lit
hra
ph
idit
es
ca
rnio
len
sis
Ma
niv
ite
lla
pe
cte
n
Mic
ran
tho
lith
us
ob
tus
us
Na
nn
oc
on
us
sp
p.
(to
p v
iew
)
Na
nn
oc
on
us
cir
cu
lari
s
Na
nn
oc
on
us
ste
inm
an
nii
Pe
rciv
ali
a f
en
es
tra
ta
Re
tec
ap
sa
sp
p.
Re
tec
ap
s a
ng
us
tifo
rata
Rh
ag
od
isc
us
as
pe
r
Rh
ag
od
isc
us
in
fin
itu
s
Rh
ag
od
isc
us
ro
bu
stu
s
Ro
tela
pil
lus
cre
nu
latu
s
Sta
uro
lith
ite
s c
rux
Tu
bo
dis
cu
s j
ura
pe
lag
icu
s
Wa
tzn
au
eri
a b
arn
es
ae
Wa
tzn
au
eri
a b
rita
nn
ica
Ze
ug
rha
bd
otu
s e
mb
erg
eri
Ze
ug
rha
do
tus
mo
ull
ad
ei
Ze
ug
rha
do
tus
sc
utu
la
RDM-78 2 3 1 1 2 210 4
RDM-77 BARREN
RDM-76 1 2 150
RDM-75 17
RDM-73 2 5 5 3 2 1 410 P 4
RDM-71 1 1 1 11
RDM-70 1 1 2 1 P 2 1 1 2 200 P
Unassigned RDM-69 BARREN
RDM-67 60 42 1 3 2 2 2 420 7
RDM-66 13 5 3 5 1 `1 P 5 5 6 1 1 260 4 4
RDM-65 8 2 1 2 2 2 4 P 1 270 P 1
RDM-63 33 2 2 2 3 1` P 1 8 P 2 1 1 240 9 1 1
RDM-62 16 2 1 P 10 2 6 4 1 P 330 P 3
RDM-61 7 P P 1 3 1 1 9 4 P 7 7 P 4 P 390 1 P 3 P
RDM-60 30 P 2 6 1 1 8 5 P 1 22 6 2 1 P 430 P 2 2 1
RDM-59 7 1 4 5 5 P P 330 P 2
RDM-57 42 1 1 1 1 7 3 1 9 1 12 1 1 P 610 P 8 3 2
RDM-55 12 2 4 3 2 P 620 10 P
RDM-54 32 2 P 16 5 P 5 6 1 1 1 340 3 2 3
RDM-53 BARREN
RDM-51 2 P 1 2 1 13 1 3 1 1 3 1 57 1 P 2
RDM-50 BARREN
RDM-48 7 1 6 1 12 7 1 P 55 1 4 P 6 7 1 1 2 P 1 380 1 1 P
RDM-47 1 1 1 1 26
RDM-46 3 1 P 1 5 2 1 8 180 4 1
RDM-45 5 1 5 1 1 3 96 2
RDM-44 5 3 1 P 2 4 1 3 P 1 72 2
RDM-42 10 2 P 1 5 6 1 4 5 1 1 2 1 42 2 P P P
RDM-41 2 1 12
RDM-40 5 3 P 2 3 1 7 P 3 P 1 P 1 1 21 P P
RDM-38 BARREN
RDM-37 4
RDM-36 BARREN
RDM-31 2 3 1
RDM-27 3 1 1 3 P 1 6 P
NC
7a
- ?
NC
8a
NC
5d
- N
C6
aU
na
ss
ign
ed
Aptian - Early
Albian
Ca
rqu
iejo
Late
Barremian -
?Earliest
Aptian
Mo
rro
Earliest Aptian
& older
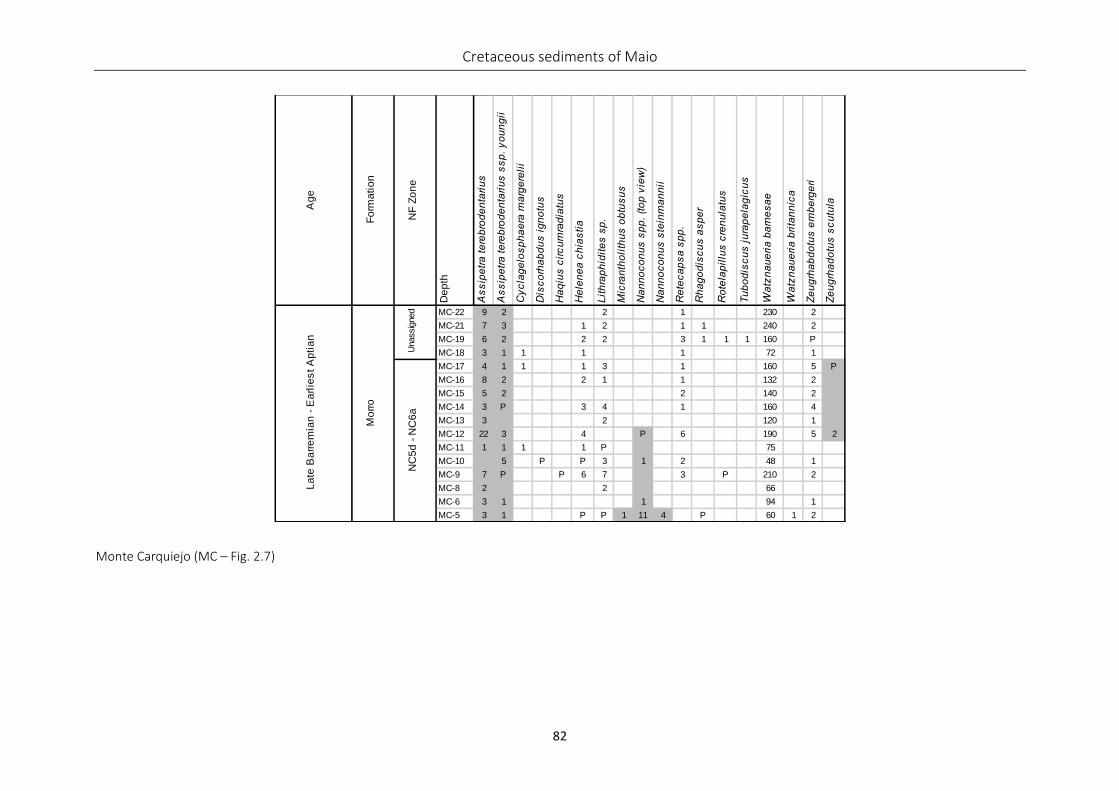
Cretaceous sediments of Maio
82
Monte Carquiejo (MC – Fig. 2.7)
Ag
e
Fo
rma
tio
n
NF
Zo
ne
De
pth
As
sip
etr
a t
ere
bro
de
nta
riu
s
As
sip
etr
a t
ere
bro
de
nta
riu
s s
sp
. y
ou
ng
ii
Cy
cla
ge
los
ph
ae
ra m
arg
ere
lii
Dis
co
rha
bd
us
ig
no
tus
Ha
qiu
s c
irc
um
rad
iatu
s
He
len
ea
ch
ias
tia
Lit
hra
ph
idit
es
sp
.
Mic
ran
tho
lith
us
ob
tus
us
Na
nn
oc
on
us
sp
p.
(to
p v
iew
)
Na
nn
oc
on
us
ste
inm
an
nii
Re
tec
ap
sa
sp
p.
Rh
ag
od
isc
us
as
pe
r
Ro
tela
pil
lus
cre
nu
latu
s
Tu
bo
dis
cu
s j
ura
pe
lag
icu
s
Wa
tzn
au
eri
a b
arn
es
ae
Wa
tzn
au
eri
a b
rita
nn
ica
Ze
ug
rha
bd
otu
s e
mb
erg
eri
Ze
ug
rha
do
tus
sc
utu
la
MC-22 9 2 2 1 230 2
MC-21 7 3 1 2 1 1 240 2
MC-19 6 2 2 2 3 1 1 1 160 P
MC-18 3 1 1 1 1 72 1
MC-17 4 1 1 1 3 1 160 5 P
MC-16 8 2 2 1 1 132 2
MC-15 5 2 2 140 2
MC-14 3 P 3 4 1 160 4
MC-13 3 2 120 1
MC-12 22 3 4 P 6 190 5 2
MC-11 1 1 1 1 P 75
MC-10 5 P P 3 1 2 48 1
MC-9 7 P P 6 7 3 P 210 2
MC-8 2 2 66
MC-6 3 1 1 94 1
MC-5 3 1 P P 1 11 4 P 60 1 2
La
te B
arr
em
ian
- E
arl
ies
t A
pti
an
Mo
rro
Unassig
ned
NC
5d
- N
C6
a
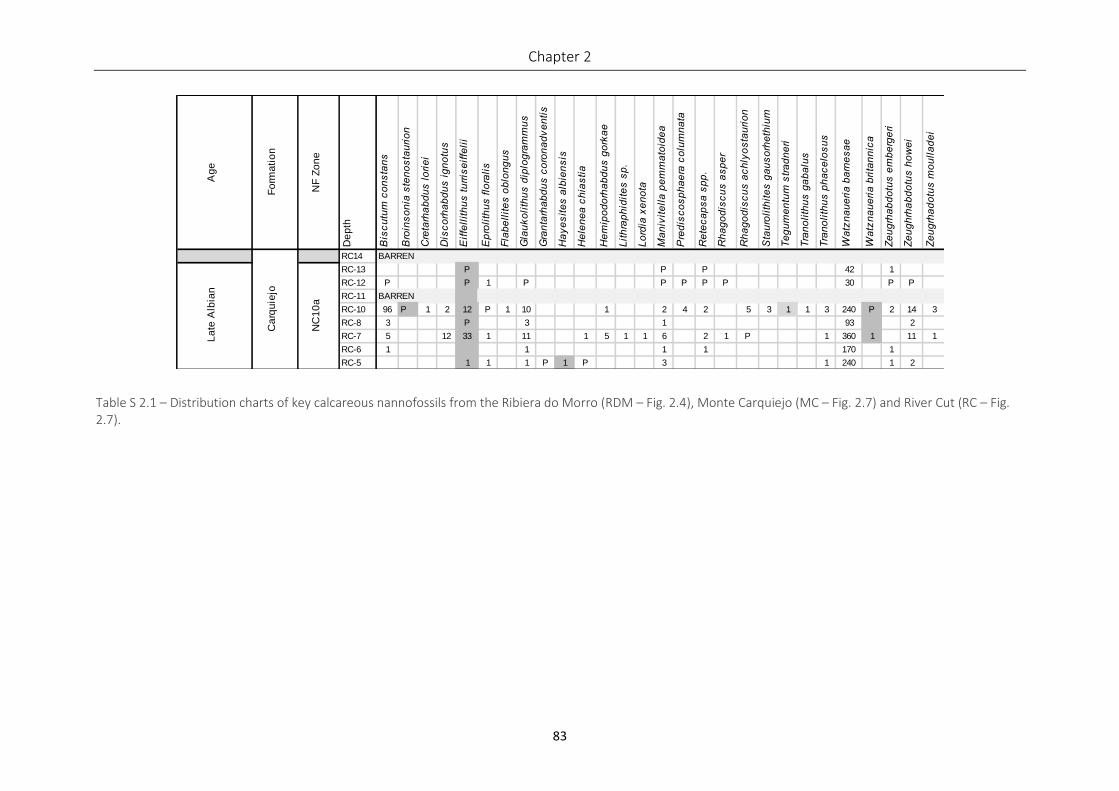
Chapter 2
83
Table S 2.1 – Distribution charts of key calcareous nannofossils from the Ribiera do Morro (RDM – Fig. 2.4), Monte Carquiejo (MC – Fig. 2.7) and River Cut (RC – Fig. 2.7).
Ag
e
Fo
rma
tio
n
NF
Zo
ne
De
pth
Bis
cu
tum
co
ns
tan
s
Bro
ins
on
ia s
ten
os
tau
rio
n
Cre
tarh
ab
du
s l
ori
ei
Dis
co
rha
bd
us
ig
no
tus
Eif
fell
ith
us
tu
rris
eif
feli
i
Ep
roli
thu
s f
lora
lis
Fla
be
llit
es
ob
lon
gu
s
Gla
uk
oli
thu
s d
iplo
gra
mm
us
Gra
nta
rha
bd
us
co
ron
ad
ve
nti
s
Ha
ye
sit
es
alb
ien
sis
He
len
ea
ch
ias
tia
He
mip
od
orh
ab
du
s g
ork
ae
Lit
hra
ph
idit
es
sp
.
Lo
rdia
xe
no
ta
Ma
niv
ite
lla
pe
mm
ato
ide
a
Pre
dis
co
sp
ha
era
co
lum
na
ta
Re
tec
ap
sa
sp
p.
Rh
ag
od
isc
us
as
pe
r
Rh
ag
od
isc
us
ac
hly
os
tau
rio
n
Sta
uro
lith
ite
s g
au
so
rhe
thiu
m
Te
gu
me
ntu
m s
tra
dn
eri
Tra
no
lith
us
ga
ba
lus
Tra
no
lith
us
ph
ac
elo
su
s
Wa
tzn
au
eri
a b
arn
es
ae
Wa
tzn
au
eri
a b
rita
nn
ica
Ze
ug
rha
bd
otu
s e
mb
erg
eri
Ze
ug
hrh
ab
do
tus
ho
we
i
Ze
ug
rha
do
tus
mo
ull
ad
ei
RC14 BARREN
RC-13 P P P 42 1
RC-12 P P 1 P P P P P 30 P P
RC-11 BARREN
RC-10 96 P 1 2 12 P 1 10 1 2 4 2 5 3 1 1 3 240 P 2 14 3
RC-8 3 P 3 1 93 2
RC-7 5 12 33 1 11 1 5 1 1 6 2 1 P 1 360 1 11 1
RC-6 1 1 1 1 170 1
RC-5 1 1 1 P 1 P 3 1 240 1 2
Ca
rqu
iejo
NC
10
a
La
te A
lbia
n
Cretaceous sediments of Maio
84
2.10 REFERENCES
Ali, M.Y., Watts, A.B. and Hill, I., 2003. A seismic reflection profile study of lithospheric flexure in the vicinity of the Cape Verde Islands. Journal of Geophysical Research: Solid Earth, 108(B5).
Armstrong, H. and Brasier, M., 2013. Microfossils. John Wiley & Sons.
Bert, D., Bersac, S., Ruiz, J., and Hughes, Z., 2018. Size reduction and ornamental oscillation within a Barremian lineage of giant heteromorphic ammonites (Early Cretaceous, northwestern Tethyan margin). Cretaceous Research 88, pp. 173-186.
Bown, P., 1998. Calcareous nannofossil biostratigraphy. Chapman and Hall; Kluwer Academic, pp. 1-315.
Carvalho, J., Bonadio, R., Silveira, G., Lebedev, S., Mata, J., Arroucau, P., Meier, T. and Celli, N.L., 2019. Evidence for high temperature in the upper mantle beneath Cape Verde archipelago from Rayleigh-wave phase-velocity measurements. Tectonophysics, 770, p.228225.
Cecca, F., Faraoni, P., Marini, A. and Pallini, G. 1995. Fieldtrip across the representative sections for the Upper Hauterivian – Barremian ammonite biostratigraphy in the Maiolica exposed at Monte Nerone, Monte Petrano and Monte Catria (Umbria-Marche Apennines). Memorie descrittive della Carta Geologica d’Italia 51, pp. 187–211.
Chamley, H., Debrabant, P. and Flicoteaux, R., 1988. Comparative evolution of the Senegal and eastern central Atlantic basins, from mineralogical and geochemical investigations. Sedimentology, 35(1), pp. 85-103.
Company, M., and Tavera, J.M., 2015. Lower Valanginian ammonite biostratigraphy in the Subbetic Domain (Betic Cordillera, southeastern Spain). Carnets de Géologie 15/8, pp. 71-88.
Crough, S.T., 1978. Thermal origin of mid-plate hot-spot swells. Geophysical Journal International, 55(2), pp. 451-469.
Davison, I., 2005. Central Atlantic margin basins of North West Africa: geology and hydrocarbon potential (Morocco to Guinea). Journal of African Earth Sciences, 43(1-3), pp.254-274.
Delanoy, G., 2003. Toxancyloceras gen. nov. (Ammonoidea, Ancyloceratina) un nouveau genre du Barrémien supérieur. Annales du Museum d'Histoire Naturelle de Nice 18, 1-19.
Delanoy, G., and Poupon, A., 1992. Sur le genre Lytocrioceras Spath, 1924 (Ammonoidea, Ancyloceratina). Geobios 25/3, pp. 367-382.
De Graciansky, P.C., Bourbon, M., Lemoine, M. and Sigal, J., 1981. The sedimentary record of mid-Cretaceous events in the western Tethys and central Atlantic Oceans and their continental margins. Eclogae Geol. Helv, pp. 353-367.
de Paepe, P., Klerkx, J., Hertogen, J. and Plinke, P., 1974. Oceanic tholeiites on the Cape Verde Islands: petrochemical and geochemical evidence. Earth and Planetary Science Letters, 22(4), pp. 347-354.
Ebbo, L, Poupon, A., Delanoy, G., and Gonnet, R., 1999. Nouvelles données sur le genre Lytocrioceras Spath, 1924 dans le Barrémien inférieur du Sud-Est de la France. Annales du Museum d'Histoire Naturelle de Nice 14, 1-25.
Farinacci, A. and Elmi, S. eds., 1981. Edizioni Tecnoscienza.
Fourcade, E., Azéma, J., de Wever, P. and Busnardo, R., 1990. Contribution à la datation de la croûte océanique de l'Atlantique central: Age valanginien inférieur des basaltes océaniques et âge néocomien des calcaires Maiolica de Maio (Iles du Cap Vert). Marine Geology, 95(1), pp. 31-44.
Chapter 2
85
Frau, C., Delanoy, G., Masse, J.-P., Lanteaume, C., Tendil, A.J.B., 2016. New Heteroceratidae (Ammonoidea) from the late Barremian deepening succession of Marseille (Bouches-du-Rhône, France). Acta Geologica Polonica 66(2), pp. 205–225.
Gerard, J. and Bromley, R., 2008. Ichnofabrics in clastic sediments: applications to sedimentological core studies (p. 100). Madrid: J. Gerard.
Gradstein, F.M., Ogg, J.G., Schmitz, M. and Ogg, G. eds., 2012. The geologic time scale 2012. elsevier.
Hancock, J.M., 1975. The petrology of the Chalk. Proceedings of the Geologists' Association, 86(4), pp. 499-535.
Hayes, D.E. and Rabinowitz, P.D., 1975. Mesozoic magnetic lineations and the magnetic quiet zone off northwest Africa. Earth and Planetary Science Letters, 28(2), pp. 105-115.
Hennig, E. 1914. Aptychen von den Cap Verdeschen Inseln. Zeitschrift der Deutschen geologischen Gesellschaft, 65, pp. 151.
Holm, P.M., Grandvuinet, T., Friis, J., Wilson, J.R., Barker, A.K. and Plesner, S., 2008. An 40Ar‐39Ar study of the Cape Verde hot spot: Temporal evolution in a semistationary plate environment. Journal of Geophysical Research: Solid Earth.
Jeremiah, J., 1996. A proposed Albian to Lower Cenomanian nannofossil biozonation for England and the North Sea Basin. Journal of Micropalaeontology, 15(2), pp. 97-129.
Klein, J., Busnardo, R., Company, M., Delanoy, G., Reboulet, S., Ropolo, P., and Vermeulen, J., 2007. Lower Cretaceous Ammonites III, Bochianitoidea, Protancyloceratoidea, Ancyloceratoidea, Ptychoceratoidea. In: Riegraf, W., Ed., Fossilium catalogus I: Animalia 144, pp. 1-381. Backhuys Publishers, Leiden.
Lancelot, Y., Seibold, E. et al., 1976. Initial Reports of the DSDP, Vol. 41. U.S. Government Printing Office, Washington, D.C., 1259 pp.
Leroy, L., Vermeulen, J., Lazarin, P., Lepinay, P., and Mascarelli, E., 2016. Nouvelles données sur la classification et l'évolution des Anahamulinidae Breistroffer, 1952 (Turrilitina, Ptychoceratoidea). Annales du Muséum d'Histoire Naturelle de Nice 31, pp. 1-25.
Lodhia, B.H., Roberts, G.G., Fraser, A.J., Fishwick, S., Goes, S. and Jarvis, J., 2018. Continental margin subsidence from shallow mantle convection: Example from West Africa. Earth and Planetary Science Letters, 481, pp.350-361.
Luber, T.L., Bulot, L.G., Redfern, J., Frau, C., Arantegui, A. and Masrour, M., 2017. A revised ammonoid biostratigraphy for the Aptian of NW Africa: Essaouira-Agadir Basin, Morocco. Cretaceous Research, 79, pp. 12-34.
Luber, T.L., Bulot, L.G., Redfern, J., Nahim, M., Jeremiah, J., Simmons, M., Bodin, S., Frau, C., Bidgood, M. and Masrour, M., 2019. A revised chronostratigraphic framework for the Aptian of the Essaouira-Agadir Basin, a candidate type section for the NW African Atlantic Margin. Cretaceous Research, 93, pp.292-317.
Měchová, L., Vašíček, Z., and Houša, V., 2010. Early Cretaceous ribbed aptychi – a proposal for a new systematic classification. Bulletin of Geosciences 85/2, pp. 219–274. Czech Geological Survey, Prague.
Mourlot, Y., Calvès, G., Clift, P.D., Baby, G., Chaboureau, A.C. and Raisson, F., 2018. Seismic stratigraphy of Cretaceous eastern Central Atlantic Ocean: Basin evolution and palaeoceanographic implications. Earth and Planetary Science Letters, 499, pp. 107-121.
Müller, C., Schaff, A. and Sigal, J., 1983. Biochronostratigraphy of Cretaceous Formations in DSDP boreholes in the North Atlantic 1. Revue de l’Institut Français du Petrole, 38(6), pp. 683-708.
Cretaceous sediments of Maio
86
Myczynski, R., and Triff, J., 1986. Los ammonites del Cretácio Inferior de las provincias de Pinar del Río y Matanzas. Bulletin of the Polish Academy of Sciences, Earth Sciences 34, pp. 113-137.
Olyphant, J.R., Johnson, R.A. and Hughes, A.N., 2017. Evolution of the Southern Guinea Plateau: Implications on Guinea-Demerara Plateau formation using insights from seismic, subsidence, and gravity data. Tectonophysics 717, pp. 358-371.
Patarroyo, P., 2004. Die Entwicklung der Ammoniten der Familie Pulchelliidae aus dem Barrême von Zentral-Kolumbien (Südamerika). Revue de Paléobiologie 23(1), pp. 1-65.
Petrova, S., Lakova, I., Ivanova, D., 2011. Berriasian–Valanginian boundary in Bulgaria. Review of the Bulgarian Geological Society 72(1–3), pp. 91–97.
Pim, J., Peirce, C., Watts, A.B., Grevemeyer, I. and Krabbenhöft, A., 2008. Crustal structure and origin of the Cape Verde Rise. Earth and Planetary Science Letters 272(1-2), pp. 422-428.
Pszczółkowski, A., 1978. Geosynclinal sequences of the Cordillera de Guaniguanico in western Cuba; their lithostratigraphy, facies development, and paleogeography. Acta Geologica Polonica 28(1), pp. 1-96.
Pszczółkowski, A. and Myczyński, R., 1999. Nannoconid assemblages in Upper Hauterivian-Lower Aptian limestones of Cuba: their correlation with ammonites and some planktonic foraminifers. Studia Geologica Polonica, 114, pp. 35-75.
Renz, O., 1983. Early Cretaceous Cephalopoda from the Blake-Bahama basin (DSDP Leg 76, Site 534A) and their correlation in the Atlantic and southwestern Tethys. Sheridan, RE, and others, Initial reports of the Deep Sea Drilling Project, 76, pp.639-645.
Rigassi, D., 1972. Geology and oil prospect of Cape Verde Islands. In Report for the Oil Industry (p. 75). Petroconsultants Geneva.
Robertson, A.H.F., 1984. Mesozoic deep-water and Tertiary volcaniclastic deposition of Maio, Cape Verde Islands: Implications for Atlantic paleoenvironments and ocean island volcanism. Geological Society of America Bulletin, 95(4), pp. 433-453.
Robertson, A.H. and Bernoulli, D., 1982. Stratigraphy, facies, and significance of late Mesozoic and early Tertiary sedimentary rocks of Fuerteventura (Canary Islands) and Maio (Cape Verde Islands). In Geology of the Northwest African continental margin (pp. 498-525). Springer, Berlin, Heidelberg.
Serralheiro, A., 1968. Formações sedimentares do arquipélago de Cabo Verde.
Serralheiro, A., 1970. Geologia da Ilha de Maio (Cabo Verde). Junta de Investigações do Ultramar.
Seton, M., J. Whittaker, P. Wessel, R. D. Müller, C. DeMets, S. Merkouriev, S. Cande, C. Gaina, G. Eagles, R. Granot, J. Stock, N. Wright, and S. Williams (2014), Community infrastructure and repository for marine magnetic identifications. Geochemistry, Geophysics, Geosystems, pp. 1629-1641.
Stahlecker, R., 1935. Neocom auf der Kapverden-Insel Maio. Neues Jahrbuch für Geologie und Palaeontolgie, 73, pp. 265-301.
Stillman, C.J., Furnes, H., LeBas, M.J., Robertson, A.H.F. and Zielonka, J., 1982. The geological history of Maio, Cape Verde islands. Journal of the Geological Society, 139(3), pp. 347-361.
Vail, P.R., Hardenbol, J. and Todd, R.G., 1984. Jurassic unconformities, chronostratigraphy, and sea-level changes from seismic stratigraphy and biostratigraphy.
Vašíček, Z. and Klajmon, P., 1998. Contribution to the knowledge of some small Early Barremian ammonites from the Silesian Unit (Outer Western Carpathians, Czech Republic). Vĕstník Českého Geologického ústavu, 73, pp.331-342.
Chapter 2
87
Vašíček, Z., and Wiedmann, J., 1994. The Leptoceratoidinae: small heteromorph ammonites from the Barremian. Palaeontology 37/1, pp. 203-239.
Vašíček, Z., Janssen, N.M.M., and Klein, J., 2016. The chronostratigraphical record of Didayilamellaptychus (Lamellaptychi, Ammonitina). Neues Jahrbuch für Geologie und Paläontologie-Abhandlungen 280/1, pp. 37-48.
Vermeulen, J., 2010a. Nouvelle tripartition de la famille des Anahamulinidae Breistroffer, 1952 (Turrilitina, Ptychoceratoidea) et description de quelques taxa du Barrémien inférieur du sud-est de la France. Annales du Muséum d'Histoire Naturelle de Nice 25, pp. 61-91.
Vermeulen, J., 2010b. Sur deux nouvelles espèces de la famille des Anahamulinidae Breistroffer, 1952. Riviera scientifique 94, pp. 107-116.
Vermeulen, J., Lazarin, P., Lepinay, P., Leroy, L., Mascarelli, E., 2014. Ammonites du Barrémien du sud-est de la France. Strata, série 2, Mémoires 50, pp. 1-95.
van den Bogaard, P., 2013 The origin of the Canary Island Seamount Province - New ages of old seamounts. Sci. Rep. 3, 2107
Wieczorek, J., 1988. Maiolica - a unique facies of the Western Tethys. Annales Societatis Geologorum Poloniae, 58 (3-4), pp. 255-276.
88
3 An integrated stratigraphic re-evaluation of
key Central Atlantic DSDP sites
Max Casson1, Jason Jeremiah2, Gérôme Calvès3, Frédéric de Ville de Goyet4,
Luc Bulot5,1, Jonathan Redfern1
1 North Africa Research Group (NARG), Department of Earth and Environmental Sciences, The University of
Manchester, Williamson Building, Oxford Road, Manchester, M13 9PL, UK
2 Golden Spike Geosolutions Ltd., 20 Ten Acres Crescent, Stevenage, Hertfordshire, SG2 9US, UK
3 Université Toulouse 3, Paul Sabatier, Géosciences Environnement Toulouse, 14 avenue Edouard Belin,
31400, Toulouse, France
4 PetroStrat Ltd. Tan-y-Graig, Parc Caer Seion, Conwy, LL32 8FA, Wales, UK
5 Aix-Marseille Université, CNRS, IRD, Collège de France, INRA, Cerege, Site Saint-Charles, Case 67, 3, Place
Victor Hugo, 13331, Marseille Cedex 3, France
Chapter 3
89
3.1 ABSTRACT
Re-sampling DSDP core from key Central Atlantic sites drilled over 30 years ago has defined an updated
stratigraphic framework. Biostratigraphic dating using calcareous nannofossils and palynology, has been
performed on 234 samples. This reveals a higher biostratigraphic resolution for regional correlation and
identification of major hiatus previously unrecognised within the oceanic domain stratigraphy. This work
builds on the pioneering work of these cruises, to utilise the valuable data for new age dating, supplemented
with new organic geochemistry analysis and a sedimentological characterisation to improve the
documentation of the Mesozoic strata. Results are extrapolated along the continental margins of northwest
Africa using regional two-dimensional seismic sections, providing a correlation between the oceanic domain
stratigraphy and shelfal depositional systems penetrated by hydrocarbon exploration wells.
At DSDP Site 367, a middle Berriasian unconformity is recognised for the first time from Core 33, where
middle Berriasian white pelagic limestones (Blake-Bahama Formation) sit unconformably on Early Tithonian
red argillaceous limestones (Cat Gap Formation), indicating a ca. 5 Myr hiatus at the Jurassic-Cretaceous
boundary. Marl interbeds within the pelagic limestones increase in occurrence through the Barremian,
reflecting increased terrigenous input, with associated total organic content (TOC) averaging 5%. A major
lithological break is reported at DSDP Site 367, interpreted as a base Albian unconformity, between the
Blake-Bahama and overlying Hatteras Formation. Sediments above are intra Late Albian variegated
claystones with abundant terrestrial detritus and distal turbidites. Seismic data that intersects the well
location show onlapping reflections of Early-Middle Albian strata landward of DSDP Site 367, indicating
paleo-topography prior to Albian deposition. These sediments are contemporaneous with a major
progradational phase on the shelf and sedimentary wedge at the base of the carbonate escarpment. Early
Albian sediments sit above an interpreted base Albian unconformity at DSDP Site 534A on the conjugate US
Atlantic margin, suggesting the super-regional nature of this event. The refined dating provides calibration
of a basin-wide unconformity recognised at this level, previously known from seismo-stratigraphic studies
as Reflector .
The Late Albian to Late Cenomanian strata (Hatteras Formation) is a 164 m thick organic-rich interval, up to
37% TOC, with internal facies and organic geochemical heterogeneity. This transgressive sequence is
associated with a flooding of the shelf. A temporal variation in the cessation of anoxia (earliest Turonian) is
observed at DSDP Site 368. This revised stratigraphic framework provides a solid foundation for future
Central Atlantic studies intending to use these sites as calibration of the oceanic domain stratigraphy.
Key words: stratigraphic framework; DSDP Site 367; Central Atlantic; MSGBC basin
Central Atlantic DSDP Sites
90
3.2 INTRODUCTION
Over fifty years ago, scientific drilling on the very first leg of the Deep Sea Drilling Project (DSDP) recovered
sediments from the Central Atlantic, establishing the foundations for a stratigraphic framework (Ewing et
al., 1969). After hundreds of additional boreholes, subsequent research has revealed the Meso-Cenozoic
evolution of one of the oldest oceans on Earth, and consequently the adjacent continents, investigating a
variety themes from plate tectonics to climate change. The principal aim of these early expeditions was to
recover samples of the oceanic crust and overlying sediments deposited on the ocean floor. Data generated
by this program forms the most complete and continuous stratigraphic record in the oceanic domain.
However, since the initial reports from the scientific drilling, few studies have revisited these cores to re-
sample and revise the stratigraphy, more commonly the original reported biostratigraphic data is merely re-
interpreted (Müller et al., 1983; 1984).
Unconformities represent a hiatus in the geological record (Blackwelder, 1909, Sloss et al., 1949). Identifying
these surfaces and characterising the sequences that they bound in the oceanic domain is critical to building
a framework for understanding the regional evolution of the surrounding continental margins. Within the
oceanic domain, i.e. the oceanic crust seaward of the continent-ocean boundary (COB), marine
unconformities/correlative conformities (sensu Posamentier & Allen, 1999) are generated by low
accommodation rates or non-deposition related to regional tectonics, global eustasy, and/or erosion by
turbidity or contour currents (Catuneanu, 2006). This surface marks the onset of relative sea-level fall and
the development of an overlying lowstand fan/wedge in siliciclastic systems. Maximum flooding surfaces
(MFS) form when marine sediments reach their most land-ward position, typically after flooding the
continental shelf and are associated with condensed sequences in the oceanic domain. These sequence
boundaries vary in spatial distribution related to their scale; first-order surfaces are typically super-regional
in scale recording plate to margin-scale events (e.g. Vail et al., 1980).
For this study, two key DSDP sites were selected that recovered the most complete Mesozoic stratigraphy,
sites 367, 368 offshore northwest Africa (Lancelot et al., 1978a; 1978b). These two African sites are the
principle calibration points for the oceanic domain stratigraphy within the emerging hydrocarbon province
of the Mauritania-Senegal-Guinea Bissau-Conakry (MSGBC) basin. A comparison is made to the re-evaluated
Early Cretaceous interval at DSDP Site 534A, within the Blake-Bahamas basin along the eastern US Atlantic
conjugate continental margin. The Mesozoic northwest African continental margin is characterised by an
escarpment-type carbonate platform, where the shelf (proximal to distal domains) and basin (oceanic)
depositional systems are decoupled across the escarpment unconformity surface (Casson et al., 2020b).
Therefore, there is difficulty extrapolating, using seismic reflection data, a stratigraphic framework from
exploration well data on the shelf and onshore basin, to the offshore beyond the paleo-shelf edge, where
the prospective slope to basin floor hydrocarbon plays exist. Understanding the margin evolution and
Chapter 3
91
petroleum systems relies on the stratigraphic framework and calibrations to the boreholes at DSDP sites
367, 368. Additional Mesozoic stratigraphical data can be leveraged from the fortuitous uplift of the oceanic
domain sediments on the volcanic island of Maio, Cape Verde, and as part of this integrated study these
outcrops were also recently re-investigated (Casson et al., 2020a).
In order to revise the stratigraphic framework for the Central Atlantic oceanic domain, we undertook new
biostratigraphic, sedimentological and organic geochemical analysis on 234 new samples collected from the
Bremen core repository. This would not have been possible without the meticulous curation and
preservation of the vintage data by the DSDP. A new age model, based on multiple biostratigraphic proxies
is proposed to calibrate the oceanic domain stratigraphy, providing re-dating of the Mesozoic sequences
and bounding regional surfaces, as well as insights into the timing and nature of organic-rich sedimentation.
This study examines the full dip-length of the depositional system by integrating a re-interpretation of
Senegalese exploration wells and regional seismic reflection profiles to construct a chronostratigraphic
framework.
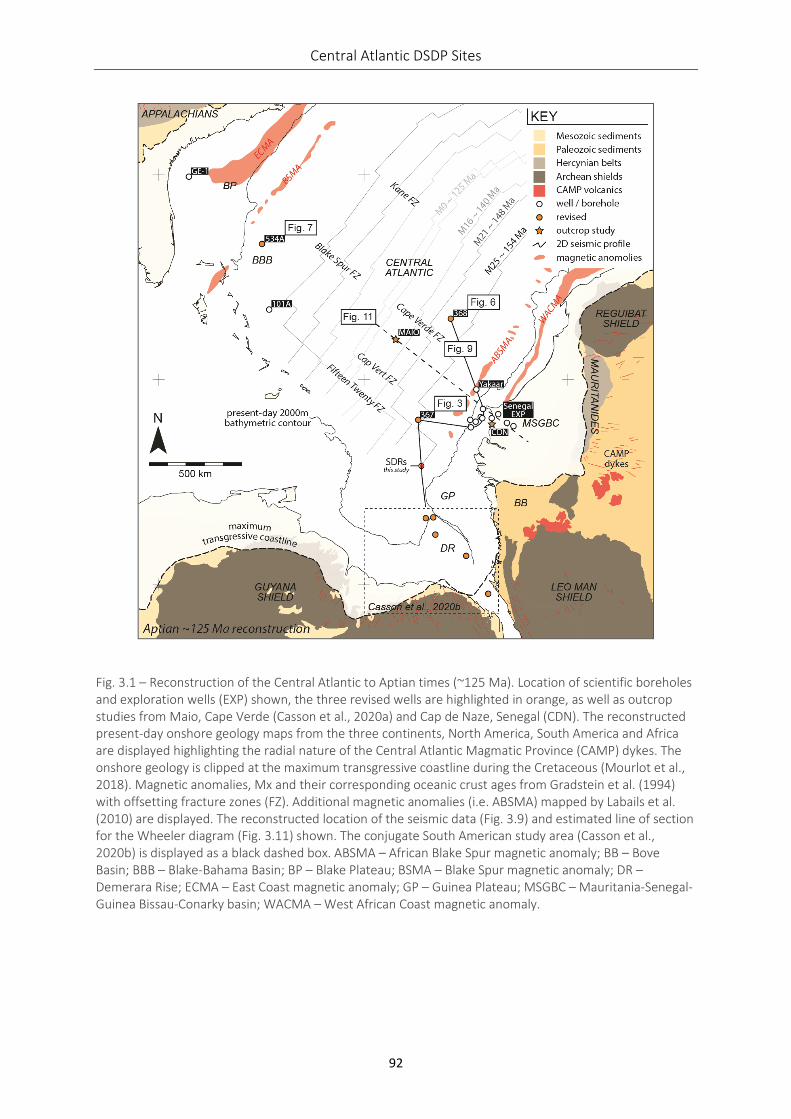
Central Atlantic DSDP Sites
92
Fig. 3.1 – Reconstruction of the Central Atlantic to Aptian times (~125 Ma). Location of scientific boreholes and exploration wells (EXP) shown, the three revised wells are highlighted in orange, as well as outcrop studies from Maio, Cape Verde (Casson et al., 2020a) and Cap de Naze, Senegal (CDN). The reconstructed present-day onshore geology maps from the three continents, North America, South America and Africa are displayed highlighting the radial nature of the Central Atlantic Magmatic Province (CAMP) dykes. The onshore geology is clipped at the maximum transgressive coastline during the Cretaceous (Mourlot et al., 2018). Magnetic anomalies, Mx and their corresponding oceanic crust ages from Gradstein et al. (1994) with offsetting fracture zones (FZ). Additional magnetic anomalies (i.e. ABSMA) mapped by Labails et al. (2010) are displayed. The reconstructed location of the seismic data (Fig. 3.9) and estimated line of section for the Wheeler diagram (Fig. 3.11) shown. The conjugate South American study area (Casson et al., 2020b) is displayed as a black dashed box. ABSMA – African Blake Spur magnetic anomaly; BB – Bove Basin; BBB – Blake-Bahama Basin; BP – Blake Plateau; BSMA – Blake Spur magnetic anomaly; DR – Demerara Rise; ECMA – East Coast magnetic anomaly; GP – Guinea Plateau; MSGBC – Mauritania-Senegal-Guinea Bissau-Conarky basin; WACMA – West African Coast magnetic anomaly.
Chapter 3
93
3.3 REGIONAL SETTING
The Central Atlantic formed following the breakup of Gondwana in the early Mesozoic. Late Triassic rifting
throughout the Central Atlantic occurred contemporaneously, recorded in the onshore rift basins of
Morocco and Nova Scotia (Fig. 3.1; Withjack et al., 1985; Olsen, 1980; Olsen, 1997). During the early Jurassic
(around 201 Ma) the Central Atlantic and surrounding continental margins were affected by extensive
volcanism; the Central Atlantic Magmatic Province event (CAMP; Wilson, 1997; Hames et al., 2003). Onset
of seafloor spreading, and hence formation of oceanic crust is assumed to be diachronous from north to
south, commencing 185 Ma in the north (dependant on various models; Labails et al., 2010 and references
therein) with spreading commencing in the southern segment (study area) around 175 Ma. Kinematic
reconstructions of the Central Atlantic use the positioning and identification of two magnetic anomalies, the
Blake Spur Magnetic Anomaly (BSMA) and West African Coast Magnetic Anomaly (WACMA; Klitgord &
Schouten, 1986; Labails et al., 2010) and juxtaposed syn-rift salt basins reconstructed along fracture zones
(Davison, 2005). Oceanic crust basalts with resemblance to mid-ocean ridge lithologies are penetrated at
DSDP sites 100, 105 (Holister et al., 1972), 367 (Lancelot et al., 1978a) and are exposed on the volcanic island
of Maio, Cape Verde (Serralheiro, 1968; Casson et al., 2020a). Subsequent thermal subsidence of the Central
Atlantic conjugate margins persists to present day (Latil-Brun & Lucazeau, 1988).
Several geodynamic and tectono-stratigraphic events affected the sedimentary succession of the Central
Atlantic in the Cretaceous. The opening of the Equatorial Atlantic gateway caused by drifting of South
America from Africa in the latest Albian (105 Ma) altered paleo-circulation patterns in the Central Atlantic
influencing deep water depositional systems (Forster, 1978; Mourlot et al., 2018b). Cenomanian-aged
transgression and coeval establishment of coastal upwelling of deep oceanic water masses resulted in the
deposition of a thick organic-rich interval throughout global Oceanic Anoxic Event 2 (OAE-2) and the
Cenomanian-Turonian boundary event (Arthur et al., 1984). This transgression created the Florida Straits
and Bahama channels (Sheridan et al., 1983).
Far-field tectonic stresses, i.e. the Santonian compressional event (84-80 Ma) associated with Africa-Europe
convergence and a change in the pole of rotation in the opening Central Atlantic, caused destabilisation,
local inversion and tilting, resulting in canyonisation of the distal African continental margin during the Late
Cretaceous (Casson et al., 2020b). Volcanism and uplift of the Cape Verde archipelago, and an associated
basement bulge is postulated to co-occur in the Late Cretaceous through to emergence in the Miocene
(Patriat & Labails, 2006).
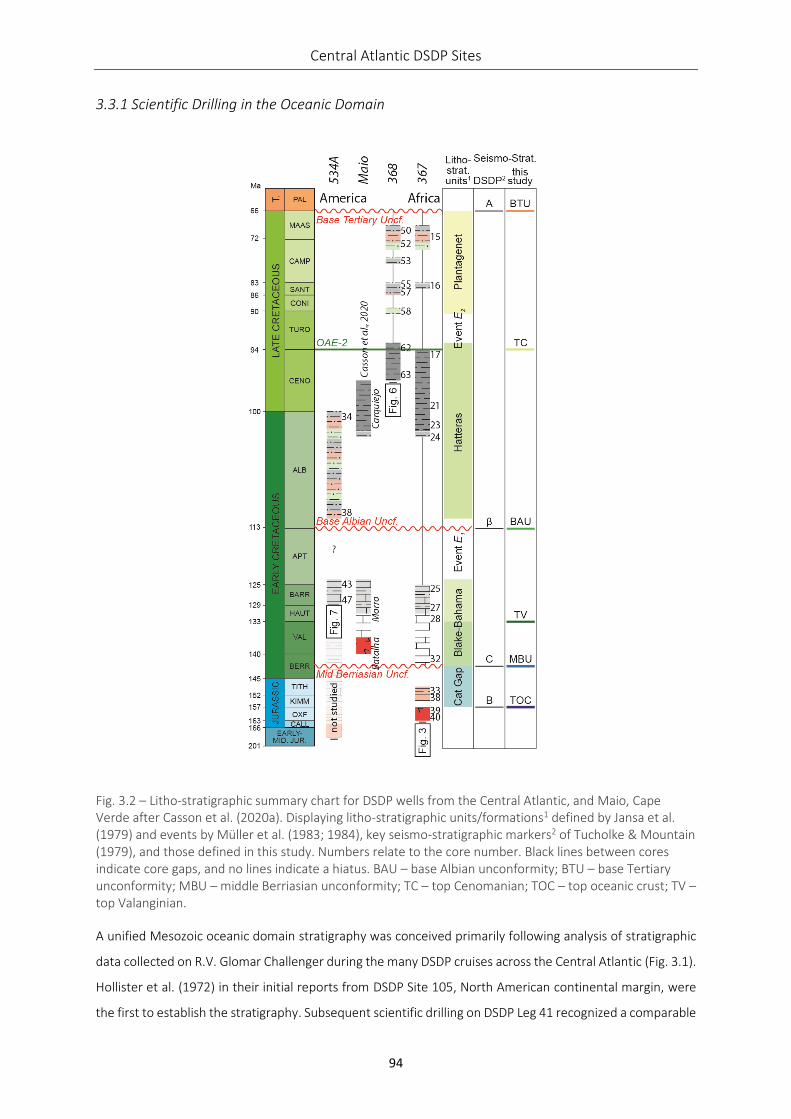
Central Atlantic DSDP Sites
94
3.3.1 Scientific Drilling in the Oceanic Domain
Fig. 3.2 – Litho-stratigraphic summary chart for DSDP wells from the Central Atlantic, and Maio, Cape Verde after Casson et al. (2020a). Displaying litho-stratigraphic units/formations1 defined by Jansa et al. (1979) and events by Müller et al. (1983; 1984), key seismo-stratigraphic markers2 of Tucholke & Mountain (1979), and those defined in this study. Numbers relate to the core number. Black lines between cores indicate core gaps, and no lines indicate a hiatus. BAU – base Albian unconformity; BTU – base Tertiary unconformity; MBU – middle Berriasian unconformity; TC – top Cenomanian; TOC – top oceanic crust; TV – top Valanginian.
A unified Mesozoic oceanic domain stratigraphy was conceived primarily following analysis of stratigraphic
data collected on R.V. Glomar Challenger during the many DSDP cruises across the Central Atlantic (Fig. 3.1).
Hollister et al. (1972) in their initial reports from DSDP Site 105, North American continental margin, were
the first to establish the stratigraphy. Subsequent scientific drilling on DSDP Leg 41 recognized a comparable
Chapter 3
95
stratigraphy offshore northwest Africa (Lancelot et al., 1978a; 1978b; Jansa et al., 1978). Following
documentation in the DSDP Initial Reports, the Mesozoic lithostratigraphic units were formally defined by
Jansa et al. (1979), later refined by Müller et al., (1983; 1984), as the Cat Gap Fm. (Kimmeridgian – Tithonian)
– red argillaceous limestone and marl (‘Rosso Ammonitico’ sensu Farinacci & Elmi, 1981); Blake-Bahama Fm.
(Berriasian – early Aptian) – white grey limestone, chert, chalk and marl; Hatteras (late Aptian – Cenomanian)
– carbonaceous claystone; and Plantagenet Fm. (Turonian – Senonian) – variegated clays (with ‘Cretaceous
oceanic red beds, CORBs’ sensu Hu et al., 2005). A correlation chart is provided in Fig. 3.2 summarising the
litho-stratigraphic units, linking with various seismo-stratigraphic schemes. Recent integrated stratigraphic
analysis by Casson et al. (2020a) of equivalent sediments exposed on Maio, Cape Verde provides calibration
of these sequences at outcrop. Two major unconformities sub-divide the Cretaceous formations, Event E1
(late Aptian) and Event E2 (Cenomanian – Turonian; Müller et al., 1983; 1984), interpreted to record
significant Central Atlantic palaeoceanographic events (Jansa et al., 1979). De Graciansky et al. (1987)
provides the most recent stratigraphic synthesis based on a compilation of previous biostratigraphy (Müller
et al., 1983; 1984) and organic geochemistry (Herbin & Deroo, 1982).
3.3.2 Proximal Continental Margin Evolution
Whilst the focus of this study is on the sediments of the oceanic domain, the depositional systems operating
in more proximal settings, on continental margins, are important to consider, as this is the source of much
of the sediment delivered into the deeper basins. These areas surrounding the Central Atlantic have been
subject to hydrocarbon exploration for decades, creating valuable well and seismic reflection datasets, often
yielding far more data in comparison to the relatively few penetrations in the oceanic domain. In the
adjacent onshore basins, the post-rift sediments can be studied at outcrop (i.e. Morocco – Luber et al.,
2019), although within the study area on both continental margins, thick Cenozoic sediments and lack of
Alpine-related exhumation means there are limited Mesozoic outcrops south of Morocco or on the North
American margin (with local exceptions such as Cap de Naze, Senegal; Sarr, 1995).
Recent work (Mourlot et al., 2019; Casson et al., 2020b) characterising the shelfal depositional systems of
the African continental margin can be summarised as follows: a carbonate escarpment margin fringes the
circumference of the Central Atlantic from Jurassic to Aptian times, with the first major delivery of siliciclastic
sediment to the shelf edge by deltaic systems during the Albian. In the Cenomanian to Turonian-aged,
transgression of the continental margin occurred, often extending into the onshore basins, and the Late
Cretaceous was a period of instability, with collapse of the distal continental margin associated
canyonisation.
The continental margin has a wide present-day shelf and the onshore sedimentary basins are characterised
by low topographic relief, with Mesozoic and younger sediments onlapping the post-rift unconformity and
Central Atlantic DSDP Sites
96
bordering cratons. The location of the present-day shelf edge is spatially inherited and controlled by the
underlying Jurassic carbonate platforms; a feature that remains outcropping at the seafloor along the Blake
Escarpment on the conjugate margin (Jansa, 1981; Land et al., 1999), indicating the control the palaeo-shelf
edge trend had on succeeding depositional systems.
3.4 DATASET & METHODS
3.4.1 Data
Lithological Samples
Re-sampling the DSDP cores took place through 2017 to 2018 at the IODP Bremen Core Repository, Germany
(request ID: 054376IODP, 065859IODP and 077865IODP). The two key African DSDP sites 367 and 368 were
reanalysed. The late Early Cretaceous interval of DSDP Site 534A in the Blake-Bahama basin was used as a
comparison as it penetrated with high core recovery (56%; Sheridan et al., 1983) a similar Mesozoic
sequence to DSDP Site 367. These remaining samples are stored for reference in the North Africa Research
Group (NARG) collection at the University of Manchester. A sample summary is provided in the
supplementary data documenting the new analysis performed on each sample (Table S 3.1). Additional
organic geochemistry data was compiled from existing studies (Lancelot et al., 1978a; 1978b; Deroo et al.,
1978; Wagner, 2013; Mourlot, 2018a).
Subsurface Seismic and Well Data
The seismic reflection data offshore northwest Africa (WGS 1984 UTM Zone 28N) consists of four 2D seismic
reflection profiles (total of 1728 line km) from the Spectrum Geo (now TGS Geophysical) VER01 MWT
regional 2D survey reprocessed to broadband in 2016-2017. The survey ties key DSDP sites (367, 368) to the
continental margin, intersecting hydrocarbon exploration wells on the shelf (CVM-1, Jammah-1), and
providing a crucial well tie for the oceanic domain. The seismic data records to a depth of 12.5 seconds two-
way-travel time and was provided as Pre-Stack Time Migrated (PSTM) SEGY data. Hydrocarbon exploration
well data (wireline logs, end-of-well reports) from Senegal, courtesy of Petrosen, were available to expand
our investigation more proximally.
3.4.2 Methods
Biostratigraphy
Dependent on lithology various biostratigraphic analyses were performed to provide age constraints on the
stratigraphy. Calcareous nannofossils (JJ): 154 samples were analysed with standard techniques described
Chapter 3
97
by Bown (1998), and the picking brush method of Jeremiah (1996). Samples were analysed semi-
quantitatively, with the first 30 fields of view counted and the remaining slide scanned for rare specimens.
Palynology (FVG): 14 samples for palynological analyses were subject to the standard palynological
preparation technique which involves removal of all mineral material by hydrofluoric acid digestion and
sieving to produce a residue of the 10 micron and above size fraction for each sample. An initial count of
100 in situ palynomorph specimens was performed and abundance quantitatively assessed using percentage
of total palynoflora. Twenty-eight samples were cut for thin sections and dyed blue to analyse for the
occurrence of calpionellids within the limestones of the Blake-Bahamas and Cat Gap formation, DSDP Site
367. Unfortunately, the deep-water pelagic facies did not yield any calpionellids.
Organic Geochemistry
Forty-three samples were selected for organic geochemical analysis using a Shimadzu TOC-V CPN and Solid
Sample Module (SSM), calibrated to sodium carbonate and glucose to measure inorganic and total carbon
respectively. Additional geochemical data for DSDP Site 534A was incorporated from Herbin et al. (1983).
Pyrolysis of 17 samples yielding greater than 0.5% TOC was completed using a Rock-Eval 6 instrument at
GHGeochem by Gareth Harriman.
Fig. 3.3 (next page) – A re-evaluation of DSDP Leg 41 Site 367 stratigraphy displaying nannofossil events (Table S 3.2) and palynology results (Fig. S 3.1), depth of an ichthyodectiform reported in Casson et al. (2018), total organic carbon (TOC; Table S 3.1) measurements and key stratigraphic surfaces. Palynology abbreviations: ABN – abundant, AOM – amorphous organic matter, FDO – first downhole occurrence, FDCO – first downhole common occurrence, FDAO – first downhole abundant occurrence, FDSAO – first downhole superabundant occurrence, INCR – increase in abundance, PRES - presence, CMN - common, SABN – superabundant, TNS – top not seen.
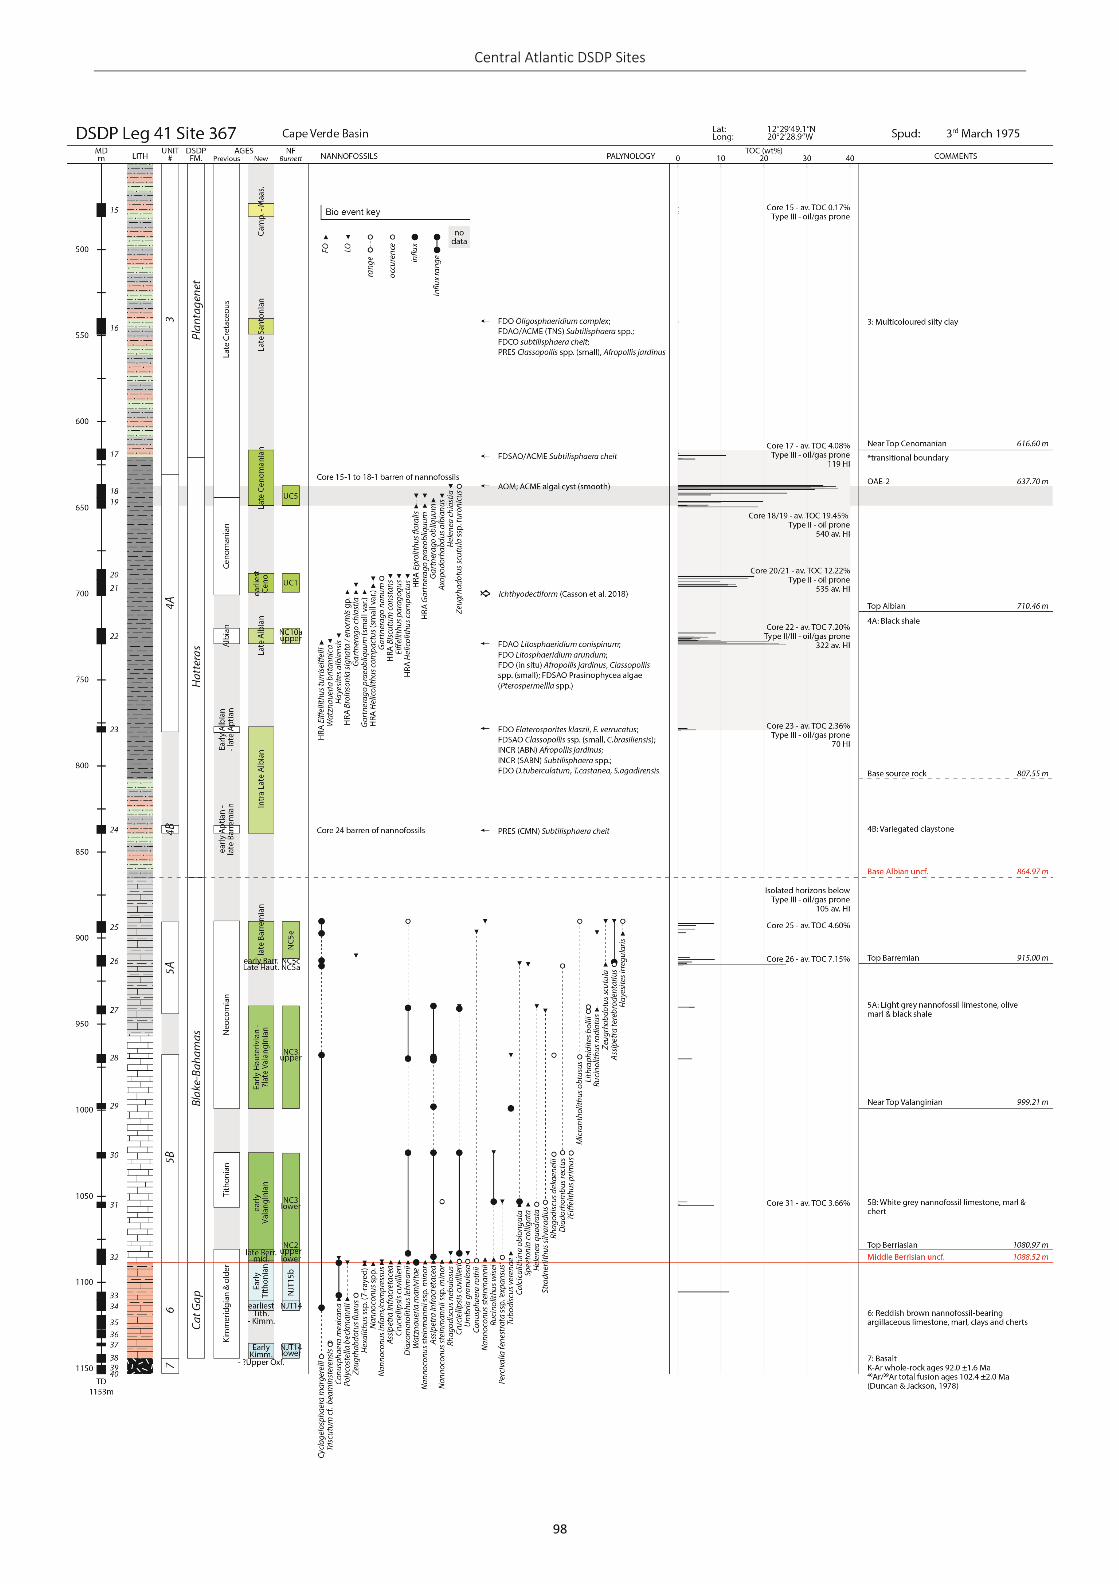
Central Atlantic DSDP Sites
98
Chapter 3
99
3.5 RESULTS
3.5.1 Stratigraphic Revision
DSDP Site 367
The scientific objectives of Site 367 were to “collect core to calibrate the lithological properties of the
acoustic stratigraphy and correlate this with sequences interpreted on the conjugate American margin”
(Lancelot et al., 1978a). In drilling Site 367, a full Mesozoic sequence was penetrated to oceanic basement,
providing the most complete record of the oceanic domain stratigraphy offshore northwest Africa (Fig. 3.3).
Site 367 was drilled above a basement high to a TD of 1153m, the lowermost three cores recovered basalts
dated using potassium-argon (K-Ar) whole rock and argon-argon (40Ar/39Ar) methods, yielding ages of 92.0
± 1.6 and 102.4 ± 2.0 Ma respectively (Duncan & Jackson, 1978). These relatively young ages (middle
Cretaceous) contradict with the age of the overlying sediments of the Cat Gap Formation,
Kimmeridgian/Oxfordian (~160 Ma; Lancelot et al., 1978a). This relatively young age may indicate the well
intersected dykes and sills intruded into and/or altered oceanic crust. Future work re-dating and describing
these basalts with modern techniques may yield ages that align with the age of the overlying sediments and
magnetic anomalies.
A lithostratigraphic summary from representative cores of the overlying Mesozoic units is provided in Fig.
3.4 detailing the sedimentary facies, organic content and interpreted depositional environments of DSDP
Site 367 (to be used in conjunction with the composite log, Fig. 3.3).
Fig. 3.4 (next page) – A litho-stratigraphic summary of the Mesozoic sediments recovered at DSDP Leg 41 Site 367 displaying key stratigraphic units after Lancelot et al. (1976). Total organic carbon (TOC) maximum and average values per unit displayed from new geochemical analysis (Table S 3.1). ACD – aragonite compensation depth; CCD – calcite compensation depth.
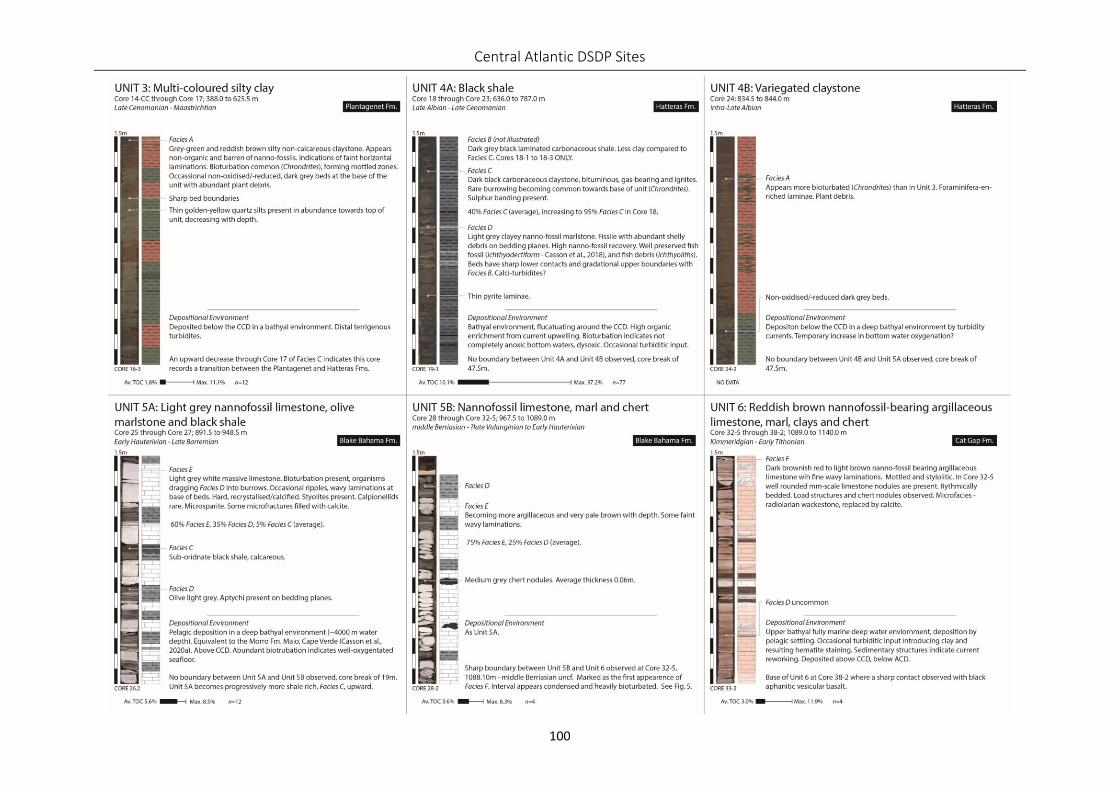
Central Atlantic DSDP Sites
100
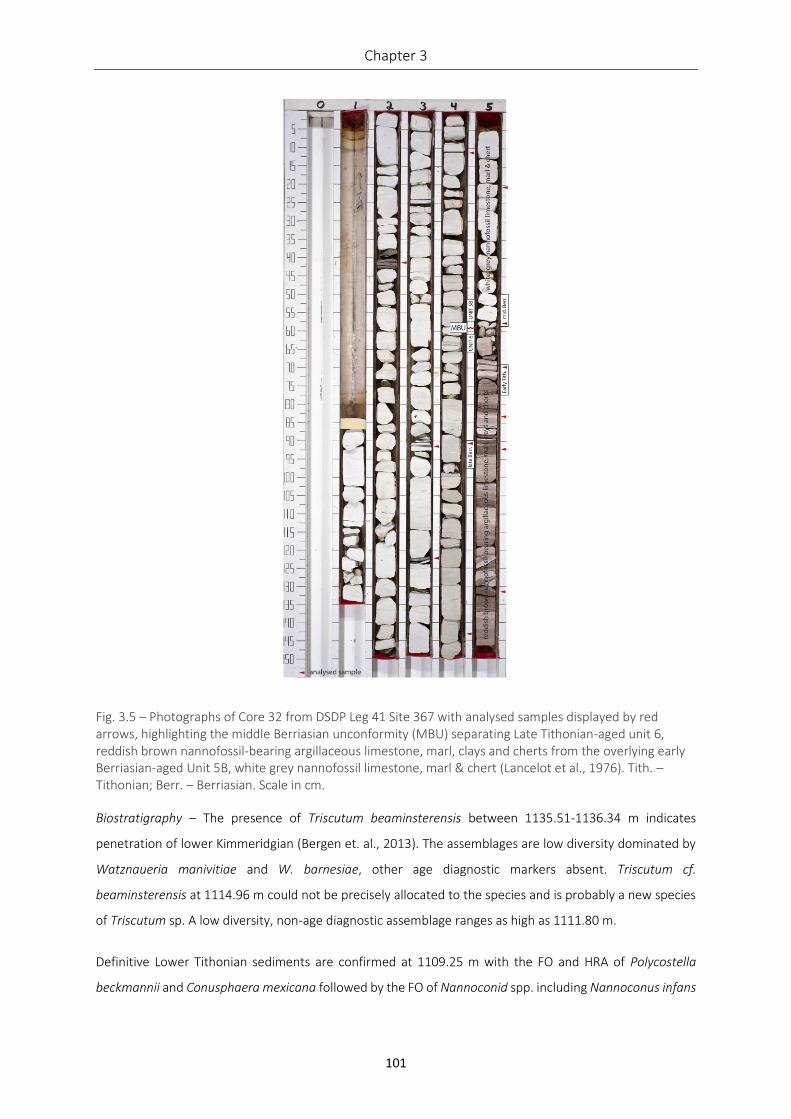
Chapter 3
101
Fig. 3.5 – Photographs of Core 32 from DSDP Leg 41 Site 367 with analysed samples displayed by red arrows, highlighting the middle Berriasian unconformity (MBU) separating Late Tithonian-aged unit 6, reddish brown nannofossil-bearing argillaceous limestone, marl, clays and cherts from the overlying early Berriasian-aged Unit 5B, white grey nannofossil limestone, marl & chert (Lancelot et al., 1976). Tith. – Tithonian; Berr. – Berriasian. Scale in cm.
Biostratigraphy – The presence of Triscutum beaminsterensis between 1135.51-1136.34 m indicates
penetration of lower Kimmeridgian (Bergen et. al., 2013). The assemblages are low diversity dominated by
Watznaueria manivitiae and W. barnesiae, other age diagnostic markers absent. Triscutum cf.
beaminsterensis at 1114.96 m could not be precisely allocated to the species and is probably a new species
of Triscutum sp. A low diversity, non-age diagnostic assemblage ranges as high as 1111.80 m.
Definitive Lower Tithonian sediments are confirmed at 1109.25 m with the FO and HRA of Polycostella
beckmannii and Conusphaera mexicana followed by the FO of Nannoconid spp. including Nannoconus infans
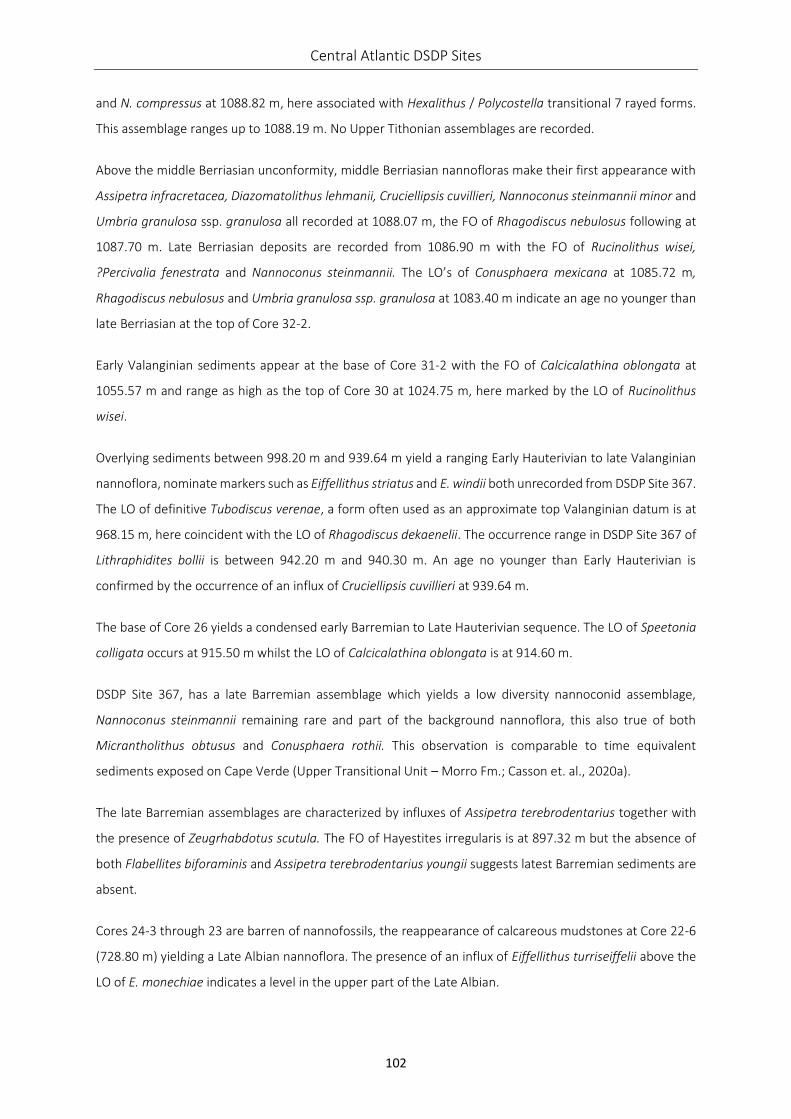
Central Atlantic DSDP Sites
102
and N. compressus at 1088.82 m, here associated with Hexalithus / Polycostella transitional 7 rayed forms.
This assemblage ranges up to 1088.19 m. No Upper Tithonian assemblages are recorded.
Above the middle Berriasian unconformity, middle Berriasian nannofloras make their first appearance with
Assipetra infracretacea, Diazomatolithus lehmanii, Cruciellipsis cuvillieri, Nannoconus steinmannii minor and
Umbria granulosa ssp. granulosa all recorded at 1088.07 m, the FO of Rhagodiscus nebulosus following at
1087.70 m. Late Berriasian deposits are recorded from 1086.90 m with the FO of Rucinolithus wisei,
?Percivalia fenestrata and Nannoconus steinmannii. The LO’s of Conusphaera mexicana at 1085.72 m,
Rhagodiscus nebulosus and Umbria granulosa ssp. granulosa at 1083.40 m indicate an age no younger than
late Berriasian at the top of Core 32-2.
Early Valanginian sediments appear at the base of Core 31-2 with the FO of Calcicalathina oblongata at
1055.57 m and range as high as the top of Core 30 at 1024.75 m, here marked by the LO of Rucinolithus
wisei.
Overlying sediments between 998.20 m and 939.64 m yield a ranging Early Hauterivian to late Valanginian
nannoflora, nominate markers such as Eiffellithus striatus and E. windii both unrecorded from DSDP Site 367.
The LO of definitive Tubodiscus verenae, a form often used as an approximate top Valanginian datum is at
968.15 m, here coincident with the LO of Rhagodiscus dekaenelii. The occurrence range in DSDP Site 367 of
Lithraphidites bollii is between 942.20 m and 940.30 m. An age no younger than Early Hauterivian is
confirmed by the occurrence of an influx of Cruciellipsis cuvillieri at 939.64 m.
The base of Core 26 yields a condensed early Barremian to Late Hauterivian sequence. The LO of Speetonia
colligata occurs at 915.50 m whilst the LO of Calcicalathina oblongata is at 914.60 m.
DSDP Site 367, has a late Barremian assemblage which yields a low diversity nannoconid assemblage,
Nannoconus steinmannii remaining rare and part of the background nannoflora, this also true of both
Micrantholithus obtusus and Conusphaera rothii. This observation is comparable to time equivalent
sediments exposed on Cape Verde (Upper Transitional Unit – Morro Fm.; Casson et. al., 2020a).
The late Barremian assemblages are characterized by influxes of Assipetra terebrodentarius together with
the presence of Zeugrhabdotus scutula. The FO of Hayestites irregularis is at 897.32 m but the absence of
both Flabellites biforaminis and Assipetra terebrodentarius youngii suggests latest Barremian sediments are
absent.
Cores 24-3 through 23 are barren of nannofossils, the reappearance of calcareous mudstones at Core 22-6
(728.80 m) yielding a Late Albian nannoflora. The presence of an influx of Eiffellithus turriseiffelii above the
LO of E. monechiae indicates a level in the upper part of the Late Albian.
Chapter 3
103
Despite the poor recovery of the sample analysed from Core 24-3 (729.00 m), the palynoflora indicates
marine conditions with some current upwelling of nutrients, as suggested by the sole presence of marine
palynofloras (Subtilisphaera species; Prauss, 2011; Prauss, 2012). The presence of Subtilisphaera cheit
suggests the sediments are no older than Late Albian (only by analogy with the similar taxon
Palaeohystrichophora infusorioides, which ranges no older than intra Late Albian in northwest Europe; Costa
et al., 1992).The presence in the samples from cores 22-6 and 23-1 (729.00; 778.35 m) of Litosphaeridium
arundum (Eisenack et al., 1960; Davey, 1979; Costa et al., 1992), Litosphaeridium conispinum (Davey et al.,
1973; Costa et al., 1992), Afropollis jardinus (Doyle et al., 1982), Elaterosporites klaszii and Elaterosporites
verrucatus (Jardine, 1967; Jardine et al., 1965; Regali et al., 1974; Salard-Cheboldaeff, 1991), all together
indicate penetration of sediments no younger than Late Albian. A terrestrial input is noted to occur within
Core 23-1 (778.35 m) as evidenced by the high abundances of pollen and spores. This input is also
characterised by an important increase in Classopollis species, indicating sediments input from a hot and dry
hinterland (Doyle et al., 1982), but the overall palynofloras of this latter sample still indicates an open marine
palaeoenvironment.
The Albian / Cenomanian boundary (ca. 710.46 m) lies between cores 22-1 (721.80 m) and 21-6 (700.26 m).
The LO of H. albiensis is at 723.96 m; Cenomanian sediments confirmed at 700.26 m by the FO of an increase
in Broinsonia signata / enormis group and FO of Gartnerago chiastia. The LO’s of G. chiastia at 695.93 m and
Eiffellithus paragogus at 690.94m indicates and age no younger than Lower Cenomanian.
A break in the core coverage into the base of Core 19-4 yields assemblages characteristic of the Late
Cenomanian. The acme of Eprolithus spp. between 649.17 m and 642.77 m is particularly characteristic of
Late Cenomanian to earliest Turonian sediments. An age no younger than Late Cenomanian is confirmed by
the LAD’s of Axopodorhabdus albianus and Gartnerago praeobliquum at 642.77 m followed by Helenea
chiastia at 637.70 m.
Two samples analysed for palynology from cores 17-3 and 18-1 (620.10; 637.40 m) had very poor recovery
and the chronostratigraphic interpretation of these cores from ?Late Cenomanian to ?Late Albian is mainly
based on similar bio-events already noted to occur offshore West Africa and cannot therefore be identified
with certainty. An open marine to offshore deep water paleoenvironment still prevails in this interval.
The uppermost sample from Core 16-2 (541.63 m) yielded a poor recovery. However, the presence of
Oligosphaeridium complex indicates penetration of sediments no younger than Late Santonian (unpublished
Petrostrat data West Africa). Deposition under open marine conditions prevail as evidenced by moderately
rich dinocyst assemblages. However, the low diversity in dinoflagellates indicate some restriction in the
surface waters.
Central Atlantic DSDP Sites
104
DSDP Site 368
Fig. 3.6 – A re-evaluation of DSDP Leg 41 Site 368 stratigraphy displaying nannofossil events (Table S 3.2), total organic carbon (TOC; Table S 3.1) measurements, palynology results (Fig. S 3.1) and key stratigraphic surfaces.
Along with Site 367 (Fig. 3.3), Site 368 adds further lithological data captured in the oceanic domain offshore
northwest Africa (Fig. 3.6). The borehole was abandoned at 984.5 mMD, after intersecting two diabase sills
and associated gas in black shale facies, equivalent to those drilled at Site 367 (Lancelot et al., 1978b). K-Ar
whole-rock ages for the sills are 16.3-19.3 Ma (Duncan & Jackson, 1978), linked to Cape Verde volcanism.
Contact metamorphism increased the thermal maturity of the surrounding Hatteras Formation shales,
revealing their hydrocarbon generating potential (Dow, 1978). The notable difference in lithostratigraphy to
Site 367 is the increased presence of coarser-grained terrigenous turbidites, that decrease in abundance
upwards through Plantagenet Formation of Site 368 (Unit 2; Fig. 3.6). Decimetre-scale cyclical turbidite
packages have fine-grained to silt grade quartz sand bases with load casts grading to claystones, best
preserved in cores 53 to 59 (Fig. 3.6).
Biostratigraphy – The oldest sediments analysed for calcareous nannofossils from Core 63 (980.78 m) yield
an influx of Eprolithus floralis, which ranges to the top of Core 62-4 (973.51 m); this influx is characteristic
Chapter 3
105
of Late Cenomanian to earliest Turonian sediments. Definitive Late Cenomanian markers, Axopodorhabdus
albianus, Gartnerago praeobliquum and Corollithion kennedyi have FO’s at 979.75 m. The LO’s of
Axopodorhabdus albianus and Gartnerago praeobliquum at 975.97 m indicates an age no younger than Late
Cenomanian.
Fifteen samples analysed between cores 60-2 (951.24 m) and 50-2 (704.52 m) proved barren of nannofossils.
Therefore 8 samples were analysed for palynology.
The impoverished recovery from cores 59-3 to 62-4 (942.87; 973.54 m) precludes a biostratigraphic or
paleoenvironmental interpretation. An Early Coniancian? – ?Late Turonian has been tentatively assigned to
the Core 58-2 (923.55 m) following the presence of increased algal cysts, which is one of the events noted
to occur within this age assignment offshore northwest Africa. The low diversity in dinocysts in this sample,
supported by this increased number of algal cysts, could indicate environmental stress and some restriction
in the surface waters.
Three samples taken from cores 55-2, 56-3 and 57-2 (840.36; 849.3; 894.52 m) yielded a relatively good
palynological recovery. The presence of Oligosphaeridium species (O. complex, O. irregulare, O.
pulcherrimum, Oligosphaeridium spp.), Chatangiella spp. and Cretacaeiporites mullerii in those samples all
indicate penetration of Santonian or older sediments (unpublished Petrostrat data West Africa). The
occurrence of high numbers in Subtilisphaera species, an event which is consistent with Late Santonian
sediments offshore northwest Africa (unpublished Petrostrat data West Africa), also supports this
interpretation. There is a notable change in the paleoenvironment through this interval, from open marine
with surface water restrictions and with current upwelling of nutrients (as indicated by the bloom of
Subtilisphaera species) to middle neritic environment as suggested by the decrease in marine palynofloras
and the decrease in spores and pollen compared to the sample from Core 53-2 (752.03 m).
A possible middle Campanian age has been assigned to the samples from Core 53-2 (752.03 m), as indicated
by the presence of Xenascus ceratoides (unpublished Petrostrat data West Africa). A moderately rich and
diverse dinoflagellate cysts assemblage indicates a degree of oxygenated surface waters, while the absence
of terrestrial palynoflora suggests an offshore setting or limited terrestrial input.
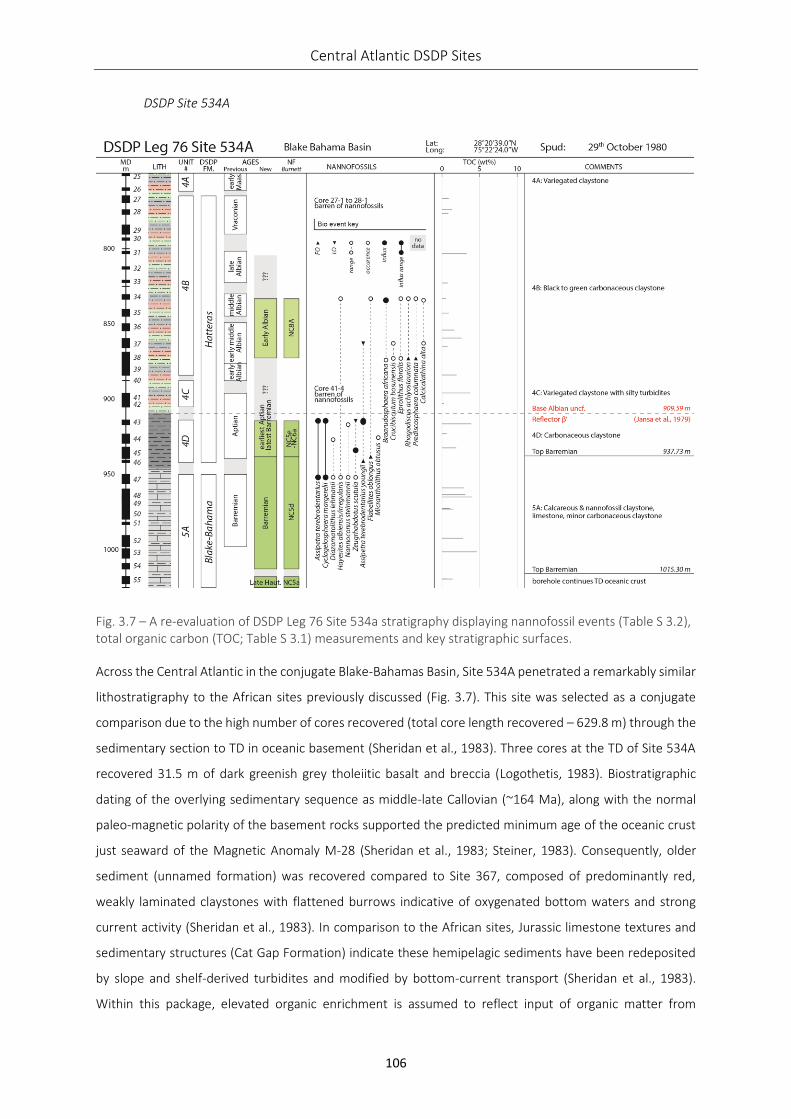
Central Atlantic DSDP Sites
106
DSDP Site 534A
Fig. 3.7 – A re-evaluation of DSDP Leg 76 Site 534a stratigraphy displaying nannofossil events (Table S 3.2), total organic carbon (TOC; Table S 3.1) measurements and key stratigraphic surfaces.
Across the Central Atlantic in the conjugate Blake-Bahamas Basin, Site 534A penetrated a remarkably similar
lithostratigraphy to the African sites previously discussed (Fig. 3.7). This site was selected as a conjugate
comparison due to the high number of cores recovered (total core length recovered – 629.8 m) through the
sedimentary section to TD in oceanic basement (Sheridan et al., 1983). Three cores at the TD of Site 534A
recovered 31.5 m of dark greenish grey tholeiitic basalt and breccia (Logothetis, 1983). Biostratigraphic
dating of the overlying sedimentary sequence as middle-late Callovian (~164 Ma), along with the normal
paleo-magnetic polarity of the basement rocks supported the predicted minimum age of the oceanic crust
just seaward of the Magnetic Anomaly M-28 (Sheridan et al., 1983; Steiner, 1983). Consequently, older
sediment (unnamed formation) was recovered compared to Site 367, composed of predominantly red,
weakly laminated claystones with flattened burrows indicative of oxygenated bottom waters and strong
current activity (Sheridan et al., 1983). In comparison to the African sites, Jurassic limestone textures and
sedimentary structures (Cat Gap Formation) indicate these hemipelagic sediments have been redeposited
by slope and shelf-derived turbidites and modified by bottom-current transport (Sheridan et al., 1983).
Within this package, elevated organic enrichment is assumed to reflect input of organic matter from
Chapter 3
107
terrestrial sources reflected in the Type III organic matter (Herbin et al., 1983). The Lower Cretaceous Blake
Bahama Formation shows a gradual increase in carbonaceous claystone through a predominantly pelagic
limestone sequence mirroring Site 367. In the Hatteras Formation, black shales were deposited by distal
turbidity currents (Sheridan et al., 1983), supported in the terrestrial origin of the organic matter (Herbin et
al., 1983). Sediment starvation resulted in an unusually thin (41.0 m) Plantagenet Formation unconformably
overlying the Hatteras Formation (Sheridan et al., 1983).
Biostratigraphy – DSDP Site 534A has been studied extensively for nannofossils stratigraphy. The current
investigation focused on the Albian through Barremian sequence (Fig. 3.7), which has also been reviewed
by Roth, 1983 and Bergen, 1994). The Lower Cretaceous through Upper Jurassic sequence, not described
here, was the focus of studies by Roth, 1983; Bralower et. al., 1989; Cassellato, 2010 and Bergen et. al.,
2013).
The oldest samples analysed in the current analysis are Late Barremian in age. This is confirmed by the
presence of Zeugrhabdotus scutula above the LO of Calcicalathina oblongata and below the FO of Assipetra
infracretacea ssp. youngii at 952.04 m and the FO of Flabellites oblongus at 938.36 m. A ranging earliest
Aptian to late Barremian age is given for the interval between 914.50 m and 938.36 m based on the LO of
Zeugrhabdotus scutula, an influx of Assipetra terebrodentarius youngii and abundant Cyclagelosphaera
margerelii. Conusphaera rothii was completely absent from this section whilst other characteristic
nannofossils of the Barremian, Nannoconus steinmannii and Micrantholithus obtusus, were sporadic.
These assemblages are very similar to Barremian nannofloras from Cape Verde (Casson et al., 2020a) and
DSDP Site 367 (Fig. 3.3). The FO of Hayesites irregularis is also shown to range below the FO of Flabellites
oblongus at DSDP Site 534A (Fig. 3.7) and DSDP Site 367 (Fig. 3.3). Along the Atlantic Morocco margin, the
LO of Zeugrhabdotus scutula was found immediately below a condensed earliest Aptian ammonite bearing
section with Procheloniceras dechauxii and Deshayesites aff. euglyphus ammonites (Luber et. al., 2019; J.
Jeremiah., pers. obs.). The condensed nature of this section in Morocco, however, does not preclude Z.
scutula ranging up into the basal Aptian so a ranging age for the current interval is preferred.
Bergen (1994) utilised the FO of Rhagodiscus achlyostaurion in Core 45-4 to indicate a late Barremian age.
This species has not been found in sediments any older than latest Aptian by the author and was not found
below the Albian in the reinvestigation of DSDP Site 534A.
Cores 39-42 are barren of nannofossils. The DSDP preliminary investigation of DSDP Site 534A (Gradstein &
Sheridan, 1983 & Roth, 1983) did not yield definitive nannofossil or foraminiferal markers over this
sequence. The LO of the palynomorph, Druggidium deflandrei from Core 41-6 was utilised as an Aptian
marker but this form is known to range into the Lower Albian.
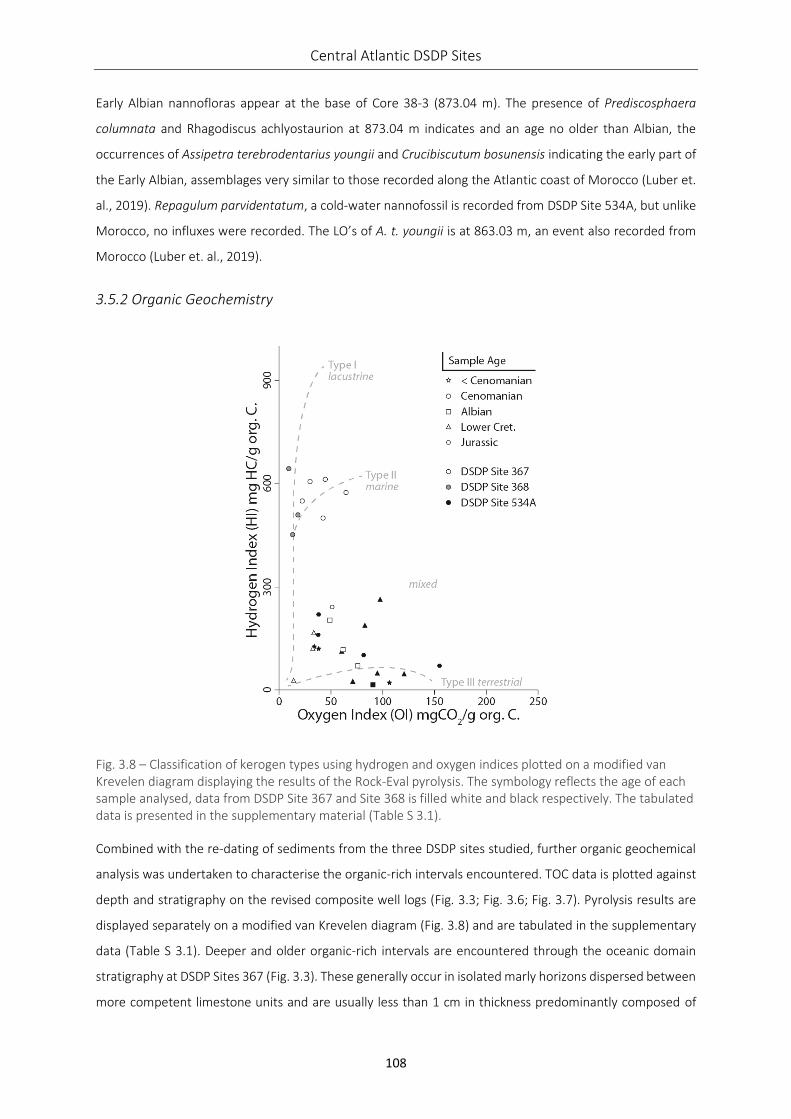
Central Atlantic DSDP Sites
108
Early Albian nannofloras appear at the base of Core 38-3 (873.04 m). The presence of Prediscosphaera
columnata and Rhagodiscus achlyostaurion at 873.04 m indicates and an age no older than Albian, the
occurrences of Assipetra terebrodentarius youngii and Crucibiscutum bosunensis indicating the early part of
the Early Albian, assemblages very similar to those recorded along the Atlantic coast of Morocco (Luber et.
al., 2019). Repagulum parvidentatum, a cold-water nannofossil is recorded from DSDP Site 534A, but unlike
Morocco, no influxes were recorded. The LO’s of A. t. youngii is at 863.03 m, an event also recorded from
Morocco (Luber et. al., 2019).
3.5.2 Organic Geochemistry
Fig. 3.8 – Classification of kerogen types using hydrogen and oxygen indices plotted on a modified van Krevelen diagram displaying the results of the Rock-Eval pyrolysis. The symbology reflects the age of each sample analysed, data from DSDP Site 367 and Site 368 is filled white and black respectively. The tabulated data is presented in the supplementary material (Table S 3.1).
Combined with the re-dating of sediments from the three DSDP sites studied, further organic geochemical
analysis was undertaken to characterise the organic-rich intervals encountered. TOC data is plotted against
depth and stratigraphy on the revised composite well logs (Fig. 3.3; Fig. 3.6; Fig. 3.7). Pyrolysis results are
displayed separately on a modified van Krevelen diagram (Fig. 3.8) and are tabulated in the supplementary
data (Table S 3.1). Deeper and older organic-rich intervals are encountered through the oceanic domain
stratigraphy at DSDP Sites 367 (Fig. 3.3). These generally occur in isolated marly horizons dispersed between
more competent limestone units and are usually less than 1 cm in thickness predominantly composed of
Chapter 3
109
fissile marl (Facies D – DSDP Site 367; Fig. 3.4). It is conceivable that these isolated horizons thicken
proximally, as indicated in the seismic architecture of these sediments (Fig. 3.9). TOC values at DSDP Site
367 from the Lower Cretaceous to Jurassic (TD) interval average 4.71%, with occasionally higher values up
to 25.07% (Core 26) taken from plant material. The pyrolysis results record a more Type III kerogen type
indicating terrestrial-derived organic matter (Fig. 3.8). The majority of the pyrolysis data from DSDP Site
534A (Herbin et al., 1983) also have low HI and high OI values indicating Type III organic matter derived from
terrestrial sources, and hence are more gas-prone (Fig. 3.8). An increase in TOC content is recorded in
Callovian-aged sediments from this borehole, unpenetrated elsewhere around the Central Atlantic reflecting
local terrestrial organic matter input (Herbin et al., 1983).
The two DSDP sites along the African margin have exceptionally elevated TOC levels in Cenomanian-aged
black shales, with average TOC values of 19.45% and 13.78% from DSDP Site 367 and 368, respectively. Tmax
values average 405 °C for the organic-rich sediments from DSDP Site 367 indicating the source rock is
immature. By comparison, the time-equivalent stratigraphy at DSDP Site 368 has average Tmax value of 429
°C, closer to the temperatures capable of generating hydrocarbons, probably due to thermal maturation
associated with the recorded volcanic intrusives (Dow, 1978). In more proximal settings along the
continental margin the Cenomanian organic-rich interval will be buried under a thicker sediment
accumulation, increasing the maturity and therefore making it capable of generating hydrocarbons, and this
is the predicted source of the oil in the Sangomar field (Clayburn, 2017). A Cenomanian-aged grouping of
data points on Fig. 3.8 with high HI (hydrogen index – 450 to 600+ mg hydrocarbons/g organic carbon) and
low OI values (oxygen index – 10 to 65 mg CO₂/g organic carbon) indicates Type II marine kerogen with oil
generating potential.
Both dating by palynology and calcareous nannofossils (Fig. 3.3) indicate a Late Cenomanian age throughout
cores 17 to 19 from DSDP Site 367. Previously, Müller et al., (1983) reported these cores as early Turonian
in age and this dating was used by Herbin et al. (1986) to characterise the organic-enrichment around the
Cenomanian-Turonian boundary event. Our new stratigraphic results indicate these sediments show a
temporal correlation to the global oceanic anoxic event 2 (OAE-2 ~Late Cenomanian, nannofossil zone UC5).
The equivalent OAE-2 interval is penetrated in DSDP Site 368 in Core 63 (Fig. 3.6). Isotope geochemical
results from these intervals are discussed in Kuypers et al. (2002) and van Bentum et al. (2012).
Differences in the geochemical properties of correlative organic-rich intervals drilled on the Senegalese
continental shelf are recorded by exploration wells (Casamance Marine – CM). Herbin et al. (1986) show
TOC values decreasing towards the paleo-coastline and kerogen type shifting to become more terrestrial
(Type III) in nature, reflecting the proximity to terrigenous input and decrease in the preservation potential
of planktonic (marine Type II) organic matter.
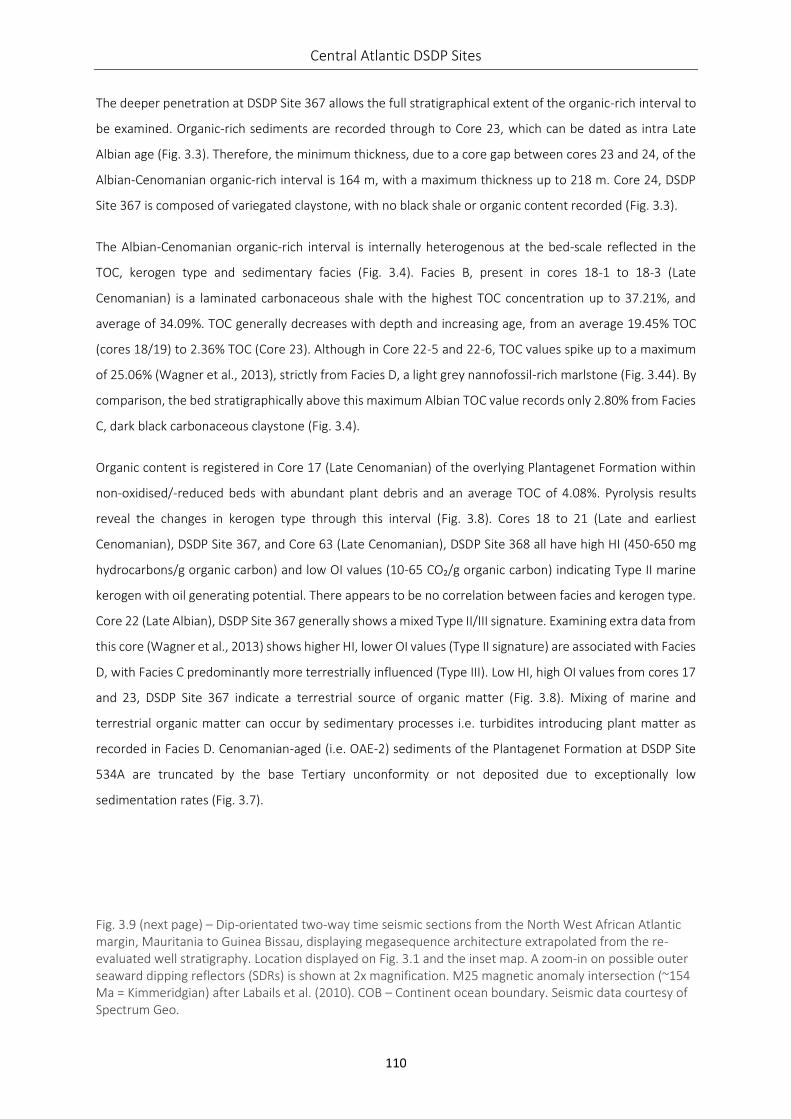
Central Atlantic DSDP Sites
110
The deeper penetration at DSDP Site 367 allows the full stratigraphical extent of the organic-rich interval to
be examined. Organic-rich sediments are recorded through to Core 23, which can be dated as intra Late
Albian age (Fig. 3.3). Therefore, the minimum thickness, due to a core gap between cores 23 and 24, of the
Albian-Cenomanian organic-rich interval is 164 m, with a maximum thickness up to 218 m. Core 24, DSDP
Site 367 is composed of variegated claystone, with no black shale or organic content recorded (Fig. 3.3).
The Albian-Cenomanian organic-rich interval is internally heterogenous at the bed-scale reflected in the
TOC, kerogen type and sedimentary facies (Fig. 3.4). Facies B, present in cores 18-1 to 18-3 (Late
Cenomanian) is a laminated carbonaceous shale with the highest TOC concentration up to 37.21%, and
average of 34.09%. TOC generally decreases with depth and increasing age, from an average 19.45% TOC
(cores 18/19) to 2.36% TOC (Core 23). Although in Core 22-5 and 22-6, TOC values spike up to a maximum
of 25.06% (Wagner et al., 2013), strictly from Facies D, a light grey nannofossil-rich marlstone (Fig. 3.44). By
comparison, the bed stratigraphically above this maximum Albian TOC value records only 2.80% from Facies
C, dark black carbonaceous claystone (Fig. 3.4).
Organic content is registered in Core 17 (Late Cenomanian) of the overlying Plantagenet Formation within
non-oxidised/-reduced beds with abundant plant debris and an average TOC of 4.08%. Pyrolysis results
reveal the changes in kerogen type through this interval (Fig. 3.8). Cores 18 to 21 (Late and earliest
Cenomanian), DSDP Site 367, and Core 63 (Late Cenomanian), DSDP Site 368 all have high HI (450-650 mg
hydrocarbons/g organic carbon) and low OI values (10-65 CO₂/g organic carbon) indicating Type II marine
kerogen with oil generating potential. There appears to be no correlation between facies and kerogen type.
Core 22 (Late Albian), DSDP Site 367 generally shows a mixed Type II/III signature. Examining extra data from
this core (Wagner et al., 2013) shows higher HI, lower OI values (Type II signature) are associated with Facies
D, with Facies C predominantly more terrestrially influenced (Type III). Low HI, high OI values from cores 17
and 23, DSDP Site 367 indicate a terrestrial source of organic matter (Fig. 3.8). Mixing of marine and
terrestrial organic matter can occur by sedimentary processes i.e. turbidites introducing plant matter as
recorded in Facies D. Cenomanian-aged (i.e. OAE-2) sediments of the Plantagenet Formation at DSDP Site
534A are truncated by the base Tertiary unconformity or not deposited due to exceptionally low
sedimentation rates (Fig. 3.7).
Fig. 3.9 (next page) – Dip-orientated two-way time seismic sections from the North West African Atlantic margin, Mauritania to Guinea Bissau, displaying megasequence architecture extrapolated from the re-evaluated well stratigraphy. Location displayed on Fig. 3.1 and the inset map. A zoom-in on possible outer seaward dipping reflectors (SDRs) is shown at 2x magnification. M25 magnetic anomaly intersection (~154 Ma = Kimmeridgian) after Labails et al. (2010). COB – Continent ocean boundary. Seismic data courtesy of Spectrum Geo.
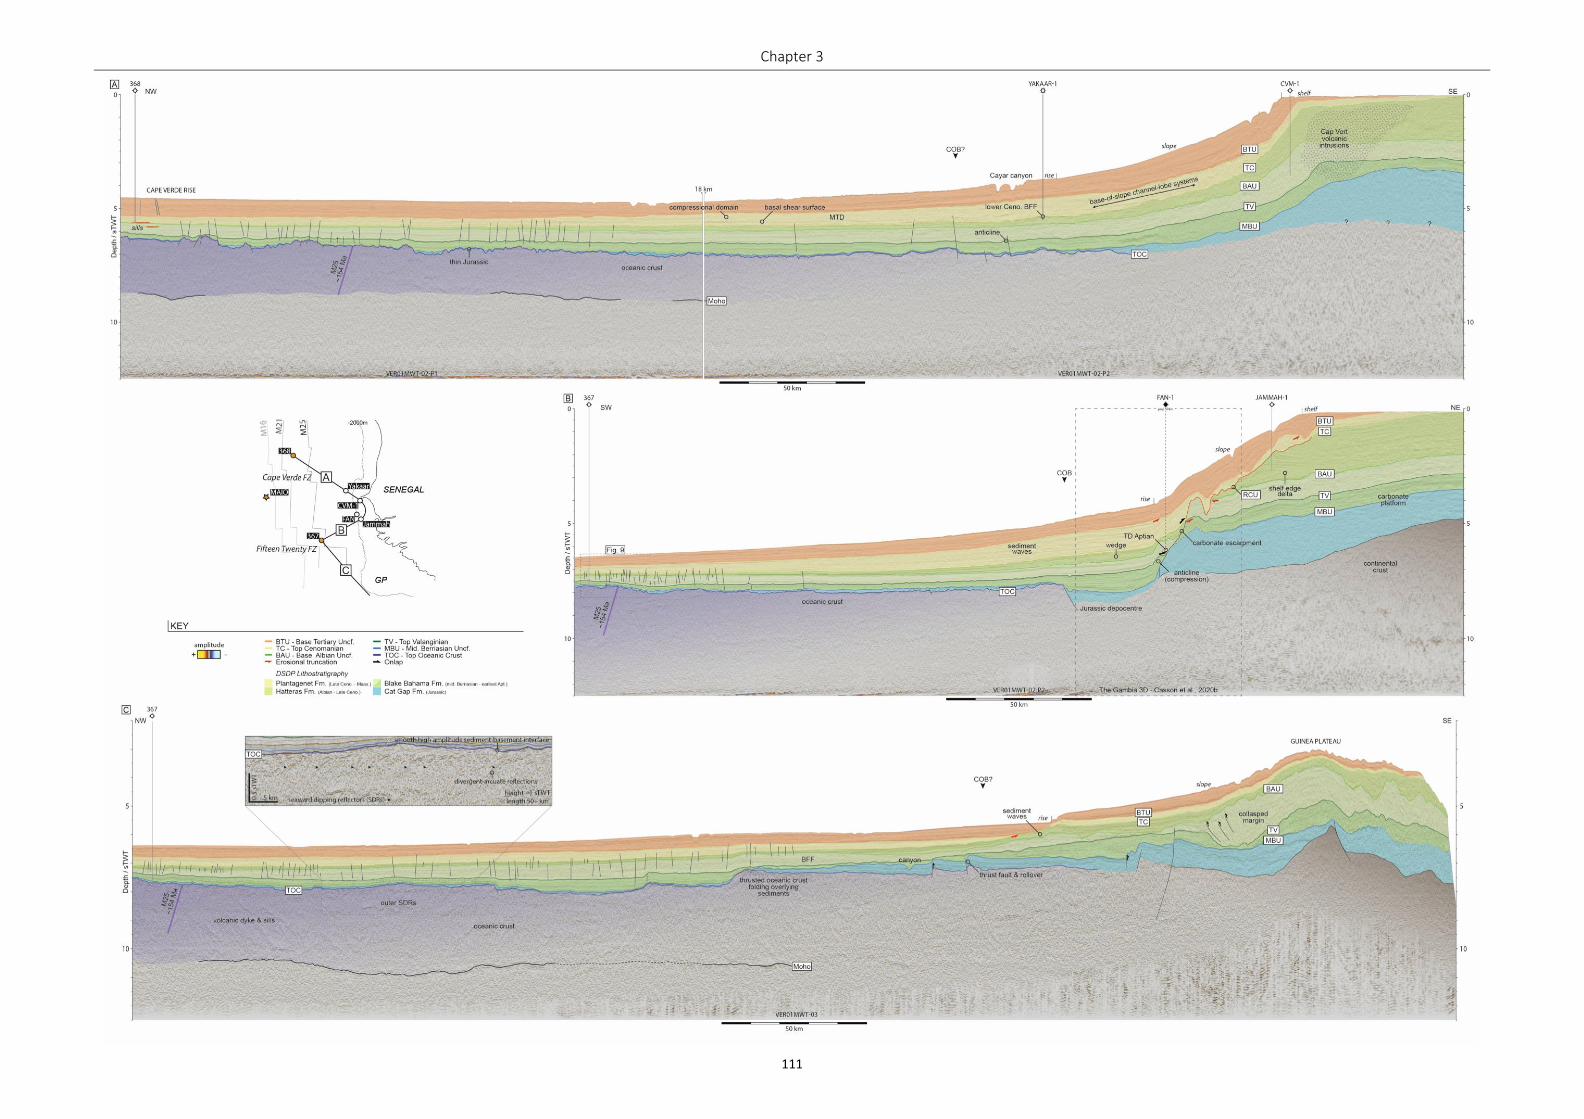
Chapter 3
111
Central Atlantic DSDP Sites
112
3.5.3 Seismic Stratigraphy
An overview of the seismic stratigraphy documenting the margin architecture is provided to extend
observations and the new age interpretations from the DSDP sites eastward to the continental margin (Fig.
3.9), linking with studies of the shelfal stratigraphy (Casson et al., 2020b). The broad present-day basement
bulge (sensu Patriat & Labails, 2006) of the Cape Verde Rise is subtly apparent on Fig. 3.9A forming a
bathymetric rise dipping towards the continental margin, reflected in the oceanic crust geometry. A semi-
continuous seismic reflection interpreted below the oceanic crust at 8.5 and 10 sTWT depth (Fig. 3.9A and
Fig. 3.9C, respectively) is possibly the Moho. Below the top oceanic crust, ca. 100 km southeast of DSDP Site
367, reflections are arcuate, curving to sub-vertical and dip basin/oceanward, over a distance of ca. 50 km
(Fig. 3.9C inset); normal oceanic crust exists to the northwest and southeast. The sediment-basement
reflection (i.e. top oceanic crust) is smooth, relative to the rugose oceanic crust topography further outboard
to the northwest (Fig. 3.9C). By comparison to Calvès et al. (2011), these features can be interpreted as
volcanic seaward dipping reflections (SDRs) produced by basaltic flows during early seafloor spreading. The
reflections extend ca. 50 km along the seismic profile (Fig. 3.9C). Labails et al. (2010) map two magnetic
anomalies along the northwest African continental margin, the African Blake Spur magnetic anomaly
(ABSMA) and the West African Coast magnetic anomaly (WACMA; Fig. 3.1); whether these magnetic
anomalies are associated with SDR packages remains to be proven. Their mapped extent stops south of the
Cap Vert fracture zone (Fig. 3.1). However, our work documents SDRs on trend with the African Blake Spur
magnetic anomaly (Fig. 3.1).
The oceanic crust is faulted and rugose further outboard, becoming smoother towards the continental
margin (Fig. 3.9A), as observed by Patriat & Labails (2006). Locating the continent-ocean boundary (COB) on
Fig. 3.9A is difficult due to the seismic line intersecting a fracture zone offshore Dakar and the acoustic
effects of the Cap Vert intrusive volcanism (Hansen et al., 2008). However, the COB on Fig. 3.9B is
identifiable within in The Gambia 3D dataset, where a landward-dipping normal fault separates oceanic crust
from a postulated syn-rift wedge and continental crust to the east. The oceanic crust and overlying Jurassic-
Lower Cretaceous stratigraphy in Fig. 3.9C is thrusted, forming roll-over structures in the overlying
stratigraphy, and again intersects east-west trending fracture zones causing pronounced steps. Imaging the
continental basement structure is limited by the seismic penetration on all profiles. All the overlying
stratigraphy thins onto oceanic crust and thickens considerably inboard. DSDP sites located outboard
therefore encounter condensed sequences, this is exaggerated at Site 367, which was drilled on a basement
high. Expanded and complete stratigraphic intervals are predicted from the seismic interpretation at the
base of carbonate margin (Fig. 3.9).
Both DSDP sites are located west of the Magnetic Anomaly M-25 (~154 Ma – Kimmeridgian), therefore latest
Jurassic stratigraphy is interpreted along all three profiles in the oceanic domain, as encountered at Site 367
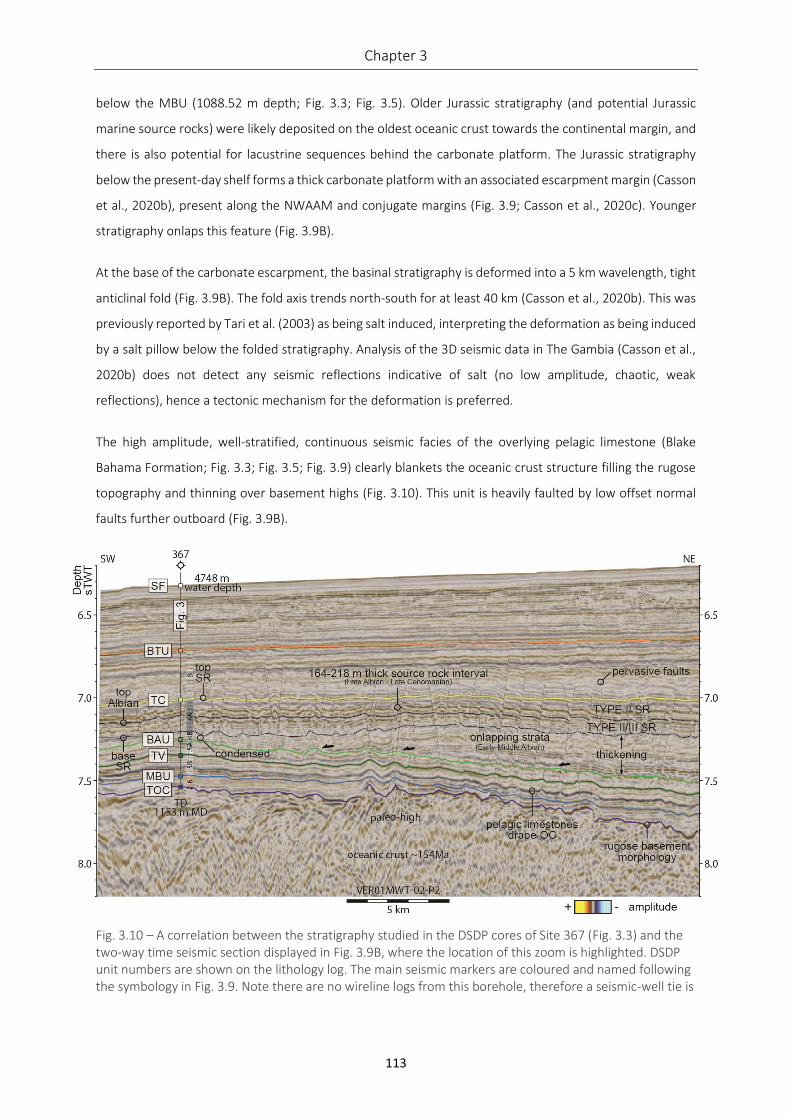
Chapter 3
113
below the MBU (1088.52 m depth; Fig. 3.3; Fig. 3.5). Older Jurassic stratigraphy (and potential Jurassic
marine source rocks) were likely deposited on the oldest oceanic crust towards the continental margin, and
there is also potential for lacustrine sequences behind the carbonate platform. The Jurassic stratigraphy
below the present-day shelf forms a thick carbonate platform with an associated escarpment margin (Casson
et al., 2020b), present along the NWAAM and conjugate margins (Fig. 3.9; Casson et al., 2020c). Younger
stratigraphy onlaps this feature (Fig. 3.9B).
At the base of the carbonate escarpment, the basinal stratigraphy is deformed into a 5 km wavelength, tight
anticlinal fold (Fig. 3.9B). The fold axis trends north-south for at least 40 km (Casson et al., 2020b). This was
previously reported by Tari et al. (2003) as being salt induced, interpreting the deformation as being induced
by a salt pillow below the folded stratigraphy. Analysis of the 3D seismic data in The Gambia (Casson et al.,
2020b) does not detect any seismic reflections indicative of salt (no low amplitude, chaotic, weak
reflections), hence a tectonic mechanism for the deformation is preferred.
The high amplitude, well-stratified, continuous seismic facies of the overlying pelagic limestone (Blake
Bahama Formation; Fig. 3.3; Fig. 3.5; Fig. 3.9) clearly blankets the oceanic crust structure filling the rugose
topography and thinning over basement highs (Fig. 3.10). This unit is heavily faulted by low offset normal
faults further outboard (Fig. 3.9B).
Fig. 3.10 – A correlation between the stratigraphy studied in the DSDP cores of Site 367 (Fig. 3.3) and the two-way time seismic section displayed in Fig. 3.9B, where the location of this zoom is highlighted. DSDP unit numbers are shown on the lithology log. The main seismic markers are coloured and named following the symbology in Fig. 3.9. Note there are no wireline logs from this borehole, therefore a seismic-well tie is
Central Atlantic DSDP Sites
114
not possible. Type II and Type II/III refers to the predominate kerogen type, i.e. marine and mixed, respectively, for those particular intervals. OC – oceanic crust; SF – sea floor; SR – source rock.
Without a seismic-well tie calibration, due to the lack of wireline logs, there is uncertainty in definitively
assigning seismic reflections to the key stratigraphic surfaces established in the re-investigation of Site 367.
However, a most-likely interpretation based on the known unit thicknesses correlated to packages of
different seismic facies, is provided in Fig. 3.10. The BAU is inferred to occur between Core 24 (intra Late
Albian) and 25 (Late Barremian), with overlying Early-Middle Albian onlapping the BAU surface to the
northeast of the site. This explains why Early-Middle Albian strata are not present or at least very condensed
(and if present, located between cores 24 and 25) at Site 367. This observation and the clear thinning of the
Albian sequence suggests the formation of significant paleo-topography prior to Albian deposition. Mourlot
et al. (2018) attributed this to emplacement of sheeted contourite drifts.
Interpreting eastward on Fig. 3.9C to the present-day base of slope, the BAU bisects a series of undulating,
draping continuous reflections with km-scale wavelength that are interpreted as sediment waves. This
indicates that there was oceanic circulation at this time, as reported by Mourlot et al. (2018). Below the
most distal region of the Guinea Plateau (Fig. 3.9C), the pre-Albian sediments are anomalously thick with
minor thrust faults observed, interpreted as a collapsed part of the carbonate margin. A similar-aged
collapse feature is observed on the conjugate Demerara Rise (Casson et al., 2020c).
At Site 368, in the interval equivalent to the TD of the borehole, high amplitude seismic reflections are
observed that form elongated horizontal geobodies up to 5 km wide, disrupting underlying reflections (Fig.
3.9A). These are interpreted to represent the diabase sills encountered at TD of Site 368, intruded into
relatively undeformed oceanic domain stratigraphy (Fig. 3.6). Along the remainder of the profiles, no similar
geobodies/sills are identified.
The Hatteras Formation source rock (Late Albian – Late Cenomanian) encountered at both DSDP sites again
thickens towards the continental margin and has a distinctive seismic response, forming high amplitude,
continuous reflections (Fig. 3.10). The base of the source rock interval, i.e. the boundary between Unit 4A
and 4B at DSDP Site 367, is interpreted to correlate to the observed change in seismic amplitude and
continuity (Fig. 3.10). Displayed on Fig. 3.9A, near the top Cenomanian horizon, locally high amplitude,
lobate reflections are interpreted to represent basin floor fan systems (BFF) of equivalent up dip erosive
base of slope channel-lobe systems (SC; Posamentier & Kolla, 2003). The Yakaar-1 gas discovery (15 TCF)
encountered a 120 m hydrocarbon in high quality Lower Cenomanian reservoir sands (Kosmos Energy,
2019). The comparable sequence further south along the margin at the base of the escarpment (Fig. 3.9B),
shows significant thickening forming a wedge geometry, time-equivalent to a shelf-edge delta system
documented on the distal continental margin (Casson et al., 2020b). Subsequent canyonisation and erosion
of the shelf margin that occurred during the Late Cretaceous is recorded as the regional composite
Chapter 3
115
unconformity (RCU; Casson et al., 2020b), correlating approximately to the top Cenomanian (TC) in the
oceanic domain and the significant facies change between the Hatteras and Plantagenet Formations (Fig.
3.3).
Within the interval correlated to the Plantagenet Formation, chaotic and discontinuous reflections above
continuous sub-parallel basal shear surfaces are interpreted as mass transport deposits (MTDs; Fig. 3.9A;
Posamentier & Kolla, 2003) representing material associated with the margin collapse (Casson et al., 2020b).
The BTU erodes the Mesozoic stratigraphy primarily at the base of slope, forming slope canyons mirroring
earlier RCU-related canyons (Fig. 3.9B), completely truncating the Plantagenet Formation (Fig. 3.9C) and
subcropping on the present-day shelf due to Cap Vert volcanism and associated uplift in the Cenozoic.
Fig. 3.11 (next page) – A dip-orientated Wheeler diagram constructed from the oceanic domain (left) to distal and proximal domains of onshore Senegal, northwest Africa Atlantic margin (right) detailing the stratigraphic evolution of the continental margin, from pre-rift to the top of the Cretaceous. The horizontal axis is not accurately to scale. Pin stripe vertical lines indicate hiatus’ corresponding to various regional unconformities dated in the stratigraphic analysis. Dash black and white lines indicate revised wells in this study. The geological time scale (GTS 2018) is non-linear. Hydrocarbon occurrences are shown. Outcrop studies from Maio, Cape Verde (Casson et al., 2020a) and Cap de Naze, Senegal (CDN) displayed. BFF – basin floor fan; TD – total depth.
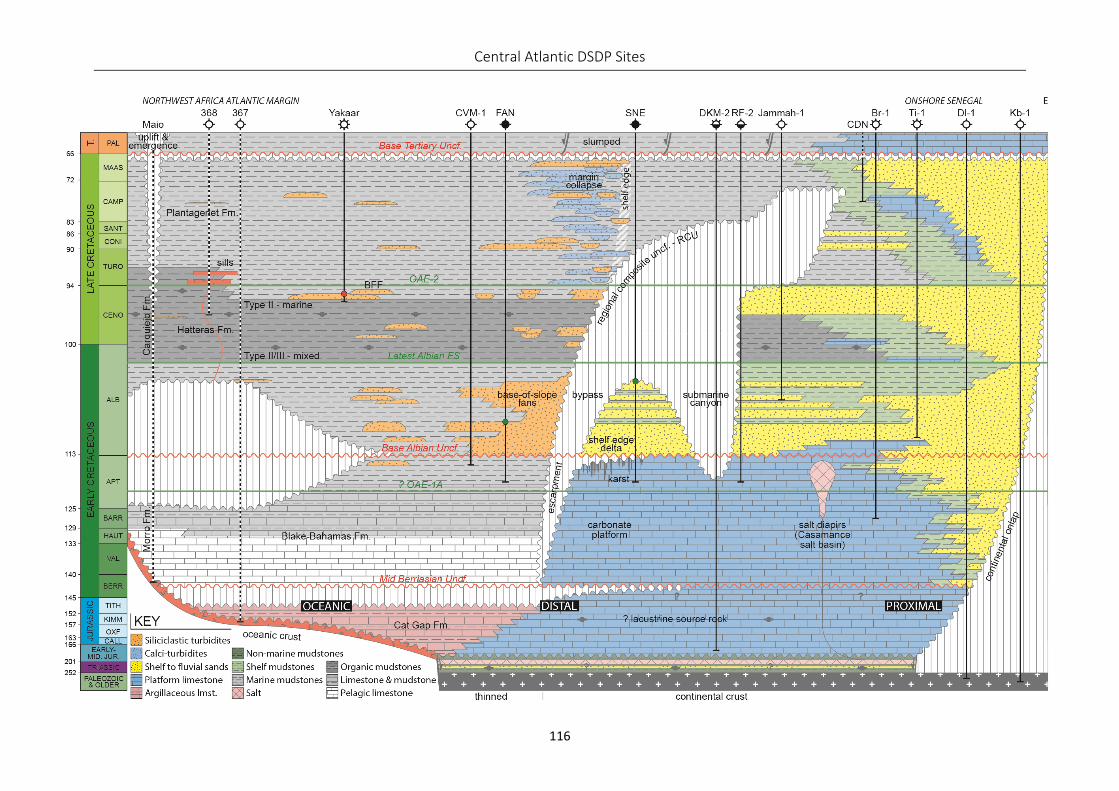
Central Atlantic DSDP Sites
116
Chapter 3
117
3.6 DISCUSSION
3.6.1 Stratigraphic Evolution
Incorporating the new interpretations of the oceanic domain dating and revised stratigraphy with the
existing shelfal stratigraphy encountered in exploration wells, and new data from the outcrop studies on
Maio, Cape Verde (Casson et al., 2020a) and Cap de Naze, Senegal (pers. obs.), allows the full dip-extent of
the depositional systems and stratigraphic architecture to be investigated across the northwest African
continental margin (Fig. 3.11).
Basement rocks are encountered in the most proximal (onshore), easterly drilled Senegalese exploration
wells (17 total), where the overlying Meso-Cenozoic sedimentary sequence thins and gradually onlaps
basement. These penetrations reveal the heterogeneous nature in the pre-Mesozoic basement, summarised
by Villeneuve et al. (2015) and Ndiaye et al. (2016). Wells Dl-1 and Kb-1 (Fig. 3.11) recovered Silurian to
Permian-aged quartzites (biotite hornfels), shales and breccias that show affinity to Bove Basin Palaeozoic
strata (Fig. 3.11). Analogous meta-sediments radiometrically dated as Late Devonian in age are found at TD
on the conjugate North American margin in the COST GE-1 well (Poppe et al., 1995; Scholle, 1979). These
Palaeozoic sediments were widely distributed over the sutured African American continental margin (Sougy,
1962; Dillon & Sougy, 1974; Petters, 1979).
Syn-rift strata are inferred from seismic reflection data in the MSGBC basin (Tari et al., 2003), and by
comparison to similar sedimentary sequences exposed in neighbouring Central Atlantic basins (i.e. Morocco;
Davison, 2005; Pichel et al., 2019) and on the conjugate margin (Shipley et al., 1978). Late Triassic to Early
Jurassic continental clastics and salt were probably deposited in these rift graben systems, isolated by
basement highs into two mapped sub-basins: the Mauritania and Casamance salt basins. Salt has been
remobilised in both basins primarily into narrow, km-wide diapiric structures intruded into the overlying
sedimentary succession, drilled in offshore Casamance Maritime (CM) exploration wells, southern Senegal
and in Guinea Bissau. Conjugate syn-rift salt basins are predicted from tectonic reconstructions on the
American margin and occur further north in the Carolina Trough (Davison, 2005).
Early to Middle Jurassic post-rift strata are encountered in Senegalese exploration wells drilled close to the
paleo-shelf edge (i.e. DKM-2) consisting of interbedded micritic limestones, calcareous sandstones and marls
forming a carbonate platform with an oceanward escarpment margin (Casson et al., 2020b). The conjugate
is the Bahamas-Grand Banks carbonate platform and carbonate platforms are encountered surrounding the
Central Atlantic. Jurassic lacustrine/lagoonal shales located inboard of the escarpment margin are
postulated to be a source for the oil in the onshore Gadiaga and Diam Niado fields, based on biomarker
analysis (Carr et al., 2015; 2017).
Central Atlantic DSDP Sites
118
Argillaceous limestones (Cat Gap Formation) from DSDP Site 367 are the time-equivalent basinal sediments
to Jurassic carbonate platform. Observed terrestrial organic material in these sediments is indicative of
terrigenous input into the deep basin, suggesting Jurassic deltas were present along the continental margin.
This stratigraphy is not recorded at outcrop on Maio, where the oldest sediments are of Lower Valanginian
age, resting on oceanic crust pillow lavas (Casson et al., 2020a).
The middle Berriasian unconformity identified in this study at DSDP Site 367 (Fig. 3.3; Fig. 3.5) represents
the Jurassic-Cretaceous boundary. On the conjugate margin, in the Georgia Embayment and along the
remainder of the American margin to the north, the carbonate platforms were drowned at this time by
Berriasian and younger siliciclastic systems (drowning unconformity sensu Schlager, 1989), however across
the Blake Plateau and the Bahamas, carbonate platforms persisted through the Early Cretaceous (Poag,
1991). The carbonate platform survived until Aptian times in the MSGBC basin (Casson et al., 2020b). Pelagic
limestones of the Blake-Bahamas Formation accumulated in the deep basin across the Central Atlantic. DSDP
Site 367 and outcrops on Maio record an upward increase in marl interbeds, reflecting additional terrigenous
input. A recent appraisal well on the Yakaar discovery, northern Senegal (Kosmos Energy, 2019) hinted at
the occurrence of Aptian basin floor fan systems at this time.
The base Albian unconformity is interpreted to occur across the oceanic domain of the Central Atlantic and
is recorded at multiple locations as a hiatus spanning most of the Aptian. On Maio and at DSDP Site 367 Late
Barremian sediments are recorded below this event, bracketing the timing of the unconformity. The
overlying stratigraphy of the Hatteras Formation varies in age from Early Albian (DSDP Site 534A) to Late
Albian (DSDP Site 367). At this time, karstification of the most distal edge of the African carbonate platform
preceded the first major siliciclastic input (Martin et al., 2010; Casson et al., 2020b). Shelfal wells record fine-
grained sandstones and seismic geomorphology reveals a shelf edge delta prograded through the Albian
across the relict carbonate margin in many areas of the MSGBC basin, spilling sediment over the escarpment
margin to form base-of-slope fans (Casson et al., 2020b). In the deep basin, the equivalent stratigraphy
records thin distal turbidites, with observed plant debris within interbedded mudstones and an increase in
terrestrially derived organic matter (Core 24, DSDP Site 367 – Fig. 3.3; Fig. 3.4). We postulate that these
sediments were introduced into the deep basin by the Albian shelf-edge delta systems.
A latest Albian flooding surface is recognised around the Central Atlantic, transgressing the shelf, and coeval
with the onset of organic-rich sedimentation. Minor carbonate production on the transgressed Senegalese
shelf at this time is interspersed within siliciclastics (Br-1; Ti-1). At DSDP Site 367, the organic enrichment
ceases in the Late Cenomanian, whereas 580 km northwest at DSDP Site 368 enrichment prevails into the
Turonian. Jones et al. (2007) reveals through regional seismic mapping of the top of the black shale
sequence, the diachronous nature of the interval extending into the Campanian south of the Guinea Fracture
Zone. A progradational phase in the Late Cenomanian delivers siliciclastic sediment to basin floor fans
Chapter 3
119
encountered in Yakaar wells, through the palaeo-Senegal river system, inboard of DSDP Site 368. The
continental margin is transgressed at the Cenomanian-Turonian boundary and this is followed by the onset
of margin collapse observed offshore The Gambia (Casson et al., 2020b). Debris-rich lobes form at the base
of submarine canyons redepositing eroded carbonate material from the underlying platform. A regional
composite unconformity, with erosion restricted to the shelf edge, is established, bypassing sediment
throughout the remainder of the Late Cretaceous. Non-calcareous mudstones and siltstones of distal
turbidites, part of the Plantagenet Formation are recorded through DSDP sites 367 and 368 (Fig. 3.11). Late
Cretaceous sediments of this age are not present on Maio due to postulated volcanic uplift (or are not
exposed). Shallow marine sands prograded across the Senegalese shelf in the Campanian to Maastrichtian
period, observed at the Cap de Naze outcrop as stacked progradational para-sequences of shallow marine
sandstones and shelfal siltstones (Barusseau et al., 2009). Development of a base Tertiary unconformity at
the Cretaceous-Tertiary boundary is associated with a major relative sea-level fall (Shipley et al., 1978).
3.6.2 Regional Extent and Drivers of Major Unconformities
This study refines the timing and nature of key unconformities that have previously been documented to
occur elsewhere in the oceanic domain of the Central Atlantic during the drilling of many DSDP legs
(summarised in Jansa et al., 1978), and in subsequent stratigraphic studies (Müller et al., 1983; 1984; de
Graciansky et al., 1987). A summary of these events is provided below, capturing their regional distribution
and postulated drivers behind their formation.
Middle Berriasian unconformity - MBU
At DSDP Site 367, the MBU and Jurassic-Cretaceous (J/K) boundary is located between the Cat Gap (red
argillaceous limestone) and Blake-Bahama (white-grey limestone with marl) formations (Fig. 3.5). This
unconformity at DSDP Site 367 is reported for the first time in this publication based on the new high-
resolution biostratigraphy. The original interpretation (Lancelot et al., 1978a) reported from all the
stratigraphy from Core 32 to TD as Kimmeridgian and older. We now reveal the unconformity records a ca.
5 million-year hiatus between the Early Tithonian and middle Berriasian and is equivalent to seismo-
stratigraphic Horizon C recognised across the Central Atlantic (Jansa et al., 1979). The interval on the
Moroccan shelf is characterised by multiple hard ground surfaces (NARG obs.). The Cat Gap Formation
shares remarkably similar lithological characteristics to the ‘Rosso Ammonitico’ facies (sensu Farinacci &
Elmi, 1981), more precisely to the ‘Rosso ad Aptici’ sub-facies, i.e. the basinal facies with abundant chert and
marl (sensu Rossi, 1975). The Rosso Ammonitico facies is characterised by red pelagic limestones and marls,
the development of hard grounds, condensed sequences, and ferro-manganese nodules, typically deposited
over topographic highs (Cecca et al, 1992). This facies is pervasive in the Mediterranean Tethys, and occurs
throughout the Central Atlantic, recovered at other DSDP sites (100, 105; Hollister et al., 1972a; 1972b).
Central Atlantic DSDP Sites
120
There are no known occurrences of the Rosso Ammonitico in late Berriasian or younger stratigraphy; the
disappearance is associated with, (1) major paleoceanographic circulation changes establishing a connection
between the Tethys and Caribbean, (2) increase in biogenic (rapid diversification of calcareous
nannoplankton) and siliciclastic sediment supply, (3) thermal subsidence following the end of Central
Atlantic rifting, (4) North Atlantic breakup in the Iberia-Newfoundland segment (Cecca et al, 1992). Further
examination of the J/K boundary at DSDP Site 534A (Tremolada et al., 2006) implied a significant
temperature increase in surface waters through the interval. Without further investigation it is difficult to
pinpoint what process is generating this unconformity within the Central Atlantic, our primary model is this
is related to North Atlantic breakup within the Iberia-Newfoundland segment; Pereira & Alves (2011)
reported an unconformity of this age.
Base Albian unconformity - BAU
The base Albian unconformity (BAU) is inferred to be located within the 47.5 m core gap between intra Late
Albian dated Core 24 (Hatteras Formation) and Late Barremian dated Core 25 (Blake-Bahama Formation) at
DSDP Site 367 (Fig. 3.3). The occurrence of the BAU is supported by seismic interpretation that recognises
an unconformity at this stratigraphic level (Fig. 3.10). The BAU is recorded throughout the Central Atlantic
(Reflector sensu Jansa et al., 1979), and as interpreted in the re-evaluation of DSDP Site 534A between the
Early Albian dated Core 38 (Hatteras Formation) and the earliest Aptian – latest Barremian dated Core 42
(Blake-Bahama Formation). This event corresponds to a major lithological change between carbonate (pre-
BAU) and siliciclastic-prone deposition (Fig. 3.11; de Graciansky et al., 1981). Locally to DSDP Site 105, pre-
Reflector strata (Blake-Bahamas Formation) onlap onto a similar basement structure (swell) to that drilled
by DSDP Site 367 (Tucholke & Mountain, 1979). Stratigraphy onlapping the BAU is also observed at DSDP
Site 367 (Mourlot et al., 2018). The BAU forms an angular unconformity peneplaining up to 1 km of sediment
across the Demerara Rise, ca. 500 km to the southeast (Casson et al., 2020c). The pre-BAU stratigraphy is
heavily deformed creating a suite of compressional structures. Thrust faults and associated folding of pre-
BAU stratigraphy are observed along the full length of Fig. 3.9C, (ca. 250 km northwest of the Demerara
Rise), additionally, a tight anticlinal fold at the foot of the carbonate escarpment is interpreted along Fig.
3.9B. These compressional features are thought to be associated with this tectonic activity, highlighting the
widespread nature of the Equatorial Atlantic tectonic deformation. There is also a major margin collapse off
the Demerara Rise at this time and we interpret the collapse observed on Fig. 3.9C to be the equivalent on
the Guinea Plateau. The rejuvenated tectonism associated with Equatorial Atlantic break-up is postulated to
have far-field effects across the Central Atlantic, potentially leading to hiatus on paleo-highs within the basin
(i.e. at DSDP Site 367). De Graciansky et al. (1981) suggest this event (E1) is recorded throughout the Central
Atlantic, in a variety of depositional environments, from the shelf to deep basin.
Chapter 3
121
Hatteras-Plantagenet Formation boundary
A transitional boundary between the Hatteras (black shale) and Plantagenet (variegated clays) formations is
recorded in Core 17 at DSDP Site 367, observed as an upward decrease of dark black carbonaceous claystone
(Facies C; Fig. 3.4). Previous work (Herbin et al., 1986 and references therein) placed the Cenomanian-
Turonian boundary in Core 18, whereas we record Late Cenomanian stratigraphy throughout Core 17, 10.5
m shallower, suggesting DSDP Site 367 did not recover any Turonian-aged sediments, as Core 16 is assigned
a late Santonian age. This new age dating has implications for the timing, distribution and correlation of
organic-enrichment based on the 13C curve in the Central Atlantic. Around the Cenomanian-Turonian
boundary, a major marine transgression is recorded over the shelf and extending to the present-day onshore
Senegal basin, shifting depositional systems proximally (Mourlot et al., 2018). This transgression correlates
to the global eustatic sea-level rise (Haq et al., 2014). The new stratigraphic data does not support the
interpretation of a second stratigraphic gap (Event E2; de Graciansky et al., 1981) at DSDP Site 367, where
most of the Cenomanian-aged strata was interpreted to be absent. Our new dating shows a complete
Cenomanian succession equivalent to the Hatteras Formation from Core 17 to 21 (Fig. 3.3).
3.6.3 Seaward Dipping Reflector (SDR) Occurrence & Volcanism in the Central Atlantic
Based on the interpretation of one regional 2-D seismic reflection profile (Fig. 3.9), SDRs are reported for
the first time along the northwest African continental margin. The location of these newly discovered SDRs
is on trend (parallel) with the African Blake Spur magnetic anomaly (Fig. 3.1) further to the north beyond the
Cape Vert fracture zone. No evidence has been presented thus far for the occurrence of SDRs tied spatially
to the two magnetic anomalies along the northwest African continental margin (Davison, pers. comms.
2020). Further volcanism during early Central Atlantic seafloor spreading resulting in the formation of SDR
sequences is documented on the conjugate margins of northeast South America below the Demerara Rise
(Reuber et al., 2016) and North American Atlantic margin within the Carolina trough and Blake Plateau basin
(Oh et al., 1995). Hence the continental margins in the southern Central Atlantic can be classified as volcanic
margins. Basile et al. (2020) suggests this volcanism is a related to the Sierra Leone hotspot.
3.7 CONCLUSIONS
Re-investigating the cores of key DSDP sites drilled across the Central Atlantic using modern multi-discipline
biostratigraphic techniques has yielded an updated stratigraphic framework that improves the timing and
resolution, as well as the identification of key stratigraphic events. Specifically, in relation to the two African
DSDP sites, 367 and 368, this is the first new investigation that includes re-sampling to have been published
in the last 30 years. The stratigraphic framework developed in the oceanic domain is extended and
correlated with depositional systems in data from the northwest African continental margin. A well-
Central Atlantic DSDP Sites
122
constrained middle Berriasian unconformity is reported for the first time in Core 33 at DSDP Site 367, where
middle Berriasian white pelagic limestones (Blake-Bahama Formation) sit unconformably on Early Tithonian
red argillaceous limestones (Cat Gap Formation), indicating a ca. 5 Myr hiatus.
Organic content in the middle Berriasian to Late Barremian Blake-Bahamas Formation is recorded in isolated
marl horizons (cms-thick) with a terrestrial kerogen type that records total organic carbon content (TOC)
averaging 5% at DSDP Site 367. Seismic evidence indicates this package expands towards the carbonate
escarpment and hence may offer a prospective hydrocarbon source rock interval.
A major lithological change is recorded at DSDP Site 367 in the intra-Late Albian Core 24, where the facies
consists of variegated mudstones with abundant terrestrial detritus with a notable absence of any limestone
beds. A base Albian unconformity is inferred below this core at the boundary with the Hatteras Formation
(Barremian). Early-Middle Albian strata are interpreted onlapping the base Albian unconformity away from
Site 367, suggesting there was paleo-topography prior to Albian deposition. This unconformity is recorded
throughout the Central Atlantic postulated to be tectonically driven by far field stresses related to the
opening Equatorial Atlantic. This is evidenced by the re-evaluation of the corresponding interval
encountered at DSDP Site 534A, where Early Albian-aged sediments sit above this event, recognised on
seismic data previously as Reflector . A major margin collapse feature and evidence of compression, thrust
faulting and folding, is observed related to this tectonism from the Guinea Plateau to Senegal.
The onset of organic-rich sedimentation, and hence anoxic to dysoxic bottom-water conditions is well-dated
as occurring in the intra Late Albian at DSDP Site 367. Internal heterogeneity is observed between different
facies within this source rock interval that extends into the Late Cenomanian and earliest Turonian, in DSDP
Site 367 and 368 respectively. This indicates spatio-temporal changes in the cessation of anoxia along the
African margin. Dark black carbonaceous claystones have terrestrially-derived organic matter, whereas the
kerogen type is marine in origin within the light grey clayey nanno-fossil marlstone facies that record much
higher TOC values (up to 25%). Terrestrial organic matter is likely introduced by turbidity currents linked to
sediment input from shelf edge delta systems active on the African continental shelf.
The Late Cenomanian dark black laminated shales present in Core 18, DSDP Site 367, average 34% TOC,
time-equivalent to the global anoxic event, OAE-2. The organic-rich interval on the American margin is
truncated by a base Tertiary unconformity at DSDP Site 534A. Palynological dating of the non-calcareous
variegated clays of the overlying Plantagenet Formation span the remainder of the Late Cretaceous. A
transitional boundary is observed in Core 17, DSDP Site 367 suggesting the gradual cessation of anoxic
conditions within the oceanic domain, changes in sediment input and/or decrease in organic productivity.
In addition to the stratigraphic framework, evidence is presented for the occurrence of seaward dipping
reflectors (SDRs) northwest of the Guinea Plateau. SDRs have not been reported along this section of the

Chapter 3
123
African margin, demonstrating volcanicism during early seafloor spreading. There are similar volcanic
packages on the conjugate margins of the Central Atlantic indicating volcanic nature of this province during
early seafloor spreading.
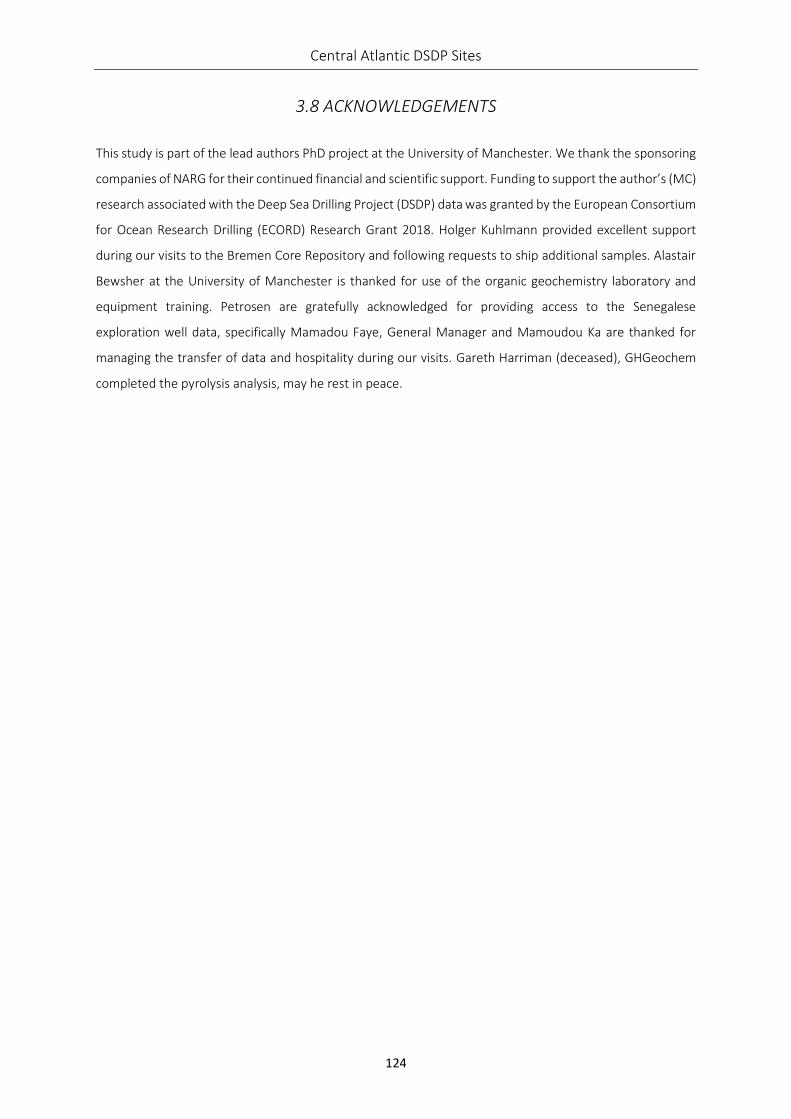
Central Atlantic DSDP Sites
124
3.8 ACKNOWLEDGEMENTS
This study is part of the lead authors PhD project at the University of Manchester. We thank the sponsoring
companies of NARG for their continued financial and scientific support. Funding to support the author’s (MC)
research associated with the Deep Sea Drilling Project (DSDP) data was granted by the European Consortium
for Ocean Research Drilling (ECORD) Research Grant 2018. Holger Kuhlmann provided excellent support
during our visits to the Bremen Core Repository and following requests to ship additional samples. Alastair
Bewsher at the University of Manchester is thanked for use of the organic geochemistry laboratory and
equipment training. Petrosen are gratefully acknowledged for providing access to the Senegalese
exploration well data, specifically Mamadou Faye, General Manager and Mamoudou Ka are thanked for
managing the transfer of data and hospitality during our visits. Gareth Harriman (deceased), GHGeochem
completed the pyrolysis analysis, may he rest in peace.
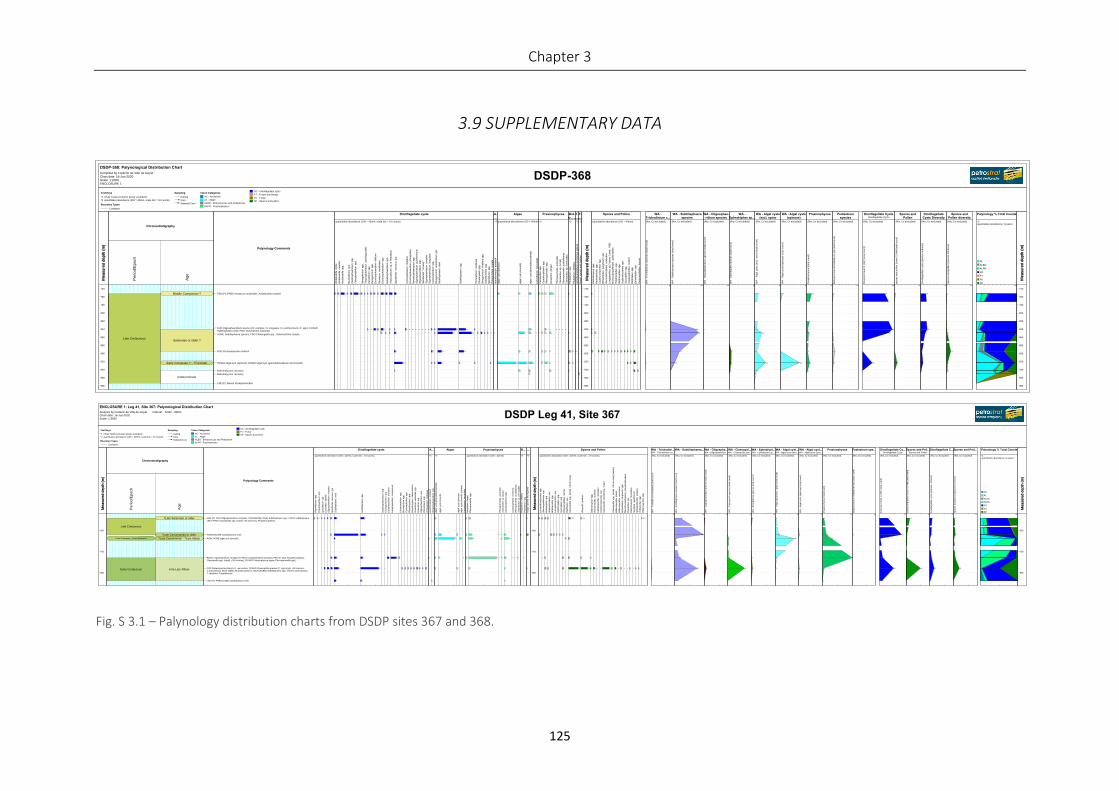
Chapter 3
125
3.9 SUPPLEMENTARY DATA
Fig. S 3.1 – Palynology distribution charts from DSDP sites 367 and 368.
DSDP-368DSDP-368: Palynological Distribution Chart
Compiled by Frederic de Ville de GoyetChart date: 16-Jun-2020Scale: 1:2000ENCLOSURE 1
*1quantitative abundance, % panel
SP
FU
FT
DC
ALPR
ALBO
AL
100
740
760
780
800
820
840
860
880
900
920
940
960
980
Me
asu
red d
ep
th (
m)
Late Cretaceous
Pe
rio
d/E
poch
Santonian or older ?
Indeterminate
Middle Campanian ?
Early Coniacian ? - ?Turonian
Ag
e
FSE (P): PRES Xenascus ceratioides, Andalusiella mauthei
FDO Oligosphaeridium species (O. complex, O. irregulare, O. pulcherrimum, O. spp.); FDSAO Subtilisphaera cheit; FDO Trichodinium castanea
ACME Subtilisphaera species; FDO Chatangiella spp., Odontochitina costata
FDO Cretacaeiporites mullerii
FDSAO algal cyst (spinose); FDSAO algal cyst (granulate/scabrate and smooth)
Extremely poor recovery.
Extremely poor recovery.
LSE (P): Barren of palynomorphs
quantitative abundance (100 = 40mm, scale tick = 10 counts)
2 2 11 1 4 13 2 1 1
1
2
+
2
6
1
1
8
7
1
5
1
9
1
1
6
1
5
4
26
1
2 + + + + + +
+
+
+
2
3
1
1
1
1
57
46
12
11
21
39
15
1
1
1
1 3 1 1 +
1
*2
+
quantitative abundance (100 = 40mm)
5
58
2
17
2
23
3
6
5
4
2
11
3
1
+
*2
2
+
2
1
1
1
1
3
1
1
7
10
+
4
1
1
3
+ + +
+
+
+
*2
2
1
6
3
1
1
1
*2
1
*2
1
740
760
780
800
820
840
860
880
900
920
940
960
980
Me
asu
red d
ep
th (
m)
quantitative abundance (100 = 40mm)
1
1
1
2
1
2 4 1 1 1 1 1 1 2 2
2
1
1
3
6
3 1
(Rw, Cv excluded)
WA
- T
richo
din
ium
casta
nea
(to
tal count)
80
1
1
(Rw, Cv excluded)
WA
- S
ub
tilis
ph
ae
ra s
pe
cie
s (
tota
l coun
t)
100
78
85
27
12
(Rw, Cv excluded)
WA
- O
ligosph
ae
rid
ium
sp
ecie
s (
tota
l co
unt)
80
+
+
(Rw, Cv excluded)
WA
- E
ph
ed
ripite
s s
pecie
s (
tota
l coun
t)
80
7
6
3
(Rw, Cv excluded)
WA
-
Alg
al cysts
(excl. s
pin
o (
tota
l co
unt)
80
8
5
21
4
34
6
1
(Rw, Cv excluded)
WA
- A
lga
l cysts
(sp
inose)
(tota
l co
un
t)
80
5
58
(Rw, Cv excluded)
Pra
sin
oph
yce
a (
tota
l coun
t)
80
15
3
6
3
9
3
(Rw, Cv excluded)
Bo
tryococcus &
Ped
iastr
um
spp
(to
tal cou
nt)
80
2
1
7
4
1
(Rw, Cv excluded)
Din
ocyst
Co
unt 1 (
AM
) (t
ota
l cou
nt)
100
69
92
80
30
(Rw, Cv excluded)
spore
s a
nd
po
llen
(cou
nt
1)
AM
(to
tal co
un
t)
80
1
7
(Rw, Cv excluded)
Din
ofla
gella
te c
ysts
(spe
cie
s r
ich
ne
ss)
80
16
20
14
4
7
1
(Rw, Cv excluded)
Sp
ore
s a
nd p
olle
n (
sp
ecie
s r
ichn
ess)
80
1
1
2
13
3
2
740
760
780
800
820
840
860
880
900
920
940
960
980
Me
asu
red d
ep
th (
m)
Me
asu
red d
ep
th (
m)
Chronostratigraphy
Palynology Comments
Dinoflagellate cysts A-...
Algae Prasinophycea Bot-ry......
T-......
F-......
Me
asu
red d
ep
th (
m)
Spores and Pollen WA -Trichodinium c...
WA - Subtilisphaeraspecies
WA - Oligosphae-ridium species
WA -Ephedripites sp...
WA - Algal cysts(excl. spino
WA - Algal cysts(spinose)
Prasinophycea Pediastrumspecies
Dinoflagellate CystsDinoflagellate Cysts
Spores andPollen
DinoflagellateCysts Diversity
Spores andPollen diversity
Palynology % Total Counts
Me
asu
red d
ep
th (
m)
Text Keys
*1 ('Paly Totals exclusion group' excluded)
*2 quantitative abundance (100 = 40mm, scale tick = 10 counts)
Boundary Types
Confident
Sampling
Cutting
Core
Sidewall Core
Taxon Categories
AC - Acritarchs
AL - Algae
ALBO - Botryococcus and Pediastrum
ALPR - Prasinophycea
DC - Dinoflagellate cysts
FT - Foram test linings
FU - Fungi
SP - Spores and pollen
DSDP Leg 41, Site 367ENCLOSURE 1: Leg 41, Site 367: Palynological Distribution Chart
Analysis by Frederic de Ville de GoyetChart date: 16-Jun-2020Scale: 1:3500
Interval: 520m - 860m
*1quantitative abundance, % panel
SP
FU
DC
ALPR
ALBO
AL
AC
100
600
700
800
Me
asu
red
de
pth
(m
)
Late Cretaceous
Early Cretaceous
?Late Cretaceous - ?Early Cretaceous
Peri
od
/Epo
ch
intra-Late Albian
?Late Santonian or older
?Late Cenomanian or older
?Late Cenomanian - ?Late Albian
Age
FSE (P): FDO Oligosphaeridium complex; FDAO/ACME (TNS) Subtilisphaera spp.; FDCO subtilisphaera cheit; PRES Classopollis spp. (small, <30 microns), Afropollis jardinus
FDSAO/ACME Subtilisphaera cheit
AOM; ACME algal cyst (smooth)
FDAO Litosphaeridium conispinum; FDO Litosphaeridium arundum; FDO (in situ) Afropollis jardinus, Classopollis spp. (small, <30 microns); FDSAO Prasinophycea algae (Pterospermellla spp.)
FDO Elaterosporites klaszii, E. verrucatus; FDSAO Classopollis species (C. spp.small, <30 microns, C.brasiliensis); INCR (ABN) Afropollis jardinus; INCR (SABN) Subtilisphaera spp.; FDO D.tuberculatum, T.castanea, S.agadirensis
LSE (P): PRES (CMN) Subtilisphaera cheit
quantitative abundance (100 = 40mm, scale tick = 10 counts)
1 ? 1 ? 1 1
3
2
6
2
1
3
5
8
81
3
8
15
6
12
17
7
61
3
1 1
+
6 19 1
1 1 1 1 1 3 1 1 2
*2
1
1
1
*2
3
2
8
2
2
8
53
2
1
1
4
+
quantitative abundance (100 = 40mm)
1
1
2
4
9
12
92
2
+
+
+
2
1
3
15
5
2
1
+ + 1
*2
2
+
*2
1
7
1
600
700
800
Me
asu
red
de
pth
(m
)
quantitative abundance (100 = 40mm, scale tick = 10 counts)
1
1
1
+
2
1
2
1
1
2 1 1 1 1
2
2
1
6 Rw
2
2
33
1 Rw
1
23
1
2 5 + + 23 1 4 + 1 + + 1 + 1 1
1 Rw ?
(Rw, Cv excluded)
WA
- T
richo
din
ium
casta
nea (
tota
l cou
nt)
80
2
(Rw, Cv excluded)
WA
- S
ub
tilis
ph
aera
specie
s (
tota
l co
unt)
100
20
98
3
15
76
9
(Rw, Cv excluded)
WA
- O
ligosph
ae
rid
ium
spe
cie
s (
tota
l co
unt)
80
2
7
(Rw, Cv excluded)
WA
- C
lassop
olli
s s
pecie
s (
tota
l cou
nt)
80
2
2
57
(Rw, Cv excluded)
WA
- E
ph
ed
rip
ites s
pecie
s (
tota
l co
un
t)
80
2
1
3
(Rw, Cv excluded)
WA
- A
lgal cysts
(excl. s
pin
o (
tota
l count)
80
3
10
65
4
2
(Rw, Cv excluded)
WA
- A
lgal cysts
(sp
inose)
(tota
l co
unt)
80
1
1
(Rw, Cv excluded)
Pra
sin
op
hyce
a (
tota
l co
un
t)
100
5
13
29
101
4
1
(Rw, Cv excluded)
Botr
yoco
ccus &
Ped
iastr
um
sp
p (
tota
l co
un
t)
80
2
+
(Rw, Cv excluded)
Din
ocyst C
oun
t 1 (
AM
) (t
ota
l cou
nt)
90
28
75
3
11
48
9
(Rw, Cv excluded)
spo
res a
nd
po
llen
(cou
nt 1
) A
M (
tota
l coun
t)
80
13
3
3
2
49
(Rw, Cv excluded)
Din
ofla
ge
llate
cysts
(spe
cie
s r
ichn
ess)
80
8 ?
5
1
6
15
2
(Rw, Cv excluded)
Spo
res a
nd p
olle
n (
sp
ecie
s r
ichn
ess)
80
4
6
2
6
20
600
700
800
Me
asu
red
de
pth
(m
)
Me
asu
red
de
pth
(m
)
Chronostratigraphy
Palynology Comments
Dinoflagellate cysts A... Algae Prasinophycea B... ...
Me
asu
red
de
pth
(m
)
Spores and Pollen WA - Trichodini...WA - Trichodinium ca...
WA - Subtilisphaera... WA - Oligospha...WA - Oligosphaeridiu...
WA - Classopol...WA - Classopollis spe...
WA - Ephedripit...WA - Ephedripites sp...
WA - Algal cyst...WA - Algal cysts (excl...
WA - Algal cyst...WA - Algal cysts (spin...
Prasinophycea Pediastrum spe... Dinoflagellate Cy...Dinoflagellate Cysts
Spores and Poll...Spores and Pollen
Dinoflagellate C...Spores and Poll... Palynology % Total Counts
Me
asu
red
de
pth
(m
)
Text Keys
*1 ('Paly Totals exclusion group' excluded)
*2 quantitative abundance (100 = 40mm, scale tick = 10 counts)
Boundary Types
Confident
Sampling
Cutting
Core
Sidewall Core
Taxon Categories
AC - Acritarchs
AL - Algae
ALBO - Botryococcus and Pediastrum
ALPR - Prasinophycea
DC - Dinoflagellate cysts
FU - Fungi
SP - Spores and pollen
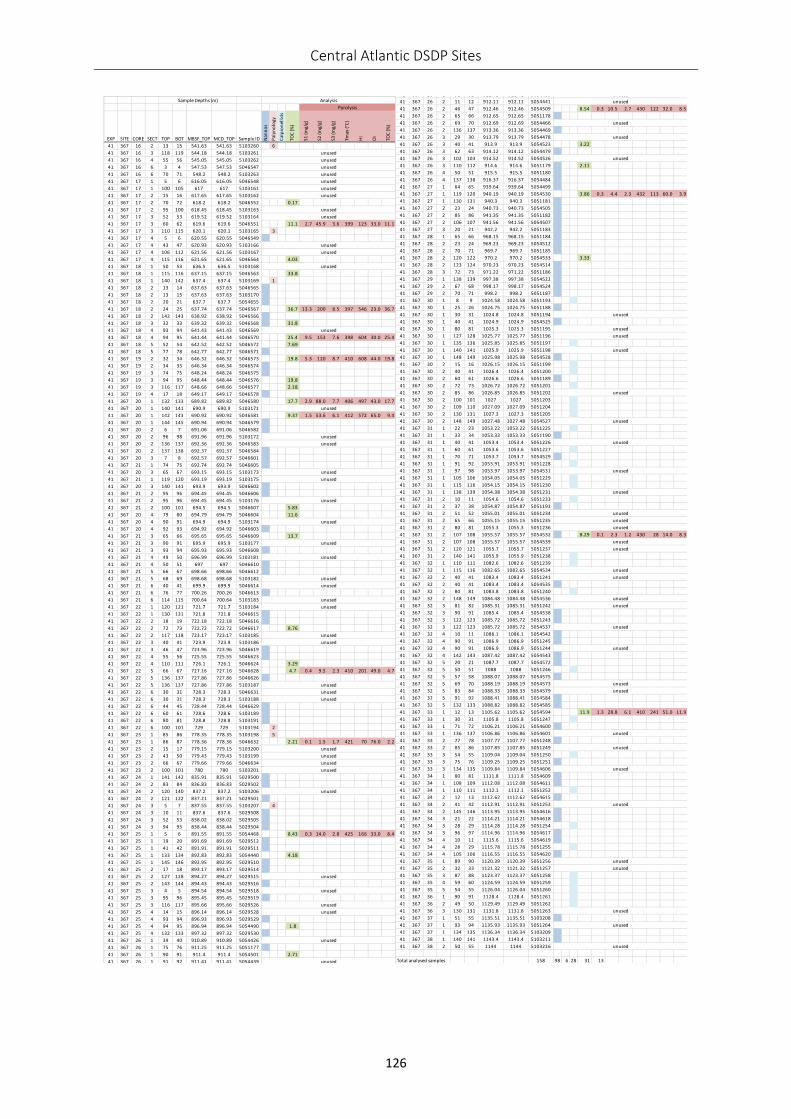
Central Atlantic DSDP Sites
126
EXP SITE CORE SECT TOP BOT MBSF_TOP MCD_TOP Sample ID Nan
no
s
Pal
yno
logy
Cal
pio
nel
lid
s
TOC
(%)
S1 (m
g/g)
S2 (m
g/g)
S3 (m
g/g)
Tmax
(°C
)
HI
OI
TOC
(%)
41 367 16 2 13 15 541.63 541.63 5103260 6
41 367 16 3 118 119 544.18 544.18 5103261
41 367 16 4 55 56 545.05 545.05 5103262
41 367 16 6 3 4 547.53 547.53 5046547
41 367 16 6 70 71 548.2 548.2 5103263
41 367 17 1 5 6 616.05 616.05 5046548
41 367 17 1 100 105 617 617 5103161
41 367 17 2 15 16 617.65 617.65 5103162
41 367 17 2 70 72 618.2 618.2 5046552 0.17
41 367 17 2 95 100 618.45 618.45 5103163
41 367 17 3 52 53 619.52 619.52 5103164
41 367 17 3 60 62 619.6 619.6 5046551 11.1 2.7 45.9 3.6 399 123 33.0 11.1
41 367 17 3 110 115 620.1 620.1 5103165 3
41 367 17 4 5 6 620.55 620.55 5046549
41 367 17 4 43 47 620.93 620.93 5103166
41 367 17 4 106 112 621.56 621.56 5103167
41 367 17 4 115 116 621.65 621.65 5046564 4.03
41 367 18 1 50 53 636.5 636.5 5103168
41 367 18 1 115 116 637.15 637.15 5046563 33.8
41 367 18 1 140 142 637.4 637.4 5103169 1
41 367 18 2 13 14 637.63 637.63 5046565
41 367 18 2 13 15 637.63 637.63 5103170
41 367 18 2 20 21 637.7 637.7 5054655
41 367 18 2 24 25 637.74 637.74 5046567 36.7 13.3 200 8.5 397 546 23.0 36.7
41 367 18 2 142 143 638.92 638.92 5046566
41 367 18 3 32 33 639.32 639.32 5046568 31.8
41 367 18 4 93 94 641.43 641.43 5046569
41 367 18 4 94 95 641.44 641.44 5046570 25.4 9.5 153 7.6 398 604 30.0 25.4
41 367 18 5 52 54 642.52 642.52 5046572 7.69
41 367 18 5 77 78 642.77 642.77 5046571
41 367 19 2 32 34 646.32 646.32 5046573 19.8 5.3 120 8.7 410 608 44.0 19.8
41 367 19 2 34 35 646.34 646.34 5046574
41 367 19 3 74 75 648.24 648.24 5046575
41 367 19 3 94 95 648.44 648.44 5046576 19.8
41 367 19 3 116 117 648.66 648.66 5046577 2.18
41 367 19 4 17 18 649.17 649.17 5046578
41 367 20 1 132 133 689.82 689.82 5046580 17.7 2.9 88.0 7.7 406 497 43.0 17.7
41 367 20 1 140 141 690.9 690.9 5103171
41 367 20 1 142 143 690.92 690.92 5046581 9.37 1.5 53.6 6.1 412 572 65.0 9.4
41 367 20 1 144 145 690.94 690.94 5046579
41 367 20 2 6 7 691.06 691.06 5046582
41 367 20 2 96 98 691.96 691.96 5103172
41 367 20 2 136 137 692.36 692.36 5046583
41 367 20 2 137 138 692.37 692.37 5046584
41 367 20 3 7 8 692.57 692.57 5046601
41 367 21 1 74 75 692.74 692.74 5046605
41 367 20 3 65 67 693.15 693.15 5103173
41 367 21 1 119 120 693.19 693.19 5103175
41 367 20 3 140 141 693.9 693.9 5046602
41 367 21 2 95 96 694.45 694.45 5046606
41 367 21 2 95 96 694.45 694.45 5103176
41 367 21 2 100 101 694.5 694.5 5046607 5.83
41 367 20 4 79 80 694.79 694.79 5046604 11.6
41 367 20 4 90 91 694.9 694.9 5103174
41 367 20 4 92 93 694.92 694.92 5046603
41 367 21 3 65 66 695.65 695.65 5046609 13.7
41 367 21 3 90 91 695.9 695.9 5103177
41 367 21 3 93 94 695.93 695.93 5046608
41 367 21 4 49 50 696.99 696.99 5103181
41 367 21 4 50 51 697 697 5046610
41 367 21 5 66 67 698.66 698.66 5046612
41 367 21 5 68 69 698.68 698.68 5103182
41 367 21 6 40 41 699.9 699.9 5046614
41 367 21 6 76 77 700.26 700.26 5046613
41 367 21 6 114 115 700.64 700.64 5103183
41 367 22 1 120 121 721.7 721.7 5103184
41 367 22 1 130 131 721.8 721.8 5046615
41 367 22 2 18 19 722.18 722.18 5046616
41 367 22 2 72 73 722.72 722.72 5046617 8.76
41 367 22 2 117 118 723.17 723.17 5103185
41 367 22 3 40 41 723.9 723.9 5103186
41 367 22 3 46 47 723.96 723.96 5046619
41 367 22 4 55 56 725.55 725.55 5046623
41 367 22 4 110 111 726.1 726.1 5046624 3.29
41 367 22 5 66 67 727.16 727.16 5046628 4.7 0.4 9.5 2.3 410 201 49.0 4.7
41 367 22 5 136 137 727.86 727.86 5046626
41 367 22 5 136 137 727.86 727.86 5103187
41 367 22 6 30 31 728.3 728.3 5046631
41 367 22 6 30 31 728.3 728.3 5103188
41 367 22 6 44 45 728.44 728.44 5046629
41 367 22 6 60 61 728.6 728.6 5103189
41 367 22 6 80 81 728.8 728.8 5103191
41 367 22 6 100 101 729 729 5103194 2
41 367 23 1 85 86 778.35 778.35 5103198 5
41 367 23 1 86 87 778.36 778.36 5046632 2.21 0.1 1.5 1.7 421 70 76.0 2.2
41 367 23 2 15 17 779.15 779.15 5103200
41 367 23 2 43 50 779.43 779.43 5103199
41 367 23 2 66 67 779.66 779.66 5046634
41 367 23 2 100 101 780 780 5103201
41 367 24 1 141 142 835.91 835.91 5029500
41 367 24 2 83 84 836.83 836.83 5029502
41 367 24 2 120 140 837.2 837.2 5103206
41 367 24 2 121 122 837.21 837.21 5029501
41 367 24 3 5 7 837.55 837.55 5103207 4
41 367 24 3 10 11 837.6 837.6 5029508
41 367 24 3 52 53 838.02 838.02 5029505
41 367 24 3 94 95 838.44 838.44 5029504
41 367 25 1 5 6 891.55 891.55 5054468 8.43 0.3 14.0 2.8 425 166 33.0 8.4
41 367 25 1 19 20 891.69 891.69 5029512
41 367 25 1 41 42 891.91 891.91 5029511
41 367 25 1 133 134 892.83 892.83 5054440 4.18
41 367 25 1 145 146 892.95 892.95 5029510
41 367 25 2 17 18 893.17 893.17 5029514
41 367 25 2 127 128 894.27 894.27 5029515
41 367 25 2 143 144 894.43 894.43 5029516
41 367 25 3 4 5 894.54 894.54 5029518
41 367 25 3 95 96 895.45 895.45 5029519
41 367 25 3 116 117 895.66 895.66 5029526
41 367 25 4 14 15 896.14 896.14 5029528
41 367 25 4 93 94 896.93 896.93 5029529
41 367 25 4 94 95 896.94 896.94 5054490 1.8
41 367 25 4 132 133 897.32 897.32 5029530
41 367 26 1 39 40 910.89 910.89 5054426
41 367 26 1 75 76 911.25 911.25 5051177
41 367 26 1 90 91 911.4 911.4 5054501 2.71
41 367 26 1 91 92 911.41 911.41 5054439
41 367 26 2 11 12 912.11 912.11 5054441
41 367 26 2 46 47 912.46 912.46 5054509 8.54 0.3 10.5 2.7 430 122 32.0 8.5
41 367 26 2 65 66 912.65 912.65 5051178
41 367 26 2 69 70 912.69 912.69 5054466
41 367 26 2 136 137 913.36 913.36 5054469
41 367 26 3 29 30 913.79 913.79 5054478
41 367 26 3 40 41 913.9 913.9 5054523 3.22
41 367 26 3 62 63 914.12 914.12 5054479
41 367 26 3 102 103 914.52 914.52 5054526
41 367 26 3 110 112 914.6 914.6 5051179 2.11
41 367 26 4 50 51 915.5 915.5 5051180
41 367 26 4 137 138 916.37 916.37 5054484
41 367 27 1 64 65 939.64 939.64 5054499
41 367 27 1 119 120 940.19 940.19 5054530 3.86 0.3 4.4 2.3 432 113 60.0 3.9
41 367 27 1 130 131 940.3 940.3 5051181
41 367 27 2 23 24 940.73 940.73 5054505
41 367 27 2 85 86 941.35 941.35 5051182
41 367 27 2 106 107 941.56 941.56 5054507
41 367 27 3 20 21 942.2 942.2 5051183
41 367 28 1 65 66 968.15 968.15 5051184
41 367 28 2 23 24 969.23 969.23 5054512
41 367 28 2 70 71 969.7 969.7 5051185
41 367 28 2 120 122 970.2 970.2 5054533 3.33
41 367 28 2 123 124 970.23 970.23 5054514
41 367 28 3 72 73 971.22 971.22 5051186
41 367 29 1 138 139 997.38 997.38 5054522
41 367 29 2 67 68 998.17 998.17 5054524
41 367 29 2 70 71 998.2 998.2 5051187
41 367 30 1 8 9 1024.58 1024.58 5051193
41 367 30 1 25 26 1024.75 1024.75 5051188
41 367 30 1 30 31 1024.8 1024.8 5051194
41 367 30 1 40 41 1024.9 1024.9 5054525
41 367 30 1 80 81 1025.3 1025.3 5051195
41 367 30 1 127 128 1025.77 1025.77 5051196
41 367 30 1 135 136 1025.85 1025.85 5051197
41 367 30 1 140 141 1025.9 1025.9 5051198
41 367 30 1 148 149 1025.98 1025.98 5054528
41 367 30 2 15 16 1026.15 1026.15 5051199
41 367 30 2 40 41 1026.4 1026.4 5051200
41 367 30 2 60 61 1026.6 1026.6 5051189
41 367 30 2 72 73 1026.72 1026.72 5051201
41 367 30 2 85 86 1026.85 1026.85 5051202
41 367 30 2 100 101 1027 1027 5051203
41 367 30 2 109 110 1027.09 1027.09 5051204
41 367 30 2 130 131 1027.3 1027.3 5051205
41 367 30 2 148 149 1027.48 1027.48 5054527
41 367 31 1 22 23 1053.22 1053.22 5051225
41 367 31 1 33 34 1053.33 1053.33 5051190
41 367 31 1 40 41 1053.4 1053.4 5051226
41 367 31 1 60 61 1053.6 1053.6 5051227
41 367 31 1 70 71 1053.7 1053.7 5054529
41 367 31 1 91 92 1053.91 1053.91 5051228
41 367 31 1 97 98 1053.97 1053.97 5054531
41 367 31 1 105 106 1054.05 1054.05 5051229
41 367 31 1 115 116 1054.15 1054.15 5051230
41 367 31 1 138 139 1054.38 1054.38 5051231
41 367 31 2 10 11 1054.6 1054.6 5051233
41 367 31 2 37 38 1054.87 1054.87 5051191
41 367 31 2 51 52 1055.01 1055.01 5051234
41 367 31 2 65 66 1055.15 1055.15 5051235
41 367 31 2 80 81 1055.3 1055.3 5051236
41 367 31 2 107 108 1055.57 1055.57 5054532 8.29 0.1 2.3 1.2 430 28 14.0 8.3
41 367 31 2 107 108 1055.57 1055.57 5054539
41 367 31 2 120 121 1055.7 1055.7 5051237
41 367 31 2 140 141 1055.9 1055.9 5051238
41 367 32 1 110 111 1082.6 1082.6 5051239
41 367 32 1 115 116 1082.65 1082.65 5054534
41 367 32 2 40 41 1083.4 1083.4 5051241
41 367 32 2 40 41 1083.4 1083.4 5054535
41 367 32 2 80 81 1083.8 1083.8 5051240
41 367 32 2 148 149 1084.48 1084.48 5054536
41 367 32 3 81 82 1085.31 1085.31 5051242
41 367 32 3 90 91 1085.4 1085.4 5054538
41 367 32 3 122 123 1085.72 1085.72 5051243
41 367 32 3 122 123 1085.72 1085.72 5054537
41 367 32 4 10 11 1086.1 1086.1 5054542
41 367 32 4 90 91 1086.9 1086.9 5051245
41 367 32 4 90 91 1086.9 1086.9 5051244
41 367 32 4 142 143 1087.42 1087.42 5054543
41 367 32 5 20 21 1087.7 1087.7 5054572
41 367 32 5 50 51 1088 1088 5051246
41 367 32 5 57 58 1088.07 1088.07 5054575
41 367 32 5 69 70 1088.19 1088.19 5054573
41 367 32 5 83 84 1088.33 1088.33 5054579
41 367 32 5 91 92 1088.41 1088.41 5054584
41 367 32 5 132 133 1088.82 1088.82 5054585
41 367 33 1 12 13 1105.62 1105.62 5054594 11.9 1.3 28.8 6.1 410 241 51.0 11.9
41 367 33 1 30 31 1105.8 1105.8 5051247
41 367 33 1 71 72 1106.21 1106.21 5054600
41 367 33 1 136 137 1106.86 1106.86 5054601
41 367 33 2 77 78 1107.77 1107.77 5051248
41 367 33 2 85 86 1107.85 1107.85 5051249
41 367 33 3 54 55 1109.04 1109.04 5051250
41 367 33 3 75 76 1109.25 1109.25 5051251
41 367 33 3 134 135 1109.84 1109.84 5054606
41 367 34 1 80 81 1111.8 1111.8 5054609
41 367 34 1 108 109 1112.08 1112.08 5054611
41 367 34 1 110 111 1112.1 1112.1 5051252
41 367 34 2 12 13 1112.62 1112.62 5054615
41 367 34 2 41 42 1112.91 1112.91 5051253
41 367 34 2 145 146 1113.95 1113.95 5054616
41 367 34 3 21 22 1114.21 1114.21 5054618
41 367 34 3 28 29 1114.28 1114.28 5051254
41 367 34 3 96 97 1114.96 1114.96 5054617
41 367 34 4 10 11 1115.6 1115.6 5054619
41 367 34 4 28 29 1115.78 1115.78 5051255
41 367 34 4 105 106 1116.55 1116.55 5054620
41 367 35 1 89 90 1120.39 1120.39 5051256
41 367 35 2 32 33 1121.32 1121.32 5051257
41 367 35 3 87 88 1123.37 1123.37 5051258
41 367 35 4 59 60 1124.59 1124.59 5051259
41 367 35 5 54 55 1126.04 1126.04 5051260
41 367 36 1 90 91 1128.4 1128.4 5051261
41 367 36 2 49 50 1129.49 1129.49 5051262
41 367 36 3 130 131 1131.8 1131.8 5051263
41 367 37 1 51 55 1135.51 1135.51 5103208
41 367 37 1 93 94 1135.93 1135.93 5051264
41 367 37 1 134 135 1136.34 1136.34 5103209
41 367 38 1 140 141 1143.4 1143.4 5103211
41 367 38 2 50 55 1144 1144 5103216
Total analysed samples 158 98 6 28 31 13
unused
unused
unused
unused
unused
unused
unused
unused
unused
unused
unused
unused
unused
unused
unused
unused
unused
unused
unused
unused
unused
unused
unused
unused
unused
unused
unused
unused
unused
unused
unused
unused
unused
unused
unused
unused
unused
unused
unused
unused
unused
unused
unused
unused
unused
unused
unused
unused
unused
unused
unused
unused
unused
unused
unused
unused
unused
unused
unused
unused
unused
unused
unused
unused
unused
unused
unused
unused
unused
unused
unused
unused
unused
unused
unused
Sample Depths (m) Analysis
Pyrolysis
unused
unused
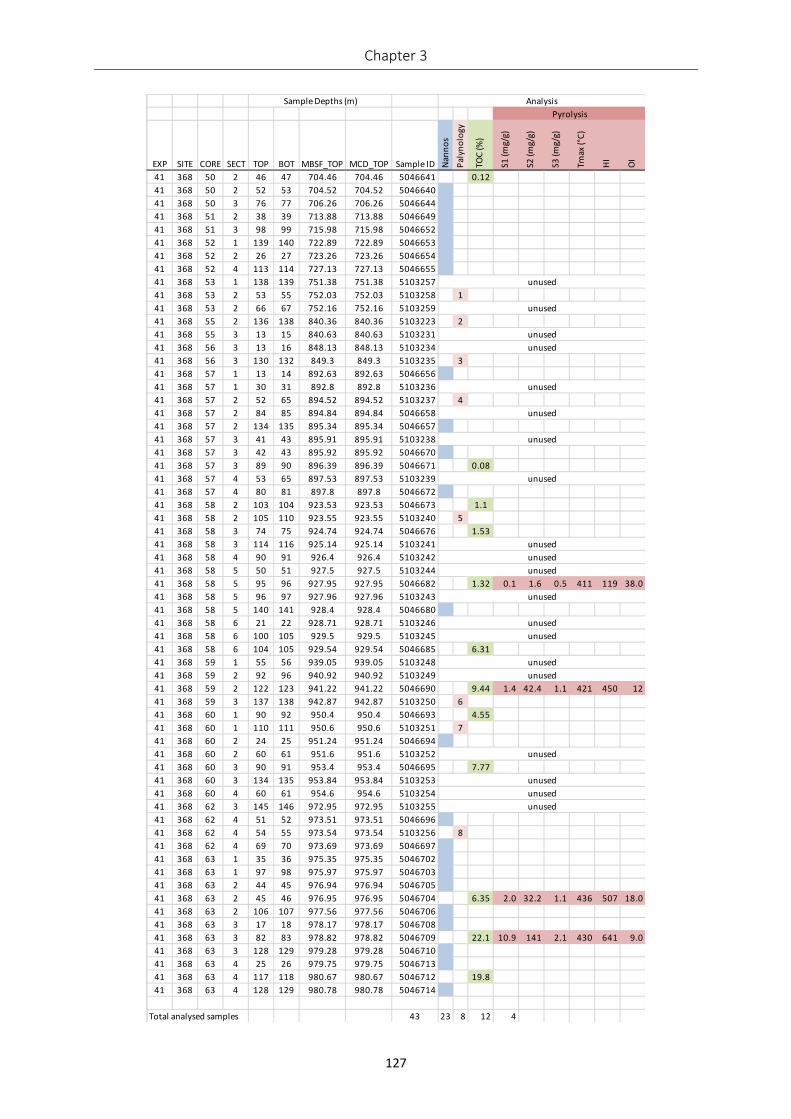
Chapter 3
127
EXP SITE CORE SECT TOP BOT MBSF_TOP MCD_TOP Sample ID Nan
no
s
Pal
yno
logy
TOC
(%)
S1 (m
g/g)
S2 (m
g/g)
S3 (m
g/g)
Tmax
(°C
)
HI
OI
41 368 50 2 46 47 704.46 704.46 5046641 0.12
41 368 50 2 52 53 704.52 704.52 5046640
41 368 50 3 76 77 706.26 706.26 5046644
41 368 51 2 38 39 713.88 713.88 5046649
41 368 51 3 98 99 715.98 715.98 5046652
41 368 52 1 139 140 722.89 722.89 5046653
41 368 52 2 26 27 723.26 723.26 5046654
41 368 52 4 113 114 727.13 727.13 5046655
41 368 53 1 138 139 751.38 751.38 5103257
41 368 53 2 53 55 752.03 752.03 5103258 1
41 368 53 2 66 67 752.16 752.16 5103259
41 368 55 2 136 138 840.36 840.36 5103223 2
41 368 55 3 13 15 840.63 840.63 5103231
41 368 56 3 13 16 848.13 848.13 5103234
41 368 56 3 130 132 849.3 849.3 5103235 3
41 368 57 1 13 14 892.63 892.63 5046656
41 368 57 1 30 31 892.8 892.8 5103236
41 368 57 2 52 65 894.52 894.52 5103237 4
41 368 57 2 84 85 894.84 894.84 5046658
41 368 57 2 134 135 895.34 895.34 5046657
41 368 57 3 41 43 895.91 895.91 5103238
41 368 57 3 42 43 895.92 895.92 5046670
41 368 57 3 89 90 896.39 896.39 5046671 0.08
41 368 57 4 53 65 897.53 897.53 5103239
41 368 57 4 80 81 897.8 897.8 5046672
41 368 58 2 103 104 923.53 923.53 5046673 1.1
41 368 58 2 105 110 923.55 923.55 5103240 5
41 368 58 3 74 75 924.74 924.74 5046676 1.53
41 368 58 3 114 116 925.14 925.14 5103241
41 368 58 4 90 91 926.4 926.4 5103242
41 368 58 5 50 51 927.5 927.5 5103244
41 368 58 5 95 96 927.95 927.95 5046682 1.32 0.1 1.6 0.5 411 119 38.0
41 368 58 5 96 97 927.96 927.96 5103243
41 368 58 5 140 141 928.4 928.4 5046680
41 368 58 6 21 22 928.71 928.71 5103246
41 368 58 6 100 105 929.5 929.5 5103245
41 368 58 6 104 105 929.54 929.54 5046685 6.31
41 368 59 1 55 56 939.05 939.05 5103248
41 368 59 2 92 96 940.92 940.92 5103249
41 368 59 2 122 123 941.22 941.22 5046690 9.44 1.4 42.4 1.1 421 450 12
41 368 59 3 137 138 942.87 942.87 5103250 6
41 368 60 1 90 92 950.4 950.4 5046693 4.55
41 368 60 1 110 111 950.6 950.6 5103251 7
41 368 60 2 24 25 951.24 951.24 5046694
41 368 60 2 60 61 951.6 951.6 5103252
41 368 60 3 90 91 953.4 953.4 5046695 7.77
41 368 60 3 134 135 953.84 953.84 5103253
41 368 60 4 60 61 954.6 954.6 5103254
41 368 62 3 145 146 972.95 972.95 5103255
41 368 62 4 51 52 973.51 973.51 5046696
41 368 62 4 54 55 973.54 973.54 5103256 8
41 368 62 4 69 70 973.69 973.69 5046697
41 368 63 1 35 36 975.35 975.35 5046702
41 368 63 1 97 98 975.97 975.97 5046703
41 368 63 2 44 45 976.94 976.94 5046705
41 368 63 2 45 46 976.95 976.95 5046704 6.35 2.0 32.2 1.1 436 507 18.0
41 368 63 2 106 107 977.56 977.56 5046706
41 368 63 3 17 18 978.17 978.17 5046708
41 368 63 3 82 83 978.82 978.82 5046709 22.1 10.9 141 2.1 430 641 9.0
41 368 63 3 128 129 979.28 979.28 5046710
41 368 63 4 25 26 979.75 979.75 5046713
41 368 63 4 117 118 980.67 980.67 5046712 19.8
41 368 63 4 128 129 980.78 980.78 5046714
Total analysed samples 43 23 8 12 4
unused
unused
unused
unused
unused
unused
unused
unused
unused
unused
unused
unused
unused
Sample Depths (m) Analysis
Pyrolysis
unused
unused
unused
unused
unused
unused
unused
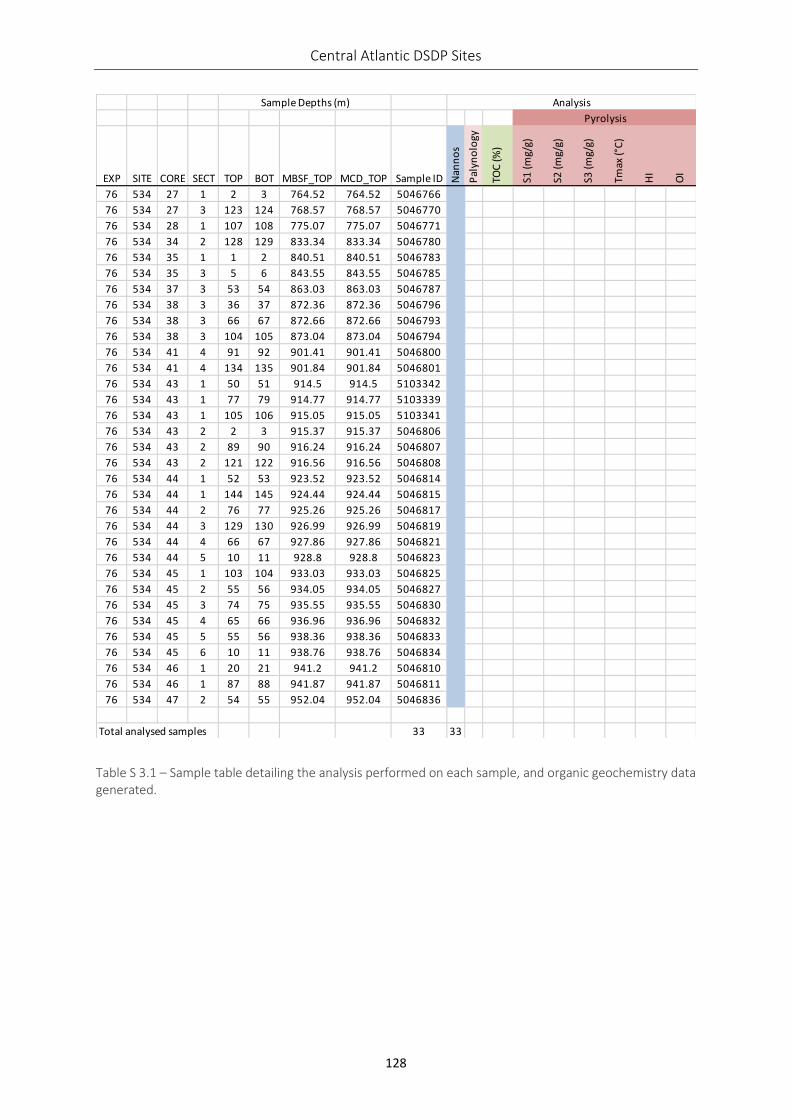
Central Atlantic DSDP Sites
128
Table S 3.1 – Sample table detailing the analysis performed on each sample, and organic geochemistry data generated.
EXP SITE CORE SECT TOP BOT MBSF_TOP MCD_TOP Sample ID Nan
no
s
Pal
yno
logy
TOC
(%)
S1 (m
g/g)
S2 (m
g/g)
S3 (m
g/g)
Tmax
(°C
)
HI
OI
76 534 27 1 2 3 764.52 764.52 5046766
76 534 27 3 123 124 768.57 768.57 5046770
76 534 28 1 107 108 775.07 775.07 5046771
76 534 34 2 128 129 833.34 833.34 5046780
76 534 35 1 1 2 840.51 840.51 5046783
76 534 35 3 5 6 843.55 843.55 5046785
76 534 37 3 53 54 863.03 863.03 5046787
76 534 38 3 36 37 872.36 872.36 5046796
76 534 38 3 66 67 872.66 872.66 5046793
76 534 38 3 104 105 873.04 873.04 5046794
76 534 41 4 91 92 901.41 901.41 5046800
76 534 41 4 134 135 901.84 901.84 5046801
76 534 43 1 50 51 914.5 914.5 5103342
76 534 43 1 77 79 914.77 914.77 5103339
76 534 43 1 105 106 915.05 915.05 5103341
76 534 43 2 2 3 915.37 915.37 5046806
76 534 43 2 89 90 916.24 916.24 5046807
76 534 43 2 121 122 916.56 916.56 5046808
76 534 44 1 52 53 923.52 923.52 5046814
76 534 44 1 144 145 924.44 924.44 5046815
76 534 44 2 76 77 925.26 925.26 5046817
76 534 44 3 129 130 926.99 926.99 5046819
76 534 44 4 66 67 927.86 927.86 5046821
76 534 44 5 10 11 928.8 928.8 5046823
76 534 45 1 103 104 933.03 933.03 5046825
76 534 45 2 55 56 934.05 934.05 5046827
76 534 45 3 74 75 935.55 935.55 5046830
76 534 45 4 65 66 936.96 936.96 5046832
76 534 45 5 55 56 938.36 938.36 5046833
76 534 45 6 10 11 938.76 938.76 5046834
76 534 46 1 20 21 941.2 941.2 5046810
76 534 46 1 87 88 941.87 941.87 5046811
76 534 47 2 54 55 952.04 952.04 5046836
Total analysed samples 33 33
Sample Depths (m) Analysis
Pyrolysis
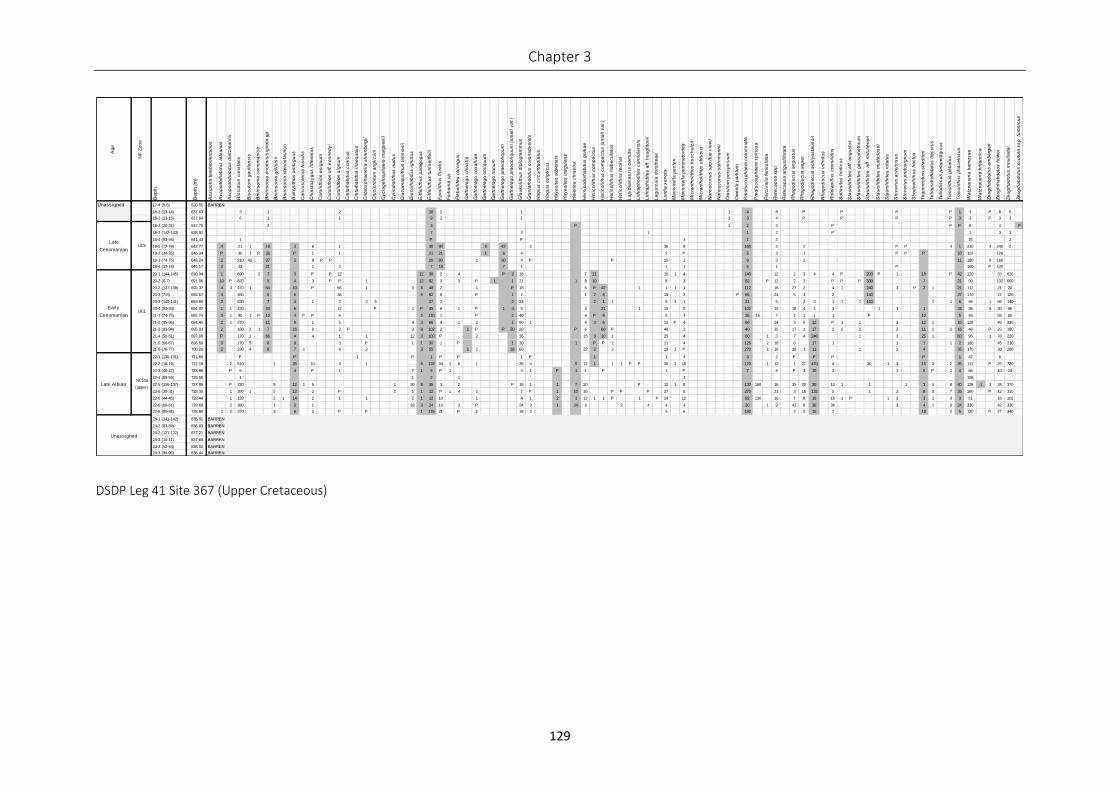
Chapter 3
129
DSDP Leg 41 Site 367 (Upper Cretaceous)
Ag
e
NF
Zo
ne
De
pth
De
pth
(m
)
As
sip
etr
a t
ere
bro
de
nta
riu
s
Ax
op
od
orh
ab
du
s a
lbia
nu
s
Ax
op
od
orh
ab
du
s d
ietz
ma
nn
ii
Bis
cu
tum
co
ns
tan
s
Bis
cu
tum
ga
ult
en
sis
Bro
ins
on
ia c
en
om
an
ica
Bro
ins
on
ia e
no
rmis
/sig
na
ta g
p
Bro
ins
on
ia g
all
ois
ii
Bro
ins
on
ia s
ten
os
tau
rio
n
Bu
kry
lith
us
am
big
uu
s
Ca
lcio
so
len
ia f
os
sil
is
Ch
ias
toz
yg
us
lit
tera
riu
s
Co
roll
ith
ion
ex
igu
um
Co
roll
ith
ion
aff
. k
en
ne
dy
i
Co
roll
ith
ion
sig
nu
m
Cre
tarh
ab
du
s c
on
icu
s
Cre
tarh
ab
du
s i
na
eq
ua
lis
Cri
bro
sp
ha
ere
lla
eh
ren
be
rgii
Cru
cic
rib
rum
an
gli
cu
m
Cy
cla
ge
los
ph
ae
ra m
arg
ere
lii
Cy
lin
dra
lith
us
nu
du
s
Dia
zo
ma
toli
thu
s l
eh
ma
nii
Dis
co
rha
bd
us
ig
no
tus
Eif
fell
ith
us
pa
rag
og
us
Eif
fell
ith
us
tu
rris
eif
feli
i
Ep
roli
thu
s f
lora
lis
Fa
rha
nia
sp
.
Fla
be
llit
es
ob
lon
gu
s
Ga
rtn
era
go
ch
ias
tia
Ga
rtn
era
go
co
xa
llia
e
Ga
rtn
era
go
ob
liq
uu
m
Ga
rtn
era
go
na
nu
m
Ga
rtn
era
go
pra
eo
bli
qu
um
Ga
rtn
era
go
pra
eo
bli
qu
um
(s
ma
ll v
ar.
)
Gla
uk
oli
thu
s d
iplo
gra
mm
us
Gra
nta
rha
bd
us
co
ron
ad
ve
nti
s
Ha
qiu
s c
irc
um
rad
iatu
s
Ha
qiu
s e
llip
tic
us
Ha
ye
sit
es
alb
ien
sis
Ha
ye
sit
es
irr
eg
ula
ris
He
len
ea
ch
ias
tia
He
mip
od
orh
ab
du
s g
ork
ae
He
lic
oli
thu
s c
om
pa
ctu
s
He
lic
oli
thu
s c
om
pa
ctu
s (
sm
all
va
r.)
He
lic
oli
thu
s t
rab
ec
ula
tus
He
lic
oli
thu
s l
ec
kie
i
La
pid
ea
ca
ss
is c
orn
uta
Lit
hra
ph
od
ite
s c
arn
iole
ns
is
Lit
hra
ph
idit
es
aff
. h
ou
gh
ton
ii
La
gu
nc
ula
do
roth
ea
e
Lo
rdia
xe
no
ta
Ma
niv
ite
lla
pe
cte
n
Ma
niv
ite
lla
pe
mm
ato
ide
a
Mic
ran
tho
lith
us
ho
sc
hu
lzii
Mic
ran
tho
lith
us
ob
tus
us
Na
nn
oc
on
us
sp
p (
top
vie
w)
Na
nn
oc
on
us
ste
inm
an
nii
Ora
str
um
pe
rsp
icu
um
Ow
en
ia p
art
itu
m
Pre
dis
co
sp
ha
era
co
lum
na
ta
Pre
dis
co
sp
ha
era
sp
ino
sa
Pe
rciv
ali
a f
en
es
tra
ta
Re
tec
ap
sa
sp
p.
Re
tec
ap
sa
an
gu
sti
fora
ta
Rh
ag
od
isc
us
an
gu
stu
s
Rh
ag
od
isc
us
as
pe
r
Rh
ag
od
isc
us
ac
hly
os
tau
rio
n
Rh
ag
od
isc
us
in
fin
itu
s
Ro
tela
pil
lus
cre
nu
latu
s
So
lla
sit
es
ho
rtic
us
Sta
uro
lith
ite
s a
ff.
an
gu
stu
s
Sta
uro
lith
ite
s g
au
so
rhe
thiu
m
Sta
uro
lith
ite
s
aff
. m
itc
he
ne
ri
Sta
uro
lith
ite
s m
utt
erl
os
ei
Sta
uro
lith
ite
s r
ota
tus
Sto
ve
riu
s a
ch
ylo
su
s
Sto
ve
riu
s p
roto
sig
nu
m
Str
ad
ne
rlit
hu
s f
rac
tus
Te
gu
me
ntu
m s
tra
dn
eri
Te
tra
po
do
rha
bd
us
de
co
rus
Tu
bo
dis
cu
s j
ura
pe
lag
icu
s
Tra
no
lith
us
ga
ba
lus
Tra
no
lith
us
ph
ac
elo
su
s
Wa
tzn
au
eri
a b
arn
es
ae
Wa
tzn
au
eri
a b
rita
nn
ica
Ze
ug
rha
bd
otu
s e
mb
erg
eri
Ze
ug
hrh
ab
do
tus
ho
we
i
Ze
ug
rha
do
tus
mo
ull
ad
ei
Ze
ug
rha
bd
otu
s s
cu
tula
ss
p.
turo
nic
us
Unassigned 17-4 (5-6) 620.55 BARREN
18-2 (13-14) 637.63 3 1 2 10 2 1 1 4 8 P P P P 1 3 P 8 5
18-2 (13-15) 637.64 6 1 1 9 2 1 1 3 4 P P P P 3 2 P 3 3
18-2 (20-21) 637.70 2 3 P 1 2 3 P P P 8 4 P
18-2 (142-143) 638.92 7 4 1 1 2 P 1 3 3
18-4 (93-94) 641.43 1 P P 1 1 2 15 2
18-5 (77-78) 642.77 4 21 1 18 3 6 1 30 90 8 42 2 36 8 160 2 2 P P 4 1 210 4 240 2
19-2 (34-35) 646.34 P 30 1 P 36 P 1 1 21 21 1 6 4 2 P 5 3 1 P P P 10 102 126
19-3 (74-75) 648.24 2 210 42 37 2 8 P P 20 90 1 90 4 P P 15 1 9 3 2 11 180 9 160
19-4 (17-18) 649.17 2 33 21 2 2 7 18 7 1 1 1 5 1 P 160 P 120
20-1 (144-145) 690.94 1 690 2 7 3 P P 12 12 30 2 4 P 2 18 7 21 10 1 4 140 12 2 3 4 4 P 200 P 1 18 P 42 120 33 620
20-2 (6-7) 691.06 10 P 820 5 4 3 P P 1 12 82 3 3 P 1 1 21 1 8 10 8 3 82 P 12 2 2 P P P 330 7 21 90 132 660
20-2 (137-138) 692.37 4 3 470 1 54 10 P 66 1 3 6 48 2 1 P 18 5 P 42 1 1 1 1 112 16 27 2 4 1 240 3 P 2 1 21 112 21 20
20-3 (7-8) 692.57 4 480 6 6 36 6 82 6 P 1 7 1 2 8 18 2 P 66 24 5 3 2 140 27 170 72 120
20-3 (140-141) 693.90 2 630 7 4 1 2 2 5 27 1 2 33 2 1 1 5 1 1 21 5 2 3 1 1 1 150 1 1 6 96 1 66 140
20-4 (92-93) 694.92 1 1 420 20 6 12 P 2 P 45 6 1 P 1 4 5 3 21 1 18 5 102 10 18 4 1 1 1 1 1 24 36 9 30 96
21-1 (74-75) 692.74 3 1 90 1 P 10 4 P P 6 2 110 1 P 2 40 6 P 8 5 4 35 15 7 1 1 1 1 P 10 5 45 55 60
21-2 (95-96) 694.45 2 1 270 11 8 1 5 4 3 66 4 1 2 1 60 1 6 3 6 12 P 4 66 24 3 5 12 P 1 1 2 12 1 10 128 48 230
21-3 (93-94) 695.93 2 180 2 1 7 16 6 2 P 3 8 102 2 1 P P 20 20 P 6 60 P 40 2 40 35 17 1 17 2 2 1 2 11 1 2 16 48 P 25 180
21-4 (50-51) 697.00 P 170 1 66 4 4 1 1 12 3 100 P 2 35 15 3 10 1 25 4 60 1 3 7 4 240 1 3 25 1 60 96 1 78 220
21-5 (66-67) 698.66 3 170 5 8 9 3 P 1 1 30 1 P 1 30 1 P P 2 11 4 126 2 18 8 17 1 1 1 1 2 180 45 230
21-6 (76-77) 700.26 2 230 4 8 7 1 6 2 3 55 1 1 18 60 22 2 2 18 1 P 270 1 16 18 1 11 1 1 4 35 170 30 260
22-1 (130-131) 721.80 P P 1 P 1 P P 1 P 1 1 4 3 2 P P P P 1 42 6
22-2 (18-19) 722.18 2 510 1 35 10 3 1 6 128 34 1 6 1 35 4 5 12 1 1 1 P P 30 2 15 170 1 12 1 21 470 4 30 3 3 15 3 2 35 112 P 25 720
22-3 (46-47) 723.96 P 6 4 P 1 7 1 9 P 1 4 1 P 1 1 P 1 P 7 9 P 3 15 2 1 5 P 2 4 66 10 24
22-4 (55-56) 725.55 1 1 2 1 3 108
22-5 (136-137) 727.86 P 720 9 12 1 5 1 30 6 35 3 2 P 18 1 1 7 20 P 12 1 8 130 160 16 35 20 30 10 1 1 1 3 1 8 40 128 1 3 34 370
22-6 (30-31) 728.30 1 390 1 5 12 2 P 2 1 1 12 P 1 4 1 7 P 1 10 16 P P P 27 5 270 21 3 18 132 5 1 2 8 3 7 36 160 P 12 310
22-6 (44-45) 728.44 1 128 2 1 14 2 1 1 2 1 12 10 1 4 1 2 1 12 1 1 P 1 P 14 12 82 130 16 7 8 16 16 1 P 1 3 3 1 3 3 51 16 102
22-6 (60-61) 728.60 2 380 1 2 1 18 3 24 10 3 P 24 3 1 24 6 2 4 4 4 30 1 9 42 8 36 36 3 4 1 9 24 330 42 330
22-6 (80-81) 728.80 1 2 370 3 6 3 P P 1 115 21 P 1 18 3 5 6 180 2 2 15 2 18 2 5 130 P 27 340
24-1 (141-142) 835.91 BARREN
24-2 (83-84) 836.83 BARREN
24-2 (121-122) 837.21 BARREN
24-3 (10-11) 837.60 BARREN
24-3 (52-53) 838.02 BARREN
24-3 (94-95) 838.44 BARREN
Unassigned
Early
Cenomanian
Late
CenomanianUC5
UC1
NC10a
(upper)Late Albian
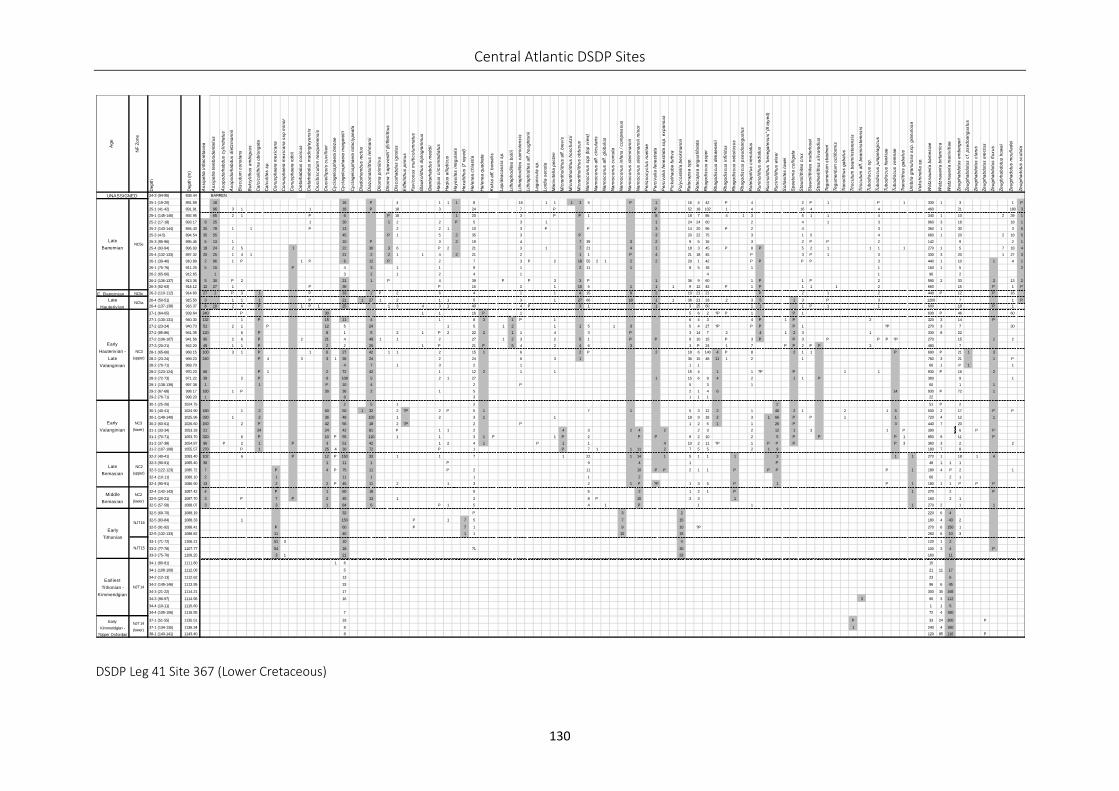
Central Atlantic DSDP Sites
130
DSDP Leg 41 Site 367 (Lower Cretaceous)
Ag
e
NF
Zo
ne
De
pth
De
pth
(m
)
As
sip
etr
a i
nfr
ac
reta
ce
a
As
sip
etr
a t
ere
bro
de
nta
riu
s
Ax
op
od
orh
ab
du
s c
yli
nd
ratu
s
Ax
op
od
orh
ab
du
s d
ietz
ma
nn
ii
Bis
cu
tum
co
ns
tan
s
Bu
kry
lith
us
am
big
uu
s
Ca
lcic
ali
thin
a o
blo
ng
ata
Ca
lcu
lite
s s
p.
Co
nu
sp
ha
era
me
xic
an
a
Co
nu
sp
ha
era
me
xic
an
a s
sp
min
or
Co
nu
sp
ha
era
ro
thii
Cre
tarh
ab
du
s c
on
icu
s
Cre
tarh
ab
du
s m
ad
ing
ley
en
sis
Cru
cib
isc
utu
m n
eu
qu
en
en
sis
Cru
cie
llip
sis
cu
vil
lie
ri
Cy
cla
ge
los
ph
ae
ra b
rez
ae
Cy
cla
ge
los
ph
ae
ra m
arg
ere
lii
Cy
cla
ge
los
ph
ae
ra r
ota
cly
pe
ata
Dia
do
rho
mb
us
re
ctu
s
Dia
zo
ma
toli
thu
s l
eh
ma
nii
Dil
om
a p
rim
itiv
a
Dil
om
a "
ca
pe
ve
rdii
" (E
iffe
llit
hu
s
Dis
co
rha
bd
us
ig
no
tus
Eif
fell
ith
us
pri
mu
s
Fa
vic
on
us
mu
ltic
olu
mn
atu
s
Gla
uk
oli
thu
s d
iplo
gra
mm
us
Gra
nta
rha
bd
us
me
dd
ii
Ha
qiu
s c
irc
um
rad
iatu
s
Ha
qiu
s e
llip
tic
us
Ha
ye
sit
es
irr
eg
ula
ris
He
xa
lith
us
(7
ra
ye
d)
He
len
ea
ch
ias
tia
He
len
ea
qu
ad
rata
Ko
kia
aff
. b
ore
ali
s
La
pid
ea
ca
ss
is s
p.
Lit
hra
ph
od
ite
s b
oll
ii
Lit
hra
ph
od
ite
s c
arn
iole
ns
is
Lit
hra
ph
idit
es
aff
. h
ou
gh
ton
ii
La
gu
nc
ula
sp
.
Lo
rdia
xe
no
ta
Ma
niv
ite
lla
pe
cte
n
Mic
ran
tho
lith
us
aff
. b
rev
is
Mic
ran
tho
lith
us
ho
sc
hu
lzii
Mic
ran
tho
lith
us
ob
tus
us
Na
nn
oc
on
us
sp
p (
top
vie
w)
Na
nn
oc
on
us
aff
. c
irc
ula
ris
Na
nn
oc
on
us
aff
. g
lob
ulu
s
Na
nn
oc
on
us
co
rnu
ta
Na
nn
oc
on
us
in
fan
s /
co
mp
res
su
s
Na
nn
oc
on
us
ste
inm
an
nii
Na
nn
oc
on
us
ste
inm
an
nii
min
or
Pe
ris
so
cy
clu
s n
oe
lia
e
Pe
rciv
ali
a f
en
es
tra
ta
Pe
rciv
ali
a f
en
es
tra
ta s
sp
. e
xp
an
su
s
Pic
ke
lha
ub
e f
urt
iva
Po
lyc
os
tell
a b
ec
km
an
nii
Re
tec
ap
sa
sp
p.
Re
tec
ap
sa
an
gu
sti
fora
ta
Rh
ag
od
isc
us
as
pe
r
Rh
ag
od
isc
us
de
ka
en
eli
i
Rh
ag
od
isc
us
in
fin
itu
s
Rh
ag
od
isc
us
ne
bu
los
us
Rh
ag
od
isc
us
ps
eu
do
an
gu
stu
s
Ro
tela
pil
lus
cre
nu
latu
s
Ru
nin
oli
thu
s r
ad
iatu
s
Ru
cin
oli
thu
s "
se
ne
ga
len
sis
" (8
ra
ye
d)
Ru
cin
oli
thu
s w
ise
i
So
lla
sit
es
lo
we
i
Sp
ee
ton
ia c
oll
iga
ta
Sta
uro
lith
ite
s c
rux
Sta
uro
lith
ite
s m
utt
erl
os
ei
Str
ad
ne
rlit
hu
s s
ilv
ara
diu
s
Te
gu
me
ntu
m s
tra
dn
eri
Te
gu
me
ntu
m o
cti
form
is
Tra
no
lith
us
ga
ba
lus
Tri
sc
utu
m b
ea
min
ste
ren
sis
Tri
sc
utu
m a
ff.
be
am
ins
tere
ns
is
Tu
bo
dis
cu
s s
p.
Tu
bo
dis
cu
s j
ura
pe
lag
icu
s
Tu
bo
dis
cu
s f
ran
kia
e
Tu
bo
dis
cu
s v
ere
na
e
Tra
no
lith
us
ga
ba
lus
Um
bri
a g
ran
ulo
sa
ss
p.
gra
nu
los
a
Ve
ks
hin
ell
a s
p.
Wa
tzn
au
eri
a b
arn
es
iae
Wa
tzn
au
eri
a b
rita
nn
ica
Wa
tzn
au
eri
a m
an
ivit
iae
Ze
ug
rha
bd
otu
s e
mb
erg
eri
Ze
ug
rha
bd
otu
s c
f. p
se
do
an
gu
stu
s
Ze
ug
rha
bd
otu
s c
laru
s
Ze
ug
rha
bd
otu
s e
rec
tus
Ze
ug
rha
bd
otu
s f
lux
us
Ze
ug
hrh
ab
do
tus
ho
we
i
Ze
ug
rha
do
tus
mo
ull
ad
ei
Ze
ug
rha
do
tus
sc
utu
la
24-3 (94-95) 838.44 BARREN
25-1 (19-20) 891.69 18 16 P 4 1 1 1 8 16 1 1 1 3 5 P 1 16 4 42 P 4 2 P 1 P 1 330 1 3 1 P
25-1 (41-42) 891,91 96 3 1 1 18 P 18 3 24 7 P P 52 18 102 1 4 16 4 4 460 21 180 3
25-1 (145-146) 892.95 65 2 1 P 6 P 18 1 20 3 P P 1 8 18 7 86 4 1 3 5 1 1 4 340 1 10 2 39 1
25-2 (17-18) 893.17 8 25 1 30 1 2 2 P 5 3 1 1 24 24 60 2 4 1 3 960 3 18 18 1
25-2 (143-144) 894,43 25 78 1 1 P 13 2 2 1 10 3 P P 3 14 20 96 P 2 4 3 360 1 30 3 6
25-3 (4-5) 894.54 35 55 45 P 1 5 2 35 3 P 3 20 22 75 3 1 5 4 660 1 20 2 18 5
25-3 (95-96) 895.45 5 13 1 10 P 3 2 19 4 7 39 3 2 9 5 16 3 2 P P 2 142 9 2 1
25-4 (93-94) 896.93 18 24 2 5 1 22 30 3 6 P 2 21 3 1 7 21 4 1 18 3 45 P 8 P 5 2 1 1 1 1 270 1 5 7 18 4
25-4 (132-133) 897.32 20 25 1 4 1 21 2 2 1 1 4 2 21 2 1 1 P 4 21 18 45 P 3 P 1 3 330 3 20 1 27 3
26-1 (39-40) 910.89 2 96 1 P 1 P 6 12 P 2 7 3 P 2 18 55 2 1 2 2 20 1 42 P P P P 3 440 1 10 1 4 1
26-1 (75-76) 911.25 5 15 P 4 3 1 1 9 1 2 11 1 8 5 18 1 1 160 1 5 2
26-2 (65-66) 912.65 1 3 2 1 2 4 1 4 1 96 2
26-2 (136-137) 913.36 5 30 P 2 21 1 P 4 39 P P 3 3 P 1 36 9 60 1 P 1 P 2 590 2 33 2 13 2
26-3 (62-63) 914.12 12 27 1 P 36 P 15 2 1 15 5 1 1 1 9 12 42 P 1 P 1 1 1 2 660 15 P 1 P
E. Barremian NC5c 26-3 (110-112) 914.60 27 2 P 3 1 P 33 2 P 2 6 4 1 1 4 15 8 2 10 21 21 P 2 1 2 440 P 12 P 16
26-4 (50-51) 915.50 3 1 1 1 P 21 1 27 1 2 1 1 5 3 1 27 66 18 1 1 36 21 33 2 3 5 1 3 P 3 1200 7 1 P
26-4 (137-138) 916.37 8 10 2 4 P 1 P 1 25 1 3 4 3 1 40 4 P 3 1 1 3 25 60 1 1 1 P 1 1 600 18 P 1
27-1 (64-65) 939.64 240 P 30 1 1 16 P 1 5 6 2 ?P P 1 P 1 630 P 46 60
27-1 (130-131) 940.30 132 1 P 15 11 4 1 8 3 1 P 1 6 4 3 4 P 1 P 2 320 3 14 P
27-2 (23-24) 940.73 51 2 1 P 12 5 24 1 5 1 2 1 1 5 1 3 5 4 27 ?P P P P 1 ?P 270 3 7 30
27-2 (85-86) 941.35 120 6 P 8 1 5 2 1 P 2 22 2 1 1 4 3 P 3 14 7 2 4 1 2 3 1 330 8 22
27-2 (106-107) 941.56 90 2 6 P 2 21 4 48 1 1 2 27 1 2 3 2 5 1 P P 9 10 15 P 3 P P 3 P P P ?P 270 15 1 2
27-3 (20-21) 942.20 45 1 1 P 2 2 20 1 P 21 P 5 4 2 4 6 3 3 P 24 1 7 P P 2 P P 3 480 7
28-1 (65-66) 968.15 100 3 1 P 1 6 27 42 1 1 2 15 1 6 2 P 2 18 6 140 4 P 8 2 1 1 P 690 P 21 1 3
28-2 (23-24) 969.23 240 P 4 3 3 1 36 24 2 24 6 3 1 36 15 48 11 1 2 1 760 3 21 1 P
28-2 (70-71) 969.70 4 7 1 3 2 1 1 1 66 1 P 1 1
28-2 (123-124) 970.23 66 P 1 2 72 42 1 12 2 1 1 15 4 1 1 ?P P 1 1 930 P 16 2
28-3 (72-73) 971.22 39 2 P 6 108 5 2 1 27 1 15 6 9 4 2 1 1 P 360 9 1
29-1 (138-139) 997.38 1 1 P 10 4 2 P 5 3 1 60 1 1
29-2 (67-68) 998.17 180 1 P 30 36 2 1 5 2 1 4 6 14 930 P 72 1
29-2 (70-71) 998.20 1 8 3 1 1 1 22
30-1 (25-26) 1024.75 2 5 1 2 2 51 P 2
30-1 (40-41) 1024.90 180 1 2 50 50 1 32 2 ?P 2 P 5 1 7 1 5 3 12 2 1 40 2 1 2 1 5 500 2 17 P P
30-1 (148-149) 1025.96 330 1 2 36 48 150 1 2 3 1 1 18 9 18 2 3 1 66 P P 1 1 720 4 12 1
30-2 (60-61) 1026.60 150 2 P 42 56 18 2 ?P 2 P 1 2 5 1 1 26 P 3 440 7 20
31-1 (33-34) 1053.33 21 24 24 42 81 P 1 1 2 4 3 2 4 2 2 3 2 12 1 3 1 P 390 6 P P
31-1 (70-71) 1053.70 320 6 P 10 P 55 110 1 1 3 1 P 1 P 2 P P 9 2 10 2 5 P P P 1 850 9 11 P
31-2 (37-38) 1054.87 96 P 2 1 P 3 51 42 1 2 4 1 P 1 1 4 10 2 11 ?P 1 P P P P 3 360 3 2 2
31-2 (107-108) 1055.57 270 P 1 25 4 30 72 P 1 P 7 1 1 11 2 7 5 5 2 1 9 180 7 8
32-2 (40-41) 1083.40 102 6 P 12 P 150 33 1 1 7 1 22 1 14 1 5 1 1 1 3 1 1 270 1 18 1 4
32-3 (90-91) 1085.40 36 1 11 1 P 9 4 1 P 48 1 1 1
32-3 (122-123) 1085.72 7 P 4 P 75 11 P 2 11 10 P P 2 1 1 P P P P 1 180 4 P 2 1
32-4 (10-11) 1086.10 2 1 11 1 1 1 2 66 2 1
32-4 (90-91) 1086.90 13 2 2 P 45 11 2 1 3 2 1 P ?P 1 3 5 P 1 P 1 180 1 1 P P P
32-4 (142-143) 1087.42 4 P 1 60 18 5 5 2 1 2 1 P 1 270 2 P
32-5 (20-21) 1087.70 3 P 7 P 2 45 13 1 2 8 P 15 3 3 1 160 2 1
32-5 (57-58) 1088.07 3 3 1 84 6 P 1 5 4 1 P 1 1 1 270 2 1 1
32-5 (69-70) 1088.19 32 P 3 2 220 6 4
32-5 (83-84) 1088.33 1 150 P 1 7 5 7 15 180 4 40 2
32-5 (91-92) 1088.41 P 60 P 7 1 9 10 ?P 270 6 150 1
32-5 (132-133) 1088.82 11 40 1 1 10 15 260 6 10 3
33-1 (71-72) 1106.21 51 3 10 4 120 1 2
33-2 (77-78) 1107.77 54 18 ?1 30 100 3 4 P
33-3 (75-76) 1109.25 3 1 21 33 160 11
34-1 (80-81) 1111.80 1 6 15
34-1 (108-109) 1112.08 5 21 11 17
34-2 (12-13) 1112.62 13 23 6
34-2 (145-146) 1113.95 33 96 6 45
34-3 (21-22) 1114.21 17 300 30 168
34-3 (96-97) 1114.96 16 3 90 3 112
34-4 (10-11) 1115.60 1 1 5
34-4 (105-106) 1116.55 7 72 4 180
37-1 (51-55) 1135.51 33 P 33 24 300 P
37-1 (134-135) 1136.34 8 1 240 4 180
38-1 (140-141) 1143.40 8 120 85 116 P
Early
Kimmeridgian -
?Upper Oxfordian
Earliest
Tithonian -
Kimmeridgian
Middle
Berriasian
Early
Tithonian
Early
Valanginian
UNASSIGNED
Late
Berriasian
Late
BarremianNC5e
NC3
(lower)
Early
Hauterivian -
Late
Valanginian
NC3
(upper)
Late
HauterivianNC5a
NC2
(upper)
NC2
(lower)
NJT16
NJT15
NJT14
(lower)
NJT14
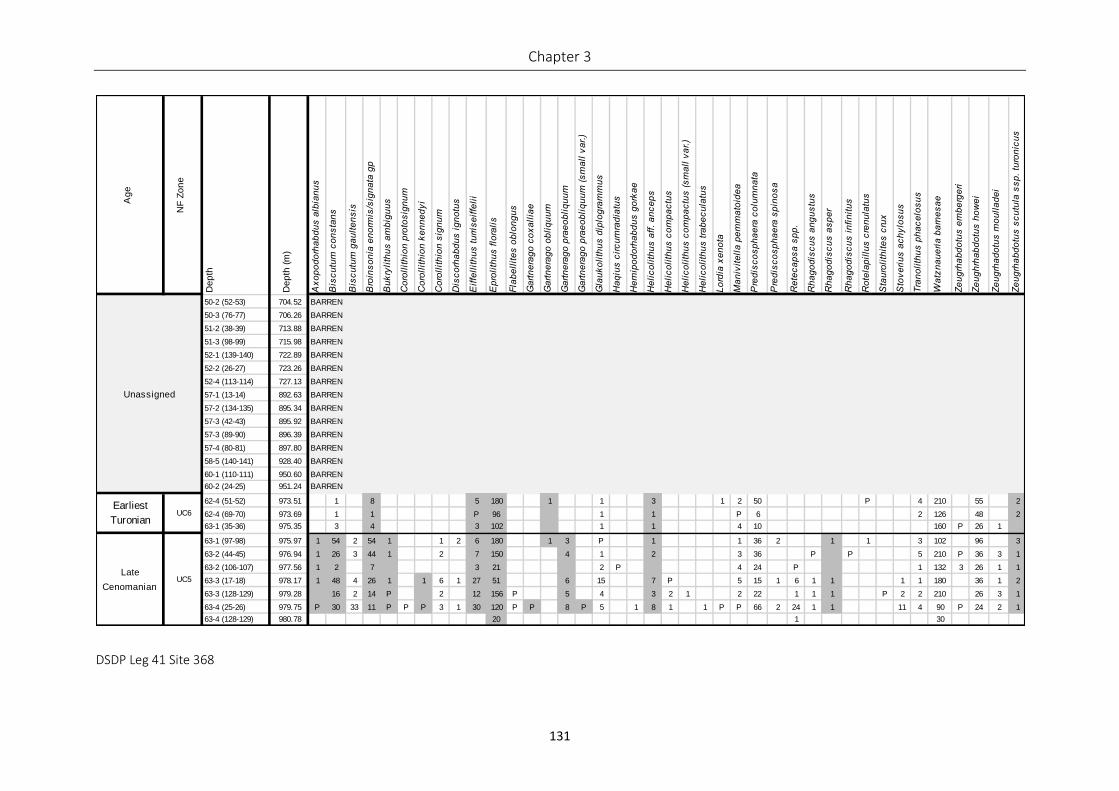
Chapter 3
131
DSDP Leg 41 Site 368
Ag
e
NF
Zo
ne
De
pth
De
pth
(m
)
Ax
op
od
orh
ab
du
s a
lbia
nu
s
Bis
cu
tum
co
ns
tan
s
Bis
cu
tum
ga
ult
en
sis
Bro
ins
on
ia e
no
rmis
/sig
na
ta g
p
Bu
kry
lith
us
am
big
uu
s
Co
roll
ith
ion
pro
tos
ign
um
Co
roll
ith
ion
ke
nn
ed
yi
Co
roll
ith
ion
sig
nu
m
Dis
co
rha
bd
us
ig
no
tus
Eif
fell
ith
us
tu
rris
eif
feli
i
Ep
roli
thu
s f
lora
lis
Fla
be
llit
es
ob
lon
gu
s
Ga
rtn
era
go
co
xa
llia
e
Ga
rtn
era
go
ob
liq
uu
m
Ga
rtn
era
go
pra
eo
bli
qu
um
Ga
rtn
era
go
pra
eo
bli
qu
um
(s
ma
ll v
ar.
)
Gla
uk
oli
thu
s d
iplo
gra
mm
us
Ha
qiu
s c
irc
um
rad
iatu
s
He
mip
od
orh
ab
du
s g
ork
ae
He
lic
oli
thu
s a
ff.
an
ce
ps
He
lic
oli
thu
s c
om
pa
ctu
s
He
lic
oli
thu
s c
om
pa
ctu
s (
sm
all
va
r.)
He
lic
oli
thu
s t
rab
ec
ula
tus
Lo
rdia
xe
no
ta
Ma
niv
ite
lla
pe
mm
ato
ide
a
Pre
dis
co
sp
ha
era
co
lum
na
ta
Pre
dis
co
sp
ha
era
sp
ino
sa
Re
tec
ap
sa
sp
p.
Rh
ag
od
isc
us
an
gu
stu
s
Rh
ag
od
isc
us
as
pe
r
Rh
ag
od
isc
us
in
fin
itu
s
Ro
tela
pil
lus
cre
nu
latu
s
Sta
uro
lith
ite
s c
rux
Sto
ve
riu
s a
ch
ylo
su
s
Tra
no
lith
us
ph
ac
elo
su
s
Wa
tzn
au
eri
a b
arn
es
ae
Ze
ug
rha
bd
otu
s e
mb
erg
eri
Ze
ug
hrh
ab
do
tus
ho
we
i
Ze
ug
rha
do
tus
mo
ull
ad
ei
Ze
ug
rha
bd
otu
s s
cu
tula
ss
p.
turo
nic
us
50-2 (52-53) 704.52 BARREN
50-3 (76-77) 706.26 BARREN
51-2 (38-39) 713.88 BARREN
51-3 (98-99) 715.98 BARREN
52-1 (139-140) 722.89 BARREN
52-2 (26-27) 723.26 BARREN
52-4 (113-114) 727.13 BARREN
57-1 (13-14) 892.63 BARREN
57-2 (134-135) 895.34 BARREN
57-3 (42-43) 895.92 BARREN
57-3 (89-90) 896.39 BARREN
57-4 (80-81) 897.80 BARREN
58-5 (140-141) 928.40 BARREN
60-1 (110-111) 950.60 BARREN
60-2 (24-25) 951.24 BARREN
62-4 (51-52) 973.51 1 8 5 180 1 1 3 1 2 50 P 4 210 55 2
62-4 (69-70) 973.69 1 1 P 96 1 1 P 6 2 126 48 2
63-1 (35-36) 975.35 3 4 3 102 1 1 4 10 160 P 26 1
63-1 (97-98) 975.97 1 54 2 54 1 1 2 6 180 1 3 P 1 1 36 2 1 1 3 102 96 3
63-2 (44-45) 976.94 1 26 3 44 1 2 7 150 4 1 2 3 36 P P 5 210 P 36 3 1
63-2 (106-107) 977.56 1 2 7 3 21 2 P 4 24 P 1 132 3 26 1 1
63-3 (17-18) 978.17 1 48 4 26 1 1 6 1 27 51 6 15 7 P 5 15 1 6 1 1 1 1 180 36 1 2
63-3 (128-129) 979.28 16 2 14 P 2 12 156 P 5 4 3 2 1 2 22 1 1 1 P 2 2 210 26 3 1
63-4 (25-26) 979.75 P 30 33 11 P P P 3 1 30 120 P P 8 P 5 1 8 1 1 P P 66 2 24 1 1 11 4 90 P 24 2 1
63-4 (128-129) 980.78 20 1 30
Unassigned
Late
Cenomanian
Earliest
TuronianUC6
UC5
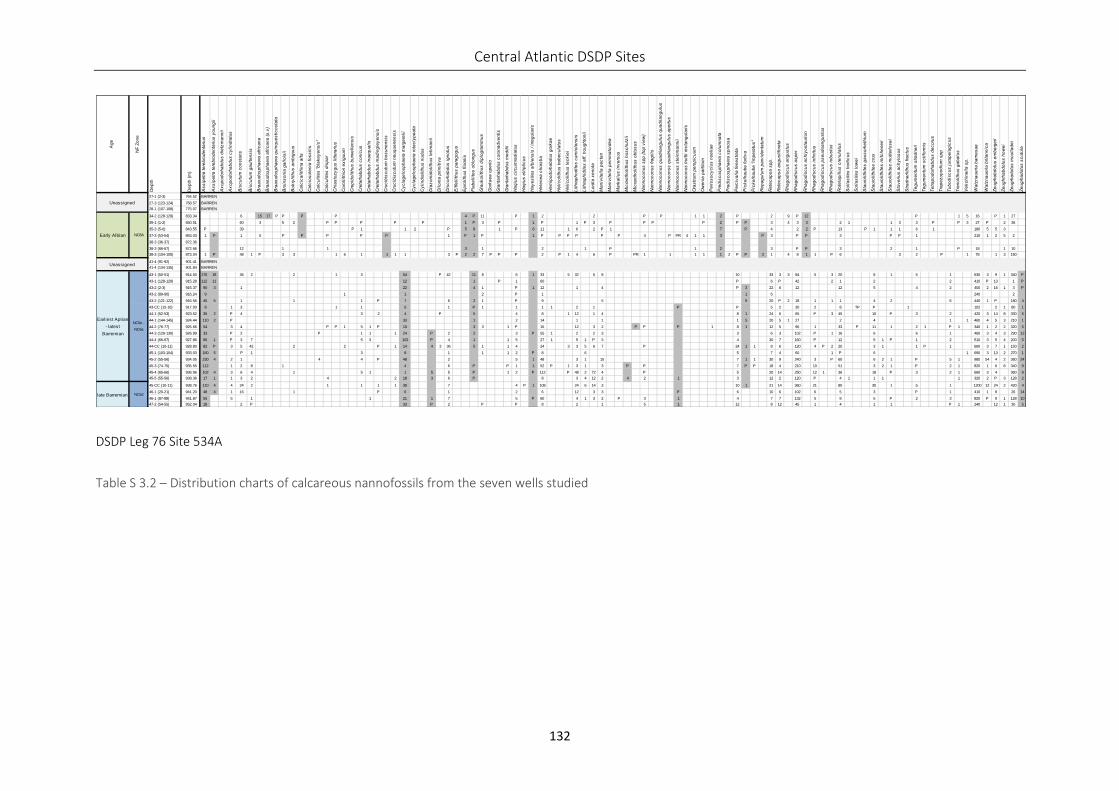
Central Atlantic DSDP Sites
132
DSDP Leg 76 Site 534A
Table S 3.2 – Distribution charts of calcareous nannofossils from the seven wells studied
Ag
e
NF
Zo
ne
De
pth
De
pth
(m
)
As
sip
etr
a t
ere
bro
de
nta
riu
s
As
sip
etr
a t
ere
bro
de
nta
riu
s y
ou
ng
ii
Ax
op
od
orh
ab
du
s d
ietz
ma
nn
ii
Ax
op
od
orh
ab
du
s c
yli
nd
ratu
s
Bis
cu
tum
co
ns
tan
s
Bis
cu
tum
ga
ult
en
sis
Bra
aru
do
sp
ha
era
afr
ica
na
Bra
aru
do
sp
ha
era
afr
ica
na
(s
.v)
Bra
aru
do
sp
ha
era
qu
inq
ue
sti
co
sta
ta
Bro
ins
on
ia g
all
ois
ii
Bu
kry
lith
us
am
big
uu
s
Ca
lcic
ali
thin
a a
lta
Ca
lcio
so
len
ia f
os
sil
is
Ca
lcu
lite
s "
bla
ke
ye
ns
is"
Ca
lcu
lite
s d
isp
ar
Ch
ias
toz
yg
us
lit
tera
riu
s
Co
roll
ith
ion
ex
igu
um
Cre
pid
oli
thu
s b
urw
ell
en
sis
Cre
tarh
ab
du
s c
on
icu
s
Cre
tarh
ab
du
s i
na
eq
ua
lis
Cre
tarh
ab
du
s m
ad
ing
ley
en
sis
Cru
cib
isc
utu
m b
os
un
en
sis
Cru
cib
isc
utu
m n
eu
qu
en
en
sis
Cy
cla
ge
los
ph
ae
ra m
arg
ere
lii
Cy
cla
ge
los
ph
ae
ra r
ota
cly
pe
ata
Cy
lin
dra
lith
us
nu
du
s
Dia
zo
ma
toli
thu
s l
eh
ma
nii
Dil
om
a p
rim
itiv
a
Dis
co
rha
bd
us
ig
no
tus
Eif
fell
ith
us
pa
rag
og
us
Ep
roli
thu
s f
lora
lis
Fla
be
llit
es
ob
lon
gu
s
Gla
uk
oli
thu
s d
iplo
gra
mm
us
Go
rka
ea
op
eri
o
Gra
nta
rha
bd
us
co
ron
ad
ve
nti
s
Gra
nta
rha
bd
us
me
dd
ii
Ha
qiu
s c
irc
um
rad
iatu
s
Ha
qiu
s e
llip
tic
us
Ha
ye
sit
es
alb
ien
sis
/ i
rre
gu
lari
s
He
len
ea
ch
ias
tia
He
mip
od
orh
ab
du
s g
ork
ae
He
lic
oli
thu
s t
rab
ec
ula
tus
He
lic
oli
thu
s l
ec
kie
i
Lit
hra
ph
od
ite
s c
arn
iole
ns
is
Lit
hra
ph
idit
es
aff
. h
ou
gh
ton
ii
Lo
rdia
xe
no
ta
Ma
niv
ite
lla
pe
cte
n
Ma
niv
ite
lla
pe
mm
ato
ide
a
Ma
rka
liu
s i
nv
ers
us
Mic
ran
tho
lith
us
ho
sc
hu
lzii
Mic
ran
tho
lith
us
ob
tus
us
Na
nn
oc
on
us
sp
p (
top
vie
w)
Na
nn
oc
on
us
fra
gil
is
Na
nn
oc
on
us
qu
ad
ria
ng
ulu
s q
ua
dri
an
gu
lus
Na
nn
oc
on
us
qu
ad
ria
ng
ulu
s a
pe
rtu
s
Na
nn
oc
on
us
ste
inm
an
nii
Na
nn
oc
on
us
tru
itti
re
cta
ng
ula
ris
Ora
str
um
pe
rsp
icu
um
Ow
en
ia p
art
itu
m
Pe
ris
so
cy
clu
s n
oe
lia
e
Pre
dis
co
sp
ha
era
co
lum
na
ta
Pre
dis
co
sp
ha
era
sp
ino
sa
Pe
rciv
ali
a f
en
es
tra
ta
Pic
ke
lha
ub
e f
urt
iva
Pic
ke
lha
ub
e "
imp
era
tus
"
Re
pa
gu
lum
pa
rvid
en
tatu
m
Re
tec
ap
sa
sp
p.
Re
tec
ap
sa
an
gu
sti
fora
ta
Rh
ag
od
isc
us
an
gu
stu
s
Rh
ag
od
isc
us
as
pe
r
Rh
ag
od
isc
us
ac
hly
os
tau
rio
n
Rh
ag
od
isc
us
in
fin
itu
s
Rh
ag
od
isc
us
ps
eu
do
an
gu
stu
s
Rh
ag
od
isc
us
ro
bu
stu
s
Ro
tela
pil
lus
cre
nu
latu
s
So
lla
sit
es
ho
rtic
us
So
lla
sit
es
lo
we
i
Sta
uro
lith
ite
s g
au
so
rhe
thiu
m
Sta
uro
lith
ite
s c
rux
Sta
uro
lith
ite
s m
itc
he
ne
ri
Sta
uro
lith
ite
s m
utt
erl
os
ei
Sto
ve
riu
s a
ch
ylo
su
s
Str
ad
ne
rlit
hu
s f
rac
tus
Te
gu
me
ntu
m s
tra
dn
eri
Te
gu
me
ntu
m o
cti
form
is
Te
tra
po
do
rha
bd
us
de
co
rus
Tra
pe
zo
po
diu
m s
pp
Tu
bo
dis
cu
s j
ura
pe
lag
icu
s
Tra
no
lith
us
ga
ba
lus
Ve
ks
hin
ell
a s
p.
Wa
tzn
au
eri
a b
arn
es
ae
Wa
tzn
au
eri
a b
rita
nn
ica
Ze
ug
rha
bd
otu
s e
mb
erg
eri
Ze
ug
hrh
ab
do
tus
ho
we
i
Ze
ug
rha
do
tus
mo
ull
ad
ei
Ze
ug
rha
do
tus
sc
utu
la
27-1 (2-3) 764.52 BARREN
27-3 (123-124) 768.57 BARREN
28-1 (107-108) 775.07 BARREN
34-2 (128-129) 833.34 6 15 17 P P P P 4 P 11 P 1 2 2 P P 1 1 2 P 2 9 P 12 P 1 5 16 P 1 27
35-1 (1-2) 840.51 60 3 5 2 P P P P P 1 P 3 P 1 P 1 P 3 P P P P 2 P P 3 4 3 3 2 1 1 3 3 P P 3 27 P 2 36
35-3 (5-6) 843.55 P 39 P 1 1 2 P 5 8 1 P 6 11 1 6 2 P 1 7 P 4 2 2 P 13 P 1 1 1 6 1 180 5 5 3
37-3 (53-54) 863.03 1 P 1 5 P P P P P 1 P 1 P 1 P P P P P P 4 P PR 4 1 1 3 P 3 P P 3 P P 1 210 1 2 5 2
38-3 (36-37) 872.36
38-3 (66-67) 872.66 12 1 1 3 1 2 1 P 1 2 3 P P 3 2 1 P 18 1 10
38-3 (104-105) 873.04 1 P 48 1 P 3 3 1 6 1 1 1 1 3 P 2 2 7 P P P 2 P 1 4 6 P PR 1 1 1 1 1 2 P P 2 1 4 8 1 1 P 6 3 2 P 1 78 1 3 150
41-4 (91-92) 901.41 BARREN
41-4 (134-135) 901.84 BARREN
43-1 (50-51) 914.50 170 18 36 2 2 1 3 54 P 42 11 8 6 1 33 5 32 5 8 10 33 3 3 84 5 3 20 8 1 5 1 630 3 9 1 340 P
43-1 (128-129) 915.28 112 11 12 1 P 1 60 P 6 P 42 2 1 2 2 410 P 13 1 P
43-2 (2-3) 915.37 90 3 1 22 4 1 P 1 12 1 4 P 3 22 6 12 12 5 4 2 400 2 16 1 3 P
43-2 (89-90) 916.24 9 1 1 2 P 1 1 6 240 2
43-2 (121-122) 916.56 45 5 1 1 1 P 7 6 2 1 P 9 5 9 20 P 2 18 1 1 1 4 2 6 440 1 P 180 4
43-CC (15-16) 917.00 8 1 3 1 1 5 1 P 1 1 1 1 2 1 P P 5 2 30 2 8 ?P P 1 102 2 1 80 1
44-1 (52-53) 923.52 35 2 P 4 3 2 4 P 5 4 8 1 12 1 4 8 1 24 6 65 P 3 45 10 P 3 2 420 3 14 8 330 5
44-1 (144-145) 924.44 110 2 P 33 1 2 14 1 1 1 5 20 5 1 27 2 4 1 1 460 4 5 3 210 1
44-2 (76-77) 925.66 54 3 4 P P 1 5 1 P 10 3 3 1 P 15 12 3 2 P P P 1 8 1 12 5 96 1 33 P 11 1 2 1 P 1 340 1 2 2 320 5
44-3 (129-130) 926.99 33 P 2 P 1 1 1 24 P 2 2 3 P 55 1 2 2 3 3 6 3 102 P 1 16 6 6 1 460 3 4 3 290 12
44-4 (66-67) 927.86 96 1 P 3 7 5 3 102 P 4 1 1 5 27 1 5 1 P 3 4 30 7 160 P 12 5 1 P 1 2 510 3 5 4 200 5
44-CC (10-11) 928.80 82 P 3 5 42 2 2 P 1 14 4 3 36 5 1 1 4 24 3 3 5 6 7 P 24 1 1 8 6 120 4 P 2 20 3 1 1 P 1 660 3 7 1 150 2
45-1 (103-104) 933.03 180 5 P 1 3 8 1 1 1 2 P 8 6 5 7 4 60 1 P 6 1 690 3 13 2 270 1
45-2 (55-56) 934.05 230 4 2 1 4 4 P 48 2 5 1 48 3 1 15 7 1 1 30 9 240 3 P 60 6 2 1 P 5 1 980 54 4 2 360 24
45-3 (74-75) 935.55 112 1 2 8 1 4 6 P P 1 1 52 P 1 3 1 3 P P 7 P P 18 4 210 10 51 3 2 1 P 2 1 820 1 6 8 340 9
45-4 (65-66) 936.96 102 4 3 6 4 1 5 1 1 5 5 P 1 2 P 112 P 48 2 72 4 P 5 20 14 250 12 1 36 18 P 3 2 1 660 3 4 360 9
45-5 (55-56) 938.36 17 1 1 3 2 4 2 18 3 6 P 8 3 4 12 2 4 2 1 3 12 2 120 P 4 1 1 1 1 320 2 P 3 128 2
45-CC (10-11) 938.76 110 4 4 24 2 1 1 1 1 39 7 4 P 1 108 24 6 14 3 10 1 21 14 360 21 80 30 1 5 1 1200 12 24 2 420 4
46-1 (20-21) 941.20 48 4 1 16 1 P 6 1 2 6 12 3 3 P 6 10 6 102 6 5 3 P 1 410 1 9 26 14
46-1 (87-88) 941.87 55 5 1 1 21 1 7 5 P 60 4 1 3 2 P 3 1 4 7 7 132 5 8 5 P 2 3 820 P 9 1 128 10
47-2 (54-55) 952.04 18 2 P 33 P 2 P P 8 2 1 5 1 12 8 12 45 1 4 1 1 P 1 240 12 1 30 5
late Barremian NC5d
Unassigned
NC8AEarly Albian
Unassigned
Earliest Aptian
- latest
Barremian
NC5e -
NC6a
Chapter 3
133
3.10 REFERENCES
Arthur, M.A., Dean, W.E. and Stow, D.A.V., 1984. Models for the deposition of Mesozoic-Cenozoic fine-grained organic-carbon-rich sediment in the deep sea. Geological Society, London, Special Publications, 15(1), pp.527-560.
Barusseau, J.P., Roger, J., Noel, B.J., Serrano, O. and Duvail, C., 2009. Notice explicative de la carte géologique du Sénégal à 1/200 000, feuilles de Saint-Louis–Dagana, Podor–Saldé, Matam Semmé. Ministère des Mines, de l’Industrie et des PME, Direction des Mines et de la Géologie, Dakar.
Basile, C., Girault, I., Paquette, J.L., Agranier, A., Loncke, L., Heuret, A. and Poetisi, E., 2020. The Jurassic magmatism of the Demerara Plateau (offshore French Guiana) as a remnant of the Sierra Leone hotspot during the Atlantic rifting. Scientific Reports, 10(1), pp.1-12.
van Bentum, E.C., Reichart, G.J., Forster, A. and Sinninghe Damsté, J.S., 2012. Latitudinal differences in the amplitude of the OAE-2 carbon isotopic excursion: pCO2 and paleo productivity. Biogeosciences, 9(2), pp.717-731.
Bergen, J.A. 1994. Berriasian to early Aptian calcareous nannofossils from the Vocontian Trough (SE France) and Deep Sea Drilling Site 534: new nannofossil taxa and a summary of low-latitude biostratigraphic events. Journal of Nannoplankton Research, 16, pp, 59-69.
Bergen, J.A., Boesiger, T.M. and Pospichal, J.J., 2013. 5. Low-latitude Oxfordian to Early Berriasian Nannofossil Biostratigraphy and its Application to the Subsurface of Eastern Texas, In Hammes, U and Gale, J, (eds), Geology of the Haynesville Gas Shale in East Texas and West Louisiana, USA. AAPG Memoir 105, pp. 69-102.
Blackwelder, E., 1909. The valuation of unconformities. The Journal of Geology, 17(3), pp.289-299.
Bralower, T.J., Monechi, S. and Thierstein, H.R., 1989. Calcareous nannofossil zonation of the Jurassic-Cretaceous boundary interval and correlation with the geomagnetic polarity timescale. Marine Micropaleontology, 14, pp.153-235.
Calvès, G., Schwab, A.M., Huuse, M., Clift, P.D., Gaina, C., Jolley, D., Tabrez, A.R. and Inam, A., 2011. Seismic volcanostratigraphy of the western Indian rifted margin: The pre‐Deccan igneous province. Journal of Geophysical Research: Solid Earth, 116(B1).
Carr, A.D., N.R. Cameron, and L. Resendez, 2015, Unraveling the Lower Jurassic and Cretaceous Petroleum Systems within the Diender Block north east of Dakar: 14th PESGB/HGS Conference on African E&P, 3-4 September 2015, p. 106-107 (extended abstract).
Carr, A.D., N.R. Cameron, and R.E. Beall, 2017, Petroleum geochemistry of hydrocarbons in Gadiaga Field, Senegal: A new Lower Jurassic lacustrine source rock and play identified: AAPG/SEG International Conference & Exhibition, London, 15-18 October 2017.
Casellato, C.E., 2010. Calcareous nannofossil biostratigraphy of upper Callovian-Lower Berriasian successions from the southern Alps, north Italy. Revista Italiana di Paleontologia e Stratigrafia, 116 (3), pp. 357-404.
Casson, M., Cavin, L., Jeremiah, J., Bulot, L., Redfern, J., 2018. Fishing in the Central Atlantic, an earliest Cenomanian ichthyodectiform from DSDP Site 367, Cape Verde Basin. Journal of Vertebrate Paleontology, 1–5.
Casson, M., Bulot, L.G., Jeremiah, J. and Redfern, J., 2020a. Deep sea rock record exhumed on oceanic volcanic islands: the Cretaceous sediments of Maio, Cape Verde. Gondwana Research, 81, pp.252-264.
Central Atlantic DSDP Sites
134
Casson, M., Calvès, G., Redfern, J., Huuse, M. and Sayers, B. 2020b. Cretaceous continental margin evolution revealed using quantitative seismic geomorphology, offshore NW Africa. Basin Research.
Catuneanu, O., 2006. Principles of sequence stratigraphy. Elsevier.
Cecca, F., Fourcade, E. and Azéma, J., 1992. The disappearance of the “Ammonitico Rosso”. Palaeogeography, Palaeoclimatology, Palaeoecology, 99(1-2), pp.55-70.
Chen, C.S., 1965. The regional lithostratigraphic analysis of Paleocene and Eocene rocks of Florida (No. 45). Northwestern University.
Clayburn, J. 2017. Realising the deepwater hydrocarbon potential of Senegal. AAPG/SEG 2017 International Conference and Exhibition, London, England. Search and Discovery Article 70345. Costa, L. I. & Davey, R. J., 1992. Dinoflagellate Cysts of the Cretaceous System. In: A Stratigraphic Index of Dinoflagellate Cysts, Ed. by A. J. McIntyrepowel (Chapman and Hall, London), 99–131.
Davey, R.J., 1979. Marine Apto-Albian palynomorphs from Holes 400A and 402A, IPOD Leg 48, northern Bay of Biscay. In: Montadert, L. et al., Deep Sea Drilling Project, Washington, Initial Reports, 48, 547-577, pl.1-8.
Davey, R.J. and Verdier, J.-P., 1973: An investigation of microplankton assemblages from latest Albian (Vraconian) sediments. Revista española de micropaleontologia, 5, 173-212, pl.1-5.
Davison, I., 2005. Central Atlantic margin basins of North West Africa: geology and hydrocarbon potential (Morocco to Guinea). Journal of African Earth Sciences, 43(1-3), pp.254-274.
Deroo, G., Herbin, J.P., Roucache, J., Tissot, B., Albrecht, P. and Schaeffle, J., 1978. Organic geochemistry of some Cretaceous black shales from Sites 367 and 368; Leg 41, Eastern North Atlantic. Initial Reports of the Deep Sea Drilling Project, 41, pp.865-874.
Dillon, W.P. and Sougy, J.M., 1974. Geology of West Africa and Canary and Cape Verde Islands. In The ocean basins and margins (pp. 315-390). Springer, Boston, MA.
Dow, W.G. 1978. Contact Metamorphism of Kerogen in Sediments from Leg 41: Cape Verde Rise and Basin. In: Initial Reports of the Deep Sea Drilling Project, 41, pp.821-824.
Doyle, J. A., Jardiné, S. & Doerenkamp, A., 1982. Afropollis, a new genus of early angiosperm pollen, with notes on the Cretaceous palynostratigraphy and paleoenvironments of Northern Gondwana. Bulletin des Centres Recherches Exploration-Production Elf Aquitaine, 6, 39–117.
Duncan, R.A. & Jackson, E.D. 1978. Geochronology of basaltic rocks recovered by DSDP Leg 41, eastern Atlantic Ocean. In: Initial Reports of the Deep Sea Drilling Project, 41, pp.1113–1118.
Farinacci, A. and Elmi, S. eds., 1981. Proceedings. Edizioni Tecnoscienza.
De Graciansky, P.C., Brosse, E., Deroo, G., Herbin, J.P. and Montadert, L., 1982. Les formations d'âge crétacé de l'Atlantique Nord et leur matière organique: paléogéographie et milieux de dépôt. Revue de l'Institut français du Pétrole, 37(3), pp.275-336.
Eisenack, A. and Cookson, I.C., 1960: Microplankton from Australian Lower Cretaceous sediments. Proceedings of the Royal Society of Victoria, 72, 1-11, pl.1-3.
Ewing, M., Worzel, J.L., and Burk, C.A. 1969 Introduction. In: Initial Reports of the Deep Sea Drilling Project, 1, pp.3-9.
de Graciansky, P.C., Brosse, E., Deroo, G., Herbin, J.P. and Montadert, L., 1982. Les formations d'âge crétacé de l'Atlantique Nord et leur matière organique: paléogéographie et milieux de dépôt. Revue de l'Institut français du Pétrole, 37(3), pp.275-336.
Gradstein, F.M., Agterberg, F.P., Ogg, J.G., Hardenbol, J., van Veen, P., Thierry, J. and Huang, Z., 1994. A Mesozoic time scale. Journal of Geophysical Research: Solid Earth, 99(B12), pp.24051-24074.
Chapter 3
135
Gradstein, F.M. and Sheridan, R.E., 1983. 44. On the Jurassic Atlantic Ocean and a synthesis of results of Deep Sea drilling project Leg 76. Initial Reports of the Deep Sea Drilling Project: Vol 76 (U.S. Government Printing Office), pp. 913-943).
Haq, B.U., 2014. Cretaceous eustasy revisited. Global and Planetary change, 113, pp.44-58.
Hames, W., McHone, J.G., Renne, P. and Ruppel, C., 2003. The Central Atlantic magmatic province: Insights from fragments of Pangea. Washington DC American Geophysical Union Geophysical Monograph Series, 136.
Hansen, D.M., Redfern, J., Federici, F., Di Biase, D. and Bertozzi, G., 2008. Miocene igneous activity in the Northern Subbasin, offshore Senegal, NW Africa. Marine and Petroleum Geology, 25(1), pp.1-15.
Herbin, J.P. and Deroo, G., 1982. Sedimentologie de la matiere organique dans les formations du Mesozoique de l'Atlantique Nord. Bulletin de la Société Géologique de France, 7(3), pp.497-510.
Herbin, J.P., Deroo, G. & Roucaché, J. 1983. Organic Geochemistry in the Mesozoic and Cenozoic Formations of Site 534, Leg 76, Blake-Bahama Basin, and Comparison with Site 391, Leg 44. In Sheridan, R. E., Gradstein, F. M., et al., Initial Reports of the Deep Sea Drilling Project, 76, pp.481-493.
Herbin, J.P., Montadert, L., Müller, C., Gomez, R., Thurow, J. and Wiedmann, J., 1986. Organic-rich sedimentation at the Cenomanian-Turonian boundary in oceanic and coastal basins in the North Atlantic and Tethys. Geological Society, London, Special Publications, 21(1), pp.389-422.
Hollister, C.D., Ewing, J.I., Habib, D., Hathaway, J.C., Lancelot, Y., Luterbacher, H., Paulus, F.J., Poag, F.J., Wilcoxon, J.A. and Worstell, P., 1972a. Site 100-Cat Gap. Initial Reports of the Deep-Sea Drilling Project. Edited by CD Hollister and JI Ewing. US Government Printing Office, Washington, DC, pp.75-104.
Hollister, C.D., Ewing, J.I., Habib, D., Hathaway, J.C., Lancelot, Y., Luterbacher, H., Paulus, F.J., Poag, F.J., Wilcoxon, J.A. and Worstell, P., 1972b. Site 105-Lower continental rise hills. Initial Reports of the Deep-Sea Drilling Project. Edited by CD Hollister and JI Ewing. US Government Printing Office, Washington, DC, pp.219-312.
Hu, X., Jansa, L., Wang, C., Sarti, M., Bak, K., Wagreich, M., Michalik, J. and Sotak, J., 2005. Upper Cretaceous oceanic red beds (CORBs) in the Tethys: occurrences, lithofacies, age, and environments. Cretaceous Research, 26(1), pp.3-20.
Jansa, L., Gardner, J.V. and Dean, W.E. 1978. Mesosoiz sequences of the central North Atlantic.
Jansa, L.F., 1981. Mesozoic carbonate platforms and banks of the eastern North American margin. Marine Geology, 44(1-2), pp.97-117.
Jardiné, S., 1967. Spores á expansions en forme d'élateres du Crétacé moyen d'Afrique occidentale. Review of Palaeobotany and Palynology, 1, 1-4.
Jardiné, S. & Magloire, L., 1965. Palynologie et stratigraphie du Crétacé des bassins du Sénégal et de Cote d'Ivoire. Mémoires du Bureau de Recherches Géologiques et Minières, v. 32.
Jeremiah, J., 2001. A Lower Cretaceous nannofossil zonation for the North Sea Basin. Journal of Micropalaeontology, 20(1), pp.45-80.
Kosmos Energy, 2019. Investor Presentation – 3Q 2019 Results. Dallas, Texas. Available from < https://www.kosmosenergy.com/>.
Labails, C., Olivet, J.L., Aslanian, D. and Roest, W.R., 2010. An alternative early opening scenario for the Central Atlantic Ocean. Earth and Planetary Science Letters, 297(3-4), pp.355-368.
Lancelot, Y., Seibold, E., Cepek, P., Dean, W.E., Eremeev, V., Gardner, J.V., Jansa, L., Johnson, D., Kasheninnikov, V., Pflaumann, U., Graham, J., Bukry, D., 1978a. Site 367: Cape Verde Basin. In: Initial Reports of the Deep Sea Drilling Project, 41, pp.163–232.
Central Atlantic DSDP Sites
136
Lancelot, Y., Seibold, E., Cepek, P., Dean, W.E., Eremeev, V., Gardner, J.V., Jansa, L., Johnson, D., Kasheninnikov, V., Pflaumann, U., Graham, J., Bukry, D., 1978b. Site 368: Cape Verde Rise. In: Initial Reports of the Deep Sea Drilling Project, 41, pp.233–326.
Land, L.A., Paull, C.K. and Spiess, F.N., 1999. Abyssal erosion and scarp retreat: Deep Tow observations of the Blake Escarpment and Blake Spur. Marine geology, 160(1-2), pp.63-83.
Latil-Brun, M.V.L. and Lucazeau, F., 1988. Subsidence, extension and thermal history of the West African margin in Senegal. Earth and Planetary Science Letters, 90(2), pp.204-220.
Logothetis, J. 1983. Petrography, Mineralogy, and Geochemistry of Basalts from Hole 534A, Leg 76. In Sheridan, R. E., Gradstein, F. M., et al., Initial Reports of the Deep Sea Drilling Project, 76, pp.713-717.
Luber, T.L., Bulot, L.G., Redfern, J., Nahim, M., Jeremiah, J., Simmons, M., Bodin, S., Frau, C., Bidgood, M., Masrour, M., 2019. A revised chronostratigraphic framework for the Aptian of the Essaouira-Agadir Basin, a candidate type section for the NW African Atlantic Margin. Cretaceous Research 93, 292–317.
Martin, L., Effimoff, I., Medou, J. and Laughland, M., 2010 Hydrocarbon Prospectivity of Offshore Senegal-Unlocking the Door to a New Deepwater Petroleum Province. Search and Discovery Article 10278
Mourlot, Y., 2018a. Contrôles sur la répartition des argiles organiques dans les bassins profonds: cas de l'Atlantique central au Crétacé (Doctoral dissertation).
Mourlot, Y., Calvès, G., Clift, P.D., Baby, G., Chaboureau, A.C. and Raisson, F., 2018b. Seismic stratigraphy of Cretaceous eastern Central Atlantic Ocean: Basin evolution and palaeoceanographic implications. Earth and Planetary Science Letters, 499, pp.107-121.
Müller, C., Schaaf, A. and Sigal, J., 1983. Biochronostratigraphie des formations d'âge crétacé dans les forages du DSDP dans l'Océan Atlantique Nord. Première partie. Revue de l'Institut français du pétrole, 38(6), pp.683-708.
Müller, C., Schaaf, A. and Sigal, J., 1984. Biochronostratigraphie des formations d'âge crétacé dans les forages du DSDP dans l'Océan Atlantique Nord. Deuxième partie. Revue de l'Institut Français du Pétrole, 39(1), pp.3-23.
Ndiaye, M., Ngom, P.M., Gorin, G., Villeneuve, M., Sartori, M. and Medou, J., 2016. A new interpretation of the deep-part of Senegal-Mauritanian Basin in the Diourbel-Thies area by integrating seismic, magnetic, gravimetric and borehole data: Implication for petroleum exploration. Journal of African Earth Sciences, 121, pp.330-341.
Oh, J., Austin Jr, J.A., Phillips, J.D., Coffin, M.F. and Stoffa, P.L., 1995. Seaward-dipping reflectors offshore the southeastern United States: Seismic evidence for extensive volcanism accompanying sequential formation of the Carolina trough and Blake Plateau basin. Geology, 23(1), pp.9-12.
Olsen, P.E., 1980. Triassic and Jurassic formations of the Newark Basin. In Field studies of New Jersey geology and guide to field trips: 52nd annual meeting of the New York State Geological Association, ed. W. Manspeizer (pp. 2-41).
Olsen, P.E., 1997. Stratigraphic record of the early Mesozoic breakup of Pangea in the Laurasia-Gondwana rift system. Annual Review of Earth and Planetary Sciences, 25(1), pp.337-401.
Patriat, M. and Labails, C., 2006. Linking the Canary and Cape-Verde hot-spots, northwest Africa. Marine Geophysical Research, 27(3), pp.201-215.
Pereira, R. and Alves, T.M., 2011. Margin segmentation prior to continental break-up: A seismic–stratigraphic record of multiphased rifting in the North Atlantic (Southwest Iberia). Tectonophysics, 505(1-4), pp.17-34.
Chapter 3
137
Pichel, L.M., Huuse, M., Redfern, J. and Finch, E., 2019. The influence of base-salt relief, rift topography and regional events on salt tectonics offshore Morocco. Marine and Petroleum Geology, 103, pp.87-113.
Poag, C.W., 1991. Rise and demise of the Bahama-Grand Banks gigaplatform, northern margin of the Jurassic proto-Atlantic seaway. Marine Geology, 102(1-4), pp.63-130.
Poppe, L.J., Popenoe, P., Poag, C.W. and Swift, B.A., 1995. Stratigraphic and palaeoenvironmental summary of the south-east Georgia embayment: a correlation of exploratory wells. Marine and petroleum geology, 12(6), pp.677-690.
Posamentier, H.W. and Kolla, V., 2003. Seismic geomorphology and stratigraphy of depositional elements in deep-water settings. Journal of sedimentary research, 73(3), pp.367-388.
Prauss, M.L., 2011. The Cenomanian/Turonian boundary event (CTBE) at Tarfaya, Morocco: Palaeoecological aspects as reflected by marine palynology. Cretaceous Research, 34: 233-256.
Prauss, M.L., 2012. The Cenomanian/Turonian Boundary Event (CTBE) at Tarfaya, Morocco, northwest Africa: Eccentricity controlled water column stratification as major factor for total organic carbon (TOC) accumulation: Evidence form marine palynology. Cretaceous Research, 37: 246-260.
Regali, M.S.P., Uesugui, N. & Santos, A.S., 1974. Palinologia dos sedimentos meso-cenozóicos do Brasil. Bol. Téc. Petrobras, 17 (3), 177-191 & 17 (4): 263-301.
Roth, P.H., 1983 Jurassic and Lower Cretaceous calcareous nannofossils in the western North Atlantic (Site 534 ) : Biostratigraphy , preservation , and some observations on biogeography and paleooceanography, In Sheridan, R.E, Gradstein, F.M. et. al., Initial Reports of the Deep Sea Drilling Project: Vol 76 (U.S. Government Printing Office), pp. 587-621).
Salard-Cheboldaeff, M., 1991. Intertropical African palynostratigraphy from Cretaceous to late Quaternary times. Journal of African Earth Sciences, 11: 1-24.
Sarr, R., 1995. Etude biostratigraphique et paléoenvironnementale des séries d’âge Crétacé terminal à Eocène moyen du Sénégal occidental. Systématique et migration des ostracodes. Systématique et migration des ostracodes. These doctorat d’Etat es Sciences, Université Cheikh Anta Diop, Dakar.
Schlager, W., 1989. Drowning unconformities on carbonate platforms. In: P.D. Crevello, J.L. Wilson, J.F. Sarg and J,F. Read (Editors), Controls on Platform and Basin Develop- ment. Soc. Econ. Paleontol. Mineral. Spec. Publ., 44: 15-26.
Scholle, P.A., 1979. Geological studies of the COST GE-1 well, United States South Atlantic outer continental shelf area. US Department of the Interior, Geological Survey.
Serralheiro, A., 1968. Formacoes sedimentares do arquipélago de Cabo Verde.
Sheridan, R., Gradstein, F., Barnard, L.A., Bliefnick, D.M., Habib, D., Jenden, P.D., Kagami, H., Keenan, E.M., Kostecki, K., Moullade, M., Ogg, J., Roth, P.H. and Shipley, T. 1983. Site 534: Blake Bahama Basin. In Sheridan, R. E., Gradstein, F. M., et al., Initial Reports of the Deep Sea Drilling Project, 76, pp.141-340.
Shipley, T.H., Buffler, R.T. and Watkins, J.S., 1978. Seismic stratigraphy and geologic history of Blake Plateau and adjacent western Atlantic continental margin. AAPG Bulletin, 62(5), pp.792-812.
Sloss, L.L., 1949. Integrated facies analysis. In: Sedimentary facies in geologic history: Conference at meeting of the Geological Society of America held in New York, New York, November 11, 1948 (Vol. 39, p. 91). Geological Society of America.
Sougy, J., 1962. West African fold belt. Geological Society of America Bulletin, 73(7), pp.871-876.
Steiner, M.B. 1983. Paleomagnetism of Middle Jurassic Basalts, Deep Sea Drilling Project Leg 76. In Sheridan, R. E., Gradstein, F. M., et al., Initial Reports of the Deep Sea Drilling Project, 76, pp.705-711.
Central Atlantic DSDP Sites
138
Tari, G., Molnar, J. and Ashton, P., 2003. Examples of salt tectonics from West Africa: a comparative approach. Geological Society, London, Special Publications, 207(1), pp.85-104.
Tremolada, F., Bornemann, A., Bralower, T.J., Koeberl, C. and van de Schootbrugge, B., 2006. Paleoceanographic changes across the Jurassic/Cretaceous boundary: the calcareous phytoplankton response. Earth and Planetary Science Letters, 241(3-4), pp.361-371.
Tucholke, B.E. and Mountain, G.S., 1979. Seismic stratigraphy, lithostratigraphy and paleosedimentation patterns in the North American Basin. Deep drilling results in the Atlantic Ocean: Continental margins and paleoenvironment, 3, pp.58-86.
Vail, P.R., Mitchum, R.M., Shipley, T.H. and Buffler, R.T., 1980. Unconformities of the North Atlantic. Philosophical Transactions of the Royal Society of London. Series A, Mathematical and Physical Sciences, 294(1409), pp.137-155.
Villeneuve, M., Fournier, F., Cirilli, S., Spina, A., Ndiaye, M., Zamba, J., Viseur, S., Borgomano, J. and Ngom, P.M., 2015. Structure of the Paleozoic basement in the Senegalo-Mauritanian basin (West Africa). Bulletin de la Société Géologique de France, 186(2-3), pp.193-203.
Wagner, T., Hofmann, P. and Flögel, S., 2013. Hadley Cell dynamics and Cretaceous black shale sedimentation in the low latitude Atlantic Ocean: Validation against DSDP/ODP core data.
Wilson, M., 1997. Thermal evolution of the Central Atlantic passive margins: continental break-up above a Mesozoic super-plume. Journal of the Geological Society, 154(3), pp.491-495.
Withjack, M.O., Olsen, P.E. and Schlische, R.W., 1995. Tectonic evolution of the Fundy rift basin, Canada: evidence of extension and shortening during passive margin development. Tectonics, 14(2), pp.390-405.
139
4 Cretaceous continental margin evolution
revealed using quantitative seismic geomorphology, offshore northwest Africa
Max Casson1, Gérôme Calvès2, Jonathan Redfern1, Mads Huuse1, Ben Sayers3
1 North Africa Research Group (NARG), Department of Earth and Environmental Sciences, The University of
Manchester, Williamson Building, Oxford Road, Manchester, M13 9PL, UK
2 Université Toulouse 3, Paul Sabatier, Géosciences Environnement Toulouse, 14 avenue Edouard Belin,
31400, Toulouse, France
3 TGS, 1 The Crescent Surbiton, Surrey, KT6 4BN, UK
Casson, M., Calvès, G., Huuse, M., Sayers, B. and Redfern, J., 2020. Cretaceous continental margin evolution
revealed using quantitative seismic geomorphology, offshore northwest Africa. Basin Research.
Quantitative seismic geomorphology, The Gambia
140
4.1 ABSTRACT
The application of high-resolution seismic geomorphology, integrated with lithological data from the
continental margin offshore The Gambia, northwest Africa, documents a complex tectono-stratigraphic
history and seascape evolution through the Cretaceous. This reveals the spatial-temporal evolution of
submarine canyons by quantifying the related basin depositional elements and providing an estimate of
intra- vs extra-basinal sediment budget. The margin developed from the Jurassic to Aptian as a carbonate
escarpment. Subsequently, an Albian-aged wave-dominated delta system prograded to the paleo-shelf
edge. This is the first major delivery of siliciclastic sediment into the basin during the evolution of the
continental margin, with increased sediment input linked to exhumation events of the hinterland.
Subaqueous channel systems (up to 320 m wide) meandered through the pro-delta region reaching the
paleo-shelf edge, where it is postulated they initiated early submarine canyonisation of the margin. The
canyonisation was long-lived (ca. 28 Myr) dissecting the inherited seascape topography. Thirteen submarine
canyons can be mapped, associated with a Late Cretaceous-aged regional composite unconformity (RCU),
classified as shelf-incised or slope-confined. Major knickpoints within the canyons and the sharp inflection
point along the margin are controlled by the lithological contrast between carbonate and siliciclastic subcrop
lithologies. Analysis of the base-of-slope deposits at the terminus of the canyons identifies two end-member
lobe styles, debris-rich and debris-poor, reflecting the amount of carbonate detritus eroded and redeposited
from the escarpment margin (blocks up to ca. 1 km3). The vast majority of canyon-derived sediment (97%)
in the base-of-slope is interpreted as locally derived intra-basinal material. The average volume of sediment
bypassed through shelf-incised canyons is an order of magnitude higher than the slope-confined systems.
These results document a complex mixed margin evolution, with seascape evolution, sedimentation style
and volume controlled by shelf-margin collapse, far-field tectonic activity and the effects of hinterland
rejuvenation of the siliciclastic source.
Key words: submarine canyons; quantitative seismic geomorphology; Central Atlantic; regional composite
unconformity; continental margin sedimentary processes; mixed siliciclastic-carbonate systems
Chapter 4
141
4.2 INTRODUCTION
Continental margins through the rift to drift stages of the Wilson cycle are major archives of the stratigraphic
record (Bond & Kominz, 1988; Bradley, 2008). Following a period of initial extension induced by rifting
processes (McKenzie, 1978), continental breakup and related oceanic crust formation (rift to drift transition)
is typically marked by a break-up unconformity (Braun & Beaumont, 1989). Younger post-rift stratigraphy
traditionally ‘passively’ infills the accommodation generated by thermal subsidence of the margin (Steckler
et al., 1988; Bond et al., 1989). The fill of these basins host 35% of known giant hydrocarbon discoveries
(Mann et al., 2003). These extensive basins have been evaluated in deep-sea boreholes, hydrocarbon
exploration wells, exhumed outcrops, seafloor geophysical and seismic reflection data. Since the first
recognition of ‘Atlantic-type’ margins by Suess in 1885 (Bond & Kominz, 1988), findings from these datasets
have been used to pioneer our understanding of continental margins and to develop fundamental
knowledge of earth system processes, i.e. continental drift (Wegener, 1912). New techniques i.e. seismic
stratigraphy (Mitchum & Vail, 1977), seismic geomorphology (Posamentier & Kolla, 2003) and source-to-
sink analysis (Allen, 2008; Clift et al., 2008; Sømme et al., 2009; Martinsen et al, 2010) have been used to
investigate these continental margin sedimentary systems. These observations document the stratigraphic
record to calibrate studies modelling the solid earth (Granjeon and Joseph, 1999; Burgess, 2001; Moucha et
al., 2008).
Study of continental margin sedimentary systems has remained conventionally divided into siliciclastic and
carbonate realms (Chiarella et al., 2017). Moscardelli et al. (2019) highlighted the apparent lack of complete
examples using modern data to document mixed siliciclastic-carbonate systems in the literature. Mixed
siliciclastic-carbonate systems or ‘mixed systems’ are defined by contemporaneous siliciclastic and
carbonate sedimentation in the stratigraphic record. Mixing occurs across the full length of the depositional
system. Shallow marine to shelf settings exhibit a complex interaction between fluvio-deltaic and shallow
marine siliciclastic systems with intervening carbonate factories (e.g. Chiarella & Longhitano, 2012). Deep-
water settings are significantly different, here mixing occurs when siliciclastic and carbonate sediment is re-
deposited by a range of sedimentary gravity flow types (e.g. Payros and Pujalte, 2008; Playton et al., 2010).
The continental margins of the Central Atlantic developed as mixed systems during the Cretaceous,
subsequently deeply dissected by submarine canyon systems (Meyer, 1989; Mourlot et al., 2018a). Canyons
on continental margins act as key pathways for sediment transported from the shelf to deep basin (Normark
& Piper, 1969; Normark, 1974; Davies et al., 2007; Harris & Whiteway, 2011; Fildani, 2017). The seascape
geomorphology is deeply shaped by these long-lived systems (Pratson et al., 2007). Within this complex
depositional and erosional template, fundamental sedimentary processes persist and carve the morphology
of continental margins: sedimentary gravity flows and mass wasting events (gravitational processes),
modified by along-slope oceanographic currents.
Quantitative seismic geomorphology, The Gambia
142
This study examines a high-resolution three-dimensional (3D) seismic dataset offshore The Gambia,
northwest Africa to study continental margin evolution of a mixed system, whilst examining the style and
evolution of buried submarine canyons with associated base-of-slope deposits (Fig. 4.1). The study area is
located in an important position within the source-to-sink system, covering the shelf, through the slope to
the basin floor (Martinsen et al., 2010). Quantitative seismic geomorphology techniques are used
(Posamentier & Kolla, 2003; Wood, 2007), integrated with exploration and scientific well data to reconstruct
sedimentary processes and margin morphology over million-year geological timescales (Fig. 4.2; Pratson et
al., 2007).
Fig. 4.1 (next page) (A) – Shaded bathymetric and topographic map of northwest Africa showing the present-day structure of the continental margin, with major river systems delineated (blue lines). The M25 (154 Ma) magnetic anomaly is shown as a black line and the continent-ocean boundary (COB) as a red dashed line after Labails et al. (2010). 3D seismic reflection dataset in hydrocarbon exploration blocks A1 and A4, offshore The Gambia (WGS 1984 UTM Zone 28N) is tied to Deep Sea Drilling Project (DSDP) sites 367 and 368 by regional 2D seismic reflection data. The study area covers the present-day basin-to-shelf transition. The location of the well correlation in Fig. 4.2 is shown; see Fig. 4.2 inset for a more detailed map naming the exploration wells. Hydrocarbon accumulations along the margin are displayed. The eastern margin of the Mauritania-Senegal-Guinea-Bissau-Conakry (MSGBC) Basin is defined by the Mauritanide front (Labails et al., 2010). The Mesozoic shelf edge (after Purdy, 1989), Late Cretaceous shoreline and erosion (after Mourlot et al., 2018a), and Casamance failed rift arm (after Long, 2016) are mapped. Present-day canyon systems locations from Wynn (2000a). (B) – Regional cross section based on the 2D seismic line. See Fig. 4.1A for location. TB – Top Basement; TJ – Top Jurassic; TAp – Top Aptian; TA – Top Albian; RCU – Regional Composite Unconformity; BTU – Base Tertiary Unconformity; SF – Seafloor.
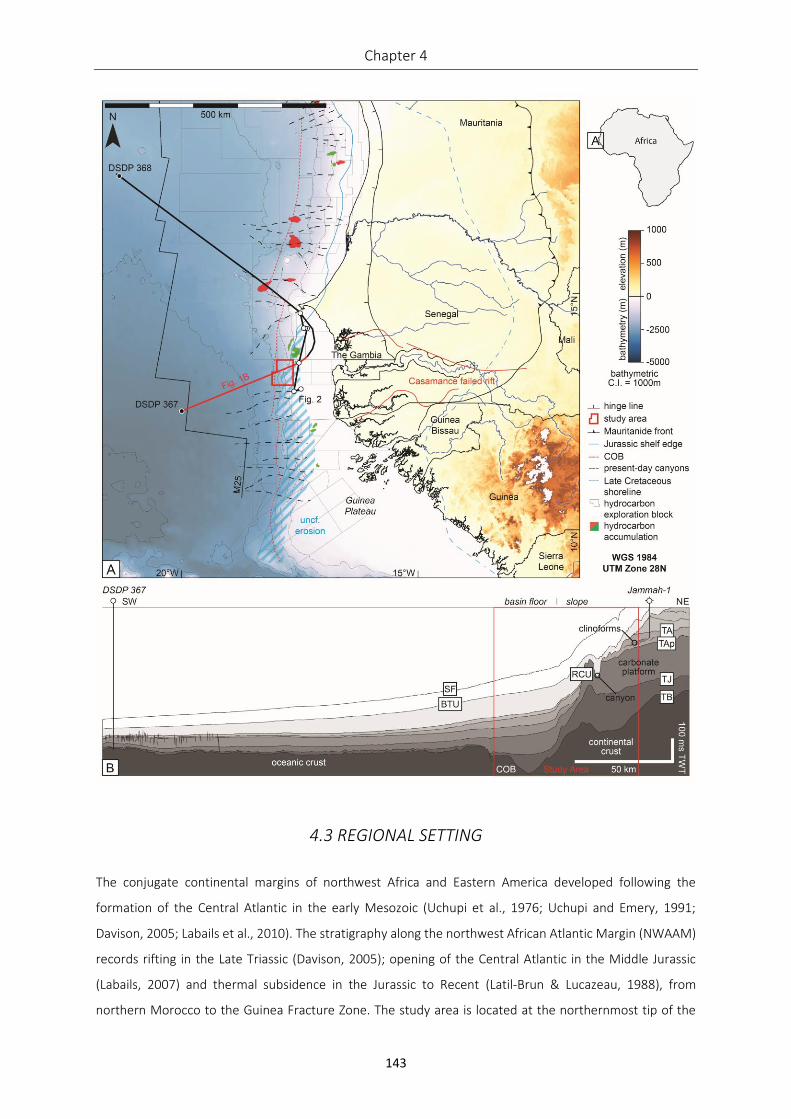
Chapter 4
143
4.3 REGIONAL SETTING
The conjugate continental margins of northwest Africa and Eastern America developed following the
formation of the Central Atlantic in the early Mesozoic (Uchupi et al., 1976; Uchupi and Emery, 1991;
Davison, 2005; Labails et al., 2010). The stratigraphy along the northwest African Atlantic Margin (NWAAM)
records rifting in the Late Triassic (Davison, 2005); opening of the Central Atlantic in the Middle Jurassic
(Labails, 2007) and thermal subsidence in the Jurassic to Recent (Latil-Brun & Lucazeau, 1988), from
northern Morocco to the Guinea Fracture Zone. The study area is located at the northernmost tip of the
Quantitative seismic geomorphology, The Gambia
144
Casamance sub-basin (Fig. 4.1A). The margin is structurally segmented by Pan-African structures and later
transform faults (Brownfield & Charpentier, 2003). The sub-basin contains allochthonous salt that forms
pillows and diapirs (Tari et al., 2003). The study area is located outboard of the Casamance failed rift arm,
which is postulated to have controlled the antecedent drainage of the proto-Gambia river (Fig. 4.1; Long and
Cameron, 2016).
The Mesozoic post-rift evolution of the basin fill initiated with the establishment of an extensive Tethyan-
type carbonate platform surrounding the Central Atlantic margins. During the Albian, the platform died out
as siliciclastic sedimentation proceeded to dominate (Martin et al., 2010). At this time, the opening of the
Equatorial Atlantic gateway influenced paleo-circulation in the Central Atlantic (Forster, 1978) influencing
the depositional systems in the deep basin (Mourlot et al., 2018a) and a transpressional tectonic regime was
established along the southern NWAAM and conjugate Demerara Plateau (Reuber et al., 2016).
Subsequently, Albian deltas prograded across the platform, forming the prolific pro-delta hydrocarbon
reservoirs of the SNE field, Senegal (Clayburn, 2017). The Cenomanian transgression and the altered
circulation patterns associated with the opening of the Equatorial Atlantic formed a coastal upwelling zone
of deeper oceanic water masses off the NWAAM (Arthur et al., 1984). This resulted in deposition of ca. 150
m thick organic-rich interval (av. TOC – 10%; Arthur et al., 1984) on the basin floor (encountered at DSDP
Site 367) onlapping onto the wide transgressed shelf and coastal basin.
The Santonian compressional event (84-80 Ma) associated with Africa-Europe convergence caused inversion
of sedimentary basins in North Africa and at this time there was also a change in the pole of rotation in the
opening Central Atlantic (Labails, 2007). Regional uplift of the NWAAM accompanied these tectonic events,
manifesting as a Late Cretaceous regional composite unconformity (RCU) that can be recognised along the
entirety of the margin south of Dakar (ca. 660 km; Fig. 4.1). This feature has previously been termed the
Senonian unconformity (Tari et al., 2003) and pre-Maastrichtian unconformity (Clayburn, 2017). The
tectonism coincided with relatively high sea level and a transgressed onshore basin during the Late
Cretaceous greenhouse period, implying that tectonism was the primary allogenic control (Fig. 4.1; Haq et
al., 2014). Destabilisation of the distal continental margin resulted in tilting and margin collapse, with erosion
focused at the paleo-shelf edge removing up to 1.5 km of sediment (Fig. 4.1; Tari et al., 2003; Mourlot et al.,
2018a). The margin remains heavily canyonised to present-day (Fig. 4.1; Wynn, 2000a). It is postulated that,
despite the high sea level, uplift was such that the platform was subaerially exposed at this time, resulting
in karstification (Tari et al., 2003; Martin et al., 2010). An increase in sedimentary overburden initiated
differential loading and subsequent salt movement at the base of the carbonate escarpment (Tari et al.,
2003). A major Cenozoic magmatic event affected the area surrounding Dakar, Senegal (Goumbo Lo et al.,
1992).
Chapter 4
145
Historically, the American margin has been a key region for the study of submarine canyons (Miller et al.,
1987; McHugh et al., 1993; Dugan & Flemmings, 2000; Fulthorpe et al., 2000; Mitchell, 2005). Comparatively
less work has documented the African conjugate (Antobreh & Krastel, 2006). However, there is now
increased interest as recent significant hydrocarbon accumulations (e.g. SNE field, Senegal – Clayburn, 2017)
indicate submarine canyons here are an important paleogeomorphic trapping mechanism for oil and gas.
They also spatially control delivery of reservoir sands into the deep basin (e.g. Greater Tortue Ahmeyim field,
Mauritania-Senegal – Kosmos Energy, 2017), and their fill may form attractive hydrocarbon exploration
targets.
4.4. DATASET & METHODS
4.4.1 Data
The subsurface dataset offshore The Gambia consists of a 3D seismic reflection survey covering exploration
blocks A1 and A4, and one regional 2-D seismic tie line linking the 3D survey to DSDP sites 367 and 368
(VER01 MWT). The 3D seismic survey covers an area of 2,566 km2 across the present-day mid to lower slope,
with water depths ranging from 279 to 3524 m. Across all surveys, the seismic data is presented in zero
phase and follows SEG normal polarity convention: where a downward increase in acoustic impedance is
represented by a peak (black) reflection event, and a trough (red) event is associated with the opposite
downward impedance decrease. The bin spacing is 12.5 x 25 m. In the interval of interest (3 – 6.5 s TWT),
the dominant frequency is around 35 Hz. Using an average velocity of 2750 m/s for the overlying Late
Cretaceous to Recent sediments (based on well DKM-2: Fig. 4.2), the vertical resolution (λ/4) is ca. 20 m.
Additionally, wireline data and final well reports from six exploration wells drilled offshore Senegal are
correlated along a 200 km strike profile of the NWAAM (Fig. 4.2; data provided by Petrosen). The gamma
ray log and lithological data for well Jammah-1 offshore The Gambia was published by Clayburn et al., (2017).
4.4.2 Methods
Seismic interpretation of key horizons was performed using the methods of Posamentier (2005; Fig. 4.3).
Age constraints for the key stratigraphic surfaces were attained from nearby exploration wells and
correlated to the 3D seismic dataset using the 2-D regional tie line. The stratigraphy and age model in the
DSDP boreholes have been recently re-evaluated (Mourlot et al., 2018a). Using the available well data, we
have established a correlation between key horizons on the platform, across the escarpment margin, into
the basin.
The RCU (Fig. 4.3; Fig. 4.6A) was manually interpreted and converted to depth using a simple average interval
velocity model (data extrapolated from well DKM-2). We recognise uncertainty is inherent in the depth
Quantitative seismic geomorphology, The Gambia
146
conversion process, however this provides more accurate geometries than a time structure map and was
the best depth conversion method available. The surface was ‘restored’ to depositional geometry by
flattening on the top Aptian horizon (Fig. 4.3). We interpret this horizon to have been a relatively flat
depositional surface at the scale of the study area (horizontal extent of flattened surface and carbonate
platform is 7.5 to 30 km; Fig. 4.6A). This flattened topography is recognised on comparable distal carbonate
platforms (Kenter, 1990). Major structural and tectonic modification of this surface occurred following
canyon incision. The depth-converted surface was exported to ESRI ArcMap v. 10.4.1 and the Arc Hydro
module used to calculate drainage catchments and subsequently flow pathways. This workflow is commonly
used in hydrology to simulate drainage patterns of rivers (Maidment & Morehouse, 2002), and to extract
modern-day submarine drainage (i.e. California margin; Pratson & Ryan, 1996). Flow pathways recording
submarine canyons are labelled from North to South, A1 to M (Fig. 4.6A). From the RCU horizon, there was
further extraction of quantitative seismic geomorphological data to characterise the submarine canyons (Fig.
4.3).
The top Aptian and base Tertiary unconformity were initially interpreted manually. These key surfaces and
the RCU were used to constrain a geo-model in PaleoScan™. Semi-automated seismic interpretation in
PaleoScan™ produced a 200-horizon stack of stratigraphically concordant slices with extracted seismic
attributes such as RMS amplitude (Fig. 4.8) and variance. GeoTeric software was used to perform spectral
decomposition by extracting an amplitude spectrum and assigning each frequency bin, 20-30-40 Hz, with
the colours red, green, blue respectively. These volumes were blended to produce the spectral
decomposition images (Fig. 4.7). Integration of the data from these seismic attributes and acoustic
characteristics was used to identify seismic facies characteristic of deep-water architectural elements
(canyons, channels, lobes, mass transport deposits/MTDs, sediment waves) after Posamentier & Kolla
(2003). These features are associated with specific canyons and plotted against relative time (horizon 1-200)
from the PaleoScan™ model to understand the spatial and temporal evolution of the depositional systems.
A Geobody interpretation in PaleoScan™ was performed to extract quantitative data for the basin deposits
(Table 4.2).
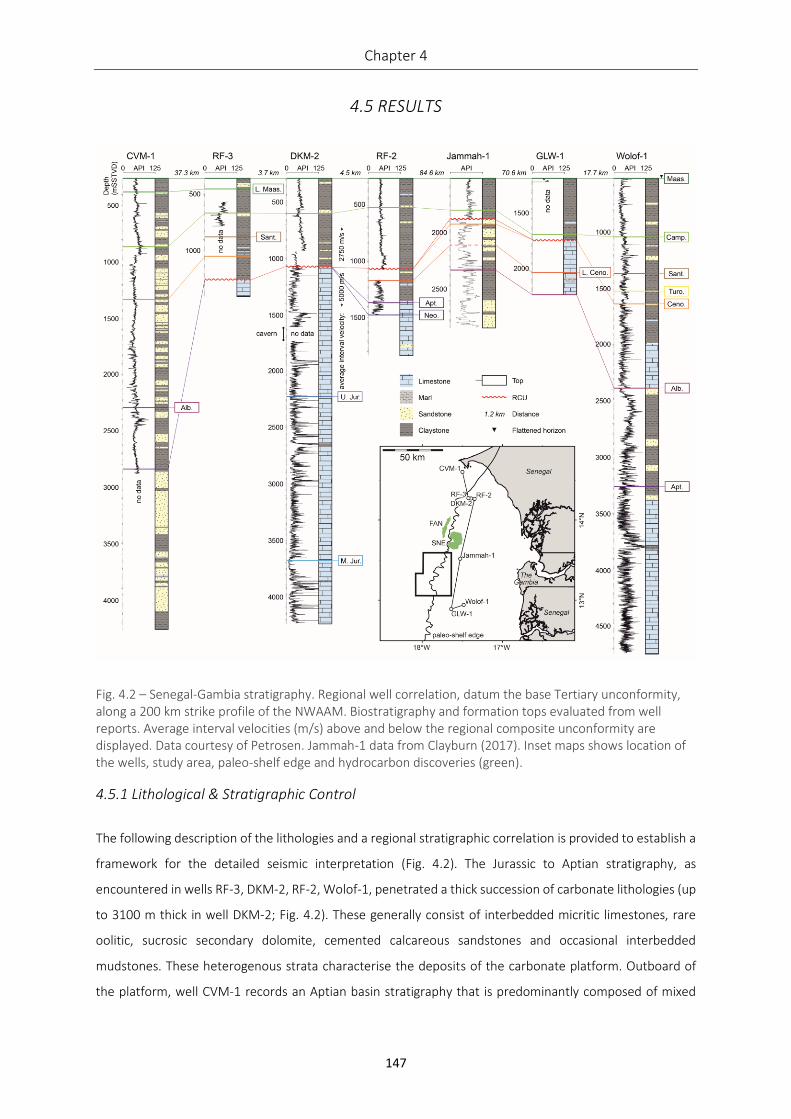
Chapter 4
147
4.5 RESULTS
Fig. 4.2 – Senegal-Gambia stratigraphy. Regional well correlation, datum the base Tertiary unconformity, along a 200 km strike profile of the NWAAM. Biostratigraphy and formation tops evaluated from well reports. Average interval velocities (m/s) above and below the regional composite unconformity are displayed. Data courtesy of Petrosen. Jammah-1 data from Clayburn (2017). Inset maps shows location of the wells, study area, paleo-shelf edge and hydrocarbon discoveries (green).
4.5.1 Lithological & Stratigraphic Control
The following description of the lithologies and a regional stratigraphic correlation is provided to establish a
framework for the detailed seismic interpretation (Fig. 4.2). The Jurassic to Aptian stratigraphy, as
encountered in wells RF-3, DKM-2, RF-2, Wolof-1, penetrated a thick succession of carbonate lithologies (up
to 3100 m thick in well DKM-2; Fig. 4.2). These generally consist of interbedded micritic limestones, rare
oolitic, sucrosic secondary dolomite, cemented calcareous sandstones and occasional interbedded
mudstones. These heterogenous strata characterise the deposits of the carbonate platform. Outboard of
the platform, well CVM-1 records an Aptian basin stratigraphy that is predominantly composed of mixed
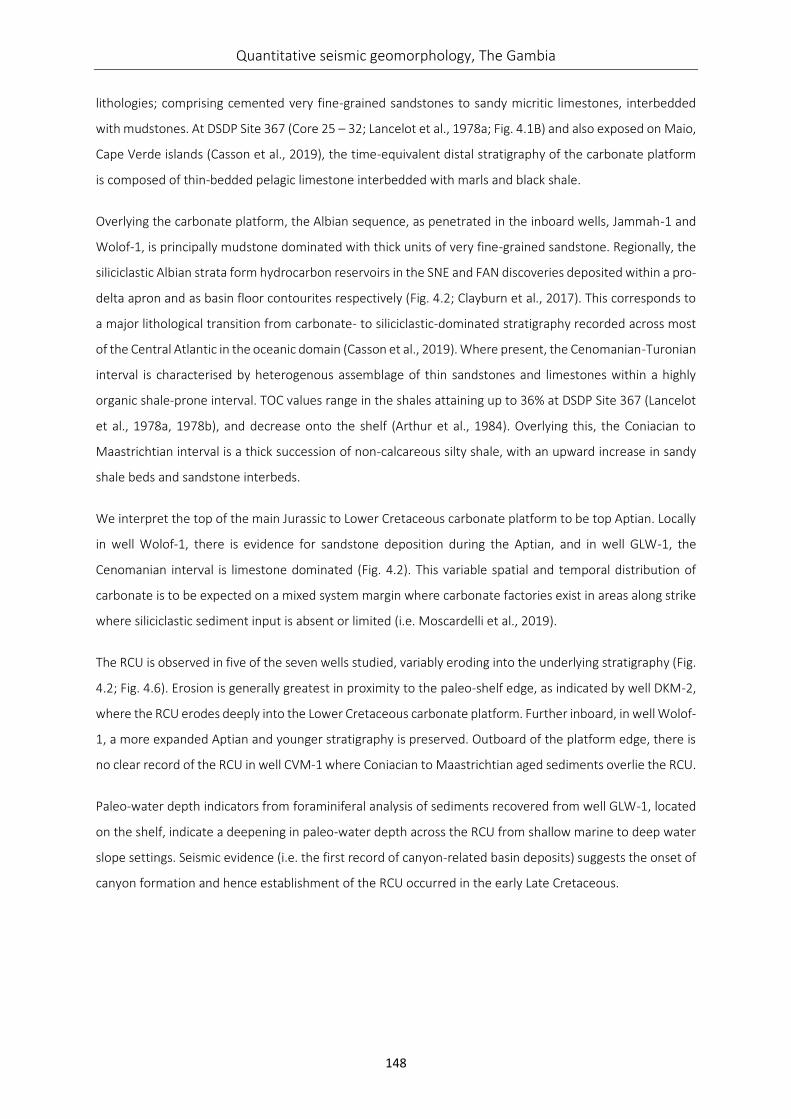
Quantitative seismic geomorphology, The Gambia
148
lithologies; comprising cemented very fine-grained sandstones to sandy micritic limestones, interbedded
with mudstones. At DSDP Site 367 (Core 25 – 32; Lancelot et al., 1978a; Fig. 4.1B) and also exposed on Maio,
Cape Verde islands (Casson et al., 2019), the time-equivalent distal stratigraphy of the carbonate platform
is composed of thin-bedded pelagic limestone interbedded with marls and black shale.
Overlying the carbonate platform, the Albian sequence, as penetrated in the inboard wells, Jammah-1 and
Wolof-1, is principally mudstone dominated with thick units of very fine-grained sandstone. Regionally, the
siliciclastic Albian strata form hydrocarbon reservoirs in the SNE and FAN discoveries deposited within a pro-
delta apron and as basin floor contourites respectively (Fig. 4.2; Clayburn et al., 2017). This corresponds to
a major lithological transition from carbonate- to siliciclastic-dominated stratigraphy recorded across most
of the Central Atlantic in the oceanic domain (Casson et al., 2019). Where present, the Cenomanian-Turonian
interval is characterised by heterogenous assemblage of thin sandstones and limestones within a highly
organic shale-prone interval. TOC values range in the shales attaining up to 36% at DSDP Site 367 (Lancelot
et al., 1978a, 1978b), and decrease onto the shelf (Arthur et al., 1984). Overlying this, the Coniacian to
Maastrichtian interval is a thick succession of non-calcareous silty shale, with an upward increase in sandy
shale beds and sandstone interbeds.
We interpret the top of the main Jurassic to Lower Cretaceous carbonate platform to be top Aptian. Locally
in well Wolof-1, there is evidence for sandstone deposition during the Aptian, and in well GLW-1, the
Cenomanian interval is limestone dominated (Fig. 4.2). This variable spatial and temporal distribution of
carbonate is to be expected on a mixed system margin where carbonate factories exist in areas along strike
where siliciclastic sediment input is absent or limited (i.e. Moscardelli et al., 2019).
The RCU is observed in five of the seven wells studied, variably eroding into the underlying stratigraphy (Fig.
4.2; Fig. 4.6). Erosion is generally greatest in proximity to the paleo-shelf edge, as indicated by well DKM-2,
where the RCU erodes deeply into the Lower Cretaceous carbonate platform. Further inboard, in well Wolof-
1, a more expanded Aptian and younger stratigraphy is preserved. Outboard of the platform edge, there is
no clear record of the RCU in well CVM-1 where Coniacian to Maastrichtian aged sediments overlie the RCU.
Paleo-water depth indicators from foraminiferal analysis of sediments recovered from well GLW-1, located
on the shelf, indicate a deepening in paleo-water depth across the RCU from shallow marine to deep water
slope settings. Seismic evidence (i.e. the first record of canyon-related basin deposits) suggests the onset of
canyon formation and hence establishment of the RCU occurred in the early Late Cretaceous.
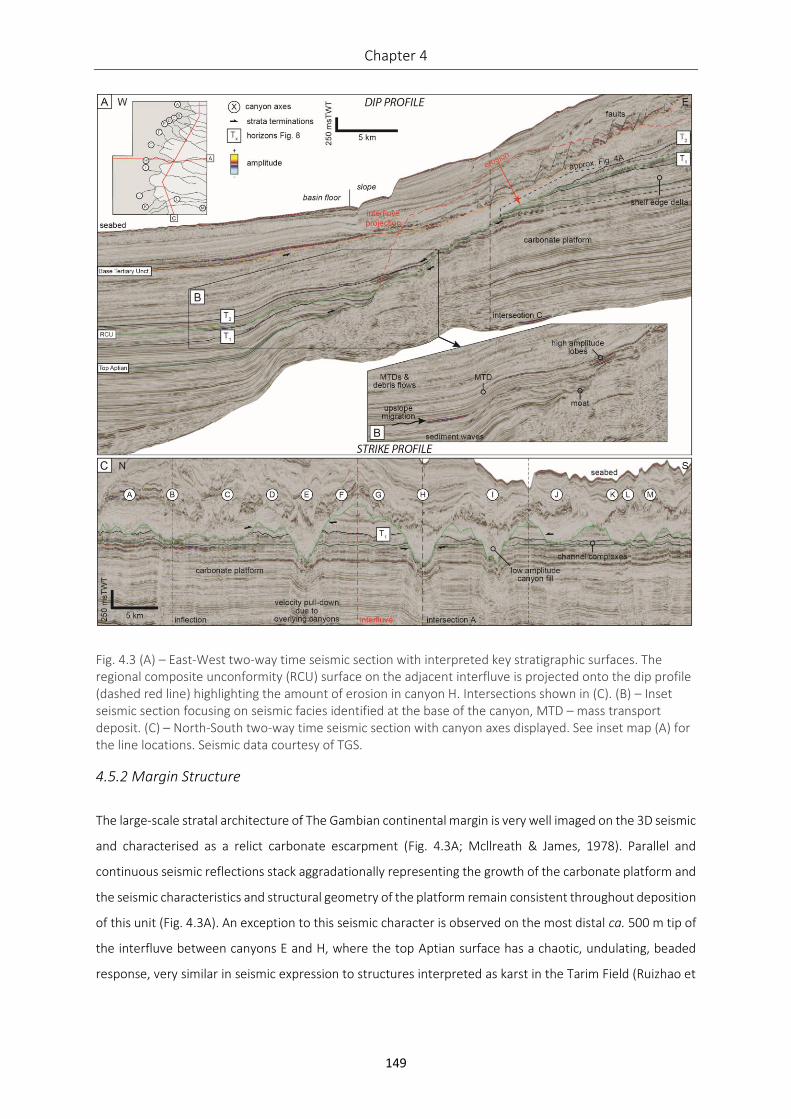
Chapter 4
149
Fig. 4.3 (A) – East-West two-way time seismic section with interpreted key stratigraphic surfaces. The regional composite unconformity (RCU) surface on the adjacent interfluve is projected onto the dip profile (dashed red line) highlighting the amount of erosion in canyon H. Intersections shown in (C). (B) – Inset seismic section focusing on seismic facies identified at the base of the canyon, MTD – mass transport deposit. (C) – North-South two-way time seismic section with canyon axes displayed. See inset map (A) for the line locations. Seismic data courtesy of TGS.
4.5.2 Margin Structure
The large-scale stratal architecture of The Gambian continental margin is very well imaged on the 3D seismic
and characterised as a relict carbonate escarpment (Fig. 4.3A; Mcllreath & James, 1978). Parallel and
continuous seismic reflections stack aggradationally representing the growth of the carbonate platform and
the seismic characteristics and structural geometry of the platform remain consistent throughout deposition
of this unit (Fig. 4.3A). An exception to this seismic character is observed on the most distal ca. 500 m tip of
the interfluve between canyons E and H, where the top Aptian surface has a chaotic, undulating, beaded
response, very similar in seismic expression to structures interpreted as karst in the Tarim Field (Ruizhao et
Quantitative seismic geomorphology, The Gambia
150
al., 2017). Martin et al. (2010) and Clayburn et al. (2017) found similar features in the top of the carbonate
platform adjacent to the study area. Seismic reflections did not indicate any reef body characteristics.
Only one major NNE-trending post-depositional normal fault is observed in the south of the study area within
the carbonate platform with minor offset (ca. 50 ms TWT). The time-equivalent deposits in the basin are
thinner than the carbonate platform (ca. 1200 vs. 1800 ms TWT maximum thickness, Fig. 4.3A), onlapping
the carbonate platform interfluve. This architecture can be classified as an escarpment bypass margin
considered to be a decoupled sedimentary system, where a bypass surface of non-deposition separates
coeval platform margin and slope-to-basin deposits (Playton et al., 2010).
Stratal evolution can be used for further classification of escarpment margins as inherited or growth (Playton
et al., 2010). Fig. 4.3 shows the progression from an accretionary margin with coupled systems (i.e. Lower
Jurassic, Morocco – Kenter & Campbell, 1991) to escarpment stratal patterns indicating a growth
escarpment margin (Playton et al., 2010). The carbonate platform did not form above high-relief antecedent
topography as indicated by the relatively sub-parallel seismic reflection of the acoustic basement above
extended continental crust (Mourlot et al., 2018a). The subsequent post carbonate platform margin
structure and depositional systems were heavily influenced by this early stratal architecture and the
inflection point in the slope profile.
Fig. 4.4 (A) – Interpreted dip two-way time seismic section of the progradational shelf edge delta shown in Fig. 4.3A. Section flattened on the top Aptian surface shown in Fig. 4.3A to ‘restore’ the depositional geometry. (B) – Interpreted strike two-way time seismic section. Only seismic data between the regional composite unconformity (RCU) and -20 ms TWT below the top Aptian is shown. See inset map (A) and Fig. 4.5C for the line locations. Seismic data courtesy of TGS.
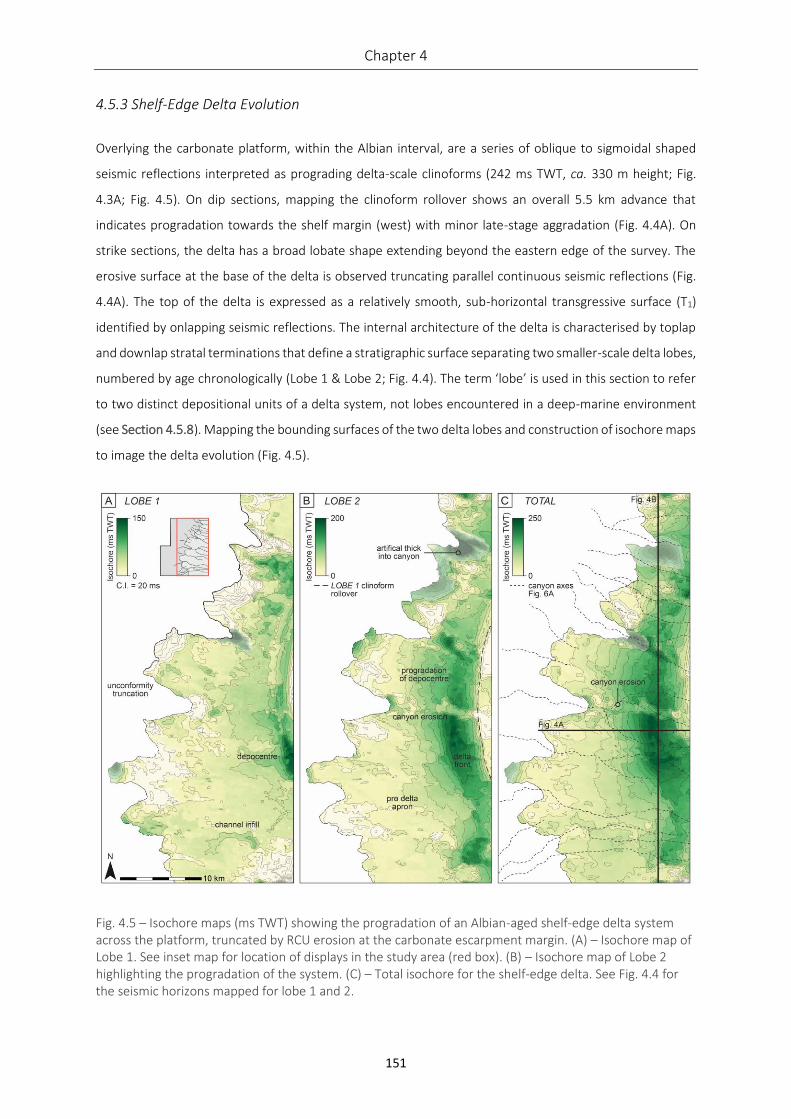
Chapter 4
151
4.5.3 Shelf-Edge Delta Evolution
Overlying the carbonate platform, within the Albian interval, are a series of oblique to sigmoidal shaped
seismic reflections interpreted as prograding delta-scale clinoforms (242 ms TWT, ca. 330 m height; Fig.
4.3A; Fig. 4.5). On dip sections, mapping the clinoform rollover shows an overall 5.5 km advance that
indicates progradation towards the shelf margin (west) with minor late-stage aggradation (Fig. 4.4A). On
strike sections, the delta has a broad lobate shape extending beyond the eastern edge of the survey. The
erosive surface at the base of the delta is observed truncating parallel continuous seismic reflections (Fig.
4.4A). The top of the delta is expressed as a relatively smooth, sub-horizontal transgressive surface (T1)
identified by onlapping seismic reflections. The internal architecture of the delta is characterised by toplap
and downlap stratal terminations that define a stratigraphic surface separating two smaller-scale delta lobes,
numbered by age chronologically (Lobe 1 & Lobe 2; Fig. 4.4). The term ‘lobe’ is used in this section to refer
to two distinct depositional units of a delta system, not lobes encountered in a deep-marine environment
(see Section 4.5.8). Mapping the bounding surfaces of the two delta lobes and construction of isochore maps
to image the delta evolution (Fig. 4.5).
Fig. 4.5 – Isochore maps (ms TWT) showing the progradation of an Albian-aged shelf-edge delta system across the platform, truncated by RCU erosion at the carbonate escarpment margin. (A) – Isochore map of Lobe 1. See inset map for location of displays in the study area (red box). (B) – Isochore map of Lobe 2 highlighting the progradation of the system. (C) – Total isochore for the shelf-edge delta. See Fig. 4.4 for the seismic horizons mapped for lobe 1 and 2.
Quantitative seismic geomorphology, The Gambia
152
The depocentre of delta lobe 1 is located centrally within the study area, in a more proximal position on the
shelf than delta lobe 2 (Fig. 4.5). Lobe 1 shows significant thinning towards the shelf edge (RCU truncation)
with discrete areas of sediment accumulation scattered across the distal pro-delta, potentially representing
the infill of subaqeous channel systems (Fig. 4.5A). Deposition appears focused at the delta front during the
deposition of both lobes represented by the thickest deposits (Fig. 4.5). Lobe 2 is volumetrically greater than
Lobe 1 and progrades further into the basin. Clinoforms in lobe 2 slightly downstep and show offlap
geometries (Fig. 4.4A) resulting in thinning of Lobe 2 to the east of the lobe 1 clinoform rollover as a result
of compensational stacking (Fig. 4.5B).
The presence of delta-scale clinoforms in close proximity to the shelf edge and the characteristic morphology
is indicative of a shelf-edge delta, comparable to examples from the Gulf of Mexico (i.e. Sylvester et al., 2012.
The delta prograded across the relict carbonate escarpment margin (e.g. Steel et al., 2003). The clinoforms
have a lobate-to-arcuate planform shape, identified in the tripartite classification scheme of Galloway (1975)
as being a likely wave influenced fluvial system (Fig. 4.4; Fig. 4.6A). Further characterisation following the
criteria defined by Patruno et al., (2015) suggests the geometry of the clinoforms is indicative of subaqueous
deposition in a stepped deltaic system. Therefore, the paleo-water depth at the subaqueous clinoform
rollover would not be more than 60 m on the shelf, increasing outboard onto the outer shelf (Patruno et al.,
2015).
Beyond the delta clinoforms, multiple subaqueous channel complexes, with a maximum width of ca. 320 m,
are observed migrating across the remainder of the shelf (Fig. 4.7A), with their infill forming accumulations
in the pro-delta apron (Fig. 4.5). These channels form highly sinuous systems present across the entire shelf,
indicating there was no significant paleo-topography capable of diverting or capturing the channels in this
interval between the delta and paleo-shelf edge. Most channels appear linked to Lobe 2, however earlier
channels in this pro-delta area may have been cannibalised by subsequent channels associated with Lobe 2.
Due to erosion by the RCU, the terminus of the channel systems cannot be observed, although
approximately half are observed to be offset from the canyon axes, indicating these channels did not
contribute to the initial formation of the observed later canyon systems.
Fig. 4.6 (next page) (A) – Depth structure map (contours), draped over a dip magnitude map, showing the regional composite unconformity (RCU) surface and the heavily canyonised carbonate escarpment margin. Arc Hydro™ computed flow pathways are displayed (solid white lines), lettered and cross-referenced in the following figures. (B) – Rose diagram showing the flow direction of each vertices from the flow pathways. (C) – Talweg longitudinal slope profiles of 13 canyons and a interfluve surface shown in (A). A major knickpoint zone exists between -3600 and -4100 m present-day depth (shown in grey shading) corresponding to the change in lithology at the subcrop of the top carbonate, see (A). (D) – Slope angle versus length along talweg longitudinal profile for two major canyons. Fine line sampled every vertices, bold averaged over 10 vertices. (E) – Canyon cross-profiles sampled every 1.5 km along the talweg longitudinal profile, locations displayed on Fig. 4.6A (white dashed lines).
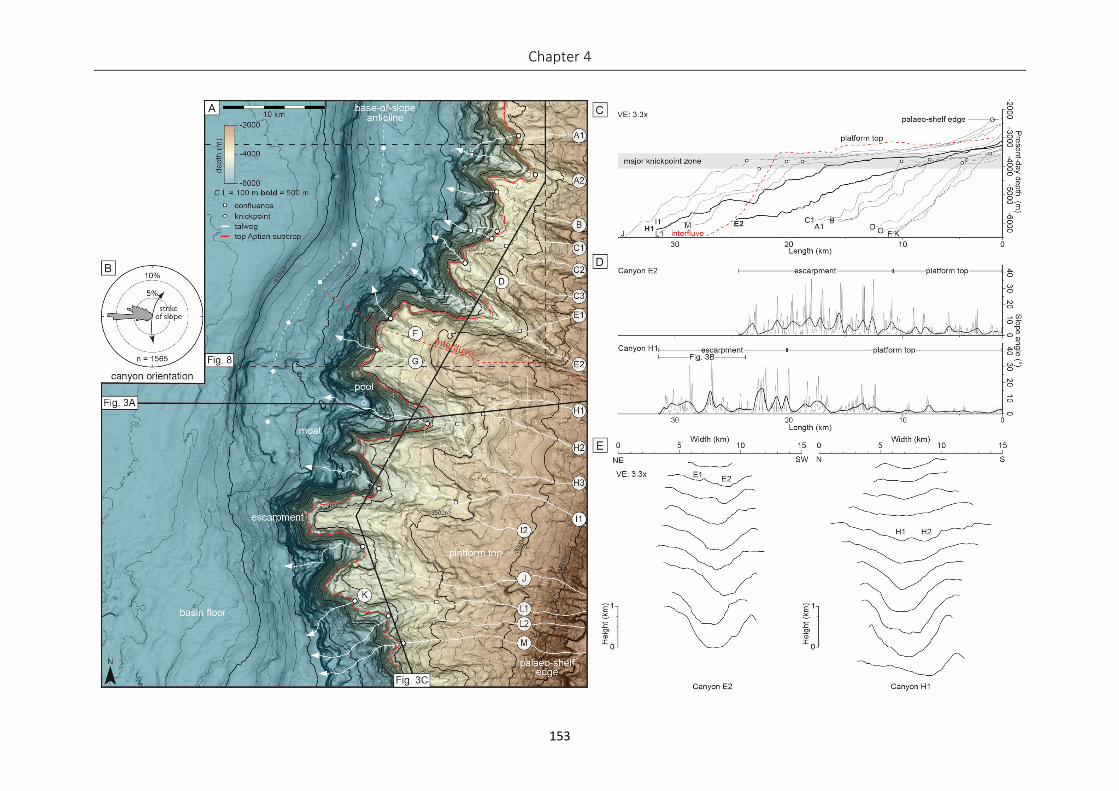
Chapter 4
153
Quantitative seismic geomorphology, The Gambia
154
4.5.4 Canyon Incision
Prior to major canyon incision, the upper part of the continental slope would have had two contrasting
subcropping lithologies separated at the top Aptian subcrop surface (Fig. 4.2; Fig. 4.3A; Fig. 4.6A). Carbonate
sediments would outcrop on the exposed escarpment, however, to the east at the top Aptian subcrop (Fig.
4.6A), siliciclastic sediments introduced by the shelf-edge delta system and overlying transgressive
sediments would be present. Hence, later canyonisation eroded into a variable-lithology paleo-seafloor. The
paleo-topography and margin geometry of the study area in the Aptian can be characterised as a low-relief
platform top/shelf. This extends to the steep carbonate escarpment that has an average dip angle of 18.8°,
with a maximum angle of 83.3° in the canyon walls and a relief from basin floor to shelf of up to ca. 1.5 km
(Fig. 4.6A). Slope gradient increases significantly to the west and downdip of the sub-cropping top Aptian
surface before flattening out on to the basin floor.
4.5.5 Quantitative seismic geomorphology
Analysing the flow pathways over the RCU surface reveal 13 submarine canyons or tributaries (A1 – M) that
are orientated perpendicular to the margin (Fig. 4.6A; Fig. 4.6B). The main flow pathway trend is to the west
(Fig. 4.6B), with a minor WNW trend primarily observed in the north of the dataset. These features variably
erode into the underlying stratigraphy along a ca. 56 km length of the slope with an average spacing of ca.
4 km. This average canyon spacing is significantly smaller than any modern-day canyon system as recorded
by Harris and Whiteway (2011; data resolution 1-2 km), with the average value for modern canyon spacing
on continental margins worldwide being 39 km.
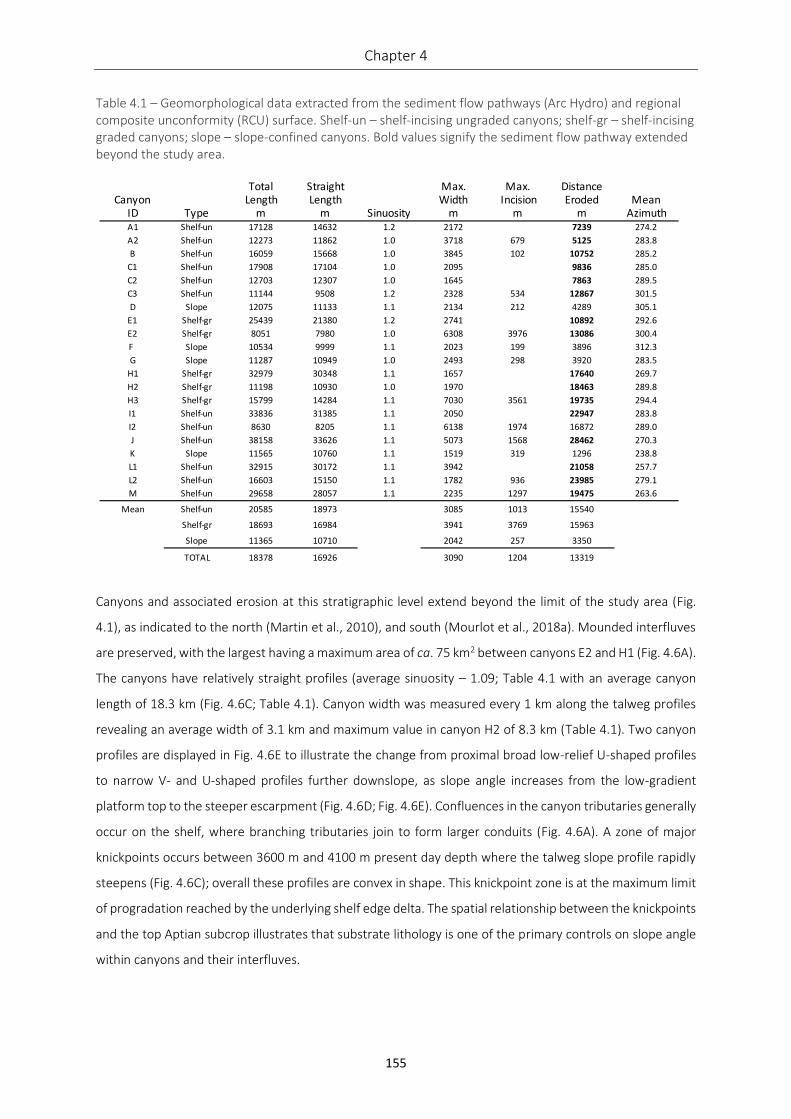
Chapter 4
155
Table 4.1 – Geomorphological data extracted from the sediment flow pathways (Arc Hydro) and regional composite unconformity (RCU) surface. Shelf-un – shelf-incising ungraded canyons; shelf-gr – shelf-incising graded canyons; slope – slope-confined canyons. Bold values signify the sediment flow pathway extended beyond the study area.
Canyons and associated erosion at this stratigraphic level extend beyond the limit of the study area (Fig.
4.1), as indicated to the north (Martin et al., 2010), and south (Mourlot et al., 2018a). Mounded interfluves
are preserved, with the largest having a maximum area of ca. 75 km2 between canyons E2 and H1 (Fig. 4.6A).
The canyons have relatively straight profiles (average sinuosity – 1.09; Table 4.1 with an average canyon
length of 18.3 km (Fig. 4.6C; Table 4.1). Canyon width was measured every 1 km along the talweg profiles
revealing an average width of 3.1 km and maximum value in canyon H2 of 8.3 km (Table 4.1). Two canyon
profiles are displayed in Fig. 4.6E to illustrate the change from proximal broad low-relief U-shaped profiles
to narrow V- and U-shaped profiles further downslope, as slope angle increases from the low-gradient
platform top to the steeper escarpment (Fig. 4.6D; Fig. 4.6E). Confluences in the canyon tributaries generally
occur on the shelf, where branching tributaries join to form larger conduits (Fig. 4.6A). A zone of major
knickpoints occurs between 3600 m and 4100 m present day depth where the talweg slope profile rapidly
steepens (Fig. 4.6C); overall these profiles are convex in shape. This knickpoint zone is at the maximum limit
of progradation reached by the underlying shelf edge delta. The spatial relationship between the knickpoints
and the top Aptian subcrop illustrates that substrate lithology is one of the primary controls on slope angle
within canyons and their interfluves.
Total Straight Max. Max. DistanceCanyon Length Length Width Incision Eroded Mean
ID Type m m Sinuosity m m m AzimuthA1 Shelf-un 17128 14632 1.2 2172 7239 274.2
A2 Shelf-un 12273 11862 1.0 3718 679 5125 283.8
B Shelf-un 16059 15668 1.0 3845 102 10752 285.2
C1 Shelf-un 17908 17104 1.0 2095 9836 285.0
C2 Shelf-un 12703 12307 1.0 1645 7863 289.5
C3 Shelf-un 11144 9508 1.2 2328 534 12867 301.5
D Slope 12075 11133 1.1 2134 212 4289 305.1
E1 Shelf-gr 25439 21380 1.2 2741 10892 292.6
E2 Shelf-gr 8051 7980 1.0 6308 3976 13086 300.4
F Slope 10534 9999 1.1 2023 199 3896 312.3
G Slope 11287 10949 1.0 2493 298 3920 283.5
H1 Shelf-gr 32979 30348 1.1 1657 17640 269.7
H2 Shelf-gr 11198 10930 1.0 1970 18463 289.8
H3 Shelf-gr 15799 14284 1.1 7030 3561 19735 294.4
I1 Shelf-un 33836 31385 1.1 2050 22947 283.8
I2 Shelf-un 8630 8205 1.1 6138 1974 16872 289.0
J Shelf-un 38158 33626 1.1 5073 1568 28462 270.3
K Slope 11565 10760 1.1 1519 319 1296 238.8
L1 Shelf-un 32915 30172 1.1 3942 21058 257.7
L2 Shelf-un 16603 15150 1.1 1782 936 23985 279.1
M Shelf-un 29658 28057 1.1 2235 1297 19475 263.6
Mean Shelf-un 20585 18973 3085 1013 15540
Shelf-gr 18693 16984 3941 3769 15963
Slope 11365 10710 2042 257 3350
TOTAL 18378 16926 3090 1204 13319
Quantitative seismic geomorphology, The Gambia
156
4.5.6 Canyon Classification
Models for formative processes have been developed following the early identification of submarine
canyons by Shepard (1934). Submarine canyons are typically classified based on the degree of incision into
the shelf and slope (Twichell & Roberts, 1982; Farre et al., 1983; Brothers et al., 2013; e.g. siliciclastic system
– Jobe et al., 2011; mixed system – Puga-Bernabéu et al., 2011; global review – Harris & Whiteway, 2011),
and/or morphological criteria (Tournadour et al., 2017). A geomorphological approach was proposed by
Puga-Bernabéu et al., (2011). Jobe et al., (2011) proposed a more holistic classification incorporating
depositional processes and canyon-fill. In this study these methodologies have been combined to provide a
template for the classification of the canyons offshore The Gambia, the key discriminator being whether the
canyons incise the shelf or not. This allows definition of two primary types; 1. shelf-incised and 2. slope-
confined systems (otherwise known as blind or headless canyons, Amblas et al., 2006). We further subdivide
shelf-incised canyons dependent on the degree of erosion within the canyon long profile, as: 1A. graded
versus 1B. un-graded (Mitchell, 2005). Previous workers have suggested that slope-confined and shelf-
incised canyons represent the primary and secondary stages respectively of canyon evolution, potentially
indicating the relative ages of canyons along the margin (McGregor, 1985; Dingle & Robson, 1985; Nelson &
Maldonado, 1988; Klaus & Taylor, 1991).
Based on this classification, Table 4.1 summarises the main geomorphological parameters extracted from
the canyonised RCU surface (Table 4.1; Fig. 4.6A). Shelf-incised canyons erode into the shelf and extend a
greater distance from the escarpment margin (average distance eroded from paleo-shelf edge 15.7 km),
whereas slope-confined canyons are confined to the escarpment. Only two canyons display the
characteristics of graded shelf-incised canyons based on their relatively smooth long profiles in Fig. 4.6C,
canyons E2 and H1; the remainder have irregular concave upwards profiles. Canyon heads vary from pointed
(slope-confined canyons) to amphitheatre-shaped at the paleo-shelf edge (Fig. 4.6A), however the dataset
does not cover the upper reaches (origin) of these canyons in the north. Canyon width, length and incision
depth commonly decreases from graded to ungraded shelf-incised canyons to slope-confined canyons
(Table 4.1).
4.5.7 Formation Processes
Two models are proposed and well supported by modern day examples for the formation of canyons on
continental margins (summarised in Pratson et al., 2007): downslope erosion (Daly, 1936) and retrogressive
failure (Twichell & Roberts, 1982; Farre et al., 1983). Downslope erosion by sediment gravity flows with a
variety of trigger mechanisms that create incisions in the slope, subsequently enlarged by later flows to
establish a canyon; and retrogressive failure, a result of mass movement due to slope failure that migrates
erosion upslope. These processes propagate in opposite directions, can occur coevally (Pratson & Coakley,
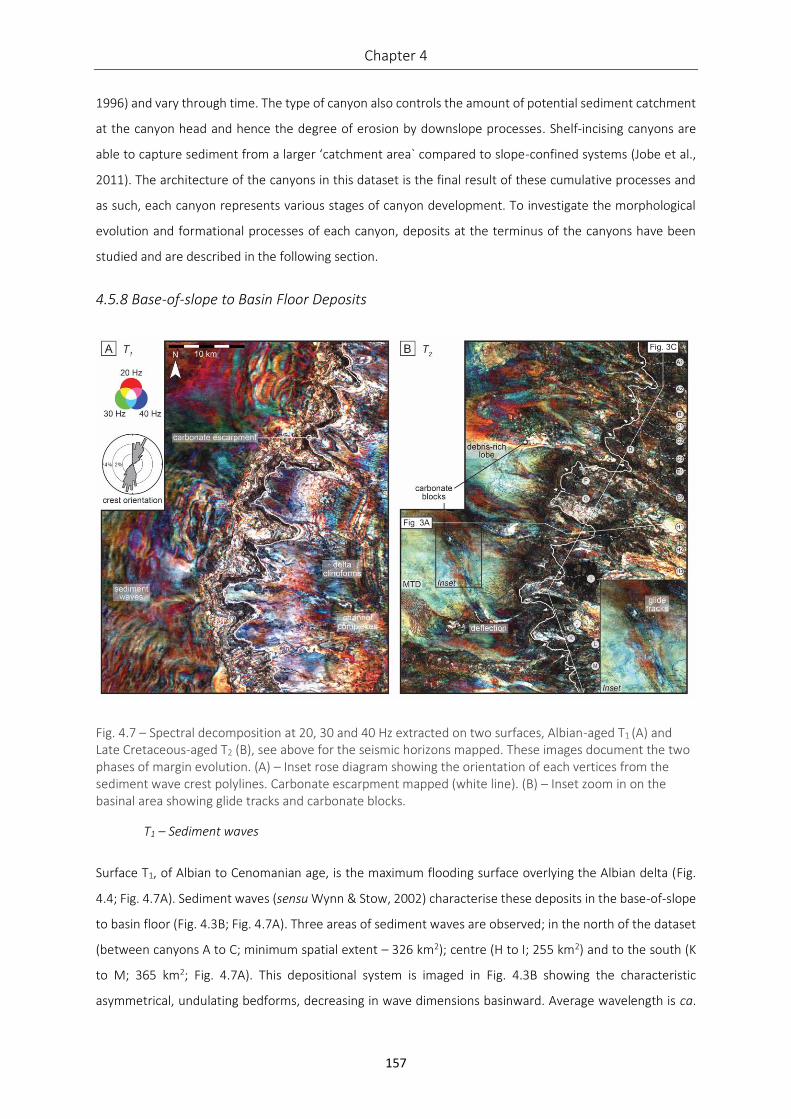
Chapter 4
157
1996) and vary through time. The type of canyon also controls the amount of potential sediment catchment
at the canyon head and hence the degree of erosion by downslope processes. Shelf-incising canyons are
able to capture sediment from a larger ‘catchment area` compared to slope-confined systems (Jobe et al.,
2011). The architecture of the canyons in this dataset is the final result of these cumulative processes and
as such, each canyon represents various stages of canyon development. To investigate the morphological
evolution and formational processes of each canyon, deposits at the terminus of the canyons have been
studied and are described in the following section.
4.5.8 Base-of-slope to Basin Floor Deposits
Fig. 4.7 – Spectral decomposition at 20, 30 and 40 Hz extracted on two surfaces, Albian-aged T1 (A) and Late Cretaceous-aged T2 (B), see above for the seismic horizons mapped. These images document the two phases of margin evolution. (A) – Inset rose diagram showing the orientation of each vertices from the sediment wave crest polylines. Carbonate escarpment mapped (white line). (B) – Inset zoom in on the basinal area showing glide tracks and carbonate blocks.
T1 – Sediment waves
Surface T1, of Albian to Cenomanian age, is the maximum flooding surface overlying the Albian delta (Fig.
4.4; Fig. 4.7A). Sediment waves (sensu Wynn & Stow, 2002) characterise these deposits in the base-of-slope
to basin floor (Fig. 4.3B; Fig. 4.7A). Three areas of sediment waves are observed; in the north of the dataset
(between canyons A to C; minimum spatial extent – 326 km2); centre (H to I; 255 km2) and to the south (K
to M; 365 km2; Fig. 4.7A). This depositional system is imaged in Fig. 4.3B showing the characteristic
asymmetrical, undulating bedforms, decreasing in wave dimensions basinward. Average wavelength is ca.
Quantitative seismic geomorphology, The Gambia
158
325 m and average trough-to-crest height is ca. 15 m. Orientation data extracted from digitized wave crests
shows a dominant NNE-SSW trend, aligned parallel to the strike of the regional slope (Fig. 4.7A). A 10 km
long moat is present at the base of the escarpment margin (Fig. 4.3B), separating the sediment wave field
from the escarpment. Crest curvature has an upslope convexity, possibly indicating up-current migration
(i.e. antidunes; Wynn et al. 2000b; Fildani et al., 2006; Fildani et al., 2013). Following the classification of
Wynn & Stow (2002), we propose that these sediment waves likely formed by downslope-flowing turbidity
currents originating from subaqueous channel complexes imaged in Fig. 4.7A (Fildani et al., 2013). However,
this classification is based on geomorphological parameters of sediment waves and deducing their formative
processes remains unclear (McCave, 2017). Cretaceous contour-parallel currents have been postulated
along this margin (Mourlot et al., 2018a). Without lithological calibration, we can only postulate based on
the morphology described that the systems are fine-grained (sensu Wynn & Stow, 2002).
T2 – Margin collapse
The T2 surface is Late Cretaceous in age and illustrates a variety of deposits in the basin associated with the
margin collapse (Fig. 4.7B). A total of 58 geobodies at the base-of-slope to basin floor are interpreted
through 200 horizon slices from the top Aptian to the base Tertiary unconformity surface, and
geomorphological data extracted (Table 4.2). The spectral decomposition of surface T2 allows the
visualisation of some of these depositional systems and facies (Fig. 4.7B). Two end-member styles of lobate
deposits are observed originating from canyons (Fig. 4.8). Earlier lobes are predominately debris-poor,
lacking seismically resolvable blocks and have an elongate lobate shape (Fig. 4.8A). Whereas later lobes are
debris-rich containing blocks of the eroded carbonate platform up to 0.92 km2, with some blocks observed
beyond the lobate bodies termed ‘outrunner blocks’ (Fig. 4.8B). In total, three seismic facies dominate in
this region, lobes (debris-poor vs. debris-rich; Fig. 4.8) and mass transport deposits (MTDs).
Table 4.2 (next page) – Geomorphological data extracted from the PaleoScan™ horizon stack and interpreted geobodies. Bold values signify the deposit extended beyond the study area. DP – debris-poor lobes; DR – debris-rich lobes; MTD – mass transport deposit.
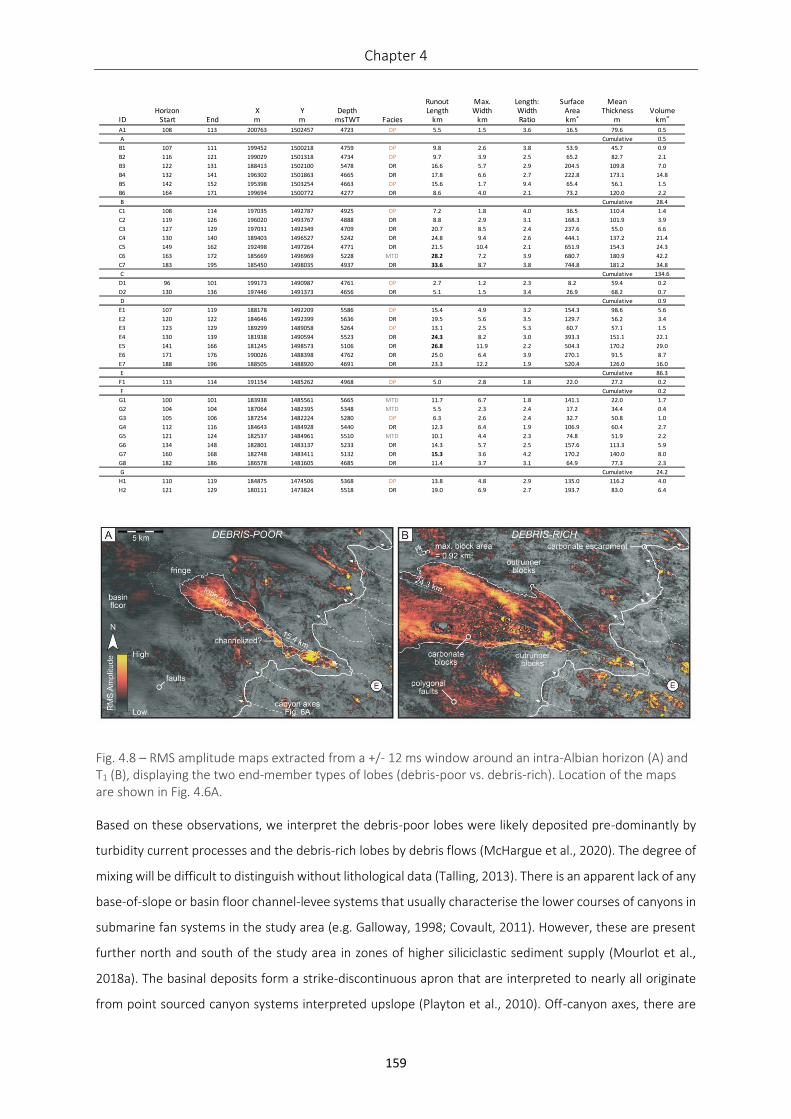
Chapter 4
159
Fig. 4.8 – RMS amplitude maps extracted from a +/- 12 ms window around an intra-Albian horizon (A) and T1 (B), displaying the two end-member types of lobes (debris-poor vs. debris-rich). Location of the maps are shown in Fig. 4.6A.
Based on these observations, we interpret the debris-poor lobes were likely deposited pre-dominantly by
turbidity current processes and the debris-rich lobes by debris flows (McHargue et al., 2020). The degree of
mixing will be difficult to distinguish without lithological data (Talling, 2013). There is an apparent lack of any
base-of-slope or basin floor channel-levee systems that usually characterise the lower courses of canyons in
submarine fan systems in the study area (e.g. Galloway, 1998; Covault, 2011). However, these are present
further north and south of the study area in zones of higher siliciclastic sediment supply (Mourlot et al.,
2018a). The basinal deposits form a strike-discontinuous apron that are interpreted to nearly all originate
from point sourced canyon systems interpreted upslope (Playton et al., 2010). Off-canyon axes, there are
Runout Max. Length: Surface MeanHorizon X Y Depth Length Width Width Area Thickness Volume
ID Start End m m msTWT Facies km km Ratio km2
m km3
A1 108 113 200763 1502457 4723 DP 5.5 1.5 3.6 16.5 79.6 0.5
A Cumulative 0.5
B1 107 111 199452 1500218 4759 DP 9.8 2.6 3.8 53.9 45.7 0.9
B2 116 121 199029 1501318 4734 DP 9.7 3.9 2.5 65.2 82.7 2.1
B3 122 131 188413 1502100 5478 DR 16.6 5.7 2.9 204.5 109.8 7.0
B4 132 141 196302 1501863 4665 DR 17.8 6.6 2.7 222.8 173.1 14.8
B5 142 152 195398 1503254 4663 DP 15.6 1.7 9.4 65.4 56.1 1.5
B6 164 171 199694 1500772 4277 DR 8.6 4.0 2.1 73.2 120.0 2.2
B Cumulative 28.4
C1 108 114 197035 1492787 4925 DP 7.2 1.8 4.0 36.5 110.4 1.4
C2 119 126 196020 1493767 4888 DR 8.8 2.9 3.1 168.3 101.9 3.9
C3 127 129 197031 1492349 4709 DR 20.7 8.5 2.4 237.6 55.0 6.6
C4 130 140 189403 1496527 5242 DR 24.8 9.4 2.6 444.1 137.2 21.4
C5 149 162 192498 1497264 4771 DR 21.5 10.4 2.1 651.9 154.3 24.3
C6 163 172 185669 1496969 5228 MTD 28.2 7.2 3.9 680.7 180.9 42.2
C7 183 195 185450 1498035 4937 DR 33.6 8.7 3.8 744.8 181.2 34.8
C Cumulative 134.6
D1 96 101 199173 1490987 4761 DP 2.7 1.2 2.3 8.2 59.4 0.2
D2 130 136 197446 1491373 4656 DR 5.1 1.5 3.4 26.9 68.2 0.7
D Cumulative 0.9
E1 107 119 188178 1492209 5586 DP 15.4 4.9 3.2 154.3 98.6 5.6
E2 120 122 184646 1492399 5636 DR 19.5 5.6 3.5 129.7 56.2 3.4
E3 123 129 189299 1489058 5264 DP 13.1 2.5 5.3 60.7 57.1 1.5
E4 130 139 181938 1490594 5523 DR 24.3 8.2 3.0 393.3 151.1 22.1
E5 141 166 181245 1498573 5106 DR 26.8 11.9 2.2 504.3 170.2 29.0
E6 171 176 190026 1488398 4762 DR 25.0 6.4 3.9 270.1 91.5 8.7
E7 188 196 188505 1488920 4691 DR 23.3 12.2 1.9 520.4 126.0 16.0
E Cumulative 86.3
F1 113 114 191154 1485262 4968 DP 5.0 2.8 1.8 22.0 27.2 0.2
F Cumulative 0.2
G1 100 101 183938 1485561 5665 MTD 11.7 6.7 1.8 141.1 22.0 1.7
G2 104 104 187064 1482395 5348 MTD 5.5 2.3 2.4 17.2 34.4 0.4
G3 105 106 187254 1482224 5280 DP 6.3 2.6 2.4 32.7 50.8 1.0
G4 112 116 184643 1484928 5440 DR 12.3 6.4 1.9 106.9 60.4 2.7
G5 121 124 182537 1484961 5510 MTD 10.1 4.4 2.3 74.8 51.9 2.2
G6 134 148 182801 1483137 5233 DR 14.3 5.7 2.5 157.6 113.3 5.9
G7 160 168 182748 1483411 5132 DR 15.3 3.6 4.2 170.2 140.0 8.0
G8 182 186 186578 1481605 4685 DR 11.4 3.7 3.1 64.9 77.3 2.3
G Cumulative 24.2
H1 110 119 184875 1474506 5368 DP 13.8 4.8 2.9 135.0 116.2 4.0
H2 121 129 180111 1473824 5518 DR 19.0 6.9 2.7 193.7 83.0 6.4
Quantitative seismic geomorphology, The Gambia
160
abundant polygonal faults in the base-of-slope signifying background apron mud-rich deposits (Fig. 4.8B;
Cartwright & Lonergan, 1996).
The number and volume of debris-poor lobes and run-out distances are minor in comparison to the
contribution to the slope apron by the two other facies (Table 4.2). The average debris-poor lobe run-out
distance is ca. 9.9 km and limited to the most proximal position in the base-of-slope, forming narrow
elongate lobes characterised by high amplitude seismic reflectors (Fig. 4.3B). In Fig. 4.3B, there are multiple
horizons with similar acoustic properties and geometries suggesting vertical lobe stacking over numerous
depositional events.
Throughout the stratigraphy, 8 discrete geobodies are identified with a complex and chaotic internal
character, compressional ridges and imbricate thrusts at their toe, basal scoured shear surfaces that
distinguish them from the debris-rich lobes as MTDs (sensu Moscardelli & Wood, 2016; i.e. Fig. 4.7B). These
are mostly detached from the escarpment margin and occur dispersed throughout the interval. Two types
exist: point-sourced MTDs associated with a local canyon system, and MTDs developed on the basin floor,
both having similar geomorphological features, but different origins. A confined MTD point-sourced from
canyon J is identified with a run-out distance of 23.6 km (Fig. 4.7B), compressional ridges are present in the
distal toe region of the MTD and large blocks are observed proximally. This feature formed basin floor
topography that was capable of deflecting the overlying debris-rich lobe to the north (Fig. 4.7B). Run-out
distances of all MTDs average ca. 14.3 km, with average volumes of 10.1 km3 (Clare et al., 2019; Table 4.2).
These values are comparable to the values reported from a global compilation of MTDs by Moscardelli &
Wood (2016). Clear basal shear surfaces and imbricate thrusts are imaged in Fig. 4.3B. In this example the
MTD appears to be generated by underlying salt pillow inflation increasing the gradient of the sea-floor
topography.
Volumetrically the most significant facies contribution to deposition in the base-of-slope to basin floor are
debris-rich lobes (volume of debris-rich lobes is 573.3 km3 from a total of 669.8 km3, 86%), with run-out
distances commonly beyond the extent of the dataset (Fig. 4.7B; Fig. 4.8B). The lobate planform morphology
is similar in appearance to unconfined submarine fans (Prélat et al., 2010), but the abundance of 100 m-
scale high amplitude blocks suggests these flows are debris-rich (isolated basinal megabreccia sensu Playton
et al., 2010). The blocks are interpreted as eroded blocks of the lithified carbonate platform, based on their
observed glide tracks in the underlying stratigraphy (Fig. 4.7B; Hurd et al., 2016; Bull et al., 2009). These
denser flows, where there is suspension of particles in a viscous matrix, are likely to contribute to more
erosion (Mitchell, 2006). Mapping 36 debris-rich lobes indicates they are exclusively point-sourced from
canyon mouths.
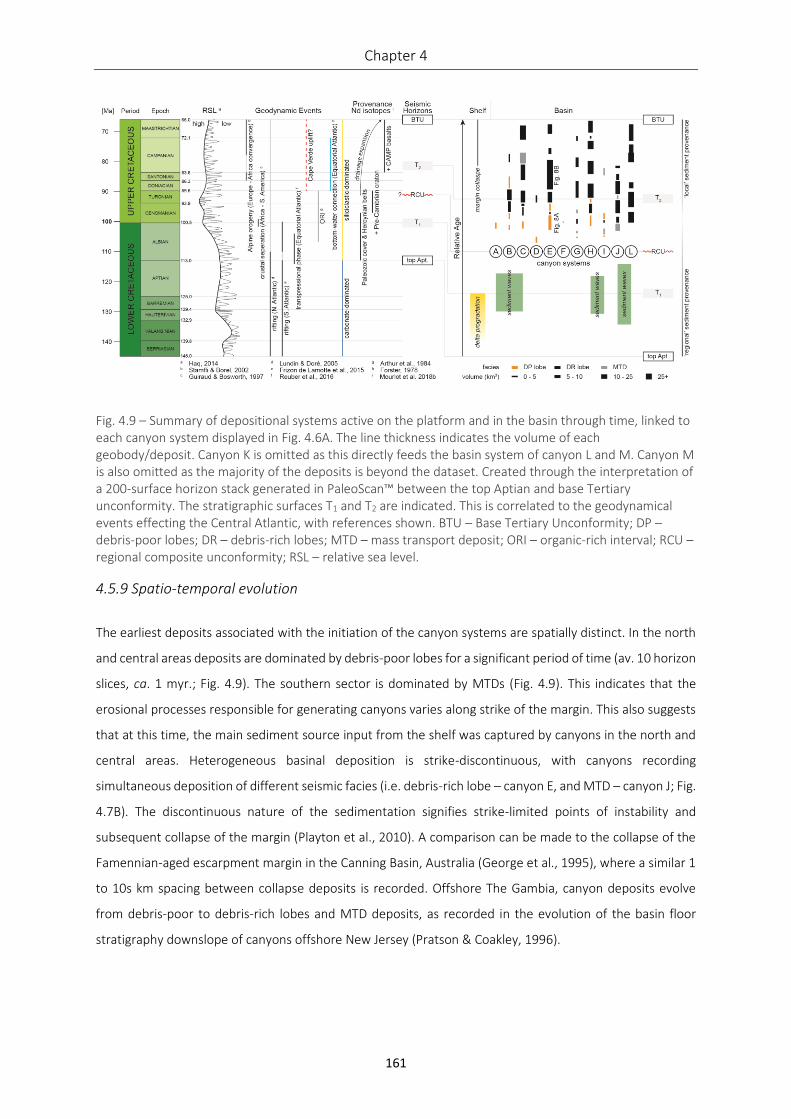
Chapter 4
161
Fig. 4.9 – Summary of depositional systems active on the platform and in the basin through time, linked to each canyon system displayed in Fig. 4.6A. The line thickness indicates the volume of each geobody/deposit. Canyon K is omitted as this directly feeds the basin system of canyon L and M. Canyon M is also omitted as the majority of the deposits is beyond the dataset. Created through the interpretation of a 200-surface horizon stack generated in PaleoScan™ between the top Aptian and base Tertiary unconformity. The stratigraphic surfaces T1 and T2 are indicated. This is correlated to the geodynamical events effecting the Central Atlantic, with references shown. BTU – Base Tertiary Unconformity; DP – debris-poor lobes; DR – debris-rich lobes; MTD – mass transport deposit; ORI – organic-rich interval; RCU – regional composite unconformity; RSL – relative sea level.
4.5.9 Spatio-temporal evolution
The earliest deposits associated with the initiation of the canyon systems are spatially distinct. In the north
and central areas deposits are dominated by debris-poor lobes for a significant period of time (av. 10 horizon
slices, ca. 1 myr.; Fig. 4.9). The southern sector is dominated by MTDs (Fig. 4.9). This indicates that the
erosional processes responsible for generating canyons varies along strike of the margin. This also suggests
that at this time, the main sediment source input from the shelf was captured by canyons in the north and
central areas. Heterogeneous basinal deposition is strike-discontinuous, with canyons recording
simultaneous deposition of different seismic facies (i.e. debris-rich lobe – canyon E, and MTD – canyon J; Fig.
4.7B). The discontinuous nature of the sedimentation signifies strike-limited points of instability and
subsequent collapse of the margin (Playton et al., 2010). A comparison can be made to the collapse of the
Famennian-aged escarpment margin in the Canning Basin, Australia (George et al., 1995), where a similar 1
to 10s km spacing between collapse deposits is recorded. Offshore The Gambia, canyon deposits evolve
from debris-poor to debris-rich lobes and MTD deposits, as recorded in the evolution of the basin floor
stratigraphy downslope of canyons offshore New Jersey (Pratson & Coakley, 1996).
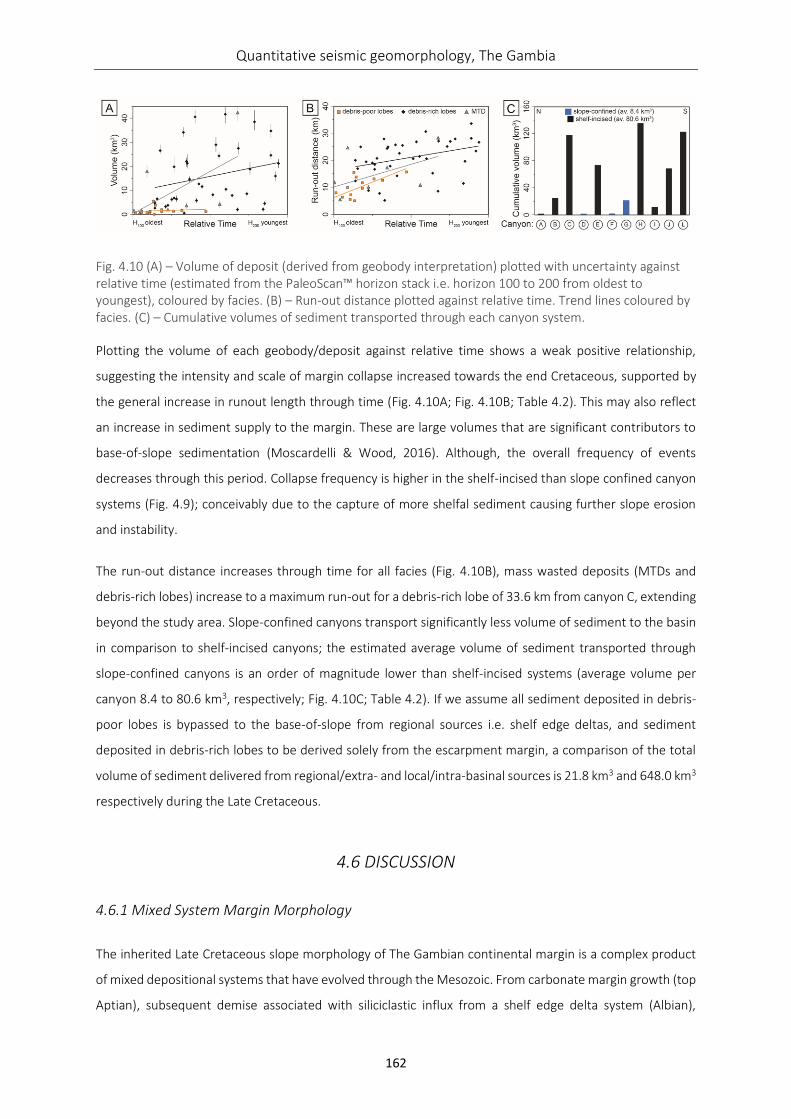
Quantitative seismic geomorphology, The Gambia
162
Fig. 4.10 (A) – Volume of deposit (derived from geobody interpretation) plotted with uncertainty against relative time (estimated from the PaleoScan™ horizon stack i.e. horizon 100 to 200 from oldest to youngest), coloured by facies. (B) – Run-out distance plotted against relative time. Trend lines coloured by facies. (C) – Cumulative volumes of sediment transported through each canyon system.
Plotting the volume of each geobody/deposit against relative time shows a weak positive relationship,
suggesting the intensity and scale of margin collapse increased towards the end Cretaceous, supported by
the general increase in runout length through time (Fig. 4.10A; Fig. 4.10B; Table 4.2). This may also reflect
an increase in sediment supply to the margin. These are large volumes that are significant contributors to
base-of-slope sedimentation (Moscardelli & Wood, 2016). Although, the overall frequency of events
decreases through this period. Collapse frequency is higher in the shelf-incised than slope confined canyon
systems (Fig. 4.9); conceivably due to the capture of more shelfal sediment causing further slope erosion
and instability.
The run-out distance increases through time for all facies (Fig. 4.10B), mass wasted deposits (MTDs and
debris-rich lobes) increase to a maximum run-out for a debris-rich lobe of 33.6 km from canyon C, extending
beyond the study area. Slope-confined canyons transport significantly less volume of sediment to the basin
in comparison to shelf-incised canyons; the estimated average volume of sediment transported through
slope-confined canyons is an order of magnitude lower than shelf-incised systems (average volume per
canyon 8.4 to 80.6 km3, respectively; Fig. 4.10C; Table 4.2). If we assume all sediment deposited in debris-
poor lobes is bypassed to the base-of-slope from regional sources i.e. shelf edge deltas, and sediment
deposited in debris-rich lobes to be derived solely from the escarpment margin, a comparison of the total
volume of sediment delivered from regional/extra- and local/intra-basinal sources is 21.8 km3 and 648.0 km3
respectively during the Late Cretaceous.
4.6 DISCUSSION
4.6.1 Mixed System Margin Morphology
The inherited Late Cretaceous slope morphology of The Gambian continental margin is a complex product
of mixed depositional systems that have evolved through the Mesozoic. From carbonate margin growth (top
Aptian), subsequent demise associated with siliciclastic influx from a shelf edge delta system (Albian),
Chapter 4
163
transgression during the Cenomanian and ultimately Late Cretaceous margin collapse (summarized in Fig.
4.9).
Spatial variability in siliciclastic input is a major control on the location and health of carbonate factories,
which strongly influences continental margin morphology (Moscardelli et al., 2019). The study area is located
in a region that received siliciclastic-dominated sedimentation post-Aptian times, delivered by a shelf-edge
delta, whereas beyond this area we predict margin morphology may have continued to be controlled by
carbonate deposition where siliciclastic sediment input was low. In those areas, there may be other allogenic
controls on the regional demise of the carbonate platform, i.e. climate, nutrient availability, rapid sea-level
rise. Similar spatial heterogeneity of a mixed system recorded on the shelf is documented on the conjugate
US-Canadian margin in the Baltimore Canyon trough (Meyer, 1989) and Shelburne sub-basin, Nova Scotia
(Moscardelli et al., 2019).
The depositional evolution established a significant lithological contrast in the subcrop on the slope prior to
later canyonisation, which had an important regional control on the subsequent inflection in the slope (Hurd
et al., 2016), location of knickpoints within canyons and the nature of the seafloor substrate eroded. This is
comparable to slope morphology observed on the present-day conjugate U.S. Atlantic continental margin,
where steep subcropping Mesozoic limestone escarpments have up to 2 km of relief, and shape the Blake
Escarpment seascape (Jansa, 1981; Land et al., 1999). The lithological properties and seismic character of
the carbonate margin imply heterogeneous carbonate lithologies cropped out on the seabed of the
escarpment during canyon incision, generating rugose seafloor topography. Horizontal limestone benches
form angular ledges in the face of the Blake Escarpment, produced by lateral scarp retreat (Land et al., 1999).
A comparable seafloor is envisaged during the Late Cretaceous in the study area. Knickpoints and the slope
inflection form at the siliciclastic-carbonate contact (top Aptian subcrop – Fig. 4.6A) by simple entrenchment
due to varied competence of the substrate, with similarities to knickpoints in fluvial systems (i.e. Miller et
al., 1991). Substrate lithology is therefore one of the key controls on the slope morphology.
4.6.2 Canyon Incision Evolution
Combining techniques adapted from hydrology with seismic facies analysis and interpretation of the basin
deposits allows interpretation of the possible mechanisms of slope-confined and shelf-incised canyons
initiation during the Late Cretaceous. The spatial variation in the earliest canyon-related deposits recorded
in the basin stratigraphy can be used to interpret the characteristics of the early stages of canyon formation,
i.e. canyons linked with debris-poor lobes are interpreted to be related to downslope eroding sediment
gravity flows (northern canyons), whereas debris-rich lobe- and MTD-related canyons formed due to mass
wasting processes (southern canyons; Fig. 4.9). The relative increase in volume and frequency of gravity flow
and mass wasting events is interpreted to be due to an evolution from ungraded to graded canyons (Fig.
Quantitative seismic geomorphology, The Gambia
164
4.6C; Fig. 4.9). Pratson & Coakley (1996) show how repeated sediment flows trigger retrogressive failure,
and hence headward migration of canyon erosion by downslope-eroding sediment gravity flows and grading
of the submarine canyon long profile.
The subaqueous channel complexes observed associated with the shelf edge delta are indicative of sediment
transported to the escarpment margin and may have contributed to the early inception of canyons (Fig.
4.7A). This could be another mechanism to initiate canyons that can be tied spatially to channels (Canyons
L and M), however many channels are observed to be spatially-distinct from the overlying younger canyons
(i.e. interfluve between Canyons H and I).
The broad lobate geometry and orientation of the sediment wave deposits in the basin downdip of the
canyons (Fig. 4.7A) suggest sediment gravity flows bypassed and eroded the early escarpment margin,
forming base-of-slope aprons. Nelson et al. (1991) recognise these apron facies on line-sourced mature
continental margins, where deltas feed sediment through a gullied slope. Hence, we postulate some canyons
are likely to have formed from an initial gullied slope during the progradation of the shelf edge delta (in the
Albian), in a similar maturation process documented by Farre et al., (1983) on the U.S. Atlantic continental
margin. This is recorded in many siliciclastic settings (e.g. Jobe et al., 2011; Lonergan et al., 2013; Shumaker
et al., 2017), where the seabed substrate is composed of un-compacted fine-grained sediment. However, in
this study, no gullies have been observed on the RCU surface. To the west of the top Aptian subcrop, i.e.
beyond the shelf edge delta deposits, the Late Cretaceous seabed offshore The Gambia would have been
relatively compact and hard, composed of lithified carbonate lithologies (Fig. 4.6A), potentially preventing
the formation of gullies (e.g. Prélat et al., 2015).
Several canyon evolution models have evolved from the preliminary findings of canyon origins by Daly
(1936), and Twitchell & Roberts (1982). This has been supported by reduced-scale experimental approaches,
such as that of Lai et al. (2016), that develop understanding of how unconfined sediment gravity flows form
and shape submarine canyons, with progressive growth of slope relief. Findings from this model agree with
the results from our analysis for canyons interpreted to have formed by downslope erosion. It would be of
interest to repeat this experiment on a semi-consolidated or consolidated slope to imitate the carbonate
escarpment and understand changes in canyon architecture and long profile grading, and model how basin
deposits temporally evolve. In the study area, there is geomorphological and stratigraphic evidence for
canyons having formed by both processes of downslope erosion and retrogressive failure.
4.6.3 Sediment Transfer from Shelf to Basin
Sediment transfer from the shelf to basin across the carbonate escarpment, and latterly through the
canyonised surface of the RCU, is governed by three principal physical erosional processes: gravity flows,
mass wasting and oceanographic bottom currents, in addition to chemical dissolution of carbonates.
Chapter 4
165
Ultimately these processes shape the architecture of the continental margin and control sediment
distribution. During the Albian, the location of the main depocentre is linked to the location of the shelf edge
delta. Coarse grained sediment is mainly trapped on the shelf, although some bypass does occur to base-of-
slope aprons down canyons. This regional, extra-basinal, siliciclastic-prone source of sediment and drainage
is postulated to vary laterally and may have also exerted a control on the location and health of the
carbonate factories and accumulation of the platform along this mixed system margin. Mourlot et al. (2018a)
show multiple entry points for similar-aged deltaic systems (see their Fig. 9B), introducing a regional source
of sediment from rivers draining the onshore Senegal Basin and hinterland of NW Africa. This sediment is
likely to be very different in composition to locally derived material associated with the erosion and collapse
of the margin. We postulate the local, intra-basinal sediment to be much more heterogenous, composed of
mixed re-sedimented lithified carbonate facies and siliciclastic material, in comparison to the very-fine
grained, clean sandstones and mudstones derived from the regional fluvio-deltaic input (encountered in
wells Jammah-1 and Wolof-1, Fig. 4.2). As the margin begins to collapse following establishment of the RCU
in the early Late Cretaceous, locally derived sediment, developing debris-rich lobes and MTDs, dominates
over sediments input from extra-basinal drainage. Much of the extra-basinal drainage sediment may have
been trapped further inboard as the onshore Senegal Basin was transgressed.
A quantitative analysis of the different facies distinguishes regional (3% of total sediment transported to the
basin) versus local (97%) provenance signals from the seismic geomorphology. Long-lived (ca. 28 Myr)
sediment bypass is documented by the canyon systems interpreted in this paper (Fig. 4.6A), facilitating
sediment transfer from the shelf to basin floor. The seismic expression of the composite RCU shows
entrenchment of the canyon systems rather than lateral migration, and there is a lack of evidence for
multiple incisions (i.e. slope-channel-levee systems – Deptuck et al., 2003). This forms a deeply incised
surface where we assume the basal surface of the canyons (RCU) records a considerable amount of time
when either complete sediment bypass occurred and/or the canyon was bypass-dominated through time
(sensu Stevenson et al., 2015). The limited vertical resolution (ca. 20 m) of the seismic reflection data and
lack of borehole data within any of the canyons documented in this study inhibits our sedimentological and
stratigraphic interpretation of the deposits associated with these zones. Generally, the stratigraphic
architecture of the canyon-fill has a back-stepping onlapping signature, with a low amplitude acoustic
response throughout the Late Cretaceous sequence (Fig. 4.3). In all the wells where the RCU has been drilled,
the overlying stratigraphy is mudstone-dominated (Fig. 4.2). However, it is conceivable that the canyon fill
directly above the bypass surface may be thin-bedded and sand-prone (i.e. Stevenson et al., 2015 and
references therein), below the resolution of the seismic data. From an applied perspective, the RCU surface
and deposits associated with it, may act as conduits for migrating hydrocarbons from the basin to the shelf,
potential stratigraphic traps and/or act as thief zones in stratigraphic traps of hydrocarbons in the potential
base-of-slope reservoirs (e.g. Ghana – Kelly & Doust, 2016).
Quantitative seismic geomorphology, The Gambia
166
4.6.4 Regional Controls on Stratigraphic Evolution
High-resolution documentation of the seismic geomorphology related to the collapse and submarine
canyonisation of The Gambian continental margin offers improved understanding of the regional evolution
of this complex ‘passive’ margin. Integrated with the regional geology, we can elude to the possible drivers
behind the stratigraphic evolution (Fig. 4.9). Further work constraining the vertical movements of the
hinterland in Morocco (Charton, 2018) and in Mauritania (Lodhia, 2018; Gouiza et al., 2019) show that the
‘passive’ nature of the margin is punctuated by discrete uplift events (e.g. Leprêtre et al., 2015). The
stratigraphic response in the sink records increased sediment input during these tectonic events as deduced
from backstripping and subsidence analysis (Latil-Brun & Lucazeau, 1988). The Albian shelf edge delta,
recognised in this study, together with others along the margin (Fig. 4.9; Mourlot et al., 2018a), represent
the first major phase of siliciclastic sedimentation into the basin, potentially contributing to the demise of
the Jurassic to Lower Cretaceous carbonate platform. Results from the analysis of neodymium isotope data
delineates the segmented drainage of northwest Africa and the exhumation of Paleozoic cover and
Hercynian belts triggered by the opening of the Equatorial and South Atlantic was most-likely the driver for
delivering the siliciclastic influx during this period (Mourlot et al., 2018b). This is supported by new low-
temperature thermochronology data recording exhumation of the Mauritanides between 180-100 Ma
(Gouiza et al., 2019).
Prior to margin collapse, the Cenomanian-Turonian boundary records maximum transgression of the margin
(Schlanger & Jenkyns, 1976), associated with a flattened peneplained topography (Flicoteaux et al., 1988).
During this period, in the study area there are no collapse features or deposits observed, reflecting the
quiescent geodynamic setting and high eustatic sea-level that resulted in a transgressed margin, where
sedimentation is likely trapped in the onshore Senegal basin and/or drainage reorganisation shifts sediment
input points laterally beyond the study area (Fig. 4.1; Mourlot et al., 2018a; 2018b). Further refinement of
this model would be possible with access to well data located at the base of the carbonate escarpment,
allowing for a more detailed stratigraphic interpretation and lithological control on these deposits.
Margin collapse at the scale and frequency observed through the Late Cretaceous is indicative of a significant
change in accommodation (Playton et al., 2010). Covault et al., (2011) associate convex longitudinal canyon
profiles (i.e. Fig. 4.6C) with continental margin uplift and deformation. Several geodynamic events affecting
the Central Atlantic are likely to manifest in vertical movements of the margin and eventual collapse, i.e.
distal effects of the Santonian-aged early Alpine Orogeny compressional event, a shift in the pole of rotation
of Atlantic spreading due to continental separation between Africa and South America (Guiraud and
Bosworth, 1997; Labails, 2007) and similarly timed rifting episodes in Central Africa (Guiraud, 1998).
Postulated Late Cretaceous volcanic uplift of the Cape Verde islands and associated swell, ca. 500 km from
the continental margin and study area, also affected the oceanic domain architecture (Fig. 4.9; Casson et al.,
Chapter 4
167
2020). Regional uplift associated with this event may have created instability contributing to margin collapse.
Tectonic stress accompanying these far-field events and linked to exhumation onshore was likely localized
along the boundaries of the African plate (Gouiza et al., 2019). The base-of-slope in the study area directly
overlies the continent-ocean boundary (Fig. 4.1B). Further amplification of the base level signal is expected
due to relative changes in sea level (Haq, 2014), where, during lowstands, increased erosion within canyons
is predicted due to canyons capturing more sediment input as depositional systems shift basinward (Pratson
et al., 2007). However, canyon incision can also occur outside of lowstands (e.g. Fulthorpe et al., 2000).
Linking the stratigraphic response to sea-level cyclicity would require a more detailed stratigraphic
framework. Nevertheless, the timing of margin collapse is coeval with the relative first order fall in sea-level
from the Coniacian to Maastrichtian, and expansion of drainage eastwards into the West African Craton (Fig.
4.9; Haq, 2014; Mourlot et al., 2018b).
4.7 CONCLUSIONS
The integration of seismic geomorphology with stratigraphic and lithological data from well data has allowed
a quantitative evaluation of continental margin evolution, recording buried submarine canyons present on
a regional composite unconformity surface (RCU) surface. This has significantly improved the understanding
of the seascape evolution offshore The Gambia during the Cretaceous, developing a workflow and models
applicable to the wider Central Atlantic and other continental margins worldwide within mixed siliciclastic-
carbonate systems. Thirteen submarine canyons are identified from the drainage model and
geomorphological data extracted from these systems has been used to constrain two types of canyons,
slope-confined and shelf-incised. The carbonate subcrop, which would have formed the seabed in the Aptian
(the top Aptian surface), is interpreted to have been the main control on the location of knickpoints within
these canyons and can be correlated with the sharp inflection in the slope profile. Through the Albian, a
progradational shelf-edge delta delivered siliciclastic sediment with an extra-basinal provenance from
hinterland drainage into the margin. It is likely subaqueous channel systems on the paleo-shelf contributed
to the early development of canyons due to erosion by downslope flowing turbidity currents, the
depositional products forming a base-of-slope apron.
By utilising a semi-automated seismic interpretation and a geobody classification workflow we are able to
reconstruct the spatial-temporal evolution of mixed system basin deposits linked to the submarine canyons
and shelfal systems, providing insights into the early stages of canyon incision. Three main seismic facies are
identified in the basin, debris-rich and debris poor lobes, and MTDs. The integration of deposits linked to
feeder canyon morphology reveals distinct types of canyons that originated both by gravity-flow and mass-
wasting processes, with time-equivalent lateral variations along the margin.
Quantitative seismic geomorphology, The Gambia
168
Following establishment of the RCU, the margin began collapsing and canyonisation was initiated,
intensifying during the Late Cretaceous. It is postulated this collapse was related to regional
tilting/exhumation caused by far-field tectonic stresses, with deformation localized on the margin of the
African plate corresponding to the location of the platform margin study area. Locally derived sediment from
the carbonate escarpment was incorporated and re-deposited in the basin by sediment mass transport
events and sediment gravity flows. Volumetrically, shelf-incised canyons contributed on average an order of
magnitude more sediment to the basin than slope-confined canyons. Large km-scale blocks recognised in
the seismic geomorphology of debris-rich lobes are interpreted to be carbonate detritus. The vast majority
of canyon-derived sediment (97%) in the base-of-slope is observed to comprise of debris-rich lobes and
hence, composed of locally derived material from the degradation of the pre-existing margin.
4.8 ACKNOWLEDGEMENTS
This study is part of the lead authors PhD project at the University of Manchester. We thank the sponsoring
companies of the North Africa Research Group (NARG) for their continued financial and scientific support.
We are grateful to TGS and Spectrum Geo for the provision of the seismic data, and we appreciate Felicia
Winter’s (TGS) comments on the preparation of figures and manuscript. We are thankful to Petrosen for
permission to access the Senegal exploration wells. Alex Clarke (Cairn Energy) is thanked for his assistance
with the seismic interpretation workflow. Andrew Newton (Queen’s University Belfast) is thanked for the
rose diagram spreadsheet tool. Early discussions of concepts with Keith Maynard (CGG Robertson) and Neil
Mitchell (University of Manchester) helped with original concepts. Schlumberger (Petrel), Eliis (Paleoscan),
ESRI (ArcMap; Arc Hydro) and Geoteric are thanked for academic licenses to the software used herein.
Katherine Maier (National Institute of Water and Atmospheric Research), Zane Jobe (Colorado School of
Mines), Andrea Fildani (Equinor) and Basin Research Editor-in-Chief, Atle Rotevatn, are thanked for their
constructive reviews that improved the direction of this paper.
4.9 REFERENCES
Allen, P. A. 2008. From landscapes into geological history. Nature, 451, pp.274–276.
Amblas, D., Canals, M., Urgeles, R., Lastras, G., Liquete, C., Hughes-Clarke, J.E., Casamor, J.L. and Calafat, A.M., 2006. Morphogenetic mesoscale analysis of the northeastern Iberian margin, NW Mediterranean Basin. Marine Geology, 234(1-4), pp.3-20.
Antobreh, A.A. and Krastel, S., 2006. Morphology, seismic characteristics and development of Cap Timiris Canyon, offshore Mauritania: a newly discovered canyon preserved-off a major arid climatic region. Marine and Petroleum Geology, 23(1), pp.37-59.
Chapter 4
169
Arthur, M.A., Dean, W.E. and Stow, D.A.V., 1984. Models for the deposition of Mesozoic-Cenozoic fine-grained organic-carbon-rich sediment in the deep sea. Geological Society, London, Special Publications, 15(1), pp.527-560.
Bond, G.C. and Kominz, M.A., 1988. Evolution of thought on passive continental margins from the origin of geosynclinal theory (∼ 1860) to the present. Geological Society of America Bulletin, 100(12), pp.1909-1933.
Bond, G.C., Kominz, M.A., Steckler, M.S., Grotzinger, J.P. and Crevello, P.D., 1989. Role of thermal subsidence, flexure, and eustasy in the evolution of early Paleozoic passive-margin carbonate platforms. Controls on Carbonate Platform and Basin Development: SEPM, Special Publication, 44, pp.39-61.
Bradley, D.C., 2008. Passive margins through earth history. Earth-Science Reviews, 91(1-4), pp.1-26.
Braun, J. and Beaumont, C., 1989. A physical explanation of the relation between flank uplifts and the breakup unconformity at rifted continental margins. Geology, 17(8), pp.760-764.
Brothers, D.S., Uri, S., Andrews, B.D. and Chaytor, J.D., 2013. Geomorphic characterization of the US Atlantic continental margin. Marine Geology, 338, pp.46-63.
Brownfield, M.E. and Charpentier, R.R., 2003. Assessment of the undiscovered oil and gas of the Senegal Province, Mauritania, Senegal, the Gambia, and Guinea-Bissau, Northwest Africa (25). Denver: US Department of the Interior, US Geological Survey.
Bull, S., Cartwright, J. and Huuse, M., 2009. A review of kinematic indicators from mass-transport complexes using 3D seismic data. Marine and Petroleum Geology, 26(7), pp.1132-1151.
Burgess, P.M., 2001. Modelling carbonate sequence development without relative sea-level oscillations. Geology, 29(12), pp.1127-1130.
Cartwright, J.A. and Lonergan, L., 1996. Volumetric contraction during the compaction of mudrocks: A mechanism for the development of regional‐scale polygonal fault systems. Basin Research, 8(2), pp.183-193.
Casson, M., Bulot, L.G., Jeremiah, J. and Redfern, J., 2020. Deep sea rock record exhumed on oceanic volcanic islands: the Cretaceous sediments of Maio, Cape Verde. Gondwana Research, 81, pp.252-264..
Charton, R.J.G., 2018. Phanerozoic Vertical Movements in Morocco. (Doctoral dissertation). TUDelft, Netherlands.
Chiarella, D. and Longhitano, S.G., 2012. Distinguishing depositional environments in shallow-water mixed, bio-siliciclastic deposits on the basis of the degree of heterolithic segregation (Gelasian, southern Italy). Journal of Sedimentary Research, 82(12), pp.969-990.
Chiarella, D., Longhitano, S.G. and Tropeano, M., 2017. Types of mixing and heterogeneities in siliciclastic-carbonate sediments. Marine and Petroleum Geology, 88, pp.617-627.
Clare, M., Chaytor, J., Dabson, O., Gamboa, D., Georgiopoulou, A., Eady, H., Hunt, J., Jackson, C., Katz, O., Krastel, S. and León, R., 2019. A consistent global approach for the morphometric characterization of subaqueous landslides. Geological Society, London, Special Publications, 477(1), pp.455-477.
Clayburn, J. 2017. Realising the deepwater hydrocarbon potential of Senegal. AAPG/SEG 2017 International Conference and Exhibition, London, England. Search and Discovery Article 70345.
Clift, P.D., Hodges, K., Heslop, D., Hannigan, R., Hoang, L.V. and Calvès, G., 2008. Greater Himalayan exhumation triggered by Early Miocene monsoon intensification. Nature Geoscience, 1, pp.875880
Covault, J.A., 2011. Submarine fans and canyon-channel systems: A review of processes, products, and models: Nature Education Knowledge, 3(10).
Quantitative seismic geomorphology, The Gambia
170
Covault, J.A., Fildani, A., Romans, B.W. and McHargue, T., 2011. The natural range of submarine canyon-and-channel longitudinal profiles. Geosphere, 7(2), pp.313-332.
Daly, R.A., 1936. Origin of submarine canyons. American Journal of Science, (186), pp.401-420.
Davies, A.J., Roberts, J.M. and Hall-Spencer, J., 2007. Preserving deep-sea natural heritage: emerging issues in offshore conservation and management. Biological conservation, 138(3-4), pp.299-312.
Davison, I., 2005. Central Atlantic margin basins of North West Africa: geology and hydrocarbon potential (Morocco to Guinea). Journal of African Earth Sciences, 43(1-3), pp.254-274.
Deptuck, M.E., Steffens, G.S., Barton, M., and Pirmez, C., 2003. Architecture and evolution of upper fan channel-belts on the Niger Delta slope and in the Arabian Sea: Marine and Petroleum Geology, v. 20, pp.649–676.
Dingle, R. V., and Robson, S., 1985. Slumps, canyons and related features on the continental margin off East London, SE Africa (SW Indian Ocean): Marine Geology, 67, pp.37–54.
Dugan, B. and Flemings, P.B., 2000. Overpressure and fluid flow in the New Jersey continental slope: Implications for slope failure and cold seeps. Science, 289(5477), pp.288-291.
Farre, J.A., McGregor, B.A., Ryan, W.B. and Robb, J.M., 1983. Breaching the shelf break: passage from youthful to mature phase in submarine canyon evolution. SEPM Special Publication, 33, pp.25-39.
Fildani, A., 2017. Submarine Canyons: A brief review looking forward. Geology, 45(4), pp.383-384.
Fildani, A., Normark, W.R., Kostic, S. and Parker, G., 2006. Channel formation by flow stripping: Large‐scale scour features along the Monterey East Channel and their relation to sediment waves. Sedimentology, 53(6), pp.1265-1287.
Fildani, A., Hubbard, S.M., Covault, J.A., Maier, K.L., Romans, B.W., Traer, M. and Rowland, J.C., 2013. Erosion at inception of deep-sea channels. Marine and Petroleum Geology, 41, pp.48-61.
Flicoteaux, R., Latil-Brun, M.V. and Michaud, L., 1988. Histoire de la subsidence post-rift du bassin côtier mauritano-sénégalo-guinéen. Relation avec l'amincissement crustal pendant la période jurassique à Crétacé inférieur. Comparaison avec l'évolution des marges péri-atlantiques au niveau de l'Atlantique Central et Equatorial (côte est des USA, Sud-Sahara, Côte d'Ivoire et Plateau du Demerara). Journal of African Earth Sciences (and the Middle East), 7(2), pp.345-359.
Förster, R., 1978. Evidence for an open seaway between northern and southern proto-Atlantic in Albian times. Nature, 272(5649), pp.158.
Frizon de Lamotte, D., Fourdan, B., Leleu, S., Leparmentier, F. and de Clarens, P., 2015. Style of rifting and the stages of Pangea breakup. Tectonics, 34(5), pp.1009-1029.
Fulthorpe, C.S., Austin, J.A., Jr. and Mountain, G.S., 2000. Morphology and distribution of Miocene slope incisions off New Jersey; are they diagnostic of sequence boundaries? Geol. Soc. Am. Bull., 112, pp.817–828.
Galloway, W.E., 1975. Process framework for describing the morphologic and stratigraphic evolution of deltaic depositional systems. Houston Geological Society, pp.87-98.
Galloway, W.E., 1998. Siliciclastic slope and base-of-slope depositional systems: component facies, stratigraphic architecture, and classification. AAPG bulletin, 82(4), pp.569-595.
Goumbo Lo, P., Dia, A. and Kampunzu, A.B., 1992. Cenozoic volcanism in Western Senegal and its relationship to the opening of the Central Atlantic Ocean. Tectonophysics 209, pp.281–291.
Gouiza, M., Bertotti, G., Charton, R., Haimoudane, K., Dunkl, I. and Anczkiewicz, A.A., 2019. New Evidence of Anomalous' Vertical Movements along the Hinterland of the Atlantic NW African Margin. Journal of Geophysical Research: Solid Earth.
Chapter 4
171
Granjeon, D. and Joseph, P., 1999. Concepts and applications of a 3-D multiple lithology, diffusive model in stratigraphic modeling.
Guiraud, R., 1998. Mesozoic rifting and basin inversion along the northern African Tethyan margin: an overview. Geological Society, London, Special Publications, 132(1), pp.217-229.
Guiraud, R. and Bosworth, W., 1997. Senonian basin inversion and rejuvenation of rifting in Africa and Arabia: synthesis and implications to plate-scale tectonics. Tectonophysics, 282(1-4), pp.39-82.
Haq, B.U., 2014. Cretaceous eustasy revisited. Global and Planetary change, 113, pp.44-58.
Harris, P.T. and Whiteway, T., 2011. Global distribution of large submarine canyons: Geomorphic differences between active and passive continental margins. Marine Geology, 285(1-4), pp.69-86.
Hathon, E. 2018. The SNE Discovery Offshore Senegal – Moving a Frontier Basin to Emergent. EAGE 80th Annual Conference Exhibition, Copenhagen, Denmark.
Hubbard, S.M., 2005. Deep-sea foreland basin axial channels and associated sediment gravity flow deposits, Oligocene Molasse basin, Upper Austria, and Cretaceous Magallanes basin, Chile.
Hurd, G.S., Kerans, C., Fullmer, S. and Janson, X., 2016. Large-scale inflections in slope angle below the shelf break: A first order control on the stratigraphic architecture of carbonate slopes: Cutoff Formation, Guadalupe Mountains National Park, West Texas, USA. Journal of Sedimentary Research, 86(4), pp.336-362.
Jansa, L.F., 1981. Mesozoic carbonate platforms and banks of the eastern North American margin. Marine Geology, 44(1-2), pp.97-117.
Jobe, Z.R., Lowe, D.R. and Uchytil, S.J., 2011. Two fundamentally different types of submarine canyons along the continental margin of Equatorial Guinea. Marine and Petroleum Geology, 28(3), pp.843-860.
Kane, I.A. and Clare, M.A., 2019. Dispersion, accumulation, and the ultimate fate of microplastics in deep-marine environments: a review and future directions. Frontiers in Earth Science, 7.
Kelly, J. and Doust, H., 2016. Exploration for Late Cretaceous turbidites in the Equatorial African and northeast South American margins. Netherlands Journal of Geosciences, 95(4), pp.393-403.
Kenter, J.A.M. and Campbell, A.E., 1991. Sedimentation on a Lower Jurassic carbonate platform flank: Geometry, sediment fabric and related depositional structures (Djebel Bou Dahar, High Atlas, Morocco): Sedimentary Geology, 72, pp.1-34.
Klaus, A., and Taylor, B., 1991. Submarine canyon development in the Izu-Bonin forearc; a SeaMARC II and seismic survey of Aoga Shima Canyon: Marine Geophysical Researches, 13, pp.105–130.
Kosmos Energy, 2017. Investor Presentation – March 2017. Dallas, Texas. Available from < https://www.kosmosenergy.com/>.
Labails, C., 2007. La marge sud-marocaine et les premières phases d'ouverture de l'océan Atlantique Central. (Doctoral dissertation) Université de Bretagne Occidentale, France.
Labails, C., Olivet, J.L., Aslanian, D. and Roest, W.R., 2010. An alternative early opening scenario for the Central Atlantic Ocean. Earth and Planetary Science Letters, 297(3-4), pp.355-368.
Lai, S.Y., Gerber, T.P. and Amblas, D., 2016. An experimental approach to submarine canyon evolution. Geophysical Research Letters, 43(6), pp.2741-2747.
Lancelot, Y., Seibold, E., Cepek, P., Dean, W.E., Eremeev, V., Gardner, J.V., Jansa, L., Johnson, D., Kasheninnikov, V., Pflaumann, U., Graham, J., Bukry, D., 1978a. Site 367: Cape Verde Basin. In: Initial Reports of the Deep Sea Drilling Project, 41, pp.163–232.
Quantitative seismic geomorphology, The Gambia
172
Lancelot, Y., Seibold, E., Cepek, P., Dean, W.E., Eremeev, V., Gardner, J.V., Jansa, L., Johnson, D., Kasheninnikov, V., Pflaumann, U., Graham, J., Bukry, D., 1978b. Site 368: Cape Verde Rise. In: Initial Reports of the Deep Sea Drilling Project, 41, pp.233–326.
Land, L.A., Paull, C.K. and Spiess, F.N., 1999. Abyssal erosion and scarp retreat: Deep Tow observations of the Blake Escarpment and Blake Spur. Marine geology, 160(1-2), pp.63-83.
Latil-Brun, M.V.L. and Lucazeau, F., 1988. Subsidence, extension and thermal history of the West African margin in Senegal. Earth and Planetary Science Letters, 90(2), pp.204-220.
Leprêtre, R., Missenard, Y., Barbarand, J., Gautheron, C., Saddiqi, O. and Pinna‐Jamme, R., 2015. Postrift history of the eastern central Atlantic passive margin: Insights from the Saharan region of South Morocco. Journal of Geophysical Research: Solid Earth, 120(6), pp.4645-4666.
Lodhia, B.H., 2018. Dynamic subsidence, continental uplift and sedimentary deposition to West Africa's passive margin. (Doctoral dissertation) Imperial College London, UK.
Lonergan, L., Jamin, N.H., Jackson, C.A.L. and Johnson, H.D., 2013. U-shaped slope gully systems and sediment waves on the passive margin of Gabon (West Africa). Marine Geology, 337, pp.80-97.
Long, A. and Cameron, N., 2016. Gravity and magnetic constraints and limitations in defining basin structure, offshore Senegal.
Lundin, E. and Doré, A.G., 2002. Mid-Cenozoic post-breakup deformation in the ‘passive’margins bordering the Norwegian–Greenland Sea. Marine and Petroleum Geology, 19(1), pp.79-93.
Maidment, D.R. and Morehouse, S., 2002. Arc Hydro: GIS for water resources. ESRI, Inc.
Malkowski, M.A., Jobe, Z.R., Sharman, G.R. and Graham, S.A., 2018. Down‐slope facies variability within deep‐water channel systems: Insights from the Upper Cretaceous Cerro Toro Formation, southern Patagonia. Sedimentology, 65(6), pp.1918-1946.
Mann, P., Gahagan, L. and Gordon, M.B., 2003. Tectonic setting of the world's giant oil and gas fields. In M. T. Halbouty, 2003, Giant oil and gas fields of the decade 1990-1999: AAPG Memoir 78, p. 15-105.
Martin, L., Effimoff, I., Medou, J. and Laughland, M., 2010 Hydrocarbon Prospectivity of Offshore Senegal-Unlocking the Door to a New Deepwater Petroleum Province. Search and Discovery Article 10278
Martinsen, O.J., Sømme, T.O., Thurmond, J.B., Helland-Hansen, W. and Lunt, I., 2010. January. Source-to-sink systems on passive margins: theory and practice with an example from the Norwegian continental margin. In Geological Society, London, Petroleum Geology Conference series (Vol. 7, No. 1, pp. 913-920). Geological Society of London.
McCave, I.N., 2017. Formation of sediment waves by turbidity currents and geostrophic flows: A discussion. Marine Geology, 390, pp.89-93.
McGregor, B., 1985. Role of submarine canyons in shaping the rise between Lydonia and Oceanographer canyons, Georges Bank: Marine Geology, 62, pp.277–293.
McHargue, T.R., Hodgson, D.M. and Shelef, E., 2019. Architectural Diversity of Submarine Lobes. EarthArXiv. https://doi.org/10.31223/osf.io/cs8rp
McHugh, C.M., Ryan, W.B. and Schreiber, B.C., 1993. The role of diagenesis in exfoliation of submarine canyons. AAPG Bulletin, 77(2), pp.145-172.
McKenzie, D., 1978. Some remarks on the development of sedimentary basins. Earth and Planetary science letters, 40(1), pp.25-32.
Chapter 4
173
McIlreath, I.A. and James, N.P., 1978. Carbonate slopes, in, Walker, R.G., ed., Facies Models: Geological Association of Canada, Geoscience Canada Series, pp.245-257.
Meyer, F.O., 1989. Siliciclastic influence on Mesozoic platform development: Baltimore Canyon trough, western Atlantic.
Miller, J.R., 1991. The influence of bedrock geology on knickpoint development and channel-bed degradation along downcutting streams in south-central Indiana: The Journal of Geology, 99, pp.591–605.
Mitchell, N.C., 2005. Interpreting long-profiles of canyons in the USA Atlantic continental slope. Marine Geology, 214(1-3), pp.75-99.
Mitchum, R.M. and Vail, P.R., 1977. Seismic Stratigraphy and Global Changes of Sea Level: Part 7. Seismic Stratigraphic Interpretation Procedure: Section 2. Application of Seismic Reflection Configuration to Stratigraphic Interpretation.
Moscardelli, L. and Wood, L., 2016. Morphometry of mass-transport deposits as a predictive tool. Bulletin, 128(1-2), pp.47-80.
Moscardelli, L., Ochoa, J., Lunt, I. and Zahm, L., 2019. Mixed siliciclastic–carbonate systems and their impact for the development of deep-water turbidites in continental margins: A case study from the Late Jurassic to Early Cretaceous Shelburne subbasin in offshore Nova Scotia. AAPG Bulletin, 103(10), pp.2487-2520.
Moucha, R., Forte, A. M., Mitrovica, J. X., Rowley, D. B., Quéré, S., Simmons, N. A., & Grand, S. P. (2008). Dynamic topography and long-term sea-level variations: There is no such thing as a stable continental platform. Earth and Planetary Science Letters, 271(1), 101–108.
Mourlot, Y., Calvès, G., Clift, P.D., Baby, G., Chaboureau, A.C. and Raisson, F., 2018a. Seismic stratigraphy of Cretaceous eastern Central Atlantic Ocean: Basin evolution and palaeoceanographic implications. Earth and Planetary Science Letters, 499, pp.107-121.
Mourlot, Y., Roddaz, M., Dera, G., Calvès, G., Kim, J.H., Chaboureau, A.C., Mounic, S. and Raisson, F., 2018. Geochemical Evidence for Large‐Scale Drainage Reorganization in Northwest Africa during the Cretaceous. Geochemistry, Geophysics, Geosystems, 19(5), pp.1690-1712.
Mulder, T., Joumes, M., Hanquiez, V., Gillet, H., Reijmer, J.J.G., Tournadour, E., Chabaud, L., Principaud, M., Schnyder, J.S.D., Borgomano, J. and Fauquembergue, K., 2017. Carbonate slope morphology revealing sediment transfer from bank-to-slope (Little Bahama Bank, Bahamas). Marine and Petroleum Geology, 83, pp.26-34.
Nelson, C. H., and Maldonado, A., 1988. Factors controlling depositional patterns of Ebro turbidite systems, Mediterranean Sea: American Association of Petroleum Geologists Bulletin, 72, pp.698–716.
Nelson, C.H., Maldonado, A., Barber, J.H. and Alonso, B., 1991. Modern sand-rich and mud-rich siliciclastic aprons: alternative base-of-slope turbidite systems to submarine fans. In Seismic facies and sedimentary processes of submarine fans and turbidite systems (pp. 171-190). Springer, New York, NY.
Normark, W.R., 1974. Submarine canyons and fan valleys Factors affecting growth patterns of deep-sea fans.
Normark, W.R. and Piper, D.W., 1969. Deep-sea fan-valleys, past and present. Geological Society of America Bulletin, 80(9), pp.1859-1866.
Oliveira, F., Monteiro, P., Bentes, L., Henriques, N.S., Aguilar, R. and Gonçalves, J.M., 2015. Marine litter in the upper São Vicente submarine canyon (SW Portugal): Abundance, distribution, composition and fauna interactions. Marine pollution bulletin, 97(1-2), pp.401-407.
Quantitative seismic geomorphology, The Gambia
174
Patruno, S., Hampson, G.J. and Jackson, C.A., 2015. Quantitative characterisation of deltaic and subaqueous clinoforms. Earth-Science Reviews, 142, pp.79-119.
Payros, A. and Pujalte, V., 2008. Calciclastic submarine fans: An integrated overview. Earth-Science Reviews, 86(1-4), pp.203-246.
Playton, T.E., Janson, X., Kerans, C., James, N.P. and Dalrymple, R.W., 2010. Carbonate slopes. Facies models, 4, pp.449-476.
Posamentier, H.W., 2005. Application of 3D seismic visualization techniques for seismic stratigraphy, seismic geomorphology and depositional systems analysis: examples from fluvial to deep-marine depositional environments. In Geological Society, London, Petroleum Geology Conference series (Vol. 6, No. 1, pp. 1565-1576). Geological Society of London.
Posamentier, H.W. and Kolla, V., 2003. Seismic geomorphology and stratigraphy of depositional elements in deep-water settings. Journal of sedimentary research, 73(3), pp.367-388.
Pratson, L.F. and Coakley, B.J., 1996. A model for the headward erosion of submarine canyons induced by downslope-eroding sediment flows. Geological Society of America Bulletin, 108(2), pp.225-234.
Pratson, L.F. and Ryan, W.B., 1996. Automated drainage extraction in mapping the Monterey submarine drainage system, California margin. Marine Geophysical Researches, 18(6), pp.757-777.
Pratson, L.F., Nittrouer, C.A., Wiberg, P.L., Steckler, M.S., Swenson, J.B., Cacchione, D.A., Karson, J.A., Murray, A.B., Wolinsky, M.A., Gerber, T.P. and Mullenbach, B.L., 2007. Seascape evolution on clastic continental shelves and slopes. Continental margin sedimentation: from sediment transport to sequence stratigraphy, pp.339-380.
Prélat, A., Covault, J.A., Hodgson, D.M., Fildani, A. and Flint, S.S., 2010. Intrinsic controls on the range of volumes, morphologies, and dimensions of submarine lobes. Sedimentary Geology, 232(1-2), pp.66-76.
Prélat, A., Pankhania, S.S., Jackson, C.A.L. and Hodgson, D.M., 2015. Slope gradient and lithology as controls on the initiation of submarine slope gullies; insights from the North Carnarvon Basin, offshore NW Australia. Sedimentary Geology, 329, pp.12-17.
Principaud, M., Mulder, T., Gillet, H. and Borgomano, J., 2015. Large-scale carbonate submarine mass-wasting along the northwestern slope of the Great Bahama Bank (Bahamas): Morphology, architecture, and mechanisms. Sedimentary Geology, 317, pp.27-42.
Reuber, K.R., Pindell, J. and Horn, B.W., 2016. Demerara Rise, offshore Suriname: Magma-rich segment of the Central Atlantic Ocean, and conjugate to the Bahamas hot spot. Interpretation, 4(2), pp.141-155.
Ruizhao, Y., Shenglin, J., Tian, Z., Yuxin, L., Lijun, D. and Zhangwu, M., 2017. Seismic response characteristics and identification of different types of karst collapse in Tahe oil field, Tarim Basin. In International Geophysical Conference, Qingdao, China, 17-20 April 2017 (pp. 1482-1484). Society of Exploration Geophysicists and Chinese Petroleum Society.Schlanger, S.O. and Jenkyns, H.C., 1976. Cretaceous oceanic anoxic events: causes and consequences. Geologie en mijnbouw, 55(3-4).
Shepard, F.P., 1934. Canyons off the New England coast. American Journal of Science, (157), pp.24-36.
Shumaker, L.E., Jobe, Z.R. and Graham, S.A., 2017. Evolution of submarine gullies on a prograding slope: Insights from 3D seismic reflection data. Marine Geology, 393, pp.35-46.
Sømme T., Helland-Hansen W., Martinsen O. J., Thurmond J. B. (2009) Relationships between morphological and sedimentological parameters in source-to-sink systems: a basis for predicting semi-quantitative characteristics in subsurface systems. Basin Research 21:361–387.
Chapter 4
175
Stampfli, G.M. and Borel, G.D., 2002. A plate tectonic model for the Paleozoic and Mesozoic constrained by dynamic plate boundaries and restored synthetic oceanic isochrons. Earth and Planetary Science Letters, 196(1-2), pp.17-33.
Steckler, M.S., Watts, A.B. and Thorne, J.A., 1988. Subsidence and basin modeling at the US Atlantic passive margin. The Geology of North America, 2, pp.399-416.
Steel, R.J., Porebski, S.J., Plink-Bjorklund, P., Mellere, D. and Schellpeper, M., 2003. Shelf-edge delta types and their sequence-stratigraphic relationships. Shelf Margin Deltas and Linked Down Slope Petroleum Systems, pp.205-230.
Stevenson, C.J., Jackson, C.A.L., Hodgson, D.M., Hubbard, S.M. and Eggenhuisen, J.T., 2015. Deep-water sediment bypass. Journal of Sedimentary Research, 85(9), pp.1058-1081.
Sylvester, Z., Deptuck, M.E., Prather, B.E., Pirmez, C., O’Byrne, C., Mohrig, D., Van Hoorn, B. and Wynn, R.B., 2012. Seismic stratigraphy of a shelf-edge delta and linked submarine channels in the northeastern Gulf of Mexico. Application of the Principles of Seismic Geomorphology to Continental-Slope and Base-of-Slope Systems: Case Studies from Seafloor and Near-Seafloor Analogues: SEPM, Special Publication, 99, pp.31-59.
Talling, P.J., 2013. Hybrid submarine flows comprising turbidity current and cohesive debris flow: Deposits, theoretical and experimental analyses, and generalized models. Geosphere, 9(3), pp.460-488.
Tari, G., Molnar, J. and Ashton, P., 2003. Examples of salt tectonics from West Africa: a comparative approach. Geological Society, London, Special Publications, 207(1), pp.85-104.
Twichell, D.C. and Roberts, D.G., 1982. Morphology, distribution, and development of submarine canyons on the United States Atlantic continental slope between Hudson and Baltimore Canyons. Geology, 10(8), pp.408-412.
Uchupi, E., Emery, K.O., Bowin, C.O. and Phillips, J.D., 1976. Continental margin off western Africa: Senegal to Portugal. AAPG Bulletin, 60(5), pp.809-878.
Uchupi, E. and Emery, K.O., 1991. Pangaean divergent margins: historical perspective. Marine Geology, 102(1-4), pp.1-28.
Wegener, A., 1912. The origin of continents. Petermanns Geog. Mitteilungen, v. 58, p. 185-309.
Wood, L.J., 2007. Quantitative seismic geomorphology of Pliocene and Miocene fluvial systems in the northern Gulf of Mexico, USA. Journal of Sedimentary Research, 77(9), pp.713-730.
Wynn, R.B., Masson, D.G., Stow, D.A. and Weaver, P.P., 2000a. The Northwest African slope apron: a modern analogue for deep-water systems with complex seafloor topography. Marine and Petroleum Geology, 17(2), pp.253-265.
Wynn, R.B., Masson, D.G., Stow, D.A.V., Weaver, P.P.E., 2000b. Turbidity current sediment waves on the submarine slopes of the western Canary Islands. Marine Geology. 163, pp.185-198.
Wynn, R.B. and Stow, D.A., 2002. Classification and characterisation of deep-water sediment waves. Marine Geology, 192(1-3), pp.7-22.
176
5 Evaluating the segmented post-rift
stratigraphic architecture of the Guyanas continental margin
Max Casson1, Jason Jeremiah2, Gérôme Calvès3, Frédéric de Ville de Goyet4, Kyle
Reuber5, Mike Bidgood6, Daniela Reháková7, Luc Bulot8,1, Jonathan Redfern1
1 North Africa Research Group (NARG), Department of Earth and Environmental Sciences, The University of
Manchester, Williamson Building, Oxford Road, Manchester, M13 9PL, UK
2 Golden Spike Geosolutions Ltd., 20 Ten Acres Crescent, Stevenage, Hertfordshire, SG2 9US, UK
3 Université Toulouse 3, Paul Sabatier, Géosciences Environnement Toulouse, 14 avenue Edouard Belin,
31400, Toulouse, France
4 PetroStrat Ltd. Tan-y-Graig, Parc Caer Seion, Conwy, LL32 8FA, Wales, UK
5 ION GeoVentures, Houston, Texas, USA
6 GSS (Geoscience) Ltd., 2 Meadows Drive, Oldmeldrum, Aberdeenshire, AB51 0GA, UK
7 Comenius University in Bratislava, Faculty of Natural Sciences, Department of Geology and Paleontology,
Mlynská dolina, Ilkovičova 6, 842 15 Bratislava, Slovakia
8 Aix-Marseille Université, CNRS, IRD, Collège de France, INRA, Cerege, Site Saint-Charles, Case 67, 3, Place
Victor Hugo, 13331, Marseille Cedex 3, France
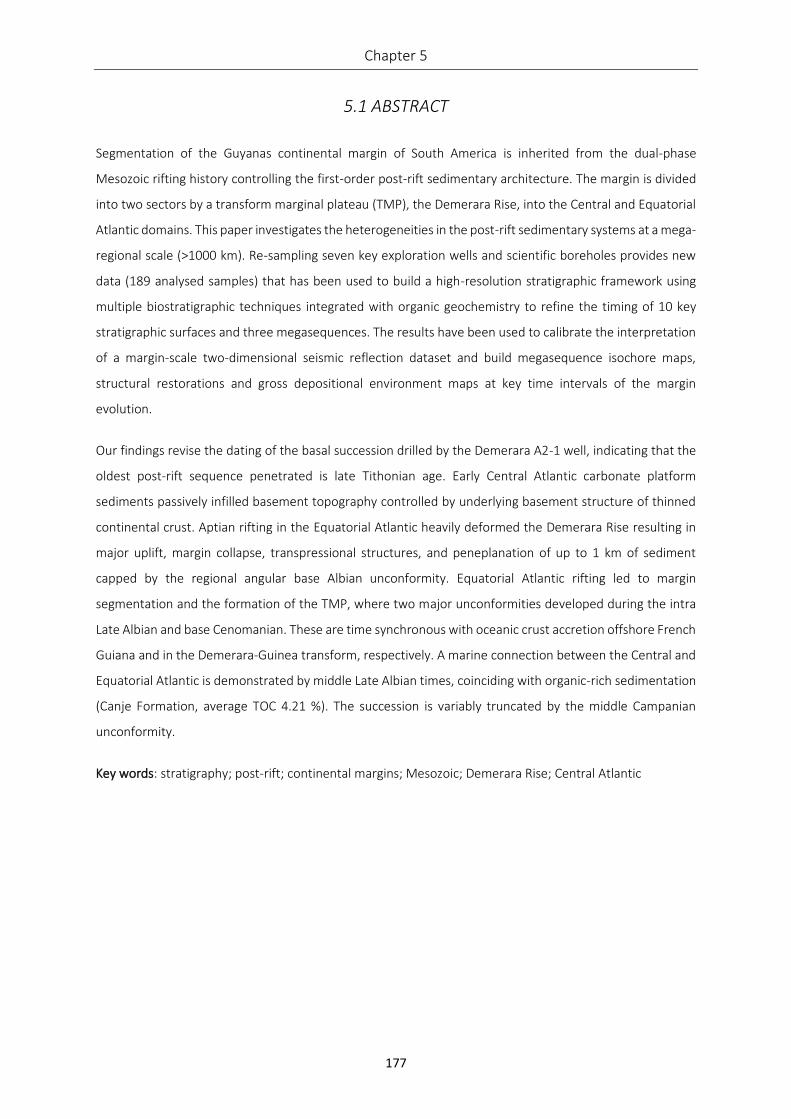
Chapter 5
177
5.1 ABSTRACT
Segmentation of the Guyanas continental margin of South America is inherited from the dual-phase
Mesozoic rifting history controlling the first-order post-rift sedimentary architecture. The margin is divided
into two sectors by a transform marginal plateau (TMP), the Demerara Rise, into the Central and Equatorial
Atlantic domains. This paper investigates the heterogeneities in the post-rift sedimentary systems at a mega-
regional scale (>1000 km). Re-sampling seven key exploration wells and scientific boreholes provides new
data (189 analysed samples) that has been used to build a high-resolution stratigraphic framework using
multiple biostratigraphic techniques integrated with organic geochemistry to refine the timing of 10 key
stratigraphic surfaces and three megasequences. The results have been used to calibrate the interpretation
of a margin-scale two-dimensional seismic reflection dataset and build megasequence isochore maps,
structural restorations and gross depositional environment maps at key time intervals of the margin
evolution.
Our findings revise the dating of the basal succession drilled by the Demerara A2-1 well, indicating that the
oldest post-rift sequence penetrated is late Tithonian age. Early Central Atlantic carbonate platform
sediments passively infilled basement topography controlled by underlying basement structure of thinned
continental crust. Aptian rifting in the Equatorial Atlantic heavily deformed the Demerara Rise resulting in
major uplift, margin collapse, transpressional structures, and peneplanation of up to 1 km of sediment
capped by the regional angular base Albian unconformity. Equatorial Atlantic rifting led to margin
segmentation and the formation of the TMP, where two major unconformities developed during the intra
Late Albian and base Cenomanian. These are time synchronous with oceanic crust accretion offshore French
Guiana and in the Demerara-Guinea transform, respectively. A marine connection between the Central and
Equatorial Atlantic is demonstrated by middle Late Albian times, coinciding with organic-rich sedimentation
(Canje Formation, average TOC 4.21 %). The succession is variably truncated by the middle Campanian
unconformity.
Key words: stratigraphy; post-rift; continental margins; Mesozoic; Demerara Rise; Central Atlantic
Stratigraphic architecture, Guyanas continental margin
178
5.2 INTRODUCTION
Continental margins are heterogeneous at various scales, resulting in along strike asymmetry and
segmentation. First-order structural and tectonic diversity is mainly related to pre-existing basement
heterogeneity often separated by long-lived lineaments. Subsequently modified by the rifting process, i.e.
the magnitude and orientation of extension (β-factor; McKenzie, 1978), and breakup magmatism, volcanic
versus non-volcanic margins (Franke, 2013). Post-rift subsidence and sedimentation finally influences the
overall margin architecture, but it is still largely controlled by the pre-existing structure (Clemson et al.,
1997). Old segmented continental margins, and particularly marginal plateaus record multiple rift-to-drift
cycles and/or failed rifts related to the gradual fragmentation of supercontinents (Wilson cycle; Wilson,
1966; Burke & Dewey, 1974). Exemplified in the studied Guyanas continental margin of South America,
caused by the opening of the Central Atlantic and succeeding transform-dominated Equatorial Atlantic, with
oblique opening directions (Fig. 5.1A; Pindell, 1985). Conventional models of lithospheric thinning assume
continuous post-rift subsidence (McKenzie, 1978), yet more studies are revealing the dynamic nature of
continental margins, with major post-rift vertical movements further influencing stratigraphic architecture
(Morocco – Charton, 2018; Mauritania – Gouiza et al., 2019; French Guiana – Derycke et al. 2018). All these
formative processes can invariably lead to a complex structural segmentation of the ‘basement’, i.e. crust
plus syn- and pre-rift strata, that subsequently controls post-rift depositional systems. Limited studies
intrinsically address the margin-scale mega-sequence architecture in this emerging and complex geological
setting.
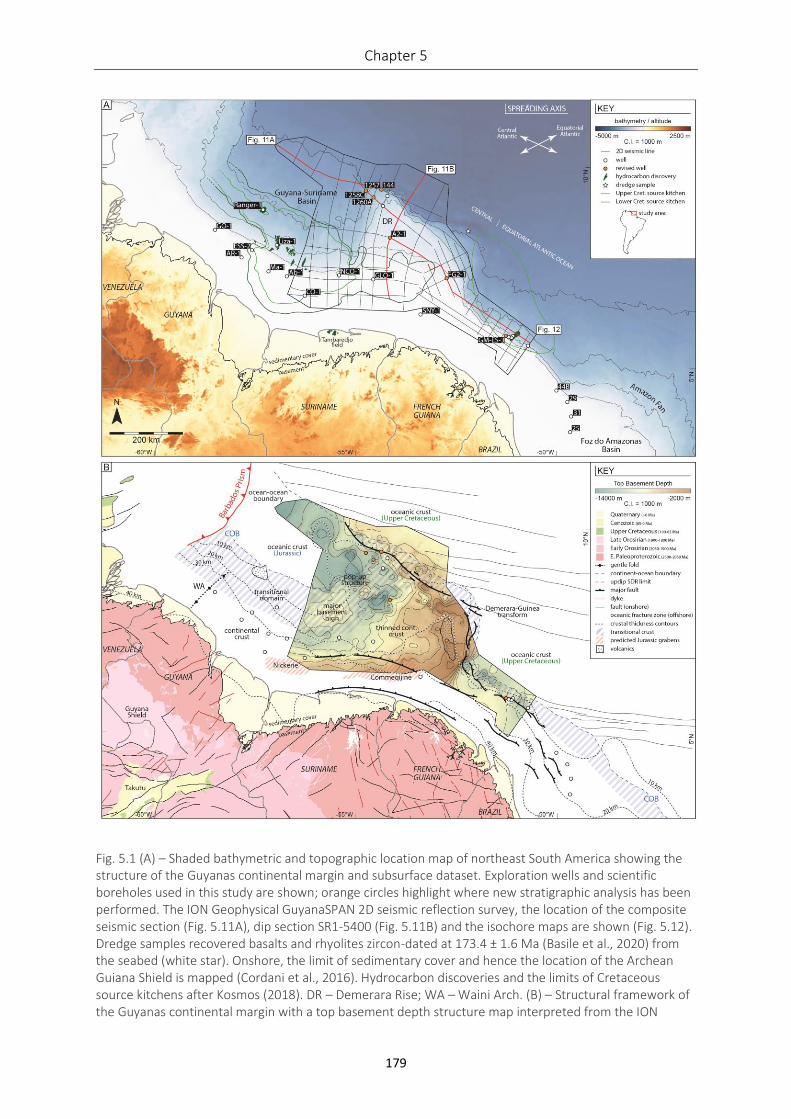
Chapter 5
179
Fig. 5.1 (A) – Shaded bathymetric and topographic location map of northeast South America showing the structure of the Guyanas continental margin and subsurface dataset. Exploration wells and scientific boreholes used in this study are shown; orange circles highlight where new stratigraphic analysis has been performed. The ION Geophysical GuyanaSPAN 2D seismic reflection survey, the location of the composite seismic section (Fig. 5.11A), dip section SR1-5400 (Fig. 5.11B) and the isochore maps are shown (Fig. 5.12). Dredge samples recovered basalts and rhyolites zircon-dated at 173.4 ± 1.6 Ma (Basile et al., 2020) from the seabed (white star). Onshore, the limit of sedimentary cover and hence the location of the Archean Guiana Shield is mapped (Cordani et al., 2016). Hydrocarbon discoveries and the limits of Cretaceous source kitchens after Kosmos (2018). DR – Demerara Rise; WA – Waini Arch. (B) – Structural framework of the Guyanas continental margin with a top basement depth structure map interpreted from the ION
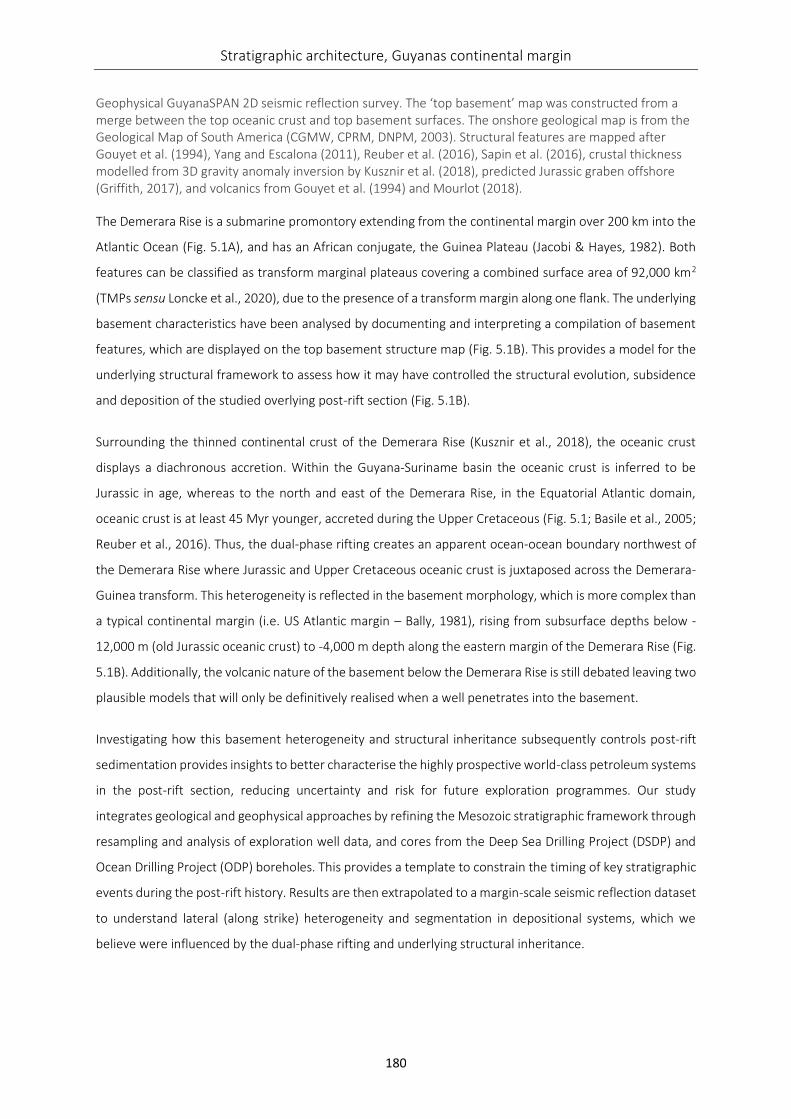
Stratigraphic architecture, Guyanas continental margin
180
Geophysical GuyanaSPAN 2D seismic reflection survey. The ‘top basement’ map was constructed from a merge between the top oceanic crust and top basement surfaces. The onshore geological map is from the Geological Map of South America (CGMW, CPRM, DNPM, 2003). Structural features are mapped after Gouyet et al. (1994), Yang and Escalona (2011), Reuber et al. (2016), Sapin et al. (2016), crustal thickness modelled from 3D gravity anomaly inversion by Kusznir et al. (2018), predicted Jurassic graben offshore (Griffith, 2017), and volcanics from Gouyet et al. (1994) and Mourlot (2018).
The Demerara Rise is a submarine promontory extending from the continental margin over 200 km into the
Atlantic Ocean (Fig. 5.1A), and has an African conjugate, the Guinea Plateau (Jacobi & Hayes, 1982). Both
features can be classified as transform marginal plateaus covering a combined surface area of 92,000 km2
(TMPs sensu Loncke et al., 2020), due to the presence of a transform margin along one flank. The underlying
basement characteristics have been analysed by documenting and interpreting a compilation of basement
features, which are displayed on the top basement structure map (Fig. 5.1B). This provides a model for the
underlying structural framework to assess how it may have controlled the structural evolution, subsidence
and deposition of the studied overlying post-rift section (Fig. 5.1B).
Surrounding the thinned continental crust of the Demerara Rise (Kusznir et al., 2018), the oceanic crust
displays a diachronous accretion. Within the Guyana-Suriname basin the oceanic crust is inferred to be
Jurassic in age, whereas to the north and east of the Demerara Rise, in the Equatorial Atlantic domain,
oceanic crust is at least 45 Myr younger, accreted during the Upper Cretaceous (Fig. 5.1; Basile et al., 2005;
Reuber et al., 2016). Thus, the dual-phase rifting creates an apparent ocean-ocean boundary northwest of
the Demerara Rise where Jurassic and Upper Cretaceous oceanic crust is juxtaposed across the Demerara-
Guinea transform. This heterogeneity is reflected in the basement morphology, which is more complex than
a typical continental margin (i.e. US Atlantic margin – Bally, 1981), rising from subsurface depths below -
12,000 m (old Jurassic oceanic crust) to -4,000 m depth along the eastern margin of the Demerara Rise (Fig.
5.1B). Additionally, the volcanic nature of the basement below the Demerara Rise is still debated leaving two
plausible models that will only be definitively realised when a well penetrates into the basement.
Investigating how this basement heterogeneity and structural inheritance subsequently controls post-rift
sedimentation provides insights to better characterise the highly prospective world-class petroleum systems
in the post-rift section, reducing uncertainty and risk for future exploration programmes. Our study
integrates geological and geophysical approaches by refining the Mesozoic stratigraphic framework through
resampling and analysis of exploration well data, and cores from the Deep Sea Drilling Project (DSDP) and
Ocean Drilling Project (ODP) boreholes. This provides a template to constrain the timing of key stratigraphic
events during the post-rift history. Results are then extrapolated to a margin-scale seismic reflection dataset
to understand lateral (along strike) heterogeneity and segmentation in depositional systems, which we
believe were influenced by the dual-phase rifting and underlying structural inheritance.
Chapter 5
181
5.3 REGIONAL SETTING
The Guyanas continental margin of South America extends 1500 km from the Barbados Prism in the west
through the Guyana-Suriname basin and across the Demerara Rise into the Equatorial Atlantic offshore
French Guiana, and the Foz do Amazonas basin, Brazil (Fig. 5.1A). This margin is situated on the north-eastern
rim of the Archean Guiana Shield (Fig. 5.1B). The Demerara Rise, a prominent bathymetric feature, divides
the margin into two tectonic domains, the Central Atlantic passive margin to the west, and the Equatorial
Atlantic transform margin to the east. Consequently, the offshore stratigraphy records the opening of the
Central Atlantic (170 Ma; Labails et al., 2010), and Equatorial Atlantic (105 Ma; Sibuet and Mascle, 1978) as
the African plate rotated anticlockwise and rifted away from South America. Prior to this later rifting and
establishment of the Guinea-Demerara transform, the Demerara Rise formed the southern extension of the
Guinea Plateau and hence the key study area for Atlantic plate reconstructions (Pindell, 1985; Moulin et al.,
2010; Kneller and Johnson, 2011; Heine et al., 2013). Post-rift sedimentation on the sutured south-eastern
margin of the Central Atlantic initiated with the establishment of an extensive, basin-fringing carbonate
platform (Fig. 5.2; Davison, 2005). The south-eastern extension of the Jurassic-Lower Cretaceous Central
Atlantic Ocean formed an arcuate shoreline at the neck of the Equatorial Atlantic across the Demerara Rise
(Gouyet et al., 1994).
Opening of the Equatorial Atlantic punctuated this tectonically-quiescent period which is expressed on the
adjacent transform margin and on the West African conjugate as an Aptian unconformity associated with
the onset of rifting (Sapin et al., 2016; Olyphant et al., 2017). Volcanism linked to Equatorial Atlantic breakup
is locally developed on both margins (Gouyet, 1988; Greenroyd et al., 2008b; Olyphant et al., 2017). The
Equatorial Atlantic basins developed as a series of en-échelon pull-apart basins separated by paleo-dextral
transform faults, now preserved as fracture zones (Pindell, 1985; Greenroyd et al., 2007, 2008a; Basile et
al., 2013). Adjacent to this, on the northern margin of the Demerara Rise, compressional structural features
are observed below a peneplaned Albian-aged angular unconformity (Gouyet, 1988; Mann et al., 1995;
Reuber et al., 2016). Transgression and opening of the Equatorial Atlantic gateway followed (Gasperini et
al., 2001; Friedrich and Erbacher, 2006). Cenomanian to Coniacian organic-rich sediments deposited along
the margin (Canje Formation, Guyana), and in adjacent basins (i.e. Naparima Hill Formation, Trinidad; La
Luna Formation, Venezuela and Colombia). These form prolific hydrocarbon source rocks (Erlich et al., 2003;
Meyers et al., 2006). Thermal subsidence of the continental margin and denudation of the Guiana Shield
resulted in increased sedimentation rates through the Late Cretaceous (Benkhelil et al., 1995; Yang and
Escalona, 2011; Mourlot, 2018). Major uplift of the South American cratons led to the formation of the Purus
Arch induced by Andean tectonism during the Paleogene-Miocene (Sapin et al., 2016). This initiated the
transcontinental Amazon River, debouching significant volumes of sediment in a depocentre along the
margin that persists to present-day (Fig. 5.1A; Figueiredo et al., 2009).
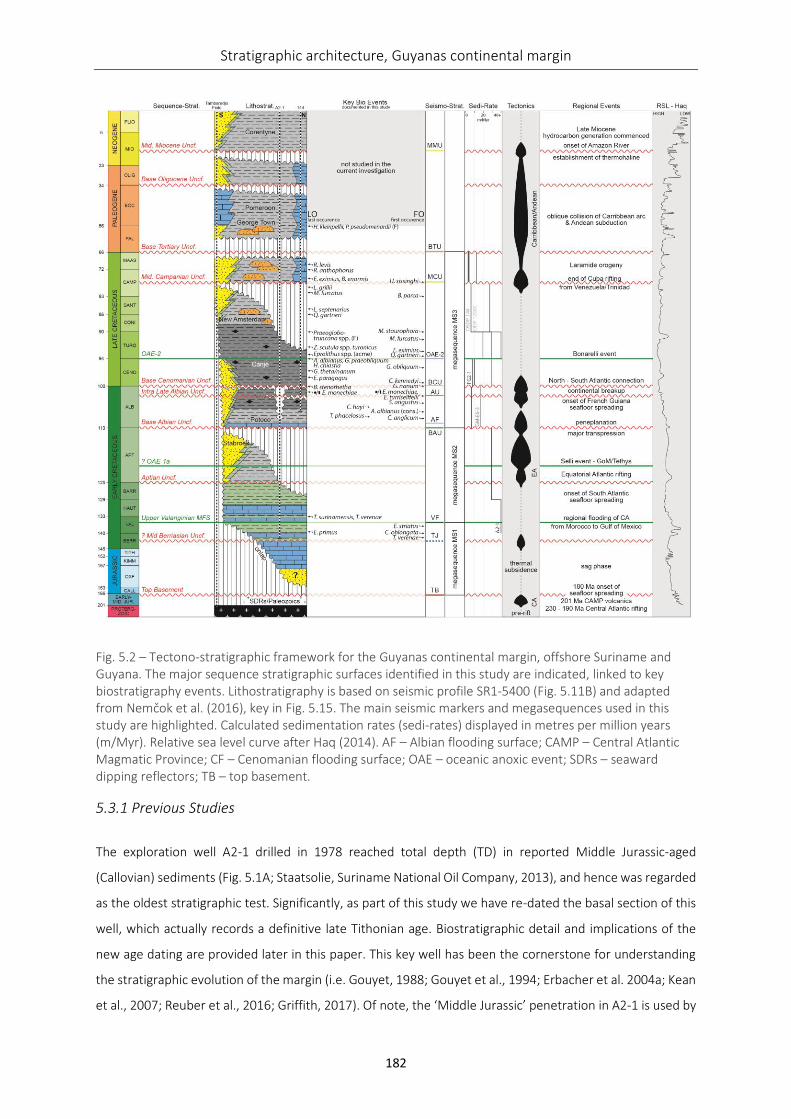
Stratigraphic architecture, Guyanas continental margin
182
Fig. 5.2 – Tectono-stratigraphic framework for the Guyanas continental margin, offshore Suriname and Guyana. The major sequence stratigraphic surfaces identified in this study are indicated, linked to key biostratigraphy events. Lithostratigraphy is based on seismic profile SR1-5400 (Fig. 5.11B) and adapted from Nemčok et al. (2016), key in Fig. 5.15. The main seismic markers and megasequences used in this study are highlighted. Calculated sedimentation rates (sedi-rates) displayed in metres per million years (m/Myr). Relative sea level curve after Haq (2014). AF – Albian flooding surface; CAMP – Central Atlantic Magmatic Province; CF – Cenomanian flooding surface; OAE – oceanic anoxic event; SDRs – seaward dipping reflectors; TB – top basement.
5.3.1 Previous Studies
The exploration well A2-1 drilled in 1978 reached total depth (TD) in reported Middle Jurassic-aged
(Callovian) sediments (Fig. 5.1A; Staatsolie, Suriname National Oil Company, 2013), and hence was regarded
as the oldest stratigraphic test. Significantly, as part of this study we have re-dated the basal section of this
well, which actually records a definitive late Tithonian age. Biostratigraphic detail and implications of the
new age dating are provided later in this paper. This key well has been the cornerstone for understanding
the stratigraphic evolution of the margin (i.e. Gouyet, 1988; Gouyet et al., 1994; Erbacher et al. 2004a; Kean
et al., 2007; Reuber et al., 2016; Griffith, 2017). Of note, the ‘Middle Jurassic’ penetration in A2-1 is used by
Chapter 5
183
Griffith (2017) to propose Jurassic source rock potential. The Deep Sea Drilling Project (DSDP) collected data
from the Cretaceous sequence to investigate the early evolution of the Central Atlantic on Leg 14 at Site 144
(Fig. 5.1A; Hayes et al., 1972). More recently, the Ocean Drilling Project (ODP) studied the opening of the
Equatorial Atlantic Gateway by drilling sites on Leg 207 (Fig. 5.1A; Erbacher et al., 2004a). This provided the
scientific community with core data from the Late Cretaceous to recent sequence, and subsequent studies
have significantly improved the existing stratigraphic framework (Erbacher et al., 2004a; 2004b; Erbacher et
al., 2005; Mosher et al., 2005; Friedrich and Erbacher, 2006; Hardas and Mutterlose, 2006; Kulhanek and
Wise, 2006; Thibault and Gardin, 2006; Krauspenhar et al., 2014). Yang and Escalona (2014) used existing
industry data to propose the tectono-stratigraphic evolution of the Guyana-Suriname basin. Post-Albian
sedimentary evolution of the Demerara Rise is investigated in Tallobre et al. (2016) and Fanget et al. (2020)
focussing on documentation of contourite deposits related to the North Atlantic Deep-Water current. Re-
evaluating and integrating these data along the full extent of the margin provides new stratigraphic insights.
5.4 DATASET & METHODS
5.4.1 Data
Lithological Samples
Re-sampling the DSDP Site 144 and ODP Leg 207 cores took place during 2017-2018, at the IODP Bremen
Core Repository, Germany (request ID: 054376IODP, 065859IODP and 077865IODP). Drill cutting samples
from the exploration wells (A2-1, FG2-1, GM-ES-3) were collected from the CGG Schulenburg facility,
Houston, United-States in 2018, kindly donated by Shell. The remainder of these samples are stored for
reference in the North Africa Research Group collection at the University of Manchester. A sample summary
is provided in the supplementary data (Table S 5.1).
Subsurface Seismic and Well Data
The seismic reflection data used in this study offshore northeast South America consists of 34 two-
dimensional (2D) seismic reflection profiles (total of 7970 line km) from the ION Geophysical GuyanaSPAN
survey (Fig. 5.1A). The survey images the entire continental margin in water depths of 40-3500 m, with a 50
m shot spacing, recording to 40 km depth and was provided as Pre-Stack Depth Migrated (PSDM) SEGY data.
The Suriname – French Guiana data is reprocessed data using WiBand broadband technology, recording to
25 km depth. A comparison is made to the conjugate Guinea Plateau. Wireline logs (gamma ray and sonic)
for the exploration wells were provided by Shell, and downloaded from the IODP data repository for ODP
Leg 207.
Stratigraphic architecture, Guyanas continental margin
184
5.4.2 Methods
A multi-disciplinary approach has been adopted to investigate and integrate a large subsurface dataset with
existing studies to document continental margin evolution.
Sedimentology and Organic Geochemistry
Drill cutting samples were set in resin and thin sectioned for petrographic analysis using an optical light
microscope. Descriptive petrographic sandstone classification was performed after Garzanti (2016). Whole-
rock X-Ray diffraction (XRD) was performed at BGS Keyworth on samples from FG2-1 using PANalytical X’Pert
Pro series diffractometer and the quantification methods of Snyder and Bish (1989).
Sixty-five shale samples were selected for organic geochemical analysis using a Shimadzu TOC-V CPN and
Solid Sample Module (SSM), calibrated to sodium carbonate and glucose to measure inorganic and total
carbon respectively. Additional geochemical data for ODP Site 1258C was incorporated from Meyers et al.
(2006). TOC data generated from the analysis of cuttings (exploration wells) is expected to yield lower results
due to the contaminant and mixing with other lithologies, as compared to core data (DSDP Site 144).
Further geochemical characterisation of thirty-four samples yielding greater than 0.5% TOC was completed
using a Rock-Eval 6 instrument at the University of Greenwich. Measurements of TOC are consistently less
than TOC derived from the Rock-Eval, by on average 0.53%. We report the results from the separate TOC
analysis as this is often a more reliable measurement of TOC compared to results from the Rock-Eval 6 (see
Behar et al., 2001). Additionally, a solvent was not used to remove free hydrocarbons prior to the pyrolysis,
whereas in the TOC analysis, free hydrocarbons are generally removed during the process, leading to a
higher value from the Rock-Eval.
Four samples from well A2-1 at levels with reported hydrocarbon shows were sent to GeoMark Research,
Houston for hydrocarbon extract analysis. Extracts were analysed for high resolution gas chromatography
and biomarker geochemical analysis.
Biostratigraphy
Dependent on lithology, various biostratigraphic analyses were performed to provide age constraints on the
stratigraphy. All key biostratigraphic events are shown on Fig. 5.2. Additionally, micro-fossil photographs are
fully documented in the supplementary data for future reference (Fig. S 5.2, Fig. S 5.3). Calcareous
nannofossils (JJ): In total 138 samples (see supplementary data Table S 5.1 for sample overview) were
analysed with standard techniques described by Bown (1998), and the picking brush method of Jeremiah
(1996). Samples were analysed semi-quantitatively, with the first thirty fields of view counted and the
remaining slide scanned for rare specimens. Foraminifera (MB): Thirty-one samples with relatively abundant
Chapter 5
185
calcareous nannofossil content were chosen for micropaleontological analysis and prepared using the
standard methodology described by Armstrong and Brasier (2013). Palynology (FdVdG): Ten samples for
palynological analyses were subject to the standard palynological preparation technique which involves
removal of all mineral material by hydrofluoric acid digestion and sieving to produce a residue of the 10
micron and above size fraction for each sample. An initial count of 100 in situ palynomorph specimens was
performed and abundance quantitatively assessed using percentage of total palynoflora. Calpionellids (DR):
A total of eight limestone-rich cutting samples from well A2-1 were thin sectioned and petrographically
analysed for the occurrence of calpionellids. Results are amalgamated within the ‘dating’ section of each
well/borehole, therefore the letters (N), (F), (P) and (C) are used to denote the type of fauna, calcareous
nannofossils, foraminifera, palynology, calpionellids respectively, when discussed.
Cuttings samples are (theoretically) composited, representative material from a drilled interval of rock.
Cuttings are susceptible to contamination from material collapsing into the borehole (called “cavings”) from
levels higher in the section and contaminating in situ sample material from near the drill bit. To mitigate
contamination from cavings, multiple picked lithologies per sample were analysed for nannofossils, the
oldest sample being considered representative of the depth, first occurrence (FO’s) and last occurrence
datums (LO’s) were then utilised. This was not possible for the palynology and foraminiferal work where
more rock material is required, here extinction events (or events which become apparent in a downhole
perspective) form the basis for the majority of biostratigraphic determinations i.e. first downhole
occurrence, FDO.
Seismic Interpretation & Structural Evolution
To ensure a robust seismic-well tie and depth calibration, synthetic seismograms for two exploration wells,
A2-1 and FG2-1 (Fig. 5.10), plus the ODP Leg 207 boreholes were produced. This process tied the wireline
log data to the seismic survey following the methodology of Sheriff (1976; 1977). Despiked sonic logs were
converted to give an estimation of the density log using Gardner’s equation. Statistical wavelets were
extracted for A2-1 and FG2-1 from the zones of interest, 2000 – 4000 m and 2000 – 3500 m depth
respectively (Fig. 5.10). Following this, key horizons (Fig. 5.2) identified during the stratigraphic re-evaluation
were interpreted on the 2D seismic dataset using Schlumberger’s Petrel software and the interpretation
methods of Payton (1977). Horizons were gridded and isochore thickness maps calculated (Fig. 5.12).
Flattening of the seismic section (Fig. 5.11A) on key horizons helped improve our understanding of
depositional geometries and structural features at the time of deposition (Fig. 5.14; Bland et al., 2004).
Projecting the uppermost continuous seismic reflector below the base Albian unconformity (BAU) provided
an estimation for the amount of missing section due to erosion.
Stratigraphic architecture, Guyanas continental margin
186
5.5 RESULTS
5.5.1 Sedimentological & Stratigraphic Control
Seven wells and scientific boreholes in the study area provide the control on lithologies/facies, age dating
and organic geochemistry. These have been re-examined and the new data used to build depositional
models to constrain and be integrated into the seismic dataset. Sample depths are reported in the original
unit of measurement, a metric conversion is provided for imperial depth measurements.
GM-ES-3
Exploratory drilling offshore French Guiana targeted the Santonian to Maastrichtian-aged Cingulata turbidite
fan system (McCoss, 2017). Through 2011-2013, 5 exploration wells were drilled with the first, GM-ES-1
(Zaedyus), encountering 72 m of net oil pay. Subsequent wells failed to find commercial hydrocarbons in
adjacent prospects. This includes GM-ES-3 (Priodontes), which penetrated a 50 m gross section of oil-stained
sandstone reservoir (Bradypus fan) above the targeted water-wet reservoir (Priodontes fan), well failure as
a result of an invalid trap. The 670 m thick sequence below the reservoir section to TD is mudstone-
dominated with calcareous and organic-rich intervals. At 6036 m, there is a lithology change from shale to
non-calcareous mudstones and at TD, sandstones, considered to be pre-rift strata. The data from this well
provides crucial stratigraphic information of deposits recording the rift-to-drift transition and timing of
breakup in the Equatorial Atlantic (Fig. 5.3).
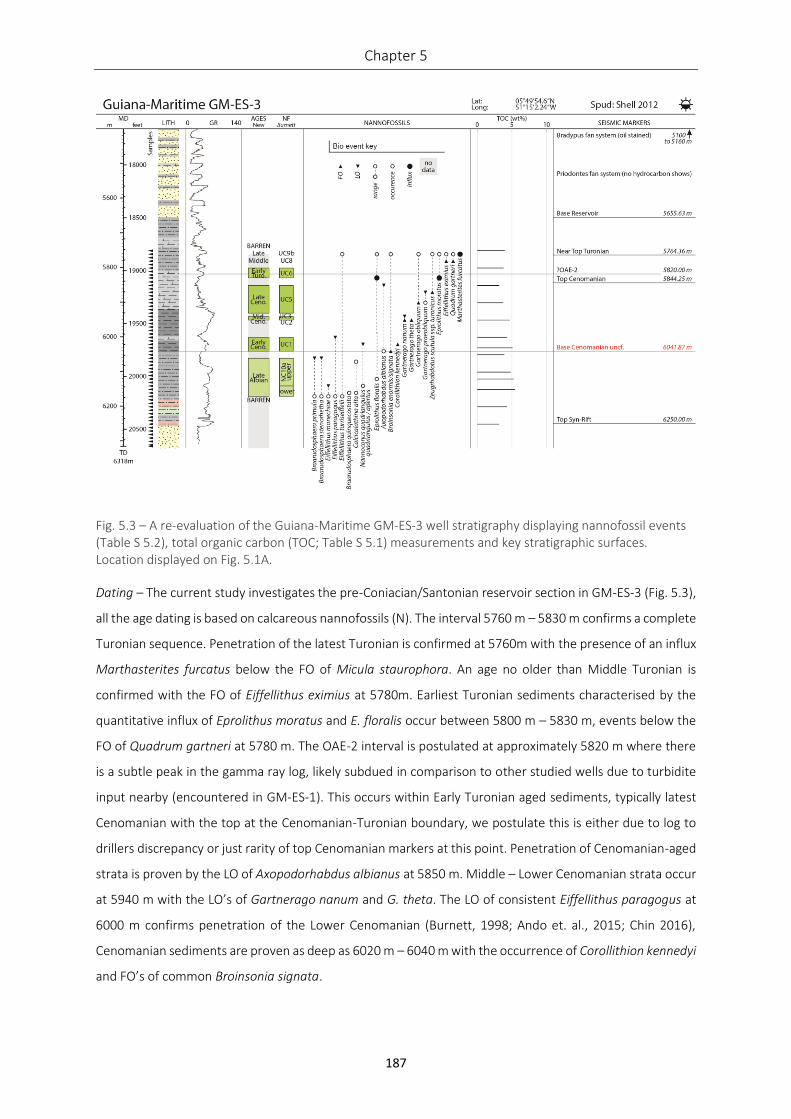
Chapter 5
187
Fig. 5.3 – A re-evaluation of the Guiana-Maritime GM-ES-3 well stratigraphy displaying nannofossil events (Table S 5.2), total organic carbon (TOC; Table S 5.1) measurements and key stratigraphic surfaces. Location displayed on Fig. 5.1A.
Dating – The current study investigates the pre-Coniacian/Santonian reservoir section in GM-ES-3 (Fig. 5.3),
all the age dating is based on calcareous nannofossils (N). The interval 5760 m – 5830 m confirms a complete
Turonian sequence. Penetration of the latest Turonian is confirmed at 5760m with the presence of an influx
Marthasterites furcatus below the FO of Micula staurophora. An age no older than Middle Turonian is
confirmed with the FO of Eiffellithus eximius at 5780m. Earliest Turonian sediments characterised by the
quantitative influx of Eprolithus moratus and E. floralis occur between 5800 m – 5830 m, events below the
FO of Quadrum gartneri at 5780 m. The OAE-2 interval is postulated at approximately 5820 m where there
is a subtle peak in the gamma ray log, likely subdued in comparison to other studied wells due to turbidite
input nearby (encountered in GM-ES-1). This occurs within Early Turonian aged sediments, typically latest
Cenomanian with the top at the Cenomanian-Turonian boundary, we postulate this is either due to log to
drillers discrepancy or just rarity of top Cenomanian markers at this point. Penetration of Cenomanian-aged
strata is proven by the LO of Axopodorhabdus albianus at 5850 m. Middle – Lower Cenomanian strata occur
at 5940 m with the LO’s of Gartnerago nanum and G. theta. The LO of consistent Eiffellithus paragogus at
6000 m confirms penetration of the Lower Cenomanian (Burnett, 1998; Ando et. al., 2015; Chin 2016),
Cenomanian sediments are proven as deep as 6020 m – 6040 m with the occurrence of Corollithion kennedyi
and FO’s of common Broinsonia signata.
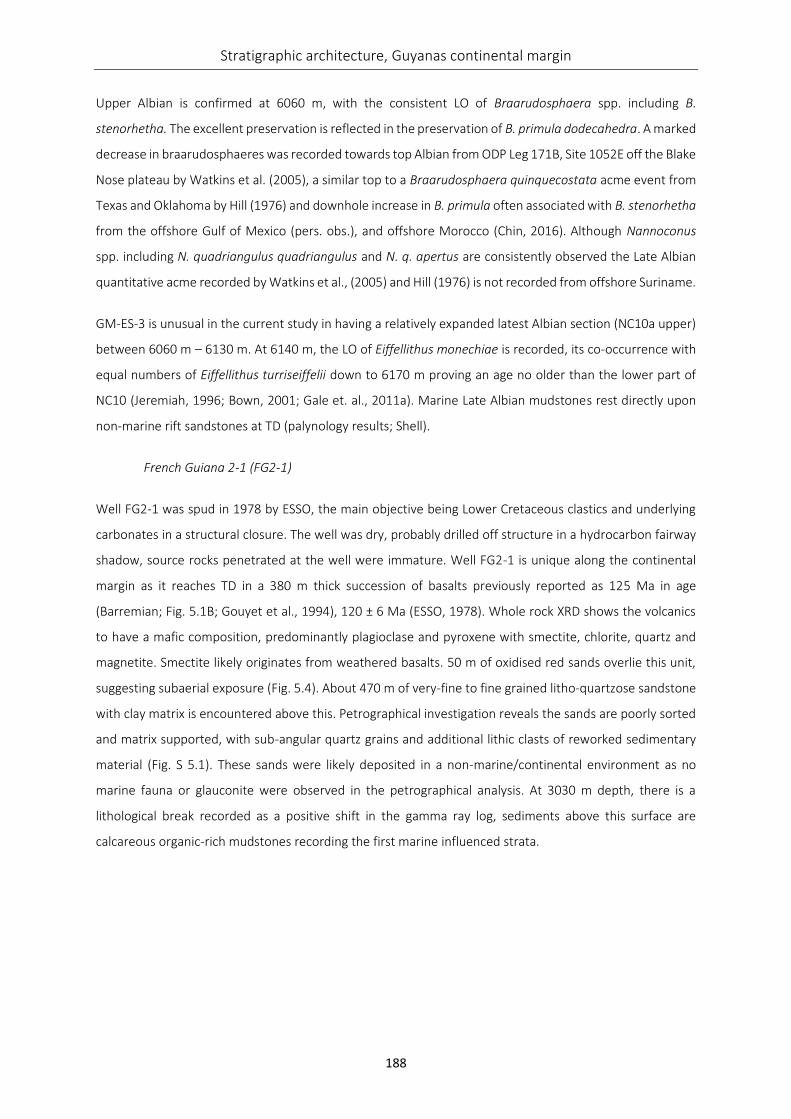
Stratigraphic architecture, Guyanas continental margin
188
Upper Albian is confirmed at 6060 m, with the consistent LO of Braarudosphaera spp. including B.
stenorhetha. The excellent preservation is reflected in the preservation of B. primula dodecahedra. A marked
decrease in braarudosphaeres was recorded towards top Albian from ODP Leg 171B, Site 1052E off the Blake
Nose plateau by Watkins et al. (2005), a similar top to a Braarudosphaera quinquecostata acme event from
Texas and Oklahoma by Hill (1976) and downhole increase in B. primula often associated with B. stenorhetha
from the offshore Gulf of Mexico (pers. obs.), and offshore Morocco (Chin, 2016). Although Nannoconus
spp. including N. quadriangulus quadriangulus and N. q. apertus are consistently observed the Late Albian
quantitative acme recorded by Watkins et al., (2005) and Hill (1976) is not recorded from offshore Suriname.
GM-ES-3 is unusual in the current study in having a relatively expanded latest Albian section (NC10a upper)
between 6060 m – 6130 m. At 6140 m, the LO of Eiffellithus monechiae is recorded, its co-occurrence with
equal numbers of Eiffellithus turriseiffelii down to 6170 m proving an age no older than the lower part of
NC10 (Jeremiah, 1996; Bown, 2001; Gale et. al., 2011a). Marine Late Albian mudstones rest directly upon
non-marine rift sandstones at TD (palynology results; Shell).
French Guiana 2-1 (FG2-1)
Well FG2-1 was spud in 1978 by ESSO, the main objective being Lower Cretaceous clastics and underlying
carbonates in a structural closure. The well was dry, probably drilled off structure in a hydrocarbon fairway
shadow, source rocks penetrated at the well were immature. Well FG2-1 is unique along the continental
margin as it reaches TD in a 380 m thick succession of basalts previously reported as 125 Ma in age
(Barremian; Fig. 5.1B; Gouyet et al., 1994), 120 ± 6 Ma (ESSO, 1978). Whole rock XRD shows the volcanics
to have a mafic composition, predominantly plagioclase and pyroxene with smectite, chlorite, quartz and
magnetite. Smectite likely originates from weathered basalts. 50 m of oxidised red sands overlie this unit,
suggesting subaerial exposure (Fig. 5.4). About 470 m of very-fine to fine grained litho-quartzose sandstone
with clay matrix is encountered above this. Petrographical investigation reveals the sands are poorly sorted
and matrix supported, with sub-angular quartz grains and additional lithic clasts of reworked sedimentary
material (Fig. S 5.1). These sands were likely deposited in a non-marine/continental environment as no
marine fauna or glauconite were observed in the petrographical analysis. At 3030 m depth, there is a
lithological break recorded as a positive shift in the gamma ray log, sediments above this surface are
calcareous organic-rich mudstones recording the first marine influenced strata.
Chapter 5
189
Fig. 5.4 – A re-evaluation of the French Guiana 2-1 (FG2-1) well stratigraphy displaying nannofossil events (Table S 5.2), foraminifera and palynology results, total organic carbon (TOC; Table S 5.1) measurements and key stratigraphic surfaces. Location displayed on Fig. 5.1A.
Dating – Nannofossil and foraminifera analysis started at 7600 ft (2316.50 m) within lower Thanetian
sediments, based on the co-occurrence of Heliolithus kleinpellii, Discoaster mohleri (N) and FDO of
Globanomalina pseudomenardii (F). This level is just above the Base Tertiary unconformity (BTU) identified
at 2329.79 m. Lower Paleocene and Upper Maastrichtian deposits appear missing, this sequence is not
encountered in subsequent cavings. A diverse Lower Maastrichtian assemblage is recovered from the
interval 7800 ft – 8000 ft (2377.4 m – 2438.4 m) with Reinhardtites levis (N) recorded, supported by the FDO
of Globotruncana aegyptiaca (F). At 8200 ft (2499.4 m) the LO’s of Marthasterites furcatus, common
Eiffellithus eximius, Lithastrinus grillii and Broinsonia signata (N) indicates basal Campanian deposits.
A relatively complete Santonian to Coniacian sequence is penetrated between 8400 ft – 8980 ft (2560.3 m
– 2737.1 m). At 8400 ft (2560.3 m) Lower Santonian deposits are proven with the LO of Lithastrinus
Stratigraphic architecture, Guyanas continental margin
190
septenarius (N). The LO of Quadrum gartneri and Q. eneabrachium (N) is at 8780 ft (2676.1 m) followed by
the FO of Micula staurophora and LO of Eprolithus floralis (N) at 8980 ft (2737.1 m). This is supported by the
foraminifera analysis where the FDO of Marginotrucana sigmoconcavata (F) indicates an age no younger
than Santonian (intra-Dicarinella asymetrica zone) at 8400 ft (2560.3 m). The presence of common
Marginotruncana spp. (F) in assemblages at and below this depth support the age assignment. This genus is
restricted to the Santonian – Turonian interval.
Turonian sediments are recorded from 9200 ft (2804.2 m), this interval below the FO of Micula staurophora
(N) and supported by the FDO of Praeglobotruncana spp. (F). The base of the Middle Turonian is marked by
both FO’s of Marthasterites furcatus and Eiffellithus eximius (N) at 9400 ft (2865.1 m). The Upper
Cenomanian is penetrated at 9790 ft (2984.0 m) characterised by the LO of Axopodorhabdus albianus and
Gartnerago praeobliquum (N). Between 9820 ft (2993.1 m) and 9890 ft (3014.5 m) the cuttings are
dominated by Upper Turonian cavings, no in-situ assemblages are recovered. Penetration of Middle to Lower
Cenomanian is confirmed by the LO’s of Gartnerago theta and G. nanum (N) at 9920 ft (3023.6 m). The
oldest sample from 9950 ft (3032.5 m) yields Corollithion kennedyi, abundant Broinsonia enormis and G.
nanum (N) confirming Cenomanian sediments, Upper Albian deposits absent.
Three samples from the sandstones overlying the volcanics were analysed for palynology (3072.4 to 3288.8
m; Fig. 5.4), however, the samples were dominated by Late Cenomanian cavings.
Demerara A2-1
Demerara A2-1 was spudded by Esso in 1977 in 3937 ft (1200 m) water depth to appraise a large anticlinal
structure over the Demerara Rise, offshore Suriname. The well was drilled to a total measured depth of
16207 ft (4940.0 m) within previously reported Middle Jurassic (Callovian) platform carbonates and
abandoned as a dry well. The lowermost ca. 2350 m of stratigraphy in A2-1 is composed mainly of an
alternating limestone/mudstone sequence (Fig. 5.5). Limestone-dominated strata sharply decrease the
gamma ray log forming distinctive blocky responses (Fig. 5.5; Fig. 5.10), these sequences are up to 450 m
thick. Petrographic analysis of these limestones reveals a mixture of microfacies within the cuttings;
biomicritic, bioclastic, sandy, silty limestones are observed with a mudstone to grainstone texture,
occasionally dolomitised. Limestones rich in bioclastic material contain fragments of ostracods, crinoids,
spores, echinoid spines, recrystalised bivalve shells, framboidal pyrite, representative of platform
carbonates. The micro-fauna includes planktonic foraminifera observed in most limestone cuttings, with
common cysts and spores, and occasional calpionellids (discussed below). Two samples from near TD of the
well contain more argillaceous and siliciclastic material with minor organic matter. Sedimentation rates are
relatively high averaging 65.8 m/Myr throughout this interval (Fig. 5.2). This sequence is more mudstone-
dominated towards the top, becoming increasingly organic (max. TOC – 1.09%).

Chapter 5
191
A 40 m thick sandstone unit with remarkably similar lithological characteristics to the fine-grained sands in
FG2-1 overlies this package and is interpreted as part of the Starbroek Formation (Fig. S 5.1). Of note, the
presence of glauconite is indicative of deposition in shallow marine conditions (e.g. Stonecipher, 1999; Fig.
S 5.1) and sedimentation rates. Limestones (Potoco Formation), 80 m thick, overlie these sands and are the
first transgressive deposits above the BAU. The overlying unit is marked by a sharp increase in the gamma
ray log. A thick interval of calcareous mudstone is encountered with high organic content and is eventually
truncated by the BTU.
Fig. 5.5 (next page) – A re-evaluation of the Demerara A2-1 well stratigraphy displaying nannofossil events (Table S 5.2), foraminifera and palynology results, total organic carbon (TOC; Table S 5.1) measurements and key stratigraphic surfaces. Oil shows indicated on lithology column as green stars. Palynology abbreviations: CMN – common, FDCO – first downhole common occurrence. Location displayed on Fig. 5.1A.
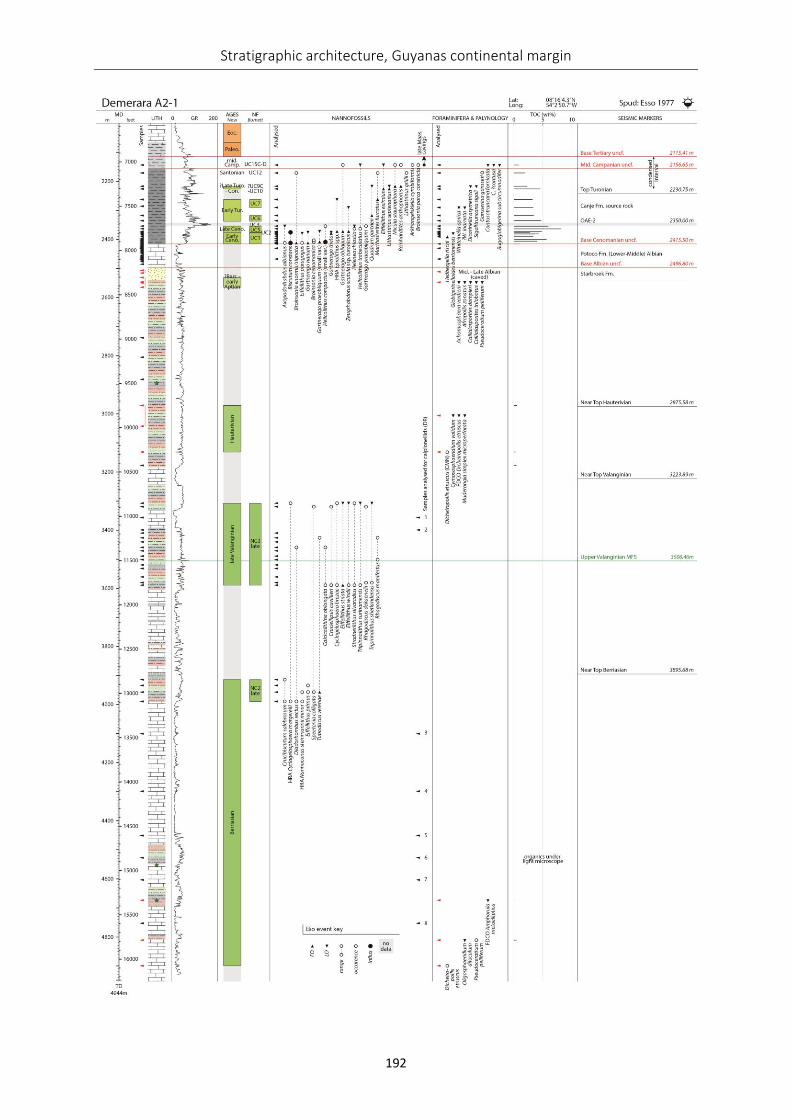
Stratigraphic architecture, Guyanas continental margin
192
Chapter 5
193
Dating – The youngest samples analysed at 7020 ft (2139.7 m) yielded a middle Campanian assemblage
characterised by Eiffelithus eximius, Uniplanarius sissinghi and Arkhangelskiellla cymbiformis (N), and FDOs
of Contusotruncana fornicata, C. ?contusa and Rugotruncana subcircumnodifer (F). The middle Campanian
unconformity (MCU) is recognised in this well at 2156.65 m, with the underlying sediments recorded from
7110 ft (2167.1 m) yielding Santonian fauna characterised by Marthasterites furcatus, Lithastrinus grillii (N)
below FO’s of the Broinsonia parca group and A. cymbiformis (N). Organic mudstones of Coniacian to ?Upper
Turonian age are recovered over the interval 7260 ft – 7290 ft (2212.8 m – 2222.0 m). The assemblages are
characterised by Quadrum gartneri, Eprolithus floralis and Lithastrinus septenarius (N). The FO of Micula
staurophora (N) at 7290 ft (2212.8 m; if in-situ) would indicate an age no older than Coniacian. The
occurrence of abundant M. furcatus (N) also at 7290 ft (2212.8 m) confirms an age no older than uppermost
Turonian.
A relatively expanded Lower Turonian succession between 7410 ft – 7650 ft (2258.6 m – 2331.7 m) is
characterised by the HRA of Eprolithus spp. (N) including quantitative influxes of Eprolithus moratus and E.
floralis (N) below the FO of Eiffelithus eximius (N). The LO of Zeugrhabdotus scutula ssp. turonicus (N) is at
7500 ft (2286.0 m), whilst the FO of Quadrum gartneri (N) is at 7590 ft (2313.4 m). The age assignment is
supported by FDOs of Whiteinella aprica and ?W. inornata (F). Penetration of Upper Cenomanian strata is
confirmed by the LO’s of Axopodorhabdus albianus, Gartnerago praeobliquum and Helenea chiastia co-
occurring with Gartnerago obliquum (N) at 7710 ft (2350.0 m). Lower Cenomanian age is penetrated at 7800
ft (2377.4 m) with the LO’s of Gartnerago nanum and G. theta (N), the age assignment supported by the LO
of consistent Eiffellithus paragogus at 7840ft (2389.63m). The basal Cenomanian is characterised by the
Broinsonia plexus including B. cenomanicus, B. signata and B. enormis (N). Other characteristic nannofloral
events of the basal Cenomanian is the HRA of Helicolithus compactus, H. compactus (small var.) and
Gartnerago praeobliquum (small var.). At well A2-1 the base Cenomanian unconformity (BCU) lies directly
upon a ?Lower Albian Potoco carbonate succession, no Upper to Middle Albian preserved as at ODP Leg 207
(Erbacher et al., 2004a).
The mudstone-dominated sequence below the BAU at 2496.4 m yields an intra-early Aptian to ?Barremian
marine dinocyst assemblage due to the presence of Pseudoceratium pelliferum (Duxbury, 1983),
Achomosphaera verdierii (Below, 1982) and Afropollis zonatus (Doyle et al., 1982; P). The co-occurrence of
common Dicheiropollis etruscus, is a sporomorph event which has been recorded from unpublished data of
Atlantic offshore Morocco within Hauterivian dated sediments. It is widely recorded from undifferentiated
Neocomian sediments offshore West Africa) and Muderongia simplex microperforata (Davey, 1982; Costa
et al., 1992; P).
Between 10840 ft (3307.1 m) and 11790 ft (3593.6 m) rich nannofloras yielding Eiffellithus windii, E. striatus,
Stradnerlithus silvaradius, Rhagodiscus dekaenelii, R. manifestus, Speetonia colligata, Cruciellipsis cuvillieri,
Stratigraphic architecture, Guyanas continental margin
194
abundant Cyclagelosphaera margerelii, C. brezae, Tubodiscus verenae and Tripinnalithus surinamensis (N)
are encountered indicating penetration of late Valanginian sediments. Sporadic occurrences of
Calcicalathina oblongata and Diadorhombus rectus (N) are also recorded. Nannoconids are dominated by
the wide canal species N. kamptneri, N. wassalii and N. cornuta (N). The late Valanginian appears to record
the Lower Cretaceous maximum sea level pre-Albian and associated increase in nannofloral diversity. This
level is calibrated to the Upper Valanginian MFS (VF), an event recorded in this study from the Gulf of Mexico
(Loucks et al., 2017; Jeremiah, pers. obs.).
Below 11790 ft (3593.6 m), nannofossil diversity decreases with the increased frequency of platform
limestones. A brief flooding event is recorded between 12850 ft (3916.7 m) and 13090 ft (3989.8 m), where
calcareous mudstones are encountered again. The nannoflora is characterised by Crucibiscutum salebrosum,
Nannoconus steinmannii minor, Diadorhombus rectus, Eiffellithus primus and Tubodiscus verenae below the
FO of Calcicalithina oblongata (N), an indication that late Berriasian sediments have been penetrated.
The current biostratigraphy study confirms the age at TD of this well as no older than late Tithonian based
on calpionellid occurrences, much younger than previous studies that indicate an age as old as Callovian
(Griffith, 2017). The majority of the carbonate succession is Early Cretaceous aged. At 14100 ft (4297.7 m)
the top occurrence of Crassicollaria intermedia (C) is recorded, indicating the late Tithonian has been
penetrated, specifically the Crassicollaria Zone (Rename, 1985; Blau & Grün, 1997). Below this, the top
occurrence of Calpionella alpina and Crassicollaria parvula (C) occur at 15100 ft (4602.5 m), as well as
occurrences of Calpionella alpina, Crassicollaria intermedia and Tintinnopsella carpathica (C) at 15590 ft
(4751.8 m) are again characteristic of the late Tithonian Crassicollaria Zone. The acme of Calpionella alpina,
diagnostic of the Jurassic-Cretaceous boundary (Michalík & Reháková, 2011; Wimbledon et al., 2011), is not
recorded likely due to the studied sampling interval and therefore a tentative top Jurassic is placed at 4277.1
m. Three samples from the interval 15330 ft – 16070 ft (4672.6 m – 4898.1 m) yield a low diversity dinocyst
assemblage of Amphorula metaelliptica (Dodekova, 1969; Monteil, 1992; Habib & Drugg, 1983; van Helden,
1986), Oligosphaeridium diluculum (Davey, 1982) and Pseudoceratium pelliferum (P), indicating an age no
older than Berriasian, the assemblage considered caved.
ODP Leg 207
The following lithological summary is provided for the Cretaceous sediments of Site 1258C (the main focus
of the study), however a more complete description of the stratigraphy penetrated on Leg 207 and
specifically Site 1258 is presented in Erbacher et al. (2004a; 2004b; Fig. 5.6). Additional data is presented
from sites 1257A and 1260A. Cores from three Cretaceous units were recovered (Fig. 5.7): Unit 3 –
calcareous nannofossil clay (139 m); Unit 4 – laminated black shale and limestone (55 m); Unit 5 –
phosphoritic calcareous clay with organic matter (thickness – 37 m). The top of Unit 3 is marked by 2 cm
thick layer of graded medium to fine-sized green spherules representing the ejecta layer of the Cretaceous-
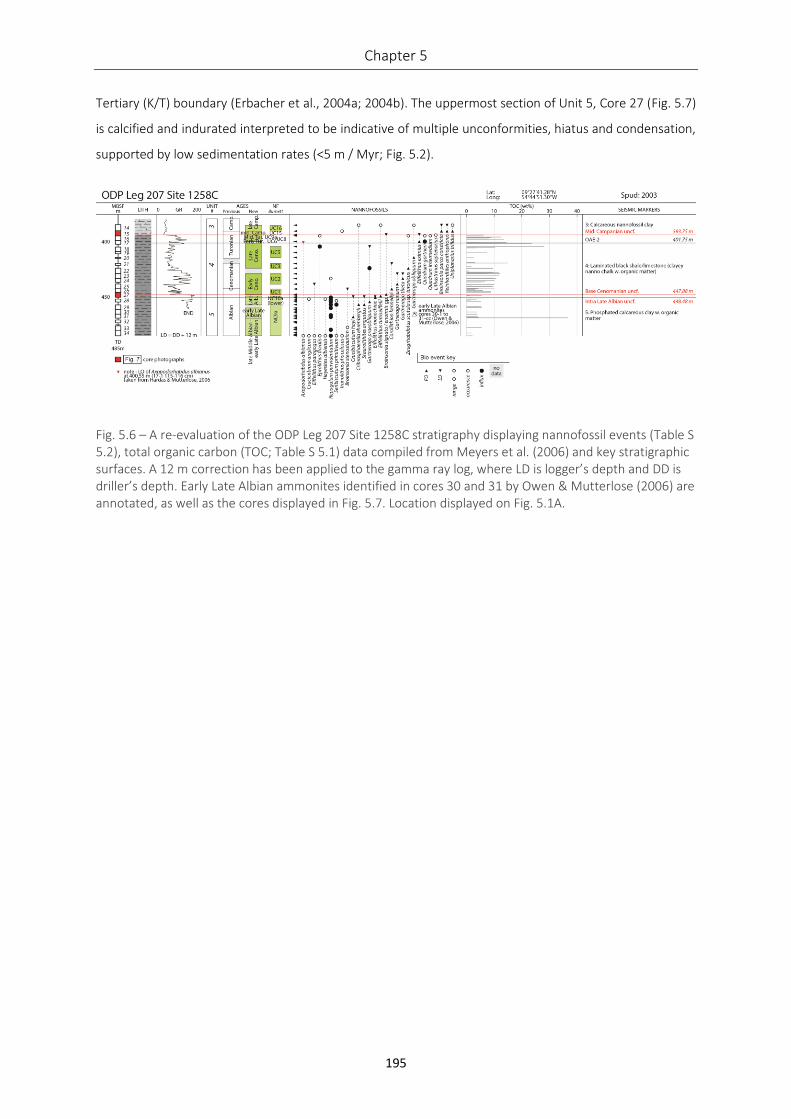
Chapter 5
195
Tertiary (K/T) boundary (Erbacher et al., 2004a; 2004b). The uppermost section of Unit 5, Core 27 (Fig. 5.7)
is calcified and indurated interpreted to be indicative of multiple unconformities, hiatus and condensation,
supported by low sedimentation rates (<5 m / Myr; Fig. 5.2).
Fig. 5.6 – A re-evaluation of the ODP Leg 207 Site 1258C stratigraphy displaying nannofossil events (Table S 5.2), total organic carbon (TOC; Table S 5.1) data compiled from Meyers et al. (2006) and key stratigraphic surfaces. A 12 m correction has been applied to the gamma ray log, where LD is logger’s depth and DD is driller’s depth. Early Late Albian ammonites identified in cores 30 and 31 by Owen & Mutterlose (2006) are annotated, as well as the cores displayed in Fig. 5.7. Location displayed on Fig. 5.1A.
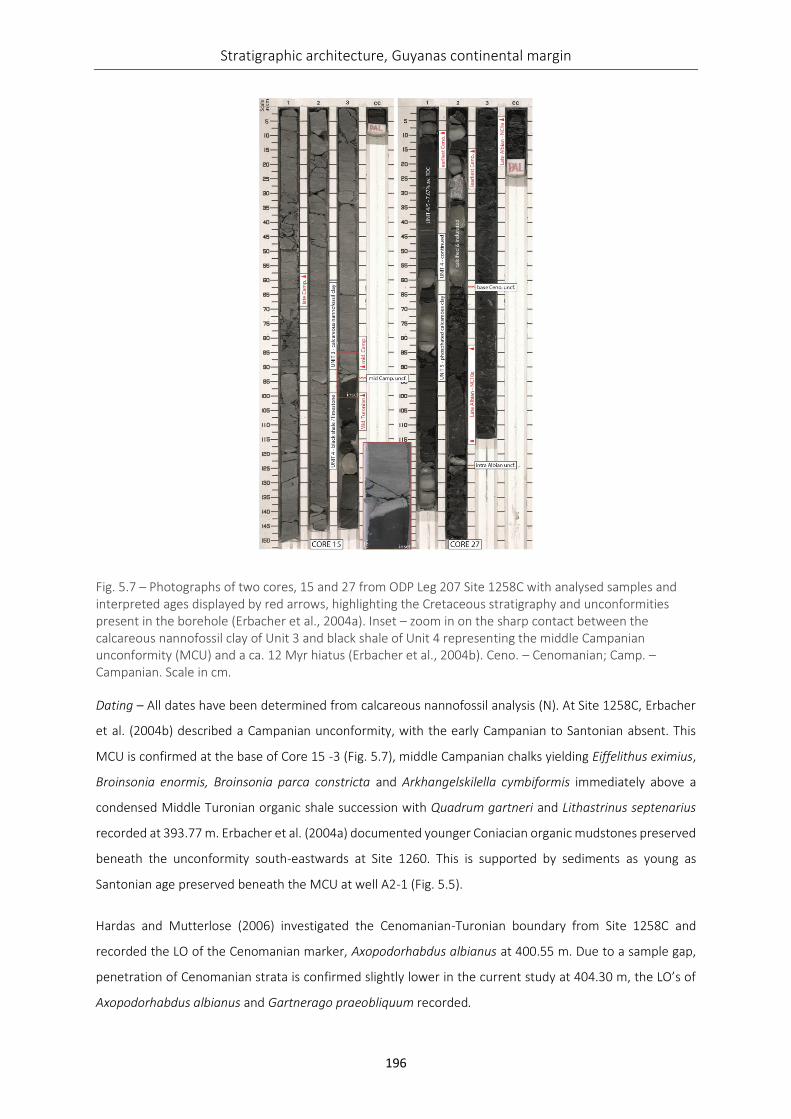
Stratigraphic architecture, Guyanas continental margin
196
Fig. 5.7 – Photographs of two cores, 15 and 27 from ODP Leg 207 Site 1258C with analysed samples and interpreted ages displayed by red arrows, highlighting the Cretaceous stratigraphy and unconformities present in the borehole (Erbacher et al., 2004a). Inset – zoom in on the sharp contact between the calcareous nannofossil clay of Unit 3 and black shale of Unit 4 representing the middle Campanian unconformity (MCU) and a ca. 12 Myr hiatus (Erbacher et al., 2004b). Ceno. – Cenomanian; Camp. – Campanian. Scale in cm.
Dating – All dates have been determined from calcareous nannofossil analysis (N). At Site 1258C, Erbacher
et al. (2004b) described a Campanian unconformity, with the early Campanian to Santonian absent. This
MCU is confirmed at the base of Core 15 -3 (Fig. 5.7), middle Campanian chalks yielding Eiffelithus eximius,
Broinsonia enormis, Broinsonia parca constricta and Arkhangelskilella cymbiformis immediately above a
condensed Middle Turonian organic shale succession with Quadrum gartneri and Lithastrinus septenarius
recorded at 393.77 m. Erbacher et al. (2004a) documented younger Coniacian organic mudstones preserved
beneath the unconformity south-eastwards at Site 1260. This is supported by sediments as young as
Santonian age preserved beneath the MCU at well A2-1 (Fig. 5.5).
Hardas and Mutterlose (2006) investigated the Cenomanian-Turonian boundary from Site 1258C and
recorded the LO of the Cenomanian marker, Axopodorhabdus albianus at 400.55 m. Due to a sample gap,
penetration of Cenomanian strata is confirmed slightly lower in the current study at 404.30 m, the LO’s of
Axopodorhabdus albianus and Gartnerago praeobliquum recorded.
Chapter 5
197
Lower Cenomanian sediments are proven at 428.95m with the occurrence of common Gartnerago theta,
the age assignment supported by the LO of consistent Eiffellithus paragogus at 438.32m. Cenomanian strata
are confirmed down to 447.58 m at Site 1258C with the FO of Corollithion kennedyi. Erbacher et al. (2004b)
documented a major hiatus at the base Cenomanian with no support for the preservation of Upper Albian
sediments. The current study supports the identification of the BCU, with latest Albian sediments missing.
The upper part of Zone NC10 is not recorded. Intra Late Albian aged sediment is however recorded
immediately below at 449.74m with the LO of an increase in Eiffellithus monechiae, E. turriseiffelii, however
still quantitatively dominant over E. monechiae, down to 450.06m.
The FO of E. turriseiffelii and associated E. monechiae acme and earlier FO is not preserved in 1258C. Another
hiatus, an intra Late Albian unconformity is recorded from the base of Core 27-2 at 450.16m, sediments
occurring below characterised by Staurolithites angustus at 450.45m. The LO’s of Watznaueria britannica
and Hayesites albiensis are both recorded from 450.45m, these forms utilised as alternative top Albian
markers (Watkins and Bowdler, 1984; Burnett, 1998); their occurrences here depressed stratigraphically but
of potential local correlative significance. Another major change in nannoflora at this stratigraphical level is
the increase downhole of cold-water nannofossils such as the HRA of Repagulum parvidentatum below
450.45 m and consistent Seribiscutum primitivum below 451.85 m, events also recorded by Kulhanek and
Wise (2006).
The oldest definitive Late Albian sediments at Site 1258C are confirmed by the FO of Staurolithites angustus
and consistent Cribrosphaerella ehrenbergii (Jeremiah, 1996; 2001; Bown, 2001) at 456.84 m (Core 29-1).
Additionally, an assemblage of ammonites collected and examined by Owen and Mutterlose (2006) from
cores 30 and 31, Site 1258C refine this age assignment to early Late Albian within the Hysteroceras varicosum
Zone. Late Albian sediments are potentially confirmed as deep as 467.94 m with the FO of Crucibiscutum
hayi (Jeremiah, 1996; Bown, 2001; Gale et. al., 2011); similar forms though are known to range down into
the Middle Albian (Jeremiah, 1996). Hence in the current paper are assigned the ranged Middle-Late Albian
age.
Kulhanek and Wise (2006) also recorded Eiffelithus monechiae consistently down to Core 33-2,
Cribrosphaerella eherenbergii almost to the base of the cored section at Core 34-2 and the boreal Upper
Albian marker Tegulalithus tessellatus between Cores 33-2 and 34-2. All these markers are Upper Albian
restricted but could not be corroborated in the current study at these deeper levels within the core. The
interval 459.85 m – 484.82 m yields an early Late Albian through late Middle Albian nannoflora. Boreal
markers that would enable further subdivision of the early Late Albian through Middle Albian succession
such as Tegulalithus tessellatus, the Ceratolithina plexus and Braloweria boletiformis are all absent. The
consistent occurrence of Axopodorhabdus albianus to the base of the cored section at 484.82 m, however,
confirms an age no older than late Middle Albian.
Stratigraphic architecture, Guyanas continental margin
198
Sporadic records of Axopodorhabdus albianus are recorded from the lower Middle Albian (Jeremiah, 1996,
2001; Bown, 2001; this study DSDP144; 299.28 m). Base consistent A. albianus from the upper Middle Albian
was preferred by Jeremiah (1996, 2001; Bown, 2001) as a cosmopolitan event and supported by
observations from Texas by Hill (1976) and Bralower et al., 1993.
The oldest cored sediments investigated from the Demerara Rise on ODP Leg 207 were found at sites 1257A
and 1260A. Here, early Middle Albian nannofloral assemblages were recovered similar to that recorded from
DSDP Leg 14, Site 144 (Table S 5.2).
DSDP Leg 14 Site 144
The objective of DSDP Leg 14 Site 144 was to recover the oldest marine sediments of the proto-Atlantic
(Hayes et al., 1972). Three boreholes (A, B, Z) were drilled to a TD of 327 m recovering 10 cores, totalling
31.9 m in length, from four Cretaceous-aged units (Fig. 5.8): Unit 2 – zeolitic greenish-grey marl; Unit 3 –
black and olive zeolitic marl; Unit 4 – olive green marl; Unit 5 – silty quartzose marl with shelly limestones
and background organics. These units differ from the lithostratigraphic units of ODP Leg 207 (Fig. 5.6; Fig.
5.7).
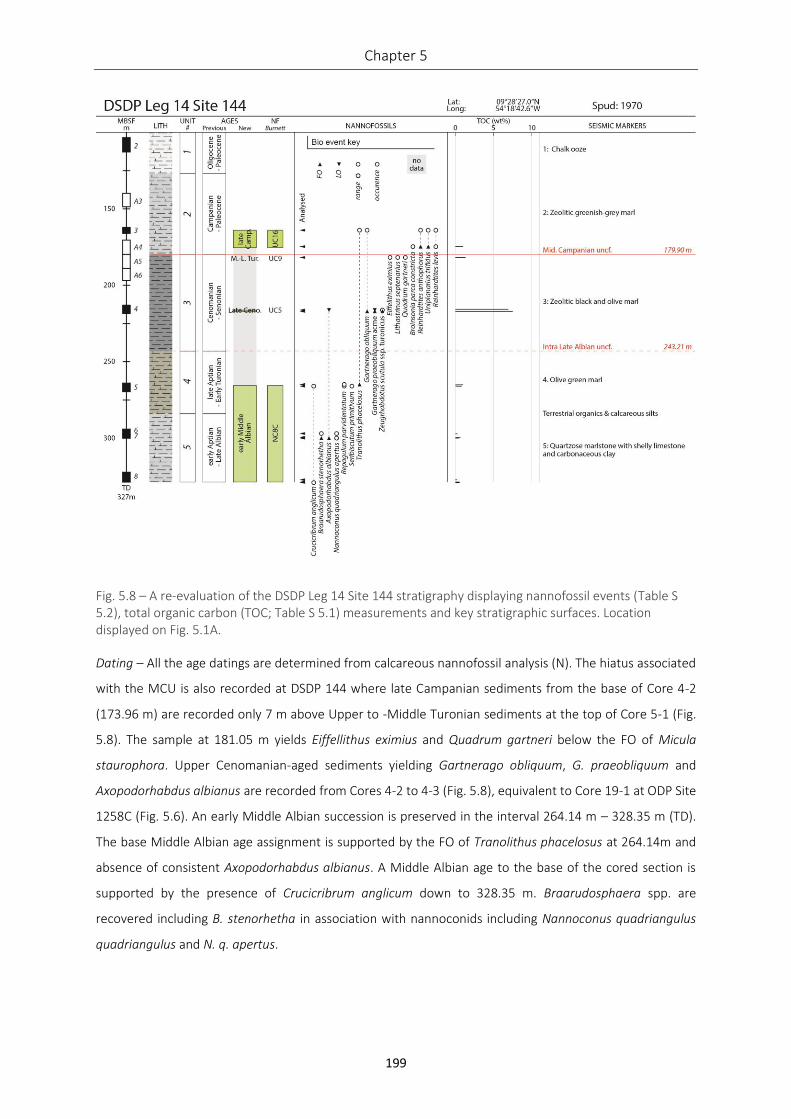
Chapter 5
199
Fig. 5.8 – A re-evaluation of the DSDP Leg 14 Site 144 stratigraphy displaying nannofossil events (Table S 5.2), total organic carbon (TOC; Table S 5.1) measurements and key stratigraphic surfaces. Location displayed on Fig. 5.1A.
Dating – All the age datings are determined from calcareous nannofossil analysis (N). The hiatus associated
with the MCU is also recorded at DSDP 144 where late Campanian sediments from the base of Core 4-2
(173.96 m) are recorded only 7 m above Upper to -Middle Turonian sediments at the top of Core 5-1 (Fig.
5.8). The sample at 181.05 m yields Eiffellithus eximius and Quadrum gartneri below the FO of Micula
staurophora. Upper Cenomanian-aged sediments yielding Gartnerago obliquum, G. praeobliquum and
Axopodorhabdus albianus are recorded from Cores 4-2 to 4-3 (Fig. 5.8), equivalent to Core 19-1 at ODP Site
1258C (Fig. 5.6). An early Middle Albian succession is preserved in the interval 264.14 m – 328.35 m (TD).
The base Middle Albian age assignment is supported by the FO of Tranolithus phacelosus at 264.14m and
absence of consistent Axopodorhabdus albianus. A Middle Albian age to the base of the cored section is
supported by the presence of Crucicribrum anglicum down to 328.35 m. Braarudosphaera spp. are
recovered including B. stenorhetha in association with nannoconids including Nannoconus quadriangulus
quadriangulus and N. q. apertus.
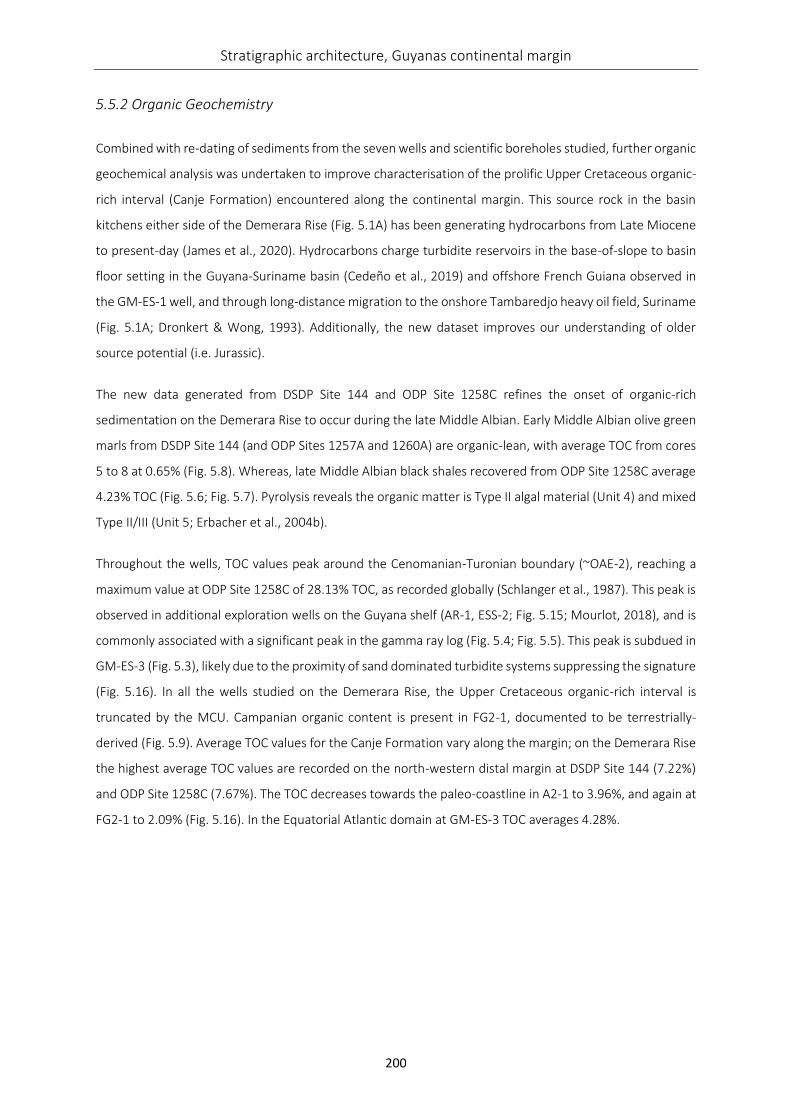
Stratigraphic architecture, Guyanas continental margin
200
5.5.2 Organic Geochemistry
Combined with re-dating of sediments from the seven wells and scientific boreholes studied, further organic
geochemical analysis was undertaken to improve characterisation of the prolific Upper Cretaceous organic-
rich interval (Canje Formation) encountered along the continental margin. This source rock in the basin
kitchens either side of the Demerara Rise (Fig. 5.1A) has been generating hydrocarbons from Late Miocene
to present-day (James et al., 2020). Hydrocarbons charge turbidite reservoirs in the base-of-slope to basin
floor setting in the Guyana-Suriname basin (Cedeño et al., 2019) and offshore French Guiana observed in
the GM-ES-1 well, and through long-distance migration to the onshore Tambaredjo heavy oil field, Suriname
(Fig. 5.1A; Dronkert & Wong, 1993). Additionally, the new dataset improves our understanding of older
source potential (i.e. Jurassic).
The new data generated from DSDP Site 144 and ODP Site 1258C refines the onset of organic-rich
sedimentation on the Demerara Rise to occur during the late Middle Albian. Early Middle Albian olive green
marls from DSDP Site 144 (and ODP Sites 1257A and 1260A) are organic-lean, with average TOC from cores
5 to 8 at 0.65% (Fig. 5.8). Whereas, late Middle Albian black shales recovered from ODP Site 1258C average
4.23% TOC (Fig. 5.6; Fig. 5.7). Pyrolysis reveals the organic matter is Type II algal material (Unit 4) and mixed
Type II/III (Unit 5; Erbacher et al., 2004b).
Throughout the wells, TOC values peak around the Cenomanian-Turonian boundary (~OAE-2), reaching a
maximum value at ODP Site 1258C of 28.13% TOC, as recorded globally (Schlanger et al., 1987). This peak is
observed in additional exploration wells on the Guyana shelf (AR-1, ESS-2; Fig. 5.15; Mourlot, 2018), and is
commonly associated with a significant peak in the gamma ray log (Fig. 5.4; Fig. 5.5). This peak is subdued in
GM-ES-3 (Fig. 5.3), likely due to the proximity of sand dominated turbidite systems suppressing the signature
(Fig. 5.16). In all the wells studied on the Demerara Rise, the Upper Cretaceous organic-rich interval is
truncated by the MCU. Campanian organic content is present in FG2-1, documented to be terrestrially-
derived (Fig. 5.9). Average TOC values for the Canje Formation vary along the margin; on the Demerara Rise
the highest average TOC values are recorded on the north-western distal margin at DSDP Site 144 (7.22%)
and ODP Site 1258C (7.67%). The TOC decreases towards the paleo-coastline in A2-1 to 3.96%, and again at
FG2-1 to 2.09% (Fig. 5.16). In the Equatorial Atlantic domain at GM-ES-3 TOC averages 4.28%.
Chapter 5
201
Fig. 5.9 – Classification of kerogen types using hydrogen and oxygen indices plotted on a modified van Krevelen diagram displaying the results of the Rock-Eval pyrolysis. The symbology reflects the age of each sample analysed. New data generated in this study from four of the revised wells (A2-1, DSDP Site 144, FG2-1 and GM-ES-3) is amalgamated with data presented in Meyers et al. (2006) from ODP Site 1258C, the ages are updated following the new biostratigraphy results. The tabulated data is presented in the supplementary material (Table S 5.1).
Source rock maturity indicated by Tmax values range from 346 to 430 °C, averaging 418 °C indicating all
samples are immature (Table S 5.1). To compare source rock quality and kerogen type, hydrogen and oxygen
indices were plotted on a modified van Krevelen diagram (Fig. 5.9). Raw data is presented in Table S 5.1. To
understand temporal changes in kerogen type the symbology reflects the age of the sample. The majority
of samples have high hydrogen index (HI; 475 to 600+ mg hydrocarbons/g organic carbon) and low oxygen
index (OI; 20 to 65 mg CO₂/g organic carbon) indicating Type II marine kerogen with oil generating potential.
Outliers from this group with low HI and high OI values are all early Middle Albian in age from DSDP Site 144
(cores 5 to 8) indicative of gas-prone Type III terrestrial kerogen. Younger Albian samples show a progressive
increase in HI and decrease in OI towards the Type II group, indicating the gradual increase in marine-type
organic matter through this interval. Cenomanian to Coniacian samples from FG2-1 have lower HI and higher
OI values (average HI – 251 mg hydrocarbons/g organic carbon; average OI – 76 mg CO₂/g organic carbon)
showing a mixing between Type II/III. This reflects the relative position of FG2-1 closer to the paleo-shoreline
and sediment input from river systems (Fig. 5.16) and therefore likely receiving more terrestrial input as
indicated by the higher sedimentation rates compared to the time-equivalent interval in A2-1 (Fig. 5.2).
Pyrolysis results from GM-ES-3 fall within a tight grouping away from main Type II signature with low OI (20
Stratigraphic architecture, Guyanas continental margin
202
to 30 mg CO₂/g organic carbon) and moderate HI (200 to 450 mg hydrocarbons/g organic carbon) values,
suggesting a mixing of kerogen types. S1 peaks are representative of hydrocarbons generated at low
temperatures during the pyrolysis and indicate free or absorbed hydrocarbons (Allen & Allen, 2013). Average
S1 values for GM-ES-3 samples are 21.4 mg/g, compared to an average of 1.0 mg/g for all remaining samples,
indicating free hydrocarbons throughout the interval analysed in GM-ES-3. Alongside the low Tmax values
(immature), this suggests the free hydrocarbons are migratory.
Geochemical analysis of samples below the BAU in A2-1, i.e. Aptian to Berriasian, all yield low TOC values
(average 0.37%). Higher values 1.1 to 1.5% TOC were previously reported by Griffith (2017) from this interval
as indicative of a Middle Jurassic (Callovian) syn-rift source rock based on the original biostratigraphy. Our
new age dating proves no Callovian sediments were encountered in A2-1, meaning the well did not
penetrate a syn-rift source rock below the Demerara Rise. However, this new evidence does not rule out the
potential for a Jurassic source rock along the margin. Seismic evidence from this study supports the
interpretation of additional older Jurassic sediments below the well TD of A2-1 (Fig. 5.11), distributed deeper
across the Demerara Rise (see Margin Architecture, Fig. 5.12A – MS1), and onto the Guinea Plateau (Fig.
5.16A). Oil and gas shows within the Lower Cretaceous interval are reported suggesting deeper source rock
potential as the main organic-rich interval sits above the BAU (Fig. 5.5). Additional support for a potential
Jurassic source rock is evidenced by proven Jurassic-aged lacustrine shales with 2.5% TOC within the Takutu
Graben onshore (Webster, 2004), and predicted in two grabens (Nickerie, Commeqijine; Fig. 5.1B) offshore
from gravity data (Griffith, 2017). Further geochemical work by Cedeño et al. (2019) of oil recovered from
wells onshore Suriname (Tambaredjo field) revealed two hydrocarbon groups, one typed to the proven
Upper Cretaceous source rock and another group from a source that generated hydrocarbons from
terrestrial organic matter in marly sediments interpreted as Jurassic or Lower Cretaceous in age. These
hydrocarbons are postulated to be generated from the Lower Cretaceous interval penetrated by A2-1.
The hydrocarbons at the Liza and Tambaredjo fields have migrated out of the deep Guyana-Suriname basin
from the Canje Formation, sitting on oceanic crust (Fig. 5.1B; Cedeño et al., 2019). We postulate that an
unpenetrated early Aptian source rock (OAE-1A-equivalent) may be present in the deep marine basin
(Bihariesingh, 2014), and absent across the Demerara Rise and basin margins. Additionally, along the French
Guiana margin, Aptian lacustrine syn-rift deposits may be potential source rock candidates.
Hydrocarbons were extracted from four Lower Cretaceous – Upper Jurassic samples (well A2-1) with very
low organic richness (0.11 to 0.43%) yielding very low quantities. It is difficult to determine for certain if the
extracts are a naturally occurring product or a drilling introduced contaminant. If the former then their
geochemical characteristics are very consistent and would most likely represent the residual product of
migratory hydrocarbons rather than in-situ generation. Overall the extracted hydrocarbons are from an
aquatic (possibly marine) environment, but with significant terrestrial input (Fig. 5.9).
Chapter 5
203
To summarise, further geochemical characterisation of the main source rock (Canje Formation) reveals the
heterogeneities in age of organic-rich sedimentation, organic richness and kerogen type. Highest TOC with
marine Type II kerogen occurs at the Cenomanian-Turonian boundary (OAE-2), typically recognised as a spike
in the gamma ray log profile. Free hydrocarbons are recorded throughout all samples analysed in GM-ES-3.
Jurassic source potential is not encountered in A2-1, further evidence for its occurrence is postulated. Aptian
source rock potential is hypothesised.
5.5.3 Margin Architecture
Mapping of the deep-penetrating GuyanaSPAN seismic data tied to the re-evaluated wells (Fig. 5.10) reveals
the seismic-stratigraphic architecture of the Guyanas continental margin (Fig. 5.11; Fig. 5.12; Fig. 5.13).
Three Mesozoic megasequences are defined and discussed based on our new data (Fig. 5.2).
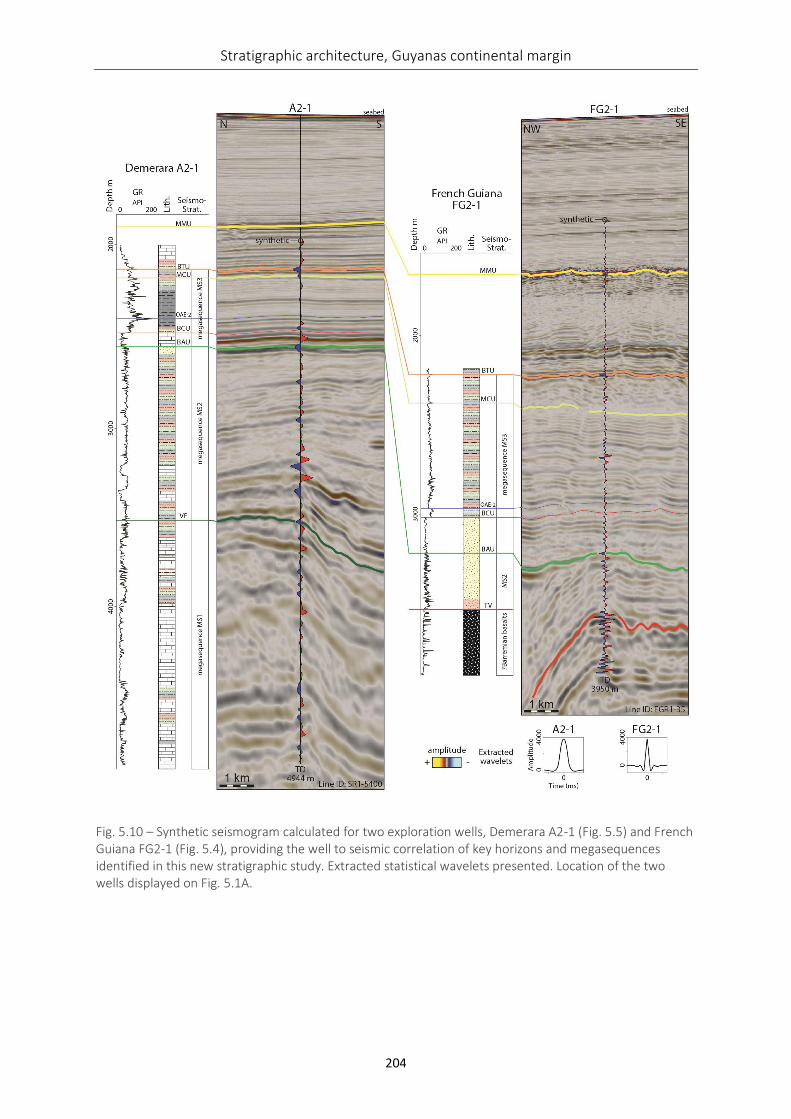
Stratigraphic architecture, Guyanas continental margin
204
Fig. 5.10 – Synthetic seismogram calculated for two exploration wells, Demerara A2-1 (Fig. 5.5) and French Guiana FG2-1 (Fig. 5.4), providing the well to seismic correlation of key horizons and megasequences identified in this new stratigraphic study. Extracted statistical wavelets presented. Location of the two wells displayed on Fig. 5.1A.
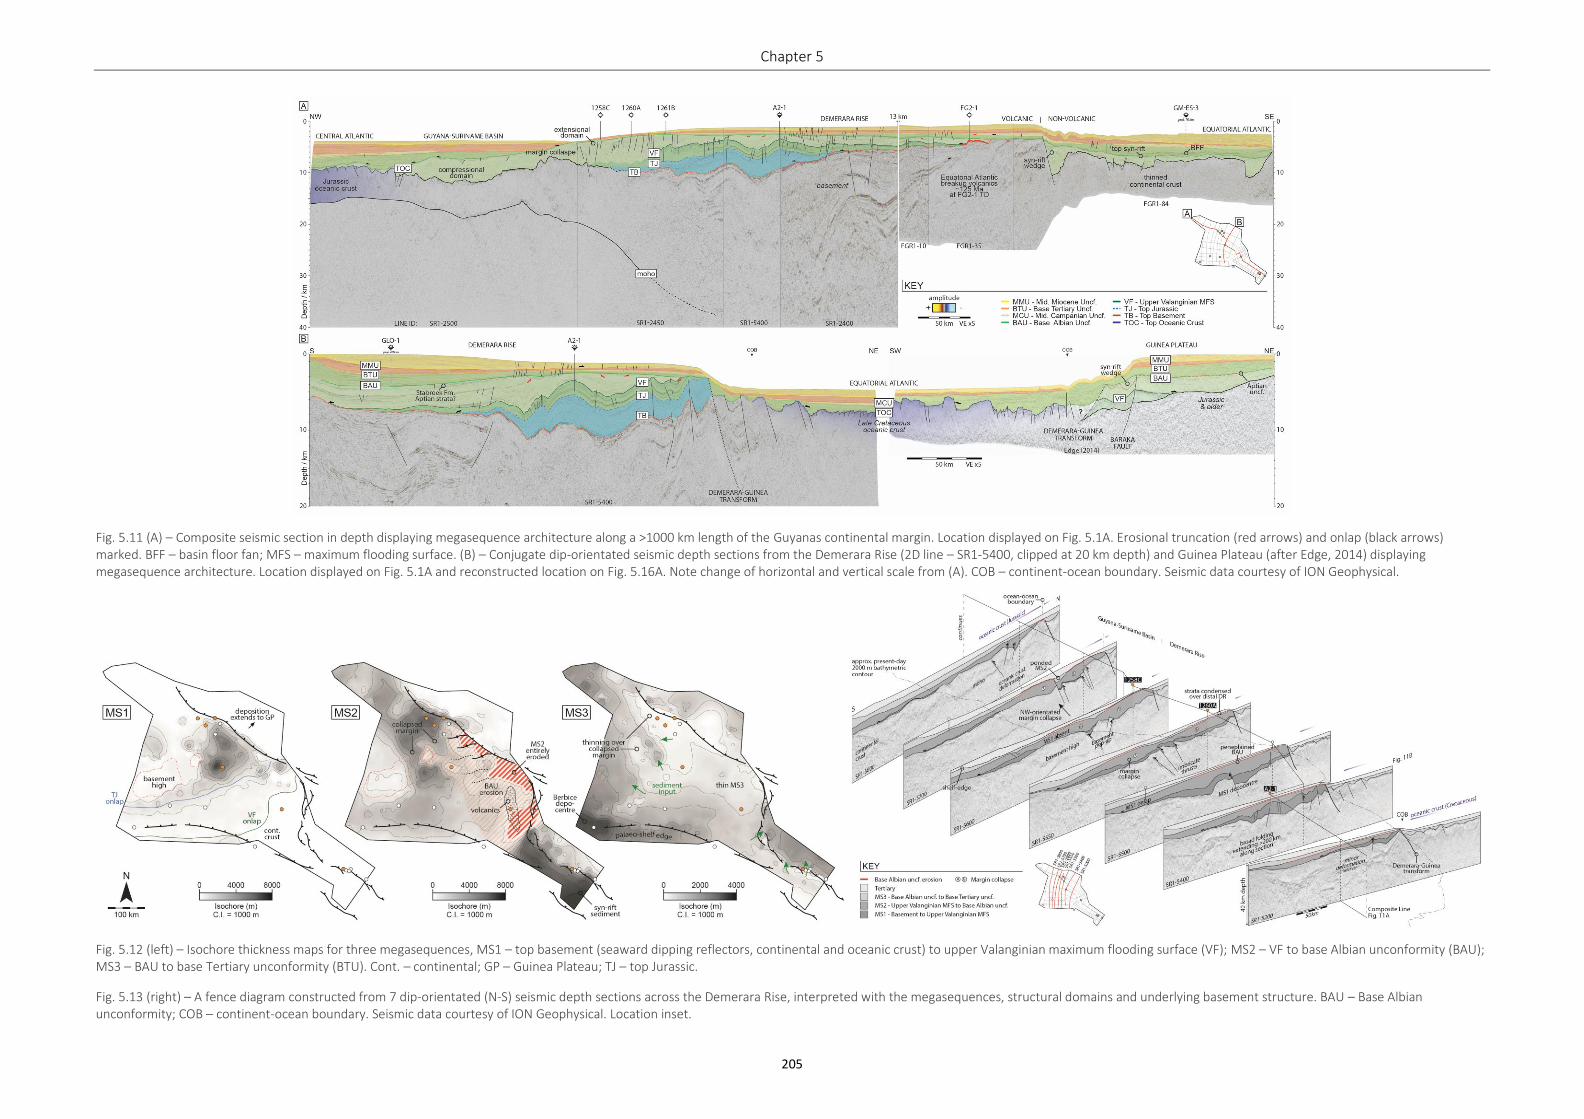
Chapter 5
205
Fig. 5.11 (A) – Composite seismic section in depth displaying megasequence architecture along a >1000 km length of the Guyanas continental margin. Location displayed on Fig. 5.1A. Erosional truncation (red arrows) and onlap (black arrows) marked. BFF – basin floor fan; MFS – maximum flooding surface. (B) – Conjugate dip-orientated seismic depth sections from the Demerara Rise (2D line – SR1-5400, clipped at 20 km depth) and Guinea Plateau (after Edge, 2014) displaying megasequence architecture. Location displayed on Fig. 5.1A and reconstructed location on Fig. 5.16A. Note change of horizontal and vertical scale from (A). COB – continent-ocean boundary. Seismic data courtesy of ION Geophysical.
Fig. 5.12 (left) – Isochore thickness maps for three megasequences, MS1 – top basement (seaward dipping reflectors, continental and oceanic crust) to upper Valanginian maximum flooding surface (VF); MS2 – VF to base Albian unconformity (BAU); MS3 – BAU to base Tertiary unconformity (BTU). Cont. – continental; GP – Guinea Plateau; TJ – top Jurassic.
Fig. 5.13 (right) – A fence diagram constructed from 7 dip-orientated (N-S) seismic depth sections across the Demerara Rise, interpreted with the megasequences, structural domains and underlying basement structure. BAU – Base Albian unconformity; COB – continent-ocean boundary. Seismic data courtesy of ION Geophysical. Location inset.
Stratigraphic architecture, Guyanas continental margin
206
Basement
As introduced earlier, the ‘basement’ in this study is defined as the crust plus pre- and syn-rift sediments,
that exist below the Central Atlantic post-rift succession. Previous studies (Mercier de Lépinay et al., 2016;
Reuber et al., 2016; Kusznir et al., 2018) have characterised this interval, which is beyond the scope of this
paper. However, a brief overview is provided summarising the evidence for the two models of basement
composition. Despite the nature of the basement, the top surface is defined by a major unconformity,
interpreted as the top basement (TB), with MS1 strata successively onlapping this surface towards to the
southeast (Fig. 5.12; Fig. 5.13).
The main evidence for the volcanic nature of the basement below the Demerara Rise is the interpretation
of seaward dipping reflectors (SDRs) based on deep-penetrating seismic data (Mercier de Lépinay et al.,
2016; Reuber et al., 2016). Clearly on Fig. 5.11A, the basement comprises a series of high-amplitude
reflections forming a thick package (up to 21 km), dipping towards the Guyana-Suriname basin to the
northwest, i.e. seaward dipping. The interpreted basaltic flows have either been associated with the
migrating Bahamas hotspot (Morgan, 1983) during early opening of the Central Atlantic (~158 Ma; Reuber
et al., 2016), or related to the Central Atlantic Magmatic Province (CAMP) volcanism (~200 Ma; Loncke et
al., 2019). Volcanism is further supported by recovered dredge samples of Jurassic-aged (173.4 ± 1.6 Ma)
rhyolites and basalts from the Demerara Rise (white star – Fig. 5.1A; Basile et al., 2020).
Alternatively, a model for the non-volcanic origin of the basement is also conceivable where the basement
is composed of heavily deformed Paleozoic strata (Geognostics, 2020), as the acoustic properties and
thickness of the interpreted SDR sequence do not show close affinity to other volcanic sequences (Franke,
2013). This possible layered sedimentary sequence thins to the east, onlaps the basement, is broadly folded
and truncated at the TB (Fig. 5.11A). These postulated Paleozoic sediments are interpreted as marine
sediments deposited on top of stranded Neoproterozoic oceanic crust and distal Appalachian-related
foredeep sediments, initially deformed during the early Appalachian orogeny (Hercynian), and latterly by
Equatorial Atlantic-associated tectonism (Fig. 5.13).
Megasequence 1 – MS1
Well A2-1 penetrated the deepest and oldest stratigraphy on the Demerara Rise, re-dated as late Tithonian.
This succession (up to 7 km thick) of alternating limestone and mudstone forms parallel, high-amplitude
reflections (limestones) interspersed with low amplitude, transparent acoustic facies (mudstones) that are
extremely laterally continuous (>200 km; Fig. 5.11A). MS1 and MS2 both prograde basinward towards the
northwest. The upper Valanginian MFS (VF) encountered in A2-1 onlaps the TB in a more proximal position
(near FG2-1) defining the south-eastern limit of Central Atlantic Ocean during the Lower Cretaceous (Fig.
5.16A). The MS1 interval is thickest below A2-1, extending below ODP Leg 207 sites (Fig. 5.12), and
Chapter 5
207
temporally records the highest sedimentation rates from the studied wells (Fig. 5.2). Sediments thin over a
series of northeast-trending basement highs and thicken inboard to form an elongate depocentre aligned
along the paleo-shelf edge. MS1 sediment is absent northeast of the Guinea-Demerara transform on this
map due to succeeding Equatorial Atlantic rifting (now located below the Guinea Plateau) and is notably thin
to absent above Jurassic-aged oceanic crust in the Guyana-Suriname basin (Fig. 5.11A; Fig. 5.12; Fig. 5.13).
Megasequence 2 – MS2
The Valanginian flooding surface (VF) defines the base of MS2, which comprises of a Hauterivian to Aptian-
aged mudstone-dominated package, with the top truncated by the BAU across the distal area of the
Demerara Rise (Fig. 5.13). MS2 shows gradual progradation (Fig. 5.11B) culminating in the major fluvio-
deltaic system (Stabroek Formation). Mapping MS2 thickness shows the sequence is completely eroded and
peneplaned by the BAU to the north and east against the arcuate-shaped bounding faults of the Demerara
Rise (Fig. 5.12). The northeast-trending anticlinal folds appear to control the amount of erosion, suggesting
MS2 was deformed first, followed by peneplanation (Fig. 5.12). BAU erosion decreases towards the
southwest, highlighted along the dip profile (Fig. 5.11B) and fence diagram (Fig. 5.13). Towards the present-
day South American coastline the sequences below the unconformity are less deformed and no truncation
is observed, suggesting a more complete section and the BAU becoming a correlative conformity (Fig. 5.11B;
Mitchum & Vail, 1977). On the north-western margin of the Demerara Rise below the ODP Leg 207 sites, the
pre-Albian sediments are rotated by extensional listric normal faults, and thin over a basement high showing
compressional features (thrust faults) 100 km downdip in the Guyana-Suriname Basin (Fig. 5.11A). The
extensional domain is divided from the remainder of the Demerara Rise by an arcuate fault zone defining
the headwall, positioned above continental crust; the compressional domain is emplaced on Jurassic oceanic
crust (Fig. 5.11A). This feature is interpreted as a major margin collapse and forms two thick northwest-
trending lobes with a spatial extent of over 1000 km2 emplaced around the basement high (Fig. 5.13). These
lobes (A, B) are observed in strike profile through Fig. 5.13 separated by a thrusted basement high.
The BAU can be followed through the Guyana-Suriname Basin where overlying sediments onlap this surface.
MS2-aged sediments of the French Guiana margin show growth strata into a major basin-bounding
eastward-dipping normal fault (Fig. 5.11A). The thickest MS2 deposits occur along this section of the margin,
controlled by accommodation generated in a series of en-échelon normal faults recording the syn-rift non-
marine sediments of the proto-Equatorial Atlantic encountered at TD in GM-ES-3 (Fig. 5.12). These MS2
sequence syn-rift sediments attain maximum thickness in the Brazilian Cacipore grabens (Fig. 5.15), wells
here penetrate >3000 m of non-marine clastics, seismic indicating these rifts attain >6000m thickness (pers.
obs). At FG2-1, the basaltic lavas encountered at TD of the well are expressed in the seismic data as a chaotic
high amplitude package interpreted to pinch out to the northeast and onlap the basement to the southeast
(Fig. 5.11A). Their distribution forms a north-trending elongate ribbon (Fig. 5.1B; Gouyet et al., 1994)
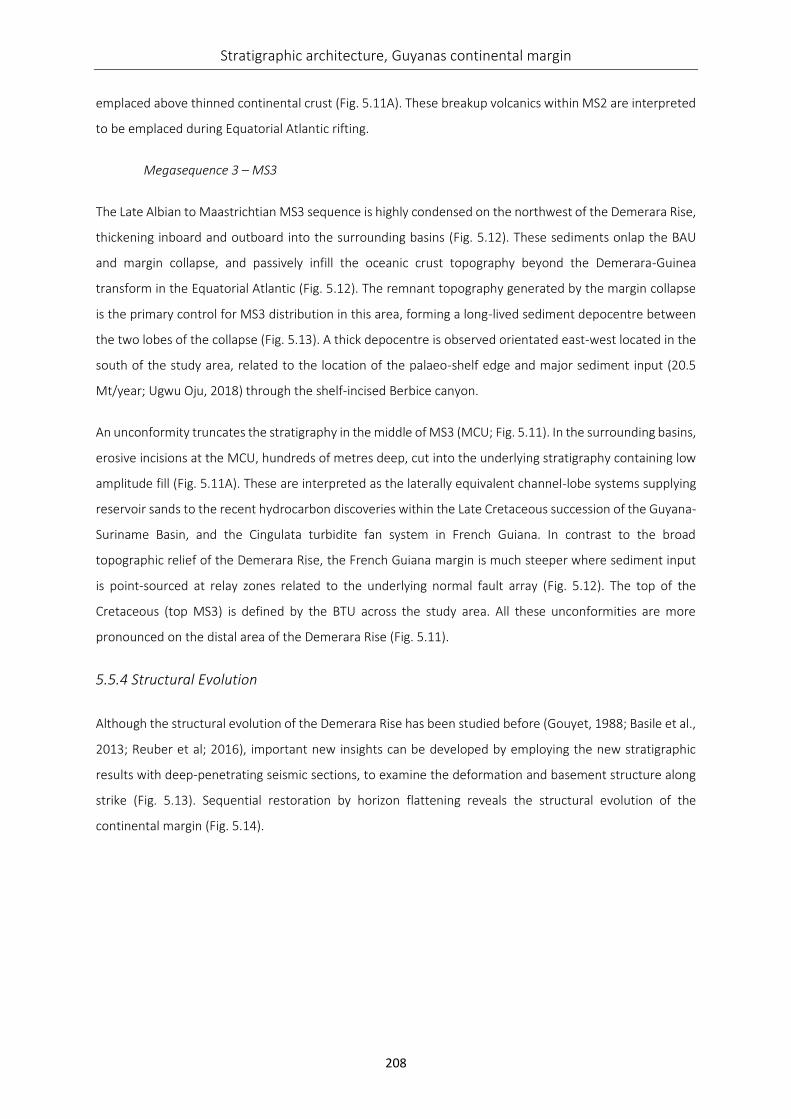
Stratigraphic architecture, Guyanas continental margin
208
emplaced above thinned continental crust (Fig. 5.11A). These breakup volcanics within MS2 are interpreted
to be emplaced during Equatorial Atlantic rifting.
Megasequence 3 – MS3
The Late Albian to Maastrichtian MS3 sequence is highly condensed on the northwest of the Demerara Rise,
thickening inboard and outboard into the surrounding basins (Fig. 5.12). These sediments onlap the BAU
and margin collapse, and passively infill the oceanic crust topography beyond the Demerara-Guinea
transform in the Equatorial Atlantic (Fig. 5.12). The remnant topography generated by the margin collapse
is the primary control for MS3 distribution in this area, forming a long-lived sediment depocentre between
the two lobes of the collapse (Fig. 5.13). A thick depocentre is observed orientated east-west located in the
south of the study area, related to the location of the palaeo-shelf edge and major sediment input (20.5
Mt/year; Ugwu Oju, 2018) through the shelf-incised Berbice canyon.
An unconformity truncates the stratigraphy in the middle of MS3 (MCU; Fig. 5.11). In the surrounding basins,
erosive incisions at the MCU, hundreds of metres deep, cut into the underlying stratigraphy containing low
amplitude fill (Fig. 5.11A). These are interpreted as the laterally equivalent channel-lobe systems supplying
reservoir sands to the recent hydrocarbon discoveries within the Late Cretaceous succession of the Guyana-
Suriname Basin, and the Cingulata turbidite fan system in French Guiana. In contrast to the broad
topographic relief of the Demerara Rise, the French Guiana margin is much steeper where sediment input
is point-sourced at relay zones related to the underlying normal fault array (Fig. 5.12). The top of the
Cretaceous (top MS3) is defined by the BTU across the study area. All these unconformities are more
pronounced on the distal area of the Demerara Rise (Fig. 5.11).
5.5.4 Structural Evolution
Although the structural evolution of the Demerara Rise has been studied before (Gouyet, 1988; Basile et al.,
2013; Reuber et al; 2016), important new insights can be developed by employing the new stratigraphic
results with deep-penetrating seismic sections, to examine the deformation and basement structure along
strike (Fig. 5.13). Sequential restoration by horizon flattening reveals the structural evolution of the
continental margin (Fig. 5.14).
Chapter 5
209
Fig. 5.14 – Sequential restoration by horizon flattening for a segment of the strike seismic profile displayed in Fig 11A, at three key time stages, (D) Valanginian, (C) Aptian and (B) Albian revealing the structural evolution of the continental margin to (A) present day. A zoom in on the seismic around Demerara A2-1 with a projection of the uppermost truncated seismic reflection (black dashed line) revealing approximately a kilometre of erosion at the well location is shown. MFS – maximum flooding surface. Fig. 5.1A for location of the section.
Stratigraphic architecture, Guyanas continental margin
210
Angular onlap of the MS1 sequence onto the TB is apparent (Fig. 5.14D), suggesting significant topography
was present prior to deposition of MS1. Flattening on the TB shows the basement was broadly folded prior
to deposition of Central Atlantic carbonates (Fig. 5.14D). Eventual flooding of the paleo-topography occurred
in the upper Valanginian (Fig. 5.14D). A major depocentre is mapped in MS1 (Fig. 5.12) positioned above the
youngest SDR sequence (syn-6 sensu Reuber et al., 2016) that is located between the Jurassic oceanic crust
and thinned continental crust, indicating the area of maximum subsidence. MS1 is therefore interpreted to
represent the early sag phase following opening of the Central Atlantic.
The Aptian (125 – 113 Ma) onset of Equatorial Atlantic extension generated syn-rift en-échelon half grabens
along the divergent margin east of the Demerara Rise (Fig. 5.14C; Pindell, 1985; Greenroyd et al., 2007,
2008a; Basile et al., 2013). On the Demerara Rise, the Equatorial Atlantic rifting induced a transpressional
tectonic regime across the northern margin due to movement on the Demerara-Guinea transform. This
induced compression buckling of the MS1 and MS2 stratigraphy into tight (wavelength 30-50 km) anticlinal
folds trending ENE (Fig. 5.12). Major imbricate thrust fault systems with hundreds of metres of displacement
contain associated roll-overs and basement pop-up structures (Fig. 5.13). The orientation of these features
indicates a maximum paleo-stress direction orientated northwest-southeast suggesting there was significant
compression associated with the transpressional Equatorial Atlantic breakup. Faulting also affects the
underlying basement sequence and is pervasive in the rheologically-competent carbonate lithologies. An
approximate estimation of shortening by measuring the most continuous stratigraphic surface (VF) suggests
8.3 km of shortening along the profile orientated in the direction of maximum compression (Fig. 5.14C).
Maximum deformation and basin inversion occur localised above the thickest MS1 and MS2 deposits.
Deformation continues outboard onto Jurassic oceanic crust (Fig. 5.13). At this time, there is evidence for
margin collapse to the northwest into the Guyana-Suriname basin induced by uplift-related instability. The
north-westward collapse indicates the asymmetric instability of the Demerara Rise. The compressional
features, inversion and collapse of the margin are all related to transpressional deformation along the
sheared northern margin of the Demerara Rise (Gouyet, 1988).
The compression-related paleo-topography was subsequently peneplaned by the BAU across the full width
of the Demerara Rise, truncating up to 1 km of section at the A2-1 well location (Fig. 5.14B), comparable to
the amount of erosion observed in the megasequence isochore mapping (Fig. 5.12). There is a lack of any
major incisional features on the peneplaned surface that would be indicative of canyon systems at the
resolution of our dataset. The recognition of red oxidised sands in FG2-1 indicates subaerial exposure at this
time. Erosion by a combination of subaerial (denudation) and shallow marine submarine processes (wave
action) created the peneplain architecture. Eroded sediments are postulated to have filled depocentres
adjacent to the Demerara Rise. Accommodation generated by the major bounding fault on the eastern
margin of the Demerara Rise forms a significant syn-rift wedge capped by the BAU (Fig. 5.11A), likely
Chapter 5
211
receiving some of the eroded material. Further deformation of the BAU results in the surface subtly tilted
east and west (Fig. 5.14A). This deformation is related to the loading of adjacent oceanic crust by the
initiation of the Amazon, Essequibo and Orinoco river systems in the Cenozoic depositing excessively thick
deep-sea fans, loading the crust and causing subsequent flexure of the Demerara Rise (Watts et al., 2005;
Basile et al., 2013).
5.5.5 Chronostratigraphic Analysis
Visualisation in the geological time domain of the stratigraphic architecture can be enhanced through the
construction of a Wheeler diagram or chronostratigraphic chart, building a spatiotemporal stratigraphic
framework (Wheeler, 1958; Fig. 5.15). Key stratigraphic surfaces and sequences, re-dated from the samples
analysed from seven key wells and scientific boreholes were used as the framework, and later extended to
an additional thirteen exploration wells. The Wheeler diagram (Fig. 5.15) highlights the variability in the age
and composition of the basement template as documented earlier. Several wells penetrate continental crust
along the margin, with Arapaima-1 (AR-1) recovering phyllitic schists. The Jurassic to Barremian stratigraphy
is restricted to below the Demerara Rise based on seismic interpretation (MS1 mapping – Fig. 5.12) and is
only penetrated by A2-1. However, it is conceivable that a condensed equivalent extends out onto the
oceanic crust in the Guyana-Suriname basin. Defining the exact age of the Jurassic oceanic crust in the
Guyana-Suriname basin is problematic due to the lack of basement penetrations and magnetic anomalies
(Nemčok et al., 2017). Based on the east-west spreading axis of the Central Atlantic, it can be assumed
oceanic crust becomes younger into the basin towards the northwest.
Fig. 5.15 (next page) – A Wheeler diagram constructed along strike from Guyana (left) to Brazil (right) detailing the stratigraphic evolution of the segmented Guyanas continental margin. Pin stripe vertical lines indicate hiatus’ corresponding to various regional unconformities dated in the stratigraphic analysis. Dash black and white lines indicate revised wells in this study. The geological time scale (GTS 2018) is non-linear. Hydrocarbon occurrences are shown. Average TOC values for the Canje Formation displayed, AR-1 data from Mourlot (2018).
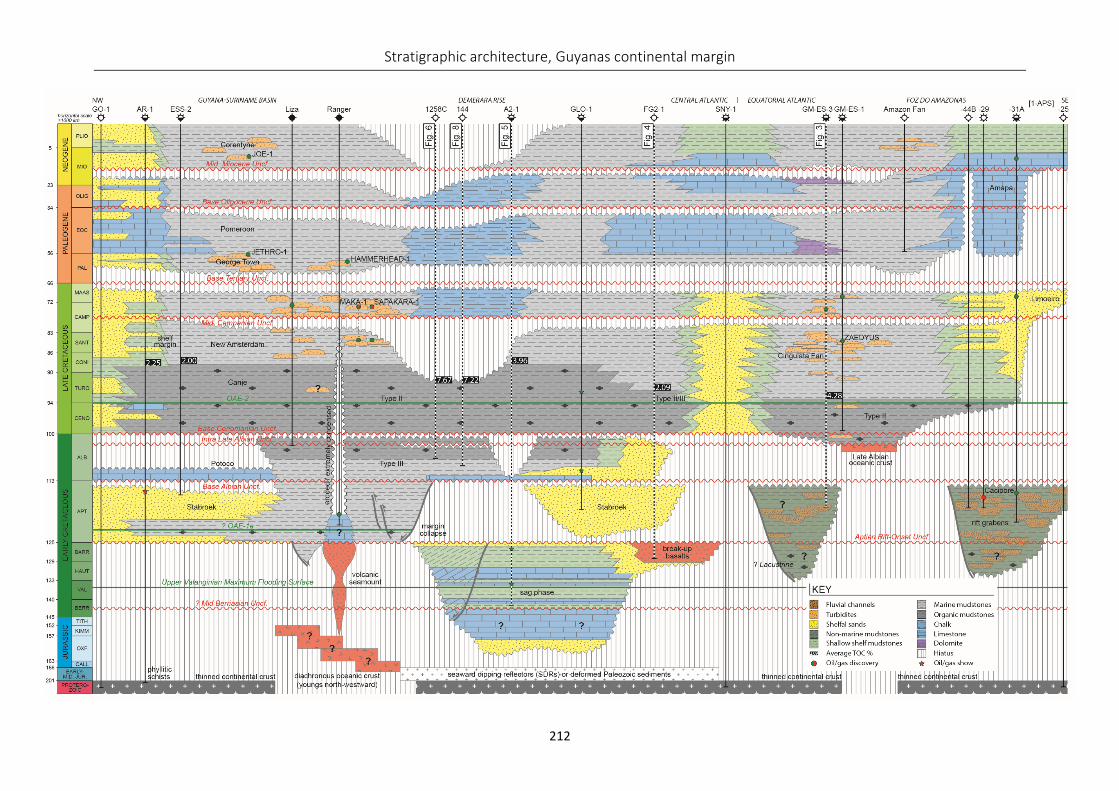
Stratigraphic architecture, Guyanas continental margin
212
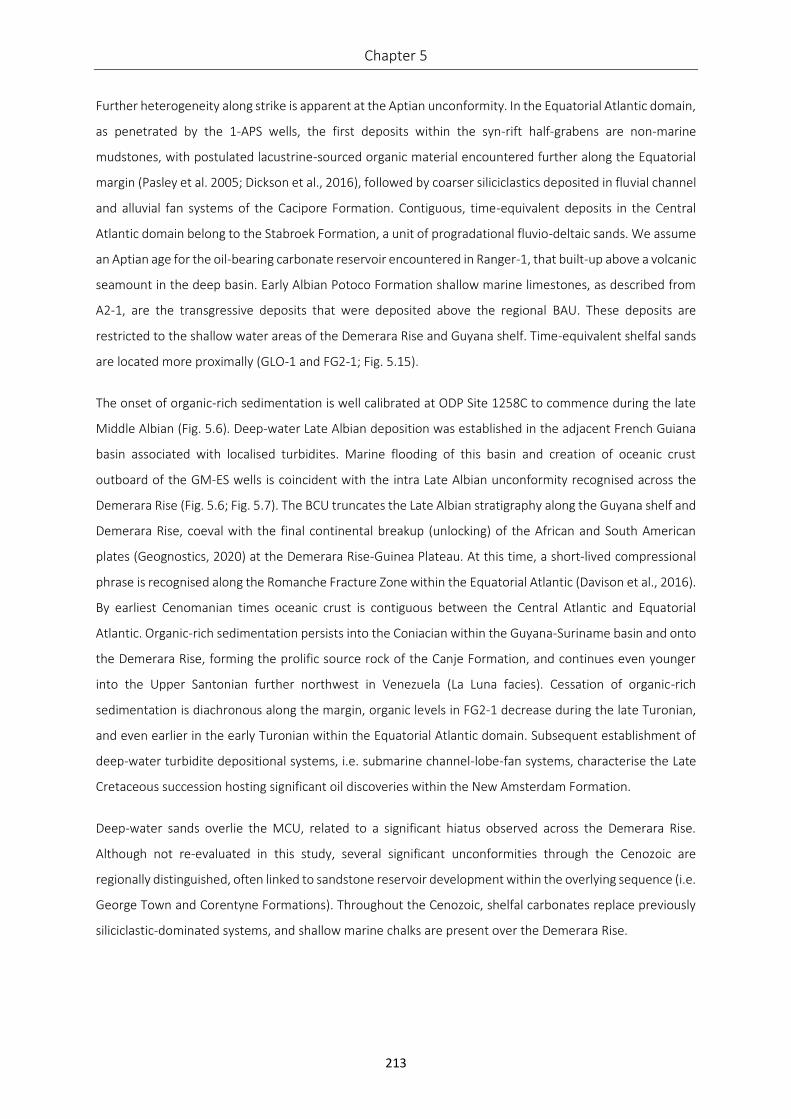
Chapter 5
213
Further heterogeneity along strike is apparent at the Aptian unconformity. In the Equatorial Atlantic domain,
as penetrated by the 1-APS wells, the first deposits within the syn-rift half-grabens are non-marine
mudstones, with postulated lacustrine-sourced organic material encountered further along the Equatorial
margin (Pasley et al. 2005; Dickson et al., 2016), followed by coarser siliciclastics deposited in fluvial channel
and alluvial fan systems of the Cacipore Formation. Contiguous, time-equivalent deposits in the Central
Atlantic domain belong to the Stabroek Formation, a unit of progradational fluvio-deltaic sands. We assume
an Aptian age for the oil-bearing carbonate reservoir encountered in Ranger-1, that built-up above a volcanic
seamount in the deep basin. Early Albian Potoco Formation shallow marine limestones, as described from
A2-1, are the transgressive deposits that were deposited above the regional BAU. These deposits are
restricted to the shallow water areas of the Demerara Rise and Guyana shelf. Time-equivalent shelfal sands
are located more proximally (GLO-1 and FG2-1; Fig. 5.15).
The onset of organic-rich sedimentation is well calibrated at ODP Site 1258C to commence during the late
Middle Albian (Fig. 5.6). Deep-water Late Albian deposition was established in the adjacent French Guiana
basin associated with localised turbidites. Marine flooding of this basin and creation of oceanic crust
outboard of the GM-ES wells is coincident with the intra Late Albian unconformity recognised across the
Demerara Rise (Fig. 5.6; Fig. 5.7). The BCU truncates the Late Albian stratigraphy along the Guyana shelf and
Demerara Rise, coeval with the final continental breakup (unlocking) of the African and South American
plates (Geognostics, 2020) at the Demerara Rise-Guinea Plateau. At this time, a short-lived compressional
phrase is recognised along the Romanche Fracture Zone within the Equatorial Atlantic (Davison et al., 2016).
By earliest Cenomanian times oceanic crust is contiguous between the Central Atlantic and Equatorial
Atlantic. Organic-rich sedimentation persists into the Coniacian within the Guyana-Suriname basin and onto
the Demerara Rise, forming the prolific source rock of the Canje Formation, and continues even younger
into the Upper Santonian further northwest in Venezuela (La Luna facies). Cessation of organic-rich
sedimentation is diachronous along the margin, organic levels in FG2-1 decrease during the late Turonian,
and even earlier in the early Turonian within the Equatorial Atlantic domain. Subsequent establishment of
deep-water turbidite depositional systems, i.e. submarine channel-lobe-fan systems, characterise the Late
Cretaceous succession hosting significant oil discoveries within the New Amsterdam Formation.
Deep-water sands overlie the MCU, related to a significant hiatus observed across the Demerara Rise.
Although not re-evaluated in this study, several significant unconformities through the Cenozoic are
regionally distinguished, often linked to sandstone reservoir development within the overlying sequence (i.e.
George Town and Corentyne Formations). Throughout the Cenozoic, shelfal carbonates replace previously
siliciclastic-dominated systems, and shallow marine chalks are present over the Demerara Rise.
Stratigraphic architecture, Guyanas continental margin
214
5.5.6 Palaeogeographical Reconstructions
A series of gross depositional environment (GDE) maps (Fig. 5.16) have been constructed at four key time
intervals during the Cretaceous recognised in the stratigraphic analysis (Fig. 5.2). These events are either
major sequence boundaries or maximum flooding surfaces, representing the environment of deposition
during maximum regression or transgression, respectively. Four types of environment are described in this
study: terrestrial, transitional, slope, and deep basin with their sand fairways (submarine canyon, channel to
fan systems). These environmental interpretations are primarily based on the well data and seismic evidence
presented in this study, as well as the incorporation of additional published data. Facies distributions (pies)
for wells that penetrate sediments of each age interval are added as control points, however there may be
additional penetrations of the stratigraphy unavailable in this study. As the individual depositional systems
have been described earlier, a more holistic review of the regional geology is discussed below.
Fig. 5.16 (next page)– Gross depositional environment (GDE) maps for four key time stages, defined by the stratigraphic analysis, in the evolution of the Guyanas continental margin. (A) Upper Valanginian (135 Ma); (B) Aptian (115 Ma); (C) Latest Albian (101 Ma) and (D) Santonian (85 Ma). The reconstructed location of the conjugate seismic sections (Fig. 5.11B) are displayed in (A). Facies distribution (%) for the interval encountered in each well is shown. Geometries were reconstructed following the Geognostics Earth Model (GEM™). BFF – basin floor fan; DR – Demerara Rise; FZ – fracture zone; GP – Guinea Plateau.
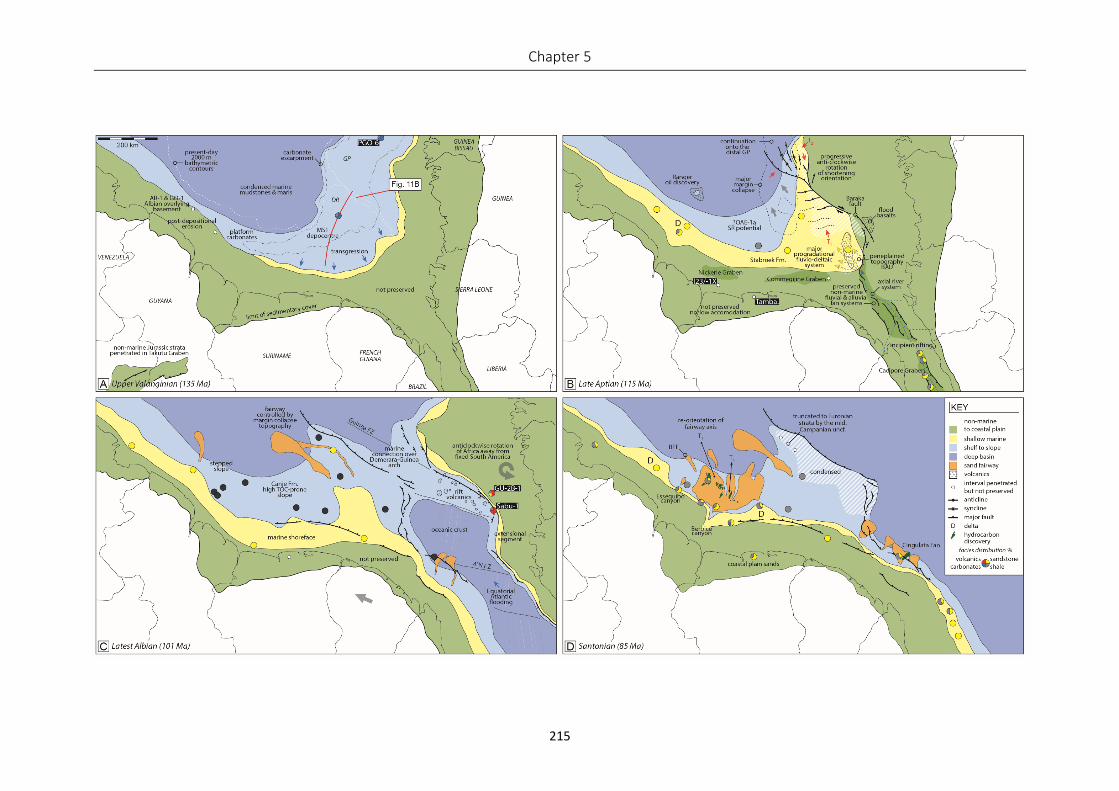
Chapter 5
215
Stratigraphic architecture, Guyanas continental margin
216
Upper Valanginian
The conjugate Demerara Rise and Guinea Plateau formed a carbonate-dominated shallow marine
embayment extending ca. 300 km from the paleo-coastline to the shelf margin. The maximum extent of the
south-eastern proto-Central Atlantic Ocean prior to Equatorial Atlantic opening and breakthrough is defined
by the coastline shown in Fig. 5.16A. Due to the margin collapse, an interpretation of the carbonate shelf
margin architecture is restricted, however a carbonate escarpment geometry is documented to the north in
The Gambia and to the west in Guyana (Mourlot, 2018; Mourlot et al., 2018; Casson et al., 2020). The
extension of the major depocentre below the majority of the Guinea Plateau (Fig. 5.16A; Zinecker et al.,
2018) indicates continuous and synchronous deposition linking the conjugate margins, challenging the
interpretation by Gouyet et al. (1994) that a local high was present between the Demerara Rise and Guinea
Plateau. Lower Cretaceous strata are absent due to post-depositional erosion across the Guyana shelf.
Late Aptian
Rift initiation to the east in the Equatorial Atlantic created an oblique-slip stress regime that exerted
transpression-related compression along the Demerara-Guinea transform, leading to the north-westward
collapse of the Demerara Rise margin. A similar margin collapse feature is recognised from seismic data on
the Guinea Plateau (Casson et al. in prep). The topography generated by this feature on the Guinea Plateau
remains reflected in the present-day bathymetry, forming an ‘outer high’ (Long et al., 2018). Progressive
anti-clockwise rotation of Africa away from South America continued to deform the transform margins of
the Demerara Rise and Guinea Plateau (Pindell, 1985; Greenroyd et al., 2007, 2008a; Basile et al., 2013).
Equatorial Atlantic rifting likely rejuvenated sediment supply from the Guiana Shield resulting in
progradation of the fluvio-deltaic systems of the Stabroek Formation (MS2) into the Guyana-Suriname basin.
This system was likely fed by a major axial fluvial system interpreted running through the Cacipore Graben
north-westwards into French Guiana, with associated non-marine and fluvial sediments preserved within
the rifting-induced accommodation. Coastal plain strata are not preserved due to no or low accommodation
as recorded in wells I23/-1X, SNY-1 and Tambaredjo (Dronkert & Wong, 1993). Associated exhumation of
the hinterland is supported by low-temperature thermochronological data from the northern rim of the
Guiana Shield in French Guiana, where Derycke et al. (2018) record a major cooling event suggesting
exhumation occurred from 140-100 Ma.
Latest Albian
During this time, elevated organic levels were established in sediments deposited across the shelf to slope
environment, evidenced in the scientific boreholes. A stepped slope was established along the Guyana-
Suriname margin. Deposition of a major submarine channel-fan system was controlled by the antecedent
topography generated by the collapsed margin. Rift volcanics observed on seismic are also interpreted
Chapter 5
217
throughout the opening Demerara – Guinea oceanic domain segment (Olyphant et al., 2017, Fig. 5.16C).
Adjacent continental margins are narrow and fault controlled within the extensional basin.
At this time, models of magnetic anomalies in the oceanic crust (Müller et al., 2008) predict seafloor
spreading initiated in the extensional segment offshore French Guiana between 105 and 110 Ma (Albian).
The relatively thick (ca. 200 m) latest Albian (NC10a oldest) deep marine section documented in GM-ES-3
(Fig. 5.11A) unconformably, based on seismic interpretation, overlies undated non-marine syn-rift strata.
The well is located above thinned continental crust (Fig. 5.11A). This interval (NC10a) is highly condensed,
only 0.55 m thick, on the Demerara Rise above an intra Late Albian unconformity (Fig. 5.7). We suggest that
the creation of accommodation offshore French Guiana and subsequent filling with latest Albian deep
marine deposits indicates an early Late Albian age (i.e. pre-intra Late Albian unconformity) for the onset of
seafloor spreading and oceanic crust formation. It remains to be understood whether the late Albian marine
connection between the Central and Equatorial Atlantic occurred over a flooded Demerara Rise or through
an open Demerara-Guinea transform. The conjugated Demerara Rise and Guinea Plateau was likely the final
buttress (thinned continental crust) preventing the establishment of a deep-water connection between the
Equatorial and Central Atlantic, this deep-water connection only established with the final phase of oceanic
crust formation at the beginning of the Cenomanian, this event is represented by the BCU across the
Demerara Rise (Fig. 5.15).
Santonian
By Santonian times (Fig. 5.16D), Africa has drifted away from South America forming a deep-water
connection between North and South Atlantic Oceans. The Late Cretaceous sequence is highly condensed
and the MCU is observed in wells across the distal Demerara Rise, due to this area likely being a paleo-high.
This period is associated with deposition of extensive submarine fan-channel systems in the basin. These
systems offshore French Guiana are relatively short (distance from shelf margin to fan) in comparison to
their Suriname-Guyana counterparts, likely due to the narrow and steep nature of the margin, and perhaps
corresponding to the length and volume of the onshore drainage system (Sømme et al., 2009). Entry points
for these systems breach relay zones between rift faults along the Equatorial Atlantic margin. The channels
of these short systems erode and remove the underlying organic-rich interval as observed in GM-ES-3. The
deep-water systems in Suriname-Guyana form the prolific hydrocarbon reservoirs encountered in the
Stabroek block. Up-dip these systems are fed through the Berbice and Essequibo canyons, depositing sand
in submarine channel complexes across the slope to basin floor fans. A re-orientation and retrogression of
this fairway axis is observed through the Late Cretaceous, postulated to be related to a decrease in sediment
supply through the Berbice canyon and compensational stacking (T3 – Albian to Turonian; T4 – Coniacian to
Maastrichtian; Mourlot, 2018).
Stratigraphic architecture, Guyanas continental margin
218
5.6 DISCUSSION
5.6.1 Comparison to the Conjugate Margin – Guinea Plateau
Although seismic reflection or well data from the Guinea Plateau was not available for this study, a review
of material previously published allows both the conjugate margins to be examined in light of our new
findings. Analysis of seismic lines (Fig. 5.11) on the Demerara Rise, SR1-5400 (GuyanaSPAN), and lines from
the Guinea Plateau presented in Edge (2014), reconstructed to their position at pre-Equatorial Atlantic rifting
times, i.e. pre-Aptian, reveals that these lines align as ‘conjugates’ (Fig. 5.16A). This has been used to
supplement the GDE mapping of the Guinea Plateau (Fig. 5.16). Although seismic imaging quality of the deep
basement structure below the Guinea Plateau is poor, preventing detailed analysis, exploration wells on the
southern margin of the Guinea Plateau (GU-2B-1, Sabu-1, Fatala-1; Fig. 5.16C) targeted the post-rift
sequence. Calibration of the oldest strata is extrapolated from wells PGO-2 and PGO-6, reaching TD in
Jurassic micritic limestones and shale (Zinecker et al., 2018). Notably, both Long et al. (2018) and Zinecker
et al. (2018) during their regional seismic interpretation of 2D seismic data across the Guinea Plateau
identified northwest-ward orientated SDR sequences underlying the Jurassic carbonate sequence (~MS1),
consistent with the dip orientation of the basement sequence below the Demerara Rise (Reuber et al., 2016).
Several major southwest-ward dipping listric faults (i.e. Baraka fault; Fig. 5.16B) are observed on the
southern rifted margin of the Guinea Plateau; Olyphant et al. (2017) interpreted these faults to sole out into
basement. The geometry of the Demerara-Guinea transform faults and narrow conjugate continental
margins appear similar, however the first major faults that develop at the continental/oceanic transition
have reverse polarities, i.e. the faults near the Guinea Plateau COB dip landward, whereas on the Demerara
Rise they dip towards the oceanic basin, highlighting the margin asymmetry (Fig. 5.11B).
Our interpretation is that the mapped Top Neocomian horizon of Edge (2004) represents the VF, based on
the correlation of seismic facies and architecture (Fig. 5.11B). Below the BAU, the Aptian unconformity and
overlying syn-rift wedge is penetrated in well GU-2B-1 on the Guinea Plateau (Fig. 5.11B). These syn-rift
strata are only preserved basinward of the east-west trending Baraka fault (see Fig. 3 in Olyphant et al.,
2017), likely analogous to the syn-rift strata offshore French Guiana (Fig. 5.11A) and correlating with the
Cacipore Formation in the Foz do Amazonas basin (Fig. 5.15). Within this sequence, breakup related basalts
and volcaniclastics are penetrated in wells GU-2B-1 and Sabu-1 (Olyphant et al., 2017), distributed along the
southern margin of the Guinea Plateau (Fig. 5.16C; Benkhelil et al., 1994; Gouyet et al., 1994). The apparent
lack of any Aptian compressional deformation on the conjugate margin seismic profile (Fig. 5.11B) is
probably due to its position, as the majority of the deformation is located on the southwest nose of the
Guinea Plateau (Fig. 5.16B; Benkhelil et al., 1994; Basile et al., 2013). There is a considerable difference in
the Cenozoic sediment thickness (Fig. 5.11B); progradational sigmoidal seismic reflections (clinoforms) on
Chapter 5
219
the Demerara Rise indicate the deposition of a major shelfal siliciclastic system penetrated in well GLO-1
leading to the deeper burial of pre-Cenozoic stratigraphy.
5.6.2 Margin Heterogeneity Influenced by Structural Inheritance
Evaluating the margin architecture at a super-regional scale, i.e. >1000 km along strike, highlights the
heterogeneities that result in the segmentation of continental margins (e.g. Watts & Stewart, 1998; Franke
et al., 2007; Faleide et al., 2008). From this study, spatial variabilities are recorded in the depositional
systems, associated drainage systems onshore, structural style and organic matter distribution. Further
studies show segmentation causes additional variations in subsidence history (Pereira & Alves, 2011; Tsikalas
et al. 2001). Sedimentation over the Demerara Rise, particularly the more distal section, is heavily condensed
with low sedimentation rates (Fig. 5.2), and many Cretaceous to recent post-rift unconformities are recorded
(Fig. 5.11). These re-dated surfaces are interpreted to be sequence boundaries developed at lowstands that
can be correlated with increased siliciclastic delivery into the adjacent deep-water basins (Vail et al., 1980).
Additionally, the margins of the Demerara Rise were the focus of repeated tectonic deformation, developing
both transpressional and extensional fault systems, during Equatorial Atlantic breakup. Internal deformation
of the Demerara Rise is diverse, ranging from broad long-wavelength folding to tight imbricate thrust fault
systems. Fundamentally the heterogeneities discussed are consequential of the pre-rift structural
inheritance, eventually modified by the dual-phase rifting history.
The Demerara Rise and its conjugate, the Guinea Plateau, is thought to have formed a focal point for hot
spot magmatism (CAMP or Bahamas hotspot related) during the early stages of the Central Atlantic opening,
potentially creating a volcanic accumulation up to 21 km thick (Reuber et al., 2016; Long et al., 2018; Zinecker
et al., 2018). These submarine plateaus are clearly identifiable in present-day bathymetric maps, being a
testament to the longstanding influence this basement configuration had on the bathymetry and ultimately,
the segmentation of the continental margin, as observed on other TMPs worldwide (Loncke et al., 2019).
The location of the volcanism in the south-eastern Central Atlantic has been interpreted as creating a
‘pinning point’ for the final fragmentation of Gondwana and the breakup of the Equatorial Atlantic segment
(Pindell, 1985; Greenroyd et al., 2007, 2008a; Basile et al., 2013). It is conceivable the volcanism was
associated with a crustal weakness exploited during the second Equatorial phase of rifting. Similar
segmentation of continental margins and its effects on post-rift deposition are documented globally from
the rifted Norwegian (Tsikalas et al. 2001), western India (Calvès et al., 2011), Levant (Ben‐Avraham et al.,
2006) and Uruguayan margins (Soto et al., 2001).
Stratigraphic architecture, Guyanas continental margin
220
5.7 CONCLUSIONS
New stratigraphic data acquired by re-sampling seven exploration wells and scientific boreholes located
along the Guyanas continental margin of South America has been used to refine a high-resolution
stratigraphic framework, applicable to the Central Atlantic. This framework is applied to the interpretation
of a margin-scale two-dimensional deep seismic reflection survey to produce a new megasequence
architecture model, create updated paleogeographic reconstructions for four key geological intervals and
reconstruct the structural evolution through the two divergent phases of breakup.
Our findings highlight deposition during the early Central Atlantic post-rift sequence (Jurassic-Lower
Cretaceous i.e. MS1) was influenced by the underlying heterogenous basement structure. The major MS1
depocentre below the Demerara Rise passively infilled pre-existing basement topography, continuing below
the conjugate Guinea Plateau. The only well on the South American margin to penetrate this sequence is
the Demerara A2-1 well. New multi-proxy biostratigraphy data conclusively reveals the well reached total
depth in late Tithonian organic-lean (average TOC 0.37%) shales and limestones. Previous work that suggests
A2-1 penetrated a Jurassic-aged source rock is questioned by this new integrated dataset. MS1 is capped by
a super-regional maximum flooding surface (MFS) during the upper Valanginian (VF) recognised elsewhere
around the Central Atlantic and Gulf of Mexico. The landward limit of the MFS reveals the south-eastern
extension of the early Central Atlantic.
Rifting in the Equatorial Atlantic during Barremian to Aptian times modified the continental margin
architecture, the structure and succeeding depositional systems. Deep grabens formed along the proto-
Equatorial margins receiving continental sedimentation. Further associated breakup volcanism is evidenced
by basalts recovered in the French Guiana FG2-1 well. The progressive anti-clockwise rotation of Africa from
South America during the Aptian induced a transpressional regime causing an estimated 8.3 km of
shortening across the distal Demerara Rise. This tectonism resulted in short-wavelength folding and
thrusting, major margin collapse into adjacent basins and the formation of a progradational shelfal
siliciclastic system (Stabroek Formation). This sequence (MS2) is truncated by a super-regional angular
unconformity re-dated as basal Albian (BAU), peneplaning up to 1 km of sediment from the Demerara Rise.
Late Albian deep marine sediments from GM-ES-3 prove oceanic crust had formed by this time in the
extensional segment of the opening Equatorial Atlantic offshore French Guiana, represented by the time
synchronous intra Late Albian unconformity recognised on the Demerara Rise. Our model suggests final
breakup of the Demerara Rise and Guinea Plateau, and deep marine connection between the Equatorial and
Central Atlantic occurred during the earliest Cenomanian.
The distal Demerara Rise sedimentary sequence is highly condensed and contains multiple unconformities
dated as middle Campanian (MCU), base Tertiary (BTU) and middle Miocene (MMU), suggesting this area
Chapter 5
221
remained an area of low accommodation and a relative high. Onset of organic-rich sedimentation (Canje
Formation) co-occurred with the flooding of the Equatorial Atlantic (pre-oceanic crust formation), during
the late Middle Albian. Geochemical characterisation of these primarily marine Type II organic-rich strata
(average TOC 4.21%) shows heterogeneity along strike, reflecting sediment dilution and terrestrial organic
matter input.
The topography generated by the margin collapse is interpreted to have been a major control on the entry
point of siliciclastic delivery, funnelling sediment from the shallow Demerara Rise into the deep-water
sedimentary systems of the Guyana-Suriname basin. The Berbice canyon has already been described from
previous studies as another major sediment input point throughout the Late Cretaceous, delivering
sediment to the world-class hydrocarbon reservoirs in the Guyana-Suriname basin. Coeval siliciclastic input
occurred along the Equatorial margin, and the depositional systems display relatively short runout lengths,
related to the steep, narrow margin geometry.
Examining the sedimentary systems using this integrated approach at a margin-scale, reveals the important
control of inherited pre-rift structural and basement heterogeneity, and later structural evolution associated
with the second phase of breakup, on the post-rift depositional system distribution and overall margin
heterogeneity.
5.8 ACKNOWLEDGEMENTS
This study is part of the lead authors PhD project at the University of Manchester. We thank the sponsoring
companies of the North Africa Research Group (NARG) for their continued financial and scientific support.
The sampling and subsequent analysis of DSDP/ODP cores was partially supported by a European
Consortium for Ocean Research Drilling (ECORD) research grant awarded to the lead author. Holger
Kuhlmann provided excellent support during our visits to the Bremen Core Repository and subsequent
requests for additional samples. Shell is thanked for the access to hydrocarbon exploration well data,
particularly Tyrone Sigur at the CGG storage facility, Schulenburg, Texas. Iain Prince and Peter Osterloff
(Shell) are thanked for their attentive support and additionally David Owen and Robert Campbell (Shell)
helped improve the manuscript. The seismic data presented is courtesy of ION Geophysical. Ian Mounteney
is acknowledged for his assistance in performing the XRD analysis at the British Geological Survey, Keyworth.
Alastair Bewsher at the University of Manchester is thanked for use of the organic geochemistry laboratory.
Discussion with Jon Teasdale and academic access to the Geognostics Earth Model (GEM™) were particularly
useful in understanding the regional geology, plate tectonics and structure. Frédéric de Ville de Goyet thanks
Nick Miles, Petrostrat for assistance in the Lower Cretaceous palynology. Prof. David Wray, Greenwich
University is acknowledged for his assistance running the pyrolysis. Cairn Energy are thanked for funding the
Stratigraphic architecture, Guyanas continental margin
222
hydrocarbon extractions at GeoMark Research. Jim Armstrong is acknowledged for his assistance
interpreting the organic geochemistry results.
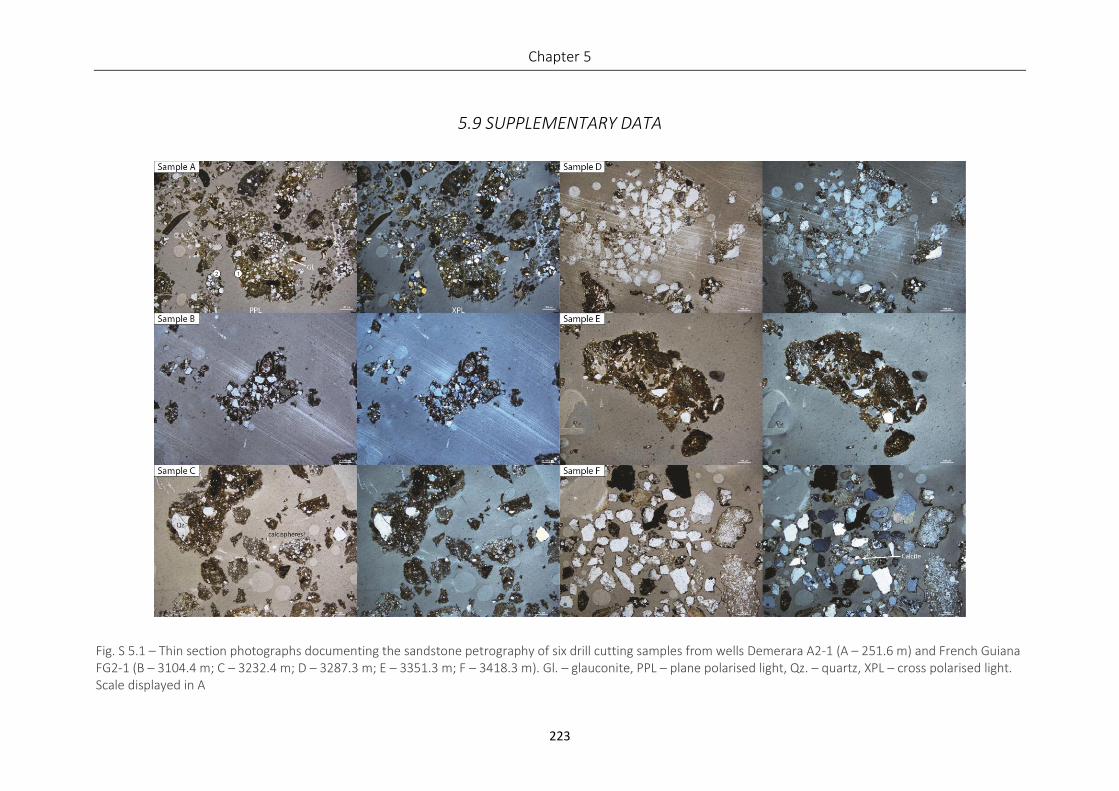
Chapter 5
223
5.9 SUPPLEMENTARY DATA
Fig. S 5.1 – Thin section photographs documenting the sandstone petrography of six drill cutting samples from wells Demerara A2-1 (A – 251.6 m) and French Guiana FG2-1 (B – 3104.4 m; C – 3232.4 m; D – 3287.3 m; E – 3351.3 m; F – 3418.3 m). Gl. – glauconite, PPL – plane polarised light, Qz. – quartz, XPL – cross polarised light. Scale displayed in A
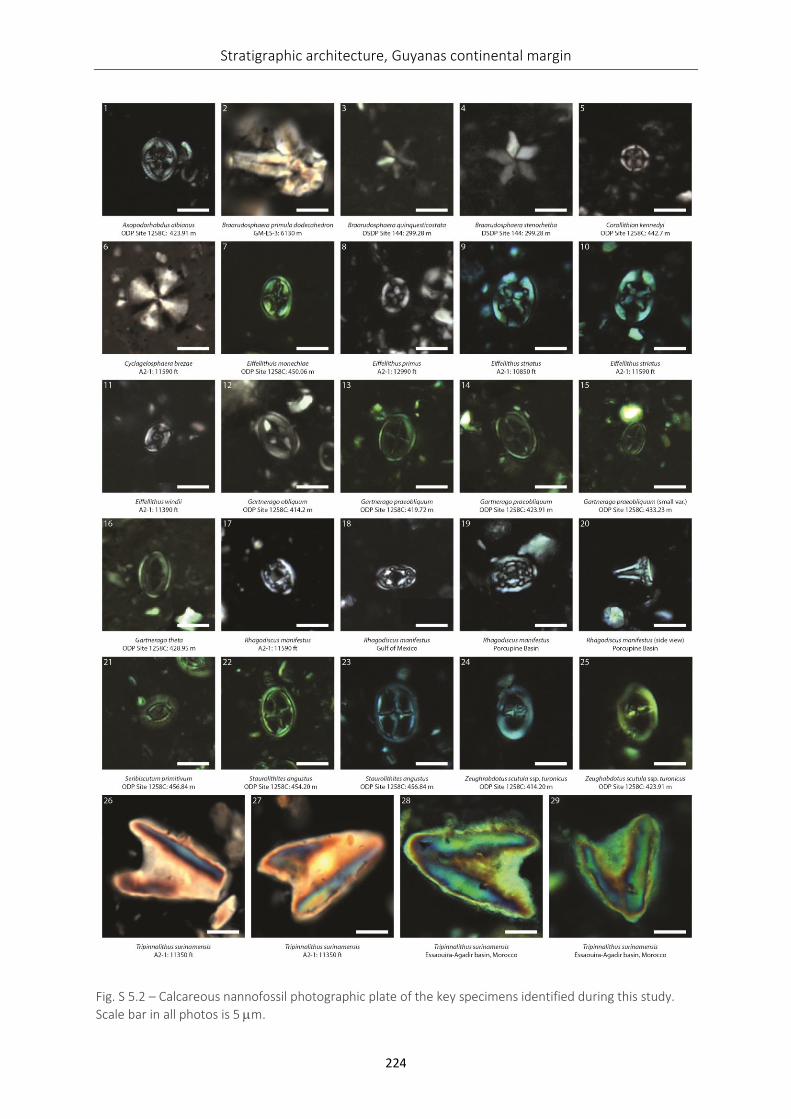
Stratigraphic architecture, Guyanas continental margin
224
Fig. S 5.2 – Calcareous nannofossil photographic plate of the key specimens identified during this study.
Scale bar in all photos is 5 m.
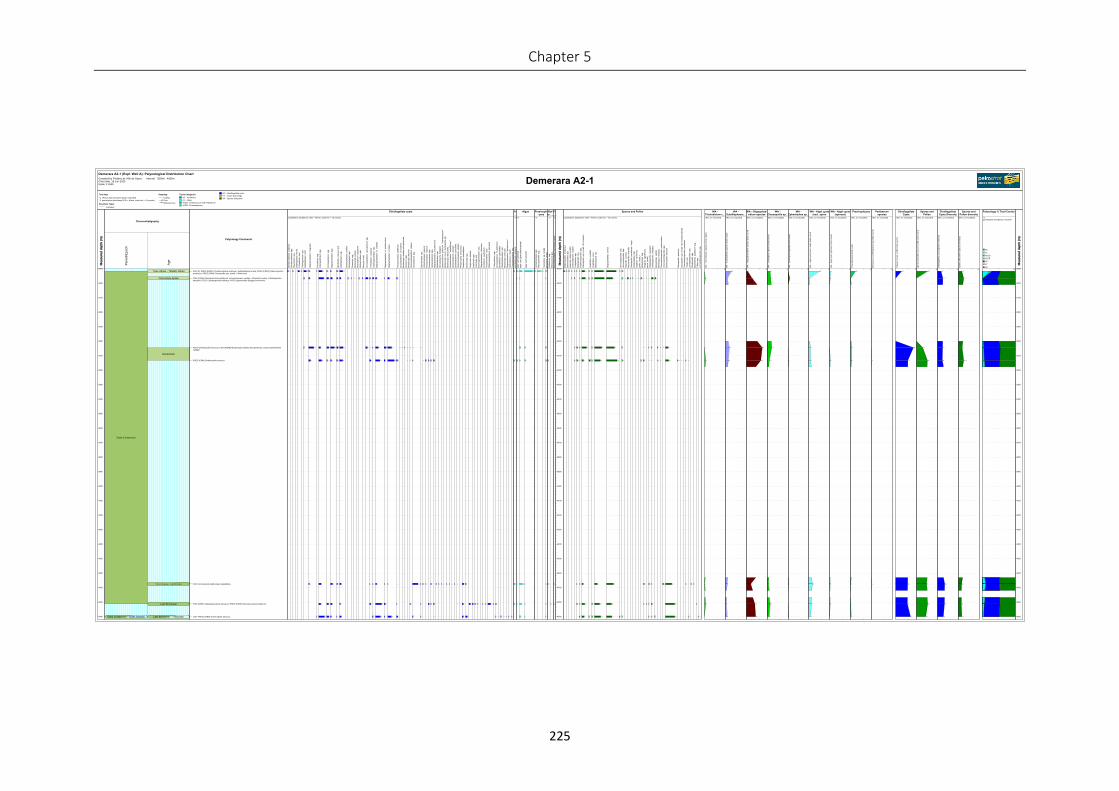
Chapter 5
225
Demerara A2-1Demerara A2-1 (Expl. Well A): Palynological Distribution Chart
Compiled by Frédéric de Ville de GoyetChart date: 16-Jun-2020Scale: 1:4500
Interval: 2500m - 4920m
*1quantitative abundance, % panel
SP
FT
DC
ALPR
ALBO
AL
AC
1002500
2600
2700
2800
2900
3000
3100
3200
3300
3400
3500
3600
3700
3800
3900
4000
4100
4200
4300
4400
4500
4600
4700
4800
4900
Me
asu
red
de
pth
(m
)
Early Cretaceous
Early Cretaceous - ?Late Jurassic
Pe
riod
/Ep
och
Hauterivian
?Late Albian - ?Middle Albian
?intra-Early Aptian
?Early Valanginian - ?Late Berriasian
Late Berriasian
Late Berriasian - ?Tithonian
Ag
e
FSE (P): PRES (RARE) Chichaoudinium arabicum, Subtilisphaera terrula; PRES (FREQ) Elaterosporites protensus; PRES (CMN) Classopollis spp. (small, <30microns)
FDO (RARE) Pseudoceratium pelliferum, Achomosphaera verdierii, Afropollis zonatus, Callialasporites dampieri; FDCO Callialasporites trilobatus; PRES questionable Sergipea naviformis
FDCO Dicheiropollis etruscus; FDO (RARE) Muderongia simplex microperforata, Cymososphaeridium validum
PRES (CMN) Dicheiropollis etruscus
FDCO (consistent) Amphorula metaelliptica
FDO (RARE) Oligosphaeridium diluculum; PRES (RARE) Pseudoceratium pelliferum
LSE: PRES (SABN) Dicheiropollis etruscus
quantitative abundance (100 = 40mm, scale tick = 10 counts)
3 + 1 + 6 1 10
2
1
3
4
20
7
3
1
1
13
19
7
11
9
8
22
2
7
8
2
7
8
2
7
15
4
8
6
3
3
4
5
3
3
1
12
5
13
11
6
3
6
+ 1 ? 1 + + 1 ? 2 ? 9
7
3
+
5
1
5
5
1
1
+
2
5
11
17
5
24
19
1
8
4
1
5
2
6
15
25
1
14
3
4
+
1
5
+ + 1 +
+
+
+
2
+
1
21
2
+
1
1
1
+
1
2
1
2
4
1
2
1
3
3
+
1 1 1 + 1 1 + 1 +
+
+
+
7
5
5
2
7
6 4 2 1 + 1 1 11 1 2
1 + 1 + + 1 1
*2
1
1
2
1
*2
4
1
2
1
1
10
1
4
3
12
8
5
30
2
3
1
1
1
*2
3 12 1 3
1
3
3
1
1
2
*2
1
1
1
*2
3
2
2500
2600
2700
2800
2900
3000
3100
3200
3300
3400
3500
3600
3700
3800
3900
4000
4100
4200
4300
4400
4500
4600
4700
4800
4900
Me
asu
red
de
pth
(m
)
quantitative abundance (100 = 40mm, scale tick = 10 counts)
4 1 1 1
1
1
2
1
1
1
3
3
1
2
1
1
1
+
1
1
2
11
13
18
6
5
11
8
1
1
5
1
1
2
1
1
2
2
35
37
28
22
11
20
24
37
24
31
41
27
20
21
1
2
2
2
1
2
1
+ 5 1 1 + ? + 3
1
+
+
2
3
1
+
1
+
1
+
2
1
1
7
2
+
1
3
1
4
1
2
1
+
+
+
4
11
13
25
36
36
2 ? + + 1
1
+
1
1 1
1
1
(Rw, Cv excluded)
WA
- T
richodin
ium
ca
sta
ne
a (
tota
l co
un
t)
80
3
+
5
1
5
(Rw, Cv excluded)
WA
- S
ubtilis
ph
aera
spe
cie
s (
tota
l co
unt)
80
22
7
14
11
6
3
6
(Rw, Cv excluded)
WA
- O
ligo
sphae
ridiu
m s
pecie
s (
tota
l cou
nt)
80
5
22
61
56
17
33
36
(Rw, Cv excluded)
WA
- C
lassop
olli
s s
pecie
s (
tota
l cou
nt)
80
11
14
18
8 ?
5
11
8
(Rw, Cv excluded)
WA
- E
phedrip
ite
s s
pe
cie
s (
tota
l co
unt)
80
7
1
1
1
(Rw, Cv excluded)
WA
- A
lgal cysts
(excl. s
pin
o (
tota
l co
unt)
80
40
1
6
6
13
9
6
(Rw, Cv excluded)
WA
- A
lga
l cysts
(spin
ose)
(tota
l co
unt)
80
4
1
2
1
1
(Rw, Cv excluded)
Pra
sin
oph
yce
a (
tota
l co
unt)
80
19
1
3
3
1
1
2
(Rw, Cv excluded)
Bo
tryo
coccus &
Pe
dia
str
um
spp (
tota
l coun
t)
80
1
1
(Rw, Cv excluded)
Din
ocyst
Coun
t 1
(A
M)
(tota
l count)
80
23
68
47
46
45
57
(Rw, Cv excluded)
spore
s a
nd p
olle
n (
co
unt
1)
AM
(to
tal cou
nt)
80
43
24
42
39
43
36
(Rw, Cv excluded)
Din
oflag
ella
te c
ysts
(spe
cie
s r
ichne
ss)
80
14
21 ?
20
19
28
27
23
(Rw, Cv excluded)
Sp
ore
s a
nd p
olle
n (
specie
s r
ichness)
80
14
21 ?
15
21 ?
13
12
14
2500
2600
2700
2800
2900
3000
3100
3200
3300
3400
3500
3600
3700
3800
3900
4000
4100
4200
4300
4400
4500
4600
4700
4800
4900
Me
asu
red
de
pth
(m
)
Me
asu
red
de
pth
(m
)
Chronostratigraphy
Palynology Comments
Dinoflagellate cysts A-...
Algae Prasinoph-ycea
Bot-ry......
T-......
Me
asu
red
de
pth
(m
)
Spores and Pollen WA -Trichodinium c...
WA -Subtilisphaera...
WA - Oligosphae-ridium species
WA -Classopollis sp...
WA -Ephedripites sp...
WA - Algal cysts(excl. spino
WA - Algal cysts(spinose)
Prasinophycea Pediastrumspecies
DinoflagellateCysts
Spores andPollen
DinoflagellateCysts Diversity
Spores andPollen diversity
Palynology % Total Counts
Me
asu
red
de
pth
(m
)
Text Keys
*1 ('Paly Totals exclusion group' excluded)
*2 quantitative abundance (100 = 40mm, scale tick = 10 counts)
Boundary Types
Confident
Sampling
Cutting
Core
Sidewall Core
Taxon Categories
AC - Acritarchs
AL - Algae
ALBO - Botryococcus and Pediastrum
ALPR - Prasinophycea
DC - Dinoflagellate cysts
FT - Foram test linings
SP - Spores and pollen
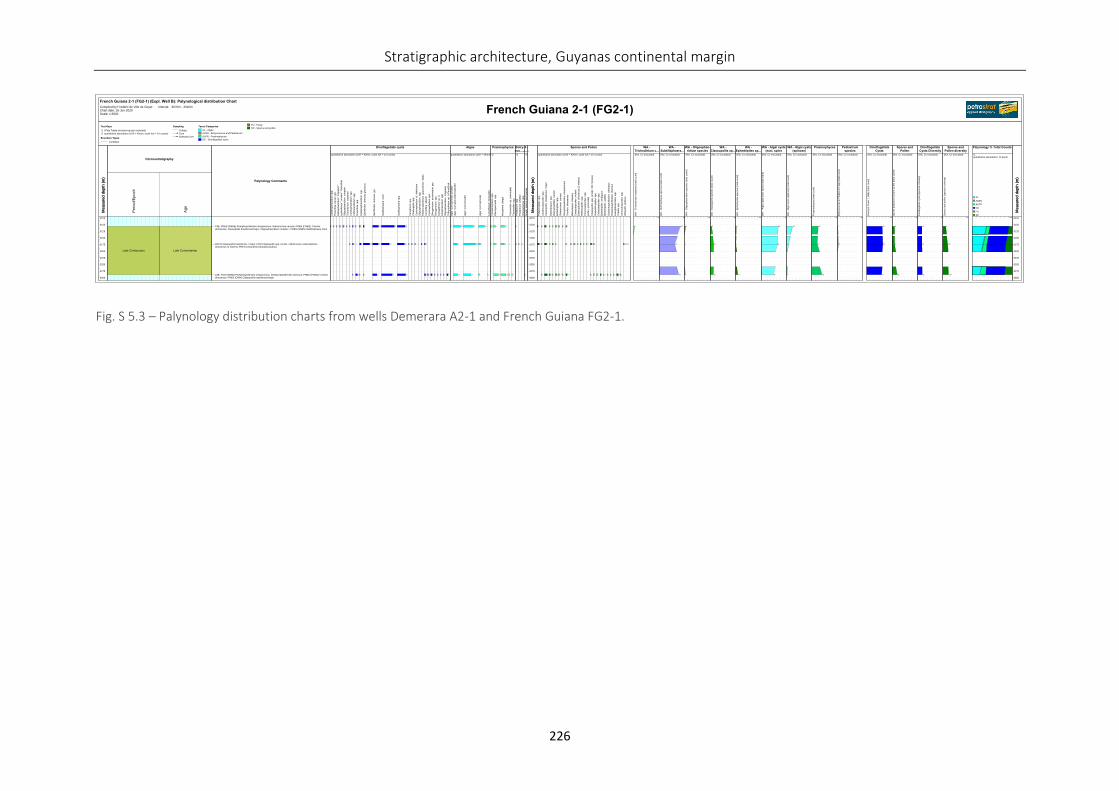
Stratigraphic architecture, Guyanas continental margin
226
Fig. S 5.3 – Palynology distribution charts from wells Demerara A2-1 and French Guiana FG2-1.
French Guiana 2-1 (FG2-1)French Guiana 2-1 (FG2-1) (Expl. Well B): Palynological distribution Chart
Compiled by Frédéric de Ville de GoyetChart date: 16-Jun-2020Scale: 1:3000
Interval: 3070m - 3310m
*1quantitative abundance, % panel
SP
FU
DC
ALPR
ALBO
AL
1003075
3100
3125
3150
3175
3200
3225
3250
3275
3300
Mea
sure
d d
epth
(m
)
Late Cretaceous
Pe
rio
d/E
po
ch
Late Cenomanian
Ag
e
FSE: PRES (RARE) Pemphixipollenites inequiexinius, Galeacornea causea; PRES (FREQ) Triorites africaensis, Classopollis brasiliensis/major, Oligosphaeridium complex ; PRES (SABN) Subtilisphaera cheit
FDCO Classopollis brasiliensis / major; FDO Classopollis spp. (small, <30microns), Elateroplicites africaensis (2 elaters); PRES (reworked) Afropollis jardinus
LSE: FDO (RARE) Pemphixipollenites inequiexinius, Gnetaceaepollenites diversus; PRES (FREQ) Triorites africaensis; PRES (CMN) Classopollis brasiliensis/major
quantitative abundance (100 = 40mm, scale tick = 10 counts)
1 1 1 1 2 1 1
1
2
3
1
1
+
6
2
5
1
3
21
1
19
18
14
41
25
34
25
23
27
1 1 1 + 2 3
4 2 4 1 1 1 1 4
quantitative abundance (100 = 40mm)
1 23
12
14
31
39
24
19
6
2 1
*2
3
1
5
6
14
12
10
16
+
1 1
*2
1
2 2 1
*2
1
3075
3100
3125
3150
3175
3200
3225
3250
3275
3300
Mea
sure
d d
epth
(m
)
quantitative abundance (100 = 40mm, scale tick = 10 counts)
2
6
1
1
1
5
7
9
1
1
3
1
2
1
2
1
3
1
1 ?
1
1
2
1
4 ?
1 2 1 2 1 1 ? 4
1
1
1 1 3 1 ? 1 1 1 5 1
2 Rw ?
(Rw, Cv excluded)
WA
- T
rich
od
iniu
m c
asta
ne
a (
tota
l cou
nt)
80
1
(Rw, Cv excluded)
WA
- S
ubtilis
phae
ra s
pecie
s (
tota
l cou
nt)
80
66
48
61
(Rw, Cv excluded)
WA
- O
ligo
sp
ha
eri
diu
m s
pecie
s (
tota
l cou
nt)
80
2
+
1
(Rw, Cv excluded)
WA
- C
lass
opo
llis s
pecie
s (
tota
l cou
nt)
80
5
11
10
(Rw, Cv excluded)
WA
- E
phe
dripites s
pecie
s (
tota
l co
un
t)
80
2
1
7 ?
(Rw, Cv excluded)
WA
- A
lga
l cysts
(e
xcl. s
pin
o (
tota
l cou
nt)
80
54
51
38
(Rw, Cv excluded)
WA
- A
lga
l cysts
(spin
ose
) (t
ota
l co
un
t)
80
20
6
2
(Rw, Cv excluded)
Pra
sin
oph
ycea
(to
tal co
un
t)
80
20
17
32
(Rw, Cv excluded)
Bo
tryococcus &
Pe
dia
str
um
spp
(to
tal coun
t)
80
1
5
(Rw, Cv excluded)
Din
ocyst C
ou
nt
1 (
AM
) (t
ota
l cou
nt)
80
49
51
47
(Rw, Cv excluded)
spo
res a
nd p
olle
n (
cou
nt 1)
AM
(to
tal co
unt)
80
8
8
16
(Rw, Cv excluded)
Din
oflag
ella
te c
ysts
(spe
cie
s r
ich
ness
)
80
14
14
15
(Rw, Cv excluded)
Sp
ore
s a
nd
po
llen (
sp
ecie
s r
ichn
ess
)
80
9
15 ?
18 ?
3075
3100
3125
3150
3175
3200
3225
3250
3275
3300
Mea
sure
d d
epth
(m
)
Mea
sure
d d
epth
(m
)
Chronostratigraphy
Palynology Comments
Dinoflagellate cysts Algae Prasinophycea Botry-oco......
F-......
Mea
sure
d d
epth
(m
)
Spores and Pollen WA -Trichodinium c...
WA -Subtilisphaera...
WA - Oligosphae-ridium species
WA -Classopollis sp...
WA -Ephedripites sp...
WA - Algal cysts(excl. spino
WA - Algal cysts(spinose)
Prasinophycea Pediastrumspecies
DinoflagellateCysts
Spores andPollen
DinoflagellateCysts Diversity
Spores andPollen diversity
Palynology % Total Counts
Mea
sure
d d
epth
(m
)
Text Keys
*1 ('Paly Totals exclusion group' excluded)
*2 quantitative abundance (100 = 40mm, scale tick = 10 counts)
Boundary Types
Confident
Sampling
Cutting
Core
Sidewall Core
Taxon Categories
AL - Algae
ALBO - Botryococcus and Pediastrum
ALPR - Prasinophycea
DC - Dinoflagellate cysts
FU - Fungi
SP - Spores and pollen
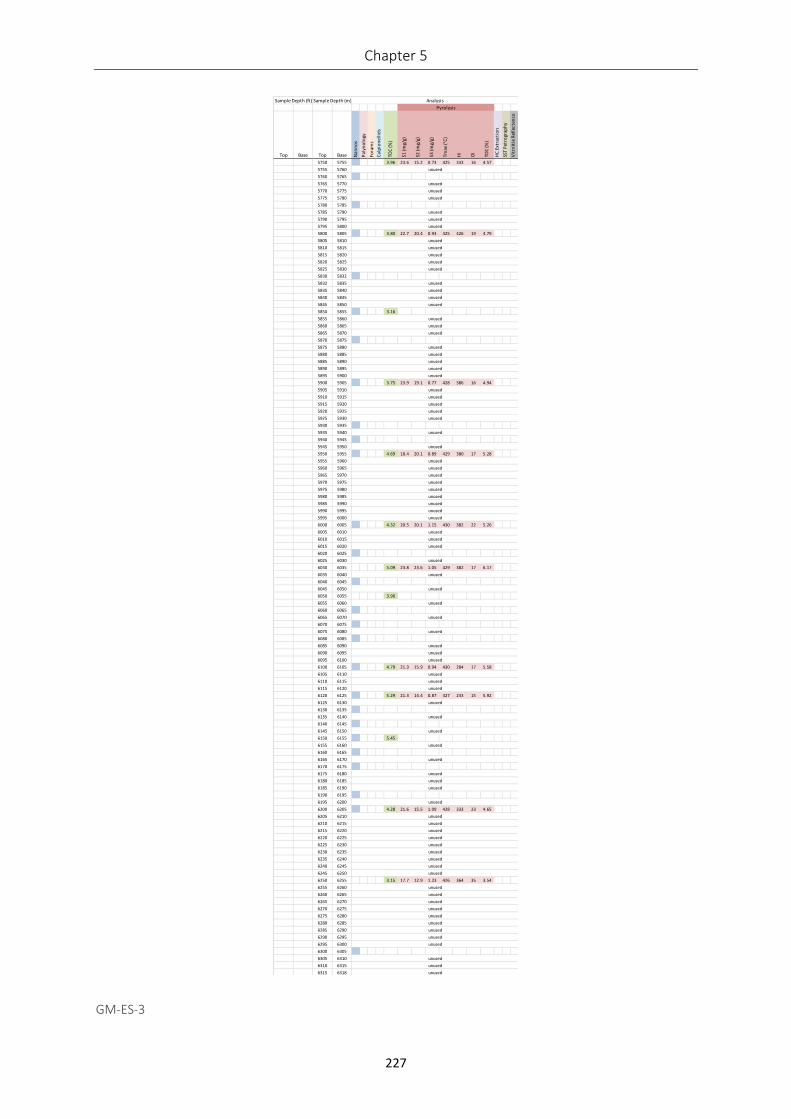
Chapter 5
227
GM-ES-3
Top Base Top Base Nan
no
s
Pal
yno
logy
Fora
ms
Cal
pio
nel
lid
s
TOC
(%)
S1 (m
g/g)
S2 (m
g/g)
S3 (m
g/g)
Tmax
(°C
)
HI
OI
TOC
(%)
HC
Ext
ract
ion
SST
Pet
rogr
aph
y
Vit
rnit
ie R
efle
cten
ce
5750 5755 3.96 23.6 15.2 0.73 425 333 16 4.57
5755 5760
5760 5765
5765 5770
5770 5775
5775 5780
5780 5785
5785 5790
5790 5795
5795 5800
5800 5805 3.80 22.7 20.4 0.93 425 426 19 4.79
5805 5810
5810 5815
5815 5820
5820 5825
5825 5830
5830 5832
5832 5835
5835 5840
5840 5845
5845 5850
5850 5855 3.16
5855 5860
5860 5865
5865 5870
5870 5875
5875 5880
5880 5885
5885 5890
5890 5895
5895 5900
5900 5905 3.75 23.9 19.1 0.77 428 386 16 4.94
5905 5910
5910 5915
5915 5920
5920 5925
5925 5930
5930 5935
5935 5940
5940 5945
5945 5950
5950 5955 4.69 18.4 20.1 0.89 429 380 17 5.28
5955 5960
5960 5965
5965 5970
5970 5975
5975 5980
5980 5985
5985 5990
5990 5995
5995 6000
6000 6005 4.32 20.5 20.1 1.15 430 382 22 5.26
6005 6010
6010 6015
6015 6020
6020 6025
6025 6030
6030 6035 5.09 23.8 23.6 1.05 429 382 17 6.17
6035 6040
6040 6045
6045 6050
6050 6055 3.90
6055 6060
6060 6065
6065 6070
6070 6075
6075 6080
6080 6085
6085 6090
6090 6095
6095 6100
6100 6105 4.79 21.3 15.9 0.94 430 284 17 5.58
6105 6110
6110 6115
6115 6120
6120 6125 5.29 21.3 14.4 0.87 427 243 15 5.92
6125 6130
6130 6135
6135 6140
6140 6145
6145 6150
6150 6155 5.45
6155 6160
6160 6165
6165 6170
6170 6175
6175 6180
6180 6185
6185 6190
6190 6195
6195 6200
6200 6205 4.28 21.6 15.5 1.09 428 333 23 4.65
6205 6210
6210 6215
6215 6220
6220 6225
6225 6230
6230 6235
6235 6240
6240 6245
6245 6250
6250 6255 3.15 17.7 12.9 1.23 426 364 35 3.54
6255 6260
6260 6265
6265 6270
6270 6275
6275 6280
6280 6285
6285 6290
6290 6295
6295 6300
6300 6305
6305 6310
6310 6315
6315 6318
unused
unused
unused
unused
unused
unused
unused
unused
unused
unused
unused
unused
unused
unused
unused
unused
unused
unused
unused
unused
unused
unused
unused
unused
unused
unused
unused
unused
unused
unused
unused
unused
unused
unused
unused
unused
unused
unused
unused
unused
unused
unused
unused
unused
unused
unused
unused
unused
unused
unused
unused
unused
unused
unused
unused
unused
unused
unused
unused
unused
unused
unused
unused
unused
unused
unused
unused
unused
unused
unused
unused
unused
unused
unused
unused
unused
unused
unused
unused
unused
unused
unused
unused
unused
Pyrolysis
Sample Depth (ft) Sample Depth (m) Analysis
unused
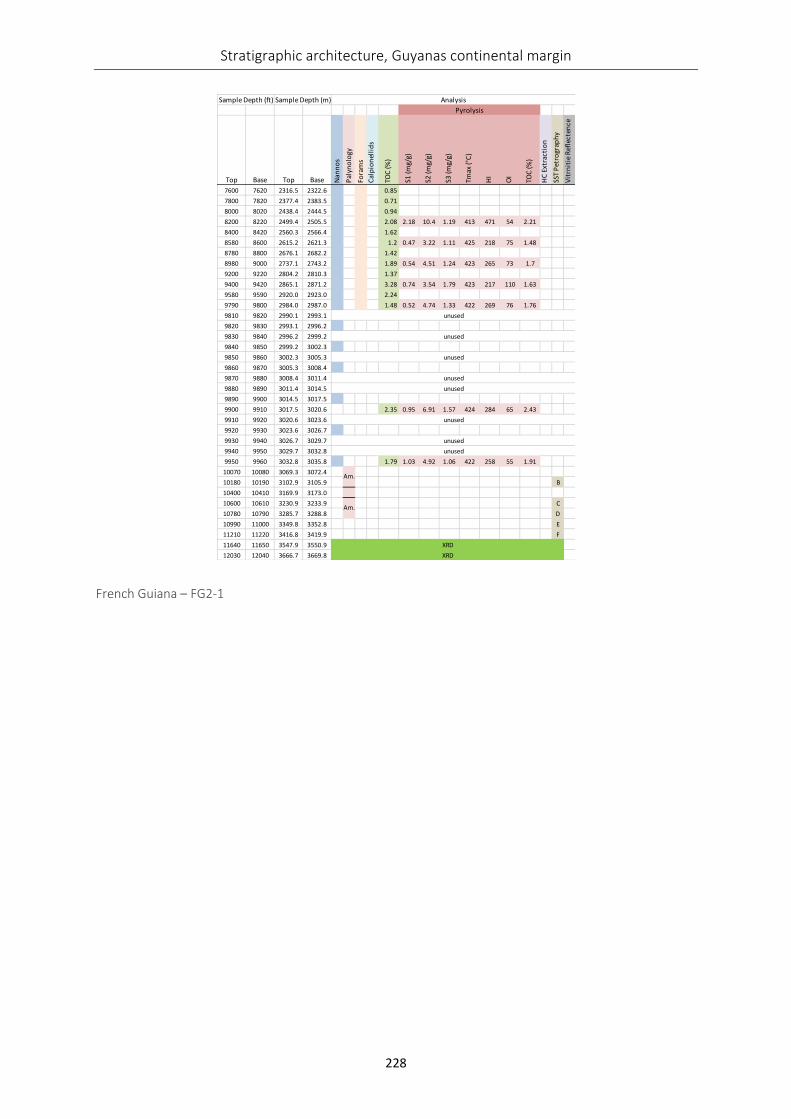
Stratigraphic architecture, Guyanas continental margin
228
French Guiana – FG2-1
Top Base Top Base Nan
no
s
Pal
yno
logy
Fora
ms
Cal
pio
nel
lid
s
TOC
(%)
S1 (m
g/g)
S2 (m
g/g)
S3 (m
g/g)
Tmax
(°C
)
HI
OI
TOC
(%)
HC
Ext
ract
ion
SST
Pet
rogr
aph
y
Vit
rnit
ie R
efle
cten
ce
7600 7620 2316.5 2322.6 0.85
7800 7820 2377.4 2383.5 0.71
8000 8020 2438.4 2444.5 0.94
8200 8220 2499.4 2505.5 2.08 2.18 10.4 1.19 413 471 54 2.21
8400 8420 2560.3 2566.4 1.62
8580 8600 2615.2 2621.3 1.2 0.47 3.22 1.11 425 218 75 1.48
8780 8800 2676.1 2682.2 1.42
8980 9000 2737.1 2743.2 1.89 0.54 4.51 1.24 423 265 73 1.7
9200 9220 2804.2 2810.3 1.37
9400 9420 2865.1 2871.2 3.28 0.74 3.54 1.79 423 217 110 1.63
9580 9590 2920.0 2923.0 2.24
9790 9800 2984.0 2987.0 1.48 0.52 4.74 1.33 422 269 76 1.76
9810 9820 2990.1 2993.1
9820 9830 2993.1 2996.2
9830 9840 2996.2 2999.2
9840 9850 2999.2 3002.3
9850 9860 3002.3 3005.3
9860 9870 3005.3 3008.4
9870 9880 3008.4 3011.4
9880 9890 3011.4 3014.5
9890 9900 3014.5 3017.5
9900 9910 3017.5 3020.6 2.35 0.95 6.91 1.57 424 284 65 2.43
9910 9920 3020.6 3023.6
9920 9930 3023.6 3026.7
9930 9940 3026.7 3029.7
9940 9950 3029.7 3032.8
9950 9960 3032.8 3035.8 1.79 1.03 4.92 1.06 422 258 55 1.91
10070 10080 3069.3 3072.4
10180 10190 3102.9 3105.9 B
10400 10410 3169.9 3173.0
10600 10610 3230.9 3233.9 C
10780 10790 3285.7 3288.8 D
10990 11000 3349.8 3352.8 E
11210 11220 3416.8 3419.9 F
11640 11650 3547.9 3550.9
12030 12040 3666.7 3669.8
XRD
XRD
unused
unused
unused
unused
unused
unused
unused
unused
Sample Depth (ft) Sample Depth (m)
Am.
Am.
Analysis
Pyrolysis
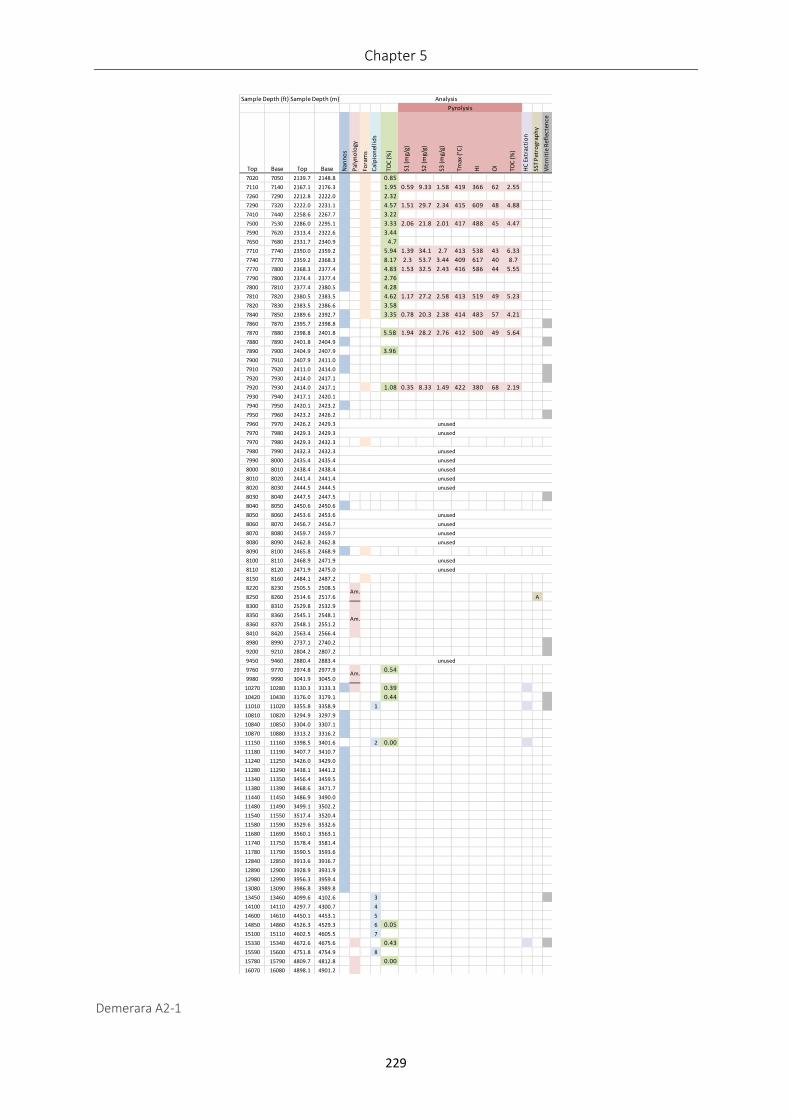
Chapter 5
229
Demerara A2-1
Top Base Top Base Nan
no
s
Pal
yno
logy
Fora
ms
Cal
pio
nel
lid
s
TOC
(%)
S1 (m
g/g)
S2 (m
g/g)
S3 (m
g/g)
Tmax
(°C
)
HI
OI
TOC
(%)
HC
Ext
ract
ion
SST
Pet
rogr
aph
y
Vit
rnit
ie R
efle
cten
ce
7020 7050 2139.7 2148.8 0.85
7110 7140 2167.1 2176.3 1.95 0.59 9.33 1.58 419 366 62 2.55
7260 7290 2212.8 2222.0 2.32
7290 7320 2222.0 2231.1 4.57 1.51 29.7 2.34 415 609 48 4.88
7410 7440 2258.6 2267.7 3.22
7500 7530 2286.0 2295.1 3.33 2.06 21.8 2.01 417 488 45 4.47
7590 7620 2313.4 2322.6 3.44
7650 7680 2331.7 2340.9 4.7
7710 7740 2350.0 2359.2 5.94 1.39 34.1 2.7 413 538 43 6.33
7740 7770 2359.2 2368.3 8.17 2.3 53.7 3.44 409 617 40 8.7
7770 7800 2368.3 2377.4 4.83 1.53 32.5 2.43 416 586 44 5.55
7790 7800 2374.4 2377.4 2.76
7800 7810 2377.4 2380.5 4.28
7810 7820 2380.5 2383.5 4.62 1.17 27.2 2.58 413 519 49 5.23
7820 7830 2383.5 2386.6 3.58
7840 7850 2389.6 2392.7 3.35 0.78 20.3 2.38 414 483 57 4.21
7860 7870 2395.7 2398.8
7870 7880 2398.8 2401.8 5.58 1.94 28.2 2.76 412 500 49 5.64
7880 7890 2401.8 2404.9
7890 7900 2404.9 2407.9 3.96
7900 7910 2407.9 2411.0
7910 7920 2411.0 2414.0
7920 7930 2414.0 2417.1
7920 7930 2414.0 2417.1 1.08 0.35 8.33 1.49 422 380 68 2.19
7930 7940 2417.1 2420.1
7940 7950 2420.1 2423.2
7950 7960 2423.2 2426.2
7960 7970 2426.2 2429.3
7970 7980 2429.3 2429.3
7970 7980 2429.3 2432.3
7980 7990 2432.3 2432.3
7990 8000 2435.4 2435.4
8000 8010 2438.4 2438.4
8010 8020 2441.4 2441.4
8020 8030 2444.5 2444.5
8030 8040 2447.5 2447.5
8040 8050 2450.6 2450.6
8050 8060 2453.6 2453.6
8060 8070 2456.7 2456.7
8070 8080 2459.7 2459.7
8080 8090 2462.8 2462.8
8090 8100 2465.8 2468.9
8100 8110 2468.9 2471.9
8110 8120 2471.9 2475.0
8150 8160 2484.1 2487.2
8220 8230 2505.5 2508.5
8250 8260 2514.6 2517.6 A
8300 8310 2529.8 2532.9
8350 8360 2545.1 2548.1
8360 8370 2548.1 2551.2
8410 8420 2563.4 2566.4
8980 8990 2737.1 2740.2
9200 9210 2804.2 2807.2
9450 9460 2880.4 2883.4
9760 9770 2974.8 2977.9 0.54
9980 9990 3041.9 3045.0
10270 10280 3130.3 3133.3 0.39
10420 10430 3176.0 3179.1 0.44
11010 11020 3355.8 3358.9 1
10810 10820 3294.9 3297.9
10840 10850 3304.0 3307.1
10870 10880 3313.2 3316.2
11150 11160 3398.5 3401.6 2 0.00
11180 11190 3407.7 3410.7
11240 11250 3426.0 3429.0
11280 11290 3438.1 3441.2
11340 11350 3456.4 3459.5
11380 11390 3468.6 3471.7
11440 11450 3486.9 3490.0
11480 11490 3499.1 3502.2
11540 11550 3517.4 3520.4
11580 11590 3529.6 3532.6
11680 11690 3560.1 3563.1
11740 11750 3578.4 3581.4
11780 11790 3590.5 3593.6
12840 12850 3913.6 3916.7
12890 12900 3928.9 3931.9
12980 12990 3956.3 3959.4
13080 13090 3986.8 3989.8
13450 13460 4099.6 4102.6 3
14100 14110 4297.7 4300.7 4
14600 14610 4450.1 4453.1 5
14850 14860 4526.3 4529.3 6 0.05
15100 15110 4602.5 4605.5 7
15330 15340 4672.6 4675.6 0.43
15590 15600 4751.8 4754.9 8
15780 15790 4809.7 4812.8 0.00
16070 16080 4898.1 4901.2
unused
unused
unused
unused
unused
Am.
AnalysisSample Depth (ft) Sample Depth (m)
Am.
Am.
Pyrolysis
unused
unused
unused
unused
unused
unused
unused
unused
unused
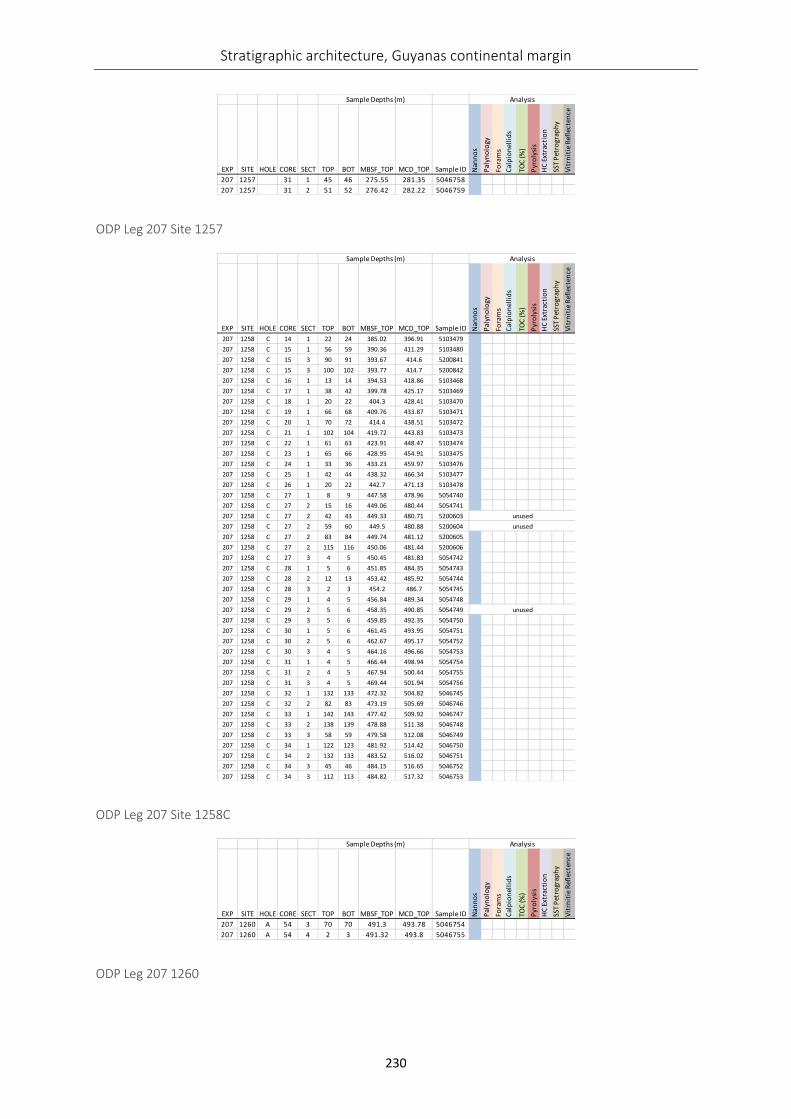
Stratigraphic architecture, Guyanas continental margin
230
ODP Leg 207 Site 1257
ODP Leg 207 Site 1258C
ODP Leg 207 1260
EXP SITE HOLE CORE SECT TOP BOT MBSF_TOP MCD_TOP Sample ID Nan
no
s
Pal
yno
logy
Fora
ms
Cal
pio
nel
lid
s
TOC
(%)
Pyr
oly
sis
HC
Ext
ract
ion
SST
Pet
rogr
aph
y
Vit
rnit
ie R
efle
cten
ce
207 1257 31 1 45 46 275.55 281.35 5046758
207 1257 31 2 51 52 276.42 282.22 5046759
Sample Depths (m) Analysis
EXP SITE HOLE CORE SECT TOP BOT MBSF_TOP MCD_TOP Sample ID Nan
no
s
Pal
yno
logy
Fora
ms
Cal
pio
nel
lid
s
TOC
(%)
Pyr
oly
sis
HC
Ext
ract
ion
SST
Pet
rogr
aph
y
Vit
rnit
ie R
efle
cten
ce
207 1258 C 14 1 22 24 385.02 396.91 5103479
207 1258 C 15 1 56 59 390.36 411.29 5103480
207 1258 C 15 3 90 91 393.67 414.6 5200841
207 1258 C 15 3 100 102 393.77 414.7 5200842
207 1258 C 16 1 13 14 394.53 418.86 5103468
207 1258 C 17 1 38 42 399.78 425.17 5103469
207 1258 C 18 1 20 22 404.3 428.41 5103470
207 1258 C 19 1 66 68 409.76 433.87 5103471
207 1258 C 20 1 70 72 414.4 438.51 5103472
207 1258 C 21 1 102 104 419.72 443.83 5103473
207 1258 C 22 1 61 63 423.91 448.47 5103474
207 1258 C 23 1 65 66 428.95 454.91 5103475
207 1258 C 24 1 33 36 433.23 459.97 5103476
207 1258 C 25 1 42 44 438.32 466.34 5103477
207 1258 C 26 1 20 22 442.7 471.13 5103478
207 1258 C 27 1 8 9 447.58 478.96 5054740
207 1258 C 27 2 15 16 449.06 480.44 5054741
207 1258 C 27 2 42 43 449.33 480.71 5200603
207 1258 C 27 2 59 60 449.5 480.88 5200604
207 1258 C 27 2 83 84 449.74 481.12 5200605
207 1258 C 27 2 115 116 450.06 481.44 5200606
207 1258 C 27 3 4 5 450.45 481.83 5054742
207 1258 C 28 1 5 6 451.85 484.35 5054743
207 1258 C 28 2 12 13 453.42 485.92 5054744
207 1258 C 28 3 2 3 454.2 486.7 5054745
207 1258 C 29 1 4 5 456.84 489.34 5054748
207 1258 C 29 2 5 6 458.35 490.85 5054749
207 1258 C 29 3 5 6 459.85 492.35 5054750
207 1258 C 30 1 5 6 461.45 493.95 5054751
207 1258 C 30 2 5 6 462.67 495.17 5054752
207 1258 C 30 3 4 5 464.16 496.66 5054753
207 1258 C 31 1 4 5 466.44 498.94 5054754
207 1258 C 31 2 4 5 467.94 500.44 5054755
207 1258 C 31 3 4 5 469.44 501.94 5054756
207 1258 C 32 1 132 133 472.32 504.82 5046745
207 1258 C 32 2 82 83 473.19 505.69 5046746
207 1258 C 33 1 142 143 477.42 509.92 5046747
207 1258 C 33 2 138 139 478.88 511.38 5046748
207 1258 C 33 3 58 59 479.58 512.08 5046749
207 1258 C 34 1 122 123 481.92 514.42 5046750
207 1258 C 34 2 132 133 483.52 516.02 5046751
207 1258 C 34 3 45 46 484.15 516.65 5046752
207 1258 C 34 3 112 113 484.82 517.32 5046753
AnalysisSample Depths (m)
unused
unused
unused
EXP SITE HOLE CORE SECT TOP BOT MBSF_TOP MCD_TOP Sample ID Nan
no
s
Pal
yno
logy
Fora
ms
Cal
pio
nel
lid
s
TOC
(%)
Pyr
oly
sis
HC
Ext
ract
ion
SST
Pet
rogr
aph
y
Vit
rnit
ie R
efle
cten
ce
207 1260 A 54 3 70 70 491.3 493.78 5046754
207 1260 A 54 4 2 3 491.32 493.8 5046755
Sample Depths (m) Analysis
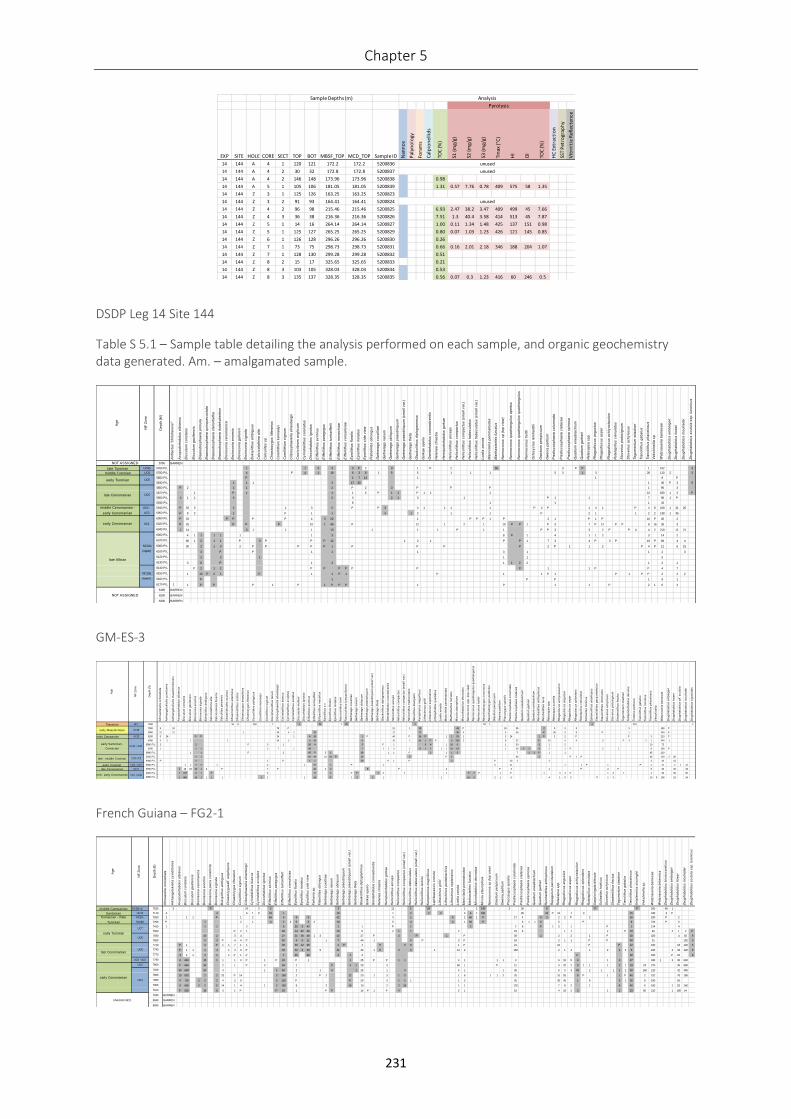
Chapter 5
231
DSDP Leg 14 Site 144
Table S 5.1 – Sample table detailing the analysis performed on each sample, and organic geochemistry data generated. Am. – amalgamated sample.
GM-ES-3
French Guiana – FG2-1
EXP SITE HOLE CORE SECT TOP BOT MBSF_TOP MCD_TOP Sample ID Nan
no
s
Pal
yno
logy
Fora
ms
Cal
pio
nel
lid
s
TOC
(%)
S1 (m
g/g)
S2 (m
g/g)
S3 (m
g/g)
Tmax
(°C
)
HI
OI
TOC
(%)
HC
Ext
ract
ion
SST
Pet
rogr
aph
y
Vit
rnit
ie R
efle
cten
ce
14 144 A 4 1 120 121 172.2 172.2 5200836
14 144 A 4 2 30 32 172.8 172.8 5200837
14 144 A 4 2 146 148 173.96 173.96 5200838 0.98
14 144 A 5 1 105 106 181.05 181.05 5200839 1.31 0.57 7.76 0.78 409 575 58 1.35
14 144 Z 3 1 125 126 163.25 163.25 5200823
14 144 Z 3 2 91 93 164.41 164.41 5200824
14 144 Z 4 2 96 98 215.46 215.46 5200825 6.93 2.47 38.2 3.47 409 499 45 7.66
14 144 Z 4 3 36 38 216.36 216.36 5200826 7.51 1.3 40.4 3.58 414 513 45 7.87
14 144 Z 5 1 14 16 264.14 264.14 5200827 1.00 0.11 1.34 1.48 425 137 151 0.98
14 144 Z 5 1 125 127 265.25 265.25 5200829 0.80 0.07 1.03 1.23 426 121 145 0.85
14 144 Z 6 1 126 128 296.26 296.26 5200830 0.26
14 144 Z 7 1 73 75 298.73 298.73 5200831 0.66 0.16 2.01 2.18 346 188 204 1.07
14 144 Z 7 1 128 130 299.28 299.28 5200832 0.51
14 144 Z 8 2 15 17 325.65 325.65 5200833 0.21
14 144 Z 8 3 103 105 328.03 328.03 5200834 0.53
14 144 Z 8 3 135 137 328.35 328.35 5200835 0.56 0.07 0.3 1.23 416 60 246 0.5
unused
Sample Depths (m) Analysis
Pyrolysis
unused
unused
Ag
e
NF
Zo
ne
De
pth
(M
)
An
fra
ctu
s "
sh
ilo
he
ns
is"
Ax
op
od
orh
ab
du
s a
lbia
nu
s
Bis
cu
tum
co
ns
tan
s
Bis
cu
tum
ga
ult
en
sis
Bra
aru
do
sp
ha
era
pri
mu
la
Bra
aru
do
sp
ha
era
qu
inq
ue
co
sta
ta
Bra
aru
do
sp
ha
era
ste
no
rhe
tha
Bra
aru
do
sp
ha
era
do
de
ka
he
dro
n
Bro
ins
on
ia c
en
om
an
ica
Bro
ins
on
ia e
no
rmis
Bro
ins
on
ia g
all
ois
ii
Bro
ins
on
ia s
ign
ata
Bu
kry
lith
us
am
big
uu
s
Ca
lcic
ala
thin
a a
lta
Ca
lcu
lite
s s
p.
Ch
ias
toz
yg
us
lit
tera
riu
s
Co
roll
ith
ion
ke
nn
ed
yi
Co
roll
ith
ion
sig
nu
m
Cri
bro
sp
ha
ere
lla
eh
ren
be
rgii
Cru
cic
rib
rum
an
gli
cu
m
Cy
lin
dra
lith
us
co
ron
atu
s
Dis
co
rha
bd
us
ig
no
tus
Eif
fell
ith
us
ex
imiu
s
Eif
fell
ith
us
pa
rag
og
us
Eif
fell
ith
us
tu
rris
eif
feli
i
Eif
fell
ith
us
mo
ne
ch
iae
Eif
fell
ith
us
vo
ns
ali
sia
e
Ep
roli
thu
s f
lora
lis
Ep
roli
thu
s m
ora
tus
Ep
roli
thu
s s
ide
vie
w
Fla
be
llit
es
ob
lon
gu
s
Ga
rtn
era
go
co
xa
llia
e
Ga
rtn
era
go
na
nu
m
Ga
rtn
era
go
ob
liq
uu
m
Ga
rtn
era
go
pra
eo
bli
qu
um
Ga
rtn
era
go
pra
eo
bli
qu
um
(s
ma
ll v
ar.
)
Ga
rtn
era
go
th
eta
Gla
uk
oli
thu
s d
iplo
gra
mm
us
Go
rka
e o
pe
rio
Gra
nta
rha
bd
us
co
ron
ad
ve
nti
s
He
len
ea
ch
ias
tia
He
mip
od
orh
ab
du
s g
ork
ae
He
lic
oli
thu
s a
nc
ep
s
He
lic
oli
thu
s c
om
pa
ctu
s
He
lic
oli
thu
s c
om
pa
ctu
s (
sm
all
va
r.)
He
lic
oli
thu
s t
rab
ec
ula
tus
He
lic
oli
thu
s t
rab
ec
ula
tus
(s
ma
ll v
ar.
)
Lo
rdia
xe
no
ta
Ma
niv
ite
lla
pe
mm
ato
ide
a
Ma
rth
as
teri
tes
fu
rca
tus
Na
nn
oc
on
us
sp
(to
p v
iew
)
Na
nn
oc
on
us
qu
ad
ria
ng
ulu
s a
pe
rtu
s
Na
nn
oc
on
us
qu
ad
ria
ng
ulu
s q
ua
dri
an
gu
lus
Na
nn
oc
on
us
tru
itti
Oc
toc
yc
lus
re
inh
ard
tii
Ora
str
um
pe
rsp
icu
um
Ow
en
ia p
art
itu
m
Pre
dis
co
sp
ha
era
co
lum
na
ta
Pre
dis
co
sp
ha
era
cre
tac
ea
Pre
dis
co
sp
ha
era
sp
ino
sa
Qu
ad
rum
en
ea
bra
ch
ium
Qu
ad
rum
ga
rtn
eri
Re
tec
ap
sa
sp
p.
Rh
ag
od
isc
us
an
gu
stu
s
Rh
ag
od
isc
us
as
pe
r
Rh
ag
od
isc
us
ac
hly
os
tau
rio
n
Ro
tela
pil
lus
cre
nu
latu
s
Sto
ve
riu
s p
roto
sig
nu
m
Sto
ve
riu
s a
ch
ylo
su
s
Te
gu
me
ntu
m s
tra
dn
eri
Tra
no
lith
us
ga
ba
lus
Tra
no
lith
us
ph
ac
elo
su
s
Ve
ks
hin
ell
a s
p.
Wa
tzn
au
eri
a b
arn
es
ae
Ze
ug
rha
bd
otu
s e
mb
erg
eri
Ze
ug
rha
bd
otu
s h
ow
ei
Ze
ug
rha
bd
otu
s m
ou
lla
de
i
Ze
ug
rha
bd
otu
s s
cu
tula
ss
p.
turo
nic
us
5750 BARREN
late Turonian UC9b 5760 P/L 1 1 3 3 3 P 2 3 1 P 2 50 3 P P 1 102 3
middle Turonian UC8 5780 P/L 4 P 4 1 18 6 3 8 1 5 5 1 1 1 5 3 1 3 26 110 2 2
5800 P/L P 1 7 13 1 1 9 P
5830 P/L 1 1 1 2 17 30 1 45 P 3 5
5850 P/L P 2 1 1 2 P 2 3 P P P 1 90 3
5870 P/L 1 P 1 1 1 5 P 1 1 P 1 1 1 15 180 1 2 P
5900 P/L 4 1 1 4 2 3 2 1 3 1 P 1 1 7 96 1 P
5930 P/L 8 1 1 1 42
5940 P/L P 33 3 2 1 3 2 P P 3 4 1 1 1 1 P 2 P 1 4 1 P 4 8 240 1 21 20
5950 P/L P 8 2 1 P 1 1 4 1 2 1 1 P 2 1 1 2 2 138 1 36
6000 P/L P 33 P P P P 4 3 22 1 P P P 1 P 2 1 P 1 P 16 P 45 2
6020 P/L P 25 P P P 10 1 45 P 12 1 2 1 10 P P 1 P 3 7 P 12 P P 8 16 30 3
6040 P/L 1 14 3 1 1 1 13 1 1 1 P 1 1 P P 3 3 2 P P 4 4 2 210 11 21
6060 P/L 4 1 1 1 1 1 1 3 8 P 1 4 1 1 2 3 14 2
6070 P/L 60 1 2 1 1 P 3 P P P 12 1 2 1 P P 1 7 3 4 P 3 P 16 P 96 4 4
6080 P/L 30 2 1 3 2 P P P P P 1 P P P P 2 P 1 1 2 P 4 P 12 6 15
6100 P/L 3 P P 1 1 1 3 1 1 2 3
6120 P/L 2 2 1 1 1 5
6130 P/L 3 8 P 1 3 1 1 2 2 1 2 1
6140 P/L P 2 1 2 P P P P P P P 1 1 P P 4 7
6150 P/L 1 10 P 2 1 P 1 1 P 1 P 1 1 P 1 P 1 P P 2 4 2
6160 P/L P 1 P P 1 9 1
6170 P/L 1 1 P P P 1 P 1 P P P 1 P 1 1 P 2 1 6 4
6190 BARREN
6200 BARREN
6300 BARREN
NOT ASSIGNED
UC5
UC2 -
UC3
middle Cenomanian -
early Cenomanian
late Cenomanian
NOT ASSIGNED
late Albian
UC1early Cenomanian
UC6early Turonian
NC10a
(upper)
NC10a
(lower)
Ag
e
NF
Zo
ne
De
pth
(ft
)
Ah
mu
ell
ere
lla
oc
tora
dia
ta
Ark
ha
ng
els
kie
lla
cy
mif
orm
is
Ark
ha
ng
els
kie
lla
ma
as
tric
hti
en
sis
Ax
op
od
orh
ab
du
s a
lbia
nu
s
Bis
cu
tum
co
ns
tan
s
Bis
cu
tum
ga
ult
en
sis
Bro
ins
on
ia e
no
rmis
Bri
on
so
nia
sig
na
ta
Bu
kry
lith
us
am
big
uu
s
Ca
lcic
ala
thin
a a
lta
Ca
lcio
so
len
ia f
os
sil
is
Ca
lcu
lite
s p
erc
ern
is
Ce
rato
lith
oid
es
ac
ule
us
Ch
ias
mo
lith
us
ed
en
tulu
s
Ch
ias
mo
lith
us
so
litu
s
Ch
ias
toz
yg
us
am
pip
ho
ns
Ch
ias
toz
yg
us
lit
tera
riu
s
Co
cc
oli
thu
s p
ela
gic
us
Co
roll
ith
ion
ke
nn
ed
yi
Co
roll
ith
ion
sig
nu
m
Cru
cip
lac
oli
thu
s t
en
uis
Cri
bro
sp
ha
ere
lla
eh
ren
be
rgii
Cy
lin
dra
lith
us
bia
rcu
s
Cy
lin
dra
lith
us
sc
ulp
tus
Cy
lin
dra
lith
us
se
rra
tus
Dis
co
as
ter
mo
hle
ri
Dis
co
rha
bd
us
ig
no
tus
Eif
fell
ith
us
ex
imiu
s
Eif
fell
ith
us
tu
rris
eif
feli
i
Ell
ips
oli
thu
s m
ac
ell
us
Ep
roli
thu
s s
.v
Ep
roli
thu
s f
lora
lis
Ep
roli
thu
s m
ora
tus
Fa
sc
icu
lith
us
to
nii
Fa
sc
icu
lith
us
ty
mp
an
ifo
rmis
Ga
rtn
era
go
co
xa
llia
e
Ga
rtn
era
go
na
nu
m
Ga
rtn
era
go
ob
liq
uu
m
Ga
rtn
era
go
pra
eo
bli
qu
um
Ga
rtn
era
go
pra
eo
bli
qu
um
(s
ma
ll v
ar.
)
Ga
rtn
era
go
th
eta
Gla
uk
oli
thu
s d
iplo
gra
mm
us
Gra
nta
rha
bd
us
co
ron
ad
ve
nti
s
He
lic
oli
thu
s a
nc
ep
s
He
lic
oli
thu
s c
om
pa
ctu
s
He
lic
oli
thu
s c
om
pa
ctu
s (
sm
all
va
r.)
He
lic
oli
thu
s t
rab
ec
ula
tus
He
lio
lith
us
kle
inp
ell
ii
Ka
mp
tne
riu
s m
ag
nif
icu
s
Lit
ha
str
un
us
gri
llii
Lit
ha
str
un
us
se
pte
na
riu
s
Lit
hra
ph
idit
es
qu
ad
ratu
s
Lo
rdia
xe
no
ta
Ma
niv
ite
lla
pe
mm
ato
ide
a
Ma
rth
as
teri
tes
fu
rca
tus
Mic
ula
sta
uro
ph
ora
Mic
rorh
ab
du
lus
de
co
ratu
s
Na
nn
oc
on
us
sp
p.
(to
p v
iew
)
Na
nn
oc
on
us
qu
ad
ria
ng
ulu
s q
ua
dri
an
gu
lus
Na
nn
oc
on
us
tru
itti
i
Ne
oc
hia
sto
zy
gu
s c
on
cin
nu
s
Ne
oc
hia
sto
zy
gu
s p
erf
ec
tus
Ora
str
um
pe
rsp
icu
um
Ow
en
ia p
art
itu
m
Pla
co
zy
gu
s s
pir
ali
s
Pre
dis
co
sp
ha
era
co
lum
na
ta
Pre
dis
co
sp
ha
era
cre
tac
ea
Qu
ad
rum
en
ea
bra
ch
ium
Qu
ad
rum
ga
rtn
eri
Qu
ad
rum
oc
tob
rac
hiu
m
Re
inh
ard
tite
s a
nth
op
ho
rus
Re
inh
ard
tite
s l
ev
is
Re
tec
ap
sa
sp
p.
Re
tec
ap
sa
su
rire
lla
Rh
ag
od
isc
us
ac
hly
os
tau
rio
n
Rh
ag
od
isc
us
an
gu
stu
s
Rh
ag
od
isc
us
as
pe
r
Rh
ag
od
isc
us
sp
len
de
ns
Ro
tela
pil
lus
cre
nu
latu
s
So
lla
sit
es
ho
rtic
us
Sp
he
no
lith
us
an
arr
ho
pu
s
Sta
uro
lith
ite
s g
au
so
rhe
thiu
m
Sta
uro
lith
ite
s i
mb
ric
atu
s
Sto
ve
riu
s a
ch
ylo
su
s
Sto
ve
riu
s p
roto
sig
nu
m
Str
ad
ne
rlit
hu
s f
rac
tus
Te
gu
me
ntu
m s
tra
dn
eri
Te
tra
po
do
rha
bd
us
de
co
rus
To
we
ius
pe
rtu
su
s
Tra
no
lith
us
ga
ba
lus
Tra
no
lith
us
min
imu
s
Tra
no
lith
us
ph
ac
elo
su
s
Ve
ks
hin
ell
a
Wa
tzn
au
eri
a b
arn
es
ae
Ze
ug
rha
bd
otu
s e
mb
erg
eri
Ze
ug
rha
bd
otu
s h
ow
ei
Ze
ug
rha
bd
otu
s a
ff.
sc
utu
la
Ze
ug
rha
bd
otu
s m
ou
lla
de
i
Ze
ug
rha
bd
otu
s s
igm
oid
es
Thanetian NP7 7600 16 8 150 1 4 24 1 30 4 18 1 4 210 1
7800 5 10 78 P 21 1 18 45 P 15 35 2 9 3 3 3 180 P
8000 12 12 1 30 4 2 10 12 72 30 4 5 36 P 36 3 8 P 1 240 P
early Campanian UC13 8200 5 24 P P 24 1 4 18 1 P 48 P 36 P 1 1 55 1 3 24 1 P 2 2 P P 3 210 P
8400 4 3 1 1 54 2 3 10 6 16 1 54 1 P P 5 200 2 8 32 P 10 4 4 3 P 3 2 1 240 1
8580 P/L 2 2 P 3 1 36 4 3 P 1 8 4 1 16 6 1 30 3 1 2 10 72
8780 1 1 1 2 7 1 48 7 1 1 3 1 8 1 1 1 1 10 54 1 30 1 1 3 2 1 P 2 1 8 160 P
8980 P/L 1 1 P 2 45 P 5 1 36 1 1 P 1 1 1 3 7 1 1 P 1 1 45 210
9200 P/L 2 1 10 14 10 16 P 14 5 P 1 60 1 P 1 P 36 120 2 90
9400 P/L P 2 2 P 1 1 26 P 1 P 2 P 20 2 2 3 40 10
early Turonian UC6 - UC7 9580 P/L 1 1 1 2 1 3 1 27 1 P 1 5 21 1 1 P 1 P 2 21 2 1 12
late Cenomanian UC 5 9790 P/L 1 15 15 13 1 2 P 7 P 21 2 2 8 P 2 P 3 1 P 2 P 5 30 33 15
9920 P/L 1 370 6 1 P 3 8 1 P P 1 4 1 1 8 2 P 1 P 1 4 4 P 1 3 1 4 96 30 95
9950 P/L 1 480 14 1 1 1 1 1 1 1 14 P 1 2 2 1 1 16 3 2 1 6 4 1 8 3 P 1 3 10 5 108 18 24mid - early Cenomanian UC2- UC3a
early Santonian -
Coniacian
late - middle Turonian
early Maastrichtian
UC8-UC9
UC10- UC11
UC18
Ag
e
NF
Zo
ne
De
pth
(ft
)
Ah
mu
ere
lla
oc
tora
dia
ta
Ark
ha
ng
els
kie
lla
cy
mb
ifo
rmis
Ax
op
od
orh
ab
du
s a
lbia
nu
s
Bis
cu
tum
co
ns
tan
s
Bis
cu
tum
ga
ult
en
sis
Bro
ins
on
ia c
en
om
an
ica
Bro
ins
on
ia e
no
rmis
Bro
ins
on
ia p
arc
a c
on
str
icta
Bro
ins
on
ia s
ign
ata
Bu
kry
lith
us
am
big
uu
s
Ch
ias
toz
yg
us
aff
. a
mp
hip
on
s
Ch
ias
toz
yg
us
lit
tera
riu
s
Co
roll
ith
ion
sig
nu
m
Cri
bro
sp
ha
ere
lla
eh
ren
be
rgii
Cy
lin
dra
lith
us
bia
rcu
s
Cy
lin
dra
lith
us
sc
ulp
tus
Dis
co
rha
bd
us
ig
no
tus
Eif
fell
ith
us
ex
imiu
s
Eif
fell
ith
us
pa
rag
og
us
Eif
fell
ith
us
tu
rris
eif
feli
i
Eif
fell
ith
us
vo
ns
ali
sia
e
Ep
roli
thu
s f
lora
lis
Ep
roli
thu
s m
ora
tus
Ep
roli
thu
s s
ide
vie
w
Fa
rha
nia
sp
.
Fla
be
llit
es
ob
lon
gu
s
Ga
rtn
era
go
co
xa
llia
e
Ga
rtn
era
go
na
nu
m
Ga
rtn
era
go
ob
liq
uu
m
Ga
rtn
era
go
pra
eo
bli
qu
um
Ga
rtn
era
go
pra
eo
bli
qu
um
(s
ma
ll v
ar.
)
Ga
rtn
era
go
th
eta
Gla
uk
oli
thu
s d
iplo
gra
mm
us
Go
rka
e o
pe
rio
Gra
nta
rha
bd
us
co
ron
ad
ve
nti
s
He
len
ea
ch
ias
tia
He
mip
od
orh
ab
du
s g
ork
ae
He
lic
oli
thu
s a
nc
ep
s
He
lic
oli
thu
s c
om
pa
ctu
s
He
lic
oli
thu
s c
om
pa
ctu
s (
sm
all
va
r.)
He
lic
oli
thu
s t
rab
ec
ula
tus
He
lic
oli
thu
s t
rab
ec
ula
tus
(s
ma
ll v
ar.
)
He
lic
oli
thu
s l
ec
kie
i
Ka
mp
tne
riu
s m
ag
nif
icu
s
La
pid
ea
ca
ss
is c
orn
uta
Lit
ha
str
inu
s g
rill
ii
Lit
ha
str
inu
s p
en
tab
rac
hiu
s
Lit
ha
str
inu
s s
ep
ten
ari
us
Lo
rdia
xe
no
ta
Ma
niv
ite
lla
pe
mm
ato
ide
a
Ma
rth
as
teri
tes
fu
rca
tus
Mic
rorh
ab
du
lus
de
co
ratu
s
Mic
ula
sta
uro
ph
ora
Na
nn
oc
on
us
sp
(to
p v
iew
)
Ora
str
um
pe
rsp
icu
um
Ow
en
ia p
art
itu
m
Pla
co
zy
gu
s s
pir
ali
s
Pre
dis
co
sp
ha
era
co
lum
na
ta
Pre
dis
co
sp
ha
era
cre
tac
ea
Pre
dis
co
sp
ha
era
sp
ino
sa
Qu
ad
rum
en
ea
bra
ch
ium
Qu
ad
rum
ga
rtn
eri
Re
inh
ard
tite
s a
nth
op
ho
rus
Re
pa
gu
lum
pa
rvid
en
tatu
m
Re
tec
ap
sa
sp
p.
Rh
ag
od
isc
us
an
gu
stu
s
Rh
ag
od
isc
us
as
pe
r
Rh
ag
od
isc
us
ac
hly
os
tau
rio
n
Rh
ag
od
isc
us
sp
len
de
ns
Ro
tela
pil
lus
cre
nu
latu
s
Sa
ep
iov
irg
ata
bif
eru
la
So
lla
sit
es
ho
rtic
us
Sto
ve
riu
s a
ch
ylo
su
s
Str
ad
ne
rlit
hu
s f
rac
tus
Te
gu
me
ntu
m s
tra
dn
eri
Tra
no
lith
us
ga
ba
lus
Tra
no
lith
us
ph
ac
elo
su
s
Un
ipla
na
riu
s s
iss
ing
hii
Ve
ks
hin
ell
a s
p.
Wa
tzn
au
eri
a b
arn
es
ae
Wa
tzn
au
eri
a b
rita
nn
ica
Ze
ug
rha
bd
otu
s b
icre
sc
en
tic
us
Ze
ug
rha
bd
otu
s e
mb
erg
eri
Ze
ug
rha
bd
otu
s h
ow
ei
Ze
ug
rha
bd
otu
s m
ou
lla
de
i
Ze
ug
rha
bd
otu
s s
cu
tula
ss
p.
turo
nic
us
middle Campanian UC15c-d 7020 3 P 24 3 2 3 12 1 24 1 2 140 3 36 6 P P 260 48 1
Santonian UC12 7110 4 4 6 1 9 18 1 18 1 2 2 2 3 4 1 180 39 24 P 16 1 3 15 240 3 P
7260 2 1 1 P 1 2 66 3 3 5 42 3 1 5 2 66 1 P 17 4 5 2 2 2 P 2 16 180 P 2
7290 P 1 2 1 3 2 3 5 5 2 18 5 4 3 1 30 P 3 1 1 6 5 P 9 720 P 5
7410 1 1 1 2 6 35 5 42 1 1 P 1 2 2 8 P 1 3 1 P 1 124 4
7500 P 2 1 39 14 82 96 16 5 2 1 1 2 18 6 1 1 2 P 10 45 2 1 2 P
7590 10 2 3 4 27 21 36 48 1 3 12 27 P 2 P 1 P 36 1 2 2 1 P 30 320 4 82 9
7650 5 3 P 4 4 P 50 4 5 21 1 7 40 1 5 P 3 P 24 2 1 1 P P 40 51 152 3
7710 P 1 2 P 1 1 7 1 1 39 30 12 96 2 P 4 P 5 8 1 P 21 10 P P 12 190 18 120 5
7740 P 1 1 1 4 1 4 3 P 30 42 6 60 5 21 42 1 P 4 6 1 12 2 160 2 1 4 1 2 2 3 6 180 2 33 120 5
7770 3 2 1 4 1 1 P 1 P 4 90 92 2 1 3 P 30 160 P 94 8
UC3 -UC4 7790 6 660 15 1 1 1 3 P 1 P 40 P 1 1 25 P P 1 1 4 1 1 1 3 6 15 5 3 1 3 47 330 1 3 35 630
UC2 7800 P 640 30 2 1 P 3 54 2 P 3 1 25 3 60 1 P 12 3 20 2 3 1 1 1 2 1 24 24 270 35 580
7840 30 690 20 3 1 1 50 2 1 6 1 25 1 3 4 1 1 35 5 3 3 40 2 1 1 1 2 30 160 210 42 450
7860 10 620 2 2 25 P 14 3 160 2 P 2 12 20 1 3 1 5 1 6 1 1 2 20 10 55 8 P 1 1 P 40 2 102 78 180
7880 9 720 2 2 2 4 2 9 3 125 P P 20 3 1 1 1 1 2 35 30 45 1 8 3 1 35 6 190 50
7900 8 660 2 2 5 14 1 4 1 2 160 8 2 14 10 2 2 18 1 1 120 7 8 2 1 8 45 6 180 1 55 160
7910 P 630 16 6 3 1 P P 30 1 P P 15 P 1 P 4 2 1 18 4 18 2 3 1 1 33 80 210 1 180 54
7940 BARREN
8040 BARREN
8090 BARREN
early Cenomanian
late CenomanianUC5
UC1
UNASSIGNED
early Turonian
Coniacian - ?late
Turonian
UC10-
?UC9C
UC6
UC7
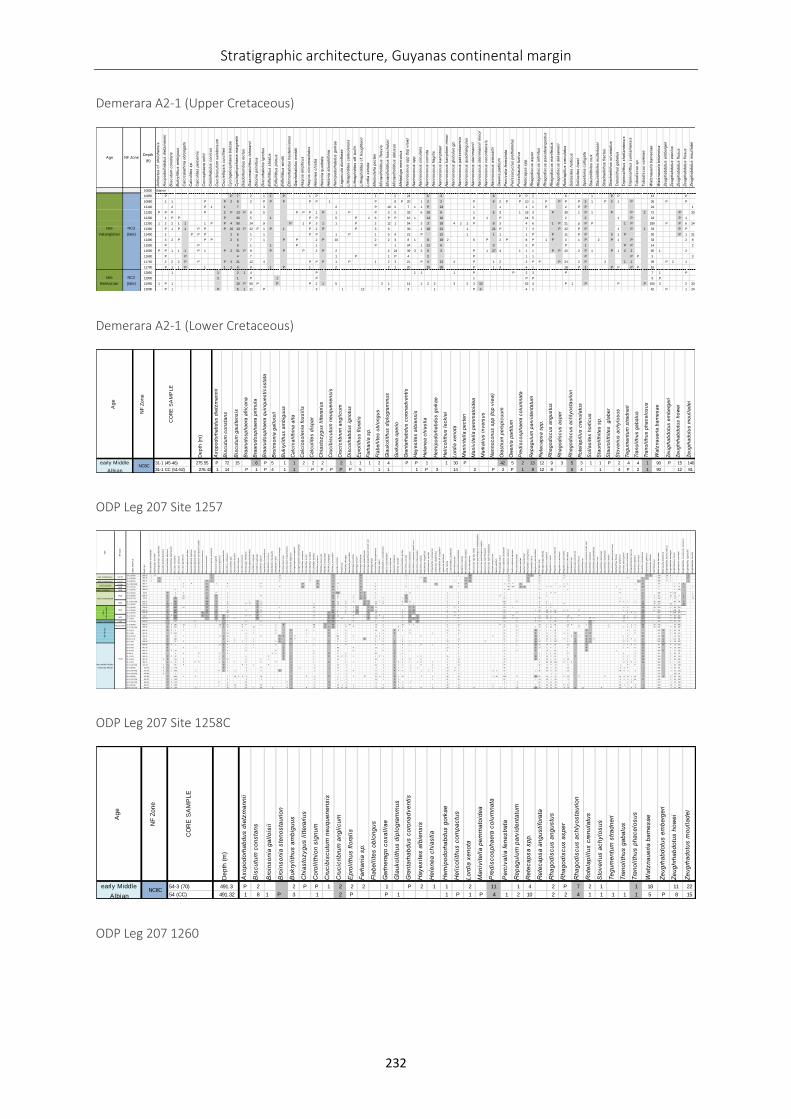
Stratigraphic architecture, Guyanas continental margin
232
Demerara A2-1 (Upper Cretaceous)
Demerara A2-1 (Lower Cretaceous)
ODP Leg 207 Site 1257
ODP Leg 207 Site 1258C
ODP Leg 207 1260
Age NF ZoneDepth
(ft)
An
fra
ctu
s c
f. s
hil
oh
en
sis
Ax
op
od
orh
ab
du
s d
ietz
ma
nn
ii
Bis
cu
tum
co
ns
tan
s
Bu
kry
lith
us
am
big
uu
s
Ca
lcic
ala
thin
a o
blo
ng
ata
Ca
lcu
lite
s s
p.
Ca
lcu
lite
s p
erc
ern
is
Co
nu
sp
ha
era
ro
thii
Cre
tarh
ab
du
s c
on
icu
s
Cru
cib
isc
utu
m s
ale
bro
su
m
Cru
cie
llip
sis
cu
vil
lie
ri
Cy
cla
ge
los
ph
ae
ra b
rez
ae
Cy
cla
ge
lop
sh
ae
ra m
arg
ere
lii
Dia
do
rho
mb
us
re
ctu
s
Dia
zo
ma
toli
thu
s l
eh
ma
nii
Dil
om
a p
rim
itiv
a
Dis
co
rha
bd
us
ig
no
tus
Eif
fell
ith
us
str
iatu
s
Eif
fell
ith
us
pri
mu
s
Eif
fell
ith
us
win
dii
Eth
mo
rha
bd
us
ha
ute
riv
ian
us
Gra
nta
rha
bd
us
me
dd
ii
Ha
qiu
s e
llip
tic
us
Ha
qiu
s c
irc
um
rad
iatu
s
He
len
ea
ch
isti
a
He
len
ia q
ua
dra
ta
He
len
ia s
tau
roli
thin
a
He
mip
od
orh
ab
du
s g
ork
ae
La
gu
nc
ula
do
roth
ea
e
Lit
hra
ph
idit
es
ca
rnio
len
sis
Lit
hra
ph
idit
es
aff
. b
oll
ii
Lit
hra
ph
idit
es
cf.
ho
ug
hto
nii
Lo
rdia
xe
no
ta
Ma
niv
ite
lla
pe
cte
n
Mic
ran
tho
lith
us
?b
rev
is
Mic
ran
tho
lith
us
ho
sc
hu
lzii
Mic
ran
tho
lith
us
ob
tus
us
Me
tad
og
a m
erc
uri
us
Na
nn
oc
on
us
sp
p (
top
vie
w)
Na
nn
oc
on
us
sp
p.
Na
nn
oc
on
us
cir
cu
lari
s
Na
nn
oc
on
us
co
rnu
ta
Na
nn
oc
on
us
fra
gil
is
Na
nn
oc
on
us
ka
mp
tne
ri
Na
nn
oc
on
us
ka
mp
tne
ri m
ino
r
Na
nn
oc
on
us
glo
bu
lus
gp
.
Na
nn
oc
on
us
pa
ks
en
tae
ns
is
Na
nn
oc
on
us
qu
ad
ria
ng
ulu
s
Na
nn
oc
on
us
ste
inm
an
nii
Na
nn
oc
on
us
ste
inm
an
nii
min
or
Na
nn
oc
on
us
vo
co
nti
en
sis
Na
nn
oc
on
us
wa
ss
all
ii
Ow
en
ia p
art
itu
m
Pe
rciv
ali
a f
en
es
tra
ta
Pe
ris
so
cy
clu
s p
leth
otr
etu
s
Pic
ke
lha
ub
e f
urt
iva
Re
tec
ap
sa
sp
p.
Rh
ag
od
isc
us
as
pe
r
Rh
ag
od
isc
us
in
fin
itu
s
Rh
ag
od
isc
us
ps
eu
do
an
gu
stu
s
Rh
ag
od
isc
us
ma
nif
es
tus
Rh
ag
od
isc
us
de
ka
en
eli
i
Ro
tela
pil
lus
cre
nu
latu
s
So
lla
sit
es
ho
rtic
us
So
lla
sit
es
lo
we
i
Sp
ee
ton
ia c
oll
iga
ta
Sta
uro
lith
ite
s c
rux
Sta
uro
lith
ite
s m
utt
erl
os
ei
Str
ad
ne
rlit
hu
s f
rac
tus
Str
ad
ne
rlit
hu
s s
ilv
ara
diu
s
Tra
no
lith
us
ga
ba
lus
Tri
pin
na
lith
us
sh
etl
an
de
ns
is
Tri
pin
na
lith
us
su
rin
am
en
sis
Tu
bo
dis
cu
s s
p.
Tu
bo
dis
cu
s v
ere
na
e
Wa
tzn
au
eri
a b
arn
es
iae
Wa
tzn
au
eri
a b
rita
nn
ica
Ze
ug
rha
bd
otu
s e
mb
erg
eri
Ze
ug
rha
bd
otu
s e
rec
tus
Ze
ug
rha
bd
otu
s f
lux
us
Ze
ug
rha
bd
otu
s f
iss
us
Ze
ug
rha
bd
otu
s m
ou
lla
de
i
10820 Barren
10850 P P 7 2 1 1 P 1 P 1 2 24 5 4 6 P P 1 6 1 P P 13 P
10880 1 1 P P 2 8 2 P P P P P 1 P 8 P 20 1 2 2 P 8 2 P P 10 1 P P P P 2 1 P 2 1 P 36 P P
11190 2 P 1 1 7 3 2 P 10 2 7 1 1 P 24 1 1 1 1 P 2 P P 24 1
11250 P P P P 2 P 13 P 8 5 P P P 1 P 1 P P 3 5 33 6 10 6 1 5 3 1 18 3 P 30 1 P 1 P P 2 72 P 33
11290 1 P P P 30 5 1 P P 5 P 1 6 P P 10 1 14 10 9 1 P 14 5 2 2 1 P 24 P 1
11350 1 2 2 1 1 1 P P 4 90 24 9 P 1 P 3 1 1 P 2 12 1 54 3 3 18 4 2 2 P 8 3 4 6 1 P 21 p P P 1 P 180 P P 6 24
11390 P 1 P 1 P P P 10 13 P 22 P 1 P 1 P 2 P P 3 6 36 1 18 21 1 21 P 7 4 P 22 P P 1 P 1 33 P P
11450 1 P P P 2 6 1 1 P P 1 P 1 5 4 21 P 21 1 1 1 1 P P 11 P P 3 1 P 30 P 1 21
11490 3 2 P P P 2 6 7 1 P P 2 P 10 2 2 3 8 1 8 18 2 6 P 2 P 8 P 1 P 3 1 P 2 P 1 P 33 2 8
11550 P P 5 1 1 P 1 P 1 24 1 11 6 3 2 P P 1 P P 14 2
11590 P P 1 1 1 P 1 P 2 51 P 8 P P P 2 P 2 4 24 39 3 2 6 3 P 1 27 4 1 1 1 P P 22 2 P 1 P 1 2 2 60 1 2
11690 P P 4 7 1 P 1 P 4 2 P 1 1 P P P 3 3
11750 2 2 2 P P P 4 21 12 4 P P P 1 P 1 2 3 21 P 4 21 4 P 1 2 2 P P P 24 2 P 2 1 1 39 P 2 1
11790 P 1 1 P 1 1 1 4 8 1 P 1 2 2 1 20 15 30 P 1 3 4 1 18 P 2 P P P P 15
12850 1 1 2 1 4 P 1 1 1 P P 2 3 P 7 1 P
12900 2 1 P 1 P 1 P P 3 P
12990 1 P 1 10 P 60 P P P 2 1 5 2 1 14 1 2 2 3 2 3 10 52 4 P 1 P P P 160 3 2 30
13090 P 1 P 5 1 21 P 3 1 12 P 3 1 P 3 4 1 42 P 1 24
late
Valanginian
late
Berriasian
NC3
(late)
NC2
(late)
Ag
e
NF
Zo
ne
CO
RE
SA
MP
LE
De
pth
(m
)
Ax
op
od
orh
ab
du
s d
ietz
ma
nn
ii
Bis
cu
tum
co
ns
tan
s
Bis
cu
tum
ga
ult
en
sis
Bra
aru
do
sp
ha
era
afr
ica
na
Bra
aru
do
sp
ha
era
pri
mu
la
Bra
aru
do
sp
ha
era
qu
inq
ue
sti
co
sta
ta
Bro
ins
on
ia g
all
ois
ii
Bu
kry
lith
us
am
big
uu
s
Ca
lcic
ali
thin
a a
lta
Ca
lcio
so
len
ia f
os
sil
is
Ca
lcu
lite
s d
isp
ar
Ch
ias
toz
yg
us
lit
tera
riu
s
Cru
cib
isc
utu
m n
eu
qu
en
en
sis
Cru
cic
rib
rum
an
gli
cu
m
Dis
co
rha
bd
us
ig
no
tus
Ep
roli
thu
s f
lora
lis
Fa
rha
nia
sp
.
Fla
be
llit
es
ob
lon
gu
s
Gla
uk
oli
thu
s d
iplo
gra
mm
us
Go
rka
ea
op
eri
o
Gra
nta
rha
bd
us
co
ron
ad
ve
nti
s
Ha
ye
sit
es
alb
ien
sis
He
len
ea
ch
ias
tia
He
mip
od
orh
ab
du
s g
ork
ae
He
lic
oli
thu
s l
ec
kie
i
Lo
rdia
xe
no
ta
Ma
niv
ite
lla
pe
cte
n
Ma
niv
ite
lla
pe
mm
ato
ide
a
Ma
rka
liu
s i
nv
ers
us
Na
nn
oc
on
us
sp
p (
top
vie
w)
Ora
str
um
pe
rsp
icu
um
Ow
en
ia p
art
itu
m
Pre
dis
co
sp
ha
era
co
lum
na
ta
Re
pa
gu
lum
pa
rvid
en
tatu
m
Re
tec
ap
sa
sp
p.
Rh
ag
od
isc
us
an
gu
stu
s
Rh
ag
od
isc
us
as
pe
r
Rh
ag
od
isc
us
ac
hly
os
tau
rio
n
Ro
tela
pil
lus
cre
nu
latu
s
So
lla
sit
es
ho
rtic
us
Sta
uro
lith
ite
s s
p.
Sta
uro
lith
ite
s
gla
be
r
Sto
ve
riu
s a
ch
ylo
su
s
Te
gu
me
ntu
m s
tra
dn
eri
Tra
no
lith
us
ga
ba
lus
Tra
no
lith
us
ph
ac
elo
su
s
Wa
tzn
au
eri
a b
arn
es
ae
Ze
ug
rha
bd
otu
s e
mb
erg
eri
Ze
ug
hrh
ab
do
tus
ho
we
i
Ze
ug
rha
do
tus
mo
ull
ad
ei
31-1 (45-46) 275.55 P 72 15 6 P 5 1 1 2 2 2 2 1 1 1 2 4 P P 1 1 30 P 42 5 2 13 12 9 3 5 3 1 1 P 2 4 4 1 90 P 15 140
31-1 CC (51-52) 276.42 1 14 P 1 P 4 1 1 P P P P P 5 1 1 1 P 3 14 2 P 2 P 1 8 12 8 5 4 1 4 P 2 1 90 12 81
early Middle
Albian NC8C
Ag
e
NF
Zo
ne
CO
RE
SA
MP
LE
De
pth
(m
)
Ah
mu
ell
ere
lla
oc
tora
dia
ta
Am
ph
izy
gu
s b
roo
ks
ei
Ark
ha
ng
els
kie
lla
cy
mb
ifo
rmis
As
sip
etr
a t
ere
bro
de
nta
riu
s
Ax
op
od
orh
ab
du
s a
lbia
nu
s
Ax
op
od
orh
ab
du
s d
ietz
ma
nn
ii
Bis
cu
tum
co
ns
tan
s
Bis
cu
tum
co
ron
um
Bis
cu
tum
ga
ult
en
sis
Bra
aru
do
sp
ha
era
afr
ica
na
Bra
aru
do
sp
ha
era
big
elo
wi
Bra
aru
do
sp
ha
era
pri
mu
la
Bra
aru
do
sp
ha
era
qu
inq
ue
sti
co
sta
ta
Bro
ins
on
ia c
en
om
an
icu
s
Bro
ins
on
ia e
no
rmis
Bro
ins
on
ia p
arc
a c
on
str
icta
Bro
ins
on
ia s
ign
ata
Bro
ins
on
ia g
all
ois
ii
Bro
ins
on
ia s
ten
os
tau
rio
n
Bu
kry
lith
us
am
big
uu
s
Ca
lcic
ali
thin
a a
lta
Ca
lcio
so
len
ia f
os
sil
is
Ca
lcu
lite
s d
isp
ar
Ca
lcu
lite
s p
erc
ern
is
Ch
ias
toz
yg
us
lit
tera
riu
s
Ch
ias
toz
yg
us
pla
tyrh
eth
us
Co
roll
ith
ion
ex
igu
um
Co
roll
ith
ion
ke
nn
ed
yi
Co
roll
ith
ion
sig
nu
m
Cre
pid
oli
thu
s b
urw
ell
en
sis
Cre
tarh
ab
du
s c
on
icu
s
Cre
tarh
ab
du
s i
na
eq
ua
lis
Cre
tarh
ab
du
s l
ori
ei
Cri
bro
sp
ha
ere
lla
eh
ren
be
rgii
Cru
cib
isc
utu
m h
ay
i
Cru
cib
isc
utu
m n
eu
qu
en
en
sis
Cru
cic
rib
rum
an
gli
cu
m
Cy
cla
ge
los
ph
ae
ra m
arg
ere
lii
Cy
cla
ge
los
ph
ae
ra r
ota
cly
pe
ata
Cy
lin
dra
lith
us
co
ron
atu
s
Cy
lin
dra
lith
us
nu
du
s
Cy
lin
dra
lith
us
sc
ulp
tus
Dis
co
rha
bd
us
ig
no
tus
Eif
fell
ith
us
ex
imiu
s
Eif
fell
ith
us
ha
nc
oc
kii
Eif
feli
thu
s m
on
ec
hia
e
Eif
feli
thu
s p
ara
go
gu
s
Eif
fell
ith
us
tu
rris
eif
feli
i
Ep
roli
thu
s f
lora
lis
Fa
rha
nia
sp
.
Fla
be
llit
es
ob
lon
gu
s
Ga
ard
ere
lla
gra
nu
life
ra
Ga
rtn
era
go
co
xa
llia
e
Ga
rtn
era
go
na
nu
m
Ga
rtn
era
go
ob
liq
uu
m
Ga
rtn
era
go
pra
eo
bli
qu
um
Ga
rtn
era
go
pra
eo
bli
qu
um
(s
ma
ll v
ar.
)
Ga
rtn
era
go
th
eta
Gla
uk
oli
thu
s d
iplo
gra
mm
us
Go
rka
ea
op
eri
o
Gra
nta
rha
bd
us
co
ron
ad
ve
nti
s
Ha
qiu
s c
irc
um
rad
iatu
s
Ha
qiu
s e
llip
tic
us
Ha
ye
sit
es
alb
ien
sis
He
len
ea
ch
ias
tia
He
mip
od
orh
ab
du
s g
ork
ae
He
lic
oli
thu
s a
nc
ep
s
He
lic
oli
thu
s c
om
pa
ctu
s
He
lic
oli
thu
s c
om
pa
ctu
s (
sm
all
va
r.)
He
lic
oli
thu
s t
rab
ec
ula
tus
He
lic
oli
thu
s l
ec
kie
i
Ka
mp
tne
riu
s m
ag
nif
icu
s
La
pid
ea
ca
ss
is c
orn
uta
Lit
hra
ph
od
ite
s c
arn
iole
ns
is
Lit
ha
str
inu
s s
ep
ten
ari
us
Lit
hra
ph
idit
es
aff
. h
ou
gh
ton
ii
La
gu
nc
ula
do
roth
ea
e
Lo
rdia
xe
no
ta
Lu
cia
no
rha
bd
us
ma
lefo
rmis
Ma
niv
ite
lla
pe
cte
n
Ma
niv
ite
lla
pe
mm
ato
ide
a
Ma
rka
liu
s i
nv
ers
us
Mic
rorh
ab
du
lus
de
co
ratu
s
Mic
ula
sta
uro
ph
ora
Na
nn
oc
on
us
sp
p (
top
vie
w)
Na
nn
oc
on
us
qu
ad
ria
ng
ulu
s q
ua
dri
an
gu
lus
Na
nn
oc
on
us
qu
ad
ria
ng
ulu
s a
pe
rtu
s
Na
nn
oc
on
us
tru
itti
fre
qu
en
s
Na
nn
oc
on
us
tru
itti
re
cta
ng
ula
ris
Ora
str
um
pe
rsp
icu
um
Ow
en
ia p
art
itu
m
Pic
ke
lha
ub
e f
urt
iva
Pre
dis
co
sp
ha
era
co
lum
na
ta
Pre
dis
co
sp
ha
era
cre
tac
ea
Pre
dis
co
sp
ha
era
sp
ino
sa
Pe
rciv
ali
a f
en
es
tra
ta
Qu
ad
rum
ga
rtn
eri
Qu
ad
rum
in
term
ed
ium
Re
inh
ard
tite
s a
nth
op
ho
rus
Re
inh
ard
tite
s l
ev
is
Re
pa
gu
lum
pa
rvid
en
tatu
m
Re
tec
ap
sa
sp
p.
Re
tec
ap
sa
an
gu
sti
fora
ta
Rh
ag
od
isc
us
an
gu
stu
s
Rh
ag
od
isc
us
as
pe
r
Rh
ag
od
isc
us
ac
hly
os
tau
rio
n
Rh
ag
od
isc
us
re
nif
orm
is
Rh
ag
od
isc
us
sp
len
de
ns
Ro
tela
pil
lus
cre
nu
latu
s
Sc
am
pa
ne
lla
sp
p.
Se
rib
isc
utu
m p
rim
itiv
um
So
lla
sit
es
ho
rtic
us
Sta
uro
lith
ite
s s
p.
Sta
uro
lith
ite
s a
ng
us
tus
(s
ma
ll v
ar.
)
Sta
uro
lith
ite
s a
ng
us
tus
Sta
uro
lith
ite
s g
au
so
rhe
thiu
m
Sta
uro
lith
ite
s c
rux
Sta
uro
lith
ite
s m
itc
he
ne
ri
Sta
uro
lith
ite
s m
utt
erl
os
ei
Sta
uro
lith
ite
s r
ota
tus
Sta
uro
lith
ite
s r
ota
tus
(sm
all
va
r.)
Str
ad
ne
rlit
hu
s f
rac
tus
Sto
ve
riu
s a
ch
ylo
su
s
Sto
ve
riu
s p
roto
sig
nu
m
Te
gu
me
ntu
m s
tra
dn
eri
Te
tra
po
do
rha
bd
us
de
co
rus
Tra
no
lith
us
ga
ba
lus
Tra
no
lith
us
min
imu
s
Tra
no
lith
us
ph
ac
elo
su
s
Un
ipla
na
riu
s g
oth
icu
s
Un
ipla
na
riu
s t
rifi
du
m
Ve
ks
hin
ell
a s
p.
Wa
tzn
au
eri
a b
arn
es
ae
Wa
tzn
au
eri
a b
rita
nn
ica
Ze
ug
rha
bd
otu
s b
icre
sc
en
tic
us
Ze
ug
rha
bd
otu
s e
mb
erg
eri
Ze
ug
hrh
ab
do
tus
ho
we
i
Ze
ug
rha
do
tus
mo
ull
ad
ei
Ze
ug
rha
bd
otu
s s
cu
tula
ss
p.
turo
nic
us
Ze
ug
rha
bd
otu
s s
igm
oid
es
Ze
ug
rha
bd
otu
s t
riv
ec
tis
14-1 (22-24) 385.02 1 P 1 27 1 2 P 6 1 120 15 7 6 36 P 6 3 240 24 6 1
15-1 (56-59) 390.36 2 2 1 5 16 2 2 3 1 P 2 1 32 20 11 22 P P 1 2 320 6 2 P
Mid Campanian UC15 15-3 (90-91) 393.67 2 4 P 2 2 P 2 6 4 1 1 P 60 33 3 12 1 6 360 P 1 1
UC9a 15-3 (100-102) 393.77 3 P 2 3 P P P 4 5 P 7 2 1 5 P P 2 27 4 1 3 1 1 1 1 8 39 1 9 2
UC8 16-1 (13-14) 394.53 2 22 3 6 P 21 11 54 1 21 8 6 1 P 4 P 95 160 21 P 1 3 P 2 P 1 33 6 4 72 1 1
early Turonian UC6 17-1 (38-42) 399.78 3 P 5 7 1 2 3 60 72 2 1 1 3 1 240
18-1 (20-22) 404.3 P 3 4 5 P 1 7 150 5 1 6 1 P 2 1 1 1 1 P P P 3 108 P 120 1
19-1 (66-68) 409.76 5 4 35 7 P 1 P 40 12 1 4 2 7 12 2 1 P 1 1 1 3 1 60 16 15 2 2 2
20-1 (70-72) 414.2 3 120 120 35 2 2 72 8 2 18 12 1 1 1 16 2 1 12 30 1 4 1 240 1 12 7 12
21-1 (102-104) 419.72 2 560 180 4 3 1 1 6 96 21 P 3 15 1 12 7 P 4 5 P 5 8 180 P 9 3 P 1 1 1 12 78 380 30 78 P
22-1 (61-63) 423.91 55 P 720 30 2 14 P P 2 13 2 18 18 P 55 4 55 P 1 1 1 2 P 25 4 4 1 P 30 78 270 25 1 40
23-1 (65-66) 428.95 P 810 24 21 1 3 P 3 1 24 72 7 P 3 1 1 8 24 2 2 2 2 4 15 1 15 1 P 5 P 24 28 280 P 84 220
24-1 (33-36) 433.23 2 660 12 4 10 4 1 12 3 60 4 P 1 12 3 3 10 4 3 10 4 2 24 1 18 60 3 18 4 4 P 1 1 36 27 210 1 108 30
25-1 (42-44) 438.32 3 900 P 27 6 15 P 6 P 4 P 60 1 1 P P 1 12 1 2 7 5 P 7 12 P 5 30 3 35 1 P 2 15 310 P 110 180
26-1 (20-22) 442.7 1 P 630 P 1 3 1 P 18 P P P 4 1 P 27 126 10 P 1 2 14 P 1 8 15 1 3 P P 60 P 10 24 4 18 P 1 15 1 1 16 210 P 66 460
27-1 (8-9) 447.58 6 320 1 5 2 2 1 ?P P 7 P 20 P 2 1 14 2 2 1 3 3 1 P 102 3 P 2 10 14 P 4 2 P ?P 2 12 3 P 6 330 P 30 190
?early Cenomanian ?UC1 27-2 (15-16) 449.06 54 P 1 1 2 3 P P 30 1 P 5 1 4 3 5 1 3 12 P P 24 1 33 P P 2 P 3 120 P 21 10
27-2 (83-84) 449.74 3 180 24 1 16 1 21 P 6 1 1 P 60 2 36 1 1 ?P 1 14 2 16 1 2 5 10 P 8 1 78 3 4 18 12 P 1 3 1 1 7 2 3 102 24 230 24 390
27-2 (115-116) 450.06 2 4 210 4 1 4 1 14 P 18 1 16 5 2 45 2 P P 14 4 P 4 1 6 5 27 P 2 24 4 10 7 P P 2 1 P 4 1 16 33 240 P 60 330
27-3 (4-5) 450.45 P P 2 1 4 2 1 1 P P P 1 P 5 P 26 10 P P 3 P 10 20 10 P 36 4 1 4 48 2 4 P P 600 P 6 50 96
28-1 (5-6) 451.85 P 210 24 4 1 P 1 P 1 P 1 3 2 P P 1 P 9 15 P 9 4 8 7 70 3 5 8 P 1 P 2 84 P 48 112
28-2 (12-13) 453.42 P 14 1 P P 10 2 P P P P 1 P 390 P P 14 3 2 2 P 1 7 P 10 P 20 5 10 2 30 2 P 1 P 1 P 22 140 P 1 14 160
28-CC (2-3) 454.2 P 180 P 4 1 3 1 P P P 3 55 P 1 P 5 1 P 4 1 12 14 1 18 8 20 5 30 P 5 P P P P 1 P P 1 4 240 1 2 112 90
29-1 (4-5) 456.84 1 42 5 16 1 1 1 1 1 P 2 P 5 p 3 3 P 5 1 10 2 P 5 P 36 18 5 5 120 6 22 P P P P 2 2 330 P 5 36 180
29-3 (5-6) 459.85 P P 1 P 5 4 2 1 P 1 1 3 P 4 P 8 1 P 1 3 8 5 1 10 10 14 4 54 20 1 2 4 P P 12 96 P P 16 220
30-1 (5-6) 461.45 6 5 1 1 4 2 1 1 96 P 10 1 3 10 4 2 5 10 2 4 2 4 P 1 P P 12 144 P 16 180
30-2 (5-6) 462.67 P P 24 2 8 P P 1 1 15 P 1 P 1 1 1 P 2 15 P 6 15 1 90 1 P 1 1 12 360 P 2 27 230
30-3(4-5) 464.16 4 2 P P P 1 1 2 P P P 1 30 1 1 8 1 3 4 1 10 P 1 1 2 96 2 54 72
31-1 (4-5) 466.44 P P 42 1 P 1 7 4 P P 1 1 P 42 P P 1 2 P 3 1 1 1 P 25 4 6 30 2 24 P 42 1 P 1 P P 24 160 P 60 114
31-2 (4-5) 467.94 3 P 84 P P 20 3 2 1 2 1 2 15 1 30 1 1 9 P P 9 21 78 90 3 20 4 21 1 15 1 1 2 15 180 3 45 180
31-3 (4-5) 469.44 1 2 40 P P P 1 1 6 1 P 5 P 4 1 P 1 3 1 1 1 4 P 5 1 1 P 2 3 30 75 6 60 25 150 P 3 P 9 P P 3 30 200 2 7 210
32-1 (132-133) 472.32 1 4 90 P P 1 P 5 1 P 2 1 10 3 21 2 2 1 2 1 P 3 6 15 78 42 5 P 27 6 1 P P 180 1 30 150
32-2 (82-83) 473.19 P 3 1 170 P 5 5 P 2 1 4 1 24 7 3 2 4 2 7 1 1 1 15 3 3 45 5 33 1 15 12 3 2 P 1 200 2 45 90
33-1 (142-143) 477.42 1 2 1 180 1 P 1 5 2 3 5 P 2 2 4 6 P 8 1 P 4 4 1 1 1 1 12 P 5 3 2 22 1 36 30 6 30 13 18 6 2 5 1 270 2 21 210
33-2 (138-139) 478.88 P 1 1 2 6 1 1 P 6 1 1 2 1 270 108 10
33-3 (58-59) 479.58 5 480 1 5 2 16 P 2 2 10 6 P 4 P 2 2 2 ?P 21 2 1 18 1 10 2 2 48 10 3 36 160 P 33 30 42 4 21 P 10 P P 16 8 10 1 42 1 160 1 P 30 120
34-1 (122-123) 481.92 2 1 240 3 3 1 1 3 P 4 14 1 4 1 1 51 52 52 1 24 30 2 96 3 4 2 6 1 30 P 230 P 36 240
34-2 (132-133) 483.52 4 P 112 P 3 12 P 1 1 P 1 4 3 18 P 2 2 5 5 2 1 12 3 11 22 1 P 2 P 170 2 32 130
34-3 (45-46) 484.15 7 1 200 1 21 10 16 15 1 3 3 3 21 1 9 4 3 5 6 2 4 1 39 14 2 7 3 1 12 36 33 45 P 21 36 1 4 8 1 340 14 8 370
34-3 (112-113) 484.82 3 P 160 2 18 3 10 1 48 2 P 1 P 8 P 18 P 18 2 8 12 12 10 15 1 P 3 24 12 P 1 1 2 10 24 39 21 12 39 4 18 P 21 P 30 2 P 4 3 330 3 27 240
UC5
UC1
NC9a
ea
rly
Ce
no
ma
nia
n
late Campanian
late middle Albian -
early late Albian
late
Alb
ian
UC16
mid Turonian
UC3
UC2
NC10a (lower)
late Cenomanian
Ag
e
NF
Zo
ne
CO
RE
SA
MP
LE
De
pth
(m
)
Ax
op
od
orh
ab
du
s d
ietz
ma
nn
ii
Bis
cu
tum
co
ns
tan
s
Bro
ins
on
ia g
all
ois
ii
Bro
ins
on
ia s
ten
os
tau
rio
n
Bu
kry
lith
us
am
big
uu
s
Ch
ias
toz
yg
us
lit
tera
riu
s
Co
roll
ith
ion
sig
nu
m
Cru
cib
isc
utu
m n
eu
qu
en
en
sis
Cru
cic
rib
rum
an
gli
cu
m
Ep
roli
thu
s f
lora
lis
Fa
rha
nia
sp
.
Fla
be
llit
es
ob
lon
gu
s
Ga
rtn
era
go
co
xa
llia
e
Gla
uk
oli
thu
s d
iplo
gra
mm
us
Gra
nta
rha
bd
us
co
ron
ad
ve
nti
s
Ha
ye
sit
es
alb
ien
sis
He
len
ea
ch
ias
tia
He
mip
od
orh
ab
du
s g
ork
ae
He
lic
oli
thu
s c
om
pa
ctu
s
Lo
rdia
xe
no
ta
Ma
niv
ite
lla
pe
mm
ato
ide
a
Pre
dis
co
sp
ha
era
co
lum
na
ta
Pe
rciv
ali
a f
en
es
tra
ta
Re
pa
gu
lum
pa
rvid
en
tatu
m
Re
tec
ap
sa
sp
p.
Re
tec
ap
sa
an
gu
sti
fora
ta
Rh
ag
od
isc
us
an
gu
stu
s
Rh
ag
od
isc
us
as
pe
r
Rh
ag
od
isc
us
ac
hly
os
tau
rio
n
Ro
tela
pil
lus
cre
nu
latu
s
Sto
ve
riu
s a
ch
ylo
su
s
Te
gu
me
ntu
m s
tra
dn
eri
Tra
no
lith
us
ga
ba
lus
Tra
no
lith
us
ph
ac
elo
su
s
Wa
tzn
au
eri
a b
arn
es
ae
Ze
ug
rha
bd
otu
s e
mb
erg
eri
Ze
ug
hrh
ab
do
tus
ho
we
i
Ze
ug
rha
do
tus
mo
ull
ad
ei
54-3 (70) 491.3 P 2 2 P P 1 2 2 2 1 P 2 1 1 2 11 1 4 2 P 7 2 1 1 18 11 22
54 (CC) 491.32 1 8 1 P 3 1 2 P P 1 1 P 1 P 4 1 2 10 2 2 4 1 1 1 1 1 5 P 8 15
early Middle
AlbianNC8C
Chapter 5
233
DSDP Leg 14 Site 144
Table S 5.2 – Distribution charts of calcareous nannofossils from the seven wells studied.
5.10 REFERENCES
Allen, P.A. and Allen, J.R., 2013. Basin analysis: Principles and application to petroleum play assessment. John Wiley & Sons.
Ando, A., Huber, B.T., MacLeod, K.G. and Watkins, D.K., 2015. Early Cenomanian “hot greenhouse” revealed by oxygen isotope record of exceptionally well‐preserved foraminifera from Tanzania. Paleoceanography, 30(11), pp.1556-1572.
Armstrong, H., Brasier, M., 2013. Microfossils. John Wiley & Sons.
Bally, A.W., 1981. Atlantic-type margins, pp.1-48.
Basile, C., Girault, I., Paquette, J.L., Agranier, A., Loncke, L., Heuret, A. and Poetisi, E., 2020. The Jurassic magmatism of the Demerara Plateau (offshore French Guiana) as a remnant of the Sierra Leone hotspot during the Atlantic rifting. Scientific Reports, 10(1), pp.1-12.
Basile, C., Mascle, J. and Guiraud, R., 2005. Phanerozoic geological evolution of the Equatorial Atlantic domain. Journal of African Earth Sciences, 43(1-3), pp.275-282.
Basile, C., Maillard, A., Patriat, M., Gaullier, V., Loncke, L., Roest, W., De Lepinay, M.M. and Pattier, F., 2013. Structure and evolution of the Demerara Plateau, offshore French Guiana: Rifting, tectonic inversion and post-rift tilting at transform–divergent margins intersection. Tectonophysics, 591, pp.16-29.
Behar, F., Beaumont, V. and Penteado, H.D.B., 2001. Rock-Eval 6 technology: performances and developments. Oil & Gas Science and Technology, 56(2), pp.111-134.
Below, R., 1982: Scolochorate Zysten der Gonyaulacaceae (Dinophyceae) aus der Unterkreide Marokkos. Palaeontographica, Abteilung B, v.182, p.1-51, pl.1-9.
Ben‐Avraham, Z., Schattner, U., Lazar, M., Hall, J.K., Ben‐Gai, Y., Neev, D. and Reshef, M., 2006. Segmentation of the Levant continental margin, eastern Mediterranean. Tectonics, 25(5).
Benkhelil, J., Mascle, J. and Tricart, P., 1995. The Guinea continental margin: an example of a structurally complex transform margin. Tectonophysics, 248(1-2), pp.117-137.
Bland, S., Griffiths, P. and Hodge, D., 2004. Restoring the seismic image with a geological rule base. first break, 22(4).
Bown, P., 1998. Calcareous nannofossil biostratigraphy. Chapman and Hall; Kluwer Academic, pp.1–315.
Bown, P.R, Rutledge, D., Crux, J.A. and Gallagher, L.T., 1998. Lower Cretaceous. In Bown, P. (Ed.), Calcareous Nannofossil Biostratigraphy. (pp. 86-131). Chapman and Hall; Kluwer Academic.
Ag
e
NF
Zo
ne
CO
RE
SA
MP
LE
De
pth
(m
)
Ah
mu
ell
ere
lla
oc
tora
dia
ta
Am
ph
izy
gu
s b
roo
ks
ei
An
fra
ctu
s s
hil
oh
en
sis
Ark
ha
ng
els
kie
lla
cy
mb
ifo
rmis
Ax
op
od
orh
ab
du
s a
lbia
nu
s
Ax
op
od
orh
ab
du
s d
ietz
ma
nn
ii
Bis
cu
tum
co
ns
tan
s
Bis
cu
tum
co
ron
um
Bis
cu
tum
ga
ult
en
sis
Bra
aru
do
sp
ha
era
pri
mu
la
Bra
aru
do
sp
ha
era
qu
inq
ue
sti
co
sta
ta
Bra
aru
do
sp
ha
era
ste
no
rhe
tha
Bro
ins
on
ia e
no
rmis
Bro
ins
on
ia p
arc
a c
on
str
icta
Bro
ins
on
ia s
ign
ata
Bro
ins
on
ia g
all
ois
ii
Bu
kry
lith
us
am
big
uu
s
Ca
lcic
ali
thin
a a
lta
Ca
lcio
so
len
ia f
os
sil
is
Ca
lcu
lite
s d
isp
ar
Ch
ias
toz
yg
us
lit
tera
riu
s
Co
roll
ith
ion
sig
nu
m
Cre
tarh
ab
du
s c
on
icu
s
Cre
tarh
ab
du
s i
na
eq
ua
lis
Cre
tarh
ab
du
s l
ori
ei
Cri
bro
sp
ha
ere
lla
eh
ren
be
rgii
Cru
cic
rib
rum
an
gli
cu
m
Cy
lin
dra
lith
us
sc
ulp
tus
Dis
co
rha
bd
us
ig
no
tus
Eif
fell
ith
us
ex
imiu
s
Eif
feli
thu
s p
ara
go
gu
s
Eif
fell
ith
us
tu
rris
eif
feli
i
Ep
roli
thu
s f
lora
lis
Fa
rha
nia
sp
.
Fla
be
llit
es
ob
lon
gu
s
Ga
rtn
era
go
co
xa
llia
e
Ga
rtn
era
go
ob
liq
uu
m
Ga
rtn
era
go
pra
eo
bli
qu
um
Gla
uk
oli
thu
s d
iplo
gra
mm
us
Go
rka
ea
op
eri
o
Gra
nta
rha
bd
us
co
ron
ad
ve
nti
s
Ha
ye
sit
es
alb
ien
sis
He
len
ea
ch
ias
tia
He
mip
od
orh
ab
du
s g
ork
ae
He
lic
oli
thu
s a
nc
ep
s
He
lic
oli
thu
s t
rab
ec
ula
tus
Ka
mp
tne
riu
s m
ag
nif
icu
s
La
gu
nc
ula
do
roth
ae
a
Lit
ha
str
inu
s s
ep
ten
ari
us
La
gu
nc
ula
do
roth
ea
e
Lo
rdia
xe
no
ta
Ma
niv
ite
lla
pe
cte
n
Ma
niv
ite
lla
pe
mm
ato
ide
a
Mic
rorh
ab
du
lus
de
co
ratu
s
Mic
ula
sta
uro
ph
ora
Na
nn
oc
on
us
sp
p (
top
vie
w)
Na
nn
oc
on
us
qu
ad
ria
ng
ulu
s q
ua
dri
an
gu
lus
Na
nn
oc
on
us
qu
ad
ria
ng
ulu
s a
pe
rtu
s
Ora
str
um
pe
rsp
icu
um
Ow
en
ia p
art
itu
m
Pre
dis
co
sp
ha
era
co
lum
na
ta
Pre
dis
co
sp
ha
era
cre
tac
ea
Pre
dis
co
sp
ha
era
sp
ino
sa
Qu
ad
rum
ga
rtn
eri
Re
inh
ard
tite
s a
nth
op
ho
rus
Re
inh
ard
tite
s l
ev
is
Re
pa
gu
lum
pa
rvid
en
tatu
m
Re
tec
ap
sa
sp
p.
Re
tec
ap
sa
sc
hiz
ob
rac
hia
ta
Rh
ag
od
isc
us
an
gu
stu
s
Rh
ag
od
isc
us
as
pe
r
Rh
ag
od
isc
us
ac
hly
os
tau
rio
n
Rh
ag
od
isc
us
sp
len
de
ns
Ro
tela
pil
lus
cre
nu
latu
s
Se
rib
isc
utu
m p
rim
itiv
um
So
lla
sit
es
ho
rtic
us
Sta
uro
lith
ite
s g
au
so
rhe
thiu
m
Sta
uro
lith
ite
s m
ieln
ice
ns
is
Sta
uro
lith
ite
s m
utt
erl
os
ei
Str
ad
ne
rlit
hu
s f
rac
tus
Sto
ve
riu
s a
ch
ylo
su
s
Sto
ve
riu
s p
roto
sig
nu
m
Te
gu
me
ntu
m s
tra
dn
eri
Te
tra
po
do
rha
bd
us
de
co
rus
Tra
no
lith
us
ga
ba
lus
Tra
no
lith
us
min
imu
s
Tra
no
lith
us
ph
ac
elo
su
s
Un
ipla
na
riu
s g
oth
icu
s
Un
ipla
na
riu
s s
iss
ing
hi
Un
ipla
na
riu
s t
rifi
du
s
Ve
ks
hin
ell
a s
p.
Wa
tzn
au
eri
a b
arn
es
ae
Ze
ug
rha
bd
otu
s b
icre
sc
en
tic
us
Ze
ug
rha
bd
otu
s e
mb
erg
eri
Ze
ug
hrh
ab
do
tus
ho
we
i
Ze
ug
rha
do
tus
mo
ull
ad
ei
Ze
ug
rha
bd
otu
s s
cu
tula
ss
p.
turo
nic
us
Ze
ug
rha
bd
otu
s s
igm
oid
es
3-1 (125-126) 163.25 1 8 1 54 6 7 4 1 P 2 3 65 21 2 5 90 P P P P 1 P 126 60 4 2
4-2 (146-148) 173.96 2 2 1 P 18 P 1 2 1 4 15 28 1 18 18 P P 3 1 P P P 170 18 1 1
mid - late Turonian UC9 5-1 (15-106) 181.05 P 3 P 1 2 11 1 7 4 2 1 P 1 5 24 P 2 3 1 P 1 9 30 4 2 P
4-2 (96-98) 215.46 7 15 12 2 4 78 42 4 39 14 P 3 3 24 1 P 54 3 1 5 1 5 1 300 P 270 210 2
4-3 (36-38) 216.36 6 1 3 18 15 5 1 130 30 2 15 33 8 P 1 7 11 130 3 1 1 2 4 1 2 6 210 P 96 470 1
5-1 (14-16) 264.14 P 4 7 3 2 P P 1 1 P 7 1 8 5 P 1 3 16 7 2 12 1 5 3 1 2 5 108 P 16 150
5-1 (125-127) 265.25 1 15 3 5 2 P 1 1 3 P 2 15 1 P 33 1 5 P P 1 4 5 9 4 3 3 P 1 4 2 1 2 30 4 60
6-1 (126-128) 296.26 P P 2 P P P 1 P 1 P 1 P 1 P 1 P P 3 1 P P P P 5 5 1 2
7-1 (73-75) 298.73 4 P 1 P 2 P 2 1 P P P P 6 1 2 1
7-1 (128-130) 299.28 1 P 1 P 3 1 P 3 1 P P P P P P P P P 2 P P P 2 1 1 P 1 1 2 P P 1 2 7 1 2 1
8-3 (103-105) 328.03 2 1 P P P 1 1 P 1 P P P 4 6 4
8-3 (135-137) 328.35 5 1 P 2 P P P 2 P P P P 2 2 1 P P 1 1 1 P 1 P 2 8 1 5
early middle
Albian
late Campanian UC16
late Cenomanian
NC8C
UC5
Stratigraphic architecture, Guyanas continental margin
234
Bown, P.R., 2001. Calcareous nannofossils of the Gault, Upper Greensand and Glauconitic Marl (Middle Albian-Lower Cenomanian) from the BGS Selborne boreholes, Hampshire. Proceedings of the Geologists' Association, 112(3), pp.223-236.
Bralower, T.J., Sliter, W.V., Arthur, M.A., Leckie, M.R., Allard, D. and Schlanger, S.O., 1993. Dysoxic/Anoxic Episodes in the Aptian-Albian (Early Cretaceous). The Mesozoic Pacific. Geology, Tectonics and Volcanism. Geophysical Monograph 77, American Geophysical Union, 5-37.
Burk, K. and Dewey, J.F., 1974. Two plates in Africa during the Cretaceous?. Nature, 249(5455), pp.313-316.
Burnett, J.A., 1998. Upper Cretaceous. In Bown, P.R. (ed.), Calcareous nannofossil biostratigraphy: Dordrecht, The Netherlands (Kluwer Academic Publishers), 132-199.
Calvès, G., Schwab, A.M., Huuse, M., Clift, P.D., Gaina, C., Jolley, D., Tabrez, A.R. and Inam, A., 2011. Seismic volcanostratigraphy of the western Indian rifted margin: The pre‐Deccan igneous province. Journal of Geophysical Research: Solid Earth, 116(B1).
Casson, M.A., Calves, G., Redfern, J., Huuse, M. and Sayers, B., 2020. Cretaceous continental margin evolution revealed using quantitative seismic geomorphology, offshore northwest Africa. Basin Research.
Casson et al. 2020 in prep. A stratigraphic re-evaluation of key Central Atlantic DSDP sites.
Cedeño, A.F., Ohm, S.E., Escalona, A. and Narain, E. 2019. Petroleum System (S?) in the Guyana-Suriname Basin: Insights from a Geochemical Study Onshore Suriname. European Association of Geoscientists & Engineers Conference Proceedings, 29th International Meeting on Organic Geochemistry, Sep 2019, pp.1 – 2.
CGMW, CPRM, DNPM, 2003. 1: 5,500,000 Geological Map of South America. Commission for the Geological Map of the World (CGMW), Geological Survey of Brazil (CPRM), National Department of Mineral Production, Brazil (DNPM). CD-ROM.
Charton, R.J.G., 2018. Phanerozoic Vertical Movements in Morocco. (Doctoral dissertation). TUDelft, Netherlands.
Clemson, J., Cartwright, J. and Booth, J., 1997. Structural segmentation and the influence of basement structure on the Namibian passive margin. Journal of the Geological Society, 154(3), pp.477-482.
Cordani, U.G., Ramos, V.A., Fraga, L.M., Delgado, I., de Souza, K.G., Gomes, F.E.M, Schobbenhaus, C., and Cegarra, M. 2016. Tectonic map of South America. Commission for the geological map of the world.
Costa, L. I. & Davey, R. J., 1992. Dinoflagellate Cysts of the Cretaceous System. In: A Stratigraphic Index of Dinoflagellate Cysts, Ed. by A. J. McIntyrepowel (Chapman and Hall, London), 99–131.
Davey, R.J., 1982: Dinocyst stratigraphy of the latest Jurassic to Early Cretaceous of the Haldager No. 1 borehole, Denmark. Danmarks Geologiske Undersøgelse, Series B, 6, 1-57, pl.1-10.
Davison, I., Faull, T., Greenhalgh, J., Beirne, E.O. and Steel, I., 2016. Transpressional structures and hydrocarbon potential along the Romanche Fracture Zone: a review. Geological Society, London, Special Publications, 431(1), pp.235-248.
Derycke, A., Gautheron, C.., Bourbon, P., Pinna-Jamme, R., Aertgeerts, G., Simon-Labric, T., 2018. French Guyana margin evolution: insight by low-temperature thermochronological data.
Dickson, W., Schiefelbein, C.F., Odegard, M.E. and Zumberge, J.E., 2016. Petroleum systems asymmetry across the South Atlantic Equatorial Margins. Geological Society, London, Special Publications, 431(1), pp.219-233.
Chapter 5
235
Dodekova, L., 1969: Dinoflagellés et acritarches du Tithonique aux environs de Pleven, Bulgarie central du nord. Bulgarska Akademiya na Naukite, Izvestiya na Geologicheskiya Institut, Seriya Paleontologiya, v.18, p.13-24, pl.1-5.
Doyle, J. A., Jardiné, S. & Doerenkamp, A., 1982. Afropollis, a new genus of early angiosperm pollen, with notes on the Cretaceous palynostratigraphy and paleoenvironments of Northern Gondwana. Bulletin des Centres Recherches Exploration-Production Elf Aquitaine, 6, 39–117.
Dronkert, H. and Wong, T.E., 1993. Geology of the Tambaredjo oil field, Suriname. AAPG Bulletin (American Association of Petroleum Geologists, United States), 77 (CONF-930306).
Duxbury, S. 1983. A study of dinoflagellate cysts and acritarchs from the Lower Greensand (Aptian to Lower Albian) of the Isle of Wight, southern England. Palaeontographica Abt. B, 186; 18-80.
Edge, R., 2014. Rifting of the Guinea Margin in the Equatorial Atlantic from 112 to 84 MA: Implications of Paleo-reconstructions for Structure and Sea-surface Circulation. Ph.D Thesis. Retrieved from. http://hdl.handle.net/10150/321395.
Erbacher, J., Mosher, D.C. and Malone, M.J., et al. 2004a. Demerara Rise; equatorial Cretaceous and Paleogene paleoceanographic transect, western Atlantic; covering Leg 207 of the cruises of the drilling vessel JOIDES Resolution; Bridgetown, Barbados, to Rio de Janeiro, Brazil; Sites 1257–1261; 11 January–6 March 2003, in M. Chapman, and L. L. Peters, eds., Proceedings of the Ocean Drilling Program (ODP), Initial Reports, Part A-207: Texas A&M University, pp.1–89.
Erbacher, J., Mosher, D.C. and Malone, M.J., et al. 2004b. Site 1258, in M. Chapman, and L. L. Peters, eds., Proceedings of the Ocean Drilling Program (ODP), Initial Reports, Part A-207: Texas A&M University.
Erbacher, J., Friedrich, O., Wilson, P.A., Birch, H. and Mutterlose, J., 2005. Stable organic carbon isotope stratigraphy across Oceanic Anoxic Event 2 of Demerara Rise, western tropical Atlantic. Geochemistry, Geophysics, Geosystems, 6(6).
Erlich, R. N., Villamil, T., and Keens-Dumas, J., 2003. Controls on the deposition of Upper Cretaceous organic carbon–rich rocks from Costa Rica to Suriname, in C. Bartolini, R. T. Buffler, and J. Blickwede, eds., The Circum-Gulf of Mexico and the Caribbean: Hydrocarbon habitats, basin formation, and plate tectonics: AAPG Memoir 79, pp.1–45.
Faleide, J.I., Tsikalas, F., Breivik, A.J., Mjelde, R., Ritzmann, O., Engen, O., Wilson, J. and Eldholm, O., 2008. Structure and evolution of the continental margin off Norway and the Barents Sea. Episodes, 31(1), pp.82-91.
Fanget, A.S., Loncke, L., Pattier, F., Marsset, T., Roest, W.R., Tallobre, C., de Madron, X.D. and Hernández-Molina, F.J., 2020. A synthesis of the sedimentary evolution of the Demerara Plateau (Central Atlantic Ocean) from the Late Albian to the Holocene. Marine and Petroleum Geology, 114, p.104-195.
Figueiredo, J.J.J.P., Hoorn, C., Van der Ven, P. and Soares, E., 2009. Late Miocene onset of the Amazon River and the Amazon deep-sea fan: Evidence from the Foz do Amazonas Basin. Geology, 37(7), pp.619-622.
Flügel, E., 2004. Depositional models, facies zones and standard microfacies. In Microfacies of Carbonate Rocks (pp. 657-724). Springer, Berlin, Heidelberg.
Franke, D., 2013. Rifting, lithosphere breakup and volcanism: Comparison of magma-poor and volcanic rifted margins. Marine and Petroleum geology, 43, pp.63-87.
Franke, D., Neben, S., Ladage, S., Schreckenberger, B. and Hinz, K., 2007. Margin segmentation and volcano-tectonic architecture along the volcanic margin off Argentina/Uruguay, South Atlantic. Marine Geology, 244(1-4), pp.46-67.
Stratigraphic architecture, Guyanas continental margin
236
Friedrich, O. and Erbacher, J., 2006. Benthic foraminiferal assemblages from Demerara Rise (ODP Leg 207, western tropical Atlantic): possible evidence for a progressive opening of the Equatorial Atlantic Gateway. Cretaceous Research, 27(3), pp.377-397.
Gale, A.S., Bown, P., Caron, M., Crampton, J., Crowhurst, S.J., Kennedy, W.J., Petrizzo, M.R. and Wray, D.S., 2011. The uppermost Middle and Upper Albian succession at the Col de Palluel, Hautes-Alpes, France: An integrated study (ammonites, inoceramid bivalves, planktonic foraminifera, nannofossils, geochemistry, stable oxygen and carbon isotopes, cyclostratigraphy). Cretaceous Research, 32, pp.59-130.
Garzanti, E., 2016. From static to dynamic provenance analysis—Sedimentary petrology upgraded. Sedimentary Geology, 336, pp.3-13.
Gasperini, L., Bernoulli, D., Bonatti, E., Borsetti, A.M., Ligi, M., Negri, A., Sartori, R. and Von Salis, K., 2001. Lower Cretaceous to Eocene sedimentary transverse ridge at the Romanche Fracture Zone and the opening of the equatorial Atlantic. Marine Geology, 176(1-4), pp.101-119.
Geognostics 2020. Geognostics Eart Model (GEM).
Gouiza, M., Bertotti, G., Charton, R., Haimoudane, K., Dunkl, I. and Anczkiewicz, A.A., 2019. New Evidence of Anomalous Vertical Movements along the Hinterland of the Atlantic NW African Margin. Journal of Geophysical Research: Solid Earth.
Gouyet, S., 1988. Evolution tectono-sédimentaire des marges guyanaise et nord-brésilienne au cours de l'ouverture de l'Atlantique Sud (Doctoral dissertation).
Gouyet, S., Unternehr, P. and Mascle, A., 1994. The French Guyana margin and the Demerara Plateau: geological history and petroleum plays. In Hydrocarbon and petroleum geology of France (pp. 411-422). Springer, Berlin, Heidelberg.
Grabowski, J., Lakova, I., Petrova, S., Stoykova, K., Ivanova, D., Wójcik-Tabol, P., Sobień, K. and Schnabl, P., 2016. Paleomagnetism and integrated stratigraphy of the Upper Berriasian hemipelagic succession in the Barlya section Western Balkan, Bulgaria: Implications for lithogenic input and paleoredox variations. Palaeogeography, Palaeoclimatology, Palaeoecology, 461, pp.156-177.
Greenroyd, C.J., Peirce, C., Rodger, M., Watts, A.B. and Hobbs, R.W., 2007. Crustal structure of the French Guiana margin, west equatorial Atlantic. Geophysical Journal International, 169(3), pp.964-987.
Greenroyd, C.J., Peirce, C., Rodger, M., Watts, A.B. and Hobbs, R.W., 2008a. Crustal structure and evolution of the Demerara Plateau, French Guiana: Geophysical Journal International, 172, pp.549–564,
Greenroyd, C. J., Peirce, C., Rodger, M., Watts, A.B. and Hobbs, R.W. 2008b. Demerara Plateau — The structure and evolution of a transform passive margin: Geophysical Journal International, 172, pp.549–564.
Griffith, C.P., 2017. Evidence for a Jurassic Source Rock in the Guiana-Suriname Basin. AAPG Datapages/Search and Discovery Article #90291, AAPG Annual Convention and Exhibition, Houston, Texas, April 2-5, 2017.
Habib, D. & Drugg, W.S. 1983. Dinoflagellate age of Middle Jurassic-Early Cretaceous sediments in the Blake-Bahama Basin. Deep Sea Drilling Project, Washington, Initial reports, 76: 623-638.
Hardas, P. and Mutterlose, J., 2006. Calcareous nannofossil biostratigraphy of the Cenomanian/ Turonian boundary interval of ODP Leg 207 at the Demerara Rise. Revue de micropaléontologie 49. pp. 165–179.
Haq, B.U., 2014. Cretaceous eustasy revisited. Global and Planetary change, 113, pp.44-58.
Chapter 5
237
Hardas, P. and Mutterlose, J., 2006. Calcareous nannofossil biostratigraphy of the Cenomanian/Turonian boundary interval of ODP Leg 207 at the Demerara Rise. Revue de micropaléontologie, 49(3), pp.165-179.
Hayes, D.E., Pimm, A.C., Beckman, J.B., Benson, W.E., Berger, W.H., Roth, P.H., Supko, P.R., and von Rad, U., 1972. Initial reports of the Deep Sea Drilling Project. US Government Printing office. Washington DC, 14, pp.975.
Heine, C., Zoethout,J. and Muller, R. D., 2013. Kinematics of the South Atlantic rift. Solid Earth Discussions, 5, pp.41– 116.
Hill, M.E., 1976. Lower Cretaceous calcareous nannofossils from Texas and Oklahoma. Palaeontographica Abteilung B, 156, 4-6, pp.103-179.
Jacobi, R.D. and Hayes, D.E., 1982. Bathymetry, microphysiography and reflectivity characteristics of the West African margin between Sierra Leone and Mauritania. In Geology of the Northwest African continental margin (pp. 182-212). Springer, Berlin, Heidelberg.
James, R., Scotchman, J. & Head, R., 2020. Why is there heavy oil in Cenozoic reservoirs offshore Guyana. Halliburton exploration insights, April, 2020.
Jeremiah, J., 1996. A proposed Albian to lower Cenomanian nannofossil biozonation for England and the North Sea Basin. Journal of Micropalaeontology 15 (2), pp.97–129.
Jeremiah, J., 2001. A Lower Cretaceous nannofossil zonation for the North Sea Basin. Journal of Micropalaeontology, 20, pp. 45-80.
Kneller, E.A. and Johnson, C.A., 2011. Plate kinematics of the Gulf of Mexico based on integrated observations from the Central and South Atlantic. Gulf Coast Association of Geological Societies Transactions, 61, pp.283–299.
Kulhanek, D.K. and Wise, S.W. Jr., 2006. Albian calcareous nannofossils from ODP Site 1258, Demerara Rise. Revue de Micropaléontologie 49, pp. 181-195.
Kosmos Energy, 2018. Investor Presentation – March 2018. Dallas, Texas. Available from <https://www.kosmosenergy.com/>.
Krauspenhar, P.M., Carvalho, M.A., Fauth, G. and Lana, C.C., 2014. Albian Palynostratigraphy of ODP Leg 207 (Holes 1257A, 1258C and 1260B), Demerara Rise, Equatorial Atlantic. Revue de micropaléontologie, 57(1), pp.1-13.
Kulhanek, D.K. & Wise, S.W., 2006. Albian calcareous nannofossils from ODP Site 1258, Demerara Rise. Revue de micropaléontologie, 49, pp. 181-195.
Kusznir, N.J., Roberts, A.M. and Alvey, A.D., 2018. Crustal structure of the conjugate Equatorial Atlantic Margins, derived by gravity anomaly inversion. Geological Society, London, Special Publications, 476, pp.SP476-5.
Labails, C., Olivet, J.L., Aslanian, D. and Roest, W.R., 2010. An alternative early opening scenario for the Central Atlantic Ocean. Earth and Planetary Science Letters, 297(3-4), pp.355-368.
Loncke, L., Roest, W.R., Klingelhoefer, F., Basile, C., Graindorge, D., Heuret, A., Marcaillou, B., Museur, T., Fanget, A.S. and de Lépinay, M.M., 2019. Transform marsginal plateaus. Earth-Science Reviews, p.102940.
Long, A., Cameron, N. and Sayers, B., 2018. The Guinea Marginal Plateau: Correlations from Seismic and Potential Fields. In AAPG Europe Regional Conference, Global Analogues of the Atlantic Margin.
Loucks, R.G., Kerans, C., Zeng, H. and Sullivan, P.A., 2017. Documentation and characterization of the Lower Cretaceous (Valanginian) Calvin and Winn carbonate shelves and shelf margins, onshore
Stratigraphic architecture, Guyanas continental margin
238
northcentral Gulf of Mexico. The American Association of Petroleum Geologists Bulletin, v. 101 (1), pp. 119–142.
Mann, P., Taylor, F.W., Edwards, R.L. and Ku, T.L., 1995. Actively evolving microplate formation by oblique collision and sideways motion along strike-slip faults: An example from the northeastern Caribbean plate margin. Tectonophysics, 246(1-3), pp.1-69.
McCoss, A. 2017. Opening New Oil Basins: A Pattern of Discoveries. In AAPG Annual Convention and Exhibition. Search and Discovery Article #70280.
McKenzie, D., 1978. Some remarks on the development of sedimentary basins. Earth and Planetary science letters, 40(1), pp.25-32.
Mercier de Lépinay, M., Loncke, L., Basile, C., Roest, W.R., Patriat, M., Maillard, A. and De Clarens, P., 2016. Transform continental margins–Part 2: A worldwide review. Tectonophysics, 693, pp.96-115.
Meyers, P.A., Bernasconi, S.M. and Forster, A., 2006. Origins and accumulation of organic matter in expanded Albian to Santonian black shale sequences on the Demerara Rise, South American margin. Organic Geochemistry, 37(12), pp.1816-1830.
Mitchum, R.M. and Vail, P.R., 1977. Seismic Stratigraphy and Global Changes of Sea Level: Part 7. Seismic Stratigraphic Interpretation Procedure: Section 2. Application of Seismic Reflection Configuration to Stratigraphic Interpretation.
Monteil, E. 1992. Kystes de dinoflagelles index (Tithonique-Valanginien) du Sud-Est de la France. Proposition d’une nouvelle zonation palynologique. Revue de Paleobilogie, 11: 299-306.
Morgan, W.J., 1983. Hotspot tracks and the early rifting of the Atlantic. In Developments in Geotectonics (Vol. 19, pp. 123-139). Elsevier.
Mosher, D., Erbacher, J., Zuelsdorff, L. and Meyer, H., 2005. Stratigraphy of the Demerara Rise, Suriname, South America: a rifted margin, shallow stratigraphic source rock analogue. In American association of petroleum geologists annual meeting, Calgary.
Moulin, M., Aslanian, D. and Unternehr, P., 2010. A new starting point for the South and Equatorial Atlantic Ocean. Earth-Science Reviews, 98(1-2), pp.1-37.
Mourlot, Y., 2018. Contrôles sur la répartition des argiles organiques dans les bassins profonds: cas de l'Atlantique central au Crétacé (Doctoral dissertation, Université de Toulouse, Université Toulouse III-Paul Sabatier).
Mourlot, Y., Calvès, G., Clift, P.D., Baby, G., Chaboureau, A.C. and Raisson, F., 2018. Seismic stratigraphy of Cretaceous eastern Central Atlantic Ocean: Basin evolution and palaeoceanographic implications. Earth and Planetary Science Letters, 499, pp.107-121.
Müller, R.D., Sdrolias, M., Gaina, C. and Roest, W.R., 2008. Age, spreading rates, and spreading asymmetry of the world's ocean crust. Geochemistry, Geophysics, Geosystems, 9(4).
Nemčok, M., Rybár, S., Ekkertová, P., Kotulová, J., Hermeston, S.A. and Jones, D., 2016. Transform-margin model of hydrocarbon migration: the Guyana–Suriname case study. Geological Society, London, Special Publications, 431(1), pp.199-217.
Olyphant, J.R., Johnson, R.A. and Hughes, A.N., 2017. Evolution of the Southern Guinea Plateau: Implications on Guinea-Demerara Plateau formation using insights from seismic, subsidence, and gravity data. Tectonophysics, 717, pp.358-371.
Owen, H.G. and Mutterlose, J., 2006. Late Albian ammonites from offshore Suriname: implications for biostratigraphy and palaeobiogeography. Cretaceous Research, 27(6), pp.717-727.
Chapter 5
239
Pasley, M.A., Shepherd, D.B., Pocknall, D.T., Boyd, K.P., Andrade, V. and Figueiredo, J.P., 2004, October. Sequence stratigraphy and basin evolution of the Foz do Amazonas Basin, Brazil. In AAPG ICE (p. 12).
Payton, C.E. ed., 1977. Seismic stratigraphy: applications to hydrocarbon exploration (Vol. 26, pp. 1-516). Tulsa, OK: American Association of Petroleum Geologists.
Pereira, R. and Alves, T.M., 2011. Margin segmentation prior to continental breakup: A seismic–stratigraphic record of multiphased rifting in the North Atlantic (Southwest Iberia). Tectonophysics, 505(1-4), pp.17-34.
Pindell, J.L., 1985. Alleghenian reconstruction and subsequent evolution of the Gulf of Mexico, Bahamas, and proto‐Caribbean. Tectonics, 4(1), pp.1-39.
Reháková, D, and Michalík, J, 2000. Calcareous dinoflagellate and calpionellid bioevents versus sea-level fluctuations recorded in the West-Carpathian (Late Jurassic/Early Cretaceous) pelagic environments. Geologica Carpathica, 51(4), pp.229-243.
Reuber, K.R., Pindell, J. and Horn, B.W., 2016. Demerara Rise, offshore Suriname: Magma-rich segment of the Central Atlantic Ocean, and conjugate to the Bahamas hot spot. Interpretation, 4(2), pp.141-155.
Sapin, F., Davaux, M., Dall'Asta, M., Lahmi, M., Baudot, G. and Ringenbach, J.C., 2016. Post-rift subsidence of the French Guiana hyper-oblique margin: from rift-inherited subsidence to Amazon deposition effect. Geological Society, London, Special Publications, 431(1), pp.125-144.
Schlanger, S.O., Arthur, M.A., Jenkyns, H.C. and Scholle, P.A., 1987. The Cenomanian-Turonian Oceanic Anoxic Event, I. Stratigraphy and distribution of organic carbon-rich beds and the marine δ13C excursion. Geological Society, London, Special Publications, 26(1), pp.371-399.
Zinecker, M.P., Serrano-Suarez, B.E. and Mann, P., 2018. Mesozoic Tectonostratigraphy of the Guinea Plateau, West Africa, Records Successive Rift Phases of the Central and Equatorial Atlantic. In AAPG ACE 2018.
Sheriff, R.E., 1976. Inferring stratigraphy from seismic data. AAPG Bulletin, 60(4), pp.528-542.
Sheriff, R.E., 1977. Limitations on Resolution of Seismic Reflections and Geologic Detail Derivable from Them: Section 1. Fundamentals of Stratigraphic Interpretation of Seismic Data.
Sibuet, J.C. and Mascle, J., 1978. Plate kinematic implications of Atlantic equatorial fracture zone trends. Journal of Geophysical Research: Solid Earth, 83(B7), pp.3401-3421.
Snyder, R.L. and Bish, D.L. 1989. Quantitative analysis. In: Bish, D.L., Post, J.E. (Eds), Modern Powder Diffraction, Reviews in Mineralogy, Volume 20, Mineralogical Society of America, USA, pp. 101-144 (Chapter 5).
Sømme, T.O., Helland‐Hansen, W., Martinsen, O.J. and Thurmond, J.B., 2009. Relationships between morphological and sedimentological parameters in source‐to‐sink systems: a basis for predicting semi‐quantitative characteristics in subsurface systems. Basin Research, 21(4), pp.361-387.
Soto, M., Morales, E., Veroslavsky, G., de Santa Ana, H., Ucha, N. and Rodríguez, P., 2011. The continental margin of Uruguay: Crustal architecture and segmentation. Marine and Petroleum Geology, 28(9), pp.1676-1689.
Staatsolie, Suriname National Oil Company, 2013. Suriname International Competitive Bid Round, http://www.staatsolie.com/pio/images/stories/PDF/suriname_international_bidding_round2013.pdf.
Stonecipher, S.A., 1999. Genetic Characteristics of Glauconite and Siderite: Implications for the Origin of Ambiguos Isolated Marine Sandbodies.
Stratigraphic architecture, Guyanas continental margin
240
Tallobre, C., Loncke, L., Bassetti, M.A., Giresse, P., Bayon, G., Buscail, R., de Madron, X.D., Bourrin, F., Vanhaesebroucke, M. and Sotin, C., 2016. Description of a contourite depositional system on the Demerara Plateau: Results from geophysical data and sediment cores. Marine Geology, 378, pp.56-73.
Thibault, N. and Gardin, S., 2006. Maastrichtian calcareous nannofossil biostratigraphy and paleoecology in the Equatorial Atlantic (Demerara Rise, ODP Leg 207 Hole 1258A). Revue de micropaléontologie, 49(4), pp.199-214.
Tsikalas, F., Faleide, J.I. and Eldholm, O., 2001. Lateral variations in tectono-magmatic style along the Lofoten–Vesterålen volcanic margin off Norway. Marine and Petroleum Geology, 18(7), pp.807-832.
Ugwu-Oju, O., 2018. Clinothems of the Cretaceous Berbice Canyon, Offshore Guyana (Doctoral dissertation, Colorado School of Mines. Arthur Lakes Library).
Vail, P.R., Mitchum, R.M., Shipley, T.H. and Buffler, R.T., 1980. Unconformities of the North Atlantic. Philosophical Transactions of the Royal Society of London. Series A, Mathematical and Physical Sciences, 294(1409), pp.137-155.
van Helden, B.G.T., 1986. Dinoflagellate cysts at the Jurassic-Cretaceous boundary, offshore Canada. Palynology, 10:181-199.
Watkins, D. K. and Bowdler, J.L., 1984. Cretaceous calcareous nannofossils from Deep Sea Drilling Project Leg 77, Southeast Gulf of Mexico. In: Buffler, R.T; Schlager, W. et al. (eds.). Initial Reports of the Deep-Sea Drilling Project, Washington (U.S. Govt. Printing Office), 77, pp. 659-674.
Watkins, D.K., Cooper, M.J., and Wilson, P.A., 2005. Calcareous nannoplankton response to late Albian oceanic anoxic event 1d in the western North Atlantic. Paleoceanography, Vol. 20, PA2010, pp. 1-14.
Watts, A.B. and Stewart, J., 1998. Gravity anomalies and segmentation of the continental margin offshore West Africa. Earth and Planetary Science Letters, 156(3-4), pp.239-252.
Watts, A.B., Rodger, M., Peirce, C., Greenroyd, C.J. and Hobbs, R.W., 2009. Seismic structure, gravity anomalies, and flexure of the Amazon continental margin, NE Brazil. Journal of Geophysical Research: Solid Earth, 114(B7).
Wheeler, H. E. 1958. Time-stratigraphy. American Association of Petroleum Geologists Bulletin, 42, pp.1047–1063.
Wilson, J.T., 1966. Did the Atlantic close and then re-open? Nature, 211(5050), pp.676-681.
Yang, W. and Escalona, A., 2011. Tectonostratigraphic evolution of the Guyana Basin. AAPG bulletin, 95(8), pp.1339-1368.

241
6 Synthesis
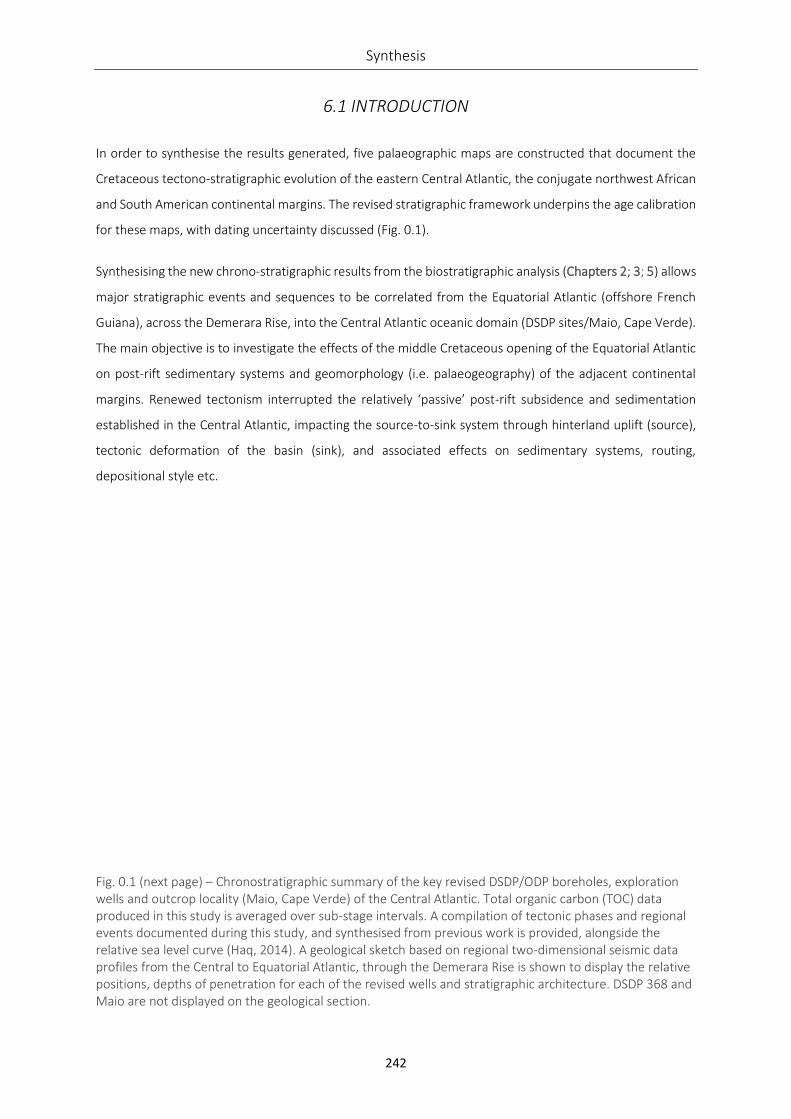
Synthesis
242
6.1 INTRODUCTION
In order to synthesise the results generated, five palaeographic maps are constructed that document the
Cretaceous tectono-stratigraphic evolution of the eastern Central Atlantic, the conjugate northwest African
and South American continental margins. The revised stratigraphic framework underpins the age calibration
for these maps, with dating uncertainty discussed (Fig. 0.1).
Synthesising the new chrono-stratigraphic results from the biostratigraphic analysis (Chapters 2; 3; 5) allows
major stratigraphic events and sequences to be correlated from the Equatorial Atlantic (offshore French
Guiana), across the Demerara Rise, into the Central Atlantic oceanic domain (DSDP sites/Maio, Cape Verde).
The main objective is to investigate the effects of the middle Cretaceous opening of the Equatorial Atlantic
on post-rift sedimentary systems and geomorphology (i.e. palaeogeography) of the adjacent continental
margins. Renewed tectonism interrupted the relatively ‘passive’ post-rift subsidence and sedimentation
established in the Central Atlantic, impacting the source-to-sink system through hinterland uplift (source),
tectonic deformation of the basin (sink), and associated effects on sedimentary systems, routing,
depositional style etc.
Fig. 0.1 (next page) – Chronostratigraphic summary of the key revised DSDP/ODP boreholes, exploration wells and outcrop locality (Maio, Cape Verde) of the Central Atlantic. Total organic carbon (TOC) data produced in this study is averaged over sub-stage intervals. A compilation of tectonic phases and regional events documented during this study, and synthesised from previous work is provided, alongside the relative sea level curve (Haq, 2014). A geological sketch based on regional two-dimensional seismic data profiles from the Central to Equatorial Atlantic, through the Demerara Rise is shown to display the relative positions, depths of penetration for each of the revised wells and stratigraphic architecture. DSDP 368 and Maio are not displayed on the geological section.
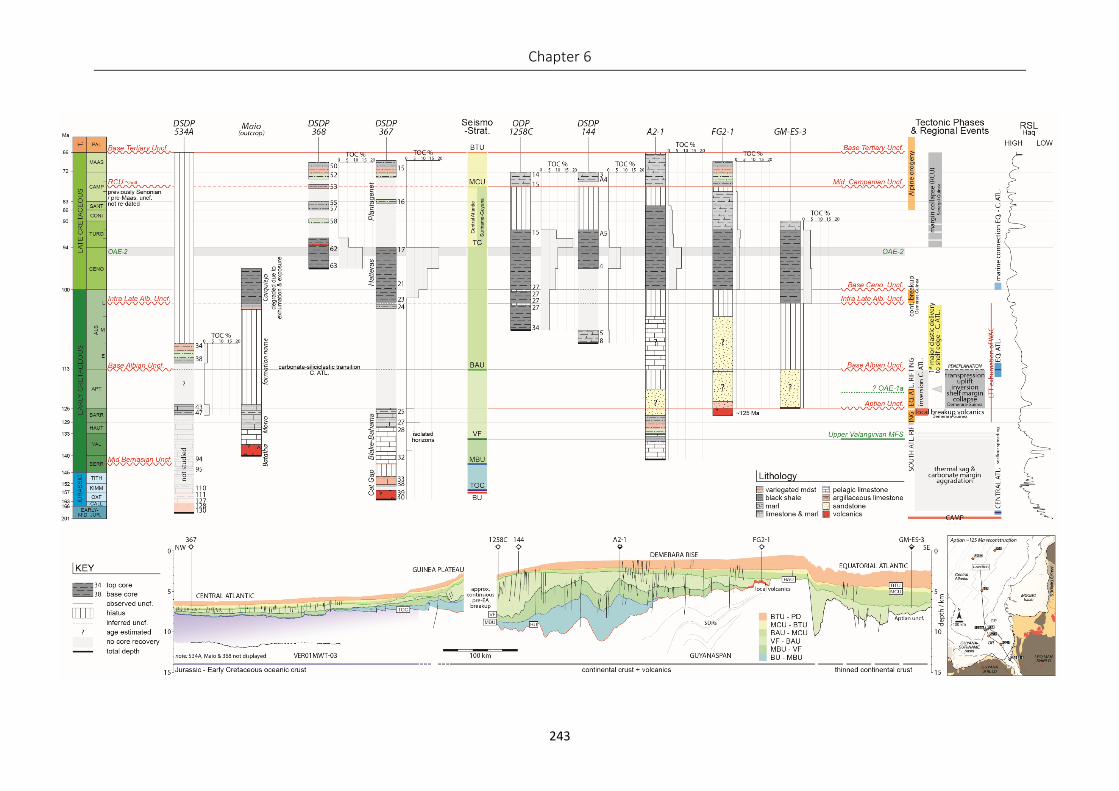
Chapter 6
243
Synthesis
244
Data produced in this study is integrated with an extensive compilation of data from existing studies. All
published work utilised is documented in Table 0.1. The tectonic framework and reconstructions for the
palaeogeographic maps is supported by the Geognostic Earth Model (GEM, 2020), modified where
appropriate to reflect the new evidence. Additional exploration well data (primarily end-of-well reports and
digital logs) from Senegal were provided by Petrosen, as well as limited information from other published
studies and company presentations. Observations from the available seismic datasets are incorporated.
To link the studied sedimentary response in the ‘sink’ to the geological evolution of the hinterland i.e.
‘source’, additional results from North Africa Research Group exhumation studies (low-temperature
thermochronology – Gouiza et al., 2019), provenance models (Mourlot et al., 2018b) and subsidence analysis
(Latil-Brun & Lucazeau, 1988) are amalgamated. However, it must be acknowledged that the resolution of
the hinterland studies is much broader and of a lower order of temporal resolution than the stratigraphic
framework developed based on the biostratigraphy and well database.
The generated maps record five different depositional environments spanning non-marine to deep marine.
Facies data for the wells that penetrate the mapped succession are drawn as pie charts for each individual
well. Wells that penetrate stratigraphy younger and older than the mapped strata, but do not recover
sediments of the mapped age are also added to indicate a recognised hiatus (for example, if the well reaches
total depth (TD) in Paleozoic sediments and the immediately overlying sequence is Albian in age, a hiatus is
interpreted through the intervening pre-Albian time stages). Significant structural features are also
displayed. The available data is used to predict major sediment input points linked to depocentres on the
shelf and in the basin. For the organic-rich intervals, latest Albian to Cenomanian-Turonian boundary,
average total organic carbon percentage is recorded for each well, with the dominant organic matter type.
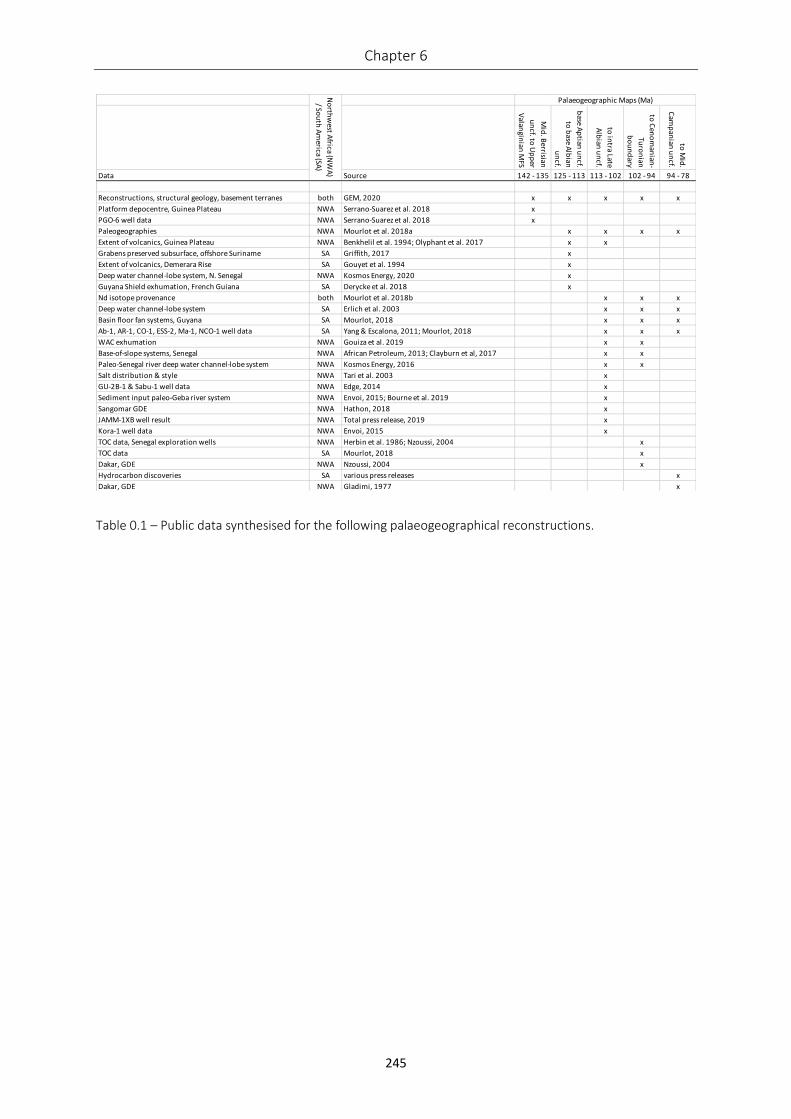
Chapter 6
245
Table 0.1 – Public data synthesised for the following palaeogeographical reconstructions.
Mid
. Berrisian
un
cf. to U
pp
er
Valan
ginian
MFS
base A
ptian
un
cf.
to b
ase Alb
ian
un
cf.
to in
tra Late
Alb
ian u
ncf.
to C
eno
man
ian-
Turo
nian
bo
un
dary
to M
id.
Cam
pan
ian u
ncf.
Data Source 142 - 135 125 - 113 113 - 102 102 - 94 94 - 78
Reconstructions, structural geology, basement terranes both GEM, 2020 x x x x x
Platform depocentre, Guinea Plateau NWA Serrano-Suarez et al. 2018 x
PGO-6 well data NWA Serrano-Suarez et al. 2018 x
Paleogeographies NWA Mourlot et al. 2018a x x x x
Extent of volcanics, Guinea Plateau NWA Benkhelil et al. 1994; Olyphant et al. 2017 x x
Grabens preserved subsurface, offshore Suriname SA Griffith, 2017 x
Extent of volcanics, Demerara Rise SA Gouyet et al. 1994 x
Deep water channel-lobe system, N. Senegal NWA Kosmos Energy, 2020 x
Guyana Shield exhumation, French Guiana SA Derycke et al. 2018 x
Nd isotope provenance both Mourlot et al. 2018b x x x
Deep water channel-lobe system SA Erlich et al. 2003 x x x
Basin floor fan systems, Guyana SA Mourlot, 2018 x x x
Ab-1, AR-1, CO-1, ESS-2, Ma-1, NCO-1 well data SA Yang & Escalona, 2011; Mourlot, 2018 x x x
WAC exhumation NWA Gouiza et al. 2019 x x
Base-of-slope systems, Senegal NWA African Petroleum, 2013; Clayburn et al, 2017 x x
Paleo-Senegal river deep water channel-lobe system NWA Kosmos Energy, 2016 x x
Salt distribution & style NWA Tari et al. 2003 x
GU-2B-1 & Sabu-1 well data NWA Edge, 2014 x
Sediment input paleo-Geba river system NWA Envoi, 2015; Bourne et al. 2019 x
Sangomar GDE NWA Hathon, 2018 x
JAMM-1XB well result NWA Total press release, 2019 x
Kora-1 well data NWA Envoi, 2015 x
TOC data, Senegal exploration wells NWA Herbin et al. 1986; Nzoussi, 2004 x
TOC data SA Mourlot, 2018 x
Dakar, GDE NWA Nzoussi, 2004 x
Hydrocarbon discoveries SA various press releases x
Dakar, GDE NWA Gladimi, 1977 x
Palaeogeographic Maps (Ma)
No
rthw
est Africa (N
WA
)
/ Sou
th A
merica (SA
)
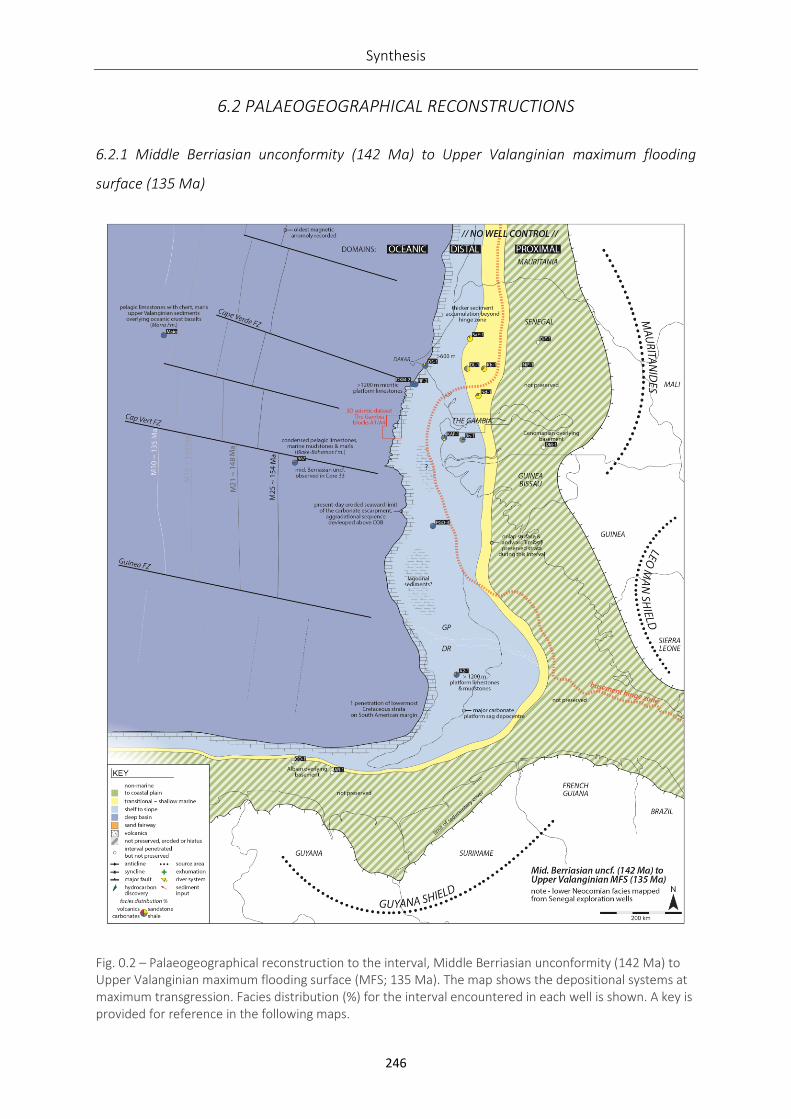
Synthesis
246
6.2 PALAEOGEOGRAPHICAL RECONSTRUCTIONS
6.2.1 Middle Berriasian unconformity (142 Ma) to Upper Valanginian maximum flooding
surface (135 Ma)
Fig. 0.2 – Palaeogeographical reconstruction to the interval, Middle Berriasian unconformity (142 Ma) to Upper Valanginian maximum flooding surface (MFS; 135 Ma). The map shows the depositional systems at maximum transgression. Facies distribution (%) for the interval encountered in each well is shown. A key is provided for reference in the following maps.
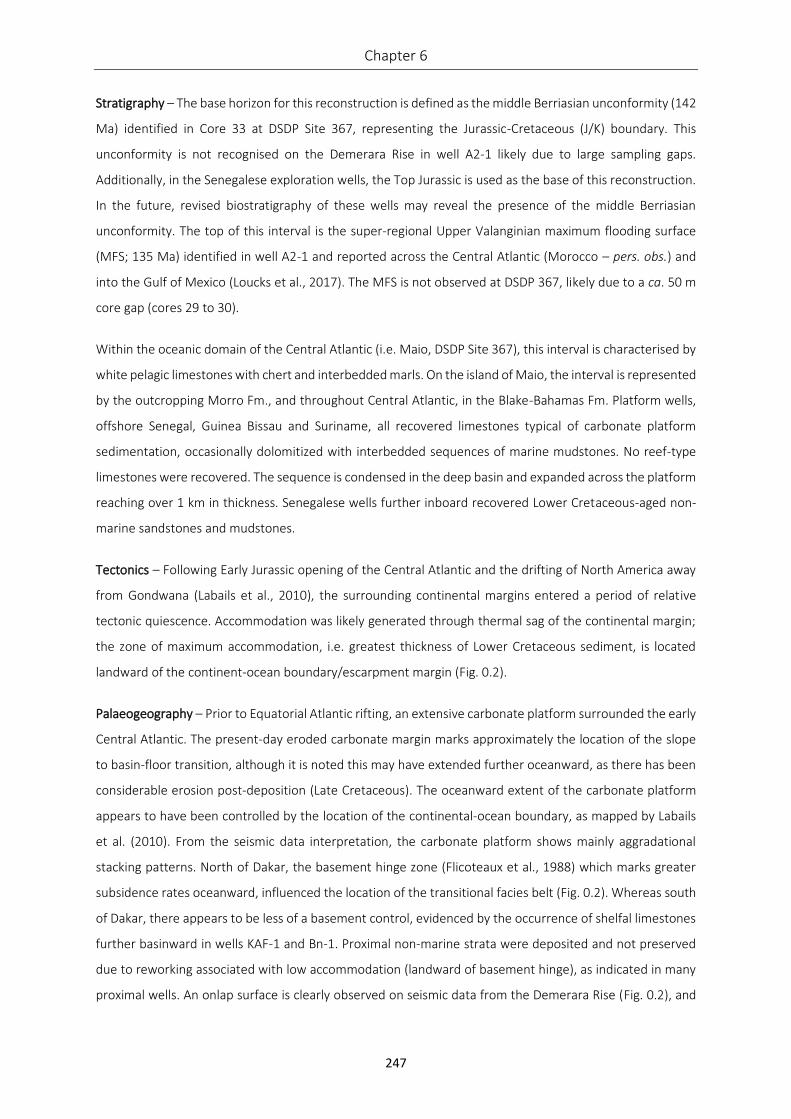
Chapter 6
247
Stratigraphy – The base horizon for this reconstruction is defined as the middle Berriasian unconformity (142
Ma) identified in Core 33 at DSDP Site 367, representing the Jurassic-Cretaceous (J/K) boundary. This
unconformity is not recognised on the Demerara Rise in well A2-1 likely due to large sampling gaps.
Additionally, in the Senegalese exploration wells, the Top Jurassic is used as the base of this reconstruction.
In the future, revised biostratigraphy of these wells may reveal the presence of the middle Berriasian
unconformity. The top of this interval is the super-regional Upper Valanginian maximum flooding surface
(MFS; 135 Ma) identified in well A2-1 and reported across the Central Atlantic (Morocco – pers. obs.) and
into the Gulf of Mexico (Loucks et al., 2017). The MFS is not observed at DSDP 367, likely due to a ca. 50 m
core gap (cores 29 to 30).
Within the oceanic domain of the Central Atlantic (i.e. Maio, DSDP Site 367), this interval is characterised by
white pelagic limestones with chert and interbedded marls. On the island of Maio, the interval is represented
by the outcropping Morro Fm., and throughout Central Atlantic, in the Blake-Bahamas Fm. Platform wells,
offshore Senegal, Guinea Bissau and Suriname, all recovered limestones typical of carbonate platform
sedimentation, occasionally dolomitized with interbedded sequences of marine mudstones. No reef-type
limestones were recovered. The sequence is condensed in the deep basin and expanded across the platform
reaching over 1 km in thickness. Senegalese wells further inboard recovered Lower Cretaceous-aged non-
marine sandstones and mudstones.
Tectonics – Following Early Jurassic opening of the Central Atlantic and the drifting of North America away
from Gondwana (Labails et al., 2010), the surrounding continental margins entered a period of relative
tectonic quiescence. Accommodation was likely generated through thermal sag of the continental margin;
the zone of maximum accommodation, i.e. greatest thickness of Lower Cretaceous sediment, is located
landward of the continent-ocean boundary/escarpment margin (Fig. 0.2).
Palaeogeography – Prior to Equatorial Atlantic rifting, an extensive carbonate platform surrounded the early
Central Atlantic. The present-day eroded carbonate margin marks approximately the location of the slope
to basin-floor transition, although it is noted this may have extended further oceanward, as there has been
considerable erosion post-deposition (Late Cretaceous). The oceanward extent of the carbonate platform
appears to have been controlled by the location of the continental-ocean boundary, as mapped by Labails
et al. (2010). From the seismic data interpretation, the carbonate platform shows mainly aggradational
stacking patterns. North of Dakar, the basement hinge zone (Flicoteaux et al., 1988) which marks greater
subsidence rates oceanward, influenced the location of the transitional facies belt (Fig. 0.2). Whereas south
of Dakar, there appears to be less of a basement control, evidenced by the occurrence of shelfal limestones
further basinward in wells KAF-1 and Bn-1. Proximal non-marine strata were deposited and not preserved
due to reworking associated with low accommodation (landward of basement hinge), as indicated in many
proximal wells. An onlap surface is clearly observed on seismic data from the Demerara Rise (Fig. 0.2), and
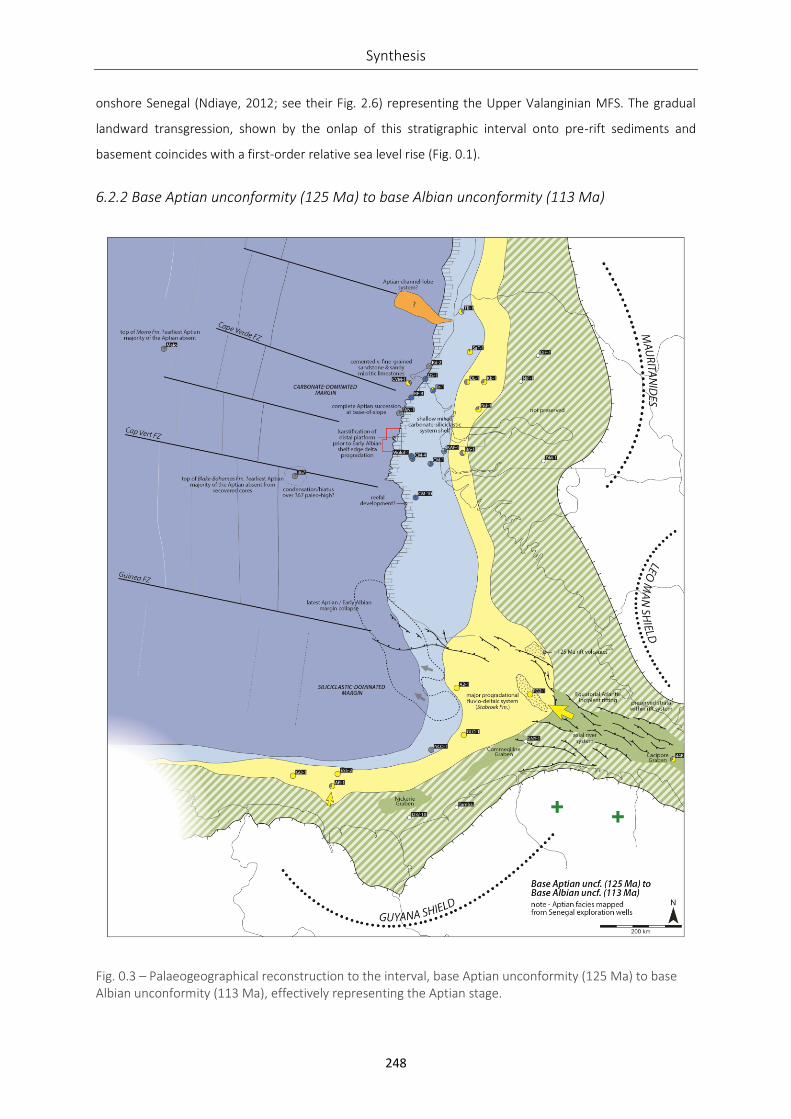
Synthesis
248
onshore Senegal (Ndiaye, 2012; see their Fig. 2.6) representing the Upper Valanginian MFS. The gradual
landward transgression, shown by the onlap of this stratigraphic interval onto pre-rift sediments and
basement coincides with a first-order relative sea level rise (Fig. 0.1).
6.2.2 Base Aptian unconformity (125 Ma) to base Albian unconformity (113 Ma)
Fig. 0.3 – Palaeogeographical reconstruction to the interval, base Aptian unconformity (125 Ma) to base Albian unconformity (113 Ma), effectively representing the Aptian stage.
Chapter 6
249
Stratigraphy – The base of this reconstruction is the base Aptian unconformity (125 Ma). This stratigraphic
surface has not been encountered biostratigraphically in any of the revised wells but is identified in the
Senegalese well database (base Aptian/top Neocomian) and in the literature (Sapin et al., 2016; Olyphant et
al., 2017) as representing temporally the onset of rifting in the Equatorial Atlantic.
An unconformity at this level is supported by seismic interpretation from offshore French Guiana, on the
Demerara Rise and Guinea Plateau (Fig. 5.11). The Aptian interval is sand-rich on the Demerara Rise in the
revised wells, A2-1 and FG2-1. New palynology dating undertaken as part of this study was unable to detect
the base Aptian unconformity, due to a combination of poor palynological recovery and low sampling
resolution. The interval extends up to the base Albian unconformity (113 Ma) discussed in more detail in the
following section, and is therefore representative of the entire Aptian stratigraphy in the Central Atlantic.
Throughout the Senegalese wells, the base Albian unconformity is equivalent to the top Aptian pick, which
is typically taken as the top of the carbonate platform. No new biostratigraphical analysis of these wells has
been performed to verify this.
The uppermost Morro Fm. on Maio and the equivalent Blake-Bahama Fm. in DSDP Site 367 is of Late
Barremian age (Fig. 0.1). On Maio, an informal ‘upper transitional unit’ can be recognised towards the top
of the Morro Fm., that containing more marly facies, indicating more terrigenous input into the oceanic
domain. There is a clear distinction between carbonate-siliciclastic dominant facies encountered along the
continental margins (Fig. 0.3). The South American margin is sand-rich; with sands in wells A2-1 and FG2-1
being recorded as fine-grained, poorly sorted, immature litho-quartzose sandstones. South of Dakar, the
shelfal wells record limited siliciclastic input, with mainly platform carbonates, and only occasional
calcareous sandstone interbeds. Well CVM-1 is the exception, being dominated by very fine-grained
calcareous sandstones. Additionally, North of Dakar, well TB-1 is sand-dominated.
Tectonics & volcanism – Rifting of the Equatorial Atlantic initiated in the Early Aptian times. Northeast-
southwest orientated extension reactivated CAMP volcanic lineaments and basement terrain boundaries
(GEM, 2020). These CAMP volcanic intrusions orientated northwest-southeast are located throughout
northeast Brazil (Roraima and Cacipore dykes; Marzoli et al., 1999) and are predicted to extend offshore
based on gravity and magnetics data (GEM, 2020). A rift system progressively migrated through the proto-
Equatorial Atlantic forming a series of en-échelon half grabens, i.e. the Cacipore Graben, offshore Brazil,
separated by dextral transforms now preserved as oceanic fracture zones (Pindell, 1985). Extrusive
volcanism associated with the second-phase of rifting is recorded on both the Demerara Rise (well FG2-1)
and Guinea Plateau (wells GU-2B-1 and Sabu-1; Olyphant et al., 2017). Previous work, dated these flood
basalts as 125 Ma (Gouyet et al., 1994) and 120 ± 6 Ma (ESSO, 1978), indicating extrusion during rifting
times. Re-dating of the volcanics in well FG2-1 was not completed in time for inclusion in this study to test
these ages; (samples have been irradiated for argon-argon dating and await final dating). Exhumation of the
Synthesis
250
Guyana Shield in French Guiana is documented by low-temperature thermochronological (LTT) data by
Derycke et al. (2018), postulated to be induced by the renewed tectonism.
Palaeogeography – Progradation of a major fluvio-deltaic system (Stabroek Fm.) across the Demerara Rise
is evidenced by sandstone sequences recorded in wells A2-1, FG2-1 and GLO-1, associated with a thick
depocentre and clinoform geometries observed on seismic (Fig. 5.11B). Post-depositional erosion, due to
emergence and exhumation at the base Albian unconformity, erodes this sand-prone interval on the
Demerara Rise. Whether this system extends onto the conjugate Guinea Plateau is poorly constrained,
however seismic data presented in Edge (2014) shows a much thinner equivalent sequence.
A major axial river system is interpreted to have flowed towards the west (Central Atlantic) through the en-
échelon half grabens, captured drainage systems from both the Leo Man (Africa) and Guyana Shield (South
America). Another fluvio-deltaic system is observed at the palaeo-Essequibo river, evidenced from thick
sands in wells AR-1 (Mourlot, 2018) and ESS-2 (Yang & Escalona, 2011). Offshore Senegal, carbonate
platform sedimentation continued, with occasional incursions of minor siliciclastic systems across a shallow
shelf. Karstification of the most distal Aptian carbonate platform occurred prior to deposition of an Early
Albian shelf edge delta. Karstification may have been sub-aerial or submarine (groundwater percolation). If
sub-aerial karstification, this suggests the distal platform was tilted and emergent in the latest Aptian to
Early Albian, related to regional transpression. Reefal bodies may have developed offshore on rejuvenated
topography (i.e. Wolverine prospect, AGC profond; Garyfalo, 2019). Based on the presence of sands in well
TB-1, sediment input through the palaeo-Senegal river system was established during the Aptian. The
offshore extension of this fluvial system, i.e. slope channel and basin floor fans, was suggested by Kosmos
(2020) following the drilling of well Orca-1.
Organic-enrichment associated with the Early Aptian global oceanic anoxic event (OAE-1A) has not been
encountered in the studied wells, but is hypothesised (Bralower et al., 1993).
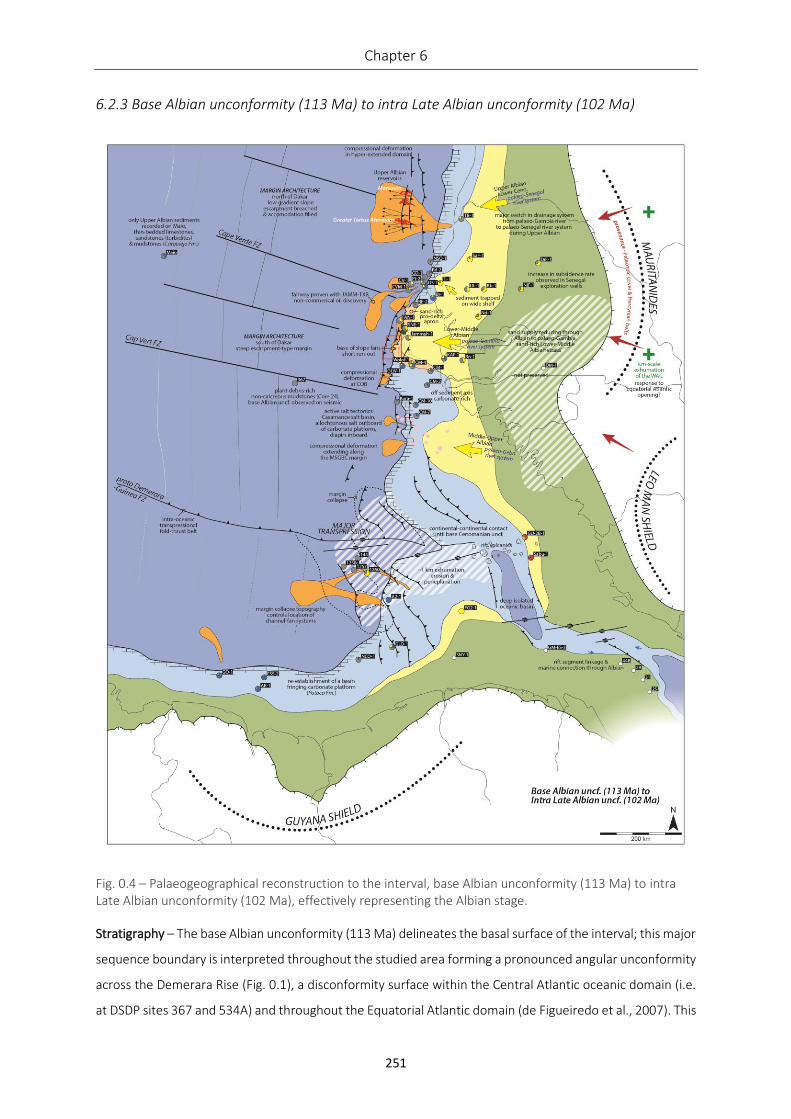
Chapter 6
251
6.2.3 Base Albian unconformity (113 Ma) to intra Late Albian unconformity (102 Ma)
Fig. 0.4 – Palaeogeographical reconstruction to the interval, base Albian unconformity (113 Ma) to intra Late Albian unconformity (102 Ma), effectively representing the Albian stage.
Stratigraphy – The base Albian unconformity (113 Ma) delineates the basal surface of the interval; this major
sequence boundary is interpreted throughout the studied area forming a pronounced angular unconformity
across the Demerara Rise (Fig. 0.1), a disconformity surface within the Central Atlantic oceanic domain (i.e.
at DSDP sites 367 and 534A) and throughout the Equatorial Atlantic domain (de Figueiredo et al., 2007). This
Synthesis
252
unconformity is interpreted from seismic data at DSDP Site 367, as core recovery limits the biostratigraphic
interpretation of the base Albian unconformity at this locality (Fig. 3.10). This disconformity in the oceanic
domain is recognised across the Central Atlantic as Reflector (Jansa et al., 1978). Importantly, sediments
recovered above this unconformity are loosely dated on the Demerara Rise i.e. at well A2-1 the Potoco Fm.
carbonates are Early to Middle Albian in age. We choose to report the oldest age, base Albian, for the age
of the unconformity. This is supported by the interpretation of the base Albian unconformity at DSDP Site
534A (US Atlantic margin), with Early Albian sediments above this event. The top of this interval is defined
by the intra Late Albian (pre-NC10A) unconformity (102 Ma), identified during this study at ODP Site 1258C
on the Demerara Rise (Fig. 0.11).
The Albian stratigraphy on the South American margin is carbonate-dominated. Limestones are encountered
at well A2-1 and offshore Guyana representing the Potoco Fm. platform (Fig. 0.4). Outboard of the carbonate
platform, ODP and DSDP sites on the Demerara Rise recovered calcareous clays with organic matter. Similar
carbonate-dominated facies were observed within the Casamance Marine (CM) wells in southern Senegal.
In The Gambia, and just to the north in Senegal, wells (Jammah-1; SNE-1), drilled on the shelf, are sand-
prone forming the hydrocarbon reservoirs in the Sangomar Field (Clayburn, 2017). These sands are very fine-
grained, ripple laminated, amalgamated to thinly-bedded, and are interpreted to be deposited in a pro-delta
apron by turbidity currents, possibly influenced by shelfal contourite currents (Cunningham-Gray et al.,
2018). In Senegal, away from the major siliciclastic sediment axis, wells become more carbonate-rich i.e. Br-
1 and DS-1. Wells drilled on the Cap Vert peninsula, around Dakar, are mudstone-dominated. In the Central
Atlantic oceanic domain, the base Albian unconformity marks the carbonate-siliciclastic transition, with
Albian sediments at DSDP Site 367 being variegated, plant-debris rich, non-calcareous mudstones; similar
facies are observed at outcrop on Maio at Ribiera do Morro.
Tectonics – Major transpression caused by wrenching of the Equatorial Atlantic resulted in compressional
deformation across the conjugated Demerara Rise and Guinea Plateau (Gouyet, 1988). Compressional
features observed on seismic include thrust faults with associated roll-overs, basement pop-up structures,
imbricate thrusts and broad folding (Fig. 3.9; Fig. 5.13). Up to ca. 1 km of exhumation of the distal Demerara
Rise is indicated, subsequently peneplained by the base Albian unconformity. Additionally, major shelf
margin collapse is documented on the Central Atlantic side of both plateaus, redistributing a voluminous
section of the underlying carbonate platforms associated with the renewed tectonism.
Deformation extended into the Central Atlantic oceanic crust, forming an intra-oceanic transpressional fold-
thrust belt along the proto Demerara-Guinea fracture zone (GEM, 2020). The effects of this tectonism are
observed over 1000 km away along the northwest African continental margin. Thrusting is prominent at the
base of the carbonate platform forming a tight base-of-slope anticline offshore The Gambia (Fig. 4.3). The
deformation is postulated to be located here as the tectonism reactivated lineaments along the continent-
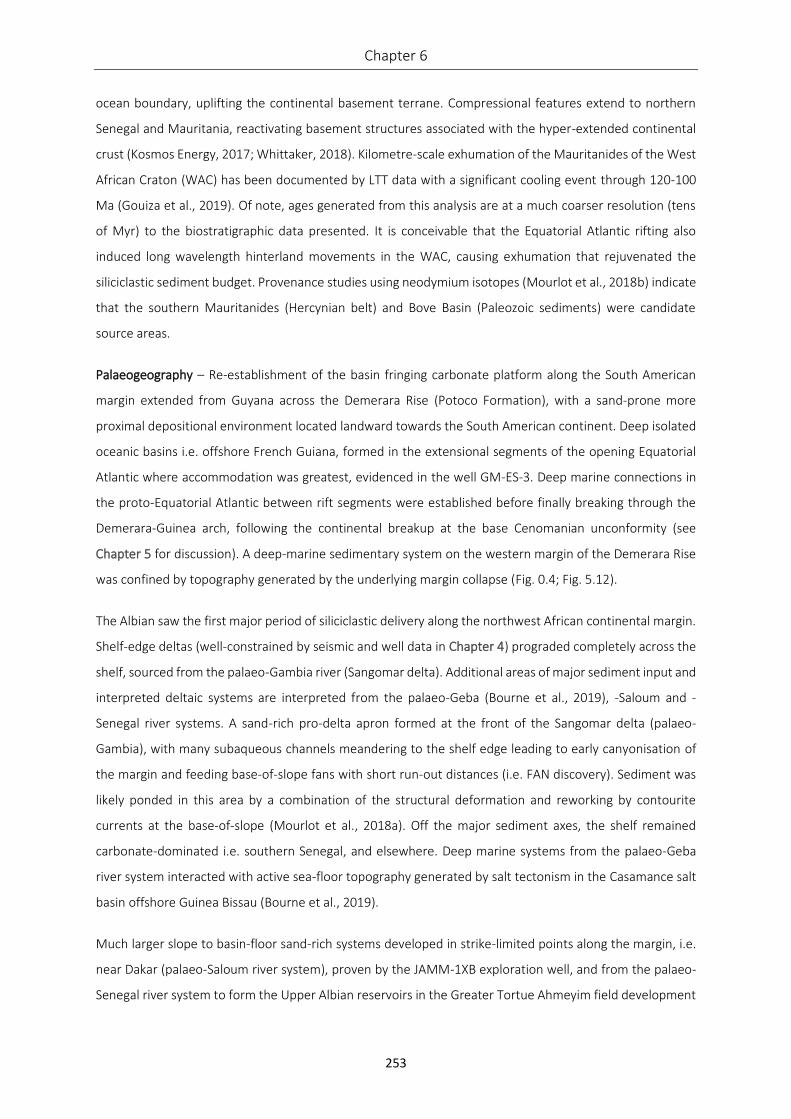
Chapter 6
253
ocean boundary, uplifting the continental basement terrane. Compressional features extend to northern
Senegal and Mauritania, reactivating basement structures associated with the hyper-extended continental
crust (Kosmos Energy, 2017; Whittaker, 2018). Kilometre-scale exhumation of the Mauritanides of the West
African Craton (WAC) has been documented by LTT data with a significant cooling event through 120-100
Ma (Gouiza et al., 2019). Of note, ages generated from this analysis are at a much coarser resolution (tens
of Myr) to the biostratigraphic data presented. It is conceivable that the Equatorial Atlantic rifting also
induced long wavelength hinterland movements in the WAC, causing exhumation that rejuvenated the
siliciclastic sediment budget. Provenance studies using neodymium isotopes (Mourlot et al., 2018b) indicate
that the southern Mauritanides (Hercynian belt) and Bove Basin (Paleozoic sediments) were candidate
source areas.
Palaeogeography – Re-establishment of the basin fringing carbonate platform along the South American
margin extended from Guyana across the Demerara Rise (Potoco Formation), with a sand-prone more
proximal depositional environment located landward towards the South American continent. Deep isolated
oceanic basins i.e. offshore French Guiana, formed in the extensional segments of the opening Equatorial
Atlantic where accommodation was greatest, evidenced in the well GM-ES-3. Deep marine connections in
the proto-Equatorial Atlantic between rift segments were established before finally breaking through the
Demerara-Guinea arch, following the continental breakup at the base Cenomanian unconformity (see
Chapter 5 for discussion). A deep-marine sedimentary system on the western margin of the Demerara Rise
was confined by topography generated by the underlying margin collapse (Fig. 0.4; Fig. 5.12).
The Albian saw the first major period of siliciclastic delivery along the northwest African continental margin.
Shelf-edge deltas (well-constrained by seismic and well data in Chapter 4) prograded completely across the
shelf, sourced from the palaeo-Gambia river (Sangomar delta). Additional areas of major sediment input and
interpreted deltaic systems are interpreted from the palaeo-Geba (Bourne et al., 2019), -Saloum and -
Senegal river systems. A sand-rich pro-delta apron formed at the front of the Sangomar delta (palaeo-
Gambia), with many subaqueous channels meandering to the shelf edge leading to early canyonisation of
the margin and feeding base-of-slope fans with short run-out distances (i.e. FAN discovery). Sediment was
likely ponded in this area by a combination of the structural deformation and reworking by contourite
currents at the base-of-slope (Mourlot et al., 2018a). Off the major sediment axes, the shelf remained
carbonate-dominated i.e. southern Senegal, and elsewhere. Deep marine systems from the palaeo-Geba
river system interacted with active sea-floor topography generated by salt tectonism in the Casamance salt
basin offshore Guinea Bissau (Bourne et al., 2019).
Much larger slope to basin-floor sand-rich systems developed in strike-limited points along the margin, i.e.
near Dakar (palaeo-Saloum river system), proven by the JAMM-1XB exploration well, and from the palaeo-
Senegal river system to form the Upper Albian reservoirs in the Greater Tortue Ahmeyim field development
Synthesis
254
and Marsouin discovery (Kosmos Energy, 2017). In comparison to the palaeo-Gambia river system, where
the majority of the sediment was trapped on the shelf, the Greater Tortue Ahmeyim systems were more
efficient at delivering sediment into the deep basin. This may be related to the volume of sediment
transported by these rivers and/or the margin architecture. North of Dakar, the Albian margin had a low
gradient slope typical of continental margins (e.g. modern-day Equatorial Guinea; Jobe et al., 2011) where
the relief of the underlying carbonate platform had been filled/healed. In contrast, the carbonate
escarpment south of Dakar was affected by the compressional deformation creating ca. 1 km of relief and
exaggerating the steep escarpment-type geometry, which impacts delivery of sediment into the deep basin
by trapping sediment on the shelf. The contrast in the margin architecture and hence sediment routing
systems can also be related to the underlying basement terranes, where features such as the Kaolack fault
(Fig. 0.6), a major terrane boundary, separates the Mauritanide (North) from the Guinea Wedge terrane.
Major progradation of the deltaic systems south of the Kaolack fault possibly indicates that the Guinea
Wedge basement terrane was reactivated and uplifted, supported by the absence of Albian sediments in
well DM-1 (Fig. 0.4).
The arrival of the renewed siliciclastic systems is time-transgressive along the margin. Sands in the Sangomar
delta (palaeo-Gambia) are thickest in the Lower Albian, also recorded in the Middle Albian and decrease into
the Upper Albian; whereas in the north, i.e. palaeo-Senegal river system reservoirs, the onset of sandstone
deposition is later, dated as Upper Albian to Lower Cenomanian. This progradational period is temporally
associated with a first-order fall in relative sea-level (Fig. 0.1), implying eustacy amplified the stratigraphic
response.
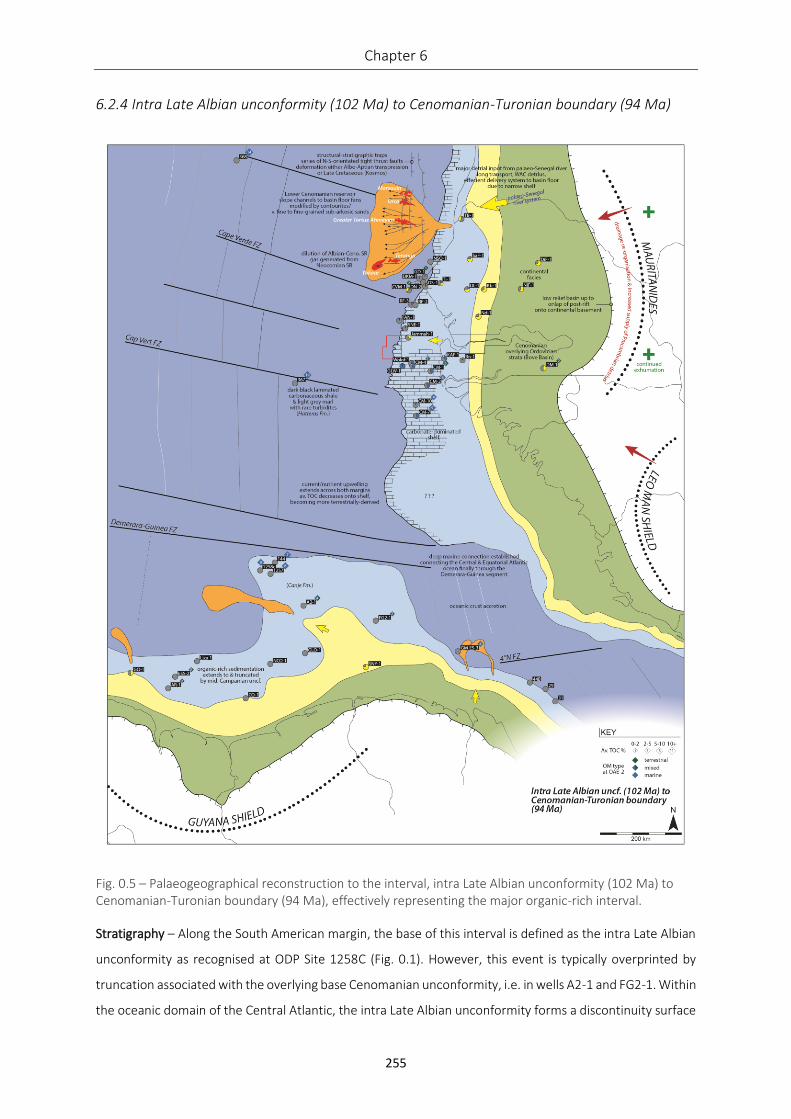
Chapter 6
255
6.2.4 Intra Late Albian unconformity (102 Ma) to Cenomanian-Turonian boundary (94 Ma)
Fig. 0.5 – Palaeogeographical reconstruction to the interval, intra Late Albian unconformity (102 Ma) to Cenomanian-Turonian boundary (94 Ma), effectively representing the major organic-rich interval.
Stratigraphy – Along the South American margin, the base of this interval is defined as the intra Late Albian
unconformity as recognised at ODP Site 1258C (Fig. 0.1). However, this event is typically overprinted by
truncation associated with the overlying base Cenomanian unconformity, i.e. in wells A2-1 and FG2-1. Within
the oceanic domain of the Central Atlantic, the intra Late Albian unconformity forms a discontinuity surface
Synthesis
256
and major facies change discussed below. The Cenomanian-Turonian boundary, above the OAE-2 level, is
taken as upper bounding surface of this interval. The top Cenomanian is biostratigraphically well-constrained
by nannofossil markers, the last occurrence of A. albianus, G. praeobliquum and H. chiastia.
This interval is characterised by high organic enrichment from the latest Albian through the Cenomanian,
with the majority of wells recording a mudstone-dominated sedimentation. Dark black laminated
carbonaceous shales of the Hatteras Fm. are encountered throughout the studied area, i.e. DSDP Site 367.
Distal wells drilled on the Senegalese shelf are typically limestone-dominated, with some more sand-rich
successions. This organic-rich sequence is named the Canje Fm. along the South American margin.
Tectonics – Following the cessation of minor continental-continental collision, due to rotation between the
Demerara Rise and Guinea Plateau, associated with the base Cenomanian unconformity, sea-floor spreading
and oceanic crust accretion resulted in the drifting and separation of the two continents. Passive margins
established on both continents.
Palaeogeography – From Guyana to Brazil, the continental margin was transgressed, with organic-rich
sedimentation extending across the shelf to slope (Fig. 0.5). However, in the deep water, discrete channel-
lobe systems punctuate this mud-prone interval along the margin. Latest Albian (NC10a nannofossil zone),
and younger turbidite systems were established offshore French Guiana, with a short run-out length due to
the narrow steep margin, likely point sourced related to fault topography inherited from the rifting process.
A carbonate-dominated shelf was re-established across much of the northwest African margin. From seismic
observations offshore The Gambia, this sequence transgresses the shelf, shifting depositional environments
landward; a clear transgressive surface is observed above the Albian delta. Jammah-1 recovered
Cenomanian-aged sands (Clayburn, 2017), suggesting continued input through the palaeo-Gambia river
system, albeit backstepped and positioned further inboard.
The palaeo-Senegal river system continued to act a major sediment input point along the margin, with
significant volumes of Lower Cenomanian sands transported to the deep basin by slope channels and basin
floor fans (Fig. 0.5). These form the high-quality reservoirs in multiple gas fields in Senegal-Mauritania,
reported as comprising of very fine- to fine-grained sub-arkosic sands (Kosmos Energy, 2016). Provenance
studies suggest a major drainage reorganisation at this time, capturing more Precambrian detritus from the
Kédougou-Kéniba inlier further to the east (Mourlot et al., 2018b), with continued exhumation of the
hinterland (Gouiza et al., 2019). Climatic models predict a tropical climatic belt to extend across the source
areas (WAC) of the African margin (Saunders, 2016), suggesting an increase in rainfall and denudation rates,
and thus potentially volume of sediment supply.
Organic-enrichment – Although the detail of geochemical data are discussed in previous chapters, a few key
themes are worth summarising here. Organic-enrichment typically peaks in sediments that correlate to the
Chapter 6
257
OAE-2, latest Cenomanian, and also occasionally extending into the Early Turonian, related to relative sea-
level rise, and an expanded Hadley Cell during the Cenomanian-Turonian climate optimum (Wagner et al.,
2013). The onset of organic-enrichment is well calibrated to start in the NC10a nannofossil zone in the latest
Albian. It is appears that the organic-enrichment along the northwest African margin terminates around the
Cenomanian-Turonian boundary, whereas it extends into the Coniacian in Guyana (Canje Fm.) and
Venezuela (La Luna Fm.). This may be related to palaeoceanographic changes related to establishment of
bottom-water connection through the opening Equatorial Atlantic seaway (Friedrich and Erbacher, 2006),
creating a more active ocean floor as currents flowed along the African margin (Mourlot et al., 2018a).
Although not investigated in this study, Cretaceous oceanic red beds (CORBs) described by Hu et al., (2012),
that are present through the Central/North Atlantic, indicate organic-enrichment and subsequent oxidation.
Throughout the studied region, strong nutrient upwelling in coastal regions and in the deep basin elevated
organic-richness (Arthur et al., 1987). This coincided with regional flooding of the shelf during the
Cenomanian-Turonian transgression / highstand and warming global sea-surface temperatures (Erlich et al,
2003). Organic-enrichment is encountered across the shelf, generally less rich (1-5% average TOC) than in
the deep basin (14-19% average TOC; Fig. 0.5). Through this thesis, heterogeneities in the organic-rich
sedimentary facies are reported, and the type of organic-matter is shown to vary primarily dependant on
the proximity to terrestrial organic matter input.
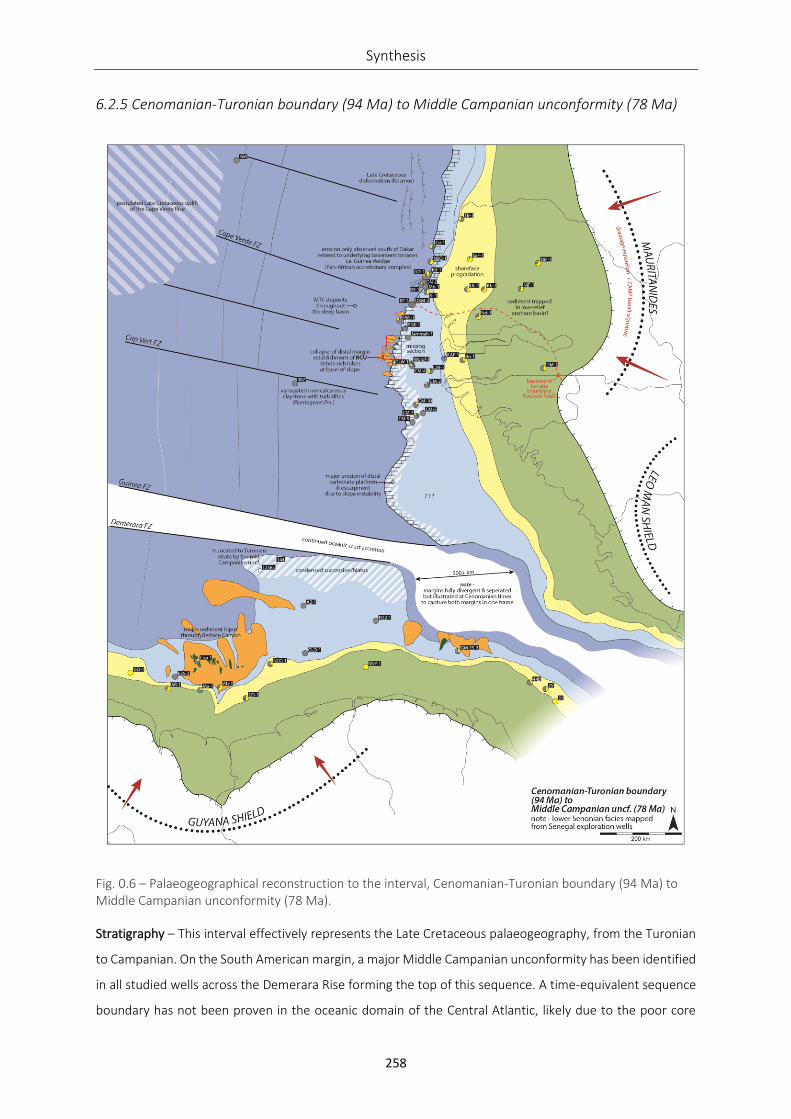
Synthesis
258
6.2.5 Cenomanian-Turonian boundary (94 Ma) to Middle Campanian unconformity (78 Ma)
Fig. 0.6 – Palaeogeographical reconstruction to the interval, Cenomanian-Turonian boundary (94 Ma) to Middle Campanian unconformity (78 Ma).
Stratigraphy – This interval effectively represents the Late Cretaceous palaeogeography, from the Turonian
to Campanian. On the South American margin, a major Middle Campanian unconformity has been identified
in all studied wells across the Demerara Rise forming the top of this sequence. A time-equivalent sequence
boundary has not been proven in the oceanic domain of the Central Atlantic, likely due to the poor core
Chapter 6
259
recovery over this interval in the DSDP wells and resolution in the palynology dating as a consequence of the
low number of samples analysed. However, a regional composite unconformity (RCU – Chapter 4) is now
well documented on the shelf edge south of Dakar (Fig. 0.1). This unconformity was previously termed the
Senonian (Coniacian to Maastrichtian) unconformity (Martin et al., 2010) and the pre-Maastrichtian
unconformity (Hathon, 2018). While no new biostratigraphic analysis of the Senegalese exploration wells
was performed, many of the wells have Campanian sediments resting unconformably on Cenomanian and
older deposits, i.e. wells DKM-2, RF-2, Jammah-1, GLW-1 (Fig. 4.2). Hence, it is interpreted in this study that
these unconformities recognised on the distal continental margins are synchronous and of middle
Campanian age.
Siliciclastic-prone sedimentation occurs throughout the wells on the South American margin (Fig. 0.6). This
interval is truncated by the middle Campanian unconformity in the DSDP and ODP wells on the Demerara
Rise. Mixed lithologies are recorded throughout southern Senegal, and moving further north beyond Dakar,
the wells record sand-rich strata. The two DSDP boreholes in the Central Atlantic are characterised by
variegated non-calcareous claystones with occasional sandy turbidites of the Plantagenet Fm. No sediments
of this age are recorded on the island of Maio (subsequently eroded due to exhumation or not deposited
during uplift).
Tectonics – The two continental margins have fully rifted and have begun drifting away from each other,
with oceanic crust accretion continuing within the opening Equatorial Atlantic. Unconformities (RCU and
Middle Campanian unconformity) developed on both distal margins associated with major slope instability.
Several similarly timed geodynamic events are documented within the Central Atlantic, related by authors
to the distal effects of the Santonian-aged early Alpine Orogeny compressional event, a shift in the pole of
rotation of Atlantic spreading due to continental separation between Africa and South America (Guiraud &
Bosworth, 1997; Labails, 2007) and rifting episodes in Central Africa (Guiraud, 1998). Again, it is interesting
to note that the erosion of the distal platform only occurs south of Dakar i.e. south of the Kaolack fault
terrane boundary. This either suggests that the Guinea Wedge experienced uplift related to the
aforementioned far-field effects of these tectonic events, or the margin architecture (escarpment margin)
was prone to collapse. Similarly, the Middle Campanian unconformity is only registered on the northern
distal margin of the Demerara Rise. These unconformities likely extend into the basin as major sequence
boundaries with associated lowstand delivery of sand-rich systems (i.e. Guyana).
Palaeogeography – This period is the first major delivery of siliciclastic sediment along the South American
margin. Deep-water slope-fan systems are extensive offshore Guyana and Suriname, forming the recently
discovered prolific hydrocarbon reservoirs, fed by sediment shed from the Guyana Shield. Shorter fan
systems exist along the French Guiana margin. By contrast, coeval major deep-marine systems are not
developed along the African margin, perhaps indicating sediment is trapped/stored in the onshore basin at
Synthesis
260
this time, where a wide low relief basin from the shelf landward was established, forming wide facies belts.
Shoreface progradation is documented in northern Senegal (Ndiaye, 2012). Mixed systems interacted on
the distal shelf. Following establishment of the RCU, margin collapse mechanisms dominated deposition in
the basin, with the shelf margin becoming heavily canyonised. Canyons develop retrogressively eroding over
a kilometre into the underlying stratigraphy. Debris-rich lobes are recorded extensively offshore The Gambia
at the base-of-slope; mass transport complexes (MTCs) are present along the entirety of the margin
indicating massive slope instability (Fig. 4.7; Mourlot et al., 2018a). Climatic belts in the Late Cretaceous
shifted south by comparison to the Cenomanian interval, resulting in arid conditions extending across
Senegal; Sauders (2016) model shows the WAC source areas to be still positioned within the tropical climatic
belt.
6.3 SUMMARY
In summary, five Palaeogeographical maps are constructed for tectono-stratigraphic intervals defined in the
revised stratigraphic framework. These maps document our current understanding of southern Central
Atlantic continental margin evolution across the conjugate margins of northwest Africa and northeast South
America, based on findings from this thesis integrated with reviewed published material. With the
Cretaceous focus, the tectono-stratigraphic response of the opening Equatorial Atlantic, a major plate-scale
event is investigated. Spatio-temporal changes in sedimentary systems, margin architecture, siliciclastic
sediment input points and organic-enrichment are constrained at a regional scale. A source-to-sink style
approach links our findings to results from hinterland studies, to be further investigated by NARG. Additional
follow-on work can use these maps as models to be tested and further refined as data and results are
generated within the NARG Geodatabase.
6.4 ACKNOWLEDGEMENTS
Dave Cox and Jonathan Redfern are thanked for reviewing the content of this chapter.
Chapter 6
261
6.5 REFERENCES
African Petroleum, 2013. Corporate presentation, May 2013.
Arthur, M.A., Schlanger, S.T. and Jenkyns, H.C., 1987. The Cenomanian-Turonian Oceanic Anoxic Event, II. Palaeoceanographic controls on organic-matter production and preservation. Geological Society, London, Special Publications, 26(1), pp.401-420.
Barusseau, J.P., Castaigne, P., Duvail, C., Noël, B.J., Nehlig, P., Roger, J., Serrano, O., Banton, O., Comte, J.C., Travi, Y. and Dabo, B., 2009. Notice explicative de la cartographie multi-couches à 1/50 000 et 1/20 000 de la zone d’activité du Cap-Vert. Ministère des Mines, de l’Industrie et des PME, Direction des Mines et de la Géologie, Dakar.
Bourne, M. et al., 2019. New plays in an exploration hotspot: AGC Profond, Senegal and Guinea Bissau. PESGB Africa E&P Conference, London 2019.
Bralower T.J., Sliter W.V., Arthur M.A., Leckie R.M., Allard D., Schlanger S.O. 1993. Dysoxic/anoxic episodes in the Aptian-Albian (Early Cretaceous), The Mesozoic Pacific; geology, tectonics, and volcanism., 77, pp. 5-37.
Clayburn, J. 2017. Realising the deepwater hydrocarbon potential of Senegal. AAPG/SEG 2017 International Conference and Exhibition, London, England. Search and Discovery Article 70345.
Cunningham-Gray, A., Nicholson, U., Stow, D.A.V., Arnold, D., Underhill, J.R., Clayburn, J. and Cullen, B. 2018. Internal architecture and external geometry of sediment waves offshore Senegal. British Sedimentological Research Group 57th AGM.
Derycke, A., Gautheron, C., Bourbon, P., Pinna-Jamme, R., Aertgeerts, G. and Simon-Labric, T. 2018 French Guyana margin evolution: insight by low-temperature thermochronological data. Geosciences Paris Sud.
Edge, R., 2014. Rifting of the Guinea Margin in the Equatorial Atlantic from 112 to 84 MA: Implications of Paleo-reconstructions for Structure and Sea-surface Circulation. Ph.D Thesis. Retrieved from. http://hdl.handle.net/10150/321395.
Envoi, 2015. Offshore Senegal / Guinea-Bissau AGC farm-in on behalf of Oryx Petroleum.
Erlich, R.N., Villamil, T. and Keens-Dumas, J., 2003. Controls on the deposition of Upper Cretaceous organic carbon–rich rocks from Costa Rica to Suriname.
de Figueiredo, JDJP, Zalán, PV and Soares, EF, 2007. Foz do Amazonas Basin. B. Geocience Petrobras , 15 , pp.299-309.
Flicoteaux, R., Latil-Brun, M.V. and Michaud, L., 1988. Histoire de la subsidence post-rift du bassin côtier mauritano-sénégalo-guinéen. Relation avec l'amincissement crustal pendant la période jurassique à Crétacé inférieur. Comparaison avec l'évolution des marges péri-atlantiques au niveau de l'Atlantique Central et Equatorial (côte est des USA, Sud-Sahara, Côte d'Ivoire et Plateau du Demerara). Journal of African Earth Sciences (and the Middle East), 7(2), pp.345-359.
Friedrich, O. and Erbacher, J., 2006. Benthic foraminiferal assemblages from Demerara Rise (ODP Leg 207, western tropical Atlantic): possible evidence for a progressive opening of the Equatorial Atlantic Gateway. Cretaceous Research, 27(3), pp.377-397.
Garyfalou, K. 2019. Exploration in Deep-Water Frontier Basins, CNOOC. PESGB Africa E&P Conference, London 2019.
GEM, 2020. Geognostics Earth Model.
Synthesis
262
Gouiza, M., Bertotti, G., Charton, R., Haimoudane, K., Dunkl, I. and Anczkiewicz, A.A., 2019. New Evidence of Anomalous' Vertical Movements along the Hinterland of the Atlantic NW African Margin. Journal of Geophysical Research: Solid Earth.
Gouyet, S., 1988. Evolution tectono-sédimentaire des marges guyanaise et nord-brésilienne au cours de l'ouverture de l'Atlantique Sud (Doctoral dissertation).
Gouyet, S., Unternehr, P. and Mascle, A., 1994. The French Guyana margin and the Demerara Plateau: geological history and petroleum plays. In Hydrocarbon and petroleum geology of France (pp. 411-422). Springer, Berlin, Heidelberg.
Guiraud, R., 1998. Mesozoic rifting and basin inversion along the northern African Tethyan margin: an overview. Geological Society, London, Special Publications, 132(1), pp.217-229.
Guiraud, R. and Bosworth, W., 1997. Senonian basin inversion and rejuvenation of rifting in Africa and Arabia: synthesis and implications to plate-scale tectonics. Tectonophysics, 282(1-4), pp.39-82.
Haq, B.U., 2014. Cretaceous eustasy revisited. Global and Planetary change, 113, pp.44-58.
Hathon, E., 2018. The SNE Discovery Offshore Senegal-Moving a Frontier Basin to Emergent. In 80th EAGE Conference and Exhibition 2018 (Vol. 2018, No. 1, pp. 1-5). European Association of Geoscientists & Engineers.
Hu, X., Scott, R.W., Cai, Y., Wang, C. and Melinte-Dobrinescu, M.C., 2012. Cretaceous oceanic red beds (CORBs): Different time scales and models of origin. Earth-Science Reviews, 115(4), pp.217-248.
Jansa, L., Gardner, J.V. and Dean, W.E. 1978. Mesozoic sequences of the central North Atlantic.
Jobe, Z.R., Lowe, D.R. and Uchytil, S.J., 2011. Two fundamentally different types of submarine canyons along the continental margin of Equatorial Guinea. Marine and Petroleum Geology, 28(3), pp.843-860.
Khatib R., Ly A., Sow E. and Sarr R., 1990. Rythmes sédimentaires liés aux variations eustatiques globales au Campanien et au Maastrichtien du Sénégal. Révision stratigraphique de la série du Crétacé terminal du Cap de Naze. Comptes rendus Académie des sciences. Paris, t. 311, série II, p. 1089-1095.
Kosmos Energy, 2016 The Petroleum System of the Deepwater Mauritania / Senegal & the discovery of the Ahmeyim Field
Kosmos Energy, 2020. Yakaar-2 Appraisal Well Confirms World-scale Gas Resource Offshore Senegal, press release. Available at: [http://investors.kosmosenergy.com/news-releases/news-release-details/yakaar-2-appraisal-well-confirms-world-scale-gas-resource].
Labails, C., 2007. La marge sud-marocaine et les premières phases d'ouverture de l'océan Atlantique Central. (Doctoral dissertation) Université de Bretagne Occidentale, France.
Labails, C., Olivet, J.L., Aslanian, D. and Roest, W.R., 2010. An alternative early opening scenario for the Central Atlantic Ocean. Earth and Planetary Science Letters, 297(3-4), pp.355-368.
Loucks, R.G., Kerans, C., Zeng, H. and Sullivan, P.A., 2017. Documentation and characterization of the Lower Cretaceous (Valanginian) Calvin and Winn carbonate shelves and shelf margins, onshore northcentral Gulf of Mexico. The American Association of Petroleum Geologists Bulletin, v. 101 (1), pp. 119–142.
Martin, L., Effimoff, I., Medou, J. and Laughland, M., 2010 Hydrocarbon Prospectivity of Offshore Senegal-Unlocking the Door to a New Deepwater Petroleum Province. Search and Discovery Article 10278
Chapter 6
263
Marzoli, A., Renne, P.R., Piccirillo, E.M., Ernesto, M., Bellieni, G. and De Min, A., 1999. Extensive 200-million-year-old continental flood basalts of the Central Atlantic Magmatic Province. Science, 284(5414), pp.616-618.
Mourlot, Y., 2018. Contrôles sur la répartition des argiles organiques dans les bassins profonds: cas de l'Atlantique central au Crétacé (Doctoral dissertation, Université de Toulouse, Université Toulouse III-Paul Sabatier).
Mourlot, Y., Calvès, G., Clift, P.D., Baby, G., Chaboureau, A.C. and Raisson, F., 2018a. Seismic stratigraphy of Cretaceous eastern Central Atlantic Ocean: Basin evolution and palaeoceanographic implications. Earth and Planetary Science Letters, 499, pp.107-121.
Mourlot, Y., Roddaz, M., Dera, G., Calvès, G., Kim, J.H., Chaboureau, A.C., Mounic, S. and Raisson, F., 2018. Geochemical Evidence for Large‐Scale Drainage Reorganization in Northwest Africa during the Cretaceous. Geochemistry, Geophysics, Geosystems, 19(5), pp.1690-1712.
Ndiaye, M., 2012. Etude sismostratigraphique et sédimentologique du Bassin Sénégalo-Mauritanien dans le secteur de Diourbel et Thiès (Doctoral dissertation, University of Geneva).
Nzoussi-Mbassani, P., 2003. Le Cénomano-Turonien de l'Atlantique Nord (bassin du Sénégal): environnement de dépôt et évolution diagénétique (Doctoral dissertation).
Olyphant, J.R., Johnson, R.A. and Hughes, A.N., 2017. Evolution of the Southern Guinea Plateau: Implications on Guinea-Demerara Plateau formation using insights from seismic, subsidence, and gravity data. Tectonophysics, 717, pp.358-371.
Pindell, J.L., 1985. Alleghenian reconstruction and subsequent evolution of the Gulf of Mexico, Bahamas, and proto‐Caribbean. Tectonics, 4(1), pp.1-39.
Sapin, F., Davaux, M., Dall'Asta, M., Lahmi, M., Baudot, G. and Ringenbach, J.C., 2016. Post-rift subsidence of the French Guiana hyper-oblique margin: from rift-inherited subsidence to Amazon deposition effect. Geological Society, London, Special Publications, 431(1), pp.125-144.
Sauders, C. 2016. North-west Africa, Africa’s New Hot Spot? Neftex Exploration Insights.
Sømme, T.O., Helland‐Hansen, W., Martinsen, O.J. and Thurmond, J.B., 2009. Relationships between morphological and sedimentological parameters in source‐to‐sink systems: a basis for predicting semi‐quantitative characteristics in subsurface systems. Basin Research, 21(4), pp.361-387.
Tessier, F., 1952. Contribution à la stratigraphie et à la paléontologie de la partie ouest du Sénégal. Bull. Dir. Mines Afr. Occ. Fr., Dakar, 14, pp.1-267.
Wagner, T., Hofmann, P. and Flögel, S., 2013. Marine black shale deposition and Hadley Cell dynamics: A conceptual framework for the Cretaceous Atlantic Ocean. Marine and Petroleum Geology, 43, pp.222-238.
Whittaker, R.C., 2018. Understanding the characteristics of hyperextended margins to model and predict new hydrocarbon plays in Atlantic deepwater provinces.
Yang, W. and Escalona, A., 2011. Tectonostratigraphic evolution of the Guyana Basin. AAPG bulletin, 95(8), pp.1339-1368.

264
7 Conclusions
Chapter 7
265
The evolution of the continental margins of northwest Africa and northeast South America surrounding the
southern Central Atlantic have been investigated by integrating a variety of new datasets and multi-
disciplinary techniques.
7.1.1 Central Atlantic Stratigraphic Framework
Previous and ongoing NARG research to develop a Central Atlantic stratigraphic framework has been
extended from key well-calibrated reference outcrop sections in Morocco to the Central Atlantic. The
principle objective driving this research is the poor applicability of Tethyan and Boreal frameworks to the
study area. Three exploration wells, seven scientific boreholes and outcrop localities across the island of
Maio, Cape Verde have been re-sampled and analysed. This is supplemented with re-analysis of previously
published material in order to leverage as much biostratigraphic information out of these data. Calcareous
nannofossil, ammonoid, foraminifera, calpionellid and palynology dating have been fully integrated to
provide a much greater age-resolution than previously published. The application of these techniques was
primarily dependant on the sedimentary facies. Although microfossil biostratigraphy has been relied upon
due to the dominant data type being cuttings and core. Uncertainties still remain primarily due to data
limitations (core gaps/sampling program) and the resolution of key bio-events (i.e. correlation to the
reference sections outside Morocco), these have been quantified where recognised. Through this work, it is
clear that various chronometers experience endemism and therefore local zonations are required. These
have been established for the oceanic domain of the Central Atlantic (Maio and DSDP sites) and northeast
South American continental margin.
Key biostratigraphic findings are summarised below:
- Basal ages of two of the key Central Atlantic sections, Maio and well A2-1 (Demerara Rise) have
been considerably revised from the original Jurassic interpretations, to Lower Valanginian and
Tithonian, respectively. This has important consequences for the potential of a Central Atlantic
Jurassic-aged organic-rich interval, plate models and palaeogeographical reconstructions of the
early Central Atlantic.
- Aptian-aged strata are rarely recovered from studied sections, either due to primary data recovery,
post-depositional erosion associated with the base Albian unconformity and/or a basin-wide hiatus.
- The carbonate-siliciclastic transition within the northwest African oceanic domain occurs at the
Aptian-Albian boundary. This event occurs slightly earlier at the base of the Aptian along the
northeast South American margin (Guyana-Suriname basin). In both cases the demise of the Lower
Cretaceous carbonate platform is associated with the first significant siliciclastic sediment influx and
Conclusions
266
establishment of siliciclastic-dominated depositional systems, whether this is a causal relationship
remains to be demonstrated and investigated in detail.
- The onset of marine type organic-enrichment within the studied area of the Central Atlantic occurs
within the Late Albian (nannofossil zone NC10a), this event is well documented in all studied wells,
boreholes and sections. High levels of organic-enrichment (discussed below) persist into the latest
Cenomanian (offshore Senegal, DSDP Site 367), earliest Turonian (offshore Mauritania, DSDP Site
368) and Coniacian to Santonian (Guyana-Suriname basin).
- Major unconformities are identified during the Middle Berriasian (type locality – DSDP Site 367),
base Albian (A2-1), intra Late Albian (ODP Site 1258C), base Cenomanian (ODP Site 1258C/A2-1)
and Middle Campanian (ODP Site 1258C). Additional events may be recognised with access to
additional data in different settings. Despite some of these unconformities only being identified in
one or more studied sections, seismic stratigraphy allows their extent and impact on continental
margin evolution to be realised, and where possible correlated with other published sections to
understand the geographical distribution.
Our comprehensive study of the Mesozoic oceanic domain stratigraphy exposed on Maio provides a modern
and critical revision. Globally, there are very few opportunities to study sediments deposited on the ocean
floor at outcrop after exhumation, especially those of Mesozoic age, only in obduction or oceanic volcanic
island settings. The findings can be used to calibrate the evolution of oceanic volcanic islands formed in intra-
plate settings and create a new age model for the oceanic domain of the. Central Atlantic. Dating of new
material reveals the oldest sedimentary strata on Maio, i.e. basal facies of the Morro Fm. is Lower
Valanginian in age, resting conformably on oceanic crust pillow basalts (Batahla Fm.). The deep-water pelagic
limestones of the Morro Fm. extend through the upper Hauterivian, becoming more marl-rich (upper
transitional unit), reflecting increased terrigenous input into the deep basin until early upper Barremian
times. A major unconformity separates carbonate- and siliciclastic-dominated lithologies, Albian-aged
Carquiejo Fm., containing bleached black shale facies and distal turbidites.
7.1.2 Continental Margin Evolution
Using a combination of the lithological data (facies analysis from well and outcrops), regional 2D and 3D
seismic data (seismic stratigraphy/geomorphology) has helped characterise the Mesozoic depositional
systems within the Central Atlantic, synthesised in five palaeogeographical reconstructions. The location of
3D seismic data offshore The Gambia critically images the shelf to basin floor transition, a key position within
the source-to-sink system and a highly prospective region from a hydrocarbon exploration perspective.
Chapter 7
267
Regional seismic data reveals seaward dipping reflectors (SDRs) northwest of the Guinea Plateau, reported
here for the first time on the African margin. This further demonstrates significant volcanic addition during
early seafloor spreading within the Central Atlantic and links with the occurrences of SDRs documented
below the Demerara Rise and on the eastern US Atlantic margin in Carolina Trough and Blake Plateau. The
SDRs on the African margin are on-trend with the African Blake Spur magnetic anomaly (ABSMA) perhaps
indicating this feature is related to the location of SDRs.
Post-rift pelagic sediments accumulated in the Central Atlantic oceanic domain outboard of the major
carbonate platform until the arrival of a shelf edge delta system during the Early Albian (offshore The
Gambia). This system fed a sand-rich base-of-slope apron and distal turbidites at the foot of the carbonate
escarpment margin. A clear correlation between the active shelfal depositional systems and response within
the oceanic domain is established using the stratigraphic framework and regional seismic profiles.
Shelf margin collapse is documented on both margins during discrete periods within the Cretaceous, this is
associated with submarine canyonisation (The Gambia) and subsequent creation of seabed topography
capable of controlling overlying deep-water sedimentary systems (Guyana). The major margin collapses off
the Demerara Rise and conjugate Guinea Plateau have a combined spatial extent of over 1000 km2. Early
canyonisation of the carbonate escarpment offshore The Gambia occurred due to downslope flowing
turbidity currents originating from the shelf edge delta, and later amplified by retrogressive failure. Our
findings conclusively support a submarine model for the canyonisation, previously considered to be
subaerial.
Through quantified seismic geomorphology, two submarine lobe types in base-of-slope settings are
differentiated offshore The Gambia related to the abundance of carbonate debris from the eroded
escarpment. These recognition criteria were used to provide an estimate of the amount of intra- versus
extra-basinal sediment input into the basin. Quantitative seismic geomorphology shows that the average
volume of sediment transported through shelf-incised canyons is an order of magnitude higher than the
slope-confined systems. Few studies document the seismic geomorphology of buried escarpment margins
and holistically analyse both the canyon features and deposits at the terminus of canyons to understand
their spatio-temporal evolution. Additionally, techniques from hydrogeology were adapted for use in
geospatially mapping the submarine canyon system drainage. This integrated and quantitative methodology
analysing source-to-sink systems is exportable to other datasets in the study of submarine canyon systems
and their deposits.
Through the palaeogeography maps, major basinal depocentres are identified linked to several palaeo-river
systems suggestive of the antecedent and long-lived nature of these fluvial systems. Margin architecture,
which can be inferred to be related to the underlying basement terranes, is postulated as one of the principal
controls on the geometry and location of siliciclastic depositional systems (i.e. deltas, fans). This work
Conclusions
268
contributes to the knowledge of spatial heterogeneities and segmentation of continental margins, linked to
underlying basement and structural inheritance.
7.1.3. Geochemical Analysis
Geochemical and sedimentological analysis of 110 mudstone samples reveals heterogeneities within the
main latest Albian to Cenomanian/Turonian organic-rich interval, one of the key source rock candidates
within the Central Atlantic. Pyrolysis results reveal the varying nature of the organic matter, related to
temporal and spatial variations in terrigenous sediment input, oceanic conditions and palaeogeography
indicating the internal complexity of this sequence. Deeper and older organic-rich intervals form isolated
horizons within the Lower Cretaceous stratigraphy that have terrestrially derived organic matter that thicken
towards the continental margin and have gas-prone source rock potential. Well A2-1 on the Demerara Rise
was used as evidence for a Jurassic source rock within the Central Atlantic, however our new analysis shows
only minor organic-enrichment (<1% TOC). Hence, no Jurassic source rock has been penetrated thus in the
southern Central Atlantic.
7.1.4. Unconformity Development
Several super-regional Cretaceous unconformities have been identified with enhanced dating during this
work from biostratigraphy and seismic interpretation, extending in some cases over 1000 km across the
studied area of the Central Atlantic. Some of these appear to be more local features or restricted to one
domain (i.e. the regional composite unconformity – RCU), whereas most appear to be regional in extent,
with profound but differing character and implications throughout the basin.
Using structural restorations, the base Albian unconformity recognised on the Demerara Rise is linked to a
major transpressional tectonic phase within the opening Equatorial Atlantic system, forming a suite of
compressional features and peneplaning up to 1 km of sediment. Structural and stratigraphic effects
diminish from this epicentre on the Demerara Rise into the Central Atlantic, but still impact the stratigraphic
response in the oceanic domain and are causally linked to exhumation in the hinterland. Deformation and
hiati are not restricted to the continental domains, palaeohighs and intra-oceanic deformation is
documented. In this example, rejuvenated tectonic stresses associated with the opening Equatorial Atlantic
are key drivers in the tectono-stratigraphy. Further work on the conjugate US margin will test how far the
effects of the opening Equatorial Atlantic can be discerned. The RCU that records the submarine collapse of
the distal continental margin of northwest Africa, appears to be driven by far-field tectonic activity and
amplified by erosion during lowstand periods of relative sea-level.
Further insights into the timing and nature of the opening western end of the Equatorial Atlantic can be
discerned from the results of the stratigraphic framework integrated with structural models. Continental
Chapter 7
269
breakup between the Demerara Rise and Guinea Plateau is associated with the base Cenomanian
unconformity, identified for the first time in this study on the Demerara Rise. Prior to this major plate-scale
‘unlocking’ event, oceanic crust had begun to form within the final Equatorial Atlantic rift segment offshore
French Guiana. Furthermore, a marine connection between the Central and Equatorial Atlantic is
demonstrated by middle Late Albian times, this was established over a relatively shallow Demerara-Guinea
arch.
7.2 FUTURE RESEARCH
A brief overview of areas for future research in the Central Atlantic is provided below.
7.2.1 Sediment provenance of sands in the Senegal basin
Through the numerous sampling campaigns of DSDP core, Senegalese exploration wells (Petrosen) and in
the field (Cap de Naze, Cap Rouge), sand-grade material was sampled. Using this data, the principle aims of
would be to investigate any temporal and spatial shifts in sediment provenance using heavy mineral analysis,
characterise the sedimentology and use this to develop source-to-sink models for the margin. Mudstone
samples taken from the DSDP cores (sites 367 and 368) should be analysed for clay minerology studies to
discern provenance switches in the deep basin and climatic controls. Scaling relationships could also be
applied to calculate drainage size, deep-water depositional system length, river length etc. (i.e. Sømme et
al., 2009). Sands have also been sampled from the South American wells so an extension of this study is
possible to compare the signatures of the WAC and Guyana Shield.
7.2.2 Geophysical studies of the MSGBC basin
With increased access to seismic datasets within the MSGBC basin regional isopachs and seismic mapping
will help to characterise the major depocentres and margin architecture and will be useful in refining the
GDE maps presented in this chapter. Additional areas to investigate are as follow:
- Comparison of shelf margin evolution documented offshore The Gambia (Chapter 4) with the
remainder of the margin.
- Structural-focussed study investigating the distal effects of Equatorial Atlantic tectonism, i.e.
faulting, tilting of the carbonate platform, folding at the base-of-slope, karstification of the platform.
- Basement characterisation and definition of a structural domain framework.
- Investigation into the demise of the Lower Cretaceous carbonate platform; did Albian siliciclastic
influx lead to collapse of carbonate sedimentation?
Conclusions
270
- A continued investigation into the results discussed in the synthesis where margin architecture is
recognised to be a major control on the overlying sand-rich depositional systems during the Albian-
Cenomanian. Examining and characterising the sediment input points, i.e. palaeo-Senegal versus
palaeo-Gambia river systems will help to understand the spatial heterogeneities in depositional
systems and associated hydrocarbon reservoirs along the margin.
7.2.3 Regional megasequence characterisation of the US Atlantic margin
During the authors PhD project, sampling of DSDP sediment cores from the US Atlantic margin was
performed (DSDP sites 101A, 105A, 390 and 534A), albeit only partially worked up (Chapter 3). Further work
across the Central Atlantic could be performed, using well and seismic data to characterise the
megasequence and stratigraphic framework and comparing to the two margins studied.
7.2.4 Re-examination of Mesozoic outcrops at Cap de Naze & Cap Rouge
As reported in the introduction of the thesis, the initial field work for this study has been performed and
samples, logs and a photogrammetry dataset collected. Further work, refining the stratigraphic
interpretation of Tessier et al. (1952), Khatib et al. (1990) and Barusseau et al. (2009), and correlating with
the Senegalese exploration wells would improve the characterisation of the Late Cretaceous interval and its
potential as a viable hydrocarbon reservoir.

271


