Embed Size (px)
Citation preview
TARGET SELECTION FROM AIRBORNE MAGNETIC AND
RADIOMETRIC DATA IN STEINHAUSEN AREA, NAMIBIA
A thesis submitted in partial fulfilment of the requirements for the degree of
Masters of Sciences in
Economic Geology
Geology Department
Rhodes University
by
Corus Naudé
January 2012
ABSTRACT
The eastern branch of the late Proterozoic Damara Orogenic Belt of central
Namibia hosts various copper, gold, manganese and uranium deposits, but in
the vicinity of Steinhausen, approximately 145 km northeast of Windhoek, the
Damara Belt becomes increasingly covered by recent Kalahari cover
sediments resulting in little known geology and subsequent lack of discovered
economic mineral deposits.
Airborne magnetic and radiometric data over the Steinhausen Study Area was
enhanced through image processing and filtering to accentuate characteristics
of subsurface geology that, by comparing these characteristics to known
geology, aided in the interpretive mapping of lithology, structure and targets
for follow-up exploration.
As a result, some important observations regarding the regional lithology can
be drawn. An arenaceous stratigraphic unit that includes a coarse grained,
glassy quartzite below the Kuiseb Formation equates to either the eastern
Damaran equivalent of the Nosib Group subjected to high grade
metamorphism or, alternatively, the upper part of the pre-Damaran sequence,
immediately underlying the Damara. The Kuiseb Formation within the study
area is uncharacteristically varied as compared to the same formation further
west along the Damaran Orogen and can be subdivided into 5 separate units
based on geophysical signature.
Structural features evident within the study area include the prominent Kudu-
and Okahandja Lineaments and straddle an area of inferred uplifted
stratigraphy of possibly pre-Damara age. The Ekuja Dome (Kibaran age and
host to the Omitiomire copper deposit) is also clearly discernible on the
airborne magnetic data and is cross-cut by an east-northeast structural zone.

Direct targets for follow-up exploration include the Rodenbeck intrusion,
anomalous magnetic bodies and numerous radiometric anomalies present
within the study area. Identified dome-like features are considered
prospective for Omitiomire-style deposits and the Okatjuru Layered Complex
is considered a possible source of copper, chromite, magnetite, ilmenite,
nickel and the platinum group elements.

ACKNOWLEDGMENTS
I would like to thank Craton Mining for permission to use the data, and Karl
Hartmann (Craton) for information on the Omitiomire copper deposit. Also,
to Remote Exploration Services for providing me with the opportunity to
undertake my studies on a part-time basis.
I would like to express my gratitude to Dr. Branko Corner for his invaluable
guidance as well as for proofing of the thesis, and to my supervisors, the late
Prof. John Moore for his insights and Prof. Yong Yao for his constructive
input.
i
TABLE OF CONTENTS
TABLE OF CONTENTS ..................................................................................................... I
LIST OF TABLES ............................................................................................................. III
LIST OF FIGURES ........................................................................................................... IV
CHAPTER 1 ......................................................................................................................... 1
INTRODUCTION ................................................................................................................... 1
CHAPTER 2 ......................................................................................................................... 6
GEOLOGICAL SETTING ........................................................................................................ 6 2.1 The Damara Orogen .............................................................................................. 6 2.2 Geology of the Steinhausen Study Area ................................................................. 8
CHAPTER 3 ....................................................................................................................... 15
KNOWN MINERAL OCCURRENCES AND DEPOSITS WITHIN STEINHAUSEN PROJECT AREA 15 3.1 Omitiomire copper deposit ................................................................................... 15 3.2 Copper geochemical anomalies ........................................................................... 16 3.3 Manganese occurrences ....................................................................................... 16 3.4 Nickel occurrences ............................................................................................... 17
CHAPTER 4 ....................................................................................................................... 19
MINERAL DEPOSIT MODELS AND SOME EXAMPLES .......................................................... 19 4.1 Matchless stratiform massive sulphides .............................................................. 19
4.1.1 Matchless Mine ........................................................................................................... 20 4.1.2 Otjihase Mine .............................................................................................................. 22 4.1.3 Ongeama Prospect ...................................................................................................... 23
4.2 Kuiseb Formation hosted hydrothermal copper deposits ................................... 23 4.2.1 Onganja Mine .............................................................................................................. 24
4.3 Manganese deposits ............................................................................................. 25 4.3.1 Otjosondu Manganese Field ....................................................................................... 25
4.4 Magmatic Nickel, Copper and Platinum Group Element (PGE) deposits ......... 26 4.4.1 Voisey’s Bay Deposit ................................................................................................. 27 4.4.2 Alpine serpentinites within Damara Orogen .............................................................. 28
4.5 Hydrothermal gold deposits ................................................................................. 28 4.5.1 Navachab Gold Mine .................................................................................................. 29 4.5.2 Ondundu-Otjiwapa Gold Field ................................................................................... 30
4.6 Uranium deposits ................................................................................................. 31 4.6.1 Calcrete-hosted uranium deposits ............................................................................... 32
4.6.1.1 Langer Heinrich Deposit .................................................................................... 32 4.6.2 Classical vein deposits ................................................................................................ 33
4.6.2.1 Schwartzwalder Mine ......................................................................................... 34 4.6.2 Deposits associated with igneous rocks ...................................................................... 34
4.7 Omitiomire-style copper ....................................................................................... 35 4.8 Geophysical expressions of target models ........................................................... 37
CHAPTER 5 ....................................................................................................................... 44
DATASETS AND PROCESSING ........................................................................................... 44 5.1 Geological Data ................................................................................................... 44 5.2 Satellite Imagery ................................................................................................... 47
5.2.1 Landsat ETM+ data..................................................................................................... 47
ii
5.2.2 Shuttle Radar Topography Mission (SRTM) ............................................................. 54 5.3 Geophysical Data ................................................................................................. 56
5.3.1 Airborne radiometric data ........................................................................................... 56 5.3.2 Airborne magnetic data ............................................................................................... 69
5.3.2.1 Total Magnetic Intensity (TMI) ......................................................................... 70 5.3.2.2 First Vertical Derivative (FVD) ......................................................................... 71 5.3.2.3 Reduction to Magnetic Pole (RTP) .................................................................... 72 5.3.2.4 Total Horizontal Derivative (THD) ................................................................... 75 5.3.2.5 Normalised Total Horizontal Derivative (TDX) ............................................... 76 5.3.2.6 Analytic Signal (AS) .......................................................................................... 78 5.3.2.7 Potential Field Tilt Derivative (TDR) ................................................................ 80 5.3.2.8 Horizontal Derivative of the TDR (HD-TDR) .................................................. 82 5.3.2.9 Theta Map ........................................................................................................... 83
CHAPTER 6 ....................................................................................................................... 85
INTERPRETATION AND DISCUSSION .................................................................................. 85 6.1 Structural Mapping .............................................................................................. 88 6.2 Stratigraphy and lithological mapping ................................................................ 90
6.2.1 Features not related to specific stratigraphy ............................................................... 95 6.2.2 Kuiseb Formation ...................................................................................................... 105 6.2.3 Hakos Group, Nosib Group and Eastern Basement ................................................. 111 6.2.4 Pre-Damara Succession ............................................................................................ 113 6.2.5 Okatjuru Layered Complex ...................................................................................... 121 6.2.6 Ekuja-Otjihangwe Nappe Complex .......................................................................... 123
6.3 Discussion ........................................................................................................... 125
CHAPTER 7 ..................................................................................................................... 130
CONCLUSIONS ................................................................................................................ 130
REFERENCES ................................................................................................................. 132
APENDIX A ...................................................................................................................... 138
Metadata Files for Landsat Images: ........................................................................ 138
iii
LIST OF TABLES
Table Page TABLE 2.1: FACIES AND LITHOSTRATIGRAPHY OF THE DAMARA SEQUENCE AS PROPOSED BY
PORADA (1985). ............................................................................................................ 8 TABLE 4.1: NAVACHAB MINERAL RESOURCES AS AT 31 DECEMBER 2010. ......................... 29 TABLE 4.2: EXPECTED GEOPHYSICAL RESPONSE FOR POSSIBLE MINERAL OCCURRENCES IN
STEINHAUSEN PROJECT AREA .................................................................................... 37 TABLE 5.1: LANDSAT ETM+ IMAGE DETAILS ..................................................................... 47 TABLE 5.2: DARK PIXEL EXCLUSION APPLIED TO LANDSAT ETM+ IMAGES ...................... 49 TABLE 5.3: RADIOMETRIC IMAGES STATISTICS .................................................................... 56 TABLE 6.1: SINGULAR MAGNETIC ANOMALIES ..................................................................... 97
iv
LIST OF FIGURES
Figure Page FIGURE 1.1: STEINHAUSEN PROJECT AREA - LOCATION MAP. ........................................... 3 FIGURE 1.2: STEINHAUSEN PROJECT AREA - FARM BOUNDARIES. .................................... 4 FIGURE 2.1: PRINCIPAL SUBDIVISION OF THE INTRACONTINENTAL BRANCH OF THE
DAMARA OROGEN (AFTER PORADA, 1985; CORNER, 2008). ....................................... 6 FIGURE 2.2: GEOLOGICAL SURVEY OF NAMIBIA GEOLOGY MAP. THE STUDY AREA
ENCOMPASSES THE SHOWN LICENSES. ........................................................................ 10 FIGURE 2.3: TECTONOSTRATIGRAPHIC SUBDIVISION OF THE UPPER BLACK NOSSOB
RIVER AREA (AFTER KASCH, 1986). ........................................................................... 11 FIGURE 5.1: EXTENT OF GEOLOGICAL MAPPING BY K.W. KASCH (1998, 2008). ............ 45 FIGURE 5.2: DETAILED GEOLOGICAL MAPPING BY K.W. KASCH (1998, 2008). ............. 46 FIGURE 5.3: FALSE COLOUR IMAGE OF LANDSAT (RED – BAND 4; GREEN – BAND 3;
BLUE – BAND 2). .......................................................................................................... 48 FIGURE 5.4: FALSE COLOUR IMAGE OF LANDSAT (RED – CLAY INDEX; GREEN –
EXTENDED FE INDEX; BLUE – VEGETATION INDEX). ................................................... 51 FIGURE 5.5: FALSE COLOUR IMAGE OF LANDSAT (RED – CLAY INDEX; GREEN –
EXTENDED FE INDEX + CLAY INDEX; BLUE – EXTENDED FE INDEX). ......................... 52 FIGURE 5.6: FALSE COLOUR IMAGE OF LANDSAT DATA OVER EKUJA-DOME AREA. (RED
– CLAY INDEX; GREEN – EXTENDED FE INDEX; BLUE – VEGETATION INDEX). ............ 53 FIGURE 5.7: FALSE COLOUR IMAGE OF LANDSAT DATA OVER EKUJA-DOME AREA. (RED
– CLAY INDEX; GREEN – EXTENDED FE INDEX + CLAY INDEX; BLUE – EXTENDED FE
INDEX). ...................................................................................................................... 54 FIGURE 5.8: SHUTTLE RADAR TOPOGRAPHY MISSION - DIGITAL ELEVATION DATA OVER
STUDY AREA. ............................................................................................................... 55 FIGURE 5.9: HISTOGRAMS OF RADIOMETRIC IMAGES. ..................................................... 57 FIGURE 5.10: TOTAL COUNT RADIOMETRIC DATA. ....................................................... 58 FIGURE 5.11: TERNARY IMAGE OF RADIO-ELEMENT CONCENTRATION. ....................... 59 FIGURE 5.12: TERNARY IMAGE OF RADIO-ELEMENT CONCENTRATION WITH FIRST-
ORDER TREND REMOVED. ............................................................................................ 60 FIGURE 5.13: HISTOGRAMS OF TREND REMOVED RADIOMETRIC IMAGES. ................... 61 FIGURE 5.14: TERNARY IMAGE OF RADIO-ELEMENT CONCENTRATION STRETCHED TO
TC RANGES. ................................................................................................................ 62 FIGURE 5.15: POTASSIUM TO THORIUM RATIO. ............................................................. 64 FIGURE 5.16: URANIUM TO THORIUM RATIO. ............................................................... 65 FIGURE 5.17: SUM-NORMALISED RADIOELEMENT DATA, TERNARY IMAGE. ................ 66 FIGURE 5.18: MAXIMUM-LIKELIHOOD CLASSIFICATION CLUSTER PROPERTIES. .......... 67 FIGURE 5.19: MAXIMUM-LIKELIHOOD CLASSIFICATION OF NORMALISED RADIO-
ELEMENT DATA. .......................................................................................................... 68 FIGURE 5.20: TOTAL MAGNETIC INTENSITY IMAGE FROM THE GSN AIRBORNE
MAGNETIC SURVEY. .................................................................................................... 70 FIGURE 5.21: FIRST VERTICAL DERIVATIVE (FVD) IMAGE FROM THE GSN AIRBORNE
MAGNETIC SURVEY. .................................................................................................... 71 FIGURE 5.22: TOTAL MAGNETIC INTENSITY (TMI) IMAGE FROM THE GSN AIRBORNE
MAGNETIC SURVEY OVER EKUJA DOME. .................................................................... 73 FIGURE 5.23: REDUCED TO MAGNETIC POLE (RTP) IMAGE FROM THE GSN AIRBORNE
MAGNETIC SURVEY OVER EKUJA DOME. .................................................................... 74 FIGURE 5.24: TOTAL HORIZONTAL DERIVATIVE (THD) IMAGE FROM THE GSN
AIRBORNE MAGNETIC SURVEY OVER EKUJA DOME.................................................... 75
v
FIGURE 5.25: NORMALISED TOTAL HORIZONTAL DERIVATIVE (TDX) IMAGE FROM
THE GSN AIRBORNE MAGNETIC SURVEY OVER EKUJA DOME. .................................. 77 FIGURE 5.26: ANALYTIC SIGNAL (AS) IMAGE FROM THE GSN AIRBORNE MAGNETIC
SURVEY OVER EKUJA DOME. ...................................................................................... 79 FIGURE 5.27: POTENTIAL FIELD TILT (TDR) IMAGE DERIVED FROM THE GSN
AIRBORNE MAGNETIC SURVEY TMI OVER EKUJA DOME. .......................................... 81 FIGURE 5.28: HORIZONTAL DERIVATIVE OF THE TDR (HD-TDR) IMAGE DERIVED
FROM THE GSN AIRBORNE MAGNETIC SURVEY TMI OVER EKUJA DOME. ................ 82 FIGURE 5.29: THETA MAP IMAGE DERIVED FROM THE AIRBORNE MAGNETIC SURVEY
TMI OVER EKUJA DOME. ............................................................................................ 83 FIGURE 6.1: FVD FROM THE GSN AIRBORNE MAGNETIC SURVEY OF THE STEINHAUSEN
PROJECT AREA. ........................................................................................................... 86 FIGURE 6.2: TERNARY IMAGE FROM THE GSN AIRBORNE RADIOMETRIC SURVEY OF THE
STEINHAUSEN PROJECT AREA. ................................................................................... 87 FIGURE 6.3: STRUCTURAL INTERPRETATION OF STEINHAUSEN PROJECT AREA. ............ 89 FIGURE 6.4: INTERPRETATION MAP OF STEINHAUSEN PROJECT AREA............................ 91 FIGURE 6.5: LEGEND FOR INTERPRETATION MAP OF STEINHAUSEN PROJECT AREA. ..... 94 FIGURE 6.6: FEATURES NOT RELATED TO SPECIFIC STRATIGRAPHY. ............................... 95 FIGURE 6.7: GEOPHYSICAL INTERPRETATION LEGEND FOR FIGURE 6.6 – FEATURES NOT
RELATED TO SPECIFIC STRATIGRAPHY. ....................................................................... 96 FIGURE 6.8: FORWARD MODEL OF STEINHAUSEN ANOMALY ALONG PROFILE B,B’
(FIGURE 6.6). ............................................................................................................... 99 FIGURE 6.9: ANOMALOUS URANIUM OVER STEINHAUSEN PROJECT AREA. .................. 101 FIGURE 6.10: KUISEB FORMATION; HAKOS GROUP, NOSIB GROUP AND EASTERN
BASEMENT; PRE-DAMARA SUCCESSION. ................................................................. 104 FIGURE 6.11: GEOPHYSICAL INTERPRETATION LEGEND FOR FIGURE 6.10 – KUISEB
FORMATION. .............................................................................................................. 105 FIGURE 6.12: COMPARISON OF MAGNETIC DATA OVER THE MATCHLESS MINE AND
ANOMALIES WITHIN THE KUISEB FORMATION IN THE STEINHAUSEN PROJECT AREA. .. ............................................................................................................... 110
FIGURE 6.13: GEOPHYSICAL INTERPRETATION LEGEND FOR FIGURE 4.10 – HAKOS
GROUP, NOSIB GROUP AND EASTERN BASEMENT. .................................................. 111 FIGURE 6.14: GEOPHYSICAL INTERPRETATION LEGEND FOR FIGURE 4.10 – PRE-
DAMARA SUCCESSION (UPPER ARENACEOUS UNITS POSSIBLY CONSTITUTING THE
NOSIB GROUP). ......................................................................................................... 113 FIGURE 6.15: OKATJURU LAYERED COMPLEX; EKUJA-OTJIHANGWE NAPPE COMPLEX.
............................................................................................................... 120 FIGURE 6.16: GEOPHYSICAL INTERPRETATION (A) AND LEGEND (B) – OKATJURU
LAYERED COMPLEX (FROM FIGURE 6.15). ............................................................... 121 FIGURE 6.17: GEOPHYSICAL INTERPRETATION (A) AND LEGEND (B) – EKUJA-
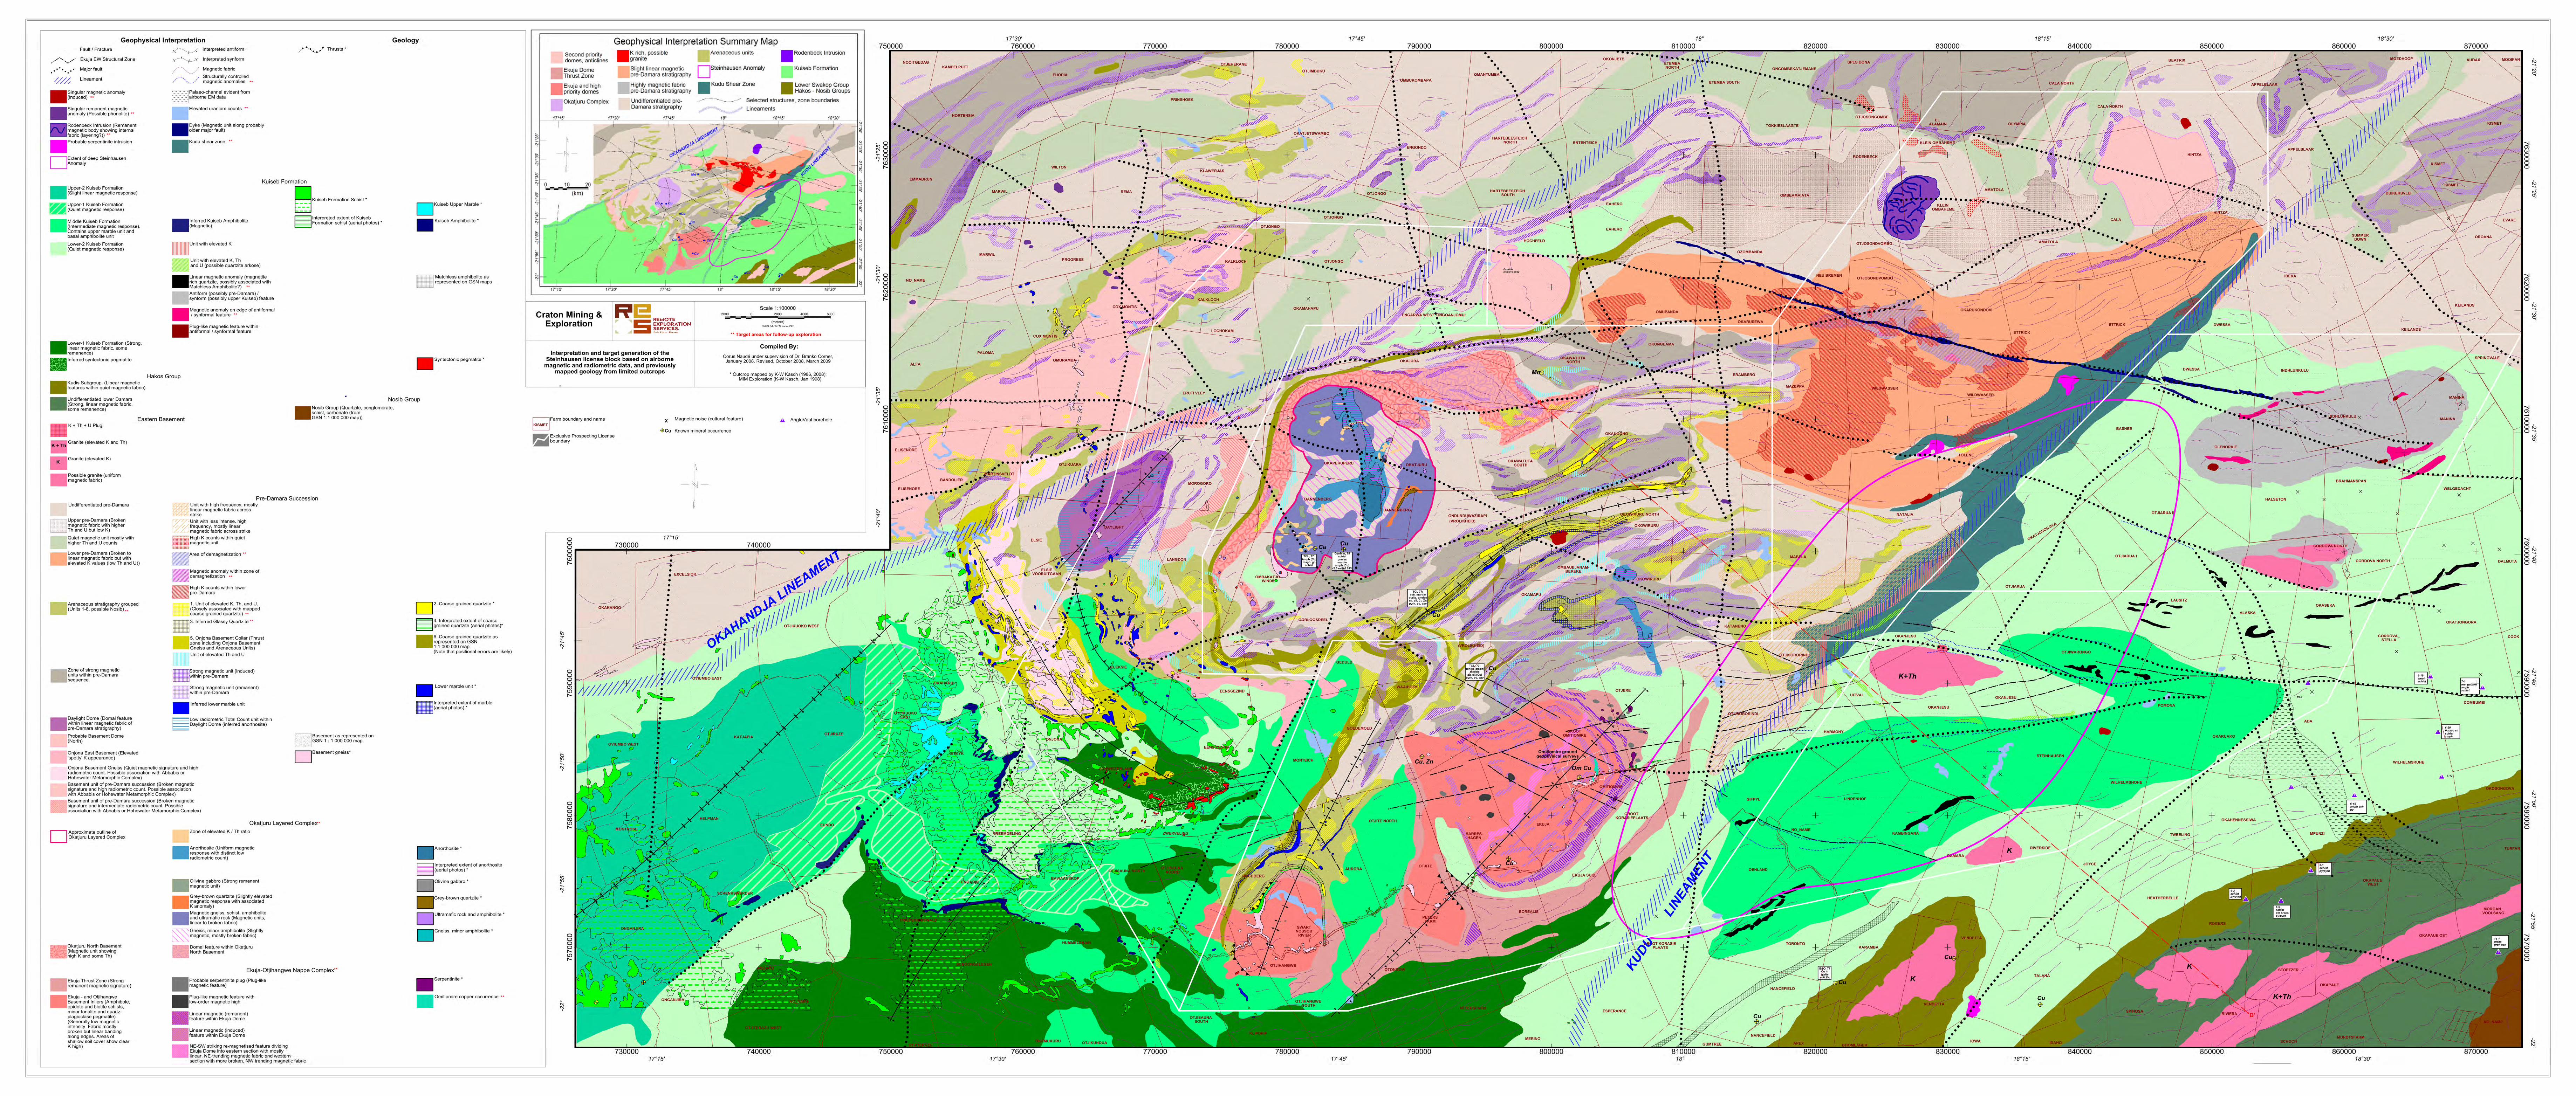
OTIHANGWE NAPPE COMPLEX (FROM FIGURE 6.15). .............................................. 123 FIGURE 6.18: GEOPHYSICAL INTERPRETATION SUMMARY MAP ............................... 128
1
C h a p t e r 1
INTRODUCTION
The northeast-trending branch of the Damara Orogenic Belt of central
Namibia hosts various known mineral deposits, inter alia, the Matchless Belt
stratiform massive sulphide deposits at the Otjihase- and Matchless Mines,
the Omitiomire copper deposit, hydrothermal copper deposits at the Onganja
mine and manganese deposits at the Otjosondu Manganese fields. In the
vicinity of Steinhausen, located approximately 145 km northeast of
Windhoek, the Damara Belt becomes increasingly covered by recent Kalahari
cover sediments resulting in little known geology and subsequent lack of
discovered economic mineral deposits. Regional geophysical data, limited
exposures and past drilling information do, however, confirm the eastward
continuation of the Damara Orogen, making the eastern areas highly
prospective.
With this in mind, Cheetah Minerals Exploration (Pty) Ltd (Cheetah) acquired
an Exclusive Reconnaissance License (ERL 74) over the Steinhausen Area
that was investigated using published mapping, historic exploration results
and the latest airborne geophysical data (Corner, 2006). Based on initial
findings Exclusive Prospecting Licenses (EPL) were then acquired over the
area.
Geological mapping of the area is severely hindered by the extensive Kalahari
cover sediments. To overcome this fact, Craton Mining and Exploration
(Pty) Ltd. (Craton) in Joint Venture with Cheetah, commissioned a detailed
geophysical interpretation of the area in order to identify possible exploration
targets within the 6 EPLs (collectively known as the Steinhausen License
Block).
2
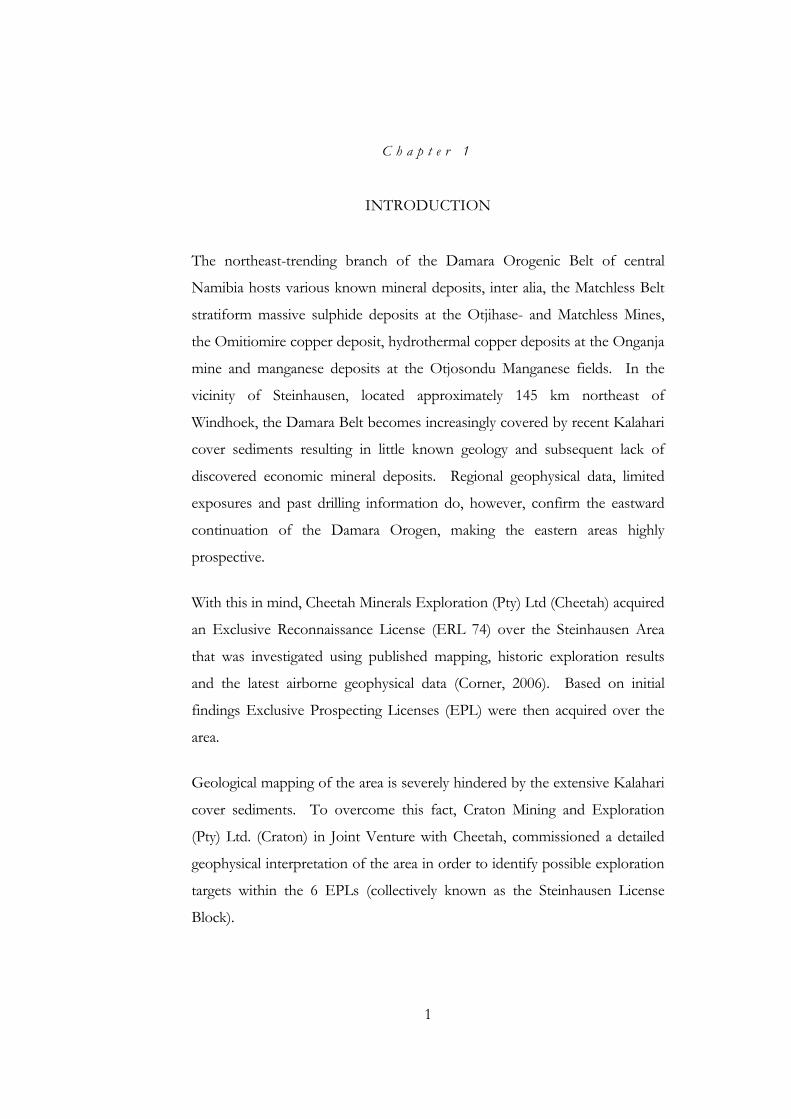
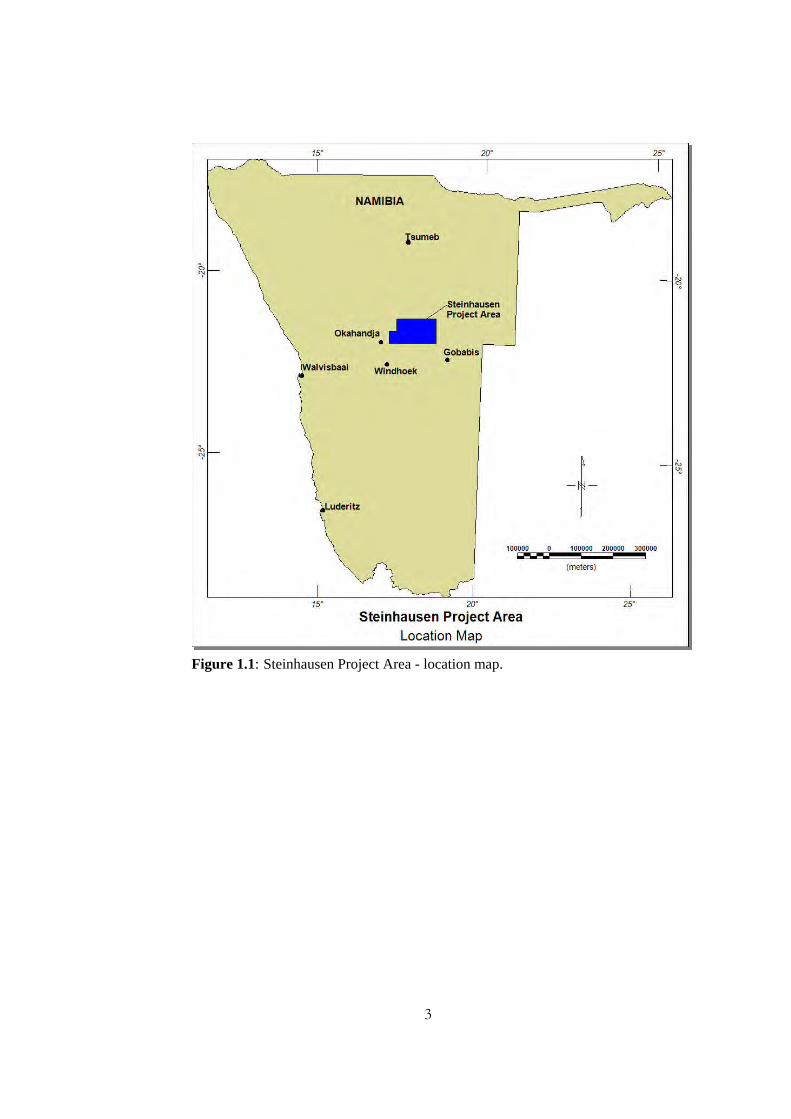
The object of this study is to compile a synergistic interpretation of the
Steinhausen Area, an area of 10,237 km2 encompassing the Steinhausen
Licence Block (Figure 1.1), using existing airborne geophysical data as well as
all other available geological information, in order to derive prospective target
areas for follow-up exploration.
Geophysical datasets comprising medium resolution airborne magnetic and
radiometric data were purchased from the Geological Survey of Namibia
(GSN). Other products purchased from the GSN include preliminary digital
1:250,000 maps for the Windhoek and Otjiwarongo sheets as well as the 1980
1:1,000,000 digital Geological Map of Namibia. Additional geological data,
that became available as the project progressed, included detailed field
mapping by Dr. Karl Kasch in selected areas, as well as exploration borehole
information.
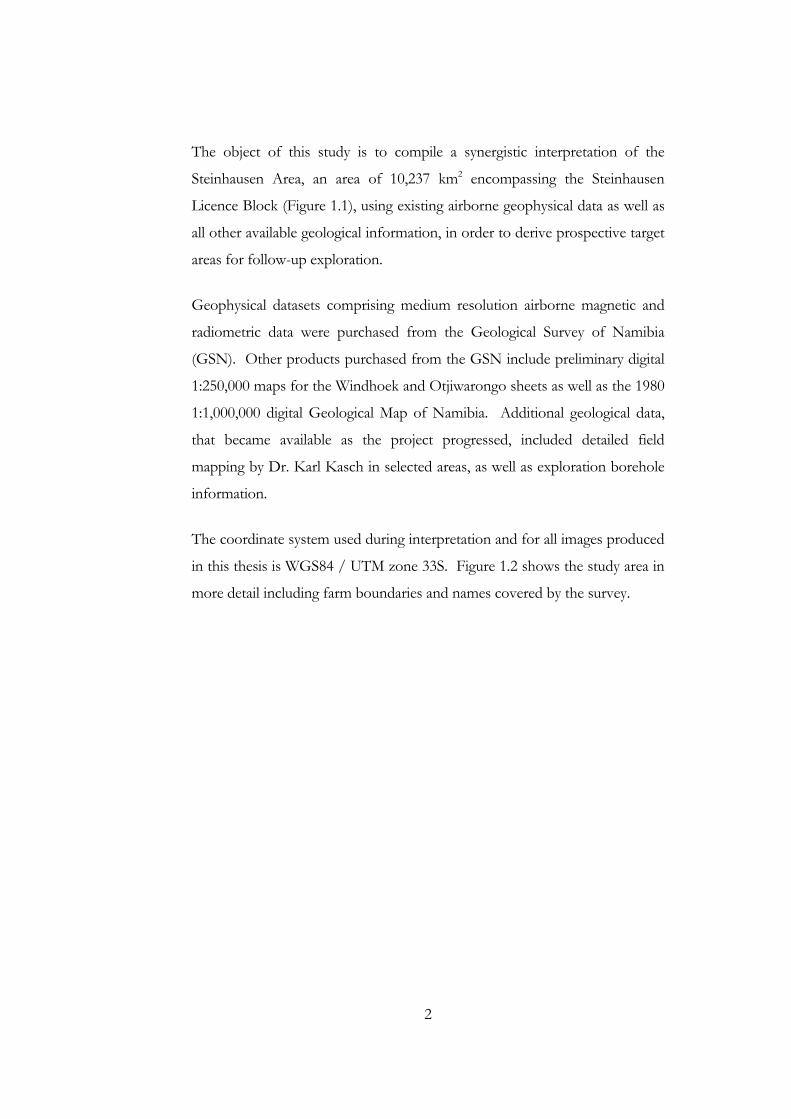
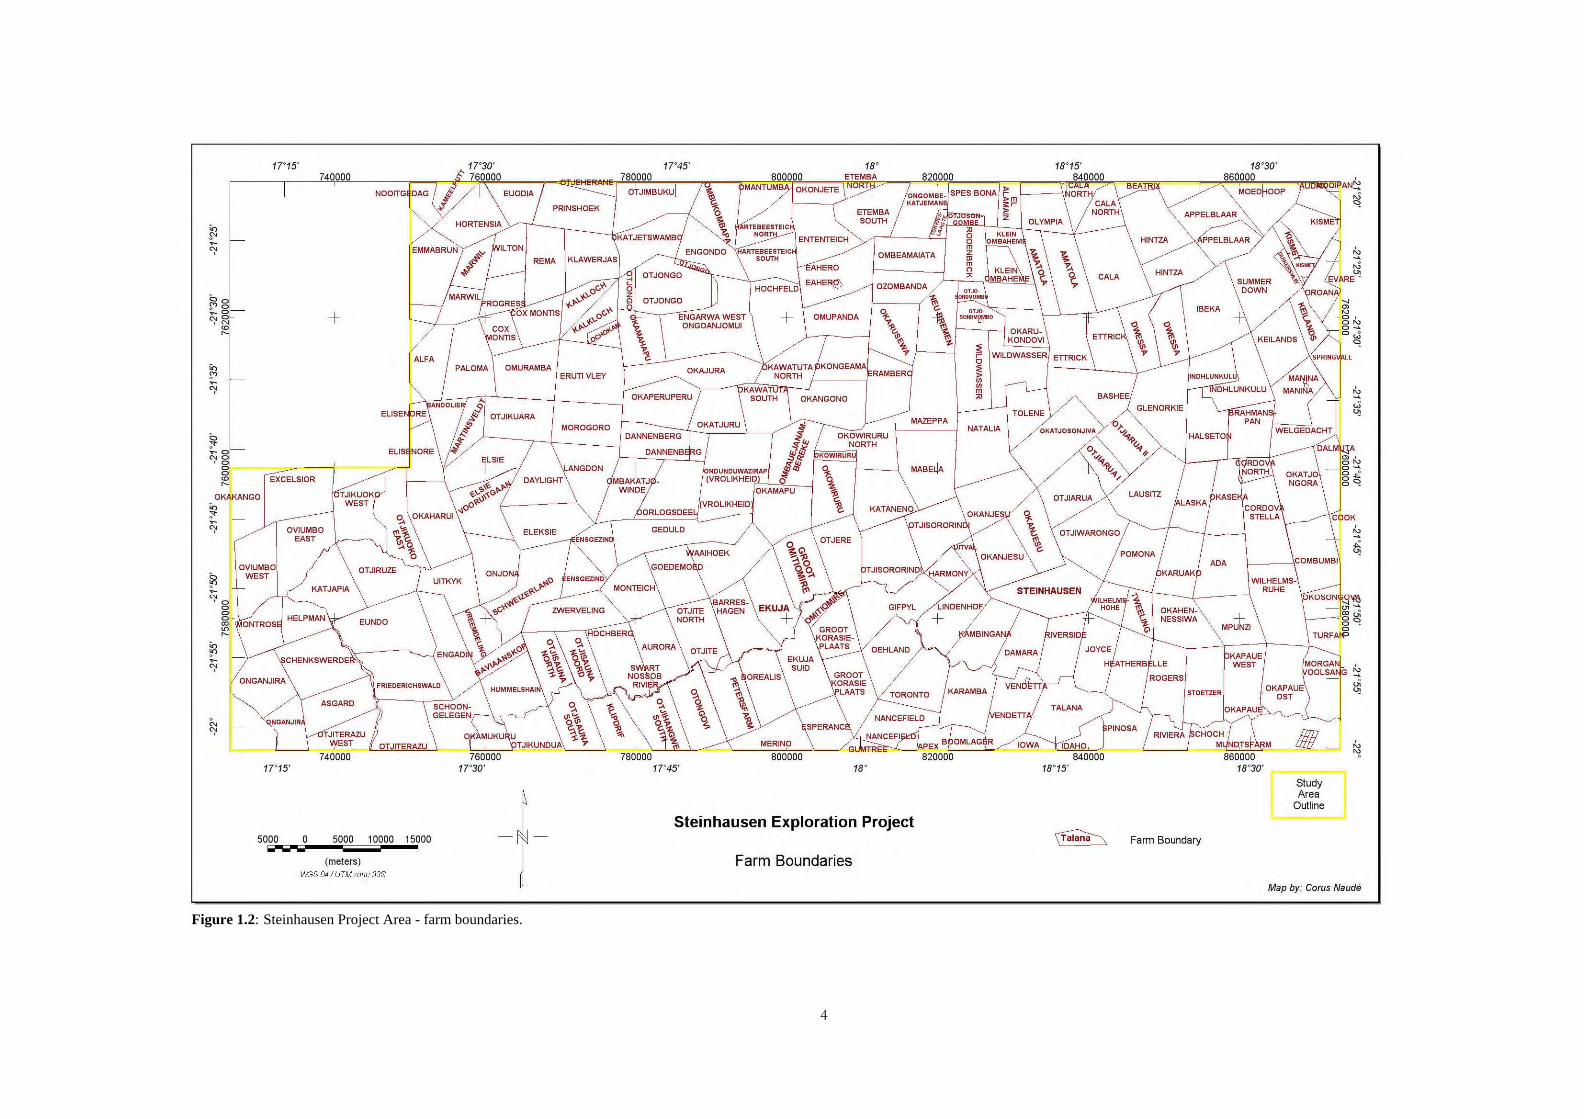
The coordinate system used during interpretation and for all images produced
in this thesis is WGS84 / UTM zone 33S. Figure 1.2 shows the study area in
more detail including farm boundaries and names covered by the survey.
3
Figure 1.1: Steinhausen Project Area - location map.
4
Figure 1.2: Steinhausen Project Area - farm boundaries.
17"15' 17"45' 18° 18°30'
1-------r----~7±40~0~0~0--~::::J:::~~~7f~~:::_~~~~~~~7~80~0~0~0~~--_r~--~~rrd8~0~OqOO~0~~~1ENT~E~MB~A~--_r~8~20~0~0~0::~~Ji~----_=rrS~~~\'~~~----1:~~8260~0;0;0~~~~~~~. 'I ~ I , ~ OT JIMBUKU ONGOMBE- SPES BONA ~ MOEDrOOP 0
+
EXCELSIOR
OK KANGO
~ -"1
OVIUMBO WEST
OVIUMBO EAST
ASGARD
TJITERAZU ":lEST
740000 17"15'
ALFA
5000 IOiOI
o 5000 10000 15000
(meters) ItYGS &4 1 UTM zone 33S
PRINSHOEK
REMA KLAWERJAS
PALOMA OMURAMBA
OTJIKUARA
760000 17"30'
ERUTl VLEY
MOROGORO
KATJEMAN ~ p:! ~
OTJONGO
RTEBEESTEIC NORT
ENGARWA WEST ONGOANJOMUI
OMBEAMAIATA
OZOMBANDA
OKAJURA ,, ______ ~~~~~~~--------_rRAMBER
OKAPERUPERU
780000 17"45'
OKANGONO
MABEtj.
MAZEPPA ::i ~ 41 OKOWIRURU
JIt b=...iNijORTH :::itt KOWIRUR
NDUNDUWAZIRAP F % (VROLIKHEID 0 ~
OKAMAPU $ 1> "
800000 18°
Steinhausen Exploration Project
Farm Boundaries
a a m z ro m n
"
NATALIA
~ Z
BASHEE
TOLENE GLENORKIE
STOETZER
Farm Boundary
KAPAUE WEST
KOSON O'ffi ~-- g: ui
' 00 o . o
TURFAI'P
MORGAN OOLSA G ~
OKAPAUE ~ OST
!I!l __
Study Area
Outline
Map by: Corus Naude

5
6
C h a p t e r 2
GEOLOGICAL SETTING
2.1 The Damara Orogen
The Damara Orogen consists of two divergent branches, one northward
trending coastal branch that parallels the Atlantic coast in northern Namibia,
and the other, an east-northeast trending intracontinental branch in north-
central Namibia (Porada, 1985). Within the intracontinental branch, the
Damara Orogen has been divided into several zones on the basis of
stratigraphy, structure, grade of metamorphism, intrusives, age and
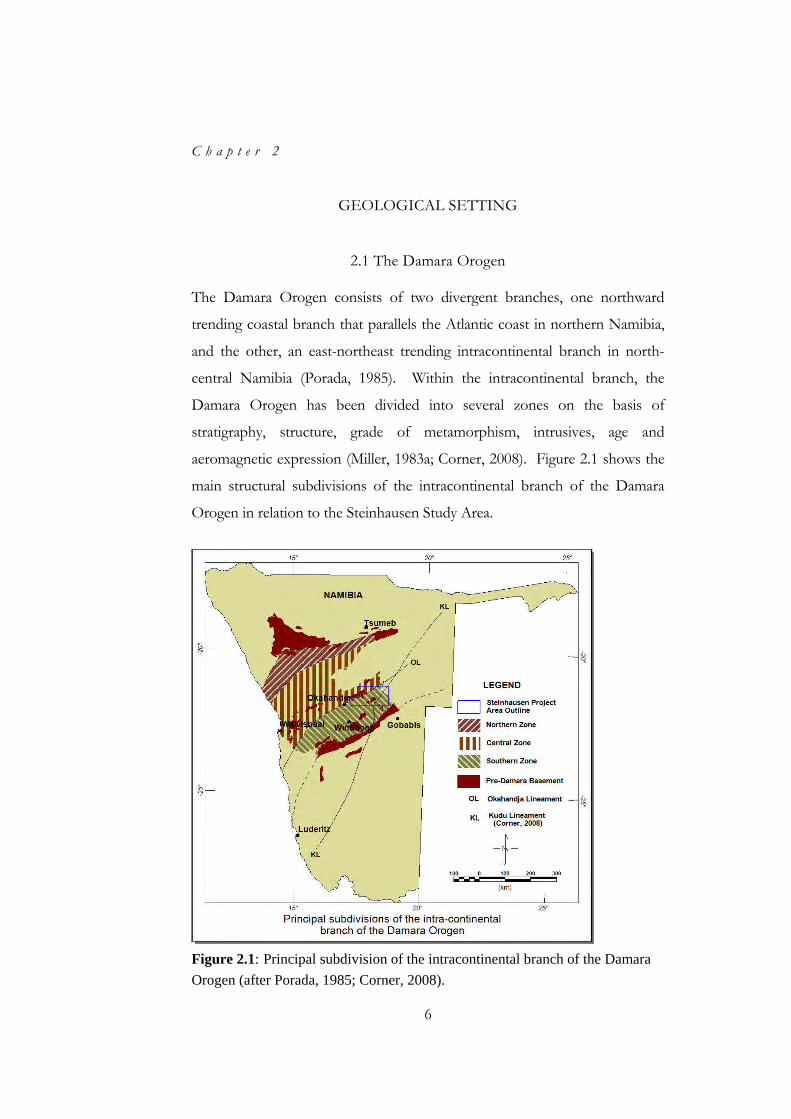
aeromagnetic expression (Miller, 1983a; Corner, 2008). Figure 2.1 shows the
main structural subdivisions of the intracontinental branch of the Damara
Orogen in relation to the Steinhausen Study Area.
Figure 2.1: Principal subdivision of the intracontinental branch of the Damara
Orogen (after Porada, 1985; Corner, 2008).
7
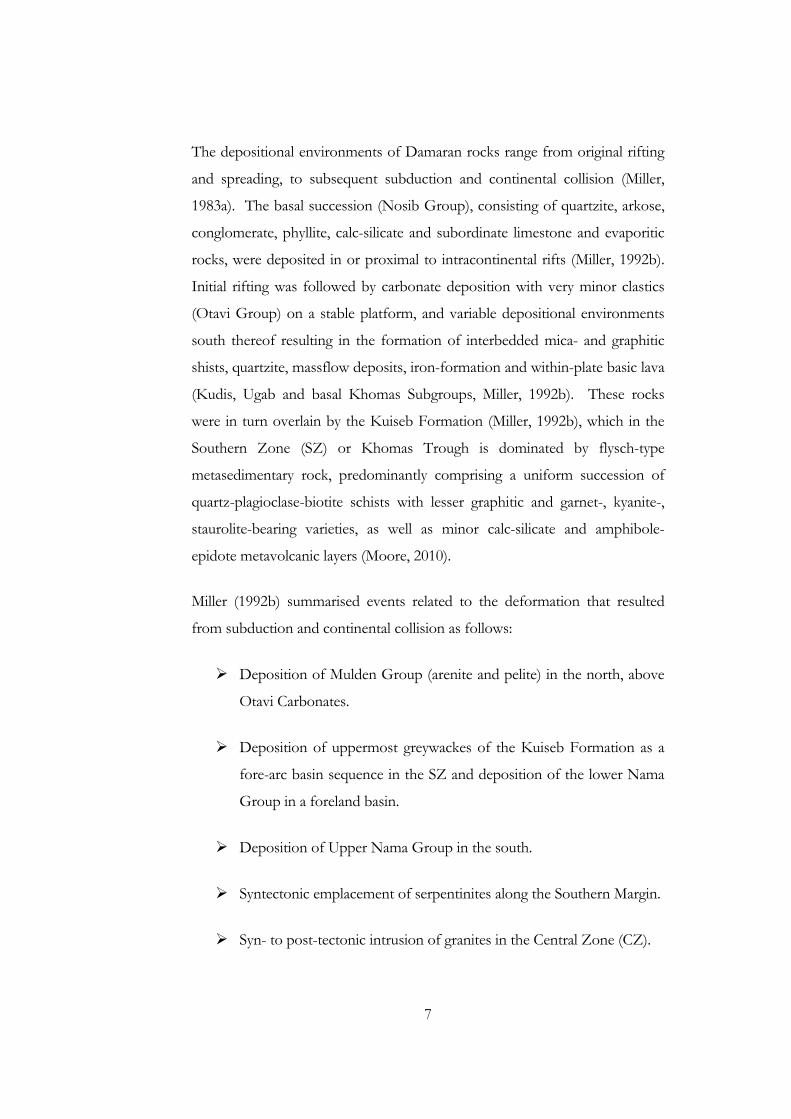
The depositional environments of Damaran rocks range from original rifting
and spreading, to subsequent subduction and continental collision (Miller,
1983a). The basal succession (Nosib Group), consisting of quartzite, arkose,
conglomerate, phyllite, calc-silicate and subordinate limestone and evaporitic
rocks, were deposited in or proximal to intracontinental rifts (Miller, 1992b).
Initial rifting was followed by carbonate deposition with very minor clastics
(Otavi Group) on a stable platform, and variable depositional environments
south thereof resulting in the formation of interbedded mica- and graphitic
shists, quartzite, massflow deposits, iron-formation and within-plate basic lava
(Kudis, Ugab and basal Khomas Subgroups, Miller, 1992b). These rocks
were in turn overlain by the Kuiseb Formation (Miller, 1992b), which in the
Southern Zone (SZ) or Khomas Trough is dominated by flysch-type
metasedimentary rock, predominantly comprising a uniform succession of
quartz-plagioclase-biotite schists with lesser graphitic and garnet-, kyanite-,
staurolite-bearing varieties, as well as minor calc-silicate and amphibole-
epidote metavolcanic layers (Moore, 2010).
Miller (1992b) summarised events related to the deformation that resulted
from subduction and continental collision as follows:
Deposition of Mulden Group (arenite and pelite) in the north, above
Otavi Carbonates.
Deposition of uppermost greywackes of the Kuiseb Formation as a
fore-arc basin sequence in the SZ and deposition of the lower Nama
Group in a foreland basin.
Deposition of Upper Nama Group in the south.
Syntectonic emplacement of serpentinites along the Southern Margin.
Syn- to post-tectonic intrusion of granites in the Central Zone (CZ).
8
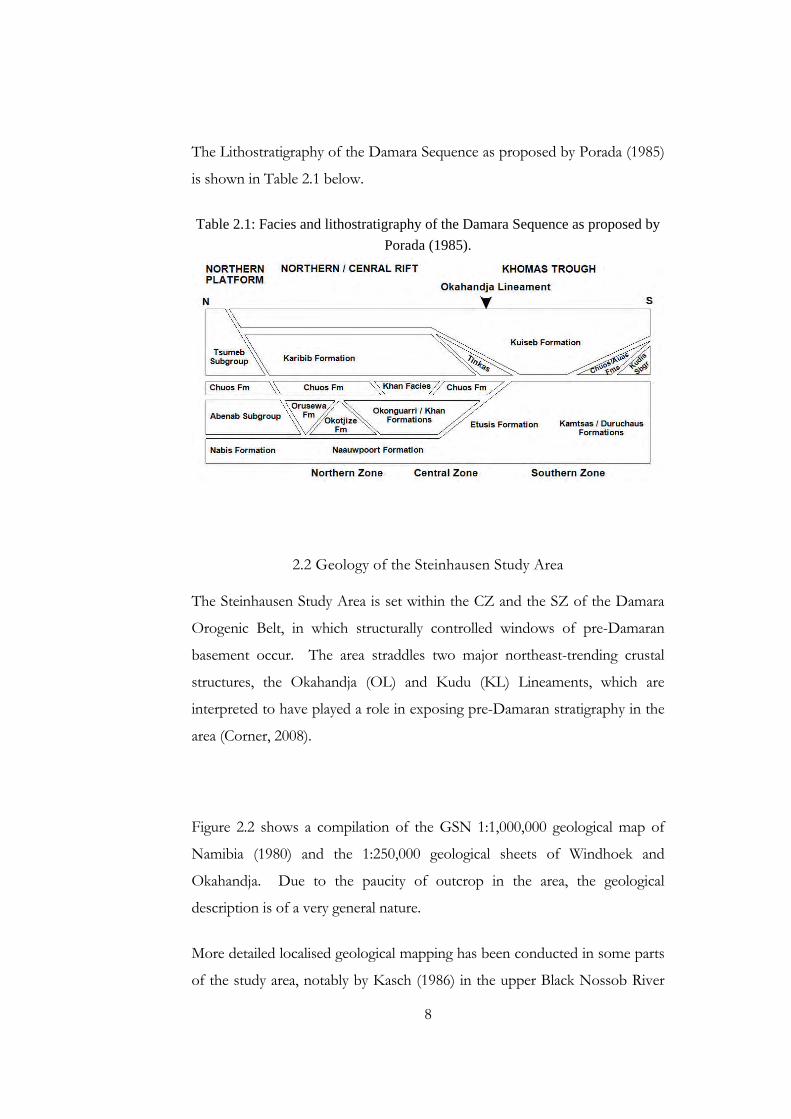
The Lithostratigraphy of the Damara Sequence as proposed by Porada (1985)
is shown in Table 2.1 below.
Table 2.1: Facies and lithostratigraphy of the Damara Sequence as proposed by
Porada (1985).
2.2 Geology of the Steinhausen Study Area
The Steinhausen Study Area is set within the CZ and the SZ of the Damara
Orogenic Belt, in which structurally controlled windows of pre-Damaran
basement occur. The area straddles two major northeast-trending crustal
structures, the Okahandja (OL) and Kudu (KL) Lineaments, which are
interpreted to have played a role in exposing pre-Damaran stratigraphy in the
area (Corner, 2008).
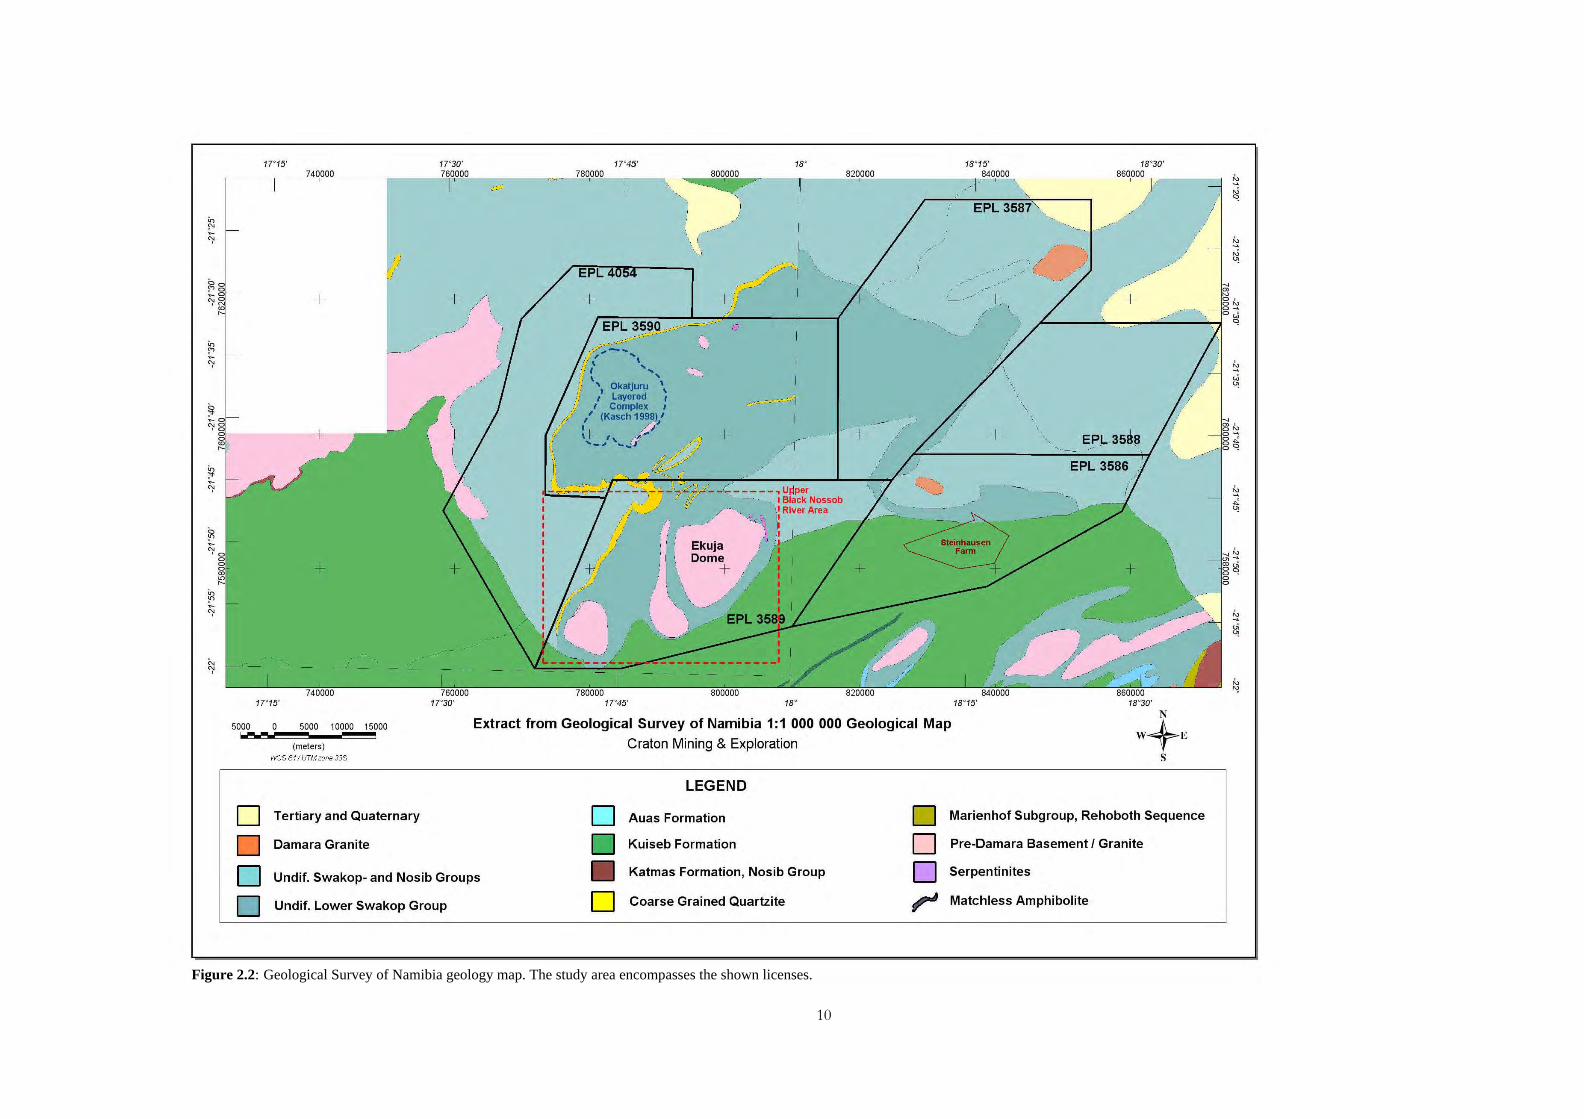
Figure 2.2 shows a compilation of the GSN 1:1,000,000 geological map of
Namibia (1980) and the 1:250,000 geological sheets of Windhoek and
Okahandja. Due to the paucity of outcrop in the area, the geological
description is of a very general nature.
More detailed localised geological mapping has been conducted in some parts
of the study area, notably by Kasch (1986) in the upper Black Nossob River

9
area and in the western part of the study area, but is also limited in detail due
to poor outcrop. Additional geological information has been derived from
mapping and drillhole logs compiled by various exploration companies that
historically held EPLs in the area.
10
Figure 2.2: Geological Survey of Namibia geology map. The study area encompasses the shown licenses.
'" "I
17"15' 17"30'
+ +
+
-"
.-'- , L. -
17"15' 17"30'
5000 0 5000 10000 15000 -- -(meters)
ItYGS &4 1 UTM zone 33S
D Tertiary and Quaternary
D Damara Granite
17"45' 18°
+
' .- < -'
'.,- ... ( " t ", <::::
" Okatjuru " I Layered r
, Complex I
" (Kasch 1998) I I /<)~ ,+ f, .'1·... + '_'" ... ..:,J
:1.:-::" ::' ''=''::.:..:;f - - ---,-"- .: '/~ . .;~ - -'- - - - - -, U~per ~-~ - ' _ I Black Nossob
17"45'
t i , '
~ , , I
! I ! " f \
_,.r '-- ~"', .. ,::..,~ I: RiVer Area ,- ,
I
18°
18°15' 18°30'
18°15' 18°30'
Extract from Geological Survey of Namibia 1:1 000000 Geological Map
Craton Mining & Exploration
LEGEND
D Auas Formation D Marienhof Subgroup, Rehoboth Sequence
D Kuiseb Formation D Pre-Damara Basement I Granite
D Undif. Swakop- and Nosib Groups • Katmas Formation, Nosib Group D Serpentinites
D Undif. Lower Swakop Group D Coarse Grained Quartzite r Matchless Amphibolite
11
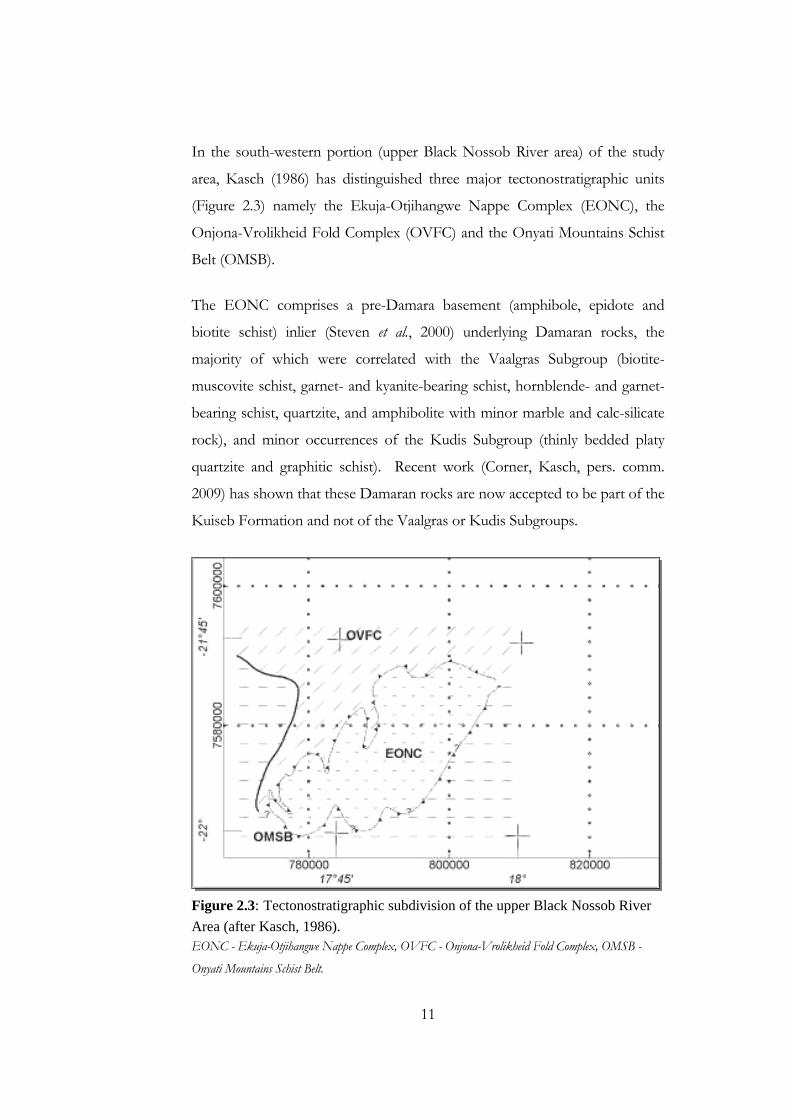
In the south-western portion (upper Black Nossob River area) of the study
area, Kasch (1986) has distinguished three major tectonostratigraphic units
(Figure 2.3) namely the Ekuja-Otjihangwe Nappe Complex (EONC), the
Onjona-Vrolikheid Fold Complex (OVFC) and the Onyati Mountains Schist
Belt (OMSB).
The EONC comprises a pre-Damara basement (amphibole, epidote and
biotite schist) inlier (Steven et al., 2000) underlying Damaran rocks, the
majority of which were correlated with the Vaalgras Subgroup (biotite-
muscovite schist, garnet- and kyanite-bearing schist, hornblende- and garnet-
bearing schist, quartzite, and amphibolite with minor marble and calc-silicate
rock), and minor occurrences of the Kudis Subgroup (thinly bedded platy
quartzite and graphitic schist). Recent work (Corner, Kasch, pers. comm.
2009) has shown that these Damaran rocks are now accepted to be part of the
Kuiseb Formation and not of the Vaalgras or Kudis Subgroups.
Figure 2.3: Tectonostratigraphic subdivision of the upper Black Nossob River
Area (after Kasch, 1986). EONC - Ekuja-Otjihangwe Nappe Complex, OVFC - Onjona-Vrolikheid Fold Complex, OMSB -
Onyati Mountains Schist Belt.
12
The OVFC is separated from the EONC by the Hochberg thrust and
consists of coarse-grained, white quartzite, white to pale blue marble, and
minor grey quartz-muscovite schist. This same stratigraphy has been mapped
further to the north-northwest by Kasch (1998) during field investigation by
Mount Isa Mines Namibia (Pty) Ltd. in 1998. Although represented as
Undifferentiated Lower Swakop Formation on GSN maps, Hoffmann
(1989b) has questioned the inclusion of this stratigraphic unit into the
Khomas Zone of the Damara sequence, and suggests that it is of pre-Damara
age correlating with upper units of the Abbabis Metamorphic complex
overlain by metasediments similar to the Duruchaus Formation of the Nosib
Group which in turn is overlain by Kuiseb Formation schist.
The OMSB consists of the Kuiseb Formation of the upper Damara
Sequence. Some syn-tectonic pegmatites have intruded the Kuiseb schists in
the western extreme of the study area.
Towards the central-western side of the study area, Mount Isa Mines (MIM)
identified a sequence of ultramafic rocks, amphibolites and anorthosites,
based on Kasch’s (1998) mapping. This sequence has been interpreted as a
metamorphosed layered complex that has intruded basement gneiss and has
been termed (by MIM) the Okatjuru Layered Complex (OLC).
Craton initiated further mapping which was completed during 2008 to the
west and southwest of the OLC by Kasch (Corner, pers. comm., 2009). Here
Kasch showed that the Kuiseb Formation in the southwest of the
interpretation area includes an upper marble and a lower amphibolite unit.
Also apparent is the occurrence of a glassy quartzite as part of the upper pre-
Damara basement sequence.
Historical exploration to investigate the north-eastward extension of the
Matchless Amphibolite Belt (MAB) was completed by Anglovaal in the south-
eastern part of the study area. This resulted in a number of drillhole
intersections of mostly schist and minor amphibolite of the Kuiseb
13
Formation (1997 EPL reports). Mapping by Gold Fields Prospecting Co
(Pty) Ltd (Charles, 1987) has suggested the occurrence of Auas Formation
rocks (feldspathic micaceous quartzites) collaring the Karamba Dome on the
farms Karamba and Vendetta. This therefore places the Auas Formation
within the Vaalgras Subgroup. This is in contrast to the stratigraphy as
described by Hoffmann (1989a) where the Auas Formation is included as part
of the Kudis Subgroup within the Hakos Terrane of the Southern Marginal
Zone. For the purpose of this study Hoffmann’s stratigraphy will be
followed.

14
15
C h a p t e r 3
KNOWN MINERAL OCCURRENCES AND DEPOSITS WITHIN STEINHAUSEN PROJECT AREA
3.1 Omitiomire copper deposit
The Omitiomire copper deposit, situated 120km northeast of Windhoek, was
located by General Mining and Finance Corp (GMFC) from regional soil
geochemistry in the mid 1970’s (Corner, 2006). Intermittent exploration at
Omitiomire since 1976 included soil geochemical, induced polarization (IP)
and magnetic surveys with percussion and core drilling (Steven et al., 2000).
Since 2007, Craton have completed more IP, magnetic and geochemical
sampling and by November 2009 completed RC and diamond drilling
totalling over 42,000 m. From this work, a resource of ore at Omitiomire was
estimated, at a cut-off grade of 0.25% Cu, to be 117mT at 0.50% Cu of which
approximately 80% are in the Inferred category and 20% in the Indicated
category (K. Hartmann, pers. comm., 2011).
The Omitiomire deposit is hosted within the Ekuja basement dome (Kibaran-
age) which comprises quartz-feldspar gneiss, amphibole and biotite-bearing
schist and amphibolite. The copper mineralisation occurs within a zone of
banded schist and mafic gneiss which underlies a unit of massive
unmineralised quartz-feldspar (felsic) gneiss. The mineralisation occurs
mainly as chalcocite and is preferentially concentrated in bands of epidote-
bearing mafic rock, either in dark biotite schist, banded quartz-plagioclase-
biotite-hornblende schist or in amphibolite (IBML, 2008).
The mineralised body strikes north-south, plunges to the north, and dips
gently towards the east. It is cut by, or possibly associated with, later north-
south trending faults (IBML 2009). Shrimp U-Pb ages for zircon cores are
between 1115 Ma and 1063 Ma for the rocks of the mineralised sequence,
16
with zircon overgrowths and rims dated at approximately 600 Ma which is
suspected to be the age of the main chalcocite-mineralising event (Steven et
al., 2000).
3.2 Copper geochemical anomalies
Various geochemical copper anomalies have been identified within the study
area, more precisely on the farms Oorlogsdeel, Waaihoek, Ombakatjowinde
and Vrolikheid (Schneider and Seeger, 1992). Historical exploration showed
pyrrhotite, pyrite and chalcopyrite occurring as dissemination, veins and
lenses mostly in association with amphibolite and calc-silicate rock together
with biotite schist, quartzite, marble and gneiss.
Within the south-eastern portion of the study area further copper occurrences
have been identified on the farms Karamba, Vendetta and Talana (Charles
1987). From Charles (1987), the anomalies on the farms Karamba and
Vendetta are associated with metasediments surrounding the leucogneissic
Karamba Dome, while on the farm Talana it is suggested that the copper is
associated with amphibolite of the Matcheless Member (Kuiseb Formation).
3.3 Manganese occurrences
The farms Hochfeld and Eahero in the north-central part of the study area
host a siliceous, ferruginous manganese horizon of at least 2m thick that
could possibly be correlated with the Otjosondu Manganese Field which
occurs to the west (Schneider, 1992).
17
3.4 Nickel occurrences
On the farm Oorlogsdeel a slightly anomalous nickel soil sample was reported
(Roesener and Schreuder, 1992). No mention is made of possible underlying
geology. The OLC as mapped by Kasch (1998) could be considered as a
possible origin for this nickel anomaly.
Nickel concentrations of up to 991 ppm occur within the mafic schists that
host the Omitiomire copper deposit (K. Hartmann, pers. comm., 2011).

18
19
C h a p t e r 4
MINERAL DEPOSIT MODELS AND SOME EXAMPLES
Due to the geological setting of the Steinhausen Project Area, a few possible
mineralisation styles can be envisaged.
4.1 Matchless stratiform massive sulphides
The Matchless Amphibolite Belt (also referred to as the Matchless Member) is
a narrow linear unit of metabasites (mainly amphibolites) interlayered with
quartz-mica schists of the Kuiseb Formation (Klemd et al., 1989). Its
geologically mapped strike extent is some 300 km, extending from east of
Walvis Bay to the Steinhausen area. Various massive and semi-massive pyritic
copper occurrences are associated with the Matchless Member, viz. Hope,
Gorob, Niedersachsen, Matchless, Otjihase, Ongeama and Ongombo.
The Kuiseb formation consists of a thick succession of alternating quartz-rich
and mica-rich schists (Miller et al., 1983) while the amphibolites represent
metamorphosed tholeiitic basaltic rocks that formed within an extensional
tectonic setting (Breitkopf, 1988). The eastern part of the Matchless Member
was emplaced as thin oceanic crust, and associated massive sulphide deposits
were thus formed in a tectonic setting of initial ocean-floor spreading
(Breitkopf, 1988), who also drew the comparison between the geology and
geochemistry of the Matchless massive sulphide occurrences and Besshi-type
deposits in the Sanbagawa Belt of south-western Japan.
A short discussion of mines situated along the eastern part of the Matchless
Member follows:
20
4.1.1 Matchless Mine
The Matchless Mine, located 30 km southwest of Windhoek, was first
exploited by Walwich Bay Copper Mining Company, which worked what
is known today as the River Shoot Gossan from the 1850s until operation
ceased in 1862 (Schneider and Seeger, 1992). Thereafter the mine passed
through the hands of various small producers until 1961 when it was
properly re-evaluated by the Tsumeb Corporation Ltd., and later put in
production from 1970 to 1983 during which time production amounted to
a total of 1.35 million ton grading 2.12% copper and 14.8% sulphur. The
remaining reserves total 563 000 tons at an average grade of 2.21% copper
(Schneider and Seeger, 1992). Mining activities were recently re-
commenced by Weatherly International plc.
The lithology of the Matchless Mine can be described as follows (from
Schneider and Seeger, 1992):
Footwall Schist: quartz-biotite-sericite schist of the Kuiseb
Formation.
Footwall Amphibolite: intercalated large isolated lenticular bodies of
dark green, medium to coarse-grained, compact, quartz-amphibole
rock.
Transition Schist: biotite-sericite rock containing frequent quartz
lenses.
Sericitic Quartzite: regularly foliated, silvery-white, pyritic quartz-
sericite schist with sections of light-grey sericite quartzite. The
principle host rock is characterized by heavy pyrite mineralisation and
concentration of chalcopyrite mineralisation towards the hanging wall
contact. A band consisting of chlorite-biotite-amphibole schist serves
21
as a marker horizon in mining because it coincides roughly with the
lower limits of the ore-grade copper mineralisation.
Intermediate Schist: quartzose biotite-sericite schist with stringers of
chlorite schist and sericitic quartzite as well as bands of magnetite
quartzite.
Amphibolite Schist: dark olive-green, chlorite-biotite-amphibole
schist, in places talcose and crumbly, characterised by the presence of
large quartz boudins and well developed amphibole needles. The
mineralisation within this unit is hosted by interbedded quartzite
bands.
Hanging wall Amphibolite: massive amphibolite with interbeds of
mineralised magnetite quartzite.
Hanging wall Schist: Identical to Footwall Schist.
The sulphide minerals at Matchless Mine are pyrite, chalcopyrite,
pyrrhotite plus marcasite, sphalerite, bornite and galena (Schneider and
Seeger, 1992). Klemd et al. (1989) favoured a two-stage process of copper
concentration: an initial pre-metamorphic and pre-deformation
concentration into a stratigraphic zone of sulphide-bearing rock and a
subsequent metamorphic upgrading by the movement of copper in
solution to produce structurally controlled ore shoots. This explains the
occurrence of more stratabound pyrite as opposed to more structurally
controlled chalcopyrite.
Klemd et al. (1989) described the deposit as consisting of three ore shoots
of massive sulphide rock, plunging to the west at 30 º to 35º. The ore
shoots are separated from one another by the sulphide-bearing Sericitic
22
Quartzite Unit. Each ore shoot is about 3 m thick and 120 m in strike
length, and has been traced down-plunge to the NNW for 600 m by
drilling.
4.1.2 Otjihase Mine
The Otjihase ore body was first developed by the Otjihase Mining
Company in the early 1970s reaching production stage by 1975. Following
a halt in production from 1979, the mine was redeveloped in 1982 and by
the end of 1991 the ore reserves amounted to 10.177 million tons
containing 2.62% copper, 20% sulphur and 10 g/t silver (Schneider and
Seeger, 1992).
From Schneider and Seeger (1992) the geology of the Otjihase Mine is
summarized below:
In the vicinity of the mine, the Matchless Member consists of
amphibolitic rocks and talc-chlorite schist forming discontinuous
layers and lenses in the garnetiferous biotite-quartz and biotite-
chlorite schists of the Kuiseb Formation. Magnetite quartzite present
as both persistent beds (south-western part of deposit) and
discontinuous lenses (lenticular pods or boudin-like structures) is
considered to be an integral part of the ore deposition.
Both secondary and primary ore zones are distinguished: the
secondary body consists of reddish-brown gossan, ferruginous schist
and magnetite quartzite. The mineralisation within the secondary ore
includes limonitic boxworks with rare malachite and chrysocolla. The
primary ore body consists of magnetite quartzite, variable schist and
occasional amphibolite. Ore minerals include pyrite, chalcopyrite and
sphalerite with minor pyrrhotite.
23
A prominent ore shoot is present near the northern limits of the
deposit. This ore shoot plunges about 14º north-westwards and
follows a well-developed lineation observed in surface outcrops of
magnetite quartzite. Small-scale isoclinal / recumbent folding in the
ore zone suggests the possible presence of a large recumbent fold.
The ore body is also cut by north-south trending faults with down
throw to the west.
4.1.3 Ongeama Prospect
The Ongeama Prospect, situated 10 km northeast of the Otjihase Mine,
has been investigated since 1971 and is estimated to contain ore reserves
that amount to 468 700 t at 1.26% copper, 0.46% zinc and 5.36 g/t silver
(Schneider and Seeger, 1992). Disseminated to massive pyrrhotite, pyrite,
chalcopyrite and sphalerite mineralisation is confined to a lenticular
magnetite quartzite, which is present as a narrow, elongate shoot which
dips 14° to 16° northwest and plunges 7° to 8° west.
4.2 Kuiseb Formation hosted hydrothermal copper deposits
Various copper deposits exist within the thick schist succession of the Kuiseb
Formation. The copper deposits are described as hydrothermal chalcopyrite-
bearing quartz veins (Miller, 1983b; Miller, 1992a). Moore (2010) concludes
that the Kuiseb Formation hosted hydrothermal copper deposits are generally
unrelated to the syngenetic massive-sulphide copper deposits of the Matchless
Belt, as the former were formed in a compressional setting with hydrothermal
fluids having a metamorphic origin, opposed to the extensional rift setting
with hydrothermal fluids derived from mafic volcanic components in the
latter.
24
4.2.1 Onganja Mine
The Onganja Mine is situated approximately 65 km southeast of
Okahandja (Miller, 1983b) and has been mined on a small scale since 1960
(Schneider and Seeger, 1992). By 1987 the estimated reserves were less
than 300,000 t at 2% copper (Schneider and Seeger, 1992).
From Schneider and Seeger (1992), the quartz-copper veins at Onganja are
confined to the crest of an antiform that plunges gently to the west and is
considered to be the upper part of a hydrothermal system that was
generated at the intersection of two major faults, one north-trending and
the other trending north-westerly. Primary mineralisation (coarse pyrite,
chalcopyrite, chalcocite and molybdenite) occurs in quartz and calcite veins
that are brecciated, steeply dipping and trend north-south at right angles to
the foliation of the host Kuiseb Formation schist (Schneider and Seeger,
1992).
The host lithology at the Onganja mine consists of basal quartz-
plagioclase-biotite schist, followed by epidote-quartz rock, amphibolites
schist, a second quartz-plagioclase-biotite schist and graphitic schist
(Moore, 2010). Epidote-quartz rocks (dominant presence of epidote with
magnetite) occur as a broad zone of discontinuous lenses and boudins
within the quartz-plagioclase-biotite schists, with most of the mineralised
veins concentrated in the immediate footwall if the epidote-quartz unit
(Moore 2010).
Two other small deposits in close proximity of the Onganja deposit that have
been mined are the Otjozonjati Mine and Thorn Tree Mine. Both these
deposits consist of copper mineralisation within northward striking,
brecciated quartz veins dipping at approximately 45° east (Schneider and
Seeger, 1992).
25
4.3 Manganese deposits
During the initial rifting stage of the Damara Orogen, pauses in widespread
glaciation were marked by the deposition of siliceous iron formation with up
to 49% manganese (Miller, 1992a). The Otjosondu area (northwest of the
study area) is the only known occurrence of economic manganese
accumulation in the Damara Orogenic Belt even though iron formations are
widespread throughout (Bühn et al., 1992).
4.3.1 Otjosondu Manganese Field
The Otjosondu Manganese Field is located 150 km northeast of
Okahandja, covers an area of approximately 240 km2, and was mined
intermittently since 1950 (Schneider, 1992).
The lithostratigraphy at Otjosondu is summarised by Bühn et al. (1992) as
follows:
Kuiseb Formation schists form the upper bracket of the sequence.
Upper quartzites: glassy quartzites consisting of mostly coarse grained
quartz with minor amounts of disseminated hematite in places.
Feldspar and mica are very rare.
Manganese-bearing unit: predominantly hematite quartzite and
hematite-rich gneiss. Two major manganese horizons occur at
bottom and top of the unit which is in sharp contact with upper and
lower quartzites.
Lower quartzites: similar to upper quartzite.
Basal gneiss and schist.
26
The Damara deformation has caused the ore to be discontinuous and has
thickened bodies in the noses of folds (Schneider, 1992). Bühn et al.
(1992) have defined the following ore types:
Braunite-hematite-jacobsite ore: massive ore with variable amounts of
braunite, hematite and other Mn-Fe minerals. No banding was
observed.
Banded ore: banding of 1 to 3 mm thick layers of Mn clinopyroxene
and Mn garnet with interlayered Ti-bearing terrigenous sediments.
Feldspatic ores: lower Mn content, increased content of potassium
feldspars.
Secondary enrichment within ore is confined to small, near-surface veins
filled with pyrolusite and psilomelane (Schneider, 1992).
Secondary manganese deposition is present as scree deposits (rounded
pebble to boulder size fragments of primary ore directly derived from
primary ore horizon) and manganocrete (dark interstitial crusts, coatings
and concretions) precipitated into and onto peripheral sands and
weathered bedrock (Schneider, 1992).
4.4 Magmatic Nickel, Copper and Platinum Group Element (PGE) deposits
Magmatic Ni-Cu-PGE deposits are found in association with ultramafic and
mafic bodies in diverse geological settings (Eckstrand and Hulbert, 2007).
These deposits can be broadly divided into 2 sub-types; Ni-Cu sulphide-rich
27
ore associated with differentiated mafic / ultramafic sills, stocks and
ultramafic volcanic flows, and (mostly) PGE ore associated with mafic /
ultramafic layered intrusions (Eckstrand and Hulbert, 2007).
Within the Steinhausen Project Area the Okatjuru Layered Complex (OLC)
consisting of ultramafic rocks, amphibolites and anorthosites (Kasch 1998) is
analogous to certain magmatic Ni-Cu-PGE deposits (e.g. Voisey’s Bay
Deposit, located in north-eastern Canada).
4.4.1 Voisey’s Bay Deposit
The Voisey’s Bay Intrusion, consisting of a series of olivine gabbros,
troctolites, ferrogabros and ferrodiorites within the anorthositic Nain
Plutonic Suite (Eckstrand and Hulbert, 2007; Lightfoot, 2007), hosts Cu-
Ni sulphide ore. The deposit consists of a series of sulphide lenses located
within a sub-vertical dyke connecting an upper and lower magma chamber
(Eckstrand and Hulbert, 2007; Naldrett, 2010). The dyke is believed to be
a feeder for the magma chambers and three main Ni-Cu zones are located
in widened parts of the feeder dyke (Eckstrand and Hulbert, 2007).
Naldrett (2010) illustrates three controls of mineralisation: the feeder dyke
at Discovery hill where sulphide mineralisation is present at a widened
section of the dyke, the Ovoid deposit interpreted as either a widening of
the dyke or the base of the upper chamber, and lastly, the feeder dyke
joining the Eastern Deeps intrusion where sulphides are concentrated at
the mouth of the feeder to the intrusion. These three controls illustrate
the relation of sulphide concentration to areas where denser material
brought up by the magma flowing up the dyke could settle due to the
decrease in rate of magma flow (Eckstrand and Hulbert, 2007; Naldrett,
2010).
28
The sulphide mineralisation consists of pyrrhotite, pentlandite,
chalcopyrite with additional troilite and magnetite (Eckstrand and Hulbert,
2007). Zoning at the Ovoid deposit consists of a magnetite-rich centre
followed by a pentlandite and chalcopyrite-rich zone with a third,
pyrrhotite-rich zone, and is broadly consistent with a sulphide body
cooling from the outside in (Naldrett, 2010).
4.4.2 Alpine serpentinites within Damara Orogen
Alpine serpentinites, tectonically emplaced ultramafic bodies (Roesener
and Schreuder, 1992) proximal to the study area also suggest the possibility
of similar Ni occurrences. Roesener and Schreuder (1992) discussed four
serpentinite bodies located on the farms Okatuma Ost, Otjihaenena and
Eorondemba:
The serpentinite bodies consist of dark green serpentinite core, ringed by
an alteration zone of talc and containing lenses of talc and chlorite schist.
The nickel and copper mineralisation at surface is associated with
brecciated serpentinite and were ascribed to surface enrichments.
4.5 Hydrothermal gold deposits
There are several examples of orogenic gold deposits from Proterozoic
terranes, including Ashanti-Obuasi in West Africa, Homestake in the U.S.A.
and Pilgrim’s Rest in South Africa (Robb, 2005). The formation of these
deposits involve metamorphic fluids that have formed from crustal
thickening, deformation, metamorphism and synorogenic magmatism, with
gold deposition being generally late orogenic and hosted in high-angle thrust
faults (Robb, 2005). With the Damara Orogen, the most notable gold
29
occurrences are the Navachab Gold Mine and the Ondundu-Otjiwapa Gold
Field.
4.5.1 Navachab Gold Mine
The Navachab Gold Mine is located on the farm Navachab, approximately
10 km southwest of Karabib (Mindat.org, 2011).
The deposit was discovered in 1984, during a geochemical survey where
small gossan fragments returned assay values of up to 11 g/t gold.
Following an appraisal in 1986, a feasibility study in 1987 and subsequent
construction, the first gold was produced in December 1989 (Burnett,
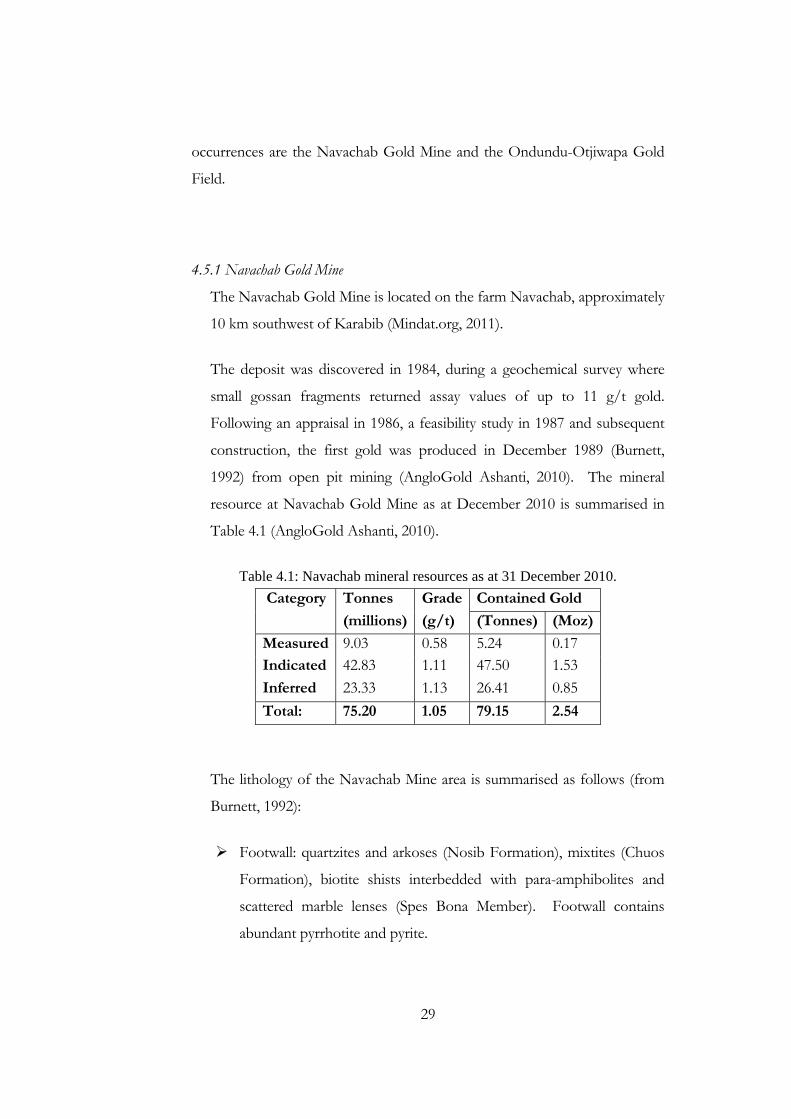
1992) from open pit mining (AngloGold Ashanti, 2010). The mineral
resource at Navachab Gold Mine as at December 2010 is summarised in
Table 4.1 (AngloGold Ashanti, 2010).
Table 4.1: Navachab mineral resources as at 31 December 2010.
Category Tonnes Grade Contained Gold
(millions) (g/t) (Tonnes) (Moz)
Measured 9.03 0.58 5.24 0.17 Indicated 42.83 1.11 47.50 1.53
Inferred 23.33 1.13 26.41 0.85
Total: 75.20 1.05 79.15 2.54
The lithology of the Navachab Mine area is summarised as follows (from
Burnett, 1992):
Footwall: quartzites and arkoses (Nosib Formation), mixtites (Chuos
Formation), biotite shists interbedded with para-amphibolites and
scattered marble lenses (Spes Bona Member). Footwall contains
abundant pyrrhotite and pyrite.
30
Main orebody: Okawayo Member comprising a calc-silicate marble
unit overlain by amphibolite and followed by a thick marble unit and
a top mottled dolomitic marble unit.
Hanging wall: siliclastic and metamorphosed volcanoclastic rocks
(Oberwasser Member).
The lower units are intruded by steeply dipping aplite and pegmatite dykes
and the presence of a late-stage, bismuth-, fluorite- and boron-rich diorite
approximately 800 m northeast of the main ore body is believed to be a
possible heat source for the final concentration of gold (Burnett, 1992).
The styles of mineralisation are summarised by Burnett (1992) as follows:
Massive echelon skarn bodies, elongated in an ENE-WSW direction
and plunging at 30˚ north. These bodies are strata-bound within
banded calc-silicate marble unit, and gold mineralisation occurs with
replacement lenses of pyrrhotite and minor pyrite, chalcopyrite, calc-
silicate minerals, garnet, biotite and quartz.
Hanging wall banded grey marbles and mottled dolomite marbles
hosts north-plunging crosscutting vein stockworks. Gold
mineralisation occurs in quartz-calcite veins.
Locally abundant to massive sulphides (pyrrhotite with accessory pyrite,
minor chalcopyrite and sphalerite) do not host gold mineralisation but are
often in close proximity (Burnett, 1992).
4.5.2 Ondundu-Otjiwapa Gold Field
Situated 90 km northwest of Omaruru, the Ondundu-Otjiwapa Gold Field
was discovered in 1917 and exploited from 1924 to 1963 resulting in a
31
total production of 448.504 kg gold from both alluvial and hard-rock
mining (Burnett, 1992).
The gold mineralisation is hosted in quartz-feldspar veins occurring
parallel to bedding planes within metaturbidites (impure phyllite and
quartz-mica-feldspar schist) of the Kuiseb Formation (Burnett, 1992). The
deposit is confined to an area of approximately 10 km2 of intense folding
(Burnett, 1992). Small mineralised quartz veins contain calcite, siderite,
pyrite and marcasite and are believed to be of hydrothermal origin with an
average grade of 5.8 g/t gold (Burnett, 1992).
4.6 Uranium deposits
Nash and Granger (1981) list the following types of uranium deposits:
quartz-pebble conglomerate deposits,
unconformity-type deposits,
deposits in ultrametamorphic rocks,
classical vein deposits,
deposits associated with igneous rocks,
deposits in sandstone, and
other deposits including calcrete-hosted deposits.
32
Considering the geological setting of the Steinhausen Area, the most likely
deposit types that may be encountered in the survey area includes: calcrete-
hosted deposits, classical vein deposits and deposits associated with igneous
rock.
4.6.1 Calcrete-hosted uranium deposits
(a) The calcrete-hosted uranium deposits are classified as surficial uranium
ores formed by accumulation of (mostly) carnotite within calcretised fluvial
drainage channels (Robb, 2005), which represent the remains of rivers from
previous high rainfall intervals that drained uranium-fertile source regions.
The main process involved in the precipitation and concentration of uranium
mineralisation is related to high rate of groundwater evaporation associated
with arid climates (Robb, 2005). The Langer Heinrich Deposit serves as an
example of a calcrete-hosted uranium deposit.
4.6.1.1 Langer Heinrich Deposit
A summary of the Langer Heinrich Deposit is discussed below (from
Roesener and Schreuder, 1992b):
Situated approximately 90 km east of Swakopmund to the south of the
Langer Heinrich Mountain, the mineralisation was first discovered in the
late 1950s.
The Langer Heinrich valley is a 13 km-long, east-west trending palaeo-
channel which transects the Bloedkoppie Granite (containing on average
10 to 15 g/t U3O8) in the east, and interbedded fine-grained metapelite,
metagreywacke and calc-silicate beds of the Tinkas Member (Khomas
Subgroup) in the central and western parts. The northern bank of the
33
palaeo-channel is formed by pink quartzites of the Etusis Formation
(Nosib Group).
Calcrete terraces within the Langer Heinrich valley indicate original
sediment thickness of the palaeo-channel as 60 m at a width of between
200 m and 1000 m. Palaeo-channel sediments are mostly covered by 1 to
2 m of scree. Channel fill sediments usually consist of basal conglomerate
or breccia followed by alterations of siltstone, conglomerate, breccia and
calcareous arkose, but mineralisation (carnotite) is not confined to a
specific sediment type. Carnotite is irregularly distributed and occurs as
small patches and lenses, around pebbles and in cracks and may be finely
disseminated.
4.6.2 Classical vein deposits
The classical vein deposits are structurally controlled deposits within a variety
of host rock types, including metasediments and granites which can be
divided into two end-members (from Nash and Granger, 1981):
Veins with simple mineralogy: veins which are characterised by
carbonate, specular hematite and pitchblende and are interpreted as
being formed by metamorphic-hydrothermal fluids. The
Schwartzwalder mine in Colorado serves as an example of a classical
vein deposit with simple mineralogy, and will be discussed below.
Veins with complex mineralogy: uranium veins which show complex
mineralogy and chemistry that include Ag, Co, Ni, Bi, Cu, Au, Se and
As, mostly in the form of sulphides, selenides and sulfarsenides. The
Shinkolobwe deposit in the Shinkolobwe-Copperbelt area of the
Democratic Republic of the Congo (D.R.C.) and Zambia serves as an
example of a classical vein deposit with complex mineralogy. Some
34
features of the Shinkolobwe deposit are similar to those of
unconformity-type uranium deposits.
4.6.2.1 Schwartzwalder Mine
From Nash and Granger (1981), the Schwartzwalder Mine occurs in early
Proterozoic metasediments about 25 km west of Denver, Colorado.
Favoured hosts are garnet-biotite gneiss, quartz-biotite schist, calc-silicate
gneiss and quartzite.
Structures hosting the uranium deposits are subsidiary to major
Precambrian faults, and show shallow dipping horsetail veins which
steepen in dip where they join major faults. Ore shoots have a strike
length of approximately 200 m and extend to a depth of 900 m.
Characteristic minerals are pitchblende, coffinite, adularia, ankerite and
pyrite. Precambrian metasediments are favoured as the source of uranium.
4.6.2 Deposits associated with igneous rocks
The deposits associated with igneous rocks are divided into three sub-classes
(Nash and Granger, 1981):
Deposits in alkalic rocks: high uranium, thorium, niobium, zirconium
and REE associated with alkalic complexes, e.g. nepheline syenites
and carbonatites. Examples of these include the Palabora carbonatite
complex in South Africa.
Deposits in contact zones: located in contact metamorphic aureoles
of granite plutons. Genesis is debated between possible hydrothermal
and supergene mechanisms. Examples include Midnight Mine in the
U.S.A. and the Mary Kathleen mine in Australia.
35
Volcanogenic deposits: volcanogenic deposits are varied in form and
structural setting and are believed to be of probable hydrothermal
origin in volcanic rocks. Uranium deposits are associated with
rhyolitic plugs and domes (Spor Mountain, U.S.A.), faults cutting
hypabyssal intrusives and outflow tuffs (Marysvale, U.S.A.),
volcaniclastic sediment fillings of palaeo-channels and calderas
(McDermit, U.S.A.). Other deposits are associated with ignimbrites,
agglomerates, ash-flow tuffs, as well as metamorphosed subaerial and
subaqueous volcanogenic rocks.
4.7 Omitiomire-style copper
The copper deposit at Omitiomire was outlined in Chapter 3. The possibility
of similar occurrences within the study area is plausible.
A summarised description of the deposit geology follows (from K. Hartmann,
pers. comm., 2011).
Two main geological units exist at the Omitiomire deposit:
Unmineralised leuco-gneisses, interpreted as being metamorphosed
dacite and rhyolite, with quartz, plagioclase, variable amounts of
biotite and trace amounts of garnet and sphene.
Mineralised mafic schist and gneiss, interpreted as being
metamorphosed basaltic andesite, consisting mainly of quartz,
plagioclase, biotite and amphibole, which are usually inter-banded
with more felsic layers.
36
The copper mineralisation is dominated by chalcocite disseminated within
the mafic rocks and is commonly associated with magnetite. Higher grade
zones contain coarse blebs of chalcocite which post-date and over print
foliation in biotite-amphibole schist implying remobilisation or
emplacement of copper during the late Damaran Orogeny. Near surface
mineralisation has been partially oxidised to malachite, chrysocolla and
native copper. Some elevated nickel concentrations (up to 991 ppm) have
been recorded within the mafic schists but generally have an inverse
relation to copper concentration.
The mineralized body is sheet-like, striking north-south and with moderate
dip to the east. The upper contact is a sharp thrust structure between
hanging-wall white gneiss and mineralised schist and amphibolite. The
lower mineralisation boundary is more diffuse and repetition through
folding and thrusting is also present.
37
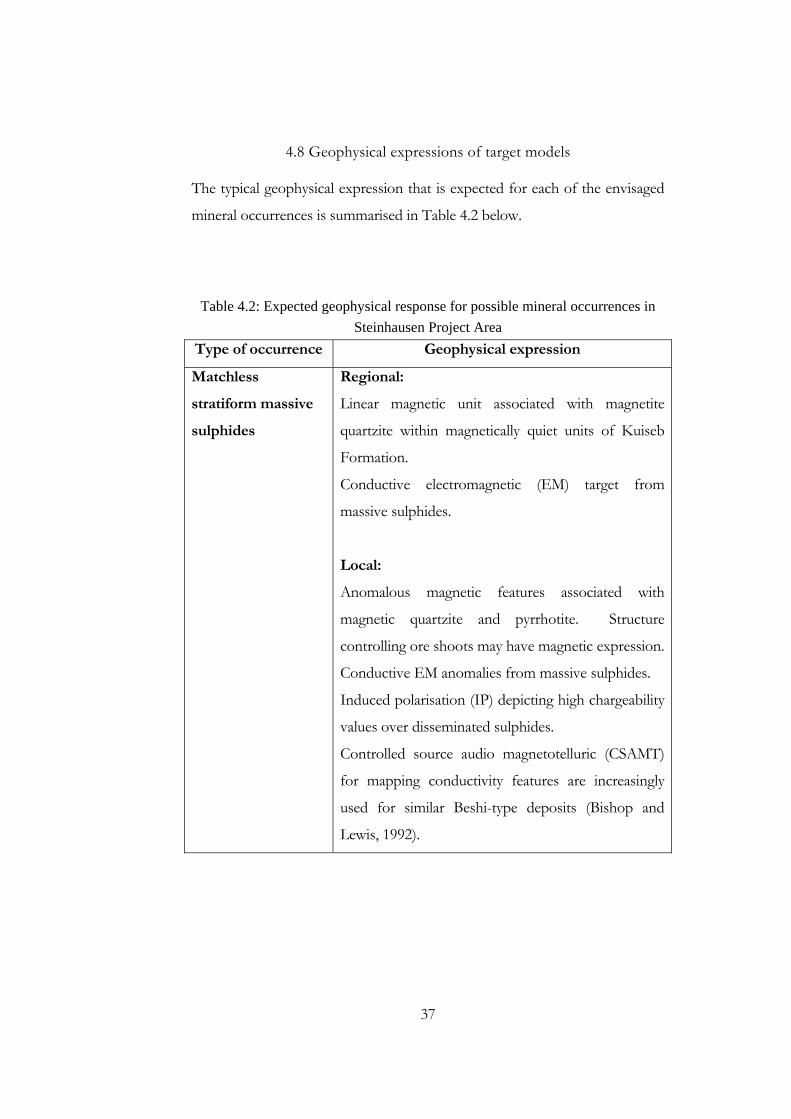
4.8 Geophysical expressions of target models
The typical geophysical expression that is expected for each of the envisaged
mineral occurrences is summarised in Table 4.2 below.
Table 4.2: Expected geophysical response for possible mineral occurrences in
Steinhausen Project Area
Type of occurrence Geophysical expression
Matchless
stratiform massive
sulphides
Regional:
Linear magnetic unit associated with magnetite
quartzite within magnetically quiet units of Kuiseb
Formation.
Conductive electromagnetic (EM) target from
massive sulphides.
Local:
Anomalous magnetic features associated with
magnetic quartzite and pyrrhotite. Structure
controlling ore shoots may have magnetic expression.
Conductive EM anomalies from massive sulphides.
Induced polarisation (IP) depicting high chargeability
values over disseminated sulphides.
Controlled source audio magnetotelluric (CSAMT)
for mapping conductivity features are increasingly
used for similar Beshi-type deposits (Bishop and
Lewis, 1992).
38
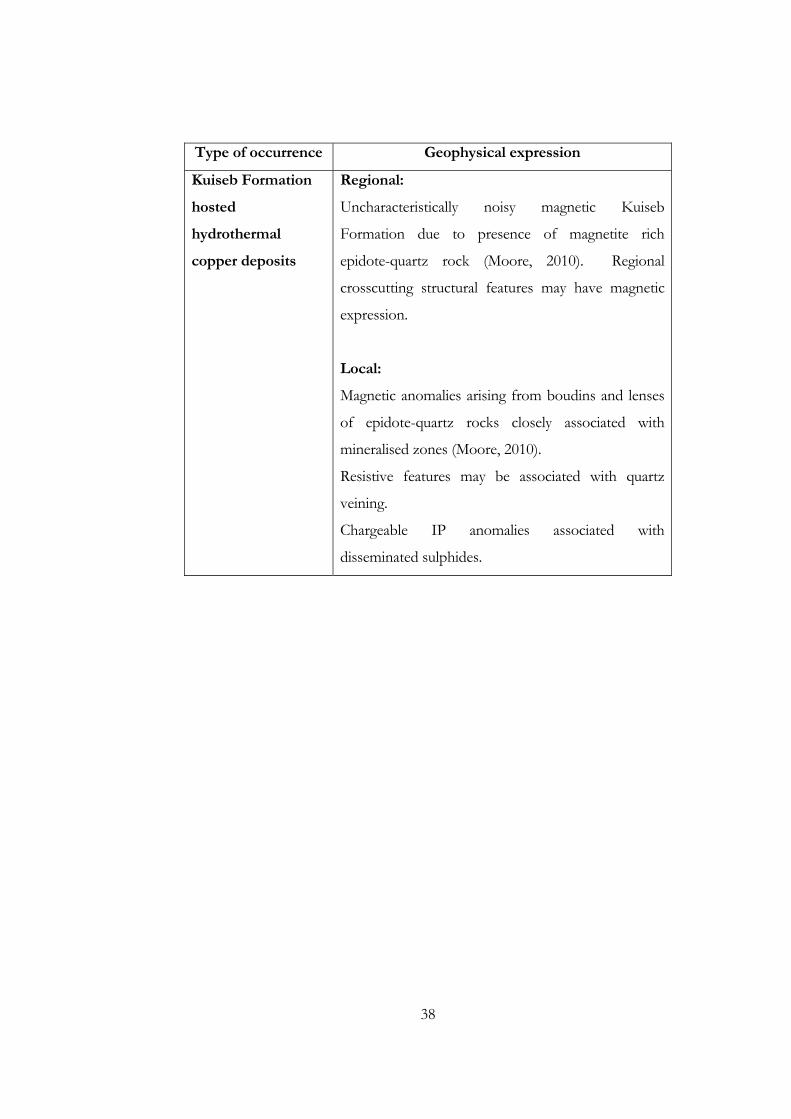
Type of occurrence Geophysical expression
Kuiseb Formation
hosted
hydrothermal
copper deposits
Regional:
Uncharacteristically noisy magnetic Kuiseb
Formation due to presence of magnetite rich
epidote-quartz rock (Moore, 2010). Regional
crosscutting structural features may have magnetic
expression.
Local:
Magnetic anomalies arising from boudins and lenses
of epidote-quartz rocks closely associated with
mineralised zones (Moore, 2010).
Resistive features may be associated with quartz
veining.
Chargeable IP anomalies associated with
disseminated sulphides.
39
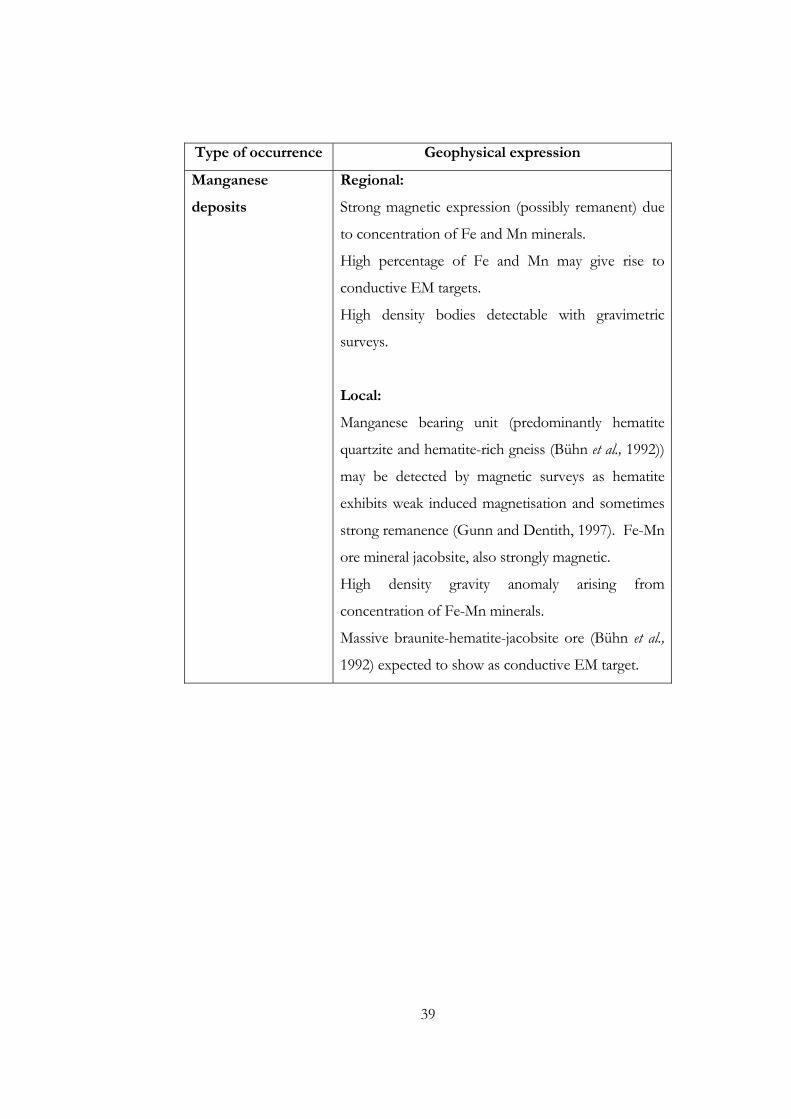
Type of occurrence Geophysical expression
Manganese
deposits
Regional:
Strong magnetic expression (possibly remanent) due
to concentration of Fe and Mn minerals.
High percentage of Fe and Mn may give rise to
conductive EM targets.
High density bodies detectable with gravimetric
surveys.
Local:
Manganese bearing unit (predominantly hematite
quartzite and hematite-rich gneiss (Bühn et al., 1992))
may be detected by magnetic surveys as hematite
exhibits weak induced magnetisation and sometimes
strong remanence (Gunn and Dentith, 1997). Fe-Mn
ore mineral jacobsite, also strongly magnetic.
High density gravity anomaly arising from
concentration of Fe-Mn minerals.
Massive braunite-hematite-jacobsite ore (Bühn et al.,
1992) expected to show as conductive EM target.
40
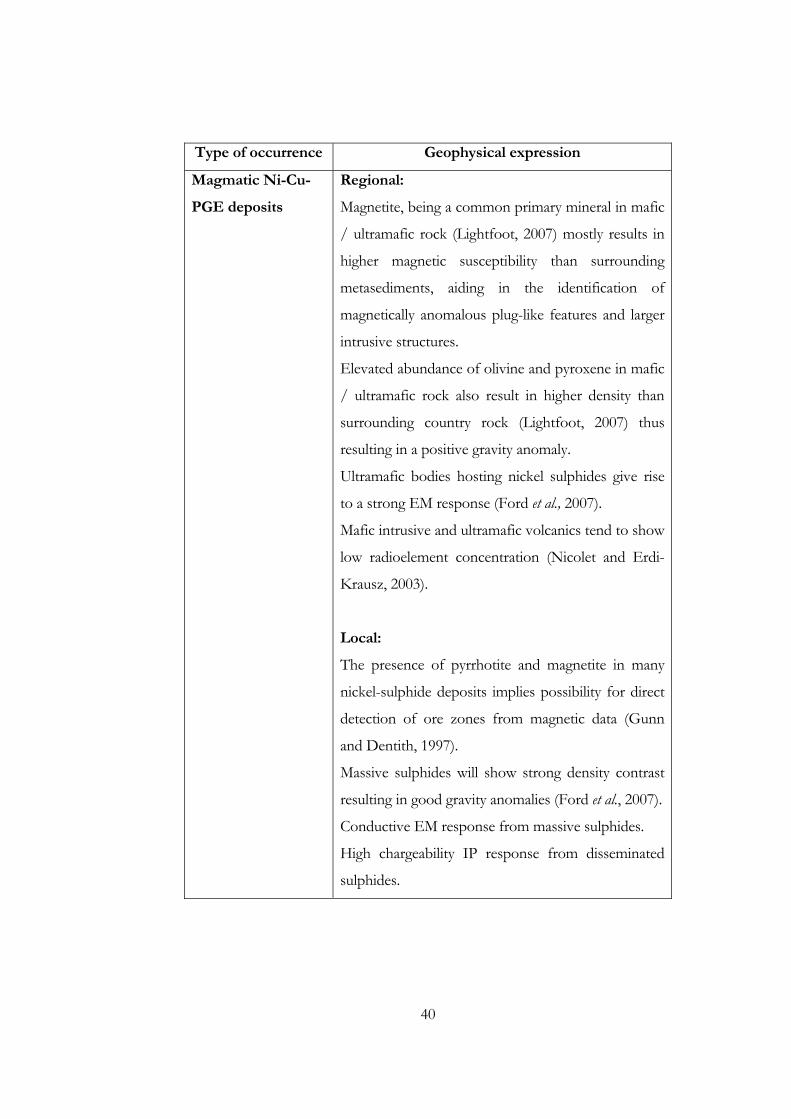
Type of occurrence Geophysical expression
Magmatic Ni-Cu-
PGE deposits
Regional:
Magnetite, being a common primary mineral in mafic
/ ultramafic rock (Lightfoot, 2007) mostly results in
higher magnetic susceptibility than surrounding
metasediments, aiding in the identification of
magnetically anomalous plug-like features and larger
intrusive structures.
Elevated abundance of olivine and pyroxene in mafic
/ ultramafic rock also result in higher density than
surrounding country rock (Lightfoot, 2007) thus
resulting in a positive gravity anomaly.
Ultramafic bodies hosting nickel sulphides give rise
to a strong EM response (Ford et al., 2007).
Mafic intrusive and ultramafic volcanics tend to show
low radioelement concentration (Nicolet and Erdi-
Krausz, 2003).
Local:
The presence of pyrrhotite and magnetite in many
nickel-sulphide deposits implies possibility for direct
detection of ore zones from magnetic data (Gunn
and Dentith, 1997).
Massive sulphides will show strong density contrast
resulting in good gravity anomalies (Ford et al., 2007).
Conductive EM response from massive sulphides.
High chargeability IP response from disseminated
sulphides.
41
Type of occurrence Geophysical expression
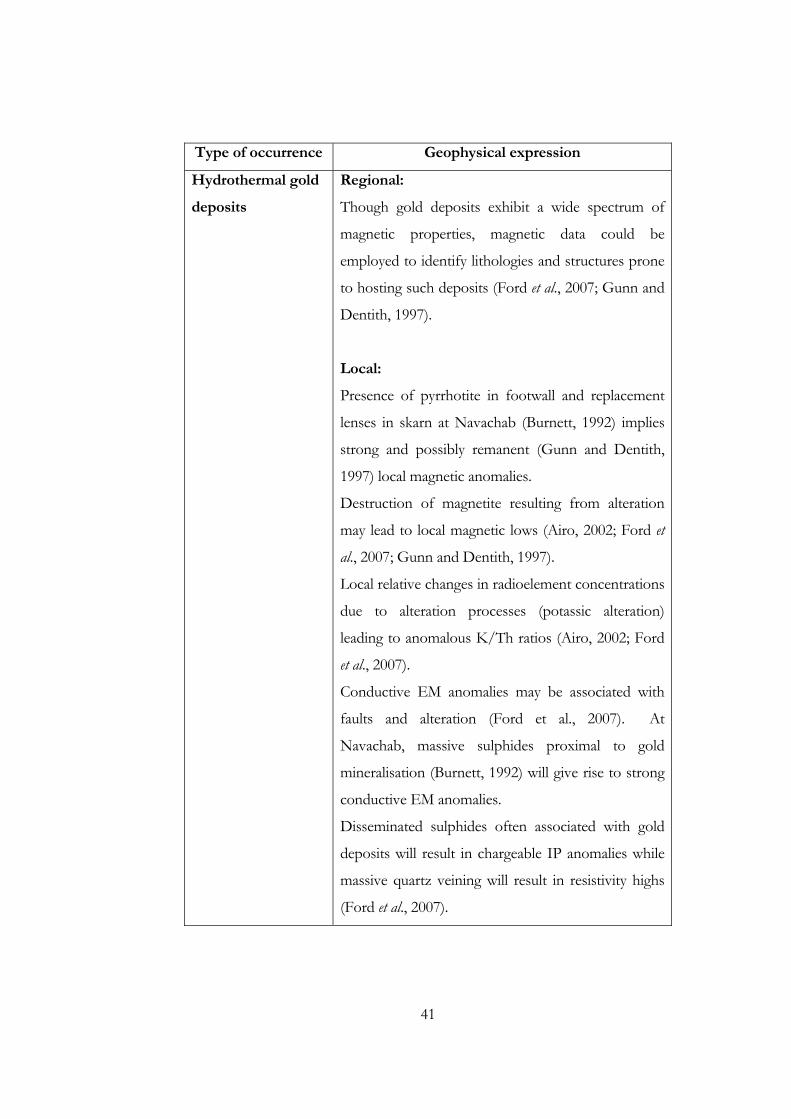
Hydrothermal gold
deposits
Regional:
Though gold deposits exhibit a wide spectrum of
magnetic properties, magnetic data could be
employed to identify lithologies and structures prone
to hosting such deposits (Ford et al., 2007; Gunn and
Dentith, 1997).
Local:
Presence of pyrrhotite in footwall and replacement
lenses in skarn at Navachab (Burnett, 1992) implies
strong and possibly remanent (Gunn and Dentith,
1997) local magnetic anomalies.
Destruction of magnetite resulting from alteration
may lead to local magnetic lows (Airo, 2002; Ford et
al., 2007; Gunn and Dentith, 1997).
Local relative changes in radioelement concentrations
due to alteration processes (potassic alteration)
leading to anomalous K/Th ratios (Airo, 2002; Ford
et al., 2007).
Conductive EM anomalies may be associated with
faults and alteration (Ford et al., 2007). At
Navachab, massive sulphides proximal to gold
mineralisation (Burnett, 1992) will give rise to strong
conductive EM anomalies.
Disseminated sulphides often associated with gold
deposits will result in chargeable IP anomalies while
massive quartz veining will result in resistivity highs
(Ford et al., 2007).
42
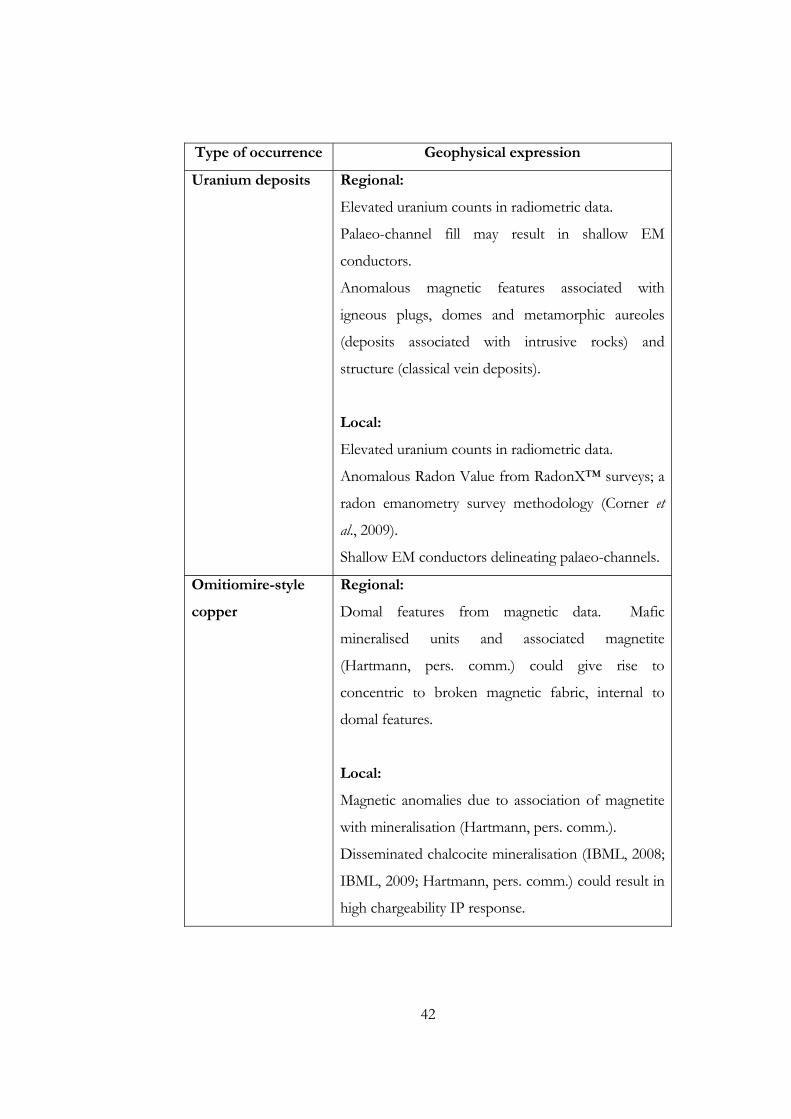
Type of occurrence Geophysical expression
Uranium deposits Regional:
Elevated uranium counts in radiometric data.
Palaeo-channel fill may result in shallow EM
conductors.
Anomalous magnetic features associated with
igneous plugs, domes and metamorphic aureoles
(deposits associated with intrusive rocks) and
structure (classical vein deposits).
Local:
Elevated uranium counts in radiometric data.
Anomalous Radon Value from RadonX™ surveys; a
radon emanometry survey methodology (Corner et
al., 2009).
Shallow EM conductors delineating palaeo-channels.
Omitiomire-style
copper
Regional:
Domal features from magnetic data. Mafic
mineralised units and associated magnetite
(Hartmann, pers. comm.) could give rise to
concentric to broken magnetic fabric, internal to
domal features.
Local:
Magnetic anomalies due to association of magnetite
with mineralisation (Hartmann, pers. comm.).
Disseminated chalcocite mineralisation (IBML, 2008;
IBML, 2009; Hartmann, pers. comm.) could result in
high chargeability IP response.

43
44
C h a p t e r 5
DATASETS AND PROCESSING
Map generation, CAD work and processing of airborne geophysical data were
completed utilising GEOSOFT Oasis Montaj software. Automated
classification of radiometric data was compiled by GRASS GIS, an Open
Source Software.
5.1 Geological Data
Apart from the geological maps from the GSN as discussed in Chapter 2,
other geological data were mostly collected by K.W. Kasch as part of field
work undertaken for Mount Isa Mines Namibia (Pty) Ltd in 1998 (Kasch
1998), and further mapping being done by him for Craton in the south-
western sector of the Steinhausen Area during 2008 (Corner, pers. comm.,
2009). Due to the more detailed collection of information on actual outcrop,
his geological description was used as the basis for geological correlation to
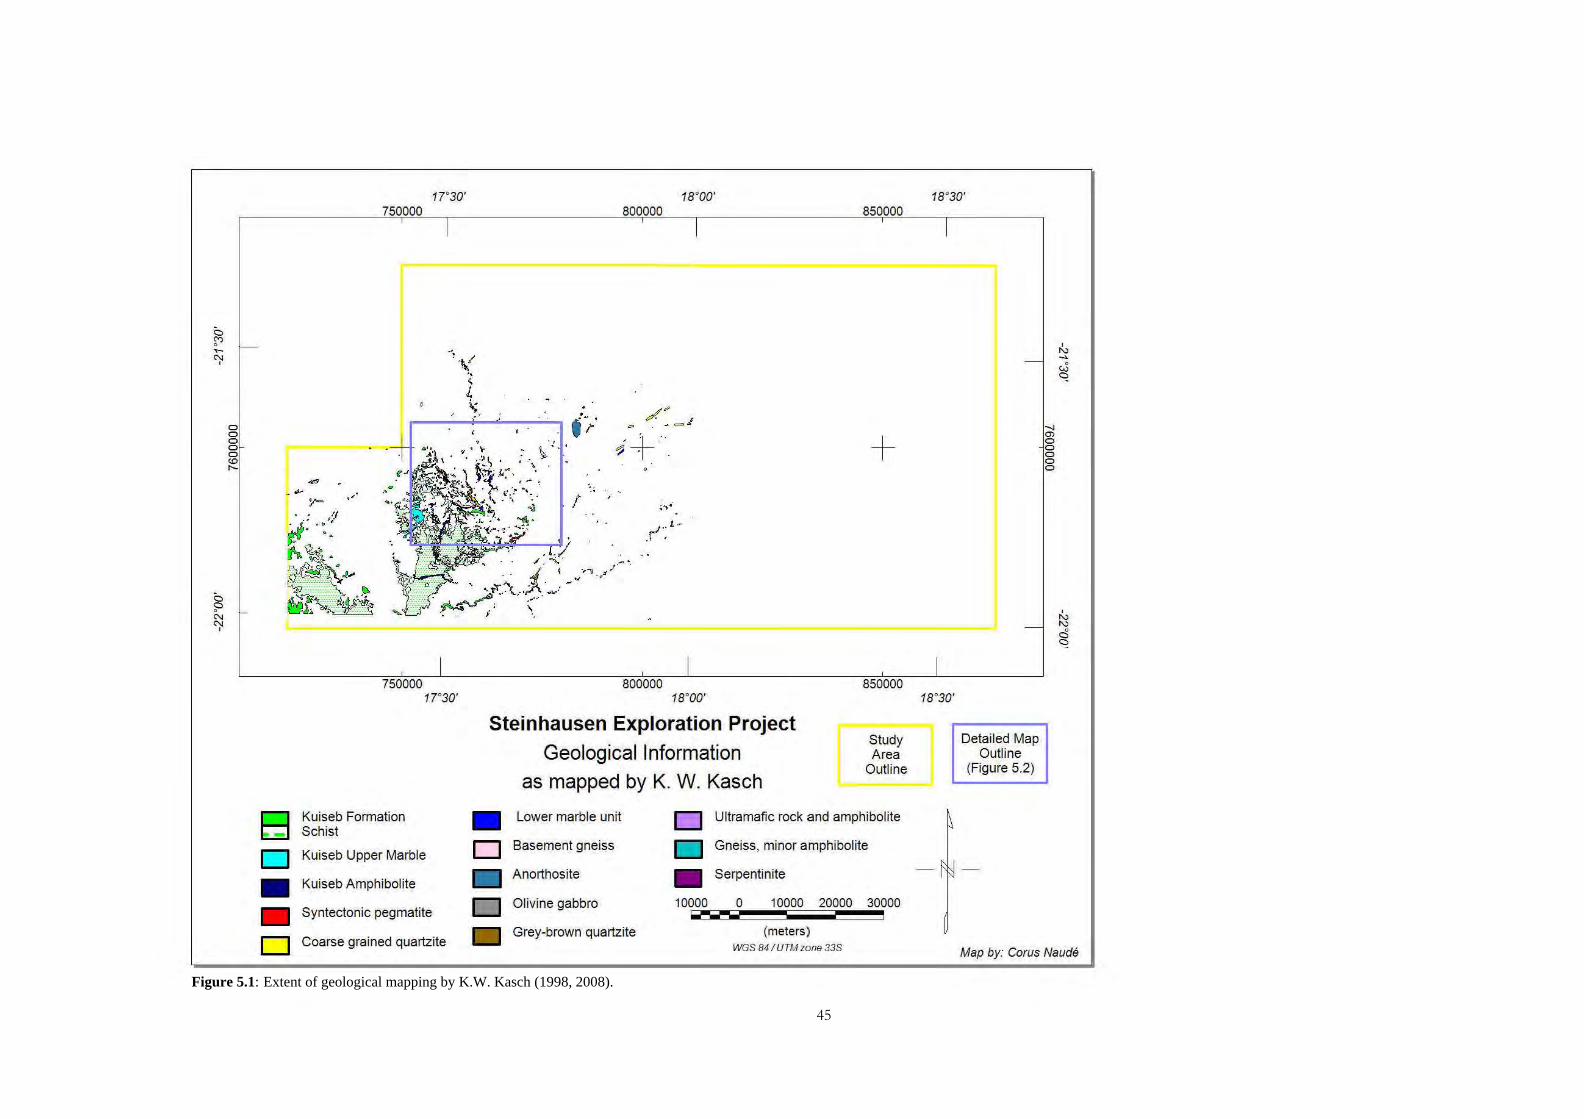
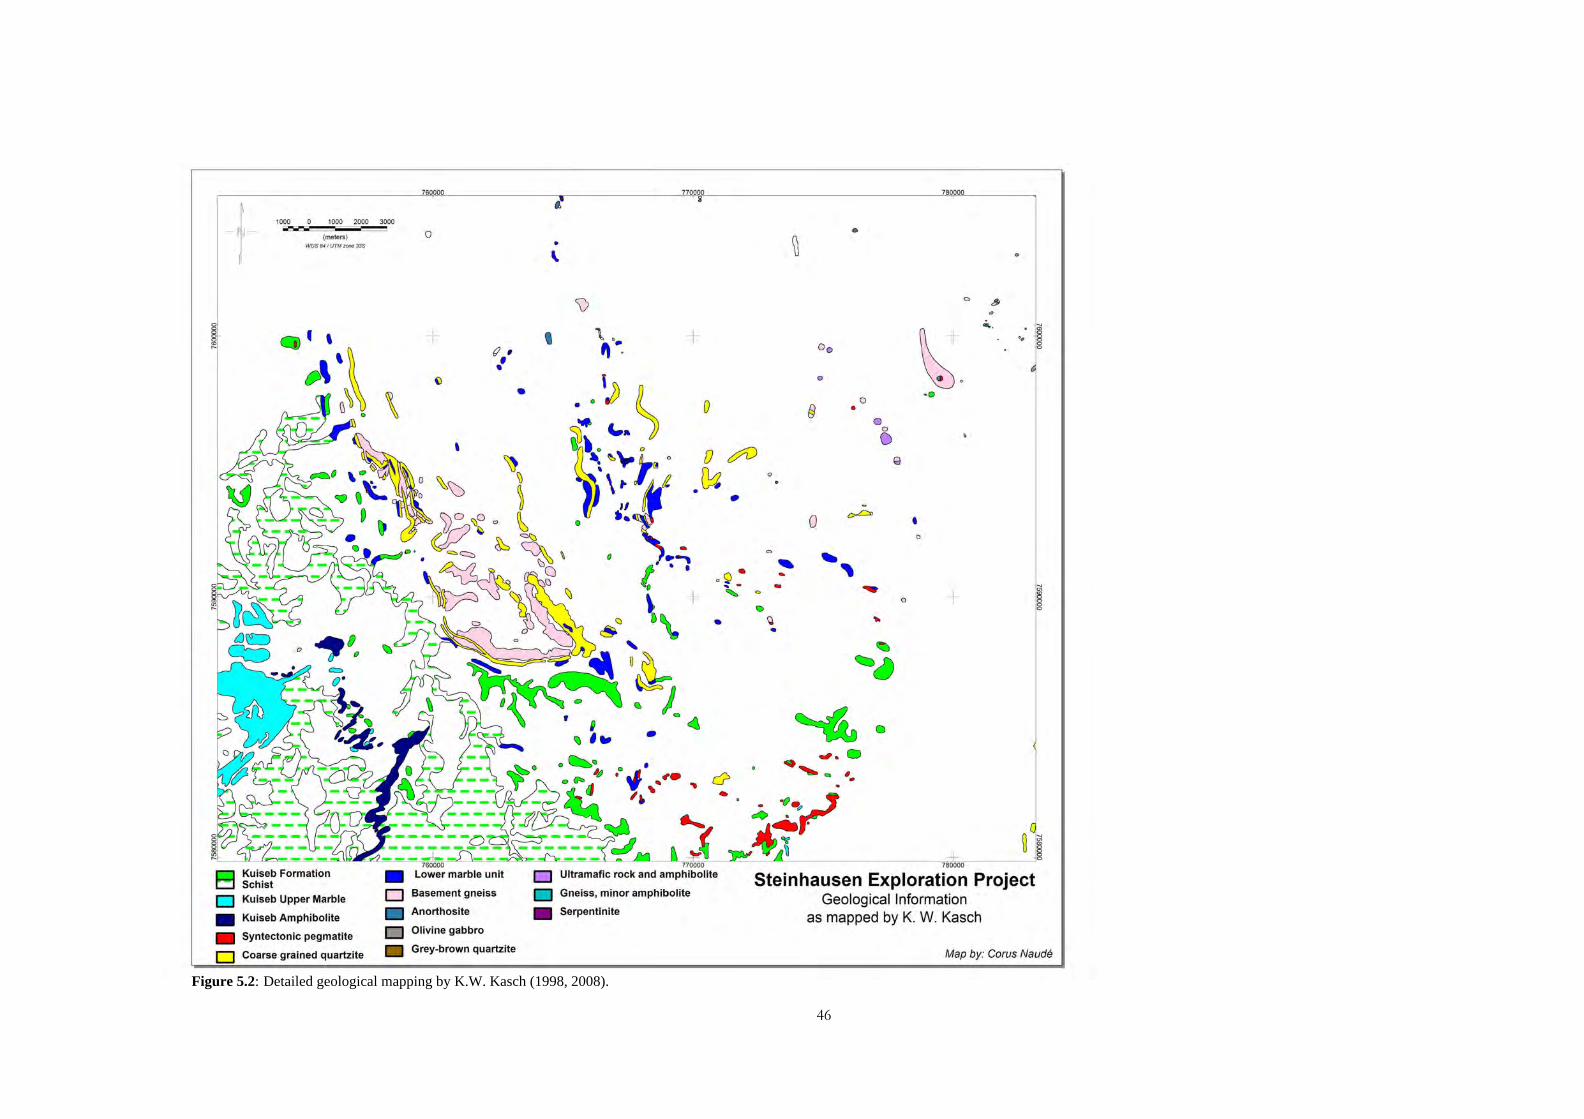
other datasets. Figure 5.1 shows the extent of Kasch’s geological mapping.
As seen in Figure 5.1, Kasch’s geological mapping is restricted to the south-
west, mostly due to the extensive Kalahari sand cover present further
northeast. Important features from Kasch’s mapping include the presence of
a lower amphibolite unit and an upper marble unit within the Kuiseb
Formation schists. These units may play a role in future Kuiseb Formation
mapping as important marker horizons. Figure 5.2 shows these units in more
detail.
45
Figure 5.1: Extent of geological mapping by K.W. Kasch (1998, 2008).
a a a a a ~ ~
E3 D
• • D
17"30' WOO' 750000 800000 850000
.. ~ /
750000 17"30'
Kuiseb Formation Schist
Kuiseb Upper Marble
Kuiseb Amphibolite
Syntectonic pegmatite
Coarse grained quartzite
/ ;.,'
800000 18'00'
Steinhausen Exploration Project
Geological Information
as mapped by K. W. Kasch
+
850000
Study Area
Outline
• Lower marble unit D Ultramafic rock and amphibolite
D Basement gneiss D Gneiss, minor amphibolite
• Anorthosite • Serpentinite
D Olivine gabbro 10000 IOiOI
0 10000 20000 30000
• Grey-brown quartzite (meters) WGS 84 1UTM zone 338
18'30'
18' 30'
Detailed Map Outline
(Figure 5.2)
~ m a a a a a
Map by: Corus Naude
46
Figure 5.2: Detailed geological mapping by K.W. Kasch (1998, 2008).
1000 1000 2000
(meters) WG S 84 I UTM zone 33S
;- Cj) f ,
o,' ~ G\
D Kuiseb Formation E:::l Schist D Kuiseb Upper Marble
• Kuiseb Amphibolite
0
• Syntectonic pegmatite
D Coarse grained quartzite
760000
3000
0
\
'\)
+ , (J , , •
()
\ • 0 •
, ~~
770000
0
D 0J ~
•
o · o _
~-
o . ~ •
•
0 0
0
0
& •
o
~ ., . 0
0 C:> • . , • . . ~.~
c::::) • 41 ·
'<6 ~
770000
780000
~
~o ....
of}
~O
0 0
0 8
• o
a +
0
780000
• D Ultramafic rock and amphibolite Steinhausen Exploration Project Geological Information D Basement gneiss Gneiss, minor amphibolite
Anorthosite • Serpentinite as mapped by K. W. Kasch D Olivine gabbro
~
Grey-brown quartzite Map by: Corus Naude
47
5.2 Satellite Imagery
The Satellite imagery over the survey area was downloaded from the Global
Land Cover Facility (http://glcfapp.glcf.umd.edu:8080/esdi/index.jsp) on the
29th of August 2009. The available data included Landsat ETM+ and Shuttle
Radar Topography data.
5.2.1 Landsat ETM+ data
The survey area is covered by the following two scenes: Path 177 Row 075,
Path 178 Row 075.
The data obtained consist of geo-referenced tiff images of separate Landsat
ETM+ bands as specified in Table 5.1 below:
Table 5.1: Landsat ETM+ Image Details
Path 177 Row 075 Path 178 Row 075
Acquisition Date 24 April
2000 Acquisition Date
17 May
2000
Resolution Bands 1,
2, 3, 4, 5, 7 28.5 m
Resolution Bands 1,
2, 3, 4, 5, 7 28.5 m
Resolution Band 6 57.0 m Resolution Band 6 57.0 m
Resolution Band 8 14.25 m Resolution Band 8 14.25 m
Cloud Cover 0 Cloud Cover 0
The metadata files for the Landsat images used, shown in Appendix A, detail
the image processing and attributes as downloaded from the Global Land
Cover Facility.
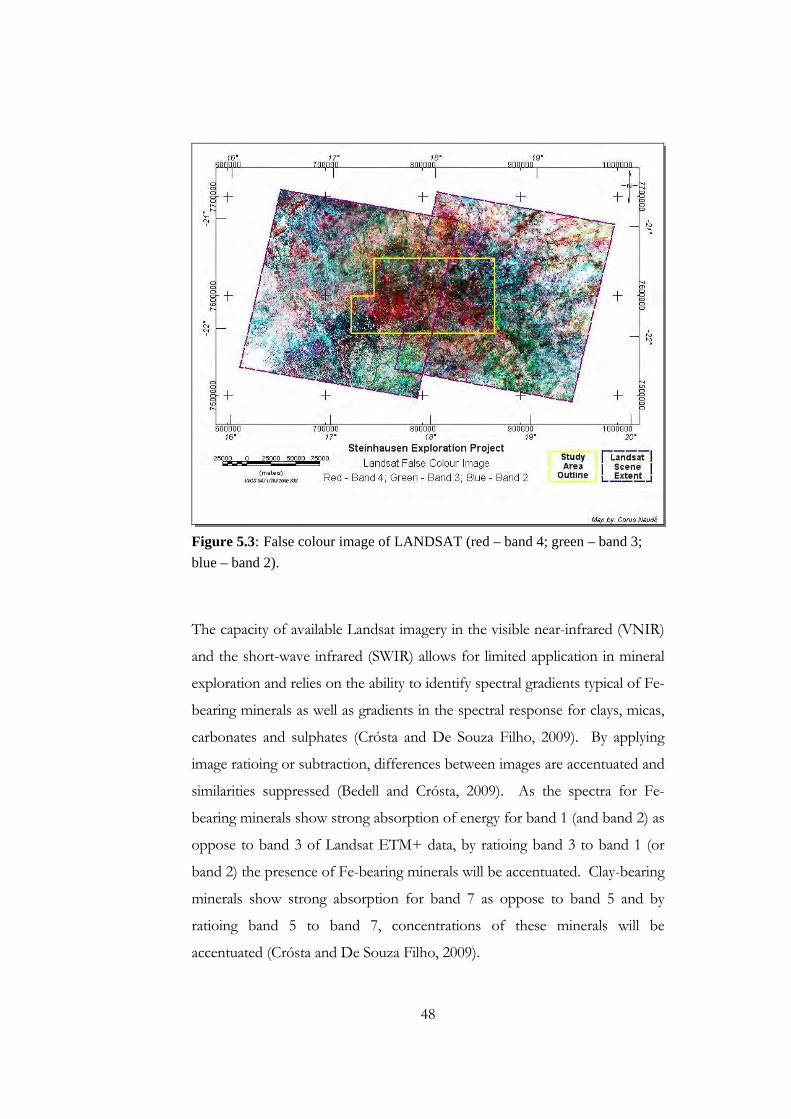
Figure 5.3 shows the false colour image (red – band 4, green – band 3 and
blue – band 2) for the two scenes covering the survey area.
48
Figure 5.3: False colour image of LANDSAT (red – band 4; green – band 3;
blue – band 2).
The capacity of available Landsat imagery in the visible near-infrared (VNIR)
and the short-wave infrared (SWIR) allows for limited application in mineral
exploration and relies on the ability to identify spectral gradients typical of Fe-
bearing minerals as well as gradients in the spectral response for clays, micas,
carbonates and sulphates (Crósta and De Souza Filho, 2009). By applying
image ratioing or subtraction, differences between images are accentuated and
similarities suppressed (Bedell and Crósta, 2009). As the spectra for Fe-
bearing minerals show strong absorption of energy for band 1 (and band 2) as
oppose to band 3 of Landsat ETM+ data, by ratioing band 3 to band 1 (or
band 2) the presence of Fe-bearing minerals will be accentuated. Clay-bearing
minerals show strong absorption for band 7 as oppose to band 5 and by
ratioing band 5 to band 7, concentrations of these minerals will be
accentuated (Crósta and De Souza Filho, 2009).
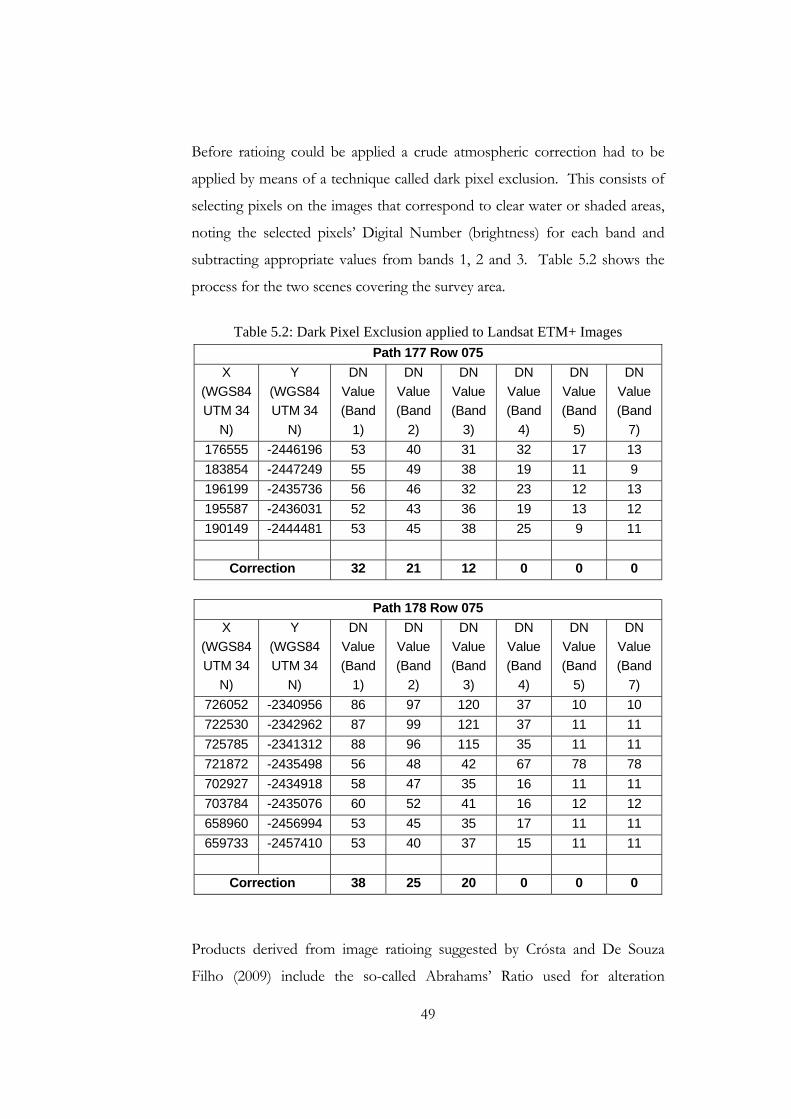
49
Before ratioing could be applied a crude atmospheric correction had to be
applied by means of a technique called dark pixel exclusion. This consists of
selecting pixels on the images that correspond to clear water or shaded areas,
noting the selected pixels’ Digital Number (brightness) for each band and
subtracting appropriate values from bands 1, 2 and 3. Table 5.2 shows the
process for the two scenes covering the survey area.
Table 5.2: Dark Pixel Exclusion applied to Landsat ETM+ Images
Path 177 Row 075
X
(WGS84
UTM 34
N)
Y
(WGS84
UTM 34
N)
DN
Value
(Band
1)
DN
Value
(Band
2)
DN
Value
(Band
3)
DN
Value
(Band
4)
DN
Value
(Band
5)
DN
Value
(Band
7)
176555 -2446196 53 40 31 32 17 13
183854 -2447249 55 49 38 19 11 9
196199 -2435736 56 46 32 23 12 13
195587 -2436031 52 43 36 19 13 12
190149 -2444481 53 45 38 25 9 11
Correction 32 21 12 0 0 0
Path 178 Row 075
X
(WGS84
UTM 34
N)
Y
(WGS84
UTM 34
N)
DN
Value
(Band
1)
DN
Value
(Band
2)
DN
Value
(Band
3)
DN
Value
(Band
4)
DN
Value
(Band
5)
DN
Value
(Band
7)
726052 -2340956 86 97 120 37 10 10
722530 -2342962 87 99 121 37 11 11
725785 -2341312 88 96 115 35 11 11
721872 -2435498 56 48 42 67 78 78
702927 -2434918 58 47 35 16 11 11
703784 -2435076 60 52 41 16 12 12
658960 -2456994 53 45 35 17 11 11
659733 -2457410 53 40 37 15 11 11
Correction 38 25 20 0 0 0
Products derived from image ratioing suggested by Crósta and De Souza
Filho (2009) include the so-called Abrahams’ Ratio used for alteration
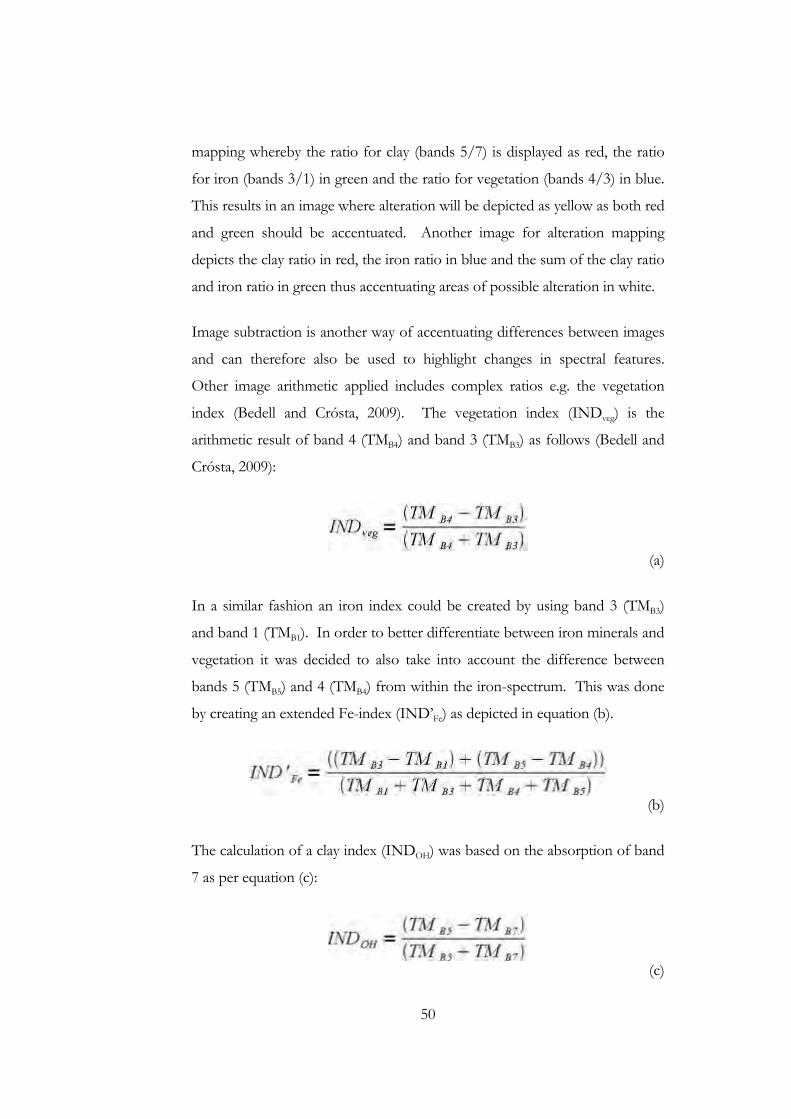
50
mapping whereby the ratio for clay (bands 5/7) is displayed as red, the ratio
for iron (bands 3/1) in green and the ratio for vegetation (bands 4/3) in blue.
This results in an image where alteration will be depicted as yellow as both red
and green should be accentuated. Another image for alteration mapping
depicts the clay ratio in red, the iron ratio in blue and the sum of the clay ratio
and iron ratio in green thus accentuating areas of possible alteration in white.
Image subtraction is another way of accentuating differences between images
and can therefore also be used to highlight changes in spectral features.
Other image arithmetic applied includes complex ratios e.g. the vegetation
index (Bedell and Crósta, 2009). The vegetation index (INDveg) is the
arithmetic result of band 4 (TMB4) and band 3 (TMB3) as follows (Bedell and
Crósta, 2009):
(a)
In a similar fashion an iron index could be created by using band 3 (TMB3)
and band 1 (TMB1). In order to better differentiate between iron minerals and
vegetation it was decided to also take into account the difference between
bands 5 (TMB5) and 4 (TMB4) from within the iron-spectrum. This was done
by creating an extended Fe-index (IND’Fe) as depicted in equation (b).
(b)
The calculation of a clay index (INDOH) was based on the absorption of band
7 as per equation (c):
(c)
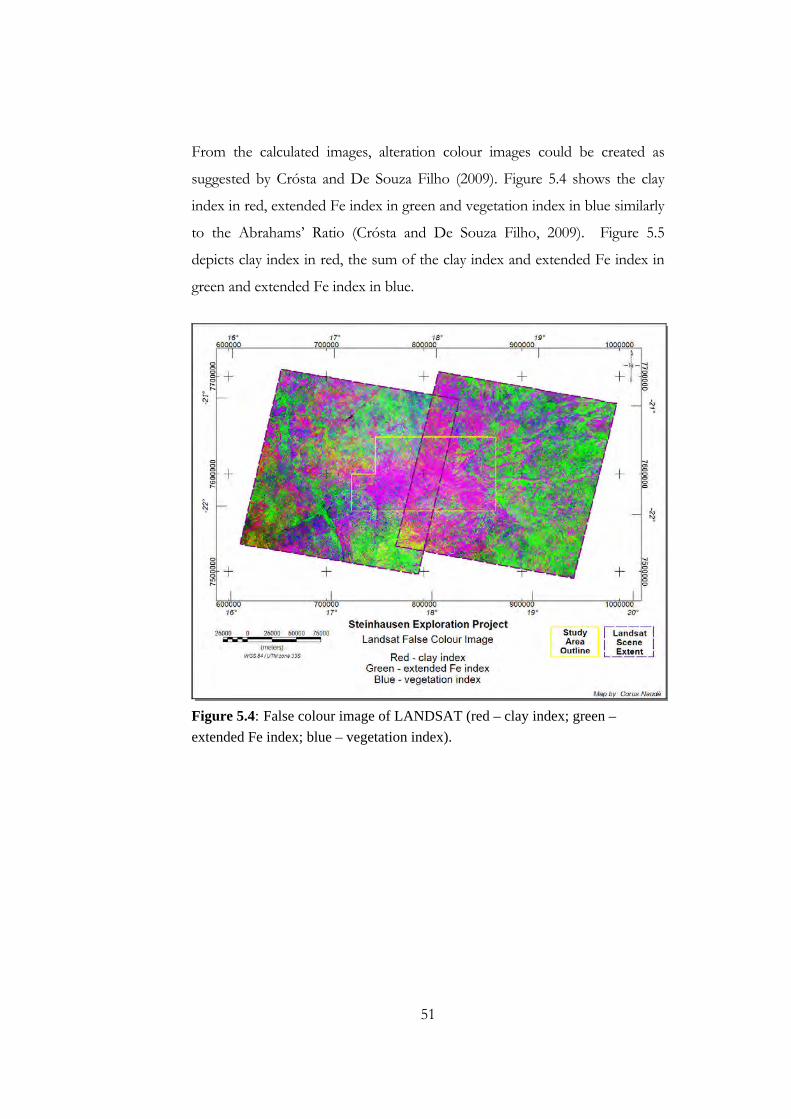
51
From the calculated images, alteration colour images could be created as
suggested by Crósta and De Souza Filho (2009). Figure 5.4 shows the clay
index in red, extended Fe index in green and vegetation index in blue similarly
to the Abrahams’ Ratio (Crósta and De Souza Filho, 2009). Figure 5.5
depicts clay index in red, the sum of the clay index and extended Fe index in
green and extended Fe index in blue.
Figure 5.4: False colour image of LANDSAT (red – clay index; green –
extended Fe index; blue – vegetation index).
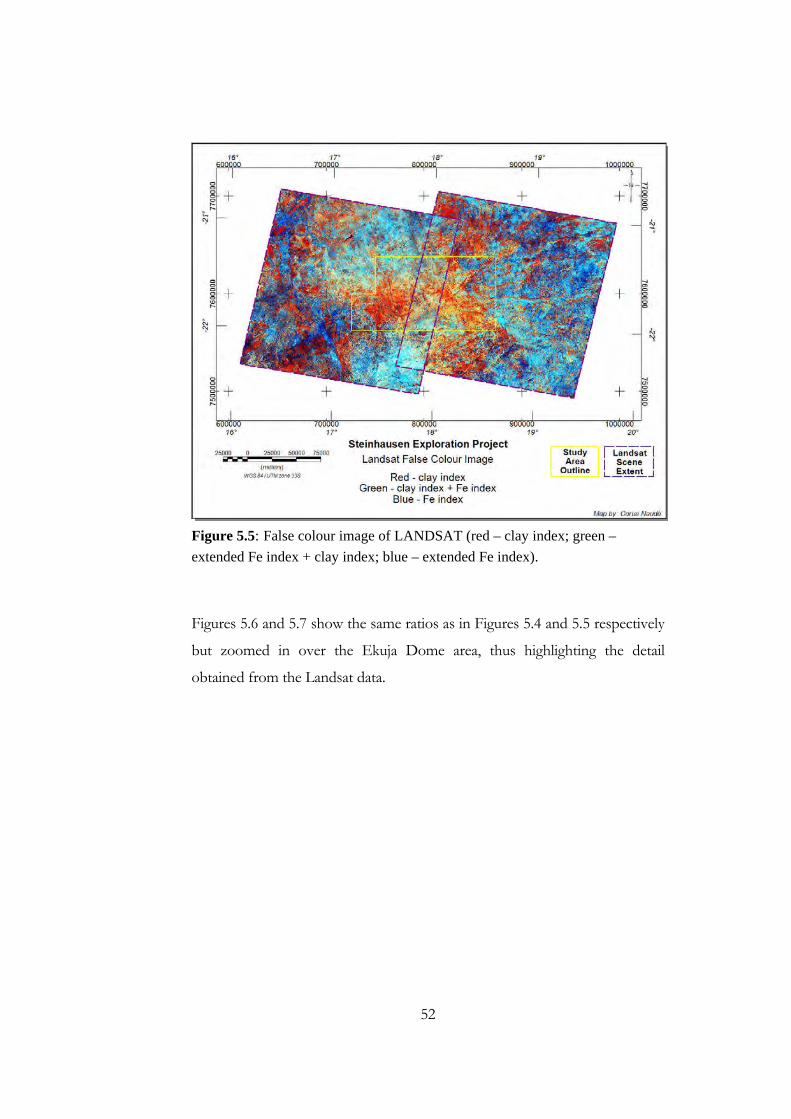
52
Figure 5.5: False colour image of LANDSAT (red – clay index; green –
extended Fe index + clay index; blue – extended Fe index).
Figures 5.6 and 5.7 show the same ratios as in Figures 5.4 and 5.5 respectively
but zoomed in over the Ekuja Dome area, thus highlighting the detail
obtained from the Landsat data.
53
Figure 5.6: False colour image of LANDSAT data over Ekuja-dome area. (red
– clay index; green – extended Fe index; blue – vegetation index).
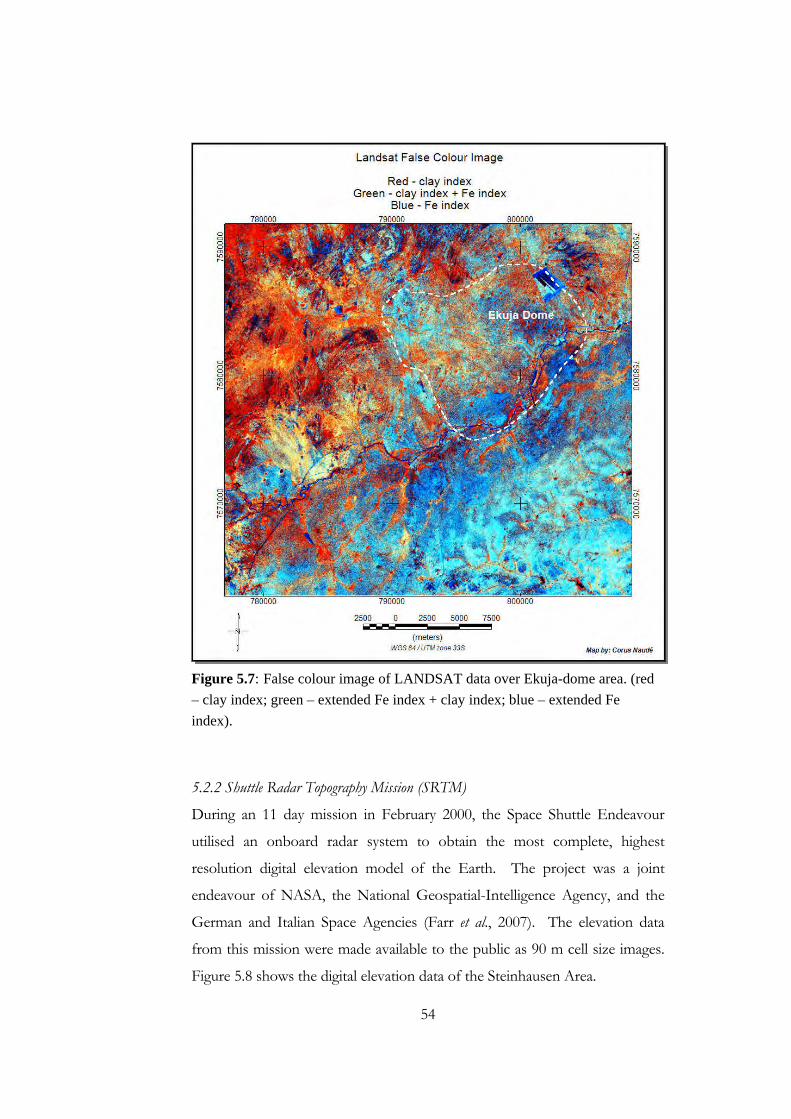
54
Figure 5.7: False colour image of LANDSAT data over Ekuja-dome area. (red
– clay index; green – extended Fe index + clay index; blue – extended Fe
index).
5.2.2 Shuttle Radar Topography Mission (SRTM)
During an 11 day mission in February 2000, the Space Shuttle Endeavour
utilised an onboard radar system to obtain the most complete, highest
resolution digital elevation model of the Earth. The project was a joint
endeavour of NASA, the National Geospatial-Intelligence Agency, and the
German and Italian Space Agencies (Farr et al., 2007). The elevation data
from this mission were made available to the public as 90 m cell size images.
Figure 5.8 shows the digital elevation data of the Steinhausen Area.
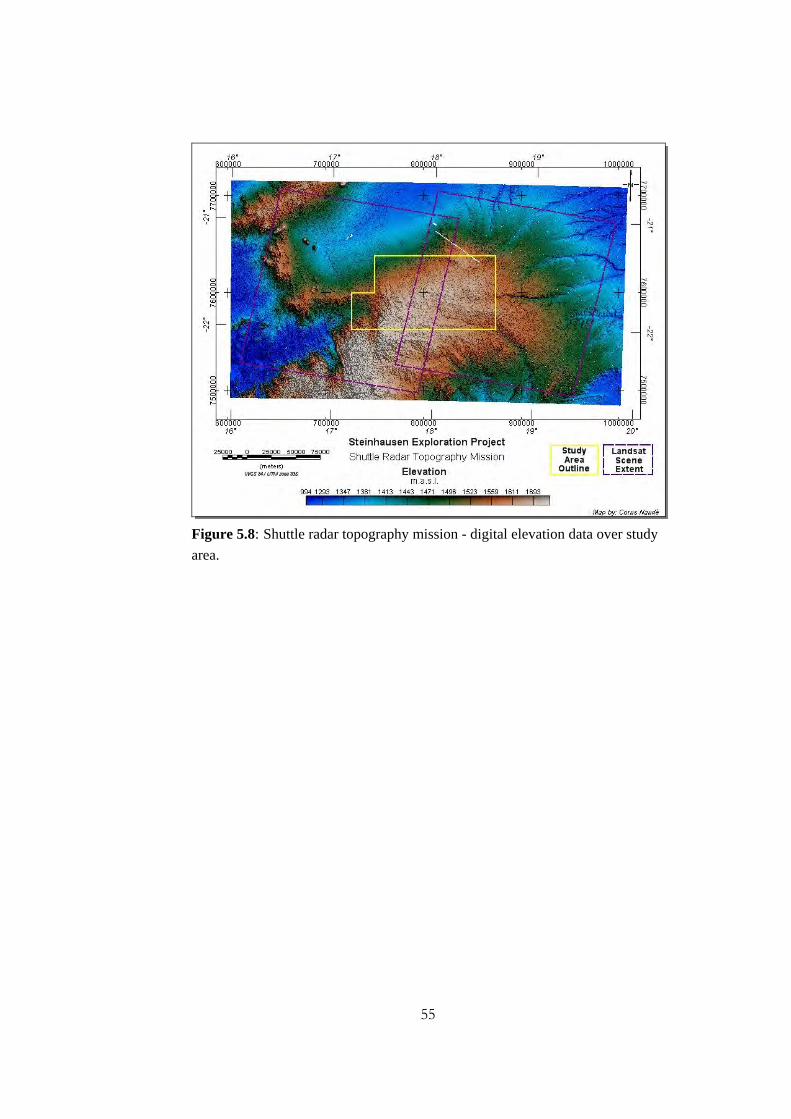
55
Figure 5.8: Shuttle radar topography mission - digital elevation data over study
area.
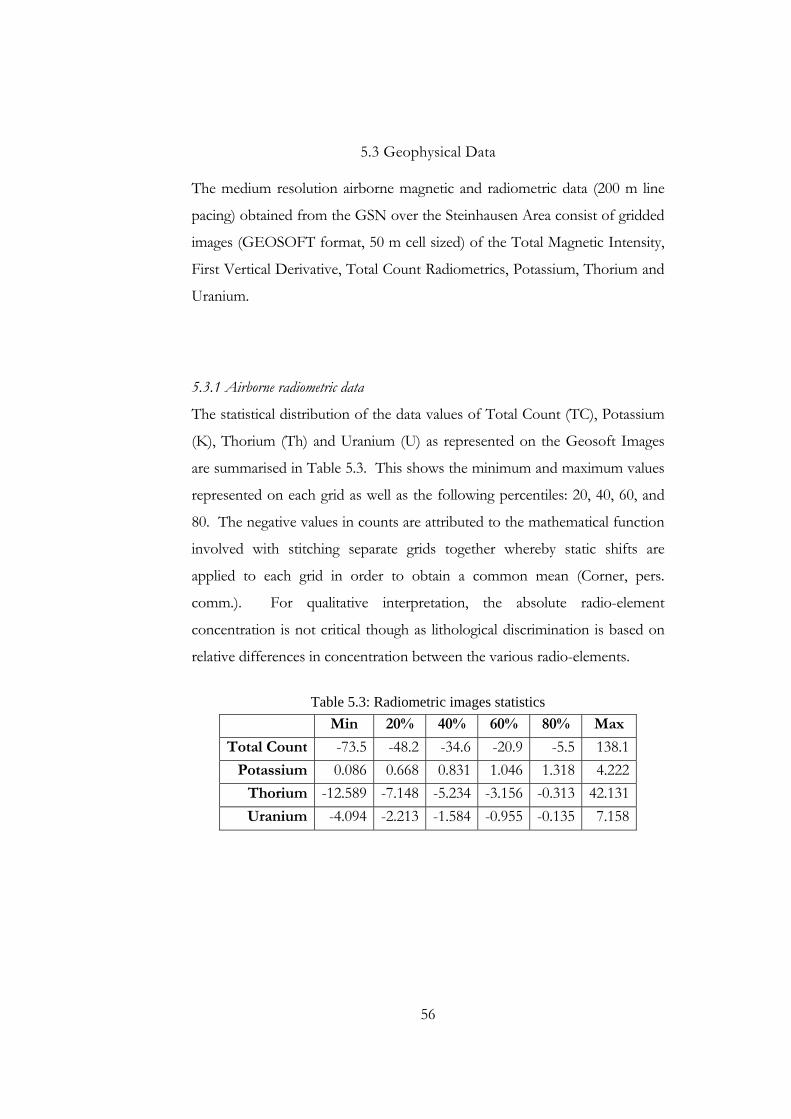
56
5.3 Geophysical Data
The medium resolution airborne magnetic and radiometric data (200 m line
pacing) obtained from the GSN over the Steinhausen Area consist of gridded
images (GEOSOFT format, 50 m cell sized) of the Total Magnetic Intensity,
First Vertical Derivative, Total Count Radiometrics, Potassium, Thorium and
Uranium.
5.3.1 Airborne radiometric data
The statistical distribution of the data values of Total Count (TC), Potassium
(K), Thorium (Th) and Uranium (U) as represented on the Geosoft Images
are summarised in Table 5.3. This shows the minimum and maximum values
represented on each grid as well as the following percentiles: 20, 40, 60, and
80. The negative values in counts are attributed to the mathematical function
involved with stitching separate grids together whereby static shifts are
applied to each grid in order to obtain a common mean (Corner, pers.
comm.). For qualitative interpretation, the absolute radio-element
concentration is not critical though as lithological discrimination is based on
relative differences in concentration between the various radio-elements.
Table 5.3: Radiometric images statistics
Min 20% 40% 60% 80% Max
Total Count -73.5 -48.2 -34.6 -20.9 -5.5 138.1
Potassium 0.086 0.668 0.831 1.046 1.318 4.222
Thorium -12.589 -7.148 -5.234 -3.156 -0.313 42.131
Uranium -4.094 -2.213 -1.584 -0.955 -0.135 7.158
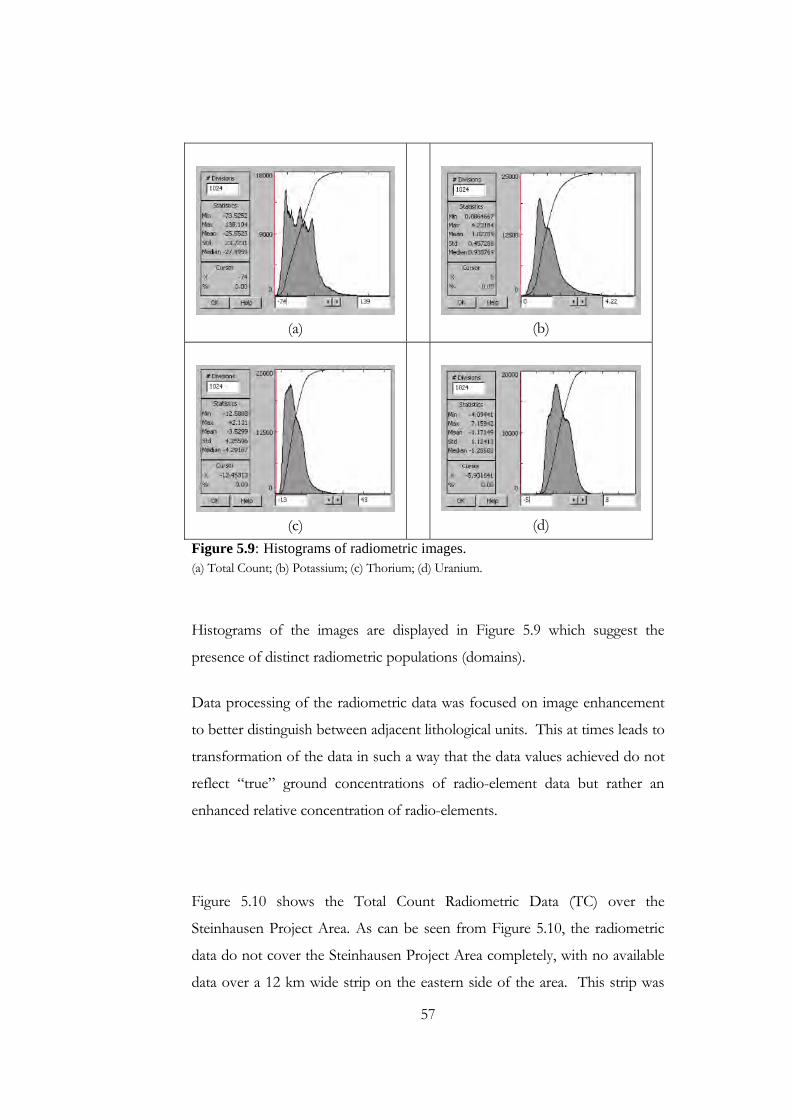
57
(a)
(b)
(c)
(d)
Figure 5.9: Histograms of radiometric images. (a) Total Count; (b) Potassium; (c) Thorium; (d) Uranium.
Histograms of the images are displayed in Figure 5.9 which suggest the
presence of distinct radiometric populations (domains).
Data processing of the radiometric data was focused on image enhancement
to better distinguish between adjacent lithological units. This at times leads to
transformation of the data in such a way that the data values achieved do not
reflect “true” ground concentrations of radio-element data but rather an
enhanced relative concentration of radio-elements.
Figure 5.10 shows the Total Count Radiometric Data (TC) over the
Steinhausen Project Area. As can be seen from Figure 5.10, the radiometric
data do not cover the Steinhausen Project Area completely, with no available
data over a 12 km wide strip on the eastern side of the area. This strip was
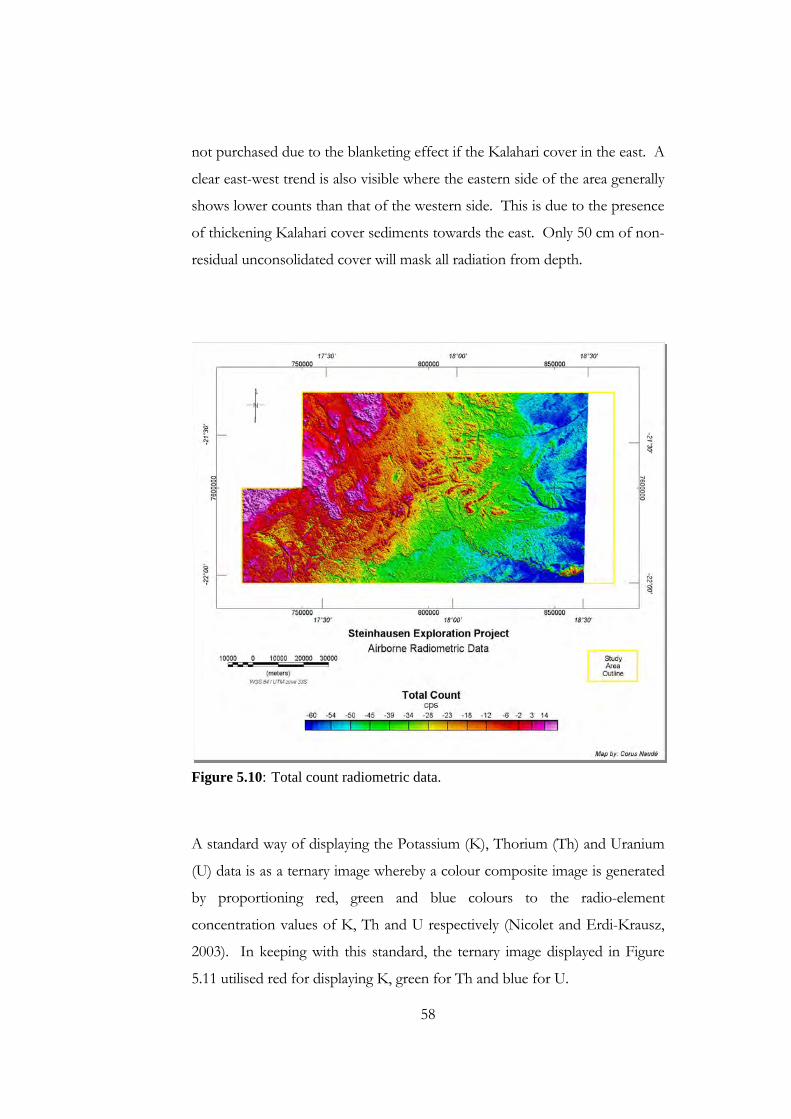
58
not purchased due to the blanketing effect if the Kalahari cover in the east. A
clear east-west trend is also visible where the eastern side of the area generally
shows lower counts than that of the western side. This is due to the presence
of thickening Kalahari cover sediments towards the east. Only 50 cm of non-
residual unconsolidated cover will mask all radiation from depth.
Figure 5.10: Total count radiometric data.
A standard way of displaying the Potassium (K), Thorium (Th) and Uranium
(U) data is as a ternary image whereby a colour composite image is generated
by proportioning red, green and blue colours to the radio-element
concentration values of K, Th and U respectively (Nicolet and Erdi-Krausz,
2003). In keeping with this standard, the ternary image displayed in Figure
5.11 utilised red for displaying K, green for Th and blue for U.
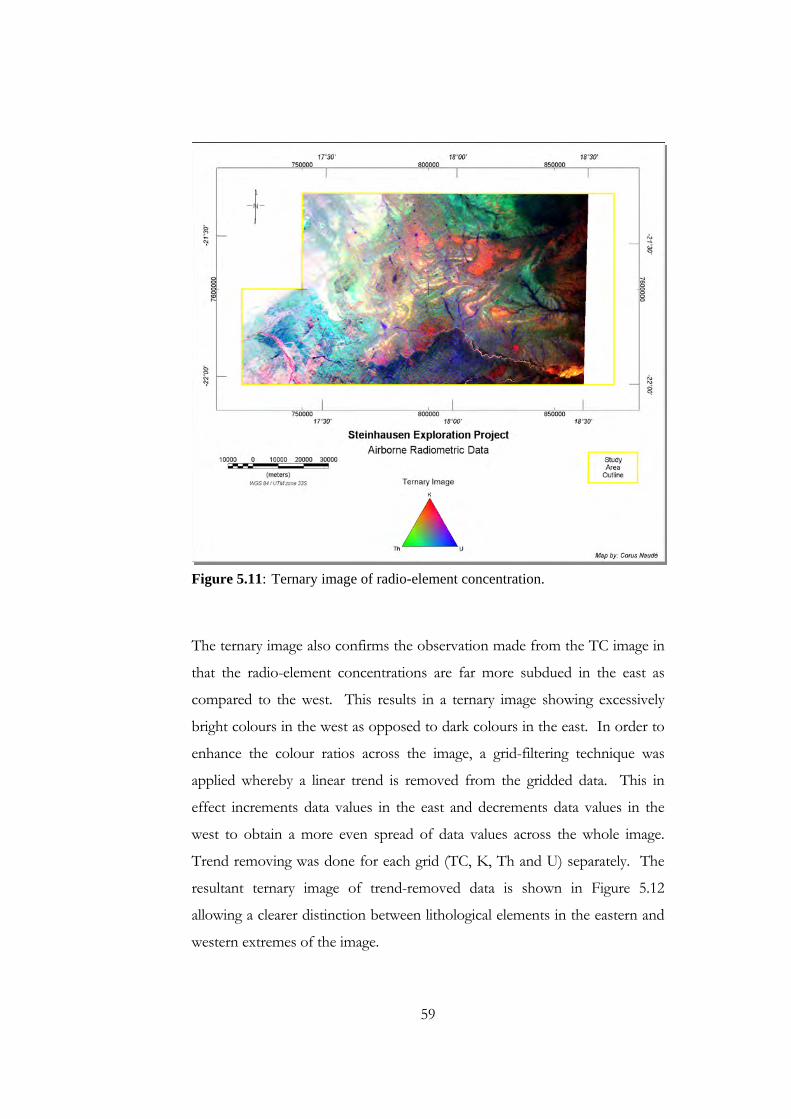
59
Figure 5.11: Ternary image of radio-element concentration.
The ternary image also confirms the observation made from the TC image in
that the radio-element concentrations are far more subdued in the east as
compared to the west. This results in a ternary image showing excessively
bright colours in the west as opposed to dark colours in the east. In order to
enhance the colour ratios across the image, a grid-filtering technique was
applied whereby a linear trend is removed from the gridded data. This in
effect increments data values in the east and decrements data values in the
west to obtain a more even spread of data values across the whole image.
Trend removing was done for each grid (TC, K, Th and U) separately. The
resultant ternary image of trend-removed data is shown in Figure 5.12
allowing a clearer distinction between lithological elements in the eastern and
western extremes of the image.
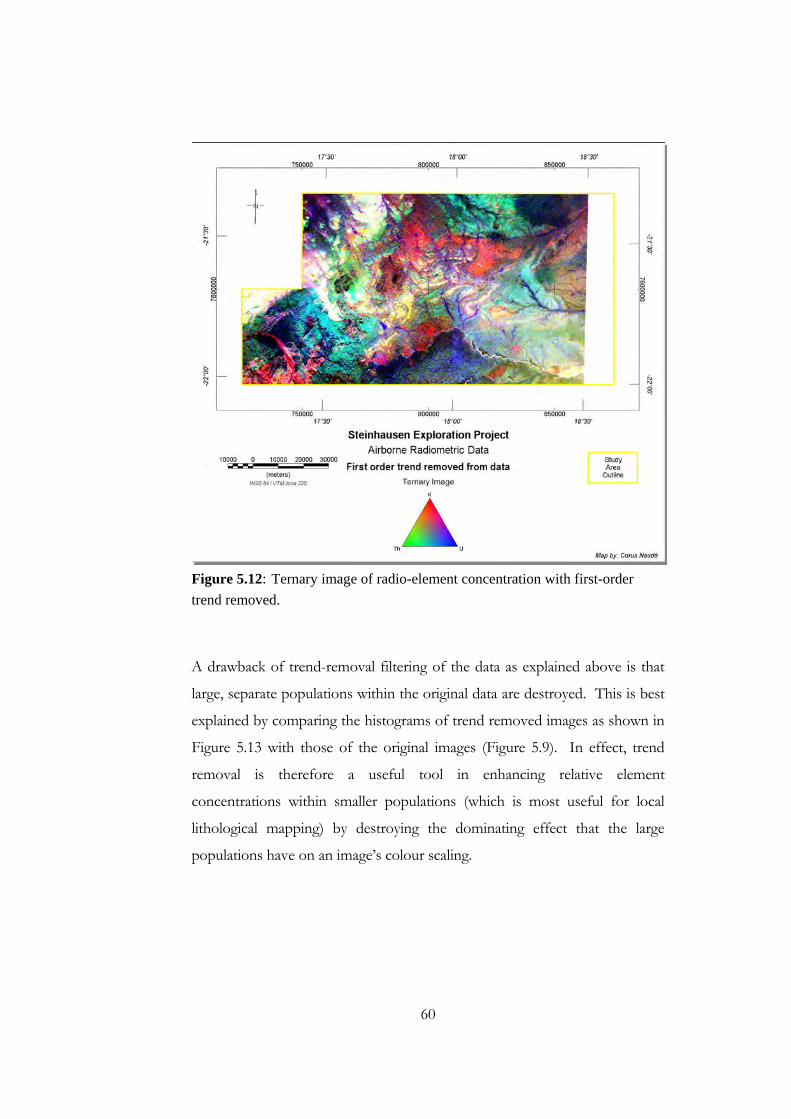
60
Figure 5.12: Ternary image of radio-element concentration with first-order
trend removed.
A drawback of trend-removal filtering of the data as explained above is that
large, separate populations within the original data are destroyed. This is best
explained by comparing the histograms of trend removed images as shown in
Figure 5.13 with those of the original images (Figure 5.9). In effect, trend
removal is therefore a useful tool in enhancing relative element
concentrations within smaller populations (which is most useful for local
lithological mapping) by destroying the dominating effect that the large
populations have on an image’s colour scaling.
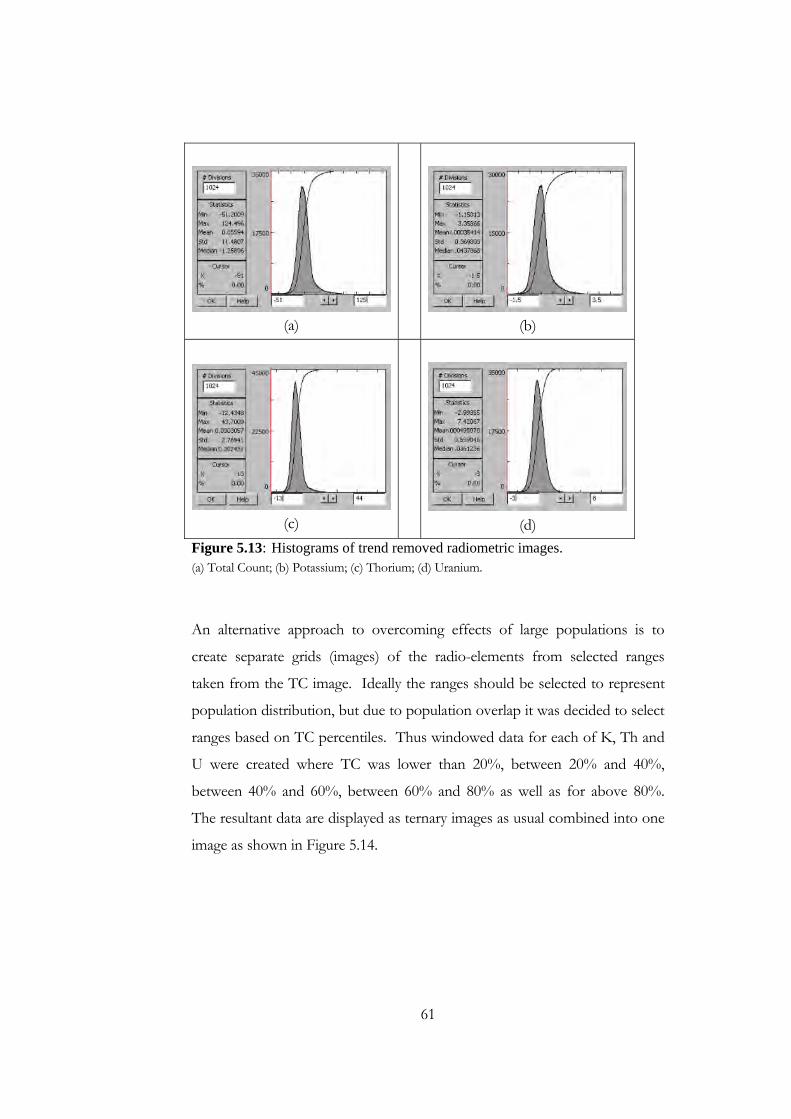
61
(a)
(b)
(c)
(d)
Figure 5.13: Histograms of trend removed radiometric images. (a) Total Count; (b) Potassium; (c) Thorium; (d) Uranium.
An alternative approach to overcoming effects of large populations is to
create separate grids (images) of the radio-elements from selected ranges
taken from the TC image. Ideally the ranges should be selected to represent
population distribution, but due to population overlap it was decided to select
ranges based on TC percentiles. Thus windowed data for each of K, Th and
U were created where TC was lower than 20%, between 20% and 40%,
between 40% and 60%, between 60% and 80% as well as for above 80%.
The resultant data are displayed as ternary images as usual combined into one
image as shown in Figure 5.14.
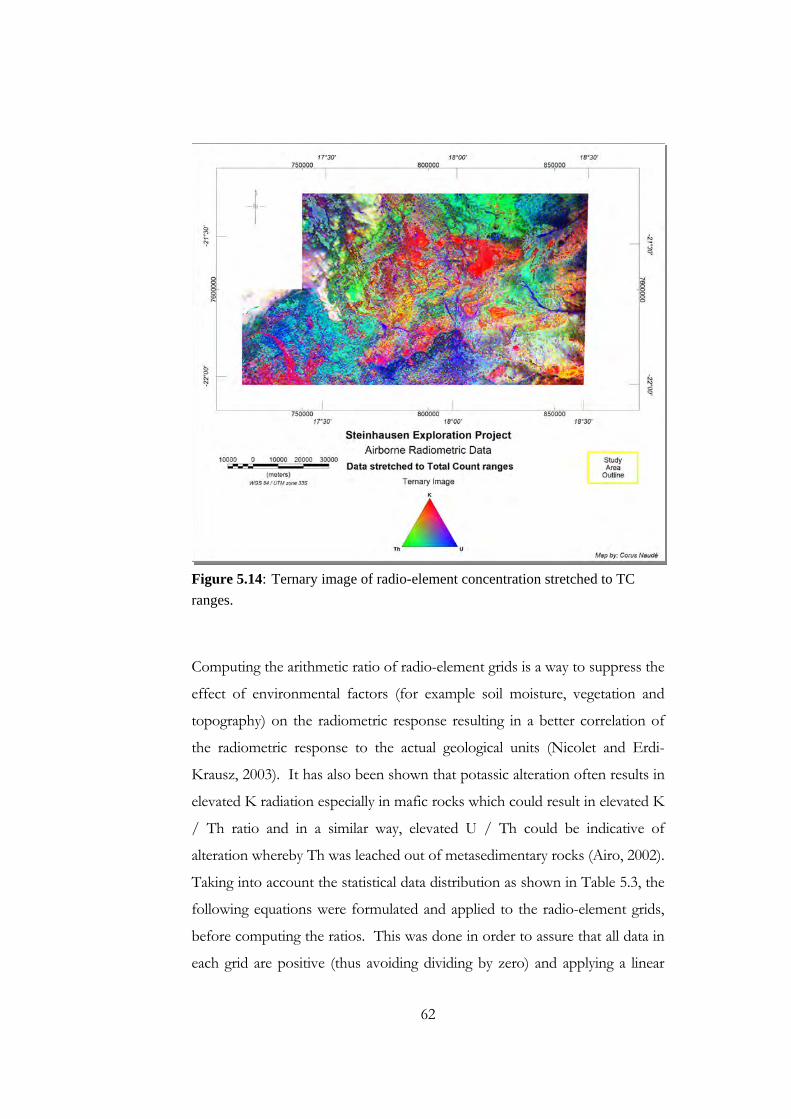
62
Figure 5.14: Ternary image of radio-element concentration stretched to TC
ranges.
Computing the arithmetic ratio of radio-element grids is a way to suppress the
effect of environmental factors (for example soil moisture, vegetation and
topography) on the radiometric response resulting in a better correlation of
the radiometric response to the actual geological units (Nicolet and Erdi-
Krausz, 2003). It has also been shown that potassic alteration often results in
elevated K radiation especially in mafic rocks which could result in elevated K
/ Th ratio and in a similar way, elevated U / Th could be indicative of
alteration whereby Th was leached out of metasedimentary rocks (Airo, 2002).
Taking into account the statistical data distribution as shown in Table 5.3, the
following equations were formulated and applied to the radio-element grids,
before computing the ratios. This was done in order to assure that all data in
each grid are positive (thus avoiding dividing by zero) and applying a linear
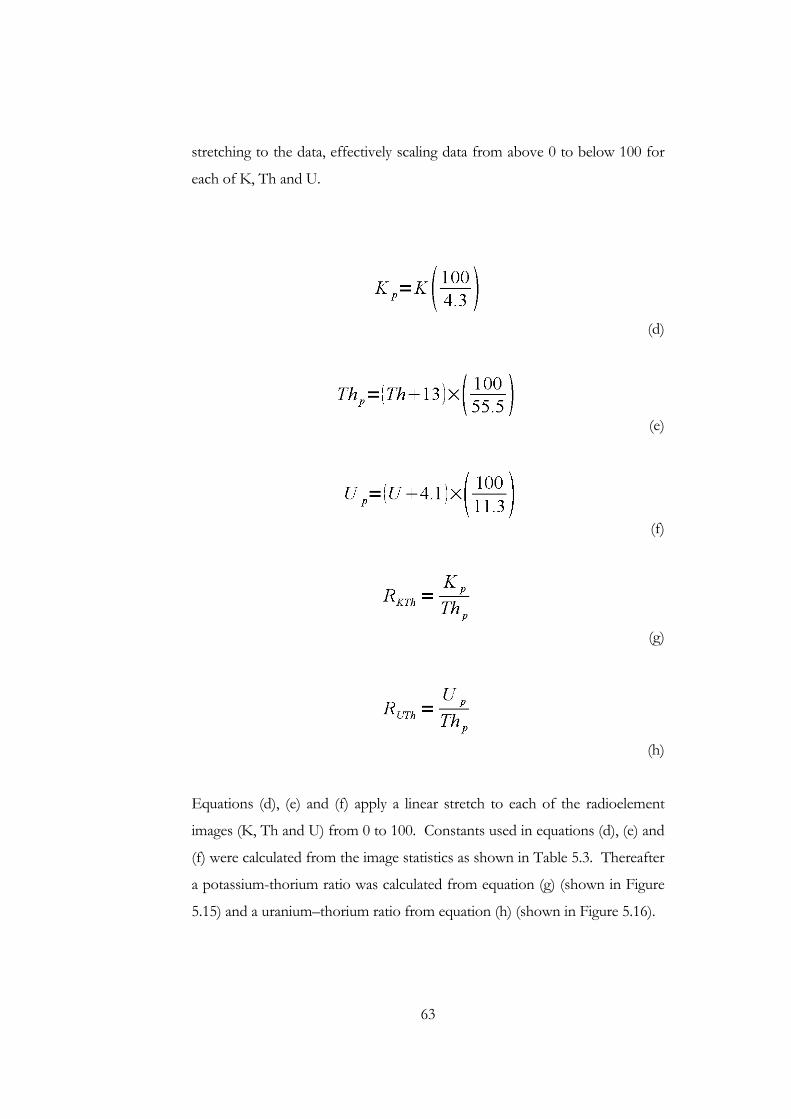
63
stretching to the data, effectively scaling data from above 0 to below 100 for
each of K, Th and U.
(d)
(e)
(f)
(g)
(h)
Equations (d), (e) and (f) apply a linear stretch to each of the radioelement
images (K, Th and U) from 0 to 100. Constants used in equations (d), (e) and
(f) were calculated from the image statistics as shown in Table 5.3. Thereafter
a potassium-thorium ratio was calculated from equation (g) (shown in Figure
5.15) and a uranium–thorium ratio from equation (h) (shown in Figure 5.16).
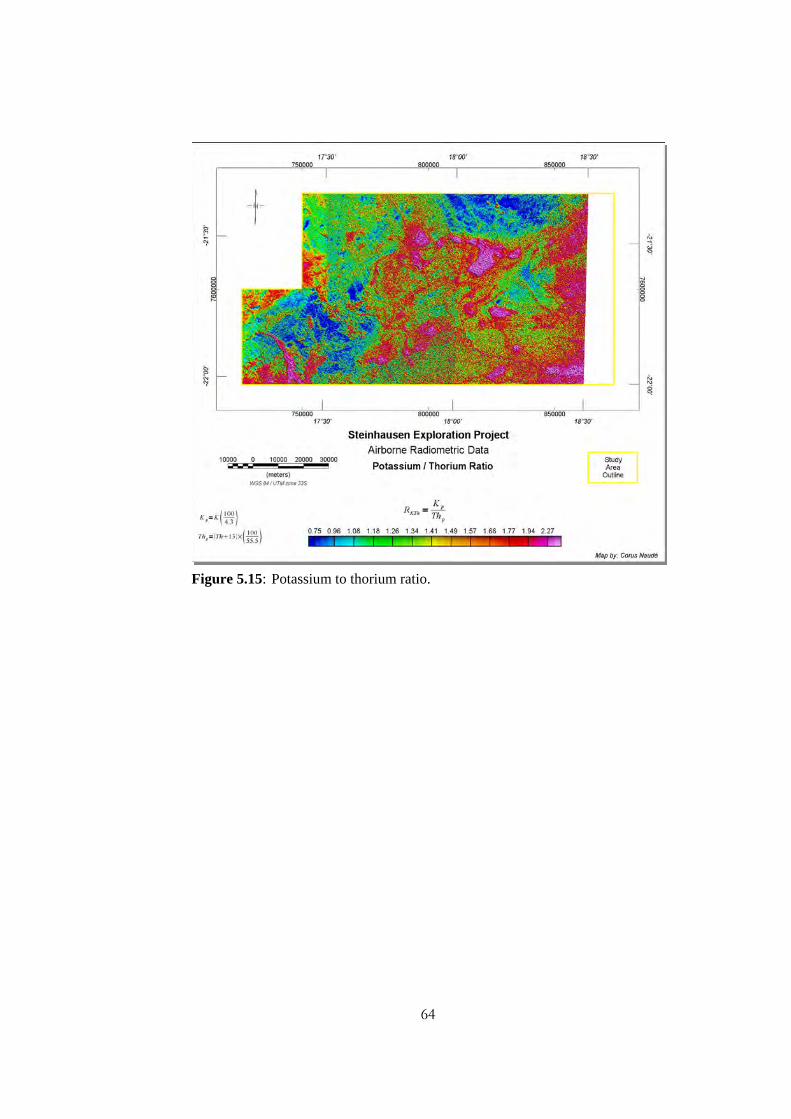
64
Figure 5.15: Potassium to thorium ratio.
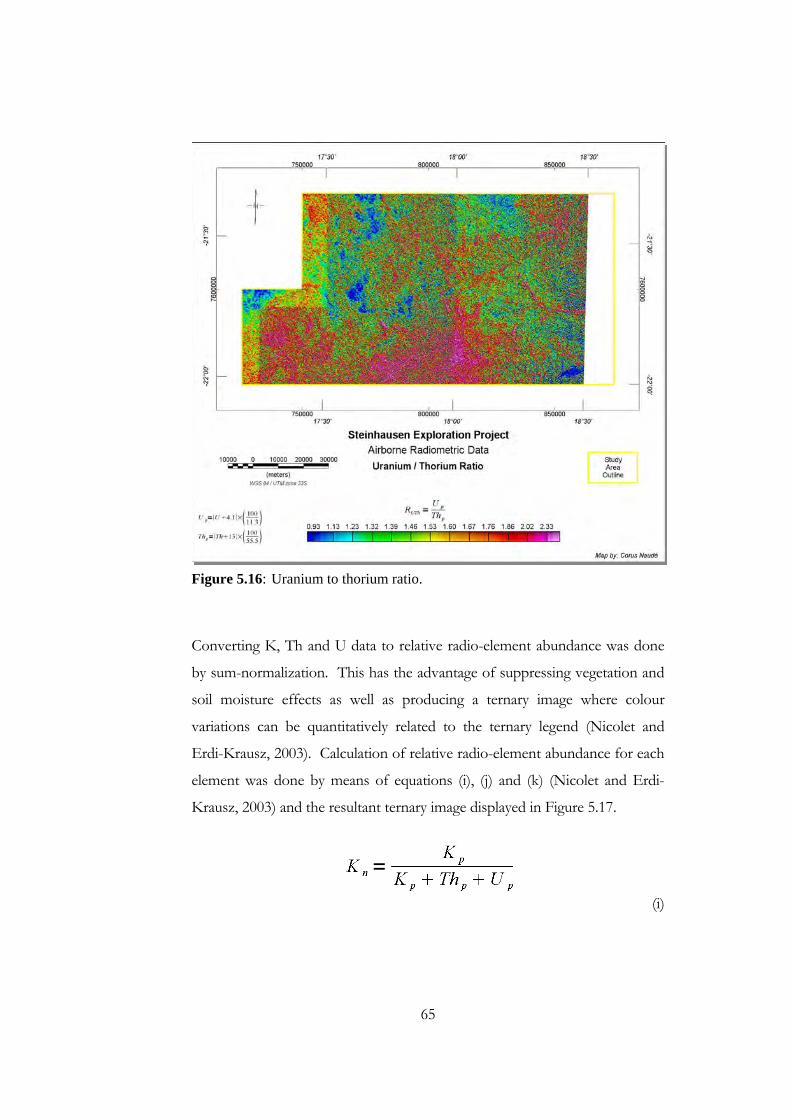
65
Figure 5.16: Uranium to thorium ratio.
Converting K, Th and U data to relative radio-element abundance was done
by sum-normalization. This has the advantage of suppressing vegetation and
soil moisture effects as well as producing a ternary image where colour
variations can be quantitatively related to the ternary legend (Nicolet and
Erdi-Krausz, 2003). Calculation of relative radio-element abundance for each
element was done by means of equations (i), (j) and (k) (Nicolet and Erdi-
Krausz, 2003) and the resultant ternary image displayed in Figure 5.17.
(i)
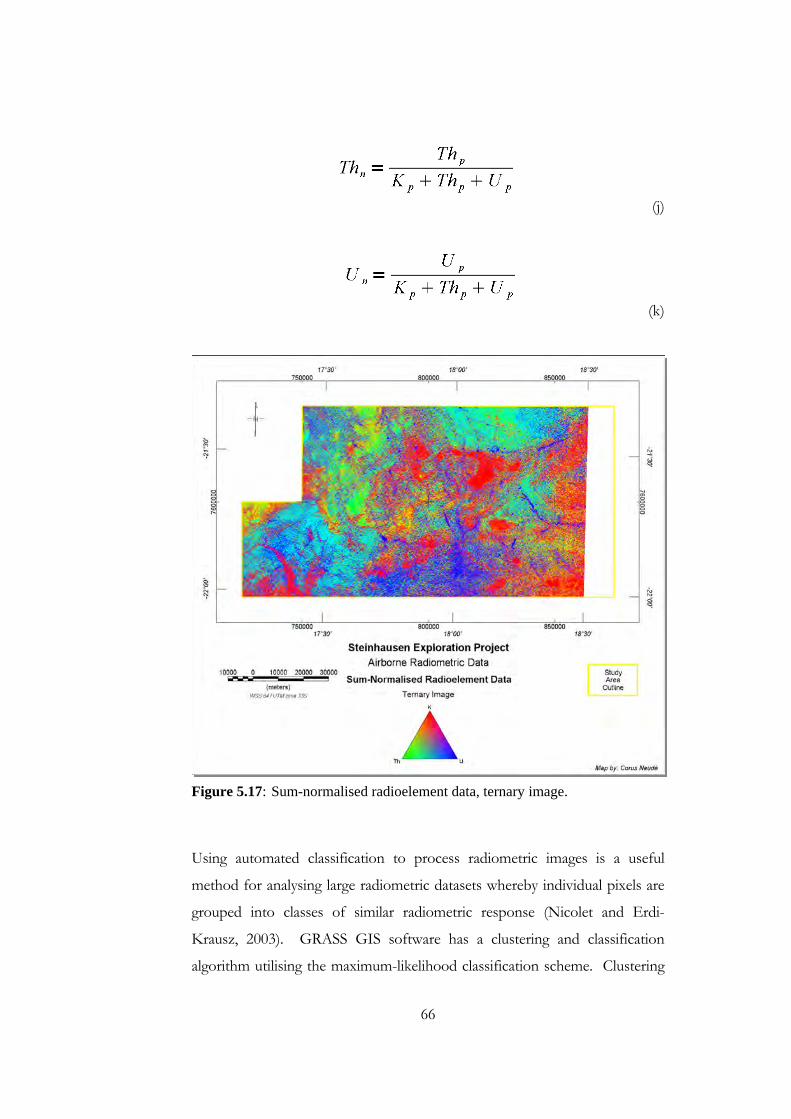
66
(j)
(k)
Figure 5.17: Sum-normalised radioelement data, ternary image.
Using automated classification to process radiometric images is a useful
method for analysing large radiometric datasets whereby individual pixels are
grouped into classes of similar radiometric response (Nicolet and Erdi-
Krausz, 2003). GRASS GIS software has a clustering and classification
algorithm utilising the maximum-likelihood classification scheme. Clustering
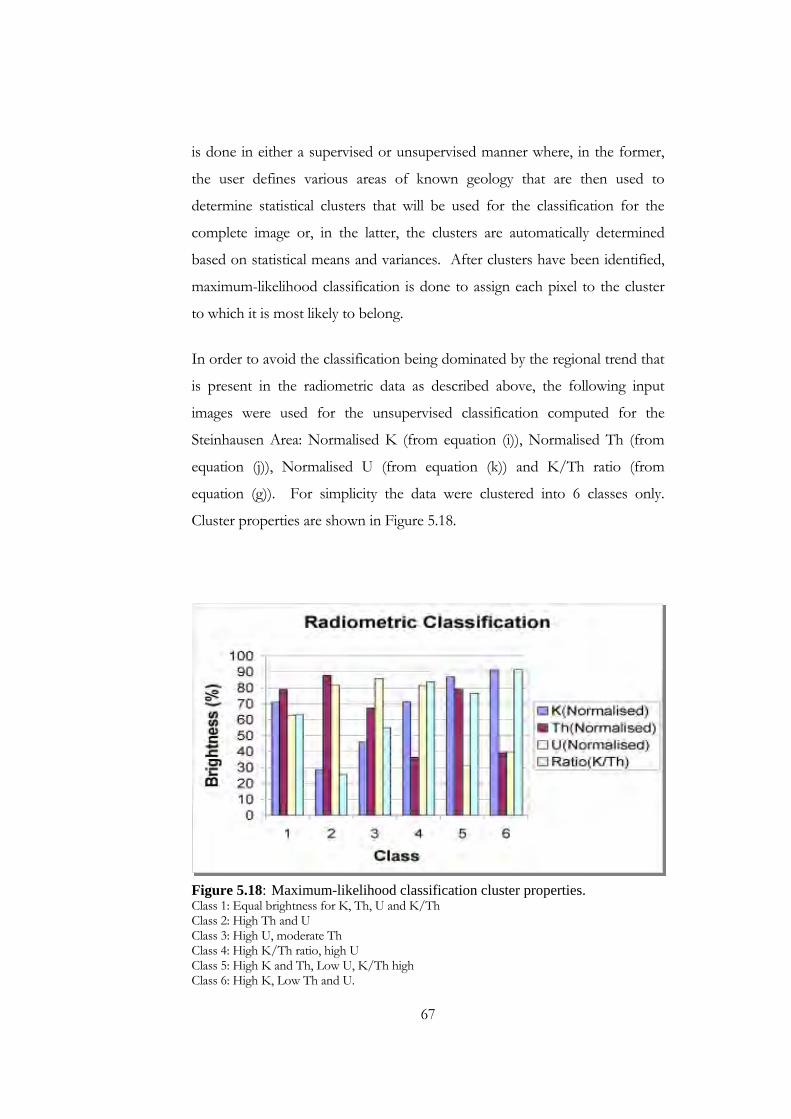
67
is done in either a supervised or unsupervised manner where, in the former,
the user defines various areas of known geology that are then used to
determine statistical clusters that will be used for the classification for the
complete image or, in the latter, the clusters are automatically determined
based on statistical means and variances. After clusters have been identified,
maximum-likelihood classification is done to assign each pixel to the cluster
to which it is most likely to belong.
In order to avoid the classification being dominated by the regional trend that
is present in the radiometric data as described above, the following input
images were used for the unsupervised classification computed for the
Steinhausen Area: Normalised K (from equation (i)), Normalised Th (from
equation (j)), Normalised U (from equation (k)) and K/Th ratio (from
equation (g)). For simplicity the data were clustered into 6 classes only.
Cluster properties are shown in Figure 5.18.
Figure 5.18: Maximum-likelihood classification cluster properties. Class 1: Equal brightness for K, Th, U and K/Th Class 2: High Th and U Class 3: High U, moderate Th Class 4: High K/Th ratio, high U Class 5: High K and Th, Low U, K/Th high Class 6: High K, Low Th and U.
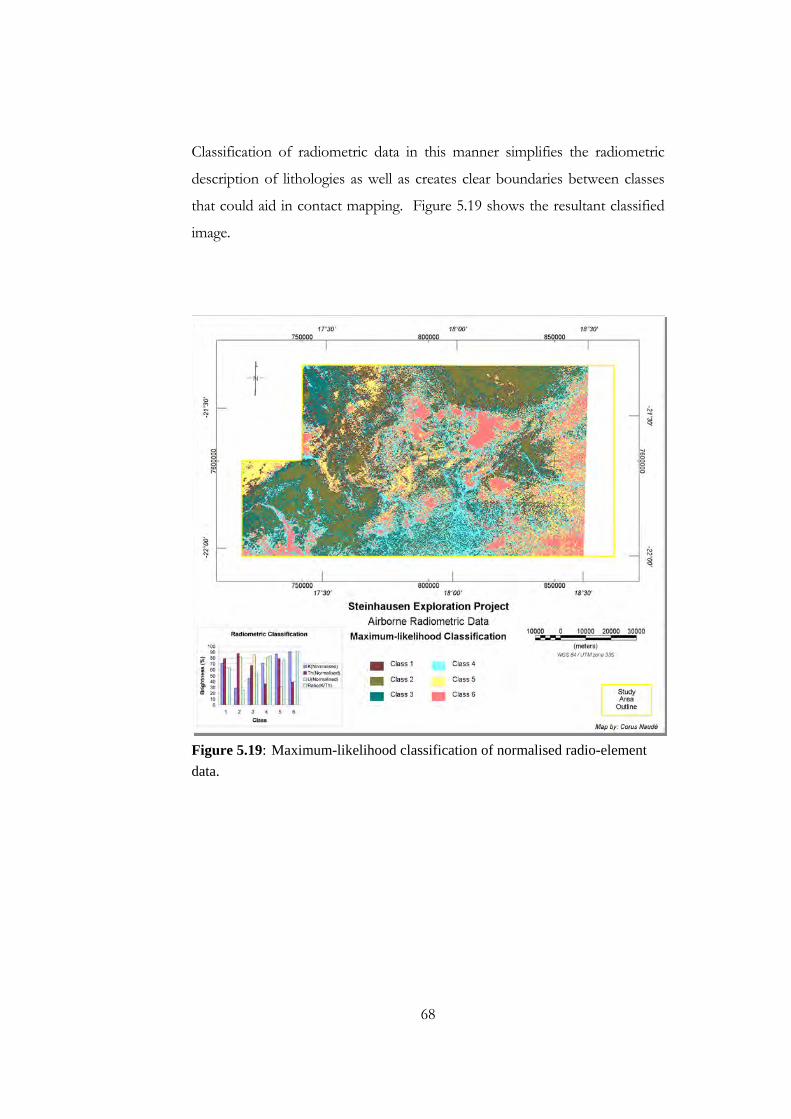
68
Classification of radiometric data in this manner simplifies the radiometric
description of lithologies as well as creates clear boundaries between classes
that could aid in contact mapping. Figure 5.19 shows the resultant classified
image.
Figure 5.19: Maximum-likelihood classification of normalised radio-element
data.
69
5.3.2 Airborne magnetic data
The airborne magnetic data consist of a Total Magnetic Intensity (TMI) grid
image (Figure 5.20) and a First Vertical Derivative (FVD) grid image (Figure
5.21), both in Geosoft format. In order to conduct a qualitative interpretation
of the magnetic data as represented by the images in Figures 5.20 and 5.21, it
is necessary to apply numerous filters with the aim of extracting important
information that aid in the identification of geological structure, contacts and
properties of magnetic units. Considerations that need to be taken into
account when designing filters for interpreting the magnetic data include
(from GETEC, 2010):
the dependency of the induced magnetic field on longitude and
latitude due to the different orientation of the Earth’s magnetic field
relative to the survey position on the Earth’s surface,
the superposition of magnetic anomalies due to proximal bodies or
vertical changes in magnetic properties, and
the dipolar nature of any magnetic field.
It is therefore clear that the shape of a magnetic anomaly not only depends on
the shape, depth and susceptibility of the perturbing body, but also on the
direction of its magnetisation and the direction of the regional field.
Proximity of the magnetic body to the magnetic sensor will also have an
effect on its observed magnetic signature with deeper bodies showing as long
wavelength features as opposed to narrow, high frequency signature of
shallow magnetic bodies. By applying various filters, different properties of
the magnetic field could be highlighted or suppressed as required in order to
properly locate and interpret magnetic features. The different filters applied
as part of the interpretation process for this study are discussed below.
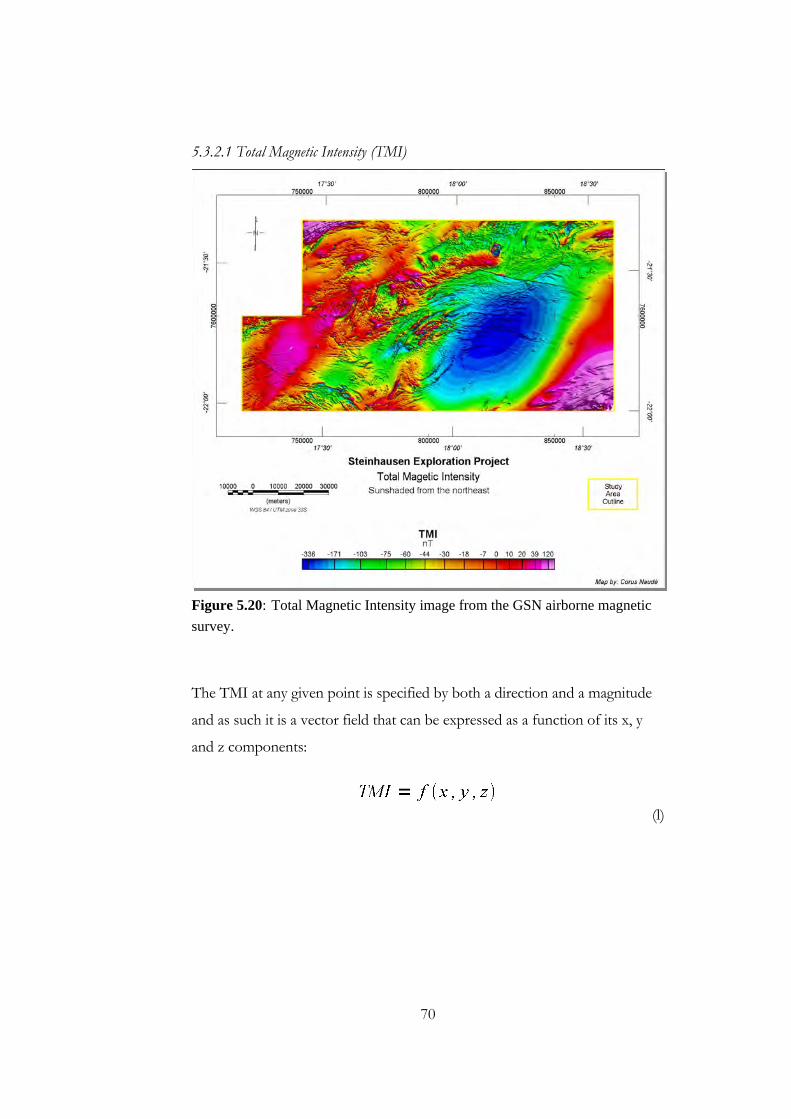
70
5.3.2.1 Total Magnetic Intensity (TMI)
Figure 5.20: Total Magnetic Intensity image from the GSN airborne magnetic
survey.
The TMI at any given point is specified by both a direction and a magnitude
and as such it is a vector field that can be expressed as a function of its x, y
and z components:
(l)
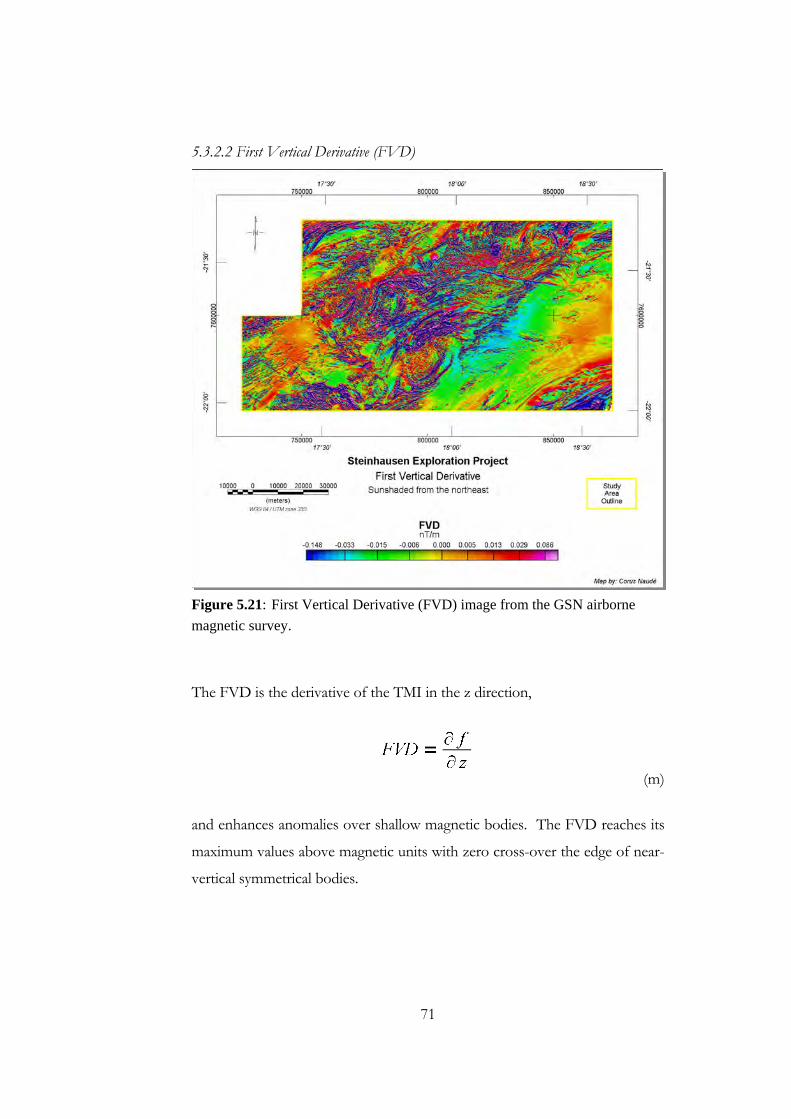
71
5.3.2.2 First Vertical Derivative (FVD)
Figure 5.21: First Vertical Derivative (FVD) image from the GSN airborne
magnetic survey.
The FVD is the derivative of the TMI in the z direction,
(m)
and enhances anomalies over shallow magnetic bodies. The FVD reaches its
maximum values above magnetic units with zero cross-over the edge of near-
vertical symmetrical bodies.
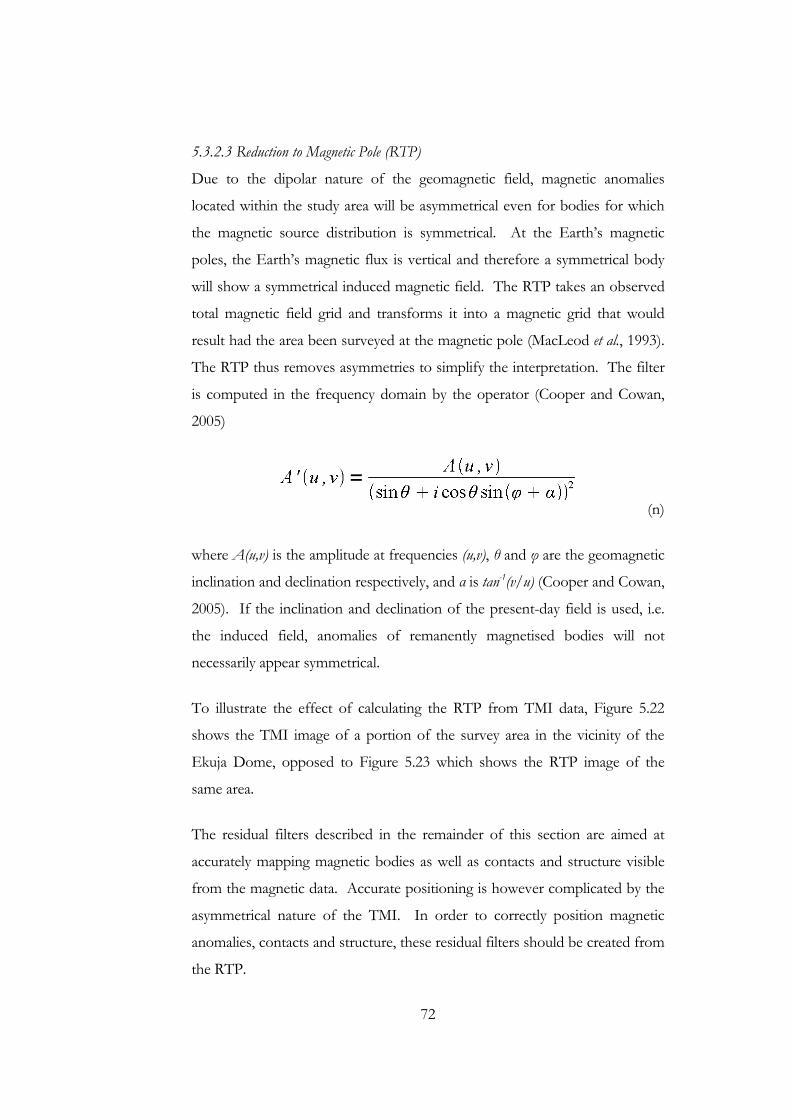
72
5.3.2.3 Reduction to Magnetic Pole (RTP)
Due to the dipolar nature of the geomagnetic field, magnetic anomalies
located within the study area will be asymmetrical even for bodies for which
the magnetic source distribution is symmetrical. At the Earth’s magnetic
poles, the Earth’s magnetic flux is vertical and therefore a symmetrical body
will show a symmetrical induced magnetic field. The RTP takes an observed
total magnetic field grid and transforms it into a magnetic grid that would
result had the area been surveyed at the magnetic pole (MacLeod et al., 1993).
The RTP thus removes asymmetries to simplify the interpretation. The filter
is computed in the frequency domain by the operator (Cooper and Cowan,
2005)
(n)
where A(u,v) is the amplitude at frequencies (u,v), θ and φ are the geomagnetic
inclination and declination respectively, and α is tan-1(v/u) (Cooper and Cowan,
2005). If the inclination and declination of the present-day field is used, i.e.
the induced field, anomalies of remanently magnetised bodies will not
necessarily appear symmetrical.
To illustrate the effect of calculating the RTP from TMI data, Figure 5.22
shows the TMI image of a portion of the survey area in the vicinity of the
Ekuja Dome, opposed to Figure 5.23 which shows the RTP image of the
same area.
The residual filters described in the remainder of this section are aimed at
accurately mapping magnetic bodies as well as contacts and structure visible
from the magnetic data. Accurate positioning is however complicated by the
asymmetrical nature of the TMI. In order to correctly position magnetic
anomalies, contacts and structure, these residual filters should be created from
the RTP.
73
Figure 5.22: Total Magnetic Intensity (TMI) image from the GSN airborne
magnetic survey over Ekuja Dome.
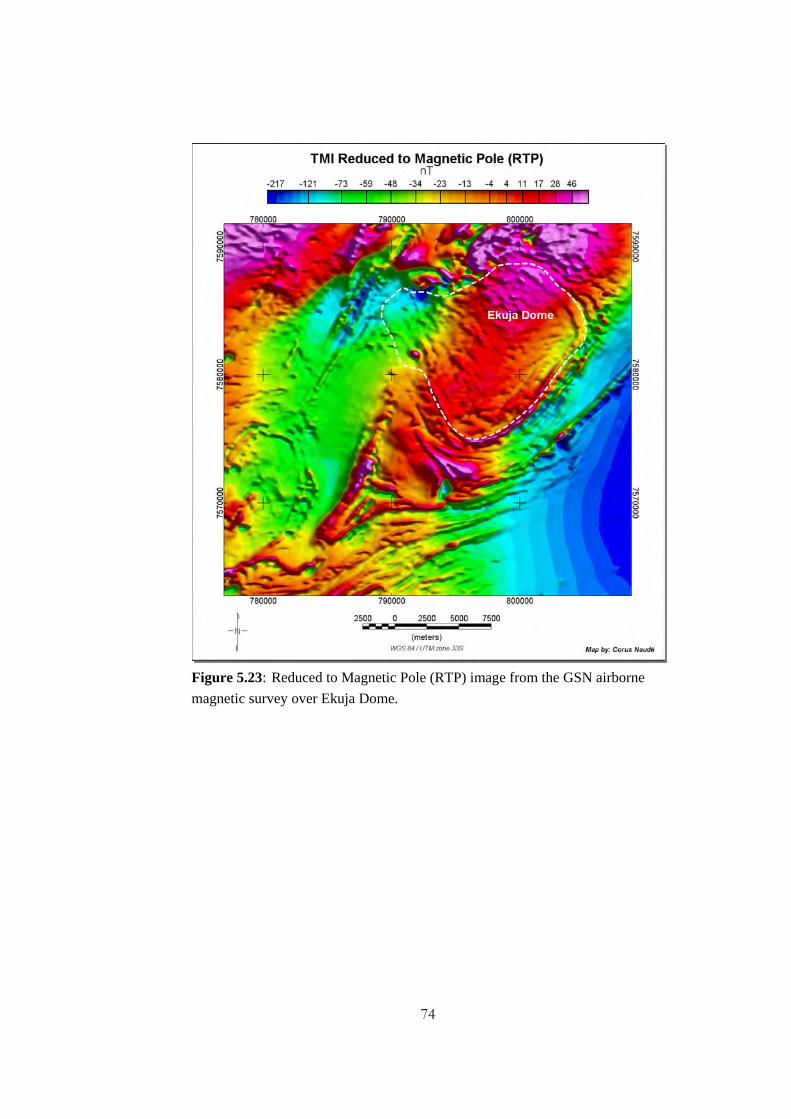
74
Figure 5.23: Reduced to Magnetic Pole (RTP) image from the GSN airborne
magnetic survey over Ekuja Dome.
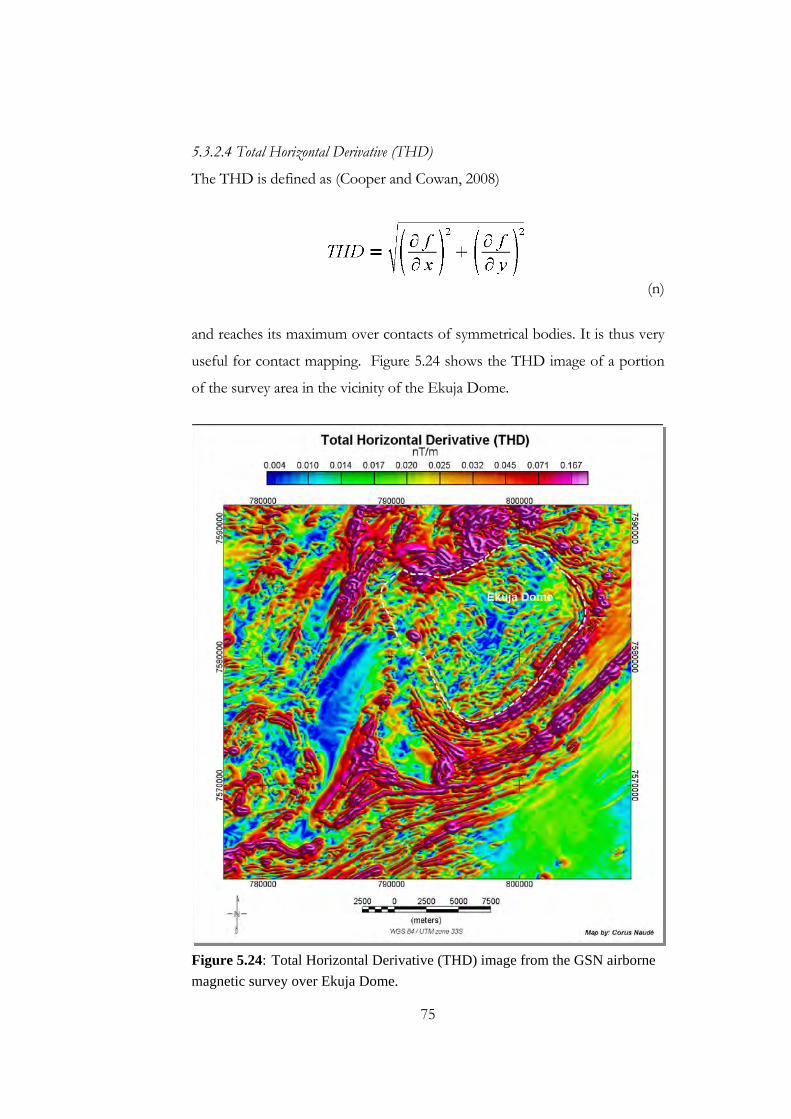
75
5.3.2.4 Total Horizontal Derivative (THD)
The THD is defined as (Cooper and Cowan, 2008)
(n)
and reaches its maximum over contacts of symmetrical bodies. It is thus very
useful for contact mapping. Figure 5.24 shows the THD image of a portion
of the survey area in the vicinity of the Ekuja Dome.
Figure 5.24: Total Horizontal Derivative (THD) image from the GSN airborne
magnetic survey over Ekuja Dome.
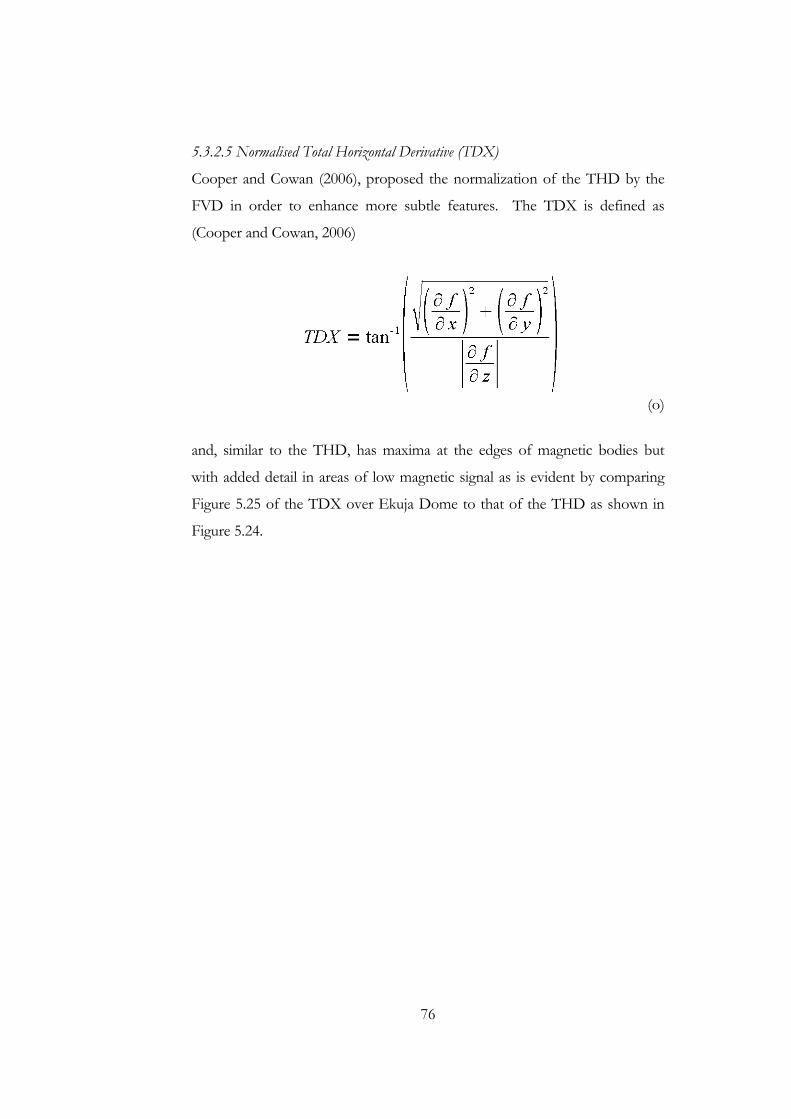
76
5.3.2.5 Normalised Total Horizontal Derivative (TDX)
Cooper and Cowan (2006), proposed the normalization of the THD by the
FVD in order to enhance more subtle features. The TDX is defined as
(Cooper and Cowan, 2006)
(o)
and, similar to the THD, has maxima at the edges of magnetic bodies but
with added detail in areas of low magnetic signal as is evident by comparing
Figure 5.25 of the TDX over Ekuja Dome to that of the THD as shown in
Figure 5.24.
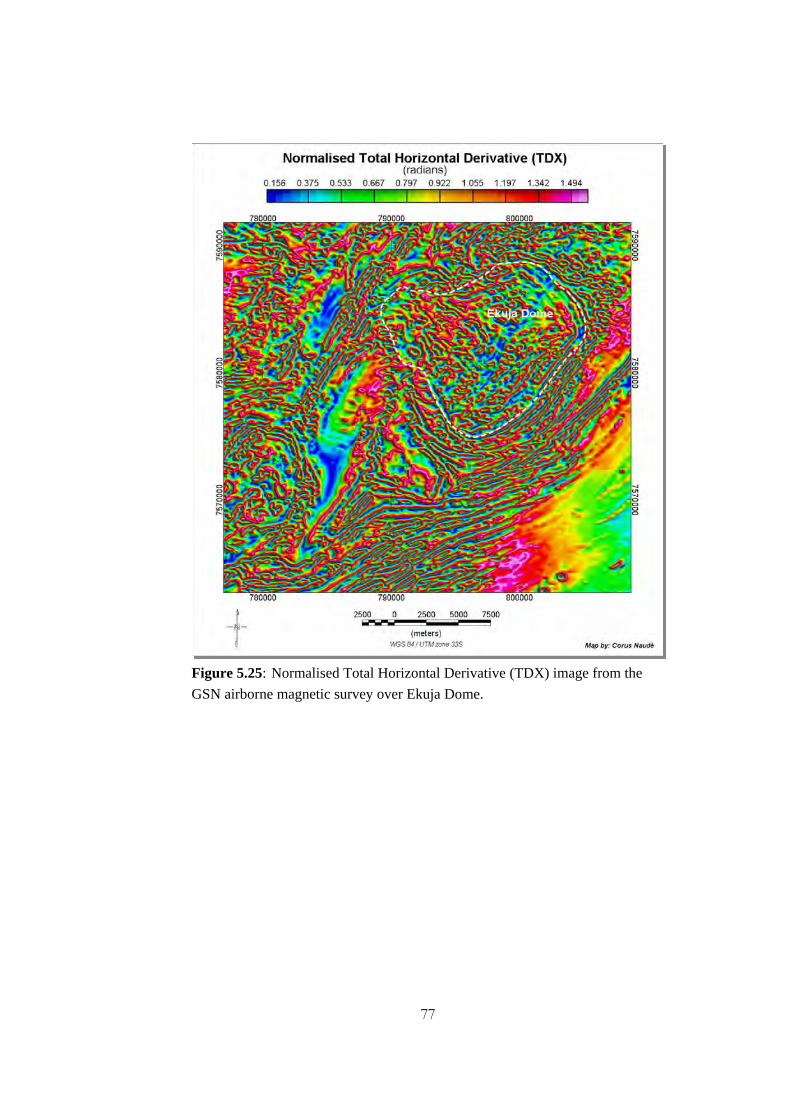
77
Figure 5.25: Normalised Total Horizontal Derivative (TDX) image from the
GSN airborne magnetic survey over Ekuja Dome.
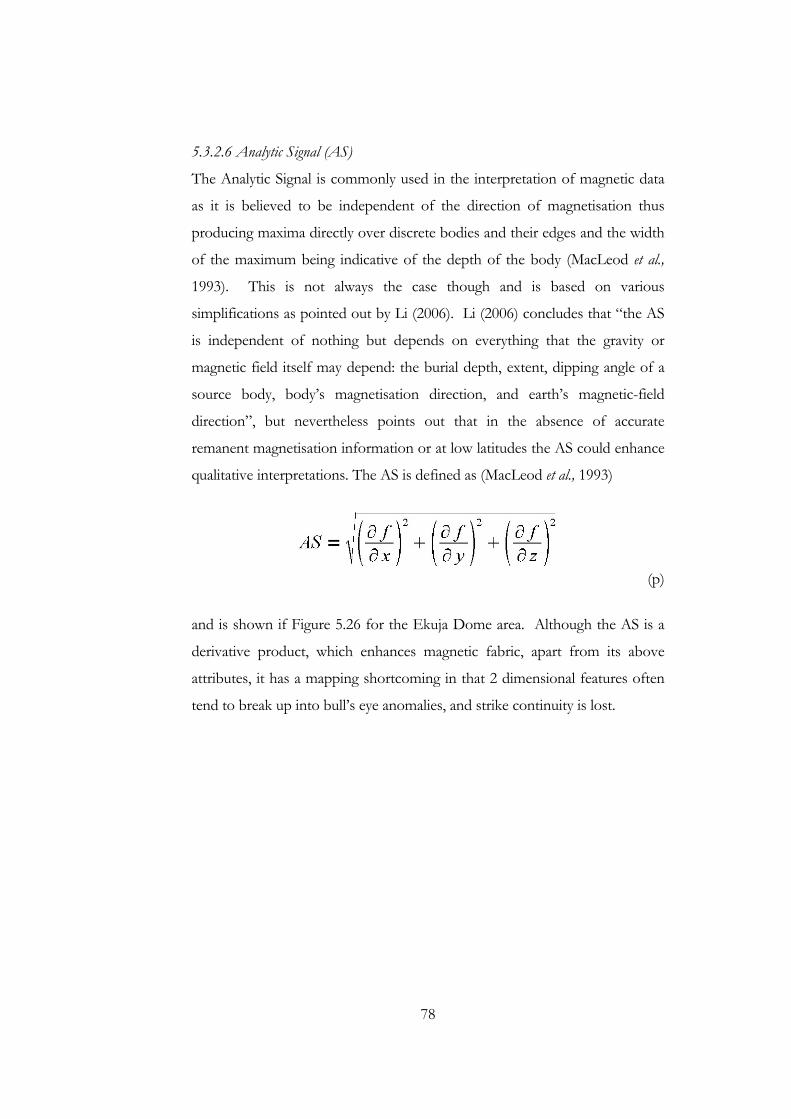
78
5.3.2.6 Analytic Signal (AS)
The Analytic Signal is commonly used in the interpretation of magnetic data
as it is believed to be independent of the direction of magnetisation thus
producing maxima directly over discrete bodies and their edges and the width
of the maximum being indicative of the depth of the body (MacLeod et al.,
1993). This is not always the case though and is based on various
simplifications as pointed out by Li (2006). Li (2006) concludes that “the AS
is independent of nothing but depends on everything that the gravity or
magnetic field itself may depend: the burial depth, extent, dipping angle of a
source body, body’s magnetisation direction, and earth’s magnetic-field
direction”, but nevertheless points out that in the absence of accurate
remanent magnetisation information or at low latitudes the AS could enhance
qualitative interpretations. The AS is defined as (MacLeod et al., 1993)
(p)
and is shown if Figure 5.26 for the Ekuja Dome area. Although the AS is a
derivative product, which enhances magnetic fabric, apart from its above
attributes, it has a mapping shortcoming in that 2 dimensional features often
tend to break up into bull’s eye anomalies, and strike continuity is lost.
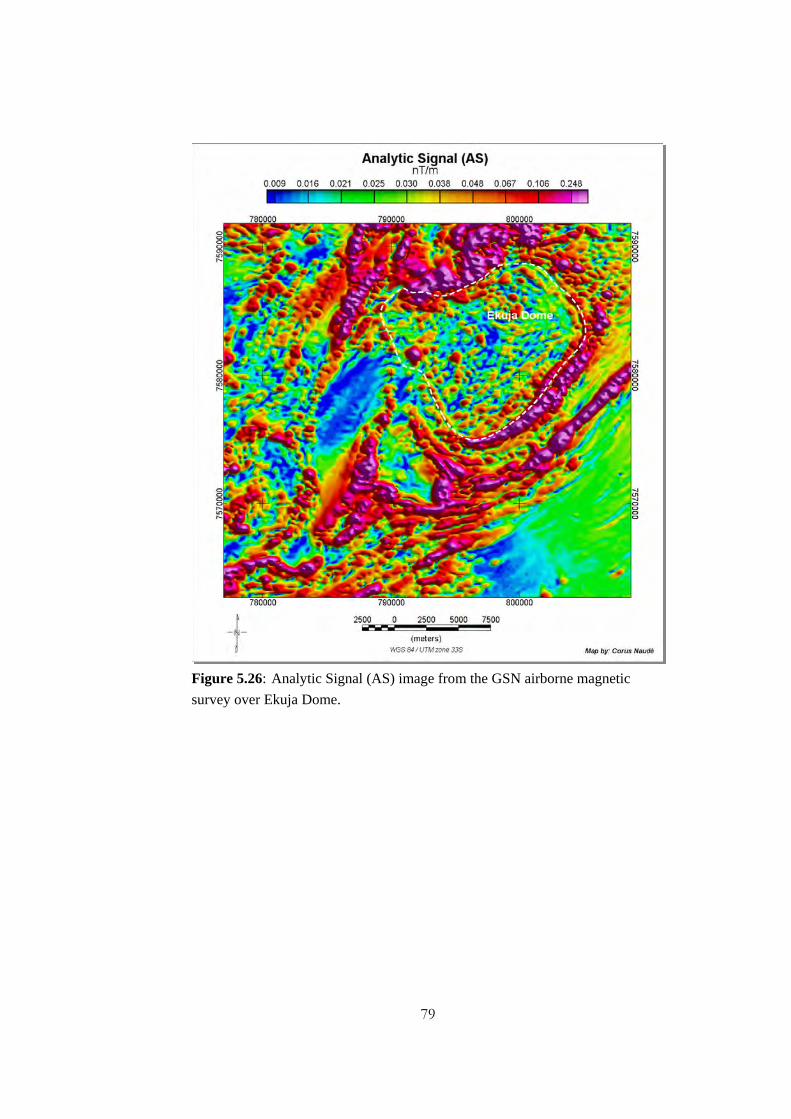
79
Figure 5.26: Analytic Signal (AS) image from the GSN airborne magnetic
survey over Ekuja Dome.
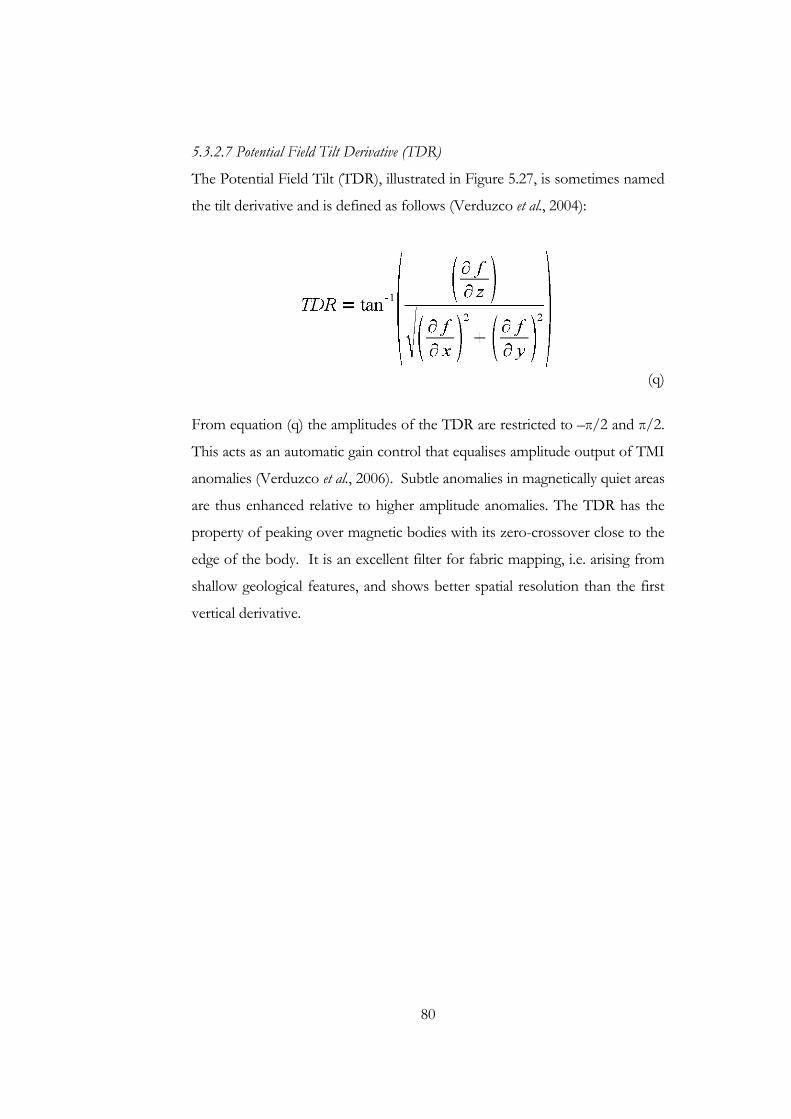
80
5.3.2.7 Potential Field Tilt Derivative (TDR)
The Potential Field Tilt (TDR), illustrated in Figure 5.27, is sometimes named
the tilt derivative and is defined as follows (Verduzco et al., 2004):
(q)
From equation (q) the amplitudes of the TDR are restricted to –π/2 and π/2.
This acts as an automatic gain control that equalises amplitude output of TMI
anomalies (Verduzco et al., 2006). Subtle anomalies in magnetically quiet areas
are thus enhanced relative to higher amplitude anomalies. The TDR has the
property of peaking over magnetic bodies with its zero-crossover close to the
edge of the body. It is an excellent filter for fabric mapping, i.e. arising from
shallow geological features, and shows better spatial resolution than the first
vertical derivative.
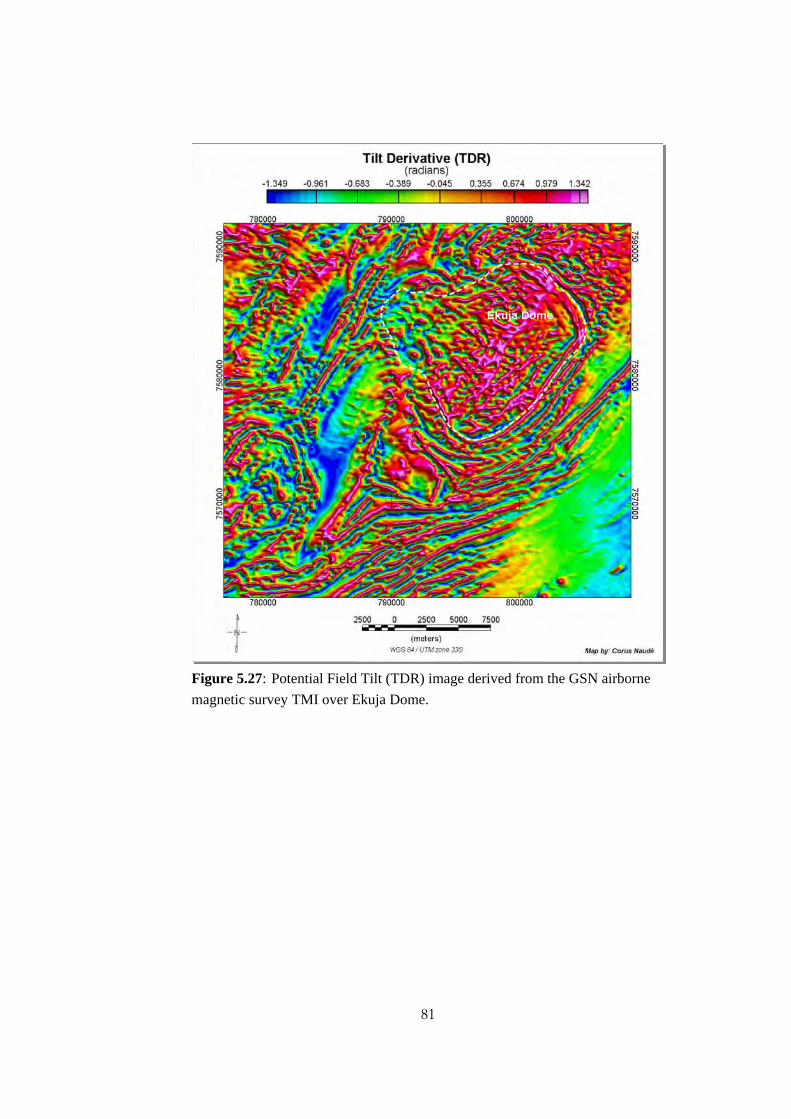
81
Figure 5.27: Potential Field Tilt (TDR) image derived from the GSN airborne
magnetic survey TMI over Ekuja Dome.
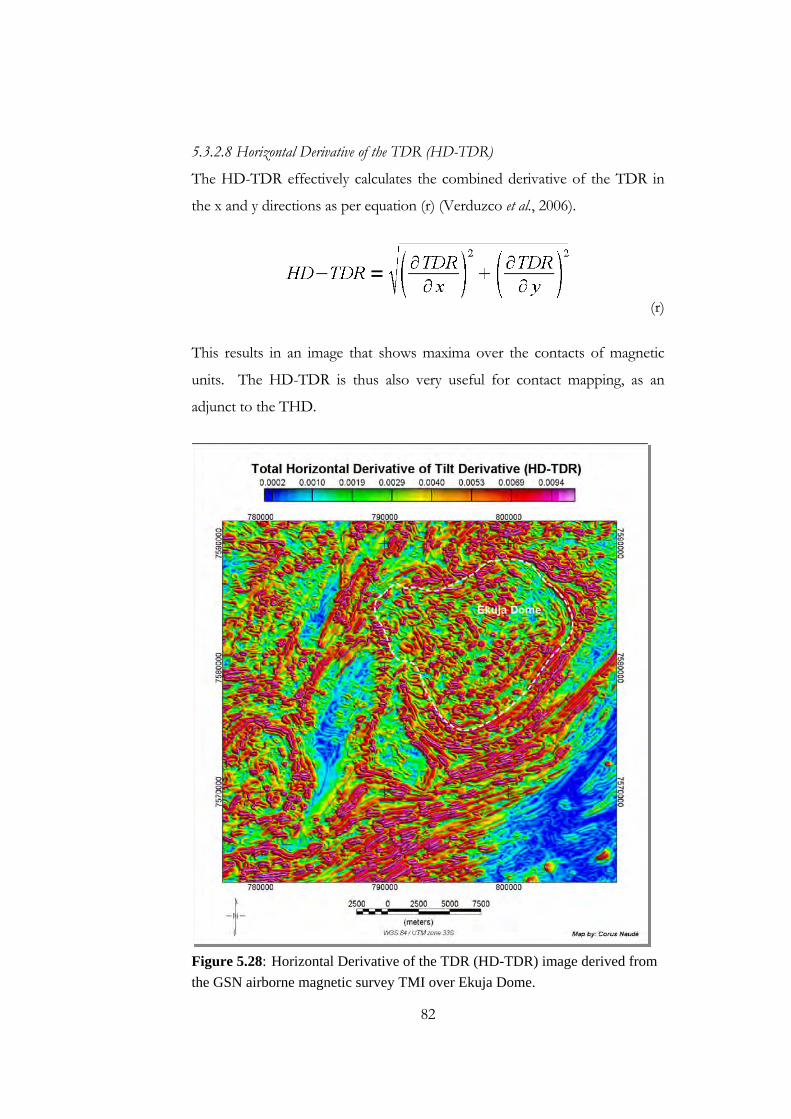
82
5.3.2.8 Horizontal Derivative of the TDR (HD-TDR)
The HD-TDR effectively calculates the combined derivative of the TDR in
the x and y directions as per equation (r) (Verduzco et al., 2006).
(r)
This results in an image that shows maxima over the contacts of magnetic
units. The HD-TDR is thus also very useful for contact mapping, as an
adjunct to the THD.
Figure 5.28: Horizontal Derivative of the TDR (HD-TDR) image derived from
the GSN airborne magnetic survey TMI over Ekuja Dome.
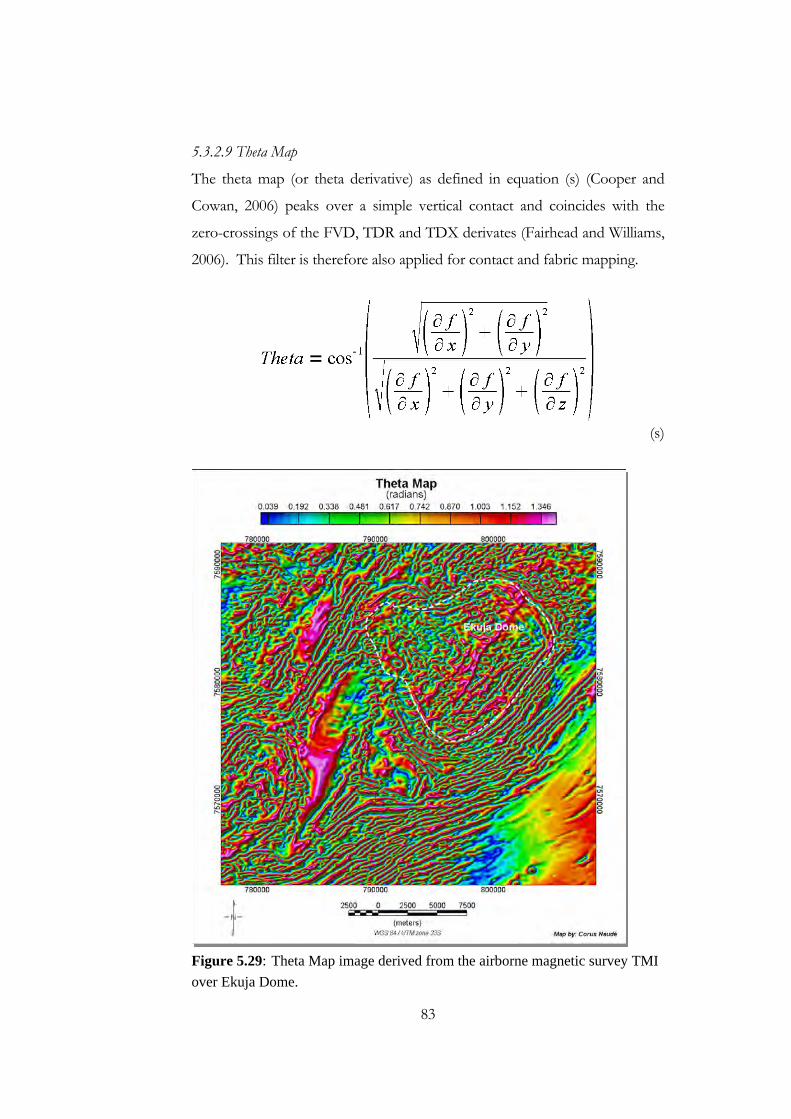
83
5.3.2.9 Theta Map
The theta map (or theta derivative) as defined in equation (s) (Cooper and
Cowan, 2006) peaks over a simple vertical contact and coincides with the
zero-crossings of the FVD, TDR and TDX derivates (Fairhead and Williams,
2006). This filter is therefore also applied for contact and fabric mapping.
(s)
Figure 5.29: Theta Map image derived from the airborne magnetic survey TMI
over Ekuja Dome.

84
85
C h a p t e r 6
INTERPRETATION AND DISCUSSION
The geophysical interpretation consists of structural, stratigraphic and
lithological mapping. The geological control for stratigraphic mapping of the
area is very limited due to Kalahari cover. Mapping by Kasch (1986) has
indicated some outcrops along the banks of the Black Nossob River in the
vicinity of the Ekuja dome and EONC. The exploration map compiled for
MIM Exploration by Kasch (1998), the mapping of the Okatjuru Layered
Complex and surrounds by Kasch (Corner, pers. comm., 2009) during 2008,
and borehole data from various EPL reports were used to classify geophysical
responses for different geological units. However, there are no geological
controls available (apart from very general GSN 1:1000000 map) over the
entire northern, central and north-eastern parts of the study area. Over these
areas the correlation of geophysical responses to lithological units is thus
subject to ground truthing.
Figure 6.1 and Figure 6.2 show the FVD and ternary radiometric image
respectively for easy referral during the following discussion.
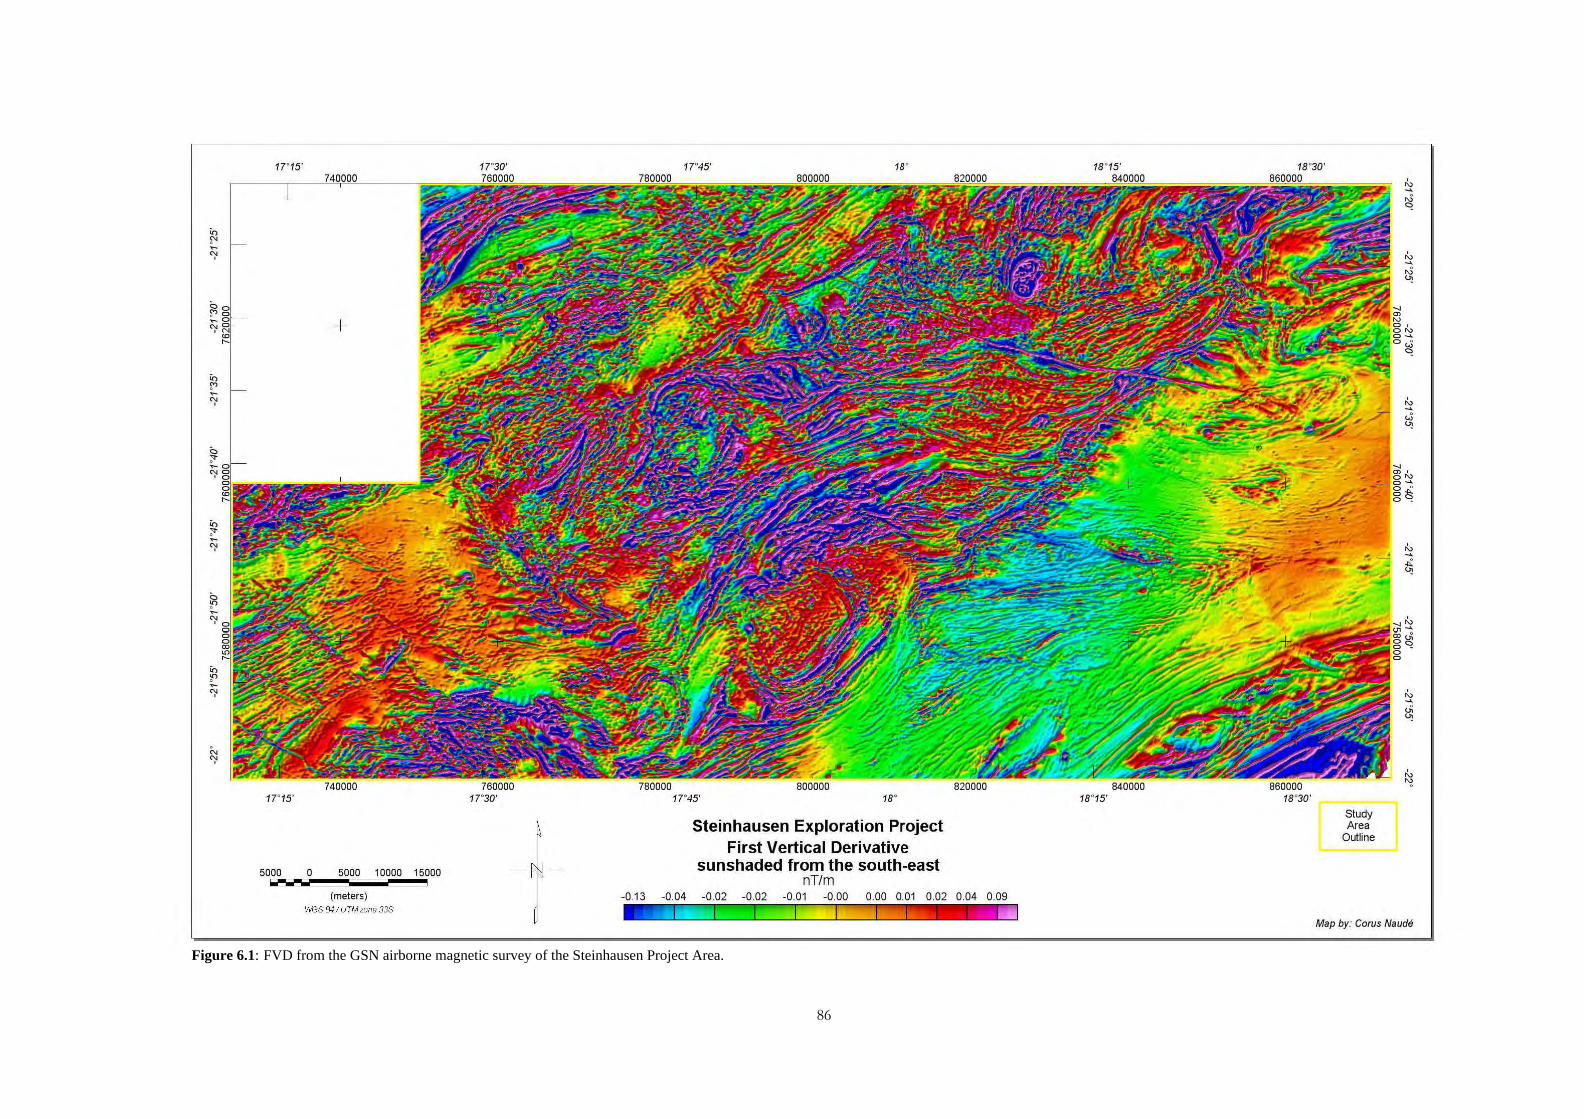
86
Figure 6.1: FVD from the GSN airborne magnetic survey of the Steinhausen Project Area.
17"15'
17"15'
5000 IOiOI
740000
o 5000 10000 15000
(meters) ItYGS &4 1 UTM zone 33S
17"30'
760000 17"30'
17"45'
780000 17"45'
800000
18°
18°
Steinhausen Exploration Project First Vertical Derivative
sunshaded from the south-east nT/m
820000
-0.13 -0.04 -0.02 -0.02 -0.01 -0.00 0.00 0.01 0.02 0.04 0.09
18°15'
840000 18°15'
18°30'
860000 18°30'
Study Area
Outline
Map by: Corus Naude
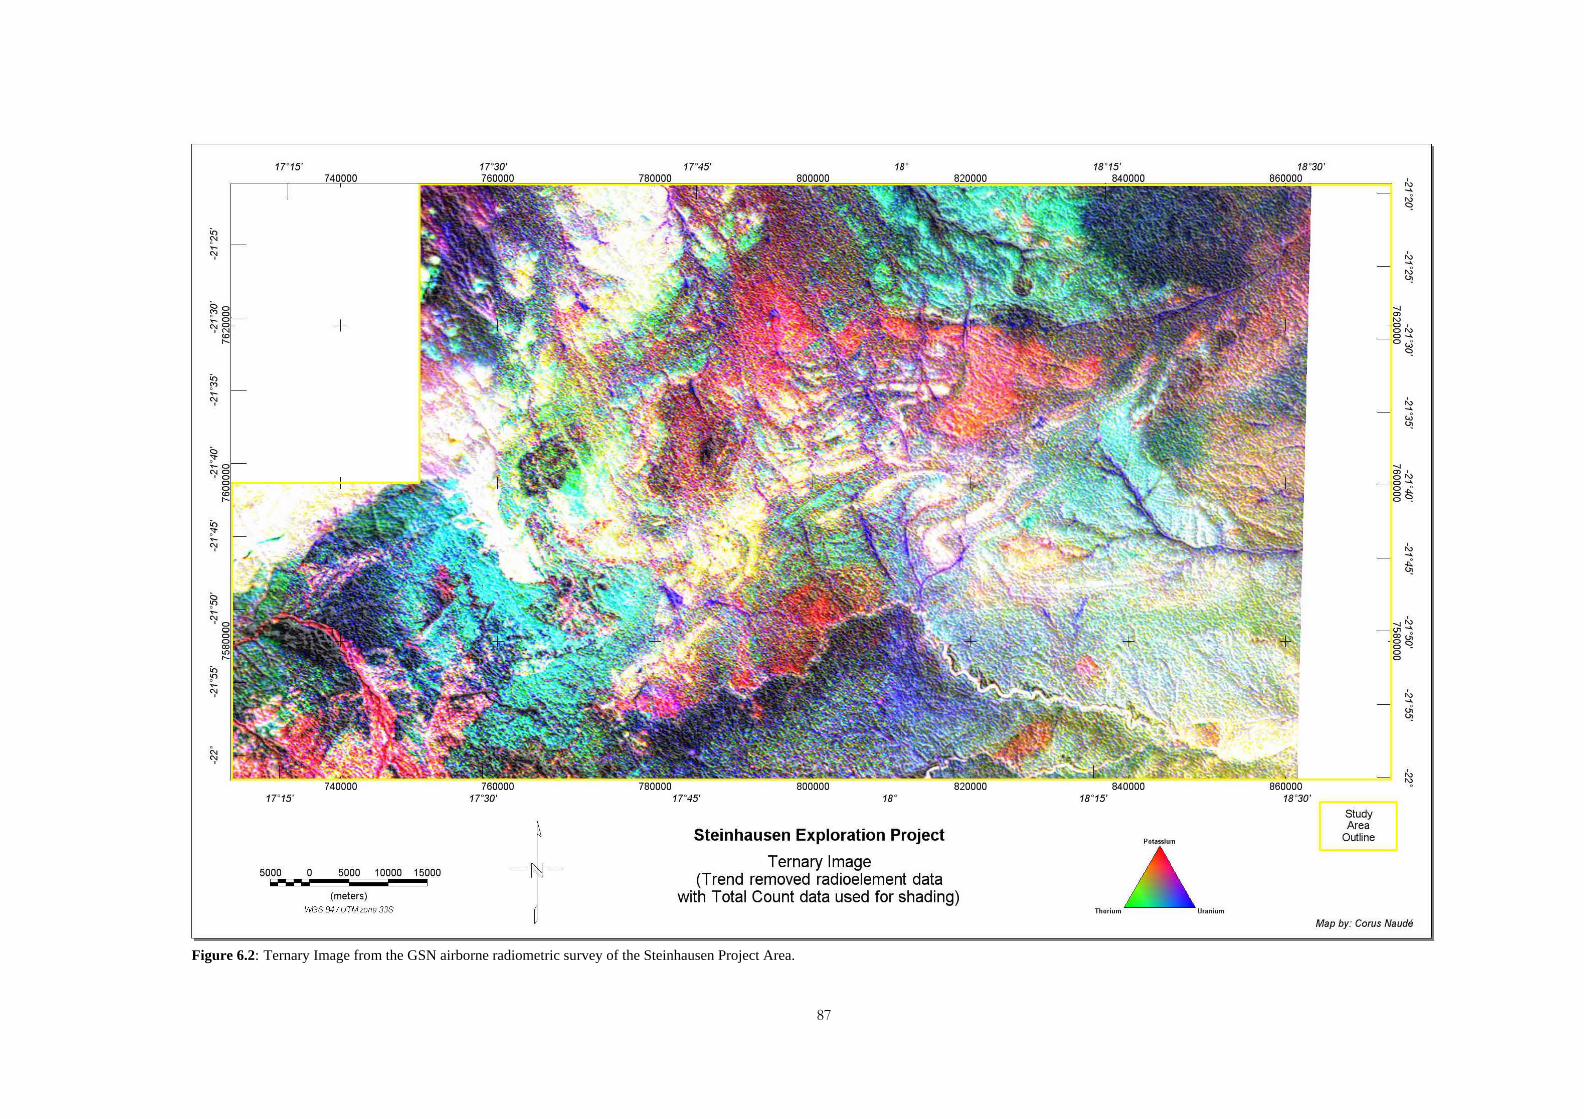
87
Figure 6.2: Ternary Image from the GSN airborne radiometric survey of the Steinhausen Project Area.
17"15' 17"30' 17"45' 18° 18°15' 18°30'
~ ,J ">
Co f' -~ ~
,J
'" c ~ ~ m - ~
~ ~ O , 0'" 0_ Ow
">
Co ~ -~ ~
w '"
c :> - ~
~ m' 0'" ------' 0 ....... 0 ° 0" a">
Co :> -~ ~
..:
'" c ~ -~ ~'" ~ ",-
- ~g a ~ a a Co ~ -~ ~
u;
'" '" ~ I.,
740000 760000 780000 800000 820000 840000 860000 ~
17"15' 17"30' 17"45' 18° 18°15' 18°30'
Study
Steinhausen Exploration Project Area
Outline
5000 0 5000 10000 15000 Ternary Image
IOiOI (Trend removed radioelement data (meters) with Total Count data used for shading)
ItYGS &4 1 UTM zone 33S Thorium
Map by: Corus Naude
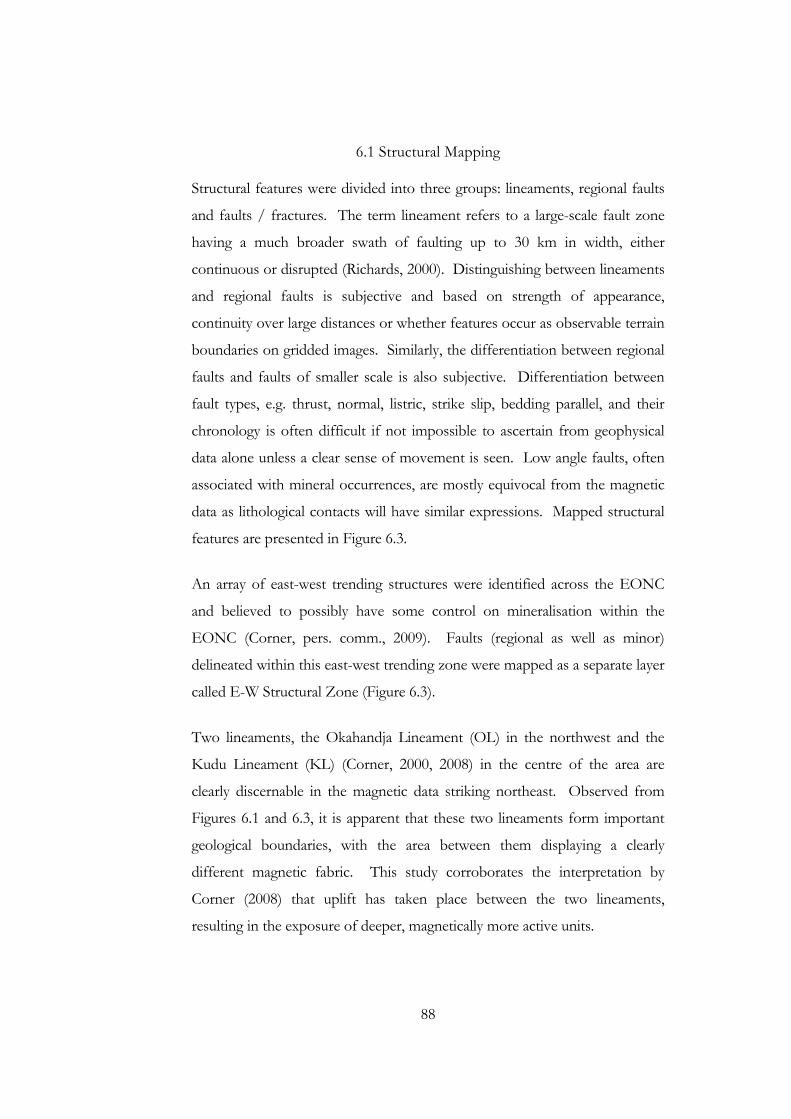
88
6.1 Structural Mapping
Structural features were divided into three groups: lineaments, regional faults
and faults / fractures. The term lineament refers to a large-scale fault zone
having a much broader swath of faulting up to 30 km in width, either
continuous or disrupted (Richards, 2000). Distinguishing between lineaments
and regional faults is subjective and based on strength of appearance,
continuity over large distances or whether features occur as observable terrain
boundaries on gridded images. Similarly, the differentiation between regional
faults and faults of smaller scale is also subjective. Differentiation between
fault types, e.g. thrust, normal, listric, strike slip, bedding parallel, and their
chronology is often difficult if not impossible to ascertain from geophysical
data alone unless a clear sense of movement is seen. Low angle faults, often
associated with mineral occurrences, are mostly equivocal from the magnetic
data as lithological contacts will have similar expressions. Mapped structural
features are presented in Figure 6.3.
An array of east-west trending structures were identified across the EONC
and believed to possibly have some control on mineralisation within the
EONC (Corner, pers. comm., 2009). Faults (regional as well as minor)
delineated within this east-west trending zone were mapped as a separate layer
called E-W Structural Zone (Figure 6.3).
Two lineaments, the Okahandja Lineament (OL) in the northwest and the
Kudu Lineament (KL) (Corner, 2000, 2008) in the centre of the area are
clearly discernable in the magnetic data striking northeast. Observed from
Figures 6.1 and 6.3, it is apparent that these two lineaments form important
geological boundaries, with the area between them displaying a clearly
different magnetic fabric. This study corroborates the interpretation by
Corner (2008) that uplift has taken place between the two lineaments,
resulting in the exposure of deeper, magnetically more active units.
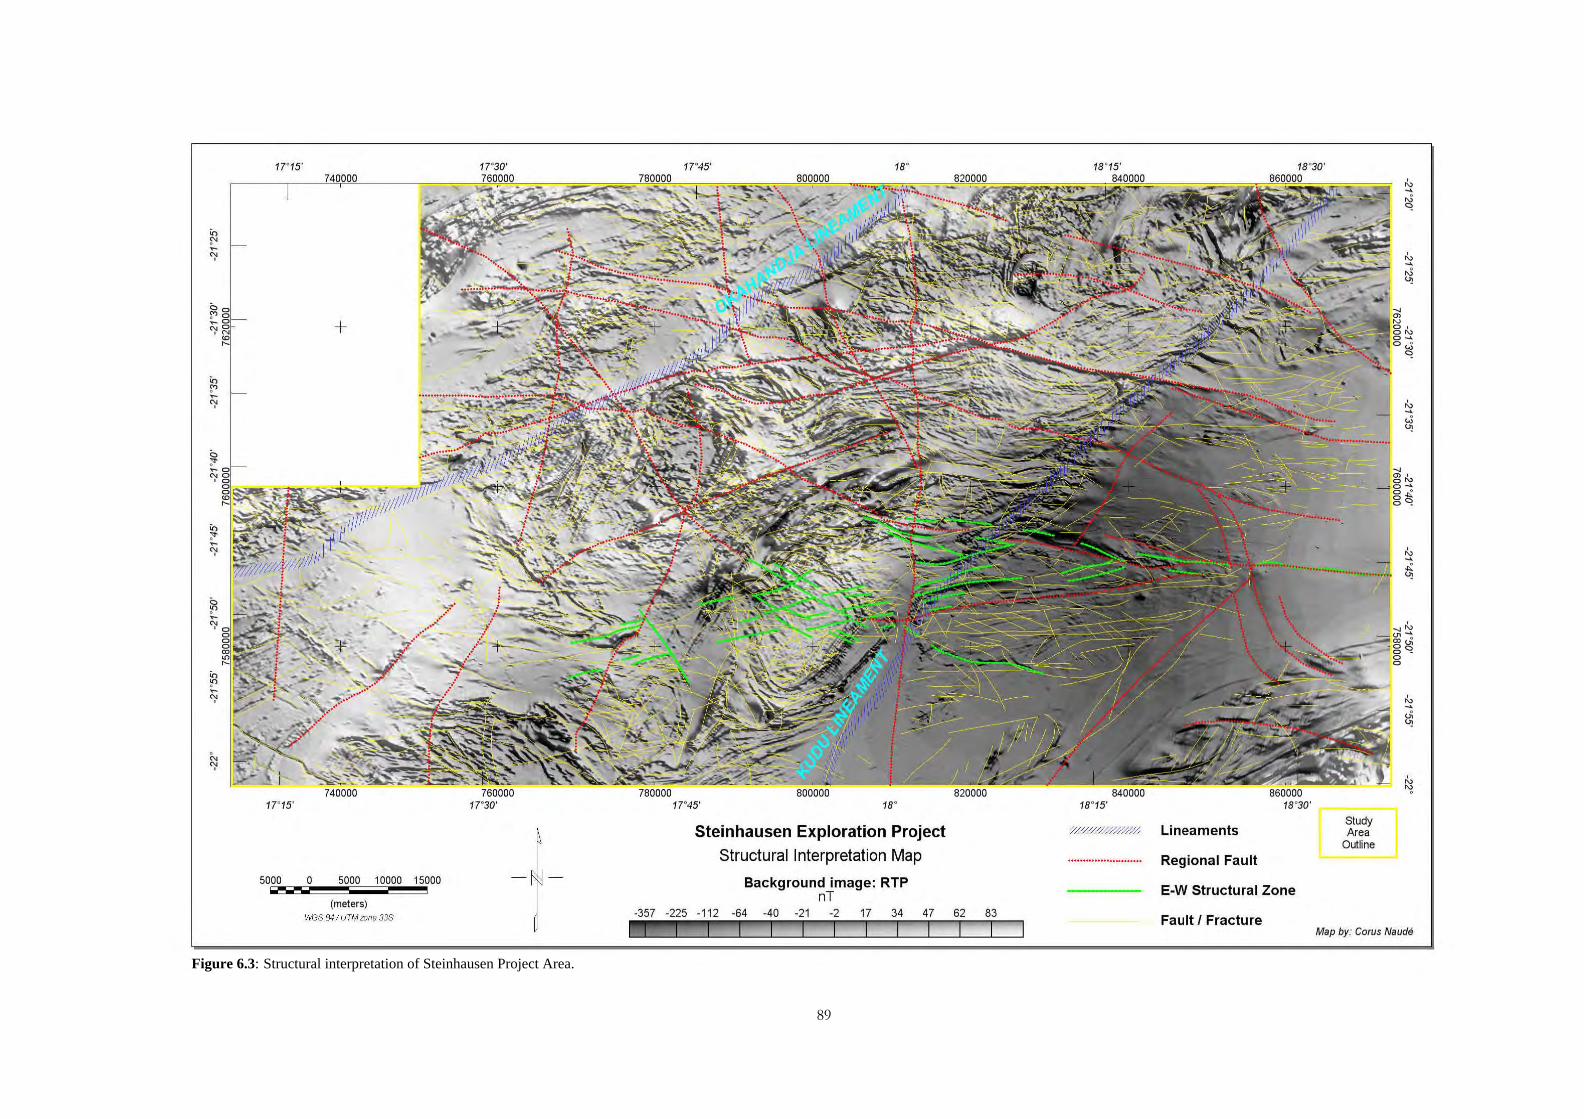
89
Figure 6.3: Structural interpretation of Steinhausen Project Area.
17"15' 17"30'
17"15'
5000 o 5000 10000 15000
(meters) ItYGS &4 1 UTM zone 33S
17"45'
780000 17"45'
18°
18°
Steinhausen Exploration Project Structural Interpretation Map
Background image: RTP nT
-357 -225 -112 -64 -40 -21 -2 17 34 47 62 83
18°15'
/"#///##////#/ Lineaments
......................... Regional Fault
E-W Structural Zone
Fault I Fracture
18°30'
Study Area
Outline
Map by: Coru$ Naude
90
6.2 Stratigraphy and lithological mapping
A number of interpretive layers have been compiled which highlight
lithologies and features that are evident from the geophysical data. These are
shown in Figure 6.4 and are discussed below. A large format 1:100,000 scale
version of Figure 6.4 accompanies this thesis as a fold out map.
The geological backdrop to this map is derived from a combination of
sources including, early GSN mapping, the mapping campaigns of Kasch
(1998, 2008), earlier interpretation of the geophysical data by Corner (2006,
pers. comm., 2009), and the current detailed interpretation of the author as
discussed below for the various stratigraphic units.
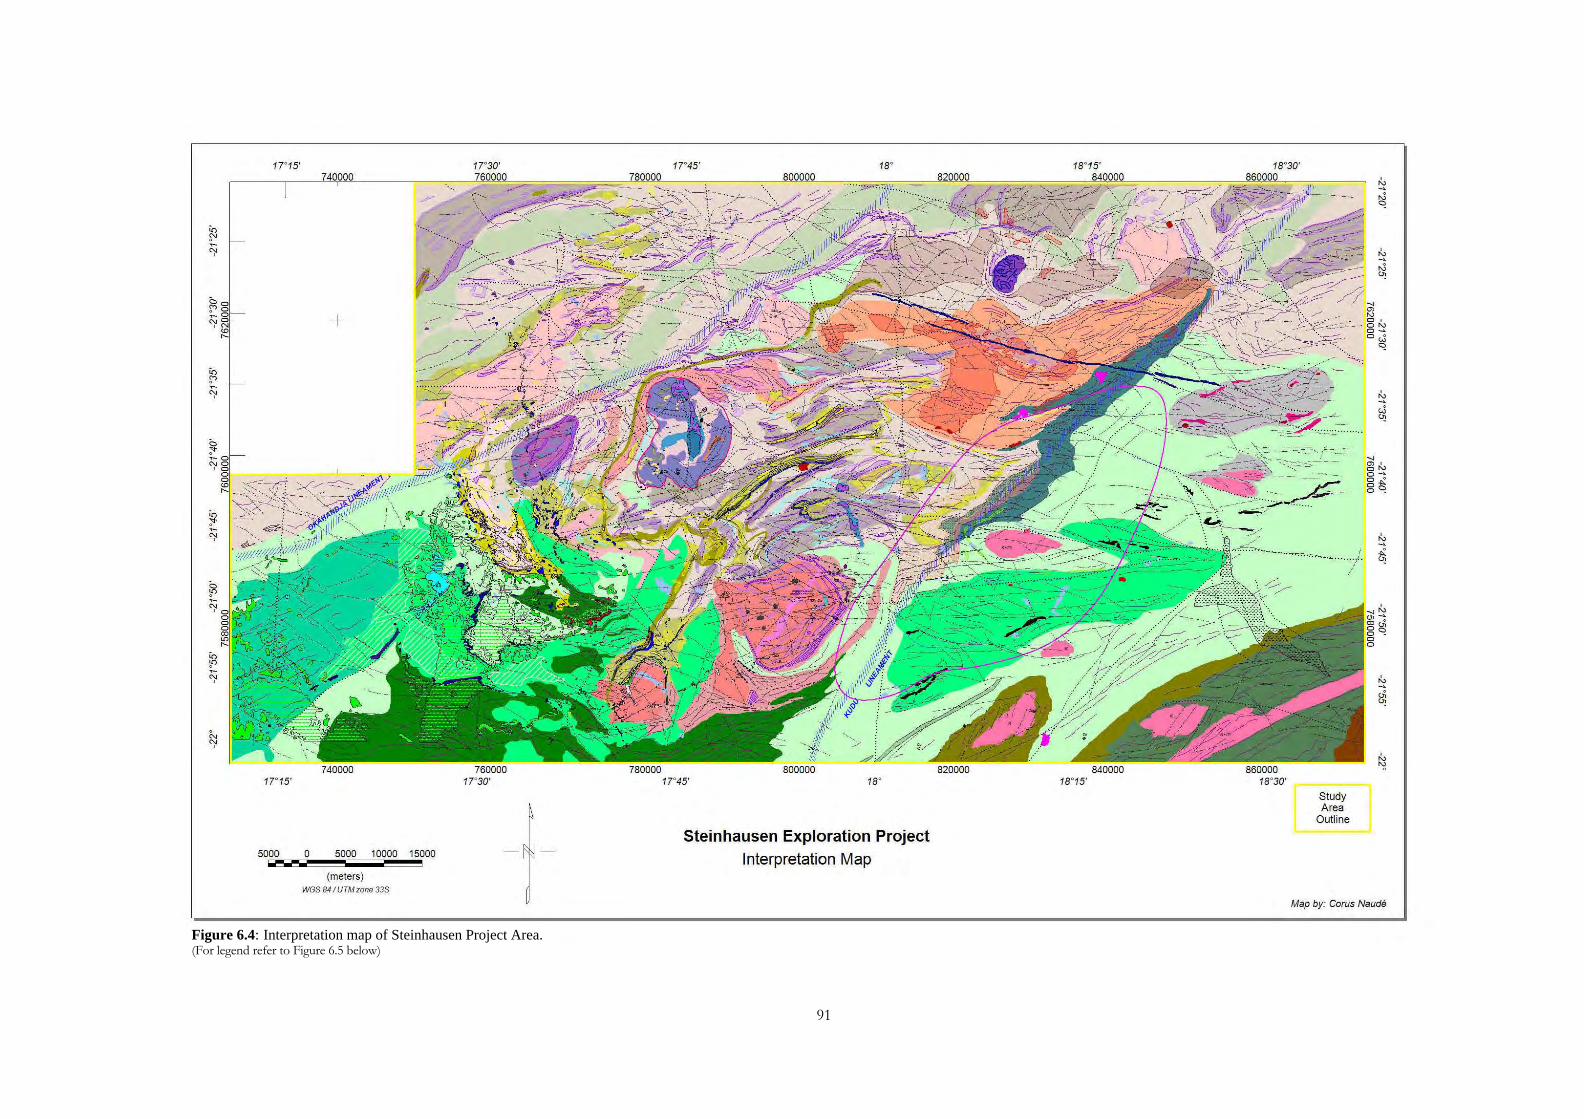
91
Figure 6.4: Interpretation map of Steinhausen Project Area. (For legend refer to Figure 6.5 below)
17"15'
17" 15'
5000 IOiOI
740000
o 5000 10000 15000
(meters ) WGS 841UTM l one 338
17"30'
760000 17"30'
17"45'
780000 17"45'
800000
18°
18°
Steinhausen Exploration Project
Interpretation Map
820000
18°15'
840000 18°15'
18°30'
860000 18"30'
~ ~ ~
r',?~""""",' •••• ', •• '" " 8 ~
Study Area
Outline
o~
Map by: Corus Naude
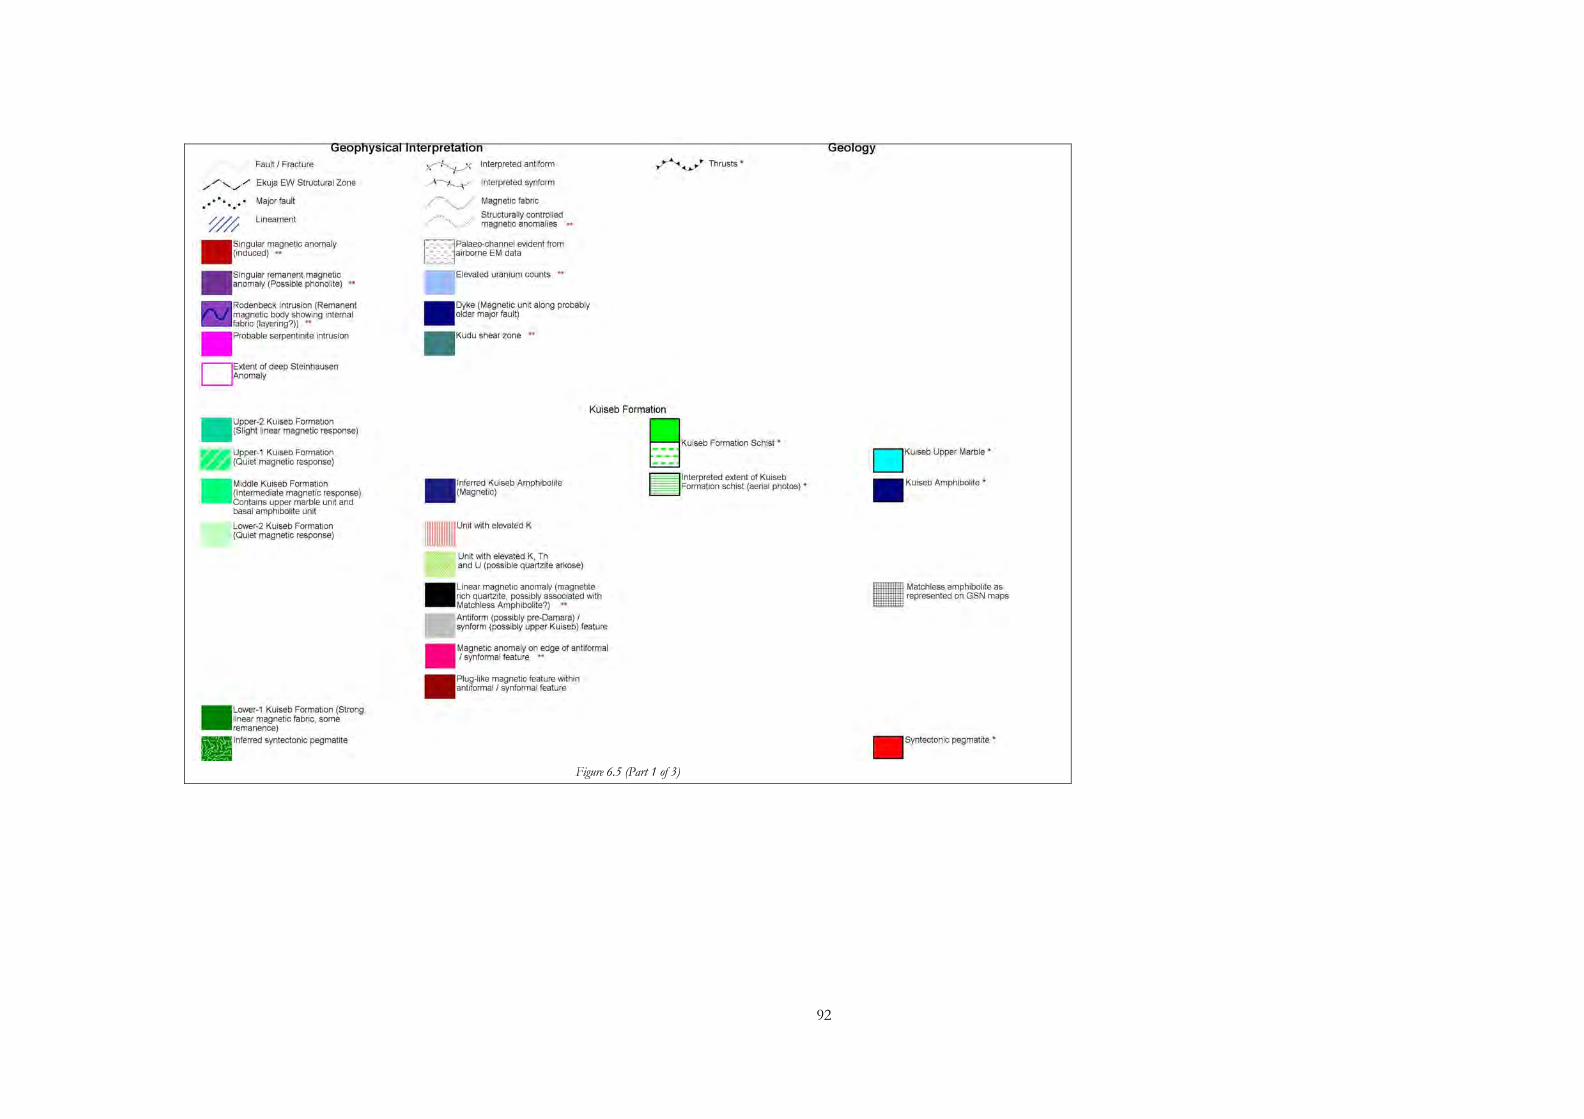
92
Figure 6.5 (Part 1 of 3)
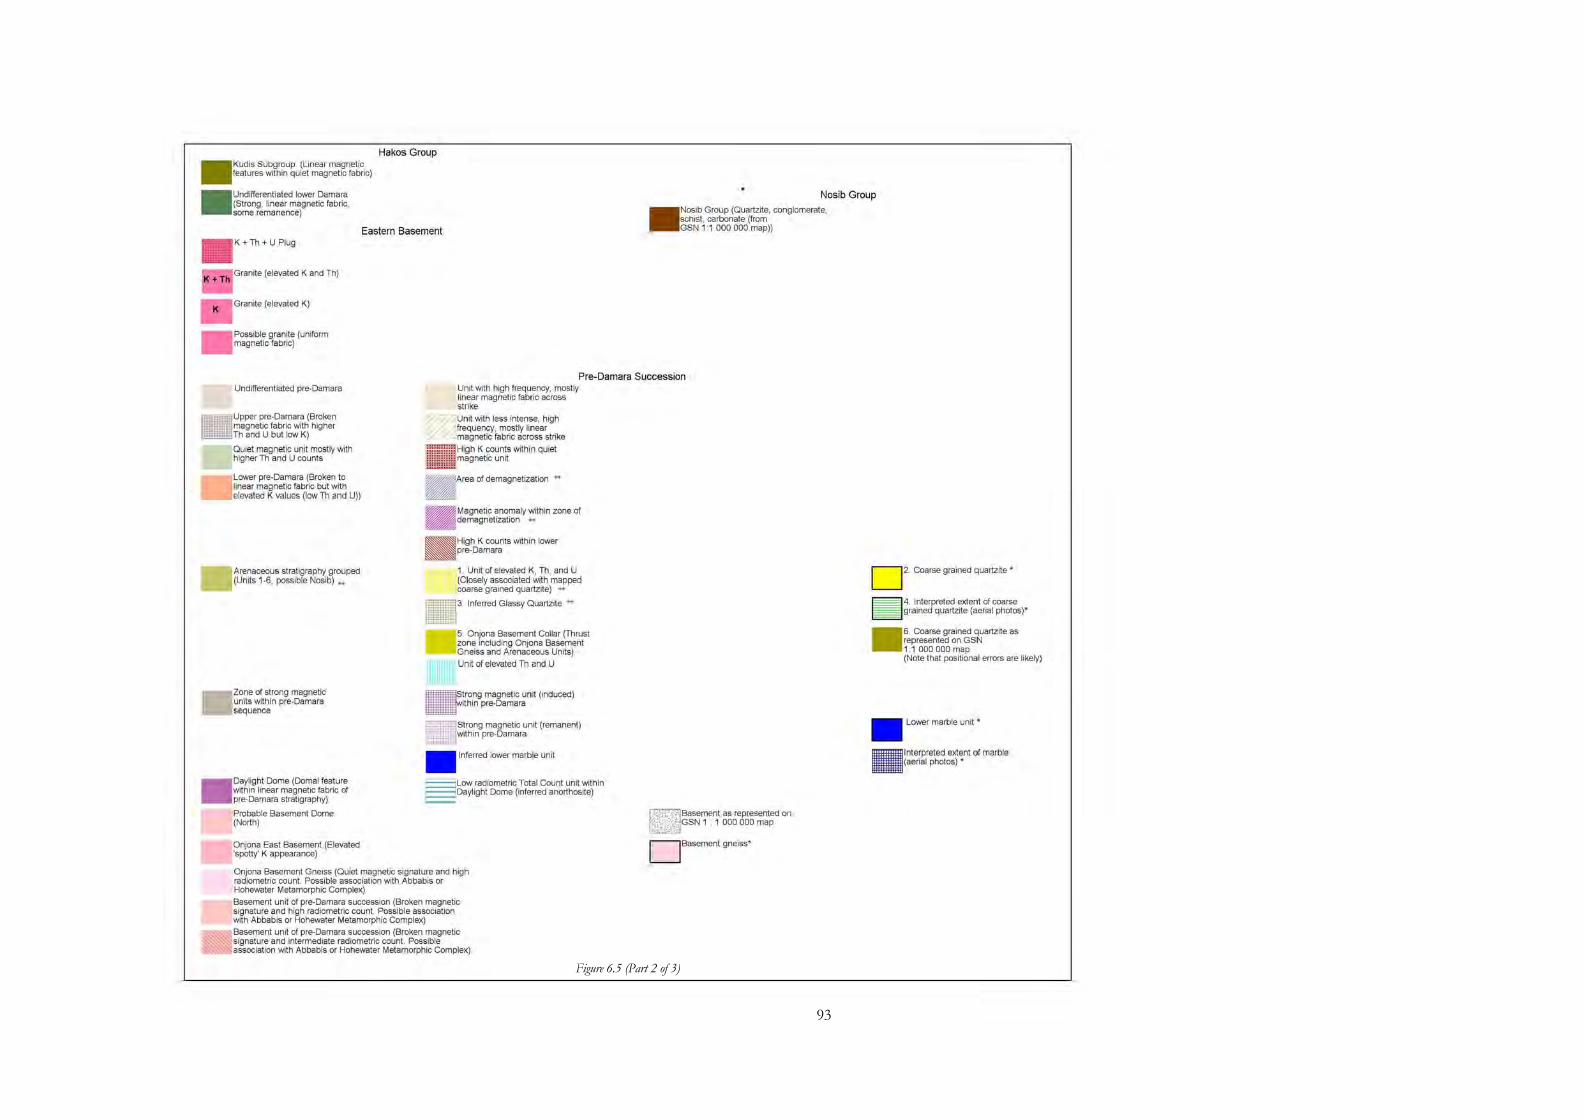
93
Figure 6.5 (Part 2 of 3)
•
KUdiS Subgroup. (Linear magnetic features within quiet magnetic fabric)
•
undifferentiated lower Damara (Strong, linear magnetic fabric, some remanence)
Hakos Group
Eastern Basement K + Th + U Plug
Granite (elevated K)
•
Possible granite (uniform magnetic fabric)
Nosib Group
•
NOSib Group (Quartzite, conglomerate, SChist, carbonate (from GSN 11 000000 map))
Pre-Damara Succession Undifferentiated pre-Damara
Upper pre-Damara (Broken magnetic fabric with higher
and U but low K)
Quiet magnetic unit mostly with higher Th and U counts
•
Lower pre-Damara (Broken to linear magnetic fabric but with elevated K values (low Th and U))
•
Arenaceous stratigraphy grouped (Units 1-6, possible Noslb) *.
•
zone of strong magnetic units within pre-Damara sequence
•
DaYlight Dome (Domal feature within linear magnetic fabric of pre-Damara stratigraphy)
•
Probable Basement Dome (North)
Onjona East Basement (Elevated 'spotty' K appearance)
Unit with high frequency, mostly linear magnetic fabric across
' strike
~Unit with less intense, high '/ '/ frequency, mostly linear /, /, magnetic fabric across strike
High K counts within quiet magnetic unit
_ Area of demagnetization
•
Magnetic anomaly within zone of demagnetization *.
_ High K counts within lower pre-Damara
1. Unit of elevated K, Th, and U (Closely associated with mapped coarse grained quartzite) ** . 3. Inferred Glassy Quartzite ••
5. Onjona Basement Collar (Thrust zone including Onjona Basement Gneiss and Arenaceous Units)
Unit of elevated Th and U
_ trong magnetic unit (induced) Ithln pre-Damara
•
Strong magnetic unit (remanent) within pre-Damara
• Inferred lower marble unit
~Low radiometric Total Count unit within E3Dayllght Dome (Inferred anorthosite)
Onjona Basement Gneiss (Quiet magnetic signature and high radiometric count. Possible association with Abbabis or Hohewater Metamorphic Complex)
Basement unit of pre-Damara succession (Broken magnetic signature and high radiometric count. Possible association with Abbabis or Hohewater Metamorphic Complex)
Basement unit of pre-Damara succession (Broken magnetic signature and intermediate radiometric count. Possible association with Abbabis or Hohewater Metamorphic Complex)
[:~', ' ..•. '.,',-~,',','-,,',',:',.:,',:",', j,,' Basement as represented on "':c'.:',",:,- GSN 1 1 000000 map
O Basement gneiss'
0 2. Coarse grained quartzite'
=4. Interpreted extent of coarse grained quartzite (aerial photos)'
•
6. Coarse grained quartzite as represented on GSN 11 000 000 map (Note that positional errors are likely)
• Lower marble unit'
_ Interpreted extent of marble (aerial photos) •
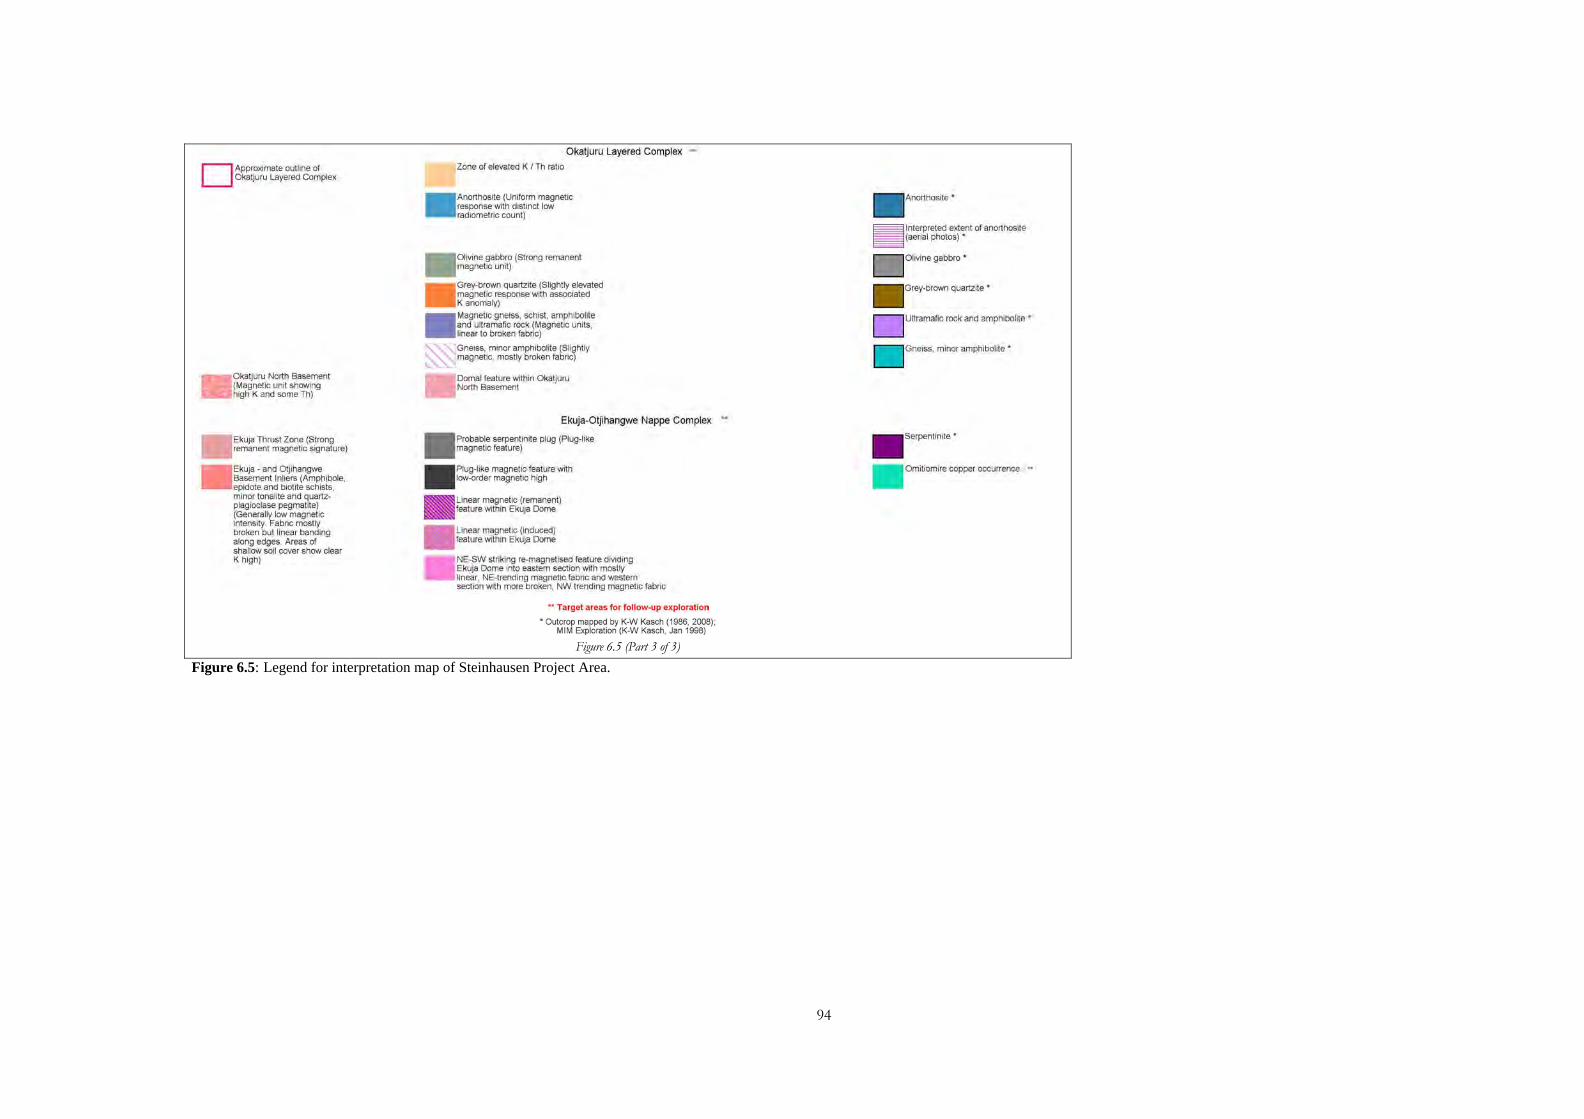
94
Figure 6.5 (Part 3 of 3)
Figure 6.5: Legend for interpretation map of Steinhausen Project Area.
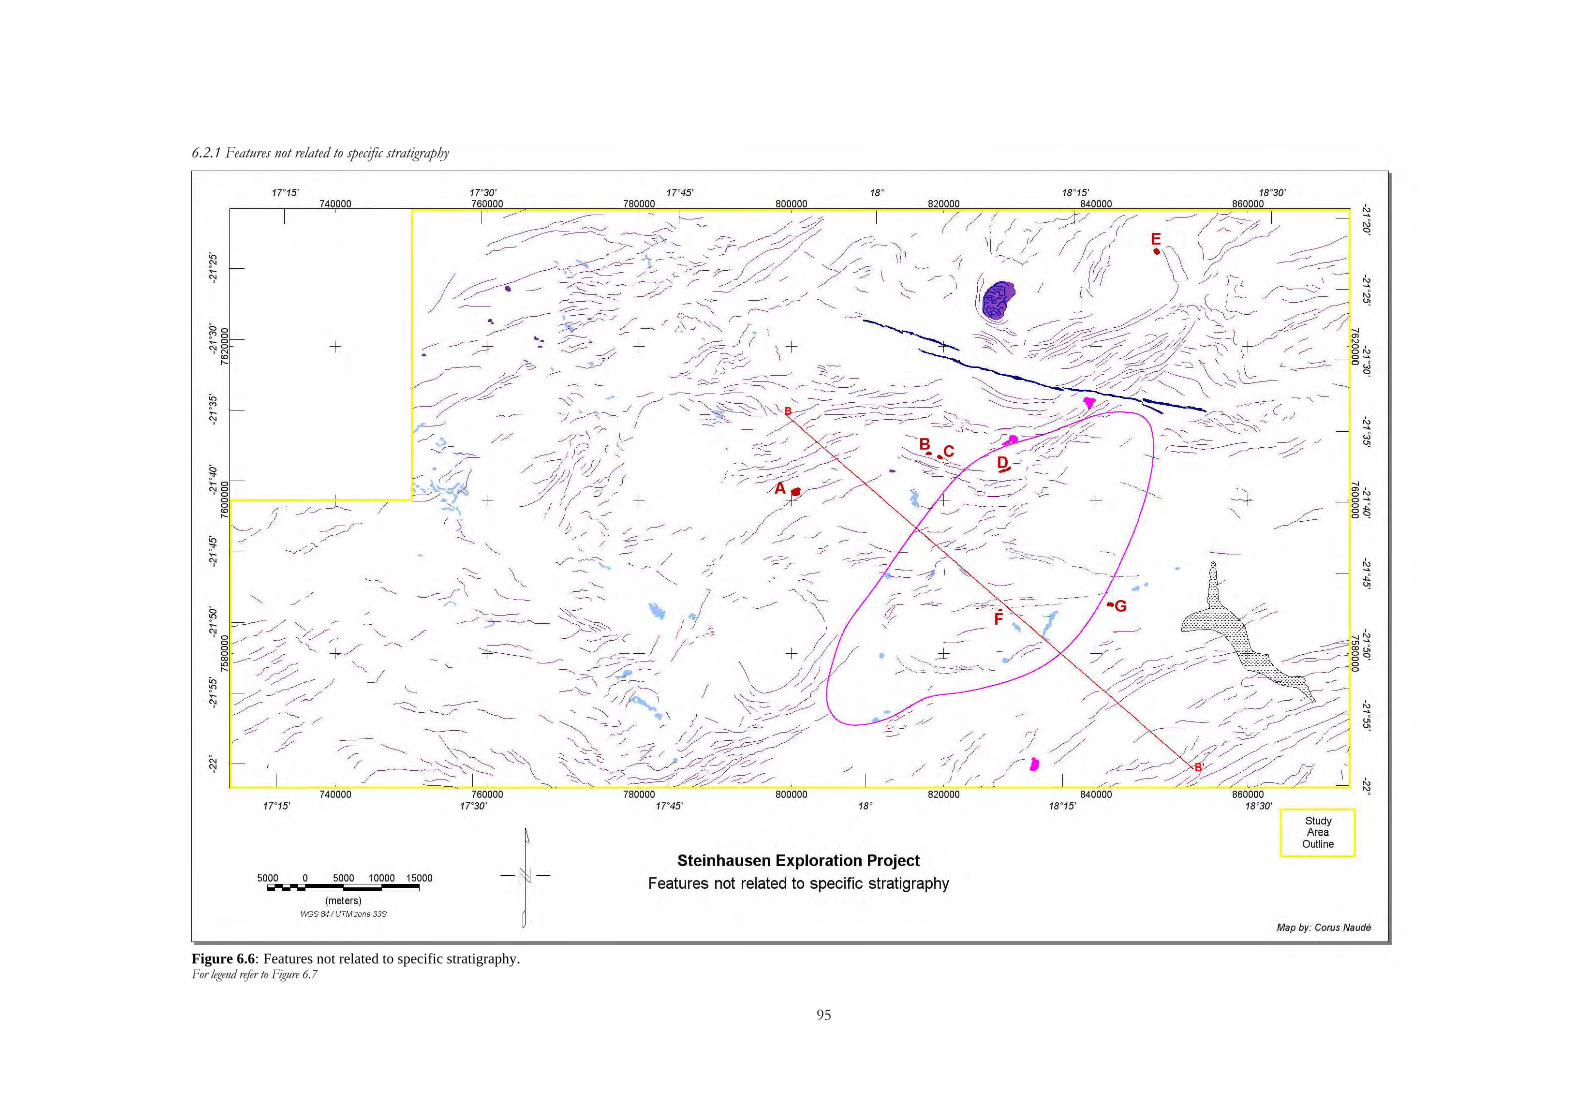
95
6.2.1 Features not related to specific stratigraphy
Figure 6.6: Features not related to specific stratigraphy. For legend refer to Figure 6.7
17"15'
17"15'
5000 IOiOI
740000
+
o 5000 10000 15000
(meters) ItYGS &4 1 UTM zone 33S
820000 18°
Steinhausen Exploration Project
Features not related to specific stratigraphy
840000 18°15'
....
860000 18°30'
~J
Study Area
Outline
Map by: Corus Naude
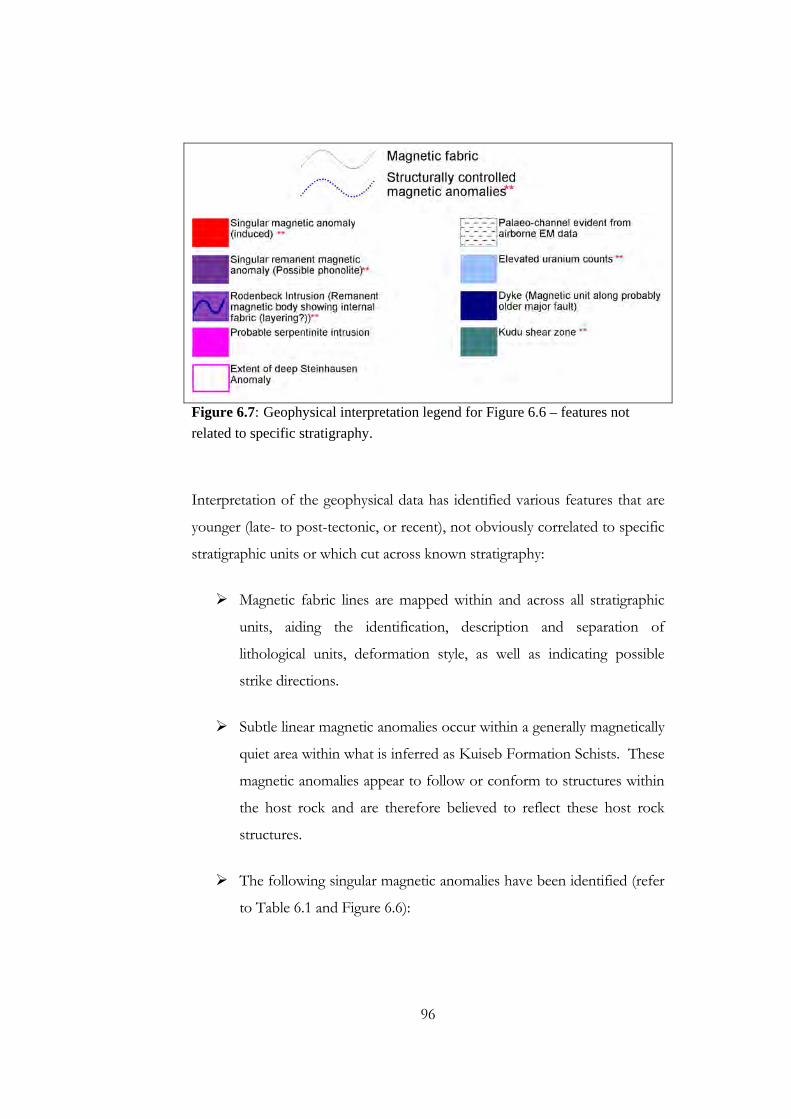
96
Figure 6.7: Geophysical interpretation legend for Figure 6.6 – features not
related to specific stratigraphy.
Interpretation of the geophysical data has identified various features that are
younger (late- to post-tectonic, or recent), not obviously correlated to specific
stratigraphic units or which cut across known stratigraphy:
Magnetic fabric lines are mapped within and across all stratigraphic
units, aiding the identification, description and separation of
lithological units, deformation style, as well as indicating possible
strike directions.
Subtle linear magnetic anomalies occur within a generally magnetically
quiet area within what is inferred as Kuiseb Formation Schists. These
magnetic anomalies appear to follow or conform to structures within
the host rock and are therefore believed to reflect these host rock
structures.
The following singular magnetic anomalies have been identified (refer
to Table 6.1 and Figure 6.6):
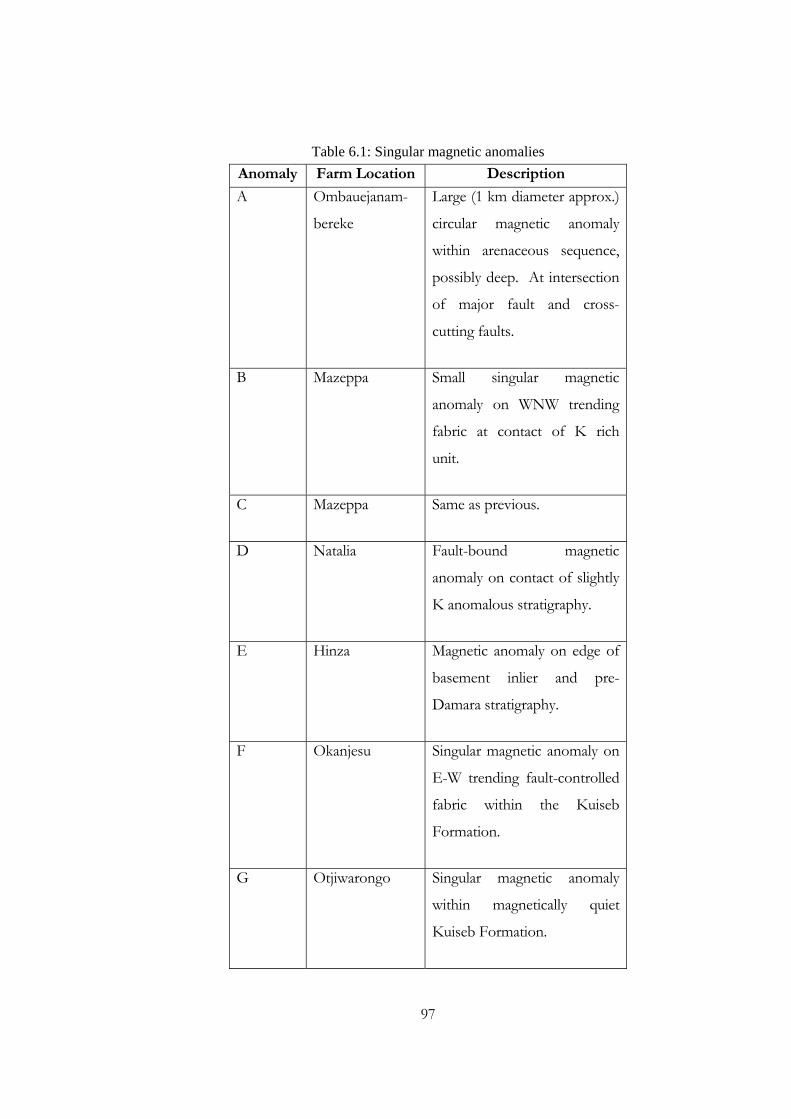
97
Table 6.1: Singular magnetic anomalies
Anomaly Farm Location Description
A Ombauejanam-
bereke
Large (1 km diameter approx.)
circular magnetic anomaly
within arenaceous sequence,
possibly deep. At intersection
of major fault and cross-
cutting faults.
B Mazeppa Small singular magnetic
anomaly on WNW trending
fabric at contact of K rich
unit.
C Mazeppa Same as previous.
D Natalia Fault-bound magnetic
anomaly on contact of slightly
K anomalous stratigraphy.
E Hinza Magnetic anomaly on edge of
basement inlier and pre-
Damara stratigraphy.
F Okanjesu Singular magnetic anomaly on
E-W trending fault-controlled
fabric within the Kuiseb
Formation.
G Otjiwarongo Singular magnetic anomaly
within magnetically quiet
Kuiseb Formation.
98
A few singular, remanent magnetic anomalies have been identified.
One on the farm Okowiruru North which is located in Pre-Damara
stratigraphy and is bound by two prominent N and NNW trending
faults. Others are situated in the northwest portion of the study area
within pre-Damara stratigraphy and inferred to be possible phonolite
intrusions.
A large, remanent magnetic body is interpreted to have intruded pre-
Damara stratigraphy on the farms Klein Ombaheme and Rodenbeck
(hereafter termed the Rodenbeck Intrusion). The southern lobe of
the intrusion is also evident on the radiometric image as low
radiometric counts in all channels. Within the body there is clear
magnetic fabric visible, indicating some degree of internal structure or
differentiation.
Various magnetic bodies have been mapped with similar responses to
known serpentinite bodies. Two of the bodies, one on the border of
the farms Tolene and Natalia and the other on the northern border of
Bashee, are associated with the Kudu shear zone and were possibly
emplaced during the shear event. A third unit was mapped on the
farms Vendetta and Talana. To date, none of the known serpentinite
bodies within the Damara Orogen have proven to be of economic
importance although a larger body south of the survey area has shown
traces of Ni mineralisation (Company reports of past EPL holders).
The Steinhausen Anomaly is a clear magnetic low, east of the EONC,
and a singular regional feature in Namibia. It is believed to be as a
result of a large, deep area of severe demagnetisation (Corner, 2008)
and modelled as such, Figure 6.8.
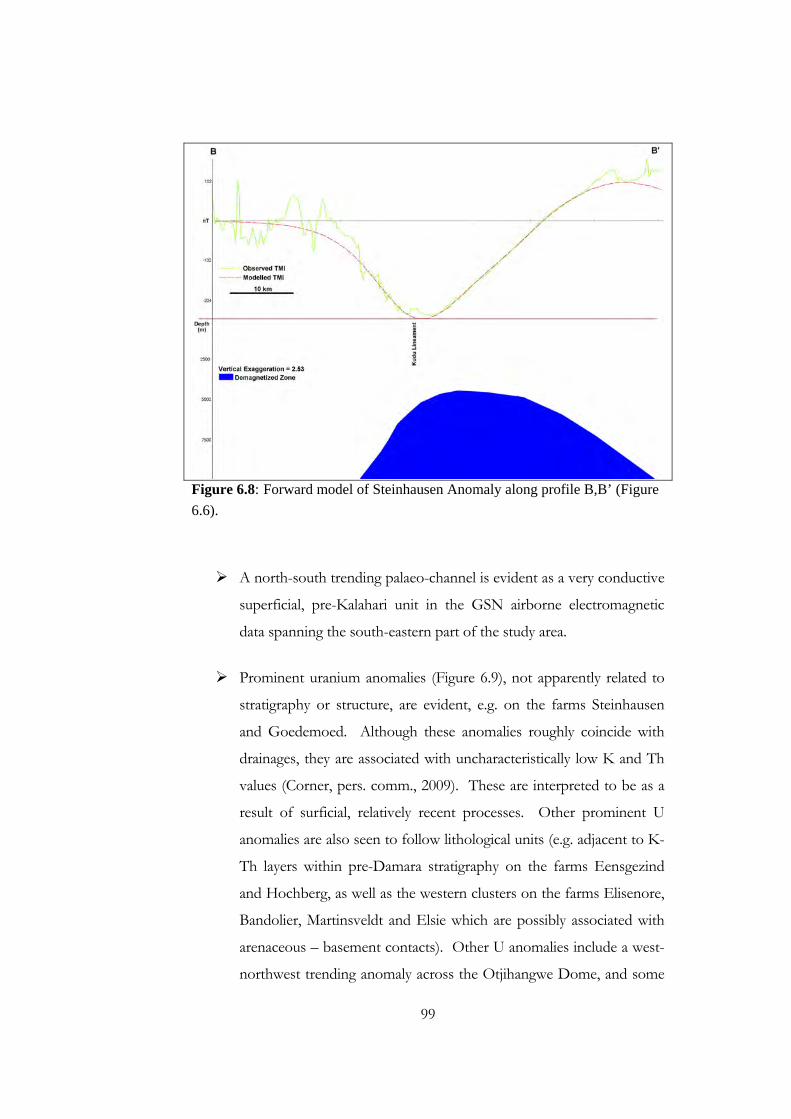
99
Figure 6.8: Forward model of Steinhausen Anomaly along profile B,B’ (Figure
6.6).
A north-south trending palaeo-channel is evident as a very conductive
superficial, pre-Kalahari unit in the GSN airborne electromagnetic
data spanning the south-eastern part of the study area.
Prominent uranium anomalies (Figure 6.9), not apparently related to
stratigraphy or structure, are evident, e.g. on the farms Steinhausen
and Goedemoed. Although these anomalies roughly coincide with
drainages, they are associated with uncharacteristically low K and Th
values (Corner, pers. comm., 2009). These are interpreted to be as a
result of surficial, relatively recent processes. Other prominent U
anomalies are also seen to follow lithological units (e.g. adjacent to K-
Th layers within pre-Damara stratigraphy on the farms Eensgezind
and Hochberg, as well as the western clusters on the farms Elisenore,
Bandolier, Martinsveldt and Elsie which are possibly associated with
arenaceous – basement contacts). Other U anomalies include a west-
northwest trending anomaly across the Otjihangwe Dome, and some
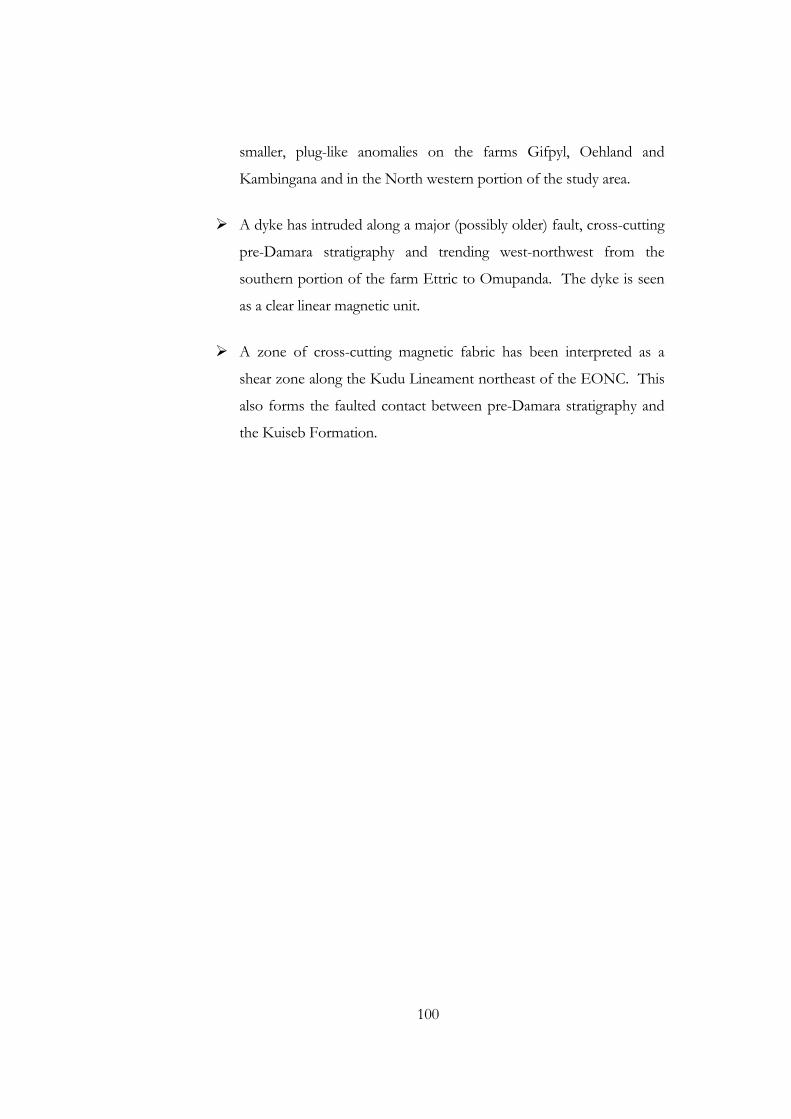
100
smaller, plug-like anomalies on the farms Gifpyl, Oehland and
Kambingana and in the North western portion of the study area.
A dyke has intruded along a major (possibly older) fault, cross-cutting
pre-Damara stratigraphy and trending west-northwest from the
southern portion of the farm Ettric to Omupanda. The dyke is seen
as a clear linear magnetic unit.
A zone of cross-cutting magnetic fabric has been interpreted as a
shear zone along the Kudu Lineament northeast of the EONC. This
also forms the faulted contact between pre-Damara stratigraphy and
the Kuiseb Formation.
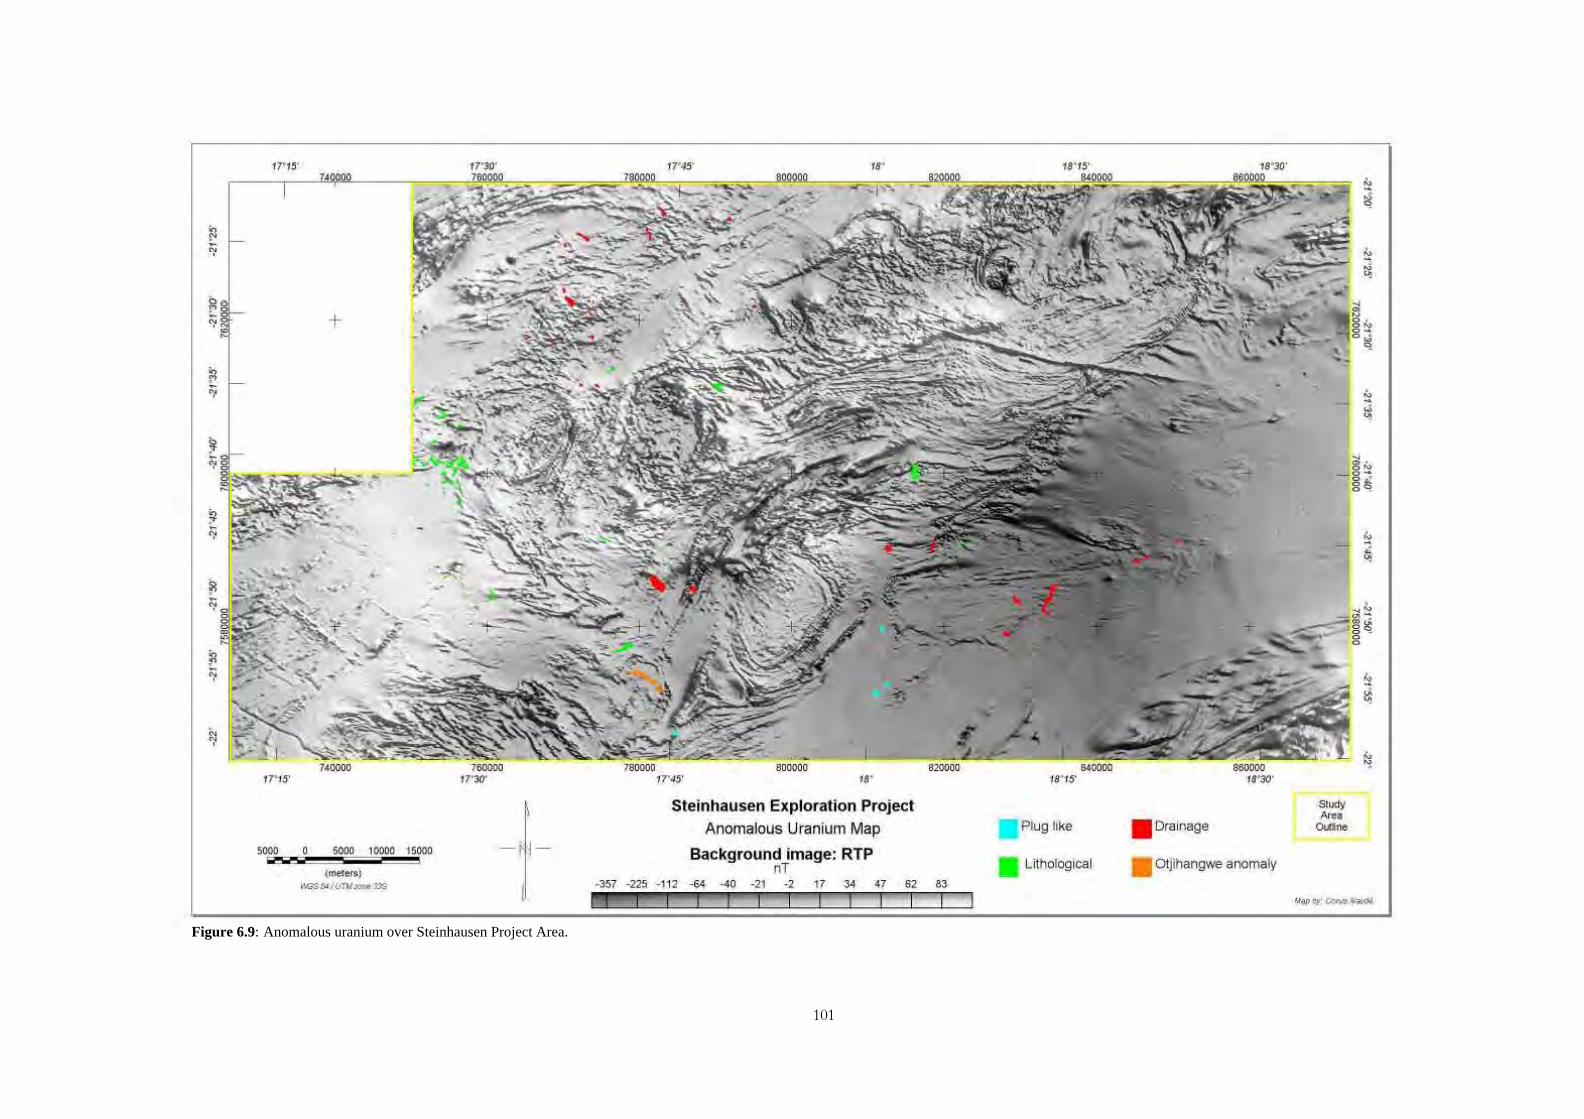
101
Figure 6.9: Anomalous uranium over Steinhausen Project Area.
, , " ' W
+ "
_ .. ,=>-=
"'..,'
". Steinhausen Exploration Project
Anomalous Ur(lnium M(lp
Background image: RTP
"'
. Plug hke
• Lrthologica l
• Dra inage
• OtJlhangwe anomaly
; ;
102
Mineralisation potential of features not related to specific stratigraphy
Various uranium anomalies have been identified from the radiometric
data (Figure 6.9). Most of these anomalies are associated with current
drainages or possible palaeo-channels. Other anomalies are evidenced
as plug-like bodies or strata-bound anomalies.
The singular, remanent magnetic anomalies that are fault/thrust
bound possibly indicate the occurrence of pyrrhotite, a strong
remanence carrier, with possible related mineralisation.
The induced singular magnetic anomalies are either pipe-like or short
strike 2D bodies. These occur in different lithological settings, and
depending thereon could host deposits associated with hydrothermal
copper or gold deposits.
The Rodenbeck Intrusion is an apparently layered intrusion, possibly
ultramafic, that holds potential for Ni - Cu mineralisation.
The Kudu shear zone is interpreted to consist of a large zone of
faulting and fracturing thus providing ample late-, to post-tectonic
secondary porosity for fluid movement and related hydrothermal
mineral deposits.
Although not a target in itself due to its deep location and extent, the
Steinhausen Anomaly could be indicative of the significant presence
of hydrothermal fluids, and therefore be an important control on
mineral occurrences in the vicinity.
Miller (1983b) described the possibility of mineral occurrences
associated with fluid movement along faults and thrusts during
prograde metamorphism. Taking cognisance of this, various
magnetic anomalies along interpreted faults have been identified.
These magnetic anomalies fall mostly within the Upper-1 Kuiseb

103
Formation but some are also evident within the Middle Kuiseb
Formation, and are seen as magnetic lows suggesting the occurrence
of demagnetisation. (The Upper-1 Kuiseb Formation and Middle
Kuiseb Formation are defined in the following section.)
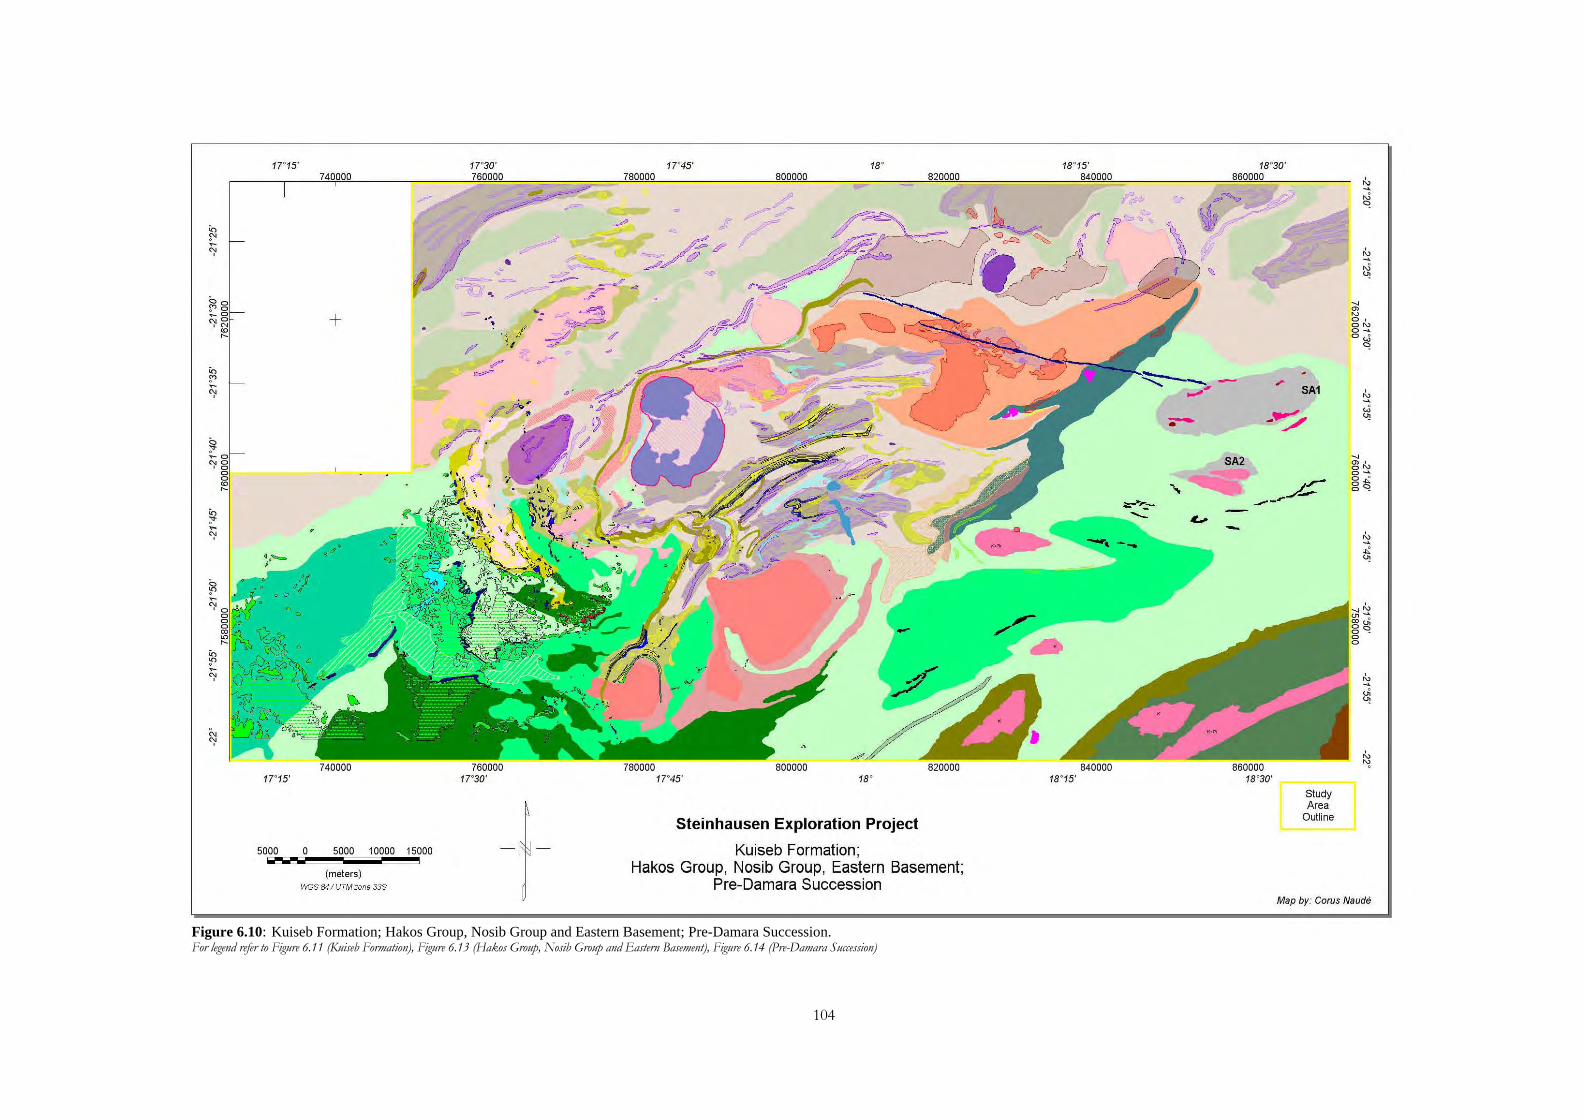
104
Figure 6.10: Kuiseb Formation; Hakos Group, Nosib Group and Eastern Basement; Pre-Damara Succession. For legend refer to Figure 6.11 (Kuiseb Formation), Figure 6.13 (Hakos Group, Nosib Group and Eastern Basement), Figure 6.14 (Pre-Damara Succession)
17"15' 17"30' 17"45' 18° 18°15' 18°30'
~
. /"~~ IF ~ ""~ ¥' ,J
6 ~ ">
'" -" ~ J~ ,f t , ~ Co ~ --. / ft y -~ .,? ~ ~ • ~-., ,J
~ '" " '" p=<'" - J
C /( ;
~ ~ '. ~ m - + " *=.::::? ~
~ .- - 0, ~ i' 0'"
~ 0_
o ~ ;J J \ Ow P" ' f <7' ">
9
Co / ~
~ ~ -~ 0 ~ SA1 ~
/G~= -~
w :-- '"
c ~? :> - ~ SA2 ~
~ m' ~ 0'"
Q " or 0-
" 0 °
~ 0"" . ~ ) " 0">
1 ~~}. ~:" i ~.~-- ----~ Co ......... c.. :>
\ . . -{ - -~ '" ". . . ~ t " "- ..:
'" c ~ -~ ~
u; ">
Co ~ - ', ' ~ .., ~
u;
'" '" ~
I., 740000 760000 780000 800000 820000 840000 860000 ~
17"15' 17"30' 17"45' 18° 18°15' 18°30'
Study Area
Steinhausen Exploration Project Outline
5000 0 5000 10000 15000 Kuiseb Formation ; IOiOI Hakos Group, Nosib Group, Eastern Basement; (meters)
ItYGS &4 1 UTM zone 33S Pre-Damara Succession Map by: Corus Naude
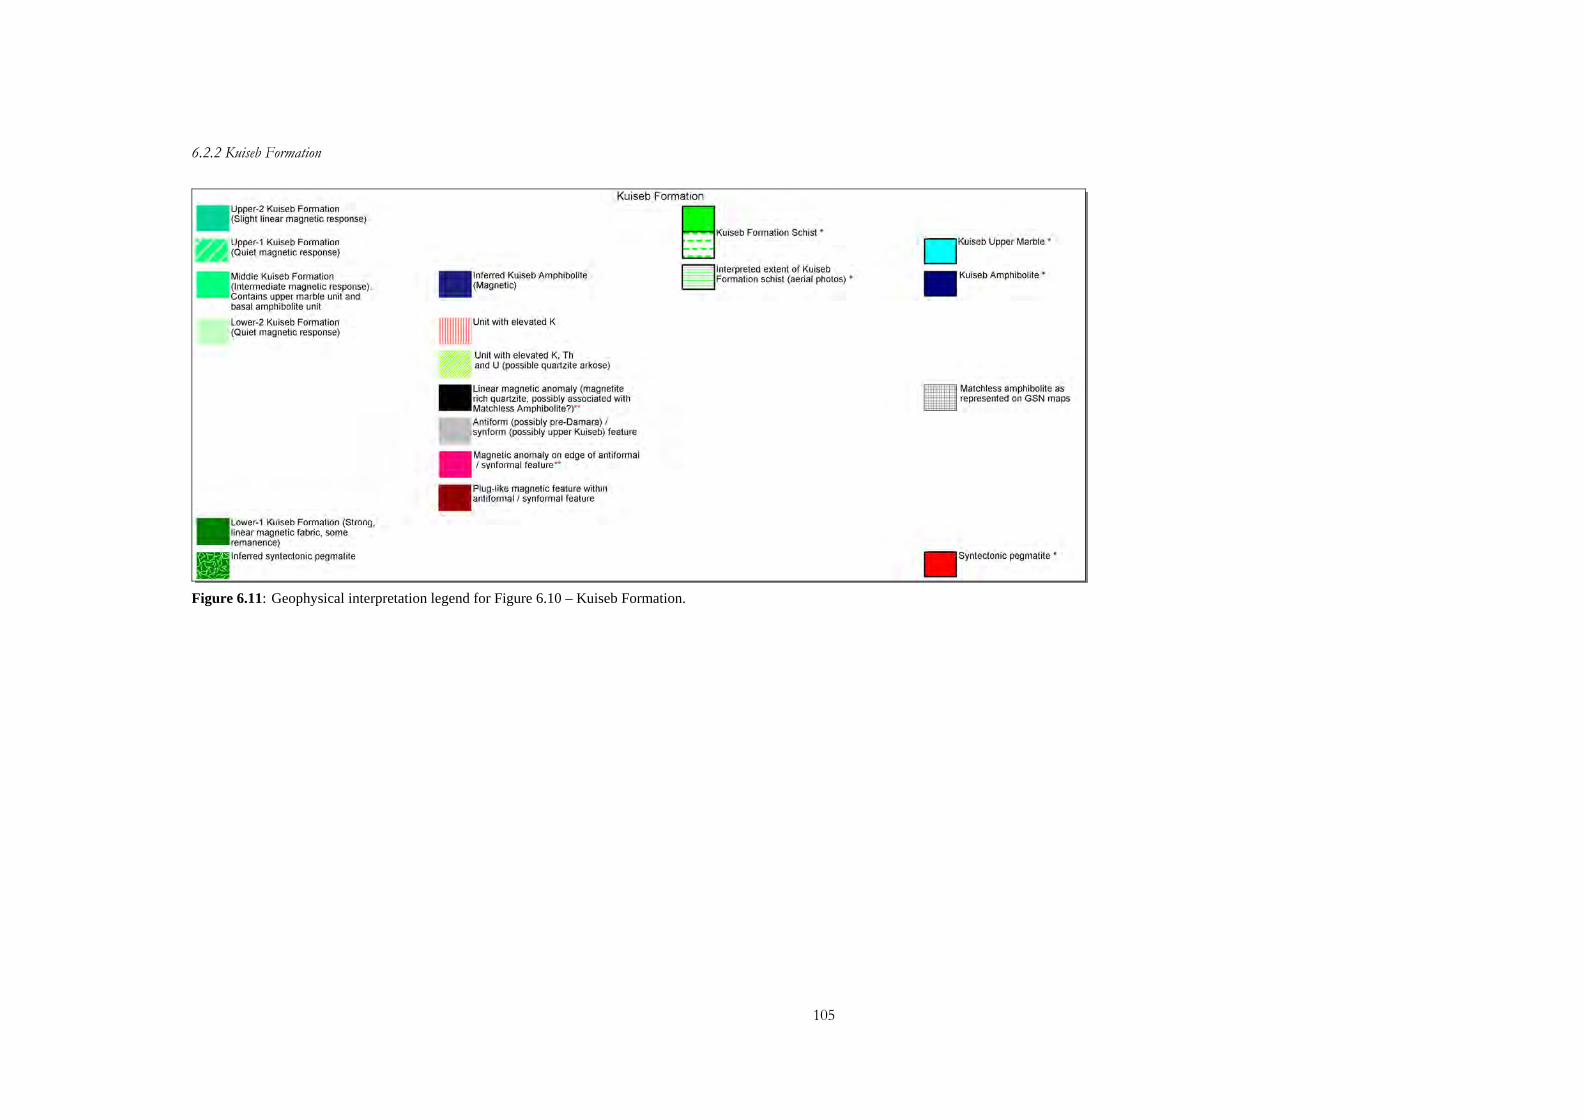
105
6.2.2 Kuiseb Formation
Figure 6.11: Geophysical interpretation legend for Figure 6.10 – Kuiseb Formation.
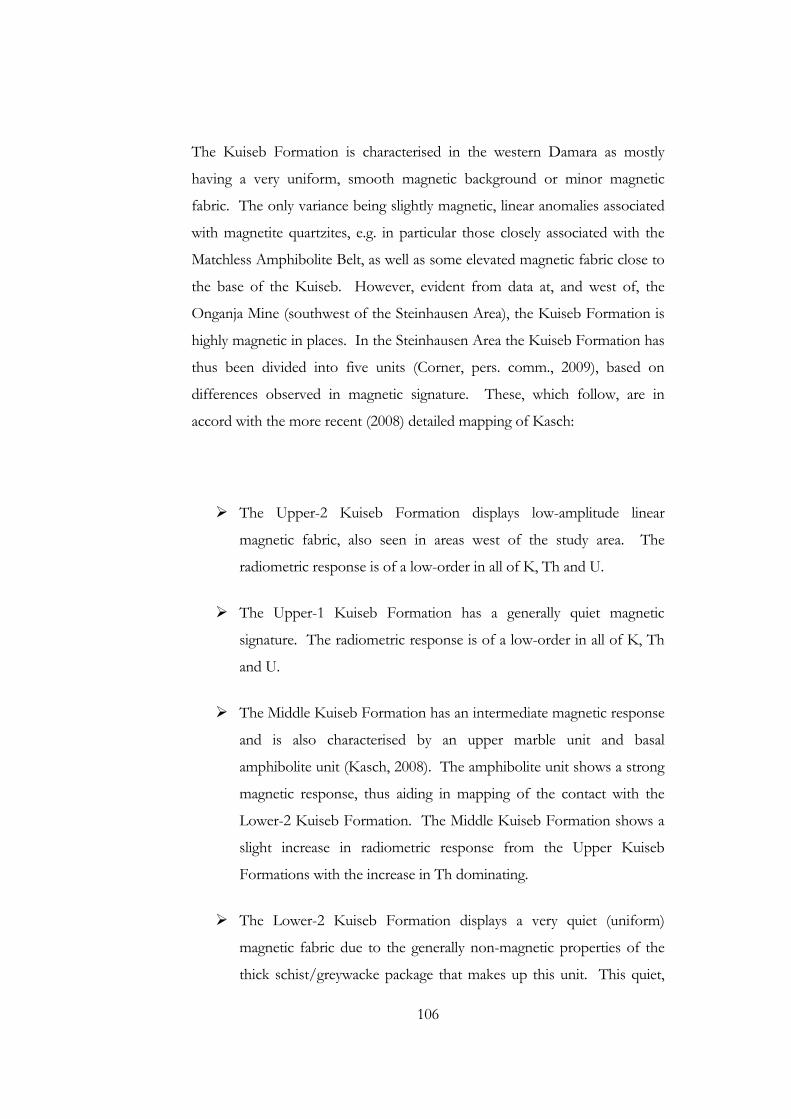
106
The Kuiseb Formation is characterised in the western Damara as mostly
having a very uniform, smooth magnetic background or minor magnetic
fabric. The only variance being slightly magnetic, linear anomalies associated
with magnetite quartzites, e.g. in particular those closely associated with the
Matchless Amphibolite Belt, as well as some elevated magnetic fabric close to
the base of the Kuiseb. However, evident from data at, and west of, the
Onganja Mine (southwest of the Steinhausen Area), the Kuiseb Formation is
highly magnetic in places. In the Steinhausen Area the Kuiseb Formation has
thus been divided into five units (Corner, pers. comm., 2009), based on
differences observed in magnetic signature. These, which follow, are in
accord with the more recent (2008) detailed mapping of Kasch:
The Upper-2 Kuiseb Formation displays low-amplitude linear
magnetic fabric, also seen in areas west of the study area. The
radiometric response is of a low-order in all of K, Th and U.
The Upper-1 Kuiseb Formation has a generally quiet magnetic
signature. The radiometric response is of a low-order in all of K, Th
and U.
The Middle Kuiseb Formation has an intermediate magnetic response
and is also characterised by an upper marble unit and basal
amphibolite unit (Kasch, 2008). The amphibolite unit shows a strong
magnetic response, thus aiding in mapping of the contact with the
Lower-2 Kuiseb Formation. The Middle Kuiseb Formation shows a
slight increase in radiometric response from the Upper Kuiseb
Formations with the increase in Th dominating.
The Lower-2 Kuiseb Formation displays a very quiet (uniform)
magnetic fabric due to the generally non-magnetic properties of the
thick schist/greywacke package that makes up this unit. This quiet,
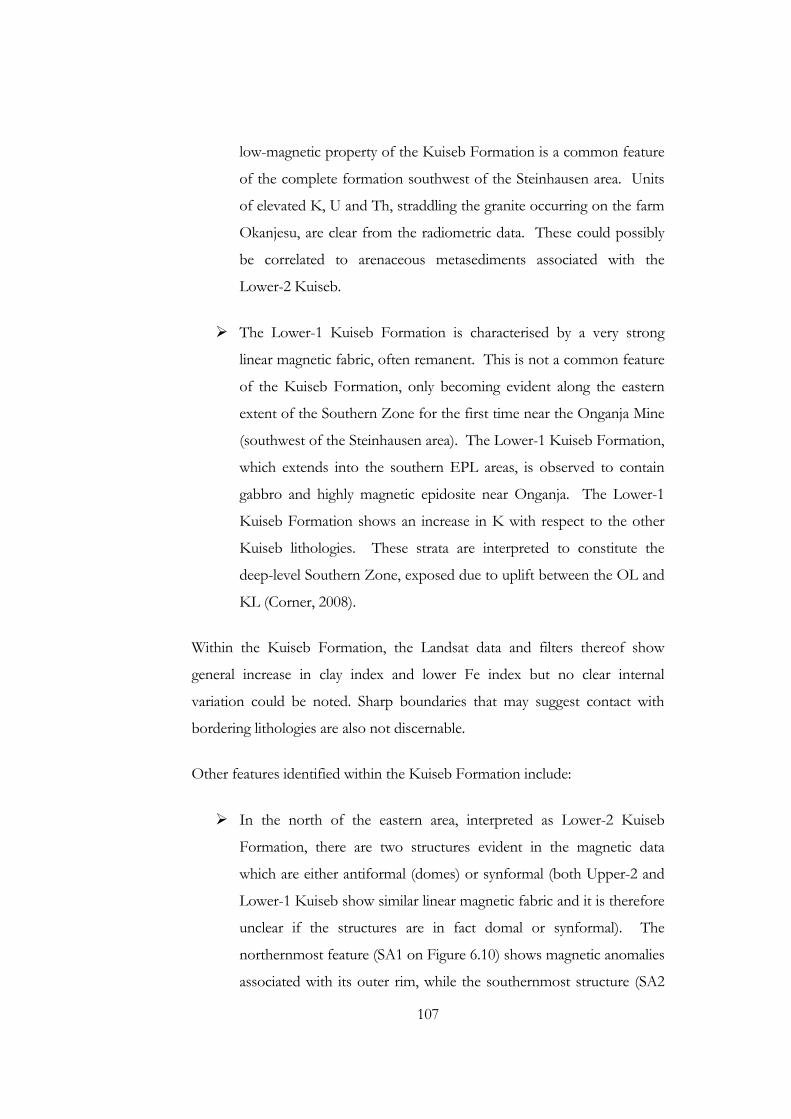
107
low-magnetic property of the Kuiseb Formation is a common feature
of the complete formation southwest of the Steinhausen area. Units
of elevated K, U and Th, straddling the granite occurring on the farm
Okanjesu, are clear from the radiometric data. These could possibly
be correlated to arenaceous metasediments associated with the
Lower-2 Kuiseb.
The Lower-1 Kuiseb Formation is characterised by a very strong
linear magnetic fabric, often remanent. This is not a common feature
of the Kuiseb Formation, only becoming evident along the eastern
extent of the Southern Zone for the first time near the Onganja Mine
(southwest of the Steinhausen area). The Lower-1 Kuiseb Formation,
which extends into the southern EPL areas, is observed to contain
gabbro and highly magnetic epidosite near Onganja. The Lower-1
Kuiseb Formation shows an increase in K with respect to the other
Kuiseb lithologies. These strata are interpreted to constitute the
deep-level Southern Zone, exposed due to uplift between the OL and
KL (Corner, 2008).
Within the Kuiseb Formation, the Landsat data and filters thereof show
general increase in clay index and lower Fe index but no clear internal
variation could be noted. Sharp boundaries that may suggest contact with
bordering lithologies are also not discernable.
Other features identified within the Kuiseb Formation include:
In the north of the eastern area, interpreted as Lower-2 Kuiseb
Formation, there are two structures evident in the magnetic data
which are either antiformal (domes) or synformal (both Upper-2 and
Lower-1 Kuiseb show similar linear magnetic fabric and it is therefore
unclear if the structures are in fact domal or synformal). The
northernmost feature (SA1 on Figure 6.10) shows magnetic anomalies
associated with its outer rim, while the southernmost structure (SA2
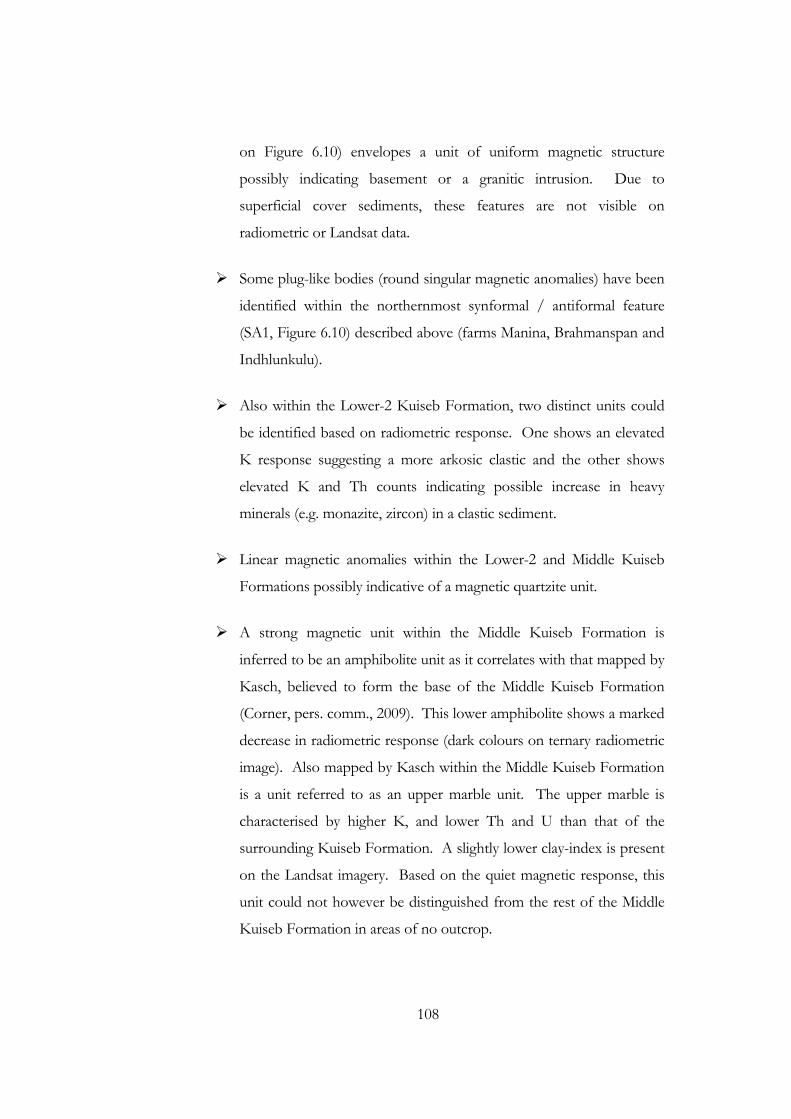
108
on Figure 6.10) envelopes a unit of uniform magnetic structure
possibly indicating basement or a granitic intrusion. Due to
superficial cover sediments, these features are not visible on
radiometric or Landsat data.
Some plug-like bodies (round singular magnetic anomalies) have been
identified within the northernmost synformal / antiformal feature
(SA1, Figure 6.10) described above (farms Manina, Brahmanspan and
Indhlunkulu).
Also within the Lower-2 Kuiseb Formation, two distinct units could
be identified based on radiometric response. One shows an elevated
K response suggesting a more arkosic clastic and the other shows
elevated K and Th counts indicating possible increase in heavy
minerals (e.g. monazite, zircon) in a clastic sediment.
Linear magnetic anomalies within the Lower-2 and Middle Kuiseb
Formations possibly indicative of a magnetic quartzite unit.
A strong magnetic unit within the Middle Kuiseb Formation is
inferred to be an amphibolite unit as it correlates with that mapped by
Kasch, believed to form the base of the Middle Kuiseb Formation
(Corner, pers. comm., 2009). This lower amphibolite shows a marked
decrease in radiometric response (dark colours on ternary radiometric
image). Also mapped by Kasch within the Middle Kuiseb Formation
is a unit referred to as an upper marble unit. The upper marble is
characterised by higher K, and lower Th and U than that of the
surrounding Kuiseb Formation. A slightly lower clay-index is present
on the Landsat imagery. Based on the quiet magnetic response, this
unit could not however be distinguished from the rest of the Middle
Kuiseb Formation in areas of no outcrop.
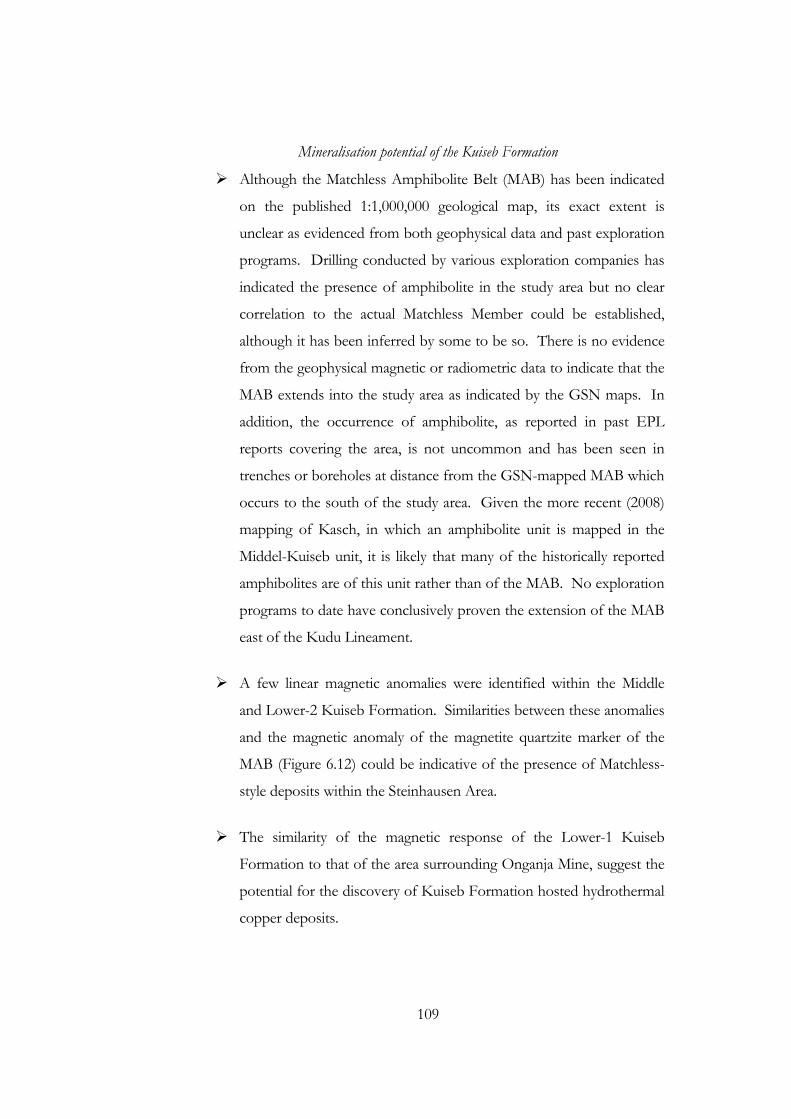
109
Mineralisation potential of the Kuiseb Formation
Although the Matchless Amphibolite Belt (MAB) has been indicated
on the published 1:1,000,000 geological map, its exact extent is
unclear as evidenced from both geophysical data and past exploration
programs. Drilling conducted by various exploration companies has
indicated the presence of amphibolite in the study area but no clear
correlation to the actual Matchless Member could be established,
although it has been inferred by some to be so. There is no evidence
from the geophysical magnetic or radiometric data to indicate that the
MAB extends into the study area as indicated by the GSN maps. In
addition, the occurrence of amphibolite, as reported in past EPL
reports covering the area, is not uncommon and has been seen in
trenches or boreholes at distance from the GSN-mapped MAB which
occurs to the south of the study area. Given the more recent (2008)
mapping of Kasch, in which an amphibolite unit is mapped in the
Middel-Kuiseb unit, it is likely that many of the historically reported
amphibolites are of this unit rather than of the MAB. No exploration
programs to date have conclusively proven the extension of the MAB
east of the Kudu Lineament.
A few linear magnetic anomalies were identified within the Middle
and Lower-2 Kuiseb Formation. Similarities between these anomalies
and the magnetic anomaly of the magnetite quartzite marker of the
MAB (Figure 6.12) could be indicative of the presence of Matchless-
style deposits within the Steinhausen Area.
The similarity of the magnetic response of the Lower-1 Kuiseb
Formation to that of the area surrounding Onganja Mine, suggest the
potential for the discovery of Kuiseb Formation hosted hydrothermal
copper deposits.
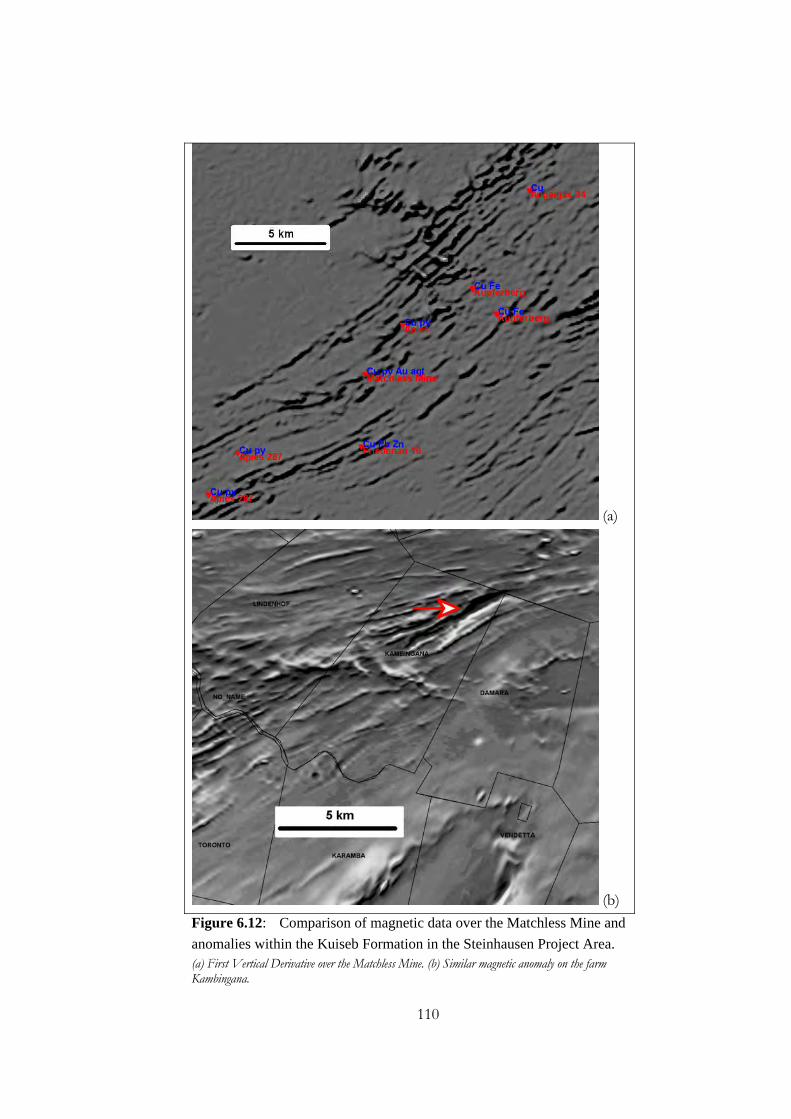
110
(a)
(b)
Figure 6.12: Comparison of magnetic data over the Matchless Mine and
anomalies within the Kuiseb Formation in the Steinhausen Project Area. (a) First Vertical Derivative over the Matchless Mine. (b) Similar magnetic anomaly on the farm Kambingana.
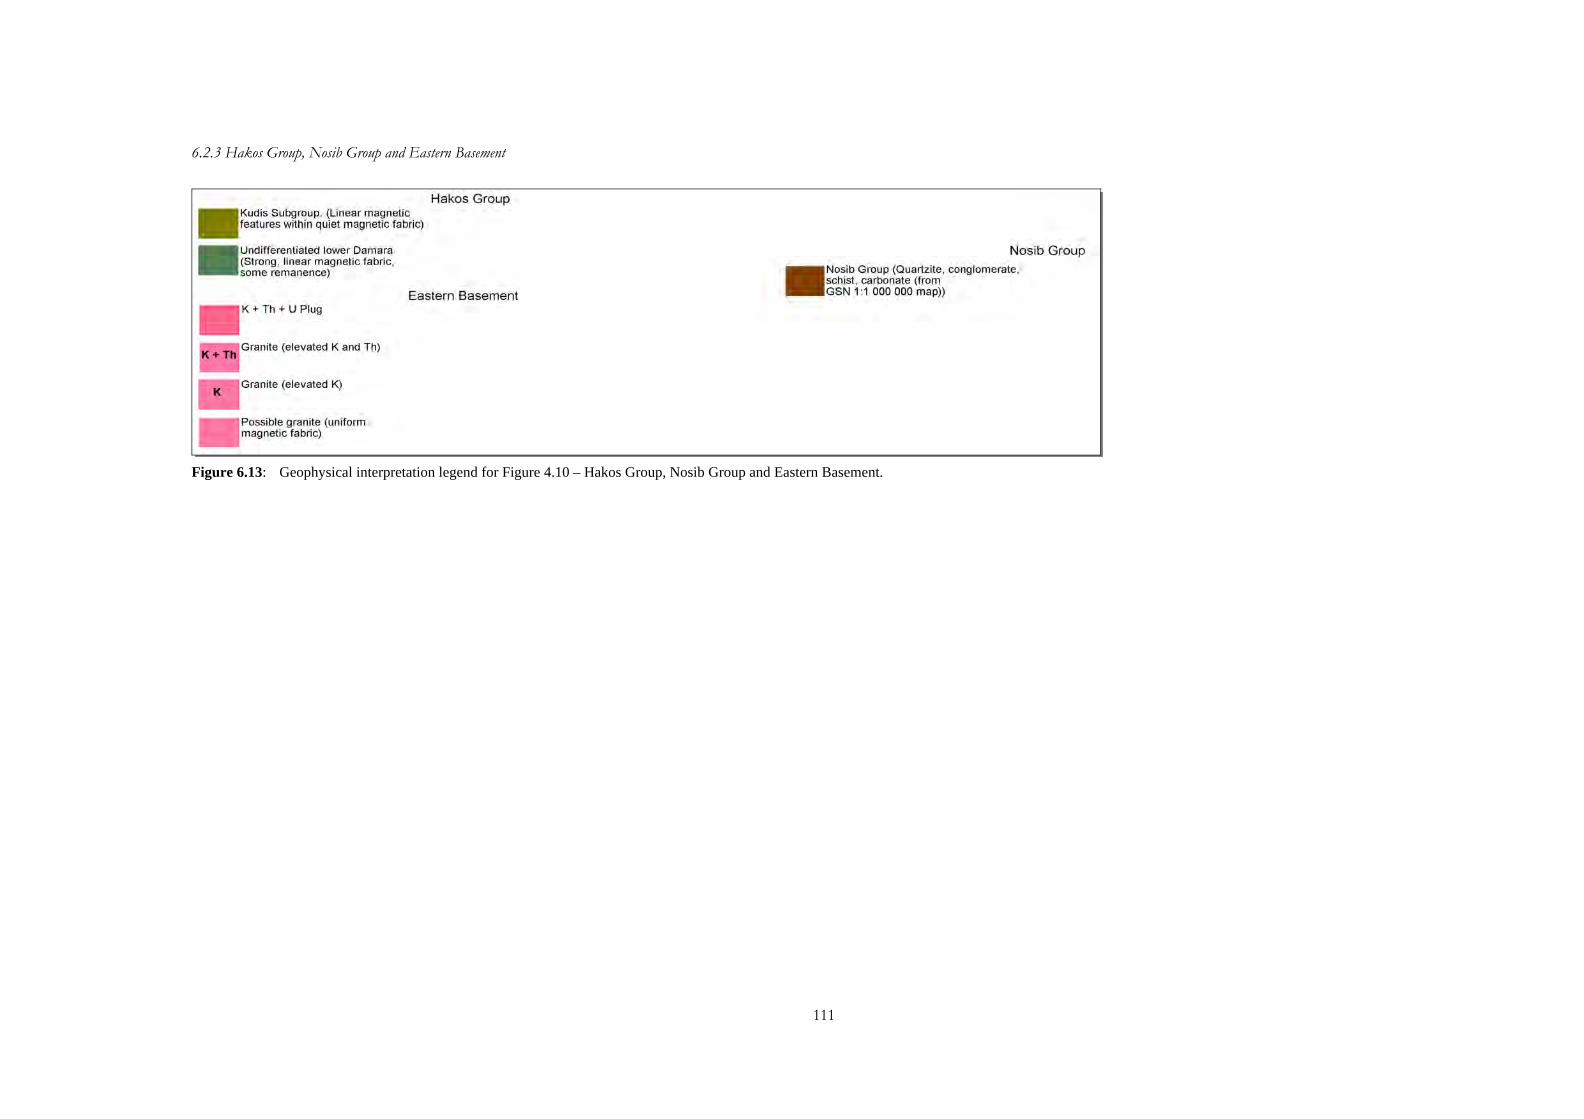
111
6.2.3 Hakos Group, Nosib Group and Eastern Basement
Figure 6.13: Geophysical interpretation legend for Figure 4.10 – Hakos Group, Nosib Group and Eastern Basement.
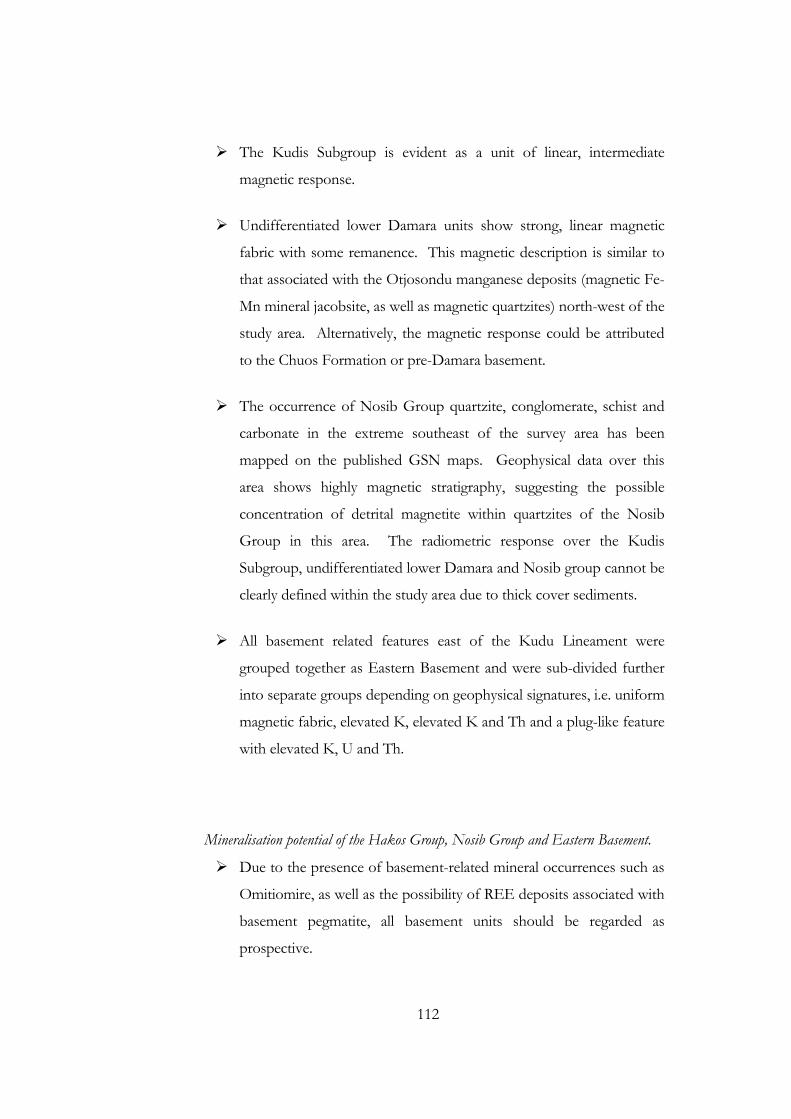
112
The Kudis Subgroup is evident as a unit of linear, intermediate
magnetic response.
Undifferentiated lower Damara units show strong, linear magnetic
fabric with some remanence. This magnetic description is similar to
that associated with the Otjosondu manganese deposits (magnetic Fe-
Mn mineral jacobsite, as well as magnetic quartzites) north-west of the
study area. Alternatively, the magnetic response could be attributed
to the Chuos Formation or pre-Damara basement.
The occurrence of Nosib Group quartzite, conglomerate, schist and
carbonate in the extreme southeast of the survey area has been
mapped on the published GSN maps. Geophysical data over this
area shows highly magnetic stratigraphy, suggesting the possible
concentration of detrital magnetite within quartzites of the Nosib
Group in this area. The radiometric response over the Kudis
Subgroup, undifferentiated lower Damara and Nosib group cannot be
clearly defined within the study area due to thick cover sediments.
All basement related features east of the Kudu Lineament were
grouped together as Eastern Basement and were sub-divided further
into separate groups depending on geophysical signatures, i.e. uniform
magnetic fabric, elevated K, elevated K and Th and a plug-like feature
with elevated K, U and Th.
Mineralisation potential of the Hakos Group, Nosib Group and Eastern Basement.
Due to the presence of basement-related mineral occurrences such as
Omitiomire, as well as the possibility of REE deposits associated with
basement pegmatite, all basement units should be regarded as
prospective.
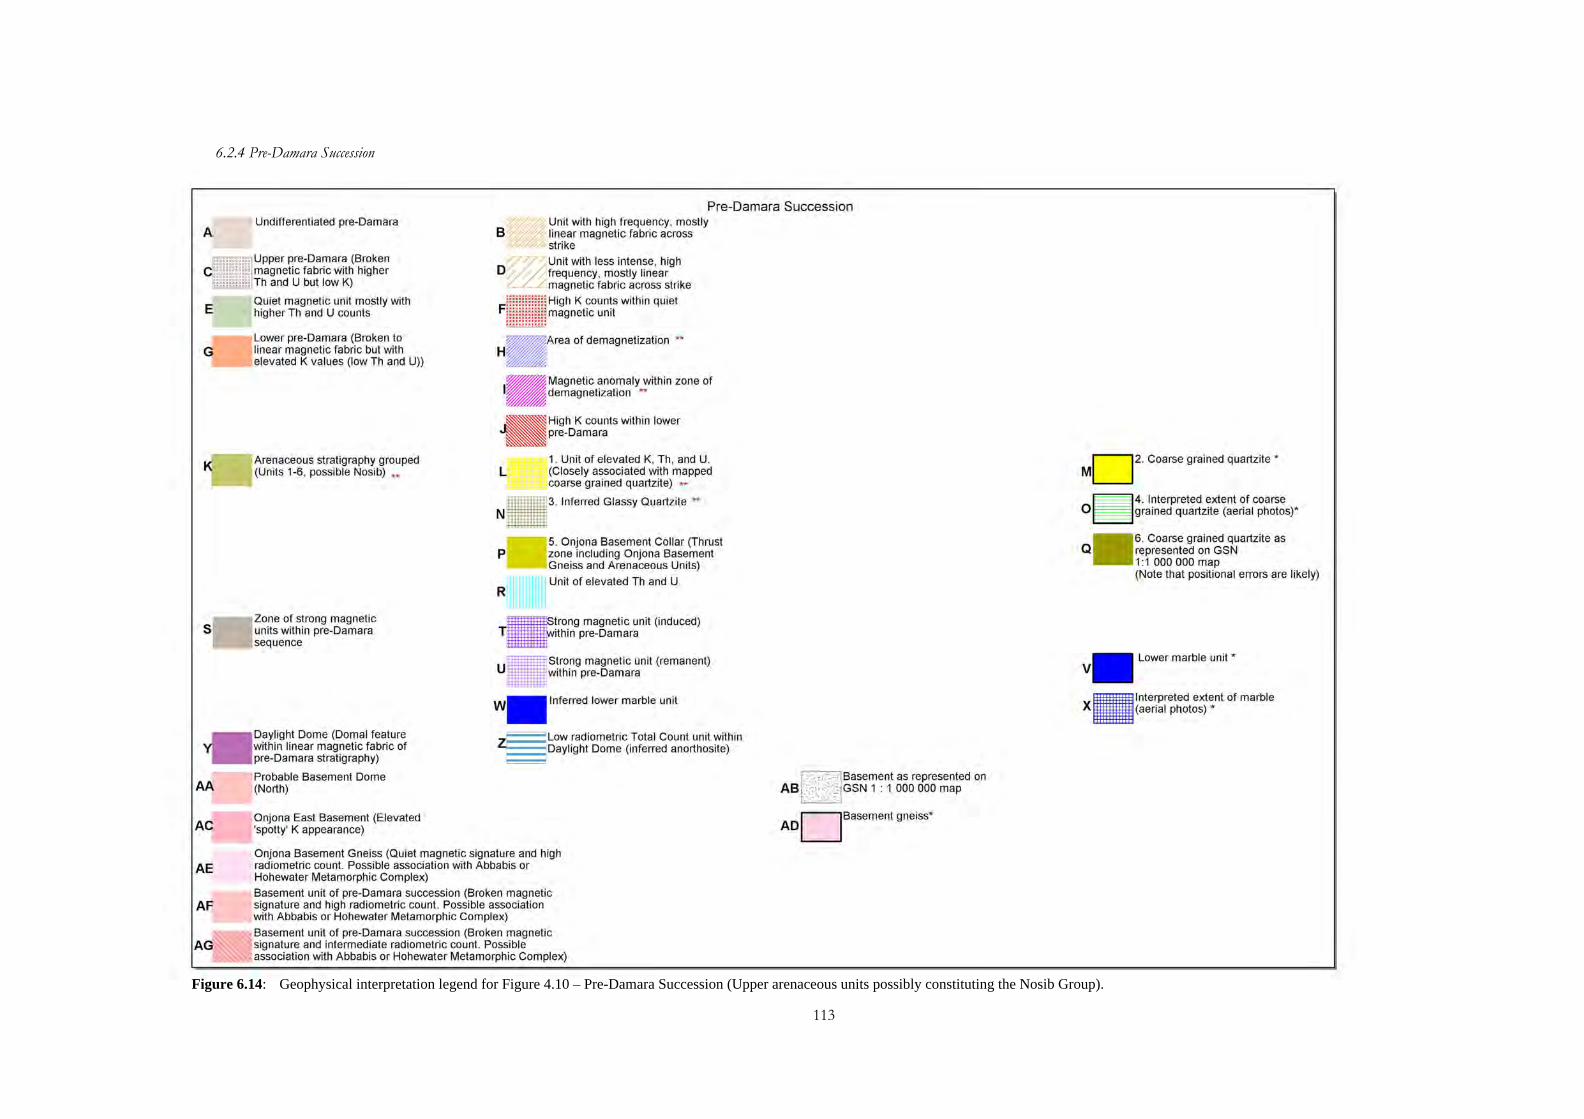
113
6.2.4 Pre-Damara Succession
Figure 6.14: Geophysical interpretation legend for Figure 4.10 – Pre-Damara Succession (Upper arenaceous units possibly constituting the Nosib Group).
A Undifferentiated pre-Damara
B
Pre-Damara Succession Unit with high frequency , mostly linear magnetic fabric across strike
9::::::::::::1 Upper pre-Damara (Broken mmmm magnetic fabric with higher mmmm Th and U but low K) ~
Unit with less intense, high D~ / / frequency , mostly linear
magnetic fabric across strike
E Quiet magnetic unit mostly with higher Th and U counts
F[~~fff~m~~1 High K counts within quiet m~~m~~~ magnetic unit
5
.-----,Lower pre-Damara (Broken to linear magnetic fabric but with
L.-_ .... elevated K values (low Th and U»
Arenaceous stratigraphy grouped (Units 1-6, possible Nosib) **
Zone of strong magnetic units within pre-Damara
'--_---' sequence
Daylight Dome (Domal feature within linear magnetic fabric of pre-Damara stratigraphy)
L
of demagnetization **
Magnetic anomaly within zone of demagnetization **
High K counts within lower pre-Damara
1. Unit of elevated K, Th , and U. (Closely associated with mapped coarse grained quartzite) **
N11113. Inferred Glassy Quartzite **
5. Onjona Basement Collar (Thrust P zone including Onjona Basement
'--_---' Gneiss and Arenaceous Units)
Unit of elevated Th and U R
T'III~~;~in~lg magnetic unit (induced) pre-Damara
UIIIII ~~I~~i~~g magnetic unit (remanent) pre-Damara
Inferred lower marble unit
Z~Low radiometric Total Count unit within ~DaYlight Dome (inferred anorthosite)
AA Probable Basement Dome (North)
AC
AE
AF
Onjona East Basement (Elevated 'spotty' K appearance)
Onjona Basement Gneiss (Quiet magnetic signature and high radiometric count. Possible association with Abbabis or Hohewater Metamorphic Complex) Basement unit of pre-Damara succession (Broken magnetic signature and high radiometric count. Possible association with Abbabis or Hohewater Metamorphic Complex)
.~~~Basement unit of pre-Damara succession (Broken magnetic signature and intermediate radiometric count. Possible association with Abbabis or Hohewater Metamorphic Complex)
~:;.~: . : ::;:.:~l Basement as represented on AB , ; ,~:.:,;,: ; GSN 1 . 1 000 000 map
D Basement gneiss* AD
MD2. Coarse grained quartzite *
~4. Interpreted extent of coarse O~ ___ grained quartzite (aerial photos)*
Q 6. Coarse grained quartzite as represented on GSN 1:1 000 000 map (Note that positional errors are likely)
Lower marble unit *
Interpreted extent of marble (aerial photos) *
114
Kasch (1986) has mapped various outcrops of coarse-grained, white quartzite,
white to pale blue marble and grey quartz-muscovite schist which at the time
he classified as part of the Onjona-Vrolikheid Fold Complex. The GSN
mapping shows a continuous quartzite unit which in part correlates with
Kasch’s mapping. This was, however, apparently derived by the GSN
primarily from interpretation of aerial photographs (Corner, pers. comm.,
2009) and positional errors are likely. Later work by Hoffmann (1989a)
described an arenaceous stratigraphy associated with the coarse grained
quartzite, drawing comparison to the pre-Damara Abbabis Metamorphic
Complex below this quartzite unit and the Duruchaus Formation of the
Nosib Group overlying it. From the radiometric data it is evident (elevated
K, U and Th) that this stratigraphy spans a large area northwest of the Kudu
Lineament, north of the EONC. To assist in the following description, units
in Figure 6.8 have been labelled A to AG. Ground truthing would be needed
to confirm or identify the associated lithologies and / or structures.
A: Undifferentiated pre-Damara. All of the units B to Z are grouped
together with units displaying no clearly identifiable magnetic /
radiometric response
B: Unit within with high frequency, mostly linear magnetic response.
Linear magnetic fabric evident within this unit is oblique to strike
direction suggested by radiometric data (Intermediate K, Th and U).
C: Unit with broken magnetic fabric and higher Th and U counts but
fairly low K counts. Inferred as an upper pre-Damara unit.
D: Unit of similar characteristics as B above but with less intense
magnetic amplitude.
E: Unit of quiet magnetic signature and elevated Th and U counts.
F: Anomalous K counts within unit E.
115
G: Unit of broken to linear magnetic fabric but with elevated K
values. Low in Th and U counts. Inferred as being a lower unit
within the pre-Damara succession.
H: Associated with a dyke (described in the section “features not
related to specific stratigraphy” above) is an area of demagnetisation
on the northern section of the farm Wildwasser. This
demagnetisation is most probably due to alteration of magnetic
minerals from hydrothermal activity associated with the intrusion of
the dyke, or in particular with its precursor fault zone. It is therefore
considered to be prospective.
I: Two isolated magnetic anomalies within H (possible relicts of
unaltered rock, or targets in their own right).
J: Within the G unit there are various zones of anomalous K counts.
Although it is not clear at this stage as to the cause of these K
anomalies they could possibly be associated with potassium-feldspar-
rich lithologies, indicative of either late-stage granites or basement.
Due to the lack of mapped outcrop the interpretation is equivocal, i.e.
basement or late-stage granite.
K: All of the arenaceous stratigraphy mapped geophysically and
geologically are grouped together as a single formational unit, i.e.
encompassing units L to Q. This formational package underlies the
Middle Kuiseb Formation in the west and may well be the eastern
Damaran equivalent of the Nosib Group subjected to high-grade
metamorphism. An alternate explanation is that it constitutes the
upper part of the pre-Damaran sequence, immediately underlying the
Damara. It is noted on the Fe-index created from Landsat data that
the inferred arenaceous stratigraphy corresponds to areas of generally
lower Fe-index values (lower Fe content) but textural features visible
116
within these zones suggest narrow (possibly repeating) lithologies of
variable Fe-content.
L: Unit of elevated K, U and Th as evident on radiometric images.
M: Coarse grained (‘glassy’) quartzite mapped by Kasch (1998)
(Corner, Kasch, pers. comm., 2009)
N: Inferred occurrences of glassy quartzite unit (Corner, Kasch, pers.
comm., 2009).
O: Interpreted extent of glassy quartzite from aerial photos (Corner,
Kasch, pers. comm., 2009)
P: Onjona Basement Collar, a zone bordering the basement unit on
the farm Onjona, which consists of thrust-repeated glassy quartzite
and basement (Corner, Kasch, pers. comm., 2009).
Q: Coarse-grained quartzite as represented on GSN 1:1,000,000 map.
Due to possible positional errors as discussed above and the lack of
geophysical evidence suggesting the actual continuation of this unit,
specifically in the area spanning the farms from Okajura to Geduld,
the complete unit was not included under K.
R: Unit of elevated Th and U counts.
S: Zone of strong magnetic anomalies encompassing units T and U.
North-northwest of the study area similar magnetic signatures are
associated with the Otjosondu manganese deposits.
T: Strong (induced) magnetic unit.
U: Strong (remanent) magnetic unit.
117
V: Marble unit mapped by Kasch during 2008 (Corner, pers. comm.,
2009). Referred to as the Lower Marble Unit as opposed to the
Upper Marble Unit evident in the Kuiseb Formation.
W: Lower Marble Unit inferred geophysically. It is believed that this
marble unit is closely associated with the glassy quartzite (M) (Corner,
pers. comm., 2009).
X: Continuation of V based on aerial photo interpretation (Corner,
Kasch, pers. comm., 2009).
Y: Distinct domal feature within linear magnetic fabric of pre-Damara
stratigraphy, referred to as the Daylight Dome after the farm on
which it is evident.
Z: Inferred anorthosite unit of very low radiometric total count within
the Daylight Dome.
AA: Two inferred basement units, one on the farm Hochfeld
characterised by linear magnetic fabric (possibly as a result of faulting)
and high K counts, and the other on the farms Cala and Hinza with a
more uniform magnetic fabric and no clear radiometric response due
to thick surficial sediments in the area.
AB: Basement units as represented on the GSN 1:1,000,000 map on
the farm Hinza. This unit seemingly cuts across various distinct
magnetic units and does not correlate with magnetic fabric, or strike
direction. It is therefore assumed that positional errors may exist in
the GSN mapping or the possibility that the GSN mapping grouped
together granitic borehole intersections.
AC: Onjona East Basement. Unit showing elevated K counts with a
spotty appearance.
118
AD: Basement gneiss as mapped by Kasch (1998) (Corner, pers.
comm., 2009).
AE to AG: Basement units associated with the Abbabis Metamorphic
Complex (Hoffmann, 1989b). Separated on the bases of distinct
magnetic fabric and radiometric response.
Mineralisation potential of the Pre-Damara Succession (Upper zone possibly constituting
the Nosib Group).
The arenaceous stratigraphy (K above) hosts various known
occurrences of copper mineralisation e.g. on the farms Vrolikheid (Cu
in amphibole and quartzo-feldspathic gneiss, biotite schist and
kyanite-bearing quartz-biotite schist) and Waaihoek (Cu in calc-silicate
rock and plagioclase-amphibole schist) (Schneider and Seeger, 1992).
The evaporitic sediments of the Duruchaus Formation are known to
contain disseminated Cu as well as tin and possibly gold (Miller,
1983b).
Units with strong magnetic content (some remanent) are similar to
the Otjosondu manganese deposits further to the north-northwest. A
siliceous, ferruginous manganese ore horizon has also been identified
on the farms Hochfeld and Eahero (Schneider, 1992).
Basement features within the pre-Damara succession should be
investigated for potential Omitiomire-style deposits.
In particular the dome on the farm Hochfeld (magnetic, K-rich and
collared by an arenaceous sequence) has two possible scenarios: 1) If
it is basement, then Omitiomire-style occurrences are of interest, or 2)
if it is a K-rich granite, the Hochfeld dome has a potentially similar
119
setting to known mineral occurrences of the Zambian Copperbelt -
i.e. granite stocks/domes collared by arenaceous stratigraphy.
The K-rich units (J), though not clearly interpreted as basement
features, have a similar radiometric response to the Hochfeld dome
and should therefore also be included for follow-up exploration with
possible basement-type (Omitiomire- or Copperbelt style) scenarios
as mentioned above.
The zone of demagnetisation (H) is prospective for occurrences
associated with hydrothermal processes. The two isolated magnetic
anomalies (I) may be targets in their own right, as mentioned above.
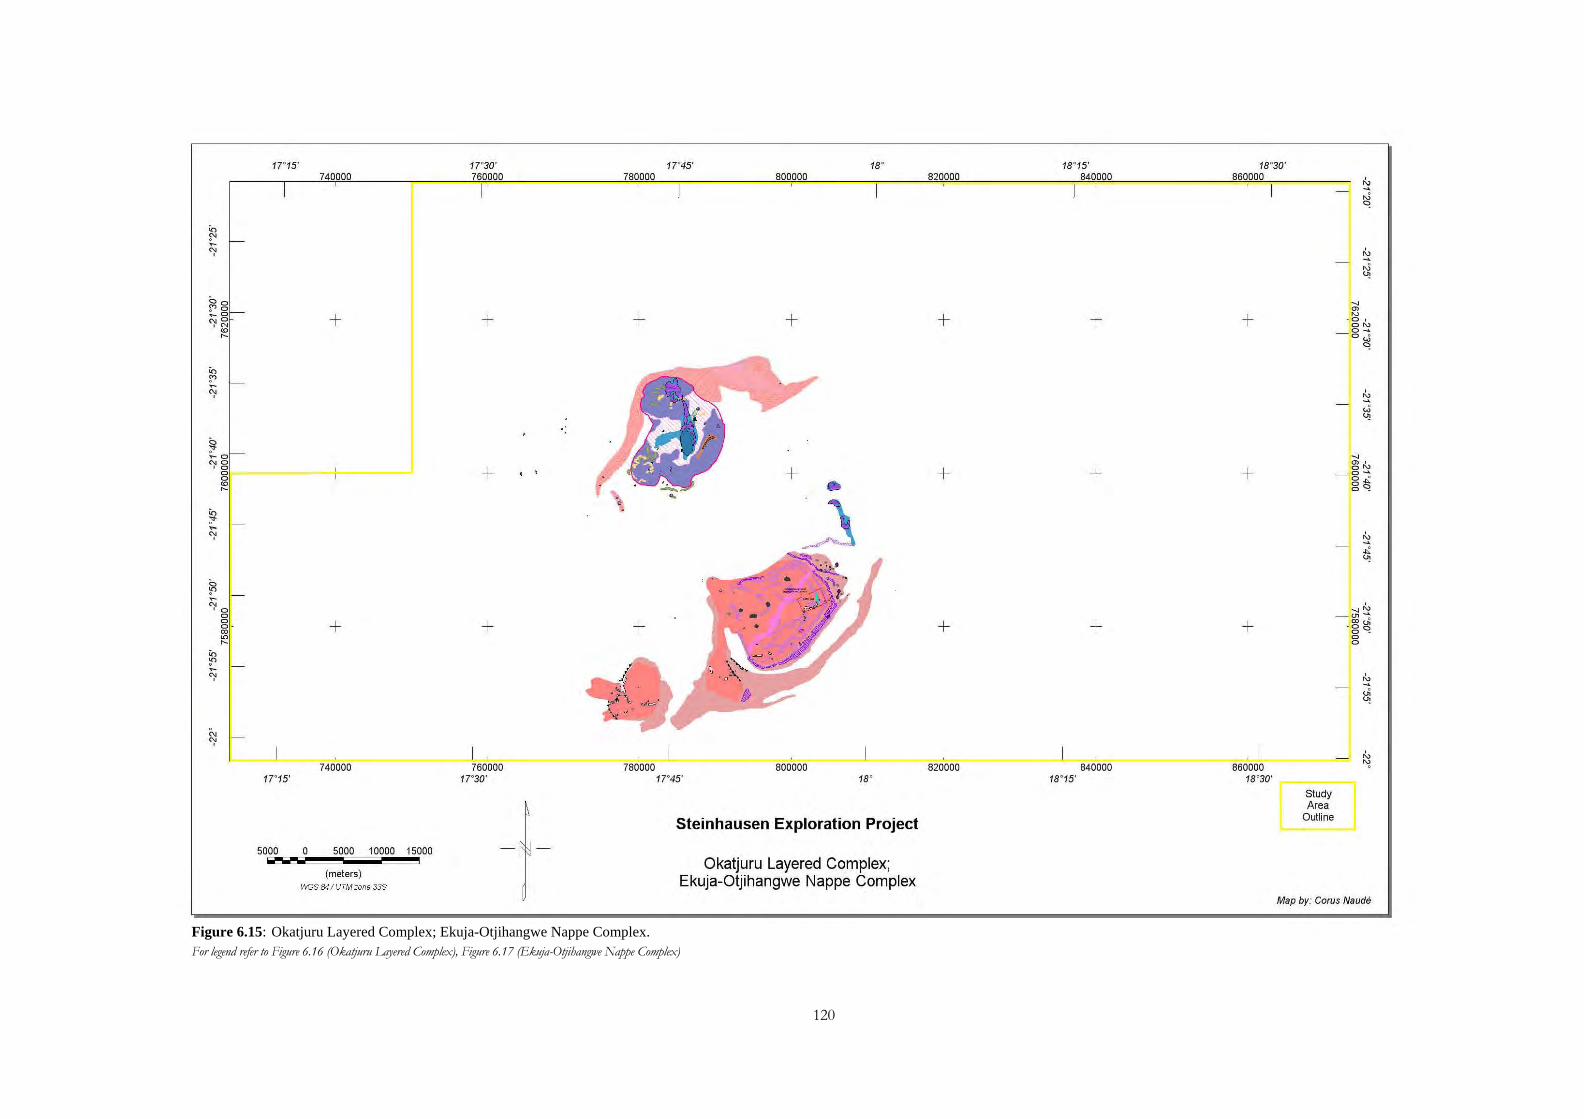
120
Figure 6.15: Okatjuru Layered Complex; Ekuja-Otjihangwe Nappe Complex. For legend refer to Figure 6.16 (Okatjuru Layered Complex), Figure 6.17 (Ekuja-Otjihangwe Nappe Complex)
17"15' 17"30' 17"45' 18° 18°15' 18°30' 740000 760000 780000 800000 820000 840000 860000
~ I I ,J ">
Co ~ -~ ~
,J
'" 0 0 ~ ~o m _0 + + + + + + + ~ ,,0 ~ O ,
, N 0'" ~ 0_ ~ Ow
">
Co ~ -~ ~
w
'" . 0 :> _0 ~ NO m' , 0 + + + + + 0'" 0 ------' 0 ......
0 0 ° ~ .. 0"" ~ 0">
Co
~ :> -~ ~ ..: '"
0 ~ -" ~'" '0 0 ~~-0 + + + + + -g: g o ~
00 o ~ ~ 0 ~ 0
Co ~ -~ ~
U;
'" '" ~
I., 740000 760000 780000 800000 820000 840000 860000 ~
17"15' 17"30' 17"45' 18° 18°15' 18°30'
Study Area
Steinhausen Exploration Project Outline
5000 0 5000 10000 15000 IOiOI Okatjuru Layered Complex;
(meters) Ekuja-Otjihangwe Nappe Complex ItYGS &4 1 UTM zone 33S
Map by: Corus Naude
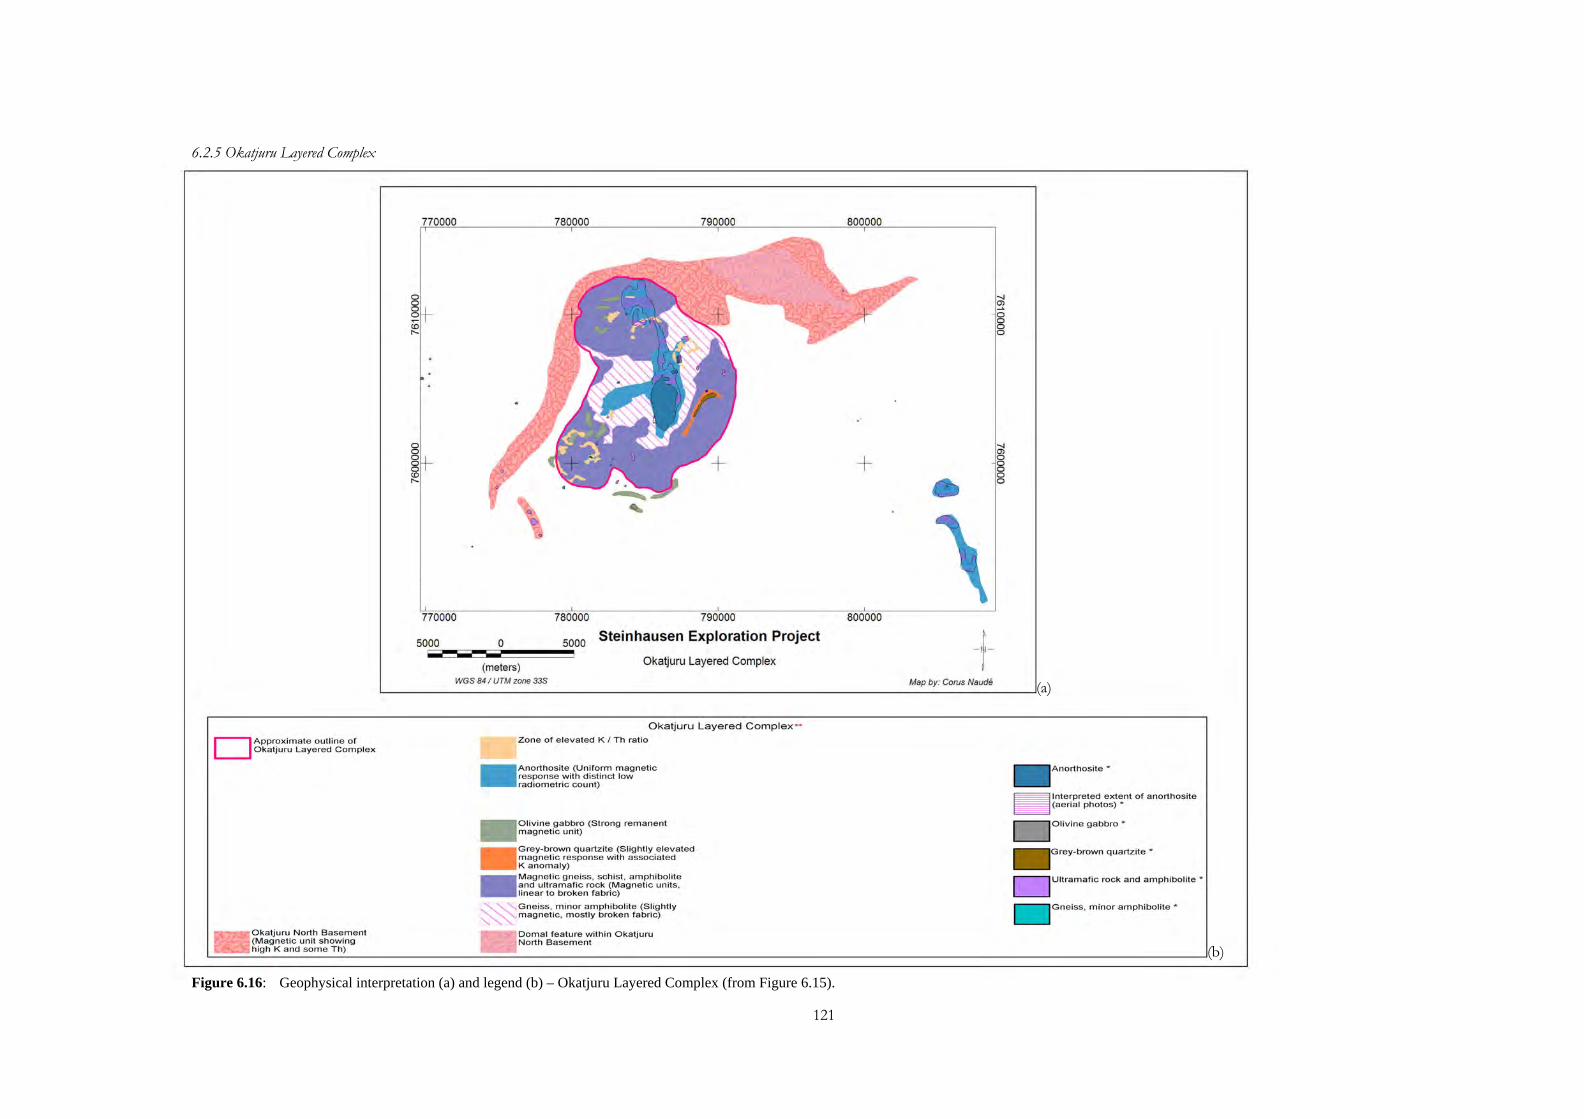
121
6.2.5 Okatjuru Layered Complex
(a)
(b)
Figure 6.16: Geophysical interpretation (a) and legend (b) – Okatjuru Layered Complex (from Figure 6.15).
DAPproXimate outline of Okaljuru Layered Complex
Okatjuru North Basement (Magnetic unit showing high K and some Th)
o o o o CD ......
o o o o o CD ......
770000
770000 780000
5000 o 5000
790000
Steinhausen Exploration Project -----(meters) Okatjuru Layered Complex
WGS 84 / UTM zone 33S
Okatjuru Layered Complex " Zone of elevated KITh ratio
_ Anorthosite (Uniform magnetic response with distinct low radiometric count)
_ Olivine gabbro (Strong remanent magnetic unit)
_ Grey-brown quartzite (Slightly elevated magnetic response with associated K anomaly)
_ Magnetic gneiss, schist, amphibolite and ultramafic rock (Magnetic units, linear to broken fabric)
,""",-"""'-"jGneiss, minor amphibolite (Slightly ~magnetic, mostly broken fabric)
_ Domal feature within Okatjuru North Basement
800000
-j-Map by : Corus Naude
-..,J
~ o o o o
-..,J (j) o o o o o
_ Anorthosite *
l1li1 nterpreted extent of anorthosite (aerial photos) *
DOliVine gabbro •
_ GreY-brown quartzite'
DUltramafic rock and amphibolite '
DGneiSS, minor amphibolite'
122
The Okatjuru Layered Complex (OLC, Kasch, 1998) is situated in the central-
western part of the study area forming a north-northeast-trending anomalous
elliptical feature with a major axis of approximately 15 km and a minor axis of
11 km. The OLC is clearly visible on the radiometric images as a lower
radiometric count rate than the surrounding stratigraphy.
The anorthosite has a very uniform magnetic fabric and very low
radiometric count rate.
The olivine gabbro has a strong remanent magnetic signature.
The grey brown quartzite has a high K signature and is high in Fe
content relative to surrounding lithologies as evident from the Fe-
index created from Landsat data.
Magnetic gneiss, schist, amphibole and ultramafic rock which have
been intersected by drilling in previous exploration programs, are
observed as strong magnetic units with a linear to broken fabric.
Areas mapped as gneiss with minor amphibolite have a slight
magnetic response with broken magnetic fabric.
Mineralisation potential of the Okatjuru Layered Complex.
Cu occurrences in amphibolite hosted in a succession of magnetic
gneiss, schist and ultramafic rocks have been identified on the farms
Oorlogsdeel and Ombakatjowinde (Schneider and Seeger, 1992).
Other mineral occurrences that may be associated with layered
ultramafic complexes include chromite, magnetite, ilmenite, nickel
and the platinum group elements.
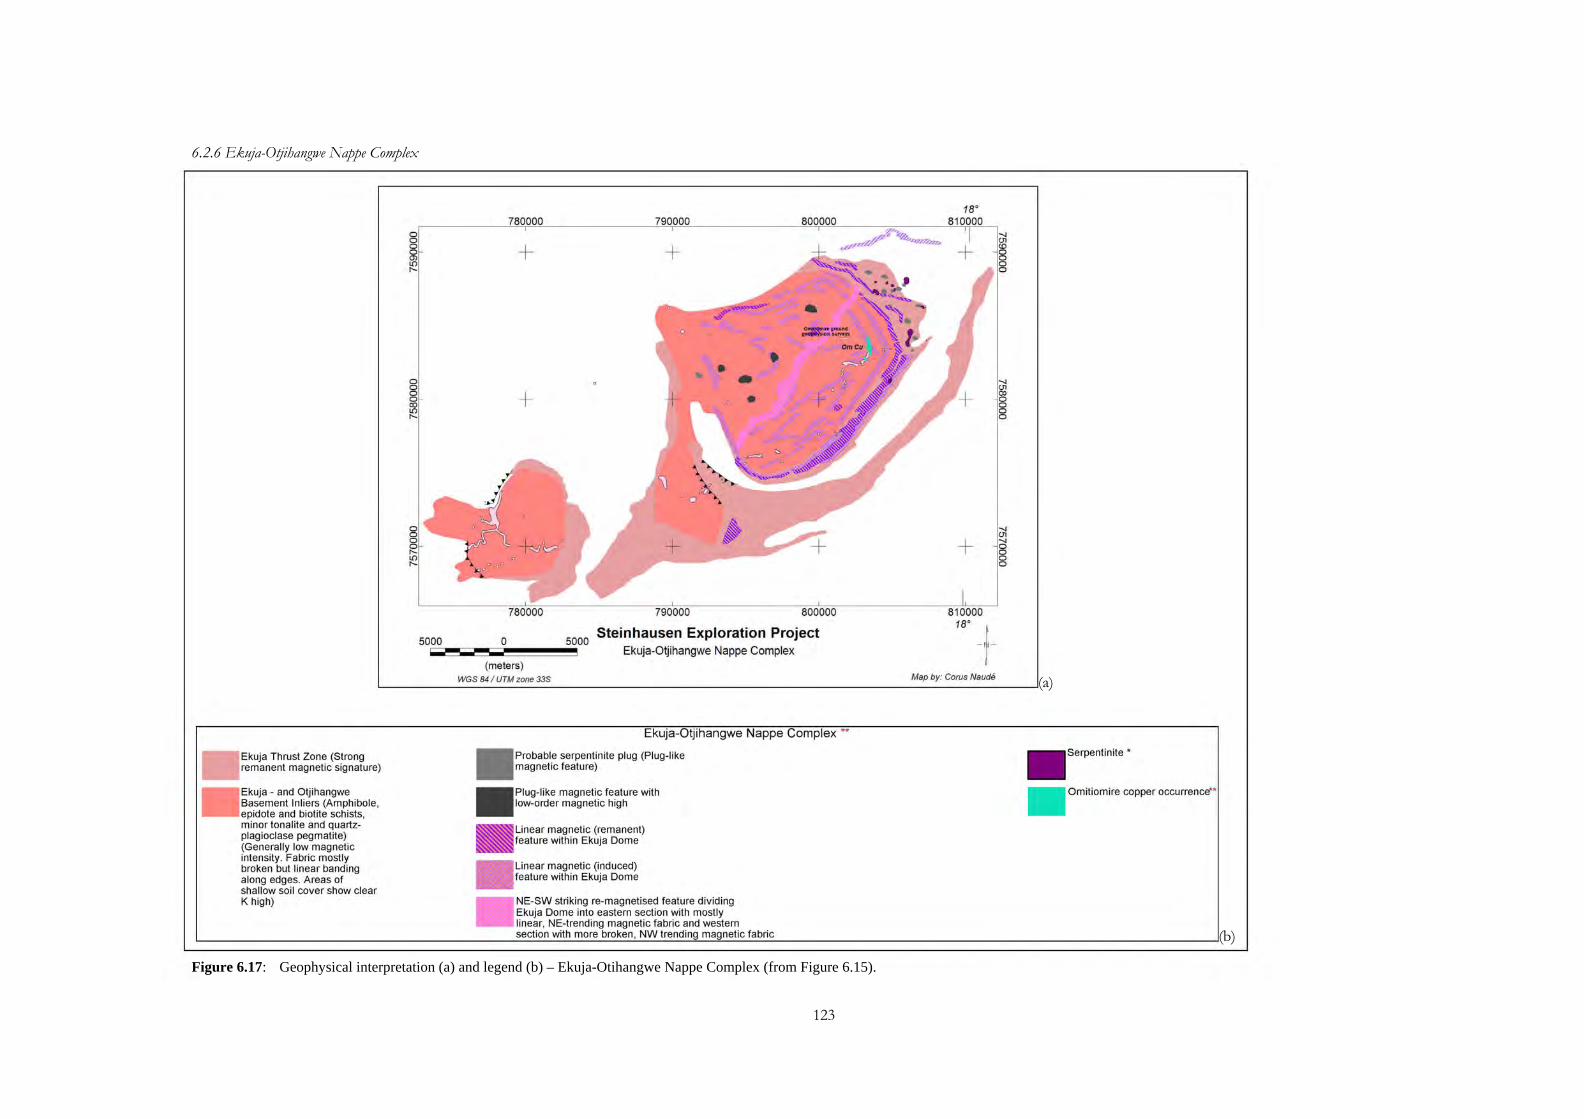
123
6.2.6 Ekuja-Otjihangwe Nappe Complex
(a)
(b)
Figure 6.17: Geophysical interpretation (a) and legend (b) – Ekuja-Otihangwe Nappe Complex (from Figure 6.15).
Ekuja Thrust Zone (Strong remanent magnetic signature)
Ekuja - and Otjihangwe Basement Inliers (Amphibole, epidote and biotite schists, minor tonalite and quartzplagioclase pegmatite) (Generally low magnetic intensity. Fabric mostly broken but linear banding along edges. Areas of shallow soil cover show clear K high)
0 0 0 0 (j) L{) f'..
0 0 0 0 00 L{) f'..
780000
+
+
5000 a '-----(meters)
WGS 84 / UTM zone 33S
790000 800000
+
-• • -• +
790000 800000
5000 Steinhausen Exploration Project Ekuja-Otjihangwe Nappe Complex
~~
18° 810000
+
+
810000 18°
+ Map by: COTUS Naude
Ekuja-Otjihangwe Nappe Complex **
Probable serpentinite plug (Plug-like magnetic feature)
Plug-like magnetic feature with low-order magnetic high
Linear magnetic (remanent) feature within Ekuja Dome
Linear magnetic (induced) feature within Ekuja Dome
NE-SW striking re-magnetised feature dividing Ekuja Dome into eastern section with mostly linear, NE-trending magnetic fabric and western section with more broken, NW trending magnetic fabric
-....J CJl co 0 0 0 0
-....J CJl -....J o o o o
Serpentinite *
Omitiomire copper occurrence**
124
The magnetic response of the Ekuja Basement Inlier (Ekuja Dome),
as mapped by the GSN and Kasch (1986), has a typically rough,
broken fabric that is occasionally concentric closer to the inlier
margins. From the radiometric images it is clear that the inlier has
elevated K values with respect to the surrounding rocks.
The Ekuja Thrust Zone, evidenced by Craton in a number of
boreholes (Corner, pers. comm., 2009) is a strong remanent magnetic
feature flanking the eastern and southern limits of the Ekuja and
Otjihangwe basement inliers. The remanent magnetic properties are
owed to magnetite concentrations, evident in the boreholes, along
thrust boundaries of the basement inliers.
Within the basement inlier there are a few plug-like magnetic features.
These were further sub-divided into possible serpentinite plugs and
other low-order magnetic features.
Within the Ekuja basement inlier, several linear magnetic features
have been mapped, as well as a central, north-east trending re-
magnetised zone. This re-magnetised zone also divides the basement
inlier into a south-eastern zone showing magnetic features generally
concentric to the dome margin, and a north-western zone having a
more broken magnetic fabric.
Within the Ekuja Thrust Zone, plug-like features were identified as
serpentinite plugs (or phonolites). These correlate well with
serpentinite outcrops mapped by Kasch (1986).
125
Mineralisation potential of the Ekuja-Otihangwe Nappe Complex.
Within the EONC, the copper occurrences at Omitiomire and Barreshagen
have been well documented and are the focus of current, ongoing exploration
by Craton. Regional geochemical exploration over the EONC by Craton has
identified numerous copper in soil anomalies across the entire area (IBML,
2009), suggesting good potential for future discoveries of Omitiomire-style
deposits.
6.3 Discussion
Through the synergistic evaluation of GSN-acquired airborne geophysical
data, available geological information and satellite imagery some important
geological features relating to the lithology and structural context of the soil-
covered area around Steinhausen, Namibia, could be brought to light. Figure
6.18 is a summary of the geophysical interpretation, to which the observations
below refer.
The Kuiseb Formation within the study area shows uncharacteristically varied
magnetic signatures, and can be subdivided into 5 units as follows:
Upper-2 Kuiseb Formation: low amplitude, linear magnetic fabric.
Upper-1 Kuiseb Formation: quiet magnetic signature.
Middle Kuiseb Formation: intermediate magnetic response.
Characterised by an upper marble unit and a strongly magnetic basal
amphibolite unit.
Lower-2 Kuiseb Formation: very quiet, uniform magnetic signature.
126
Lower-1 Kuiseb Formation: very strong, linear magnetic fabric, often
remanent. Contains gabbro and highly magnetic epidosite as
observed further west at Onganja Mine.
This subdivision of the Kuiseb Formation will aid future exploration work as
Matchless-style massive sulphides are associated with the Middle Kuiseb
Formation and Onganja-style copper is associated with the Lower-1 Kuiseb
Formation.
The Rodenbeck Intrusion, intruded into pre-Damara basement, is a kidney-
shaped, probably mafic or ultramafic body of between 3 and 5 km in
diameter, showing internal structure evident of layering or differentiation, and
is a likely host to magmatic Ni-Cu deposits.
The Kudu shear zone is characterised by cross-cutting magnetic fabric that
also suggests intense brittle deformation thus providing ample late-, or post-
tectonic secondary porosity for fluid movement and potential for
hydrothermal mineral deposits.
The enigmatic Steinhausen Anomaly, a clear regional magnetic low, is
interpreted to be a large, deep area of demagnetisation that may be indicative
of abundant hydrothermal fluid and therefore a possible control on
mineralisation in the area.
The arenaceous stratigraphy forms an important stratigraphical marker
between pre-Damara basement and the Damaran Kuiseb Formation,
including a characteristic glassy quartzite.
A structurally complex zone situated between the Okahandja Lineament and
the Kudu Lineament east of the Ekuja Dome is inferred as uplifted pre-
Damara stratigraphy. Within pre-Damaran stratigraphy areas with elevated
potassium counts could be mapped. These areas also fall within a zone of
slight linear magnetic fabric suggesting either an antiformal or synformal
127
structural regime. The high potassium values indicate the possibility that
these units may contain high amounts of potassium feldspar and may be
granitic in composition.
The Okatjuru Layered Complex could clearly be mapped from radiometric
and magnetic data. The extent of this complex is in the order of 15 km by 11
km. Apart from hosting known copper in soil anomalies, the possibility exists
for the discovery of other minerals associated with layered ultramafic
complexes which include chromite, magnetite, ilmenite, nickel, copper and
the platinum group elements
The outline of the Ekuja Dome, host to the Omitiomire copper deposit, is
clearly defined by the magnetic data. Cutting across the Ekuja Dome, the E-
W Structural Zone (which contains an array of ENE trending structures) is
likely to be a controlling factor in copper mineralisation at Omitiomire.
Other zones of similar magnetic fabric to the Ekuja Dome are also identified
within the same E-W Structural Zone and they are high-priority targets. The
domal structural features not in the ENE structural zone are grouped into a
single layer, second-priority targets comprising both domes and anticlines.
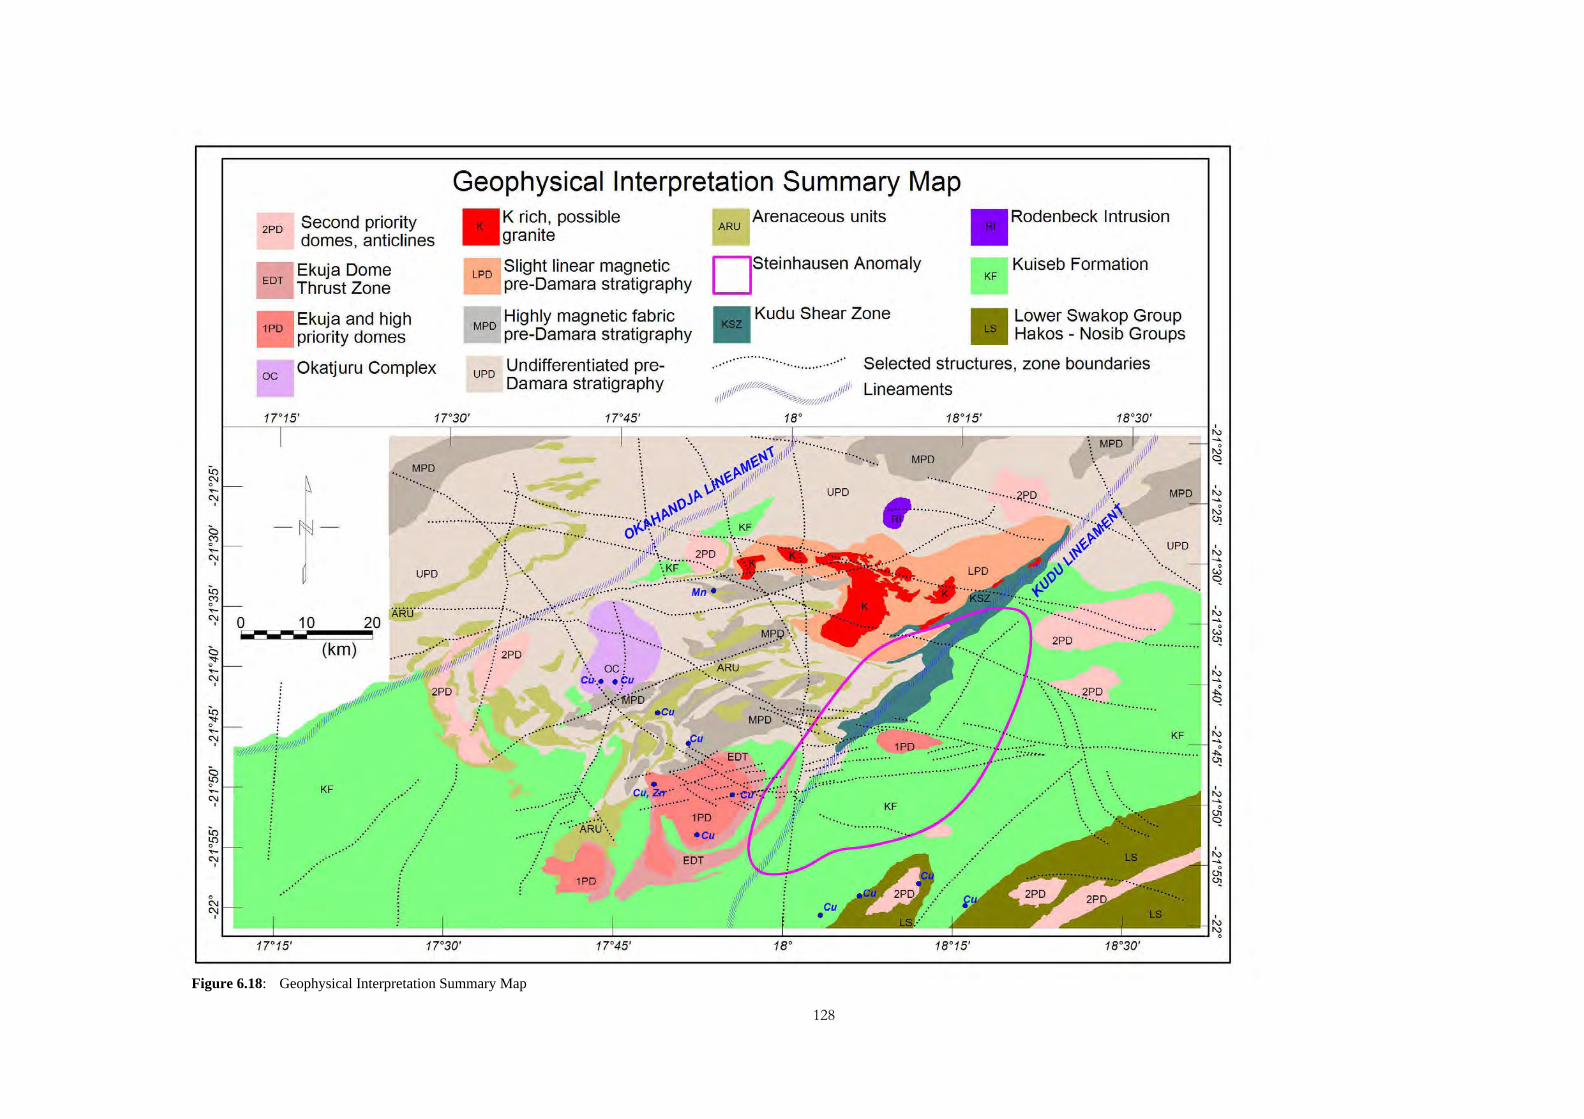
128
Figure 6.18: Geophysical Interpretation Summary Map
2PD
L...----I
.' .. '
17"15'
Geophysical Interpretation Summary Map Second priority domes, anticlines
Ekuja Dome Thrust Zone
Ekuja and high priority domes
Okatjuru Complex
.. '
20
(km)
KF
.. ' ......
.. '
..................
.. '
17"30'
K rich, possible granite
ARU Arenaceous units Rodenbeck Intrusion
Slight linear magnetic I....-..... pre-Damara stratigraphy
Highly magnetic fabric MPD pre-Damara stratigraphy
D Steinhausen Anomaly
Kudu Shear Zone
KF Kuiseb Formation
Lower Swakop Group Hakos - Nosib Groups
UPD .. ' .. ' Undifferentiated pre
Damara stratigraphy IIIII///P~ lilli' III ~ (II II! ~//////I
KF
: ..... . '"
..' ..... '" ...... : ....... .
'" .. ' .. ' ..... oc ! ..... ";:.::: .. ARU Cu· •• Cu ..... . ...... .
····::/~PD .... .... . :.... .Cu
. : .... MPD
". Ou ...... ~ ....
"'1\:"': .. EDT . :: ::":'"'
""'. C~,.~~ ::.":·:·:::.~>;:::-·.· ;.;.. ,v.''';',:::
...... :~>.::.:.:::':~::~....... :~u EDT
1PD
17"45'
UPD
Selected structures, zone boundaries
'"
Lineaments
'" MPD
...... 0 • .. ....... 2.PD II
.. .. ....... ::::::::,.::<... .. ...... · .. ····· 1.: f ··· .. ...... ........... 111 ~"l-#- ...... ....
............ v~ ....... .
. .... ... ....
'"
'" '" '"
. .... ~~~ ....
'"
'" '"
.........
.........................
KF
".

129
130
C h a p t e r 7
CONCLUSIONS
Structural features evidenced by this study are as follow:
Uplifted stratigraphy, possibly pre-Damara, is present between the
Okahandja Lineament and the Kudu Lineament.
The Kudu shear zone, coincident to the KL, is an area of intense
brittle deformation likely to host hydrothermal mineral deposits.
The E-W Structural Zone that cuts across the Ekuja Dome is a
possible control to copper mineralisation at Omitiomire.
Important lithological insights are:
The Kuiseb Formation within the study area is subdivided into 5
units of Lower-1, 2 to Upper-1, 2 parts, showing distinct magnetic
features and properties.
An arenaceous unit, containing a distinct glassy quartzite, underlies
the Kuiseb Formation.
The extent of the Ekuja Dome is evident from the magnetic data.
The Okatjuru Layered Complex, hosting known copper soil
anomalies, has the potential of discovery of other minerals in
association with the layered ultramafic complex, such as Cr,
magnetite, ilmenite, Ni, Cu and PGEs.
131
Some direct exploration targets are also identified through this study: They
are:
Singular magnetic anomalies (both induced and remanent) being
pipe-like or short strike 2D bodies.
The Rodenbeck Intrusion.
Zones of quiet magnetic fabric inferred as demagnetised zones, along
which fluids may have passed.
Linear magnetic units within quiet Kuiseb Formation possibly
associated with the Matchless Amphibolite Belt.
Anomalous uranium associated with drainage systems, plug-like
bodies and intra-stratigraphic units.

132
REFERENCES
133
Airo, M.L., 2002. Aeromagnetic and aeroradiometric response to hydrothermal alteration. Surveys in Geophysics 23, 273-302.
Anglogold Ashanti, 2010. Mineral resource and ore reserve report 2010. Accessed
from http://www.anglogold.co.za/subwebs/informationforinvestors/reports10/financials/files/AGA-resource-reserves-2010.pdf on 12/10/2011.
Bedell, R.L. and Crósta, A.P., 2009. Basic image processing. Reviews in
Economic Geology, 16, 237-256. Bishop, J.R. and Lewis, R.J.G., 1992. Geophysical signatures of Australian volcanic-
hosted massive sulfide deposits. Economic Geology, 87, 913 - 930. Breitkopf, J.H., 1988. Tectonic setting of the Matchless Belt pyritic copper deposits,
Namibia. Economic Geology, 83, 710 - 723. Bühn, B., Stanistreet, I. G. and Okrusch, M., 1992. Late Proterozoic outer shelf
manganese and iron ore deposits at Otjosondu (Namibia) related to the Damara oceanic opening. Economic Geology, 87, 1393 – 1411.
Burnett, R.J., 1992. Gold. The Mineral Resources of Namibia, 4.1, 1-48. Charles, P.C.A., 1987. Gold Fields Prospecting Co (Pty) Ltd. Matchless Amphibolite
Belt Project final report on grant M46/3/1313. Cooper, G.R.J. and Cowan, D.R., 2005. Differential reduction to the pole.
Computers and Geosciences, 31, 989-999. Cooper, G.R.J. and Cowan, D.R., 2006. Enhancing potential field data using filters
based on the local phase. Computers and Geosciences, 32, 1585-1591. Cooper, G.R.J. and Cowan, D.R., 2008. Edge enhancement of potential field data
using normalised statistics. Geophysics, 73 (3), H1-H4. Corner, B., 1983. An interpretation of the aeromagnetic data covering the western portion
of the Damara Orogenic Belt in S.W.A./Namibia. Spec. Publ. Geol. Soc. S.A., 11, 339-354.
Corner, B., 2000. Crustal framework of Namibia derived from magnetic and gravity
data. Communs. Geol. Surv. Namibia, 12, 13-19 (Henno Martin Special Volume).
Corner, B., 2006. Cheetah Minerals Exploration (PTY) Ltd. Exclusive prospecting
license 74, Steinhausen, final report.
134
Corner, B., 2008 (in press). Crustal framework of Namibia derived from an integrated interpretation of geophysical and geological data. In: Miller, R. McG. (Ed.) The Geology of Namibia, 1, 2-1 – 2-19. Geol. Surv. Namibia.
Corner, B., Sinclair, H. and Verran, D., 2009. A radon emanometry case study of
the Rössing South deposit, Namibia. 11th Biennial Technical Meeting and Exhibition, Swaziland, 16-18 September, 471-474.
Crósta, A.P. and De Souza Filho, C.R., 2009. Mineral exploration with Landsat
Thematic Mapper (TM) / Enhanced Thematic Mapper Plus (ETM+): A review of fundamentals, characteristics, data processing, and case studies. Reviews in Economic Geology, 16, 59-82.
Eckstrand, O. R. and Hulbert, L. J., 2007. Magmatic nickel-copper-platinum group
element deposits. Mineral deposits of Canada: a synthesis of major deposit-types, district metallogeny, the evolution of geological provinces, and exploration methods; Goodfellow, W D (ed.); Geological Association of Canada, Mineral Deposits Division, Special Publication no. 5, 205-222.
Fairhead, J.D. and Williams, S.E., 2006. Evaluating normalised magnetic derivatives
for structural mapping. SEG2006 New Orleans Extended Abstract. Farr, T. G., Rosen, P. A., Caro, E., Crippen, R., Duren, R., Hensley, S.,
Kobrick, M., Paller, M., Rodriguez, E., Roth, L., Seal, D., Shaffer, S., Shimada, J. and Umland, J., 2007. The Shuttle Radar Topography Mission. Rev. Geophys., 45, RG2004, doi:10.1029/2005RG000183. Accessed from http://www2.jpl.nasa.gov/srtm/SRTM_paper.pdf on 06/07/2010.
Ford, K., Keating, P. and Thomas, M. D., 2007. Overview of geophysical signatures
associated with Canadian ore deposits. Mineral deposits of Canada: a synthesis of major deposit-types, district metallogeny, the evolution of geological provinces, and exploration methods; Goodfellow, W D (ed.); Geological Association of Canada, Mineral Deposits Division, Special Publication no. 5, 939-970.
GETEC, 2010. Advanced processing and interpretation of gravity and magnetic data.
Accessed from http://www.getech.com/services/advanced_processing_and_interpretation.pdf on 18/11/2010.
Gunn, P. J. and Dentith, M. C., 1997. Magnetic responses associated with mineral
deposits. ASGO Journal of Australian Geology & Geophysics, 17(2), 145-158.
135
Hoffmann, K. H., 1989a. New aspects of lithostratigraphic subdivision and correlation of late Proterozoic to early Cambrian rocks of the southern Damara Belt and their correlation with the central and northern Damara Belt and the Gariep Belt. Communs Geol. Surv. Namibia, 5, 59-67.
Hoffmann, K. H., 1989b. Aspects of relative age, stratigraphic correlation and origin of
metaquartzites and associated Fe-Mn deposits of the Otjozondu Mine in the Eastern Okahandja District. Unpublished Geological Survey of Namibia Internal Report.
IBML, 2008. Geological factsheet on the Omitiomire Project. Accessed from
http://www.interbasemetals.com/docs/PDFs/Fact_Sheets_/2008/Omitiomire%20is%20IBML.pdf. on 10/12/2009.
IBML, 2009. International Base Metals Limited Annual Report 2009; Accessed
from http://www.interbasemetals.com/docs/PDFs/2009/Final%20Annual%20Report%202009WEB.pdf on 10/12/2009.
Kasch, K. W., 1986. Tectonic subdivision, lithostratigraphy and structural geology of the
Upper Black Nossob River Area. Communs Geol. Surv. S.W. Africa/Namibia, 2, 117-129.
Kasch, K. W., 1998. Hochfeld – EPL 2252 Interpreted Geology, Scale 1:100,000.
Mount Isa Mines Namibia (Pty.) Ltd., Drawing No. 0420. Klemd, R., Maiden, K. J., Okrusch, M. and Richter, P., 1989. Geochemistry of
the Matchless metamorphosed massive sulfide deposit, South West Africa / Namibia: Wall-rock alteration during submarine ore-forming processes. Economic Geology, 84, 603-617.
Li, X., 2006. Understanding 3-D analytic signal amplitude. Geophysics, 71 (2),
L13–L16. Lightfoot, P.C., 2007. Advances in Ni-Cu-PGE sulphide deposit models and
implications for exploration technologies. Proceedings of Exploration 07: Fifth Decennial International Conference on Mineral Exploration, Milkereit, B. (ed), 629-646.
MacLeod, I. N., Jones, K. and Dai, T. F., 1993. 3-D analytic signal in the
interpretation of total magnetic field data at low magnetic latitudes. Exploration Geophysics, 24, 679–687.
Miller, R. McG., 1983a. The Pan-African Damara Orogen of South West
Africa/Namibia. Spec. Publ. Geol. Soc. S. Afr., 11, 431-515.
136
Miller, R. McG., 1983b. Economic implications of plate tectonic models of the Damara Orogen. Spec. Publ. Geol. Soc. S. Afr., 11, 385-395.
Miller, R. McG., 1983c. Tectonic implications of the contrasting geochemistry of
Damaran mafic volcanic rocks, South West Africa/Namibia. Spec. Publ. Geol. Soc. S. Afr., 11, 115-138.
Miller, R. McG., 1992a. Mineral exploration targets in Namibia. The Mineral
Resources of Namibia, 1.1, 1-8. Miller, R. McG., 1992b. Stratigraphy. The Mineral Resources of Namibia, 1.2,
1-22. Miller, R. McG, Barnes, S. and Balkwill, G., 1983. Possible active margin deposits
within the southern Damara Orogen: The Kuiseb Formation between Okahandja and Windhoek. Spec. Publ. Geol. Soc. S. Afr., 11, 73-88.
Mindat.org, 2011. Navachab Gold Mine, Karibib District, Erongo Region, Namibia.
Accessed from http://www.mindat.org/loc-126645.html on 12/10/2011. Moore, J. M., 2010. Comparative study of the Onganja Copper Mine, Namibia: a link
between Neoproterozoic Mesothermal Cu (-Au) mineralization in Namibia and Zambia. South African Journal of Geology, 113 (4), 445-460.
Naldrett, A. J., 2010. From the mantle to the bank: The life of a Ni-Cu-(PGE)
sulphide deposit. South African Journal of Geology, 113, 1-32. Nash, J. T. and Granger, H. C., 1981. Geology and concepts of genisis of important
types of uranium deposits. Economic Geology 75th Anniversary Volume, 63 – 116.
Nicolet, J. P. and Erdi-Krausz, G., 2003. Guidelines for radiometric mapping using
gamma ray spectrometry data. International Atomic Energy Agency Technical Document 1363. ISBN 92-0-108303-3. ISSN 1011-4289.
Pirajno, F. and Jacob, R. E., 1991. Gold mineralisation in the intracontinental branch
of the Damara Orogen, Namibia: a preliminary survey. Journal of African Earth Science, 13 (3/4), 305-311.
Porada, H., 1985. Stratigraphy and facies in the upper Proterozoic Damara Orogen,
Namibia, based on a geodynamic model. Precambrian Research, 29, 235-264. Richards, J. R., 2000. Lineaments revisited. SEG Newsletter, 42. Roesener, H. and Schreuder, C.P., 1992. Cobalt and Nickel. The Mineral
Resources of Namibia, 2.2, 1-7.
137
Roesener, H. and Schreuder, C.P., 1992b. Uranium. The Mineral Resources
of Namibia, 7.1, 1-62. Robb, L.J., 2005. Introduction to ore-forming processes. Blackwell Publishing. 373p. Schneider, G.I.C., 1992. Manganese. The Mineral Resources of Namibia, 2.6,
1-11. Schneider, G.I.C. and Seeger, K.G., 1992. Copper. The Mineral Resources of
Namibia, 2.3, 1-172. Steven, N., Armstrong, R., Smalley, T. and Moore, J., 2000. First geological
description of a late Proterozoic (Kibaran) metabasaltic andesite-hosted chalcosite deposit at Omitiomire, Namibia. Geology and Ore Deposits 2000: the Great Basin and Beyond Proceedings Volume II, 711-734.
Verduzco, B., Fairhead, j. D. and MacKenzie, C., 2004. New insights into
magnetic derivatives for structural mapping. The Leading Edge, 116 -119.
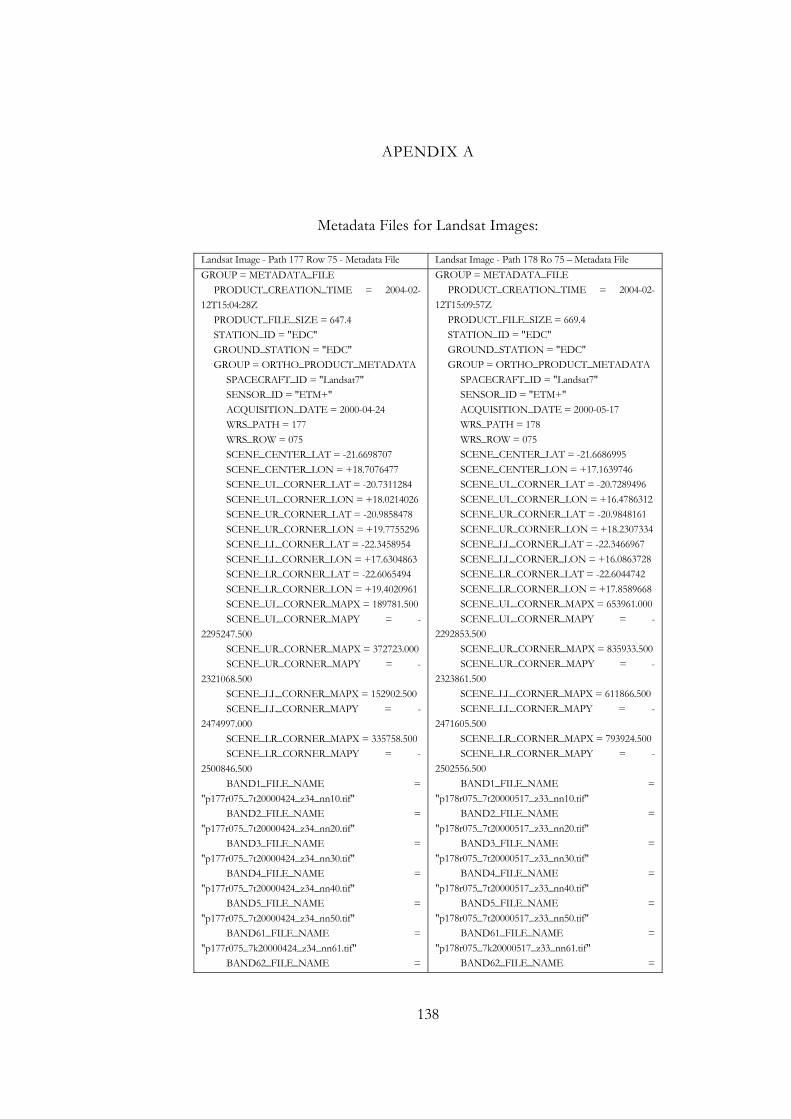
138
APENDIX A
Metadata Files for Landsat Images:
Landsat Image - Path 177 Row 75 - Metadata File Landsat Image - Path 178 Ro 75 – Metadata File
GROUP = METADATA_FILE
PRODUCT_CREATION_TIME = 2004-02-
12T15:04:28Z
PRODUCT_FILE_SIZE = 647.4
STATION_ID = "EDC"
GROUND_STATION = "EDC"
GROUP = ORTHO_PRODUCT_METADATA
SPACECRAFT_ID = "Landsat7"
SENSOR_ID = "ETM+"
ACQUISITION_DATE = 2000-04-24
WRS_PATH = 177
WRS_ROW = 075
SCENE_CENTER_LAT = -21.6698707
SCENE_CENTER_LON = +18.7076477
SCENE_UL_CORNER_LAT = -20.7311284
SCENE_UL_CORNER_LON = +18.0214026
SCENE_UR_CORNER_LAT = -20.9858478
SCENE_UR_CORNER_LON = +19.7755296
SCENE_LL_CORNER_LAT = -22.3458954
SCENE_LL_CORNER_LON = +17.6304863
SCENE_LR_CORNER_LAT = -22.6065494
SCENE_LR_CORNER_LON = +19.4020961
SCENE_UL_CORNER_MAPX = 189781.500
SCENE_UL_CORNER_MAPY = -
2295247.500
SCENE_UR_CORNER_MAPX = 372723.000
SCENE_UR_CORNER_MAPY = -
2321068.500
SCENE_LL_CORNER_MAPX = 152902.500
SCENE_LL_CORNER_MAPY = -
2474997.000
SCENE_LR_CORNER_MAPX = 335758.500
SCENE_LR_CORNER_MAPY = -
2500846.500
BAND1_FILE_NAME =
"p177r075_7t20000424_z34_nn10.tif"
BAND2_FILE_NAME =
"p177r075_7t20000424_z34_nn20.tif"
BAND3_FILE_NAME =
"p177r075_7t20000424_z34_nn30.tif"
BAND4_FILE_NAME =
"p177r075_7t20000424_z34_nn40.tif"
BAND5_FILE_NAME =
"p177r075_7t20000424_z34_nn50.tif"
BAND61_FILE_NAME =
"p177r075_7k20000424_z34_nn61.tif"
BAND62_FILE_NAME =
GROUP = METADATA_FILE
PRODUCT_CREATION_TIME = 2004-02-
12T15:09:57Z
PRODUCT_FILE_SIZE = 669.4
STATION_ID = "EDC"
GROUND_STATION = "EDC"
GROUP = ORTHO_PRODUCT_METADATA
SPACECRAFT_ID = "Landsat7"
SENSOR_ID = "ETM+"
ACQUISITION_DATE = 2000-05-17
WRS_PATH = 178
WRS_ROW = 075
SCENE_CENTER_LAT = -21.6686995
SCENE_CENTER_LON = +17.1639746
SCENE_UL_CORNER_LAT = -20.7289496
SCENE_UL_CORNER_LON = +16.4786312
SCENE_UR_CORNER_LAT = -20.9848161
SCENE_UR_CORNER_LON = +18.2307334
SCENE_LL_CORNER_LAT = -22.3466967
SCENE_LL_CORNER_LON = +16.0863728
SCENE_LR_CORNER_LAT = -22.6044742
SCENE_LR_CORNER_LON = +17.8589668
SCENE_UL_CORNER_MAPX = 653961.000
SCENE_UL_CORNER_MAPY = -
2292853.500
SCENE_UR_CORNER_MAPX = 835933.500
SCENE_UR_CORNER_MAPY = -
2323861.500
SCENE_LL_CORNER_MAPX = 611866.500
SCENE_LL_CORNER_MAPY = -
2471605.500
SCENE_LR_CORNER_MAPX = 793924.500
SCENE_LR_CORNER_MAPY = -
2502556.500
BAND1_FILE_NAME =
"p178r075_7t20000517_z33_nn10.tif"
BAND2_FILE_NAME =
"p178r075_7t20000517_z33_nn20.tif"
BAND3_FILE_NAME =
"p178r075_7t20000517_z33_nn30.tif"
BAND4_FILE_NAME =
"p178r075_7t20000517_z33_nn40.tif"
BAND5_FILE_NAME =
"p178r075_7t20000517_z33_nn50.tif"
BAND61_FILE_NAME =
"p178r075_7k20000517_z33_nn61.tif"
BAND62_FILE_NAME =
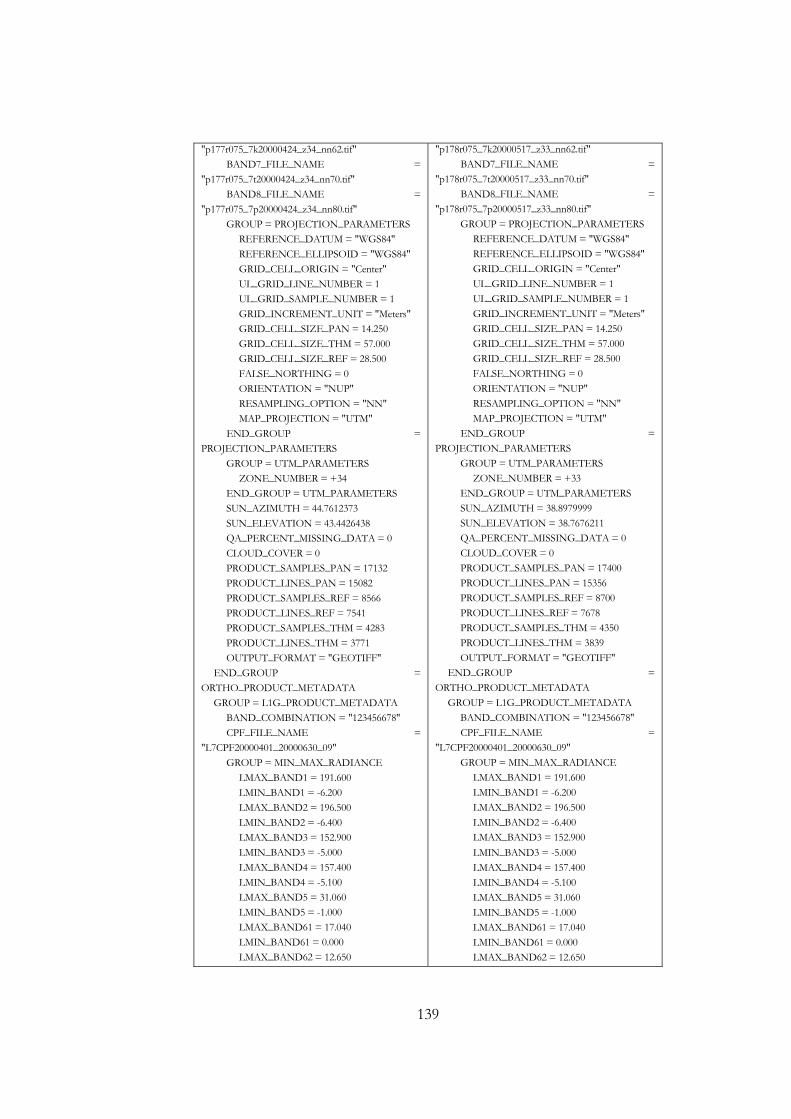
139
"p177r075_7k20000424_z34_nn62.tif"
BAND7_FILE_NAME =
"p177r075_7t20000424_z34_nn70.tif"
BAND8_FILE_NAME =
"p177r075_7p20000424_z34_nn80.tif"
GROUP = PROJECTION_PARAMETERS
REFERENCE_DATUM = "WGS84"
REFERENCE_ELLIPSOID = "WGS84"
GRID_CELL_ORIGIN = "Center"
UL_GRID_LINE_NUMBER = 1
UL_GRID_SAMPLE_NUMBER = 1
GRID_INCREMENT_UNIT = "Meters"
GRID_CELL_SIZE_PAN = 14.250
GRID_CELL_SIZE_THM = 57.000
GRID_CELL_SIZE_REF = 28.500
FALSE_NORTHING = 0
ORIENTATION = "NUP"
RESAMPLING_OPTION = "NN"
MAP_PROJECTION = "UTM"
END_GROUP =
PROJECTION_PARAMETERS
GROUP = UTM_PARAMETERS
ZONE_NUMBER = +34
END_GROUP = UTM_PARAMETERS
SUN_AZIMUTH = 44.7612373
SUN_ELEVATION = 43.4426438
QA_PERCENT_MISSING_DATA = 0
CLOUD_COVER = 0
PRODUCT_SAMPLES_PAN = 17132
PRODUCT_LINES_PAN = 15082
PRODUCT_SAMPLES_REF = 8566
PRODUCT_LINES_REF = 7541
PRODUCT_SAMPLES_THM = 4283
PRODUCT_LINES_THM = 3771
OUTPUT_FORMAT = "GEOTIFF"
END_GROUP =
ORTHO_PRODUCT_METADATA
GROUP = L1G_PRODUCT_METADATA
BAND_COMBINATION = "123456678"
CPF_FILE_NAME =
"L7CPF20000401_20000630_09"
GROUP = MIN_MAX_RADIANCE
LMAX_BAND1 = 191.600
LMIN_BAND1 = -6.200
LMAX_BAND2 = 196.500
LMIN_BAND2 = -6.400
LMAX_BAND3 = 152.900
LMIN_BAND3 = -5.000
LMAX_BAND4 = 157.400
LMIN_BAND4 = -5.100
LMAX_BAND5 = 31.060
LMIN_BAND5 = -1.000
LMAX_BAND61 = 17.040
LMIN_BAND61 = 0.000
LMAX_BAND62 = 12.650
"p178r075_7k20000517_z33_nn62.tif"
BAND7_FILE_NAME =
"p178r075_7t20000517_z33_nn70.tif"
BAND8_FILE_NAME =
"p178r075_7p20000517_z33_nn80.tif"
GROUP = PROJECTION_PARAMETERS
REFERENCE_DATUM = "WGS84"
REFERENCE_ELLIPSOID = "WGS84"
GRID_CELL_ORIGIN = "Center"
UL_GRID_LINE_NUMBER = 1
UL_GRID_SAMPLE_NUMBER = 1
GRID_INCREMENT_UNIT = "Meters"
GRID_CELL_SIZE_PAN = 14.250
GRID_CELL_SIZE_THM = 57.000
GRID_CELL_SIZE_REF = 28.500
FALSE_NORTHING = 0
ORIENTATION = "NUP"
RESAMPLING_OPTION = "NN"
MAP_PROJECTION = "UTM"
END_GROUP =
PROJECTION_PARAMETERS
GROUP = UTM_PARAMETERS
ZONE_NUMBER = +33
END_GROUP = UTM_PARAMETERS
SUN_AZIMUTH = 38.8979999
SUN_ELEVATION = 38.7676211
QA_PERCENT_MISSING_DATA = 0
CLOUD_COVER = 0
PRODUCT_SAMPLES_PAN = 17400
PRODUCT_LINES_PAN = 15356
PRODUCT_SAMPLES_REF = 8700
PRODUCT_LINES_REF = 7678
PRODUCT_SAMPLES_THM = 4350
PRODUCT_LINES_THM = 3839
OUTPUT_FORMAT = "GEOTIFF"
END_GROUP =
ORTHO_PRODUCT_METADATA
GROUP = L1G_PRODUCT_METADATA
BAND_COMBINATION = "123456678"
CPF_FILE_NAME =
"L7CPF20000401_20000630_09"
GROUP = MIN_MAX_RADIANCE
LMAX_BAND1 = 191.600
LMIN_BAND1 = -6.200
LMAX_BAND2 = 196.500
LMIN_BAND2 = -6.400
LMAX_BAND3 = 152.900
LMIN_BAND3 = -5.000
LMAX_BAND4 = 157.400
LMIN_BAND4 = -5.100
LMAX_BAND5 = 31.060
LMIN_BAND5 = -1.000
LMAX_BAND61 = 17.040
LMIN_BAND61 = 0.000
LMAX_BAND62 = 12.650
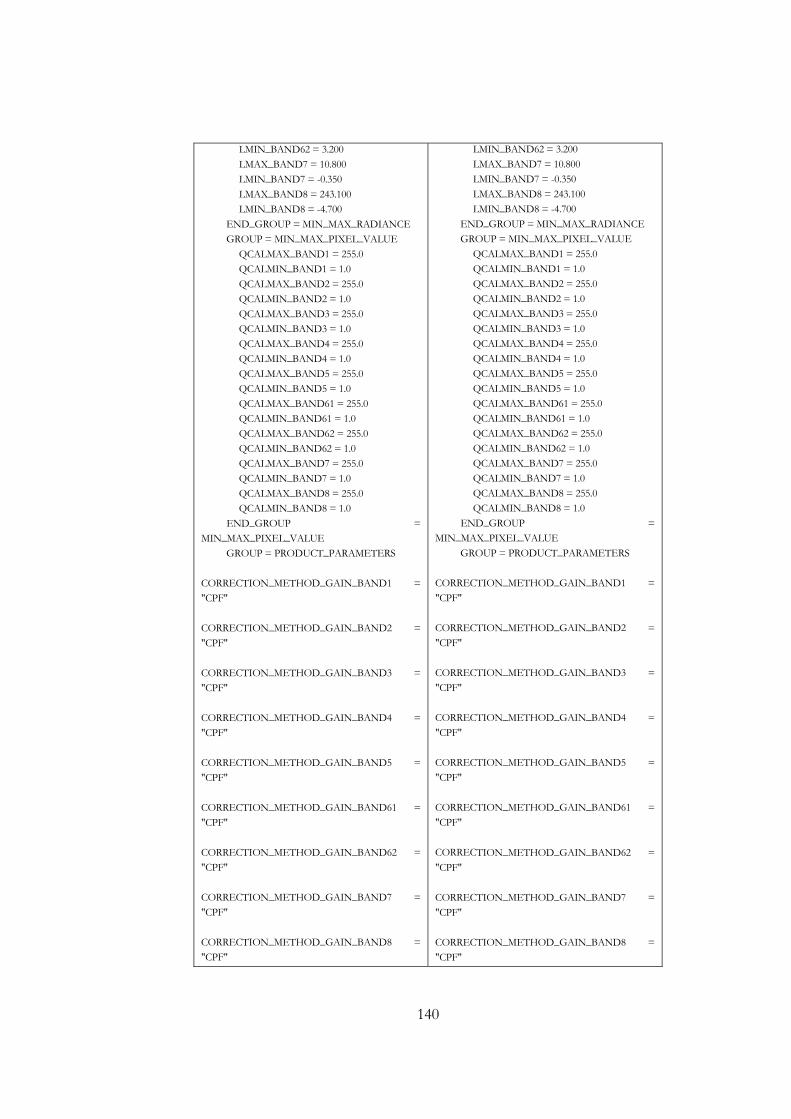
140
LMIN_BAND62 = 3.200
LMAX_BAND7 = 10.800
LMIN_BAND7 = -0.350
LMAX_BAND8 = 243.100
LMIN_BAND8 = -4.700
END_GROUP = MIN_MAX_RADIANCE
GROUP = MIN_MAX_PIXEL_VALUE
QCALMAX_BAND1 = 255.0
QCALMIN_BAND1 = 1.0
QCALMAX_BAND2 = 255.0
QCALMIN_BAND2 = 1.0
QCALMAX_BAND3 = 255.0
QCALMIN_BAND3 = 1.0
QCALMAX_BAND4 = 255.0
QCALMIN_BAND4 = 1.0
QCALMAX_BAND5 = 255.0
QCALMIN_BAND5 = 1.0
QCALMAX_BAND61 = 255.0
QCALMIN_BAND61 = 1.0
QCALMAX_BAND62 = 255.0
QCALMIN_BAND62 = 1.0
QCALMAX_BAND7 = 255.0
QCALMIN_BAND7 = 1.0
QCALMAX_BAND8 = 255.0
QCALMIN_BAND8 = 1.0
END_GROUP =
MIN_MAX_PIXEL_VALUE
GROUP = PRODUCT_PARAMETERS
CORRECTION_METHOD_GAIN_BAND1 =
"CPF"
CORRECTION_METHOD_GAIN_BAND2 =
"CPF"
CORRECTION_METHOD_GAIN_BAND3 =
"CPF"
CORRECTION_METHOD_GAIN_BAND4 =
"CPF"
CORRECTION_METHOD_GAIN_BAND5 =
"CPF"
CORRECTION_METHOD_GAIN_BAND61 =
"CPF"
CORRECTION_METHOD_GAIN_BAND62 =
"CPF"
CORRECTION_METHOD_GAIN_BAND7 =
"CPF"
CORRECTION_METHOD_GAIN_BAND8 =
"CPF"
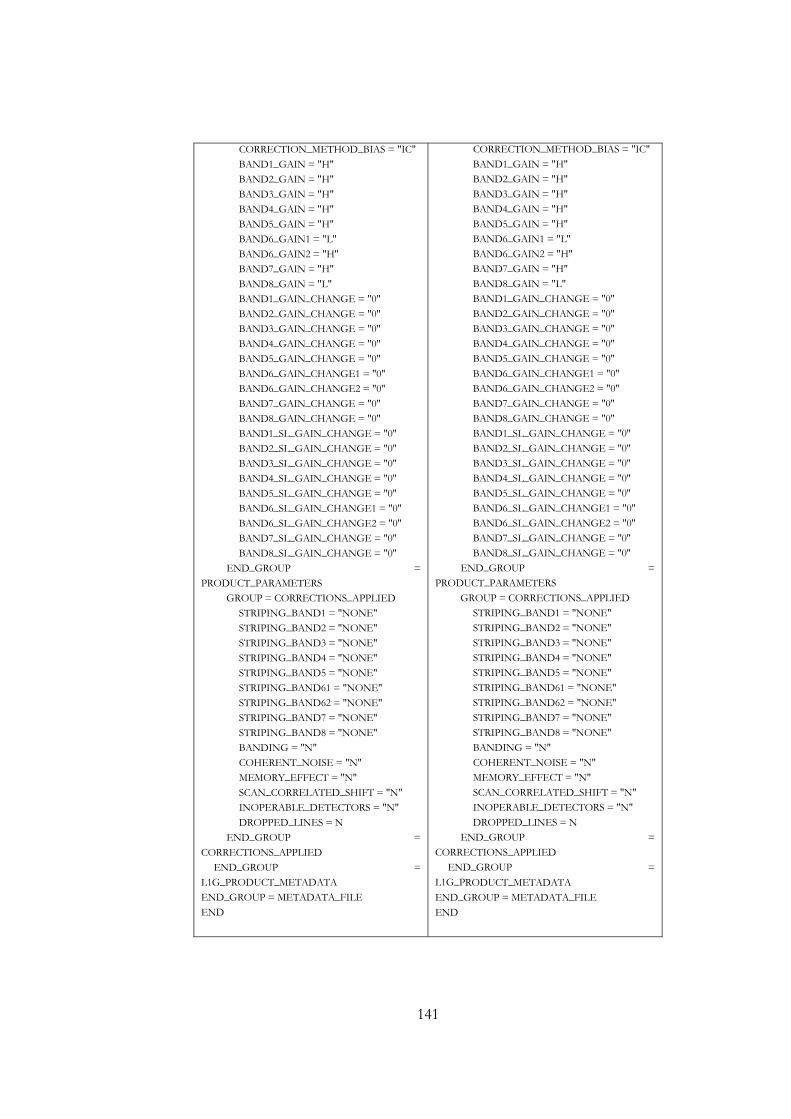
141
CORRECTION_METHOD_BIAS = "IC"
BAND1_GAIN = "H"
BAND2_GAIN = "H"
BAND3_GAIN = "H"
BAND4_GAIN = "H"
BAND5_GAIN = "H"
BAND6_GAIN1 = "L"
BAND6_GAIN2 = "H"
BAND7_GAIN = "H"
BAND8_GAIN = "L"
BAND1_GAIN_CHANGE = "0"
BAND2_GAIN_CHANGE = "0"
BAND3_GAIN_CHANGE = "0"
BAND4_GAIN_CHANGE = "0"
BAND5_GAIN_CHANGE = "0"
BAND6_GAIN_CHANGE1 = "0"
BAND6_GAIN_CHANGE2 = "0"
BAND7_GAIN_CHANGE = "0"
BAND8_GAIN_CHANGE = "0"
BAND1_SL_GAIN_CHANGE = "0"
BAND2_SL_GAIN_CHANGE = "0"
BAND3_SL_GAIN_CHANGE = "0"
BAND4_SL_GAIN_CHANGE = "0"
BAND5_SL_GAIN_CHANGE = "0"
BAND6_SL_GAIN_CHANGE1 = "0"
BAND6_SL_GAIN_CHANGE2 = "0"
BAND7_SL_GAIN_CHANGE = "0"
BAND8_SL_GAIN_CHANGE = "0"
END_GROUP =
PRODUCT_PARAMETERS
GROUP = CORRECTIONS_APPLIED
STRIPING_BAND1 = "NONE"
STRIPING_BAND2 = "NONE"
STRIPING_BAND3 = "NONE"
STRIPING_BAND4 = "NONE"
STRIPING_BAND5 = "NONE"
STRIPING_BAND61 = "NONE"
STRIPING_BAND62 = "NONE"
STRIPING_BAND7 = "NONE"
STRIPING_BAND8 = "NONE"
BANDING = "N"
COHERENT_NOISE = "N"
MEMORY_EFFECT = "N"
SCAN_CORRELATED_SHIFT = "N"
INOPERABLE_DETECTORS = "N"
DROPPED_LINES = N
END_GROUP =
CORRECTIONS_APPLIED
END_GROUP =
L1G_PRODUCT_METADATA
END_GROUP = METADATA_FILE
END