Embed Size (px)
Citation preview
University of Kentucky University of Kentucky
UKnowledge UKnowledge
Theses and Dissertations--Mechanical Engineering Mechanical Engineering
2021
Viscoelasticity of PTFE-Based Face Seals Viscoelasticity of PTFE-Based Face Seals
Bo Tan University of Kentucky, [email protected] Author ORCID Identifier:
https://orcid.org/0000-0002-7064-865X Digital Object Identifier: https://doi.org/10.13023/etd.2021.337
Right click to open a feedback form in a new tab to let us know how this document benefits you. Right click to open a feedback form in a new tab to let us know how this document benefits you.
Recommended Citation Recommended Citation Tan, Bo, "Viscoelasticity of PTFE-Based Face Seals" (2021). Theses and Dissertations--Mechanical Engineering. 178. https://uknowledge.uky.edu/me_etds/178
This Doctoral Dissertation is brought to you for free and open access by the Mechanical Engineering at UKnowledge. It has been accepted for inclusion in Theses and Dissertations--Mechanical Engineering by an authorized administrator of UKnowledge. For more information, please contact [email protected].

STUDENT AGREEMENT: STUDENT AGREEMENT:
I represent that my thesis or dissertation and abstract are my original work. Proper attribution
has been given to all outside sources. I understand that I am solely responsible for obtaining
any needed copyright permissions. I have obtained needed written permission statement(s)
from the owner(s) of each third-party copyrighted matter to be included in my work, allowing
electronic distribution (if such use is not permitted by the fair use doctrine) which will be
submitted to UKnowledge as Additional File.
I hereby grant to The University of Kentucky and its agents the irrevocable, non-exclusive, and
royalty-free license to archive and make accessible my work in whole or in part in all forms of
media, now or hereafter known. I agree that the document mentioned above may be made
available immediately for worldwide access unless an embargo applies.
I retain all other ownership rights to the copyright of my work. I also retain the right to use in
future works (such as articles or books) all or part of my work. I understand that I am free to
register the copyright to my work.
REVIEW, APPROVAL AND ACCEPTANCE REVIEW, APPROVAL AND ACCEPTANCE
The document mentioned above has been reviewed and accepted by the student’s advisor, on
behalf of the advisory committee, and by the Director of Graduate Studies (DGS), on behalf of
the program; we verify that this is the final, approved version of the student’s thesis including all
changes required by the advisory committee. The undersigned agree to abide by the statements
above.
Bo Tan, Student
Dr. Lyndon Scott Stephens, Major Professor
Dr. Alexandre Martin, Director of Graduate Studies
VISCOELASTICITY OF PTFE-BASED FACE SEALS
TITLE PAGE
________________________________________
DISSERTATION
________________________________________
A dissertation submitted in partial fulfillment of the
requirements for the degree of Doctor of Philosophy in the
College of Engineering
at the University of Kentucky
By
Bo Tan
Lexington, Kentucky
Director: Dr. Lyndon Scott Stephens, Professor of Mechanical Engineering
Lexington, Kentucky
2021
Copyright © Bo Tan 2021
https://orcid.org/0000-0002-7064-865X
ABSTRACT OF DISSERTATION
ABSTRACT
VISCOELASTICITY OF PTFE-BASED FACE SEALS
PTFE-based materials are widely used in areas of tribology, particularly in seal and
bearing applications because of their outstanding self-lubricating properties. Often in
dynamic seal applications there is a need for ultra-low mechanical friction loss between the
sealing surfaces. Due to its extremely low friction coefficient, there is interest in employing
Polytetrafluoroethylene (PTFE) materials in such applications. One challenging aspect of
employing PTFE is that these materials are viscoelastic and plastic. This dissertation
concentrates on the modeling of viscoelastic material response when used as mechanical
face seals with a focus on PTFE-based materials. First, the viscoelastic characteristics are
measured through experimental tests. Using a dynamic mechanical analyzer (DMA), the
storage modulus, loss modulus and tan δ, are measured and discussed in the frequency
domain. The relaxation modulus and creep compliances are also measured and studied in
the time domain. Furthermore, the materials’ compositions are studied using Energy
Dispersive X-ray Spectrometer for composites measurement. The experimental data is then
modeled with best fit curves using the Prony series and compared to the experimental data.
In seals made of viscoelastic materials, harmonic oscillations can lead to separation
of seal faces and leakage. The isothermal viscoelastic dynamic response of a PTFE end
face seal subjected to small harmonic input and preload static displacement from an ideally
rigid opposing face is examined. Both the magnitude and time of separation of the faces
are predicted based on dry conditions (no lubrication effect due to leakage). The presented
model is a hybrid that combines the Golla-Hughes-McTavish (GHM) finite element model,
a delayed recovery creep model and a penalty method contact model. The GHM and
delayed recovery creep models are first validated using experimental data from a Dynamic
Mechanical Analyzer (DMA) test for PTFE-based materials. Results for a simple sample
application show seal separation magnitude as a function of frequency and applied
harmonic displacement amplitude due to vibration of the rigid face. Results show that face
separation occurs in PTFE seals even for small amplitude harmonic vibrations (as
compared to the preload static displacement) and that this is due to the viscoelastic damping
effect creating a phase lag between the motions of the faces. A simple leakage estimate is
also performed for the sample application.
KEYWORDS: Seals, PTFE, Viscoelasticity, Dynamic, Separations
Bo Tan
08/04/2021
Date
Viscoelasticity of PTFE-Based Face Seals
By
Bo Tan
Dr. Lyndon Scott Stephens
Director of Dissertation
Dr. Alexandre Martin
Director of Graduate Studies
08/04/2021
Date

DEDICATION
To my mother
iii
ACKNOWLEDGMENTS
First, my deepest gratitude to my advisor, Dr. Lyndon Scott Stephens, for his
support and encouragement throughout my Ph.D. study. It would not be possible for me
to achieve a doctoral degree without his help. In addition, I would like to thank Dr. Keith
Rouch, Dr. Martha Grady, and Dr. Yang-Tse Cheng for serving as my Dissertation
Committee members as well as Dr. Alberto Corso for serving as my Outside Examiner.
I would like to thank Dr. Tristana Duvallet at Center of Applied Energy Research
and Dr. Nicolas Briot at Electron Microscopy Center at University of Kentucky for their
patience and support when conducting experiments with the DMA and SEM. Appreciate
the suggestions from Dr. Jonathan Wenk, Dr. Tingwen Wu, Dr. Hailong Chen and Dr.
Zheng Gao in Finite Element Programming. My special thanks to Mr. Floyd Taylor
helped making my test samples.
This has been a long journey and I am so fortunate to be surrounded by many
talented friends at the University of Kentucky. They are Joseph Stieha, Kevin Richardson,
Dr. Shaoqian Wang, Dr. Roshan A. Chavan, Zahra Abbasi, Guher Pelin Toker, Dr. Hui
Li, Xuhui Liu, Anna Takur. I really enjoyed the time with my friends in UK badminton
group, Dr. Yi Lin, Dr. Xiaohang Yu, Yuanrong Kang, Mingping Zheng, Chao-Hsuan
Huang, Wenjie Lu, Qinglin Zhao.
Last, I wish my deeply missed mother could receive my appreciation with all my
heart. You are the light in the darkest of times of mine, and I would never forget your
expectation on me: be a person full of love, humbleness, integrity and perseverance.
iv
TABLE OF CONTENTS
ACKNOWLEDGMENTS ............................................................................................... iii
LIST OF TABLES ........................................................................................................... vi
LIST OF FIGURES ........................................................................................................ vii
CHAPTER 1. Introduction ............................................................................................... 1
1.1 Basics of Face Seals................................................................................................ 1
1.1.1 Types of Face Seals ........................................................................................ 1
1.1.2 Applications of Face Seals .............................................................................. 4
1.1.3 Seal Design Parameters................................................................................... 9
1.2 Basics of PTFE-based materials ........................................................................... 10
1.2.1 History and background ................................................................................ 11
1.2.2 Properties of PTFE (Mechanical properties and tribology & friction
coefficients)............................................................................................................... 14
1.2.3 Applications of PTFE-based materials for seals ........................................... 16
1.3 Viscoelasticity of PTFE-based materials .............................................................. 20
1.4 Dissertation Overview .......................................................................................... 24
CHAPTER 2. Literature review .................................................................................... 26
2.1 Development and Applications of PTFE-based Materials for Seals .................... 26
2.2 Modeling of Frequency Dependent Viscoelastic Effects ...................................... 33
2.3 Research Objectives .............................................................................................. 40
CHAPTER 3. Evaluation of viscoelastic characteristics of PTFE-Based materials
used as seals 41
3.1 Theories in Viscoelasticity .................................................................................... 41
3.1.1 Relaxation Modulus and Creep Compliance ................................................ 41
3.1.2 Storage Modulus and tan δ............................................................................ 42
3.1.3 Prony Series Parameters in the Frequency Domain ...................................... 45
3.2 Experiment ............................................................................................................ 46
3.2.1 Experimental Results of Storage Modulus and tan δ .................................... 49
3.2.2 Relaxation Modulus Results ......................................................................... 53
3.2.3 Creep Compliance Results ............................................................................ 57

v
3.2.4 Creep Recovery Tests ................................................................................... 61
3.3 Anlaysis and Discussion ....................................................................................... 62
CHAPTER 4. Modeling face separation due to viscoelasticity in PTFE Seals .......... 68
4.1 Modeling and Experimental Verification .............................................................. 68
4.1.1 Example seal geometry and model ............................................................... 68
4.1.2 GHM finite element model and validation ................................................... 72
4.1.3 Recovery model ............................................................................................ 80
4.1.4 The penalty method contact model in GHM................................................. 82
4.1.5 The Total Model: Seal Face Separation ........................................................ 83
4.2 Results ................................................................................................................... 85
4.2.1 Harmonic oscillation of rigid face with no static preload ............................. 85
4.2.2 Results for an example with static and dynamic displacements (ys>yd) ....... 89
4.2.3 Harmonic Oscillation with Static Preload vs Frequency .............................. 93
4.3 Discussion and analysis ........................................................................................ 97
4.3.1 Correlations among separations, recovery compliance and mechanical loss 97
4.3.2 Separations and leakage rate ......................................................................... 99
4.3.3 Analysis of Seal Face Separation in the Time Domain .............................. 101
CHAPTER 5. Simulation results for other PTFE-based materials .......................... 106
5.1 Introduction......................................................................................................... 106
5.2 Discussion and Analysis ..................................................................................... 106
CHAPTER 6. Summary and future work ................................................................... 114
6.1 Summary and Conclusions .................................................................................. 114
6.2 Recommendations for Future Work .................................................................... 120
APPENDIX .................................................................................................................... 122
REFERENCES .............................................................................................................. 142
VITA............................................................................................................................... 148
vi
LIST OF TABLES
Table 1.1.1: Effects of cross section. .................................................................................. 4
Table 1.2.1: Material properties of PTFE-based samples. ................................................ 15
Table 2.1.1: Overview of experimental data reported in this research versus previous
research. ............................................................................................................................ 31
Table 2.1.2: Storage modulus and tan δ reported in this research versus previous research.
........................................................................................................................................... 32
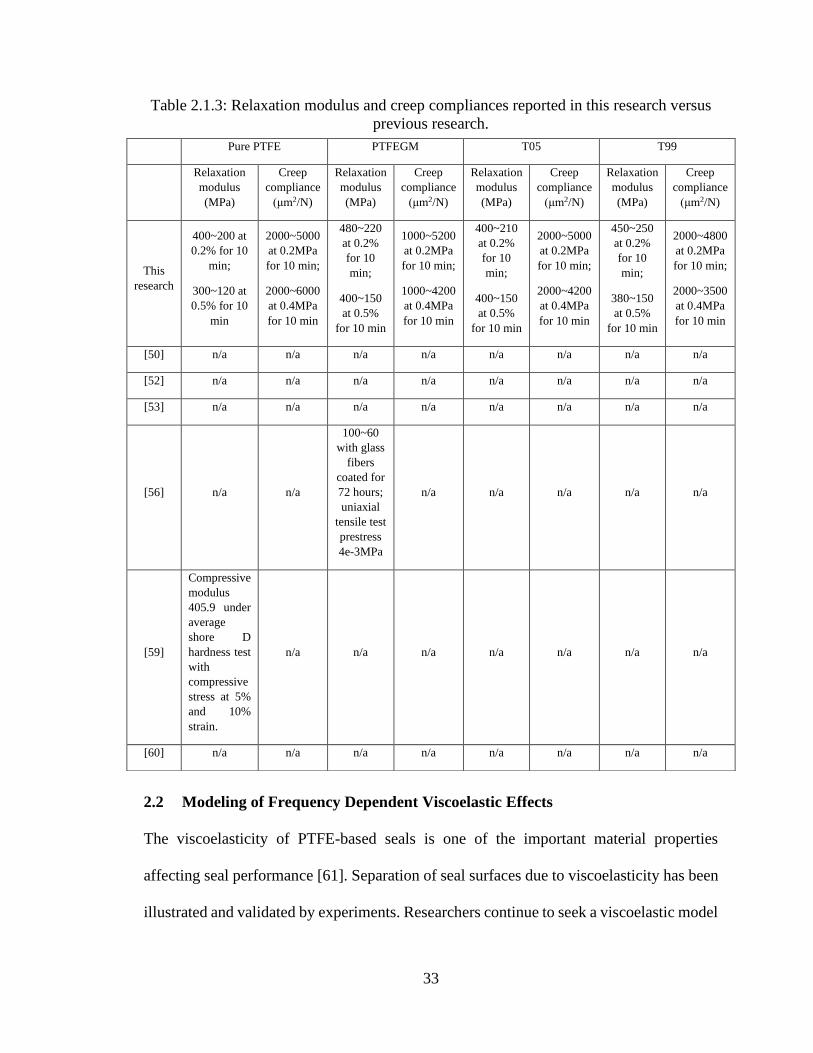
Table 2.1.3: Relaxation modulus and creep compliances reported in this research versus
previous research. ............................................................................................................. 33
Table 3.2.1: Prony parameters for storage and loss modulus ........................................... 53
Table 3.2.2: Relaxation modulus with 0.2% constant strain (Ei in MPa) ......................... 57
Table 3.2.3: Relaxation modulus with 0.5% constant strain (Ei in MPa) ......................... 57
Table 3.2.4: Creep compliances with 0.2MPa constant stress (Dj in µm2/N) ................... 60
Table 3.2.5: Creep compliances with 0.4MPa constant stress (Dj in µm2/N) ................... 61
Table 3.3.1: Expectation and deviations of pure PTFE and T05 ...................................... 67
Table 4.3.1: The correlations of average normalized separations against recovery and
𝑡𝑎𝑛𝛿 at low frequency (0.1-2.5Hz) and high frequency (2.5~50Hz) ............................... 99
vii
LIST OF FIGURES
Figure 1.1.1: Principles of radial seals. ............................................................................... 2
Figure 1.1.2: Principles of axial seals. ................................................................................ 3
Figure 1.1.3: Cross-sectional shapes for reciprocating seals. ............................................. 3
Figure 1.1.4: Functional Principle of Turcon Roto L lip seals. .......................................... 6
Figure 1.1.5: Illustration of pre-strain and harmonic oscillation. ....................................... 7
Figure 1.1.6: Illustration of Type 10T PTFE bellow seals. ................................................ 8
Figure 1.1.7: Face seal system. ......................................................................................... 10
Figure 1.2.1: Overview of PTFE....................................................................................... 11
Figure 1.2.2: Structural formula of PTFE. ........................................................................ 12
Figure 1.2.3: Flexiseal rotary seal. .................................................................................... 18
Figure 1.2.4: Turcon VL rod seals for aircraft landing gear hydraulic rod system with
reciprocating movements. ................................................................................................. 18
Figure 1.2.5: Rotary seal system. ...................................................................................... 19
Figure 1.2.6: Face seal with double PTFE-coated Viton O-rings for process and chemical
pumps. (1) floating seat; (2) sealing head with double O-ring mount; (3) O-rings; (4)
secondary seal; (5) spring; (6) sleeve; (7) seal for sleeve/shaft; (8) grub-screw. ............. 19
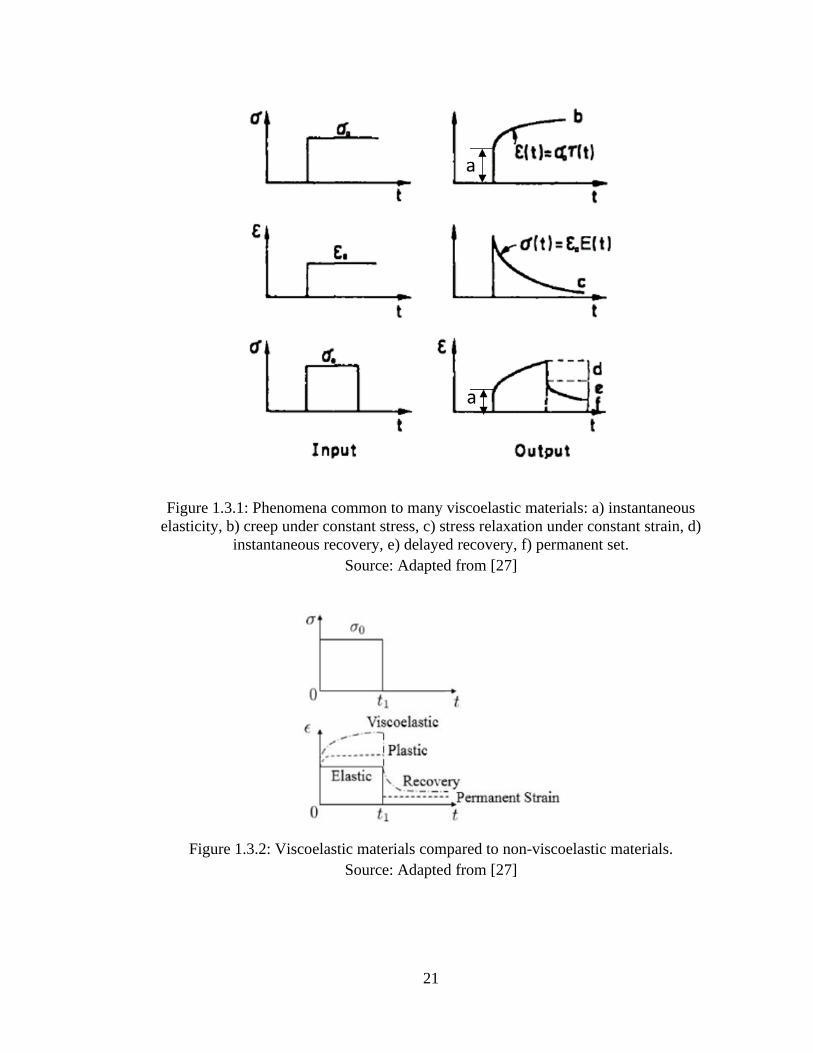
Figure 1.3.1: Phenomena common to many viscoelastic materials: a) instantaneous
elasticity, b) creep under constant stress, c) stress relaxation under constant strain, d)
instantaneous recovery, e) delayed recovery, f) permanent set. ....................................... 21
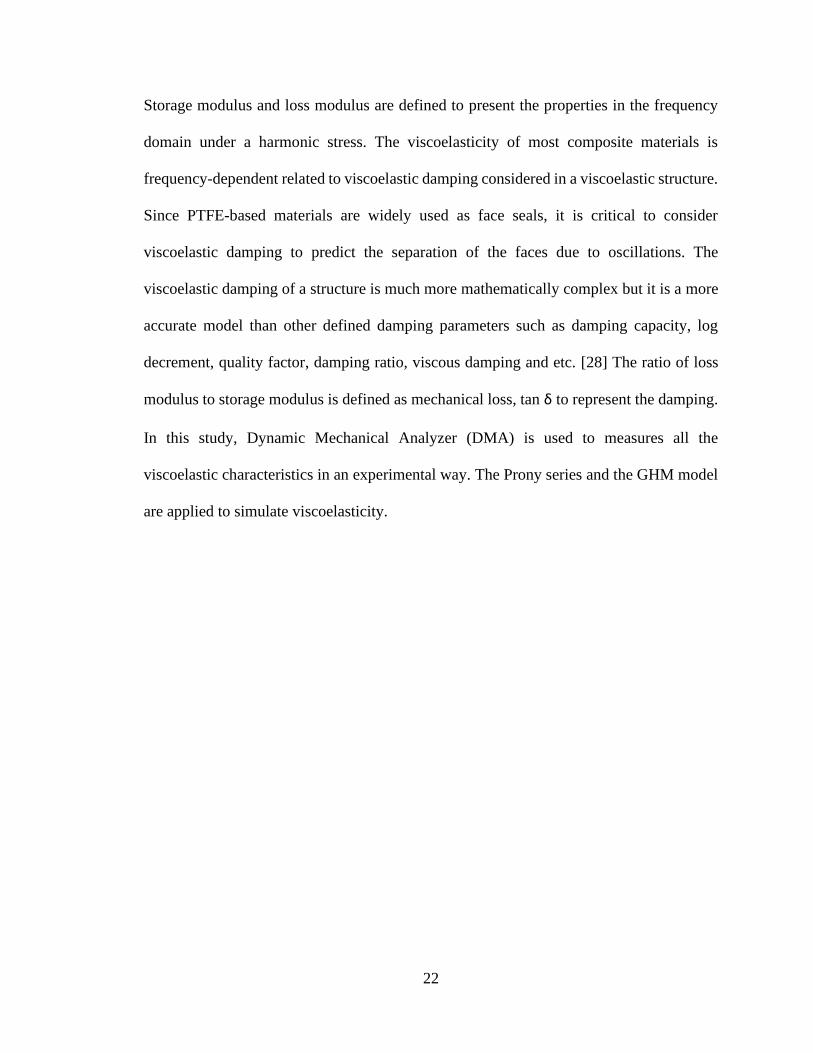
Figure 1.3.2: Viscoelastic materials compared to non-viscoelastic materials. ................. 21
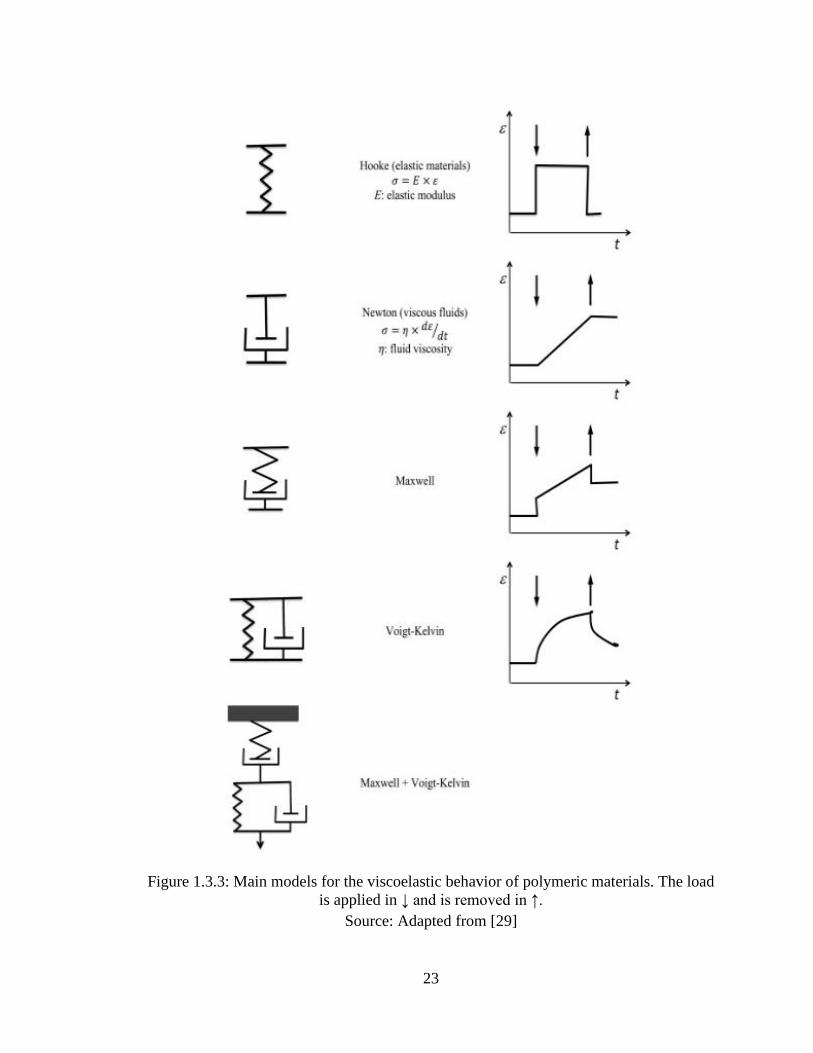
Figure 1.3.3: Main models for the viscoelastic behavior of polymeric materials. The load
is applied in ↓ and is removed in ↑. .................................................................................. 23
Figure 2.2.1: Uniaxial tension and compression data for a PTFE material. The yield stress
is higher in compression than in tension. .......................................................................... 39
Figure 3.1.1:Oscillating Stress σ, Strain ε and Phase Lag δ. ............................................ 44
Figure 3.2.1: Schematic of Dynamic Mechanical Analyzer (DMA) ................................ 46
Figure 3.2.2: Test Samples (from top to bottom: pure PTFE, T05, T99, PTFEGM) ....... 47
Figure 3.2.3: The operating range of the three-point bending clamp for DMA. .............. 48
Figure 3.2.4: Storage modulus of each PTFE-based materials (Expe:Experimental Curve;
Fitted: Fitted Curve) .......................................................................................................... 50
Figure 3.2.5: Tan δ of each PTFE-based material ............................................................ 51
Figure 3.2.6: Loss modulus of each PTFE-based materials (Expe:Experimental Curve;
Fitted: Fitted Curve) .......................................................................................................... 52
Figure 3.2.7: Relaxation modulus of PTFE-based materials under constant strain 0.2%
and 0.5% (Expe:Experimental Curve; Fitted: Fitted Curve) ............................................ 56
Figure 3.2.8: Creep compliances of PTFE-based materials under constant stress 0.2MPa
and 0.4MPa (Expe:Experimental Curve; Fitted: Fitted Curve) ........................................ 60
Figure 3.2.9: Creep recovery test of PTFE-based materials under constant stress
𝜎0=0.2MPa at 30oC. ......................................................................................................... 62

viii
Figure 3.3.1: High creep compliance samples of pure PTFE with 0.4MPa ...................... 64
Figure 3.3.2: Low creep compliance samples of pure PTFE with 0.4MPa ...................... 64
Figure 3.3.3: Creep compliances of T05 with 0.4MPa ..................................................... 65
Figure 3.3.4: Fluorine (F) weight percentage of pure PTFE and T05 for creep samples . 66
Figure 4.1.1: A simple face seal example subjected to pure axial vibration and discretized
into plane strain GHM finite elements .............................................................................. 71
Figure 4.1.2: The mini oscillator in GHM model. ............................................................ 75
Figure 4.1.3: Flowchart of the validation process between experimental and simulation
storage moduli ................................................................................................................... 77
Figure 4.1.4: Pure PTFE simulation strain versus experimental strains at frequencies of
interest (0.1Hz, 0.5Hz, 1Hz, 10Hz, 50Hz) ........................................................................ 78
Figure 4.1.5: Pure PTFE storage moduli: experimental vs GHM model results .............. 79
Figure 4.1.6: Mechanical loss (𝑡𝑎𝑛𝛿): experimental versus GHM model results with the
relative errors .................................................................................................................... 80
Figure 4.1.7: Pure PTFE creep compliance and recovery compliance ............................. 82
Figure 4.1.8: Illustration of the hybrid model ................................................................... 85
Figure 4.2.1: Flowchart of harmonic oscillation without static displacements ................ 87
Figure 4.2.2: Contact force and displacement of viscoelastic face with no seal pre-load
(ys=0) ................................................................................................................................. 88
Figure 4.2.3: Algorithm of obtaining the estimated corrected coefficient ycorrect and the
static displacement ys ........................................................................................................ 90
Figure 4.2.4: Contact force and viscoelastic face displacement at 1 Hz with ys/yd =3.83
(ys=123.3μm, yd=32.2μm) ................................................................................................ 91
Figure 4.2.5: Seal face separation for 1 peak of viscoelastic material displacement
response of Figure 8b) PTFE (ys=123.3μm, yd=32.2μm at 1Hz) ..................................... 92
Figure 4.2.6: Flowchart of harmonic oscillation with preload displacement yd ............... 94
Figure 4.2.7: The ratio of ys and yd (yd=6,10,20,30 (μm)) ............................................... 95
Figure 4.2.8: Maximum face separation at the critical threshold ratios ys/yd|crit for various
values of yd ........................................................................................................................ 96
Figure 4.2.9: Normalized maximum face separation at the critical threshold ratios
ys/yd|crit for various values of yd ........................................................................................ 97
Figure 4.3.1: The correlation between the average normalized separation hmax/yd and
delayed recovery compliance JR * period 1/f at 0.1~2.5Hz .............................................. 98
Figure 4.3.2: The correlation between average normalized separation hmax/yd and 𝑡𝑎𝑛𝛿 at
2.5~50Hz ........................................................................................................................... 99
Figure 4.3.3: Leakage rate of pure PTFE if ΔP=1MPa, viscosity η is water, ro=110(mm)
and ri=100(mm)............................................................................................................... 101
Figure 4.3.4: The separations of pure PTFE at 5 selected frequencies in the time domain
(yd=30 μm) ...................................................................................................................... 102
Figure 4.3.5: Normalized Curve-fitted coefficients AN(f) and BN(f) (AN(f)=A(f)/yd and
BN(f)=B(f)/yd, in μm-1) .................................................................................................... 103
Figure 4.3.6: The separation time at each frequency ...................................................... 105
ix
Figure 4.3.7: Separation time per cycle P(f) of pure PTFE ............................................ 105
Figure 5.2.1: The critical threshold ratio for PTFEGM, T05, T99 ................................. 109
Figure 5.2.2: Normalized maximum face separation at yd=30 μm: pure PTFE, PTFEGM,
T05, T99. ......................................................................................................................... 109
Figure 5.2.3: Leakage rate for pure PTFE, PTFEGM, T05, T99 at yd=30 μm. .............. 110
Figure 5.2.4: Leakage rate of pure PTFE, T05 and T99 at low frequency ..................... 112
Figure 5.2.5: Delayed recovery compliance curves ........................................................ 112
Figure 5.2.6: Separation time per cycle P(f) ................................................................... 113
1
CHAPTER 1. INTRODUCTION
1.1 Basics of Face Seals
This section introduces the fundamentals of face seals and gives an overview including the
categories of face seals, the applications in industry and some important seal design
parameters.
1.1.1 Types of Face Seals
A seal is a device for closing a gap or preventing fluid from leaking from high-pressure to
low pressure reservoirs.[1] The term “face” is characterized by having contact over the area
of a face rather than having a line contact or point contact, or it may characterize the fact
that contact face is on a housing or shaft.[2] There are many ways to classify seals but, in
general, they are categorized into two groups in terms of relative movements and contact
surfaces.
In terms of relative movements, seals fall broadly into two categories: 1) static seals: the
sealing takes place between surfaces which do not move relative to one another. 2) dynamic
seals: the sealing takes place between surfaces which have relative movement, rotary or
oscillating movement of a shaft relative to a housing, or reciprocating movement of a rod
or piston in a cylinder. Static seals include gaskets, O-rings, solid wire ring seals, chamfer
rings, PTFE tape, tank lid seals etc. The common dynamic seals are lip seals, mechanical
face seals, solid elastomer rings, composite seals, radial lip seal, and split ring seals, among
others.
2
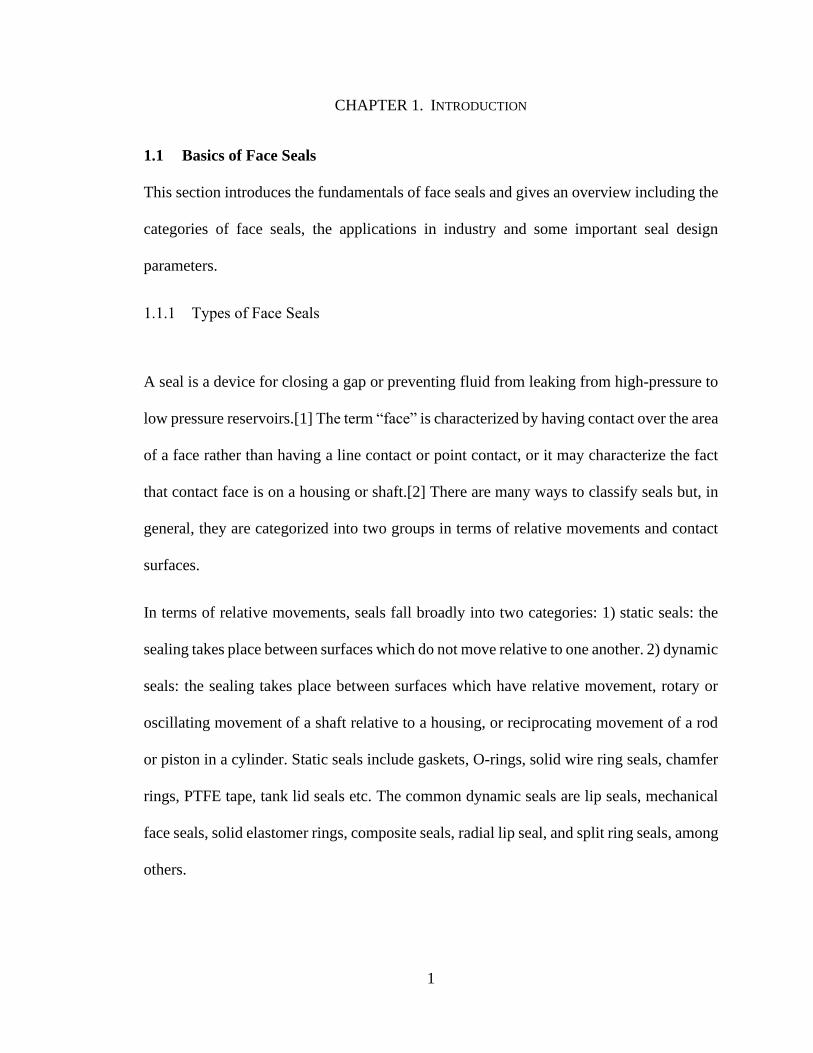
As for the contact surfaces of face seals, there are two categories: 1) cylindrical surface:
the contact surface and seal gap are on the rotating shaft labeled as “Radial Seal” shown in
Figure 1.1.1. Radial Seal designs were among the earliest of designs during the industrial
revolution. As the speed and pressure of applications increased, some major concerns were
the comparatively high leak rates necessary to avoid overheating due to the large contact
area (the leakage was used to carry away the heat due to high friction power loss), and
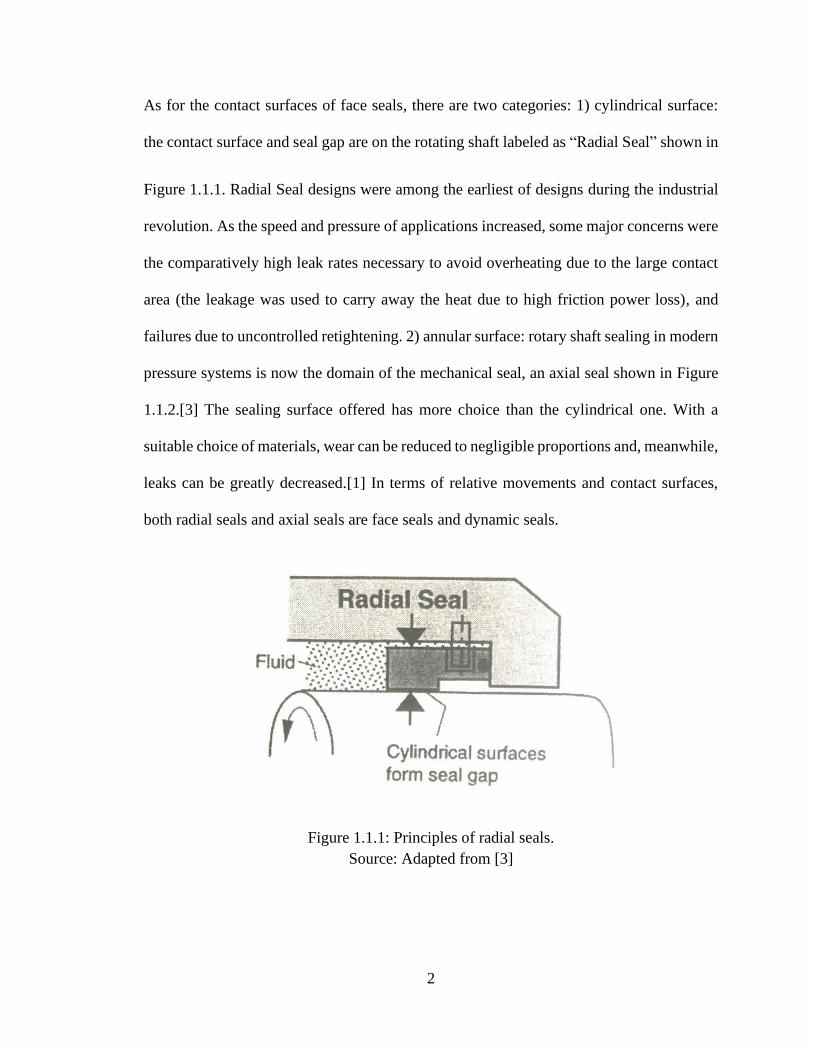
failures due to uncontrolled retightening. 2) annular surface: rotary shaft sealing in modern
pressure systems is now the domain of the mechanical seal, an axial seal shown in Figure
1.1.2.[3] The sealing surface offered has more choice than the cylindrical one. With a
suitable choice of materials, wear can be reduced to negligible proportions and, meanwhile,
leaks can be greatly decreased.[1] In terms of relative movements and contact surfaces,
both radial seals and axial seals are face seals and dynamic seals.
Figure 1.1.1: Principles of radial seals.
Source: Adapted from [3]
3
Figure 1.1.2: Principles of axial seals.
Source: Adapted from [3]
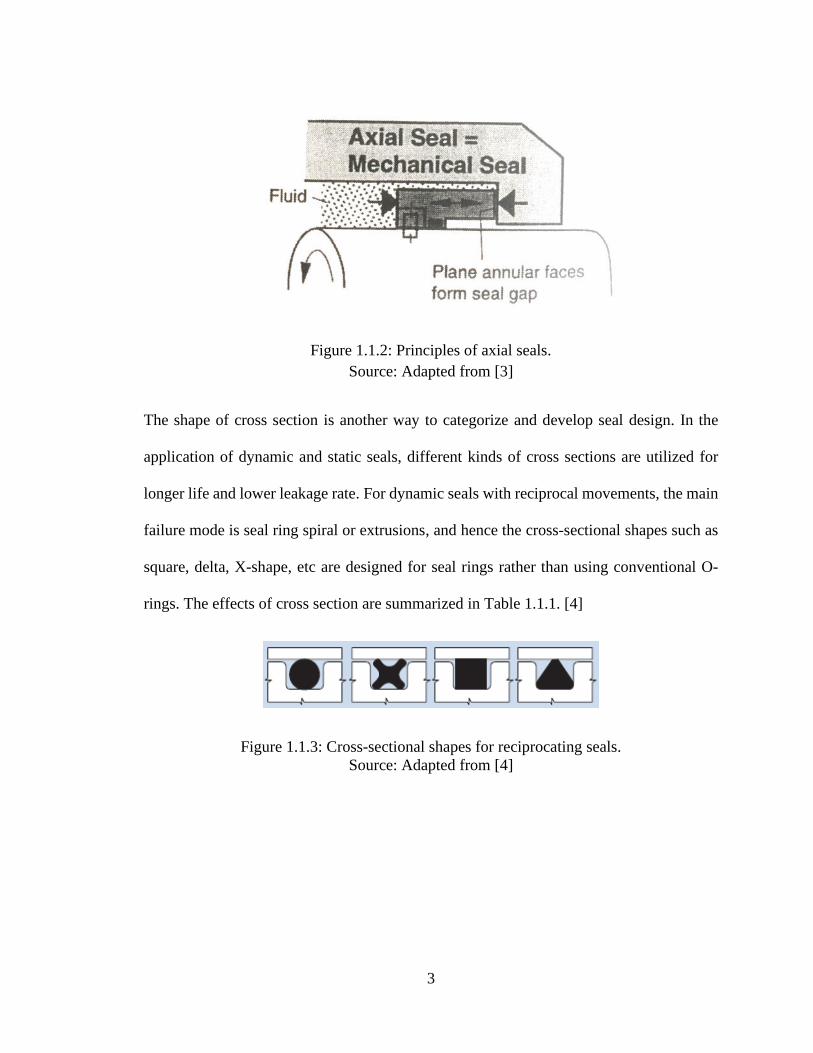
The shape of cross section is another way to categorize and develop seal design. In the
application of dynamic and static seals, different kinds of cross sections are utilized for
longer life and lower leakage rate. For dynamic seals with reciprocal movements, the main
failure mode is seal ring spiral or extrusions, and hence the cross-sectional shapes such as
square, delta, X-shape, etc are designed for seal rings rather than using conventional O-
rings. The effects of cross section are summarized in Table 1.1.1. [4]
Figure 1.1.3: Cross-sectional shapes for reciprocating seals.
Source: Adapted from [4]
4
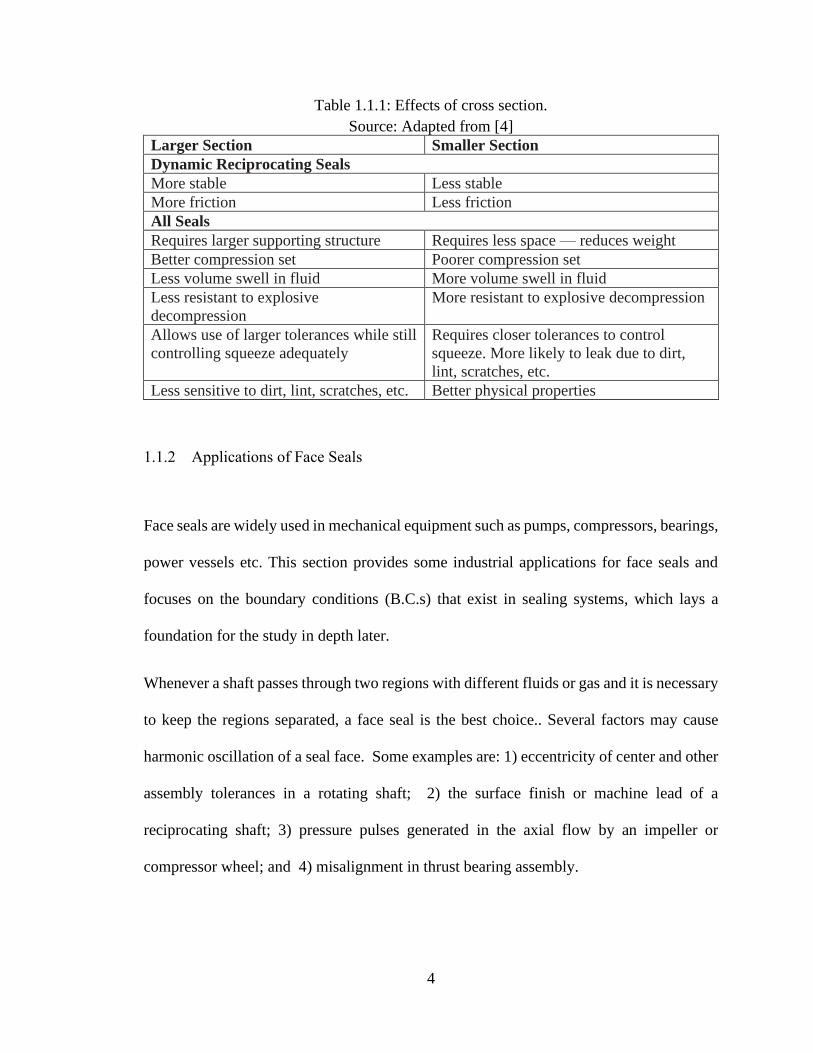
Table 1.1.1: Effects of cross section.
Source: Adapted from [4]
Larger Section Smaller Section
Dynamic Reciprocating Seals
More stable Less stable
More friction Less friction
All Seals
Requires larger supporting structure Requires less space — reduces weight
Better compression set Poorer compression set
Less volume swell in fluid More volume swell in fluid
Less resistant to explosive
decompression
More resistant to explosive decompression
Allows use of larger tolerances while still
controlling squeeze adequately
Requires closer tolerances to control
squeeze. More likely to leak due to dirt,
lint, scratches, etc.
Less sensitive to dirt, lint, scratches, etc. Better physical properties
1.1.2 Applications of Face Seals
Face seals are widely used in mechanical equipment such as pumps, compressors, bearings,
power vessels etc. This section provides some industrial applications for face seals and
focuses on the boundary conditions (B.C.s) that exist in sealing systems, which lays a
foundation for the study in depth later.
Whenever a shaft passes through two regions with different fluids or gas and it is necessary
to keep the regions separated, a face seal is the best choice.. Several factors may cause
harmonic oscillation of a seal face. Some examples are: 1) eccentricity of center and other
assembly tolerances in a rotating shaft; 2) the surface finish or machine lead of a
reciprocating shaft; 3) pressure pulses generated in the axial flow by an impeller or
compressor wheel; and 4) misalignment in thrust bearing assembly.
5
Common materials for face seals are carbon, tungsten carbide (WC) and silicon carbide
(SiC) in the heavy-duty industrial applications. In this dissertation, the focus is placed on
face seals in light duty applications where a soft face of PTFE may be applied.
Independent of the seal face material used (hard or soft), a static pre-strain is commonly
used to reduce the tendency of the faces opening during operation. The static pre-strain is
typically set by adjusting the assembly of a shaft and housing. For a face seal with a soft
face (such as PTFE) the static pre-strain results in a static deformation of the PTFE face
with relaxation in stress. As readers will see in later sections, PTFE material has a certain
amount of permanent deformation (plasticity) and recoil displacement (viscoelasticity)
such that the static pre-load will change after assembly. For the seals studied in this paper,
the displacement magnitudes are very small such that viscoelasticity is the dominant factor.
The approach taken in this study is to specify a certain amount of seal static deformation
(pre-strain). The pre-stress and pre-strain boundary conditions are illustrated further in the
two industrial applications discussed below.
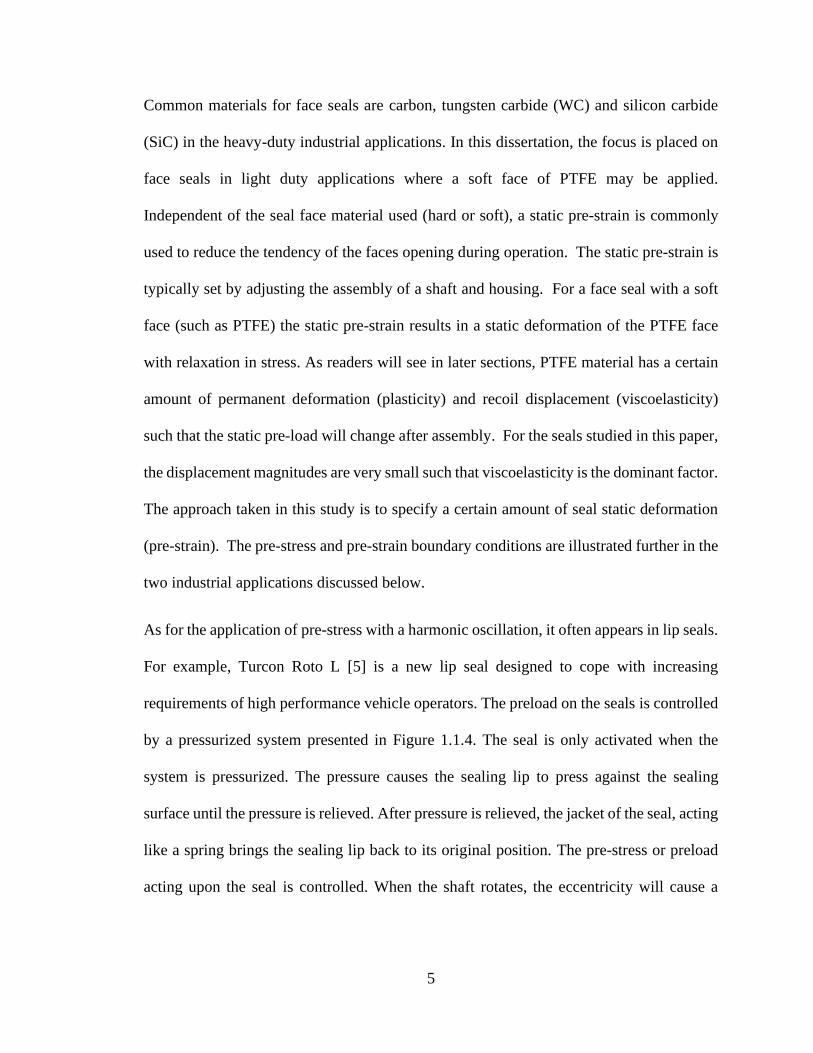
As for the application of pre-stress with a harmonic oscillation, it often appears in lip seals.
For example, Turcon Roto L [5] is a new lip seal designed to cope with increasing
requirements of high performance vehicle operators. The preload on the seals is controlled
by a pressurized system presented in Figure 1.1.4. The seal is only activated when the
system is pressurized. The pressure causes the sealing lip to press against the sealing
surface until the pressure is relieved. After pressure is relieved, the jacket of the seal, acting
like a spring brings the sealing lip back to its original position. The pre-stress or preload
acting upon the seal is controlled. When the shaft rotates, the eccentricity will cause a
6
harmonic oscillation. A conventional lip seal can replace this seal and the pre-load is
determined by a garter spring.
Figure 1.1.4: Functional Principle of Turcon Roto L lip seals.
Source: Adapted from [5]
Figure 1.1.5 a) shows a reciprocating hydraulic system sealed by O-rings. As presented in
Figure 1.1.5 b), the O-rings have pre-strains due to the clearance between the grooves and
the shaft when the shaft is static. The oscillation occurs if the shaft starts to reciprocate.
Similarly, for the rotation case in Figure 1.1.5 c), the O-ring is a rotary seal, where the
groove size prevents rotation of the O-ring. There is a pre-strain (or static displacement)
acting upon the O-ring and a harmonic oscillation exists when the shaft rotates. Figure
1.1.6 presents another type of mechanical face seals called PTFE bellow seals from John
CraneTM. The main components, seal face and bellows, use pure PTFE or carbon-filled
PTFE and the bellow provides a pre-stress for the seal surface.

7
a) Reciprocating seal application
b) Seals in reciprocation rod system
c) Seals in rotation shaft system
Figure 1.1.5: Illustration of pre-strain and harmonic oscillation.
Source: Adapted from [4]
8
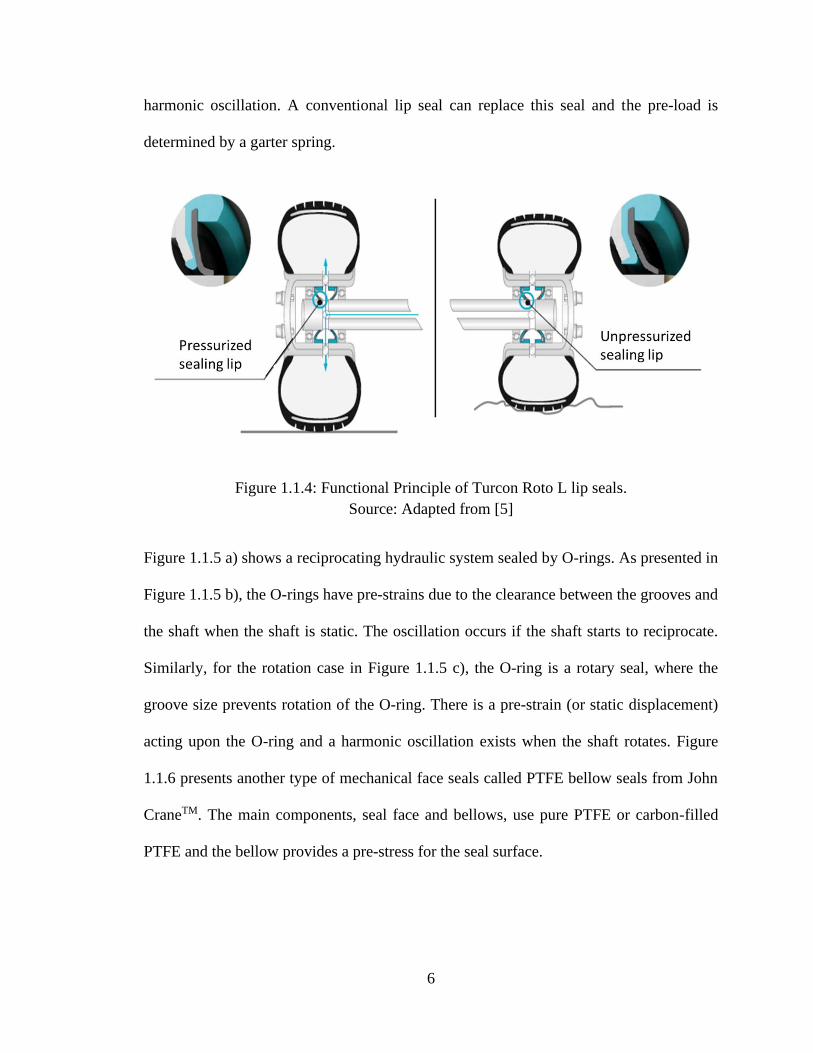
a) PTFE bellow seal
b) PTFE bellow seal components: 1) mechanical drive design; 2) replaceable seal
face; 3) flexible PTFE bellows design.
Figure 1.1.6: Illustration of Type 10T PTFE bellow seals.
Source: Adapted from [6]
9
The boundary conditions, pre-stains and pre-stress, are often used in the applications of
face seals. This research focuses on the dynamic face seals with pre-strains, which are
equivalent to static displacement of a seal face. It is treated as a non-homogeneous
boundary condition implemented through the penalty method in contact mechanics.
1.1.3 Seal Design Parameters
There are several key factors for seal design that include material, fluid, pressure,
temperature and time. For materials, it is the priority to consider involving almost all the
aspects of the ambient conditions in fluid, pressure, and thermal effects. For example, a
seal should not have chemical reactions with the fluid and the contact surface. Dynamic
pressures (oscillating or reciprocating) and static pressures may affect sealing performance.
Dynamic pressures may lead to separations under high frequencies. Static pressures can
cause relaxations and extrusions, which give rise to an increase of leakage and the failure
of a seal. In addition, the power loss, the product of frictional torque and rotational speed,
is related to the pressure and is commonly used in seal designs. Increasing pressures leads
to high frictional torque, which causes high wear rates though the leak rates are low. The
thermal effect of some materials is largely varied and a complete thermal analysis is
significant to ensure the choice of a material. Time is an easily overlooked dimension. In
fact, some materials properties in pressure and temperature are time or frequency
dependent. Shortly, a face seal may look like a concise component, but its design is quite
complicated if one requires reliable and accurate performance. These interactive
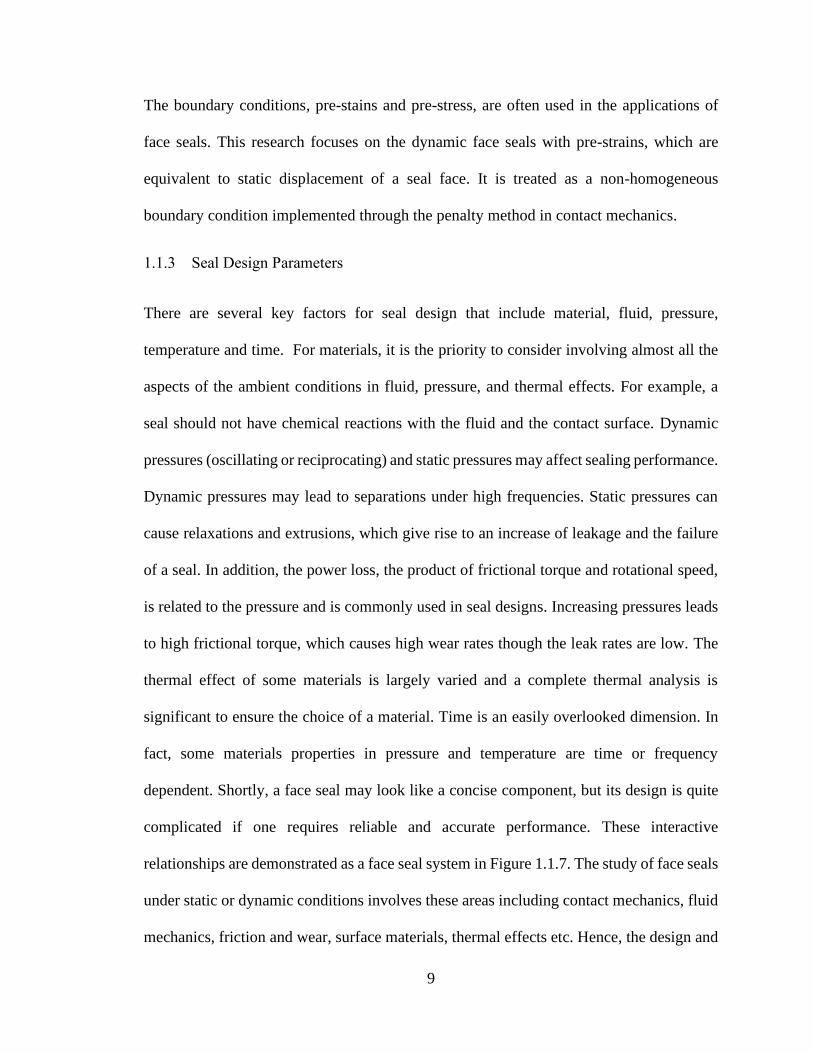
relationships are demonstrated as a face seal system in Figure 1.1.7. The study of face seals
under static or dynamic conditions involves these areas including contact mechanics, fluid
mechanics, friction and wear, surface materials, thermal effects etc. Hence, the design and
10
modeling of face seals is a comprehensive topic that attracts many researchers to
understand the fundamental mechanism of seals.
Figure 1.1.7: Face seal system.
Source: Adapted from [2]
1.2 Basics of PTFE-based materials
This section introduces the basics of PTFE-based materials including the history and
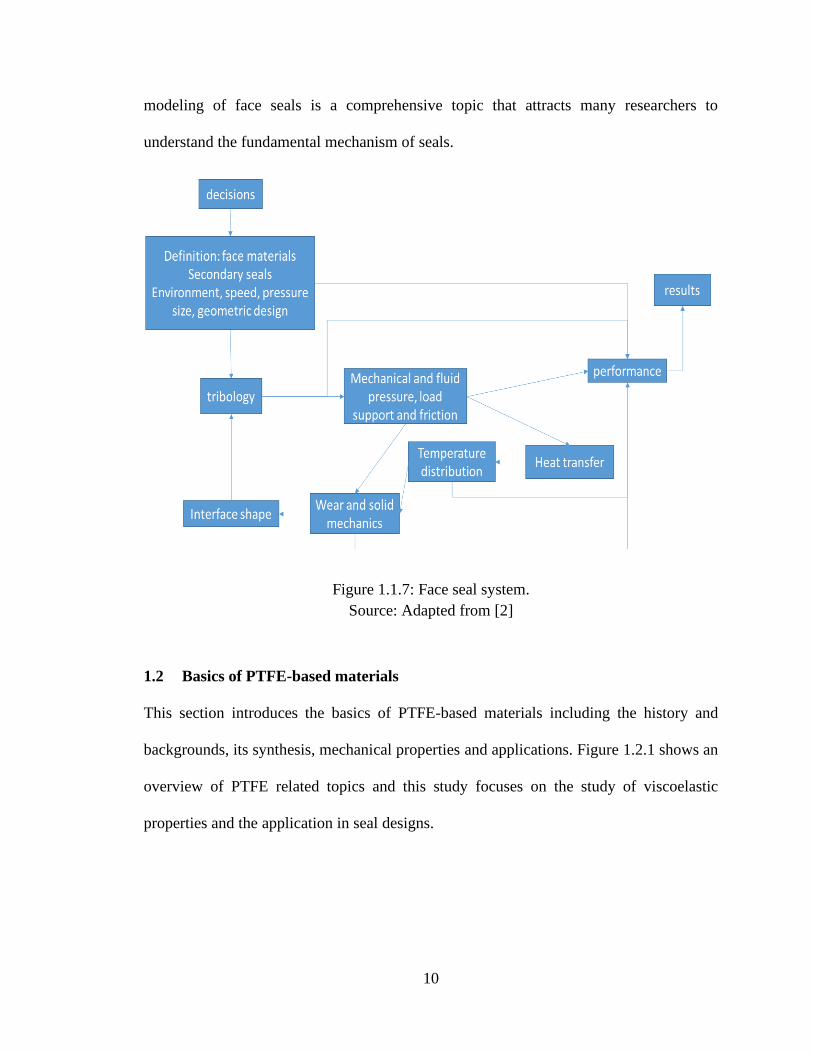
backgrounds, its synthesis, mechanical properties and applications. Figure 1.2.1 shows an
overview of PTFE related topics and this study focuses on the study of viscoelastic
properties and the application in seal designs.
11
Figure 1.2.1: Overview of PTFE.
Source: Adapted from [7]
1.2.1 History and background
“The discovery of polytetrafluoroethylene (PTFE) has been variously described as (1) an
example of serendipity, (2) a lucky accident and (3) a flash of genius. Perhaps all three
were involved. There is complete agreement, however, on the results of that discovery. It
revolutionized the plastics industry and led to vigorous applications not otherwise
possible”[8]
---- Dr. Roy J. Plunkett
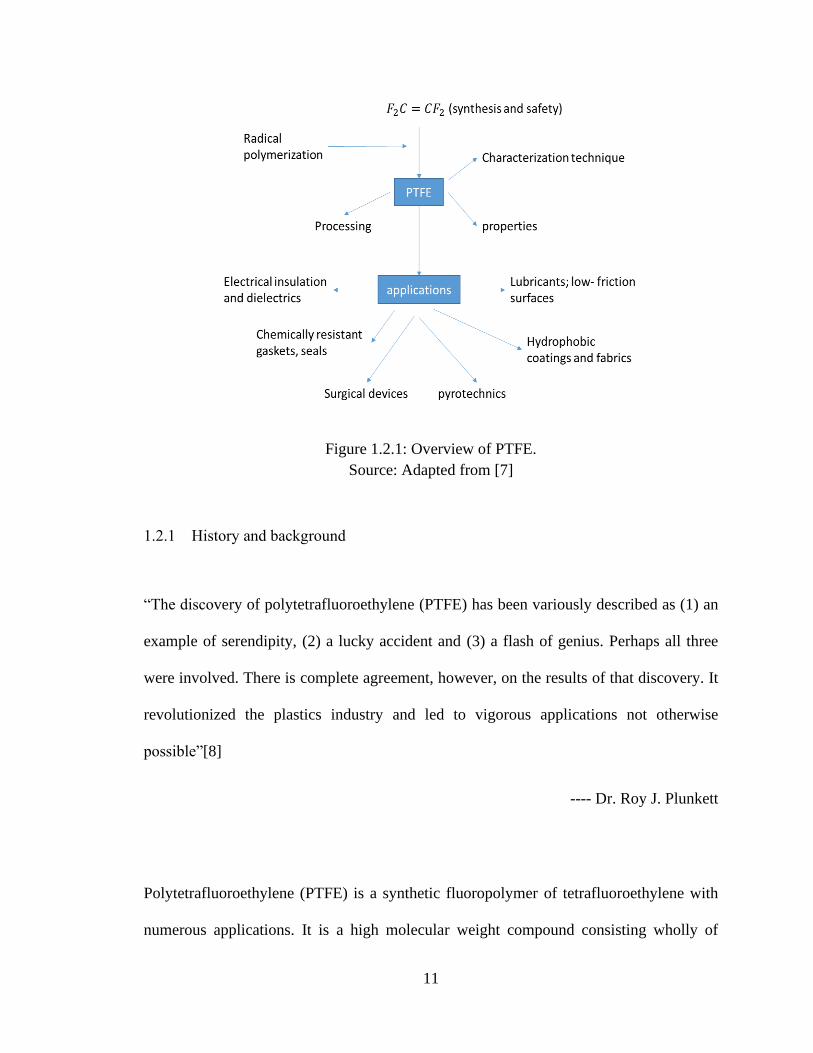
Polytetrafluoroethylene (PTFE) is a synthetic fluoropolymer of tetrafluoroethylene with
numerous applications. It is a high molecular weight compound consisting wholly of
12
carbon and fluorine presented in Figure 1.2.2. Teflon from DuPont is the well-known brand
name of PTFE-based formulas, which originally discovered the compound in 1938 by
accident.[9]
Figure 1.2.2: Structural formula of PTFE.
Plunkett first discovered the polymerization process of tetrafluoroethylene (TFE) under 1
bar pressure at 25 degC [7]. The gas was found to autopolymerize at 25 degC and produce
white, dusty powders. The concise version of the discovery story is quoted from [8] :
“ … By 1938, Dr. Roy Plunkett had been working at DuPont for 2 years, developing new
fluorinated refrigerants that were safer than old gases because of being nonflammable,
nontoxic, colorless, and odorless. He reacted tetrafluoroethylene (TFE) with hydrochloric
acid (HCl) for synthesis of a refrigerant, CClF2-CHF2 [2]. As he had done on many other
occasions, on the morning of April 6, 1938, Plunkett checked the pressure on a full cylinder
of TFE. He was surprised to find no pressure, and yet the weight of the cylinder was the
same as it had been the previous day. Plunkett and his technician removed the valve and
shook the cylinder upside down. When they cut open the gas cylinder, they recovered a
small amount of a slippery white substance. They analyzed the waxy powder and named
this new substance polytetrafluoroethylene, later trademarked as Teflon® by the DuPont
Company. …”. [8]
13
During the period of WWII, the Manhattan Project rescued Dr. Plunkett’s discovery.
Lieutenant General Leslie Richard Groves, who led the project, needs to acquire the raw
materials for isotope separation and PTFE played a significant role quoted from [8]:
“… needed corrosion-resistant materials for the uranium enrichment process… U-235 had
to be separated from U-238 using differential diffusion of UF6. UF6 is highly corrosive to
most metals, but PTFE stands up to it. Once the scientists involved in the Manhattan Project
verified its properties, the US Patent Office placed PTFE under a national “secrecy order”
and from then on it was referred to as “K-416.” Only one patent, with minimal content,
was issued to DuPont in 1941 to recognize its rights to the invention”.
After WWII in 1946, PTFE started to commercialize from pilot plant to massive production
operations. Many novel production methods are invented. For instance, Brubaker [10]
subsequently invented more rapid and economical process for the polymerization of
tetrafoluoroethylene in 1946. Since then, a large number of new methods are reported such
as free radical, coordination [11], electrochemical [12] and plasma-type polymerization
[13]. Thanks to the commercialization, the cost of PTFE is acceptable today and has been
widely used in our daily life and one of the most common application is for nonstick
cookware.
The costs of PTFE-based materials are based on fillers and fibers. A 12”x12” Teflon PTFE
sheet with 1” thickness is about 460~500 dollars. With the same dimensions, a PTFE sheet
filled with glass is 670 dollars and Rulon PTFE which has been modified with epoxy-
coated fiber is 700~800 dollars.
14
1.2.2 Properties of PTFE (Mechanical properties and tribology & friction coefficients)
PTFE materials are widely used as seals and bearings in the traditional markets like
pneumatics and hydraulics as well as in aerospace, energy, oil and gas, and beyond. PTFE
materials are suitable for use in harsh environments with temperatures ranging from
cryogenic (around −150°C) to 300°C in combination with highly aggressive media [14].
Pure PTFE is low cost, durable and recyclable [15]. Mixed virgin PTFE powder with
different fillers gives PTFE specific properties. For example, for high-speed dynamic
applications or extreme pressures, Polon™ PTFE grades and special seal designs are used.
Sealing elements or backup rings made from other engineering polymers such as PEEK
(Polyetheretheketone) or PI (Polyimide) compliment the product range for applications
where combined pressure and temperature loads push the limits of PTFE-based seals. PTFE
is famous for its low friction and self-lubricating properties as well as reduced stick-slip.
The hydrophobic nature is another key property of PTFE due to the low surface energy. By
adding the chemical agents amino (-NH2), carboxyl (-COOH) and sulfonic acid (-SO3H),
the surface of PTFE can be modified and optimized from hydrophobic to hydrophilic. To
increase the ratio of extension, the water contact angle of the surface is increased. Also,
adding the tungsten disulfide (IF-WS2) nanoparticles improves the hydrophobic property.
[15]
Though it has so many advantages, there are disadvantages for pure PTFE, like creep
behavior (also known as cold flow). Even at room temperature, PTFE experiences a
significant deformation over time when it is subjected to a continuous load. Also, pure
PTFE has low resilience (e.g. only 30% recovered on PTFE compared to 70% recovery on
15
silicone rubber [16]) and wears quickly despite its low coefficient of friction. Some pioneer
study in the adhesion of PTFE showed that surface films with low shear strength results in
the low coefficient of friction, but those films are easily removed which leads to high rates
of wear on PTFE [17, 18]. Hence, fillers are added to improve physical properties such as
creep and wear rate. Common filler elements are glass fiber, carbon and carbon-graphite,
carbon fiber, bronze, and Molybdenum disulfide (MoS2). The potential use of these filled
PTFE materials in seal and bearing applications motivates the comparison between them
and pure PTFE.
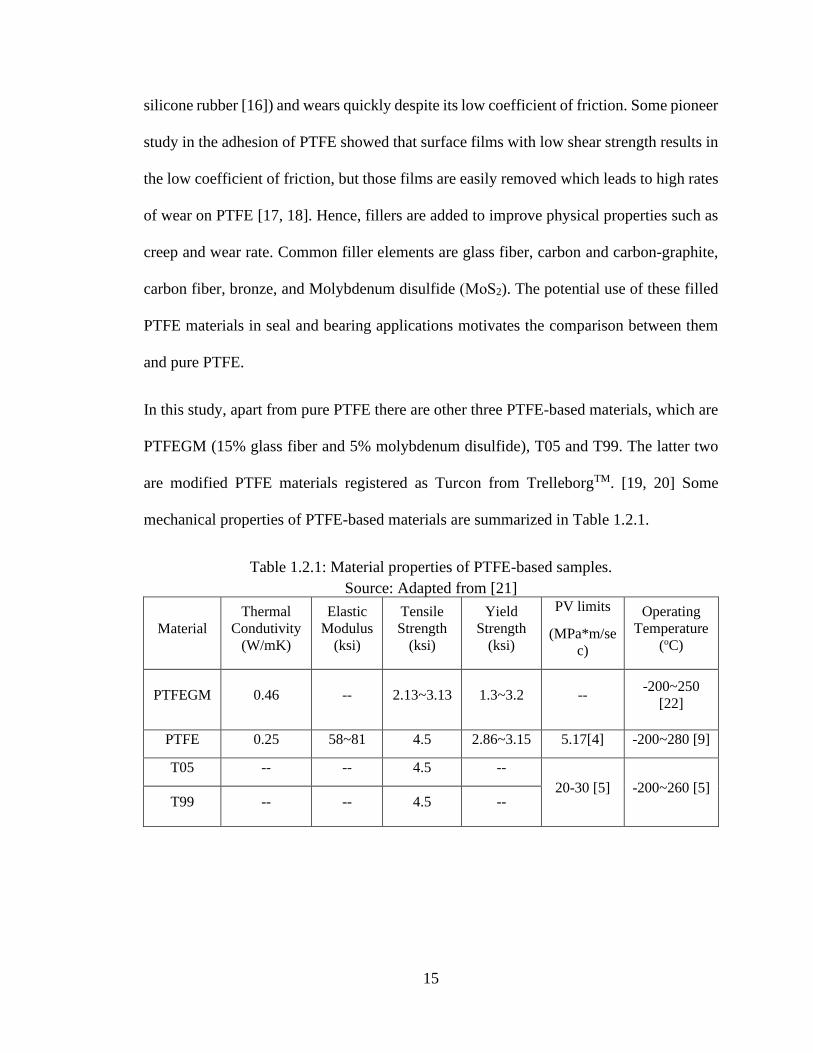
In this study, apart from pure PTFE there are other three PTFE-based materials, which are
PTFEGM (15% glass fiber and 5% molybdenum disulfide), T05 and T99. The latter two
are modified PTFE materials registered as Turcon from TrelleborgTM. [19, 20] Some
mechanical properties of PTFE-based materials are summarized in Table 1.2.1.
Table 1.2.1: Material properties of PTFE-based samples.
Source: Adapted from [21]
Material
Thermal
Condutivity
(W/mK)
Elastic
Modulus
(ksi)
Tensile
Strength
(ksi)
Yield
Strength
(ksi)
PV limits
(MPa*m/se
c)
Operating
Temperature
(oC)
PTFEGM 0.46 -- 2.13~3.13 1.3~3.2 -- -200~250
[22]
PTFE 0.25 58~81 4.5 2.86~3.15 5.17[4] -200~280 [9]
T05 -- -- 4.5 --
20-30 [5] -200~260 [5] T99 -- -- 4.5 --
16
1.2.3 Applications of PTFE-based materials for seals
There are many PTFE-based seal applications. For example, it is utilized as an O-ring for
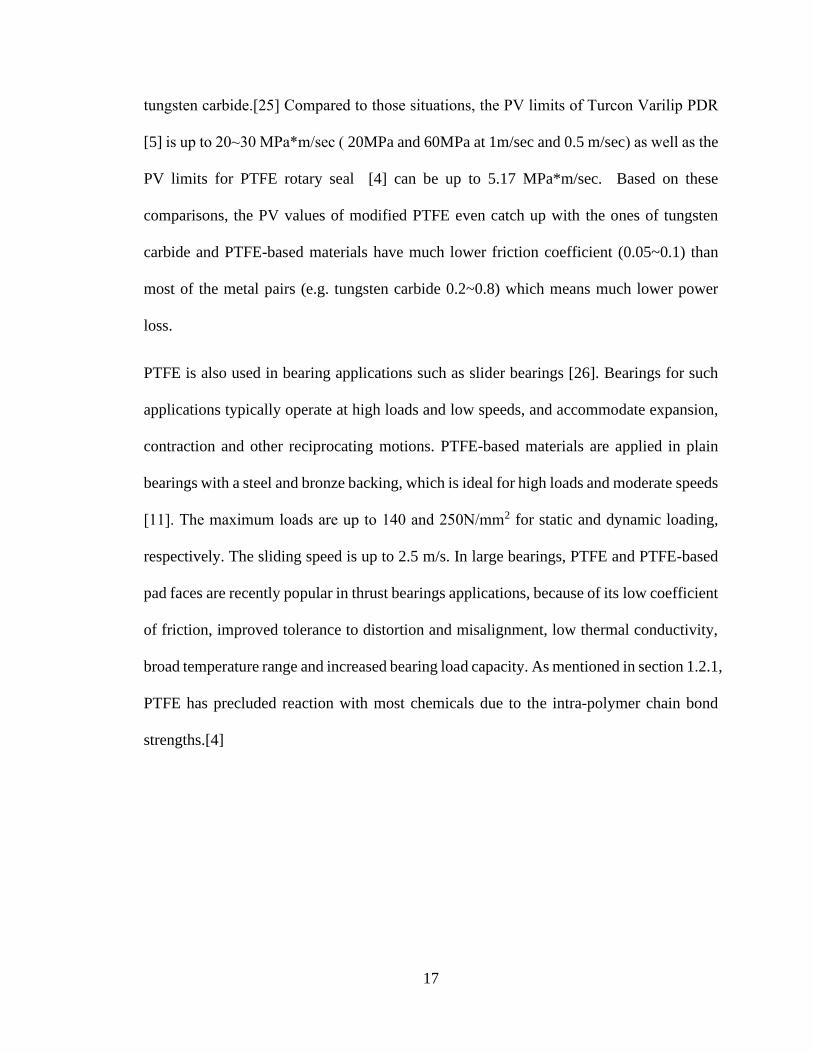
static seals. For dynamic seals, Parker Hannifin™ provides face seals branded as FlexiSeal
™ presented in Figure 1.2.3 under high surface speeds (up to 70m/s) and radial seals branded
as SlipperSeal™ under low surface speeds (<5, 10, 15m/s) [4]. SKF™ designs radial lip seals
with PTFE formulations used for more aggressive and abrasive applications than standard
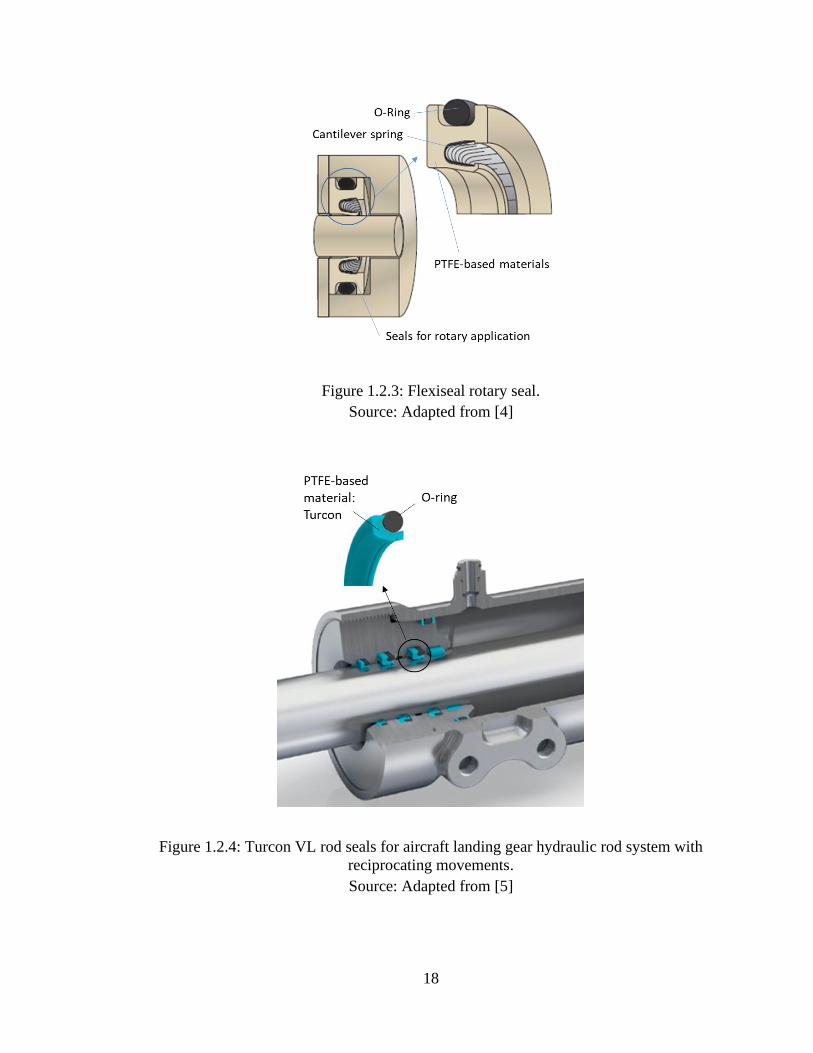
elastomeric materials ) [4]. Furthermore, Turcon [5] registered by Trelleborg™, a PTFE
based material, is widely utilized in aerospace and aircraft sealing applications including
aircraft rotary seals, aircraft static seals, airframe seals, and hydraulic rod seals [5].
Excellent friction properties, sliding properties and no stick-slip provide high sealing
efficiency. For example, Turcon VL rod seals are utilized in aircraft landing gears hydraulic
rod system for reciprocating movements shown in Figure 1.2.4. In addition, Turcon is
applied in a variety of medical, pharmaceutical and biotechnology applications such as
bone drills, swivels and valves [23]. A rotary seal system is demonstrated in Figure 1.2.5
including mechanical face seals, rotary shaft seals, cassette seals, radial lip seals and roto
L seals. Figure 1.2.6 presents a mechanical face seal used PTFE-coated O-rings for process
and chemical pumps. [24] Most of the seal components use PTFE-based materials as one
of the contact pairs, where the other contact pair is relatively very hard (rigid) by
comparison. The nominal pressure-velocity (PV), an indicator of duty severity used in the
sealing industry, is likely greater than 34MPa*m/sec. [25] In general practice, conventional
contacting face seals are within nominal PV limit of 17.23MPa*m/sec for paired carbon
and tungsten carbide seal face materials and 4.14MPa*m/sec for tungsten carbide versus
17
tungsten carbide.[25] Compared to those situations, the PV limits of Turcon Varilip PDR
[5] is up to 20~30 MPa*m/sec ( 20MPa and 60MPa at 1m/sec and 0.5 m/sec) as well as the
PV limits for PTFE rotary seal [4] can be up to 5.17 MPa*m/sec. Based on these
comparisons, the PV values of modified PTFE even catch up with the ones of tungsten
carbide and PTFE-based materials have much lower friction coefficient (0.05~0.1) than
most of the metal pairs (e.g. tungsten carbide 0.2~0.8) which means much lower power
loss.
PTFE is also used in bearing applications such as slider bearings [26]. Bearings for such
applications typically operate at high loads and low speeds, and accommodate expansion,
contraction and other reciprocating motions. PTFE-based materials are applied in plain
bearings with a steel and bronze backing, which is ideal for high loads and moderate speeds
[11]. The maximum loads are up to 140 and 250N/mm2 for static and dynamic loading,
respectively. The sliding speed is up to 2.5 m/s. In large bearings, PTFE and PTFE-based
pad faces are recently popular in thrust bearings applications, because of its low coefficient
of friction, improved tolerance to distortion and misalignment, low thermal conductivity,
broad temperature range and increased bearing load capacity. As mentioned in section 1.2.1,
PTFE has precluded reaction with most chemicals due to the intra-polymer chain bond
strengths.[4]
18
Figure 1.2.3: Flexiseal rotary seal.
Source: Adapted from [4]
Figure 1.2.4: Turcon VL rod seals for aircraft landing gear hydraulic rod system with
reciprocating movements.
Source: Adapted from [5]
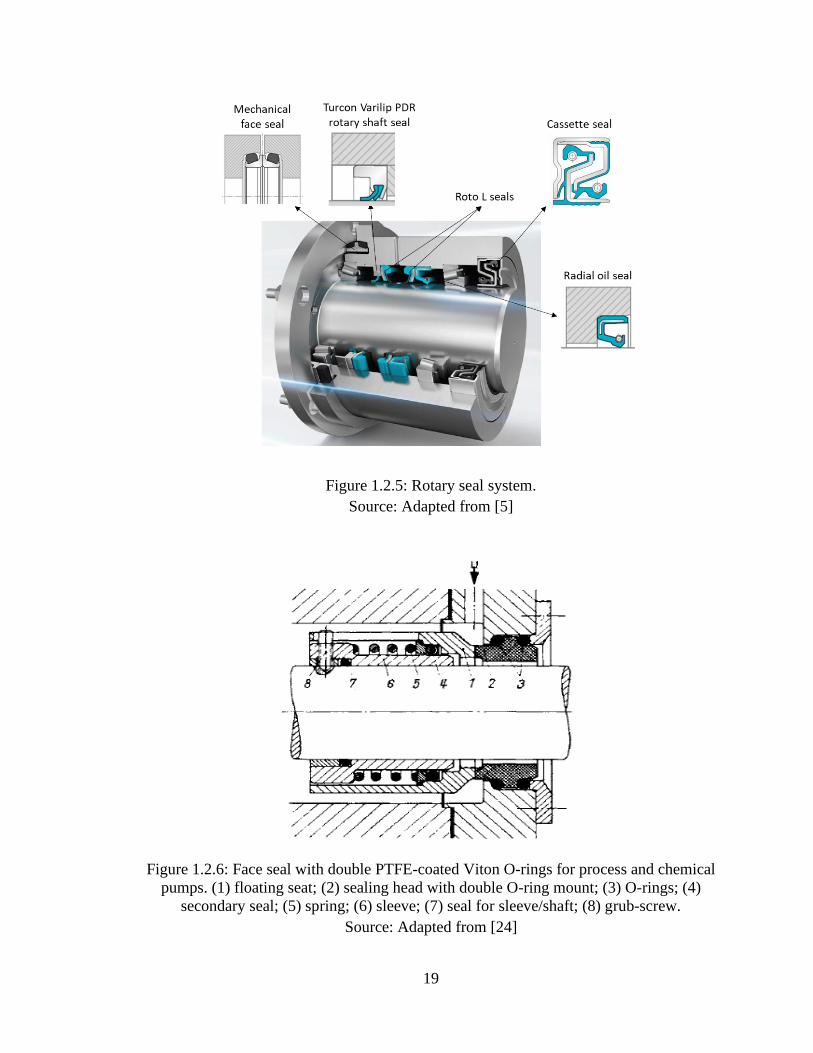
19
Figure 1.2.5: Rotary seal system.
Source: Adapted from [5]
Figure 1.2.6: Face seal with double PTFE-coated Viton O-rings for process and chemical
pumps. (1) floating seat; (2) sealing head with double O-ring mount; (3) O-rings; (4)
secondary seal; (5) spring; (6) sleeve; (7) seal for sleeve/shaft; (8) grub-screw.
Source: Adapted from [24]
20
1.3 Viscoelasticity of PTFE-based materials
Viscoelasticity is an important material property that affects sealing performance. Different
from elasticity, the viscoelastic characteristic is both time-dependent and frequency-
dependent. In the time domain, a relaxation modulus and creep compliance are defined to
depict the relations between stresses and strains. Figure 1.3.1 shows the output of a strain
and a stress curve if the input is a constant stress or strain, respectively. With a constant
stress input, the creep is defined as the b) curve presented in Figure 1.3.1. Similarly, the
relaxation stress is defined if the input is a constant strain input presented as the curve c).
More terminology is introduced for a complete recovery creep test in Figure 1.3.1 such as
a) the instantaneous elasticity, d) instantaneous recovery, e) delayed recovery and f)
permanent set. In Figure 1.3.2, plastic and elastic lines are also demonstrated for
comparison. Unlike the elastic line (or Young’s modulus), the variation of viscoelastic
process (relaxation modulus) is time-dependent including the startup stage (0<t<t1) and the
recovery stage (t>=t1). Viscoelastic materials may or may not have the plastic strain. In
Figure 1.3.3, Kelvin, Maxwell, Voigt model are presented as some basic damper and spring
system for simple viscoelastic behaviors. More complex situations are modeled through
the combinations of springs and dampers in parallel or in series such as generalized
Kelvin/Maxwell models in parallel/series.
21
Figure 1.3.1: Phenomena common to many viscoelastic materials: a) instantaneous
elasticity, b) creep under constant stress, c) stress relaxation under constant strain, d)
instantaneous recovery, e) delayed recovery, f) permanent set.
Source: Adapted from [27]
Figure 1.3.2: Viscoelastic materials compared to non-viscoelastic materials.
Source: Adapted from [27]
22
Storage modulus and loss modulus are defined to present the properties in the frequency
domain under a harmonic stress. The viscoelasticity of most composite materials is
frequency-dependent related to viscoelastic damping considered in a viscoelastic structure.
Since PTFE-based materials are widely used as face seals, it is critical to consider
viscoelastic damping to predict the separation of the faces due to oscillations. The
viscoelastic damping of a structure is much more mathematically complex but it is a more
accurate model than other defined damping parameters such as damping capacity, log
decrement, quality factor, damping ratio, viscous damping and etc. [28] The ratio of loss
modulus to storage modulus is defined as mechanical loss, tan δ to represent the damping.
In this study, Dynamic Mechanical Analyzer (DMA) is used to measures all the
viscoelastic characteristics in an experimental way. The Prony series and the GHM model
are applied to simulate viscoelasticity.
23
Figure 1.3.3: Main models for the viscoelastic behavior of polymeric materials. The load
is applied in ↓ and is removed in ↑.
Source: Adapted from [29]
24
1.4 Dissertation Overview
Chapter 2 summarizes previous work conducted on the viscoelasticity of PTFE-based
materials. The experimental measurements in viscoelasticity, the Prony series models in
the time and frequency domains, and the finite element models for viscoelastic damping
are reviewed. Much of this prior research enlightened the development of the current work
and many topics are of great importance as they are the fundamentals of viscoelastic
properties and derivations in numerical studies. This chapter is based on the work in the
sections of introduction published in Tribology international [30].
Chapter 3 presents the evaluation of the viscoelastic characteristics for pure PTFE,
PTFEGM, T05 and T99. Using a Dynamic Mechanical Analyzer (DMA), the storage
modulus, loss modulus and tan δ, are measured and discussed in the frequency domain.
The relaxation moduli and creep compliances are measured in the time domain. The
experimental data is then modeled with best fit curves using the Prony series and compared
to the experimental data. Finally, using Energy Dispersive X-ray Spectrometer for
composites measurement, the large error bars in creep compliances are explained. The
results in this chapter are also presented in Tribology International [30].
In Chapter 4, a hybrid model for viscoelastic damping separations is developed and
simulated for pure PTFE. The hybrid model combines the Golla-Hughes-McTavish (GHM)
finite element model, a delayed recovery creep model and a penalty method contact model.
The GHM and delayed recovery creep model are validated using the experimental data of
storage modulus and tan δ. Henceforth, the simulation results for face seal designs are
obtained that include the critical displacement ratio, the maximum separation height,
leakage rate and separation shape.
25
Chapter 5 repeats the work in chapter 4 and extends the simulation results for PTFEGM,
T05 and T99. The parameters for seal designs such as the critical displacement ratio, the
normalized maximum separation heights, leakage rate, are compared to the ones of pure
PTFE over the frequency range of interest. Results are also compared to the previous
experimental work in leakage rate and the discussion are made to take advantage of the
hybrid model.
Chapter 6 summarizes this research and identifies key conclusions for face seal designs
based on PTFE-based materials. Additional work is recommended for future studies that
address extensions of the current work and subsequent topics such as stick-slip
phenomenon, lubrication models and thermal effects.
Note that most of the material presented in Chapters 3 and 4 is close, or even verbatim, to
that published in my papers; see refs. [30] and [31].
26
CHAPTER 2. LITERATURE REVIEW
In this chapter, previous work conducted on the viscoelasticity of PTFE-based materials is
summarized. The experimental measurements in viscoelasticity, the Prony series models
in time and frequency domains, and the finite element models for viscoelastic damping are
reviewed.
2.1 Development and Applications of PTFE-based Materials for Seals
Seals made of PTFE-based materials are widely used in many engineering applications due
to the outstanding self-lubricating properties. The focus of literature for applications is
primarily on lip seal applications and, to a lesser extent, rotary face seals. The utilized face
materials varied in different applications. For example, Nichols et al claim a type of fluid
switching valve and its sealing faces are fluorocarbon-containing polymer and Tungsten
Carbide/Carbon [32]. Also, there are similar seals which are developed by Nichols [33, 34].
In the early 2010s, Moeller et al and Wan developed seal faces that allow a particular fluid
to flow, but is applied as a static seal that can be rotated to a different setting [35, 36]. In
the early 1990s, a seal surface on a shaft is developed by Stich, where fluid flows through
the shaft and then is directed circumferentially to the outer diameter of the shaft and
expelled into the static sealing area [37]. In the 1960s there was the development of a rotary
distributing valve claimed by Carson et al that utilized valves to transfer the fluid stream
from one conduit to any other conduits [38]. Until the study of the rotary face seal in PTFE-
based materials in [21], it shows that some modified PTFE face seals have outstanding
performance in leakage rate and power loss, in particular using pure PTFE, PTFEGM, T05
and T99.
27
PTFE-based face seals are widely used in the traditional markets like pneumatics and
hydraulics as well as in aerospace, energy, oil and gas, and beyond. PTFE materials are
suitable for use in harsh environments with temperatures ranging from cryogenic (around
-150°C) to 300 °C in combination with highly aggressive media [14]. A comprehensive
review for pure PTFE about its low cost, durability and recycling ability is illustrated by
[15]. Mixed virgin PTFE powder with different fillers gives PTFE specific properties. For
example, for high-speed dynamic applications or extreme pressures, PolonTM PTFE grades
and special seal designs are used. Sealing elements or backup rings made from other
engineering polymers such as PEEK (Polyetheretheketone) or PI (Polyimide) compliment
the product range for applications where combined pressure and temperature loads push
the limits of PTFE-based seals. PTFE is famous for its low friction and self-lubricating
properties as well as reduced stick-slip. Though it has so many advantages, there are
disadvantages for pure PTFE, like creep behavior. Even at room temperature, PTFE
experiences a significant deformation over time when it is subjected to a continuous load.
Also, pure PTFE has low resilience and wears quickly despite its low coefficient of friction.
The reason fillers are added is to improve physical properties such as creep and wear rate.
Common filler elements are glass fiber, carbon and carbon-graphite, carbon fiber, bronze,
and Molybdenum disulfide (MoS2).
Studying seals and bearings with different materials and seeking proper mathematical
models are the main objective for researchers. In Horve’s study [39] it is pointed out that
stress relaxation, creep and viscoelastic vibration and damping are seal variables that affect
seal performance when choosing seal materials. In [40, 41], the research indicated the
importance of dynamic viscoelasticity and provided relationships among friction, wear and
28
dynamic viscoelastic characteristics, however, the materials are mainly in metals. In recent
decades, many modified PTFE-based materials have been invented and tested. For example,
glass filled PTFE improves wear resistance as shown experimentally [42]. The torque and
re-torque relaxation responses of PTFE with 25% fiber glass are measured in [43].
Modified PTFEs, such as Turcon (from TrelleborgTM), are tested for friction and sealing
performance, showing lower wear rates and better sealing performance than pure PTFE
with no stick and slip for certain applications [44]. Pure PTFE and PTFEGM (15% glass
fiber and 5% molybdenum disulfide (MoS2) ), two types of Turcon, T05 and T99 were
compared in [21, 44] on the basis of friction, power loss and leakage for a novel valve seal
application. T05 and T99 are more than 50 years old and used widely. They have been
found to be superior in certain applications. MoS2 is a kind of solid lubricant, and the
friction coefficient is around 0.05 in vacuum or inert atmospheres. However, its coefficient
of friction is greatly increased to 0.1 to 0.15 if water is presented and the coating wear
faster [45]. For glass fiber, it can improve wear resistance, friction coefficient and
hardness.[46] Besides, glass fibers affect the abrasiveness and thermal conductivity. [47]
This dissertation studies and simulates the viscoelastic response of pure PTFE, PTFEGM,
T05 and T99 used as face seals.
Very common in the literature, the thermomechanical properties of polymers are studied.
Qu and Wang [48] studied thermomechanical properties of PTFE with PEEK, carbon fiber
and graphite flakes. The volume fractions of PTFE are low in their experimental samples.
In Wang et al [49] the effects of temperature, sliding speed and load on the tribological
properties of polymers are investigated. In particular, the viscoelastic material properties
of storage modulus and tan δ are compared at different temperatures. The dynamic
29
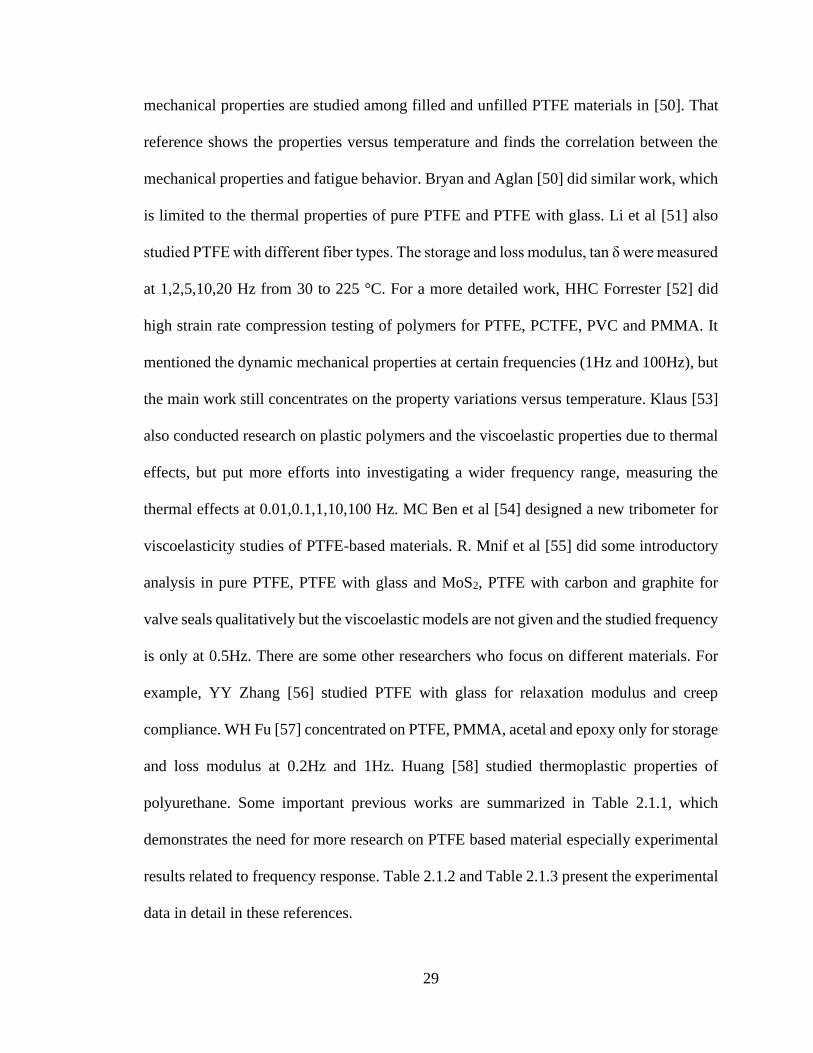
mechanical properties are studied among filled and unfilled PTFE materials in [50]. That
reference shows the properties versus temperature and finds the correlation between the
mechanical properties and fatigue behavior. Bryan and Aglan [50] did similar work, which
is limited to the thermal properties of pure PTFE and PTFE with glass. Li et al [51] also
studied PTFE with different fiber types. The storage and loss modulus, tan δ were measured
at 1,2,5,10,20 Hz from 30 to 225 °C. For a more detailed work, HHC Forrester [52] did
high strain rate compression testing of polymers for PTFE, PCTFE, PVC and PMMA. It
mentioned the dynamic mechanical properties at certain frequencies (1Hz and 100Hz), but
the main work still concentrates on the property variations versus temperature. Klaus [53]
also conducted research on plastic polymers and the viscoelastic properties due to thermal
effects, but put more efforts into investigating a wider frequency range, measuring the
thermal effects at 0.01,0.1,1,10,100 Hz. MC Ben et al [54] designed a new tribometer for
viscoelasticity studies of PTFE-based materials. R. Mnif et al [55] did some introductory
analysis in pure PTFE, PTFE with glass and MoS2, PTFE with carbon and graphite for
valve seals qualitatively but the viscoelastic models are not given and the studied frequency
is only at 0.5Hz. There are some other researchers who focus on different materials. For
example, YY Zhang [56] studied PTFE with glass for relaxation modulus and creep
compliance. WH Fu [57] concentrated on PTFE, PMMA, acetal and epoxy only for storage
and loss modulus at 0.2Hz and 1Hz. Huang [58] studied thermoplastic properties of
polyurethane. Some important previous works are summarized in Table 2.1.1, which
demonstrates the need for more research on PTFE based material especially experimental
results related to frequency response. Table 2.1.2 and Table 2.1.3 present the experimental
data in detail in these references.
30
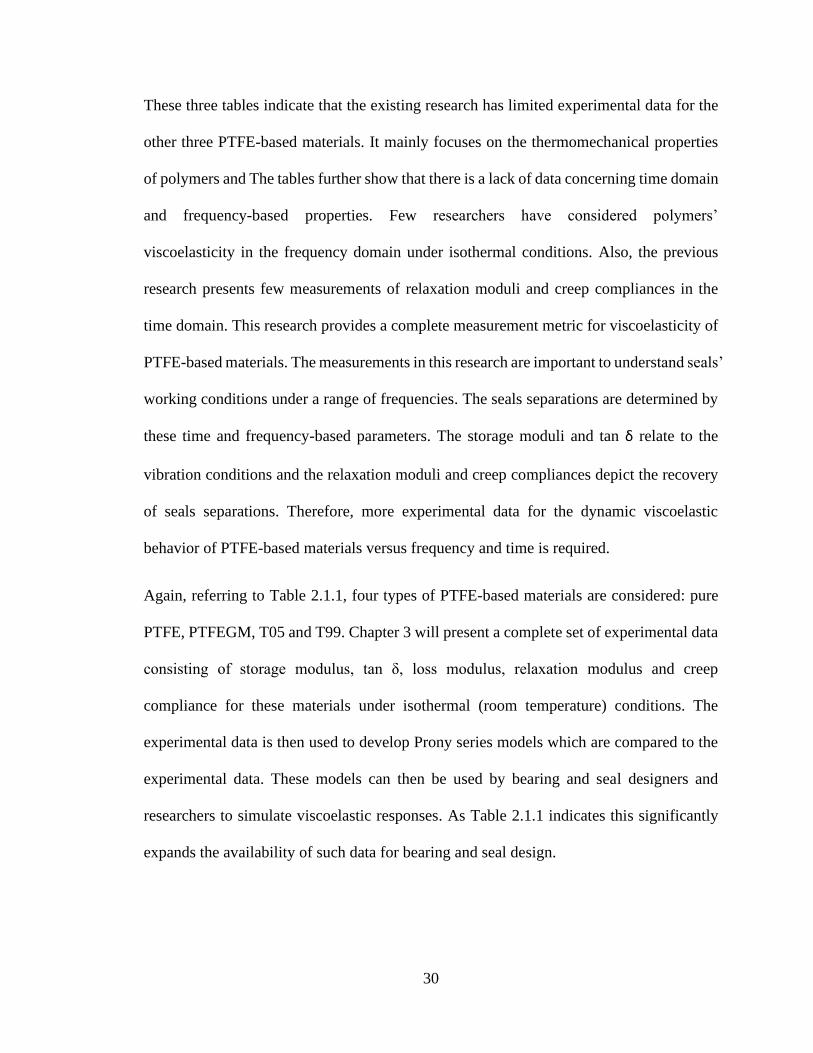
These three tables indicate that the existing research has limited experimental data for the
other three PTFE-based materials. It mainly focuses on the thermomechanical properties
of polymers and The tables further show that there is a lack of data concerning time domain
and frequency-based properties. Few researchers have considered polymers’
viscoelasticity in the frequency domain under isothermal conditions. Also, the previous
research presents few measurements of relaxation moduli and creep compliances in the
time domain. This research provides a complete measurement metric for viscoelasticity of
PTFE-based materials. The measurements in this research are important to understand seals’
working conditions under a range of frequencies. The seals separations are determined by
these time and frequency-based parameters. The storage moduli and tan δ relate to the
vibration conditions and the relaxation moduli and creep compliances depict the recovery
of seals separations. Therefore, more experimental data for the dynamic viscoelastic
behavior of PTFE-based materials versus frequency and time is required.
Again, referring to Table 2.1.1, four types of PTFE-based materials are considered: pure
PTFE, PTFEGM, T05 and T99. Chapter 3 will present a complete set of experimental data
consisting of storage modulus, tan δ, loss modulus, relaxation modulus and creep
compliance for these materials under isothermal (room temperature) conditions. The
experimental data is then used to develop Prony series models which are compared to the
experimental data. These models can then be used by bearing and seal designers and
researchers to simulate viscoelastic responses. As Table 2.1.1 indicates this significantly
expands the availability of such data for bearing and seal design.
31
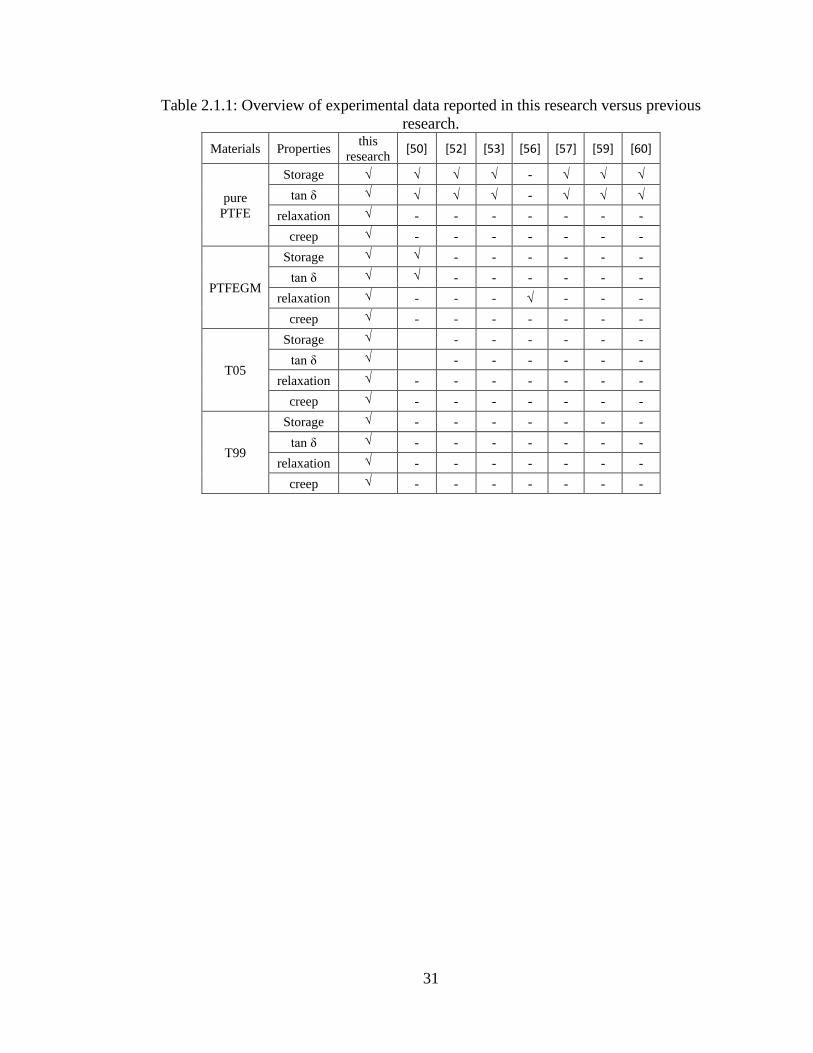
Table 2.1.1: Overview of experimental data reported in this research versus previous
research.
Materials Properties this
research [50] [52] [53] [56] [57] [59] [60]
pure
PTFE
Storage √ √ √ √ - √ √ √
tan δ √ √ √ √ - √ √ √
relaxation √ - - - - - - -
creep √ - - - - - - -
PTFEGM
Storage √ √ - - - - - -
tan δ √ √ - - - - - -
relaxation √ - - - √ - - -
creep √ - - - - - - -
T05
Storage √ - - - - - -
tan δ √ - - - - - -
relaxation √ - - - - - - -
creep √ - - - - - - -
T99
Storage √ - - - - - - -
tan δ √ - - - - - - -
relaxation √ - - - - - - -
creep √ - - - - - - -
32
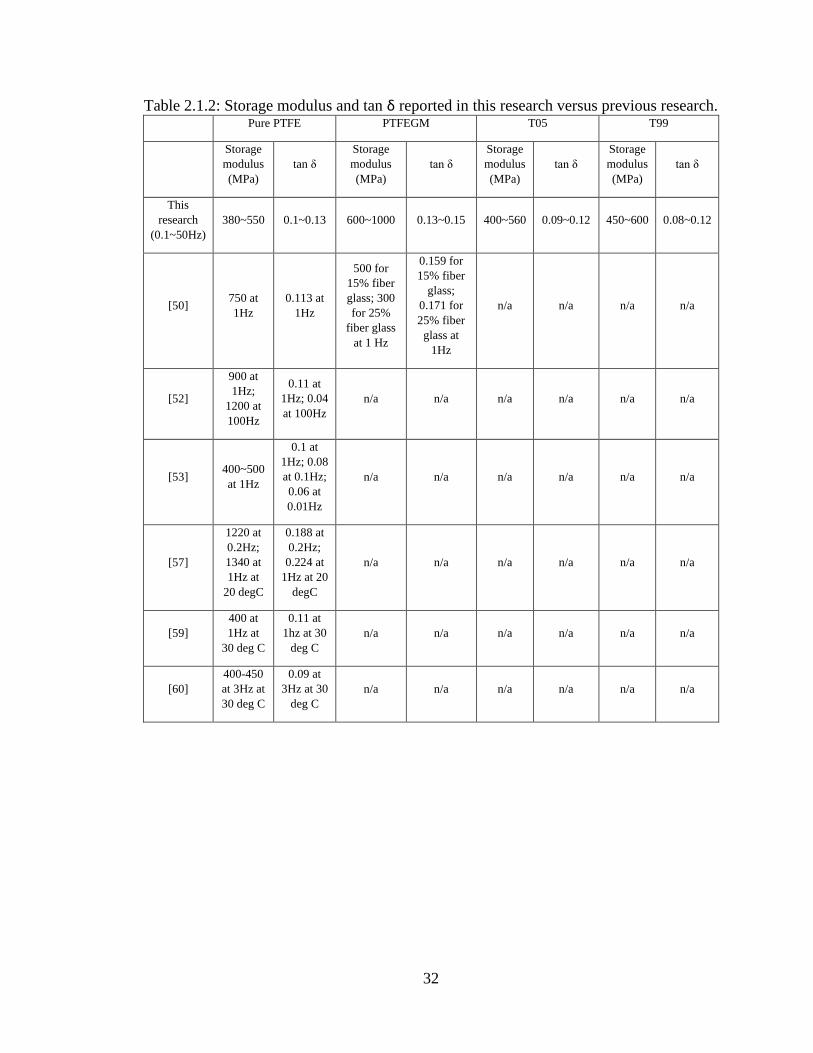
Table 2.1.2: Storage modulus and tan δ reported in this research versus previous research. Pure PTFE PTFEGM T05 T99
Storage
modulus
(MPa)
tan δ
Storage
modulus
(MPa)
tan δ
Storage
modulus
(MPa)
tan δ
Storage
modulus
(MPa)
tan δ
This
research
(0.1~50Hz)
380~550 0.1~0.13 600~1000 0.13~0.15 400~560 0.09~0.12 450~600 0.08~0.12
[50] 750 at
1Hz
0.113 at
1Hz
500 for
15% fiber
glass; 300
for 25%
fiber glass
at 1 Hz
0.159 for
15% fiber
glass;
0.171 for
25% fiber
glass at
1Hz
n/a n/a n/a n/a
[52]
900 at
1Hz;
1200 at
100Hz
0.11 at
1Hz; 0.04
at 100Hz
n/a n/a n/a n/a n/a n/a
[53] 400~500
at 1Hz
0.1 at
1Hz; 0.08
at 0.1Hz;
0.06 at
0.01Hz
n/a n/a n/a n/a n/a n/a
[57]
1220 at
0.2Hz;
1340 at
1Hz at
20 degC
0.188 at
0.2Hz;
0.224 at
1Hz at 20
degC
n/a n/a n/a n/a n/a n/a
[59]
400 at
1Hz at
30 deg C
0.11 at
1hz at 30
deg C
n/a n/a n/a n/a n/a n/a
[60]
400-450
at 3Hz at
30 deg C
0.09 at
3Hz at 30
deg C
n/a n/a n/a n/a n/a n/a
33
Table 2.1.3: Relaxation modulus and creep compliances reported in this research versus
previous research.
2.2 Modeling of Frequency Dependent Viscoelastic Effects
The viscoelasticity of PTFE-based seals is one of the important material properties
affecting seal performance [61]. Separation of seal surfaces due to viscoelasticity has been
illustrated and validated by experiments. Researchers continue to seek a viscoelastic model
Pure PTFE PTFEGM T05 T99
Relaxation
modulus
(MPa)
Creep
compliance
(μm2/N)
Relaxation
modulus
(MPa)
Creep
compliance
(μm2/N)
Relaxation
modulus
(MPa)
Creep
compliance
(μm2/N)
Relaxation
modulus
(MPa)
Creep
compliance
(μm2/N)
This
research
400~200 at
0.2% for 10
min;
300~120 at
0.5% for 10
min
2000~5000
at 0.2MPa
for 10 min;
2000~6000
at 0.4MPa
for 10 min
480~220
at 0.2%
for 10
min;
400~150
at 0.5%
for 10 min
1000~5200
at 0.2MPa
for 10 min;
1000~4200
at 0.4MPa
for 10 min
400~210
at 0.2%
for 10
min;
400~150
at 0.5%
for 10 min
2000~5000
at 0.2MPa
for 10 min;
2000~4200
at 0.4MPa
for 10 min
450~250
at 0.2%
for 10
min;
380~150
at 0.5%
for 10 min
2000~4800
at 0.2MPa
for 10 min;
2000~3500
at 0.4MPa
for 10 min
[50] n/a n/a n/a n/a n/a n/a n/a n/a
[52] n/a n/a n/a n/a n/a n/a n/a n/a
[53] n/a n/a n/a n/a n/a n/a n/a n/a
[56] n/a n/a
100~60
with glass
fibers
coated for
72 hours;
uniaxial
tensile test
prestress
4e-3MPa
n/a n/a n/a n/a n/a
[59]
Compressive
modulus
405.9 under
average
shore D
hardness test
with
compressive
stress at 5%
and 10%
strain.
n/a n/a n/a n/a n/a n/a n/a
[60] n/a n/a n/a n/a n/a n/a n/a n/a
34
to completely simulate this process. However, the study of viscoelastic models in tribology
is still incomplete, particularly due to lack of models including accurate viscoelastic
damping at different frequencies and prediction of the seal material response when
separation occurs. Consequently, the magnitude of the leaks due to gaps formed between
sealing surfaces by viscoelastic damping cannot be determined using existing models. This
magnitude of the gaps versus time is required to estimate seal leakage, the most
fundamental performance criteria of mechanical seals, and is helpful in further analysis
that may include lubrication models, where a film thickness estimate is required.
The response of viscoelastic materials is separated into that due to static inputs and that
due to dynamic (harmonic) inputs. For static inputs, one test measures the creep
compliance, J(t), which predicts the behavior of the material in the time domain due to a
constant applied stress. This includes the free response of the material, which tends towards
its initial, unstressed position when the constant stress input is removed. The creep
compliance corresponding to the free response of the material is termed the delayed
recovery compliance, JR(t), and is of particular interest in this study as it is the response of
the viscoelastic seal material when a gap between the seal faces occurs. Another material
response for static inputs is the stress response of the material due to a constant applied
strain. This is characterized by the time dependent relaxation modulus, E(t), and is useful
for determining the transient stress response and the steady state seal static preload that is
commonly used in seals. For a dynamic input the complex modulus, E*(ω)=E’(ω) + E’’(ω),
which is comprised of the storage modulus, E’(ω), and loss modulus, E’’(ω), represents the
frequency dependent properties. Finally, the mechanical loss (termed tan 𝛿) is the ratio of
the loss modulus to storage modulus and is commonly used to characterize viscoelastic
35
damping, where δ is the phase lag of the viscoelastic strain response to the applied stress.
Reference [27] provides more details of viscoelastic materials. Thus, the sealing
performance of PTFE-based seals is completely describable and predictable if there is a
viscoelastic model that simulates the behaviors in time and frequency domain, both when
the seal surfaces are in contact and when they are separated. A model that includes these
effects would provide insights into quantifying leakage and improving seal design.
Some researchers have studied viscoelasticity of seals. In reference [21], these materials
(pure PTFE, PTFEGM, T05 and T99) were used in an end face rotary valve seal, and the
seal performance was examined showing reduced friction torque and small leakage rates.
That research focused on experimental measurements and qualitative analysis. A numerical
model for such a system would be beneficial for seal leakage design and analysis. Several
papers have examined elements of numerical models to predict gap formation in seals.
Stakenborg et al [62] studied gap formation in rotary lip seals made of nitrile rubber. He
used a transfer function (frequency based) representation of the complex modulus to
predict separation. The transfer function is derived by performing a sine sweep on the seal
contact region in a finite element model. The finite element approach used is that of
Morman and Nachtagal [63], who demonstrated that incompressible, fading memory
viscoelastic materials subject to a static preload and a small harmonic oscillation, can be
modelled using superposition by separating the static part from the harmonic part. The
finite element formulation of that work does not predict the stress relaxation transients
along with the harmonic response. Stakenborg [62] found that for nitrile rubber, seal gaps
occur due to a relatively large variation of the storage modulus between 0.1Hz and 100Hz
(a large rubbery-to-glassy transition) and specifically not due to any phase shift related to
36
viscoelastic damping. By contrast, PTFE based materials have a relatively small rubbery-
to-glass transition over this frequency range at room temperature, as demonstrated in
measurements presented in [52]. A second factor, viscoelastic damping, is characterized
by the relatively large, frequency dependent phase lag (mechanical loss) and can also create
conditions for separation of sealing surfaces. Stakenborg et al [62] found negligibly small
mechanical loss for nitrile rubber at the face separation frequency. But for PTFE, a
relatively large mechanical loss was measured in this dissertation. This study focuses on
generating and validating a model to capture the viscoelastic damping effect in PTFE and
predict when a seal face separation occurs and the magnitude of this separation for static
and dynamic inputs in the time domain. Note that the general method is applicable to cases
of materials with large rubbery-to-glass transitions and those with large viscoelastic
damping, just the same.
To compute viscoelastic damping, researchers have taken a variety of approaches for
numerical models, predominantly based on the finite element method. Perhaps the most
well-known is the modal strain energy method, introduced by Johnson and Kieholz [64].
This is a popular method for light damping, where a small percentage of modal damping
is added to each mode shape. This percentage is arbitrary in many cases (1~2% might be
a rule of thumb). The need for a more systematic method for damping in structures was
discussed in several references. Approaches that integrate the viscoelastic properties based
on DMA measurements into the model have been proposed and utilized in a variety of
applications beyond tribology. Bagley and Torvik [65] first used a fractional derivative
model for viscoelastic material behavior. In that method, an expression in the Laplace
domain with four or five parameters is used for complex modulus data along with curve
37
fitting. These modelling approaches are typical in that the resulting finite element equations
are in non-canonical form such that standard finite element solution modules cannot easily
be used to solve them, especially in the time domain. Reference [63] is another example
where the resulting finite element matrices are complex valued and non-canonical.
Several models for viscoelasticity have been developed based on the Golla-Hughes-
McTavish (GHM) approach, which was presented in several papers, most notably [66] and
[67]. In the GHM method, fictitious “dissipation coordinates” are introduced and the
frequency-dependent viscoelastic behavior is added by doing curve fitting in the frequency
domain. Since the dissipation coordinates increase the size of the finite element matrices,
a disadvantage is an increase in computational time. However, there are two computational
benefits of the GHM method: 1) the resulting equations are in canonical form such that
they can be solved using standard finite element solution tools, and 2) they can be solved
in the time domain, where many of the alternative approaches are limited. This second
benefit is especially relevant when constructing a model for PTFE where the sealing
separation (gap) versus both temporal and spatial parameters is of importance to estimate
seal leakage and possible lubrication effects.
Friswell et al [68] used the general form presented in Bagley and Torvik [65] that included
more curve fitting using the GHM model. Lesieutre and Mingori [28] developed the
method of Augmenting Thermodynamic Field (ATF), another variation on the GHM
approach. However, the dissipation coordinates in ATF cannot be added into the element
mass matrix, and thus it cannot be applied in a classical second-order form of the assembled
structural model [28]. Wang and Inman [69] used GHM to investigate the frequency-
dependent viscoelastic dynamics of a multifunctional composite cantilever beam. Modal
38
analysis with experimental validation was presented and the model transformed into a first
order state-space form used for active vibration control. Trindade et al [70] did similar
study in frequency dependent viscoelastic materials for active-passive vibration damping
of a cantilever beam and compared the results based on ADF and GHM models. Barbosa
and Farage [71] studied sandwich viscoelastic beams through GHM-based finite element
model and validated between experimental and numerical results. These related research
topics focus on the damping factors of a cantilever beam or truss structures in the frequency
domain instead of in the area of tribology and seals, where modeling of the gap that forms
is a critical added effect. An inherent component of a model for sealing surfaces opening
and closing versus time where one surface is a viscoelastic material and the other is ideally
rigid, is contact between the two surfaces. A viscoelastic contact model of polymer-based
materials is studied in [72], and presents a semi-analytical model that provides results for
harmonic response and discusses energy dissipation due to viscoelastic phase lag. The
model does not, however, study or simulate the gaps caused by viscoelasticity.
For the plasticity of PTFE-based materials, Peng et al [73] performed numerical and
experimental study and considered plastic strain of combined seals. The studied material
is Turcon M30, virgin PTFE compounded with polyaryletherketone and graphite. The
compression test data indicates that the plastic deformation occurs when the compression
ratio is 8%. In [74], it demonstrated the yield stress is higher in compression than in tension
and the yield strain in compression is about 5%. The study in this research is under small
strain (strain 0.33%~1.65%) response of PTFE materials, which is much less than the yield
strain shown in Figure 2.2.1. Also, PTFE samples are tested at multiple strain-rates in [75,
76], where the plastic deformation starts at 5%~8%, which are far more beyond the
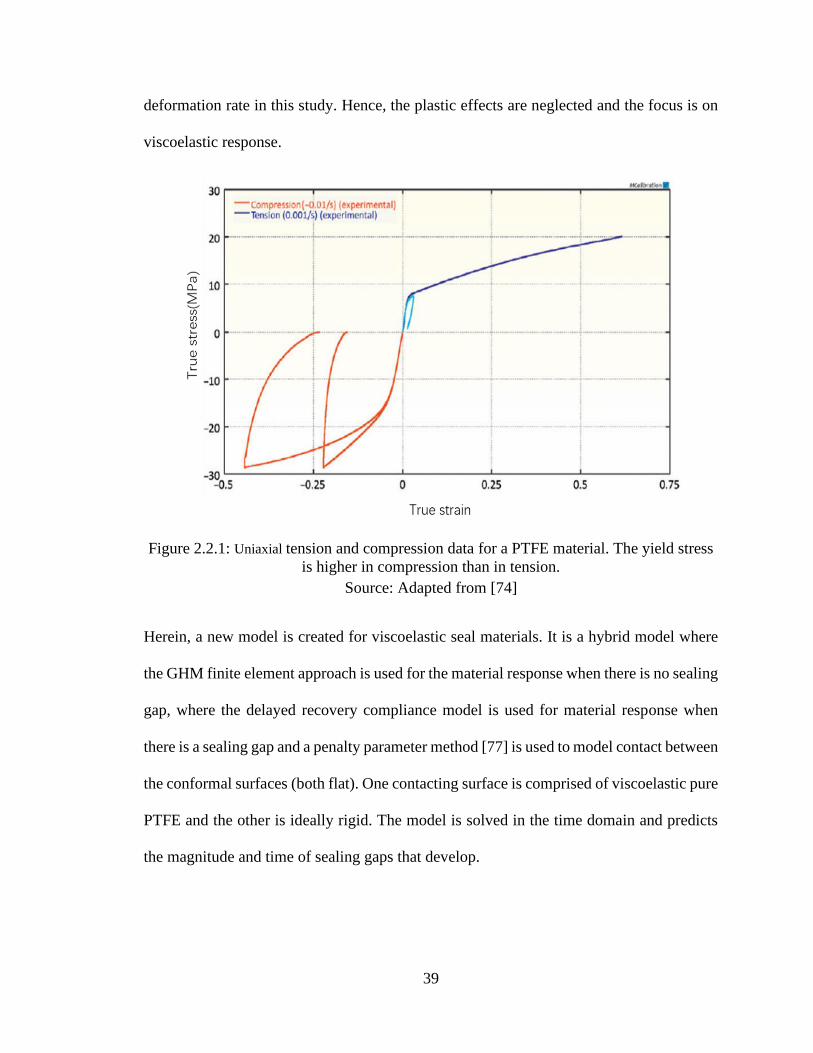
39
deformation rate in this study. Hence, the plastic effects are neglected and the focus is on
viscoelastic response.
Figure 2.2.1: Uniaxial tension and compression data for a PTFE material. The yield stress
is higher in compression than in tension.
Source: Adapted from [74]
Herein, a new model is created for viscoelastic seal materials. It is a hybrid model where
the GHM finite element approach is used for the material response when there is no sealing
gap, where the delayed recovery compliance model is used for material response when
there is a sealing gap and a penalty parameter method [77] is used to model contact between
the conformal surfaces (both flat). One contacting surface is comprised of viscoelastic pure
PTFE and the other is ideally rigid. The model is solved in the time domain and predicts
the magnitude and time of sealing gaps that develop.
40
2.3 Research Objectives
• Expand the availability of measurements of viscoelastic properties for the common
PTFE-based materials: pure PTFE, PTFEGM, T05 and T99. In particular, measure
relaxation moduli and creep compliances in the time domain, and storage moduli
and tan δ in the frequency domain.
• Obtain numerical models based on the Prony series that depict the viscoelasticity
for the four PTFE-based materials. Compare and understand those measured
viscoelastic characteristics and recommend seal designs that utilize the insights
from these measurements. Briefly discuss the results in terms of linearity and
applicability to bearing and seal applications
• Develop a finite element model that can compute the viscoelasticity of these PTFE-
based face seals both in the time and frequency domain. Validate the simulation
results with the experimental data.
• Solve face separations due to the viscoelastic damping over the frequency range of
interest through a numerical model. Obtain the preconditions for the simulation of
separations and present other related parameters, such as leakage rate and
separation shape, for face seal designs.
• Correlate the viscoelastic properties with the simulation results and recommend
face seal designs based on the properties of viscoelastic materials and the
simulation results.
41
CHAPTER 3. EVALUATION OF VISCOELASTIC CHARACTERISTICS OF PTFE-BASED
MATERIALS USED AS SEALS
This chapter concentrates on the measurements of PTFE-based materials. Using a dynamic
mechanical analyzer (DMA), the storage modulus, loss modulus and tan δ, are measured
and discussed in the frequency domain. The relaxation moduli and creep compliances are
measured and studied in the time domain. Finally, the materials’ compositions are studied
using Energy Dispersive X-ray Spectrometer for composites measurement. The
experimental data is then modeled with best fit curves using the Prony series and compared
to the experimental data.
3.1 Theories in Viscoelasticity
3.1.1 Relaxation Modulus and Creep Compliance
The relaxation modulus E(t) and creep compliance D(t) are time dependent responses to
static step inputs. For relaxation tests, slow continuous stresses are recorded when a
constant strain is applied. The relaxation modulus is given by Equation (3.1.1).
E(t) =σ(t)
ϵ0 (3.1.1)
Similarly, creep compliance is slow continuous deformation under constant stress applied
during a test. The creep compliance is given by Equation (3.1.2).
D(t) =ϵ(t)
σ0 (3.1.2)
Park [78] provides details about numerical modeling of viscoelastic materials. Assuming
linear viscoelasticity, relaxation and creep are slow developing exponential responses.
Therefore, they can be approximated using a Prony series as
42
E(t) ≈ Ee +∑Eie−(t/ρi)
m
i=1
(3.1.3)
D(t) ≈ Dg +t
η0+∑Dj(1 − e
−(t/τj))
n
j=1
(3.1.4)
Equation (3.1.3) and (3.1.4) can be physically approximated using the generalized Maxwell
model of viscoelasticity which a series of m and n spring and dashpots connected in parallel.
More details can be found in [78]. Prony series models are chosen because the curve fitting
is implemented in both the time domain and frequency. For a linear viscoelastic material,
a Prony series model is often used for interconversion between the time domain and
frequency range of interest and for interconversion between relaxation modulus and creep
compliance. It allows for incremental integration using a finite number of internal
variables.[79] In this research, the PTFE-based materials are not performed as perfect
linear viscoelastic materials. The interconversion by using one set of Prony series
parameters for a viscoelastic characteristic cannot lead to precise curve-fitted results for
other three characteristics. Instead, each set of Prony series are obtained for the
corresponding viscoelastic characteristic to have accurate results. Also, the Prony series
terms are associated with material internal state variables and are usually applied in the
discrete finite element model. Nonlinear regression methods are applied to obtain a short
and accurate Prony series.[80]
3.1.2 Storage Modulus and tan δ
Storage modulus is a measure of the elastic response of a material. It measures the stored
energy. The mechanical loss, tan δ, is the ratio of loss to the storage. It is a measure of the
energy dissipation of a material and tells how good a material will be at absorbing energy.
43
As δ approaches 0°, it approaches a purely elastic behavior. When δ approaches 90°, the
material approaches a purely viscous behavior.
If a dynamic oscillatory system has a steady-state vibration, a variation in stress at a certain
frequency is induced and the stress is given as [27].
σ = σ0cosωt (3.1.5)
If the material is linearly viscoelastic and the input is an oscillatory stress, the strain
response will be an oscillation at the same frequency as the stress but lagging by a phase
angle δ. The phase lag is a function of internal friction of the material. Equation (3.1.6) and
Equation (3.1.7) show the corresponding strain response.
ϵ = ϵ0 cos(ωt − δ) = Re[ϵ0ei(ωt−δ)] (3.1.6)
ϵ = (ϵ0e−iδ)eiωt = ϵ∗eiωt (3.1.7)
Figure 3.1.1 illustrates oscillating loading and response for a viscoelastic material including
the loss angle δ, which is reported as damping. This measures the energy dissipation of the
sample under cyclic load and illustrates how much energy is lost by the tangent of the phase
angle δ [52]. One of the key phenomena in viscoelastic materials is rebound of an object
following an impact which is less than 100% [81]. Hence, in seals, separation of surfaces
results and leads to leakage if an impact or stress is exerted upon a viscoelastic material.
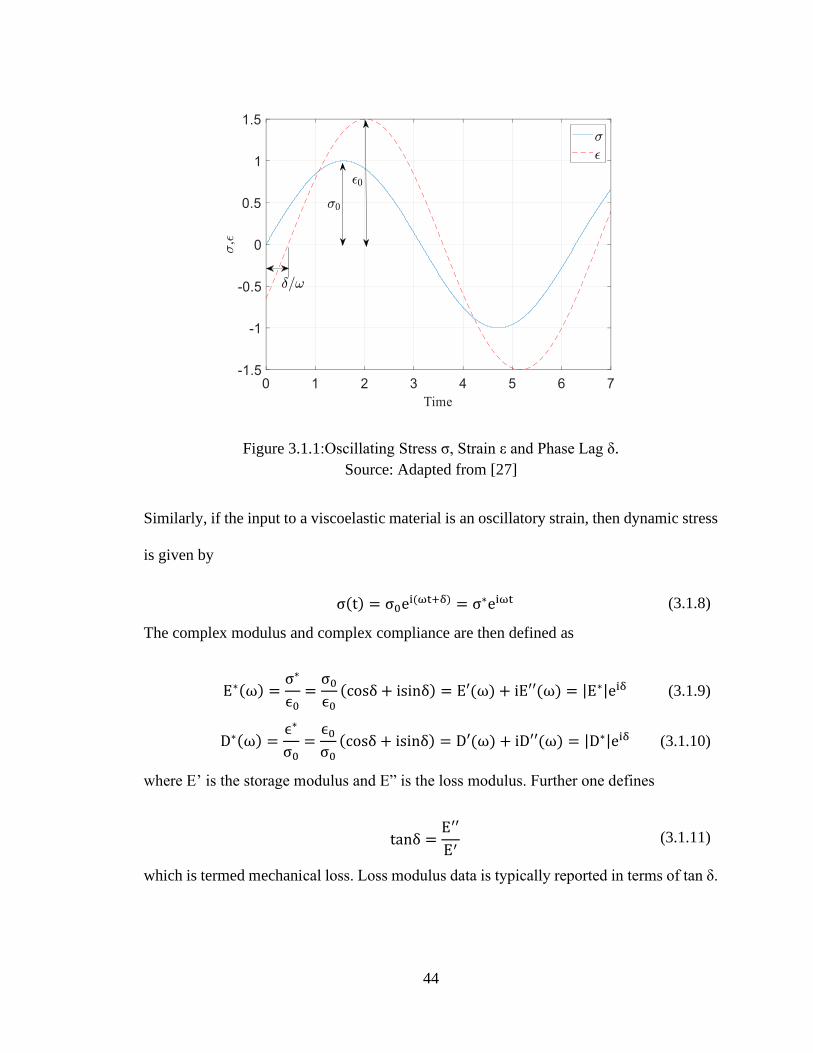
44
Figure 3.1.1:Oscillating Stress σ, Strain ε and Phase Lag δ.
Source: Adapted from [27]
Similarly, if the input to a viscoelastic material is an oscillatory strain, then dynamic stress
is given by
σ(t) = σ0ei(ωt+δ) = σ∗eiωt (3.1.8)
The complex modulus and complex compliance are then defined as
E∗(ω) =σ∗
ϵ0=σ0ϵ0(cosδ + isinδ) = E′(ω) + iE′′(ω) = |E∗|eiδ (3.1.9)
D∗(ω) =ϵ∗
σ0=ϵ0σ0(cosδ + isinδ) = D′(ω) + iD′′(ω) = |D∗|eiδ (3.1.10)
where E’ is the storage modulus and E” is the loss modulus. Further one defines
tanδ =E′′
E′ (3.1.11)
which is termed mechanical loss. Loss modulus data is typically reported in terms of tan δ.
45
As long as the storage modulus and mechanical loss are measured, other parameters such
as loss modulus and complex modulus can be derived assuming a linear viscoelastic
material [27].
3.1.3 Prony Series Parameters in the Frequency Domain
Again, based on the assumption of linear viscoelasticity, the complex modulus E*(ω) and
complex compliance D*(ω) are the Laplace transform with s=jω of the relaxation modulus
E(t) and creep compliance D(t):
E(s) = s∫ E(t)e−stdt
∞
0
(3.1.12)
D(s) = s∫ D(t)e−stdt
∞
0
(3.1.13)
To generate a mathematical model for the dynamic response using the experimental data,
substitute Equation (3.1.3) into Equation (3.1.12) to get
E′(ω) = Ee +∑ω2ρi
2Ei
ω2ρi2 + 1
i=1
m
(3.1.14)
E′′(ω) =∑ωρiEi
ω2ρi2 + 1
i=1
m
(3.1.15)
These are approximate mathematical models for the storage modulus and loss modulus
assuming linear viscoelasticity. The equilibrium strength Ee, the relaxation time ρi and
storage strength Ei are obtained through curve fitting by least squares method, resulting in
a Prony series model that can be used by researchers and designers.
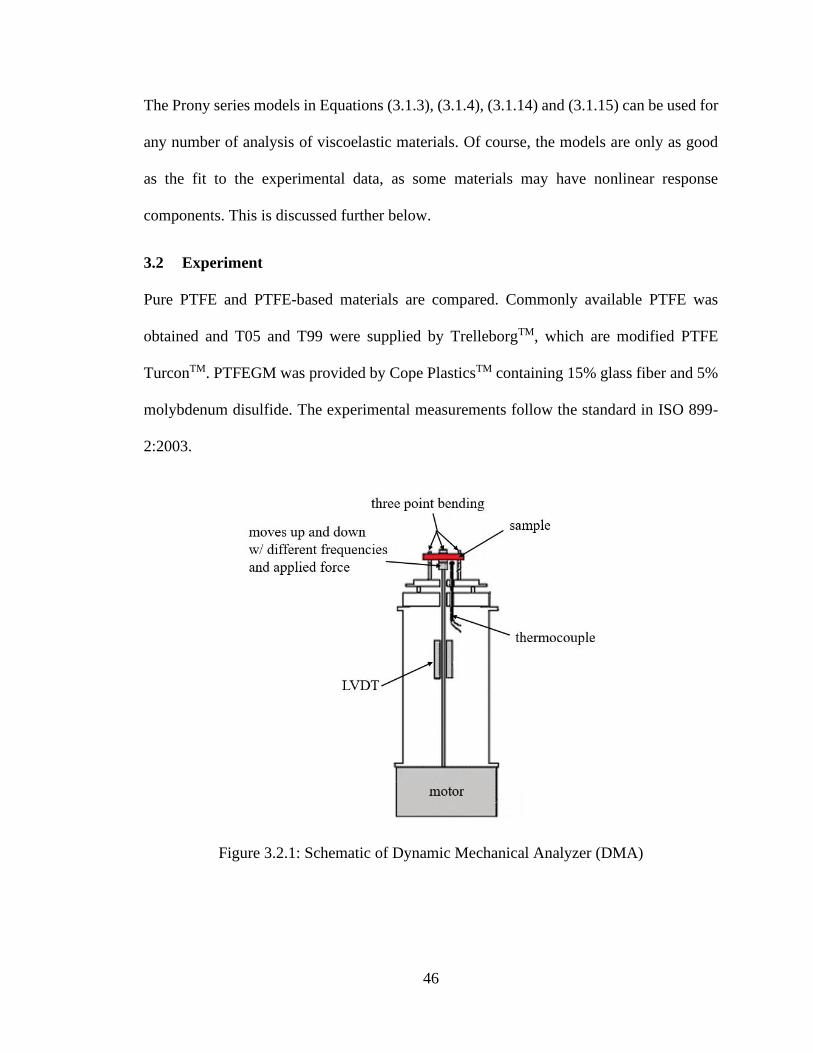
46
The Prony series models in Equations (3.1.3), (3.1.4), (3.1.14) and (3.1.15) can be used for
any number of analysis of viscoelastic materials. Of course, the models are only as good
as the fit to the experimental data, as some materials may have nonlinear response
components. This is discussed further below.
3.2 Experiment
Pure PTFE and PTFE-based materials are compared. Commonly available PTFE was
obtained and T05 and T99 were supplied by TrelleborgTM, which are modified PTFE
TurconTM. PTFEGM was provided by Cope PlasticsTM containing 15% glass fiber and 5%
molybdenum disulfide. The experimental measurements follow the standard in ISO 899-
2:2003.
Figure 3.2.1: Schematic of Dynamic Mechanical Analyzer (DMA)
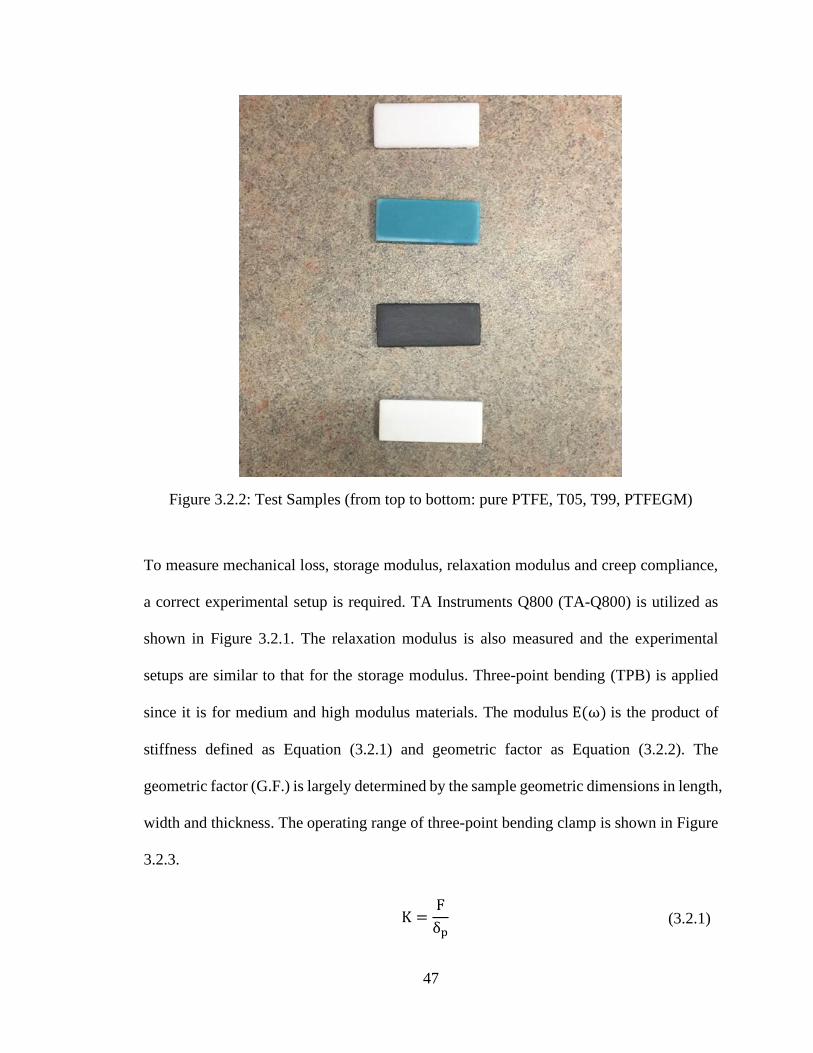
47
Figure 3.2.2: Test Samples (from top to bottom: pure PTFE, T05, T99, PTFEGM)
To measure mechanical loss, storage modulus, relaxation modulus and creep compliance,
a correct experimental setup is required. TA Instruments Q800 (TA-Q800) is utilized as
shown in Figure 3.2.1. The relaxation modulus is also measured and the experimental
setups are similar to that for the storage modulus. Three-point bending (TPB) is applied
since it is for medium and high modulus materials. The modulus E(ω) is the product of
stiffness defined as Equation (3.2.1) and geometric factor as Equation (3.2.2). The
geometric factor (G.F.) is largely determined by the sample geometric dimensions in length,
width and thickness. The operating range of three-point bending clamp is shown in Figure
3.2.3.
K =F
δp (3.2.1)
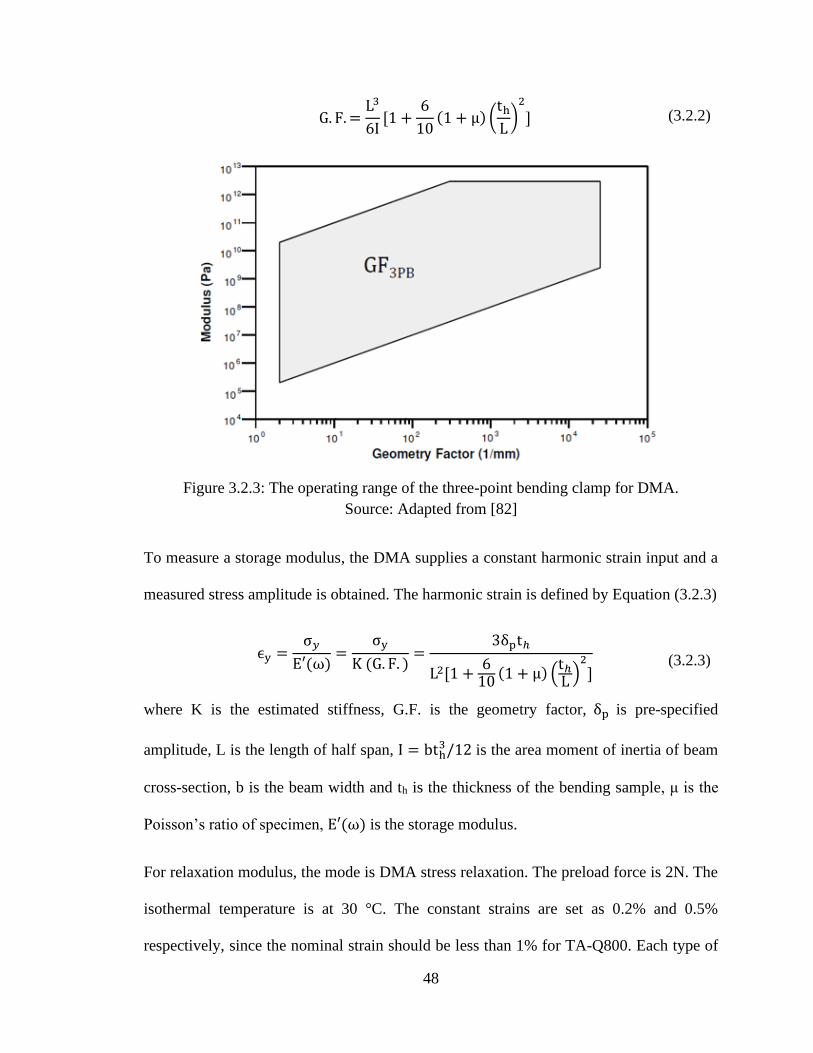
48
G. F. =L3
6I[1 +
6
10(1 + μ) (
thL)2
] (3.2.2)
Figure 3.2.3: The operating range of the three-point bending clamp for DMA.
Source: Adapted from [82]
To measure a storage modulus, the DMA supplies a constant harmonic strain input and a
measured stress amplitude is obtained. The harmonic strain is defined by Equation (3.2.3)
ϵy =σ𝑦
E′(ω)=
σy
K (G. F. )=
3δptℎ
L2[1 +610(1 + μ) (
tℎL )
2
]
(3.2.3)
where K is the estimated stiffness, G.F. is the geometry factor, δp is pre-specified
amplitude, L is the length of half span, I = bth3/12 is the area moment of inertia of beam
cross-section, b is the beam width and th is the thickness of the bending sample, μ is the
Poisson’s ratio of specimen, E′(ω) is the storage modulus.
For relaxation modulus, the mode is DMA stress relaxation. The preload force is 2N. The
isothermal temperature is at 30 °C. The constant strains are set as 0.2% and 0.5%
respectively, since the nominal strain should be less than 1% for TA-Q800. Each type of
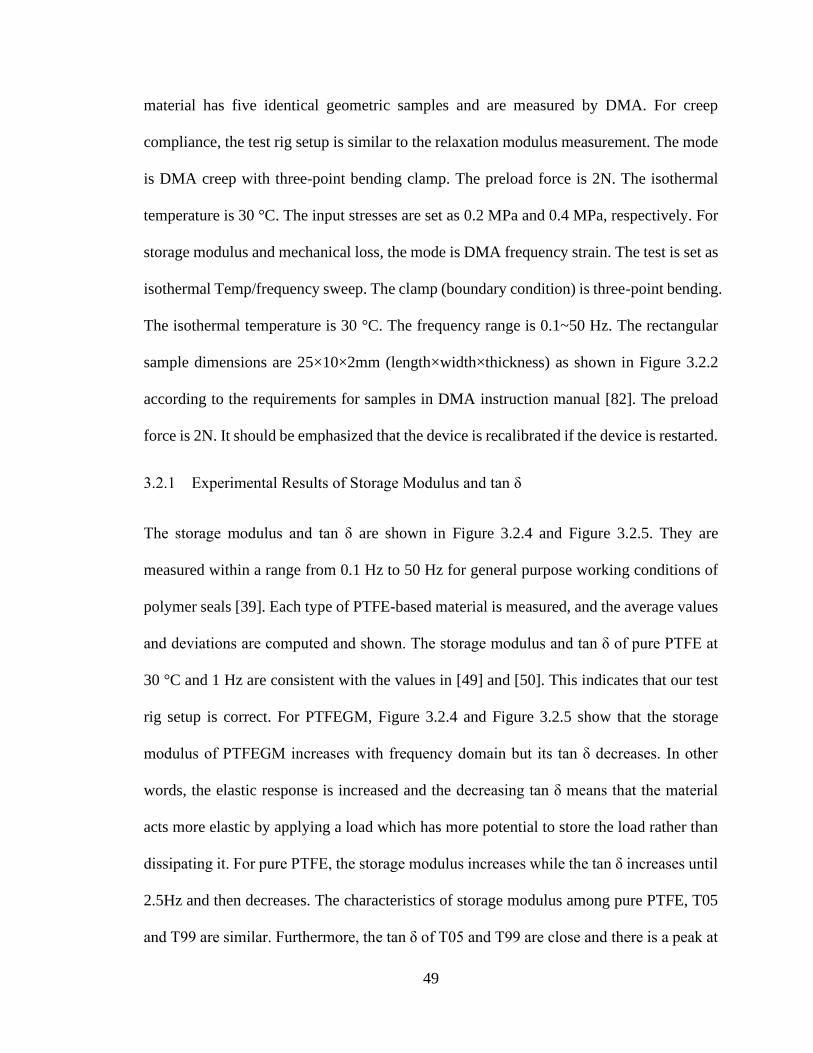
49
material has five identical geometric samples and are measured by DMA. For creep
compliance, the test rig setup is similar to the relaxation modulus measurement. The mode
is DMA creep with three-point bending clamp. The preload force is 2N. The isothermal
temperature is 30 °C. The input stresses are set as 0.2 MPa and 0.4 MPa, respectively. For
storage modulus and mechanical loss, the mode is DMA frequency strain. The test is set as
isothermal Temp/frequency sweep. The clamp (boundary condition) is three-point bending.
The isothermal temperature is 30 °C. The frequency range is 0.1~50 Hz. The rectangular
sample dimensions are 25×10×2mm (length×width×thickness) as shown in Figure 3.2.2
according to the requirements for samples in DMA instruction manual [82]. The preload
force is 2N. It should be emphasized that the device is recalibrated if the device is restarted.
3.2.1 Experimental Results of Storage Modulus and tan δ
The storage modulus and tan δ are shown in Figure 3.2.4 and Figure 3.2.5. They are
measured within a range from 0.1 Hz to 50 Hz for general purpose working conditions of
polymer seals [39]. Each type of PTFE-based material is measured, and the average values
and deviations are computed and shown. The storage modulus and tan δ of pure PTFE at
30 °C and 1 Hz are consistent with the values in [49] and [50]. This indicates that our test
rig setup is correct. For PTFEGM, Figure 3.2.4 and Figure 3.2.5 show that the storage
modulus of PTFEGM increases with frequency domain but its tan δ decreases. In other
words, the elastic response is increased and the decreasing tan δ means that the material
acts more elastic by applying a load which has more potential to store the load rather than
dissipating it. For pure PTFE, the storage modulus increases while the tan δ increases until
2.5Hz and then decreases. The characteristics of storage modulus among pure PTFE, T05
and T99 are similar. Furthermore, the tan δ of T05 and T99 are close and there is a peak at
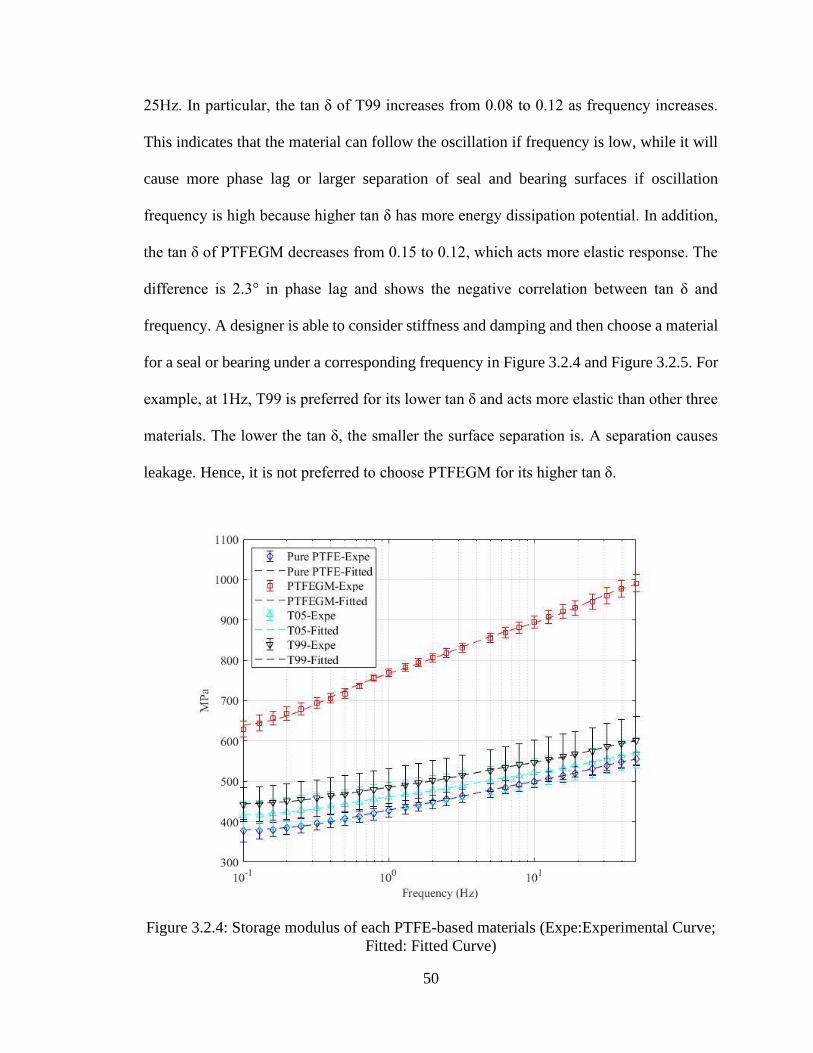
50
25Hz. In particular, the tan δ of T99 increases from 0.08 to 0.12 as frequency increases.
This indicates that the material can follow the oscillation if frequency is low, while it will
cause more phase lag or larger separation of seal and bearing surfaces if oscillation
frequency is high because higher tan δ has more energy dissipation potential. In addition,
the tan δ of PTFEGM decreases from 0.15 to 0.12, which acts more elastic response. The
difference is 2.3° in phase lag and shows the negative correlation between tan δ and
frequency. A designer is able to consider stiffness and damping and then choose a material
for a seal or bearing under a corresponding frequency in Figure 3.2.4 and Figure 3.2.5. For
example, at 1Hz, T99 is preferred for its lower tan δ and acts more elastic than other three
materials. The lower the tan δ, the smaller the surface separation is. A separation causes
leakage. Hence, it is not preferred to choose PTFEGM for its higher tan δ.
Figure 3.2.4: Storage modulus of each PTFE-based materials (Expe:Experimental Curve;
Fitted: Fitted Curve)
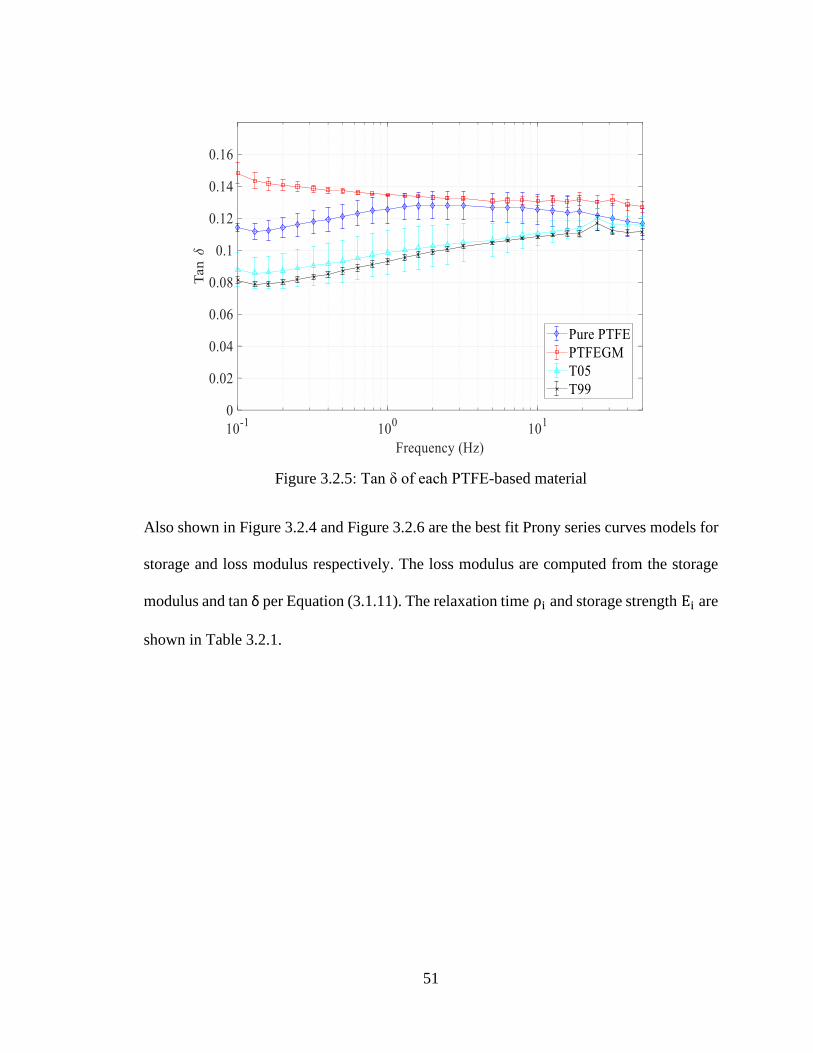
51
Figure 3.2.5: Tan δ of each PTFE-based material
Also shown in Figure 3.2.4 and Figure 3.2.6 are the best fit Prony series curves models for
storage and loss modulus respectively. The loss modulus are computed from the storage
modulus and tan δ per Equation (3.1.11). The relaxation time ρi and storage strength Ei are
shown in Table 3.2.1.
52
Figure 3.2.6: Loss modulus of each PTFE-based materials (Expe:Experimental Curve;
Fitted: Fitted Curve)
A 4-term Pony series is used for the convenience of application because the material
response curve in storage or loss modulus in these measurements simply covers a small the
frequency range of 2 decades on the logarithmic scale. This frequency range is typical for
machinery seal applications. Typically, 4 to 8-term Prony series are commonly used for the
frequency range of 10 decades on the logarithmic scale.[79] The least squares method is
utilized as the objective function and the Prony parameters are solved using nonlinear
regression. Chi square χ2 goodness of fit is applied as
χ2 =∑(Efit,i − Eexp,i)2
n
i
/Efit,i (3.2.4)
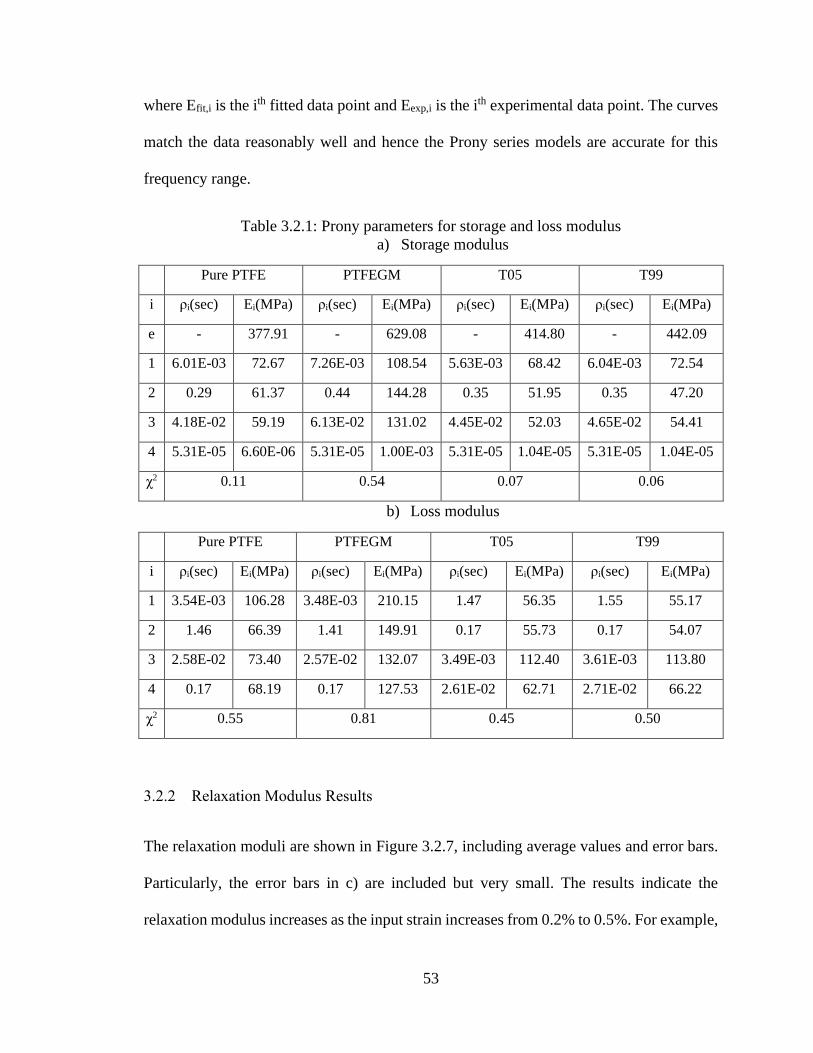
53
where Efit,i is the ith fitted data point and Eexp,i is the ith experimental data point. The curves
match the data reasonably well and hence the Prony series models are accurate for this
frequency range.
Table 3.2.1: Prony parameters for storage and loss modulus
a) Storage modulus
Pure PTFE PTFEGM T05 T99
i ρi(sec) Ei(MPa) ρi(sec) Ei(MPa) ρi(sec) Ei(MPa) ρi(sec) Ei(MPa)
e - 377.91 - 629.08 - 414.80 - 442.09
1 6.01E-03 72.67 7.26E-03 108.54 5.63E-03 68.42 6.04E-03 72.54
2 0.29 61.37 0.44 144.28 0.35 51.95 0.35 47.20
3 4.18E-02 59.19 6.13E-02 131.02 4.45E-02 52.03 4.65E-02 54.41
4 5.31E-05 6.60E-06 5.31E-05 1.00E-03 5.31E-05 1.04E-05 5.31E-05 1.04E-05
χ2 0.11 0.54 0.07 0.06
b) Loss modulus
Pure PTFE PTFEGM T05 T99
i ρi(sec) Ei(MPa) ρi(sec) Ei(MPa) ρi(sec) Ei(MPa) ρi(sec) Ei(MPa)
1 3.54E-03 106.28 3.48E-03 210.15 1.47 56.35 1.55 55.17
2 1.46 66.39 1.41 149.91 0.17 55.73 0.17 54.07
3 2.58E-02 73.40 2.57E-02 132.07 3.49E-03 112.40 3.61E-03 113.80
4 0.17 68.19 0.17 127.53 2.61E-02 62.71 2.71E-02 66.22
χ2 0.55 0.81 0.45 0.50
3.2.2 Relaxation Modulus Results
The relaxation moduli are shown in Figure 3.2.7, including average values and error bars.
Particularly, the error bars in c) are included but very small. The results indicate the
relaxation modulus increases as the input strain increases from 0.2% to 0.5%. For example,
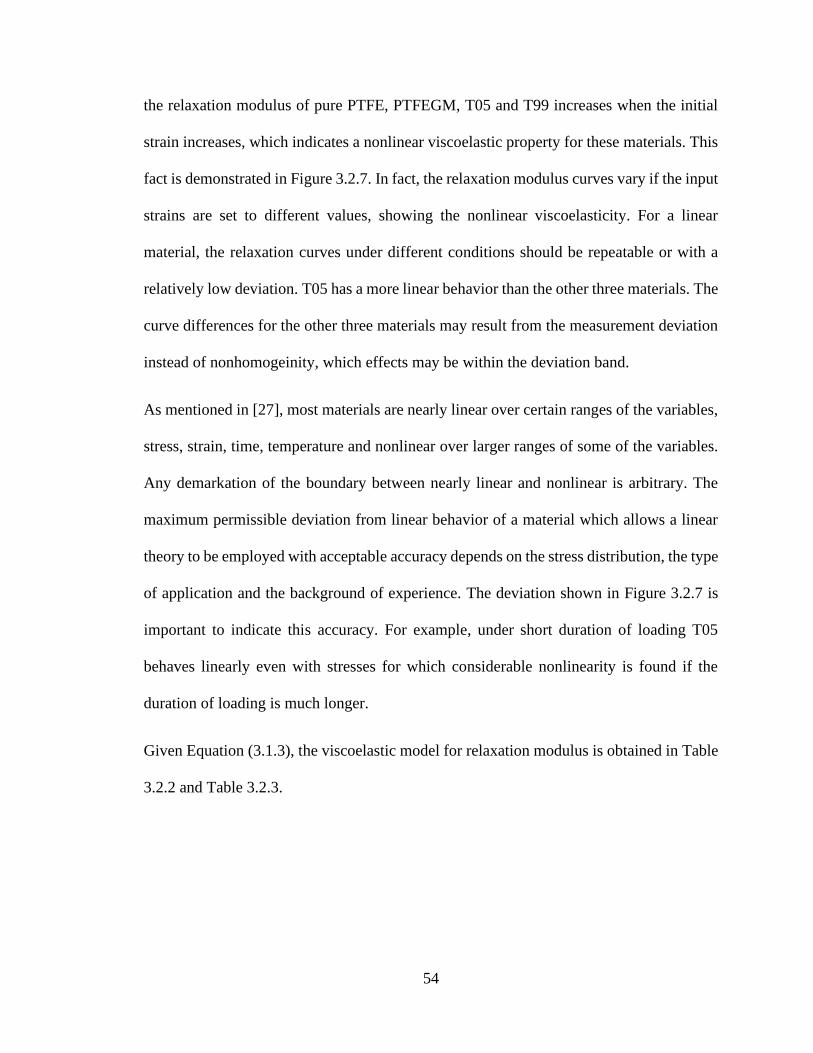
54
the relaxation modulus of pure PTFE, PTFEGM, T05 and T99 increases when the initial
strain increases, which indicates a nonlinear viscoelastic property for these materials. This
fact is demonstrated in Figure 3.2.7. In fact, the relaxation modulus curves vary if the input
strains are set to different values, showing the nonlinear viscoelasticity. For a linear
material, the relaxation curves under different conditions should be repeatable or with a
relatively low deviation. T05 has a more linear behavior than the other three materials. The
curve differences for the other three materials may result from the measurement deviation
instead of nonhomogeinity, which effects may be within the deviation band.
As mentioned in [27], most materials are nearly linear over certain ranges of the variables,
stress, strain, time, temperature and nonlinear over larger ranges of some of the variables.
Any demarkation of the boundary between nearly linear and nonlinear is arbitrary. The
maximum permissible deviation from linear behavior of a material which allows a linear
theory to be employed with acceptable accuracy depends on the stress distribution, the type
of application and the background of experience. The deviation shown in Figure 3.2.7 is
important to indicate this accuracy. For example, under short duration of loading T05
behaves linearly even with stresses for which considerable nonlinearity is found if the
duration of loading is much longer.
Given Equation (3.1.3), the viscoelastic model for relaxation modulus is obtained in Table
3.2.2 and Table 3.2.3.
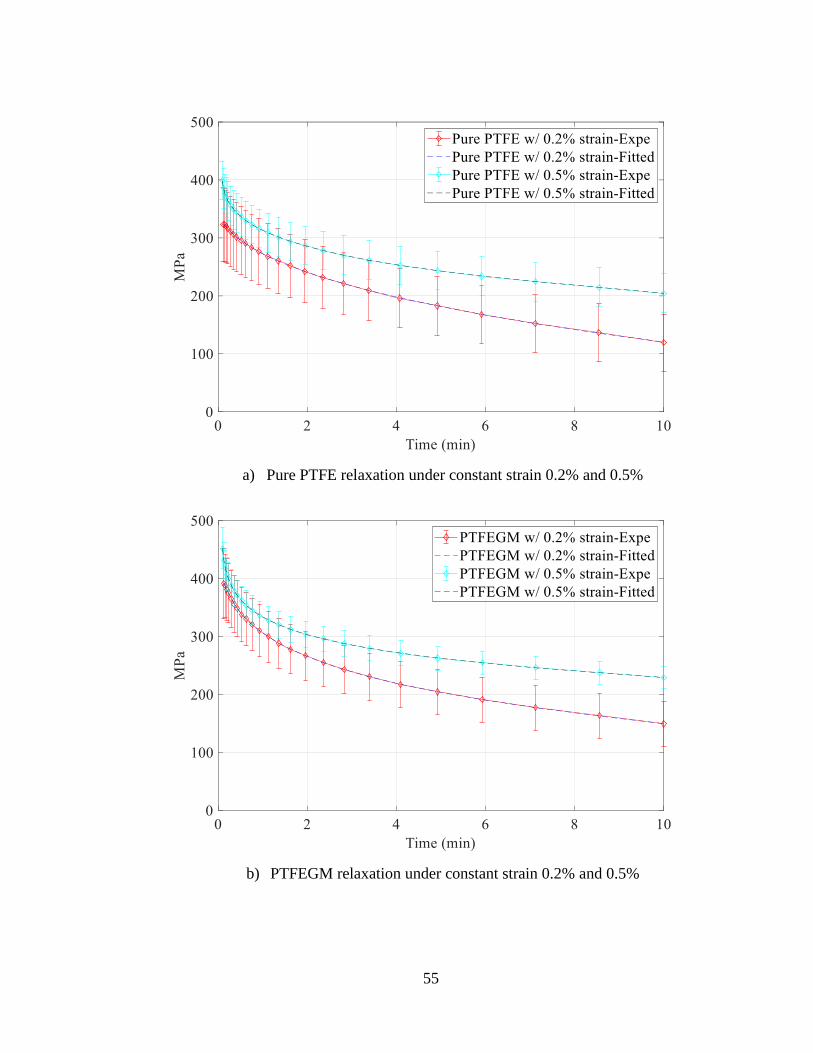
55
a) Pure PTFE relaxation under constant strain 0.2% and 0.5%
b) PTFEGM relaxation under constant strain 0.2% and 0.5%
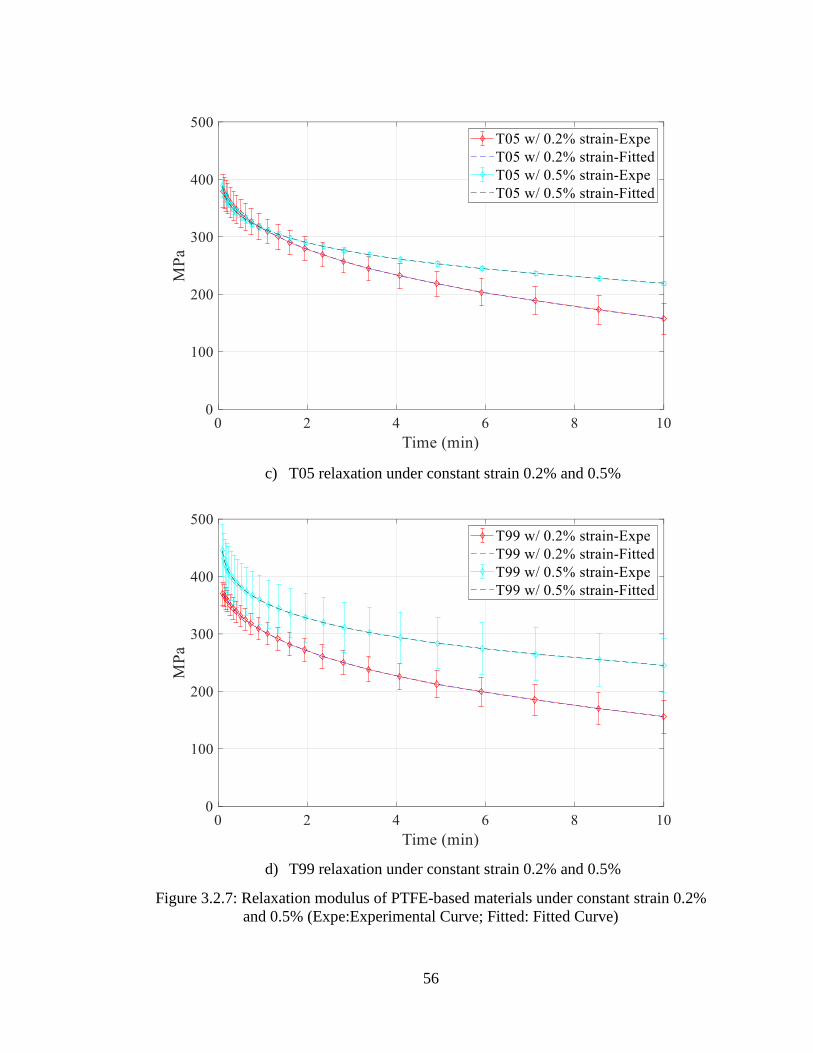
56
c) T05 relaxation under constant strain 0.2% and 0.5%
d) T99 relaxation under constant strain 0.2% and 0.5%
Figure 3.2.7: Relaxation modulus of PTFE-based materials under constant strain 0.2%
and 0.5% (Expe:Experimental Curve; Fitted: Fitted Curve)
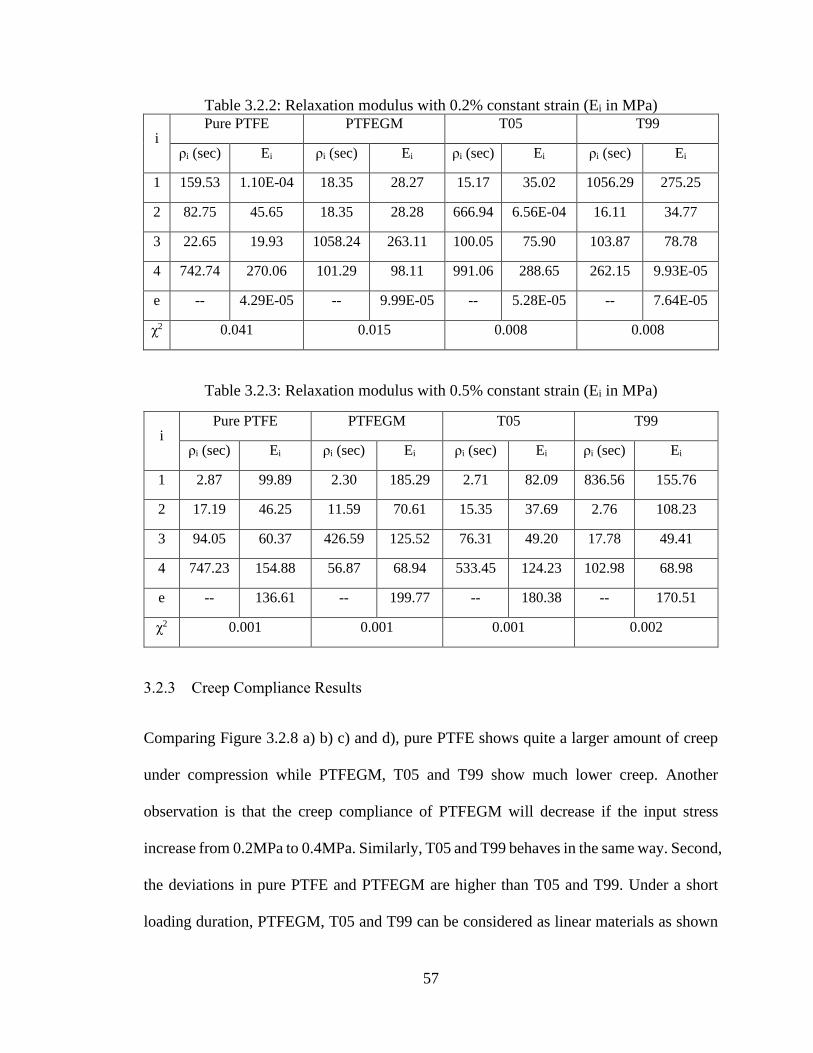
57
Table 3.2.2: Relaxation modulus with 0.2% constant strain (Ei in MPa)
i Pure PTFE PTFEGM T05 T99
ρi (sec) Ei ρi (sec) Ei ρi (sec) Ei ρi (sec) Ei
1 159.53 1.10E-04 18.35 28.27 15.17 35.02 1056.29 275.25
2 82.75 45.65 18.35 28.28 666.94 6.56E-04 16.11 34.77
3 22.65 19.93 1058.24 263.11 100.05 75.90 103.87 78.78
4 742.74 270.06 101.29 98.11 991.06 288.65 262.15 9.93E-05
e -- 4.29E-05 -- 9.99E-05 -- 5.28E-05 -- 7.64E-05
χ2 0.041 0.015 0.008 0.008
Table 3.2.3: Relaxation modulus with 0.5% constant strain (Ei in MPa)
i Pure PTFE PTFEGM T05 T99
ρi (sec) Ei ρi (sec) Ei ρi (sec) Ei ρi (sec) Ei
1 2.87 99.89 2.30 185.29 2.71 82.09 836.56 155.76
2 17.19 46.25 11.59 70.61 15.35 37.69 2.76 108.23
3 94.05 60.37 426.59 125.52 76.31 49.20 17.78 49.41
4 747.23 154.88 56.87 68.94 533.45 124.23 102.98 68.98
e -- 136.61 -- 199.77 -- 180.38 -- 170.51
χ2 0.001 0.001 0.001 0.002
3.2.3 Creep Compliance Results
Comparing Figure 3.2.8 a) b) c) and d), pure PTFE shows quite a larger amount of creep
under compression while PTFEGM, T05 and T99 show much lower creep. Another
observation is that the creep compliance of PTFEGM will decrease if the input stress
increase from 0.2MPa to 0.4MPa. Similarly, T05 and T99 behaves in the same way. Second,
the deviations in pure PTFE and PTFEGM are higher than T05 and T99. Under a short
loading duration, PTFEGM, T05 and T99 can be considered as linear materials as shown
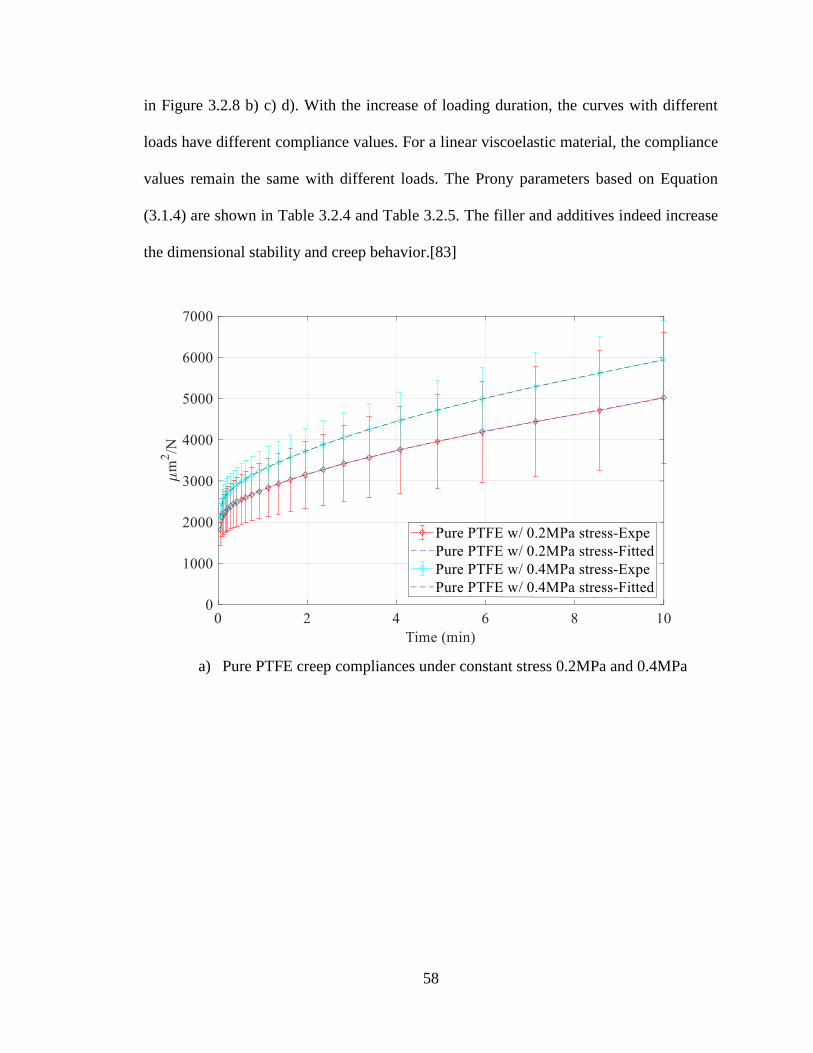
58
in Figure 3.2.8 b) c) d). With the increase of loading duration, the curves with different
loads have different compliance values. For a linear viscoelastic material, the compliance
values remain the same with different loads. The Prony parameters based on Equation
(3.1.4) are shown in Table 3.2.4 and Table 3.2.5. The filler and additives indeed increase
the dimensional stability and creep behavior.[83]
a) Pure PTFE creep compliances under constant stress 0.2MPa and 0.4MPa
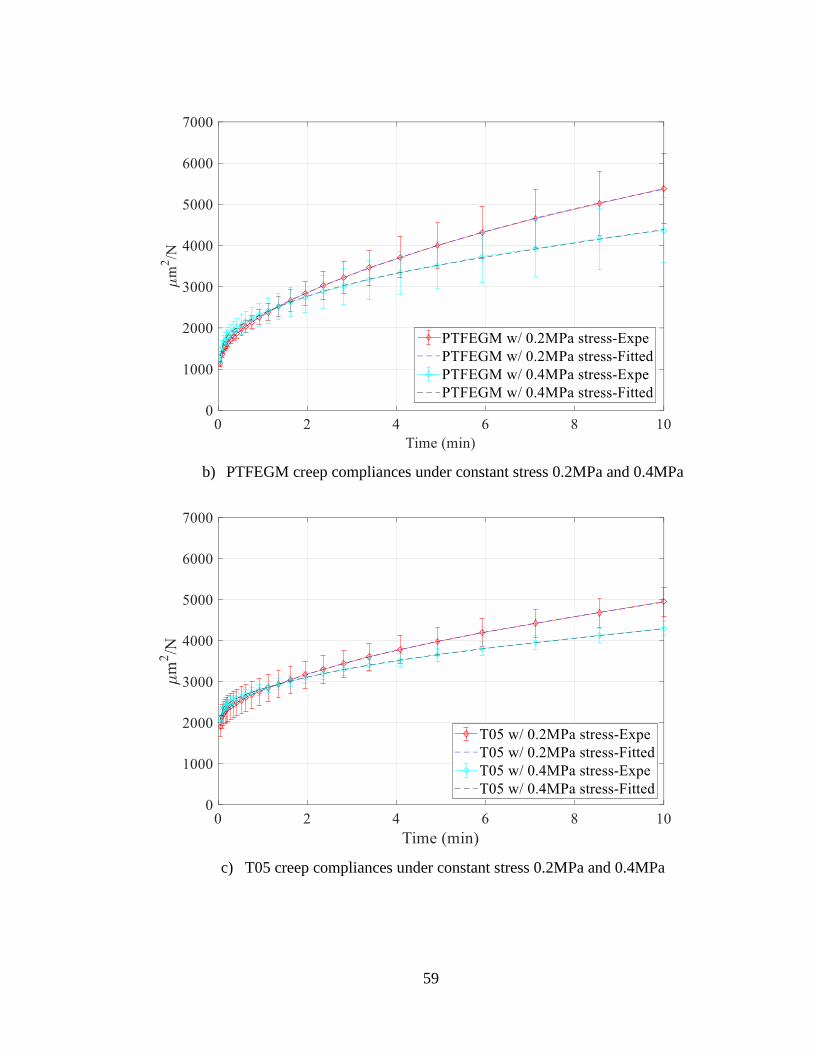
59
b) PTFEGM creep compliances under constant stress 0.2MPa and 0.4MPa
c) T05 creep compliances under constant stress 0.2MPa and 0.4MPa
60
d) T99 creep compliances under constant stress 0.2MPa and 0.4MPa
Figure 3.2.8: Creep compliances of PTFE-based materials under constant stress 0.2MPa
and 0.4MPa (Expe:Experimental Curve; Fitted: Fitted Curve)
Table 3.2.4: Creep compliances with 0.2MPa constant stress (Dj in µm2/N)
i Pure PTFE PTFEGM T05 T99
τi (sec) Dj τi (sec) Dj τi (sec) Dj τi (sec) Dj
1 433018 1363274 8758664 6504470 8234.33 23841.84 274.93 1384.81
2 1.67 2054.94 563.12 4600.08 1.52 2108.30 1.57 2069.07
3 144.75 806.63 2.38 1146.98 14.72 202.08 4740357 9028521
4 14.63 272.92 34.92 552.68 153.53 971.39 26.01 270.23
g -- 0.17 -- 206.72 -- 0.28 -- 0.02
χ2 0.256 0.726 0.177 0.344
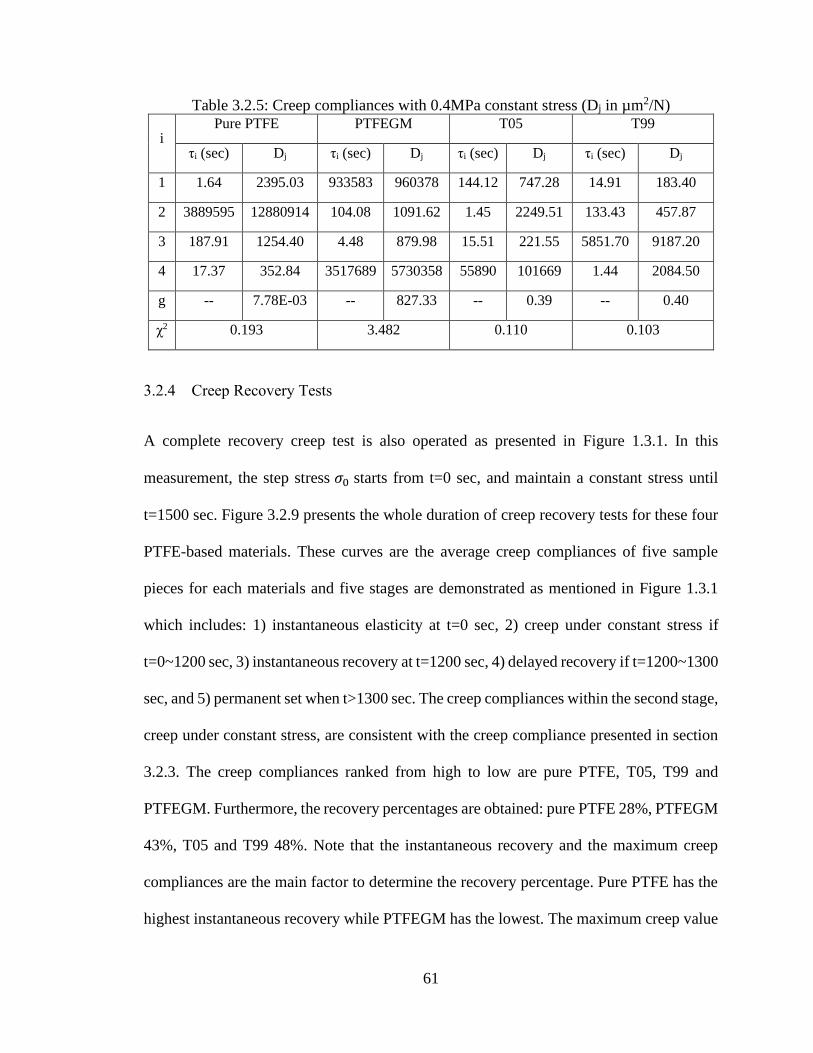
61
Table 3.2.5: Creep compliances with 0.4MPa constant stress (Dj in µm2/N)
i Pure PTFE PTFEGM T05 T99
τi (sec) Dj τi (sec) Dj τi (sec) Dj τi (sec) Dj
1 1.64 2395.03 933583 960378 144.12 747.28 14.91 183.40
2 3889595 12880914 104.08 1091.62 1.45 2249.51 133.43 457.87
3 187.91 1254.40 4.48 879.98 15.51 221.55 5851.70 9187.20
4 17.37 352.84 3517689 5730358 55890 101669 1.44 2084.50
g -- 7.78E-03 -- 827.33 -- 0.39 -- 0.40
χ2 0.193 3.482 0.110 0.103
3.2.4 Creep Recovery Tests
A complete recovery creep test is also operated as presented in Figure 1.3.1. In this
measurement, the step stress 𝜎0 starts from t=0 sec, and maintain a constant stress until
t=1500 sec. Figure 3.2.9 presents the whole duration of creep recovery tests for these four
PTFE-based materials. These curves are the average creep compliances of five sample
pieces for each materials and five stages are demonstrated as mentioned in Figure 1.3.1
which includes: 1) instantaneous elasticity at t=0 sec, 2) creep under constant stress if
t=0~1200 sec, 3) instantaneous recovery at t=1200 sec, 4) delayed recovery if t=1200~1300
sec, and 5) permanent set when t>1300 sec. The creep compliances within the second stage,
creep under constant stress, are consistent with the creep compliance presented in section
3.2.3. The creep compliances ranked from high to low are pure PTFE, T05, T99 and
PTFEGM. Furthermore, the recovery percentages are obtained: pure PTFE 28%, PTFEGM
43%, T05 and T99 48%. Note that the instantaneous recovery and the maximum creep
compliances are the main factor to determine the recovery percentage. Pure PTFE has the
highest instantaneous recovery while PTFEGM has the lowest. The maximum creep value

62
is ranked as pure PTFE, T05, T99 and PTFEGM. Among these four materials, similar
delayed recovery behaviors are presented in Figure 3.2.9. The delayed recovery is a key
factor for computing separations for viscoelastic materials and the details are discussed in
chapter 4.
Figure 3.2.9: Creep recovery test of PTFE-based materials under constant stress
𝜎0=0.2MPa at 30oC.
3.3 Anlaysis and Discussion
The results show that large error bars exist in creep tests when pure PTFE and PTFEGM
samples are tested. Figure 3.3.1, Figure 3.3.2 and Figure 3.3.3 illustrate this. To find the
composition of samples, Energy Dispersive X-ray Spectrometer (EDS) analysis was
implemented. For comparing the variation of creep compliances of a material, more
samples in pure PTFE were measured in creep compliance tests and those with either
0
1000
2000
3000
4000
5000
6000
7000
0 200 400 600 800 1000 1200 1400
cree
p c
om
plia
nce
(u
m^2
/N)
Time (sec)
Pure PTFE PTFEGM T05 T99

63
higher or lower creep compliances are categorized as two groups. Figure 3.3.4 a) illustrates
the comparison between high creep and low creep samples of pure PTFE. For each sample,
three points, location A, B and C, are randomly chosen and the weight percentage of
fluorine are obtained shown in Figure 3.3.4. The chemical element, fluorine, is chosen
because PTFE-based material is a fluorocarbon solid and, unlike the ubiquity of carbon,
the weight percentage of fluorine can represent a characteristic of samples composites. It
shows that the samples have different fluorine percentage and, for instance, the weight
percentage of fluorine in pure PTFE varies from 41% to 54%. Table 3.3.1 shows the mean
value and deviation of pure PTFE and T05 in Fluorine percentage.
In Figure 3.3.4 a), the first six EDS samples are the high creep samples and the last six are
the low creep samples from the creep compliance test. The EDS results indicate that the
deviation of F(%) in high creep samples is much higher than the low creep samples, but
the mean values of F(%) are similar. In Figure 3.3.4 b), comparing pure PTFE high creep
samples and T05, the mean value and deviation of pure PTFE high creep samples in F(%)
is higher than T05. In Figure 3.3.4 c), the deviation of low creep samples are even lower
than T05. T05 and T99 are found to be quite stable and similar, therefore for Figure 3.3.4
b) and c), T05 was selected for comparison to pure PTFE which were the least stable
materials. The results are statistically summarized in Table 3.3.1 and the student’s t-test
values are shown in the last row. For example, the t-test value between PTFE high creep
versus T05 is 2.483 which the critical value is 0.99. The student’s t-test values for PTFE
low creep and PTFE overall data sets are 4.289 and 3.299, which means the data sets are
different from the data of T05. Table 3.3.1 also indicates that lower deviation in fluorine
content has a more stable (or repeatable) creep behavior. In other words, a high deviation
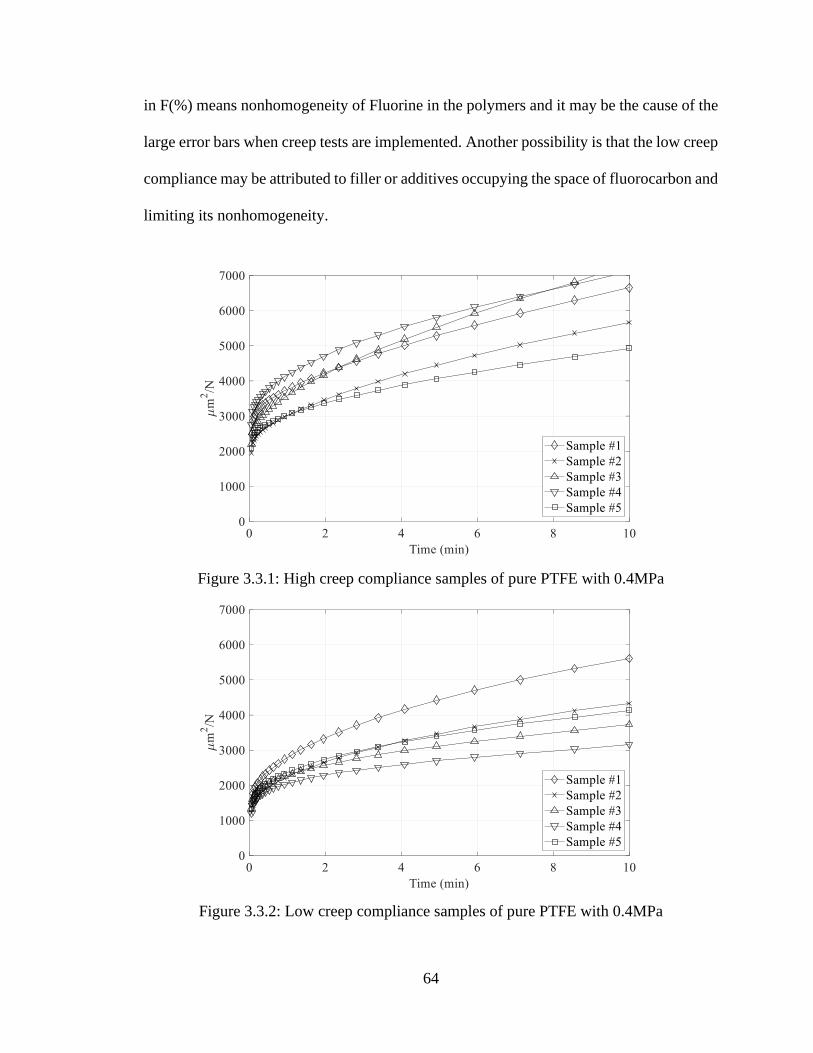
64
in F(%) means nonhomogeneity of Fluorine in the polymers and it may be the cause of the
large error bars when creep tests are implemented. Another possibility is that the low creep
compliance may be attributed to filler or additives occupying the space of fluorocarbon and
limiting its nonhomogeneity.
Figure 3.3.1: High creep compliance samples of pure PTFE with 0.4MPa
Figure 3.3.2: Low creep compliance samples of pure PTFE with 0.4MPa
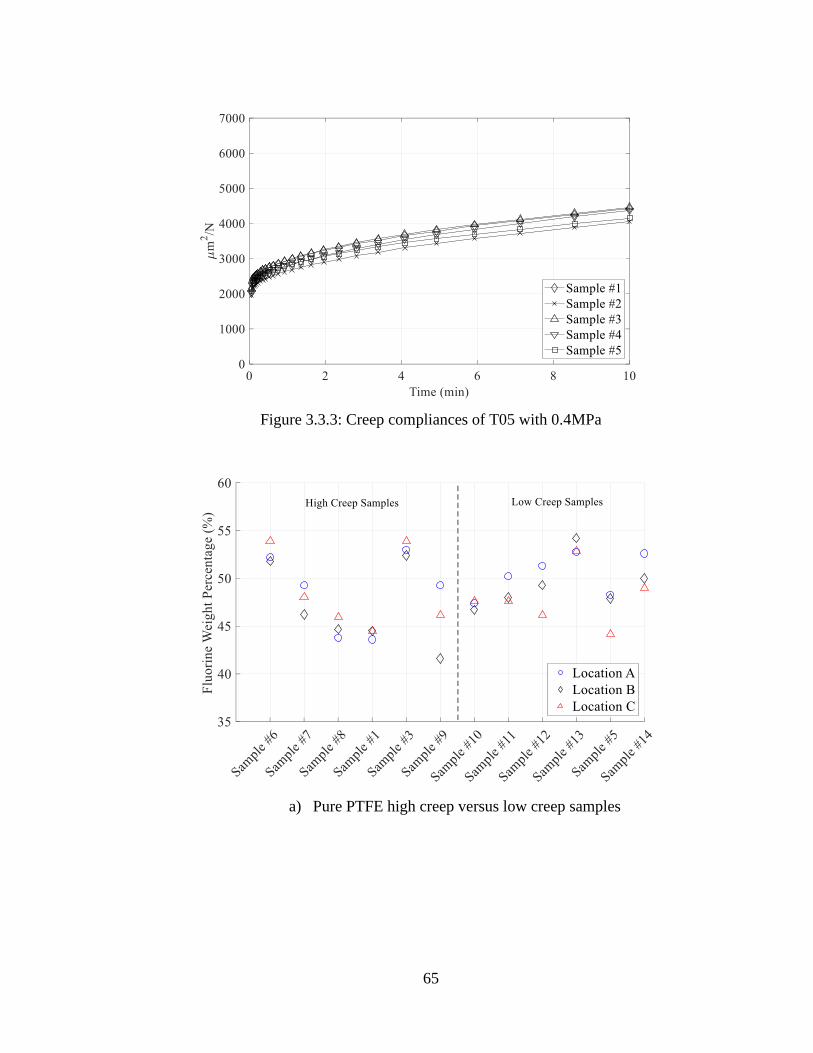
65
Figure 3.3.3: Creep compliances of T05 with 0.4MPa
a) Pure PTFE high creep versus low creep samples
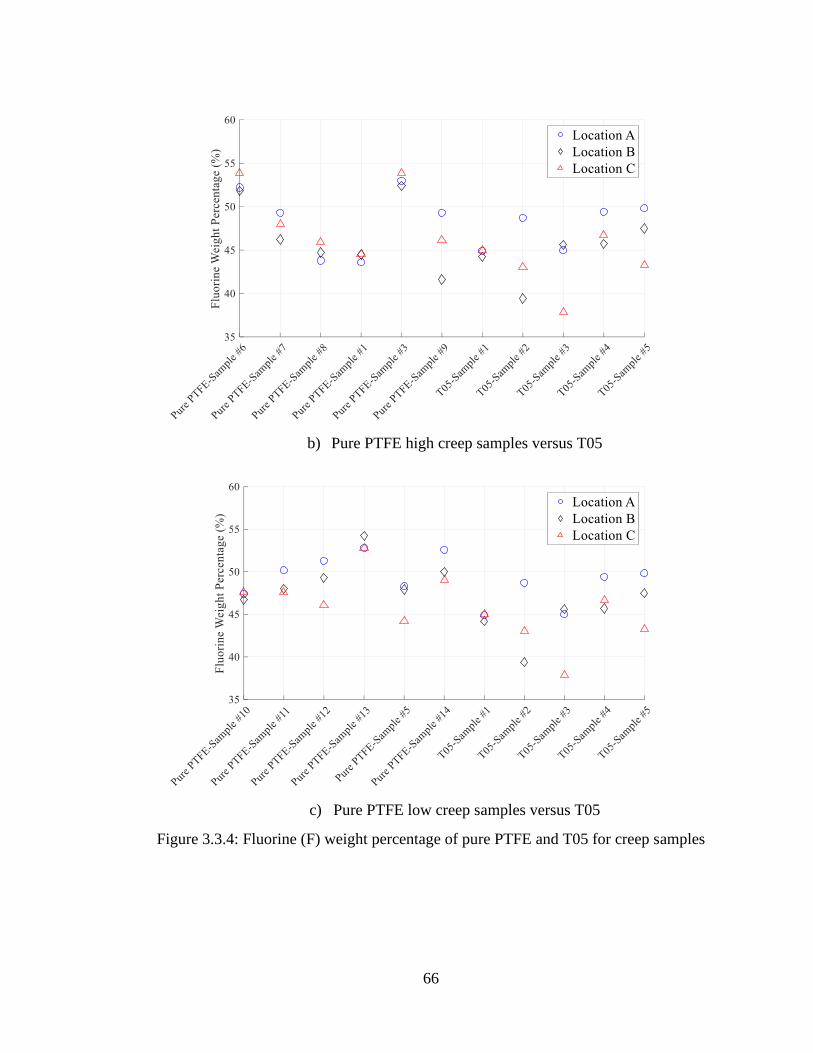
66
b) Pure PTFE high creep samples versus T05
c) Pure PTFE low creep samples versus T05
Figure 3.3.4: Fluorine (F) weight percentage of pure PTFE and T05 for creep samples
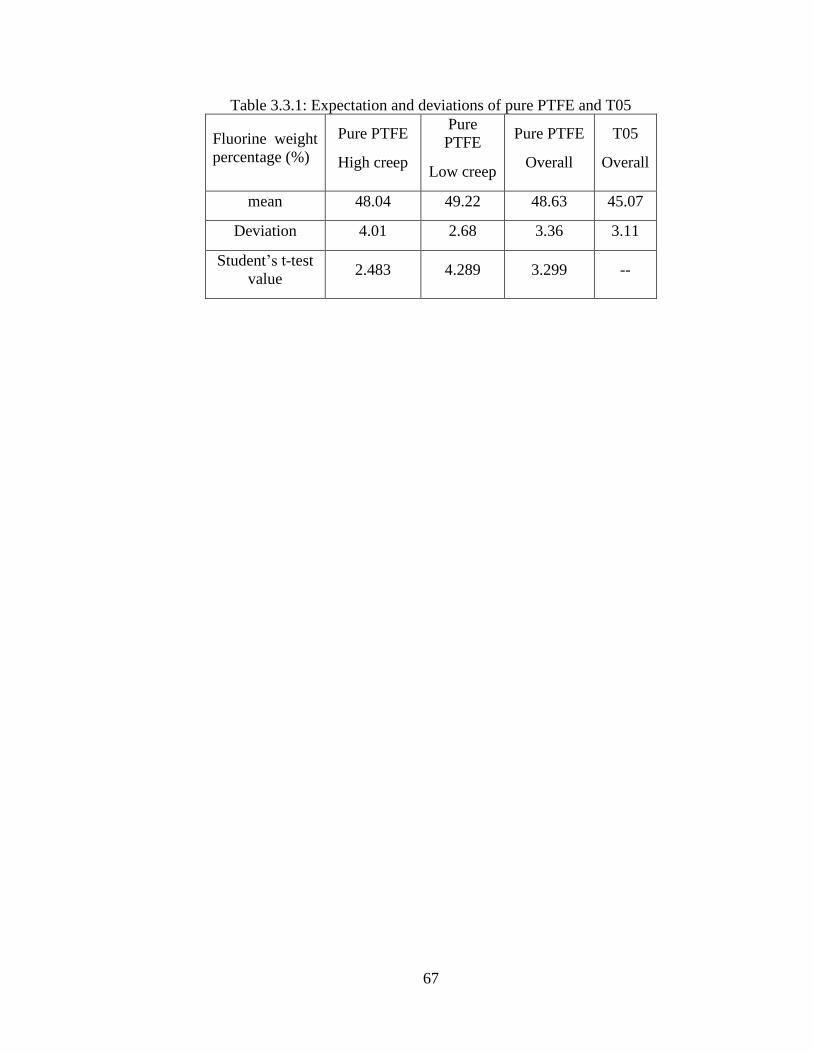
67
Table 3.3.1: Expectation and deviations of pure PTFE and T05
Fluorine weight
percentage (%)
Pure PTFE
High creep
Pure
PTFE
Low creep
Pure PTFE
Overall
T05
Overall
mean 48.04 49.22 48.63 45.07
Deviation 4.01 2.68 3.36 3.11
Student’s t-test
value 2.483 4.289 3.299 --

68
CHAPTER 4. MODELING FACE SEPARATION DUE TO VISCOELASTICITY IN PTFE SEALS
In this chapter, the isothermal viscoelastic dynamic response of a PTFE end face seal
subjected to a small harmonic input and static preload from an ideally rigid opposing face
is examined. Both the magnitude and time of separation of the faces are predicted based on
dry conditions. The presented model is a hybrid that combines the Golla-Hughes-McTavish
(GHM) finite element model, a delayed recovery creep model and a penalty method contact
model. The GHM and delayed recovery creep models are first validated using experimental
data from a Dynamic Mechanical Analyzer (DMA) test for pure PTFE material. Results
for a simple sample application show face separation magnitude as a function of frequency
and harmonic displacement amplitude. Results show that face separation occurs in PTFE
seals even for small amplitude harmonic vibrations (as compared to the static preload) and
that this is due to delayed recovery at low frequencies and to the viscoelastic damping at
higher frequencies. A threshold of static preload is also found above which there is no
separation, and a simple leakage example is presented.
4.1 Modeling and Experimental Verification
4.1.1 Example seal geometry and model
A simple face seal model consisting of a viscoelastic ring and ideally rigid ring is shown
in Figure 4.1.1. One application for this PTFE face seal is presented in Figure 4.1.1 a) that
the face seal is subjected to the pure axial vibration. To simplify modeling, the seal ring is
“unrolled” as the dimension along the circumferential (“z”) direction is much larger than
the one in the radial (“x”) direction as shown in Figure 4.1.1 b). A plane strain condition is
69
often employed for the analysis of the cross section of such a geometry [84, 85]. The strains
along the “z” axis are ignored and plane strain is used for analysis. The solution domain
consists of the cross section of the viscoelastic material which is discretized into four-node
brick elements (four such elements are shown) with two displacement degrees of freedom
per node, qx and qy. In order to model the viscoelastic nature of the material, GHM finite
elements are used that include additional “dissipation” degrees of freedom, p. (See Figure
4.1.2 for a one-dimensional representation of the approach.) These will be discussed further
in the next section. The rigid face vibrates axially in the y-direction as yr = -ys - yd(sinωtk)
where ys is the static preload displacement, yd is the amplitude of the dynamic oscillation,
ω is frequency, tk is the discretized time variable. The rigid face acts uniformly on the top
surface of the viscoelastic face, placing it in compression. The thickness of the viscoelastic
fact is Ts. Note that many flexible seals use a preload in their design. In the case of a
viscoelastic material, the preload during operation will be the static load remaining after
stress relaxation occurs in the material.
The problem is one of viscoelastic response to a non-homogeneous displacement boundary
condition from the rigid seal ring acting on the top surface of the viscoelastic ring such that
qy(xi,Ts,tk)=yr. There also exists homogeneous boundary conditions at the bottom of the
viscoelastic material where qx(xi,0,tk)=qy(xi,0,tk)=0. This type of problem is solved in [86]
for disc vertebrae with no separation (gaps) and is discussed in [62] for seals but no model
is presented. To enforce the uniform displacement of the viscoelastic material due to the
non-homogenous boundary condition, contact elements using the penalty method are
inserted into the model between the rigid face and the viscoelastic face to calculate the
displacement in the y direction of the top surface nodes [77]. When the seal faces separate
70
or “disengage” at time tk=td the force between the two seal faces becomes zero and it is a
mathematically smooth transition. When the seal faces come into contact again after a
separation has occurred, they “reengage” at time tk=tr. At this point the seal faces impact
one-another due to their differing velocities, which can cause secondary dynamic vibration
as both seal faces could have very high dynamic moduli at this condition (e.g. chatter that
occurs in end face mechanical seals with hard faces). This effect is assumed to be small as
compared to the primary seal face separation effect and is neglected in this research. Finally,
to model the response of the material when there is a sealing gap (td < tk < tr), the delayed
recovery compliance model based on measured values is used (see later section). The
frequency range of interest is from 0.1 Hz to 50 Hz, which corresponds to 6 RPM to 3000
RPM in terms of common machine rotating speed. This frequency range was selected
because the measured results from the DMA testing in this study were limited to that range.
This covers the running speed range for many pieces of rotating equipment that may utilize
flexible seal materials. The model presented in this dissertation is more general and can
be extended to other frequency ranges.
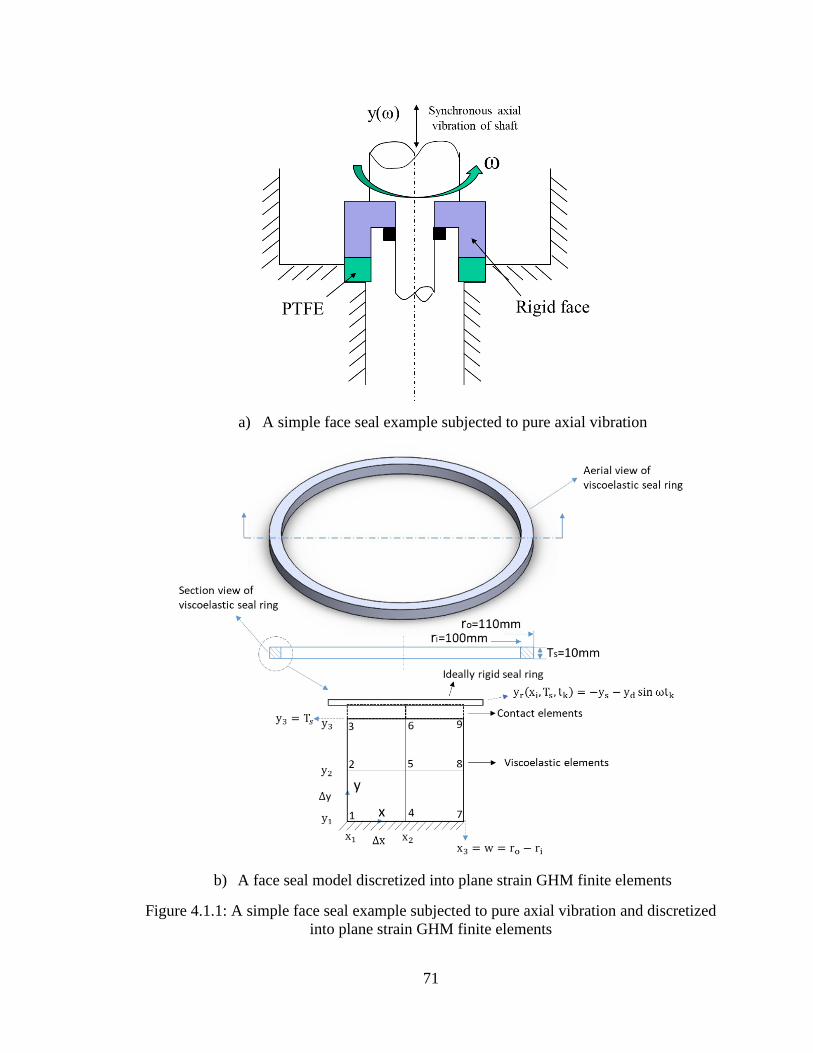
71
a) A simple face seal example subjected to pure axial vibration
b) A face seal model discretized into plane strain GHM finite elements
Figure 4.1.1: A simple face seal example subjected to pure axial vibration and discretized
into plane strain GHM finite elements
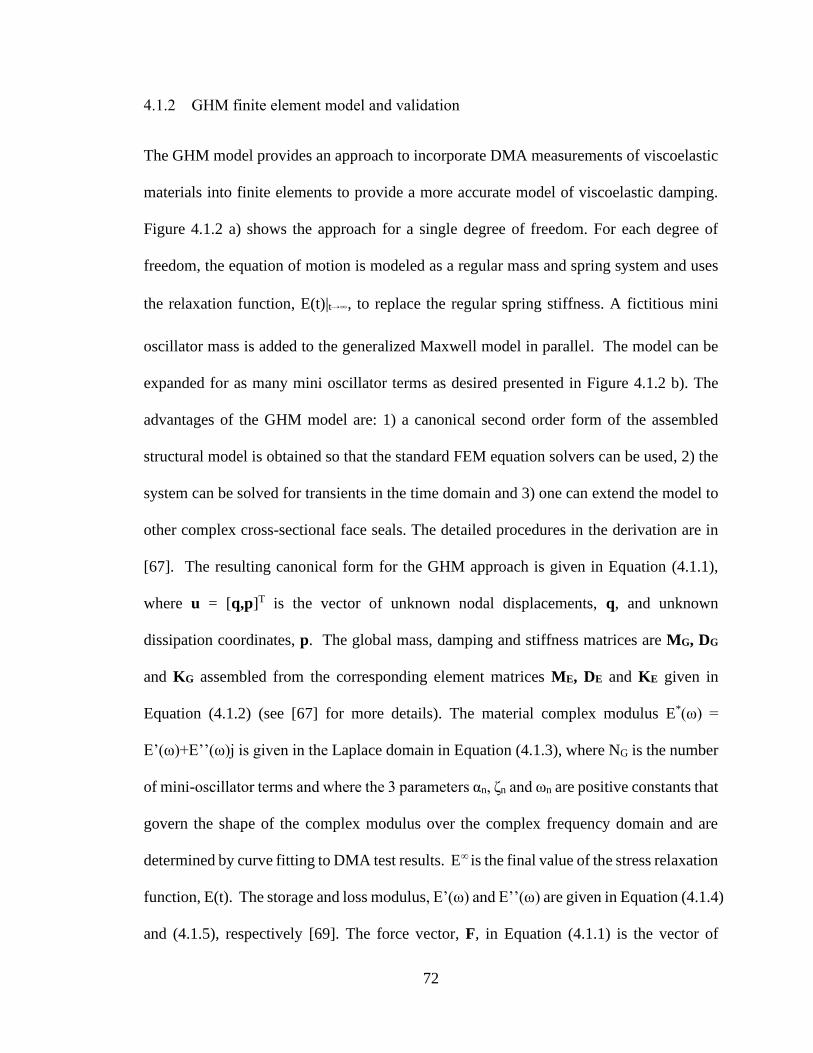
72
4.1.2 GHM finite element model and validation
The GHM model provides an approach to incorporate DMA measurements of viscoelastic
materials into finite elements to provide a more accurate model of viscoelastic damping.
Figure 4.1.2 a) shows the approach for a single degree of freedom. For each degree of
freedom, the equation of motion is modeled as a regular mass and spring system and uses
the relaxation function, E(t)|t→∞, to replace the regular spring stiffness. A fictitious mini
oscillator mass is added to the generalized Maxwell model in parallel. The model can be
expanded for as many mini oscillator terms as desired presented in Figure 4.1.2 b). The
advantages of the GHM model are: 1) a canonical second order form of the assembled
structural model is obtained so that the standard FEM equation solvers can be used, 2) the
system can be solved for transients in the time domain and 3) one can extend the model to
other complex cross-sectional face seals. The detailed procedures in the derivation are in
[67]. The resulting canonical form for the GHM approach is given in Equation (4.1.1),
where u = [q,p]T is the vector of unknown nodal displacements, q, and unknown
dissipation coordinates, p. The global mass, damping and stiffness matrices are MG, DG
and KG assembled from the corresponding element matrices ME, DE and KE given in
Equation (4.1.2) (see [67] for more details). The material complex modulus E*(ω) =
E’(ω)+E’’(ω)j is given in the Laplace domain in Equation (4.1.3), where NG is the number
of mini-oscillator terms and where the 3 parameters αn, ζn and ωn are positive constants that
govern the shape of the complex modulus over the complex frequency domain and are
determined by curve fitting to DMA test results. E∞ is the final value of the stress relaxation
function, E(t). The storage and loss modulus, E’(ω) and E’’(ω) are given in Equation (4.1.4)
and (4.1.5), respectively [69]. The force vector, F, in Equation (4.1.1) is the vector of
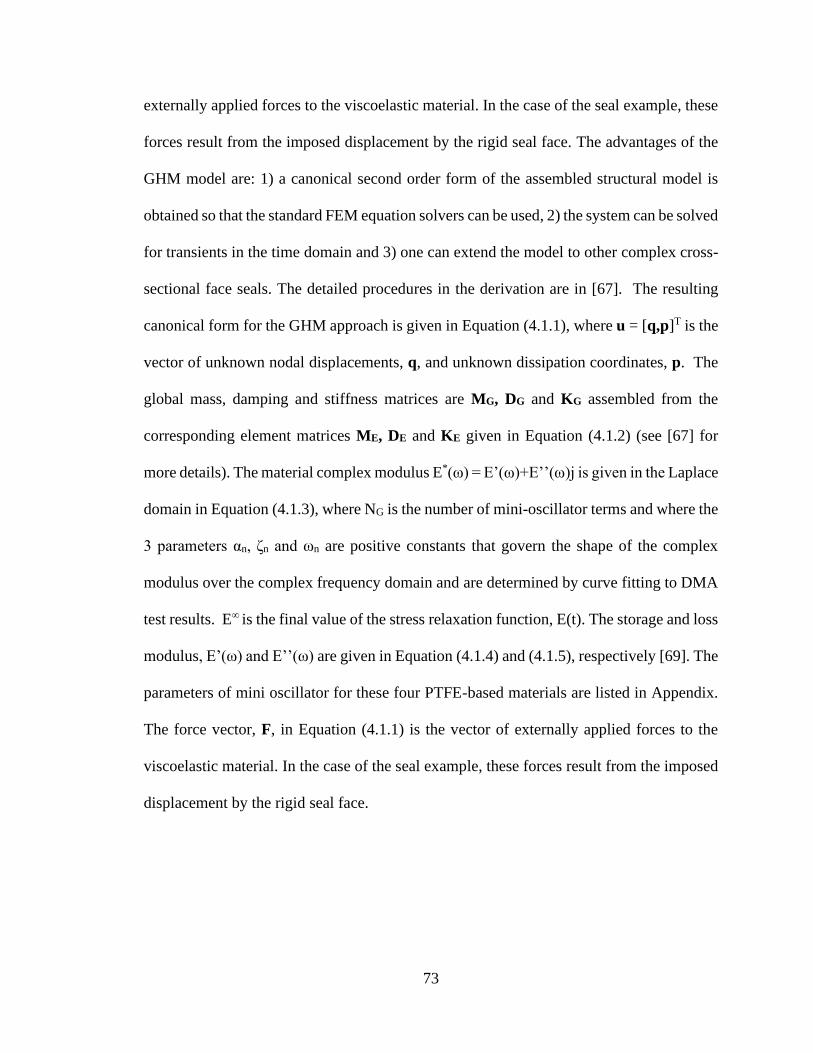
73
externally applied forces to the viscoelastic material. In the case of the seal example, these
forces result from the imposed displacement by the rigid seal face. The advantages of the
GHM model are: 1) a canonical second order form of the assembled structural model is
obtained so that the standard FEM equation solvers can be used, 2) the system can be solved
for transients in the time domain and 3) one can extend the model to other complex cross-
sectional face seals. The detailed procedures in the derivation are in [67]. The resulting
canonical form for the GHM approach is given in Equation (4.1.1), where u = [q,p]T is the
vector of unknown nodal displacements, q, and unknown dissipation coordinates, p. The
global mass, damping and stiffness matrices are MG, DG and KG assembled from the
corresponding element matrices ME, DE and KE given in Equation (4.1.2) (see [67] for
more details). The material complex modulus E*(ω) = E’(ω)+E’’(ω)j is given in the Laplace
domain in Equation (4.1.3), where NG is the number of mini-oscillator terms and where the
3 parameters αn, ζn and ωn are positive constants that govern the shape of the complex
modulus over the complex frequency domain and are determined by curve fitting to DMA
test results. E∞ is the final value of the stress relaxation function, E(t). The storage and loss
modulus, E’(ω) and E’’(ω) are given in Equation (4.1.4) and (4.1.5), respectively [69]. The
parameters of mini oscillator for these four PTFE-based materials are listed in Appendix.
The force vector, F, in Equation (4.1.1) is the vector of externally applied forces to the
viscoelastic material. In the case of the seal example, these forces result from the imposed
displacement by the rigid seal face.
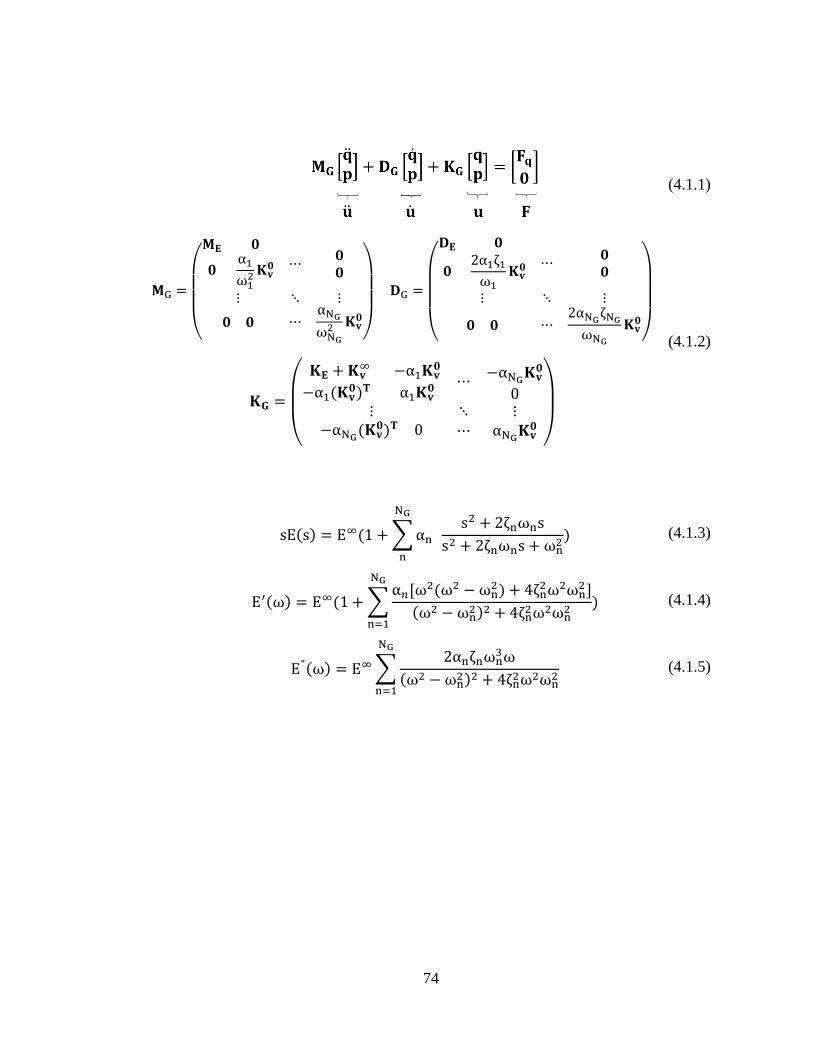
74
(4.1.1)
𝐌G =
(
𝐌𝐄 𝟎
𝟎α1
ω12𝐊𝐯
𝟎 ⋯𝟎𝟎
⋮ ⋱ ⋮
𝟎 𝟎 ⋯αNGωNG2 𝐊𝐯
𝟎
)
𝐃G =
(
𝐃𝐄 𝟎
𝟎2α1ζ1ω1
𝐊𝐯𝟎 ⋯
𝟎𝟎
⋮ ⋱ ⋮
𝟎 𝟎 ⋯2αNGζNGωNG
𝐊𝐯𝟎
)
(4.1.2)
𝐊𝐆 =
(
𝐊𝐄 + 𝐊𝐯
∞ −α1𝐊𝐯𝟎
−α1(𝐊𝐯𝟎)𝐓 α1𝐊𝐯
𝟎 ⋯−αNG𝐊𝐯
𝟎
0⋮ ⋱ ⋮
−αNG(𝐊𝐯𝟎)𝐓 0 ⋯ αNG𝐊𝐯
𝟎
)
sE(s) = E∞(1 +∑αn
NG
n
s2 + 2ζnωns
s2 + 2ζnωns + ωn2) (4.1.3)
E′(ω) = E∞(1 +∑α𝑛[ω
2(ω2 −ωn2) + 4ζn
2ω2ωn2]
(ω2 −ωn2)2 + 4ζn2ω2ωn2
NG
n=1
) (4.1.4)
E"(ω) = E∞∑2αnζnωn
3ω
(ω2 −ωn2)2 + 4ζn2ω2ωn2
NG
n=1
(4.1.5)
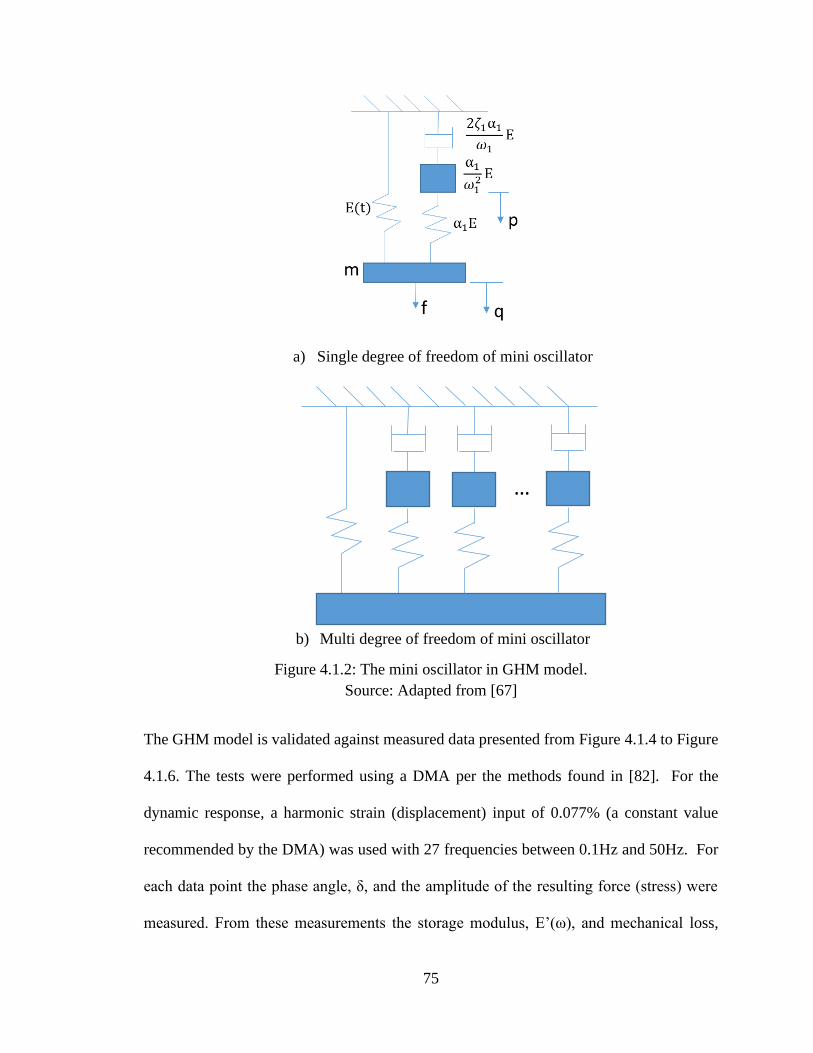
75
a) Single degree of freedom of mini oscillator
b) Multi degree of freedom of mini oscillator
Figure 4.1.2: The mini oscillator in GHM model.
Source: Adapted from [67]
The GHM model is validated against measured data presented from Figure 4.1.4 to Figure
4.1.6. The tests were performed using a DMA per the methods found in [82]. For the
dynamic response, a harmonic strain (displacement) input of 0.077% (a constant value
recommended by the DMA) was used with 27 frequencies between 0.1Hz and 50Hz. For
each data point the phase angle, δ, and the amplitude of the resulting force (stress) were
measured. From these measurements the storage modulus, E’(ω), and mechanical loss,
…
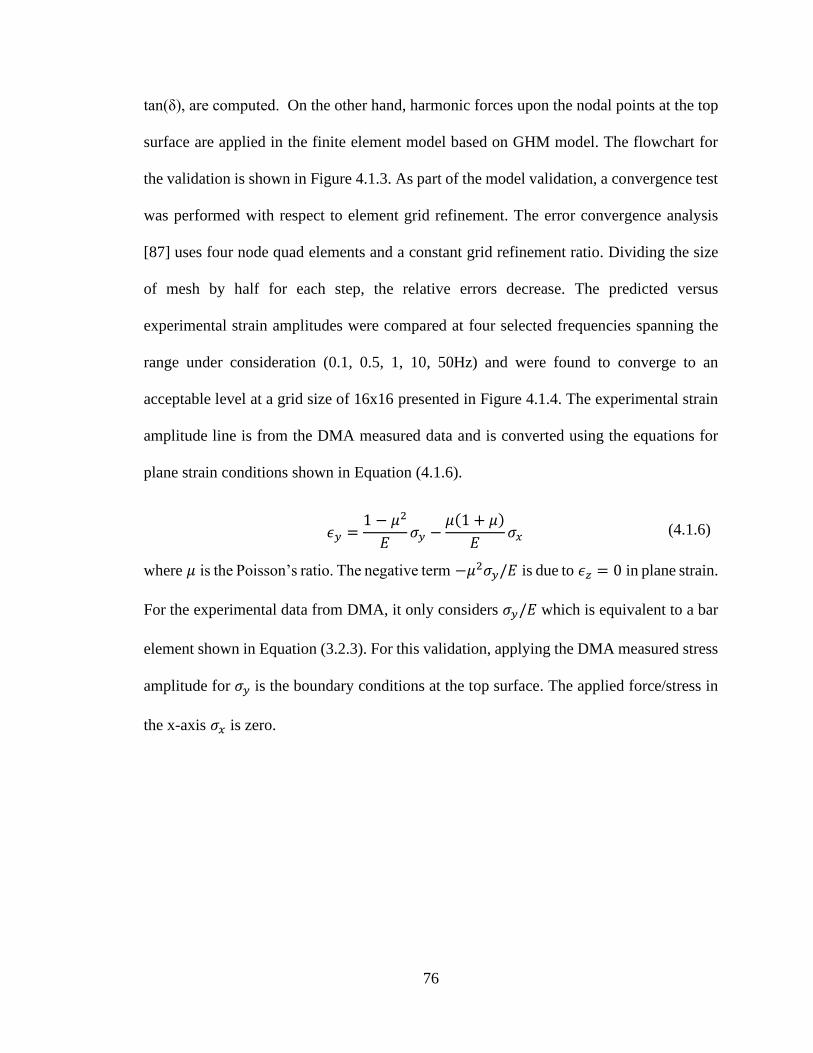
76
tan(δ), are computed. On the other hand, harmonic forces upon the nodal points at the top
surface are applied in the finite element model based on GHM model. The flowchart for
the validation is shown in Figure 4.1.3. As part of the model validation, a convergence test
was performed with respect to element grid refinement. The error convergence analysis
[87] uses four node quad elements and a constant grid refinement ratio. Dividing the size
of mesh by half for each step, the relative errors decrease. The predicted versus
experimental strain amplitudes were compared at four selected frequencies spanning the
range under consideration (0.1, 0.5, 1, 10, 50Hz) and were found to converge to an
acceptable level at a grid size of 16x16 presented in Figure 4.1.4. The experimental strain
amplitude line is from the DMA measured data and is converted using the equations for
plane strain conditions shown in Equation (4.1.6).
𝜖𝑦 =1 − 𝜇2
𝐸𝜎𝑦 −
𝜇(1 + 𝜇)
𝐸𝜎𝑥 (4.1.6)
where 𝜇 is the Poisson’s ratio. The negative term −𝜇2𝜎𝑦/𝐸 is due to 𝜖𝑧 = 0 in plane strain.
For the experimental data from DMA, it only considers 𝜎𝑦/𝐸 which is equivalent to a bar
element shown in Equation (3.2.3). For this validation, applying the DMA measured stress
amplitude for 𝜎𝑦 is the boundary conditions at the top surface. The applied force/stress in
the x-axis 𝜎𝑥 is zero.
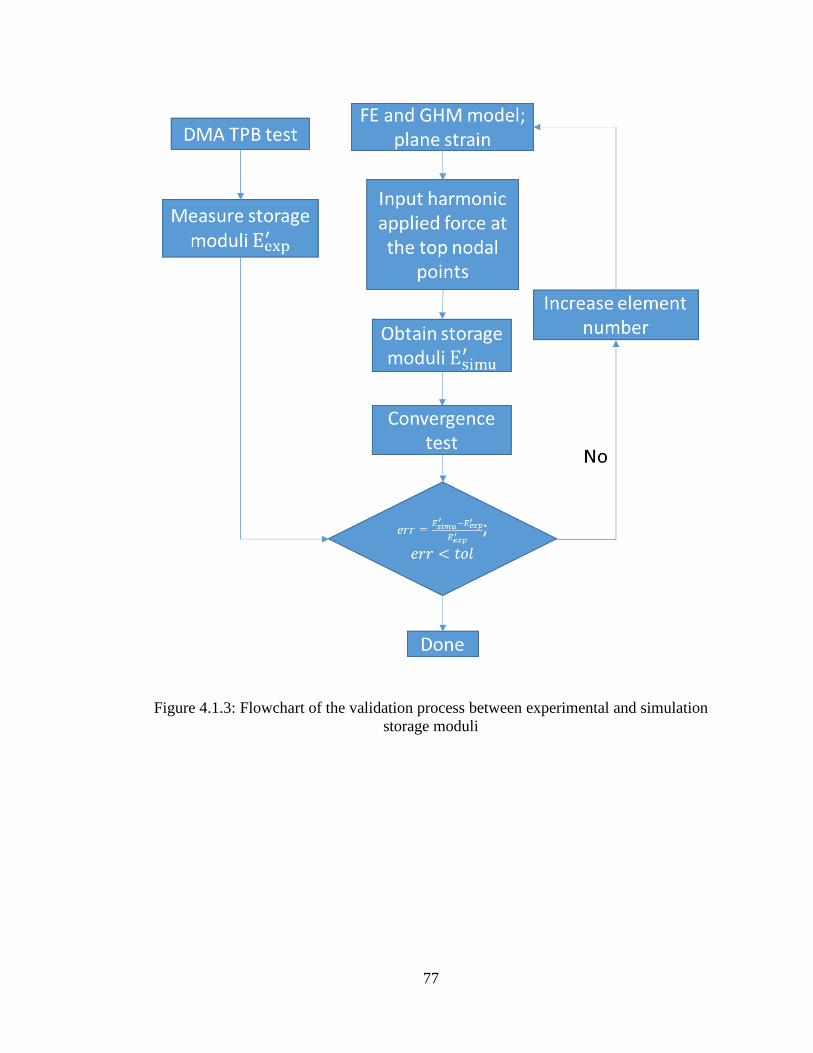
77
Figure 4.1.3: Flowchart of the validation process between experimental and simulation
storage moduli
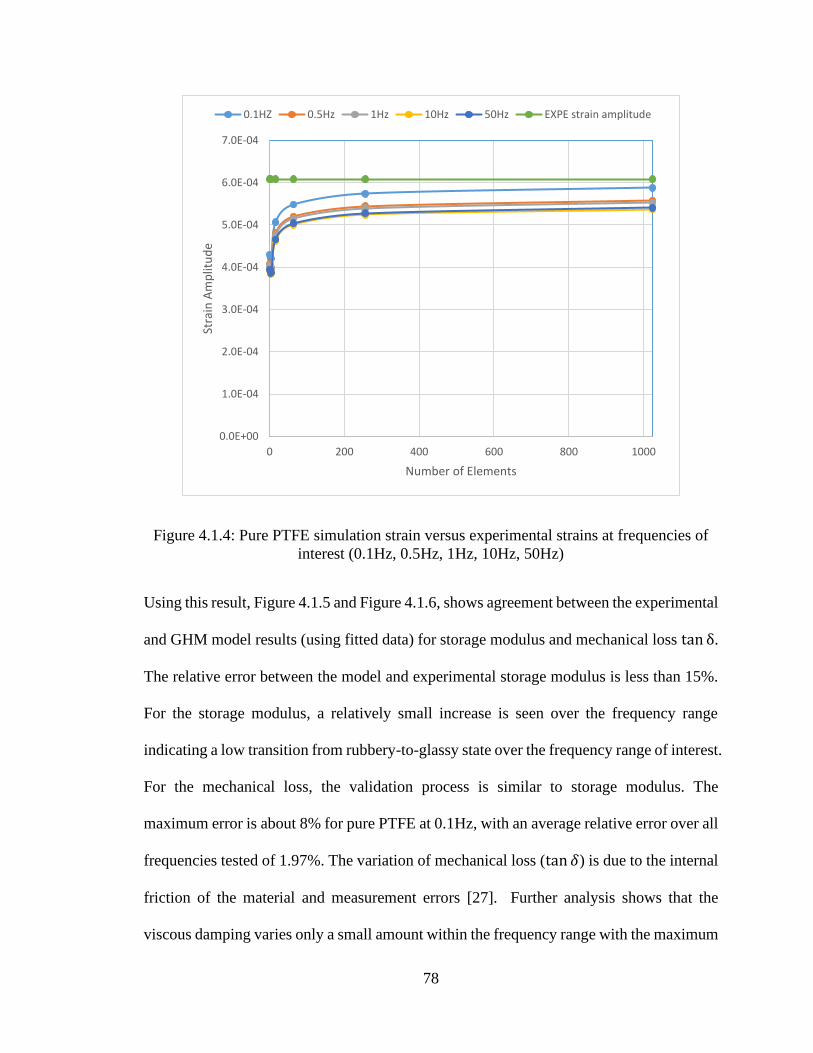
78
Figure 4.1.4: Pure PTFE simulation strain versus experimental strains at frequencies of
interest (0.1Hz, 0.5Hz, 1Hz, 10Hz, 50Hz)
Using this result, Figure 4.1.5 and Figure 4.1.6, shows agreement between the experimental
and GHM model results (using fitted data) for storage modulus and mechanical loss tan δ.
The relative error between the model and experimental storage modulus is less than 15%.
For the storage modulus, a relatively small increase is seen over the frequency range
indicating a low transition from rubbery-to-glassy state over the frequency range of interest.
For the mechanical loss, the validation process is similar to storage modulus. The
maximum error is about 8% for pure PTFE at 0.1Hz, with an average relative error over all
frequencies tested of 1.97%. The variation of mechanical loss (tan 𝛿) is due to the internal
friction of the material and measurement errors [27]. Further analysis shows that the
viscous damping varies only a small amount within the frequency range with the maximum
0.0E+00
1.0E-04
2.0E-04
3.0E-04
4.0E-04
5.0E-04
6.0E-04
7.0E-04
0 200 400 600 800 1000
Stra
in A
mp
litu
de
Number of Elements
0.1HZ 0.5Hz 1Hz 10Hz 50Hz EXPE strain amplitude
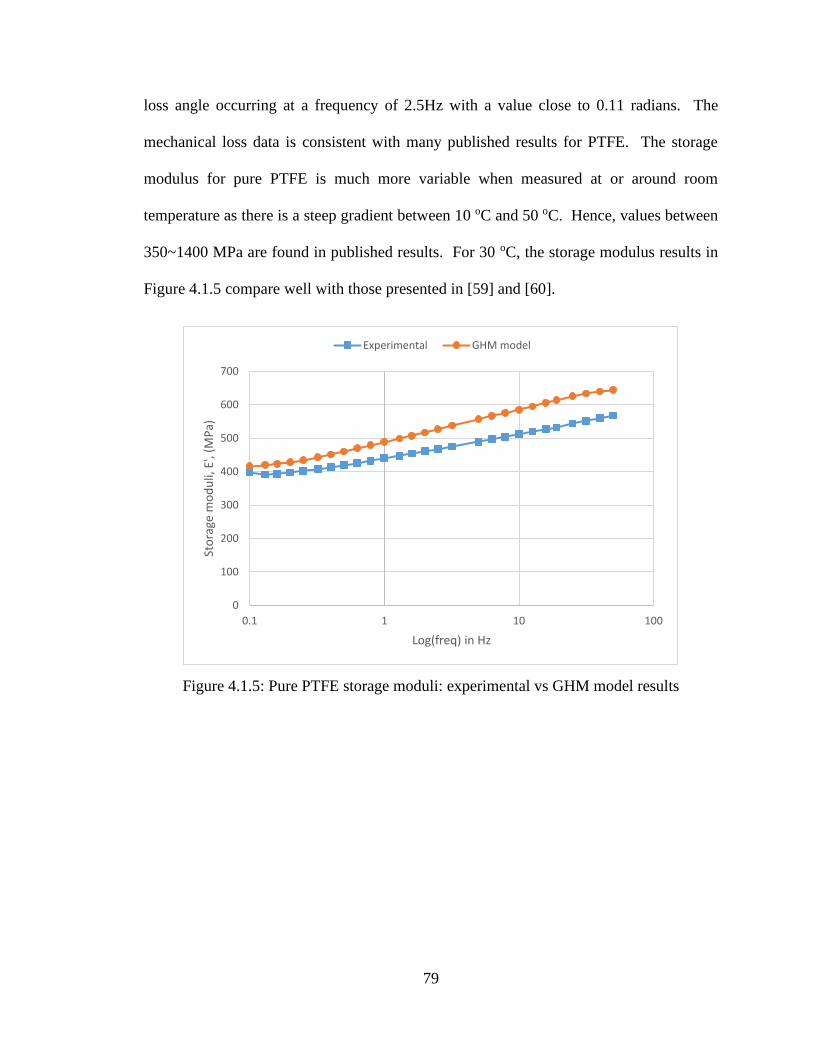
79
loss angle occurring at a frequency of 2.5Hz with a value close to 0.11 radians. The
mechanical loss data is consistent with many published results for PTFE. The storage
modulus for pure PTFE is much more variable when measured at or around room
temperature as there is a steep gradient between 10 oC and 50 oC. Hence, values between
350~1400 MPa are found in published results. For 30 oC, the storage modulus results in
Figure 4.1.5 compare well with those presented in [59] and [60].
Figure 4.1.5: Pure PTFE storage moduli: experimental vs GHM model results
0
100
200
300
400
500
600
700
0.1 1 10 100
Sto
rage
mo
du
li, E
', (M
Pa)
Log(freq) in Hz
Experimental GHM model
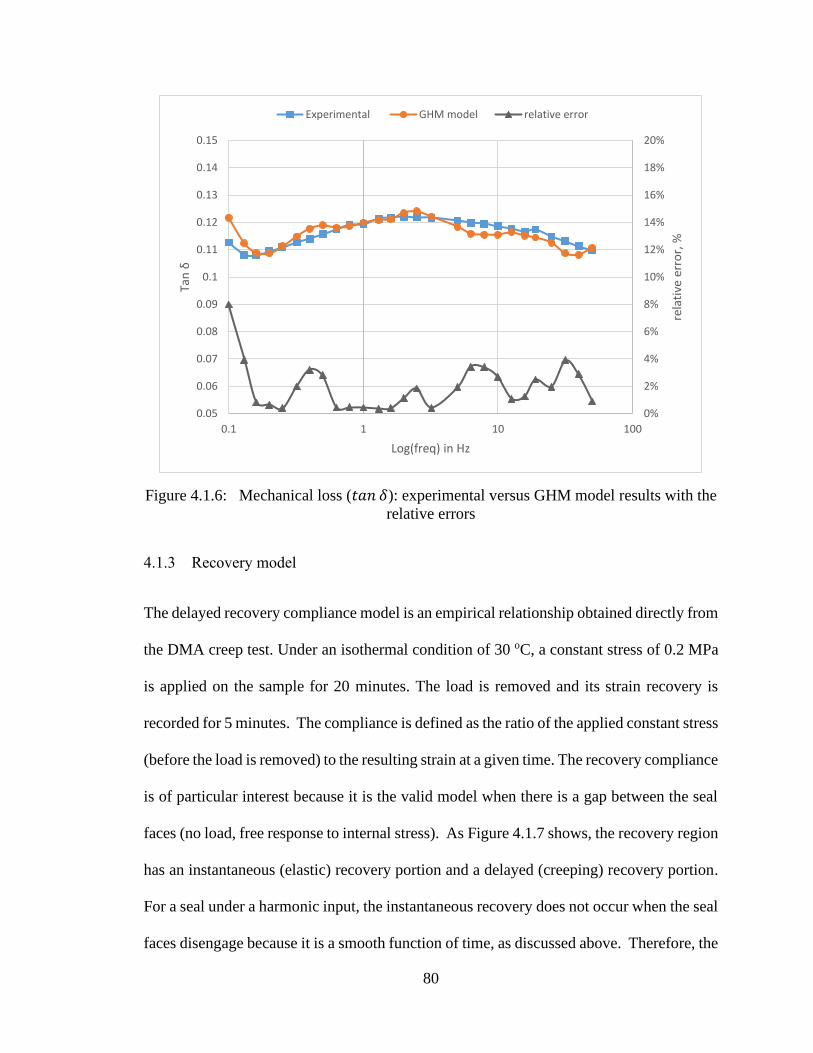
80
Figure 4.1.6: Mechanical loss (𝑡𝑎𝑛 𝛿): experimental versus GHM model results with the
relative errors
4.1.3 Recovery model
The delayed recovery compliance model is an empirical relationship obtained directly from
the DMA creep test. Under an isothermal condition of 30 oC, a constant stress of 0.2 MPa
is applied on the sample for 20 minutes. The load is removed and its strain recovery is
recorded for 5 minutes. The compliance is defined as the ratio of the applied constant stress
(before the load is removed) to the resulting strain at a given time. The recovery compliance
is of particular interest because it is the valid model when there is a gap between the seal
faces (no load, free response to internal stress). As Figure 4.1.7 shows, the recovery region
has an instantaneous (elastic) recovery portion and a delayed (creeping) recovery portion.
For a seal under a harmonic input, the instantaneous recovery does not occur when the seal
faces disengage because it is a smooth function of time, as discussed above. Therefore, the
0%
2%
4%
6%
8%
10%
12%
14%
16%
18%
20%
0.05
0.06
0.07
0.08
0.09
0.1
0.11
0.12
0.13
0.14
0.15
0.1 1 10 100
rela
tive
err
or,
%
Tan
δ
Log(freq) in Hz
Experimental GHM model relative error
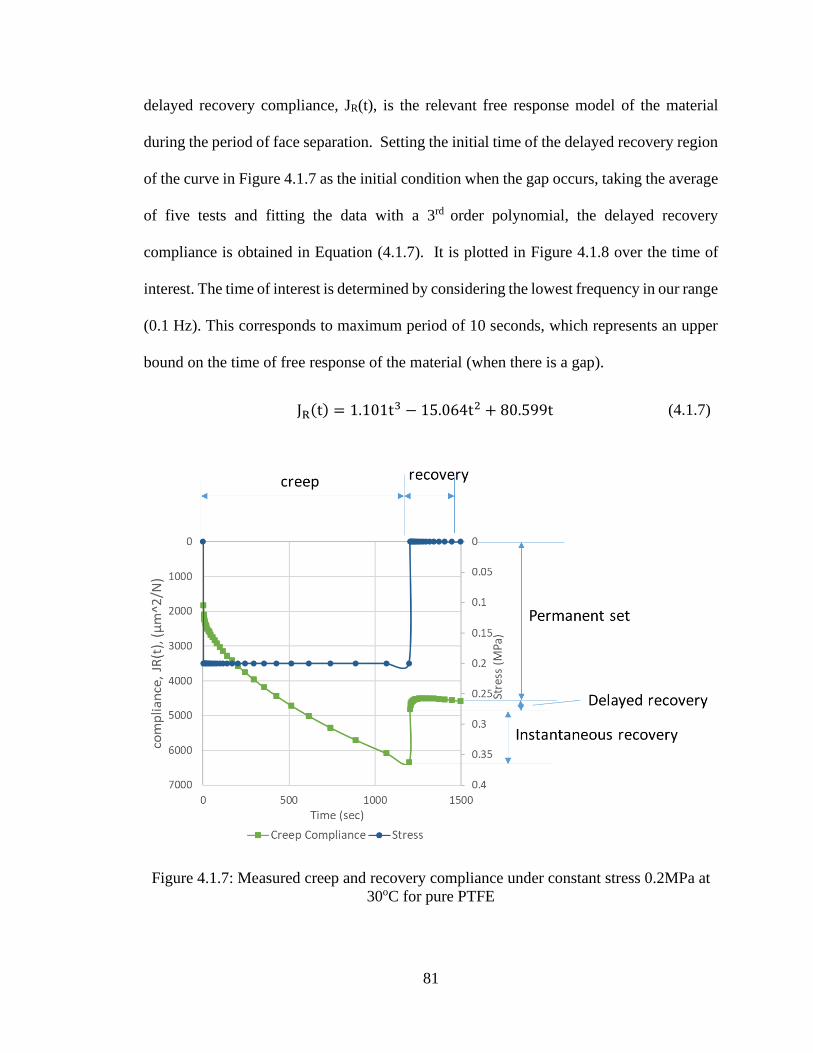
81
delayed recovery compliance, JR(t), is the relevant free response model of the material
during the period of face separation. Setting the initial time of the delayed recovery region
of the curve in Figure 4.1.7 as the initial condition when the gap occurs, taking the average
of five tests and fitting the data with a 3rd order polynomial, the delayed recovery
compliance is obtained in Equation (4.1.7). It is plotted in Figure 4.1.8 over the time of
interest. The time of interest is determined by considering the lowest frequency in our range
(0.1 Hz). This corresponds to maximum period of 10 seconds, which represents an upper
bound on the time of free response of the material (when there is a gap).
JR(t) = 1.101t3 − 15.064t2 + 80.599t (4.1.7)
Figure 4.1.7: Measured creep and recovery compliance under constant stress 0.2MPa at
30oC for pure PTFE
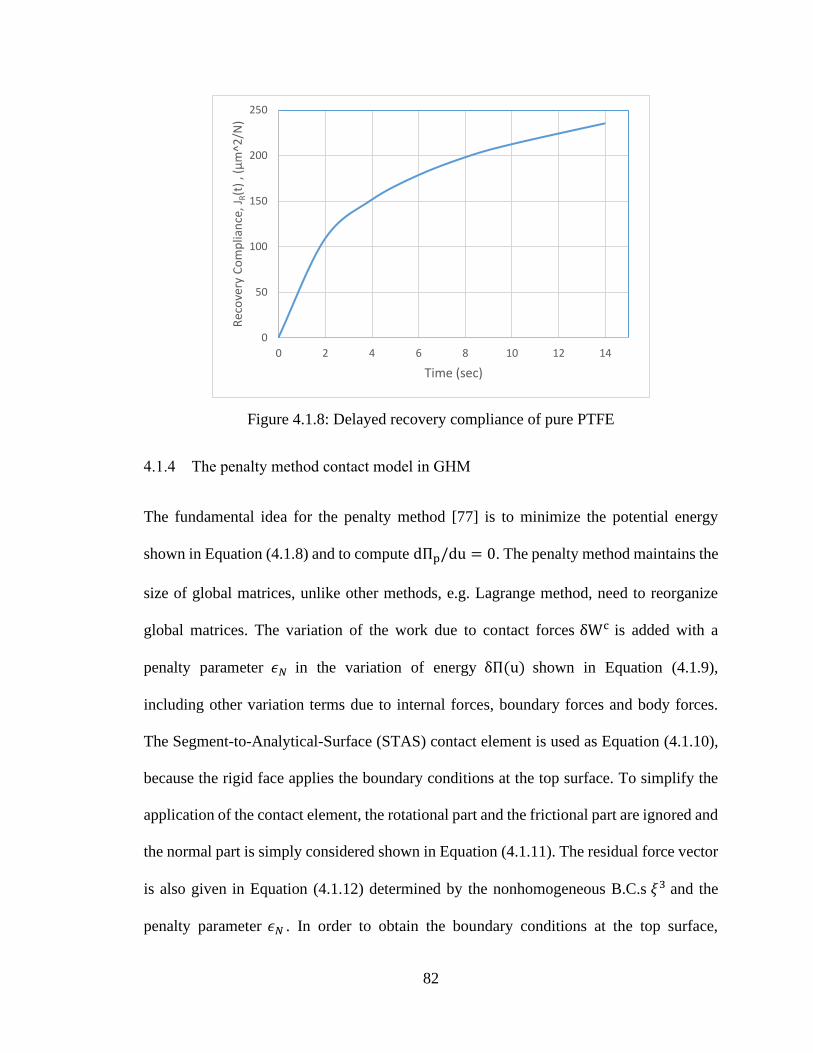
82
Figure 4.1.8: Delayed recovery compliance of pure PTFE
4.1.4 The penalty method contact model in GHM
The fundamental idea for the penalty method [77] is to minimize the potential energy
shown in Equation (4.1.8) and to compute dΠp/du = 0. The penalty method maintains the
size of global matrices, unlike other methods, e.g. Lagrange method, need to reorganize
global matrices. The variation of the work due to contact forces δWc is added with a
penalty parameter 𝜖𝑁 in the variation of energy δΠ(u) shown in Equation (4.1.9),
including other variation terms due to internal forces, boundary forces and body forces.
The Segment-to-Analytical-Surface (STAS) contact element is used as Equation (4.1.10),
because the rigid face applies the boundary conditions at the top surface. To simplify the
application of the contact element, the rotational part and the frictional part are ignored and
the normal part is simply considered shown in Equation (4.1.11). The residual force vector
is also given in Equation (4.1.12) determined by the nonhomogeneous B.C.s 𝜉3 and the
penalty parameter 𝜖𝑁 . In order to obtain the boundary conditions at the top surface,
0
50
100
150
200
250
0 2 4 6 8 10 12 14
Rec
ove
ry C
om
plia
nce
, JR(t
) , (
μm
^2/N
)
Time (sec)
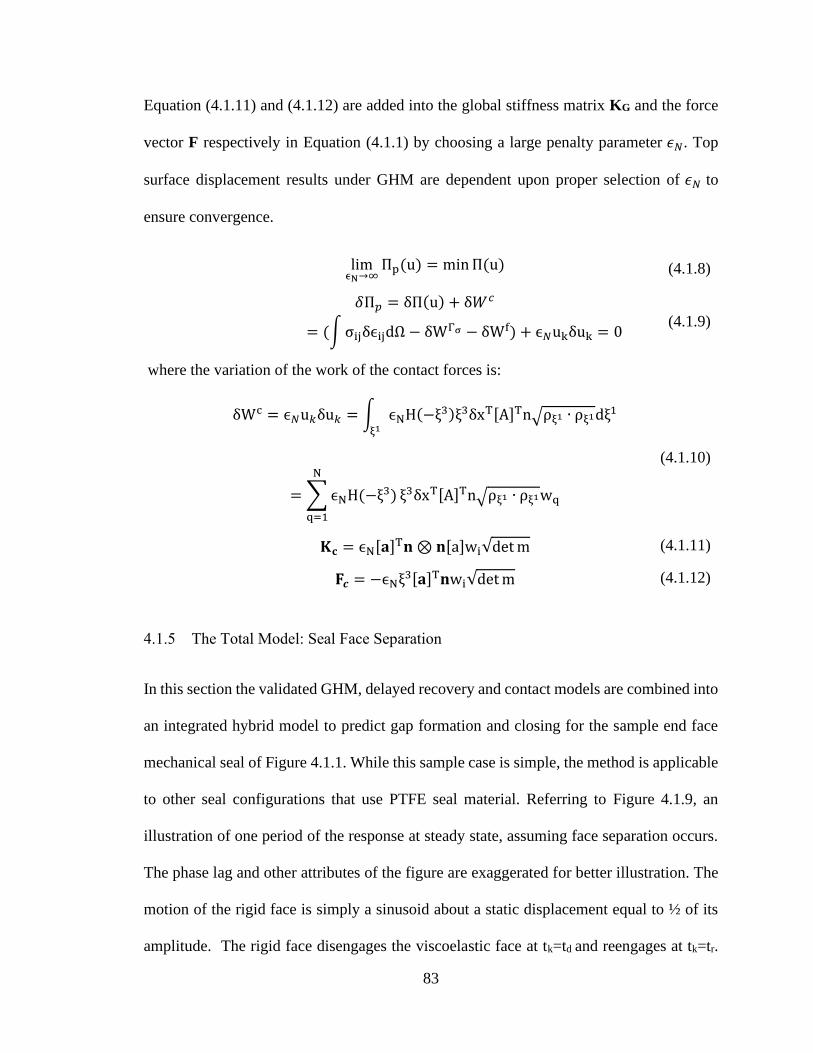
83
Equation (4.1.11) and (4.1.12) are added into the global stiffness matrix KG and the force
vector F respectively in Equation (4.1.1) by choosing a large penalty parameter 𝜖𝑁. Top
surface displacement results under GHM are dependent upon proper selection of 𝜖𝑁 to
ensure convergence.
limϵN→∞
Πp(u) = minΠ(u) (4.1.8)
𝛿Π𝑝 = δΠ(u) + δ𝑊𝑐
= (∫σijδϵijdΩ − δWΓσ − δWf) + ϵ𝑁ukδuk = 0
(4.1.9)
where the variation of the work of the contact forces is:
δWc = ϵ𝑁u𝑘δu𝑘 = ∫ ϵNH(−ξ3)ξ3δxT[A]Tn√ρξ1 ∙ ρξ1dξ
1
ξ1
=∑ϵNH(−ξ3)
N
q=1
ξ3δxT[A]Tn√ρξ1 ∙ ρξ1wq
(4.1.10)
𝐊𝐜 = ϵN[𝐚]T𝐧⊗ 𝐧[a]wi√detm (4.1.11)
𝐅𝒄 = −ϵNξ3[𝐚]T𝐧wi√detm (4.1.12)
4.1.5 The Total Model: Seal Face Separation
In this section the validated GHM, delayed recovery and contact models are combined into
an integrated hybrid model to predict gap formation and closing for the sample end face
mechanical seal of Figure 4.1.1. While this sample case is simple, the method is applicable
to other seal configurations that use PTFE seal material. Referring to Figure 4.1.9, an
illustration of one period of the response at steady state, assuming face separation occurs.
The phase lag and other attributes of the figure are exaggerated for better illustration. The
motion of the rigid face is simply a sinusoid about a static displacement equal to ½ of its
amplitude. The rigid face disengages the viscoelastic face at tk=td and reengages at tk=tr.
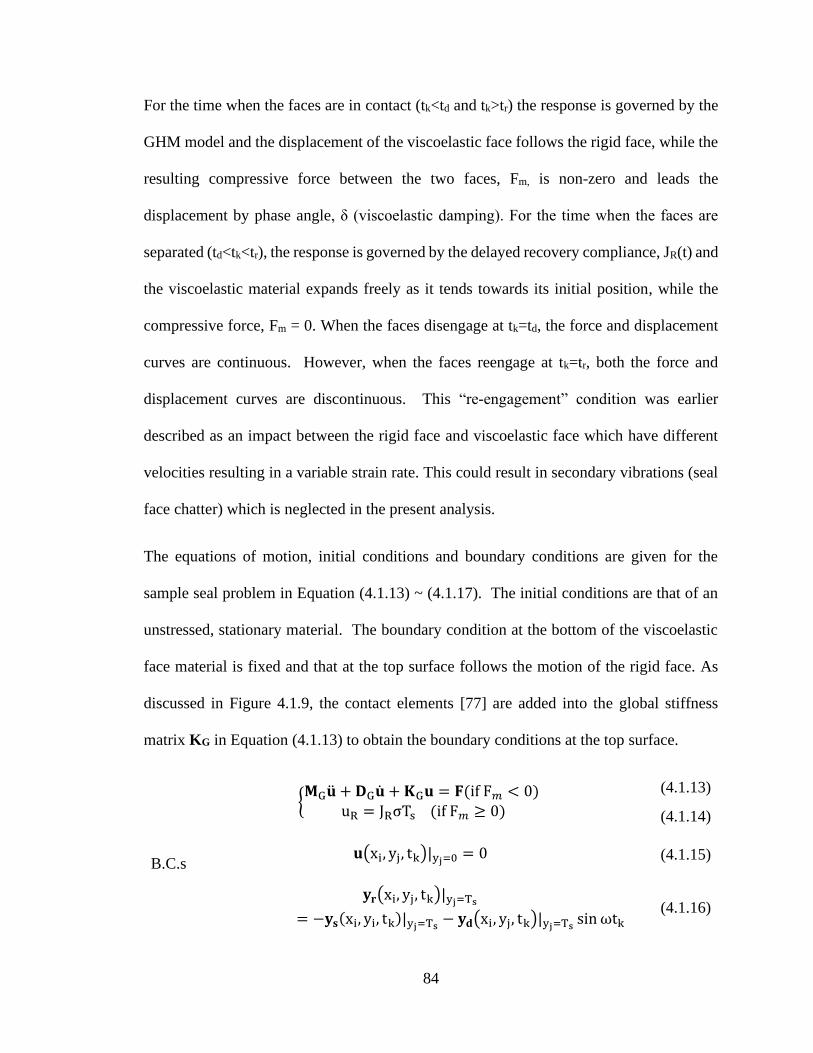
84
For the time when the faces are in contact (tk<td and tk>tr) the response is governed by the
GHM model and the displacement of the viscoelastic face follows the rigid face, while the
resulting compressive force between the two faces, Fm, is non-zero and leads the
displacement by phase angle, δ (viscoelastic damping). For the time when the faces are
separated (td<tk<tr), the response is governed by the delayed recovery compliance, JR(t) and
the viscoelastic material expands freely as it tends towards its initial position, while the
compressive force, Fm = 0. When the faces disengage at tk=td, the force and displacement
curves are continuous. However, when the faces reengage at tk=tr, both the force and
displacement curves are discontinuous. This “re-engagement” condition was earlier
described as an impact between the rigid face and viscoelastic face which have different
velocities resulting in a variable strain rate. This could result in secondary vibrations (seal
face chatter) which is neglected in the present analysis.
The equations of motion, initial conditions and boundary conditions are given for the
sample seal problem in Equation (4.1.13) ~ (4.1.17). The initial conditions are that of an
unstressed, stationary material. The boundary condition at the bottom of the viscoelastic
face material is fixed and that at the top surface follows the motion of the rigid face. As
discussed in Figure 4.1.9, the contact elements [77] are added into the global stiffness
matrix KG in Equation (4.1.13) to obtain the boundary conditions at the top surface.
{𝐌G�� + 𝐃G�� + 𝐊G𝐮 = 𝐅(if F𝑚 < 0)
uR = JRσTs (if F𝑚 ≥ 0)
(4.1.13)
(4.1.14)
B.C.s 𝐮(xi, yj, tk)|yj=0 = 0 (4.1.15)
𝐲𝐫(xi, yj, tk)|yj=Ts
= −𝐲𝐬(xi, yi, tk)|yj=Ts − 𝐲𝐝(xi, yj, tk)|yj=Ts sinωtk (4.1.16)
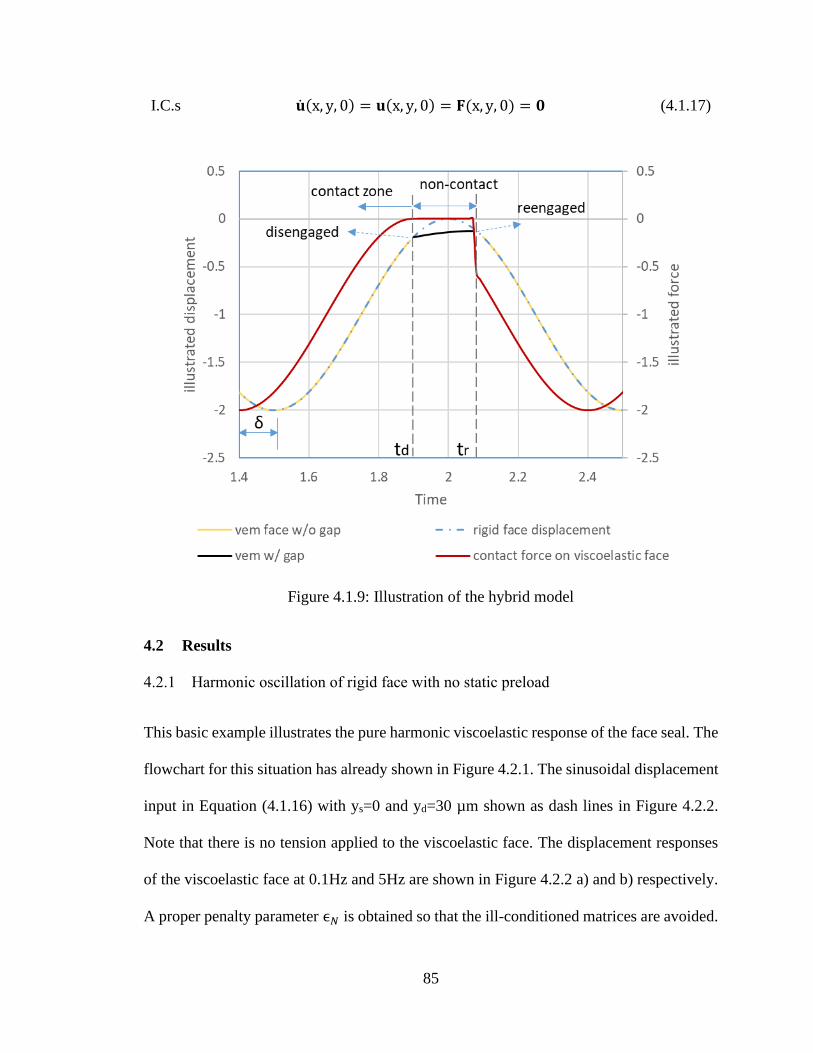
85
I.C.s ��(x, y, 0) = 𝐮(x, y, 0) = 𝐅(x, y, 0) = 𝟎 (4.1.17)
Figure 4.1.9: Illustration of the hybrid model
4.2 Results
4.2.1 Harmonic oscillation of rigid face with no static preload
This basic example illustrates the pure harmonic viscoelastic response of the face seal. The
flowchart for this situation has already shown in Figure 4.2.1. The sinusoidal displacement
input in Equation (4.1.16) with ys=0 and yd=30 µm shown as dash lines in Figure 4.2.2.
Note that there is no tension applied to the viscoelastic face. The displacement responses
of the viscoelastic face at 0.1Hz and 5Hz are shown in Figure 4.2.2 a) and b) respectively.
A proper penalty parameter ϵ𝑁 is obtained so that the ill-conditioned matrices are avoided.
86
Observe that the recovery process at 0.1Hz is more apparent than that at 5Hz due to the
length of time response. The lower the frequency is, the higher the delayed recovery
displacement of the viscoelastic face. By comparing the recovery time, it is about 5 sec at
0.1Hz (from 5 sec to 10 sec), while the recovery process at 5Hz is 0.1 sec (from 0.1 to 0.2
sec), such that the recovery time is 50 times shorter. Thus, the recovery process results in
a visually flat line in Figure 4.2.2 b). The total contact force between the seal faces is also
shown at both frequencies. In both cases, separation occurs when the compressive contact
force becomes zero and during this time the viscoelastic face expands freely per the delayed
recovery model. Also, in both cases the contact force seems to be in phase with the
displacement. However, this is not the case. From Figure 4.1.6, the phase angle at both
frequencies is approximately 0.1 radians. The corresponding time shift in the force
waveform is only 0.16 and 0.0032 seconds for 0.1 Hz and 5 Hz, respectively. Both time
shifts are imperceptible on the timescales used for the plots.
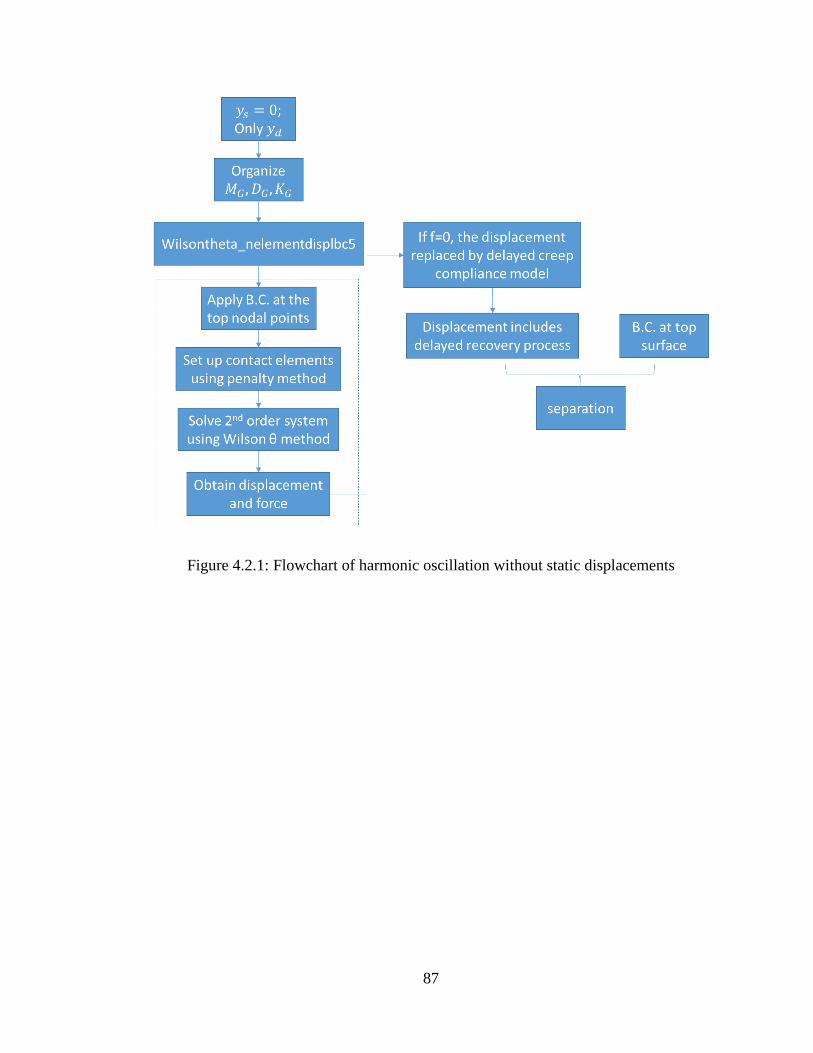
87
Figure 4.2.1: Flowchart of harmonic oscillation without static displacements
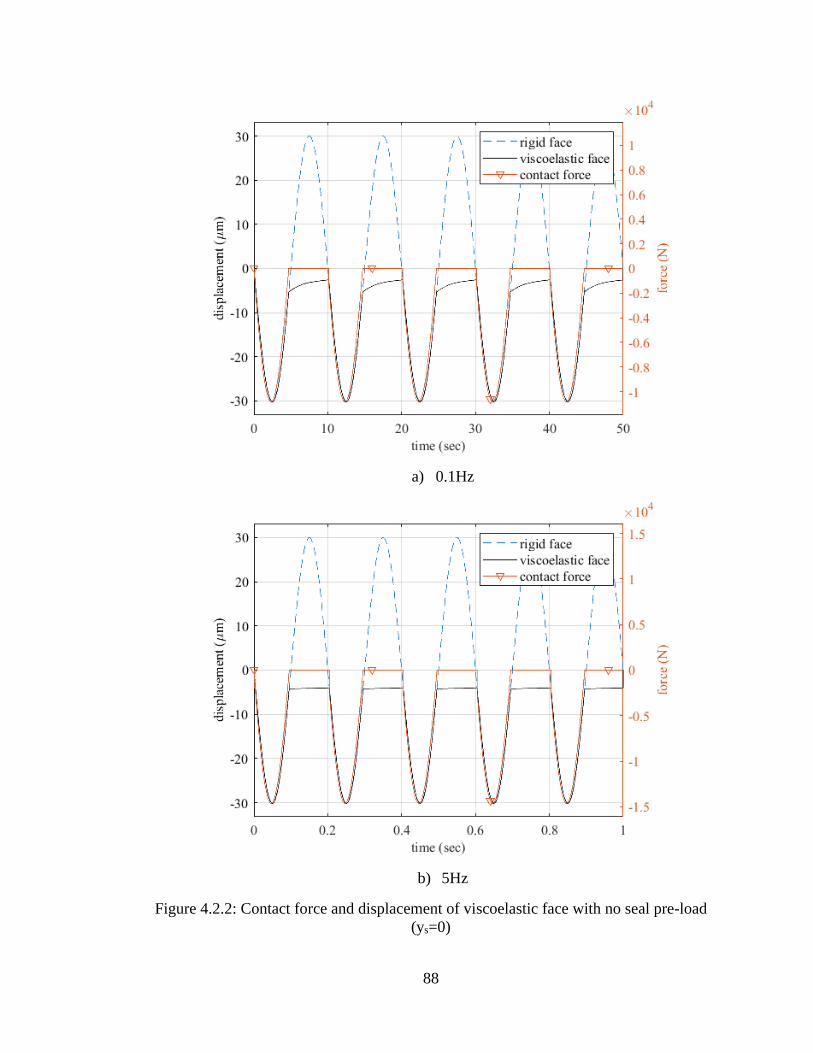
88
a) 0.1Hz
b) 5Hz
Figure 4.2.2: Contact force and displacement of viscoelastic face with no seal pre-load
(ys=0)
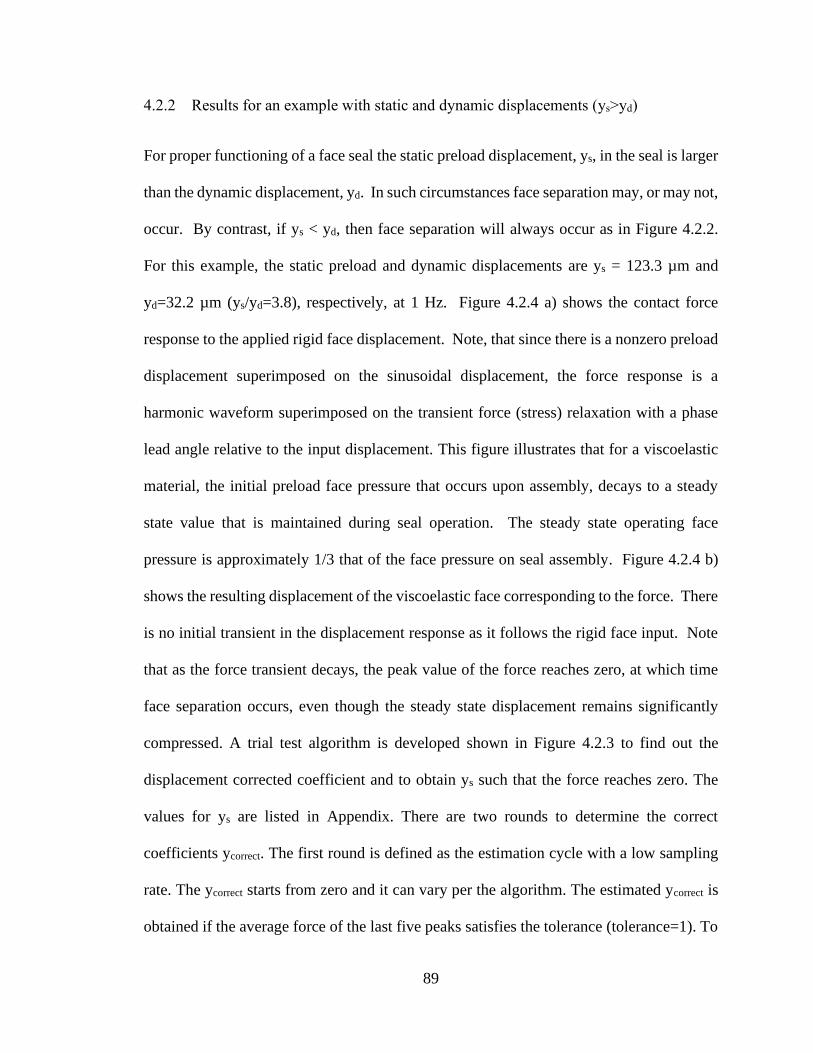
89
4.2.2 Results for an example with static and dynamic displacements (ys>yd)
For proper functioning of a face seal the static preload displacement, ys, in the seal is larger
than the dynamic displacement, yd. In such circumstances face separation may, or may not,
occur. By contrast, if ys < yd, then face separation will always occur as in Figure 4.2.2.
For this example, the static preload and dynamic displacements are ys = 123.3 µm and
yd=32.2 µm (ys/yd=3.8), respectively, at 1 Hz. Figure 4.2.4 a) shows the contact force
response to the applied rigid face displacement. Note, that since there is a nonzero preload
displacement superimposed on the sinusoidal displacement, the force response is a
harmonic waveform superimposed on the transient force (stress) relaxation with a phase
lead angle relative to the input displacement. This figure illustrates that for a viscoelastic
material, the initial preload face pressure that occurs upon assembly, decays to a steady
state value that is maintained during seal operation. The steady state operating face
pressure is approximately 1/3 that of the face pressure on seal assembly. Figure 4.2.4 b)
shows the resulting displacement of the viscoelastic face corresponding to the force. There
is no initial transient in the displacement response as it follows the rigid face input. Note
that as the force transient decays, the peak value of the force reaches zero, at which time
face separation occurs, even though the steady state displacement remains significantly
compressed. A trial test algorithm is developed shown in Figure 4.2.3 to find out the
displacement corrected coefficient and to obtain ys such that the force reaches zero. The
values for ys are listed in Appendix. There are two rounds to determine the correct
coefficients ycorrect. The first round is defined as the estimation cycle with a low sampling
rate. The ycorrect starts from zero and it can vary per the algorithm. The estimated ycorrect is
obtained if the average force of the last five peaks satisfies the tolerance (tolerance=1). To
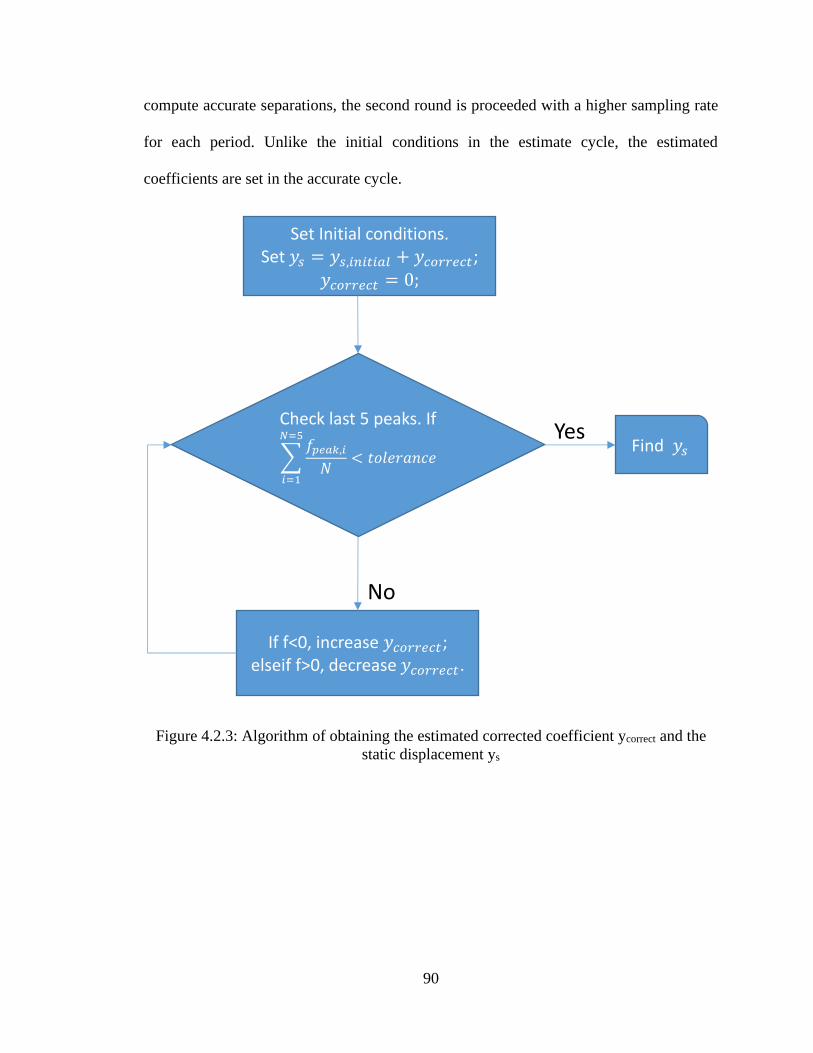
90
compute accurate separations, the second round is proceeded with a higher sampling rate
for each period. Unlike the initial conditions in the estimate cycle, the estimated
coefficients are set in the accurate cycle.
Figure 4.2.3: Algorithm of obtaining the estimated corrected coefficient ycorrect and the
static displacement ys
Set Initial conditions. Set 𝑦𝑠 = 𝑦𝑠,𝑖𝑛𝑖𝑡𝑖𝑎𝑙 + 𝑦𝑐𝑜𝑟𝑟𝑒𝑐𝑡;
𝑦𝑐𝑜𝑟𝑟𝑒𝑐𝑡 = 0;
Check last 5 peaks. If
∑𝑓𝑝𝑒𝑎𝑘,𝑖
𝑁
𝑁=5
𝑖=1
< 𝑡𝑜𝑙𝑒𝑟𝑎𝑛𝑐𝑒 Find 𝑦𝑠
If f<0, increase 𝑦𝑐𝑜𝑟𝑟𝑒𝑐𝑡; elseif f>0, decrease 𝑦𝑐𝑜𝑟𝑟𝑒𝑐𝑡.
Yes
No
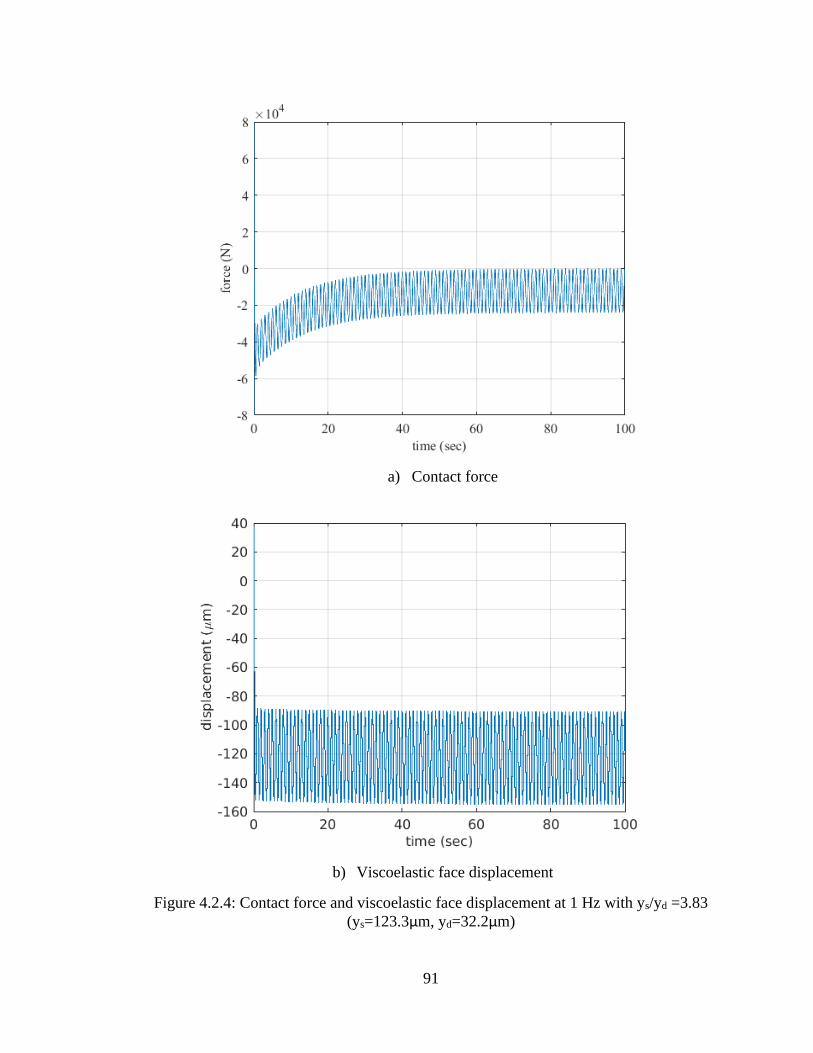
91
a) Contact force
b) Viscoelastic face displacement
Figure 4.2.4: Contact force and viscoelastic face displacement at 1 Hz with ys/yd =3.83
(ys=123.3μm, yd=32.2μm)
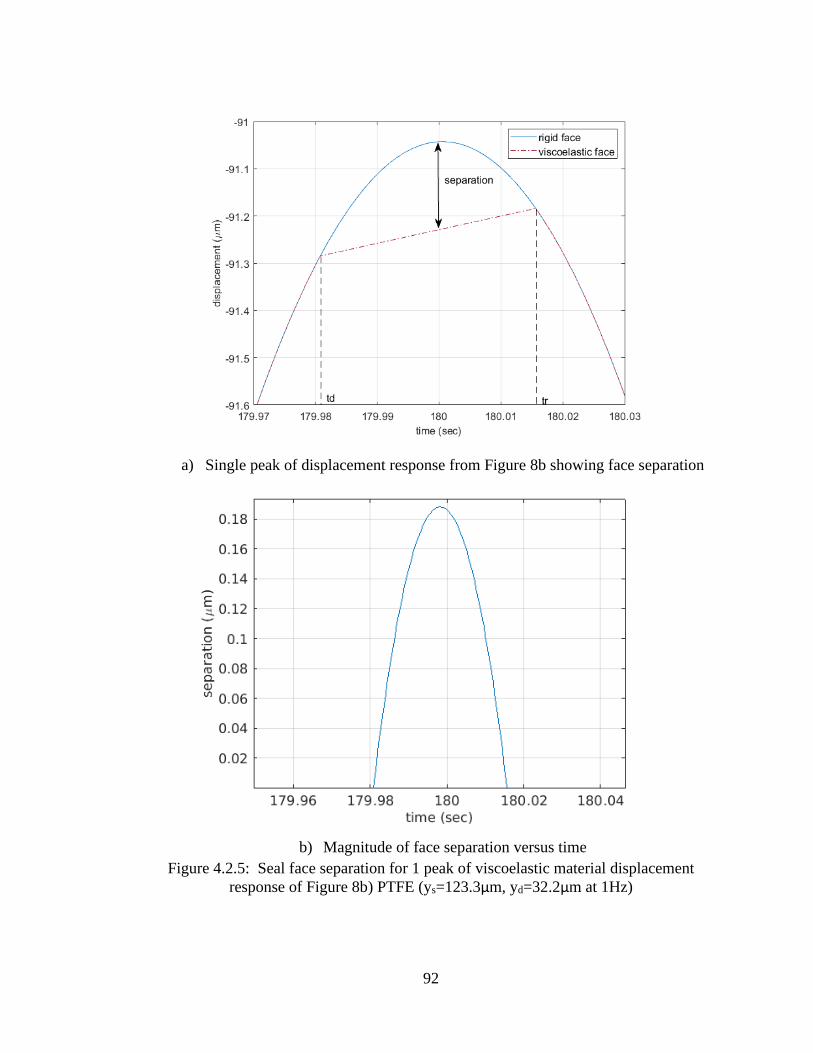
92
a) Single peak of displacement response from Figure 8b showing face separation
b) Magnitude of face separation versus time
Figure 4.2.5: Seal face separation for 1 peak of viscoelastic material displacement
response of Figure 8b) PTFE (ys=123.3μm, yd=32.2μm at 1Hz)
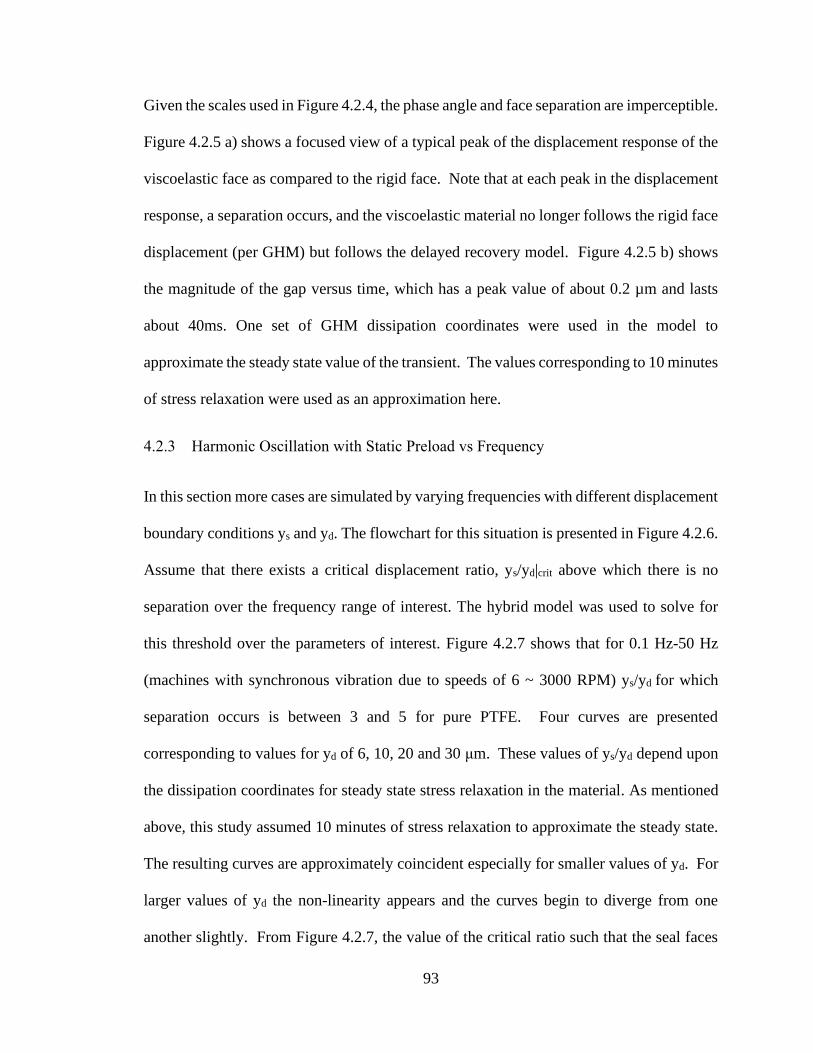
93
Given the scales used in Figure 4.2.4, the phase angle and face separation are imperceptible.
Figure 4.2.5 a) shows a focused view of a typical peak of the displacement response of the
viscoelastic face as compared to the rigid face. Note that at each peak in the displacement
response, a separation occurs, and the viscoelastic material no longer follows the rigid face
displacement (per GHM) but follows the delayed recovery model. Figure 4.2.5 b) shows
the magnitude of the gap versus time, which has a peak value of about 0.2 µm and lasts
about 40ms. One set of GHM dissipation coordinates were used in the model to
approximate the steady state value of the transient. The values corresponding to 10 minutes
of stress relaxation were used as an approximation here.
4.2.3 Harmonic Oscillation with Static Preload vs Frequency
In this section more cases are simulated by varying frequencies with different displacement
boundary conditions ys and yd. The flowchart for this situation is presented in Figure 4.2.6.
Assume that there exists a critical displacement ratio, ys/yd|crit above which there is no
separation over the frequency range of interest. The hybrid model was used to solve for
this threshold over the parameters of interest. Figure 4.2.7 shows that for 0.1 Hz-50 Hz
(machines with synchronous vibration due to speeds of 6 ~ 3000 RPM) ys/yd for which
separation occurs is between 3 and 5 for pure PTFE. Four curves are presented
corresponding to values for yd of 6, 10, 20 and 30 μm. These values of ys/yd depend upon
the dissipation coordinates for steady state stress relaxation in the material. As mentioned
above, this study assumed 10 minutes of stress relaxation to approximate the steady state.
The resulting curves are approximately coincident especially for smaller values of yd. For
larger values of yd the non-linearity appears and the curves begin to diverge from one
another slightly. From Figure 4.2.7, the value of the critical ratio such that the seal faces
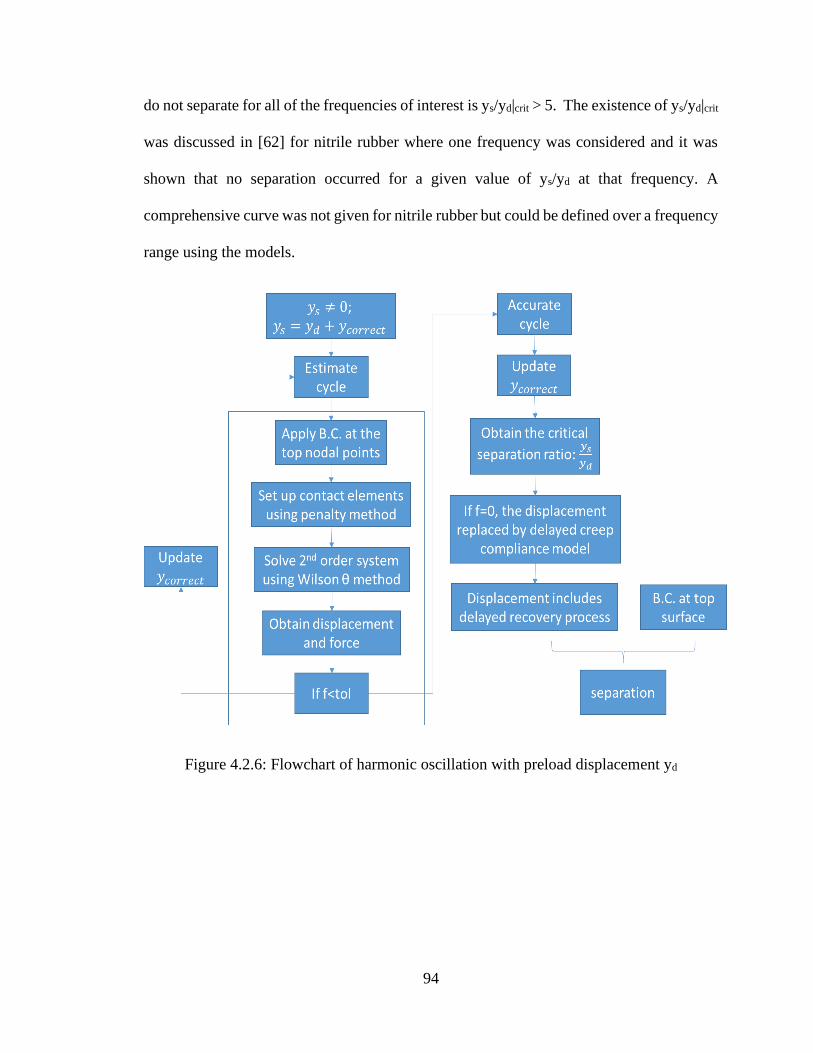
94
do not separate for all of the frequencies of interest is ys/yd|crit > 5. The existence of ys/yd|crit
was discussed in [62] for nitrile rubber where one frequency was considered and it was
shown that no separation occurred for a given value of ys/yd at that frequency. A
comprehensive curve was not given for nitrile rubber but could be defined over a frequency
range using the models.
Figure 4.2.6: Flowchart of harmonic oscillation with preload displacement yd
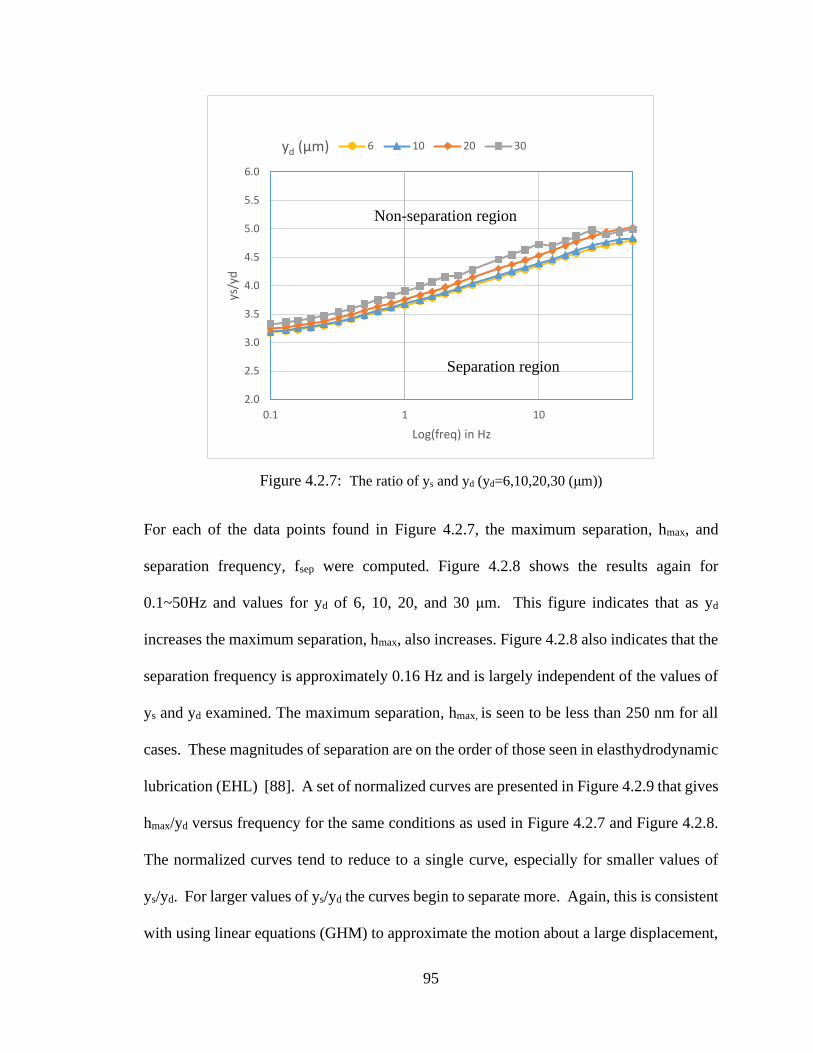
95
Figure 4.2.7: The ratio of ys and yd (yd=6,10,20,30 (μm))
For each of the data points found in Figure 4.2.7, the maximum separation, hmax, and
separation frequency, fsep were computed. Figure 4.2.8 shows the results again for
0.1~50Hz and values for yd of 6, 10, 20, and 30 μm. This figure indicates that as yd
increases the maximum separation, hmax, also increases. Figure 4.2.8 also indicates that the
separation frequency is approximately 0.16 Hz and is largely independent of the values of
ys and yd examined. The maximum separation, hmax, is seen to be less than 250 nm for all
cases. These magnitudes of separation are on the order of those seen in elasthydrodynamic
lubrication (EHL) [88]. A set of normalized curves are presented in Figure 4.2.9 that gives
hmax/yd versus frequency for the same conditions as used in Figure 4.2.7 and Figure 4.2.8.
The normalized curves tend to reduce to a single curve, especially for smaller values of
ys/yd. For larger values of ys/yd the curves begin to separate more. Again, this is consistent
with using linear equations (GHM) to approximate the motion about a large displacement,
2.0
2.5
3.0
3.5
4.0
4.5
5.0
5.5
6.0
0.1 1 10
ys/y
d
Log(freq) in Hz
yd (μm) 6 10 20 30
Non-separation region
Separation region
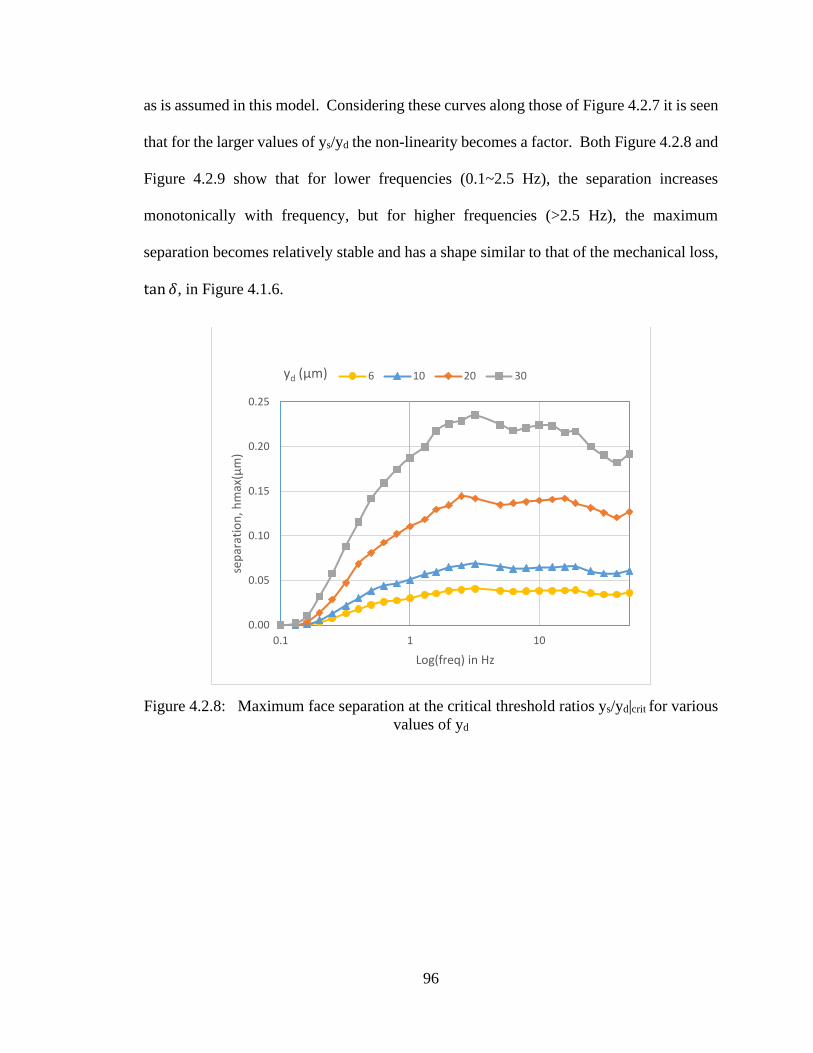
96
as is assumed in this model. Considering these curves along those of Figure 4.2.7 it is seen
that for the larger values of ys/yd the non-linearity becomes a factor. Both Figure 4.2.8 and
Figure 4.2.9 show that for lower frequencies (0.1~2.5 Hz), the separation increases
monotonically with frequency, but for higher frequencies (>2.5 Hz), the maximum
separation becomes relatively stable and has a shape similar to that of the mechanical loss,
tan 𝛿, in Figure 4.1.6.
Figure 4.2.8: Maximum face separation at the critical threshold ratios ys/yd|crit for various
values of yd
0.00
0.05
0.10
0.15
0.20
0.25
0.1 1 10
sep
arat
ion
, hm
ax(μ
m)
Log(freq) in Hz
yd (μm) 6 10 20 30
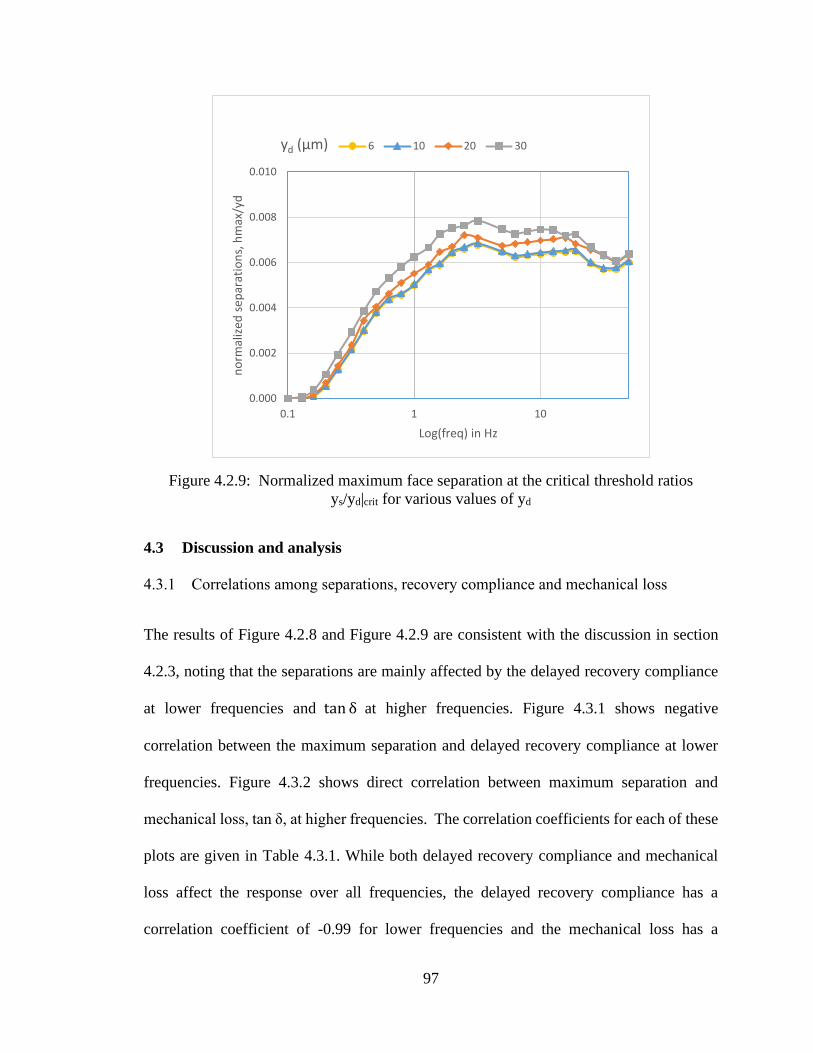
97
Figure 4.2.9: Normalized maximum face separation at the critical threshold ratios
ys/yd|crit for various values of yd
4.3 Discussion and analysis
4.3.1 Correlations among separations, recovery compliance and mechanical loss
The results of Figure 4.2.8 and Figure 4.2.9 are consistent with the discussion in section
4.2.3, noting that the separations are mainly affected by the delayed recovery compliance
at lower frequencies and tan δ at higher frequencies. Figure 4.3.1 shows negative
correlation between the maximum separation and delayed recovery compliance at lower
frequencies. Figure 4.3.2 shows direct correlation between maximum separation and
mechanical loss, tan δ, at higher frequencies. The correlation coefficients for each of these
plots are given in Table 4.3.1. While both delayed recovery compliance and mechanical
loss affect the response over all frequencies, the delayed recovery compliance has a
correlation coefficient of -0.99 for lower frequencies and the mechanical loss has a
0.000
0.002
0.004
0.006
0.008
0.010
0.1 1 10
no
rmal
ized
sep
arat
ion
s, h
max
/yd
Log(freq) in Hz
yd (μm) 6 10 20 30
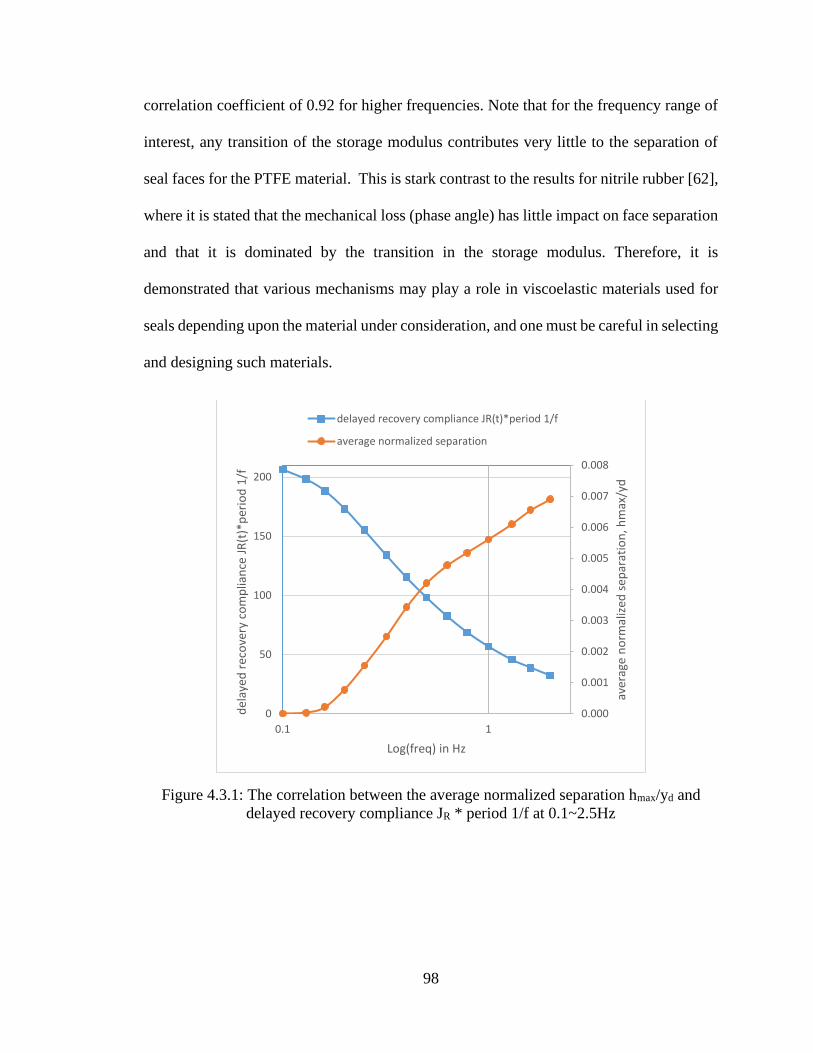
98
correlation coefficient of 0.92 for higher frequencies. Note that for the frequency range of
interest, any transition of the storage modulus contributes very little to the separation of
seal faces for the PTFE material. This is stark contrast to the results for nitrile rubber [62],
where it is stated that the mechanical loss (phase angle) has little impact on face separation
and that it is dominated by the transition in the storage modulus. Therefore, it is
demonstrated that various mechanisms may play a role in viscoelastic materials used for
seals depending upon the material under consideration, and one must be careful in selecting
and designing such materials.
Figure 4.3.1: The correlation between the average normalized separation hmax/yd and
delayed recovery compliance JR * period 1/f at 0.1~2.5Hz
0.000
0.001
0.002
0.003
0.004
0.005
0.006
0.007
0.008
0
50
100
150
200
0.1 1
aver
age
no
rmal
ized
sep
arat
ion
, hm
ax/y
d
del
ayed
rec
ove
ry c
om
plia
nce
JR
(t)*
per
iod
1/f
Log(freq) in Hz
delayed recovery compliance JR(t)*period 1/f
average normalized separation
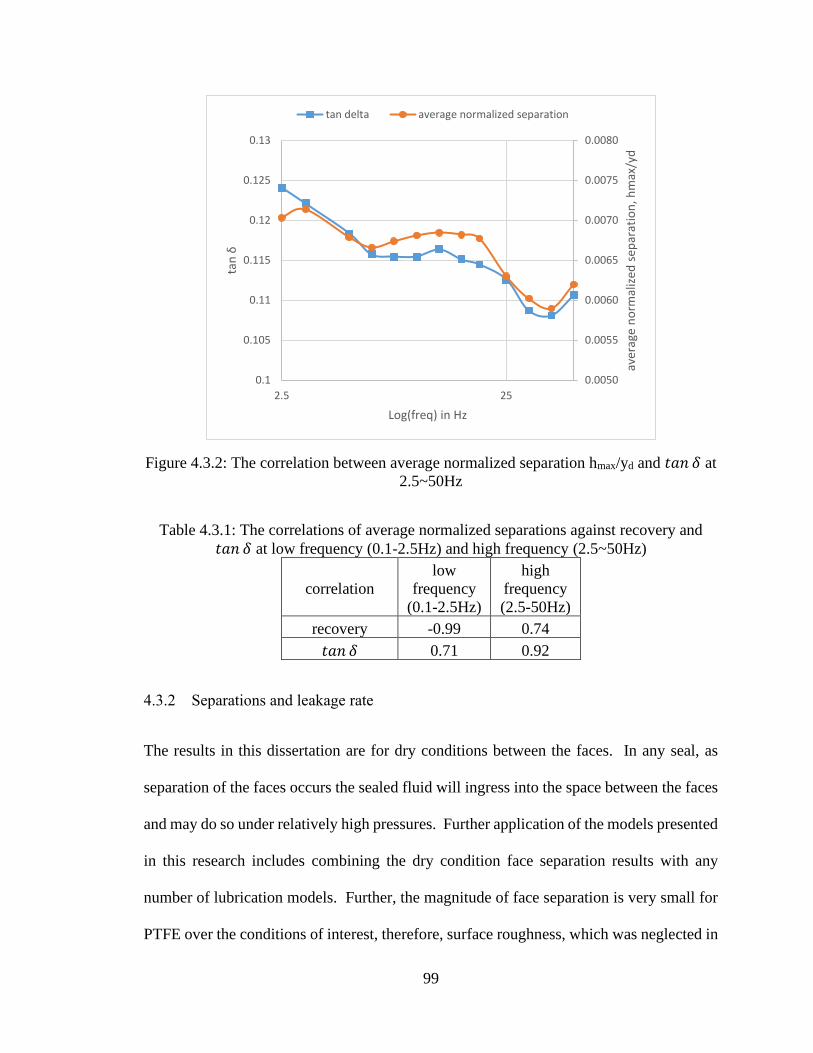
99
Figure 4.3.2: The correlation between average normalized separation hmax/yd and 𝑡𝑎𝑛 𝛿 at
2.5~50Hz
Table 4.3.1: The correlations of average normalized separations against recovery and
𝑡𝑎𝑛 𝛿 at low frequency (0.1-2.5Hz) and high frequency (2.5~50Hz)
correlation
low
frequency
(0.1-2.5Hz)
high
frequency
(2.5-50Hz)
recovery -0.99 0.74
𝑡𝑎𝑛 𝛿 0.71 0.92
4.3.2 Separations and leakage rate
The results in this dissertation are for dry conditions between the faces. In any seal, as
separation of the faces occurs the sealed fluid will ingress into the space between the faces
and may do so under relatively high pressures. Further application of the models presented
in this research includes combining the dry condition face separation results with any
number of lubrication models. Further, the magnitude of face separation is very small for
PTFE over the conditions of interest, therefore, surface roughness, which was neglected in
0.0050
0.0055
0.0060
0.0065
0.0070
0.0075
0.0080
0.1
0.105
0.11
0.115
0.12
0.125
0.13
2.5 25
aver
age
no
rmal
ized
sep
arat
ion
, hm
ax/y
d
tan
δ
Log(freq) in Hz
tan delta average normalized separation
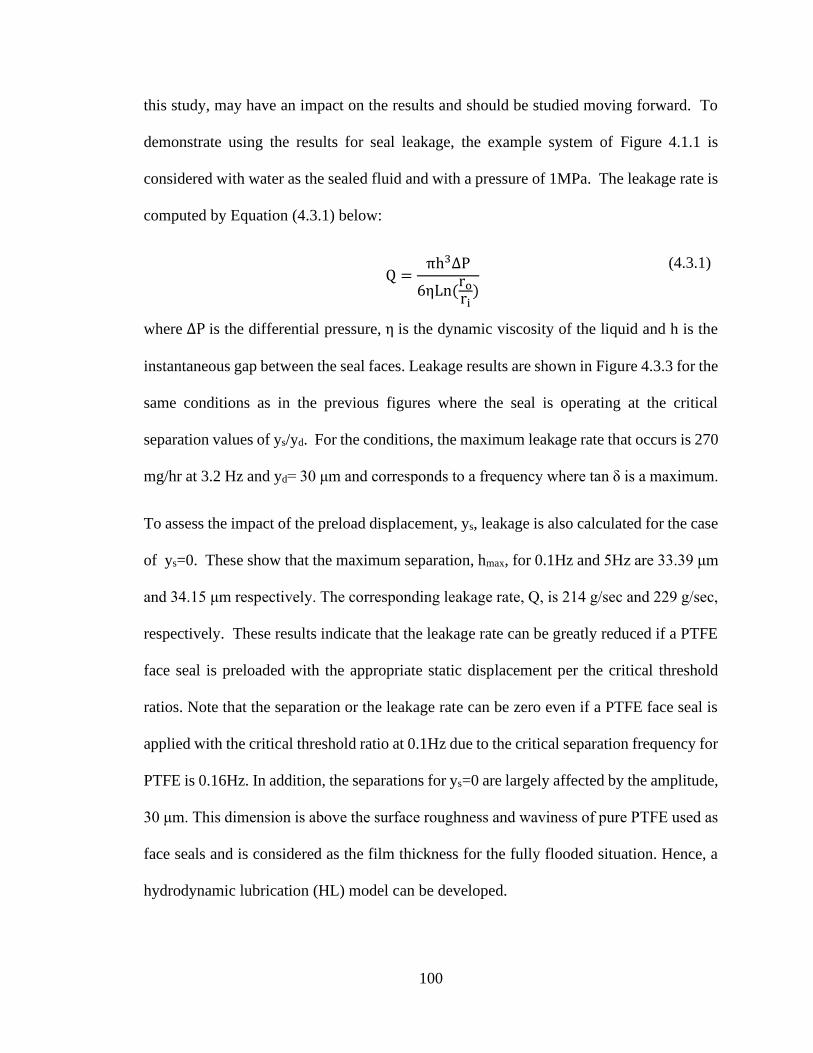
100
this study, may have an impact on the results and should be studied moving forward. To
demonstrate using the results for seal leakage, the example system of Figure 4.1.1 is
considered with water as the sealed fluid and with a pressure of 1MPa. The leakage rate is
computed by Equation (4.3.1) below:
Q =
πh3ΔP
6ηLn(rori)
(4.3.1)
where ΔP is the differential pressure, η is the dynamic viscosity of the liquid and h is the
instantaneous gap between the seal faces. Leakage results are shown in Figure 4.3.3 for the
same conditions as in the previous figures where the seal is operating at the critical
separation values of ys/yd. For the conditions, the maximum leakage rate that occurs is 270
mg/hr at 3.2 Hz and yd= 30 μm and corresponds to a frequency where tan δ is a maximum.
To assess the impact of the preload displacement, ys, leakage is also calculated for the case
of ys=0. These show that the maximum separation, hmax, for 0.1Hz and 5Hz are 33.39 μm
and 34.15 μm respectively. The corresponding leakage rate, Q, is 214 g/sec and 229 g/sec,
respectively. These results indicate that the leakage rate can be greatly reduced if a PTFE
face seal is preloaded with the appropriate static displacement per the critical threshold
ratios. Note that the separation or the leakage rate can be zero even if a PTFE face seal is
applied with the critical threshold ratio at 0.1Hz due to the critical separation frequency for
PTFE is 0.16Hz. In addition, the separations for ys=0 are largely affected by the amplitude,
30 μm. This dimension is above the surface roughness and waviness of pure PTFE used as
face seals and is considered as the film thickness for the fully flooded situation. Hence, a
hydrodynamic lubrication (HL) model can be developed.

101
Figure 4.3.3: Leakage rate of pure PTFE if ΔP=1MPa, viscosity η is water, ro=110(mm)
and ri=100(mm)
4.3.3 Analysis of Seal Face Separation in the Time Domain
As the maximum separations versus frequency with different displacement boundary
conditions have been obtained, now compare the separation of face seals in the time domain
using the hybrid model. Simulating the model at 0.5, 1, 2.5, 10, 50 Hz with yd=30 (μm),
Figure 4.3.4 shows the shape of separation h dependent on time. For the 27 selected
frequencies, the separations are fitted by a 2nd order polynomial h(t,f)=A(f)t2+B(f)t since
these curves are similar to parabola. The normalized coefficients AN(f) and BN(f) are
presented in Figure 4.3.5.
0
50
100
150
200
250
300
0.1 1 10
leak
age,
mg/
hr
Log(freq) in Hz
yd (μm) 6 10 20 30
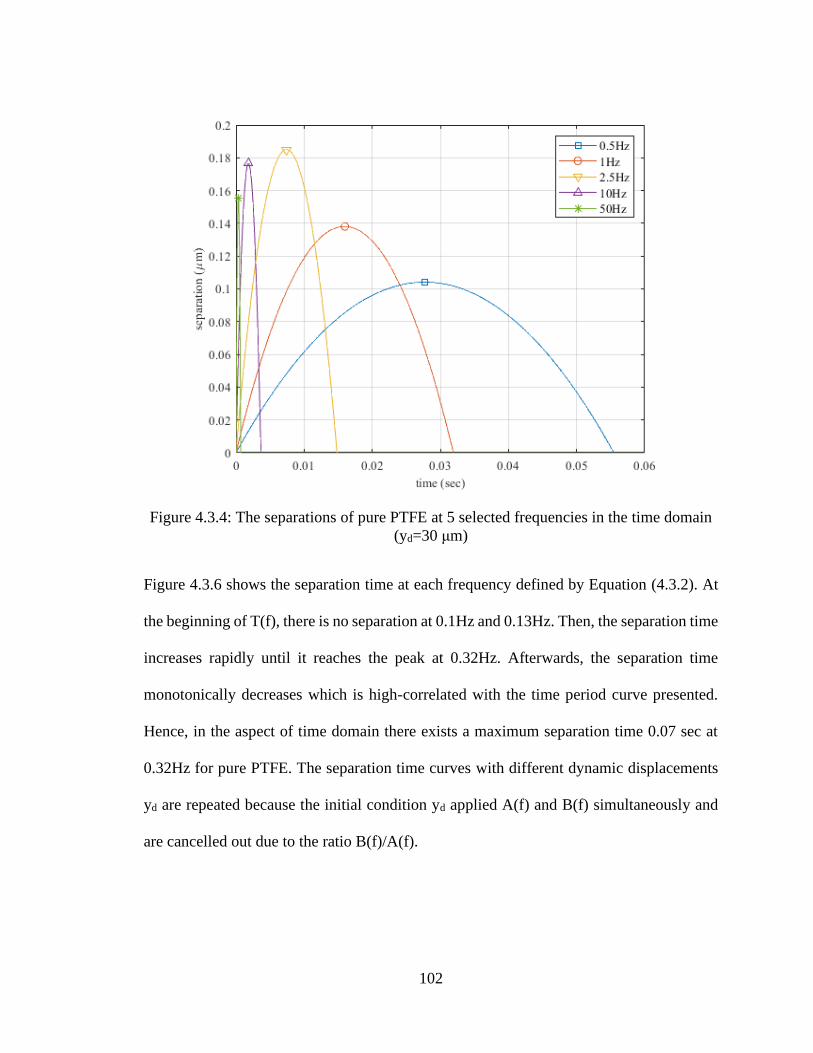
102
Figure 4.3.4: The separations of pure PTFE at 5 selected frequencies in the time domain
(yd=30 μm)
Figure 4.3.6 shows the separation time at each frequency defined by Equation (4.3.2). At
the beginning of T(f), there is no separation at 0.1Hz and 0.13Hz. Then, the separation time
increases rapidly until it reaches the peak at 0.32Hz. Afterwards, the separation time
monotonically decreases which is high-correlated with the time period curve presented.
Hence, in the aspect of time domain there exists a maximum separation time 0.07 sec at
0.32Hz for pure PTFE. The separation time curves with different dynamic displacements
yd are repeated because the initial condition yd applied A(f) and B(f) simultaneously and
are cancelled out due to the ratio B(f)/A(f).
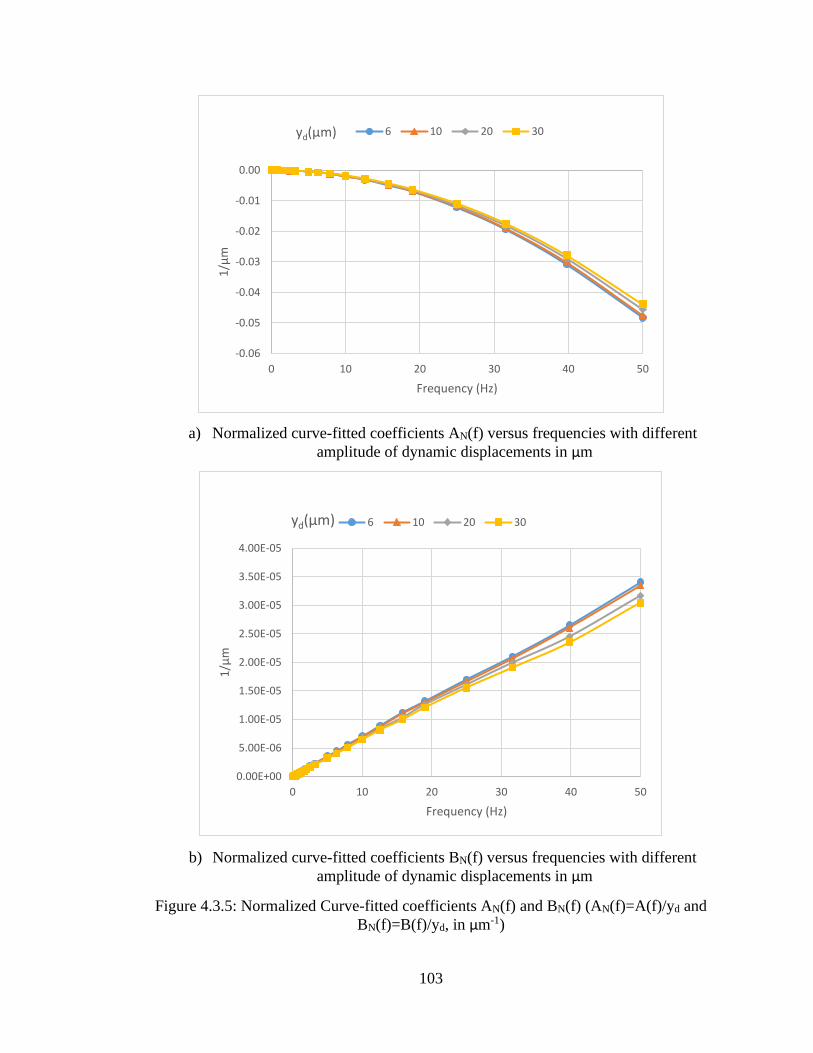
103
a) Normalized curve-fitted coefficients AN(f) versus frequencies with different
amplitude of dynamic displacements in μm
b) Normalized curve-fitted coefficients BN(f) versus frequencies with different
amplitude of dynamic displacements in μm
Figure 4.3.5: Normalized Curve-fitted coefficients AN(f) and BN(f) (AN(f)=A(f)/yd and
BN(f)=B(f)/yd, in μm-1)
-0.06
-0.05
-0.04
-0.03
-0.02
-0.01
0.00
0 10 20 30 40 50
1/μ
m
Frequency (Hz)
yd(μm) 6 10 20 30
0.00E+00
5.00E-06
1.00E-05
1.50E-05
2.00E-05
2.50E-05
3.00E-05
3.50E-05
4.00E-05
0 10 20 30 40 50
1/μ
m
Frequency (Hz)
yd(μm) 6 10 20 30
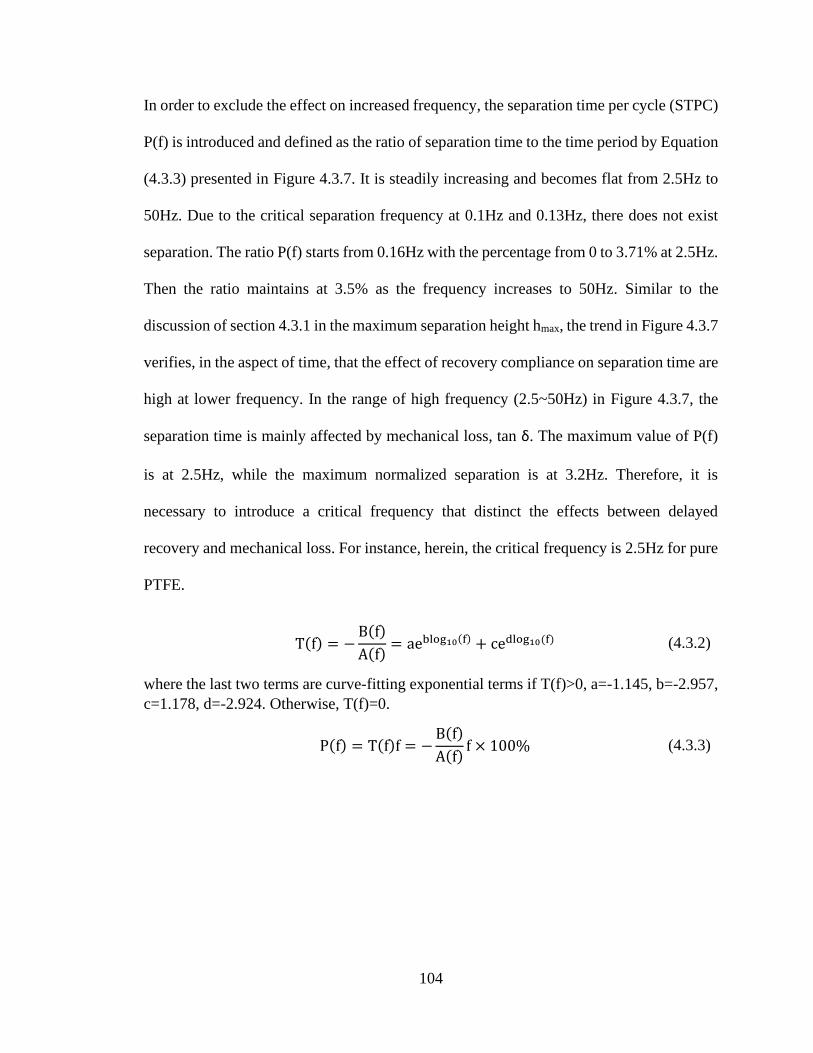
104
In order to exclude the effect on increased frequency, the separation time per cycle (STPC)
P(f) is introduced and defined as the ratio of separation time to the time period by Equation
(4.3.3) presented in Figure 4.3.7. It is steadily increasing and becomes flat from 2.5Hz to
50Hz. Due to the critical separation frequency at 0.1Hz and 0.13Hz, there does not exist
separation. The ratio P(f) starts from 0.16Hz with the percentage from 0 to 3.71% at 2.5Hz.
Then the ratio maintains at 3.5% as the frequency increases to 50Hz. Similar to the
discussion of section 4.3.1 in the maximum separation height hmax, the trend in Figure 4.3.7
verifies, in the aspect of time, that the effect of recovery compliance on separation time are
high at lower frequency. In the range of high frequency (2.5~50Hz) in Figure 4.3.7, the
separation time is mainly affected by mechanical loss, tan δ. The maximum value of P(f)
is at 2.5Hz, while the maximum normalized separation is at 3.2Hz. Therefore, it is
necessary to introduce a critical frequency that distinct the effects between delayed
recovery and mechanical loss. For instance, herein, the critical frequency is 2.5Hz for pure
PTFE.
T(f) = −B(f)
A(f)= aeblog10(f) + cedlog10(f) (4.3.2)
where the last two terms are curve-fitting exponential terms if T(f)>0, a=-1.145, b=-2.957,
c=1.178, d=-2.924. Otherwise, T(f)=0.
P(f) = T(f)f = −B(f)
A(f)f × 100% (4.3.3)
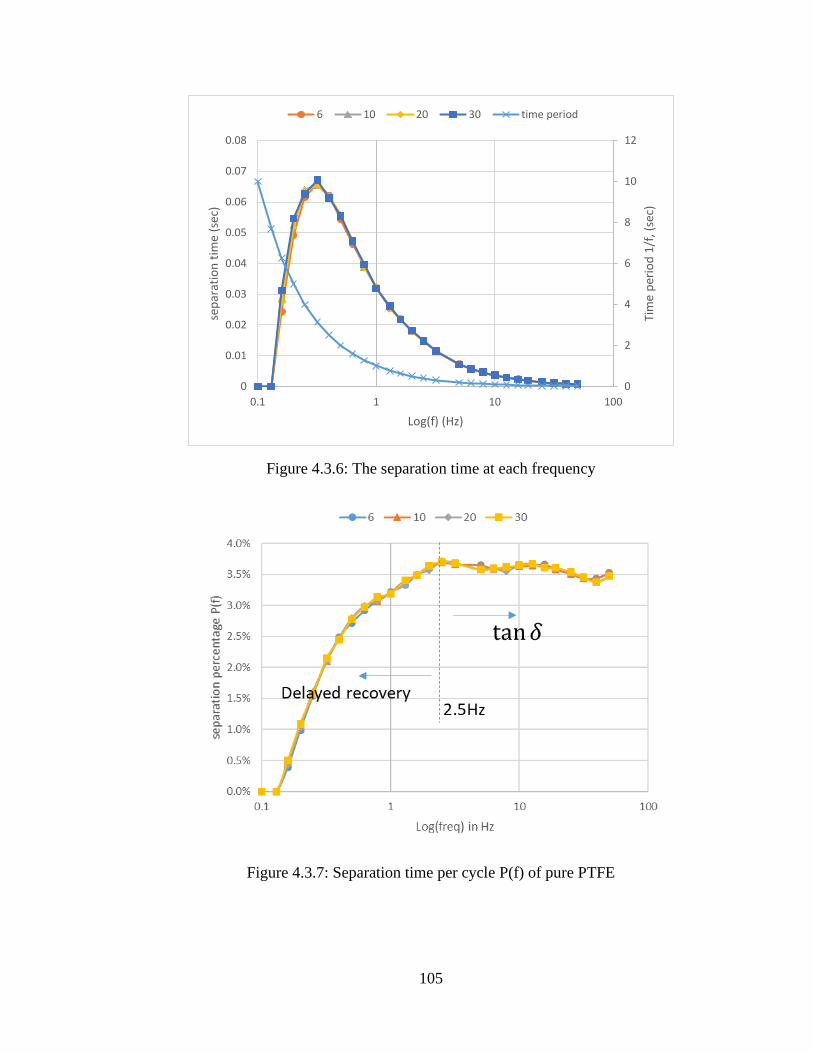
105
Figure 4.3.6: The separation time at each frequency
Figure 4.3.7: Separation time per cycle P(f) of pure PTFE
0
2
4
6
8
10
12
0
0.01
0.02
0.03
0.04
0.05
0.06
0.07
0.08
0.1 1 10 100
Tim
e p
erio
d 1
/f, (
sec)
sep
arat
ion
tim
e (s
ec)
Log(f) (Hz)
6 10 20 30 time period
106
CHAPTER 5. SIMULATION RESULTS FOR OTHER PTFE-BASED MATERIALS
5.1 Introduction
To study the other three PTFE-based materials (PTFEGM, T05 and T99), this chapter
repeats the simulation study in Chapter 4. First, the validation of the storage modulus and
mechanical loss is presented.. The simulation results based on the hybrid model include: 1)
the critical threshold ratio 2) the maximum separations and normalized maximum
separation if the dynamic displacements yd are 6, 10, 20, 30 μm 3) the leakage rate and 4)
the separation function in the time domain. Henceforth, the results are obtained to compare
the viscoelastic characteristics of pure PTFE, PTFEGM, T05 and T99. The simulation
results indicate the hybrid model can be extended to other PTFE-based materials. This
chapter is important because it provides an overview of viscoelasticity of PTFE-based
materials so that seal designers can choose a correct seal material in a quantitative way,
particularly in the frequency domain. The validation of storage modulus and mechanical
loss for each material are not elaborated in this chapter, but are presented in Appendix
instead.
5.2 Discussion and Analysis
The critical displacement ratio ys/yd|crit for the four PTFE-based materials (pure PTFE,
PTFEGM, T05 and T99) are presented in Figure 5.2.1. Again, this borderline for each
material indicates the regions whether separation occurs or not as a function of pre-strain
(or pre-load displacements) on the material. For all these materials, as the frequency
increases the critical threshold ratio also increases. PTFEGM has the highest ratio
(approximately 5~7) while T05 has the lowest ratio from 3 to 4, where the variation over
the frequency range of interest is approximately only the half of PTFEGM. The ratio values
107
are ranked from high to low as PTFEGM, pure PTFE, T99 and T05. The variation of the
ratio value is highly correlated to the storage modulus. To recall
Figure 3.2.4, the storage modulus of PTFEGM is from 600~1000 MPa on the frequency of
interest and T05 is from 400~600MPa, which the variation is only the half of PTFEGM,
similar to the variation of the critical displacement ratio. To explain it in a way of physical
meaning, Figure 5.2.1 indicates the pre-strain requirements ys of a face seal to avoid gaps
under the same dynamic displacement yd. The performance of Turcon materials (T05 and
T99) are very close and need the least pre-strain to avoid a separation. The pre-strain ratio
between PTFEGM and Turcon is 1.67~1.75, for pure PTFE and Turcon 1.25~1.33. Hence,
T99 or T05 is preferred for its low critical threshold ratio over the frequency range of
interest.
In regards to the normalized maximum face separation, the trend of PTFEGM is quite
different from the other three shown in Figure 5.2.2. The normalized curve increases at the
low frequency (from 0.1~0.79Hz). Then it dips within 1~2 Hz and the peak appears at
3.2Hz. After that, the separation curve decreases to a value as low as the values at 0.2Hz
and 0.5Hz. Unlike the curve of PTFEGM with no critical separation frequency, the other
three materials are similar: the value steadily increases from the low frequency and reaches
peak values at certain frequencies, pure PTFE at 3.2Hz, T05 and T99 at 31.6Hz. The trends
of T05 and T99 are similar except the normalized separation of T99 are slightly greater
than T05 from 0.1Hz to 10Hz. Both curves drop down to the level of 10Hz at 50Hz. To
compare the seal leakage, the leakage rates for each material are demonstrated in Figure
5.2.3 considering with water as seal fluid and with a pressure of 1MPa. The seal is operating
at the critical threshold ratio ys/yd when yd is 30 μm. Similar to the normalized separation
108
curves, the trend of leakage rate is mainly affected by the cubic term of separation heights
shown in Equation (4.3.1). For PTFEGM, there are two peaks in leakage rate: 480 mg/hr
and 510 mg/hr at 0.79Hz and 3.2Hz respectively, where the maximum leakage rate occurs
at 3.2Hz. For T05 and T99, the maximum leakage rates are 200 mg/hr at 31.6Hz.
Considering these four materials, T05 is the first choice for its lowest seal leak. Avoid the
frequency around 31.6Hz because a leak peak occurs. T99 performs in a similar way as
T05. For the low frequency range from 0.1Hz to 0.32Hz the leakage rate for pure PTFE,
T05 and T99 are low compared to PTFEGM. If PTFEGM is used for face seals, the
frequency close to 0.79Hz and 3.2 Hz should be avoided due to the leakage spikes. The
sealing performance over the low frequency range (0.1Hz~0.32Hz) and the high frequency
range (7.9Hz~50Hz). The leakage rate drops rapidly from the peak, which is different from
the other three materials and the values of leakage rate for these four materials are
approximately 100~200 mg/hr when the frequency is beyond 25Hz. Hence, a face seal
working under a high frequency can also choose PTFEGM as presented in Figure 5.2.3.
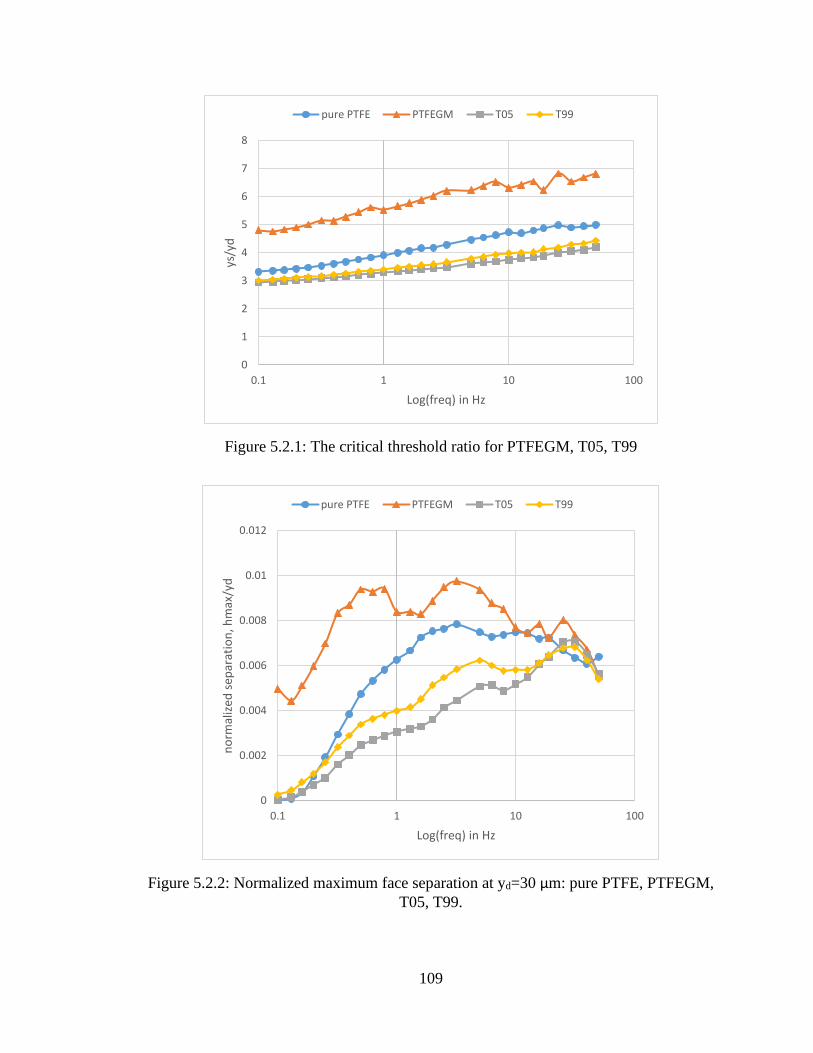
109
Figure 5.2.1: The critical threshold ratio for PTFEGM, T05, T99
Figure 5.2.2: Normalized maximum face separation at yd=30 μm: pure PTFE, PTFEGM,
T05, T99.
0
1
2
3
4
5
6
7
8
0.1 1 10 100
ys/y
d
Log(freq) in Hz
pure PTFE PTFEGM T05 T99
0
0.002
0.004
0.006
0.008
0.01
0.012
0.1 1 10 100
no
rmal
ized
sep
arat
ion
, hm
ax/y
d
Log(freq) in Hz
pure PTFE PTFEGM T05 T99
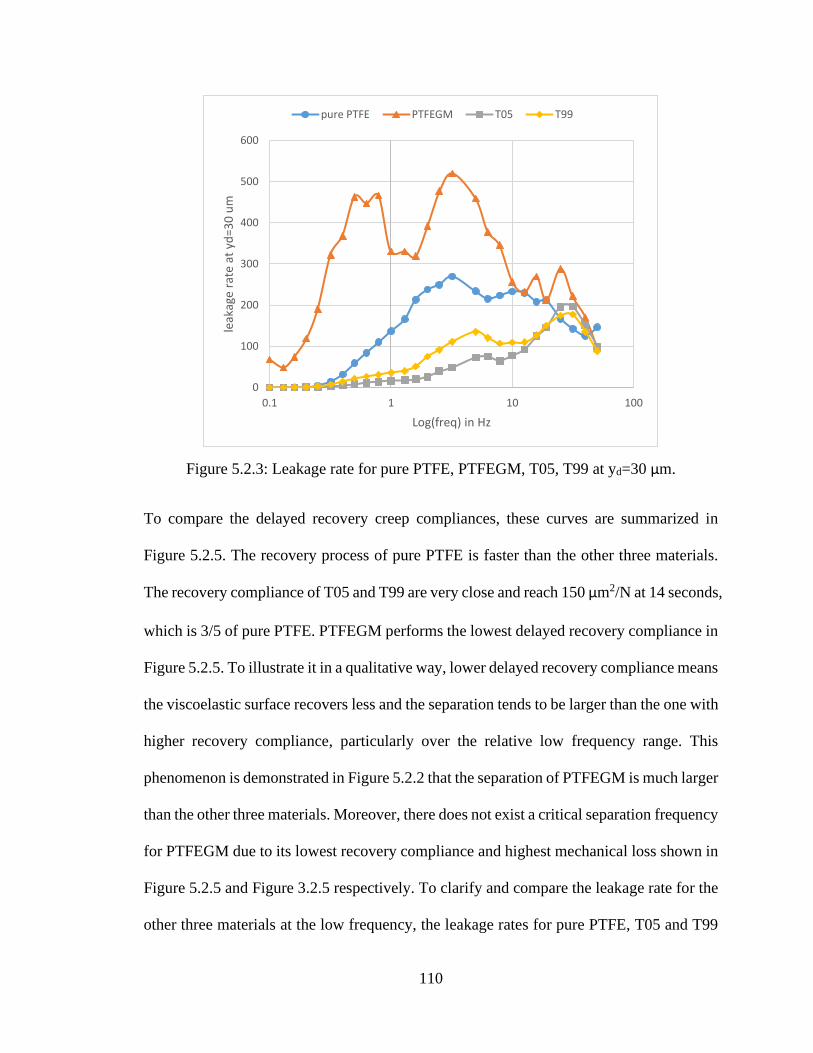
110
Figure 5.2.3: Leakage rate for pure PTFE, PTFEGM, T05, T99 at yd=30 μm.
To compare the delayed recovery creep compliances, these curves are summarized in
Figure 5.2.5. The recovery process of pure PTFE is faster than the other three materials.
The recovery compliance of T05 and T99 are very close and reach 150 μm2/N at 14 seconds,
which is 3/5 of pure PTFE. PTFEGM performs the lowest delayed recovery compliance in
Figure 5.2.5. To illustrate it in a qualitative way, lower delayed recovery compliance means
the viscoelastic surface recovers less and the separation tends to be larger than the one with
higher recovery compliance, particularly over the relative low frequency range. This
phenomenon is demonstrated in Figure 5.2.2 that the separation of PTFEGM is much larger
than the other three materials. Moreover, there does not exist a critical separation frequency
for PTFEGM due to its lowest recovery compliance and highest mechanical loss shown in
Figure 5.2.5 and Figure 3.2.5 respectively. To clarify and compare the leakage rate for the
other three materials at the low frequency, the leakage rates for pure PTFE, T05 and T99
0
100
200
300
400
500
600
0.1 1 10 100
leak
age
rate
at
yd=3
0 u
m
Log(freq) in Hz
pure PTFE PTFEGM T05 T99
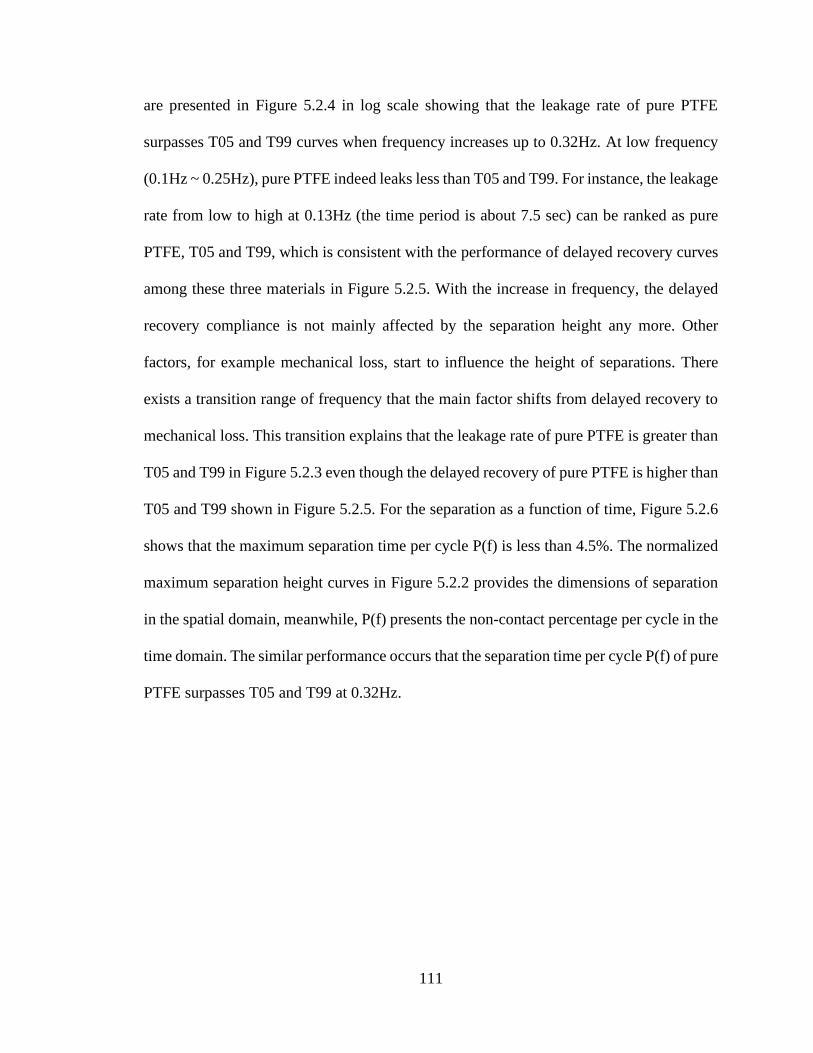
111
are presented in Figure 5.2.4 in log scale showing that the leakage rate of pure PTFE
surpasses T05 and T99 curves when frequency increases up to 0.32Hz. At low frequency
(0.1Hz ~ 0.25Hz), pure PTFE indeed leaks less than T05 and T99. For instance, the leakage
rate from low to high at 0.13Hz (the time period is about 7.5 sec) can be ranked as pure
PTFE, T05 and T99, which is consistent with the performance of delayed recovery curves
among these three materials in Figure 5.2.5. With the increase in frequency, the delayed
recovery compliance is not mainly affected by the separation height any more. Other
factors, for example mechanical loss, start to influence the height of separations. There
exists a transition range of frequency that the main factor shifts from delayed recovery to
mechanical loss. This transition explains that the leakage rate of pure PTFE is greater than
T05 and T99 in Figure 5.2.3 even though the delayed recovery of pure PTFE is higher than
T05 and T99 shown in Figure 5.2.5. For the separation as a function of time, Figure 5.2.6
shows that the maximum separation time per cycle P(f) is less than 4.5%. The normalized
maximum separation height curves in Figure 5.2.2 provides the dimensions of separation
in the spatial domain, meanwhile, P(f) presents the non-contact percentage per cycle in the
time domain. The similar performance occurs that the separation time per cycle P(f) of pure
PTFE surpasses T05 and T99 at 0.32Hz.
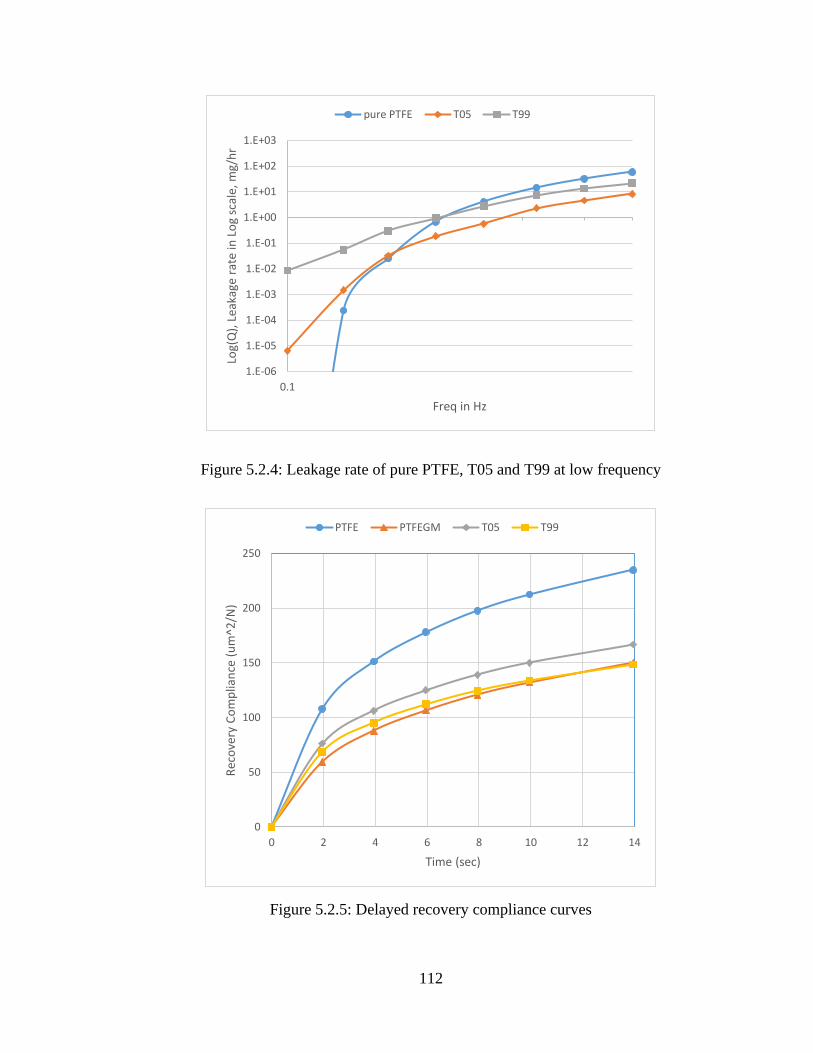
112
Figure 5.2.4: Leakage rate of pure PTFE, T05 and T99 at low frequency
Figure 5.2.5: Delayed recovery compliance curves
1.E-06
1.E-05
1.E-04
1.E-03
1.E-02
1.E-01
1.E+00
1.E+01
1.E+02
1.E+03
0.1
Log(
Q),
Lea
kage
rat
e in
Lo
g sc
ale,
mg/
hr
Freq in Hz
pure PTFE T05 T99
0
50
100
150
200
250
0 2 4 6 8 10 12 14
Rec
ove
ry C
om
plia
nce
(u
m^2
/N)
Time (sec)
PTFE PTFEGM T05 T99
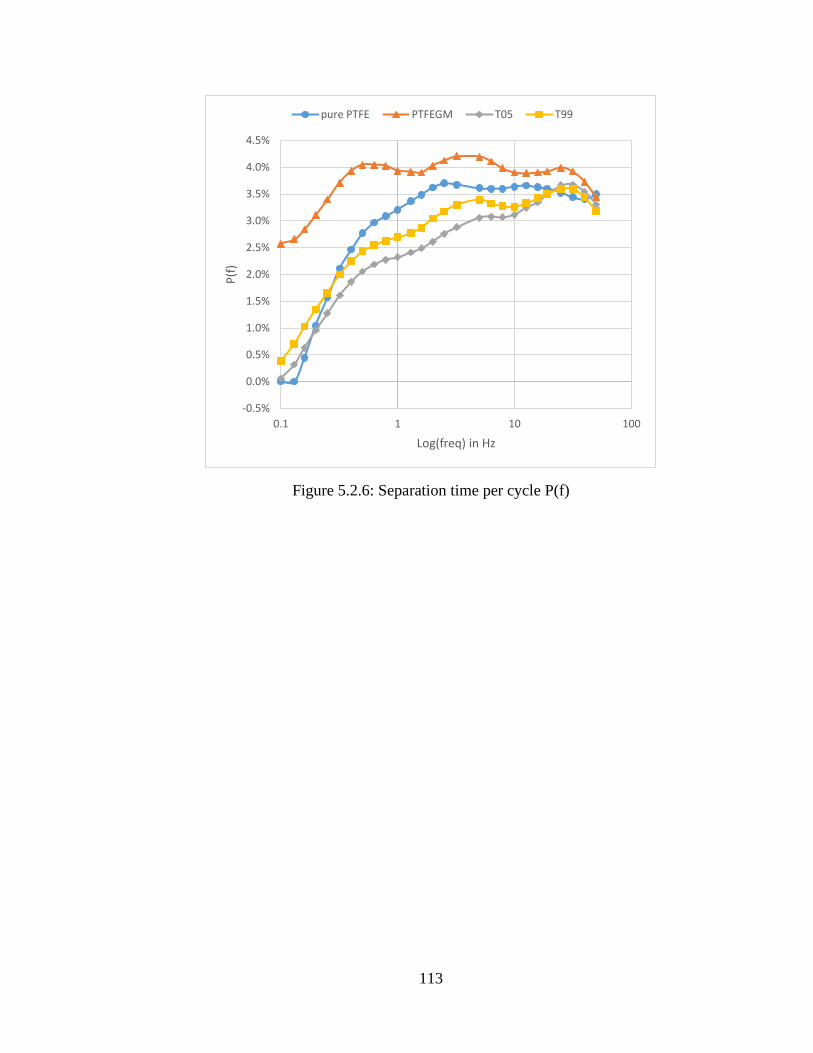
113
Figure 5.2.6: Separation time per cycle P(f)
-0.5%
0.0%
0.5%
1.0%
1.5%
2.0%
2.5%
3.0%
3.5%
4.0%
4.5%
0.1 1 10 100
P(f
)
Log(freq) in Hz
pure PTFE PTFEGM T05 T99
114
CHAPTER 6. SUMMARY AND FUTURE WORK
6.1 Summary and Conclusions
Face seals and PTFE-based materials are used extensively in many industries to retain
fluids and protect important components in machinery. Given the widespread use of face
seals and the outstanding self-lubrication performance of PTFE-based materials, it is to
understand the sealing mechanism of PTFE-based face seals due to viscoelasticity. This
work measures viscoelastic characteristics of four materials, pure PTFE, PTFEGM, T05
and T99 using DMA. A hybrid model is developed to simulate the sealing performance
under dynamic oscillation over the frequency range of interest.
Chapter 1 introduced readers to the basics of face seals and PTFE-based materials.
Applications often operated by face seals and PTFE-based materials are provided as
practical examples for readers. The fundamentals of viscoelasticity are introduced as well
to a foundation for the study in depth later.
Chapter 2 presented a literature review of previous work on both the measurement of
viscoelasticity of PTFE-based materials and its numerical modeling. The fundamentals and
the history of this study are reviewed. Opportunities to expand the state of knowledge and
the research objectives are identified.
Chapter 3 presents the evaluation of the viscoelastic characteristics for pure PTFE,
PTFEGM, T05 and T99. Using a Dynamic Mechanical Analyzer (DMA), the storage
modulus, loss modulus and tan δ, are measured and discussed in the frequency domain.
The relaxation modulus and creep compliances are measured in the time domain. The
115
experimental data is then modeled using the Prony series and compared to the experimental
data. The main conclusions of this chapter include:
1. The viscoelastic properties of pure PTFE, PTFEGM, T05 and T99 are measured
by DMA, including relaxation moduli and creep compliances in the time
domain, and storage modulus and tan δ as a function of frequency. In the
frequency domain, PTFEGM has higher storage modulus than pure PTFE, T05
and T99, such that it has more elastic energy stored than the other three
materials. The storage moduli of pure PTFE, T05 and T99 are very close. In
addition, the figures indicate that there is a positive correlation between storage
modulus and frequency. Results for tan δ, PTFEGM decreases but T05 and T99
increase and behave similarly. Pure PTFE varies only a small amount from 1Hz
to 10Hz. For the dynamic response, the characteristics of T05 and T99 behaves
similarly. For relaxation modulus, even though there is no material that behaves
as a perfectly linear viscoelastic material, T05 tends to be the most linear. T05,
T99 and PTFEGM are indeed more stable (lower deviation) than pure PTFE
considering the error bars, because pure PTFE has the largest error bars
compared with other three. Pure PTFE relaxes more (lower relaxation modulus
after strain applied) than PTFEGM, T05 and T99, which is due to the additive
and fillers within PTFE fibers. Similarly, pure PTFE has the largest error bars,
and the creep compliances increase if the input applied stress increases.
However, the creep compliance decreases while the input increases. In general,
the creep compliances of pure PTFE and PTFEGM are higher than T05 and
T99.
116
2. Prony series models are applied and Prony parameters are obtained for these
materials, and these models accurately predict the viscoelastic behavior of the
materials since they were fit directly from the experimental curves for storage
modulus, tan δ, relaxation modulus and creep compliance. Mathematically, for
linear viscoelastic materials the relaxation modulus and creep compliance
Prony series (time domain) can be found from the storage modulus and tan δ
Prony series (frequency domain) and vice versa, since they are a Laplace
transform pairs.[78] Pure PTFE and PTFEGM tested in this dissertation were
found to be quite nonlinear so this “interconversion” would not be very accurate.
T05 and T99 were found to be quite linear so we would expect the Laplace
transform interconversion to be more accurate. Nonlinear modeling of
viscoelastic materials is much more complex and could be the basis of future
work.
3. The creep tests of pure PTFE have large error bars. EDS analysis is considered
and the weight percentage of fluorine is obtained to analyze this result. The
variation of the mean and deviation in fluorine from one sample to the others
shows one factor causing large error bars may be due to the nonhomogeneous
of polymers weight percentage. Again, the PTFE-based materials with fillers
and additives like PTFEGM, T05 and T99 have smaller error bars, particularly
for T05.
4. Applying the material results to bearings and seals, one can predict leakage by
tan δ, since the phase lag angle causes surface to separate. Figure 3.2.5 shows,
for instance, at 0.1 Hz tan δ ranked as PTFEGM, pure PTFE, T05, T99. It
117
predicts T99 to have the lowest leakage and PTFEGM to have the highest
leakage, which is consistent with the experimental results in [44]. According to
[55], the relaxation moduli and creep compliances impact seals’ friction
coefficient, which is sensitive to the effect of viscoelasticity. For instance, [55]
found that relaxation may increase the friction coefficient as compared to
materials without relaxation. Pure PTFE and PTFEGM have higher relaxation
modulus while T05 and T99 are lower. The seals made of Pure PTFE and
PTFEGM are easier to be worn out so they may have higher leakage rate than
the ones made of T05 and T99 after working for the same amount of time.
Chapter 4 presented a hybrid model for simulating viscoelastic face seals. More specifically,
it is used to predict separation in pure PTFE mechanical face seals which are viscoelastic.
The hybrid modeling method combines the GHM finite element approach, the delayed
recovery compliance and a penalty method approach to predict the magnitude versus time
of seal face separation under dry conditions. The benefits of the modeling method are: 1)
the resulting finite element model is in canonical form so standard solution modules can
be used; 2) the equations can be solved directly in the time domain so that the transient
response can be determined (important for viscoelastic materials that “relax” over time); 3)
one can extend the model to more complex geometries that may use viscoelastic materials;
and 4) the modeling method is not limited to PTFE materials but can be used for other
common viscoelastic seal materials. For pure PTFE over the running speeds (frequencies)
of interest (up to 3000 RPM synchronous vibration), the following conclusions are offered:
5. Seal face separation is dominated by delayed recovery compliance, JR(t), at
lower frequencies and by mechanical loss, tan δ, at higher frequencies. The
118
borderline between high and low frequencies is about 2.5 Hz and is largely
independent of the ratio of preload displacement to dynamic displacement
amplitude, ys/yd. The storage modulus, E’(ω), certainly impacts the separation
magnitude (moves the curves versus frequency up and down) but it is largely
constant over this frequency range for pure PTFE so it does not impact the
trends versus frequency (no rubbery-to-glassy transition effect).
6. There exists a critical threshold of preload to dynamic displacement, ys/yd|crit,
above which there is no separation of the seal faces over the frequency range of
interest. For rotational speeds up to 3000 RPM, this value is about 5.0.
7. There exists a critical separation frequency below which there is no separation
between the seal faces. For pure PTFE this value is about 0.13 Hz (~10 RPM,
synchronous) and is largely independent of the ratio ys/yd.
8. The model presented here predicts seal face separation under dry conditions at
the interface. Given the canonical form of the model, it can be more easily be
combined with lubrication models to predict leakage along with other seal
performance parameters. The model does not include surface roughness. The
small face separations predicted for pure PTFE over the range of parameters
(<250 nm) are on the order found in EHL. Therefore, a surface roughness
model could be added in future work. Under the conditions with low ratio
values of ys/yd, a hydrodynamic lubrication (HL) model can be used since the
maximum separations significantly larger.
9. A simple leakage model for the end face mechanical seal was presented to
demonstrate sealing results for the sample problem presented. The leakage
119
rates were as large at 270 mg/hr for a yd of 30 μm at the critical values of ys/yd,
this amounts to about a drop per minute in a standard seal application based on
the authors experience with face seals testing rigs. The leakage rate greatly
increases up to 230 g/sec if ys=0. Hence, a relative high critical threshold ratio
is recommended for a pure PTFE face seal but it is unnecessary to beyond the
ratio (>=5) too much.
10. The hybrid GHM, delayed recovery compliance and penalty method model
presented in this work is an effective means of examining viscoelastic materials
(not just PTFE) for seal applications.
11. The separation time T(f) and the separation time per cycle P(f) are introduced
as the parameters in the time domain for pure PTFE. They are auto-normalized
and P(f) represent the non-contact percentage per time period. Again, delayed
recovery compliance and mechanical loss are the two main factors that
determines the separations of PTFE-based face seals.
Chapter 5 repeats the simulation in chapter 4 for the other three materials: PTFEGM, T05
and T99. The results shows that this developed hybrid model can be extended to more
materials if the materials perform similar viscoelastic properties. The conclusions in this
chapter include:
12. Compare the critical threshold ratio ys/yd among the four PTFE-based materials,
PTFEGM performs the highest critical threshold ratio (the ratio is 7 at
3000RPM), which is approximately twice the value of Turcon materials. The
ratio of T05 shows the lowest ratio (about 4 at 3000RPM). The ratio ys/yd
represents the pre-strain requirements of preventing a separation under
120
oscillation. Turcon materials, T05 and T99, are preferred for seal designs
because smaller pre-strains are required compared to pure PTFE and PTFEGM.
13. In the frequency range of interest, there does not exist a critical separation
frequency for PTFEGM, T05 and T99. PTFEGM performs the highest
separation heights due to the largest mechanical loss and lowest delayed
recovery among these four PTFE-based materials. For the other three materials,
there is a transition stage that both delayed recovery compliances and
mechanical loss affect the separation in the time and spatial domain. The delay
recovery only dominates the value of separation heights or the separation time
per cycle P(f) at a very low frequency (0.1Hz~0.32Hz).
6.2 Recommendations for Future Work
• Consider the frictional force in the contact model. Frictional force terms in the
reciprocal direction can be included. Hence, the improved model can simulate stick-
slip phenomenon, which is possible to predict coefficients of friction or find a way
to avoid stick-slip.
• Extend the hybrid model to larger amplitude displacements. In that model, plasticity
must be considered in greater depth.
• Due to frictions, thermal effects of viscoelastic materials should be studied. In
particular, the increase in temperature swells the materials and, more importantly,
the viscoelastic properties, the storage moduli and creep compliances, are also
temperature-dependent. The measurements in viscoelastic materials under multi-
thermal situation need to conduct using thermomechanical analyzers.
121
• The model can be extended into three-dimensional situations so that the simulation
is closer to the real application. Under this situation, the surface roughness could
be included to solve pressure distributions in 3D through lubrication models either
in elastohydrodynamic lubrication (EHL) or hydrodynamics lubrication (HL).
• An experimental test rig should be set up to verify the separations due to
viscoelastic damping. There are two key factors to observe and measure, the
maximum separation height and the separation time per cycle. The measured data
should be compared to the results of this work.
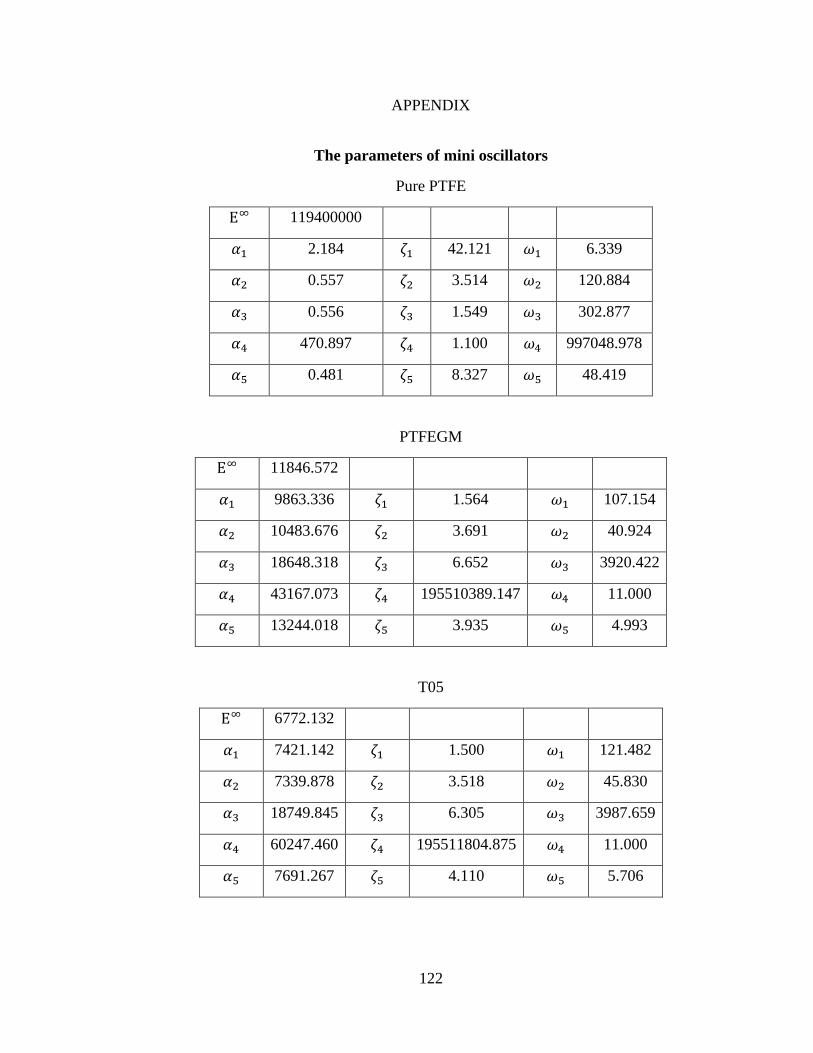
122
APPENDIX
The parameters of mini oscillators
Pure PTFE
E∞ 119400000
𝛼1 2.184 𝜁1 42.121 𝜔1 6.339
𝛼2 0.557 𝜁2 3.514 𝜔2 120.884
𝛼3 0.556 𝜁3 1.549 𝜔3 302.877
𝛼4 470.897 𝜁4 1.100 𝜔4 997048.978
𝛼5 0.481 𝜁5 8.327 𝜔5 48.419
PTFEGM
E∞ 11846.572
𝛼1 9863.336 𝜁1 1.564 𝜔1 107.154
𝛼2 10483.676 𝜁2 3.691 𝜔2 40.924
𝛼3 18648.318 𝜁3 6.652 𝜔3 3920.422
𝛼4 43167.073 𝜁4 195510389.147 𝜔4 11.000
𝛼5 13244.018 𝜁5 3.935 𝜔5 4.993
T05
E∞ 6772.132
𝛼1 7421.142 𝜁1 1.500 𝜔1 121.482
𝛼2 7339.878 𝜁2 3.518 𝜔2 45.830
𝛼3 18749.845 𝜁3 6.305 𝜔3 3987.659
𝛼4 60247.460 𝜁4 195511804.875 𝜔4 11.000
𝛼5 7691.267 𝜁5 4.110 𝜔5 5.706
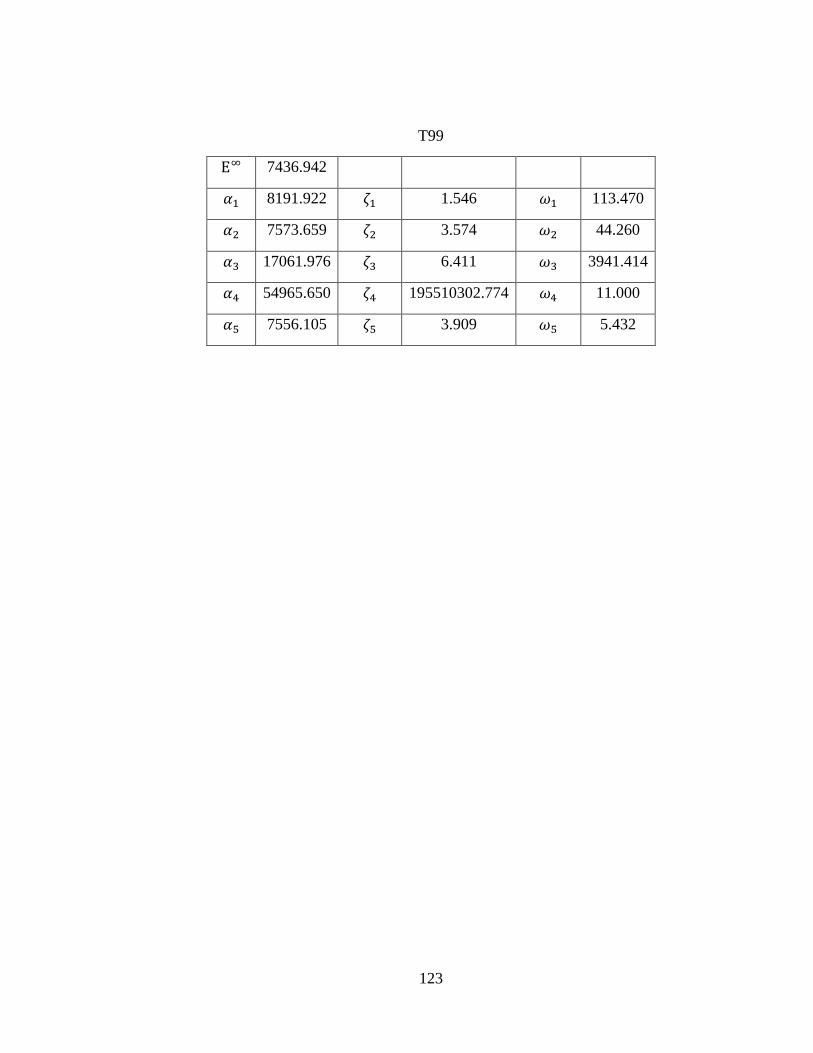
123
T99
E∞ 7436.942
𝛼1 8191.922 𝜁1 1.546 𝜔1 113.470
𝛼2 7573.659 𝜁2 3.574 𝜔2 44.260
𝛼3 17061.976 𝜁3 6.411 𝜔3 3941.414
𝛼4 54965.650 𝜁4 195510302.774 𝜔4 11.000
𝛼5 7556.105 𝜁5 3.909 𝜔5 5.432
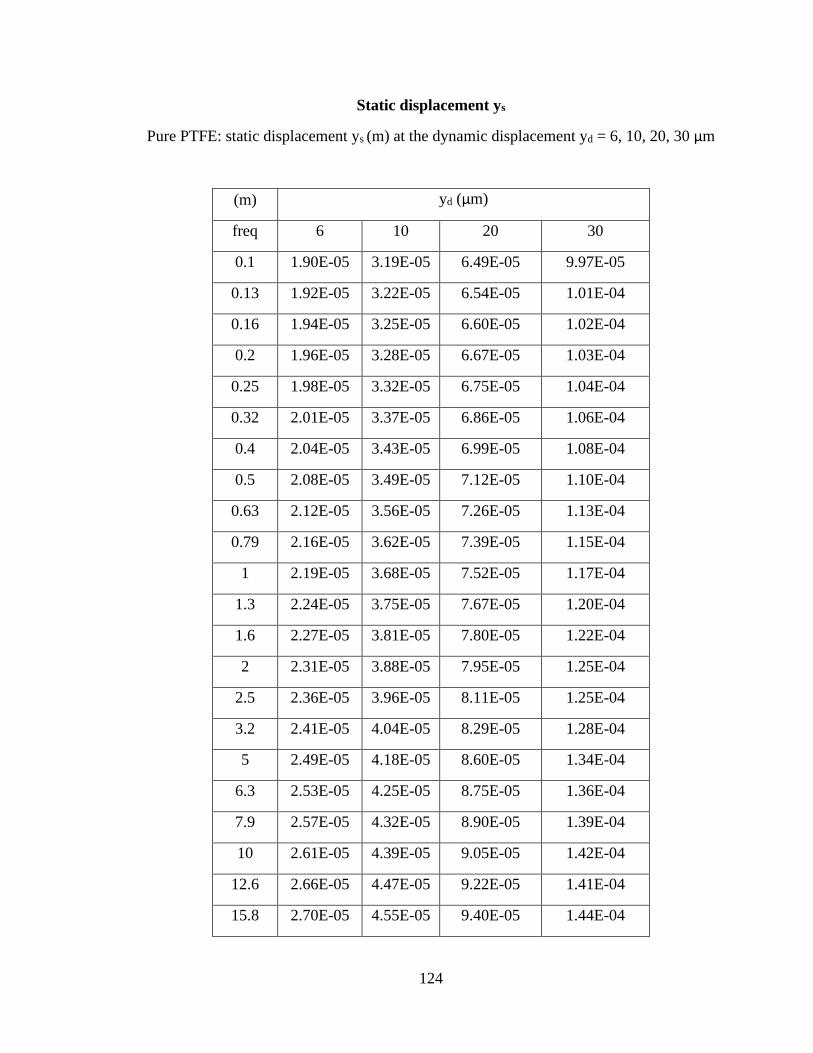
124
Static displacement ys
Pure PTFE: static displacement ys (m) at the dynamic displacement yd = 6, 10, 20, 30 μm
(m) yd (μm)
freq 6 10 20 30
0.1 1.90E-05 3.19E-05 6.49E-05 9.97E-05
0.13 1.92E-05 3.22E-05 6.54E-05 1.01E-04
0.16 1.94E-05 3.25E-05 6.60E-05 1.02E-04
0.2 1.96E-05 3.28E-05 6.67E-05 1.03E-04
0.25 1.98E-05 3.32E-05 6.75E-05 1.04E-04
0.32 2.01E-05 3.37E-05 6.86E-05 1.06E-04
0.4 2.04E-05 3.43E-05 6.99E-05 1.08E-04
0.5 2.08E-05 3.49E-05 7.12E-05 1.10E-04
0.63 2.12E-05 3.56E-05 7.26E-05 1.13E-04
0.79 2.16E-05 3.62E-05 7.39E-05 1.15E-04
1 2.19E-05 3.68E-05 7.52E-05 1.17E-04
1.3 2.24E-05 3.75E-05 7.67E-05 1.20E-04
1.6 2.27E-05 3.81E-05 7.80E-05 1.22E-04
2 2.31E-05 3.88E-05 7.95E-05 1.25E-04
2.5 2.36E-05 3.96E-05 8.11E-05 1.25E-04
3.2 2.41E-05 4.04E-05 8.29E-05 1.28E-04
5 2.49E-05 4.18E-05 8.60E-05 1.34E-04
6.3 2.53E-05 4.25E-05 8.75E-05 1.36E-04
7.9 2.57E-05 4.32E-05 8.90E-05 1.39E-04
10 2.61E-05 4.39E-05 9.05E-05 1.42E-04
12.6 2.66E-05 4.47E-05 9.22E-05 1.41E-04
15.8 2.70E-05 4.55E-05 9.40E-05 1.44E-04
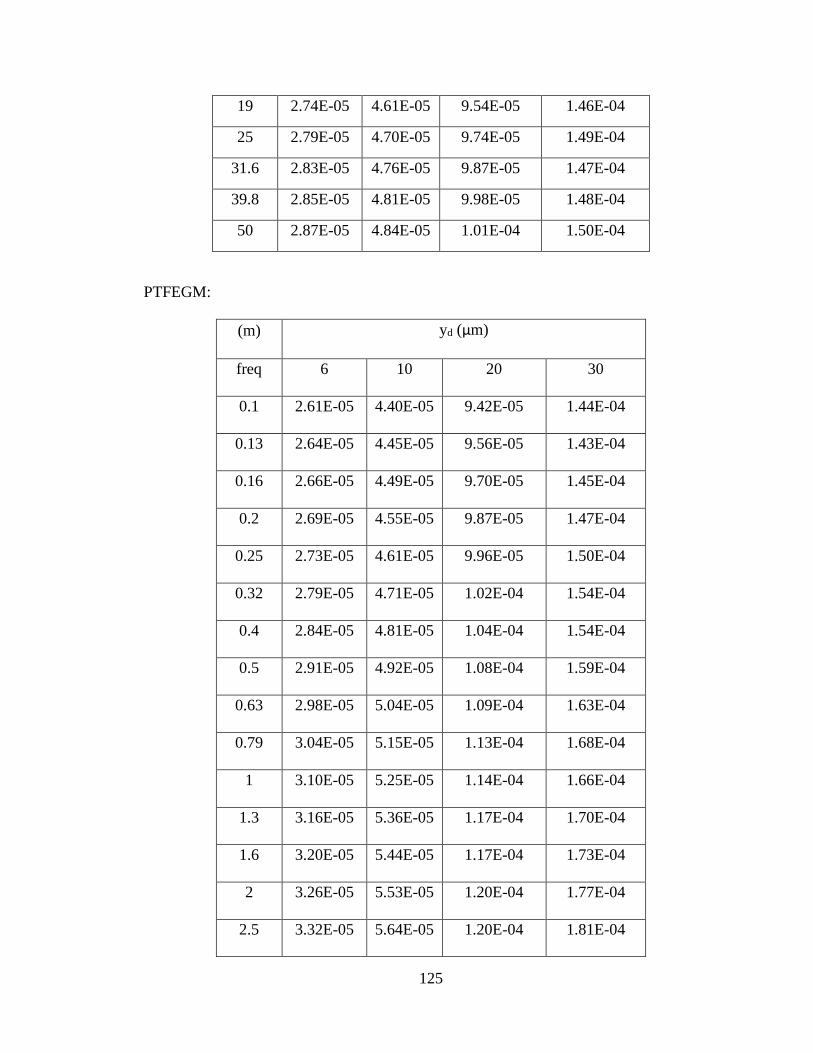
125
19 2.74E-05 4.61E-05 9.54E-05 1.46E-04
25 2.79E-05 4.70E-05 9.74E-05 1.49E-04
31.6 2.83E-05 4.76E-05 9.87E-05 1.47E-04
39.8 2.85E-05 4.81E-05 9.98E-05 1.48E-04
50 2.87E-05 4.84E-05 1.01E-04 1.50E-04
PTFEGM:
(m) yd (μm)
freq 6 10 20 30
0.1 2.61E-05 4.40E-05 9.42E-05 1.44E-04
0.13 2.64E-05 4.45E-05 9.56E-05 1.43E-04
0.16 2.66E-05 4.49E-05 9.70E-05 1.45E-04
0.2 2.69E-05 4.55E-05 9.87E-05 1.47E-04
0.25 2.73E-05 4.61E-05 9.96E-05 1.50E-04
0.32 2.79E-05 4.71E-05 1.02E-04 1.54E-04
0.4 2.84E-05 4.81E-05 1.04E-04 1.54E-04
0.5 2.91E-05 4.92E-05 1.08E-04 1.59E-04
0.63 2.98E-05 5.04E-05 1.09E-04 1.63E-04
0.79 3.04E-05 5.15E-05 1.13E-04 1.68E-04
1 3.10E-05 5.25E-05 1.14E-04 1.66E-04
1.3 3.16E-05 5.36E-05 1.17E-04 1.70E-04
1.6 3.20E-05 5.44E-05 1.17E-04 1.73E-04
2 3.26E-05 5.53E-05 1.20E-04 1.77E-04
2.5 3.32E-05 5.64E-05 1.20E-04 1.81E-04
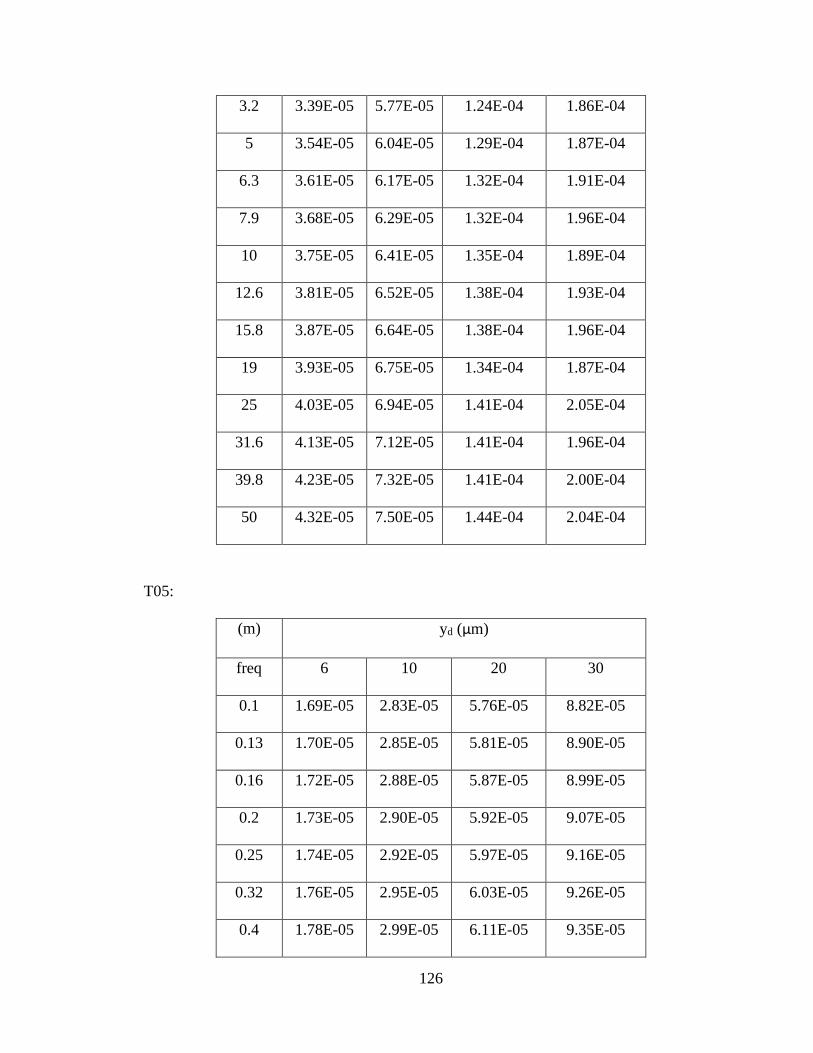
126
3.2 3.39E-05 5.77E-05 1.24E-04 1.86E-04
5 3.54E-05 6.04E-05 1.29E-04 1.87E-04
6.3 3.61E-05 6.17E-05 1.32E-04 1.91E-04
7.9 3.68E-05 6.29E-05 1.32E-04 1.96E-04
10 3.75E-05 6.41E-05 1.35E-04 1.89E-04
12.6 3.81E-05 6.52E-05 1.38E-04 1.93E-04
15.8 3.87E-05 6.64E-05 1.38E-04 1.96E-04
19 3.93E-05 6.75E-05 1.34E-04 1.87E-04
25 4.03E-05 6.94E-05 1.41E-04 2.05E-04
31.6 4.13E-05 7.12E-05 1.41E-04 1.96E-04
39.8 4.23E-05 7.32E-05 1.41E-04 2.00E-04
50 4.32E-05 7.50E-05 1.44E-04 2.04E-04
T05:
(m) yd (μm)
freq 6 10 20 30
0.1 1.69E-05 2.83E-05 5.76E-05 8.82E-05
0.13 1.70E-05 2.85E-05 5.81E-05 8.90E-05
0.16 1.72E-05 2.88E-05 5.87E-05 8.99E-05
0.2 1.73E-05 2.90E-05 5.92E-05 9.07E-05
0.25 1.74E-05 2.92E-05 5.97E-05 9.16E-05
0.32 1.76E-05 2.95E-05 6.03E-05 9.26E-05
0.4 1.78E-05 2.99E-05 6.11E-05 9.35E-05
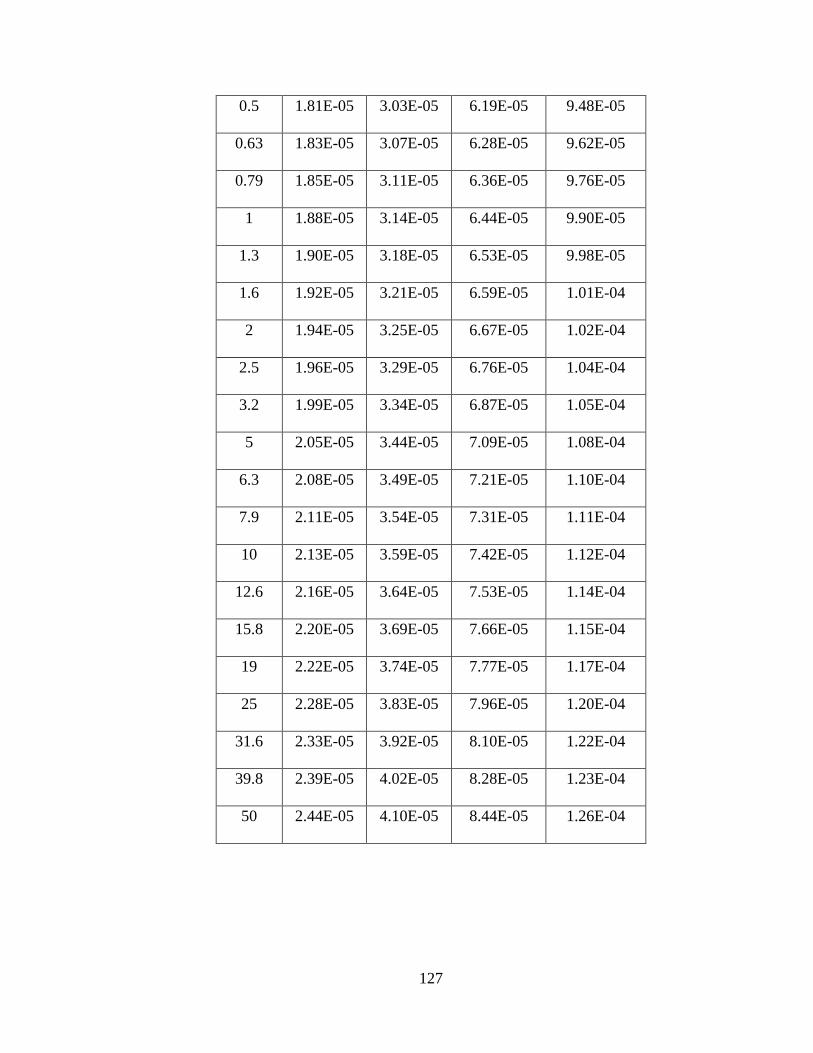
127
0.5 1.81E-05 3.03E-05 6.19E-05 9.48E-05
0.63 1.83E-05 3.07E-05 6.28E-05 9.62E-05
0.79 1.85E-05 3.11E-05 6.36E-05 9.76E-05
1 1.88E-05 3.14E-05 6.44E-05 9.90E-05
1.3 1.90E-05 3.18E-05 6.53E-05 9.98E-05
1.6 1.92E-05 3.21E-05 6.59E-05 1.01E-04
2 1.94E-05 3.25E-05 6.67E-05 1.02E-04
2.5 1.96E-05 3.29E-05 6.76E-05 1.04E-04
3.2 1.99E-05 3.34E-05 6.87E-05 1.05E-04
5 2.05E-05 3.44E-05 7.09E-05 1.08E-04
6.3 2.08E-05 3.49E-05 7.21E-05 1.10E-04
7.9 2.11E-05 3.54E-05 7.31E-05 1.11E-04
10 2.13E-05 3.59E-05 7.42E-05 1.12E-04
12.6 2.16E-05 3.64E-05 7.53E-05 1.14E-04
15.8 2.20E-05 3.69E-05 7.66E-05 1.15E-04
19 2.22E-05 3.74E-05 7.77E-05 1.17E-04
25 2.28E-05 3.83E-05 7.96E-05 1.20E-04
31.6 2.33E-05 3.92E-05 8.10E-05 1.22E-04
39.8 2.39E-05 4.02E-05 8.28E-05 1.23E-04
50 2.44E-05 4.10E-05 8.44E-05 1.26E-04
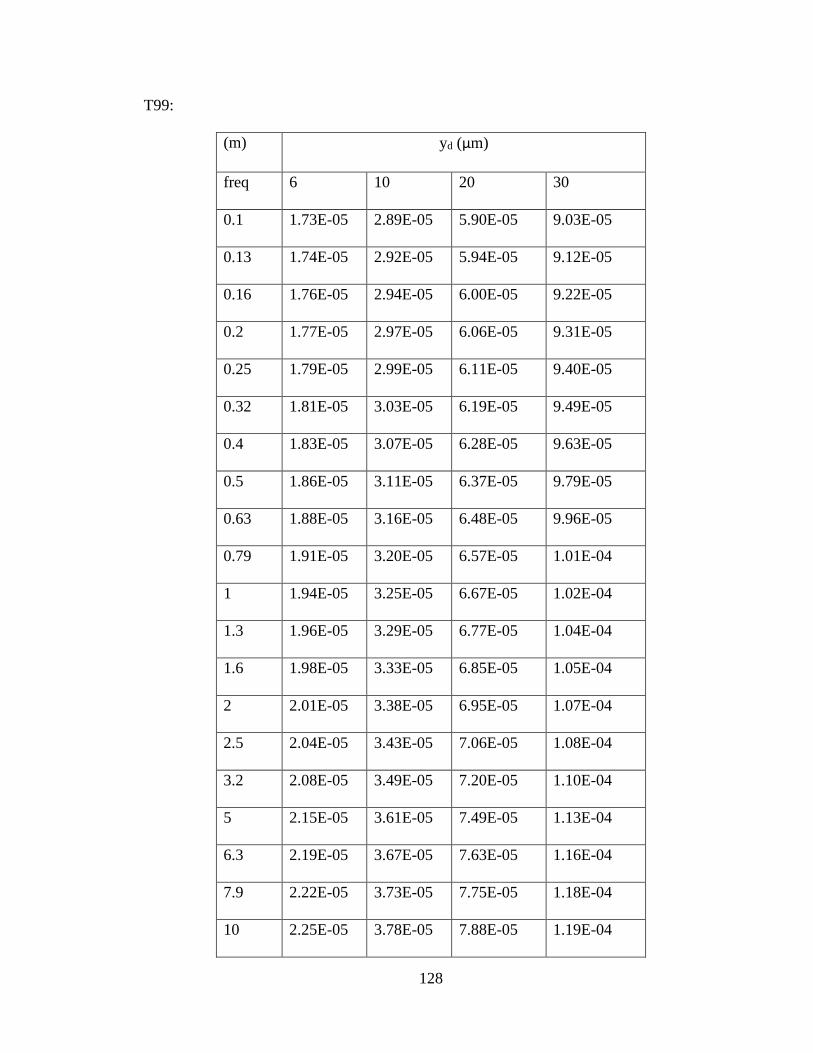
128
T99:
(m) yd (μm)
freq 6 10 20 30
0.1 1.73E-05 2.89E-05 5.90E-05 9.03E-05
0.13 1.74E-05 2.92E-05 5.94E-05 9.12E-05
0.16 1.76E-05 2.94E-05 6.00E-05 9.22E-05
0.2 1.77E-05 2.97E-05 6.06E-05 9.31E-05
0.25 1.79E-05 2.99E-05 6.11E-05 9.40E-05
0.32 1.81E-05 3.03E-05 6.19E-05 9.49E-05
0.4 1.83E-05 3.07E-05 6.28E-05 9.63E-05
0.5 1.86E-05 3.11E-05 6.37E-05 9.79E-05
0.63 1.88E-05 3.16E-05 6.48E-05 9.96E-05
0.79 1.91E-05 3.20E-05 6.57E-05 1.01E-04
1 1.94E-05 3.25E-05 6.67E-05 1.02E-04
1.3 1.96E-05 3.29E-05 6.77E-05 1.04E-04
1.6 1.98E-05 3.33E-05 6.85E-05 1.05E-04
2 2.01E-05 3.38E-05 6.95E-05 1.07E-04
2.5 2.04E-05 3.43E-05 7.06E-05 1.08E-04
3.2 2.08E-05 3.49E-05 7.20E-05 1.10E-04
5 2.15E-05 3.61E-05 7.49E-05 1.13E-04
6.3 2.19E-05 3.67E-05 7.63E-05 1.16E-04
7.9 2.22E-05 3.73E-05 7.75E-05 1.18E-04
10 2.25E-05 3.78E-05 7.88E-05 1.19E-04
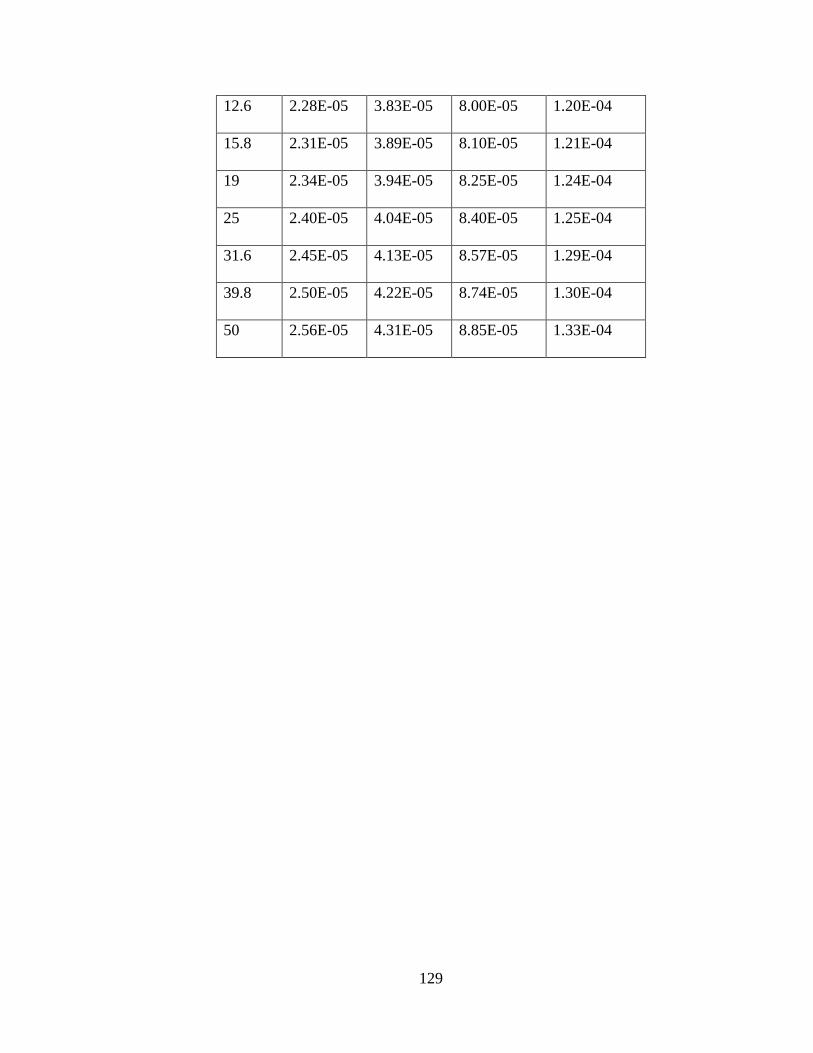
129
12.6 2.28E-05 3.83E-05 8.00E-05 1.20E-04
15.8 2.31E-05 3.89E-05 8.10E-05 1.21E-04
19 2.34E-05 3.94E-05 8.25E-05 1.24E-04
25 2.40E-05 4.04E-05 8.40E-05 1.25E-04
31.6 2.45E-05 4.13E-05 8.57E-05 1.29E-04
39.8 2.50E-05 4.22E-05 8.74E-05 1.30E-04
50 2.56E-05 4.31E-05 8.85E-05 1.33E-04

130
Validation of storage modulus and mechanical loss
PTFEGM: validation of storage modulus
PTFEGM: validation of mechanical loss
0.00E+00
2.00E+02
4.00E+02
6.00E+02
8.00E+02
1.00E+03
1.20E+03
1.40E+03
1.60E+03
0.1 1 10 100
sto
rage
mo
du
lus,
in M
Pa
Log(Freq) in Hz
Experimental GHM model
0%
2%
4%
6%
8%
10%
12%
14%
16%
18%
20%
0
0.02
0.04
0.06
0.08
0.1
0.12
0.14
0.16
0.18
0.1 1 10 100
rela
tive
err
or
Tan
δ
Frequency (Hz)
EXPE Tan Delta SIMU Tan Delta relative error
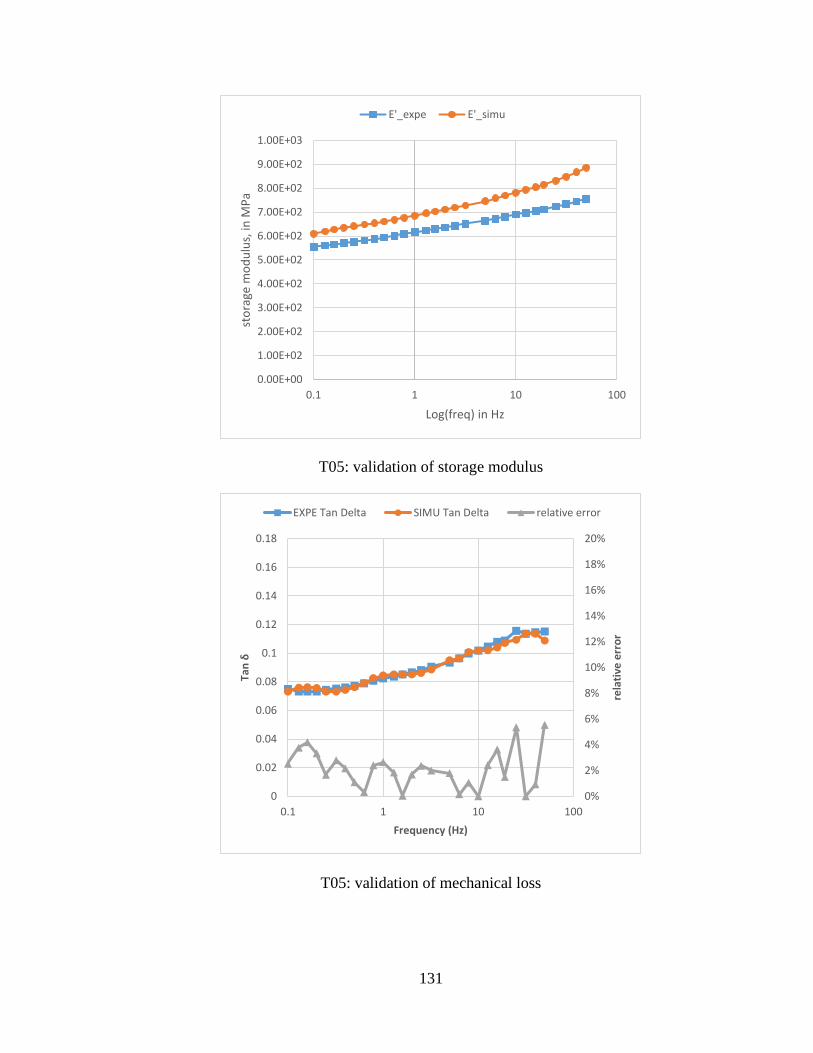
131
T05: validation of storage modulus
T05: validation of mechanical loss
0.00E+00
1.00E+02
2.00E+02
3.00E+02
4.00E+02
5.00E+02
6.00E+02
7.00E+02
8.00E+02
9.00E+02
1.00E+03
0.1 1 10 100
sto
rage
mo
du
lus,
in M
Pa
Log(freq) in Hz
E'_expe E'_simu
0%
2%
4%
6%
8%
10%
12%
14%
16%
18%
20%
0
0.02
0.04
0.06
0.08
0.1
0.12
0.14
0.16
0.18
0.1 1 10 100
rela
tive
err
or
Tan
δ
Frequency (Hz)
EXPE Tan Delta SIMU Tan Delta relative error
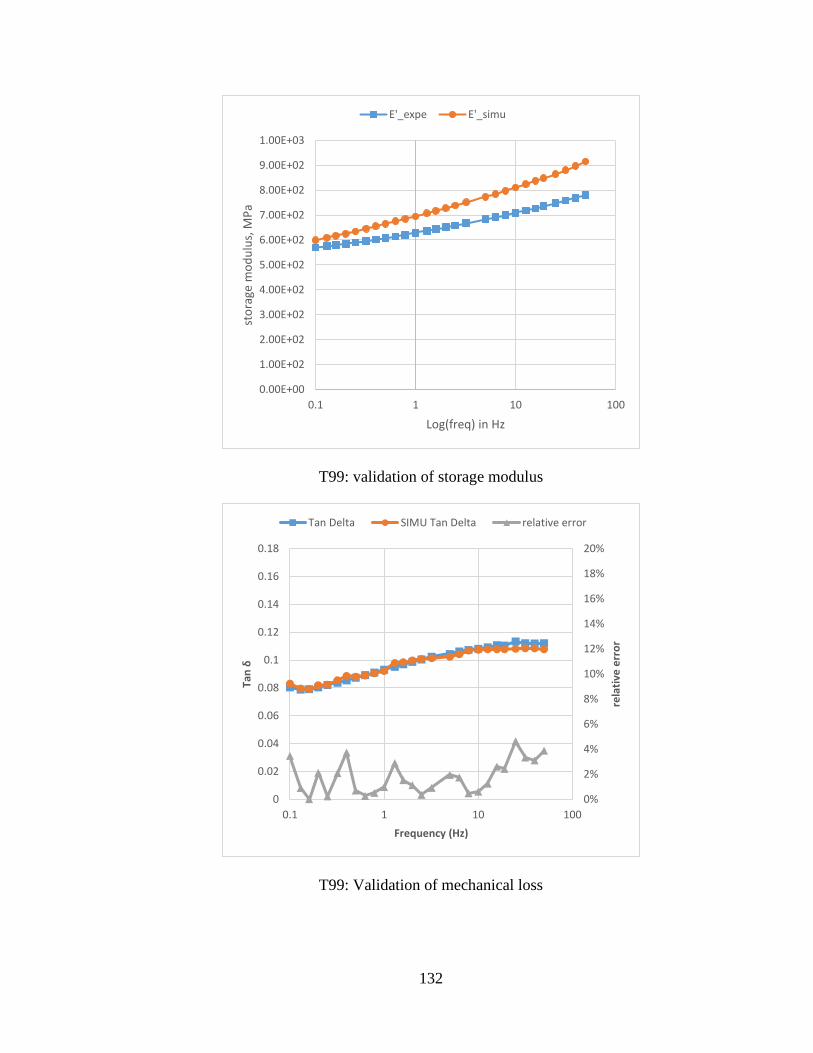
132
T99: validation of storage modulus
T99: Validation of mechanical loss
0.00E+00
1.00E+02
2.00E+02
3.00E+02
4.00E+02
5.00E+02
6.00E+02
7.00E+02
8.00E+02
9.00E+02
1.00E+03
0.1 1 10 100
sto
rage
mo
du
lus,
MP
a
Log(freq) in Hz
E'_expe E'_simu
0%
2%
4%
6%
8%
10%
12%
14%
16%
18%
20%
0
0.02
0.04
0.06
0.08
0.1
0.12
0.14
0.16
0.18
0.1 1 10 100
rela
tive
err
or
Tan
δ
Frequency (Hz)
Tan Delta SIMU Tan Delta relative error
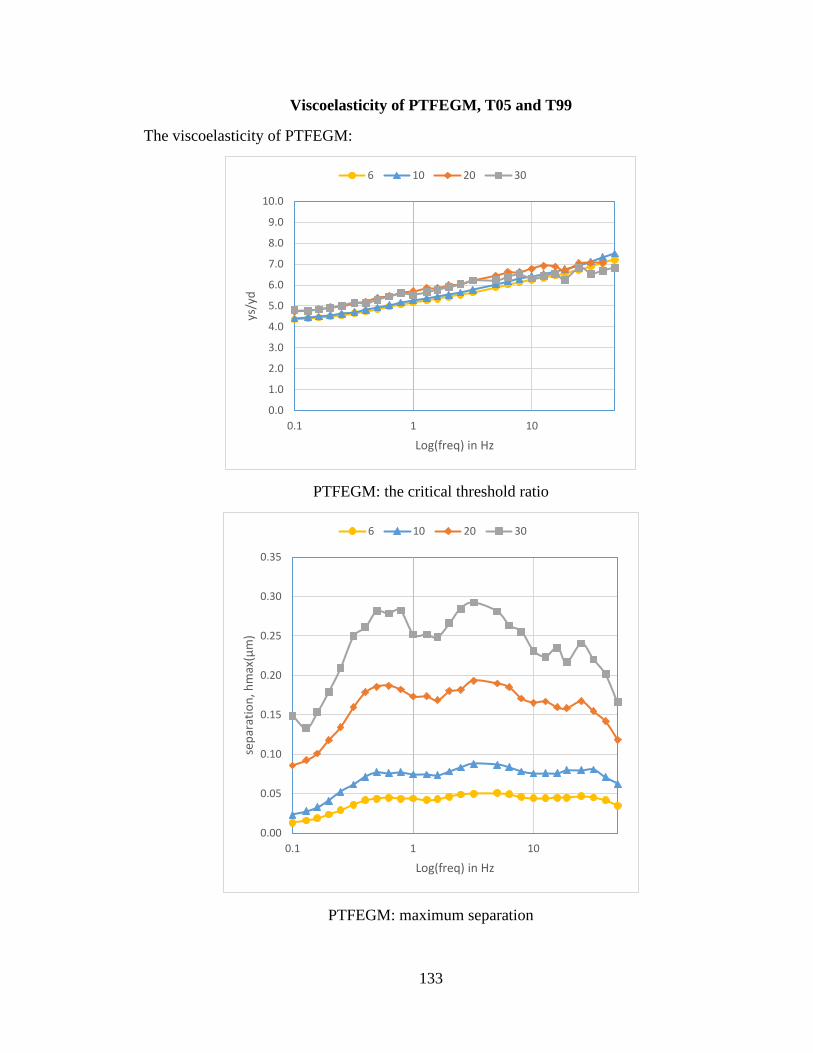
133
Viscoelasticity of PTFEGM, T05 and T99
The viscoelasticity of PTFEGM:
PTFEGM: the critical threshold ratio
PTFEGM: maximum separation
0.0
1.0
2.0
3.0
4.0
5.0
6.0
7.0
8.0
9.0
10.0
0.1 1 10
ys/y
d
Log(freq) in Hz
6 10 20 30
0.00
0.05
0.10
0.15
0.20
0.25
0.30
0.35
0.1 1 10
sep
arat
ion
, hm
ax(μ
m)
Log(freq) in Hz
6 10 20 30
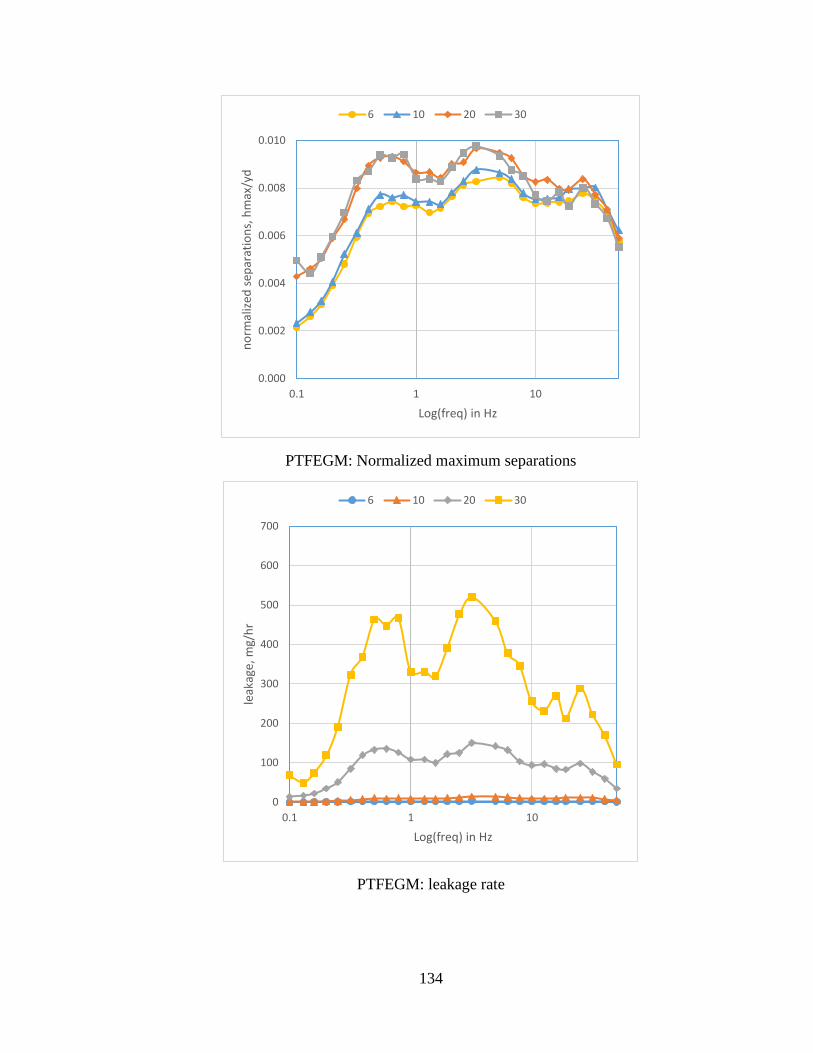
134
PTFEGM: Normalized maximum separations
PTFEGM: leakage rate
0.000
0.002
0.004
0.006
0.008
0.010
0.1 1 10
no
rmal
ized
sep
arat
ion
s, h
max
/yd
Log(freq) in Hz
6 10 20 30
0
100
200
300
400
500
600
700
0.1 1 10
leak
age,
mg/
hr
Log(freq) in Hz
6 10 20 30
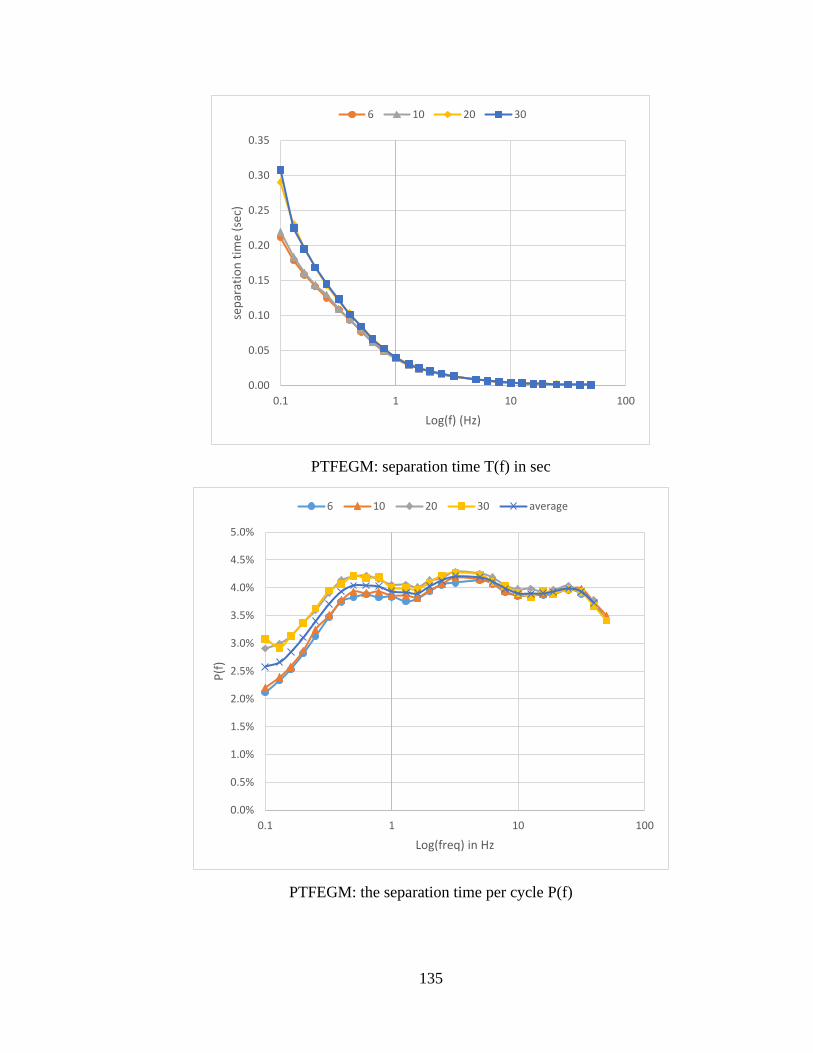
135
PTFEGM: separation time T(f) in sec
PTFEGM: the separation time per cycle P(f)
0.00
0.05
0.10
0.15
0.20
0.25
0.30
0.35
0.1 1 10 100
sep
arat
ion
tim
e (s
ec)
Log(f) (Hz)
6 10 20 30
0.0%
0.5%
1.0%
1.5%
2.0%
2.5%
3.0%
3.5%
4.0%
4.5%
5.0%
0.1 1 10 100
P(f
)
Log(freq) in Hz
6 10 20 30 average
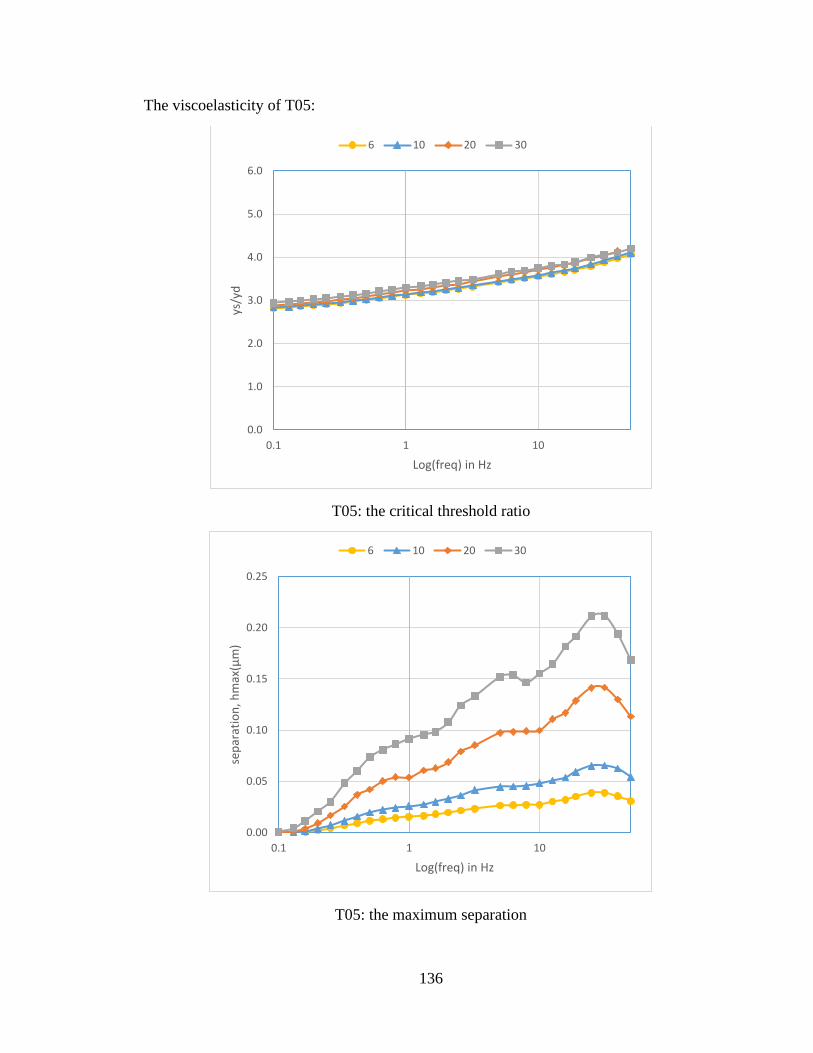
136
The viscoelasticity of T05:
T05: the critical threshold ratio
T05: the maximum separation
0.0
1.0
2.0
3.0
4.0
5.0
6.0
0.1 1 10
ys/y
d
Log(freq) in Hz
6 10 20 30
0.00
0.05
0.10
0.15
0.20
0.25
0.1 1 10
sep
arat
ion
, hm
ax(μ
m)
Log(freq) in Hz
6 10 20 30
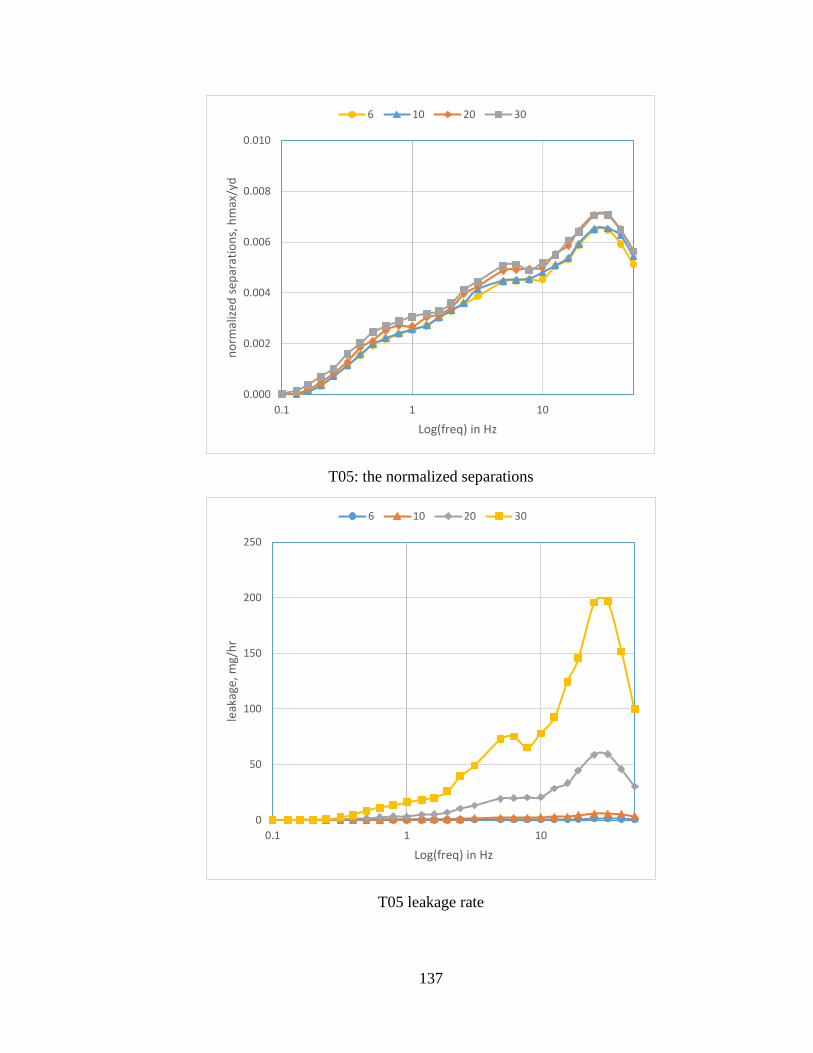
137
T05: the normalized separations
T05 leakage rate
0.000
0.002
0.004
0.006
0.008
0.010
0.1 1 10
no
rmal
ized
sep
arat
ion
s, h
max
/yd
Log(freq) in Hz
6 10 20 30
0
50
100
150
200
250
0.1 1 10
leak
age,
mg/
hr
Log(freq) in Hz
6 10 20 30
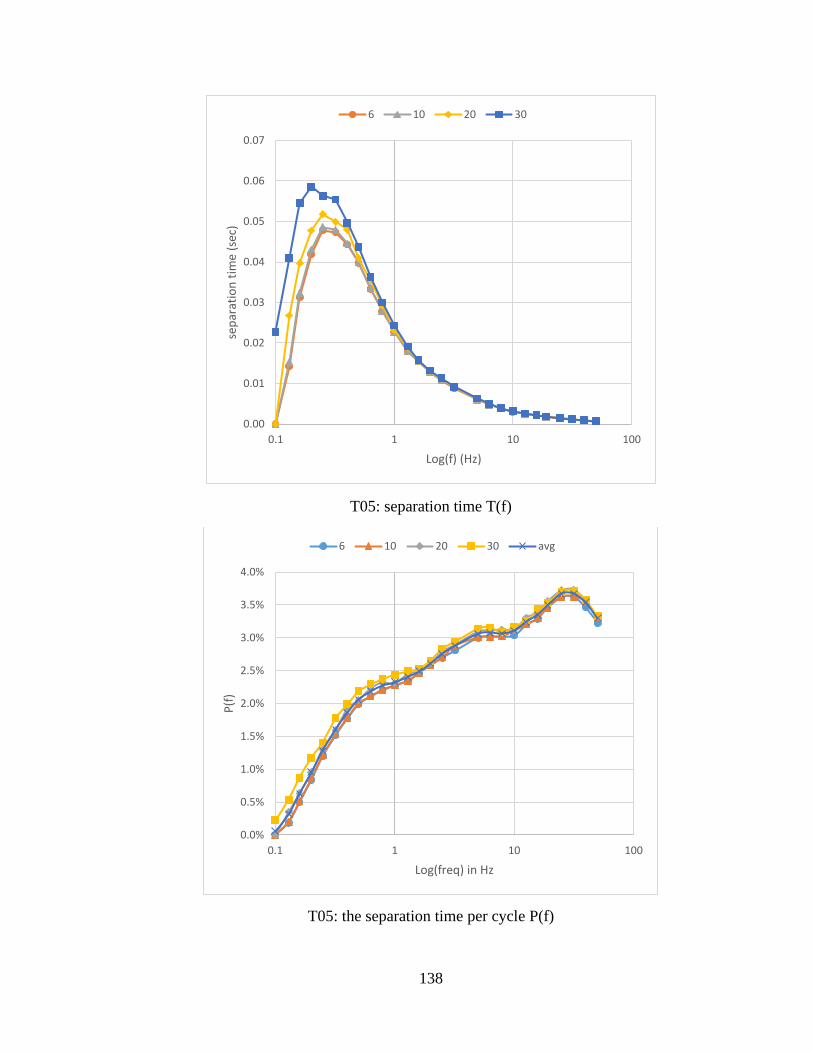
138
T05: separation time T(f)
T05: the separation time per cycle P(f)
0.00
0.01
0.02
0.03
0.04
0.05
0.06
0.07
0.1 1 10 100
sep
arat
ion
tim
e (s
ec)
Log(f) (Hz)
6 10 20 30
0.0%
0.5%
1.0%
1.5%
2.0%
2.5%
3.0%
3.5%
4.0%
0.1 1 10 100
P(f
)
Log(freq) in Hz
6 10 20 30 avg
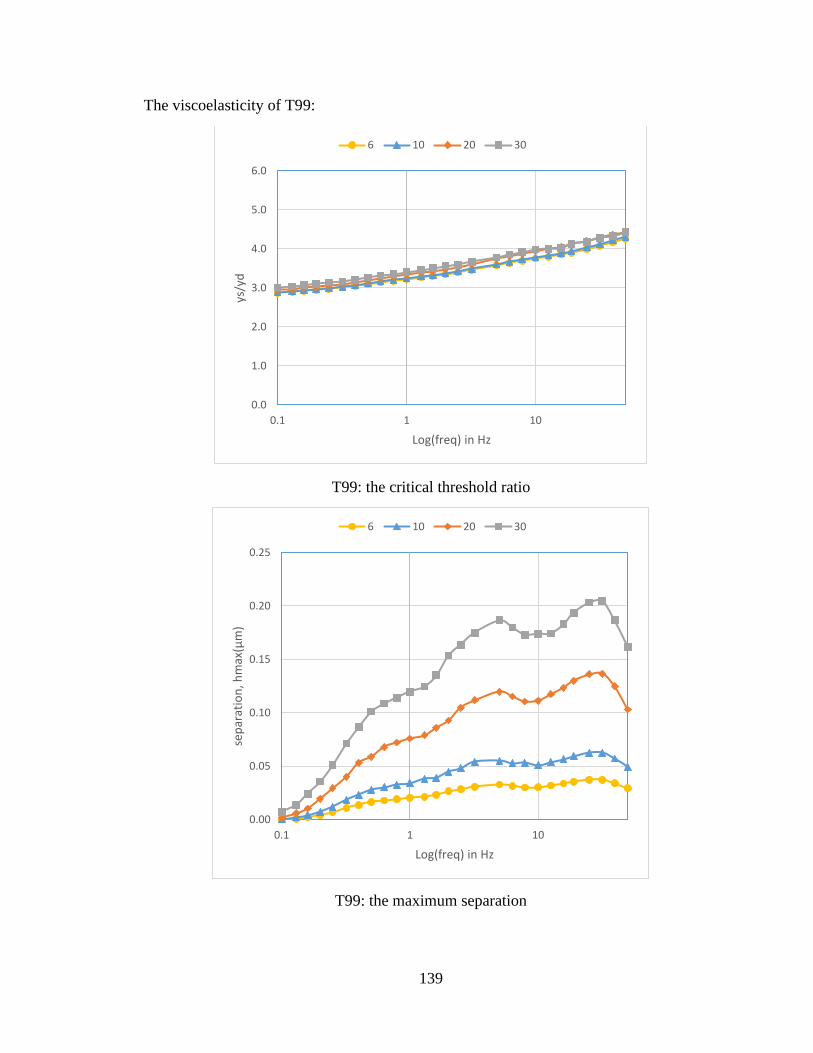
139
The viscoelasticity of T99:
T99: the critical threshold ratio
T99: the maximum separation
0.0
1.0
2.0
3.0
4.0
5.0
6.0
0.1 1 10
ys/y
d
Log(freq) in Hz
6 10 20 30
0.00
0.05
0.10
0.15
0.20
0.25
0.1 1 10
sep
arat
ion
, hm
ax(μ
m)
Log(freq) in Hz
6 10 20 30
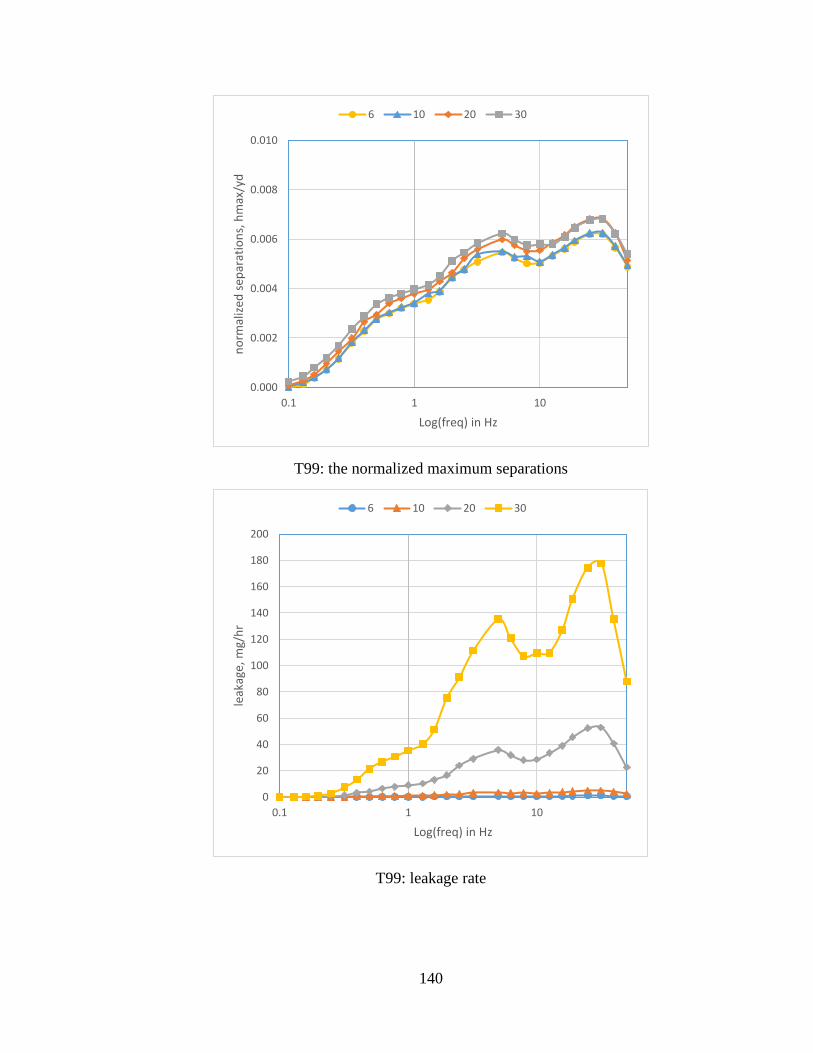
140
T99: the normalized maximum separations
T99: leakage rate
0.000
0.002
0.004
0.006
0.008
0.010
0.1 1 10
no
rmal
ized
sep
arat
ion
s, h
max
/yd
Log(freq) in Hz
6 10 20 30
0
20
40
60
80
100
120
140
160
180
200
0.1 1 10
leak
age,
mg/
hr
Log(freq) in Hz
6 10 20 30
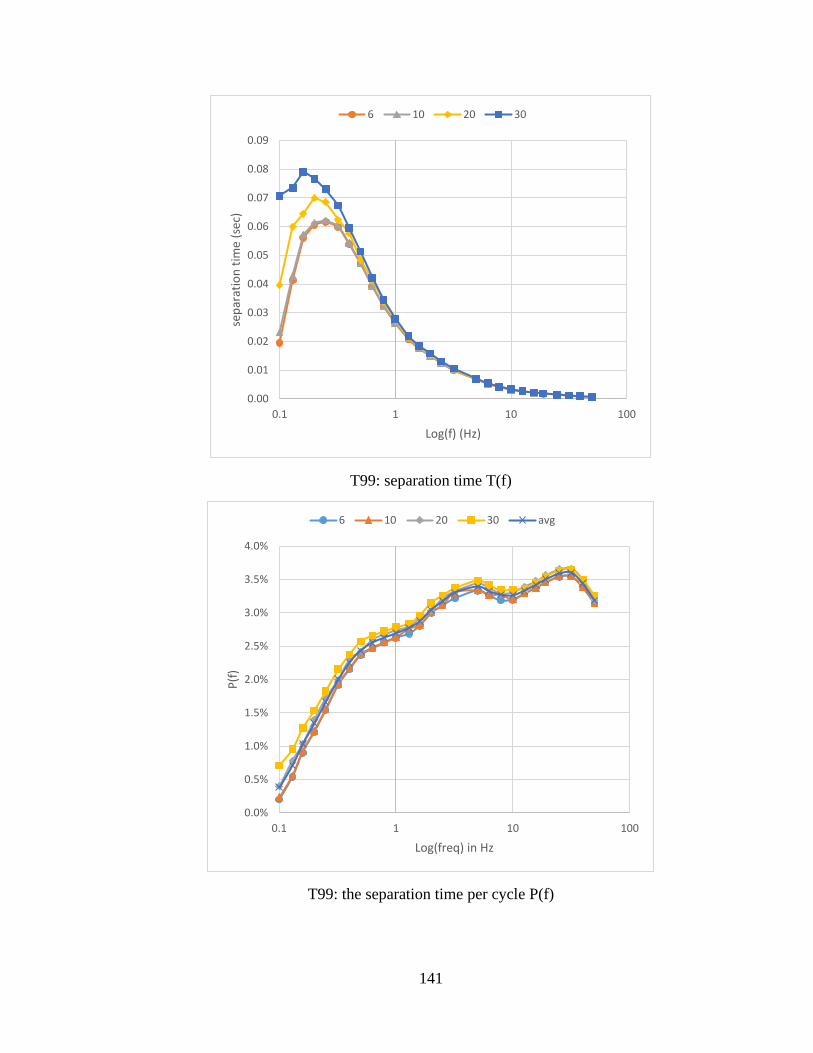
141
T99: separation time T(f)
T99: the separation time per cycle P(f)
0.00
0.01
0.02
0.03
0.04
0.05
0.06
0.07
0.08
0.09
0.1 1 10 100
sep
arat
ion
tim
e (s
ec)
Log(f) (Hz)
6 10 20 30
0.0%
0.5%
1.0%
1.5%
2.0%
2.5%
3.0%
3.5%
4.0%
0.1 1 10 100
P(f
)
Log(freq) in Hz
6 10 20 30 avg
142
REFERENCES
[1] R. H. Warring, Seals and sealing handbook. Gulf Publishing Company, 1981.
[2] A. O. Lebeck, Principles and design of mechanical face seals. John Wiley & Sons,
1991.
[3] H. K. Muller, "Fluid Sealing Technology, Principles and Applications. 1998," ed:
Marcel Decker, Inc., New York.
[4] P. Hannifin, Parker O-Ring Handbook ORD5700. Parker Hannifin Corporation,
Cleveland, OH, 2018.
[5] Trelleborg, Rotary Seals. Trelleborg Sealing Solutions, 2020.
[6] J. Crane. "Type 10T PTFE bellows seal for extreme corrosion resistance."
https://www.johncrane.com/products/mechanical-seals/ptfe-bellows/type-10t
(accessed 03/24/2021, 2021).
[7] G. J. Puts, P. Crouse, and B. M. Ameduri, "Polytetrafluoroethylene: synthesis and
characterization of the original extreme polymer," Chemical reviews, vol. 119, no.
3, pp. 1763-1805, 2019.
[8] S. Ebnesajjad, Expanded PTFE applications handbook: Technology,
manufacturing and applications. William Andrew, 2016.
[9] D. Fluoroproducts, "Teflon® PTFE fluoropolymer resin: Properties Handbook,"
DuPontTM Technical Report H-37051-3, 1996.
[10] B. M. Martin, "Process for polymerizing tetrafluoroethylene," ed: Google Patents,
1946.
[11] E. Duck, "Improvements in or relating to the preparation of fluorine-containing
polymeric materials by the catalytic polymerisation of fluorine-containing
unsaturated compounds and the resulting polymeric materials," GB853355, 1960.
[12] D. Goerrig, H. Jonas, and W. Moschel, "Process for the polymerisation of low-
molecular-mass aliphatic halogenated olefins, Part 1," D935867, 1955.
[13] P. B. Weisz and R. D. Goodwin, "Gaseous polymerization by electrical discharge,"
ed: Google Patents, 1954.
[14] Q. Wang, F. Zheng, and T. Wang, "Tribological properties of polymers PI, PTFE
and PEEK at cryogenic temperature in vacuum," Cryogenics, vol. 75, pp. 19-25,
2016, doi: https://doi.org/10.1016/j.cryogenics.2016.01.001.
[15] E. Dhanumalayan and G. M. Joshi, "Performance properties and applications of
polytetrafluoroethylene (PTFE)—a review," Advanced Composites and Hybrid
Materials, vol. 1, no. 2, pp. 247-268, 2018, doi: https://doi.org/10.1007/s42114-
018-0023-8.
[16] M. Xu, D. N. Futaba, M. Yumura, and K. Hata, "Carbon Nanotubes with
Temperature‐Invariant Creep and Creep‐Recovery from− 190 to 970° C,"
Advanced Materials, vol. 23, no. 32, pp. 3686-3691, 2011.
[17] R. Steijn, "The sliding surface of polytetrafluoroethylene: an investigation with the
electron microscope," Wear, vol. 12, no. 3, pp. 193-212, 1968.
[18] C. M. Pooley and D. Tabor, "Friction and molecular structure: the behaviour of
some thermoplastics," Proceedings of the Royal Society of London. A.
Mathematical and Physical Sciences, vol. 329, no. 1578, pp. 251-274, 1972.
[19] Trelleborg, "Turcon T99 Engineering data," Sept. 1st 2007 2007.
143
[20] Trelleborg, "Turcon T05 Engineering Data," Trelleborg Sealing Solutions, Sept 1st
2007 2007.
[21] J. K. Stieha, "Investigation of an Axial Flow Rotary Valve Seal," Master Thesis,
Department of Mechanical Engineering, University of Kentucky, 2017.
[22] R. K. Flitney, Seals and sealing handbook. Elsevier, 2011.
[23] Trelleborg. ""Turcon® Variseal®"." https://www.trelleborg-
lifesciences.com/en/products/seals/variseals/variseals.html (accessed January 10,
2019) (accessed.
[24] E. Mayer, Mechanical seals. Butterworth-Heinemann, 2013.
[25] T. W. Lai, "Development of High Pressure–Velocity Contacting Plain Face Seals
for Sealing Water," Tribology Transactions, vol. 63, no. 3, pp. 477-486, 2020.
[26] Polyfluor. ""Skidway systems and slide bearings"."
http://www.polyfluor.nl/en/products/finished-products/ptfe-slide-bearing-sheets-
skidway-systems/ (accessed December 18, 2018) (accessed.
[27] W. Findley, J. Lai, K. Onaran, and R. Christensen, Creep and relaxation of
nonlinear viscoelastic materials with an introduction to linear viscoelasticity, 2nd
ed. New York: Dover 1989, ISBN 0486660168.
[28] G. A. Lesieutre and D. L. Mingori, "Finite element modeling of frequency-
dependent material damping using augmenting thermodynamic fields," Journal of
Guidance, Control, and Dynamics, vol. 13, no. 6, pp. 1040-1050, 1990, doi:
https://doi.org/10.2514/3.20577.
[29] M. C. Tanzi, S. Farè, and G. Candiani, Foundations of biomaterials engineering.
Academic Press, 2019.
[30] B. Tan and L. S. Stephens, "Evaluation of viscoelastic characteristics of PTFE-
Based materials," Tribology International, vol. 140, p. 105870, 2019
[31] B. Tan, Stephens, L, "Analysis of End Face Rotary Valve Seals Including
Viscoelastic Effect," in 17th International Symposium on Transport Phenomena
and Dynamics of Rotating Machinery (ISROMAC2017), Maui, United States, 2017.
[32] J. A. Nichols and B. L. Baron, "Long lifetime fluid switching valve," ed: Google
Patents, 2002.
[33] J. A. Nichols, "Dual random access, three-way rotary valve apparatus," ed: Google
Patents, 2004.
[34] J. A. Nichols, "Segmenting valve," ed: Google Patents, 2000.
[35] M. W. Moeller and T. D. Ciolkosz, "Fluid Switching Valve," ed: Google Patents,
2014.
[36] H. WAN, "Fluid selection valve," ed: Google Patents, 2014.
[37] B. Stich, "Rotary coupling for fluid between stationary and rotating machine parts,"
ed: Google Patents, 1992.
[38] C. D. B and P. Frank, "Rotary valve," ed: Google Patents, 1962.
[39] L. Horve, Shaft seals for dynamic applications. CRC Press, 1996.
[40] C. Feng, D. Zhang, and K. Chen, "In situ microscopic observations of dynamic
viscoelastic contact and deformation at a friction interface," Materials Express, vol.
9, no. 3, pp. 235-244, 2019, doi: https://doi.org/10.1166/mex.2019.1490.
[41] C. Feng, D. Zhang, K. Chen, and Y. Guo, "Study on viscoelastic friction and wear
between friction linings and wire rope," International Journal of Mechanical
144
Sciences, vol. 142, pp. 140-152, 2018, doi:
https://doi.org/10.1016/j.ijmecsci.2018.04.046.
[42] N. Klaas, K. Marcus, and C. Kellock, "The tribological behaviour of glass filled
polytetrafluoroethylene," Tribology International, vol. 38, no. 9, pp. 824-833, 2005,
doi: https://doi.org/10.1016/j.triboint.2005.02.010.
[43] J. P. Williams, A.-N. Stone, R. Reedy, and A. P. Gordon, "Glass Fiber-Reinforced
PTFE Gasketed-Joint Under a Retorque," Journal of Pressure Vessel Technology,
vol. 141, no. 2, p. 021001, 2019, doi: https://doi.org/10.1115/1.4042219.
[44] J. K. Stieha and L. S. Stephens, "Analysis of an end face mechanical seal with
internal valving for low power applications," in 71st STLE Annual Meetings, Las
Vegas,NV., 2016.
[45] J. M. Andrew, "Expanding the repertoire of solid lubricant MoS2," Tribology &
Lubrication Technology, vol. 77, no. 5, pp. 40-49, 2021.
[46] T. Blanchet and F. Kennedy, "Sliding wear mechanism of polytetrafluoroethylene
(PTFE) and PTFE composites," Wear, vol. 153, no. 1, pp. 229-243, 1992.
[47] M. Conte and A. Igartua, "Study of PTFE composites tribological behavior," Wear,
vol. 296, no. 1-2, pp. 568-574, 2012.
[48] S. QU and S. WANG, "Elevated-Temperature Thermal and Mechanical Behavior
of Carbon Fiber/Graphite/PTFE/PEEK Composite," Proceedings of the American
Society for Composites—Thirty-third Technical Conference, 2018, doi:
https://doi.org/10.12783/asc33/26159.
[49] Y. Wang and F. Yan, "A study on tribological behaviour of transfer films of
PTFE/bronze composites," Wear, vol. 262, no. 7-8, pp. 876-882, 2007, doi:
https://doi.org/10.1016/j.wear.2006.08.026.
[50] P. Faughnan, C. Bryan, Y. Gan, and H. Aglan, "Correlation between the dynamic
mechanical properties and the fatigue behavior of filled and unfilled PTFE
materials," Journal of materials science letters, vol. 17, no. 20, pp. 1743-1746,
1998, doi: https://doi.org/10.1023/A:1006695723138.
[51] H. L. Li, Z. W. Yin, D. Jiang, L. Y. Jin, Q. Cao, and Y. F. Qu, "A Study of the
Static/Kinetic Friction Behavior of PTFE-Based Fabric Composites," Tribology
Transactions, vol. 61, no. 1, pp. 122-132, 2018, doi:
https://doi.org/10.1080/10402004.2017.1279700.
[52] H. H. C. Forrester, "High strain rate compression testing of polymers: PTFE,
PCTFE, PVC and PMMA," Doctoral Thesis, Department of Physics, School of
Science, Loughborough University, 2013.
[53] K. Hying, "Analyse der viskoelastischen Eigenschaften von Poly (tetrafluorethylen)
im Bereich des ß-Übergangs," Bibliothek der RWTH Aachen, 2003.
[54] M. B. Jemaa, R. Mnif, K. Fehri, and R. Elleuch, "Design of a new tribometer for
tribological and viscoelasticity studies of PTFE valve seats," Tribology Letters, vol.
45, no. 1, pp. 177-184, 2012, doi: https://doi.org/10.1007/s11249-011-9872-9.
[55] R. Mnif, M. Ben Jemaa, N. H. Kacem, and R. Elleuch, "Impact of viscoelasticity
on the tribological behavior of ptfe composites for valve seals application,"
Tribology Transactions, vol. 56, no. 5, pp. 879-886, z 2013, doi:
https://doi.org/10.1080/10402004.2013.801099.
[56] Y. Zhang, S. Xu, Q. Zhang, and Y. Zhou, "Experimental and theoretical research
on the stress-relaxation behaviors of PTFE coated fabrics under different
145
temperatures," Advances in Materials Science and Engineering, vol. 2015, 2015,
doi: http://dx.doi.org/10.1155/2015/319473.
[57] W. Fu and D. Chung, "Vibration reduction ability of polymers, particularly
polymethylmethacrylate and polytetrafluoroethylene," Polym Polym Compos, vol.
9, no. 6, pp. 423-6, 2001, doi: https://doi.org/10.1177/096739110100900607.
[58] A. Huang, X. Peng, and L. S. Turng, "In-situ fibrillated polytetrafluoroethylene
(PTFE) in thermoplastic polyurethane (TPU) via melt blending: Effect on
rheological behavior, mechanical properties, and microcellular foamability,"
Polymer, vol. 134, pp. 263-274, 2018, doi:
https://doi.org/10.1016/j.polymer.2017.11.053.
[59] L. F. Tóth, P. De Baets, and G. Szebényi, "Thermal, Viscoelastic, Mechanical and
Wear Behaviour of Nanoparticle Filled Polytetrafluoroethylene: A Comparison,"
Polymers, vol. 12, no. 9, p. 1940, 2020.
[60] S. Toumi, S. Fouvry, and M. Salvia, "Prediction of sliding speed and normal force
effects on friction and wear rate evolution in a dry oscillating-fretting PTFE/Ti-
6Al-4V contact," Wear, vol. 376, pp. 1365-1378, 2017.
[61] L. Horve, Shaft seals for dynamic applications. CRC Press, 1996, ISBN
1439822557.
[62] M. J. L. Stakenborg, H. J. van Leeuwen, and E. A. M. ten Hagen, "Visco-
Elastohydrodynamic (VEHD) Lubrication in Radial Lip Seals: Part 1—Steady-
State Dynamic Viscoelastic Seal Behavior," Journal of Tribology, vol. 112, no. 4,
pp. 578-583, 1990, doi: 10.1115/1.2920301.
[63] K. Morman Jr and J. Nagtegaal, "Finite element analysis of sinusoidal small‐
amplitude vibrations in deformed viscoelastic solids. Part I: Theoretical
development," International Journal for Numerical Methods in Engineering, vol.
19, no. 7, pp. 1079-1103, 1983.
[64] C. D. Johnson and D. A. Kienholz, "Finite element prediction of damping in
structures with constrained viscoelastic layers," AIAA journal, vol. 20, no. 9, pp.
1284-1290, 1982, doi: https://arc.aiaa.org/doi/10.2514/3.51190.
[65] R. L. Bagley and J. TORVIK, "Fractional calculus-a different approach to the
analysis of viscoelastically damped structures," AIAA journal, vol. 21, no. 5, pp.
741-748, 1983, doi: https://doi.org/10.2514/3.8142.
[66] D. F. Golla and P. C. Hughes, "Dynamics of viscoelastic structures—a time-domain,
finite element formulation," Journal of applied mechanics, vol. 52, no. 4, pp. 897-
906, 1985, doi: https://doi.org/10.1115/1.3169166.
[67] D. J. McTavish and P. C. Hughes, "Modeling of linear viscoelastic space
structures," Journal of Vibration and Acoustics, vol. 115, no. 1, pp. 103-110, 1993,
doi: https://doi.org/10.1115/1.2930302.
[68] M. I. Friswell, D. J. Inman, and M. J. Lam, "On the realisation of GHM models in
viscoelasticity," Journal of Intelligent Material Systems and Structures, vol. 8, no.
11, pp. 986-993, 1997.
[69] Y. Wang and D. J. Inman, "Finite element analysis and experimental study on
dynamic properties of a composite beam with viscoelastic damping," Journal of
Sound and Vibration, vol. 332, no. 23, pp. 6177-6191, 2013.
146
[70] M. Trindade, A. Benjeddou, and R. Ohayon, "Modeling of frequency-dependent
viscoelastic materials for active-passive vibration damping," J. Vib. Acoust., vol.
122, no. 2, pp. 169-174, 2000.
[71] F. S. Barbosa and M. Farage, "A finite element model for sandwich viscoelastic
beams: Experimental and numerical assessment," Journal of sound and vibration,
vol. 317, no. 1-2, pp. 91-111, 2008.
[72] W. Wayne Chen, Q. Jane Wang, Z. Huan, and X. Luo, "Semi-analytical viscoelastic
contact modeling of polymer-based materials," Journal of tribology, vol. 133, no.
4, 2011.
[73] C. Peng, X. Ouyang, K. Schmitz, S. Guo, and H. Yang, "Numerical and
Experimental Study on Combined Seals With the Consideration of Stretching
Effects," Journal of Tribology, vol. 143, no. 6, 2021.
[74] J. S. Bergstrom, Mechanics of solid polymers: theory and computational modeling.
William Andrew, 2015.
[75] P. Rae and D. Dattelbaum, "The properties of poly (tetrafluoroethylene)(PTFE) in
compression," Polymer, vol. 45, no. 22, pp. 7615-7625, 2004.
[76] C. R. Siviour and J. L. Jordan, "High strain rate mechanics of polymers: a review,"
Journal of Dynamic Behavior of Materials, vol. 2, no. 1, pp. 15-32, 2016.
[77] A. Konyukhov and R. Izi, Introduction to computational contact mechanics: a
geometrical approach. John Wiley & Sons, 2015.
[78] S. Park and R. Schapery, "Methods of interconversion between linear viscoelastic
material functions. Part I—A numerical method based on Prony series,"
International Journal of Solids and Structures, vol. 36, no. 11, pp. 1653-1675, 1999,
doi: https://doi.org/10.1016/S0020-7683(98)00055-9.
[79] S. Nemat-Nasser, A. Amirkhizi, K. Holzworth, Z. Jia, W. Nantasetphong, and Y.
Song, "9 Modification and Engineering of HSREP to Achieve Unique Properties,"
2015.
[80] T. Chen, "Determining a prony series for a viscoelastic material from time strain
data," US Army Research Laboratory report, NASA/TM-2000-210123, ARL-TR-
2206, 2000.
[81] R. S. Lakes, Viscoelastic solids. CRC press, 1998.
[82] TA instruments QDMA Online Help Documentation [Online] Available:
http://www.tainstruments.com
[83] M. Wodtke and M. Wasilczuk, "Evaluation of apparent Young׳ s modulus of the
composite polymer layers used as sliding surfaces in hydrodynamic thrust
bearings," Tribology International, vol. 97, pp. 244-252, 2016, doi:
https://doi.org/10.1016/j.triboint.2016.01.040.
[84] E. Dragoni and A. Strozzi, "Design of an end face seal assembly for lubricated
rotary joints," The Journal of Strain Analysis for Engineering Design, vol. 22, no.
1, pp. 37-47, 1987.
[85] F. E. Kennedy Jr and S. A. Karpe, "Thermocracking of a mechanical face seal,"
Wear, vol. 79, no. 1, pp. 21-36, 1982.
[86] O. Izambert, D. Mitton, M. Thourot, and F. Lavaste, "Dynamic stiffness and
damping of human intervertebral disc using axial oscillatory displacement under a
free mass system," European spine journal, vol. 12, no. 6, pp. 562-566, 2003.
147
[87] L. E. Schwer, "Is your mesh refined enough? Estimating discretization error using
GCI," 7th LS-DYNA Anwenderforum, vol. 1, no. 1, pp. 45-54, 2008.
[88] A. Z. Szeri, Fluid film lubrication. Cambridge University Press, 2010.
148
VITA
Bo Tan was born in Changsha, Hunan Province, China. He received his Bachelor of
Science degree in Mechanical Engineering at Changsha University, China in 2012. He then
received his Master of Science degree in Mechanical Engineering at the State University
of New York at Stony Brook in 2014. After shortly worked as a Mechanical Design
Engineer in Boneng Transmission and as an Operation Specialist at ExxonMobil in Jiangsu
Province China, he started PhD program in Mechanical Engineering at the University of
Kentucky in August 2015. During his PhD years, he has 1 (first author) conference paper,
2 conference presentations in STLE and 1 (first author) published journal paper.


