Embed Size (px)
Citation preview
TARGET MARKET: BRAZIL
MARKETING STRATEGIES FOR TOURISM DESTINATIONS
A COMPETITIVE ANALYSIS

Marketing StrategiesFor Tourism Destinations
A Competitive Analysis
Target Market - Brazil
A report produced for European Travel Commission (ETC)by Tourism Development International
Brussels, 2014
Marketing Strategies for Tourism Destinations. Target market: BRAZIL
Published and printed by:European Travel CommissionRue du Marché aux Herbes, 611000 Brussels, BelgiumWebsite: www.etc-corporate.orgEmail: [email protected]
This report was compiled and edited by: Tourism Development International on behalf of the European Travel Commission.
The designations employed and the presentation of material in this publication do not imply the expression of any opinion whatsoever on the part of the European Travel Commission concerning the legal status of any country, territory, city or area, or of its authorities or concerning the delimitations of its frontiers or bound-aries.
Cover photo: Christ, symbol of Rio de Janeiro, standing on top of Corcovado Hill, overlooking Guanabara Bay and Sugarloaf, Rio de Janeiro, Brazil; Copyright: T photography.
Copyright © 2014 European Travel Commission.
Marketing Strategies for Tourism Destinations. Target market: BRAZIL
ContentsForeword i
Introduction 1a. Defining the Competitive Environment for Destination Europe 2b. Destinations in the Global Market Place: a Comparative Analysis 2
Summary of Brazil Market Study 10
1. The Brazil Outbound Market 151.1. A High Spending Market 151.2. Brazilian Tourism to Europe 171.3. Characteristics of the Brazilian Traveller 191.4. Drivers of Growth 211.5. Successful Destination Strategies 22
2. Travel Destinations in the Brazilian Market 242.1. Visa Regimes 242.2. Air Connections 262.3. Political, Economic and Socio-Cultural Links 292.4. Consumer Assessment (TripAdvisor) 32
3. Profile of Europe’s Main Competitors in Brazil 343.1. Destination Marketing Organisations 343.2. The Australian Tourism Sector 353.3. The Mexican Tourism Sector 403.4. The Russian Federation Tourism Sector 463.5. The United States of America Tourism Sector 503.6. Conclusions
4. Marketing Strategy and Activities of Brand USA in Brazil 574.1. Brand USA’s Marketing and Promotional Activities in Brazil 574.2. Brand USA’s Success in Brazil 60
5. Key Factors in Destination Marketing in Brazil 625.1. Market Perceptions 625.2. Marketing Performance and Opportunities 63
Appendices
Appendix 1 European and Competing Destinations WET TTCI and 66 Bloom Country Brand Rankings Appendix 2 Weekly City-to-City Flights from Main Brazilian Centres 69Appendix 3 TripAdvisor Ratings 71Appendix 4 Bibliography and References 73

Marketing Strategies for Tourism Destinations. Target market: BRAZIL
AcknowledgmentsThis report was prepared by Peter Mac Nulty and Robert Cleverdon of Tourism Development International on commission to the European Travel Commission (ETC), and was carried out under the supervision of Ms Valeria Croce, Head, Research and Development Department at ETC.
The report is part of a series of fact-finding reports on the tourism strategy de-veloped by destinations competing with Europe in select long-haul markets. The project was realised as part of the European Commission and ETC joint initiative “Destination Europe 2020”.
We would like to acknowledge the support and contributions of the many ETC members, marketing organisations and tour operators associations who contrib-uted to the realisation of this report.
We also gratefully acknowledge the support of ETC partners, who committedly contributed to the realisation of this project. A special note of thanks to Mr Charlie Ballard, Director of Advertising Research at TripAdvisor, Mr Xu Jing, Regional Director for Asia and the Pacific at UNWTO, and Mr Daniel Velasco, Consultant at Amadeus Travel Intelligence Unit, for their contributions.

Marketing Strategies for Tourism Destinations. Target market: BRAZIL
ForewordIn an increasingly vibrant landscape, marked by new players, technological inno-vation and rapidly changing consumers, the need arises for European destina-tions to closely monitor others’ effort to win market shares in the global tourism market.
This compilation of best practice examples in tourism and promotion strategies is meant to provide insights relevant to ETC and its member countries through a better understanding of the environment in which they operate.
This series of reports provides insights into the strategic vision and the operation-al actions tourism destinations worldwide are developing to attract an increas-ing number of visitors from the most promising source markets. This fact-finding research offers a bird’s-eye view of the competitive environment, and a portrait of the tourism strategy and marketing activities of competing destinations. Ref-erences to official documents and publicly available reports facilitate access to detailed information, for those interested in achieving a higher level of knowl-edge. For Europe’s strongest competitors, portraits are enriched with first-hand information gathered through personal interviews with NTOs marketing directors, representatives of the travel trade and experts.
The common structure of reports facilitates cross-market comparisons. Key re-sults are synthesised in a highly visual executive summary, conceived for dis-semination to the public at large.
We trust these reports will become for ETC and its members an important tool to identify key opportunities and challenges, and to strengthen their comparative advantage in the global tourism market.
Executive UnitEuropean Travel Commission
i

Marketing Strategies for Tourism Destinations. Target market: BRAZIL
IntroductionThis report’s aim is to collect meaningful knowledge about the tourism strategy of destinations competing with destinations in Europe in select long-haul markets. This study is part of a series of publications, which offer an overview of the en-vironment, in which European tourism destinations operate, and a profile of the tourism strategy and marketing activities of competing destinations. A listing of official documents, publicly available reports and media features is provided in an appendix and through the footnotes to permit more detailed examination of the information presented and issues raised. Each report also provides first-hand in-formation on a selection of competing destinations, gathered through interviews with NTOs’ marketing directors, travel trade and experts.
This project focuses on countries competing with European destinations in high potential long-haul markets, namely Brazil, Canada, China, Japan, Russia and the United States. In this analysis, Europe is defined as the 33 countries which are members of the European Travel Commission plus France, the Netherlands and the United Kingdom.
The analysis followed a three step approach.
The first step was to identify the key markets for Europe and the primary desti-nations competing with Europe in those markets. These markets are presented in Figure 1.
The second step consisted of assessing strengths and weaknesses of destina-tions, which are significant competitors to Europe in the six target markets. The assessment has been based on the following indicators:
• the World Economic Forum Travel and Tourism Competitive Index (WEF TTCI),
• travel trade interviews and expert opinion,• visa regimes and other visitor entry requirements,• air connectivity and capacity,• price competitiveness,• political, economic and socio-cultural links,• destination tourism development policy, • destination tourism marketing strategy.
The third step consisted of identifying those destinations which are the strongest competitors for Europe in each market, i.e. destinations which attract significant volumes of travellers and are actively investing in increasing their share in the market. A detailed profile of the organisations in charge of promoting inbound tourism to these destinations has been compiled. Information about the strongest competitors has been collected by the means of personal interviews as well as from secondary sources.
Defining the competitive environment for Destination Europe
1
Marketing Strategies for Tourism Destinations. Target market: BRAZIL
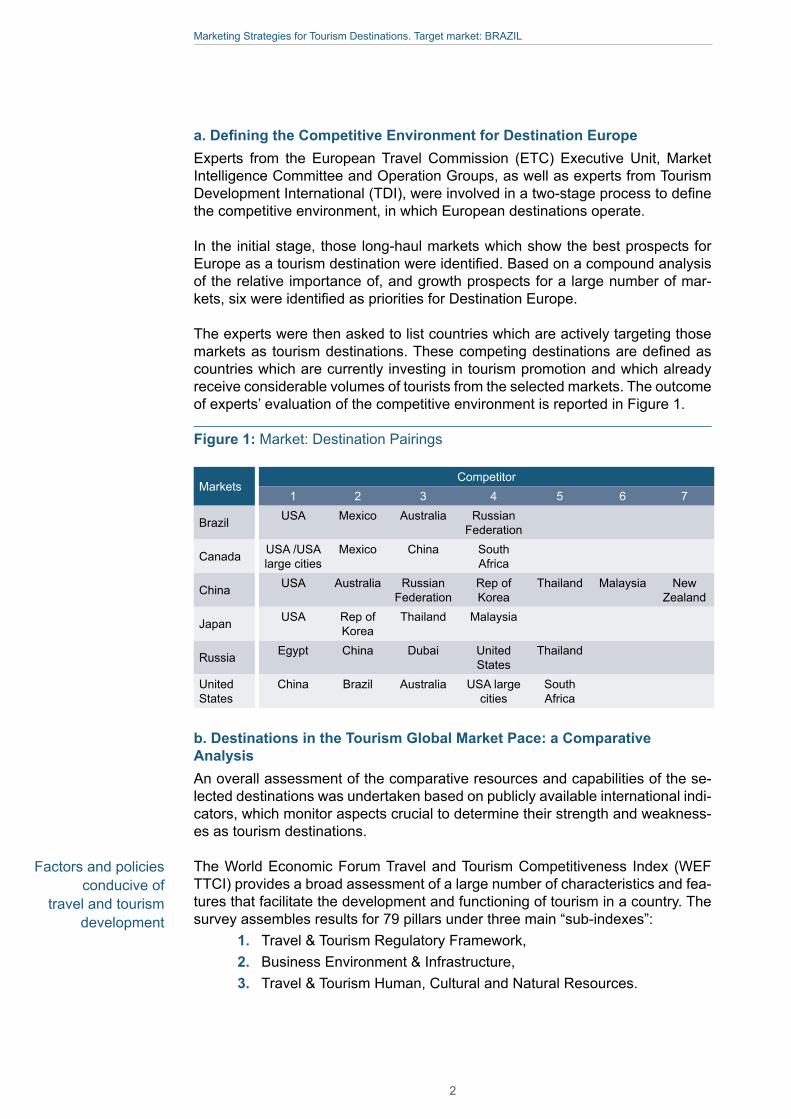
a. Defining the Competitive Environment for Destination Europe Experts from the European Travel Commission (ETC) Executive Unit, Market Intelligence Committee and Operation Groups, as well as experts from Tourism Development International (TDI), were involved in a two-stage process to define the competitive environment, in which European destinations operate.
In the initial stage, those long-haul markets which show the best prospects for Europe as a tourism destination were identified. Based on a compound analysis of the relative importance of, and growth prospects for a large number of mar-kets, six were identified as priorities for Destination Europe. The experts were then asked to list countries which are actively targeting those markets as tourism destinations. These competing destinations are defined as countries which are currently investing in tourism promotion and which already receive considerable volumes of tourists from the selected markets. The outcome of experts’ evaluation of the competitive environment is reported in Figure 1.
Figure 1: Market: Destination Pairings
MarketsCompetitor
1 2 3 4 5 6 7
Brazil USA Mexico Australia Russian Federation
Canada USA /USA large cities
Mexico China South Africa
China USA Australia Russian Federation
Rep of Korea
Thailand Malaysia New Zealand
Japan USA Rep of Korea
Thailand Malaysia
Russia Egypt China Dubai United States
Thailand
United States
China Brazil Australia USA large cities
South Africa
b. Destinations in the Tourism Global Market Pace: a Comparative AnalysisAn overall assessment of the comparative resources and capabilities of the se-lected destinations was undertaken based on publicly available international indi-cators, which monitor aspects crucial to determine their strength and weakness-es as tourism destinations.
The World Economic Forum Travel and Tourism Competitiveness Index (WEF TTCI) provides a broad assessment of a large number of characteristics and fea-tures that facilitate the development and functioning of tourism in a country. The survey assembles results for 79 pillars under three main “sub-indexes”:
1. Travel & Tourism Regulatory Framework,2. Business Environment & Infrastructure, 3. Travel & Tourism Human, Cultural and Natural Resources.
Factors and policies conducive of
travel and tourism development
2
Marketing Strategies for Tourism Destinations. Target market: BRAZIL
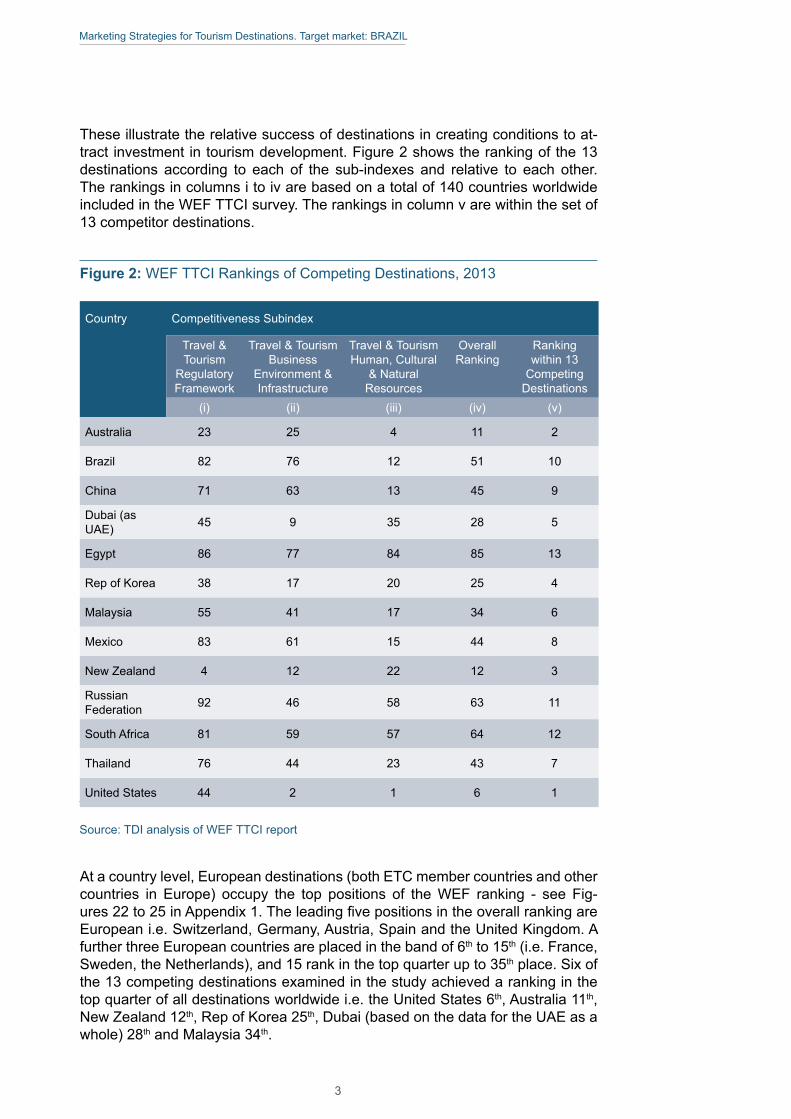
These illustrate the relative success of destinations in creating conditions to at-tract investment in tourism development. Figure 2 shows the ranking of the 13 destinations according to each of the sub-indexes and relative to each other. The rankings in columns i to iv are based on a total of 140 countries worldwide included in the WEF TTCI survey. The rankings in column v are within the set of 13 competitor destinations.
Figure 2: WEF TTCI Rankings of Competing Destinations, 2013
Country Competitiveness Subindex
Travel & Tourism
Regulatory Framework
Travel & Tourism Business
Environment & Infrastructure
Travel & Tourism Human, Cultural
& Natural Resources
Overall Ranking
Ranking within 13
Competing Destinations
(i) (ii) (iii) (iv) (v)
Australia 23 25 4 11 2
Brazil 82 76 12 51 10
China 71 63 13 45 9
Dubai (as UAE) 45 9 35 28 5
Egypt 86 77 84 85 13
Rep of Korea 38 17 20 25 4
Malaysia 55 41 17 34 6
Mexico 83 61 15 44 8
New Zealand 4 12 22 12 3
Russian Federation 92 46 58 63 11
South Africa 81 59 57 64 12
Thailand 76 44 23 43 7
United States 44 2 1 6 1
Source: TDI analysis of WEF TTCI report
At a country level, European destinations (both ETC member countries and other countries in Europe) occupy the top positions of the WEF ranking - see Fig-ures 22 to 25 in Appendix 1. The leading five positions in the overall ranking are European i.e. Switzerland, Germany, Austria, Spain and the United Kingdom. A further three European countries are placed in the band of 6th to 15th (i.e. France, Sweden, the Netherlands), and 15 rank in the top quarter up to 35th place. Six of the 13 competing destinations examined in the study achieved a ranking in the top quarter of all destinations worldwide i.e. the United States 6th, Australia 11th, New Zealand 12th, Rep of Korea 25th, Dubai (based on the data for the UAE as a whole) 28th and Malaysia 34th.
3
Marketing Strategies for Tourism Destinations. Target market: BRAZIL
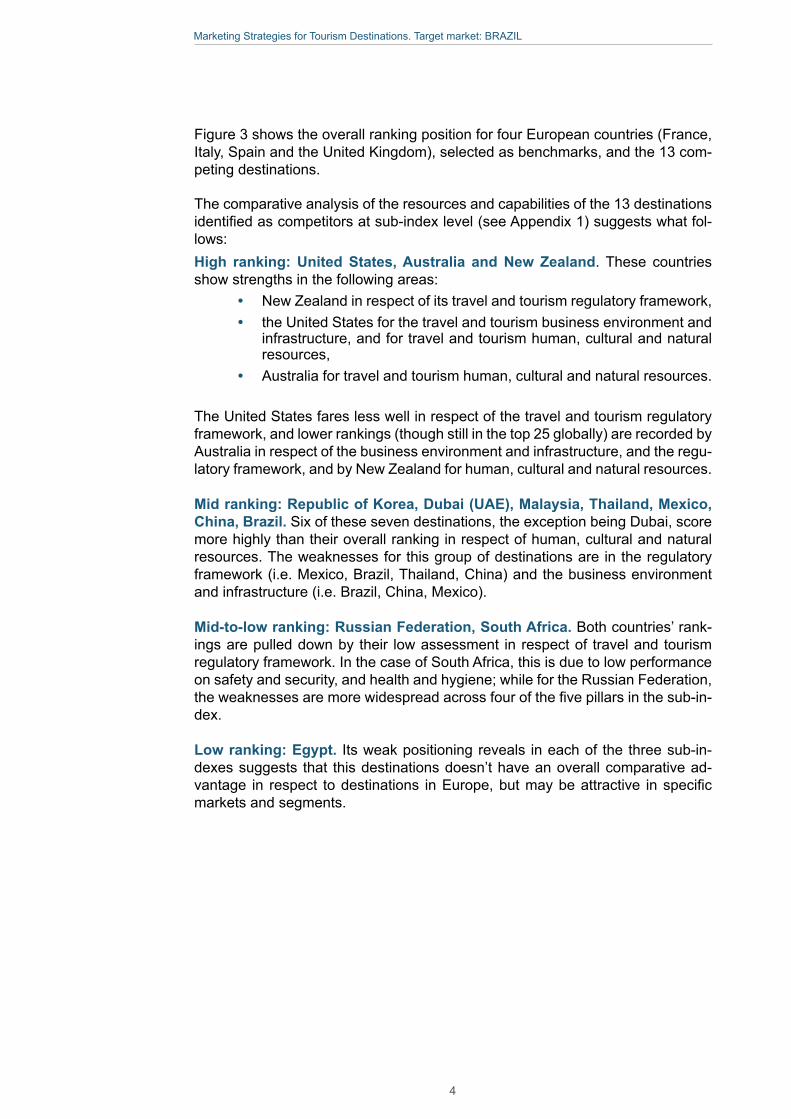
Figure 3 shows the overall ranking position for four European countries (France, Italy, Spain and the United Kingdom), selected as benchmarks, and the 13 com-peting destinations.
The comparative analysis of the resources and capabilities of the 13 destinations identified as competitors at sub-index level (see Appendix 1) suggests what fol-lows:High ranking: United States, Australia and New Zealand. These countries show strengths in the following areas:
• New Zealand in respect of its travel and tourism regulatory framework,• the United States for the travel and tourism business environment and
infrastructure, and for travel and tourism human, cultural and natural resources,
• Australia for travel and tourism human, cultural and natural resources.
The United States fares less well in respect of the travel and tourism regulatory framework, and lower rankings (though still in the top 25 globally) are recorded by Australia in respect of the business environment and infrastructure, and the regu-latory framework, and by New Zealand for human, cultural and natural resources.
Mid ranking: Republic of Korea, Dubai (UAE), Malaysia, Thailand, Mexico, China, Brazil. Six of these seven destinations, the exception being Dubai, score more highly than their overall ranking in respect of human, cultural and natural resources. The weaknesses for this group of destinations are in the regulatory framework (i.e. Mexico, Brazil, Thailand, China) and the business environment and infrastructure (i.e. Brazil, China, Mexico).
Mid-to-low ranking: Russian Federation, South Africa. Both countries’ rank-ings are pulled down by their low assessment in respect of travel and tourism regulatory framework. In the case of South Africa, this is due to low performance on safety and security, and health and hygiene; while for the Russian Federation, the weaknesses are more widespread across four of the five pillars in the sub-in-dex.
Low ranking: Egypt. Its weak positioning reveals in each of the three sub-in-dexes suggests that this destinations doesn’t have an overall comparative ad-vantage in respect to destinations in Europe, but may be attractive in specific markets and segments.
4
Marketing Strategies for Tourism Destinations. Target market: BRAZIL
Figure 3: WEF TTCI Overall Rankings
Source: WEF - TTCI, 2013, 140 destinations
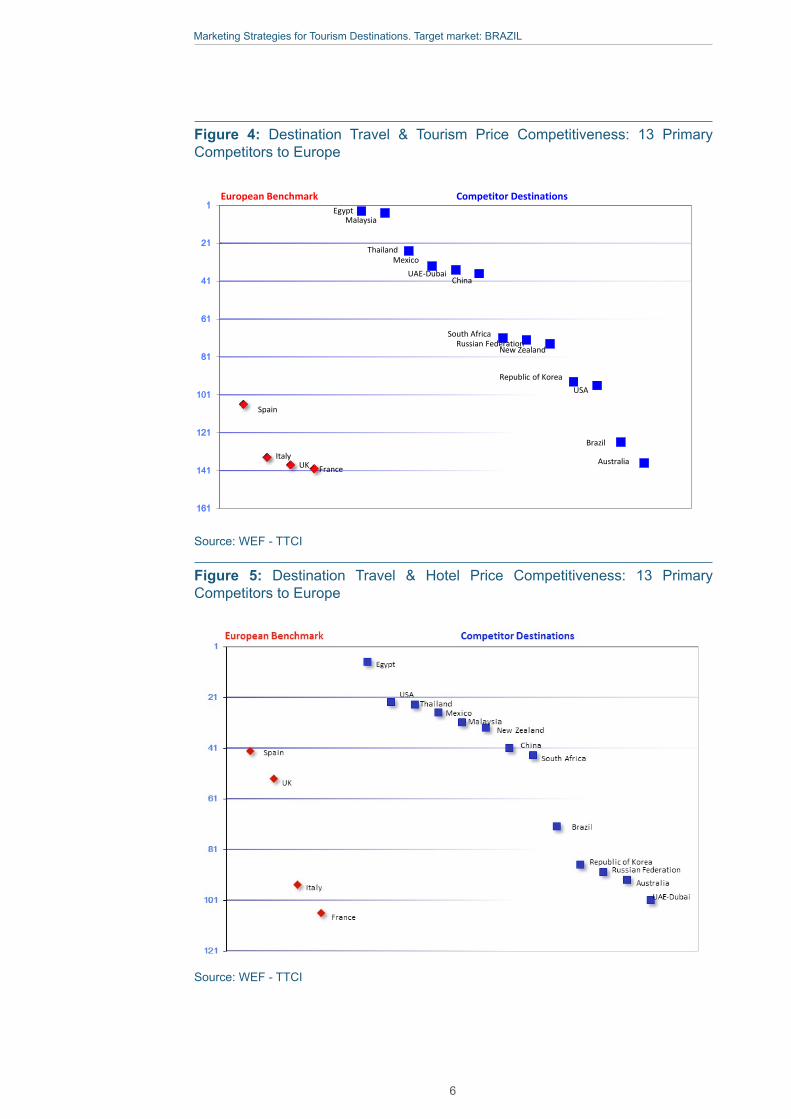
Another competitive edge for destinations is the value of their tourism offer. While the perceived value of tourism services is a subjective construct that varies across markets, segments and experiences, an assessment based on standardised in-dices can highlight destinations’ comparative advantages related to cost-related aspects.
The WEF TTCI survey examines components that impact on price levels at a destination, including taxes levied on ticket sales, airport charges and fuel costs, as well as general taxation levels. The overall price competitiveness of destina-tions is derived from these five factors. The WEF TTCI also provides a hotel price index, as a proxy of price competitiveness from a consumer perspective.
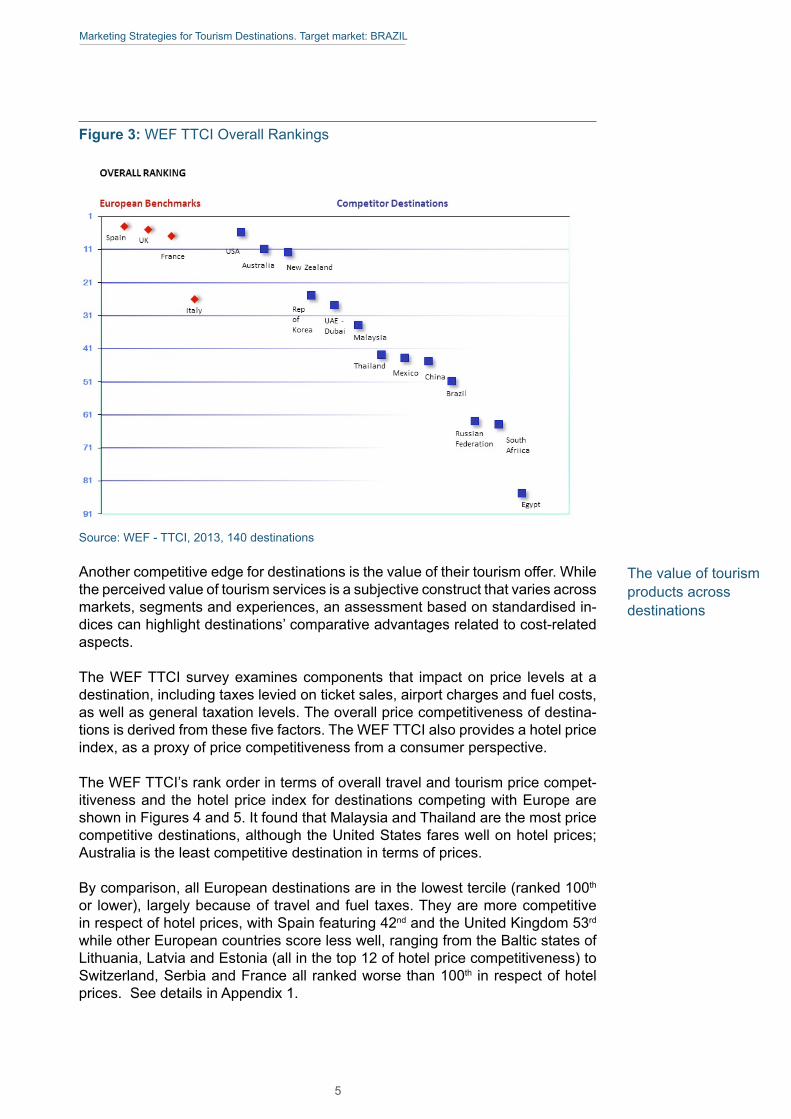
The WEF TTCI’s rank order in terms of overall travel and tourism price compet-itiveness and the hotel price index for destinations competing with Europe are shown in Figures 4 and 5. It found that Malaysia and Thailand are the most price competitive destinations, although the United States fares well on hotel prices; Australia is the least competitive destination in terms of prices.
By comparison, all European destinations are in the lowest tercile (ranked 100th or lower), largely because of travel and fuel taxes. They are more competitive in respect of hotel prices, with Spain featuring 42nd and the United Kingdom 53rd while other European countries score less well, ranging from the Baltic states of Lithuania, Latvia and Estonia (all in the top 12 of hotel price competitiveness) to Switzerland, Serbia and France all ranked worse than 100th in respect of hotel prices. See details in Appendix 1.
The value of tourism products across destinations
5
Marketing Strategies for Tourism Destinations. Target market: BRAZIL
Figure 4: Destination Travel & Tourism Price Competitiveness: 13 Primary Competitors to Europe
1
21
41
61
81
101
121
141
161
UK
Russian Federation
Malaysia
Thailand
New Zealand
European Benchmark Competitor Destinations
Source: WEF -‐ TTCI
USARepublic of Korea
Australia
Egypt
South Africa
China
MexicoUAE-‐Dubai
Spain
France
BrazilItaly
Source: WEF - TTCI
Figure 5: Destination Travel & Hotel Price Competitiveness: 13 Primary Competitors to Europe
Source: WEF - TTCI
6
Marketing Strategies for Tourism Destinations. Target market: BRAZIL
Country Brand Rankings
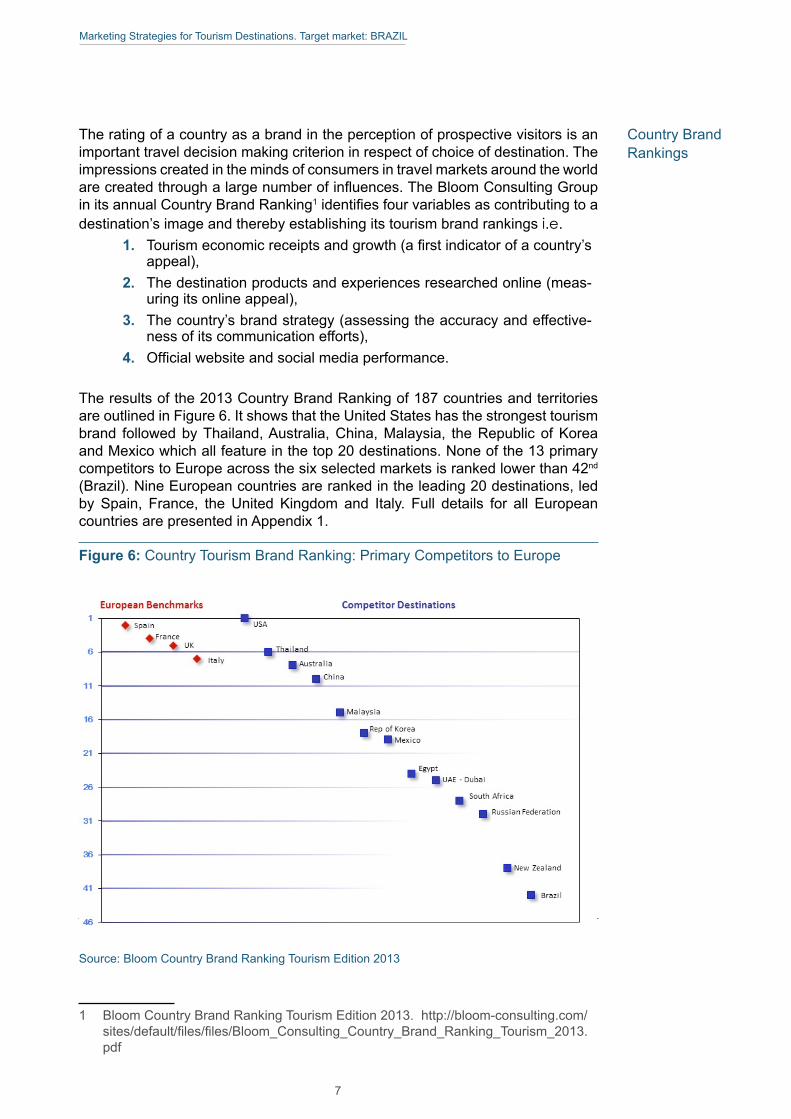
The rating of a country as a brand in the perception of prospective visitors is an important travel decision making criterion in respect of choice of destination. The impressions created in the minds of consumers in travel markets around the world are created through a large number of influences. The Bloom Consulting Group in its annual Country Brand Ranking1 identifies four variables as contributing to a destination’s image and thereby establishing its tourism brand rankings i.e.
1. Tourism economic receipts and growth (a first indicator of a country’s appeal),
2. The destination products and experiences researched online (meas-uring its online appeal),
3. The country’s brand strategy (assessing the accuracy and effective-ness of its communication efforts),
4. Official website and social media performance.
The results of the 2013 Country Brand Ranking of 187 countries and territories are outlined in Figure 6. It shows that the United States has the strongest tourism brand followed by Thailand, Australia, China, Malaysia, the Republic of Korea and Mexico which all feature in the top 20 destinations. None of the 13 primary competitors to Europe across the six selected markets is ranked lower than 42nd (Brazil). Nine European countries are ranked in the leading 20 destinations, led by Spain, France, the United Kingdom and Italy. Full details for all European countries are presented in Appendix 1.
Figure 6: Country Tourism Brand Ranking: Primary Competitors to Europe
Source: Bloom Country Brand Ranking Tourism Edition 2013
1 Bloom Country Brand Ranking Tourism Edition 2013. http://bloom-consulting.com/sites/default/files/files/Bloom_Consulting_Country_Brand_Ranking_Tourism_2013.pdf
7
Marketing Strategies for Tourism Destinations. Target market: BRAZIL
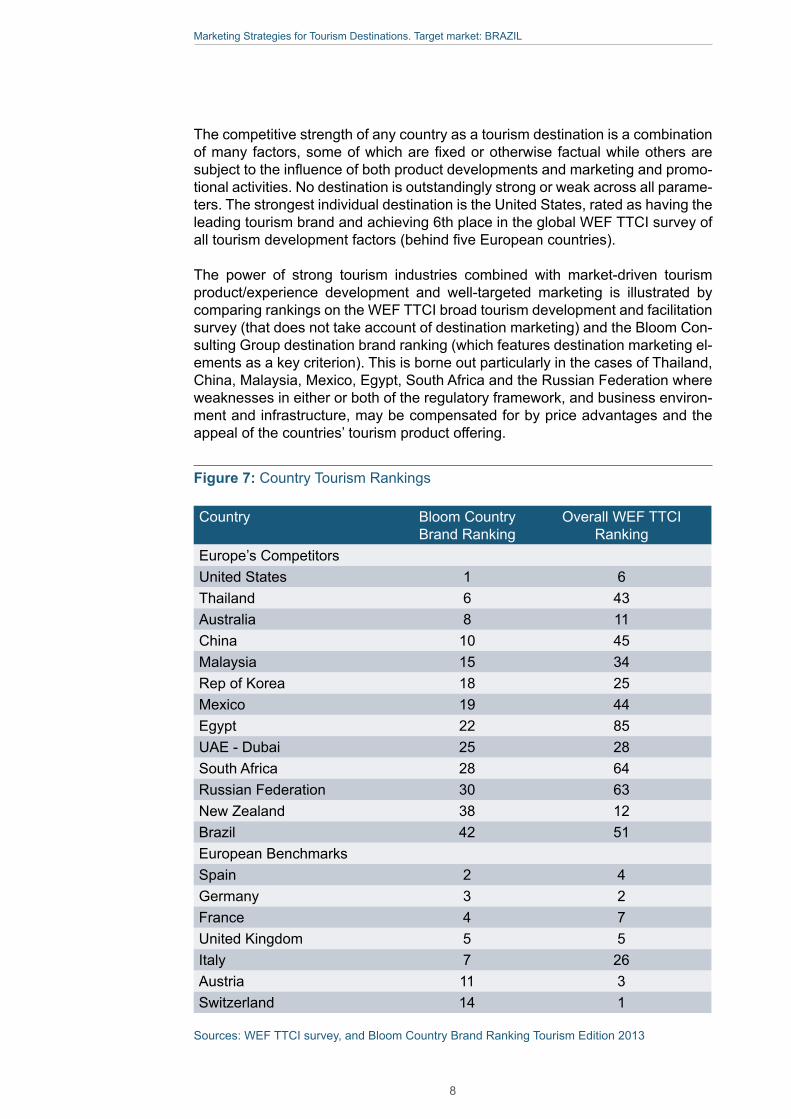
The competitive strength of any country as a tourism destination is a combination of many factors, some of which are fixed or otherwise factual while others are subject to the influence of both product developments and marketing and promo-tional activities. No destination is outstandingly strong or weak across all parame-ters. The strongest individual destination is the United States, rated as having the leading tourism brand and achieving 6th place in the global WEF TTCI survey of all tourism development factors (behind five European countries).
The power of strong tourism industries combined with market-driven tourism product/experience development and well-targeted marketing is illustrated by comparing rankings on the WEF TTCI broad tourism development and facilitation survey (that does not take account of destination marketing) and the Bloom Con-sulting Group destination brand ranking (which features destination marketing el-ements as a key criterion). This is borne out particularly in the cases of Thailand, China, Malaysia, Mexico, Egypt, South Africa and the Russian Federation where weaknesses in either or both of the regulatory framework, and business environ-ment and infrastructure, may be compensated for by price advantages and the appeal of the countries’ tourism product offering.
Figure 7: Country Tourism Rankings
Country Bloom Country Brand Ranking
Overall WEF TTCI Ranking
Europe’s CompetitorsUnited States 1 6Thailand 6 43Australia 8 11China 10 45Malaysia 15 34Rep of Korea 18 25Mexico 19 44Egypt 22 85UAE - Dubai 25 28South Africa 28 64Russian Federation 30 63New Zealand 38 12Brazil 42 51European Benchmarks Spain 2 4Germany 3 2France 4 7United Kingdom 5 5Italy 7 26Austria 11 3Switzerland 14 1
Sources: WEF TTCI survey, and Bloom Country Brand Ranking Tourism Edition 2013
8
Marketing Strategies for Tourism Destinations. Target market: BRAZIL
Information Note - Exchange Rates The monetary values quoted in the report are taken from the sources referenced, including amounts stated in the source document in US dollars. In all cases, conversion has been made to Euros. The conversion rates used are the average rates across the year between the local currency (or US dollar where that is the currency stated in the source document) and the Euro for the year of the data. For future forecasts/targets, the rate between the local currency and the Euro as at June 2014 have been used.
9
Marketing Strategies for Tourism Destinations. Target market: BRAZIL
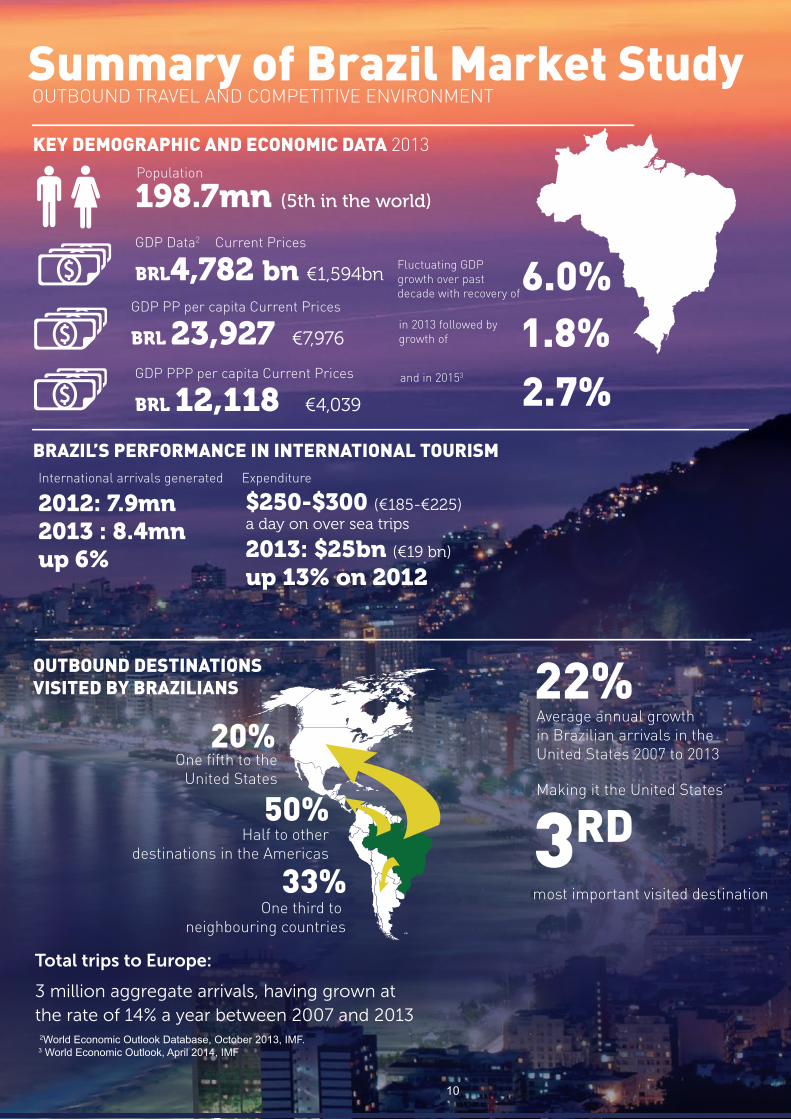
KEY DEMOGRAPHIC AND ECONOMIC DATA 2013
BRAZIL’S PERFORMANCE IN INTERNATIONAL TOURISM
OUTBOUND DESTINATIONS VISITED BY BRAZILIANS
International arrivals generated
2012: 7.9mn2013 : 8.4mnup 6%
Expenditure
Population
198.7mn (5th in the world)
BRL 23,927 €7,976
GDP PP per capita Current Prices
Fluctuating GDP growth over past decade with recovery of
Summary of Brazil Market StudyOUTBOUND TRAVEL AND COMPETITIVE ENVIRONMENT
BRL4,782 bn €1,594bn
GDP Data2
$250-$300 (€185-€225) a day on over sea trips
2013: $25bn (€19 bn)
up 13% on 2012
2World Economic Outlook Database, October 2013, IMF. 3 World Economic Outlook, April 2014, IMF
Total trips to Europe:
3 million aggregate arrivals, having grown at the rate of 14% a year between 2007 and 2013
Current Prices
BRL 12,118 €4,039
GDP PPP per capita Current Prices
in 2013 followed by growth of
and in 20153
6.0%1.8%2.7%
50%
33%
20%One fifth to the
United States
Half to other destinations in the Americas
One third to neighbouring countries
22%Average annual growth in Brazilian arrivals in the United States 2007 to 2013
3RDMaking it the United States’
most important visited destination
10
Marketing Strategies for Tourism Destinations. Target market: BRAZIL
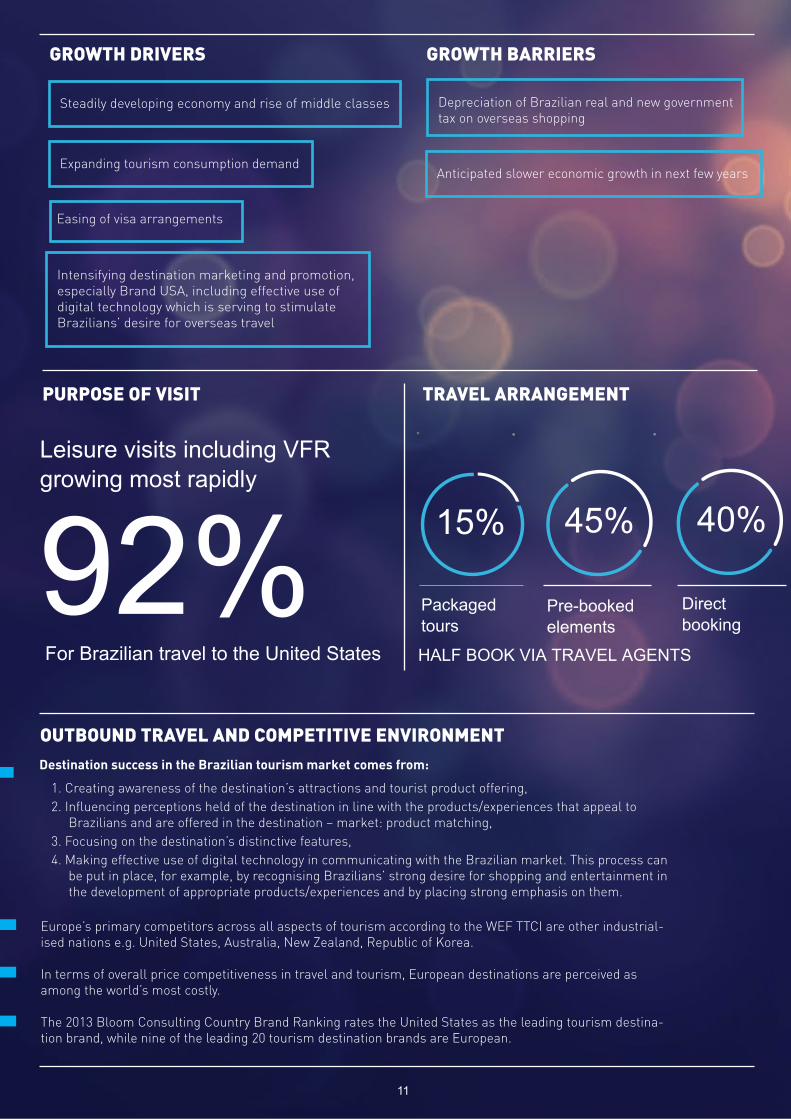
GROWTH DRIVERS
PURPOSE OF VISIT
Steadily developing economy and rise of middle classes
Easing of visa arrangements
Expanding tourism consumption demand Anticipated slower economic growth in next few years
Depreciation of Brazilian real and new government tax on overseas shopping
OUTBOUND TRAVEL AND COMPETITIVE ENVIRONMENT
1. Creating awareness of the destination’s attractions and tourist product offering, 2. Influencing perceptions held of the destination in line with the products/experiences that appeal to
Brazilians and are offered in the destination – market: product matching, 3. Focusing on the destination’s distinctive features, 4. Making effective use of digital technology in communicating with the Brazilian market. This process can
be put in place, for example, by recognising Brazilians’ strong desire for shopping and entertainment in the development of appropriate products/experiences and by placing strong emphasis on them.
Europe’s primary competitors across all aspects of tourism according to the WEF TTCI are other industrial-ised nations e.g. United States, Australia, New Zealand, Republic of Korea.
In terms of overall price competitiveness in travel and tourism, European destinations are perceived as among the world’s most costly.
The 2013 Bloom Consulting Country Brand Ranking rates the United States as the leading tourism destina-tion brand, while nine of the leading 20 tourism destination brands are European.
Intensifying destination marketing and promotion, especially Brand USA, including effective use of digital technology which is serving to stimulate Brazilians’ desire for overseas travel
TRAVEL ARRANGEMENT
Destination success in the Brazilian tourism market comes from:
GROWTH BARRIERS
11
Marketing Strategies for Tourism Destinations. Target market: BRAZIL
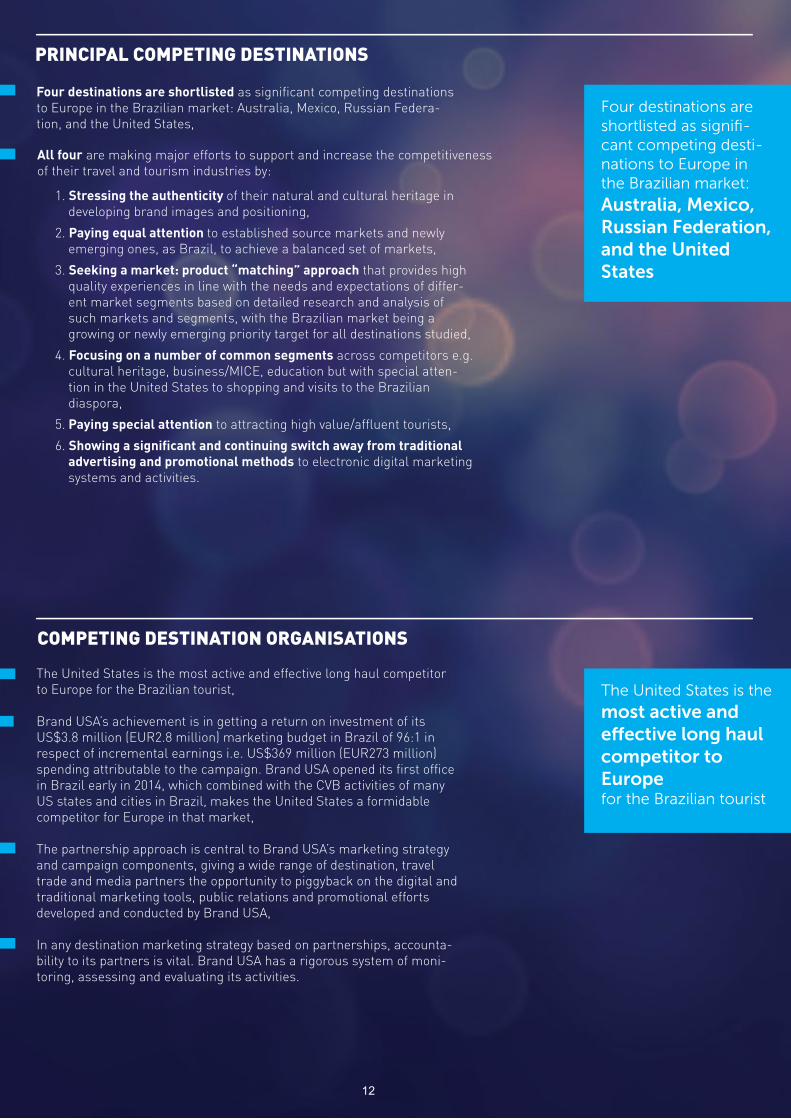
Four destinations are shortlisted as significant competing destinations to Europe in the Brazilian market: Australia, Mexico, Russian Federa-tion, and the United States,
The United States is the most active and effective long haul competitor to Europe for the Brazilian tourist,
Brand USA’s achievement is in getting a return on investment of its US$3.8 million (EUR2.8 million) marketing budget in Brazil of 96:1 in respect of incremental earnings i.e. US$369 million (EUR273 million) spending attributable to the campaign. Brand USA opened its first office in Brazil early in 2014, which combined with the CVB activities of many US states and cities in Brazil, makes the United States a formidable competitor for Europe in that market,
The partnership approach is central to Brand USA’s marketing strategy and campaign components, giving a wide range of destination, travel trade and media partners the opportunity to piggyback on the digital and traditional marketing tools, public relations and promotional efforts developed and conducted by Brand USA,
In any destination marketing strategy based on partnerships, accounta-bility to its partners is vital. Brand USA has a rigorous system of moni-toring, assessing and evaluating its activities.
PRINCIPAL COMPETING DESTINATIONS
COMPETING DESTINATION ORGANISATIONS
Four destinations are shortlisted as signifi-cant competing desti-nations to Europe in the Brazilian market:
Australia, Mexico, Russian Federation, and the UnitedStates
The United States is the
most active and e�ective long haul competitor to Europe for the Brazilian tourist
2World Economic Outlook Database, October 2013, IMF. 3 World Economic Outlook, April 2014, IMF
1. Stressing the authenticity of their natural and cultural heritage in developing brand images and positioning,
2. Paying equal attention to established source markets and newly emerging ones, as Brazil, to achieve a balanced set of markets,
3. Seeking a market: product “matching” approach that provides high quality experiences in line with the needs and expectations of differ-ent market segments based on detailed research and analysis of such markets and segments, with the Brazilian market being a growing or newly emerging priority target for all destinations studied,
4. Focusing on a number of common segments across competitors e.g. cultural heritage, business/MICE, education but with special atten-tion in the United States to shopping and visits to the Brazilian diaspora,
5. Paying special attention to attracting high value/affluent tourists,
6. Showing a significant and continuing switch away from traditional advertising and promotional methods to electronic digital marketing systems and activities.
All four are making major efforts to support and increase the competitiveness of their travel and tourism industries by:
12
Marketing Strategies for Tourism Destinations. Target market: BRAZIL
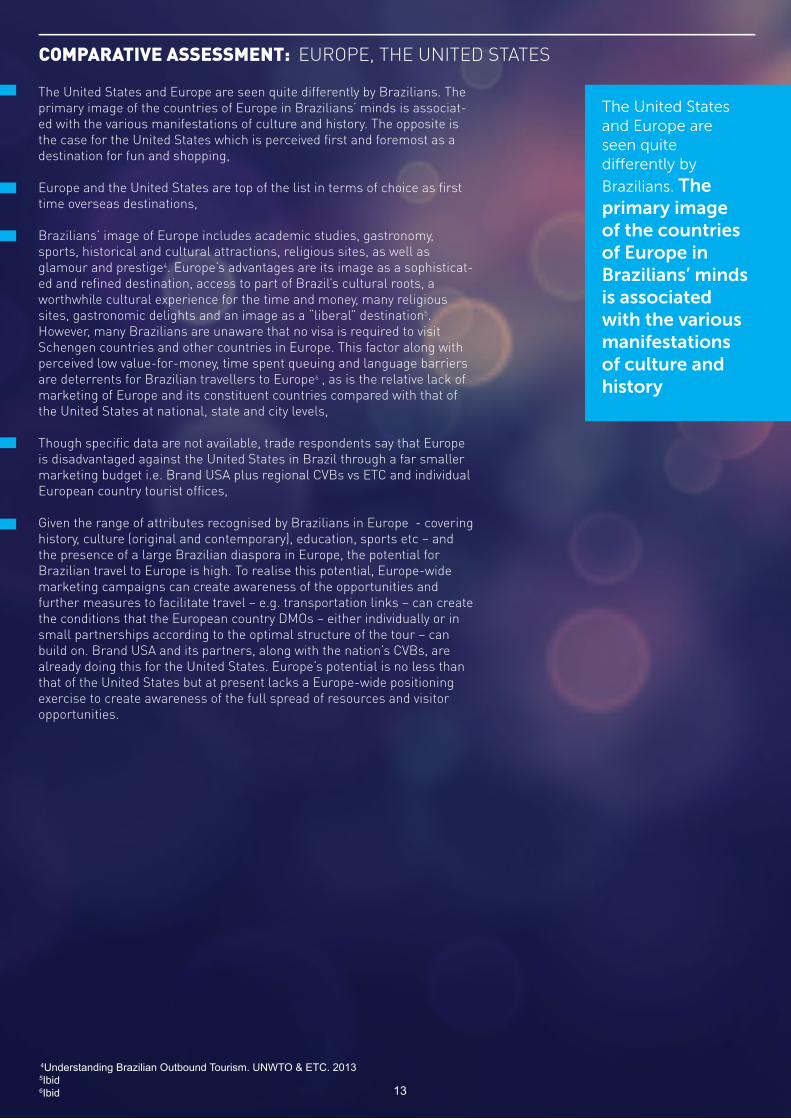
The United States and Europe are seen quite differently by Brazilians. The primary image of the countries of Europe in Brazilians’ minds is associat-ed with the various manifestations of culture and history. The opposite is the case for the United States which is perceived first and foremost as a destination for fun and shopping,
Europe and the United States are top of the list in terms of choice as first time overseas destinations,
Brazilians’ image of Europe includes academic studies, gastronomy, sports, historical and cultural attractions, religious sites, as well as glamour and prestige4. Europe’s advantages are its image as a sophisticat-ed and refined destination, access to part of Brazil’s cultural roots, a worthwhile cultural experience for the time and money, many religious sites, gastronomic delights and an image as a “liberal” destination5. However, many Brazilians are unaware that no visa is required to visit Schengen countries and other countries in Europe. This factor along with perceived low value-for-money, time spent queuing and language barriers are deterrents for Brazilian travellers to Europe6 , as is the relative lack of marketing of Europe and its constituent countries compared with that of the United States at national, state and city levels,
Though specific data are not available, trade respondents say that Europe is disadvantaged against the United States in Brazil through a far smaller marketing budget i.e. Brand USA plus regional CVBs vs ETC and individual European country tourist offices,
Given the range of attributes recognised by Brazilians in Europe - covering history, culture (original and contemporary), education, sports etc – and the presence of a large Brazilian diaspora in Europe, the potential for Brazilian travel to Europe is high. To realise this potential, Europe-wide marketing campaigns can create awareness of the opportunities and further measures to facilitate travel – e.g. transportation links – can create the conditions that the European country DMOs – either individually or in small partnerships according to the optimal structure of the tour – can build on. Brand USA and its partners, along with the nation’s CVBs, are already doing this for the United States. Europe’s potential is no less than that of the United States but at present lacks a Europe-wide positioning exercise to create awareness of the full spread of resources and visitor opportunities.
COMPARATIVE ASSESSMENT: EUROPE, THE UNITED STATES
The United States and Europe are seen quite di erently by
Brazilians. The primary image of the countries of Europe in Brazilians’ minds is associated with the various manifestations of culture and history
4Understanding Brazilian Outbound Tourism. UNWTO & ETC. 2013 5Ibid 6Ibid 13
Marketing Strategies for Tourism Destinations. Target market: BRAZIL
14
Marketing Strategies for Tourism Destinations. Target market: BRAZIL
The Brazilian Outbound Travel Market 1
Outbound travel volume is small but Brazilians remain high spenders
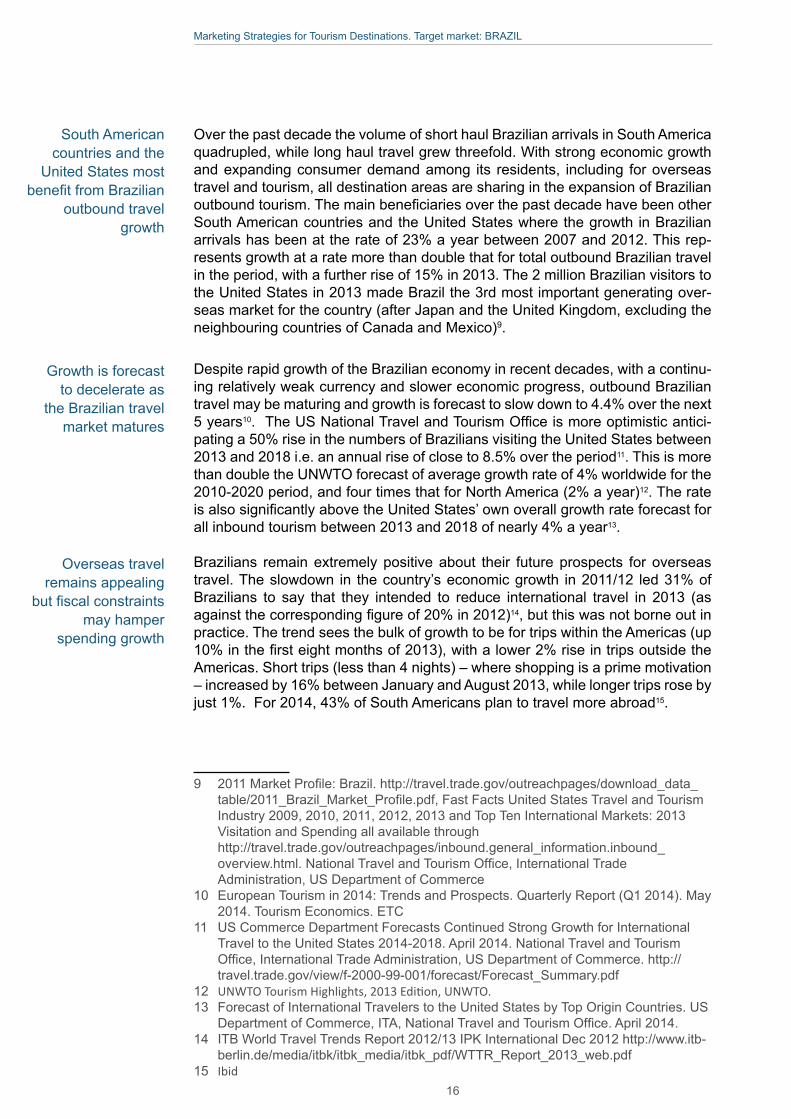
1.1 A High Spending MarketOutbound Brazilian tourism grew 9% in 2012 to reach a level of 7.9 million. Be-tween 2007 and 2012, outbound tourism from Brazil rose by 68% i.e. an average annual rate of growth of 11%, with a 6% rise during the first eight months of 20134 leading to a full year estimate of 8.4 million. The Brazilian Real fell sharply in value – by around one third - against both the United States dollar and the Euro between the peak in 2010/11 and late 2013. Nonetheless, overseas expenditure on travel and tourism continued to expand – by 13% - in 2013, reaching US$25 billion (EUR18.5 billion)5. This was a much sharper increase than the 4% recorded in 2012.
South Americans in general – and Brazilians in particular – are big spenders on international travel, with average spending per trip increasing in 2013 by 4% to EUR1,679, which is equivalent to EUR223 per night on an average 7.5 night trip6.
In volume terms, Brazil outbound travel amounts to between 8 and 9 million trips a year, which is below the level of most industrialised nations and the other fast expanding BRIC markets with their larger population base. In terms of outbound tourism levels, then, Brazil ranks outside the leading source markets but signifi-cantly higher in terms of expenditure. Brazilians are high spenders and entered the top ten by expenditure at tenth place in 2013, displacing Japan7.
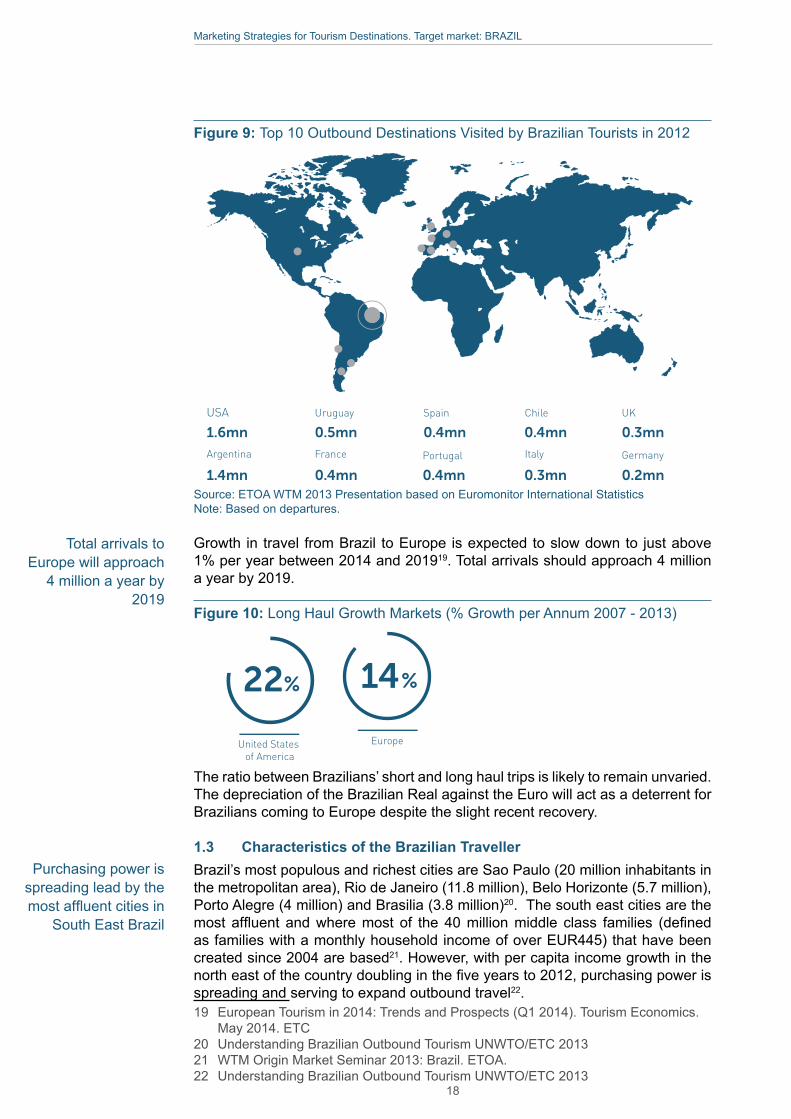
Half of Brazilian outbound travel is to other destinations in the Americas, of which just under one-third goes to neighbouring countries (i.e. Argentina 17% in 2012, Uruguay 6%, Chile 5%, Paraguay 2%). On a country level, the main destination for Brazilians is the United States which accounted for 21% of all Brazilian out-bound trips in 2012. Mexico received 2% of the Brazilian market8.
4 ITB World Travel Trends Report December 2013. March 2014. IPK International http://www.itb-berlin.de/media/itb/itb_media/itb_pdf/WTTR_Report_2014_Web.pdf
5 International tourism generates US$1.4 trillion in export earnings. UNWTO Press Release, May 2014. http://media.unwto.org/press-release/2014-05-13/international-tourism-generates-us-14-trillion-export-earnings
6 ITB World Travel Trends Report 2013/14 IPK International Dec 2013 http://www.itb-berlin.de/media/itb/itb_media/itb_pdf/WTTR_Report_2014_Web.pdf
7 Ibid8 WTM Origin Market Seminar Brazil ETOA www.etoa.org/docs/default-
source/.../2013-wtm-presentation-brazil.pdf?
Half of Brazilian outbound travel is intra-regional
15
Marketing Strategies for Tourism Destinations. Target market: BRAZIL
Growth is forecast to decelerate as
the Brazilian travel market matures
Overseas travel remains appealing
but fiscal constraints may hamper
spending growth
Over the past decade the volume of short haul Brazilian arrivals in South America quadrupled, while long haul travel grew threefold. With strong economic growth and expanding consumer demand among its residents, including for overseas travel and tourism, all destination areas are sharing in the expansion of Brazilian outbound tourism. The main beneficiaries over the past decade have been other South American countries and the United States where the growth in Brazilian arrivals has been at the rate of 23% a year between 2007 and 2012. This rep-resents growth at a rate more than double that for total outbound Brazilian travel in the period, with a further rise of 15% in 2013. The 2 million Brazilian visitors to the United States in 2013 made Brazil the 3rd most important generating over-seas market for the country (after Japan and the United Kingdom, excluding the neighbouring countries of Canada and Mexico)9.
Despite rapid growth of the Brazilian economy in recent decades, with a continu-ing relatively weak currency and slower economic progress, outbound Brazilian travel may be maturing and growth is forecast to slow down to 4.4% over the next 5 years10. The US National Travel and Tourism Office is more optimistic antici-pating a 50% rise in the numbers of Brazilians visiting the United States between 2013 and 2018 i.e. an annual rise of close to 8.5% over the period11. This is more than double the UNWTO forecast of average growth rate of 4% worldwide for the 2010-2020 period, and four times that for North America (2% a year)12. The rate is also significantly above the United States’ own overall growth rate forecast for all inbound tourism between 2013 and 2018 of nearly 4% a year13.
Brazilians remain extremely positive about their future prospects for overseas travel. The slowdown in the country’s economic growth in 2011/12 led 31% of Brazilians to say that they intended to reduce international travel in 2013 (as against the corresponding figure of 20% in 2012)14, but this was not borne out in practice. The trend sees the bulk of growth to be for trips within the Americas (up 10% in the first eight months of 2013), with a lower 2% rise in trips outside the Americas. Short trips (less than 4 nights) – where shopping is a prime motivation – increased by 16% between January and August 2013, while longer trips rose by just 1%. For 2014, 43% of South Americans plan to travel more abroad15.
9 2011 Market Profile: Brazil. http://travel.trade.gov/outreachpages/download_data_table/2011_Brazil_Market_Profile.pdf, Fast Facts United States Travel and Tourism Industry 2009, 2010, 2011, 2012, 2013 and Top Ten International Markets: 2013 Visitation and Spending all available through
http://travel.trade.gov/outreachpages/inbound.general_information.inbound_overview.html. National Travel and Tourism Office, International Trade Administration, US Department of Commerce
10 European Tourism in 2014: Trends and Prospects. Quarterly Report (Q1 2014). May 2014. Tourism Economics. ETC
11 US Commerce Department Forecasts Continued Strong Growth for International Travel to the United States 2014-2018. April 2014. National Travel and Tourism Office, International Trade Administration, US Department of Commerce. http://travel.trade.gov/view/f-2000-99-001/forecast/Forecast_Summary.pdf
12 UNWTO Tourism Highlights, 2013 Edition, UNWTO.13 Forecast of International Travelers to the United States by Top Origin Countries. US
Department of Commerce, ITA, National Travel and Tourism Office. April 2014.14 ITB World Travel Trends Report 2012/13 IPK International Dec 2012 http://www.itb-
berlin.de/media/itbk/itbk_media/itbk_pdf/WTTR_Report_2013_web.pdf 15 Ibid
South American countries and the
United States most benefit from Brazilian
outbound travel growth
16
Marketing Strategies for Tourism Destinations. Target market: BRAZIL
Europe attracts 54% of total Brazilian long-haul arrivals
The significant risk to increased Brazilian outbound travel and spending is the December 2013 introduction of an additional 6% surcharge introduced by the Government of Brazil on credit card and traveller cheque purchases, as well as cash withdrawals made overseas16.
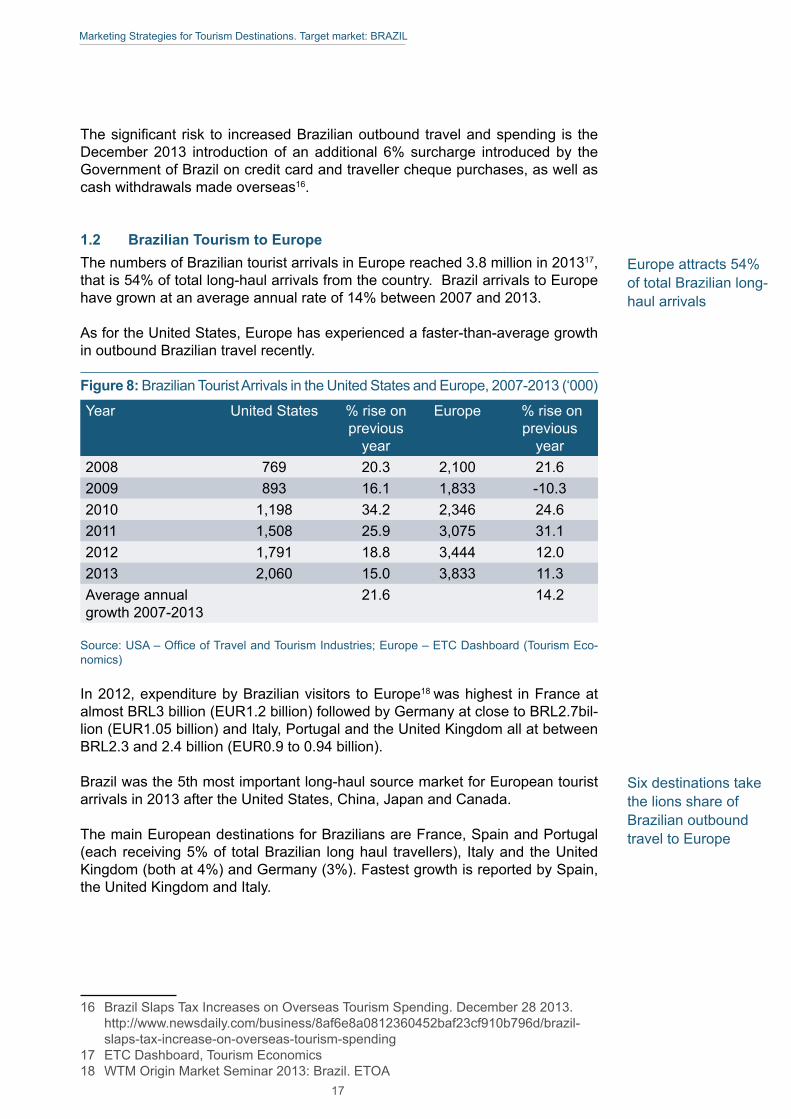
1.2 Brazilian Tourism to EuropeThe numbers of Brazilian tourist arrivals in Europe reached 3.8 million in 201317, that is 54% of total long-haul arrivals from the country. Brazil arrivals to Europe have grown at an average annual rate of 14% between 2007 and 2013.
As for the United States, Europe has experienced a faster-than-average growth in outbound Brazilian travel recently.
Figure 8: Brazilian Tourist Arrivals in the United States and Europe, 2007-2013 (‘000)
Year United States % rise on previous
year
Europe % rise on previous
year2008 769 20.3 2,100 21.62009 893 16.1 1,833 -10.32010 1,198 34.2 2,346 24.62011 1,508 25.9 3,075 31.12012 1,791 18.8 3,444 12.02013 2,060 15.0 3,833 11.3Average annual growth 2007-2013
21.6 14.2
Source: USA – Office of Travel and Tourism Industries; Europe – ETC Dashboard (Tourism Eco-nomics)
In 2012, expenditure by Brazilian visitors to Europe18 was highest in France at almost BRL3 billion (EUR1.2 billion) followed by Germany at close to BRL2.7bil-lion (EUR1.05 billion) and Italy, Portugal and the United Kingdom all at between BRL2.3 and 2.4 billion (EUR0.9 to 0.94 billion).
Brazil was the 5th most important long-haul source market for European tourist arrivals in 2013 after the United States, China, Japan and Canada.
The main European destinations for Brazilians are France, Spain and Portugal (each receiving 5% of total Brazilian long haul travellers), Italy and the United Kingdom (both at 4%) and Germany (3%). Fastest growth is reported by Spain, the United Kingdom and Italy.
16 Brazil Slaps Tax Increases on Overseas Tourism Spending. December 28 2013. http://www.newsdaily.com/business/8af6e8a0812360452baf23cf910b796d/brazil-slaps-tax-increase-on-overseas-tourism-spending
17 ETC Dashboard, Tourism Economics18 WTM Origin Market Seminar 2013: Brazil. ETOA
Six destinations take the lions share of Brazilian outbound travel to Europe
17
Marketing Strategies for Tourism Destinations. Target market: BRAZIL
Total arrivals to Europe will approach
4 million a year by 2019
Purchasing power is spreading lead by the most affluent cities in
South East Brazil
USA
Argentina
1.6mn
1.4mn
0.5mn
0.4mn
0.4mn
UK
Germany
0.4mn
0.4mn
0.3mn
0.3mn
0.2mn
Uruguay
France
Spain
Portugal
Chile
Italy
Source: ETOA WTM 2013 Presentation based on Euromonitor International StatisticsNote: Based on departures.
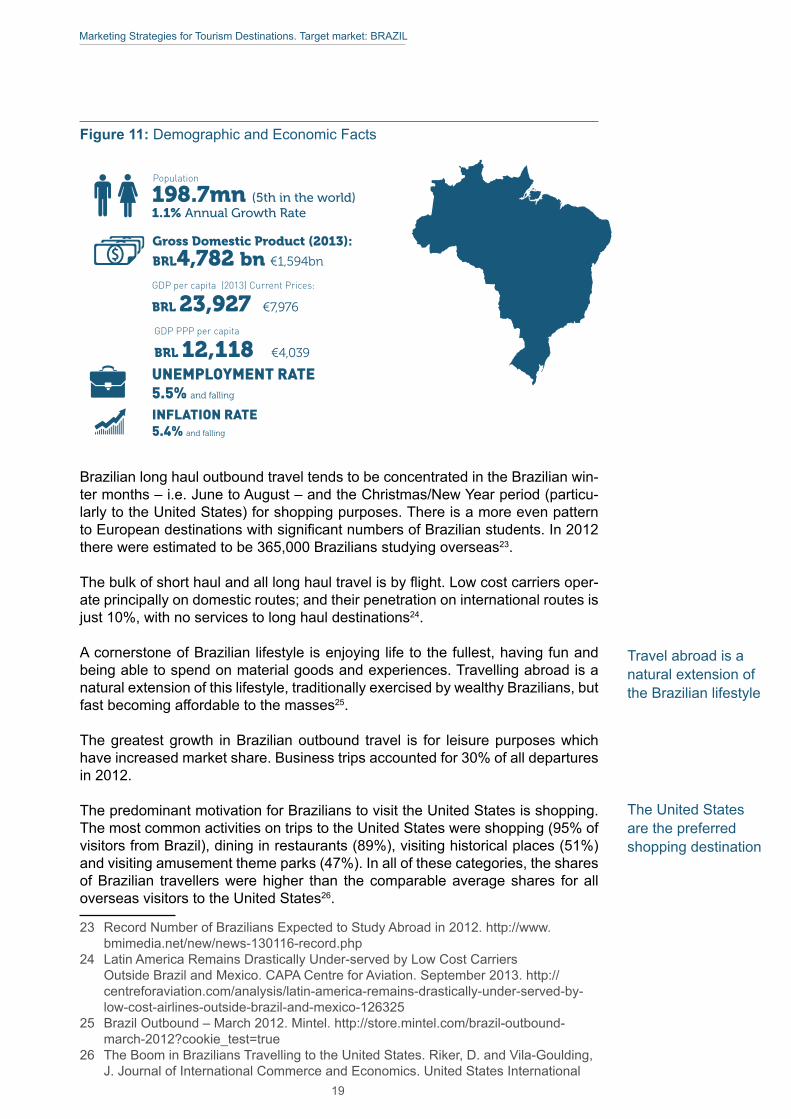
Growth in travel from Brazil to Europe is expected to slow down to just above 1% per year between 2014 and 201919. Total arrivals should approach 4 million a year by 2019.
Figure 10: Long Haul Growth Markets (% Growth per Annum 2007 - 2013)
22
United States of America
14
Europe
The ratio between Brazilians’ short and long haul trips is likely to remain unvaried. The depreciation of the Brazilian Real against the Euro will act as a deterrent for Brazilians coming to Europe despite the slight recent recovery.
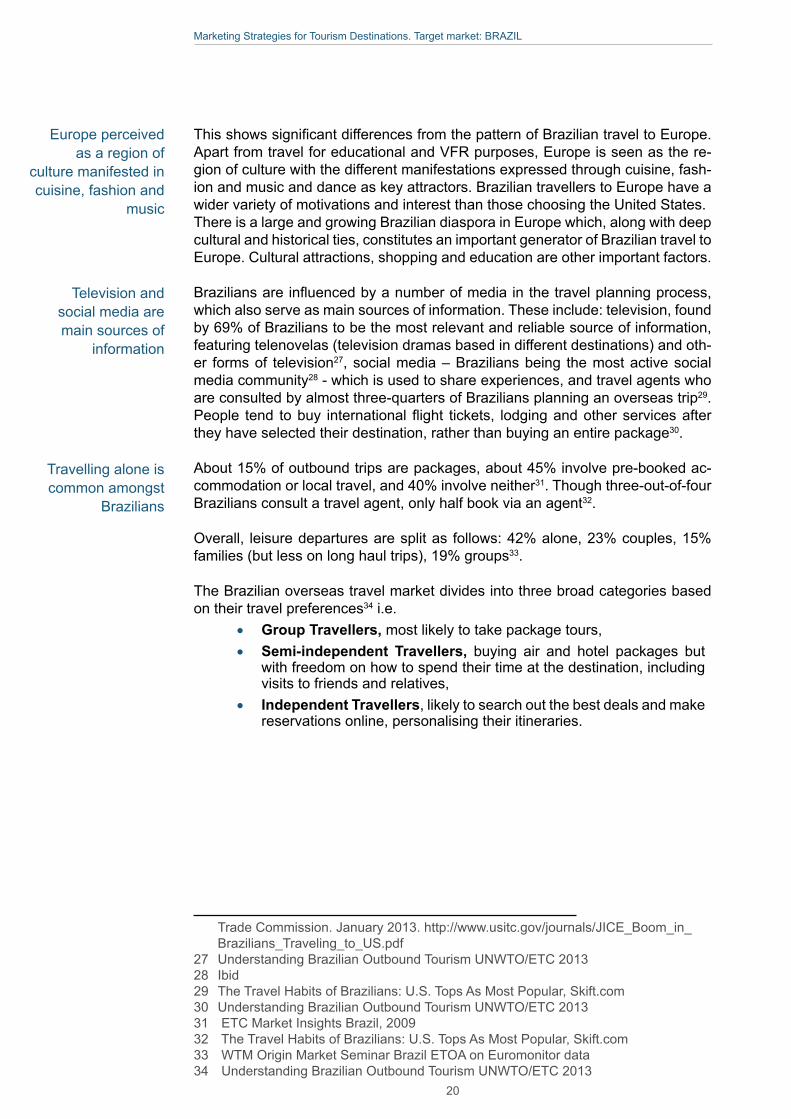
1.3 Characteristics of the Brazilian TravellerBrazil’s most populous and richest cities are Sao Paulo (20 million inhabitants in the metropolitan area), Rio de Janeiro (11.8 million), Belo Horizonte (5.7 million), Porto Alegre (4 million) and Brasilia (3.8 million)20. The south east cities are the most affluent and where most of the 40 million middle class families (defined as families with a monthly household income of over EUR445) that have been created since 2004 are based21. However, with per capita income growth in the north east of the country doubling in the five years to 2012, purchasing power is spreading and serving to expand outbound travel22.19 European Tourism in 2014: Trends and Prospects (Q1 2014). Tourism Economics.
May 2014. ETC20 Understanding Brazilian Outbound Tourism UNWTO/ETC 201321 WTM Origin Market Seminar 2013: Brazil. ETOA.22 Understanding Brazilian Outbound Tourism UNWTO/ETC 2013
Figure 9: Top 10 Outbound Destinations Visited by Brazilian Tourists in 2012
18
Marketing Strategies for Tourism Destinations. Target market: BRAZIL
Figure 11: Demographic and Economic Facts
Brazilian long haul outbound travel tends to be concentrated in the Brazilian win-ter months – i.e. June to August – and the Christmas/New Year period (particu-larly to the United States) for shopping purposes. There is a more even pattern to European destinations with significant numbers of Brazilian students. In 2012 there were estimated to be 365,000 Brazilians studying overseas23.
The bulk of short haul and all long haul travel is by flight. Low cost carriers oper-ate principally on domestic routes; and their penetration on international routes is just 10%, with no services to long haul destinations24.
A cornerstone of Brazilian lifestyle is enjoying life to the fullest, having fun and being able to spend on material goods and experiences. Travelling abroad is a natural extension of this lifestyle, traditionally exercised by wealthy Brazilians, but fast becoming affordable to the masses25.
The greatest growth in Brazilian outbound travel is for leisure purposes which have increased market share. Business trips accounted for 30% of all departures in 2012.
The predominant motivation for Brazilians to visit the United States is shopping. The most common activities on trips to the United States were shopping (95% of visitors from Brazil), dining in restaurants (89%), visiting historical places (51%) and visiting amusement theme parks (47%). In all of these categories, the shares of Brazilian travellers were higher than the comparable average shares for all overseas visitors to the United States26.
23 Record Number of Brazilians Expected to Study Abroad in 2012. http://www.bmimedia.net/new/news-130116-record.php
24 Latin America Remains Drastically Under-served by Low Cost Carriers Outside Brazil and Mexico. CAPA Centre for Aviation. September 2013. http://centreforaviation.com/analysis/latin-america-remains-drastically-under-served-by-low-cost-airlines-outside-brazil-and-mexico-126325
25 Brazil Outbound – March 2012. Mintel. http://store.mintel.com/brazil-outbound-march-2012?cookie_test=true
26 The Boom in Brazilians Travelling to the United States. Riker, D. and Vila-Goulding, J. Journal of International Commerce and Economics. United States International
Travel abroad is a natural extension of the Brazilian lifestyle
The United States are the preferred shopping destination
19
Marketing Strategies for Tourism Destinations. Target market: BRAZIL
This shows significant differences from the pattern of Brazilian travel to Europe. Apart from travel for educational and VFR purposes, Europe is seen as the re-gion of culture with the different manifestations expressed through cuisine, fash-ion and music and dance as key attractors. Brazilian travellers to Europe have a wider variety of motivations and interest than those choosing the United States.There is a large and growing Brazilian diaspora in Europe which, along with deep cultural and historical ties, constitutes an important generator of Brazilian travel to Europe. Cultural attractions, shopping and education are other important factors.
Brazilians are influenced by a number of media in the travel planning process, which also serve as main sources of information. These include: television, found by 69% of Brazilians to be the most relevant and reliable source of information, featuring telenovelas (television dramas based in different destinations) and oth-er forms of television27, social media – Brazilians being the most active social media community28 - which is used to share experiences, and travel agents who are consulted by almost three-quarters of Brazilians planning an overseas trip29. People tend to buy international flight tickets, lodging and other services after they have selected their destination, rather than buying an entire package30.
About 15% of outbound trips are packages, about 45% involve pre-booked ac-commodation or local travel, and 40% involve neither31. Though three-out-of-four Brazilians consult a travel agent, only half book via an agent32.
Overall, leisure departures are split as follows: 42% alone, 23% couples, 15% families (but less on long haul trips), 19% groups33.
The Brazilian overseas travel market divides into three broad categories based on their travel preferences34 i.e.
• Group Travellers, most likely to take package tours,• Semi-independent Travellers, buying air and hotel packages but
with freedom on how to spend their time at the destination, including visits to friends and relatives,
• Independent Travellers, likely to search out the best deals and make reservations online, personalising their itineraries.
Trade Commission. January 2013. http://www.usitc.gov/journals/JICE_Boom_in_Brazilians_Traveling_to_US.pdf
27 Understanding Brazilian Outbound Tourism UNWTO/ETC 201328 Ibid29 The Travel Habits of Brazilians: U.S. Tops As Most Popular, Skift.com30 Understanding Brazilian Outbound Tourism UNWTO/ETC 201331 ETC Market Insights Brazil, 200932 The Travel Habits of Brazilians: U.S. Tops As Most Popular, Skift.com33 WTM Origin Market Seminar Brazil ETOA on Euromonitor data34 Understanding Brazilian Outbound Tourism UNWTO/ETC 2013
Travelling alone is common amongst
Brazilians
Television and social media are main sources of
information
Europe perceived as a region of
culture manifested in cuisine, fashion and
music
20
Marketing Strategies for Tourism Destinations. Target market: BRAZIL
Rapid economic expansion created a growing middle class interested in travelling abroad
In the blogosphere, the discussion about Europe revolves around a select num-ber of themes and interests that are associated with Europe as a tourist destina-tion:35
• educational programmes,• seeking their roots – through the Brazilian diaspora in Europe esti-
mated at between three quarters of a million and a million,• glamour and prestige – all aspects of traditional and modern culture
i.e. performing arts, plastic arts, historic sites and buildings,• gastronomy,• religious tourism,• sports tourism.
There are three categories of Brazilian outbound traveller, each with their own preferences of things to do36 i.e.
• Status-related Motivations – visit as many places as possible, pho-tos posted online, exclusive artifacts purchased,
• Experience-centered Motivations – specific types of experience including relaxation, religious tourism, knowledge acquisition, gastro-nomic interests, sports, cultural origins and historical roots,
• People-centered Motivations – social connections, visits to friends and relations, seek historical roots.
1.4 Drivers of GrowthBrazil is the seventh largest economy in the world and the largest in Latin Amer-ica. In recent years, the country has been one of the fastest-growing economies in the world primarily due to its export potential. The country’s trade is driven by its extensive natural resources and diverse agricultural and manufacturing production. Also, rising domestic demand, and an increasingly skilled workforce along with scientific and technological development, have attracted foreign direct investment. The rapid expansion of the Brazilian economy has created an expanding middle class with both the resources (i.e. growth in household incomes and relatively easy access to credit) for, and interest in, foreign travel. With a growing dispos-able income but a tax system that puts high levies on imported products, many Brazilian consumers also like to travel for shopping. Currently, the United States is the high-end shopping destination of choice for Brazilian consumers37.
The Brazilian outbound travel market is maturing with outbound travel becoming accessible to more than the affluent and the Brazilian middle class expanding – with over 40 million additions since 200338. As a consequence, there is occurring growing diversification and segmentation.
35 Ibid36 Ibid37 Understanding Brazilian Outbound Tourism UNWTO/ETC 201338 WTM Origin Market Seminar Brazil ETOA on IMF data
Exploring European origins is a popular theme in the Brazilian blogosphere
21
Marketing Strategies for Tourism Destinations. Target market: BRAZIL
Though shopping is also an important element in Brazilians’ travel to Europe, the historical ties, the cultural heritage of the countries, and sports sites, theme parks and gambling are also strong draws39. Brazilian travel to Europe is affected by a large and growing diaspora, so it is common for Brazilian travellers to visit relatives and friends and to seek their roots on the Old Continent.
Key for destination marketers in Brazil is use of electronic media to supplement and complement traditional media in influencing prospective travel decisions. While the majority of Brazilians consult with a travel agent in considering their travel choice – 82% in the case of trips to Canada40 - and half book through agents, the main influences on trip planning are television travel shows, websites, magazine articles and travel advertising. Television remains the prime source of information and entertainment in the country41.
There are 70 million Brazilian internet users, and over 90% of long haul travellers use Facebook and other social networking sites, looking for special offers and sharing thoughts and opinions about travel destinations42. An example is travel to Canada43 where over a quarter of Brazilian travellers to the country recall having seen or heard about the destination through friends and family via social network.
1.5 Successful Destination StrategiesDestinations are intensifying their efforts to attract Brazilian tourists.
There are two key challenges for destinations:1. To ensure Brazilians are aware of the destination and its attractions
and tourism product offering, 2. To influence the perceptions held of the destination in line with the
products/experiences that appeal to Brazilians and which the desti-nation can provide.
This then provides destinations with the opportunity to clearly identify the aspects that resonate most with Brazilians and to focus on realising the potential in these segments.
For the leading long haul destination – the United States – the principal attrac-tions for Brazilians are shopping and entertainment experiences. Europe has a much broader range of prospective draws, but the variety of this offer is frequent-ly unknown to Brazilians.
Creating awareness of the range of tourist experiences across European coun-tries is the overriding need. Findings from the Brazilian blogosphere indicate that destinations in Europe can distinguish themselves in the eyes of the Brazilian traveller in three ways by focusing on either:
• culture and history,• shopping and recreation, • sports sites, theme parks and gambling.
39 ibid40 Ibid41 Ibid42 Ibid43 Ibid
Europe has a broad range of prospective draws for Brazilians
Digital technology is essential to
complement traditional media
22
Marketing Strategies for Tourism Destinations. Target market: BRAZIL
While these provide a framework for European destinations to position them-selves for Brazilians, local cuisine, nightlife, natural and religious sites should be considered in the approach as important parameters of the travel experience but will not set the destination apart from competitors44.
Removing barriers or mitigating negative aspects of travel to, and around, the destination is fundamental to the satisfaction of the visitor. Visa procedures and linguistic issues are barriers that any successful destination needs to address through respectively simplified systems and personnel able to communicate in the language of the tourist. Europe has a comparative advantage over the United States in respect of visitor entry requirements.
Key conclusions for Europe – as for any destination – are:1. Get the basics right and avoid frustrations, 2. Focus on distinct features of the destination45.
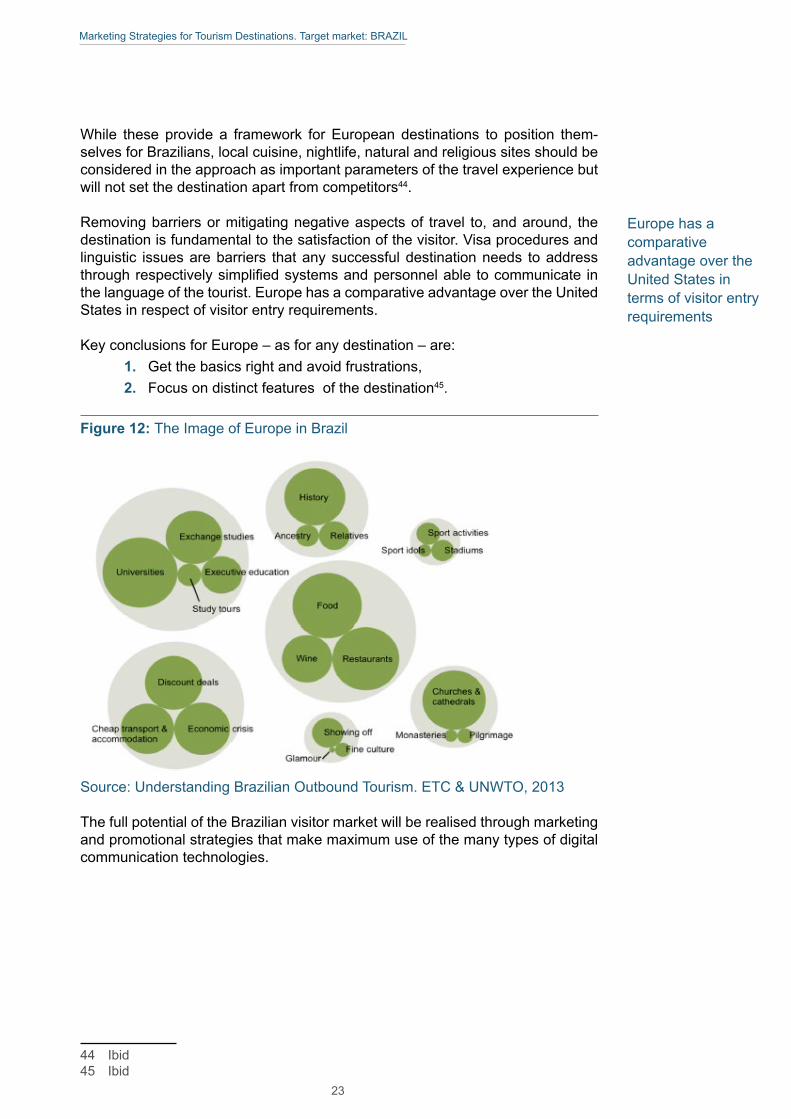
Figure 12: The Image of Europe in Brazil
Source: Understanding Brazilian Outbound Tourism. ETC & UNWTO, 2013
The full potential of the Brazilian visitor market will be realised through marketing and promotional strategies that make maximum use of the many types of digital communication technologies.
44 Ibid45 Ibid
Europe has a comparative advantage over the United States in terms of visitor entry requirements
23
Marketing Strategies for Tourism Destinations. Target market: BRAZIL
Based on the investigations and research conducted into recent trends in Bra-zilian visitor flows and the comparative assessment that introduces this report, a short list of four destinations was selected for further examination in respect of the Brazilian markets. The four – in alphabetical order – are:
1. Australia,2. Mexico,3. Russian Federation,4. United States.
The remainder of this chapter illustrates the positioning of these countries in the Brazilian market as compared to Europe. The positioning is assessed on factors that facilitate tourism flows, such as visa regimes, transport routes, and the polit-ical, socio-economic and cultural links between Brazil and each destination.
This section is enriched by an analysis of TripAdvisor ratings on accommodation, attractions and eateries, presented in Appendix 3. While not representative of Brazilian travellers, TripAdvisor ratings are used as a proxy for consumers’ ap-preciation of key aspects of a holiday experience across competing destinations.
2.1 Visa RegimesThe detailed comparison of visitor entry requirements for the selected 13 destina-tions competing with Europe considered three elements:
1. Whether the destination imposes a visa requirement for entry to the country,
2. The documentation and other details demanded for issuance of a visa,
3. A qualitative assessment of the “hassle” factor involved in obtaining the visa.
Among the four countries selected as prime competitors to Europe in the Bra-zilian market, Brazilian travellers require visa for entry to the United States and Australia whereas there is no such requirement for travel to Mexico, the Russian Federation or ETC member countries.
The United States’ visa process is a major barrier for growth compared to com-petitor destinations. Brazilians have to obtain visas in advance of arrival in what is considered a complex process, though recent steps have sought to ease the complexity and speed up the process for Brazilians obtaining their entry visas to the United States. This streamlining of the United States visa process, through the expansion of processing facilities, and increased consular staffing, is one of the factors behind the strong growth of tourism flows from Brazil to the United States.
Travel Destinations in the Brazilian Market2
24
Marketing Strategies for Tourism Destinations. Target market: BRAZIL
Australia also imposes visa entry requirement for Brazilians in advance of travel though application can be made online and no interview is required under normal circumstances.
Mexico and Russia do not impose a visa requirement on Brazilians unless stay-ing for over 90 days (in the case of Russia) or 180 days (for Mexico).
Since 2010, Russian and Brazilian tourists are not required to have visas for en-try, exit, transit or stay in the territory of each other’s state for up to 90 days within each 180-day period from the first entry.
In 2013, the governments of Mexico and Brazil agreed to the exemption of the short-stay visas in ordinary passports for their citizens, a move designed to in-crease the flow of travellers between the two nations. The visa requirement for Brazilians had been in force since 2005, and from May 2010 Mexico permit-ted entry to Brazilian citizens with a United States visa; moreover, the Migration Documentation Information System (SIDOMI) and the System of Electronic Au-thorisation (SAE) allowed Brazilian tourists and businessmen to obtain electronic visas.
By contrast Brazilians do not require visas when travelling to European countries. European Union countries grant visa free access through the Schengen agree-ment while other ETC members and non-ETC member European countries have followed suit and grant visa free entry to Brazilians. There are no particular medical requirements in the form of certificates or other aspects imposed on Brazilian tourists by any of the four destinations.
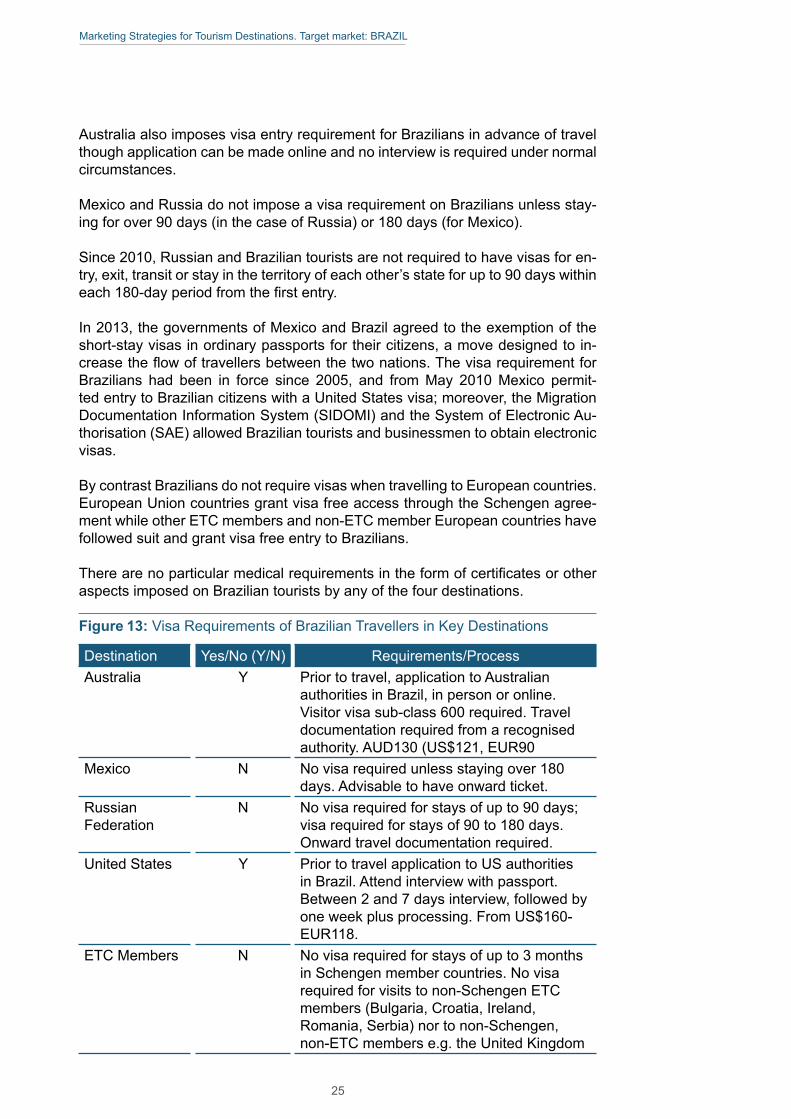
Figure 13: Visa Requirements of Brazilian Travellers in Key Destinations
Destination Yes/No (Y/N) Requirements/ProcessAustralia Y Prior to travel, application to Australian
authorities in Brazil, in person or online. Visitor visa sub-class 600 required. Travel documentation required from a recognised authority. AUD130 (US$121, EUR90
Mexico N No visa required unless staying over 180 days. Advisable to have onward ticket.
Russian Federation
N No visa required for stays of up to 90 days; visa required for stays of 90 to 180 days. Onward travel documentation required.
United States Y Prior to travel application to US authorities in Brazil. Attend interview with passport. Between 2 and 7 days interview, followed by one week plus processing. From US$160- EUR118.
ETC Members N No visa required for stays of up to 3 months in Schengen member countries. No visa required for visits to non-Schengen ETC members (Bulgaria, Croatia, Ireland, Romania, Serbia) nor to non-Schengen, non-ETC members e.g. the United Kingdom
25
Marketing Strategies for Tourism Destinations. Target market: BRAZIL
Frequent direct flights to US cities
Capacity to European gateways
may be improved
2.2 Air ConnectionsThe scheduled air capacity from Brazil’s two principal international air gateways to both shortlisted competing destinations and major European cities was mon-itored on ETC’s behalf by Amadeus. Two points in the year were examined – week 24 in 2013 (broadly corresponding to high season) and week 6 in 2014 (low season), though this can only be taken as an approximate measure given the difference in northern and southern hemisphere climates at the different times of the year. Data for two years were considered in order to provide an indication of the trend in capacity on the various routes i.e. June 2008/June 2013, and Febru-ary 2009/February 2014.
Of the observed destinations, those with the greatest frequencies of direct flights and capacities are the United States cities of Miami and New York. The aggre-gate direct flight seat capacity from the two main Brazilian airports of Sao Paulo and Rio de Janeiro to these United States cities ranges between 29,500 (June 2013) and 31,700 (February 2014), having grown over the five year period ex-amined by between 39% (February) and 48% (June). The west coast city of Los Angeles has no direct air service from Rio de Janeiro but is served through air capacity from Sao Paulo by between 900 and 2,700 seats depending on the time of the year. These levels rose by 11% between June 2008 and June 2013, and over threefold between February 2009 and the same month in 2014, as a new American Airlines flight started operations in November 2013.
The leading European destinations are Paris, Madrid, Lisbon and London. Direct seat capacity to Paris from the two Brazilian airports was 11,300 on June 2013, and slightly higher at 11,600 on February 2014, but while the February-February capacity remained the same between 2009 and 2014, the June–June seats fell by over 20% between 2008 and 2013. Direct service seat capacity to Madrid ranges between 8,000 (June 2013) and 8,800 (February 2014). There was a small decline in the numbers of direct seats available. For Lisbon, aggregate direct seat capacity from the two Brazilian airports ranges between 5,500 and 6,000 depending on time of year and has shown little change over the five-year period. For London, direct seat capacity from Brazil has increased – from 4,200 in June 2008 when no direct flights were operated between Rio de Janeiro and London - to 7,400 in June 2013; and from 5,900 to 7,000 between February 2009 and 2014, rises of 76% and 18% respectively.
Direct air seat capacity from Sao Paulo to Mexico City totaled 3,500 in June 2013 and 3,800 in February 2014, up by 75% and 25% respectively over the corre-sponding months in 2008 and 2009. There are no direct air services between Rio de Janeiro and Mexico City.
There are no direct air services between the two main Brazilian airports and the principal airports in Australia (i.e. Sydney, Perth) or to the Russian Federation.
The average travel time for the best 10 connecting services between Brazil and Australia involves a journey time of 24 hours, while for Moscow the flight time is between 16 and 17 hours. This contrasts with the average direct flight times to the east coast United States cities and Mexico City of between 8.5 and 10 hours, and to European destinations of between 10 and 11.5 hours.
26
Marketing Strategies for Tourism Destinations. Target market: BRAZIL
Competitive destinations expanded capacities more significantly than European cities
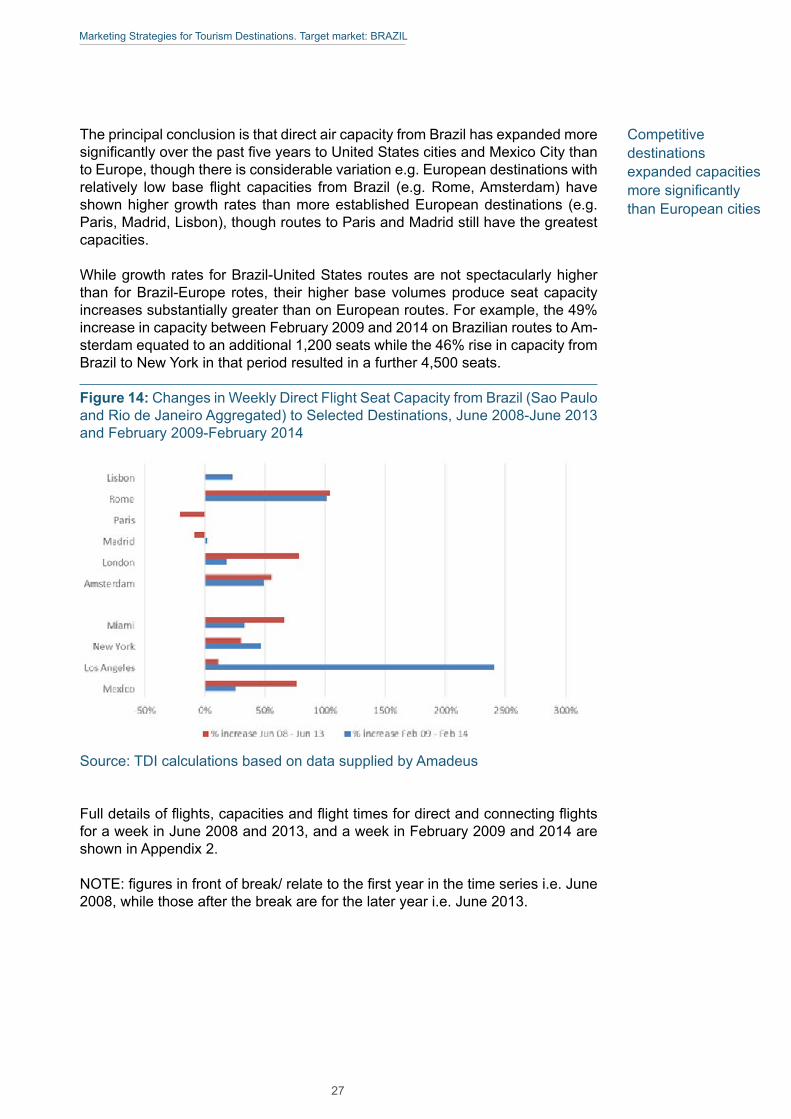
The principal conclusion is that direct air capacity from Brazil has expanded more significantly over the past five years to United States cities and Mexico City than to Europe, though there is considerable variation e.g. European destinations with relatively low base flight capacities from Brazil (e.g. Rome, Amsterdam) have shown higher growth rates than more established European destinations (e.g. Paris, Madrid, Lisbon), though routes to Paris and Madrid still have the greatest capacities.
While growth rates for Brazil-United States routes are not spectacularly higher than for Brazil-Europe rotes, their higher base volumes produce seat capacity increases substantially greater than on European routes. For example, the 49% increase in capacity between February 2009 and 2014 on Brazilian routes to Am-sterdam equated to an additional 1,200 seats while the 46% rise in capacity from Brazil to New York in that period resulted in a further 4,500 seats. Figure 14: Changes in Weekly Direct Flight Seat Capacity from Brazil (Sao Paulo and Rio de Janeiro Aggregated) to Selected Destinations, June 2008-June 2013 and February 2009-February 2014
Source: TDI calculations based on data supplied by Amadeus
Full details of flights, capacities and flight times for direct and connecting flights for a week in June 2008 and 2013, and a week in February 2009 and 2014 are shown in Appendix 2.
NOTE: figures in front of break/ relate to the first year in the time series i.e. June 2008, while those after the break are for the later year i.e. June 2013.
27
Marketing Strategies for Tourism Destinations. Target market: BRAZIL
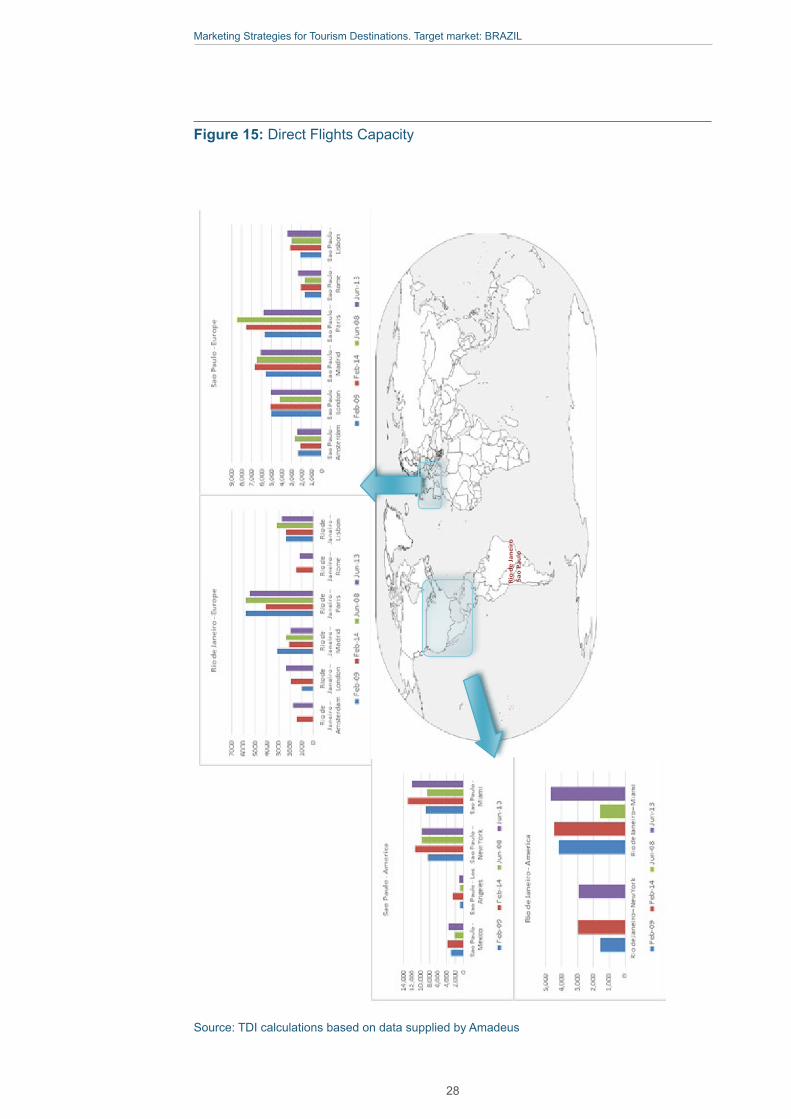
Figure 15: Direct Flights Capacity
Source: TDI calculations based on data supplied by Amadeus
Tourism Strategy of Europ
e’s Main Co
mpe
titors– Brazil R
eport
32
Fig
ure
12
- D
ire
ct
Flig
hts
Ca
pa
city
So
urc
e:
TDI c
alc
ula
tio
ns
ba
sed
on
da
ta s
up
plie
d b
y A
ma
de
us
Rio de Jane
iro
Sao
Pau
lo
28
Marketing Strategies for Tourism Destinations. Target market: BRAZIL
Relationship between Brazil and Australia has grown closer in recent years
Brazil and Mexico do not have an extensive history of bilateral socio-cultural links
2.3 Political, Economic and Socio-Cultural LinksWith the rapid growth of the Brazilian economy in recent decades, the large pop-ulation base – just under 200 million – with a rapidly expanding middle class, and the presence of a large diaspora around the world, Brazilians’ desire and ability to engage in foreign travel is being encouraged and facilitated by many destinations. Travel for family, education and business purposes is an important supplement and complement to leisure purposes travel.
Australia and Brazil entered into a Strategic Partnership in 2012 “with a view to giving expression to the deepening ties and growing shared role of the two countries in the world”46. It encompasses political, social and economic relations, in areas such as trade, investment, energy, agriculture, science and technology, education, judicial affairs, sports and culture.
Brazil is Australia’s largest trading partner in South America, with two-way mer-chandise trade between Australia and Brazil totalling AUD1.628 billion in 2012 (EUR1.28 billion), of which imports from Brazil amounted to AUD638 million (EUR502 million), mainly comprised of civil engineering equipment and parts, medicaments, coffee and fruit juices.
According to the 2011 Census, over 14,500 Australians were born in Brazil while more than 12,000 claimed Brazilian ancestry47. There have been two waves of immigration, one in the 1970s and the other starting in the 1990s and continuing to the present day.
Though tourist flows between Australia and Brazil are relatively small at present – just 34,200 Brazilians visiting Australia in 2013 – and will not increase substan-tively without direct scheduled air services, both countries are determined to step up their promotion and facilitation of travel between their nations. Australia is seen very positively by Brazilians. Global Tourism Watch 2012 found that 73% of Brazilians who had visited Australia would recommend it for a holiday – NB this is a net score subtracting detractors from promoters – the highest rating across all long haul destinations48
Mexico and Brazil represent more than half of the population, territory and eco-nomic development in Latin America and, as such, are considered as regional powers by analysts. Relations between the two countries remain good. In the economic area, both are members of the Latin American Integration Association (ALADI), the G8+5 (Brazil and Mexico being two of the 5 leading emerging econ-omies added to the eight major industrialised nations), and the G-20 group of Finance Ministers and Central Bank Governors.
46 Brazil-Australia Strategic Partnership, July 2012. http://www.brazil.embassy.gov.au/bras/StrategicPartnershipStrategicPartnership.html
47 Australian Government - Department of Immigration and Border Protection.48 Brazil Market Profile, January 2013. Canadian Tourism Commission. http://en-
corporate.canada.travel/sites/default/files/pdf/Research/Market-knowledge/Market-profile/Brazil/br_market_profile_2013_jan-2013.pdf
29
Marketing Strategies for Tourism Destinations. Target market: BRAZIL
Brazil-Mexico trade is relatively small, at US$8 billion (EUR6 billion) in goods and services annually. That compares to United States trade of US$500 billion (EUR370 billion) with Mexico and US$50 billion (EUR37 billion) with Brazil. The 2010 agreement at presidential level for a special economic pact stalled, in part because Mexican businesses were uneasy about encouraging competition from Brazil’s booming economy, and because of Brazilian concerns about the high level of Mexican car imports – US$2.4 billion (EUR1.8 billion) in 2011 – resulting in a quota being imposed on the import of Mexican cars into Brazil49.
Brazilian investment in Mexico is relatively small. Brazil‘s Odebrecht (which works in fields including construction, chemicals, and engineering) plans to in-vest US$8.1 billion (EUR6 billion) in Mexico’s infrastructure in the next five years, almost seven times the level of investment of Brazilian companies in Mexico since 199950. Colonised by opposing European nations, Brazil and Mexico do not have a long or extensive history of bilateral socio-cultural links.
Brazil-Russia relations have seen a significant improvement in recent years, demonstrated through the signing of a Strategic Alliance in 2005. Trade between the two countries is presently valued at close to US$6 billion (EUR4.5 billion), and a goal was set at the 6th Russia-Brazil cooperation commission in February 2013 to increase the level to US$10 billion (EUR7.4 billion) over the next three years. Brazil is a major supplier of agricultural products to Russia while Russia is seek-ing to be involved in Brazil’s plans to build new nuclear power stations to meet surging demand for electricity that has overwhelmed its generating capacity.
The two states are cooperating in sectors like aircraft building, metals, chemical and pharmaceutical industries, biotechnologies, and energy, including atomic en-ergy, as well as space.
The two countries signed visa exemption agreements in 2008.
There are few historical or cultural links between the two countries – and only a small number of Brazilians live in Russia. In consequence, Brazilians are not well informed about Russia. In a 2012 Pew Global Attitudes Project survey, 29.5% of Brazilians stated that they viewed Russia favourably as against 57% who saw it unfavourably51.
The United States and Brazil have enjoyed generally close relations for 200 years. The two countries currently cooperate on trade issues, HIV/AIDS efforts, regional concerns, and the international peacekeeping operation in Haiti.
49 Mexico’s next leader wants more trade with Brazil, not less. Reuters. 20 September 2012. http://www.reuters.com/article/2012/09/20/us-mexico-brazil-autos-idUSBRE88J1FD20120920
50 Brazil Institute, Wilson Center. http://brazilportal.wordpress.com/tag/brazil-mexico-relations/
51 Brazil Russia Relations. http://en.wikipedia.org/wiki/Brazil%E2%80%93Russia_relations
Brazil is a major supplier of
agricultural products to Russia
Brazil-Russia relations are
manifested in mutual visa exemption
30
Marketing Strategies for Tourism Destinations. Target market: BRAZIL
Brazil is the world’s seventh largest economy and the United States’ eighth-largest merchandise trading partner. Two way trade in 2012 was a record US$76 billion (EUR58 billion). The United States had a record US$11.6 billion (EUR8.9 billion) trade surplus with Brazil in 2012 representing the sixth highest surplus market for the United States. Brazil’s main imports from the United States are machinery, chemicals, aircraft/spacecraft, and computer and electronic products52..
The United States is Brazil’s second largest export market. The United States is the leading foreign investor in Brazil, with an accumulated foreign direct invest-ment stock in 2012 of US$79 billion (EUR61 billion). Brazilian investment in the United States has grown rapidly. In 2012, Brazil was named one of ten countries for the SelectUSA pilot programme to attract foreign investment to the United States. As the world’s largest biofuels producers, the United States and Brazil have worked together to help make sustainable biofuels a global commodity53.
There is a large Brazilian population in the United States. Of the total Brazilian diaspora of 1.5 million, almost one third – 450,599 – live in the United States. In addition there were a quarter of a million Brazilian Americans recorded in the 2007 American Community Survey. Estimates of the total numbers of people living in the United States with Brazilian heritage range up to over 1 million. The heaviest concentrations are in Florida, New York, other north eastern states and California.
Global Tourism Watch 2012 found that 59% of Brazilians who had visited the United States would recommend it for a holiday (i.e. net score after deducting detractors from promoters), the same level as for Canada but lower than record-ed for the European destinations of France (71%), Italy (70%), and the United Kingdom (63%)54.
The relationship between EU and Brazil is moving towards a strategic one based on shared interests and values, and greater coherence between different areas of cooperation. Three windows of opportunity are identified. In the bilateral sphere, a greater convergence in renewable energies beckons. At the interregional level, a formula needs to be found for a free trade agreement to be signed. In terms of the global agenda, Brazil and the EU can strengthen cooperation in Africa and adopt closer positions on matters of democracy and human rights55.
The EU is Brazil’s first trading partner, accounting for 1% of its total trade and Brazil is the EU’s eight trading partner, accounting for 2% of total EU trade (2012). EU imports from Brazil are dominated by primary products, in particular agricul-tural products (44%) and fuels and mining products (28%); while EU’s exports to Brazil consist mainly of manufactured products, such as machinery, transport equipment and chemicals.
52 US Relations with Brazil. October 2 2013. US Department of State. http://www.sate.gov/r/pa/ei/bgn/35640.htm
53 Ibid54 Brazil Market Profile, January 2013. Canadian Tourism Commission. http://en-
corporate.canada.travel/sites/default/files/pdf/Research/Market-knowledge/Market-profile/Brazil/br_market_profile_2013_jan-2013.pdf
55 Brazil and Europe Towards 2015. FRIDE Policy Brief. Gratius, S. http://www.fride.org/descarga/PB_67_Brazil_Europe_2015_Eng.pdf
The EU is Brazil’s first trading partner and foreign investor
The United States is Brazil’s second largest export market
One third of the total Brazilian diaspora live in the United States
31
Marketing Strategies for Tourism Destinations. Target market: BRAZIL
The EU is the biggest foreign investor in Brazil with investments in many sectors of the Brazilian economy. Around 50% of the FDI flows received by Brazil during the last 5 years originated in the EU56.
Brazil retains strong ties with Portugal, of which it was a colony, and there are close cultural links between the populations of the two countries. They have a common language, share much cultural heritage and are strong trading partners. There are 86,000 Brazilians living in Portugal, though if Brazilian Portuguese are included the figure is nearer 140,000. Other European countries with significant volumes of Brazilian diaspora are Spain, the United Kingdom, Germany, Italy, France, Switzerland, Belgium and the Netherlands which in total account for be-tween half and three quarters of a million57.
2.4 Consumer Assessment (TripAdvisor)This section presents an analysis of ratings provided by TripAdvisor users from Brazil on three elements of a visitor experience: attractions, accommodation and eateries. While not representative of Brazilian visitors’ behaviour, TripAdvisor rat-ings allow for cross-destination comparisons on components of a holiday experi-ence. The analysis covers the four destinations competing with Europe in Brazil (i.e. Australia, Mexico, Russian Federation and the United States), and four Euro-pean destinations used as benchmark in this study (i.e. France, Italy, Spain and United Kingdom). The results for European countries and competing destinations are presented in Appendix 3.
On average, TripAdvisor users from Brazil rate accommodation lower than either attractions or eateries, a finding that is common to all destinations. The highest rating (4.3) was achieved by Portugal and Mexico, followed by Spain and Italy at 4.1. Compared to quality of accommodation in their own country (4.0), Tri-pAdvisor users from Brazil are more satisfied with accommodation in these four destinations, equally satisfied with accommodation services in the United States, the United Kingdom, and the Russian Federation, while quality in France and Australia is slightly less satisfactory (3.9).
Average ratings for all destinations in Europe suggest that TripAdvisor users from Brazil were in general satisfied with accommodation (4.1). These visitors were most satisfied with the location (4.4), cleanliness and quality of sleep (both 4.3), and quality of service (4.2). They tended to be slightly less positive when evalu-ating the quality and value for money of the rented room (4.1).
Brazilian TripAdvisor users rate eateries in the nine destinations (including Portu-gal because of the close cultural links between the two nations) in a close range of 4.2 to just under 4.4 (Portugal). Mexico, and the United States (each at 4.3) score above the average domestic benchmark of 4.23, while Italy, Spain, the United Kingdom, the Russian Federation and France match the average rating of Brazilian eateries. Average ratings for Australia are slightly below the domestic benchmark (4.17).
56 Brazil Trade Picture. http://ec.europa.eu/trade/policy/countries-and-regions/countries/brazil/
57 Brazilian Diaspora. http://en.wikipedia.org/wiki/Brazilian_diaspora
TripAdvisor users from Brazil were
generally satisfied with accommodation
in Europe
Some European countries and Brazil share close cultural
links
32
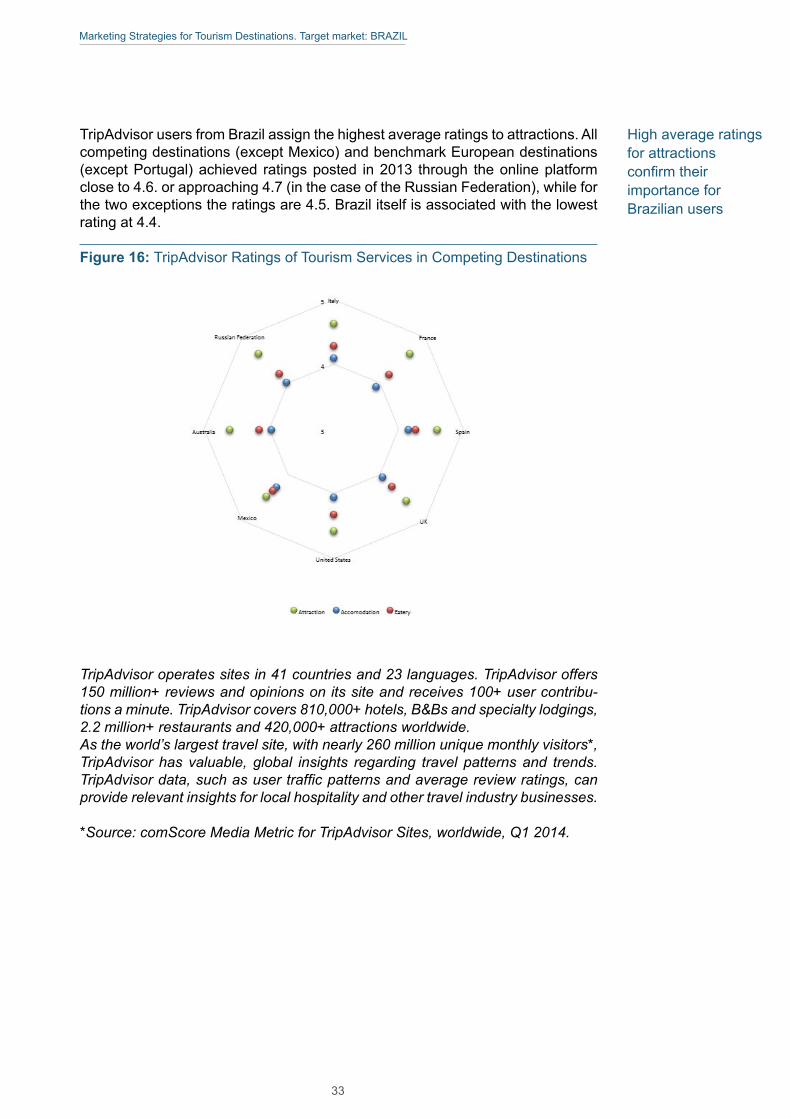
Marketing Strategies for Tourism Destinations. Target market: BRAZIL
TripAdvisor users from Brazil assign the highest average ratings to attractions. All competing destinations (except Mexico) and benchmark European destinations (except Portugal) achieved ratings posted in 2013 through the online platform close to 4.6. or approaching 4.7 (in the case of the Russian Federation), while for the two exceptions the ratings are 4.5. Brazil itself is associated with the lowest rating at 4.4.
Figure 16: TripAdvisor Ratings of Tourism Services in Competing Destinations
TripAdvisor operates sites in 41 countries and 23 languages. TripAdvisor offers 150 million+ reviews and opinions on its site and receives 100+ user contribu-tions a minute. TripAdvisor covers 810,000+ hotels, B&Bs and specialty lodgings, 2.2 million+ restaurants and 420,000+ attractions worldwide.As the world’s largest travel site, with nearly 260 million unique monthly visitors*, TripAdvisor has valuable, global insights regarding travel patterns and trends. TripAdvisor data, such as user traffic patterns and average review ratings, can provide relevant insights for local hospitality and other travel industry businesses.
*Source: comScore Media Metric for TripAdvisor Sites, worldwide, Q1 2014.
High average ratings for attractions confirm their importance for Brazilian users
33
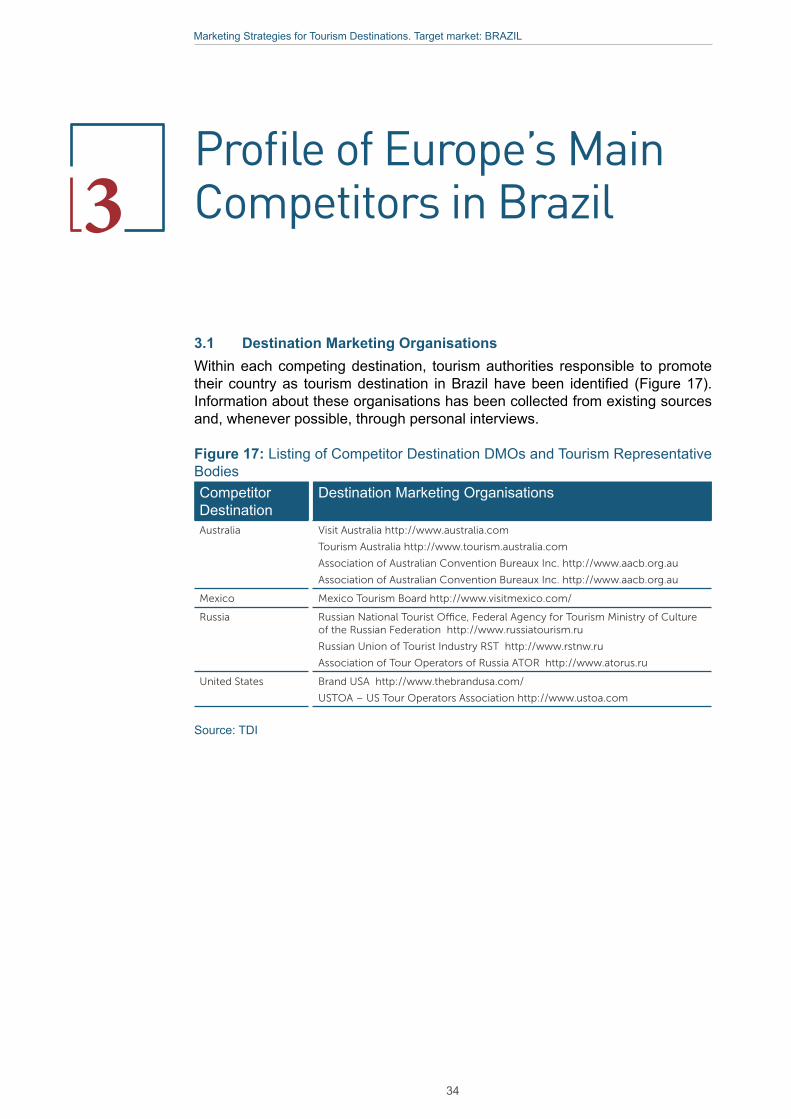
Marketing Strategies for Tourism Destinations. Target market: BRAZIL
3.1 Destination Marketing OrganisationsWithin each competing destination, tourism authorities responsible to promote their country as tourism destination in Brazil have been identified (Figure 17). Information about these organisations has been collected from existing sources and, whenever possible, through personal interviews.
Figure 17: Listing of Competitor Destination DMOs and Tourism Representative BodiesCompetitor Destination
Destination Marketing Organisations
Australia Visit Australia http://www.australia.com
Tourism Australia http://www.tourism.australia.com
Association of Australian Convention Bureaux Inc. http://www.aacb.org.au
Association of Australian Convention Bureaux Inc. http://www.aacb.org.au
Mexico Mexico Tourism Board http://www.visitmexico.com/
Russia Russian National Tourist Office, Federal Agency for Tourism Ministry of Culture of the Russian Federation http://www.russiatourism.ru
Russian Union of Tourist Industry RST http://www.rstnw.ru
Association of Tour Operators of Russia ATOR http://www.atorus.ru
United States Brand USA http://www.thebrandusa.com/
USTOA – US Tour Operators Association http://www.ustoa.com
Source: TDI
Profile of Europe’s Main Competitors in Brazil3
34
Marketing Strategies for Tourism Destinations. Target market: BRAZIL
Australia received 6.5 million international tourist arrivals in 2013, a rise of 5.5% over 2012. Between 2008 and 2013, arrivals grew at the rate of just over 3% a year. Main markets are New Zealand, China, the United Kingdom, the United States and Japan.
Brazil was the 28th ranked market for arrivals in Australia with 34,200 in 2013, 10.3% more than in 2011 following a rise over 2010 of 7%. 34% of Brazilian vis-itation to Australia is for holiday, education 28%, VFR 20% and business 9%58. Australia is the third most popular destination in which to learn English after the United States and the United Kingdom; and there are also growing numbers of Brazilian students attending Australian universities.
Tourism receipts totaled AUD32.9 billion (EUR25.9 billion) in 2012, virtually the same as four years earlier expressed in local currency, but lower than the 2009 peak of AUD34.7 billion (EUR21.7 billion)59. However, because of the apprecia-tion of the Australian dollar against its United States counterpart over the peri-od60, and especially between mid 2008 and mid 2009, the 2012 level was higher in United States dollar and Euro terms than in earlier years.
Though there are over 40 countries around the world that receive more interna-tional tourists than Australia, it is the 10th highest recipient of tourist spending as a consequence of its long distance from generating markets leading to few low spending, cross border and other short duration visits.
Direct tourism GDP for 2012/13 amounted to AUD42.3 billion (EUR31.8 billion), up 3.7% over the previous year, for a 2.8% share of the country’s GDP. Tourism provided employment for 544,000 in 2012/1361.The Tourism 2020, Tourism Aus-tralia’s Journey 2010 to 2013 report concludes that tourism in Australia:
• generates AUD$107 billion (EUR80 billion) in consumption62 ,• provides direct employment for half a million Australians,• represents the country’s leading services export sector,• contributes towards the funding of airports, roads, hotels and other
infrastructure,58 Brazil Market Profile. Tourism Australia. July 2013.59 OECD OECD Tourism Trends and Policies 2014. March 2014. OECD. http://www.
keepeek.com/Digital-Asset-Management/oecd/industry-and-services/oecd-tourism-trends-and-policies-2014_tour-2014-en
60 Yearly Average Currency Exchange Rates. IRS. http://www.irs.gov/Individuals/International-Taxpayers/Yearly-Average-Currency-Exchange-Rates
61 Australian National Accounts: Tourism Satellite Account 2012-13. Australian Bureau of Statistics http://www.abs.gov.au/AusStats/[email protected]/MF/5249.0
62 Tourist Satellite Account, 2011-12, Australia Bureau of Statistics, 2013.
Australia is the third most popular destination to learn English
Australia is the 10th highest recipient of tourist spending
The AustralianTourism Sector
Tourism provides direct employment for half a million Australians
35
Marketing Strategies for Tourism Destinations. Target market: BRAZIL
• assists in the economic development of regional Australia with 45 cents of every dollar being spent outside the major conurbations,
• achieves a high multiplier – 91 cents generated for every tourist dollar.
On 3 October 2013, responsibility for tourism policy, programmes and research transferred from the former Department of Resources, Energy and Tourism to Austrade (the Australian Trade Commission). Australia’s tourism marketing au-thority, Tourism Australia, remains a separate statutory authority with primary re-sponsibility for the international marketing of Australian tourism, reporting to the Minister for Trade and Investment.
Tourism is one of four Australian National Investment Priorities. In recognition of the importance of high quality infrastructure, products and experiences, as a key component of maintaining the country’s competitiveness as a tourism destina-tion, Tourism Australia, the-then Department of Resources Energy and Tourism and Austrade officially commenced a five-year partnership in 2012 to drive in-vestment opportunities in tourism.
The National Long-Term Tourism Strategy, published in 2009, is the overarching Australia tourism industry strategy supported by federal, state and territory Tourism Ministers. The 2020 Tourism Industry Potential, published in 2010, explains what a successful Australian tourism industry will look like in 2020. The Tourism 2020 overview, published in 2011, provides an overview of Australia’s national strategy to enhance growth and competitiveness in the tourism industry.
The aims of Tourism 2020 are to achieve increases in:• overnight tourism spend from AUD70 billion (EUR44 billion) in 2009 to
between AUD115 billion and AUD140 billion (EUR80 to 97 billion) by 2020,
• tourism labour and skills,• accommodation rooms, particularly in capital cities,• international and domestic aviation capacity,• standards in industry quality and productivity.
Key targets for areas in which additional infrastructure investment and/or devel-opment is required are:
• increasing accommodation capacity by between 6,000 and 20,000 rooms,
• increasing international-operated and domestic aviation capacity over 2009 levels by up to 50% and 30% respectively63.
It focuses on 6 strategic areas• grow demand from Asia,• build competitive digital capability,• encourage investment and implement regulatory reform,• ensure tourism transport environment supports growth,• increase supply of labour, skills and indigenous participation,• build industry resilience, productivity and quality.
63 OECD Tourism Trends and Policies 2014. March 2014. OECD. http://www.keepeek.com/Digital-Asset-Management/oecd/industry-and-services/oecd-tourism-trends-and-policies-2014/australia_tour-2014-8-en#page6
Tourism Australia has primary responsibility
for international marketing
A five-year partnership to
drive investment opportunities in
tourism
36
Marketing Strategies for Tourism Destinations. Target market: BRAZIL
Initiatives included the release of a Tourism Investment Guide, a Tourism Invest-ment Monitor and investment opportunities database; identifying and targeting key overseas investors; and establishing close working relationships with tourism specialists in state and territory tourism investment agencies64.
In November 2012 the Australian Government launched the Tourism Major Proj-ect Facilitation service to assist new tourism investment in gaining development approvals. A case manager is appointed to significant new tourism projects to pro-vide support and broker solutions to problems. 24 enquiries have been made to the TMPF scheme, four of which – involving investment of AUD2 billion (EUR1.4 billion) and the creation of 12,000 jobs – are being assisted through Australian Government approvals.
The 2020 Potential for the Business Events Sector, published in 2013, outlines how Australia’s business events sector has the potential to double the overnight expenditure by visitor delegates to between AUD15.8 billion and AUD16.0 billion (i.e. around EUR11 billion) by 2020. Tourism 2020, Tourism Australia’s Journey 2010 to 2013, published in October 2013, provides an update on Tourism Austra-lia’s progress through phase one of the Tourism 2020 strategy about ‘setting the foundation’.
Tourism Australia is an Australian Government statutory authority and the Feder-al Government agency responsible for international and domestic tourism mar-keting, attracting international visitors to Australia and encouraging Australians to travel domestically, both for leisure and business events. Its purpose is to increase the economic benefits to Australia of tourism. To do this it has imple-mented a new strategic approach – Tourism 2020 – aimed at growing overnight tourism expenditure to as much as AUD140 billion (EUR97 billion) by the end of the decade.
As a marketing body, Tourism Australia’s resources are dedicated to facilitating trade marketing opportunities for established businesses that will generate high yielding, sustainable market opportunities. Critical to its global marketing effort is reaching the customers most likely to enjoy what Australia has to offer.
Tourism Australia is highly active in undertaking extensive research into tourist markets, trends and performance with the view to guiding future tourism devel-opment and marketing strategies. It disseminates such information widely to the private sector with which it has a number of partnerships and alliances to create demand for the destination using the current theme of “There’s Nothing Like Aus-tralia”.
Under the Tourism Australia Act (2004) Tourism Australia’s objectives are:• to influence people travelling to Australia to also travel throughout Aus-
tralia,• to influence Australians to travel throughout Australia, including for
events,• to help foster a sustainable tourism industry in Australia, • to help increase the economic benefits to Australia from tourism.
64 Tourism 2020, Tourism Australia’s Journey 2010 to 2013, Tourism Australia, October 2013
Resources are dedicated to facilitating trade marketing opportunities
Tourism Major Project Facilitiation service launched to assist tourism investment
37
Marketing Strategies for Tourism Destinations. Target market: BRAZIL
Its outcome statement for 2013/14 as approved by the Government is to increase demand for Australia as a destination, strengthen the travel distribution system and contribute to the development of a sustainable tourism industry through con-sumer marketing, trade development and research activities.
Tourism Australia’s current slogan is “There’s Nothing Like Australia”.
Tourism Australia receives AUD130 million (EUR90 million) in yearly funding, and total tourism funding in the country (including for Austrade’s Tourism Quality grants and the Tourism Industry Regional Development Fund) is about AUD185 million (EUR129 million). Three quarters of the marketing element of the 2013/14 appropriation for tourism is concentrated on category 1 and 2 markets. Brazil is not included in these priority markets, but is classified as a “fast emerging” mar-ket. The country’s focus is as a destination of leisure, events (including business events) and education.
The Australian Commission of Audit has argued that the benefits of the near two-thirds of Tourism Australia’s budget directed to advertising and other promotional activities accrue to tourism operators and, as such, address market failures with-in the tourism industry. The Commission proposed that marketing Australia as a destination for international tourists should be undertaken at a Commonwealth level rather than on a State-by-State level whereby grant funding for the tourism industry would cease and Tourism Australia’s funding reduced by a half to focus on international marketing, with the function incorporated into a commercial arm of the Department of Foreign Affairs and Trade65. The Government of Australia rejected the National Commission of Audit proposals and has confirmed that the Federal Budget will include AUD$130 million (EUR90 million) in base funding for Tourism Australia and AUD13.5 million (EUR9.4 million) towards the Asia Mar-keting Fund66.
Activities include advertising, Public Relations and media programmes, trade shows and industry programmes, consumer promotions, online communications and consumer research. Tourism Australia operates a 35 language website and uses digital marketing focused on personalising, socialising and mobilising its product offerings, en-abling consumers to share their own stories and experiences. Tourism Austra-lia’s Facebook page exceeded 4.5 million fans worldwide in 2012–13. Tourism Australia launched its customised Youtube channel, youtube.com/Australia, in 16 countries in November 2012, the first for national tourism organisations and the travel industry.
Tourism Australia is active in around 30 key markets including Australia, pro-moting the unique attributes which will entice people to visit and targeting those people who its research indicates will spend more and travel most widely. Tourism Australia’s Key Market Regions are:
• Australia (domestic),• Americas - United States, Canada and Brazil,• Europe - France, Germany, Italy and the United Kingdom,
65 National Commission of Audit Recommendations. http://www.ncoa.gov.au/report/phase-one/recommendations.html
66 Tourism Funding Safe in 2014/15 Budget. http://www.travelweekly.com.au/news/tourism-funding-maintained-in-2014-15-budget
Tourism Australia receives AUD130
million (EUR90 million) in funding
annually
Digital marketing used to personalise
tourism product offerings
38
Marketing Strategies for Tourism Destinations. Target market: BRAZIL
• Greater China - China and Hong Kong,• Japan and the Republic of Korea,• New Zealand,• South and South East Asia - Singapore, Malaysia, India, Indonesia,
Vietnam and Gulf Countries.
Key markets have been categorised by the potential of growth in visitor spend by 2020. Visitor spend, tracked by the International Visitor Survey refers to the amount of AUD spent by travellers in Australia (*denotes countries where Tour-ism Australia also targets Business Events in addition to leisure consumers):
• visitor spend by these markets has the potential to be worth over AUD5 billion (EUR3.4 billion) by 2020: Greater China* (China and Hong Kong), North America* (United States and Canada), United Kingdom*, Australia,
• visitor spend by these markets has the potential to be worth over AUD2.5 billion (EUR1.7 billion) by 2020: New Zealand*, Republic of Korea, Singapore, Malaysia,
• visitor spend by these markets has the potential to be worth over AUD1 billion (EUR0.7 billion) by 2020: Japan*, Indonesia*, India*, Germany, Middle East,
• fast emerging: Brazil, Vietnam,• high priority: Italy, France.
In each key market, Tourism Australia targets specific consumer segments which represent the best prospect for achieving the Tourism 2020 targets. Reaching this customer is at the core of all of Tourism Australia’s consumer, distribution and partnership marketing activities.
• Youth - the youth segment is an important part of Australia’s visitor mix. Youth contribute nearly AUD12 billion (EUR8.3 billion) annually in tourism spending and represent a quarter of all Australia’s internation-al arrivals,
• Experience Seekers are, by definition, looking for unique, involving and personal experiences from their holidays,
• The Cruise Industry - cruising is an important segment in Australia and one that is significant to its tourism industry,
• Aboriginal Tourism,• Luxury Tourism.
To do this they have gained greater insights to better understand what moti-vates their target customers to visit Australia through their Consumer Demand Research project, conducted in 11 key international markets plus Australia.
The research findings showed that potential visitors have high expectations of Australia, and for those considering a repeat visit the destination’s biggest strengths are its world class beauty, safety and welcoming people. These insights will help to further shape and fine tune Tourism Australia’s marketing in order to maintain Australia as a compelling proposition for travellers.
Tourism Australia operates from its headquarters in Sydney and maintains over-seas offices in Canada, China, Hong Kong, India, Japan, Republic of Korea, Ma-laysia, New Zealand, Singapore, the United Kingdom (covering the United King-dom, Ireland and Nordic countries) and the United States. It has representative offices in Brazil, France, Germany (covering Continental Europe) and Italy.
Youth market and experience seekers are key segments
Beauty, safety and welcome are primary motivators for repeat visitors
39
Marketing Strategies for Tourism Destinations. Target market: BRAZIL
International tourist arrivals in Mexico reached 23.7 million in 2013, making it the 15th largest tourist receiving country67. Growth rates have not been strong in recent years – by 1.6% a year since 2007 – as the country has sought to count-er the negative reports of the drug-related gang violence in parts of the country which has depressed visitor flows, particularly from Mexico’s dominant market of the Unites States which accounted for over 20 million arrivals in 2013 (of which over 6 million arrived by air, just under half at Mexico City airport). Mexico was ranked in 128th place on the safety and security factor in the WEF TTCI 2013 survey68.
Receipts from international tourism reached US$13.8 billion (EUR10.6 billion) in 2012, having fallen from the previous peak of US$13.4 billion (EUR9.6 billion) in 2008 before recovering over the past two years – i.e. by 7.3% and 8.5% respec-tively in 2012 and 201369.
Tourism’s ability to generate jobs (both direct and indirect), foreign currency re-ceipts, and economic growth, as well as promoting regional development and productive chains, and contributing to improved living standards, makes it a na-tional priority in Mexico. It contributes 8.4% to Mexico’s GDP, is the fourth largest source of export revenues, and creates 2.5 million direct jobs and about double that number of indirect jobs70.
The Ministry of Tourism is responsible for setting and implementing policy. The Tourism Cabinet (chaired by the President and comprising ministers and sec-toral stakeholders) articulates plans, actions and budgets of federal agencies to achieve the objectives of the National Tourism Policy through working groups in order to optimise the use of public resources for the benefit of tourism. The Gen-eral Tourism Law (2009) establishes the basis for coordination between federal, state and local authorities, and defines the roles and responsibilities of each. The head of the Ministry coordinates actions with the National Trust Fund for Tourism Development (FONATUR) and the Mexico Tourist Board, to promote tourism in-vestment and products in order to increase tourist flows and spending71.
67 UNWTO World Tourism Barometer. Volume 12, April 2014. http://dtxtq4w60xqpw.cloudfront.net/sites/all/files/pdf/unwto_barom14_02_apr_statistical_annex_en_excerpt.pdf
68 WEF TTCI 2013 Report69 UNWTO World Tourism Barometer. Volume 12, April 2014. http://dtxtq4w60xqpw.
cloudfront.net/sites/all/files/pdf/unwto_barom14_02_apr_statistical_annex_en_excerpt.pdf
70 OECD Tourism Trends and Policies 2014. March 2014. OECD. http://www.keepeek.com/Digital-Asset-Management/oecd/industry-and-services/oecd-tourism-trends-and-policies-2014/mexico_tour-2014-28-en#page3
71 Ibid
Mexico’s dominant market is the United
States
Tourism is Mexico’s fourth largest source
of export revenues
Tourism is administered by the Mexican Ministry of
Tourism
The MexicanTourism Sector
40
Marketing Strategies for Tourism Destinations. Target market: BRAZIL
The Ministry’s mission is to make Mexico a world leader in tourism by 2030 through a strategy comprising:
• recognition of tourism as key to economic development,• encouragement of tourism businesses to be competitive both nation-
ally and internationally,• development of tourism that respects the natural, cultural and social
environment,• diversification of tourism products,• development of new markets72.
The National Tourism Policy is based on the four principles of:• planning and sectoral transformation,• innovation and competitiveness,• development and promotion, • sustainability and social benefit.
Among the programmes being implemented are:• Development and Improvement of Infrastructure to Foster and Pro-
mote Investments in the Tourism Sector – aimed at diversifying and improving the competitiveness of the country’s tourism offer through Integrally Planned Centres, to be included in FONATUR’s projects and programmes,
• Generation of Actions for the Development of Products – including cul-ture, gastronomic, meetings, health and nautical, spread all over the country,
• Ecotourism and Rural Tourism – developing, supporting and promot-ing natural, sustainable and competitive products.
Rutas de Mexico - presentation of ten tourist routes covering all 32 states in the country enabling visitors to experience the full range of Mexico’s natural and cul-tural heritage, featuring gastronomy, ecotourism, adventure, extreme sports, folk art, beach destinations, historical and archaeological sites73.
The Mexico Tourism Board (MTB) was established in 1999 to be Mexico’s tour-ism promotion agency, bringing together the resources of federal and state gov-ernments, municipalities and private companies to promote Mexico’s tourism at-tractions and destinations nationally and internationally. Its role is to coordinate, design and develop the national and international strategies for tourism promo-tion for Mexico, as well as promote the numerous destinations and activities in the country.
Its operations are divided into four programmes:• promotion of Mexico as a tourist destination,• tourist orientation and emergency assistance equipment and services
(provided in Mexico),• tourism infrastructure projects,• tourism product development support.
It has a workforce of 186 people spreads across 53 administrative units.
72 Ibid73 Ibid
A fifteen year plan to make Mexico a world leader in tourismThe Mexican
Tourism Sector
The Mexico Tourism Board (MTB) is responsible for promoting Mexico nationally and internationally
41
Marketing Strategies for Tourism Destinations. Target market: BRAZIL
The mission of the MTB is the “promotion, both integrally and competitively, of Mexico, its products and destinations, in domestic and international markets, by means of joint efforts involving all stakeholders in tourism”74. Its vision is to be “a leading organisation in the promotion of tourism, encouraging participation and joint efforts by the various stakeholders in the industry”75. Marketing through part-nership is, thus, central to both the MTB’s mission and vision statements, laying stress on encouraging participation and joint efforts involving all stakeholders in tourism.
The MTB’s strategy has changed recently. In the past, it focused largely on the mass market, with marketing efforts promoting first the Mexico Brand, then Mexi-co plus the destinations. Now “The new stars are the destination. Mexico is sec-ondary.” (Lopez Negrete, CEO, MTB). This is involving working closely with, and obtaining support and guidance from, commercial partners (e.g. supplying much of the marketing information), with tour operators gradually increasing their ap-peal to more affluent travellers willing to pay more for five star resorts and more amenities along with the convenience of a package holiday.
“We want to be seen as a cultural super power to compete with the likes of China, India and Greece in terms of historical interest. This is in addition to our gastrono-my and colonial architecture such as in San Miguel de Allende,” says chief exec-utive Rodolfo Lopez Negrete Coppel, United Kingdom Mexican Tourism Board76.
In order to achieve its mission and vision, a range of strategies have been adopt-ed for the MTB’s strategic and marketing plans, as follows77:
Strategic Plan• Participative: involving industry and commercial partners,• Continuity: ensuring consistency over time,• Professionalism: focused on efficiency and efficacy,• Technological development: intensive use of technology,• Results-based: measurable indicators of visitor satisfaction,• Transparency: published information on strategies, measures and re-
sults.
Marketing Plan• Specialisation: concentration of marketing and promotional activities
on most profitable markets and segments,• Consistency: creating credibility of promotional messages,• Joint efforts: encouragement and coordination of schemes to maxim-
ise the impact of all stakeholders promoting Mexico so as to achieve economies of scale and competitive advantages for everyone involved,
• Favourable image: generate public relations activities that commu-nicate a positive image and compensate for negative perceptions of what Mexico has to offer in tourism,
• Stimulate demand: advertise in target markets, with continuous mes-
74 Mexico Tourism Board Mission and Vision. http://www.cptm.com.mx/mision-y-vision 75 Ibid76 Mexico Tourist Arrivals Nudge Close to 25 Million. TTG Digital http://www.ttgdigital.
com/news/wtm-2013-mexico-tourist-arrivals-nudge-close-to-25-million/4689398.article
77 Ibid
Marketing through partnership is central
to MTB’s vision
Individual destinations and a
reputation for culture are essential in MTB’s strategy
42
Marketing Strategies for Tourism Destinations. Target market: BRAZIL
sages that identify Mexico as a country of many destinations and a range of tourism products that can satisfy a wide variety of consumer tastes,
• Diversified marketing: direct marketing and sales promotion cam-paigns that increase the channels of information and stimulate de-mand for the nation’s tourism products in the target markets.
2013 Budget Allocation for MTB’s 4 Broad Budgetary Programmes as per Prog-ress Report for Approved Indicators for MTB for July-September 2013 were78:
• tourist orientation and assistance equipment and services: MXN260 million (EUR15 million), slightly reduced on the original budget,
• promotion of Mexico as a tourist destination: MXN2,701 million (EUR156 million), modified from MXN687 (EUR40 million) in the orig-inal budget,
• tourism infrastructure projects: MXN207 million (EUR12 million), half the original budget,
• tourism product development support: MXN1,500.0 million (EUR87 million), in line with the original budget.
For 2014, the tourism promotion budget has been set at MXN732 million (EUR42 million)79 but that level may change if the example of the previous year is followed.
MTB runs a full range of marketing and promotional activities including advertis-ing, promotions, attendance at fairs (7 major ones in 2013), separate websites for trade and the public, brochures, familiarisation trips (though none were organised in the second half of 2013), consumer newsletter, social media (including Face-book, Google+, Instagram, Linked in, Pintarest, Twitter and YouTube).
The “Mexico: Live it to believe it” campaign was launched in September 2013. This builds on the highly successful previous campaign - Mexico, the place you thought you knew - which addressed security and safety and had travellers speak-ing to other travellers about shared experiences. The new campaign moves to a different level, addressing research findings that stereotypes exist about Mexico - as a destination, it is sometimes typecast as unsophisticated and not as modern or contemporary as some others - that deter the more affluent travellers now tar-geted. The concept is to generate excitement and present Mexico in a new light.
The campaign seeks to:• showcase Mexico’s diverse cultures, ecosystems, flavours, histories,
innovations and one-of-a-kind destinations, hoping to bring forth the emotions and positive experiences of visitors,
• incorporate all media platforms including public relations, with a strong emphasis on digital channels in order to present Mexican destinations to a younger, more affluent traveller.
78 Federal Government of Mexico Transparency Fulfilment Portal: www.apartados.hacienda.gob.mx/metas_indicadores/2013/21/r21_ifaiafipar_trim.pdf
79 Federal Government of Mexico Transparency Fulfilment Portal http://www.apartados.hacienda.gob.mx/presupuesto/temas/pef/2014/temas/tomos/21/r21_w3j_afpefe.pdf
Tourism promotion budget is set at MXN732 million (EUR42 million) for 2014
Multi-media marketing efforts present Mexico in a new light
43
Marketing Strategies for Tourism Destinations. Target market: BRAZIL
To accomplish this, the first round of advertisements showcase four Mexican des-tinations: Mexico City, Yucatan, Los Cabos, and the new, ‘bundled’ destination of Puerto Vallarta and Nayarit, which have partnered to market themselves as a sin-gle “Grand Destination”. The ads have a “high end” quality to them: strong visual images, young stylish actors, and depict Mexico’s history, culture, fashion and sophistication so as to appeal to the target market. They are positioned to change existing perceptions. For example, for Mexico City which is generally regarded by tourists as a business centre, the ad presents it as a vibrant, sophisticated city shown through the eyes of three stylish young women staying at a sleek contem-porary hotel, and enjoying restaurants, cuisine, shopping, art and culture.
The diversity of the ads is intended to appeal to discerning, sophisticated travel-lers or adventurers wanting more than a “fly and flop” holiday, while not dissuad-ing the average sun and sand visitors to Mexico’s beach resorts.
In line with its strategic shift away from mass tourism, Mexico’s priority markets are targeting a younger, more affluent traveller and expanding its tried and true vacation market. It is also increasing its spend and actively pursuing the Meet-ings and Convention market and various niche markets, recognising the need to help publicise good companies that cater to these niche markets.
The source markets being targeted by Mexico are:• United Kingdom,• United States,• Brazil,• Argentina,• Japan,• Russia.
The segments within its target markets that Mexico is seeking to attract are;• adventure,• cruise,• culture,• entertainment,• golf,• luxury,• magical towns,• Mayan world,• medical tourism,• meetings,• nature,• touring routes,• sun and beach,• sustainable,• weddings,• world heritage cities.
Youth market and affluent travellers are
key segments
44
Marketing Strategies for Tourism Destinations. Target market: BRAZIL
The level of Brazilian tourist arrivals in Mexico was 122,000 in 2011, a level that rose by around 12 to 13% in 2012 (based on flights to Mexico City from Brazilian airports when 150,000 arrivals were recorded, constituting 3% of all air arrivals making Brazil Mexico’s sixth largest source market).
Global Tourism Watch 2012 found that 33% of Brazilians who had visited Mexico would recommend it for a holiday – NB this is a net score subtracting detractors from promoters – the lowest rating across the seven destinations surveyed80.
MTB has 22 overseas offices spread throughout North America (Atlanta, Chica-go, Houston, Los Angeles, Miami, New York and Washington DC in the United States; and Montreal, Toronto and Vancouver in Canada), Europe (Berlin, Brus-sels, London, Madrid, Paris, Rome), Asia (Beijing, Seoul, Tokyo) and Latin Amer-ica (Buenos Aires, Sao Paulo).
80 Brazil Market Profile, January 2013. Canadian Tourism Commission. http://en-corporate.canada.travel/sites/default/files/pdf/Research/Market-knowledge/Market-profile/Brazil/br_market_profile_2013_jan-2013.pdf
45
Marketing Strategies for Tourism Destinations. Target market: BRAZIL
International tourist arrivals in the Russian Federation totalled 25.7 million in 2012, a rise of over 13% on 2011, with an average annual growth of close to 10% since 2009, a pattern that preliminary figures indicate was maintained in 2013. The Rus-sian Federation received the 9th largest inflow of foreign tourists in 201281.
International tourism receipts reached US$11.2 billion (EUR8.6 billion) in 2012.
By 2023, international tourist arrivals are forecast to total 52.5 million, generating expenditure of RUB1,002.3 billion (EUR21.5 billion), an average annual increase of 4.9%. Domestic travel is, however, the key segment in this vast country, both historically and into the future. Domestic tourism spending generated 76.0% of direct Travel & Tourism GDP in 2012 compared with 24.0% from international tourism receipts82.
Much inbound tourism is from the 20 countries that border Russia. Although out-bound tourism remained much larger in terms of number of trips, inbound tourism posted stronger growth in 2011 and 2012. This was driven by several factors, including the Domestic and Inbound Tourism Development federal programme, growing online tourism and upcoming sports events.
The direct contribution of tourism to GDP in the Russian Federation in 2012 was 2.3% while the total contribution to GDP was estimated at 6.3%. Tourism employ-ment in Russia is put at 1.8 million83.
Responsibility for the governance of tourism moved in 2012 from the Ministry for Sports, Tourism and Youth Policy to the Ministry of Culture which defines the general laws, regulations and policy lines for the industry. The Ministry incorpo-rates the Federal Agency for Tourism, set up in 2004, which is responsible for operational issues.
Since neither the Ministry nor the Federal Agency for Tourism has a territorial structure, local and municipal administrations are responsible for tourism issues within their territories. In most of the (over 80) regional administrations in the Russian Federation, there are ministries, agencies, committees and departments that have responsibilities for tourism issues. Federal governing bodies – the Min-istry and the Agency – co-ordinate efforts and co-operate with regional tourism authorities in the planning and administration of the industry.
81 UNWTO Tourism Highlights 2013 Edition. 82 WTTC83 OECD Tourism Trends and Policies 2014. March 2014. OECD. http://www.keepeek.
com/Digital-Asset-Management/oecd/industry-and-services/oecd-tourism-trends-and-policies-2014/russian-federation_tour-2014-54-en
Russian Federation recorded annual growth of 10% in
international arrivals since 2009
The RussianTourism Sector
46
Marketing Strategies for Tourism Destinations. Target market: BRAZIL
In recent years, the Russian government has taken a series of substantial mea-sures to speed up the development of tourism. In 1997, it adopted the Tourism Law of the Russian Federation, setting out the national policy for the development of tourism and the methods to make reasonable use of resources. In June 2007, the Basic Law on Tourism Business of the Russian Federation (Amendment) was officially put into effect. The Federal Target Programme for Development of Domestic and Inbound Tourism in the Russian Federation (2011-2018), which is currently in effect, set the target at “receiving 40 million foreign tourists and 50 million domestic (overnight) tourists by 2016”.
Though expansion of marketing through a special programme is being undertak-en, there is recognition that investment in infrastructure to create tourism hubs is also needed, and that visa regulations have a significant impact.
The 2011-18 development programme’s primary focus is on building a modern tourism infrastructure with expansion of marketing activities a secondary priority. Infrastructure projects are being undertaken by regional and local administra-tions with solid tourism potential on a government-approved list assessed and evaluated by the government and public bodies for approval by the Coordination Commission. The programme involved 18 regions in 201284.
The draft State Programme “Development of Culture and Tourism” for the period 2013-2020 has its main purpose the implementation of the State’s strategic role of culture as a spiritual and moral foundation of the development of the individual and the State and the unity of the Russian society.
Achieving this objective will be through the three interrelated and complementary tasks, reflecting the established powers of public authorities in the sphere of cul-ture and tourism: 1. Preservation of cultural and historical heritage of the people, ensuring cit-
izens’ access to cultural values and participation in cultural life, the imple-mentation of creative and innovative potential of the nation,
2. Improving the quality and accessibility of services in the field of domestic and international tourism, tourism development as an effective educational tool for familiarising citizens with national cultural and natural heritage,
3. The creation of favourable conditions for sustainable development of cul-ture and tourism.
The Federal Agency for Tourism is responsible for marketing and promotion. It maintains a register of federal tour operators and works closely with them. Most practical alliances are with regions but increasing attention is being paid to es-tablishing partnerships. The organisation is relatively new whereas most Russian tour operators have been in business since the beginning of the 1990s and have offices across several regions. They cooperate with the Agency when they see specific advantage in doing so. Major players include Intourist, Inna Tour, Tez Tour, Natalie Tours and Nava International. The majority of travel agents and tour operators are based in Moscow and St Petersburg.
84 OECD Tourism Trends and Policies 2014. March 2014. OECD. http://www.keepeek.com/Digital-Asset-Management/oecd/industry-and-services/oecd-tourism-trends-and-policies-2014/russian-federation_tour-2014-54-en#page4
The Russian government has taken measures to speed up development of tourism
The RussianTourism Sector
Sustainable development of culture and tourism is a strategic priority
47
Marketing Strategies for Tourism Destinations. Target market: BRAZIL
The principal aims of the Federal Agency are:• providing the state control of the activities in the tourism sphere,• legal regulation in this field,• promoting the tourist product on domestic and international markets,• establishing favourable conditions for the development of the tourist
infrastructure and for increasing the quality of tourist services,• international cooperation in the tourism sphere.
The Federal Agency for Tourism is monitoring visa facilitation programmes in cooperation with the Foreign Ministry. Draft legislation is under review for 72 hour visa-free visits.
The budget for the Federal Agency for Tourism in 2012 was RUB2,935 million (EUR72 million) of which RUB2,475 million (EUR61 million) was allocated for im-plementation of the 2012 schedule of the Federal Tourism Development Program 2011-2018. RUB3,708 million (EUR91 million) is allocated to marketing over the seven year programme85.
The principal Federal Agency for Tourism marketing and promotion activity is through participation at all major international trade and consumer tourism fairs, and facilitating business and trade missions.
The Agency focuses its marketing activity around:• developing a centralised information resource on tourist opportunities
in the Russian Federation on the Internet,• carrying out the awareness campaign and promoting social advertising
on tourism in Russia on TV, in electronic, print and out-of-home media,• holding press-tours, providing support for information centres and
rooms,• making competitive digital content,• organising and holding international, all-Russia, interregional tourist
forums, exhibitions and other events,• carrying out works and rendering services for introducing innovative
technologies and promoting the tourist project of the Russian Federa-tion on the world and domestic tourist markets.
Much activity is concentrated within Russia itself, but a series of roadshows and trade promotions are organised in target markets. For example, in Europe, the Agency undertakes roadshows to Berlin, Paris and London with representatives from tourism authorities of major destinations, hotels and tour operators in Rus-sia, travel trade, investors, media and partners.
These missions:• promote trade, investment and tourism opportunities of Russia,• build on international business partnerships,• benchmark best European practices.
85 Peculiarities of Marketing Promotion of the Russian Federation on Tourist Service Market: Problems and Solutions. Volkov, S. (2012). State University of Vladivostok.
Marketing activities are concentrated
within Russia itself and European trade
shows
Draft legislation is under review for 72 hour visa-free visits
48
Marketing Strategies for Tourism Destinations. Target market: BRAZIL
The Agency brings together the leading players in the Russian tourism industry based around the following themes for domestic and inbound tourism develop-ment within the following sections:
• “Promotion in Tourism” — PR in Russian Tourist products,• “Hunting for a Tourist” — how to make Russian tour-product saleable
and competitive on the world market,• “Connections Decide Everything” — what is required for the efficient
dialogue of state power and business on the event and business tour-ism development,
• Projects on Complex Territories Development— how to attract the in-vestor to the tourist infrastructure.
Familiarisation visits and industry forums are organised which bring together up to 500 professionals of the tourist industry from Germany, India, Austria, Finland, the Baltic States and a number of Russian Regions.
Emphasis has been placed on the Chinese market through the 2012 Tourism Year of Russia in China, and the reciprocal Tourism Year of China in Russia in 2013.
According to the Federal Agency86, Russia’s main European target markets are:• Germany,• France,• United Kingdom,• Italy.
Elsewhere the most promising markets for Russia are China, India, Saudi Arabia, the Gulf States, the Republic of Korea, Turkey and Iran. However, it is recognised that problems with infrastructure hold back the development of these markets.
Russia is positioned as a destination with rich cultural and natural heritage, as well as business and leisure destination to MICE (Meetings, Incentives, Confer-ences and Exhibitions), vastness and variety and as a welcoming destination for visitors and investors.
There are Russian National Tourist Offices in the United Kingdom, United States and Greece. Russian private sector tourism companies also act as promoters of tourism to Russia.
86 http://russiaturforum.com/eng
Marketing emphasis has been placed on the China market
49
Marketing Strategies for Tourism Destinations. Target market: BRAZIL
The United States is the second largest tourist receiving country in the world (af-ter France) but the leading country for international tourism receipts – 14.5% of the world total in 2013.
It recorded 69.8 million arrivals in 2013. The average annual growth rate in inter-national arrivals between 2009 and 2013 was 6%, though the 5% fall in the level of arrivals in 2009 over 2008 reduces the annual growth rate to 3.7% over the extended period of 2008 to 2013.
International tourists spending in the United States amounted to US$173 billion (EUR130 billion) in 2013, making it the leading country in terms of tourism re-ceipts. The average annual growth between 2008 and 2013 was almost 10%.87
Tourism contributes 2.8% of GDP in the United States and generates 8 million jobs (of which 5.7 million are direct tourism sector jobs). Travel and tourism sales amount to US$1.51 trillion (EUR1.12 trillion), with US$900 billion (EUR667 bil-lion) being direct sales 88.
The United States is highly decentralised with respect to travel and tourism, with public authorities managing it at national, regional, state and local levels. It is not federally regulated as a distinct industry though parts of it – e.g. transport – are. The official source of statistics for tourism and the role of working for the enhancement of the competitive position of the country in travel and tourism rest with the National Travel and Tourism Office within the International Trade Admin-istration of the US Department of Commerce.
The process of policy deliberation at the Department of Commerce includes the US Travel and Tourism Advisory Board (made up of appointed travel and tourism private sector representatives) and the Tourism Policy Council (an interagency committee whose function is to coordinate national policies and programmes relating to travel and tourism, recreation and national heritage resources that involve federal agencies).
87 UNWTO Tourism Barometer, October 2010 and August 2014 88 Fast Facts: US Travel and Tourism Industry 2013. International Trade
Administration, Industry and Analysis, National Travel and Tourism Office. April 2014 http://travel.trade.gov/outreachpages/download_data_table/Fast_Facts_2013.pdf
USA is the leading country for
international tourism receipts
Tourism is the USA generates 8 million
jobs
The United StatesTourism Sector
50
Marketing Strategies for Tourism Destinations. Target market: BRAZIL
In January 2012, President Obama issued an Executive Order calling for a Task Force on Travel and Competitiveness charged with developing a National Travel and Tourism Strategy to be implemented through the Tourism Policy Council. The goals set are for 100 million international visitors spending US$250 billion (EUR185 billion) a year by 2021. The five key areas identified for the United States to address were:
• destination promotion,• enabling and enhancing travel and tourism to the United States,• providing world class customer services and visitor experiences,• coordinating across government, • conducting research and measuring results.
The establishment of Brand USA addresses the first of the areas identified in the President’s Executive order - details of Brand USA are given in Chapter 4; while improvements to visitor entry arrangements are meeting the second issue e.g. new visa adjudicator positions have been established in key markets like Brazil with expanded visa processing facilities so that 90% of applicants are interviewed within three weeks of applying89.
Brand USA is the Corporation for Travel Promotion of the United States, a pub-lic-private marketing entity, created in 2010 which began operations in May 2011. It works in close partnership with the travel industry to maximise the economic and social benefits of travel in communities around the country.Destination mar-keting for the United States has been conducted since May 2011 by Brand USA – the operating arm of the Corporation for Travel Promotion of the United States, a public-private marketing entity, which works in close partnership with the travel industry to maximise the economic and social benefits of travel in communities around the country. Its purpose is to promote travel to the United States from all over the world, and its mission is to stimulate increased international visitation to the United States, thereby growing the country’s share of the global travel mar-ket. Through its call-to-action, Discover America, Brand USA seeks to encourage and inspire travellers to explore the United States.
The mission of Brand USA is to encourage increased international visitation to the United States and to grow America’s share of the global travel market. In do-ing so, the aim is to bring millions of new international visitors who spend billions of dollars to the United States, creating tens of thousands of new American jobs.
The Corporation for Travel Promotion/Brand USA is a non-profit corporation that generates its income on a matching funding principle. Up until the end of fiscal year 2014/15 (i.e. ending September 2015), US$10 out of every US$14 dollars charged for Electronic System for Travel Authorisation paid by international trav-ellers coming to the United States from countries under the Visa Waiver Pro-gramme is made available to the Corporation – up to US$100 million, provided matching funds are forthcoming from travel and tourism sources. For the ESTA income to be continued beyond fiscal 2014/15, reauthorisation will be required from the United States Congress90.
89 OECD Tourism Trends and Policies 2014. March 2014. OECD. http://www.keepeek.com/Digital-Asset-Management/oecd/industry-and-services/oecd-tourism-trends-and-policies-2014/united-states_tour-2014-41-en#page5
90 OECD Tourism Trends and Policies 2014. March 2014. http://www.keepeek.com/Digital-Asset-Management/oecd/industry-and-services/oecd-tourism-trends-and-policies-2014/united-states_tour-2014-41-en#page4
Task Force goal to attract 100 million international visitors a year by 2021
The mission of Brand USA is to encourage increased international visitation to the United States
Brand USA income generated on a matching funding basis
51
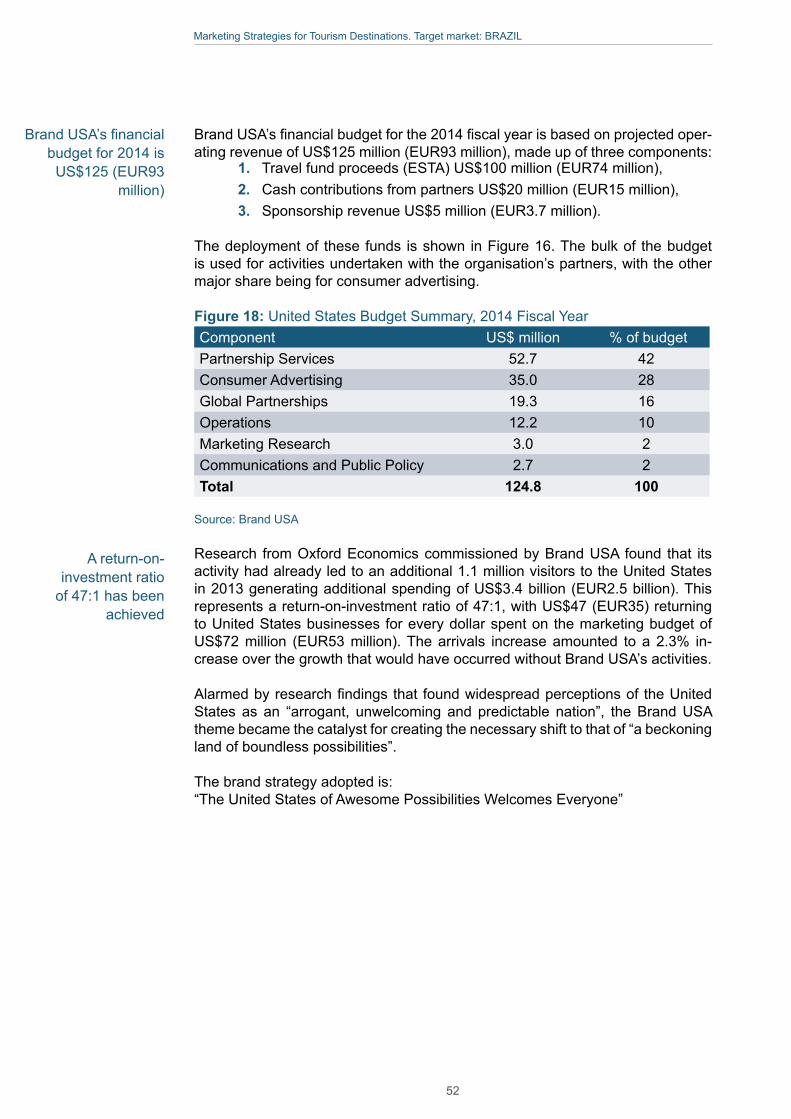
Marketing Strategies for Tourism Destinations. Target market: BRAZIL
Brand USA’s financial budget for the 2014 fiscal year is based on projected oper-ating revenue of US$125 million (EUR93 million), made up of three components:
1. Travel fund proceeds (ESTA) US$100 million (EUR74 million),2. Cash contributions from partners US$20 million (EUR15 million),3. Sponsorship revenue US$5 million (EUR3.7 million).
The deployment of these funds is shown in Figure 16. The bulk of the budget is used for activities undertaken with the organisation’s partners, with the other major share being for consumer advertising.
Figure 18: United States Budget Summary, 2014 Fiscal YearComponent US$ million % of budgetPartnership Services 52.7 42Consumer Advertising 35.0 28Global Partnerships 19.3 16Operations 12.2 10Marketing Research 3.0 2Communications and Public Policy 2.7 2Total 124.8 100
Source: Brand USA
Research from Oxford Economics commissioned by Brand USA found that its activity had already led to an additional 1.1 million visitors to the United States in 2013 generating additional spending of US$3.4 billion (EUR2.5 billion). This represents a return-on-investment ratio of 47:1, with US$47 (EUR35) returning to United States businesses for every dollar spent on the marketing budget of US$72 million (EUR53 million). The arrivals increase amounted to a 2.3% in-crease over the growth that would have occurred without Brand USA’s activities.
Alarmed by research findings that found widespread perceptions of the United States as an “arrogant, unwelcoming and predictable nation”, the Brand USA theme became the catalyst for creating the necessary shift to that of “a beckoning land of boundless possibilities”.
The brand strategy adopted is:“The United States of Awesome Possibilities Welcomes Everyone”
A return-on-investment ratio
of 47:1 has been achieved
Brand USA’s financial budget for 2014 is
US$125 (EUR93 million)
52
Marketing Strategies for Tourism Destinations. Target market: BRAZIL
The strategies being adopted as set out in Brand USA’s Marketing Plan FY 201391 are as follows:
• Relevance: Increase relevance of Brand USA as the nation’s DMO,• Leverage/Alignment: Leverage and align the industry’s international
marketing efforts,• Return on Investment: Invest in programmes and allocate resources
on markets and initiatives that will maximise results,• Growth: Attract partners and stakeholder participation/support to gen-
erate cash and in-kind contributions that will fund the work of the or-ganisation to fulfil its mandate,
• Collaborate: Collaborate on the development of programmes with government and industry stakeholders,
• Co-op: Develop co-op opportunities that add, create, or amplify value to stakeholders,
• Content: Develop unique content that inspires engagement and pro-motes travel to the United States and which can be repurposed by destinations and travel brands,
• Digital: Enhance the content, functionality, and user experience on all digital platforms,
• Excellence: Build and organise a results-driven team and a culture that promotes inclusion and diversity, operates with integrity, and rec-ognises and rewards performance,
• Awareness: Increase awareness of Brand USA as both a high-value brand and premier travel destination.
The partnership approach is the essence of Brand USA’s campaigns. Its focus is on linking with United States agencies and firms to assist in their penetration of overseas markets, using the following programmes:
• Discover America Global Inspiration Guide: language specific guides featuring sponsored content,
• DiscoverAmerica.com: global website with a variety of programmes designed to drive traffic and referrals,
• media planning and buying: Brand USA works with each partner to determine which programmes can be maximised to extend its reach,
• Brand USA in-country multi-channel programmes: customised for each country to coincide with Brand USA consumer marketing cam-paigns using the channels that are most effective in driving prospec-tive travellers to partners,
• customised in-country marketing initiatives: partners plans devel-oped through Brand USA’s international representative offices,
• media and travel trade outreach: through the Brand USA Travel Trade Network, assistance is provided to partners to enable them to target and connect with international travel media,
• United States Discovery Program: online training tool to equip source market industry to sell travel to the United States,
• international tradeshows and missions: partners can participate on United States Pavilions at Trade shows and on sales mission (e.g. to Hong Kong and China in Fiscal 2014, and China scheduled for Octo-ber 2014),
91 Brand USA FY2013 Marketing Plan. February 2013. http://www.thebrandusa.com/~/media/Files/Key%20Dox/2013/021513%20Brand%20USA%20Marketing%20Plan_February%202013.pdf
Brand USA theme addresses negative perceptions of country
The partnership approach is the essence of Brand USA’s campaigns
Co-operative programmes to increase penetration in overseas markets
53
Marketing Strategies for Tourism Destinations. Target market: BRAZIL
• in-kind support: promotion and contributions: e.g. inclusion of the Brand USA logo on partner advertising, website etc; provision of ad space to Brand USA; contribute airfare, accommodations etc to sup-port Brand USA events and activities.
Brand USA is executing a dynamic marketing programme that includes both con-sumer and travel trade marketing efforts. The international consumer campaign is comprised of television, out-of-home, and print advertising, public relations, and social media/digital efforts. The business to business marketing effort includes trade shows and sales missions, tour operator and travel agent outreach, and educational campaigns about United States entry policies. As part of the busi-ness to business effort, Brand USA is establishing one of the largest networks of international representation firms to support its efforts internationally.
Brand USA undertakes a fully integrated, multi-channel campaign plus direct in-market marketing through a global network of representation firms established in key international markets. Country specific Facebook and Twitter pages show-case targeted promotions and the Discover America.com is an information portal for trip planning. The key message in the campaign is to “Discover this land, like never before.” The second component of this central message is to spread the United States’ welcome to repeat visitors around the world, inviting travellers to visit the country again “as if for the first time”.
Brand USA’s formula in the deployment of its resources for the consumer cam-paign follows the principle of maximising results, based on the evaluation of six key factors:
• volume – numbers of visitors from each source market,• value - the total revenue value of tourism from that country,• growth – year-on-year increase both in arrivals and revenue,• costs – media costs in the source markets,• ease of entry – assessment of ease/difficulty of procedures i.e. visa
system, waiting time, political climate,• systems and facilities influencing travel decisions - Brand USA rep-
resentation and website presence, role and use of social media, strength of trade/media support.
Brand USA focuses its efforts on delivering programmes and platforms that in-crease awareness and enhance the image of the United States among worldwide travellers, and also works with the Federal Government to communicate Unites States entry and security procedures to make international travel to and into the United States easier and more welcoming92.
In 2013, Brand USA’s campaign was active in nine of the markets that drive the highest level of visitation to, and spend in, the United States:
• Australia,• Brazil,• Canada,• China,• Germany,
92 Role in the Travel Industry in Brand USA FY 2014 Business Plan, p5. http://www.thebrandusa.com/~/media/Files/Key%20Dox/2013/BrandUSA-BusinessPlan_Public-LIVE.pdf
Marketing programme that
includes both consumer and travel
trade marketing efforts
DiscoverAmerica.com information
portal for trip planning
Brand USA’s campaign active in
nine markets
54
Marketing Strategies for Tourism Destinations. Target market: BRAZIL
• India,• Japan,• Mexico, • the United Kingdom.
In total, these markets generate 75% of all international inbound visits to, and spend in, the United States equivalent to 50 million visitors and US$80 billion (EUR59 billion) in spending. Every 1% increase in visitation from these markets results in 500,000 more international travellers and US$800 million (EUR590 mil-lion) in additional revenue to the United States93.
In-market representation is considered to be vital, as it permits Brand USA to gain important market-specific intelligence and to begin to establish strong relation-ships with the travel trade. In addition, prior to the consumer campaign launch, social media and website presence in the native language of the market are established.
3.6. ConclusionsThe four shortlisted destinations competing with Europe for the Brazilian tourist are pursuing marketing strategies that:
• target both established source markets and newly emerging ones, seeking a balance between the two groups,
• recognise Brazil as a priority market with its population’s strong dispo-sition to travel outside the country for pleasure, VFR, education and business reasons,
• plan to extend the use of their natural and cultural attributes to appeal to different segments within source markets,
• undertake research leading to product/experience development plan-ning based on a market: product “matching” approach in order to realise the potential from these various market segments; such an approach guides destinations to develop products that provides high quality ex-periences in line with these segments’ needs and expectations. This process can be put in place, for example, by recognising Brazilians’ strong desire for shopping and entertainment in the development of appropriate products/experiences and by placing strong emphasis on them,
• focus on a number of common segments across competitors (e.g. cul-tural heritage, business/MICE, education) but with special attention in the United States to shopping and entertainment features,
• pay special attention within the segment mix to high value/affluent tour-ists from the expanding middle and higher socio-economic categories,
• engage in wide ranging marketing communications and promotional activities but with a strong trend towards digital electronic technology applications using Portuguese language,
• are being led in all respects by the United States which, through the extensive marketing and promotional campaigns being conducted by Brand USA – see section 5.2. – and the country’s state and city CVBs, is further stimulating the desire to travel overseas among the Brazilian population.
93 http://www.thebrandusa.com/
Europe’s competitors seek balance between established and emerging markets
Europe’s competitors extend their offering to appeal to different consumer segments
Communication trending towards digital technology and applications in Portuguese language
55
Marketing Strategies for Tourism Destinations. Target market: BRAZIL
In selecting the destinations competing with Europe to be subject to study in re-spect of the Brazilian market, consideration was given to:
• the recent growth trends in tourism from Brazil, and future priority ac-corded to the Brazilian market,
• current and planned future destination marketing strategy and priority given to the Brazilian market
• the extent to which the destinations compete for the same/similar mar-ket segments in the Brazilian market as Europe does
• price levels,• airline connectivity,• political, economic and socio-cultural inks,• overall destination tourism policy development, • entry requirements for Brazilian visitors.
On this basis, the destination selected for full analysis and assessment in respect of the Brazilian market is the United States of America.
56
Marketing Strategies for Tourism Destinations. Target market: BRAZIL
4Marketing Strategy and Activities of Brand USA in Brazil
4.1 Brand USA’s Marketing and Promotional Activities in Brazil The evolution of the Brazilian outbound travel market has attracted the attention of a wide range of destinations both in the broad Latin America region and in long haul destinations such as North America, Europe and Australasia. The Brazilian tourist differs from those of other major generating markets being driven by a combination of sybaritic activities and cultural interests. At one extreme are shop-ping, going to theme parks etc while at the other end Brazilians are interested in the cultural heritage of their destinations especially where there is an historical connection to the present day population of Brazil.
Brazilian travel to the United States has expanded at a rate of 21.6% a year be-tween 2007 and 2013, reaching an annual level of 2 million visitors, the United States’ 3rd largest overseas source market (after Japan and the United Kingdom) in 2013. The growth rate for the next five years in Brazil>United States tourism is 8.4% a year94. In order to shape its marketing strategy and activities to realise this strong potential, two major studies have been carried out by United States authorities of the Brazilian market over the past two years:
1. 2012 Market Profile: Brazil, Office of Travel and Tourism Industries95,2. Market Profile: Brazil in Brand USA’s Fiscal 2014 Business Plan96.
Among the key findings of the 2012 study were:• the proportion of Brazilian visitors on leisure and VFR trips was dom-
inant at 82%,• average stay was 15 nights,• average age was around 40, • average household income in excess of US$100,000 (EUR77,000).
94 National Travel and Tourism Office, ITA, Department of Commerce, April 2014 95 2012 Market Profile: Brazil. Office of Travel and Tourism Industries, ITA,
Department of Commerce. http://travel.trade.gov/outreachpages/download_data_table/2012_Brazil_Market_Profile.pdf
96 Market Profile: China in Brand USA FY 2014 Business Plan, pp80-81. http://www.thebrandusa.com/~/media/Files/Key%20Dox/2013/BrandUSA-BusinessPlan_Public-LIVE.pdf
Brand USA
Brand USA strategy in Brazil based on market research
57
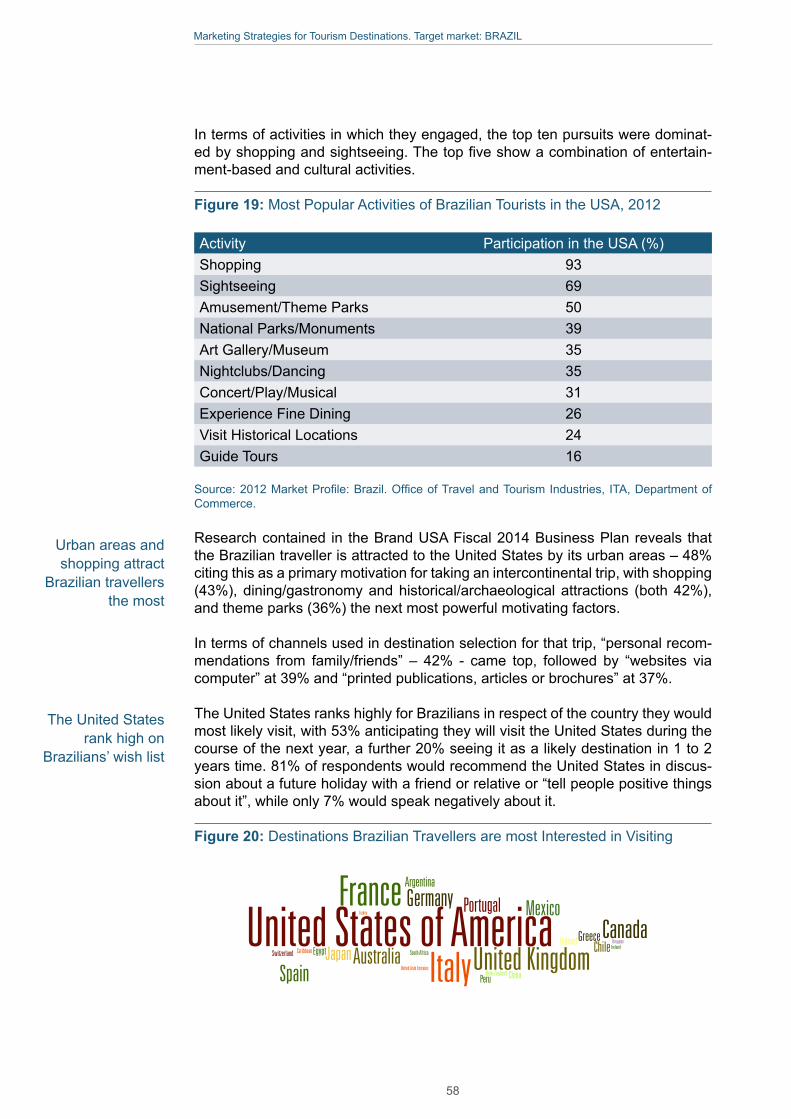
Marketing Strategies for Tourism Destinations. Target market: BRAZIL
In terms of activities in which they engaged, the top ten pursuits were dominat-ed by shopping and sightseeing. The top five show a combination of entertain-ment-based and cultural activities.
Figure 19: Most Popular Activities of Brazilian Tourists in the USA, 2012
Activity Participation in the USA (%)Shopping 93Sightseeing 69Amusement/Theme Parks 50National Parks/Monuments 39Art Gallery/Museum 35Nightclubs/Dancing 35Concert/Play/Musical 31Experience Fine Dining 26Visit Historical Locations 24Guide Tours 16
Source: 2012 Market Profile: Brazil. Office of Travel and Tourism Industries, ITA, Department of Commerce.
Research contained in the Brand USA Fiscal 2014 Business Plan reveals that the Brazilian traveller is attracted to the United States by its urban areas – 48% citing this as a primary motivation for taking an intercontinental trip, with shopping (43%), dining/gastronomy and historical/archaeological attractions (both 42%), and theme parks (36%) the next most powerful motivating factors.
In terms of channels used in destination selection for that trip, “personal recom-mendations from family/friends” – 42% - came top, followed by “websites via computer” at 39% and “printed publications, articles or brochures” at 37%.
The United States ranks highly for Brazilians in respect of the country they would most likely visit, with 53% anticipating they will visit the United States during the course of the next year, a further 20% seeing it as a likely destination in 1 to 2 years time. 81% of respondents would recommend the United States in discus-sion about a future holiday with a friend or relative or “tell people positive things about it”, while only 7% would speak negatively about it.
Figure 20: Destinations Brazilian Travellers are most Interested in Visiting
Bra
nd
US
A F
Y14
Bu
sin
ess
Pla
n •
76
M
AR
KE
T P
RO
FIL
ES
Source: Brand USA Proprietary Research unless otherwise noted.
Market Profile: BrazilTop 5 Motivations for Selecting Last Intercontinental Destination
Motivation % Selected
Urban attractions 48%
Shopping 43%
Dining/gastronomy 42%
Historical/archaeological attractions
42%
Theme parks 36%
Top 5 Strongest Impressions of the USA
Impression % Selected
Trendy 65%
Sophisticated 49%
Diverse 47%
Energetic 40%
Adventurous 38%
Question: What motivates your desire to visit that destination? Select all that apply. For each of the following countries, select which characteristics, if any, describe it as a holiday destina-
tion. Select all that apply.
Destination Decision and Air Booking Windows for Next Intercontinental Trip
DESTINATION DECISION AIR BOOKING
Question: How far in advance of your departure date did/will you decide on the destination? Please select one answer for each of the following questions. How far in advance of your
departure date did/will you book the travel products for this holiday? Select one option from the drop-down box
3%
2%
9%
8%
10%
14%
6%
25%
23%
More than one year
6 to 12 months
3 to 5 months
1 to 2 months
3 to 4 weeks�
1 to 2 week�
2 to 6 days
1 day or less
I did/will not research/decide in advance
1%
2%
5%
8%
19%
2%
37%
26%
More than one year
6 to 12 months
3 to 5 months
1 to 2 months
3 to 4 weeks�
1 to 2 week�
2 to 6 days
I did/will not research/decide in advance
Top 5 Channels Used in Destination Selection for Last Intercontinental Trip
Channels % Selected
Personal recommendations from friends/family
42%
Websites via computer 39%
Printed publications, articles or brochures
37%
Information in printed travel guidebooks
24%
Online advertising/email 24%
Question: What sources of information did/will you use to select the destination for this
holiday? Select all that apply.
Countries travelers from Brazil would most like to visit
United States of AmericaFrance Mexico
Argentina
PortugalGermany
GreeceEgypt
New Zealand China
HollandSouth Africa
United Arab Emirates
PeruSpain
CanadaUruguay
IrelandChileJapanCaribbeanSwitzerland
Turkey
ItalyUnited KingdomAustralia
2012 Arrivals 2012 Spending
1.79 million $9.3 billion
+19% v 2011 +11% v 2011
Rank: 6 Rank: 5
U.S. Department of Commerce, Office of Travel and Tourism Industries (OTTI)
Urban areas and shopping attract
Brazilian travellers the most
The United States rank high on
Brazilians’ wish list
58
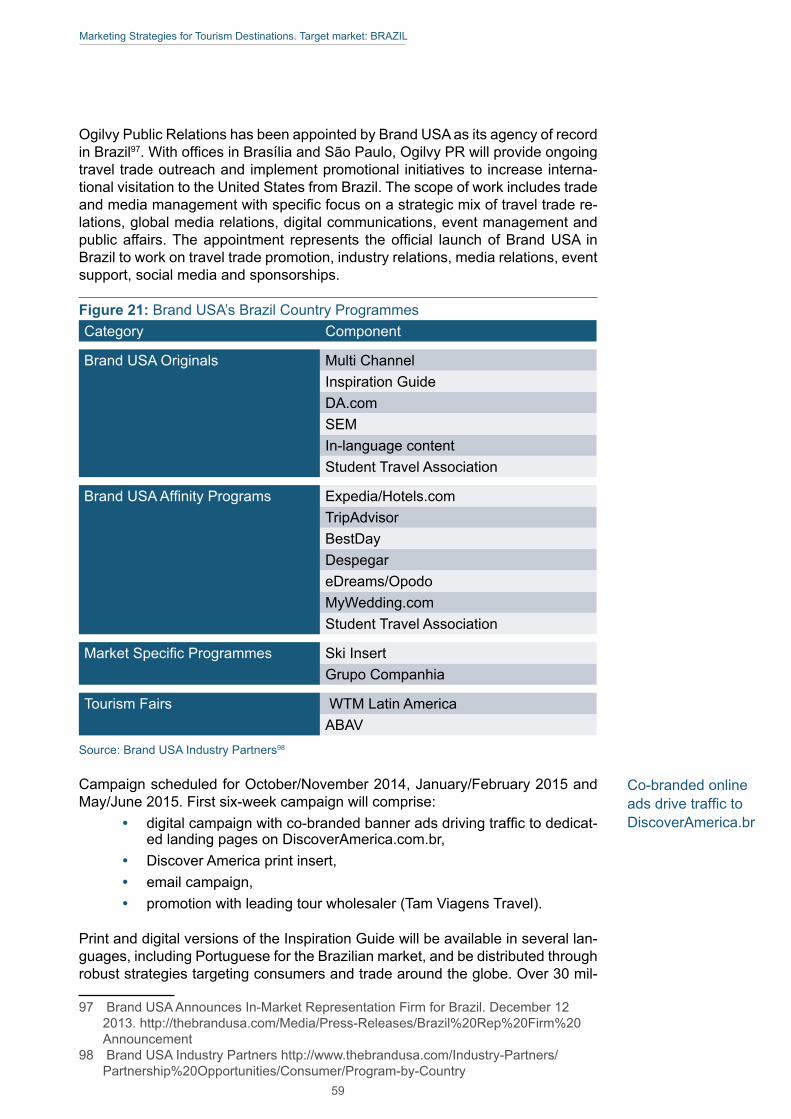
Marketing Strategies for Tourism Destinations. Target market: BRAZIL
Ogilvy Public Relations has been appointed by Brand USA as its agency of record in Brazil97. With offices in Brasília and São Paulo, Ogilvy PR will provide ongoing travel trade outreach and implement promotional initiatives to increase interna-tional visitation to the United States from Brazil. The scope of work includes trade and media management with specific focus on a strategic mix of travel trade re-lations, global media relations, digital communications, event management and public affairs. The appointment represents the official launch of Brand USA in Brazil to work on travel trade promotion, industry relations, media relations, event support, social media and sponsorships.
Figure 21: Brand USA’s Brazil Country ProgrammesCategory Component
Brand USA Originals Multi ChannelInspiration GuideDA.comSEMIn-language contentStudent Travel Association
Brand USA Affinity Programs Expedia/Hotels.comTripAdvisorBestDayDespegareDreams/OpodoMyWedding.comStudent Travel Association
Market Specific Programmes Ski InsertGrupo Companhia
Tourism Fairs WTM Latin AmericaABAV
Source: Brand USA Industry Partners98
Campaign scheduled for October/November 2014, January/February 2015 and May/June 2015. First six-week campaign will comprise:
• digital campaign with co-branded banner ads driving traffic to dedicat-ed landing pages on DiscoverAmerica.com.br,
• Discover America print insert,• email campaign,• promotion with leading tour wholesaler (Tam Viagens Travel).
Print and digital versions of the Inspiration Guide will be available in several lan-guages, including Portuguese for the Brazilian market, and be distributed through robust strategies targeting consumers and trade around the globe. Over 30 mil-
97 Brand USA Announces In-Market Representation Firm for Brazil. December 12 2013. http://thebrandusa.com/Media/Press-Releases/Brazil%20Rep%20Firm%20Announcement
98 Brand USA Industry Partners http://www.thebrandusa.com/Industry-Partners/Partnership%20Opportunities/Consumer/Program-by-Country
Co-branded online ads drive traffic to DiscoverAmerica.br
59
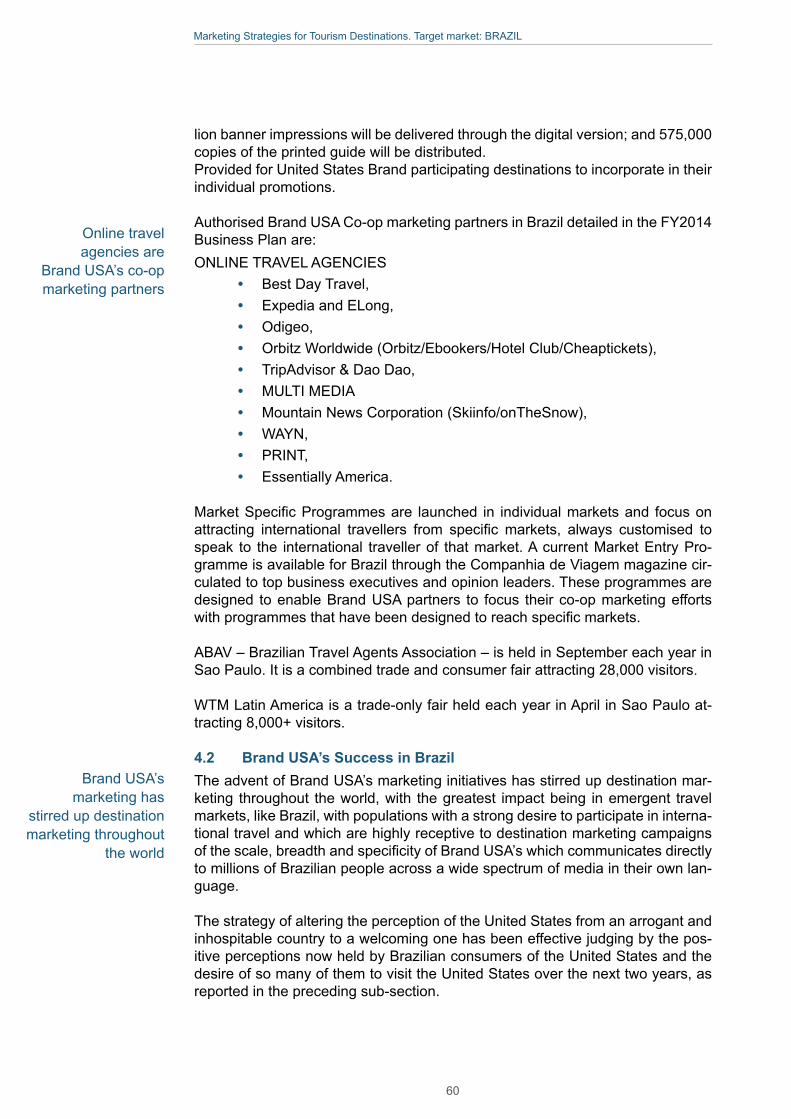
Marketing Strategies for Tourism Destinations. Target market: BRAZIL
lion banner impressions will be delivered through the digital version; and 575,000 copies of the printed guide will be distributed.Provided for United States Brand participating destinations to incorporate in their individual promotions.
Authorised Brand USA Co-op marketing partners in Brazil detailed in the FY2014 Business Plan are:ONLINE TRAVEL AGENCIES
• Best Day Travel,• Expedia and ELong,• Odigeo,• Orbitz Worldwide (Orbitz/Ebookers/Hotel Club/Cheaptickets),• TripAdvisor & Dao Dao,• MULTI MEDIA• Mountain News Corporation (Skiinfo/onTheSnow),• WAYN,• PRINT,• Essentially America.
Market Specific Programmes are launched in individual markets and focus on attracting international travellers from specific markets, always customised to speak to the international traveller of that market. A current Market Entry Pro-gramme is available for Brazil through the Companhia de Viagem magazine cir-culated to top business executives and opinion leaders. These programmes are designed to enable Brand USA partners to focus their co-op marketing efforts with programmes that have been designed to reach specific markets.
ABAV – Brazilian Travel Agents Association – is held in September each year in Sao Paulo. It is a combined trade and consumer fair attracting 28,000 visitors.
WTM Latin America is a trade-only fair held each year in April in Sao Paulo at-tracting 8,000+ visitors.
4.2 Brand USA’s Success in BrazilThe advent of Brand USA’s marketing initiatives has stirred up destination mar-keting throughout the world, with the greatest impact being in emergent travel markets, like Brazil, with populations with a strong desire to participate in interna-tional travel and which are highly receptive to destination marketing campaigns of the scale, breadth and specificity of Brand USA’s which communicates directly to millions of Brazilian people across a wide spectrum of media in their own lan-guage.
The strategy of altering the perception of the United States from an arrogant and inhospitable country to a welcoming one has been effective judging by the pos-itive perceptions now held by Brazilian consumers of the United States and the desire of so many of them to visit the United States over the next two years, as reported in the preceding sub-section.
Online travel agencies are
Brand USA’s co-op marketing partners
Brand USA’s marketing has
stirred up destination marketing throughout
the world
60
Marketing Strategies for Tourism Destinations. Target market: BRAZIL
The partnership approach is central to Brand USA’s marketing strategy and cam-paign components, giving a wide range of destination, travel trade and media partners the opportunity to piggyback on the digital and traditional marketing tools, public relations and promotional efforts developed and conducted by Brand USA.
During the official opening of its Brazilian office in March 2014, United States Am-bassador Liliana Ayalde emphasised the role of tourism in strengthening bilateral relations between the two countries, identifying its part both in the two countries’ commercial relationship and as an integral part of the growing cultural and edu-cational relationship99.
Brazil has had the largest increase in the number of visitors to the United States among the eight key countries in which Brand USA is fully deployed through all three categories: consumer advertising, consumer marketing, and travel trade channels.
The figures for Brazil, collected in a recent Oxford Economics study on the return on investment in marketing conducted by Brand USA, give particular strength to the work of Brand USA in the country. From October 2012 through September 2013, Brand USA’s marketing campaigns helped to increase the United States market share of outbound Brazilian travellers by 3.1% against competing des-tinations. Brazil showed the largest increase out of the organisation’s eight key markets and played an important role in an overall incremental increase of 1.1 million international visitors to the United States during the period100.
Given the high level of accountability to its partners, Brand USA has a rigorous system of monitoring, assessing and evaluating its activities. Brand USA is track-ing and measuring its success based on improvements and increases related to:
• awareness and image of the United States as a travel destination,• international travellers’ intent to travel to the United States, • international visitation and spending.
The commissioning of the Oxford Economics’ study The Return on Investment of Brand USA Marketing is an example of this rigorous system of performance reckoning.
99 Brand USA Officially Launches its Representation in Brazil. March 25 2014. http://www.thebrandusa.com/Media/Press-Releases/Brand%20USA%20Officially%20Launches%20Its%20Representation%20in%20Brazil
100 The Return on Investment of Brand USA Marketing. 2013 Fiscal Year Analysis. http://thebrandusa.com/~/media/Files/Key%20Dox/2014/ROI%20Results/Brand%20USA%20ROI%20FY2013%20Final.pdf
Partnerhip approach is central to Brand USA’s success
Brazil among eight key markets for Brand USA
Growth from Brazil plays incremental role in Brand USA’s positive performance
61
Marketing Strategies for Tourism Destinations. Target market: BRAZIL
5.1 Market PerceptionsThe USA is doing very well. They know how to do it. We see all the main CVBs – Florida, Orlando, Miami, New York, Las Vegas, California, Washington and Chicago. American Airlines has just started a new flight to Los Angeles. Brand USA is just starting to invest in Brazil. By contrast, we don’t see much presence from Europe compared to the USA. (Leading Brazilian tour operator interview with TDI, March 2014.)
The programme of research and analysis leads to the clear conclusion that the United States and Europe are seen quite differently by Brazilians. While Euro-pean destinations can afford the opportunity for shopping and entertainment, the primary image of the countries of Europe in Brazilians’ minds is associated with the various manifestations of culture and history. The opposite is the case for the United States which is perceived first and foremost as a destination for fun and shopping (both low cost and luxury) but where visitors can also experience aspects of the country’s cultural heritage and history, should they wish to do so.
The fact that many Brazilians have their ancestry in other lands – especially Eu-rope – or have connections with friends and family in both European countries and the United States leads to a significant volume of VFR travel, much of which is combined with a holiday. Similarly, with large numbers of Brazilians study-ing overseas, in countries with strong reputations for academic study in Europe, North America and elsewhere (e.g. Australia), the flow of education-motivated visits from Brazil is significant.
Brazilians’ image of Europe includes academic studies, gastronomy, sports, his-torical and cultural attractions, religious sites, as well as glamour and prestige101. Europe’s advantages are its image as a sophisticated and refined destination, access to part of Brazil’s cultural roots, a worthwhile cultural experience for the time and money, many religious sites, gastronomic delights and an image as a “liberal” destination102. However, immigration procedures (despite visa free ac-cess), low value-for-money and time (because of queues), and language barriers are deterrents for Brazilian travellers to Europe103, as is the relative lack of mar-keting of Europe and its constituent countries compared with that of the United States at national, state and city levels.
101 Understanding Brazilian Outbound Tourism. UNWTO & ETC. 2013102 Ibid103 Ibid
Key Factors in Destination Marketing in Brazil5
Brazilians’ perceptions of the United States and
Europe diverge greatly
Europe is a sophisticated and
“liberal” destination
62
Marketing Strategies for Tourism Destinations. Target market: BRAZIL
The other destinations examined in respect of the Brazilian market are each seeking to increase awareness among Brazilians: Mexico by seeking to create an image of a cultural superpower, Australia by focusing on the educational and business opportunities, and Russia by increasing and strengthening its official, business and trading links. 5.2 Marketing Performance and Opportunities Without significant investment in studies and surveys to more fully understand the attitudes, motivations and behaviour and characteristics of Brazilian travel-lers, destinations targeting the Brazilian market will not be able to develop fully effective communication strategies and campaigns to convert undoubted grow-ing interest in outbound travel into actual travel to their destinations. Europe – through ETC – and North America – through Brand USA and Tourism Canada are leading the way in this regard.
None of the other three destinations studied have undertaken specific market studies in Brazil though Tourism Australia compiles an annual Market Profile for Brazil based on government and other surveys of international travellers.
ETC/UNWTO research studies – Understanding Brazilian Outbound Tourism, 2013; Chinese and Brazilian Outbound Tourism Markets and Netnography, ETC, 7th UNWTO/PATA Forum on Tourism Trends and Outlook, October 2013; and ETC Market Insights: Brazil, 2009 – identify key target markets in Brazil for Eu-rope. These are outlined in section 1.5.
Though few detailed figures are available, it is clear that Europe is being out-in-vested by Brand USA (and its partners) in the Brazilian market, whose dedicated budgets for marketing and promotional activities will rise with the opening of its first office in Brazil in early 2014. In 2012, Brand USA marketing investment in Brazil was US$3,841,411 (EUR2.95 million). This produced incremental Brazilian visitor spending in the United States of US$370 million (EUR285 million) i.e. a return on investment ratio of 96:1104.
It should be noted that Brand USA’s investment is on top of the efforts made in Brazil by the US states and cities. By contrast, Europe has no overall presence in Brazil though a number of European countries have tourist offices or marketing representatives e.g. Spain, Portugal, the United Kingdom, Germany, Italy.
Analysis provided in Chapter 1 indicates that outbound Brazilian travellers are divided into three broad categories: those that are status-motivated and want to visit as many places and iconic sites as possible; those that are experience-cen-tered looking to engage is specific activities related to their interests; and those that are people-centered105.
Success for a destination is the development and communication to the market-place of products and experiences to meet the requirements of visitors in each of these categories, or to specialise as a destination of excellence in one area within a category, through a process of market:product matching. Europe, by being blessed with an abundance of cultural and natural resources, historic and modern features, and a wide variety of activity opportunities, is able to design 104 The Return on Investment of Brand USA Marketing. 2013 Fiscal Year Analysis.
http://thebrandusa.com/~/media/Files/Key%20Dox/2014/ROI%20Results/Brand%20USA%20ROI%20FY2013%20Final.pdf
105 Understanding Brazilian Outbound Tourism. UNWTO & ETC. 2013
Few competing destinations have invested in studies and surveys
Europe is being out-invested by competing destinations
Predominant view of Europe is its cultural and natural heritage
63
Marketing Strategies for Tourism Destinations. Target market: BRAZIL
products and experiences for many different market segments.
The range of attributes recognised by Brazilians in Europe - covering history, cul-ture (original and contemporary), education, sports etc – along with the presence of a large Brazilian diaspora in Europe, provides the opportunity for European destinations to exploit the cultural heritage, educational and training, and sports segments through communicating the possibilities in a convincing manner to the potential traveller. Competition will continue to intensify, not only from the major marketing investment made by Brand USA and its partners, but also by destina-tions like Mexico and, in time, Australia.
Mexico’s strategy of broadening its market appeal as a country rich in cultural heritage (as well as a destination with a high quality coastal resort product) with investment in infrastructure and support for product development in creating cul-tural heritage trails and routes will represent a threat to Europe. Brazil is one of six markets being targeted by Mexico, and is third in order of priority after neighbouring United States and the United Kingdom. Mexico is also seeking to increase the numbers of Brazilians travelling to the United States making a stop-over visit in the country. Mexico will become an increasingly significant competitor for Europe in the Brazilian market.
Brazil is classified as a “fast emerging” market for Australia, warranting invest-ment to stimulate market opportunities. However Brazil was not included as one of the 11 markets worldwide in which Tourism Australia conducted Consumer De-mand Studies in 2012. It ranked 26th in terms of international arrivals in Australia in 2013, and 22nd in respect of spending in Australia . With no direct air services, it is not presently a priority market but the large volume of Brazilian students in Australia (i.e. over 15,000 in 2012, the fifth largest nationality ) suggests that the longer term potential could be substantial, with already a 35% repeat factor among Brazilians visiting Australia .
To realise Europe’s potential, much of which will entail cross-border travel related to themed products and experiences, a Europe-wide marketing campaign can create awareness of the opportunities and facilitative measures (e.g. absence of visa requirements, transportation options) that the European country DMOs – ei-ther individually or in small partnerships according to the optimal structure of the tour – can build on. Brand USA and its partners, along with the nation’s CVBs, are already doing this for the United States; Europe’s potential is no less than that of the United States but requires a Europe-wide positioning exercise to create awareness of the full spread of resources and visitor opportunities.
Mexico is broadening its appeal as a
cultural destination and high quality
coastal resort product
A Europe-wide positioning exercise is needed to create
awareness of tourism offering
64

Marketing Strategies for Tourism Destinations. Target market: BRAZIL
Appendices
65
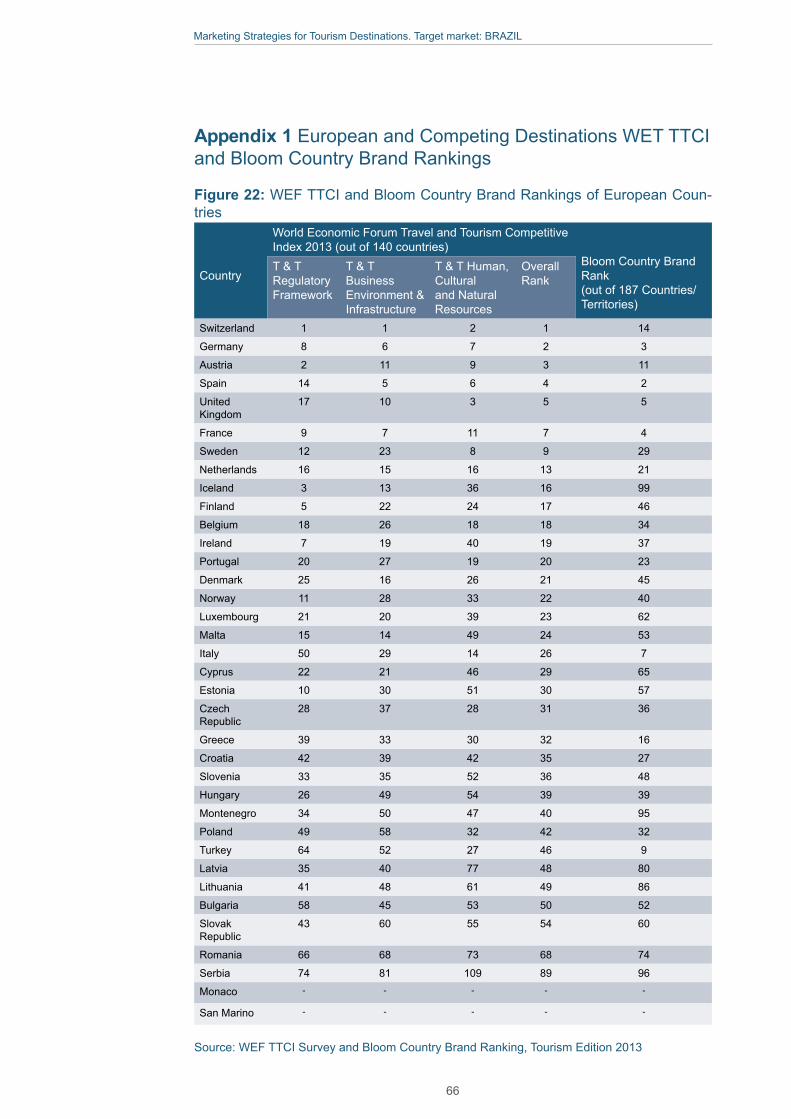
Marketing Strategies for Tourism Destinations. Target market: BRAZIL
Appendix 1 European and Competing Destinations WET TTCI and Bloom Country Brand Rankings
Figure 22: WEF TTCI and Bloom Country Brand Rankings of European Coun-tries
Country
World Economic Forum Travel and Tourism Competitive Index 2013 (out of 140 countries)
Bloom Country Brand Rank (out of 187 Countries/ Territories)
T & T Regulatory Framework
T & T Business Environment & Infrastructure
T & T Human, Cultural and Natural Resources
Overall Rank
Switzerland 1 1 2 1 14
Germany 8 6 7 2 3
Austria 2 11 9 3 11
Spain 14 5 6 4 2
United Kingdom
17 10 3 5 5
France 9 7 11 7 4
Sweden 12 23 8 9 29
Netherlands 16 15 16 13 21
Iceland 3 13 36 16 99
Finland 5 22 24 17 46
Belgium 18 26 18 18 34
Ireland 7 19 40 19 37
Portugal 20 27 19 20 23
Denmark 25 16 26 21 45
Norway 11 28 33 22 40
Luxembourg 21 20 39 23 62
Malta 15 14 49 24 53
Italy 50 29 14 26 7
Cyprus 22 21 46 29 65
Estonia 10 30 51 30 57
Czech Republic
28 37 28 31 36
Greece 39 33 30 32 16
Croatia 42 39 42 35 27
Slovenia 33 35 52 36 48
Hungary 26 49 54 39 39
Montenegro 34 50 47 40 95
Poland 49 58 32 42 32
Turkey 64 52 27 46 9
Latvia 35 40 77 48 80
Lithuania 41 48 61 49 86
Bulgaria 58 45 53 50 52
Slovak Republic
43 60 55 54 60
Romania 66 68 73 68 74
Serbia 74 81 109 89 96
Monaco - - - - -
San Marino - - - - -
Source: WEF TTCI Survey and Bloom Country Brand Ranking, Tourism Edition 2013
66
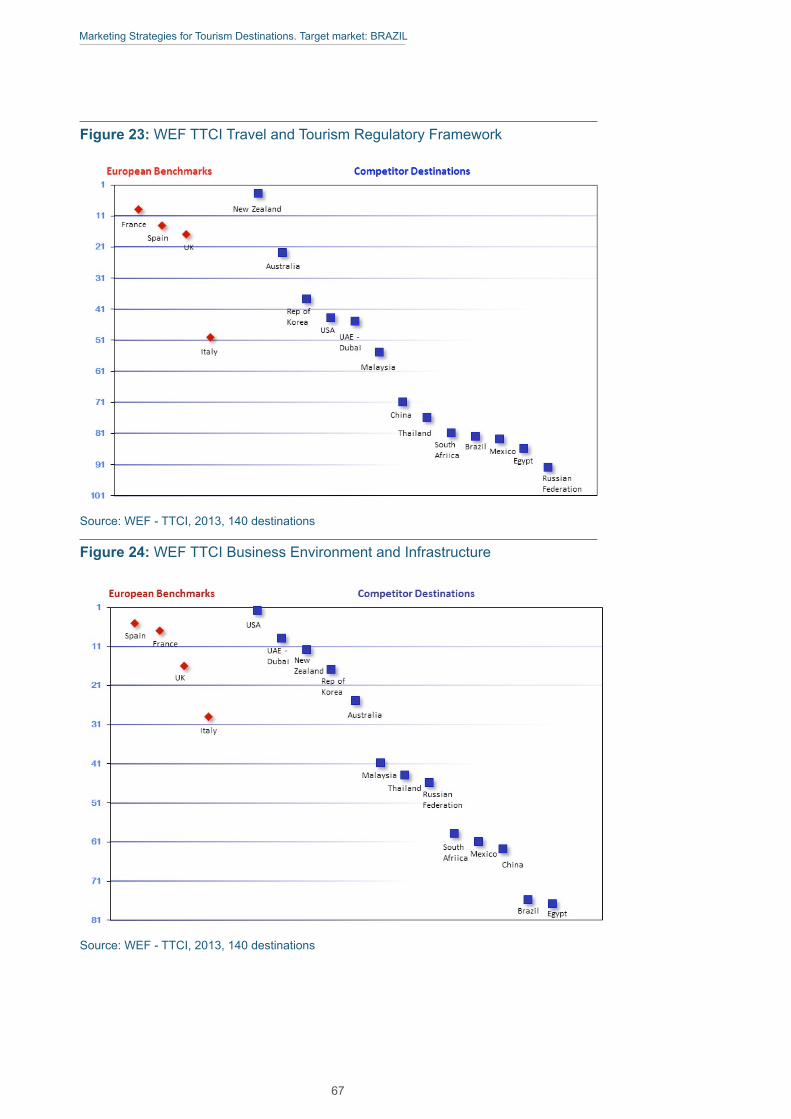
Marketing Strategies for Tourism Destinations. Target market: BRAZIL
Figure 23: WEF TTCI Travel and Tourism Regulatory Framework
Source: WEF - TTCI, 2013, 140 destinations
Figure 24: WEF TTCI Business Environment and Infrastructure
Source: WEF - TTCI, 2013, 140 destinations
67
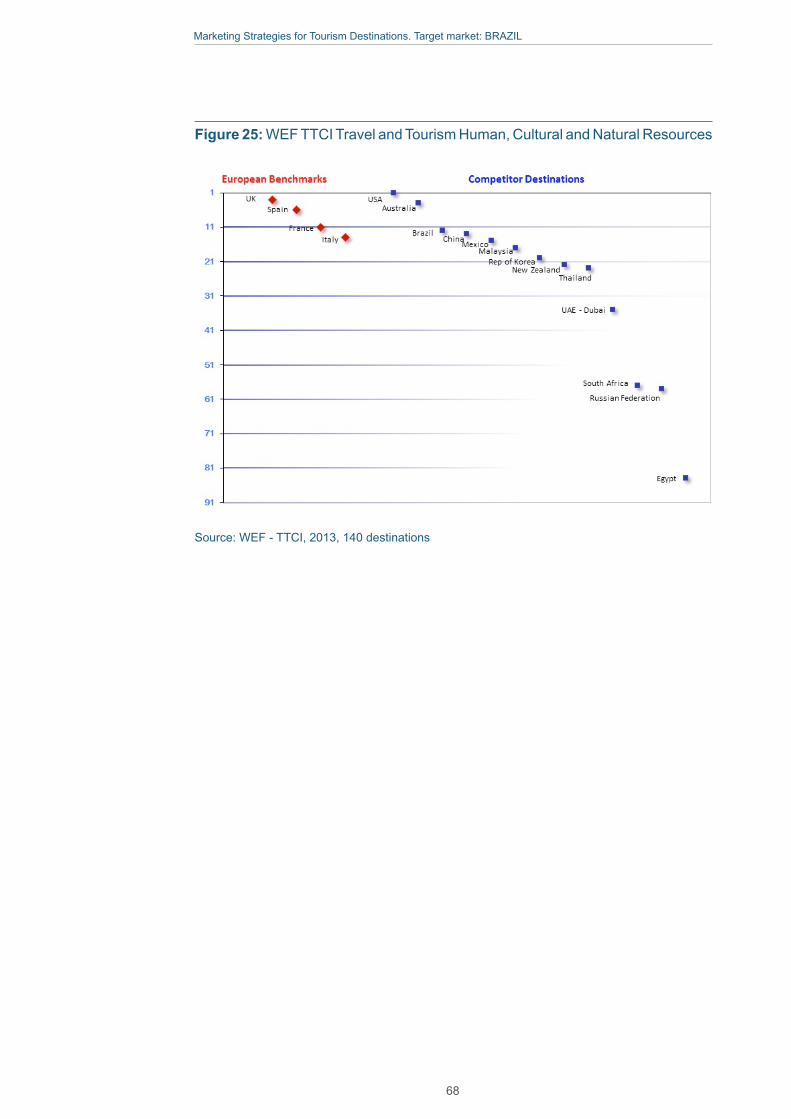
Marketing Strategies for Tourism Destinations. Target market: BRAZIL
Figure 25: WEF TTCI Travel and Tourism Human, Cultural and Natural Resources
Source: WEF - TTCI, 2013, 140 destinations
68
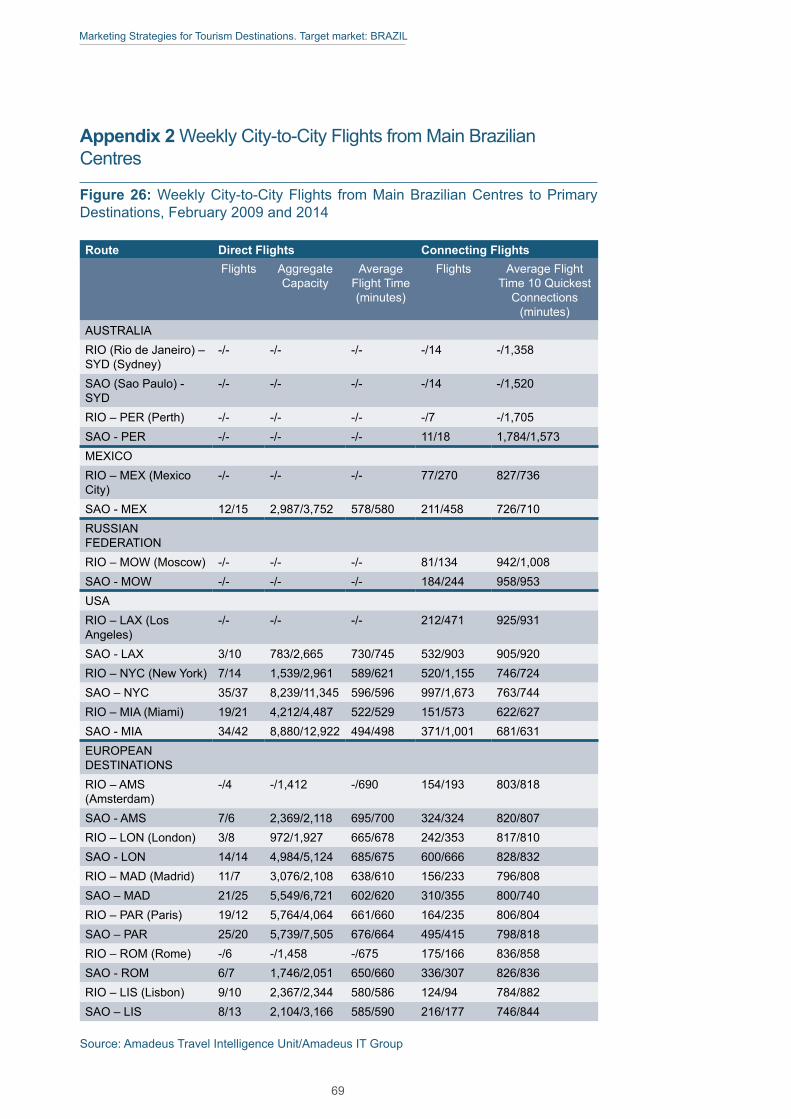
Marketing Strategies for Tourism Destinations. Target market: BRAZIL
Appendix 2 Weekly City-to-City Flights from Main Brazilian Centres
Figure 26: Weekly City-to-City Flights from Main Brazilian Centres to Primary Destinations, February 2009 and 2014
Route Direct Flights Connecting FlightsFlights Aggregate
CapacityAverage
Flight Time (minutes)
Flights Average Flight Time 10 Quickest
Connections (minutes)
AUSTRALIARIO (Rio de Janeiro) – SYD (Sydney)
-/- -/- -/- -/14 -/1,358
SAO (Sao Paulo) - SYD
-/- -/- -/- -/14 -/1,520
RIO – PER (Perth) -/- -/- -/- -/7 -/1,705SAO - PER -/- -/- -/- 11/18 1,784/1,573MEXICORIO – MEX (Mexico City)
-/- -/- -/- 77/270 827/736
SAO - MEX 12/15 2,987/3,752 578/580 211/458 726/710RUSSIAN FEDERATIONRIO – MOW (Moscow) -/- -/- -/- 81/134 942/1,008SAO - MOW -/- -/- -/- 184/244 958/953USARIO – LAX (Los Angeles)
-/- -/- -/- 212/471 925/931
SAO - LAX 3/10 783/2,665 730/745 532/903 905/920RIO – NYC (New York) 7/14 1,539/2,961 589/621 520/1,155 746/724SAO – NYC 35/37 8,239/11,345 596/596 997/1,673 763/744RIO – MIA (Miami) 19/21 4,212/4,487 522/529 151/573 622/627SAO - MIA 34/42 8,880/12,922 494/498 371/1,001 681/631EUROPEAN DESTINATIONSRIO – AMS (Amsterdam)
-/4 -/1,412 -/690 154/193 803/818
SAO - AMS 7/6 2,369/2,118 695/700 324/324 820/807RIO – LON (London) 3/8 972/1,927 665/678 242/353 817/810SAO - LON 14/14 4,984/5,124 685/675 600/666 828/832RIO – MAD (Madrid) 11/7 3,076/2,108 638/610 156/233 796/808SAO – MAD 21/25 5,549/6,721 602/620 310/355 800/740RIO – PAR (Paris) 19/12 5,764/4,064 661/660 164/235 806/804SAO – PAR 25/20 5,739/7,505 676/664 495/415 798/818RIO – ROM (Rome) -/6 -/1,458 -/675 175/166 836/858SAO - ROM 6/7 1,746/2,051 650/660 336/307 826/836RIO – LIS (Lisbon) 9/10 2,367/2,344 580/586 124/94 784/882SAO – LIS 8/13 2,104/3,166 585/590 216/177 746/844
Source: Amadeus Travel Intelligence Unit/Amadeus IT Group
69
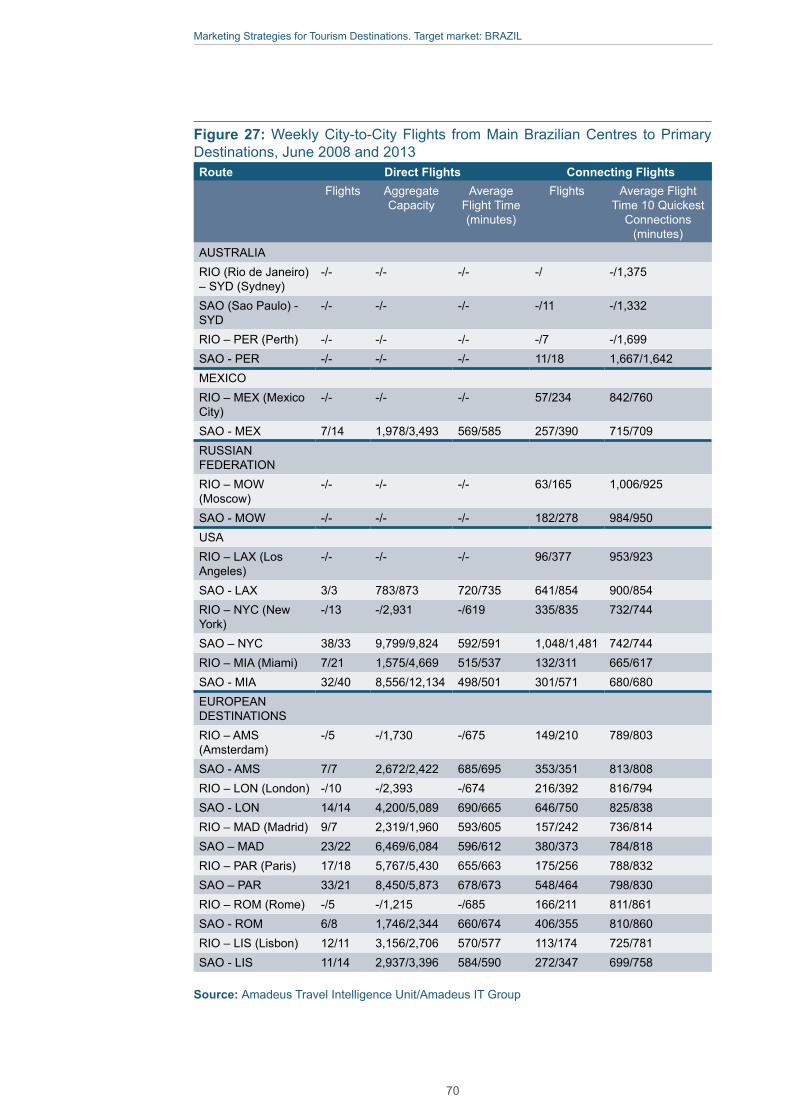
Marketing Strategies for Tourism Destinations. Target market: BRAZIL
Figure 27: Weekly City-to-City Flights from Main Brazilian Centres to Primary Destinations, June 2008 and 2013Route Direct Flights Connecting Flights
Flights Aggregate Capacity
Average Flight Time (minutes)
Flights Average Flight Time 10 Quickest
Connections (minutes)
AUSTRALIARIO (Rio de Janeiro) – SYD (Sydney)
-/- -/- -/- -/ -/1,375
SAO (Sao Paulo) - SYD
-/- -/- -/- -/11 -/1,332
RIO – PER (Perth) -/- -/- -/- -/7 -/1,699SAO - PER -/- -/- -/- 11/18 1,667/1,642MEXICORIO – MEX (Mexico City)
-/- -/- -/- 57/234 842/760
SAO - MEX 7/14 1,978/3,493 569/585 257/390 715/709RUSSIAN FEDERATIONRIO – MOW (Moscow)
-/- -/- -/- 63/165 1,006/925
SAO - MOW -/- -/- -/- 182/278 984/950USARIO – LAX (Los Angeles)
-/- -/- -/- 96/377 953/923
SAO - LAX 3/3 783/873 720/735 641/854 900/854RIO – NYC (New York)
-/13 -/2,931 -/619 335/835 732/744
SAO – NYC 38/33 9,799/9,824 592/591 1,048/1,481 742/744RIO – MIA (Miami) 7/21 1,575/4,669 515/537 132/311 665/617SAO - MIA 32/40 8,556/12,134 498/501 301/571 680/680EUROPEAN DESTINATIONSRIO – AMS (Amsterdam)
-/5 -/1,730 -/675 149/210 789/803
SAO - AMS 7/7 2,672/2,422 685/695 353/351 813/808RIO – LON (London) -/10 -/2,393 -/674 216/392 816/794SAO - LON 14/14 4,200/5,089 690/665 646/750 825/838RIO – MAD (Madrid) 9/7 2,319/1,960 593/605 157/242 736/814SAO – MAD 23/22 6,469/6,084 596/612 380/373 784/818RIO – PAR (Paris) 17/18 5,767/5,430 655/663 175/256 788/832SAO – PAR 33/21 8,450/5,873 678/673 548/464 798/830RIO – ROM (Rome) -/5 -/1,215 -/685 166/211 811/861SAO - ROM 6/8 1,746/2,344 660/674 406/355 810/860RIO – LIS (Lisbon) 12/11 3,156/2,706 570/577 113/174 725/781SAO - LIS 11/14 2,937/3,396 584/590 272/347 699/758
Source: Amadeus Travel Intelligence Unit/Amadeus IT Group
70
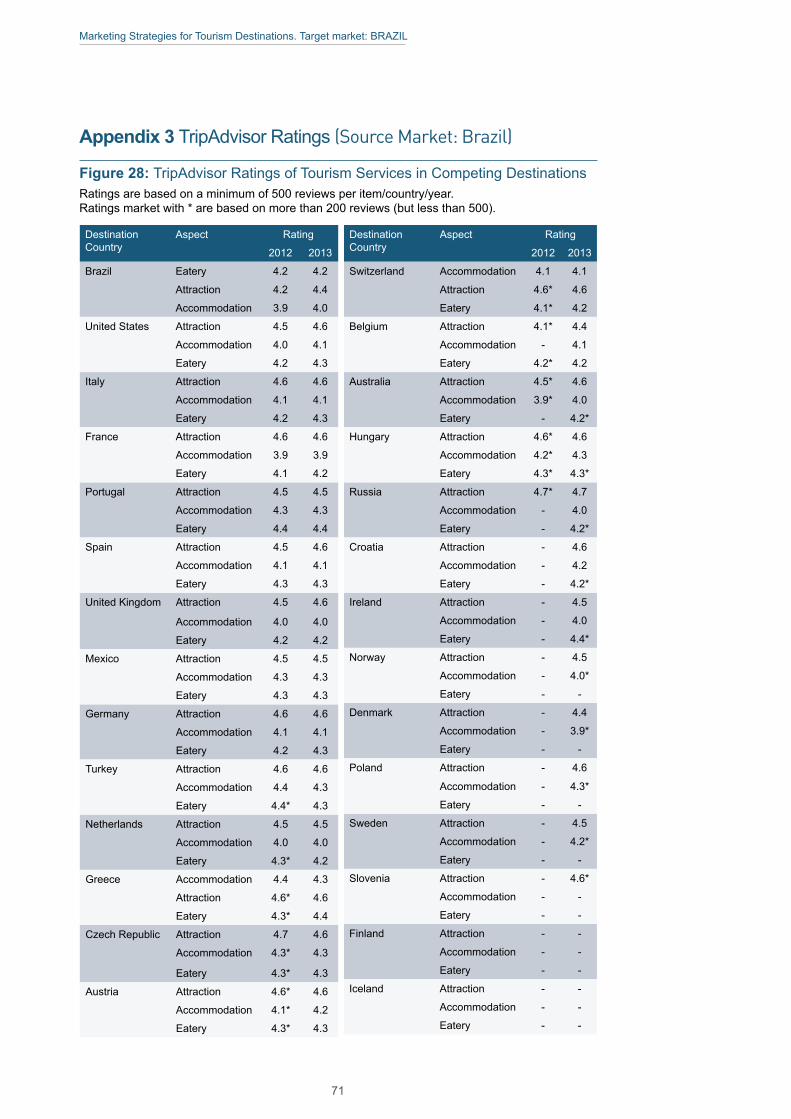
Marketing Strategies for Tourism Destinations. Target market: BRAZIL
Appendix 3 TripAdvisor Ratings (Source Market: Brazil)
Figure 28: TripAdvisor Ratings of Tourism Services in Competing Destinations
Destination Country
Aspect Rating
2012 2013
Switzerland Accommodation 4.1 4.1
Attraction 4.6* 4.6
Eatery 4.1* 4.2
Belgium Attraction 4.1* 4.4
Accommodation - 4.1
Eatery 4.2* 4.2
Australia Attraction 4.5* 4.6
Accommodation 3.9* 4.0
Eatery - 4.2*
Hungary Attraction 4.6* 4.6
Accommodation 4.2* 4.3
Eatery 4.3* 4.3*
Russia Attraction 4.7* 4.7
Accommodation - 4.0
Eatery - 4.2*
Croatia Attraction - 4.6
Accommodation - 4.2
Eatery - 4.2*
Ireland Attraction - 4.5
Accommodation - 4.0
Eatery - 4.4*
Norway Attraction - 4.5
Accommodation - 4.0*
Eatery - -
Denmark Attraction - 4.4
Accommodation - 3.9*
Eatery - -
Poland Attraction - 4.6
Accommodation - 4.3*
Eatery - -
Sweden Attraction - 4.5
Accommodation - 4.2*
Eatery - -
Slovenia Attraction - 4.6*
Accommodation - -
Eatery - -
Finland Attraction - -
Accommodation - -
Eatery - -
Iceland Attraction - -
Accommodation - -
Eatery - -
Destination Country
Aspect Rating
2012 2013
Brazil Eatery 4.2 4.2
Attraction 4.2 4.4
Accommodation 3.9 4.0
United States Attraction 4.5 4.6
Accommodation 4.0 4.1
Eatery 4.2 4.3
Italy Attraction 4.6 4.6
Accommodation 4.1 4.1
Eatery 4.2 4.3
France Attraction 4.6 4.6
Accommodation 3.9 3.9
Eatery 4.1 4.2
Portugal Attraction 4.5 4.5
Accommodation 4.3 4.3
Eatery 4.4 4.4
Spain Attraction 4.5 4.6
Accommodation 4.1 4.1
Eatery 4.3 4.3
United Kingdom Attraction 4.5 4.6
Accommodation 4.0 4.0
Eatery 4.2 4.2
Mexico Attraction 4.5 4.5
Accommodation 4.3 4.3
Eatery 4.3 4.3
Germany Attraction 4.6 4.6
Accommodation 4.1 4.1
Eatery 4.2 4.3
Turkey Attraction 4.6 4.6
Accommodation 4.4 4.3
Eatery 4.4* 4.3
Netherlands Attraction 4.5 4.5
Accommodation 4.0 4.0
Eatery 4.3* 4.2
Greece Accommodation 4.4 4.3
Attraction 4.6* 4.6
Eatery 4.3* 4.4
Czech Republic Attraction 4.7 4.6
Accommodation 4.3* 4.3
Eatery 4.3* 4.3
Austria Attraction 4.6* 4.6
Accommodation 4.1* 4.2
Eatery 4.3* 4.3
Ratings are based on a minimum of 500 reviews per item/country/year.Ratings market with * are based on more than 200 reviews (but less than 500).
71
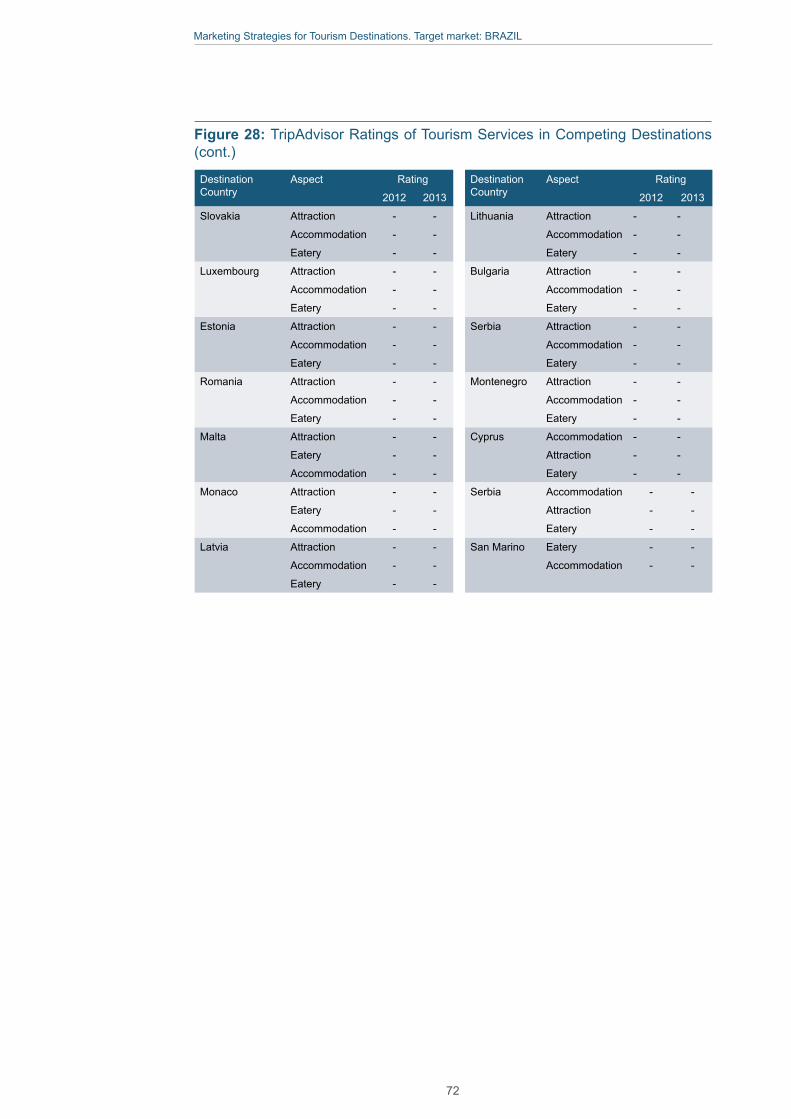
Marketing Strategies for Tourism Destinations. Target market: BRAZIL
Destination Country
Aspect Rating
2012 2013
Slovakia Attraction - -
Accommodation - -
Eatery - -
Luxembourg Attraction - -
Accommodation - -
Eatery - -
Estonia Attraction - -
Accommodation - -
Eatery - -
Romania Attraction - -
Accommodation - -
Eatery - -
Malta Attraction - -
Eatery - -
Accommodation - -
Monaco Attraction - -
Eatery - -
Accommodation - -
Latvia Attraction - -
Accommodation - -
Eatery - -
Destination Country
Aspect Rating
2012 2013
Lithuania Attraction - -
Accommodation - -
Eatery - -
Bulgaria Attraction - -
Accommodation - -
Eatery - -
Serbia Attraction - -
Accommodation - -
Eatery - -
Montenegro Attraction - -
Accommodation - -
Eatery - -
Cyprus Accommodation - -
Attraction - -
Eatery - -
Serbia Accommodation - -
Attraction - -
Eatery - -
San Marino Eatery - -
Accommodation - -
Figure 28: TripAdvisor Ratings of Tourism Services in Competing Destinations (cont.)
72
Marketing Strategies for Tourism Destinations. Target market: BRAZIL
Appendix 4 Bibliography and References
The following reports, plans and other documentation have been consulted. Ref-erences are given as footnotes in the body of the report and are not reproduced below.
• Brazil Market Profile, Canadian Tourism Commission, January 2013• Brazil Market Insights, Canadian Tourism Commission, 2011• Brazil Country Report, Stark Tourism Forum, 2011• Brazil Travel Insight, World Travel Market Latin America, 2013• Brasil Mercado em Ficha, Turismo de Portugal, November 2013• Brasil Dossier de Mercado, Turismo de Portugal, August 2013• BRAZTOA Yearbook, 2011• Chinese and Brazilian Outbound Tourism Markets and Netnography,
ETC, 7th UNWTO/PATA Forum on Tourism Trends and Outlook, Oc-tober 2013
• ETC Market Insights: Brazil, 2009• Aquarela Plan 2020 International Tourism Marketing, Brazilian Ministry
of Tourism through Embratur, December 2009• 2007-2010 National Tourism Plan: a Journey Towards Inclusion, Bra-
zilian Ministry of Tourism, 2007• Understanding Brazilian Outbound Tourism, What the Brazilian Blogo-
sphere is Saying about Europe, UNWTO & ETC, 2013• ITB World Travel Trends Report 2012/1013, December 2012• The Travel Habits of Brazilians: US Tops as Most Popular, Skift Travel
IQ, September 2013• The Boom in Brazilians Travelling to the United States. D. Riker & J.
Vila-Goulding, Journal of International Commerce and Economics, US International Trade Commission, January 2013
• Brazil Market Profile, Tourism Australia, 2013 http://www.tourism.aus-tralia.com/documents/Markets/MP-2013_Brazil-Web.pdf
• The Travel Habits of Brazilians: US Tops as Most Popular http://skift.com/2013/09/07/the-travel-habits-of-brazilians-u-s-tops-as-most-pop-ular/ PA
73
Marketing Strategies for Tourism Destinations. Target market: BRAZIL
Statistics, reports and other data relating to all markets• OECD Tourism Trends and Policies 2014. March 2014. OECD Sched-
uled air traffic from each market into Europe, 2012, IATA• Scheduled air traffic from all global origins into Europe, Jan – June
2014, IATA ETC Survey of Members’ Priorities: Markets and Products for 2014-15. ETC ETC Marketing Activity Report, 2013, ETC
• Tourism Satellite Accounts in Europe, 2010, EUROSTAT Methodolo-gies and Working Papers ITB World Travel Trends Report, 2011/12. IPK Consulting
• Europe, the world’s No 1 tourist destination – a new political frame-work for tourism in Europe, June 2010, European Commission
• The Travel and Tourism Competitiveness Report, 2013, World Eco-nomic Forum UNWTO World Tourism Barometer, Volume 12, January 2014
• Tourism Towards 2030/Global Overview, UNWTO, October 2011• UNWTO 25th CAP-CSA and UNWTO Conference on Sustainable
Tourism Development, April 2013• 2011 Census. Australian Bureau of Statistics• Australian National Accounts: Tourism Satellite Account 2012-13. Aus-
tralian Bureau of Statistics• Tourist Satellite Account, 2011-12, Australia Bureau of Statistics, 2013• Tourism 2020, Tourism Australia’s Journey 2010 to 2013, Tourism Aus-
tralia, October 2013 Portfolio Budget Statements 2013-14 Budget Re-lated Paper 1.16 Resources, Energy and Tourism Portfolio. Tourism Australia Budget
• Tourism Australia’s 2012-13 Annual Report Malaysian Population and Housing Census 2010 New Zealand 2013 Census. Statistics New Zealand
• Key Tourism Statistics. Ministry of Business, Innovation and Employ-ment, New Zealand, January 2014
• Russian Tourism Policies and Trends. February 2011 Thailand’s Na-tional Tourism Development Plan
• Travel and Tourism Economic Impact 2013 Thailand. World Travel and Tourism Council Sustainable Tourism Development in Thailand. UNW-TO Conference on Sustainable Tourism Development, April 2013
• TAT Policy and Marketing Plan• Fast Facts: US Travel and Tourism Industry 2013. International Trade
Administration, Industry and Analysis, National Travel and Tourism Of-fice. April 2014
• CIA World Factbook• Race reporting for the Asian population by selected categories, 2010.
US Census Bureau Megatrends: Ten new directions transforming our lives, 1982. Naisbitt, J.
74