Embed Size (px)
Citation preview
Swine Manure-Based Pilot-Scale Algal BiomassProduction System for Fuel Production and WastewaterTreatment—a Case Study
Min Min & Bing Hu & Michael J. Mohr & Aimin Shi &Jinfeng Ding & Yong Sun & Yongcheng Jiang & Zongqiang Fu &
Richard Griffith & Fida Hussain & Dongyan Mu & Yong Nie &
Paul Chen & Wenguang Zhou & Roger Ruan
Received: 19 April 2013 /Accepted: 14 October 2013 /Published online: 8 November 2013# Springer Science+Business Media New York 2013
Abstract Integration of wastewater treatment with algae cultivation is one of thepromising ways to achieve an economically viable and environmentally sustainable algalbiofuel production on a commercial scale. This study focused on pilot-scale algal biomassproduction system development, cultivation process optimization, and integration withswine manure wastewater treatment. The areal algal biomass productivity for thecultivation system that we developed ranged from 8.08 to 14.59 and 19.15–23.19 g/m2×day, based on ash-free dry weight and total suspended solid (TSS),respectively, which were higher than or comparable with those in literature. Theharvested algal biomass had lipid content about 1.77–3.55 %, which was relativelylow, but could be converted to bio-oil via fast microwave-assisted pyrolysis systemdeveloped in our lab. The lipids in the harvested algal biomass had a significantly higherpercentage of total unsaturated fatty acids than those grown in lab conditions, which maybe attributed to the observed temperature and light fluctuations. The nutrient removal ratewas highly correlated to the biomass productivity. The NH3-N, TN, COD, and PO4-Preduction rates for the north-located photo-bioreactor (PBR-N) in July were 2.65, 3.19,7.21, and 0.067 g/m2×day, respectively, which were higher than those in other studies.The cultivation system had advantages of high mixotrophic growth rate, low operatingcost, as well as reduced land footprint due to the stacked-tray bioreactor design used inthe study.
Keywords Algalbiofuelproductionsystem.Swinemanure .Nutrient removal rate .Pilot scale
Appl Biochem Biotechnol (2014) 172:1390–1406DOI 10.1007/s12010-013-0603-6
M. Min : B. Hu :M. J. Mohr : A. Shi : J. Ding : Y. Sun :Y. Jiang : Z. Fu : R. Griffith : F. Hussain :D. Mu : Y. Nie : P. Chen :W. Zhou (*) : R. Ruan (*)Center for Biorefining, Bioproducts and Biosystems Engineering Department, University of Minnesota,1390 Eckles Ave, Saint Paul, MN 55108, USAe-mail: [email protected]: [email protected]
Introduction
Wastes generated from livestock operations, especially from increasingly concentratedanimal feeding operations (CAFOs), present a high risk to water quality. The risk is notonly due to the increased volume of waste but also due to the pollutants, such as nutrients,organic matter, pathogens, salts, and odorous materials [1]. Contaminants from animal wastecan enter the environment through leakage from poorly constructed manure lagoons, orduring major precipitation events resulting in overflow of lagoons and runoff from recentapplications of wastes to farm fields. Excessive application of animal waste or application tosaturated land can result in direct runoff to watercourses, with the potential to cause severepollution. Application of slurries to land overlying aquifers can result in directcontamination or, more commonly, elevation of nitrogen levels (such as nitrite or nitrate).Furthermore, this contamination could happen even at recommended application rates. Forexample, Westerman et al. [2] found 3–6 mg/L nitrate (NO3) in surface runoff from sprayfields that received swine effluent at recommended rates. Stone et al. [3] measured 6–8 mg/Ltotal inorganic nitrogen (N) and 0.7–1.3 mg/L phosphorus (P) in a stream adjacent to swineeffluent spray fields. Therefore, there is an urgent need to find more effective andenvironmentally friendly alternative ways to manure management.
On the other hand, animal manure contains high-strength nutrients of organic carbon,nitrogen, and phosphorus, and therefore, wastewater has been perceived as a valuableresource of water, energy, and plant nutrients [4]. Today, approximately 1.2×10⁷ t/year ofdairy and swine wastewaters are generated, which contain about 6.0×10⁴ t of nitrogen and1.8×104 t of phosphorus [5]. Microalgae are considered a tool for extracting these nutrientsfor biofuel production. Numerous studies so far recommended incorporating wastewater intoalgae cultivation system to enhance environmental and economic performance of algalbiofuel industry. Swine manure, rich in organic carbon substrates and other nutrients suchas nitrogen and phosphorus, is an excellent source of fertilizers for farming. The ability ofraw and anaerobically digested swine manure to support algae growth in different scales wasdemonstrated by many researches. Algal biomass productivity ranged significantly from0.68 to 27.7 g/m2×day, depending on algal strains, nutrient profile of swine manure andcultivation conditions. Godos et al. [6] evaluated the performance of two 464-L high-ratealgal ponds (HRAPs) while treating 20- and 10-fold diluted swine manure at 10 days ofhydraulic residence time during July to September and found that both HRAPs supported astable and efficient carbon and nitrogen oxidation performance with average chemicaloxygen demand (COD) and total Kjeldahl nitrogen (TKN) removal efficiencies of 76±11 % and 88±6 % obtained, respectively, and biomass productivities ranging from 21 to28 g/m2×day. Kebede-Westhead et al. [5] used a laboratory-scale algal turf scrubber units todetermine how algal productivity and nutrient removal efficiencies of turf algae changed inresponse to different loading rates of raw swine manure effluent, and their results showedthat the algae productivities ranged from 7.1 to 9.4 g/m2×day. Sevrin-Reyssac [7] tested aswine manure-based raceway pond near Paris, France, operating year round in a temperatearea and demonstrated that the average algal productivity was 0.68 g/m2×day during thewinter and reached 6–9 g/m2×day in the summer.
In this study, a unique swine manure-based pilot-scale algal biomass production system wasdeveloped. The objective of this paper is to report on our experience with the developed photo-bioreactor under Minnesota summer condition by using diluted swine manure for algal biomassproductivity and nutrient removal efficiency. The experience and results could be used todevelop an optimum operation strategy aimed at producing maximal algal biomass yieldcombined with relatively high nutrient removal efficiency.
Appl Biochem Biotechnol (2014) 172:1390–1406 1391
Material and Methods
Algae Strain and Seed Culture Conditions
Alga strain UMN271 was originally screened from the water samples collected fromLoon Lake, Waseca, MN, and was identified as a Chlorella sp. strain [8]. This strainwas selected to be used in this study due to its high tolerance to manure wastewaterenvironment, fast growth rate, and robustness to environmental shock, desirablecharacteristics for large-scale algae biomass production where cultivation conditionsare not tightly controlled.
Manure
Fresh liquid swine manure was delivered on a regular basis from a farm 5 miles northeast ofthe University of Minnesota Outreach, Research and Education (UMore) Park which islocated at Rosemount, MN. After 21 days of digestion, the digested manure was fed into thephoto-bioreactor (PBR) directly according to the nutrient level we wanted to maintain. Dueto the high concentration of nutrient and high turbidity, the manure was generally diluted15∼20 times before being injected into the PBR.
Our previous study showed that the COD in digested manure did not decreasesignificantly even though the algae growth and removal of other nutrients wereobserved. This suggests that the organic compounds were not readily assimilable byalgae and other microorganisms [9]. In order to identify the organic compounds in thedigested manure, an organic fraction was prepared by mixing 5 mL of digestedmanure with 5 mL chloroform on a vortex for 1 min followed by filtering, and theresultant filtrate was analyzed using a gas chromatography–mass spectrometry (GC-MS)(Agilent 7890-5975C) with a HP-5 MS capillary column. This method was describedpreviously in the publication of Li et al. [10].
Photo Bioreactor
The system we developed was a greenhouse-based vertically arranged multilayerstructure (Fig. 1a, b). The system included a greenhouse, a temperature-controlledcurtain on each side, a digester (Fig. 1c), and a photo-bioreactor (PBR) that consistedof a supporting frame, a stack of four trays, a mixing tank, a sump pump, a CO2
tank, and a pH controller. In order to create a relative controllable environment, astandard high tunnel greenhouse (30 ft×48 ft×12 ft) was set up at the UMore Park,Rosemount, MN in which two PBRs were installed. Each PBR had an overalldimension of 4 ft (W)×32 ft (L)×8 ft (H) in which each tray can hold up to 6 in.of water equivalent to a volume of 1,800 L. With the mixing tank and four trays, thetotal capacity of each PBR was 7,500 L. Figure 1a–c illustrated the setup of thegreenhouse and the PBR.
In the PBR, the tray was made using a 3.5-mm-thick twin-wall plastic panel whichwas made of high-density polyethylene infused with UV inhibitors (Solexx, OR). Ineach tray, the water level was held up by using an overflow pipe. A 0.5-hp sumppump lifted the water from the mixing tank to the top layer of the PBR. The waterthen flowed down to the next layer through the overflow pipe by gravity and finallycame back to the mixing tank. Carbon dioxide supplied by a CO2 cylinder that wasused as carbon source as well as for pH adjustment was installed in line at the outlet
1392 Appl Biochem Biotechnol (2014) 172:1390–1406
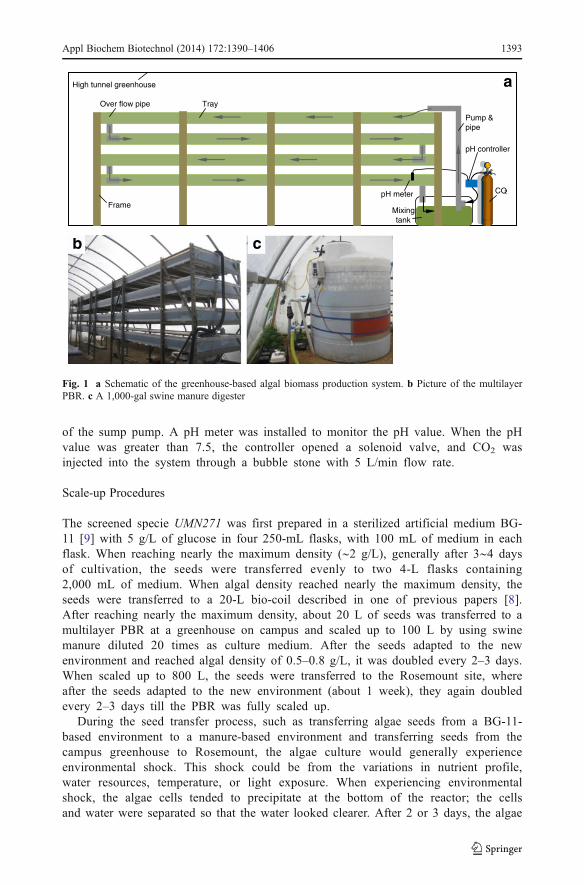
of the sump pump. A pH meter was installed to monitor the pH value. When the pHvalue was greater than 7.5, the controller opened a solenoid valve, and CO2 wasinjected into the system through a bubble stone with 5 L/min flow rate.
Scale-up Procedures
The screened specie UMN271 was first prepared in a sterilized artificial medium BG-11 [9] with 5 g/L of glucose in four 250-mL flasks, with 100 mL of medium in eachflask. When reaching nearly the maximum density (∼2 g/L), generally after 3∼4 daysof cultivation, the seeds were transferred evenly to two 4-L flasks containing2,000 mL of medium. When algal density reached nearly the maximum density, theseeds were transferred to a 20-L bio-coil described in one of previous papers [8].After reaching nearly the maximum density, about 20 L of seeds was transferred to amultilayer PBR at a greenhouse on campus and scaled up to 100 L by using swinemanure diluted 20 times as culture medium. After the seeds adapted to the newenvironment and reached algal density of 0.5–0.8 g/L, it was doubled every 2–3 days.When scaled up to 800 L, the seeds were transferred to the Rosemount site, whereafter the seeds adapted to the new environment (about 1 week), they again doubledevery 2–3 days till the PBR was fully scaled up.
During the seed transfer process, such as transferring algae seeds from a BG-11-based environment to a manure-based environment and transferring seeds from thecampus greenhouse to Rosemount, the algae culture would generally experienceenvironmental shock. This shock could be from the variations in nutrient profile,water resources, temperature, or light exposure. When experiencing environmentalshock, the algae cells tended to precipitate at the bottom of the reactor; the cellsand water were separated so that the water looked clearer. After 2 or 3 days, the algae
CO2
Mixing tank
Pump & pipe
Tray
High tunnel greenhouse
Frame
pH controller
pH meter
Over flow pipe
a
b c
Fig. 1 a Schematic of the greenhouse-based algal biomass production system. b Picture of the multilayerPBR. c A 1,000-gal swine manure digester
Appl Biochem Biotechnol (2014) 172:1390–1406 1393
cells would be able to adapt to the new environment and start to float in the waterand the water turned back to a green color gradually.
Experiment Setup and Operational Procedure
After the multilayer-based algae cultivation system was successfully developed, aseries of experiments were designed to test algal biomass and algal lipid productivityand also nutrient removal rate and the water recycling concepts. Since two PBRs wereavailable at the Rosemount inside the greenhouse, the PBR on the north side (PBR-Nhereafter) used a water recycle procedure in which water was recycled after algaebiomass was harvested. The PBR on the south side (PBR-S hereafter) was used ascontrol without water cycling, in which the harvested algae and water were dischargedto an outside field, and fresh water and manure were filled after each harvesting. BothPBRs were harvested three times a week which was equal to a 4-day hydraulicretention time.
Algae Harvesting
Cation polymer Clarifloc C-6244 (PolyDyne, GA) was used for algae biomassharvesting. About 5∼7.5 mL of polymer was used for harvesting 100 L of algaesolution. Polymer was diluted 200 times before added to algae solution to enhanceharvest efficiency. After mixing for 5 min and then allowing 5 min for settling, thealgae biomass was ready to separate with a filter cloth (50-μm pore size). Afterremoving the algae biomass, the water was pumped back to the PBR-N, and themanure was added according to the nutrient level in the reactor. Although we weretrying to keep a constant COD level in the PBR-N, it was hard to judge how muchmanure should be added due to the delay of obtaining the analytical results and thevariations in the weather. The addition of manure was between 1/80 and 1/40 of thetotal volume.
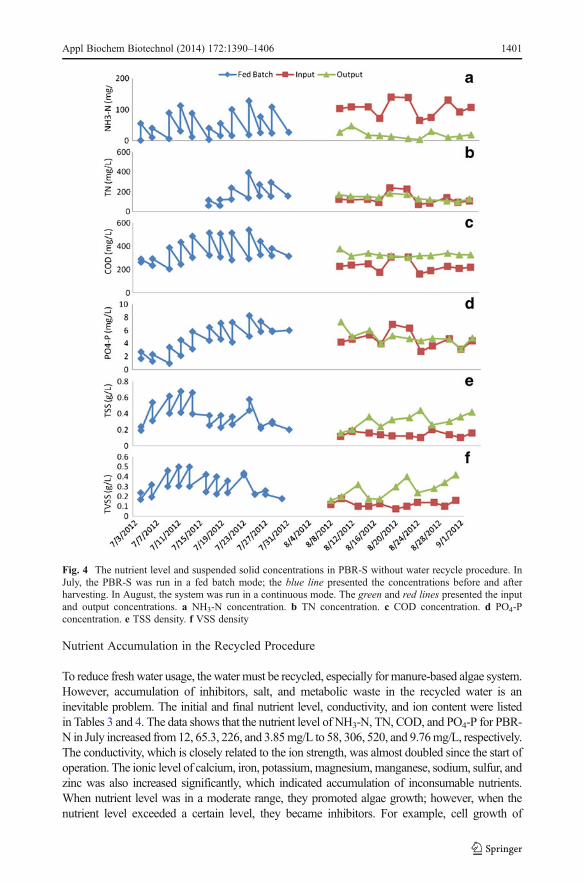
A 2-month period (July–August, 2012) was used to run these experiments. In July 2012,PBR-S was run by using a batch fed method in which ½ of the volume was harvested everyother day, and water and manure were replenished. Due to the environmental shockobserved, in August, the PBR-S was changed to continuous harvesting method in whichfresh water and manure were fed continuously, and algae culture was also harvestedcontinuously by using a controlled pump.
Analysis Methods
The weather condition (temperature and light intensity) was obtained from the nearestweather station which was 300 m away from the greenhouse. Volume of culture, pH, ionconductivity, harvested volume, and volume of added water and manure were recorded eachtime before and after harvest. Soluble nutrient, ammonia (NH3-N), total nitrogen (TN),chemical oxygen demand (COD), and total phosphorus (TP) were analyzed according to theHach DR5000 spectrophotometer manual [11]. Total suspended solid (TSS) and totalvolatile suspended solid (TVSS) were analyzed in accordance with the standard methods[12]. Conductivity as an indicator of salt concentration in algae solution was measured by aconductivity meter (Cole Parmer, model# 19815-00).
In order to test the salt accumulation in the PBR-S with the water recycle procedure, a setof 20 elements, including Al, B, Ba, Ca, Cd, Cr, Cu, Fe, K, Li, Mg, Mn, Mo, Na, Ni, P, Pb,
1394 Appl Biochem Biotechnol (2014) 172:1390–1406
Rb, S, and Zn, was analyzed at the beginning and end of July PBR-N experiment by the SoilTesting Lab at the University of Minnesota, using an inductively coupled plasma (ICP)atomic emission spectrometer (Perkin Elmer Optima 3000, USA).
Biomass Productivity and Nutrient Removal Efficiency
Productivity was calculated by the total harvested biomass divided by the water surface areaand days between each harvest. Since it is impossible to separate manure biomass from algalbiomass, the total biomass will contain both manure and algal biomass.
Productivityg
m2� day
� �¼ TSSA−TSSHð Þ⋅Vol
D⋅A
TSSA is the biomass density of algal broth before harvesting, TSSH is the biomass densityafter algae being harvested, Vol is the harvested volume, A is the total water surface area,D means days between two harvests.
The productivity can be presented as total dry biomass productivity (using TSS) or ash-free dry biomass productivity (using TVSS instead of TSS). For PBR-S without waterrecycling, the TSSH=0.
The nutrient removal efficiency can be presented in two forms which are in terms ofpercentage (%) or g
m2 � day :
Nutrient removal efficiency %ð Þ ¼ Nutrientin−Nutrientendð Þ⋅100Nutrientin
%
Nutrient removal effiencyg
m2� day
� �¼ Nutrientin−Nutrientendð Þ⋅Vol
D⋅A
in which Nutrientin is the initial nutrient content after harvesting and replenishing manureinto the system, Nutrientend is the nutrient content after 2 days of cultivation and beforeharvesting, Vol is the harvested volume, A is the total water surface area, D means daysbetween two harvests.
Results and Discussion
Manure Characteristics
The swine manure had high concentration of soluble NH3-N (2.5±0.66 g/L), TN (4.9±2.5 g/L), and COD (7.4±0.27 g/L), but low-soluble TP (0.093±0.005 g/L). The total organiccarbon in manure is 1/3 of the COD, the carbon-to-nitrogen (C/N) ratio of the manure usedin this study would be 0.5, and the nitrogen-to-phosphorus (N/P) ratio would be 53.26,resulting in a C/N/P ratio that was far off the optimal ratio of 106:8:1 for algae growth. TheTSS and VSS of the manure were 4.6±2.1 and 3.42±1.26 g/L, respectively. Table 1 is apartial list of the organic carbons in digested manure detectable by GC-MS. Among the ninepeaks identified by the GC-MS analysis, peaks 5 and 6 which were likely to be 1,3,5-triphenylbenzene made up 14.15 % of the extracted compound. The rest seven peaks wereunidentifiable (quality <50 %). Through library search and comparison, it was found thatmost of these unknown compounds had benzene ring structure imbedded in the fragments. It
Appl Biochem Biotechnol (2014) 172:1390–1406 1395
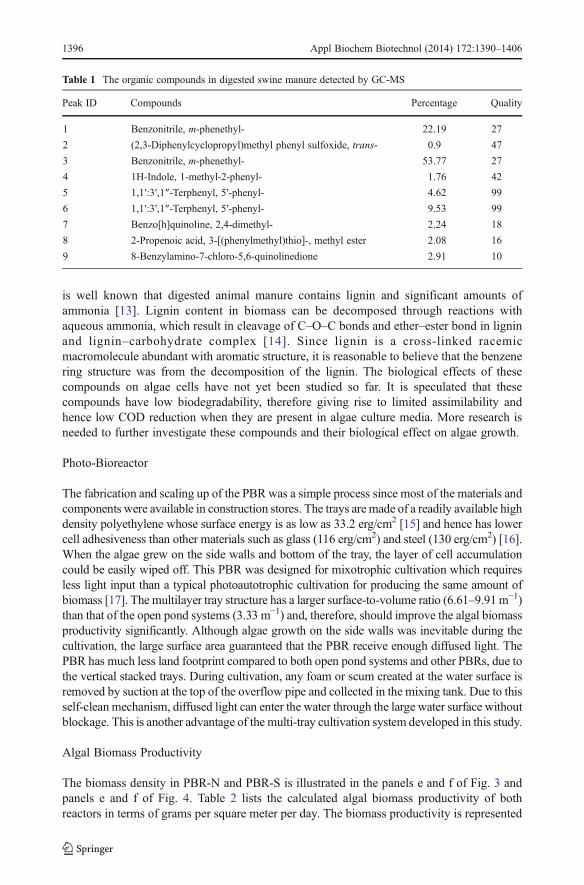
is well known that digested animal manure contains lignin and significant amounts ofammonia [13]. Lignin content in biomass can be decomposed through reactions withaqueous ammonia, which result in cleavage of C–O–C bonds and ether–ester bond in ligninand lignin–carbohydrate complex [14]. Since lignin is a cross-linked racemicmacromolecule abundant with aromatic structure, it is reasonable to believe that the benzenering structure was from the decomposition of the lignin. The biological effects of thesecompounds on algae cells have not yet been studied so far. It is speculated that thesecompounds have low biodegradability, therefore giving rise to limited assimilability andhence low COD reduction when they are present in algae culture media. More research isneeded to further investigate these compounds and their biological effect on algae growth.
Photo-Bioreactor
The fabrication and scaling up of the PBR was a simple process since most of the materials andcomponents were available in construction stores. The trays are made of a readily available highdensity polyethylene whose surface energy is as low as 33.2 erg/cm2 [15] and hence has lowercell adhesiveness than other materials such as glass (116 erg/cm2) and steel (130 erg/cm2) [16].When the algae grew on the side walls and bottom of the tray, the layer of cell accumulationcould be easily wiped off. This PBR was designed for mixotrophic cultivation which requiresless light input than a typical photoautotrophic cultivation for producing the same amount ofbiomass [17]. The multilayer tray structure has a larger surface-to-volume ratio (6.61–9.91m−1)than that of the open pond systems (3.33 m−1) and, therefore, should improve the algal biomassproductivity significantly. Although algae growth on the side walls was inevitable during thecultivation, the large surface area guaranteed that the PBR receive enough diffused light. ThePBR has much less land footprint compared to both open pond systems and other PBRs, due tothe vertical stacked trays. During cultivation, any foam or scum created at the water surface isremoved by suction at the top of the overflow pipe and collected in the mixing tank. Due to thisself-clean mechanism, diffused light can enter the water through the large water surface withoutblockage. This is another advantage of the multi-tray cultivation system developed in this study.
Algal Biomass Productivity
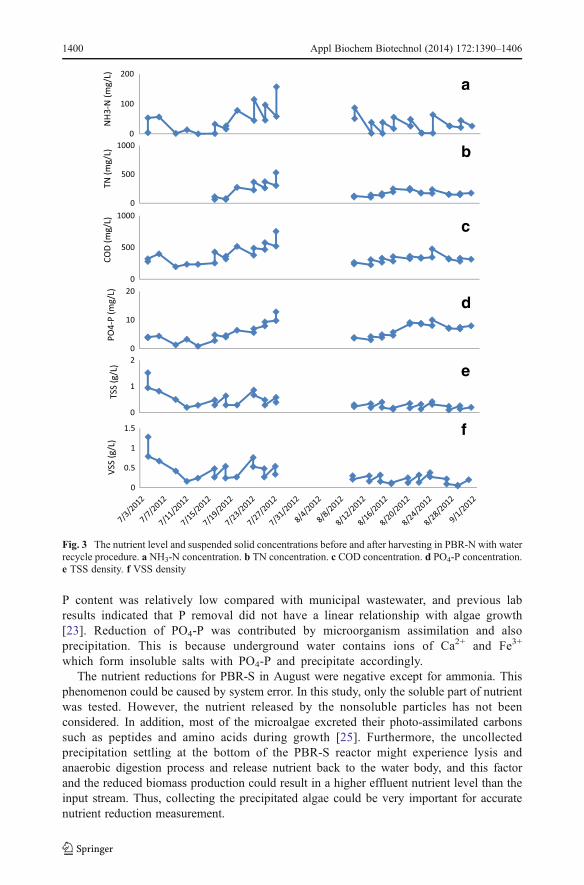
The biomass density in PBR-N and PBR-S is illustrated in the panels e and f of Fig. 3 andpanels e and f of Fig. 4. Table 2 lists the calculated algal biomass productivity of bothreactors in terms of grams per square meter per day. The biomass productivity is represented
Table 1 The organic compounds in digested swine manure detected by GC-MS
Peak ID Compounds Percentage Quality
1 Benzonitrile, m-phenethyl- 22.19 27
2 (2,3-Diphenylcyclopropyl)methyl phenyl sulfoxide, trans- 0.9 47
3 Benzonitrile, m-phenethyl- 53.77 27
4 1H-Indole, 1-methyl-2-phenyl- 1.76 42
5 1,1′:3′,1″-Terphenyl, 5′-phenyl- 4.62 99
6 1,1′:3′,1″-Terphenyl, 5′-phenyl- 9.53 99
7 Benzo[h]quinoline, 2,4-dimethyl- 2.24 18
8 2-Propenoic acid, 3-[(phenylmethyl)thio]-, methyl ester 2.08 16
9 8-Benzylamino-7-chloro-5,6-quinolinedione 2.91 10
1396 Appl Biochem Biotechnol (2014) 172:1390–1406
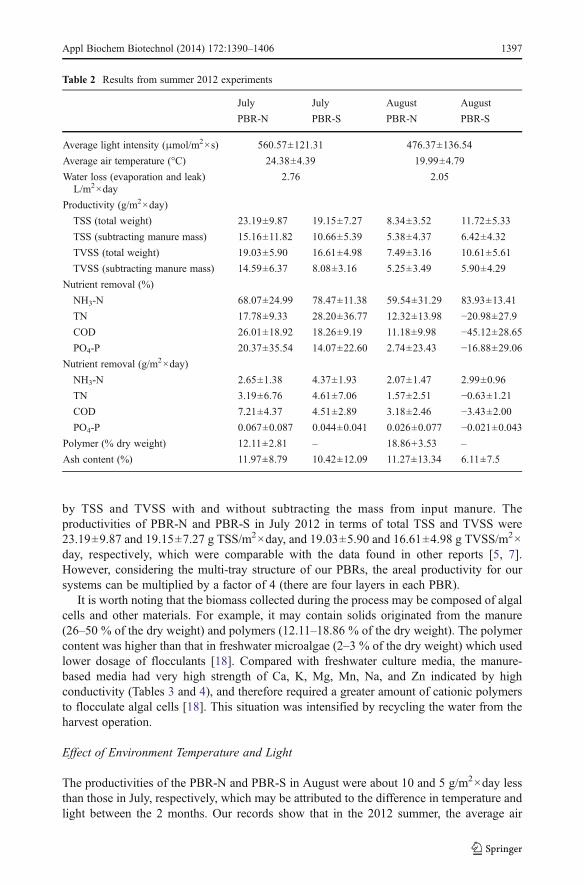
by TSS and TVSS with and without subtracting the mass from input manure. Theproductivities of PBR-N and PBR-S in July 2012 in terms of total TSS and TVSS were23.19±9.87 and 19.15±7.27 g TSS/m2×day, and 19.03±5.90 and 16.61±4.98 g TVSS/m2×day, respectively, which were comparable with the data found in other reports [5, 7].However, considering the multi-tray structure of our PBRs, the areal productivity for oursystems can be multiplied by a factor of 4 (there are four layers in each PBR).
It is worth noting that the biomass collected during the process may be composed of algalcells and other materials. For example, it may contain solids originated from the manure(26–50 % of the dry weight) and polymers (12.11–18.86 % of the dry weight). The polymercontent was higher than that in freshwater microalgae (2–3 % of the dry weight) which usedlower dosage of flocculants [18]. Compared with freshwater culture media, the manure-based media had very high strength of Ca, K, Mg, Mn, Na, and Zn indicated by highconductivity (Tables 3 and 4), and therefore required a greater amount of cationic polymersto flocculate algal cells [18]. This situation was intensified by recycling the water from theharvest operation.
Effect of Environment Temperature and Light
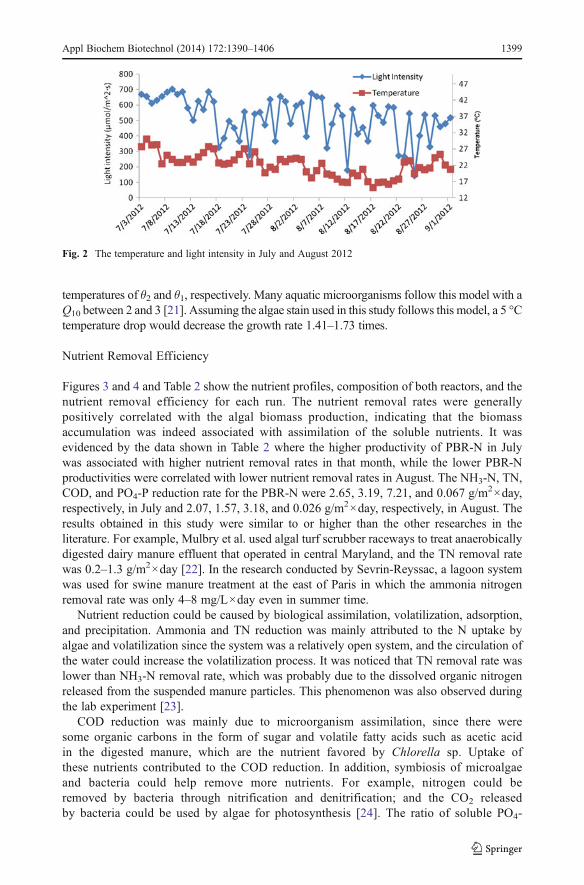
The productivities of the PBR-N and PBR-S in August were about 10 and 5 g/m2×day lessthan those in July, respectively, which may be attributed to the difference in temperature andlight between the 2 months. Our records show that in the 2012 summer, the average air
Table 2 Results from summer 2012 experiments
July July August August
PBR-N PBR-S PBR-N PBR-S
Average light intensity (μmol/m2×s) 560.57±121.31 476.37±136.54
Average air temperature (°C) 24.38±4.39 19.99±4.79
Water loss (evaporation and leak)L/m2×day
2.76 2.05
Productivity (g/m2×day)
TSS (total weight) 23.19±9.87 19.15±7.27 8.34±3.52 11.72±5.33
TSS (subtracting manure mass) 15.16±11.82 10.66±5.39 5.38±4.37 6.42±4.32
TVSS (total weight) 19.03±5.90 16.61±4.98 7.49±3.16 10.61±5.61
TVSS (subtracting manure mass) 14.59±6.37 8.08±3.16 5.25±3.49 5.90±4.29
Nutrient removal (%)
NH3-N 68.07±24.99 78.47±11.38 59.54±31.29 83.93±13.41
TN 17.78±9.33 28.20±36.77 12.32±13.98 −20.98±27.9COD 26.01±18.92 18.26±9.19 11.18±9.98 −45.12±28.65PO4-P 20.37±35.54 14.07±22.60 2.74±23.43 −16.88±29.06
Nutrient removal (g/m2×day)
NH3-N 2.65±1.38 4.37±1.93 2.07±1.47 2.99±0.96
TN 3.19±6.76 4.61±7.06 1.57±2.51 −0.63±1.21COD 7.21±4.37 4.51±2.89 3.18±2.46 −3.43±2.00PO4-P 0.067±0.087 0.044±0.041 0.026±0.077 −0.021±0.043
Polymer (% dry weight) 12.11±2.81 – 18.86+3.53 –
Ash content (%) 11.97±8.79 10.42±12.09 11.27±13.34 6.11±7.5
Appl Biochem Biotechnol (2014) 172:1390–1406 1397
temperature and 24 h-averaged light intensity in the region were 24.38 °C and560.57 μmol/m2×s in July, and 19.99 °C and 476.37 μmol/m2×s in August, (Table 2 andFig. 2). The plastic film of the greenhouse attenuated 30–35 % of the light intensity.
The productivity from PBR-S without water recycling was lower than that from PBR-Nwith water recycling. This was unexpected because recycling is believed to causeaccumulation of inhibitors and increase in salinity and consequently inhibit algae growth(see detailed data and discussion in “Nutrient Accumulation in the Recycled Procedure”section). One of the possible reasons for this may be the temperature fluctuation experiencedby PBR-S when cold underground water (14–15 °C) was added to the culture media afterharvest of PBR-S to replace half or more water every 2 or 3 days. As a result, the temperaturecould suddenly drop 4–6 °C, causing an environmental shock that might greatly affect algaephysiological activities. In addition, during the several hours before the culture media reach theair temperature, the growth rate was expected to be lower than normal [19–21]. There was awell-established Q10 model to describe the response of growth rate to temperature in a light-saturated condition, which is Q10=(μ2/μ1)
10/(θ2−θ1), where μ2 and μ1 are growth rates at
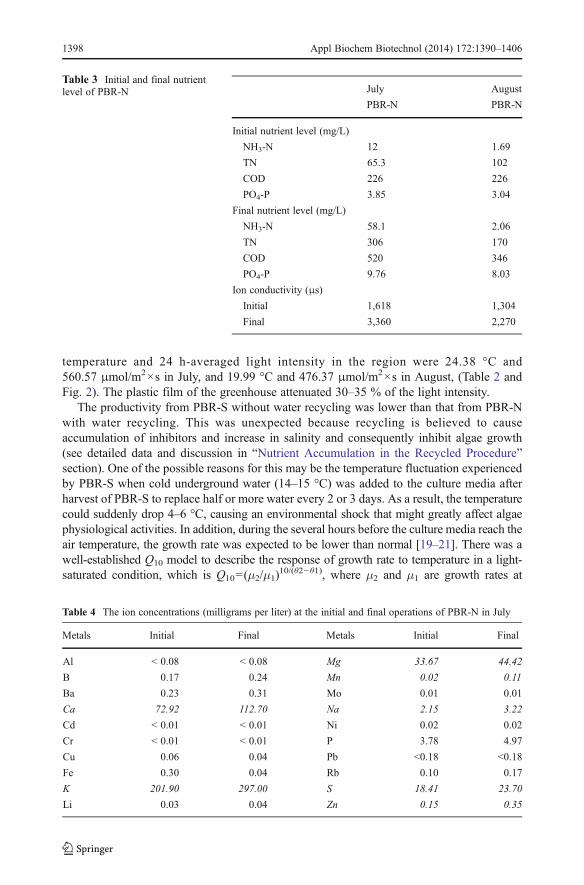
Table 3 Initial and final nutrientlevel of PBR-N July August
PBR-N PBR-N
Initial nutrient level (mg/L)
NH3-N 12 1.69
TN 65.3 102
COD 226 226
PO4-P 3.85 3.04
Final nutrient level (mg/L)
NH3-N 58.1 2.06
TN 306 170
COD 520 346
PO4-P 9.76 8.03
Ion conductivity (μs)
Initial 1,618 1,304
Final 3,360 2,270
Table 4 The ion concentrations (milligrams per liter) at the initial and final operations of PBR-N in July
Metals Initial Final Metals Initial Final
Al < 0.08 < 0.08 Mg 33.67 44.42
B 0.17 0.24 Mn 0.02 0.11
Ba 0.23 0.31 Mo 0.01 0.01
Ca 72.92 112.70 Na 2.15 3.22
Cd < 0.01 < 0.01 Ni 0.02 0.02
Cr < 0.01 < 0.01 P 3.78 4.97
Cu 0.06 0.04 Pb <0.18 <0.18
Fe 0.30 0.04 Rb 0.10 0.17
K 201.90 297.00 S 18.41 23.70
Li 0.03 0.04 Zn 0.15 0.35
1398 Appl Biochem Biotechnol (2014) 172:1390–1406
temperatures of θ2 and θ1, respectively. Many aquatic microorganisms follow this model with aQ10 between 2 and 3 [21]. Assuming the algae stain used in this study follows this model, a 5 °Ctemperature drop would decrease the growth rate 1.41–1.73 times.
Nutrient Removal Efficiency
Figures 3 and 4 and Table 2 show the nutrient profiles, composition of both reactors, and thenutrient removal efficiency for each run. The nutrient removal rates were generallypositively correlated with the algal biomass production, indicating that the biomassaccumulation was indeed associated with assimilation of the soluble nutrients. It wasevidenced by the data shown in Table 2 where the higher productivity of PBR-N in Julywas associated with higher nutrient removal rates in that month, while the lower PBR-Nproductivities were correlated with lower nutrient removal rates in August. The NH3-N, TN,COD, and PO4-P reduction rate for the PBR-N were 2.65, 3.19, 7.21, and 0.067 g/m2×day,respectively, in July and 2.07, 1.57, 3.18, and 0.026 g/m2×day, respectively, in August. Theresults obtained in this study were similar to or higher than the other researches in theliterature. For example, Mulbry et al. used algal turf scrubber raceways to treat anaerobicallydigested dairy manure effluent that operated in central Maryland, and the TN removal ratewas 0.2–1.3 g/m2×day [22]. In the research conducted by Sevrin-Reyssac, a lagoon systemwas used for swine manure treatment at the east of Paris in which the ammonia nitrogenremoval rate was only 4–8 mg/L×day even in summer time.
Nutrient reduction could be caused by biological assimilation, volatilization, adsorption,and precipitation. Ammonia and TN reduction was mainly attributed to the N uptake byalgae and volatilization since the system was a relatively open system, and the circulation ofthe water could increase the volatilization process. It was noticed that TN removal rate waslower than NH3-N removal rate, which was probably due to the dissolved organic nitrogenreleased from the suspended manure particles. This phenomenon was also observed duringthe lab experiment [23].
COD reduction was mainly due to microorganism assimilation, since there weresome organic carbons in the form of sugar and volatile fatty acids such as acetic acidin the digested manure, which are the nutrient favored by Chlorella sp. Uptake ofthese nutrients contributed to the COD reduction. In addition, symbiosis of microalgaeand bacteria could help remove more nutrients. For example, nitrogen could beremoved by bacteria through nitrification and denitrification; and the CO2 releasedby bacteria could be used by algae for photosynthesis [24]. The ratio of soluble PO4-
Fig. 2 The temperature and light intensity in July and August 2012
Appl Biochem Biotechnol (2014) 172:1390–1406 1399
P content was relatively low compared with municipal wastewater, and previous labresults indicated that P removal did not have a linear relationship with algae growth[23]. Reduction of PO4-P was contributed by microorganism assimilation and alsoprecipitation. This is because underground water contains ions of Ca2+ and Fe3+
which form insoluble salts with PO4-P and precipitate accordingly.The nutrient reductions for PBR-S in August were negative except for ammonia. This
phenomenon could be caused by system error. In this study, only the soluble part of nutrientwas tested. However, the nutrient released by the nonsoluble particles has not beenconsidered. In addition, most of the microalgae excreted their photo-assimilated carbonssuch as peptides and amino acids during growth [25]. Furthermore, the uncollectedprecipitation settling at the bottom of the PBR-S reactor might experience lysis andanaerobic digestion process and release nutrient back to the water body, and this factorand the reduced biomass production could result in a higher effluent nutrient level than theinput stream. Thus, collecting the precipitated algae could be very important for accuratenutrient reduction measurement.
a
f
e
d
b
c
Fig. 3 The nutrient level and suspended solid concentrations before and after harvesting in PBR-N with waterrecycle procedure. a NH3-N concentration. b TN concentration. c COD concentration. d PO4-P concentration.e TSS density. f VSS density
1400 Appl Biochem Biotechnol (2014) 172:1390–1406
Nutrient Accumulation in the Recycled Procedure
To reduce fresh water usage, the water must be recycled, especially for manure-based algae system.However, accumulation of inhibitors, salt, and metabolic waste in the recycled water is aninevitable problem. The initial and final nutrient level, conductivity, and ion content were listedin Tables 3 and 4. The data shows that the nutrient level of NH3-N, TN, COD, and PO4-P for PBR-N in July increased from12, 65.3, 226, and 3.85mg/L to 58, 306, 520, and 9.76mg/L, respectively.The conductivity, which is closely related to the ion strength, was almost doubled since the start ofoperation. The ionic level of calcium, iron, potassium,magnesium,manganese, sodium, sulfur, andzinc was also increased significantly, which indicated accumulation of inconsumable nutrients.When nutrient level was in a moderate range, they promoted algae growth; however, when thenutrient level exceeded a certain level, they became inhibitors. For example, cell growth of
Fig. 4 The nutrient level and suspended solid concentrations in PBR-S without water recycle procedure. InJuly, the PBR-S was run in a fed batch mode; the blue line presented the concentrations before and afterharvesting. In August, the system was run in a continuous mode. The green and red lines presented the inputand output concentrations. a NH3-N concentration. b TN concentration. c COD concentration. d PO4-Pconcentration. e TSS density. f VSS density
Appl Biochem Biotechnol (2014) 172:1390–1406 1401
Chlorella vulgaris was 50 % inhibited when NH3-N level was 330 mg/L [26], while completeinhibition of cell division for the same algal species occurred when NH3-N level was 700 mg/L[27]. Meanwhile, during the cultivation, the cells of C. vulgaris could also secret some inhibitorycompounds that could retard their own growth. The amount of these substances seemed to beproportional to the age of the cells [28]. The accumulation of all these inhibitory substances,inconsumable organic nitrogen, and carbon creates a greater hurdle for the algae growth. After a 28-day operation, the PBR-N exhibited a low productivity with TSS of only about 0.2 g/L, and waterhad turned to a brownish color. Similar results were observed during the lab experiments.
Lipid Content and Profile
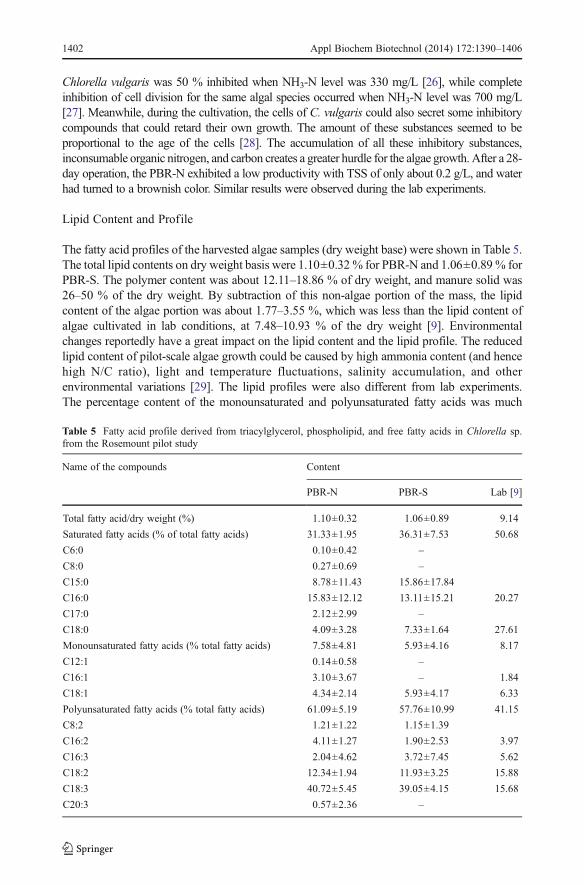
The fatty acid profiles of the harvested algae samples (dry weight base) were shown in Table 5.The total lipid contents on dry weight basis were 1.10±0.32 % for PBR-N and 1.06±0.89 % forPBR-S. The polymer content was about 12.11–18.86 % of dry weight, and manure solid was26–50 % of the dry weight. By subtraction of this non-algae portion of the mass, the lipidcontent of the algae portion was about 1.77–3.55 %, which was less than the lipid content ofalgae cultivated in lab conditions, at 7.48–10.93 % of the dry weight [9]. Environmentalchanges reportedly have a great impact on the lipid content and the lipid profile. The reducedlipid content of pilot-scale algae growth could be caused by high ammonia content (and hencehigh N/C ratio), light and temperature fluctuations, salinity accumulation, and otherenvironmental variations [29]. The lipid profiles were also different from lab experiments.The percentage content of the monounsaturated and polyunsaturated fatty acids was much
Table 5 Fatty acid profile derived from triacylglycerol, phospholipid, and free fatty acids in Chlorella sp.from the Rosemount pilot study
Name of the compounds Content
PBR-N PBR-S Lab [9]
Total fatty acid/dry weight (%) 1.10±0.32 1.06±0.89 9.14
Saturated fatty acids (% of total fatty acids) 31.33±1.95 36.31±7.53 50.68
C6:0 0.10±0.42 –
C8:0 0.27±0.69 –
C15:0 8.78±11.43 15.86±17.84
C16:0 15.83±12.12 13.11±15.21 20.27
C17:0 2.12±2.99 –
C18:0 4.09±3.28 7.33±1.64 27.61
Monounsaturated fatty acids (% total fatty acids) 7.58±4.81 5.93±4.16 8.17
C12:1 0.14±0.58 –
C16:1 3.10±3.67 – 1.84
C18:1 4.34±2.14 5.93±4.17 6.33
Polyunsaturated fatty acids (% total fatty acids) 61.09±5.19 57.76±10.99 41.15
C8:2 1.21±1.22 1.15±1.39
C16:2 4.11±1.27 1.90±2.53 3.97
C16:3 2.04±4.62 3.72±7.45 5.62
C18:2 12.34±1.94 11.93±3.25 15.88
C18:3 40.72±5.45 39.05±4.15 15.68
C20:3 0.57±2.36 –
1402 Appl Biochem Biotechnol (2014) 172:1390–1406
higher (68 %) than the lab result (50 %), and the saturated fatty acids had a lower percentagethan that of the lab experiment (Table 5). The temperature level and temperature fluctuation hadsignificant effects on fatty acid composition and total lipid content. The general consent statedin the literature is that the unsaturated fatty acids increase with decreasing temperature [30].This is consistent with our data, since the water temperature in the lab was constant and set at25 °C, while the field temperature was fluctuated from 14 to 35 °C in July and 7.7–32 °C inAugust 2012. The relationship between temperature and total lipid can be controversial andspecies-specific. A study showed that the lipid content in theChrysophytan ochromonas danica[31] and the Eustigmatophyte nannochloropsis salina [32] increased with increasingtemperature, but not for the Chlorella sorokiniana [33]. Light intensity also had a remarkableeffect on changing chemical composition of algal cells. It was reported that low light inducedmore formation of PUFAs, while high light altered fatty acid synthesis to produce more of thesaturated and monounsaturated fatty acids [30]. This agrees with our results, since the field lightcondition was lower than that of the lab condition.
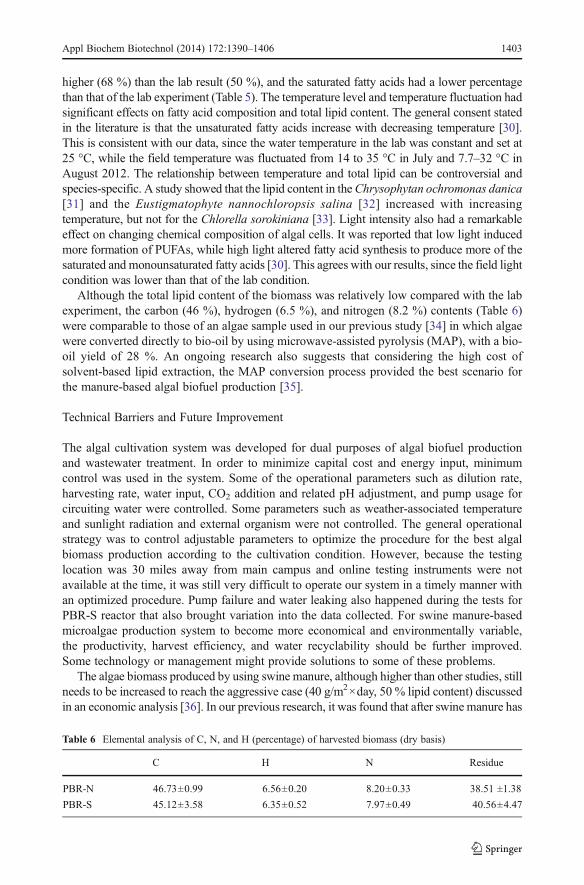
Although the total lipid content of the biomass was relatively low compared with the labexperiment, the carbon (46 %), hydrogen (6.5 %), and nitrogen (8.2 %) contents (Table 6)were comparable to those of an algae sample used in our previous study [34] in which algaewere converted directly to bio-oil by using microwave-assisted pyrolysis (MAP), with a bio-oil yield of 28 %. An ongoing research also suggests that considering the high cost ofsolvent-based lipid extraction, the MAP conversion process provided the best scenario forthe manure-based algal biofuel production [35].
Technical Barriers and Future Improvement
The algal cultivation system was developed for dual purposes of algal biofuel productionand wastewater treatment. In order to minimize capital cost and energy input, minimumcontrol was used in the system. Some of the operational parameters such as dilution rate,harvesting rate, water input, CO2 addition and related pH adjustment, and pump usage forcircuiting water were controlled. Some parameters such as weather-associated temperatureand sunlight radiation and external organism were not controlled. The general operationalstrategy was to control adjustable parameters to optimize the procedure for the best algalbiomass production according to the cultivation condition. However, because the testinglocation was 30 miles away from main campus and online testing instruments were notavailable at the time, it was still very difficult to operate our system in a timely manner withan optimized procedure. Pump failure and water leaking also happened during the tests forPBR-S reactor that also brought variation into the data collected. For swine manure-basedmicroalgae production system to become more economical and environmentally variable,the productivity, harvest efficiency, and water recyclability should be further improved.Some technology or management might provide solutions to some of these problems.
The algae biomass produced by using swine manure, although higher than other studies, stillneeds to be increased to reach the aggressive case (40 g/m2×day, 50 % lipid content) discussedin an economic analysis [36]. In our previous research, it was found that after swine manure has
Table 6 Elemental analysis of C, N, and H (percentage) of harvested biomass (dry basis)
C H N Residue
PBR-N 46.73±0.99 6.56±0.20 8.20±0.33 38.51 ±1.38
PBR-S 45.12±3.58 6.35±0.52 7.97±0.49 40.56±4.47
Appl Biochem Biotechnol (2014) 172:1390–1406 1403
been digested, biodegradable COD became scarcer. There were limited sugar and volatile fattyacids (VFAs), such as acetic acid, propionic acid, and butyric acid, available in the digestedswine manure, which were proven to promote algae growth [9]. One measure that couldpotentially improve the biomass productivity is to use acidogenic fermented swine manure toreplace the anaerobic digested manure. Hu et al. [9] found that by using swine manure diluted20 times with 1 mL/L addition of the abovementionedVFAs, the algal biomass density could betripled after a 6-day cultivation. Later on, an optimized condition of 10 times of dilution ratewith 3 days of hydraulic retention time was found to maximize the productivity with about 10%lipid content [23]. If this process was used in a large-scale system, althoughmethane productionwas lost, the biomass production is expected to be at least doubled, and water usage efficiencyshould be improved by 50–100 % due to the lower dilution rate used.
Water recyclability was directly related to the quality of treated wastewater; right now, thereis no feasible method to treat the manure wastewater to an acceptable discharge level exceptthrough land application. For better nutrient removal, longer hydraulic retention time during thealgae cultivation should be used, but this process will reduce algal biomass productivity. Theaccumulation of inhibitors is an unavoidable problem; the system must be flushed with freshwater after certain amount of water recycle. If the system could be colocated with an irrigationsystem, then fresh water could be provided for the periodically flushing and the unused nutrientin the blowdown water might be used along the irrigation line.
Although algae precipitation is a big issue that raised much attention during cultivation, itmight be used for the harvesting process. Polymer flocculation was used in this study for fastcollection of algae biomass and obtaining recycled water, but it was proved to be inefficientin this system. Using precipitation to collect the biomass might be a better option if time andsome loss of biomass could be tolerated. But the precipitated algae should first be collectedout of the PBR. An alternative design was needed for better collection of the precipitation, ora mixing device should be added.
Conclusions
Wastewater-basedmicroalga biomass production system is considered as one of the most promisingways for algal biofuel production due to its economic and environmental viability. In the currentstudy, a greenhouse-based algae biomass production system was developed, which had greatadvantages of low cost, high scalability, minimum footprint, etc. The areal productivity of ash-free dry algal biomass ranged from 8.08 to 14.59 g/m2×day, and total TSS ranged from 19.15 to23.19 g/m2×day, which were comparable or higher than the reported productivities derived from asimilar research using swine manure. The nutrient removal ratio/efficiency was proportional to thebiomass productivity. Although many barriers exist, microalgae have considerable potential toimprove the environmental impact of wastewater facilities and introduce the beneficial reuse ofwastewater. More research should be carried out to improve such a system.
References
1. Aneja, V. P., Nelson, D. R., Roelle, P. A., Walker, J. T., & Battye, W. (2003). Agricultural ammoniaemissions and ammonium concentrations associated with aerosols and precipitation in the southeastUnited States. Journal of Geophysical Research: Atmospheres, 108(D4), 1984–2012.
2. Westerman, P. W., Huffman, R. L., & Feng, J. S. (1995). Swine-lagoon seepage in sandy soil.Transactions of the ASAE, 38(6), 1749–1760.
1404 Appl Biochem Biotechnol (2014) 172:1390–1406
3. Stone, K. C., Hunt, P. G., Coffey, S.W., &Matheny, T. A. (1995).Water quality status of a USDAwater qualitydemonstration project in the Eastern Coastal Plain. Journal of Soil and Water Conservation, 50(5), 567–571.
4. Asano, T., Burton, F. L., Leverenz, H. L., Tsuchihashi, R., & Tchobanoglous, G. (2007). Water reuse,issues, technologies, and applications (p. 1570). New York: McGraw-Hill.
5. Kebede-Westhead, E., Pizarro, C., & Mulbry, W. W. (2006). Treatment of swine manure effluent usingfreshwater algae: production, nutrient recovery, and elemental composition of algal biomass at foureffluent loading rates. Journal of Applied Phycology, 18(1), 41–46.
6. Godos, I. D., Blanco, S., García-Encina, P. A., Becares, E., & Muñoz, R. (2009). Long-term operation ofhigh rate algal ponds for the bioremediation of piggery wastewaters at high loading rates. BioresourceTechnology, 100(19), 4332–4339.
7. Sevrin-Reyssac, J. (1998). Biotreatment of swine manure by production of aquatic valuable biomasses.Agriculture, Ecosystems & Environment, 68(3), 177–186.
8. Zhou, W., Hu, B., Li, Y., Min, M., Mohr, M., Du, Z., & Ruan, R. (2012). Mass cultivation of microalgaeon animal wastewater: a sequential two-stage cultivation process for energy crop and omega-3-rich animalfeed production. Applied Biochemistry and Biotechnology, 168(2), 348–363.
9. Hu, B., Min, M., Zhou, W., Du, Z., Mohr, M., Chen, P., & Ruan, R. (2012). Enhanced mixotrophic growthof microalga Chlorella sp. on pretreated swine manure for simultaneous biofuel feedstock production andnutrient removal. Bioresource Technology, 126, 71–79.
10. Li, Y., Zhou, W., Hu, B., Min, M., Chen, P., & Ruan, R. R. (2011). Integration of algae cultivation asbiodiesel production feedstock with municipal wastewater treatment: strains screening and significanceevaluation of environmental factors. Bioresource Technology, 102(23), 10861–10867.
11. Hach Inc. (2008). DR5000 spectrophotometer procedures manual (2nd ed.). Loveland: Hach Company.12. APHA. (1998). Standard methods for the examination of water and wastewater. Washington: American
Public Health Association.13. Chen, S., Liao, W., Liu, C., Wen, Z., Kincaid, R. L., Harrison, J. H., & Stevens, D. J. (2003). Value-added
chemicals from animal manure (no. PNNL-14495). Richland: Pacific Northwest National Lab.Environmental Molecular Sciences Laboratory.
14. Kim, T. H., Kim, J. S., Sunwoo, C., & Lee, Y. Y. (2003). Pretreatment of corn stover by aqueousammonia. Bioresource Technology, 90(1), 39–47.
15. Ikada, Y., Suzuki, M., & Tamada, Y. (1985). Polymer surfaces possessing minimal interaction with bloodcomponents (In polymers as biomaterials, pp. 135–147). New York: Springer.
16. Hallab, N. J., Bundy, K. J., O’Connor, K., Moses, R. L., & Jacobs, J. J. (2001). Evaluation of metallic andpolymeric biomaterial surface energy and surface roughness characteristics for directed cell adhesion.Tissue Engineering, 7(1), 55–71.
17. Min, M., Hu, B., Zhou, W., Li, Y., Chen, P., & Ruan, R. (2012). Mutual influence of light and CO2 oncarbon sequestration via cultivating mixotrophic alga Auxenochlorella protothecoides UMN280 in anorganic carbon-rich wastewater. Journal of Applied Phycology, 24(5), 1099–1105.
18. Bilanovic, D., Shelef, G., & Sukenik, A. (1988). Flocculation of microalgae with cationic polymers—effects of medium salinity. Biomass, 17(1), 65–76.
19. Montagnes, D. J., Kimmance, S. A., & Atkinson, D. (2003). Using Q10: can growth rates increase linearlywith temperature? Aquatic Microbial Ecology, 32(3), 307–313.
20. Sorokin, C., & Krauss, R. W. (1962). Effects of temperature & illuminance on chlorella growth uncoupledfrom cell division. Plant Physiology, 37(1), 37.
21. Choi, J. W., & Peters, F. (1992). Effects of temperature on two psychrophilic ecotypes of a heterotrophicnanoflagellate, Paraphysomonas imperforata. Applied and Environmental Microbiology, 58(2), 593–599.
22. Mulbry, W., Kondrad, S., Pizarro, C., & Kebede-Westhead, E. (2008). Treatment of dairy manure effluentusing freshwater algae: algal productivity and recovery of manure nutrients using pilot-scale algal turfscrubbers. Bioresource Technology, 99(17), 8137–8142.
23. Hu, B., Zhou, W., Min, M., Du, Z., Chen, P., Ma, X., & Ruan, R. (2013). Development of an effectiveacidogenically digested swine manure-based algal system for improved wastewater treatment and biofueland feed production. Applied Energy, 107, 255–263.
24. Cole, J. J. (1982). Interactions between bacteria and algae in aquatic ecosystems. Annual Review ofEcology and Systematics, 13, 291–314.
25. Hellebust, J. A. (1965). Excretion of some organic compounds by marine phytoplankton. Limnology andOceanography, 10, 192–206.
26. Przytocka-Jusiak, M., Duszota, M., Matusiak, K., &Mycielski, R. (1984). Intensive culture ofChlorella vulgaris/AA as the second stage of biological purification of nitrogen industry wastewaters.Water Research, 18(1), 1–7.
27. Matusiak, K., Przytocka-Jusiak, M., Leszczyńska-Gerula, K., & Horoch, M. (1976). Studies on thepurification of wastewater from the nitrogen fertilizer industry by intensive algal cultures. II. Removalof nitrogen from the wastewater. Acta Microbiologica Polonica, 25(4), 361.
Appl Biochem Biotechnol (2014) 172:1390–1406 1405
28. Pratt, R., Oneto, J. F., & Pratt, J. (1945). Studies on Chlorella vulgaris. X. Influence of the age of theculture on the accumulation of chlorellin. American Journal of Botany, 32, 405–408.
29. Roessler, P. G. (1990). Environmental control of glycerolipid metabolism in microalgae: commercialimplications and future research directions. Journal of Phycology, 26(3), 393–399.
30. Hu, Q., Sommerfeld, M., Jarvis, E., Ghirardi, M., Posewitz, M., Seibert, M., & Darzins, A. (2008).Microalgal triacylglycerols as feedstocks for biofuel production: perspectives and advances. The PlantJournal, 54(4), 621–639.
31. Aaronson, S. (1973). Effect of incubation temperature on the macromolecular and lipid content of thephytoflagellate Ochromonas danica. Journal of Phycology, 9(1), 111–113.
32. Boussiba, S., Vonshak, A., Cohen, Z., Avissar, Y., & Richmond, A. (1987). Lipid and biomass productionby the halotolerant microalga Nannochloropsis salina. Biomass, 12(1), 37–47.
33. Patterson, G. (1970). Effect of temperature on fatty acid composition of Chlorella sorokiniana. Lipids,5(7), 597–600.
34. Du, Z., Li, Y., Wang, X., Wan, Y., Chen, Q., Wang, C., & Ruan, R. (2011). Microwave-assisted pyrolysisof microalgae for biofuel production. Bioresource Technology, 102(7), 4890–4896.
35. Mu, D., Min, M., Hill, J. (2013). Life cycle environmental impacts of novel technologies in the productionof wastewater-based algal biofuels. Journal of Environmental Science and Technology. (in press)
36. Sun, A., Davis, R., Starbuck, M., Ben-Amotz, A., Pate, R., & Pienkos, P. T. (2011). Comparative costanalysis of algal oil production for biofuels. Energy, 36(8), 5169–5179.
1406 Appl Biochem Biotechnol (2014) 172:1390–1406