Embed Size (px)
Citation preview
SUSTAINABLE FINANCE REVIEWRefinitiv deals intelligence
FIRST NINE MONTHS 2020 WITH A FOREWORD FOR HSBC
1
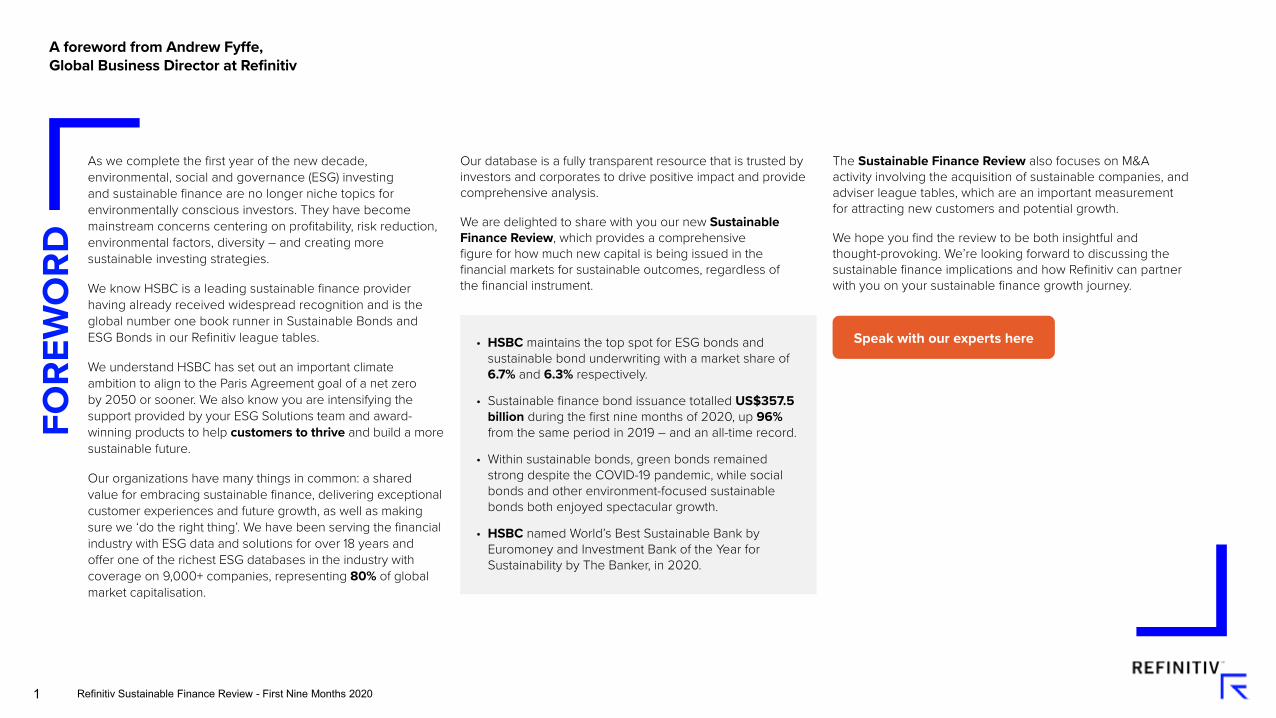
As we complete the first year of the new decade, environmental, social and governance (ESG) investing and sustainable finance are no longer niche topics for environmentally conscious investors. They have become mainstream concerns centering on profitability, risk reduction, environmental factors, diversity – and creating more sustainable investing strategies.
We know HSBC is a leading sustainable finance provider having already received widespread recognition and is the global number one book runner in Sustainable Bonds and ESG Bonds in our Refinitiv league tables.
We understand HSBC has set out an important climate ambition to align to the Paris Agreement goal of a net zero by 2050 or sooner. We also know you are intensifying the support provided by your ESG Solutions team and award-winning products to help customers to thrive and build a more sustainable future.
Our organizations have many things in common: a shared value for embracing sustainable finance, delivering exceptional customer experiences and future growth, as well as making sure we ‘do the right thing’. We have been serving the financial industry with ESG data and solutions for over 18 years and offer one of the richest ESG databases in the industry with coverage on 9,000+ companies, representing 80% of global market capitalisation.
Our database is a fully transparent resource that is trusted by investors and corporates to drive positive impact and provide comprehensive analysis.
We are delighted to share with you our new Sustainable Finance Review, which provides a comprehensive figure for how much new capital is being issued in the financial markets for sustainable outcomes, regardless of the financial instrument.
• HSBC maintains the top spot for ESG bonds and
sustainable bond underwriting with a market share of 6.7% and 6.3% respectively.
• Sustainable finance bond issuance totalled US$357.5 billion during the first nine months of 2020, up 96% from the same period in 2019 – and an all-time record.
• Within sustainable bonds, green bonds remained strong despite the COVID-19 pandemic, while social bonds and other environment-focused sustainable bonds both enjoyed spectacular growth.
• HSBC named World’s Best Sustainable Bank by Euromoney and Investment Bank of the Year for Sustainability by The Banker, in 2020.
The Sustainable Finance Review also focuses on M&A activity involving the acquisition of sustainable companies, and adviser league tables, which are an important measurement for attracting new customers and potential growth.
We hope you find the review to be both insightful and thought-provoking. We’re looking forward to discussing the sustainable finance implications and how Refinitiv can partner with you on your sustainable finance growth journey.
FORE
WO
RDA foreword from Andrew Fyffe, Global Business Director at Refinitiv
Speak with our experts here
2
Sustainable Finance Review: Overview
Refinitiv Sustainable Finance Review - First Nine Months 2020
SUSTAINABLE EQUITY CAPITAL MARKETS SUSTAINABLE MERGERS & ACQUISITIONS
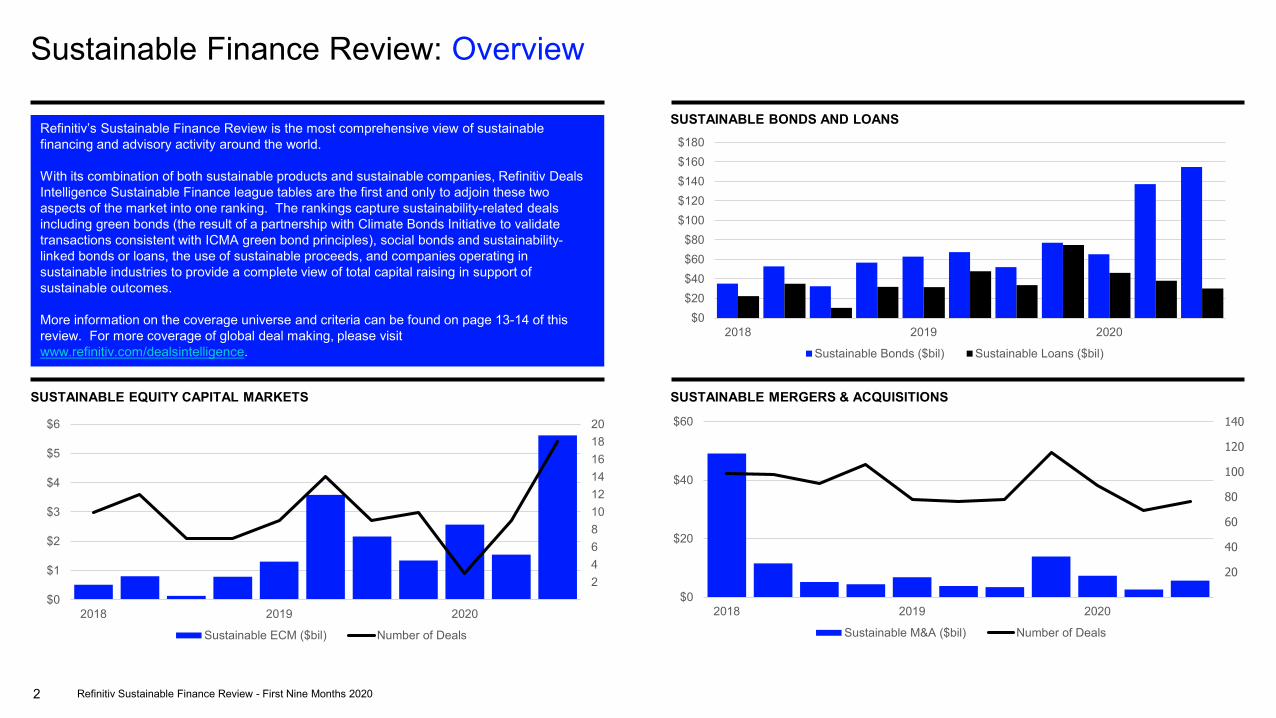
SUSTAINABLE BONDS AND LOANSRefinitiv’s Sustainable Finance Review is the most comprehensive view of sustainable financing and advisory activity around the world.
With its combination of both sustainable products and sustainable companies, Refinitiv Deals Intelligence Sustainable Finance league tables are the first and only to adjoin these two aspects of the market into one ranking. The rankings capture sustainability-related deals including green bonds (the result of a partnership with Climate Bonds Initiative to validate transactions consistent with ICMA green bond principles), social bonds and sustainability-linked bonds or loans, the use of sustainable proceeds, and companies operating in sustainable industries to provide a complete view of total capital raising in support of sustainable outcomes.
More information on the coverage universe and criteria can be found on page 13-14 of this review. For more coverage of global deal making, please visit www.refinitiv.com/dealsintelligence.
2468101214161820
$0
$1
$2
$3
$4
$5
$6
2018 2019 2020
Sustainable ECM ($bil) Number of Deals
$0$20$40$60$80
$100$120$140$160$180
2018 2019 2020
Sustainable Bonds ($bil) Sustainable Loans ($bil)
20
40
60
80
100
120
140
$0
$20
$40
$60
2018 2019 2020
Sustainable M&A ($bil) Number of Deals

3
First Nine Months 2020 Highlights
Debt Capital Markets• Sustainable Finance bonds totalled US$154.8 billion during the third quarter of 2020, up 13% compared to the second quarter of 2020 and more than double the proceeds
registered during the third quarter of 2019. The third quarter of 2020 marks the highest quarterly total, by proceeds and number of issues, since our records began in 2015. Sustainable Finance bonds totalled US$357.5 billion during the first nine months of 2020, up 96% from the same period in 2019 and an all-time record.
• Green bond issuance accelerated during the third quarter, reaching an all-time record of US$76.5 billion from 171 issues. Driven by an increase in capital raising by sovereigns, multilaterals and banks for Covid-19 relief and recovery efforts, the Sustainability and Social bond categories each surpassed US$30 billion for the second consecutive quarter.
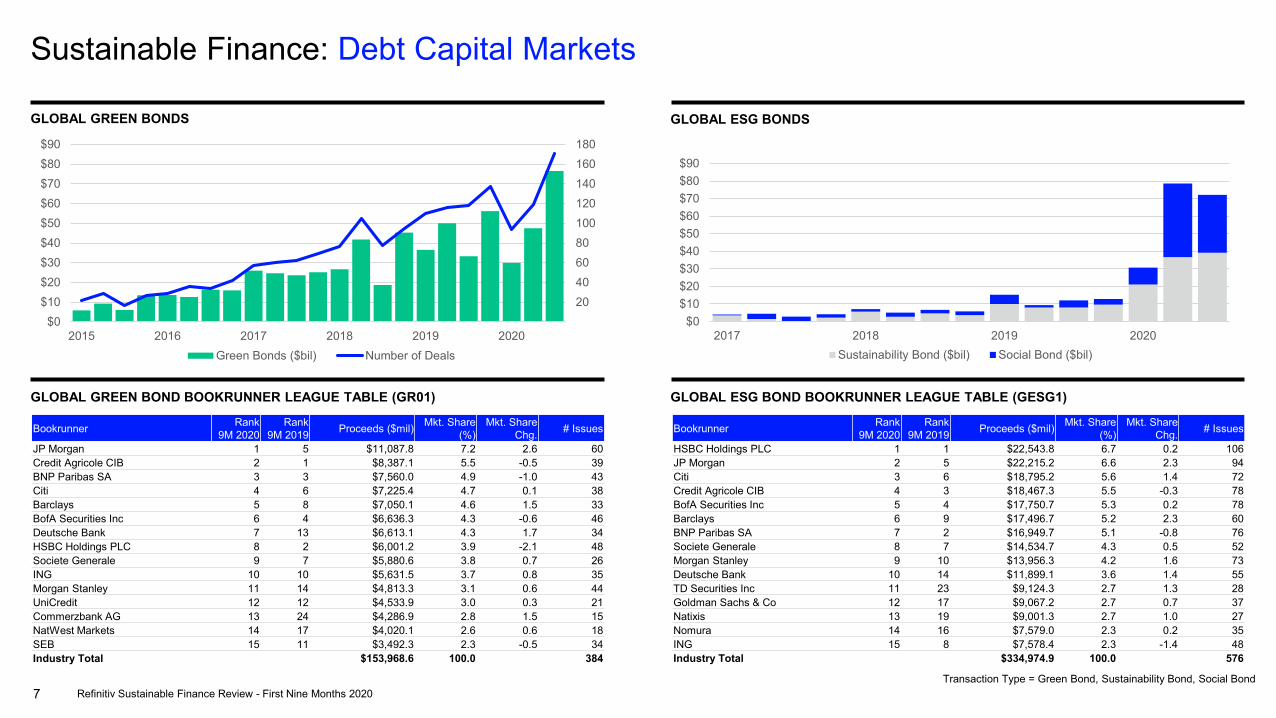
• US$84.5 billion worth of Social bonds were recorded globally during the first nine months of 2020, nearly eight times the total raised through the first nine months of 2019. Social bond issuance accounts for almost one-quarter of the sustainable bond market during 2020, compared to 6% during the first nine months of 2019.
• Sustainability bond issuance reached US$97.0 billion during the first nine months of 2020, more than triple the levels seen during the first nine months of 2019. The number of Sustainability bonds increased 101% compared to a year ago.
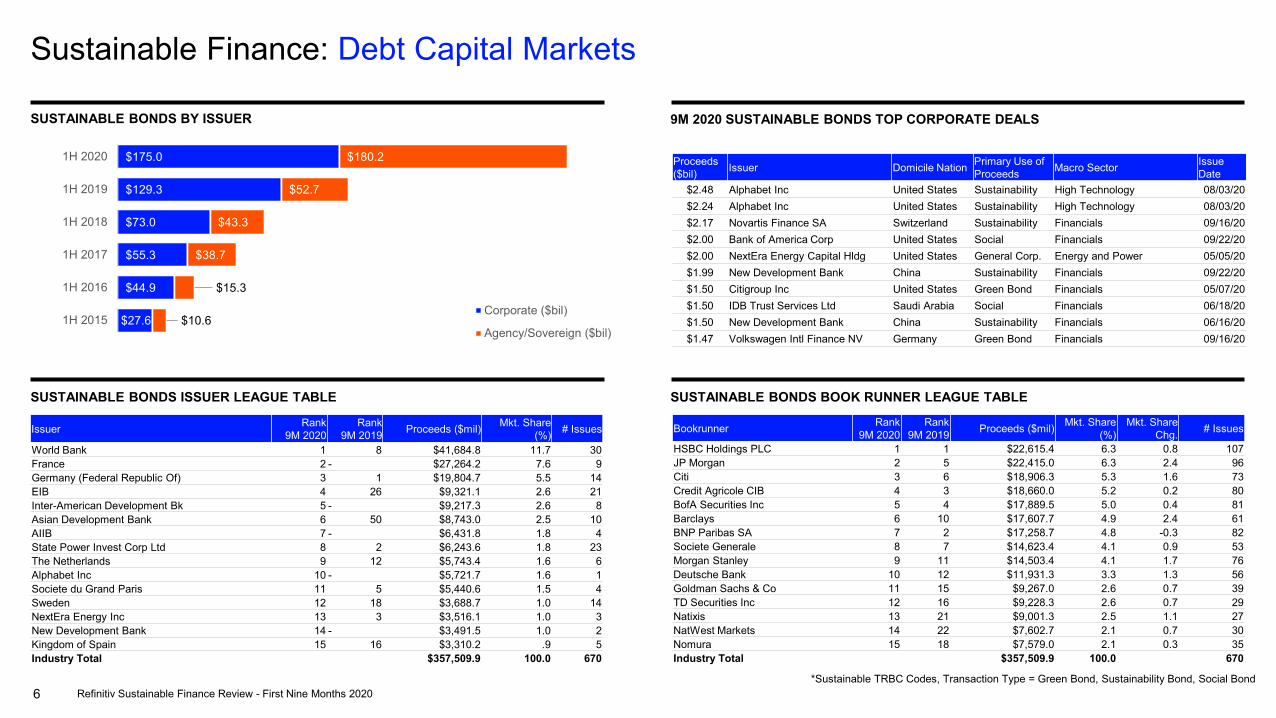
• Corporate issuers accounted for 49% of Sustainable Finance bonds during the first nine months of 2020, while Agency and Sovereign issuers accounted for 51% of overall activity, the highest percentage since sustainable records began in 2015. Corporate issuance has increased 35% during the first nine months of 2020, while Agency and Sovereign issuance more than tripled compared to 2019 levels.
• European issuers account for the largest regional market for Sustainable Finance bonds with 48% market share so far during 2020, compared to 28% from the Americas and 18% from Asia Pacific.
• HSBC maintained the top spot for sustainable bond underwriting with 6.3% market share, an increase of 0.8 market share points compared to a year ago. JP Morgan and Citi rounded out the top three underwriters during first nine months of 2020. The top ten Sustainable Finance bond underwriters comprised 49% of the overall market during the first nine months of 2020, up from 38% a year ago.
Sustainable Finance: Overview
Refinitiv Sustainable Finance Review - First Nine Months 2020
4
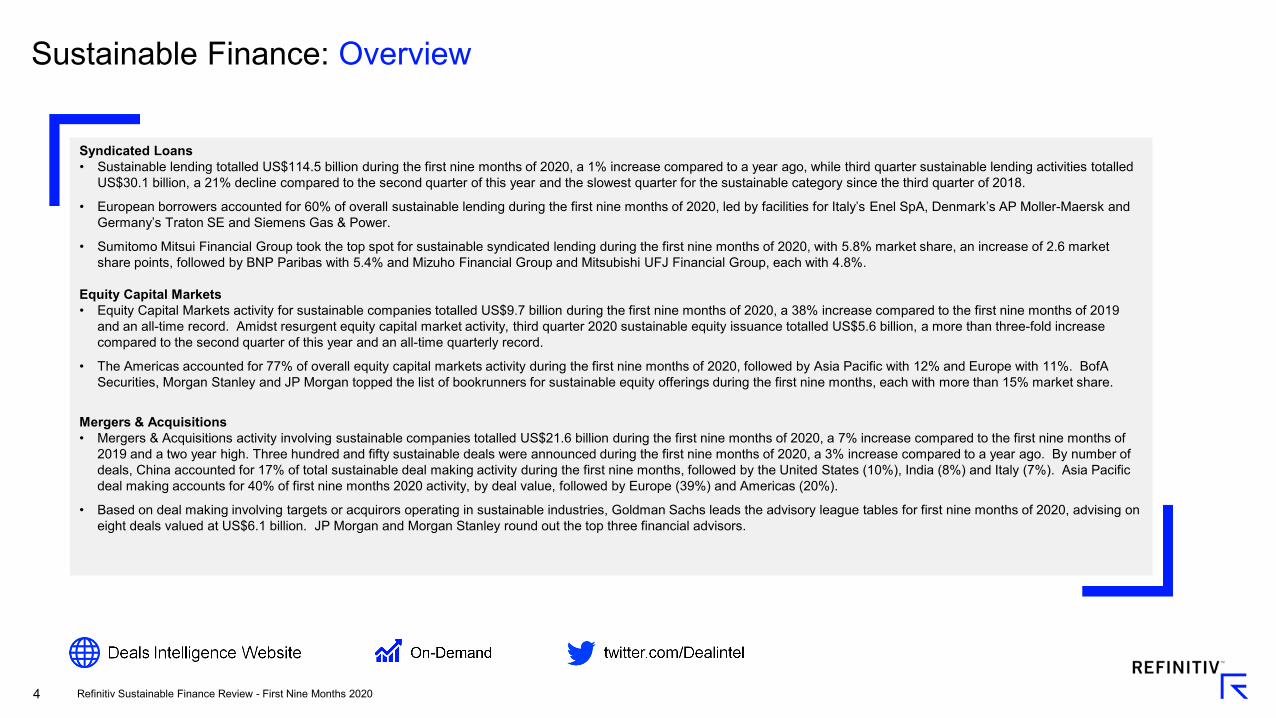
Syndicated Loans• Sustainable lending totalled US$114.5 billion during the first nine months of 2020, a 1% increase compared to a year ago, while third quarter sustainable lending activities totalled
US$30.1 billion, a 21% decline compared to the second quarter of this year and the slowest quarter for the sustainable category since the third quarter of 2018.
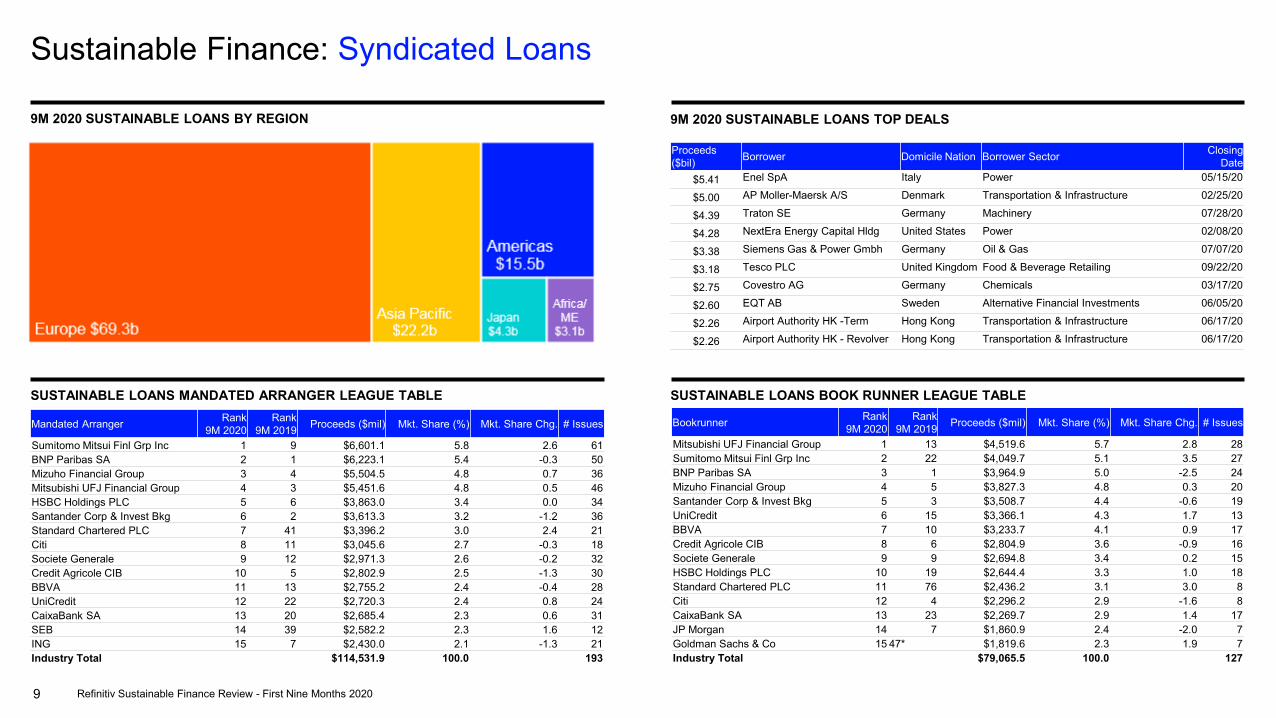
• European borrowers accounted for 60% of overall sustainable lending during the first nine months of 2020, led by facilities for Italy’s Enel SpA, Denmark’s AP Moller-Maersk and Germany’s Traton SE and Siemens Gas & Power.
• Sumitomo Mitsui Financial Group took the top spot for sustainable syndicated lending during the first nine months of 2020, with 5.8% market share, an increase of 2.6 market share points, followed by BNP Paribas with 5.4% and Mizuho Financial Group and Mitsubishi UFJ Financial Group, each with 4.8%.
Equity Capital Markets• Equity Capital Markets activity for sustainable companies totalled US$9.7 billion during the first nine months of 2020, a 38% increase compared to the first nine months of 2019
and an all-time record. Amidst resurgent equity capital market activity, third quarter 2020 sustainable equity issuance totalled US$5.6 billion, a more than three-fold increase compared to the second quarter of this year and an all-time quarterly record.
• The Americas accounted for 77% of overall equity capital markets activity during the first nine months of 2020, followed by Asia Pacific with 12% and Europe with 11%. BofA Securities, Morgan Stanley and JP Morgan topped the list of bookrunners for sustainable equity offerings during the first nine months, each with more than 15% market share.
Mergers & Acquisitions• Mergers & Acquisitions activity involving sustainable companies totalled US$21.6 billion during the first nine months of 2020, a 7% increase compared to the first nine months of
2019 and a two year high. Three hundred and fifty sustainable deals were announced during the first nine months of 2020, a 3% increase compared to a year ago. By number of deals, China accounted for 17% of total sustainable deal making activity during the first nine months, followed by the United States (10%), India (8%) and Italy (7%). Asia Pacific deal making accounts for 40% of first nine months 2020 activity, by deal value, followed by Europe (39%) and Americas (20%).
• Based on deal making involving targets or acquirors operating in sustainable industries, Goldman Sachs leads the advisory league tables for first nine months of 2020, advising on eight deals valued at US$6.1 billion. JP Morgan and Morgan Stanley round out the top three financial advisors.
Sustainable Finance: Overview
Refinitiv Sustainable Finance Review - First Nine Months 2020
5
Sustainable Finance: Debt Capital Markets
Refinitiv Sustainable Finance Review - First Nine Months 2020
SUSTAINABLE BOND QUARTERLY VOLUMES SUSTAINABLE BONDS BY TRANSACTION TYPE 9M 2020 SUSTAINABLE BONDS BY REGION
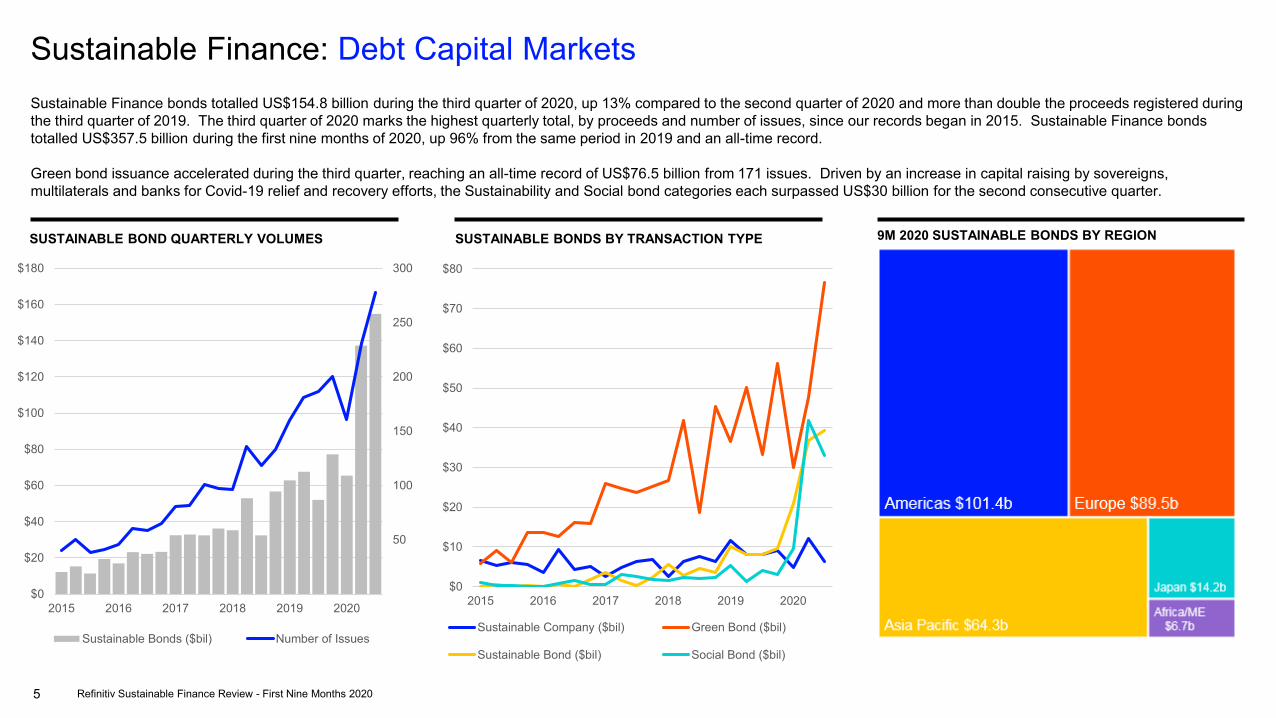
Sustainable Finance bonds totalled US$154.8 billion during the third quarter of 2020, up 13% compared to the second quarter of 2020 and more than double the proceeds registered during the third quarter of 2019. The third quarter of 2020 marks the highest quarterly total, by proceeds and number of issues, since our records began in 2015. Sustainable Finance bonds totalled US$357.5 billion during the first nine months of 2020, up 96% from the same period in 2019 and an all-time record.
Green bond issuance accelerated during the third quarter, reaching an all-time record of US$76.5 billion from 171 issues. Driven by an increase in capital raising by sovereigns, multilaterals and banks for Covid-19 relief and recovery efforts, the Sustainability and Social bond categories each surpassed US$30 billion for the second consecutive quarter.
50
100
150
200
250
300
$0
$20
$40
$60
$80
$100
$120
$140
$160
$180
2015 2016 2017 2018 2019 2020
Sustainable Bonds ($bil) Number of Issues
$0
$10
$20
$30
$40
$50
$60
$70
$80
2015 2016 2017 2018 2019 2020
Sustainable Company ($bil) Green Bond ($bil)
Sustainable Bond ($bil) Social Bond ($bil)
6
Sustainable Finance: Debt Capital Markets
Refinitiv Sustainable Finance Review - First Nine Months 2020
SUSTAINABLE BONDS BY ISSUER
SUSTAINABLE BONDS ISSUER LEAGUE TABLE SUSTAINABLE BONDS BOOK RUNNER LEAGUE TABLE
9M 2020 SUSTAINABLE BONDS TOP CORPORATE DEALS
Proceeds ($bil) Issuer Domicile Nation Primary Use of
Proceeds Macro Sector Issue Date
$2.48 Alphabet Inc United States Sustainability High Technology 08/03/20$2.24 Alphabet Inc United States Sustainability High Technology 08/03/20$2.17 Novartis Finance SA Switzerland Sustainability Financials 09/16/20$2.00 Bank of America Corp United States Social Financials 09/22/20$2.00 NextEra Energy Capital Hldg United States General Corp. Energy and Power 05/05/20$1.99 New Development Bank China Sustainability Financials 09/22/20$1.50 Citigroup Inc United States Green Bond Financials 05/07/20$1.50 IDB Trust Services Ltd Saudi Arabia Social Financials 06/18/20$1.50 New Development Bank China Sustainability Financials 06/16/20$1.47 Volkswagen Intl Finance NV Germany Green Bond Financials 09/16/20
Bookrunner Rank9M 2020
Rank9M 2019 Proceeds ($mil) Mkt. Share
(%)Mkt. Share
Chg. # Issues
HSBC Holdings PLC 1 1 $22,615.4 6.3 0.8 107JP Morgan 2 5 $22,415.0 6.3 2.4 96Citi 3 6 $18,906.3 5.3 1.6 73Credit Agricole CIB 4 3 $18,660.0 5.2 0.2 80BofA Securities Inc 5 4 $17,889.5 5.0 0.4 81Barclays 6 10 $17,607.7 4.9 2.4 61BNP Paribas SA 7 2 $17,258.7 4.8 -0.3 82Societe Generale 8 7 $14,623.4 4.1 0.9 53Morgan Stanley 9 11 $14,503.4 4.1 1.7 76Deutsche Bank 10 12 $11,931.3 3.3 1.3 56Goldman Sachs & Co 11 15 $9,267.0 2.6 0.7 39TD Securities Inc 12 16 $9,228.3 2.6 0.7 29Natixis 13 21 $9,001.3 2.5 1.1 27NatWest Markets 14 22 $7,602.7 2.1 0.7 30Nomura 15 18 $7,579.0 2.1 0.3 35Industry Total $357,509.9 100.0 670
Issuer Rank9M 2020
Rank9M 2019 Proceeds ($mil) Mkt. Share
(%) # Issues
World Bank 1 8 $41,684.8 11.7 30France 2 - $27,264.2 7.6 9Germany (Federal Republic Of) 3 1 $19,804.7 5.5 14EIB 4 26 $9,321.1 2.6 21Inter-American Development Bk 5 - $9,217.3 2.6 8Asian Development Bank 6 50 $8,743.0 2.5 10AIIB 7 - $6,431.8 1.8 4State Power Invest Corp Ltd 8 2 $6,243.6 1.8 23The Netherlands 9 12 $5,743.4 1.6 6Alphabet Inc 10 - $5,721.7 1.6 1Societe du Grand Paris 11 5 $5,440.6 1.5 4Sweden 12 18 $3,688.7 1.0 14NextEra Energy Inc 13 3 $3,516.1 1.0 3New Development Bank 14 - $3,491.5 1.0 2Kingdom of Spain 15 16 $3,310.2 .9 5Industry Total $357,509.9 100.0 670
$27.6
$44.9
$55.3
$73.0
$129.3
$175.0
$10.6
$15.3
$38.7
$43.3
$52.7
$180.2
1H 2015
1H 2016
1H 2017
1H 2018
1H 2019
1H 2020
Corporate ($bil)
Agency/Sovereign ($bil)
*Sustainable TRBC Codes, Transaction Type = Green Bond, Sustainability Bond, Social Bond
7
Sustainable Finance: Debt Capital Markets
Refinitiv Sustainable Finance Review - First Nine Months 2020
GLOBAL GREEN BONDS
GLOBAL GREEN BOND BOOKRUNNER LEAGUE TABLE (GR01) GLOBAL ESG BOND BOOKRUNNER LEAGUE TABLE (GESG1)
GLOBAL ESG BONDS
Bookrunner Rank9M 2020
Rank9M 2019 Proceeds ($mil) Mkt. Share
(%)Mkt. Share
Chg. # Issues
HSBC Holdings PLC 1 1 $22,543.8 6.7 0.2 106JP Morgan 2 5 $22,215.2 6.6 2.3 94Citi 3 6 $18,795.2 5.6 1.4 72Credit Agricole CIB 4 3 $18,467.3 5.5 -0.3 78BofA Securities Inc 5 4 $17,750.7 5.3 0.2 78Barclays 6 9 $17,496.7 5.2 2.3 60BNP Paribas SA 7 2 $16,949.7 5.1 -0.8 76Societe Generale 8 7 $14,534.7 4.3 0.5 52Morgan Stanley 9 10 $13,956.3 4.2 1.6 73Deutsche Bank 10 14 $11,899.1 3.6 1.4 55TD Securities Inc 11 23 $9,124.3 2.7 1.3 28Goldman Sachs & Co 12 17 $9,067.2 2.7 0.7 37Natixis 13 19 $9,001.3 2.7 1.0 27Nomura 14 16 $7,579.0 2.3 0.2 35ING 15 8 $7,578.4 2.3 -1.4 48Industry Total $334,974.9 100.0 576
Bookrunner Rank9M 2020
Rank9M 2019 Proceeds ($mil) Mkt. Share
(%)Mkt. Share
Chg. # Issues
JP Morgan 1 5 $11,087.8 7.2 2.6 60Credit Agricole CIB 2 1 $8,387.1 5.5 -0.5 39BNP Paribas SA 3 3 $7,560.0 4.9 -1.0 43Citi 4 6 $7,225.4 4.7 0.1 38Barclays 5 8 $7,050.1 4.6 1.5 33BofA Securities Inc 6 4 $6,636.3 4.3 -0.6 46Deutsche Bank 7 13 $6,613.1 4.3 1.7 34HSBC Holdings PLC 8 2 $6,001.2 3.9 -2.1 48Societe Generale 9 7 $5,880.6 3.8 0.7 26ING 10 10 $5,631.5 3.7 0.8 35Morgan Stanley 11 14 $4,813.3 3.1 0.6 44UniCredit 12 12 $4,533.9 3.0 0.3 21Commerzbank AG 13 24 $4,286.9 2.8 1.5 15NatWest Markets 14 17 $4,020.1 2.6 0.6 18SEB 15 11 $3,492.3 2.3 -0.5 34Industry Total $153,968.6 100.0 384
20406080100120140160180
$0$10$20$30$40$50$60$70$80$90
2015 2016 2017 2018 2019 2020Green Bonds ($bil) Number of Deals
$0$10$20$30$40$50$60$70$80$90
2017 2018 2019 2020Sustainability Bond ($bil) Social Bond ($bil)
Transaction Type = Green Bond, Sustainability Bond, Social Bond
8
Sustainable Finance: Syndicated Loans
Refinitiv Sustainable Finance Review - First Nine Months 2020
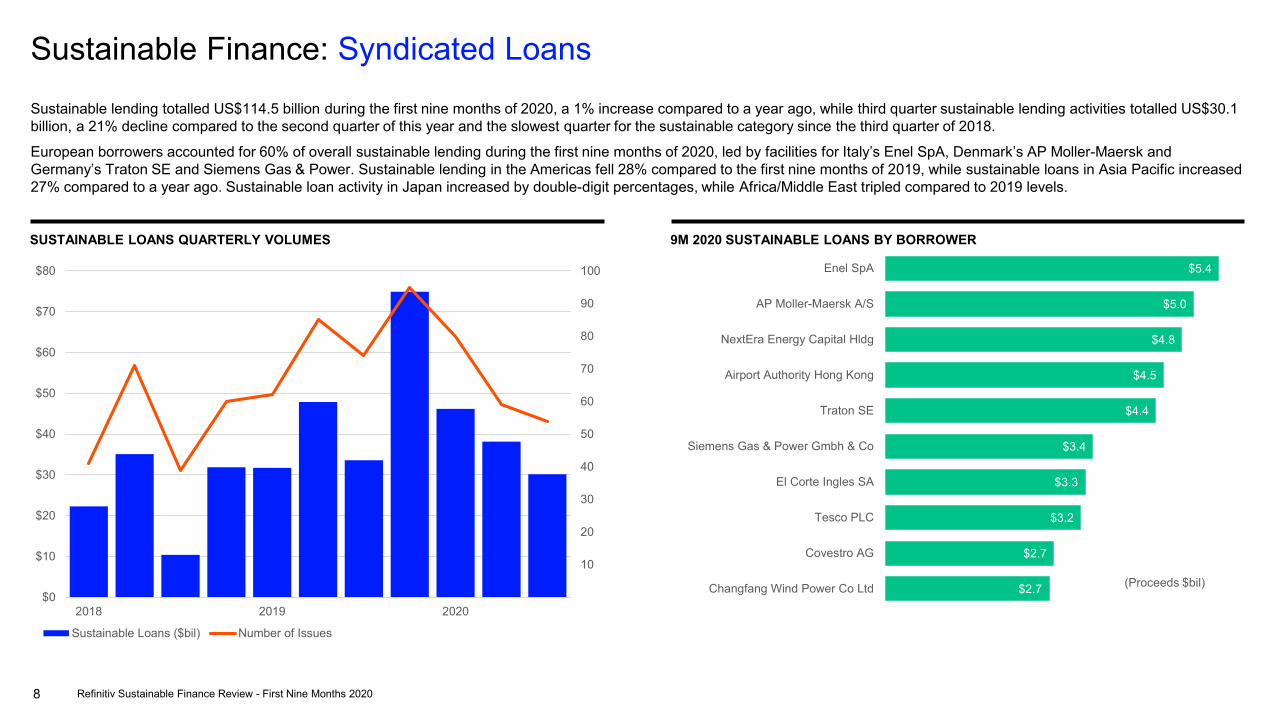
Sustainable lending totalled US$114.5 billion during the first nine months of 2020, a 1% increase compared to a year ago, while third quarter sustainable lending activities totalled US$30.1 billion, a 21% decline compared to the second quarter of this year and the slowest quarter for the sustainable category since the third quarter of 2018.
European borrowers accounted for 60% of overall sustainable lending during the first nine months of 2020, led by facilities for Italy’s Enel SpA, Denmark’s AP Moller-Maersk and Germany’s Traton SE and Siemens Gas & Power. Sustainable lending in the Americas fell 28% compared to the first nine months of 2019, while sustainable loans in Asia Pacific increased 27% compared to a year ago. Sustainable loan activity in Japan increased by double-digit percentages, while Africa/Middle East tripled compared to 2019 levels.
9M 2020 SUSTAINABLE LOANS BY BORROWERSUSTAINABLE LOANS QUARTERLY VOLUMES
10
20
30
40
50
60
70
80
90
100
$0
$10
$20
$30
$40
$50
$60
$70
$80
2018 2019 2020
Sustainable Loans ($bil) Number of Issues
$5.4
$5.0
$4.8
$4.5
$4.4
$3.4
$3.3
$3.2
$2.7
$2.7
Enel SpA
AP Moller-Maersk A/S
NextEra Energy Capital Hldg
Airport Authority Hong Kong
Traton SE
Siemens Gas & Power Gmbh & Co
El Corte Ingles SA
Tesco PLC
Covestro AG
Changfang Wind Power Co Ltd (Proceeds $bil)
9
Sustainable Finance: Syndicated Loans
Refinitiv Sustainable Finance Review - First Nine Months 2020
9M 2020 SUSTAINABLE LOANS BY REGION
SUSTAINABLE LOANS BOOK RUNNER LEAGUE TABLESUSTAINABLE LOANS MANDATED ARRANGER LEAGUE TABLE
9M 2020 SUSTAINABLE LOANS TOP DEALS
Proceeds ($bil) Borrower Domicile Nation Borrower Sector Closing
Date$5.41 Enel SpA Italy Power 05/15/20
$5.00 AP Moller-Maersk A/S Denmark Transportation & Infrastructure 02/25/20
$4.39 Traton SE Germany Machinery 07/28/20
$4.28 NextEra Energy Capital Hldg United States Power 02/08/20
$3.38 Siemens Gas & Power Gmbh Germany Oil & Gas 07/07/20
$3.18 Tesco PLC United Kingdom Food & Beverage Retailing 09/22/20
$2.75 Covestro AG Germany Chemicals 03/17/20
$2.60 EQT AB Sweden Alternative Financial Investments 06/05/20
$2.26 Airport Authority HK -Term Hong Kong Transportation & Infrastructure 06/17/20
$2.26 Airport Authority HK - Revolver Hong Kong Transportation & Infrastructure 06/17/20
Mandated Arranger Rank9M 2020
Rank9M 2019 Proceeds ($mil) Mkt. Share (%) Mkt. Share Chg. # Issues
Sumitomo Mitsui Finl Grp Inc 1 9 $6,601.1 5.8 2.6 61BNP Paribas SA 2 1 $6,223.1 5.4 -0.3 50Mizuho Financial Group 3 4 $5,504.5 4.8 0.7 36Mitsubishi UFJ Financial Group 4 3 $5,451.6 4.8 0.5 46HSBC Holdings PLC 5 6 $3,863.0 3.4 0.0 34Santander Corp & Invest Bkg 6 2 $3,613.3 3.2 -1.2 36Standard Chartered PLC 7 41 $3,396.2 3.0 2.4 21Citi 8 11 $3,045.6 2.7 -0.3 18Societe Generale 9 12 $2,971.3 2.6 -0.2 32Credit Agricole CIB 10 5 $2,802.9 2.5 -1.3 30BBVA 11 13 $2,755.2 2.4 -0.4 28UniCredit 12 22 $2,720.3 2.4 0.8 24CaixaBank SA 13 20 $2,685.4 2.3 0.6 31SEB 14 39 $2,582.2 2.3 1.6 12ING 15 7 $2,430.0 2.1 -1.3 21Industry Total $114,531.9 100.0 193
Bookrunner Rank9M 2020
Rank9M 2019 Proceeds ($mil) Mkt. Share (%) Mkt. Share Chg. # Issues
Mitsubishi UFJ Financial Group 1 13 $4,519.6 5.7 2.8 28Sumitomo Mitsui Finl Grp Inc 2 22 $4,049.7 5.1 3.5 27BNP Paribas SA 3 1 $3,964.9 5.0 -2.5 24Mizuho Financial Group 4 5 $3,827.3 4.8 0.3 20Santander Corp & Invest Bkg 5 3 $3,508.7 4.4 -0.6 19UniCredit 6 15 $3,366.1 4.3 1.7 13BBVA 7 10 $3,233.7 4.1 0.9 17Credit Agricole CIB 8 6 $2,804.9 3.6 -0.9 16Societe Generale 9 9 $2,694.8 3.4 0.2 15HSBC Holdings PLC 10 19 $2,644.4 3.3 1.0 18Standard Chartered PLC 11 76 $2,436.2 3.1 3.0 8Citi 12 4 $2,296.2 2.9 -1.6 8CaixaBank SA 13 23 $2,269.7 2.9 1.4 17JP Morgan 14 7 $1,860.9 2.4 -2.0 7Goldman Sachs & Co 15 47* $1,819.6 2.3 1.9 7Industry Total $79,065.5 100.0 127
10
Sustainable Finance: Equity Capital Markets
Refinitiv Sustainable Finance Review - First Nine Months 2020
SUSTAINABLE ECM QUARTERLY VOLUMES 9M 2020 SUSTAINABLE ECM TOP DEALS SUSTAINABLE ECM BOOK RUNNER LEAGUE TABLE
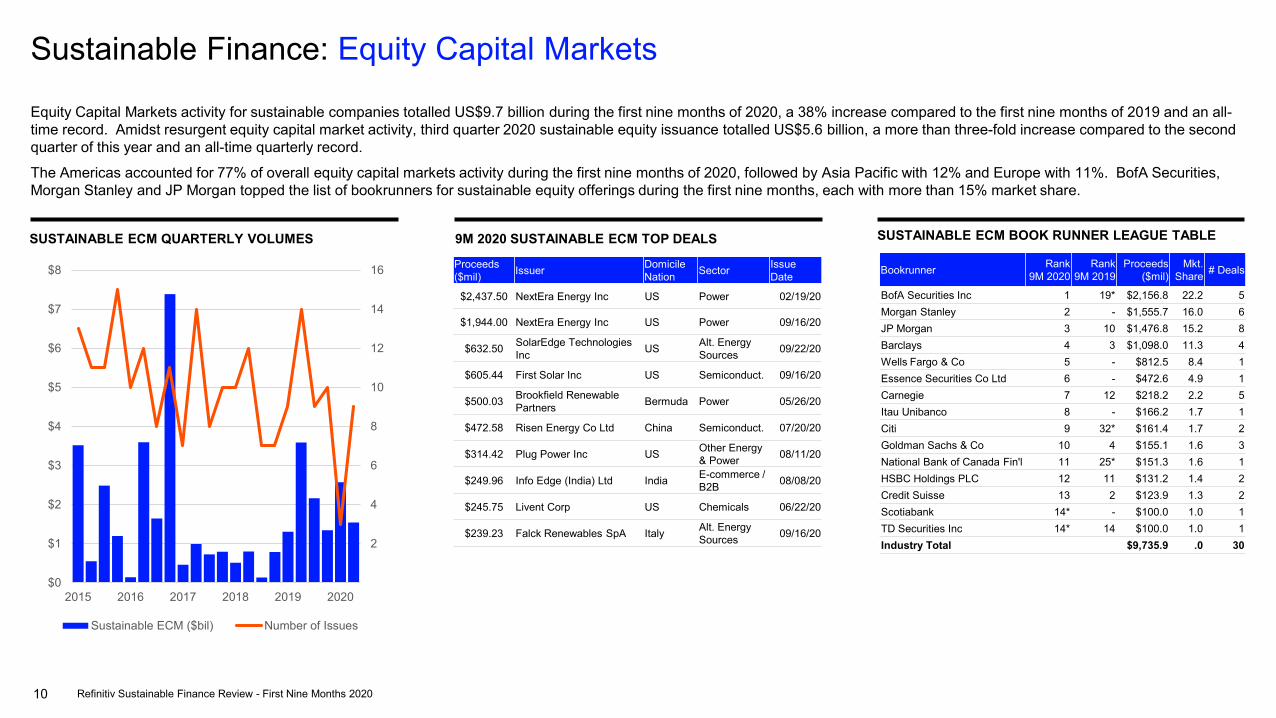
Equity Capital Markets activity for sustainable companies totalled US$9.7 billion during the first nine months of 2020, a 38% increase compared to the first nine months of 2019 and an all-time record. Amidst resurgent equity capital market activity, third quarter 2020 sustainable equity issuance totalled US$5.6 billion, a more than three-fold increase compared to the second quarter of this year and an all-time quarterly record.
The Americas accounted for 77% of overall equity capital markets activity during the first nine months of 2020, followed by Asia Pacific with 12% and Europe with 11%. BofA Securities, Morgan Stanley and JP Morgan topped the list of bookrunners for sustainable equity offerings during the first nine months, each with more than 15% market share.
Proceeds ($mil) Issuer Domicile
Nation Sector IssueDate
$2,437.50 NextEra Energy Inc US Power 02/19/20
$1,944.00 NextEra Energy Inc US Power 09/16/20
$632.50 SolarEdge Technologies Inc US Alt. Energy
Sources 09/22/20
$605.44 First Solar Inc US Semiconduct. 09/16/20
$500.03 Brookfield Renewable Partners Bermuda Power 05/26/20
$472.58 Risen Energy Co Ltd China Semiconduct. 07/20/20
$314.42 Plug Power Inc US Other Energy & Power 08/11/20
$249.96 Info Edge (India) Ltd India E-commerce / B2B 08/08/20
$245.75 Livent Corp US Chemicals 06/22/20
$239.23 Falck Renewables SpA Italy Alt. Energy Sources 09/16/20
2
4
6
8
10
12
14
16
$0
$1
$2
$3
$4
$5
$6
$7
$8
2015 2016 2017 2018 2019 2020
Sustainable ECM ($bil) Number of Issues
Bookrunner Rank9M 2020
Rank9M 2019
Proceeds ($mil)
Mkt. Share # Deals
BofA Securities Inc 1 19* $2,156.8 22.2 5Morgan Stanley 2 - $1,555.7 16.0 6JP Morgan 3 10 $1,476.8 15.2 8Barclays 4 3 $1,098.0 11.3 4Wells Fargo & Co 5 - $812.5 8.4 1Essence Securities Co Ltd 6 - $472.6 4.9 1Carnegie 7 12 $218.2 2.2 5Itau Unibanco 8 - $166.2 1.7 1Citi 9 32* $161.4 1.7 2Goldman Sachs & Co 10 4 $155.1 1.6 3National Bank of Canada Fin'l 11 25* $151.3 1.6 1HSBC Holdings PLC 12 11 $131.2 1.4 2Credit Suisse 13 2 $123.9 1.3 2Scotiabank 14* - $100.0 1.0 1TD Securities Inc 14* 14 $100.0 1.0 1Industry Total $9,735.9 .0 30
11
Sustainable Finance: Mergers & Acquisitions
Refinitiv Sustainable Finance Review - First Nine Months 2020
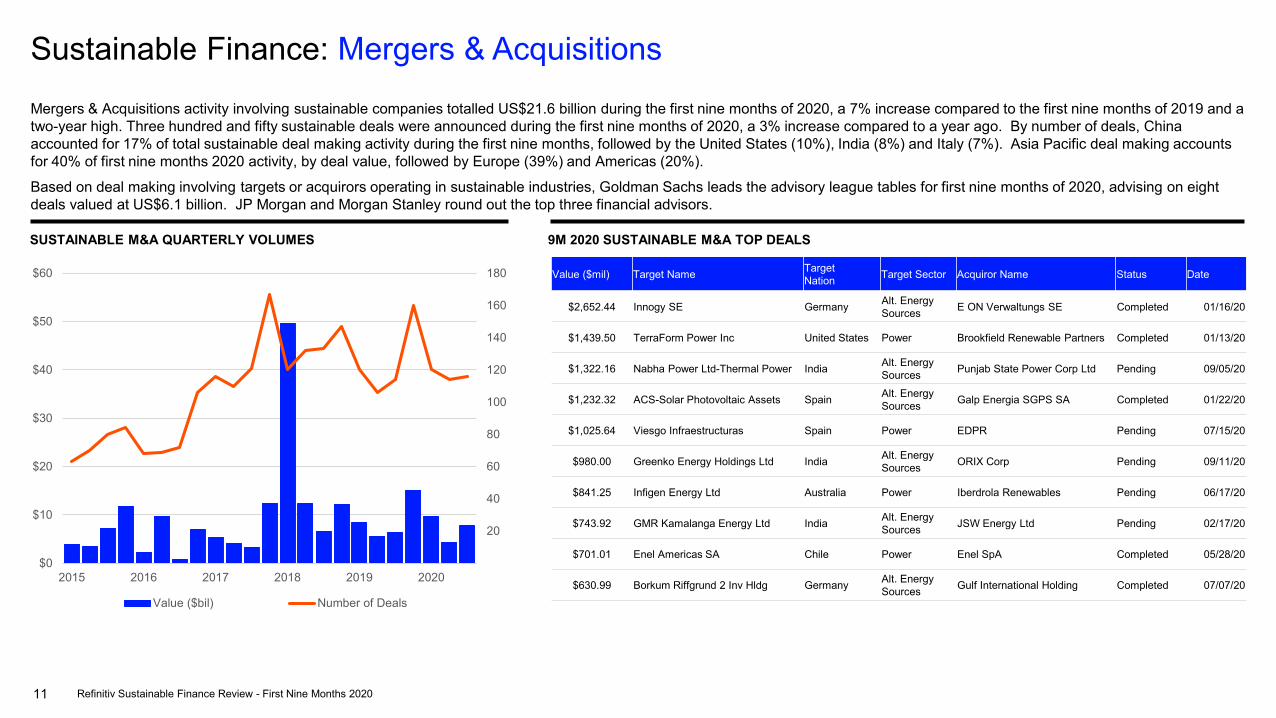
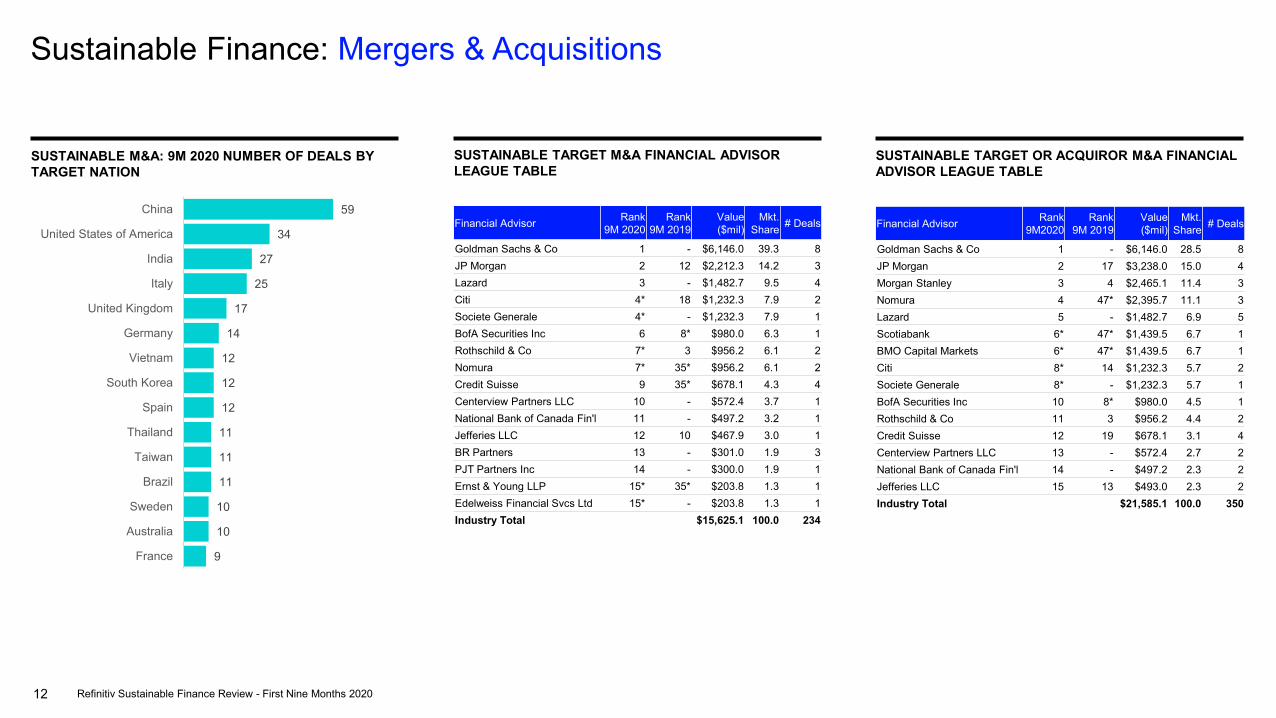
Mergers & Acquisitions activity involving sustainable companies totalled US$21.6 billion during the first nine months of 2020, a 7% increase compared to the first nine months of 2019 and a two-year high. Three hundred and fifty sustainable deals were announced during the first nine months of 2020, a 3% increase compared to a year ago. By number of deals, China accounted for 17% of total sustainable deal making activity during the first nine months, followed by the United States (10%), India (8%) and Italy (7%). Asia Pacific deal making accounts for 40% of first nine months 2020 activity, by deal value, followed by Europe (39%) and Americas (20%).
Based on deal making involving targets or acquirors operating in sustainable industries, Goldman Sachs leads the advisory league tables for first nine months of 2020, advising on eight deals valued at US$6.1 billion. JP Morgan and Morgan Stanley round out the top three financial advisors.
9M 2020 SUSTAINABLE M&A TOP DEALSSUSTAINABLE M&A QUARTERLY VOLUMES
Value ($mil) Target Name TargetNation Target Sector Acquiror Name Status Date
$2,652.44 Innogy SE Germany Alt. Energy Sources E ON Verwaltungs SE Completed 01/16/20
$1,439.50 TerraForm Power Inc United States Power Brookfield Renewable Partners Completed 01/13/20
$1,322.16 Nabha Power Ltd-Thermal Power India Alt. Energy Sources Punjab State Power Corp Ltd Pending 09/05/20
$1,232.32 ACS-Solar Photovoltaic Assets Spain Alt. Energy Sources Galp Energia SGPS SA Completed 01/22/20
$1,025.64 Viesgo Infraestructuras Spain Power EDPR Pending 07/15/20
$980.00 Greenko Energy Holdings Ltd India Alt. Energy Sources ORIX Corp Pending 09/11/20
$841.25 Infigen Energy Ltd Australia Power Iberdrola Renewables Pending 06/17/20
$743.92 GMR Kamalanga Energy Ltd India Alt. Energy Sources JSW Energy Ltd Pending 02/17/20
$701.01 Enel Americas SA Chile Power Enel SpA Completed 05/28/20
$630.99 Borkum Riffgrund 2 Inv Hldg Germany Alt. Energy Sources Gulf International Holding Completed 07/07/20
20
40
60
80
100
120
140
160
180
$0
$10
$20
$30
$40
$50
$60
2015 2016 2017 2018 2019 2020
Value ($bil) Number of Deals
12
Sustainable Finance: Mergers & Acquisitions
Refinitiv Sustainable Finance Review - First Nine Months 2020
SUSTAINABLE M&A: 9M 2020 NUMBER OF DEALS BY TARGET NATION
SUSTAINABLE TARGET M&A FINANCIAL ADVISOR LEAGUE TABLE
SUSTAINABLE TARGET OR ACQUIROR M&A FINANCIAL ADVISOR LEAGUE TABLE
Financial Advisor Rank9M2020
Rank9M 2019
Value ($mil)
Mkt. Share # Deals
Goldman Sachs & Co 1 - $6,146.0 28.5 8JP Morgan 2 17 $3,238.0 15.0 4Morgan Stanley 3 4 $2,465.1 11.4 3Nomura 4 47* $2,395.7 11.1 3Lazard 5 - $1,482.7 6.9 5Scotiabank 6* 47* $1,439.5 6.7 1BMO Capital Markets 6* 47* $1,439.5 6.7 1Citi 8* 14 $1,232.3 5.7 2Societe Generale 8* - $1,232.3 5.7 1BofA Securities Inc 10 8* $980.0 4.5 1Rothschild & Co 11 3 $956.2 4.4 2Credit Suisse 12 19 $678.1 3.1 4Centerview Partners LLC 13 - $572.4 2.7 2National Bank of Canada Fin'l 14 - $497.2 2.3 2Jefferies LLC 15 13 $493.0 2.3 2Industry Total $21,585.1 100.0 350
Financial Advisor Rank9M 2020
Rank9M 2019
Value ($mil)
Mkt. Share # Deals
Goldman Sachs & Co 1 - $6,146.0 39.3 8JP Morgan 2 12 $2,212.3 14.2 3Lazard 3 - $1,482.7 9.5 4Citi 4* 18 $1,232.3 7.9 2Societe Generale 4* - $1,232.3 7.9 1BofA Securities Inc 6 8* $980.0 6.3 1Rothschild & Co 7* 3 $956.2 6.1 2Nomura 7* 35* $956.2 6.1 2Credit Suisse 9 35* $678.1 4.3 4Centerview Partners LLC 10 - $572.4 3.7 1National Bank of Canada Fin'l 11 - $497.2 3.2 1Jefferies LLC 12 10 $467.9 3.0 1BR Partners 13 - $301.0 1.9 3PJT Partners Inc 14 - $300.0 1.9 1Ernst & Young LLP 15* 35* $203.8 1.3 1Edelweiss Financial Svcs Ltd 15* - $203.8 1.3 1Industry Total $15,625.1 100.0 234
9
10
10
11
11
11
12
12
12
14
17
25
27
34
59
France
Australia
Sweden
Brazil
Taiwan
Thailand
Spain
South Korea
Vietnam
Germany
United Kingdom
Italy
India
United States of America
China

13
Deals Intelligence, a part of Refinitiv's Investing & Advisory division, brings up to the minute market intelligence to our clients and the financial media through a variety of research reports including Daily Deals Insight, weekly Investment Banking Scorecard,monthly Deals Snapshots and our industry-leading quarterly reviews highlighting trends in M&A and Capital Markets.
While Refinitiv has used reasonable endeavours to ensure that the information provided in this document is accurate and up todate as at the time of issue, neither Refinitiv nor its third-party content providers shall be liable for any errors, inaccuracies or delays in the information, nor for any actions taken in reliance thereon, nor does it endorse any views or opinions of any thirdparty content provider. Refinitiv disclaims all warranties, express or implied, as to the accuracy or completeness of any of thecontent provided, or as to the fitness of the content for any purpose to the extent permitted by law. The content herein is not appropriate for the purposes of making a decision to carry out a transaction or trade and does not provide any form of advice(investment, tax, legal) amounting to investment advice, nor make any recommendations or solicitations regarding particular financial instruments, investments or products, including the buying or selling of securities. Refinitiv has not undertaken any liability or obligation relating to the purchase or sale of securities for or by any person in connection with this document.
The Sustainable Finance league tables are based on Refinitiv’s standard league table criteria and screen across bond and loantransaction types and use of proceeds in parallel with companies with industry classifications deemed as sustainable using proprietary TRBC industry codes.
Green Bonds league table classifications validated in partnership with Climate Bonds Initiative.
© 2020 Refinitiv. All rights reserved.
Additional Resources: Refinitiv LPC's Loanly Planet is a monthly publication covering Green, Sustainable and Positive Incentive Lending Globally.To subscribe or to learn more, email us at [email protected].
Sustainable Finance: Contacts & Criteria
CONTACT US
AMERICAS: Matthew Toole +1 646 223 7212 [email protected]
EMEA:Lucille Jones+44 207 542 [email protected]
ASIA PACIFIC:Elaine Tan+632 459 [email protected]
Refinitiv Sustainable Finance Review - First Nine Months 2020
14
Sustainable Finance: Contacts & Criteria
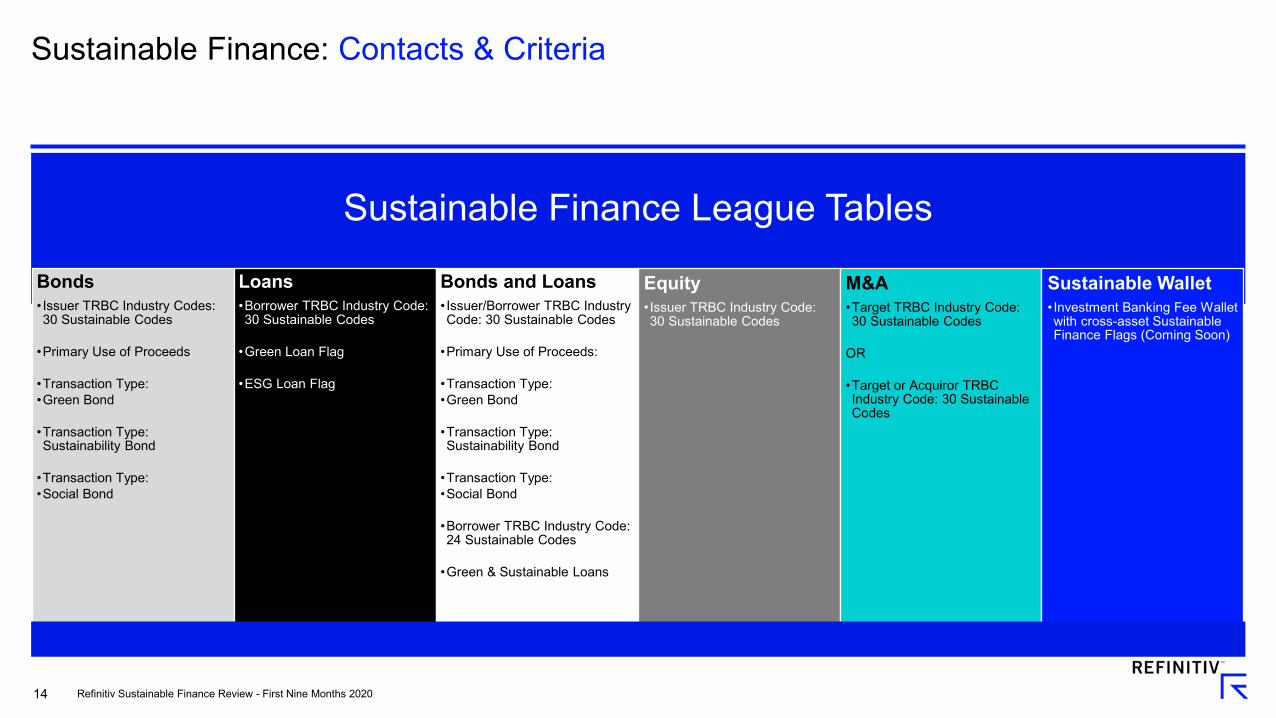
Sustainable Finance League Tables
Bonds• Issuer TRBC Industry Codes: 30 Sustainable Codes
•Primary Use of Proceeds
•Transaction Type:•Green Bond
•Transaction Type: Sustainability Bond
•Transaction Type:•Social Bond
Loans•Borrower TRBC Industry Code: 30 Sustainable Codes
•Green Loan Flag
•ESG Loan Flag
Bonds and Loans• Issuer/Borrower TRBC Industry Code: 30 Sustainable Codes
•Primary Use of Proceeds:
•Transaction Type:•Green Bond
•Transaction Type: Sustainability Bond
•Transaction Type:•Social Bond
•Borrower TRBC Industry Code: 24 Sustainable Codes
•Green & Sustainable Loans
Equity• Issuer TRBC Industry Code: 30 Sustainable Codes
M&A•Target TRBC Industry Code: 30 Sustainable Codes
OR
•Target or Acquiror TRBC Industry Code: 30 Sustainable Codes
Sustainable Wallet• Investment Banking Fee Wallet with cross-asset Sustainable Finance Flags (Coming Soon)
Refinitiv Sustainable Finance Review - First Nine Months 2020
15
Sustainable Finance: Contacts & Criteria
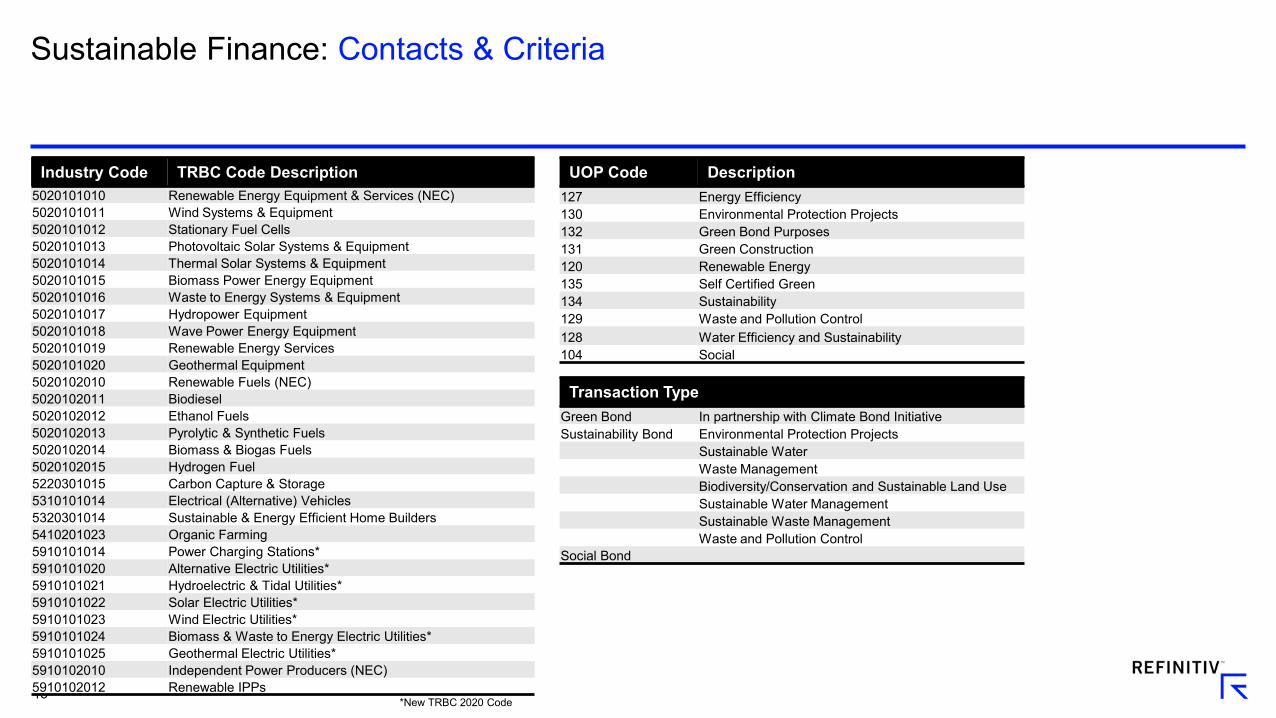
Industry Code TRBC Code Description5020101010 Renewable Energy Equipment & Services (NEC)5020101011 Wind Systems & Equipment5020101012 Stationary Fuel Cells5020101013 Photovoltaic Solar Systems & Equipment5020101014 Thermal Solar Systems & Equipment5020101015 Biomass Power Energy Equipment5020101016 Waste to Energy Systems & Equipment5020101017 Hydropower Equipment5020101018 Wave Power Energy Equipment5020101019 Renewable Energy Services5020101020 Geothermal Equipment5020102010 Renewable Fuels (NEC)5020102011 Biodiesel5020102012 Ethanol Fuels5020102013 Pyrolytic & Synthetic Fuels5020102014 Biomass & Biogas Fuels5020102015 Hydrogen Fuel5220301015 Carbon Capture & Storage5310101014 Electrical (Alternative) Vehicles5320301014 Sustainable & Energy Efficient Home Builders5410201023 Organic Farming5910101014 Power Charging Stations*5910101020 Alternative Electric Utilities*5910101021 Hydroelectric & Tidal Utilities*5910101022 Solar Electric Utilities*5910101023 Wind Electric Utilities*5910101024 Biomass & Waste to Energy Electric Utilities*5910101025 Geothermal Electric Utilities*5910102010 Independent Power Producers (NEC)5910102012 Renewable IPPs
UOP Code Description127 Energy Efficiency130 Environmental Protection Projects132 Green Bond Purposes131 Green Construction120 Renewable Energy135 Self Certified Green134 Sustainability129 Waste and Pollution Control128 Water Efficiency and Sustainability104 Social
Transaction TypeGreen Bond In partnership with Climate Bond InitiativeSustainability Bond Environmental Protection Projects
Sustainable WaterWaste ManagementBiodiversity/Conservation and Sustainable Land UseSustainable Water ManagementSustainable Waste ManagementWaste and Pollution Control
Social Bond
*New TRBC 2020 Code


