Embed Size (px)
Citation preview

Connecting customers to opportunities
HSBC Holdings plc Interim Report 2014
H S B C H O L D I N G S P L C
Interim Report 2014 Contents / Highlights
The Interim Report 2014 of HSBC Holdings has been prepared in accordance with the requirements of English law, and liability in respect thereof is also governed by English law. In particular, the liability of the Directors for this report is solely to HSBC Holdings.
Certain defined terms
Unless the context requires otherwise, ‘HSBC Holdings’ means HSBC Holdings plc and ‘HSBC’, the ‘Group’, ‘we’, ‘us’ and ‘our’ refer to HSBC Holdings together with its subsidiaries. Within this document, the Hong Kong Special Administrative Region of the People’s Republic of China is referred to as ‘Hong Kong’. When used in the terms ‘shareholders’ equity’ and ‘total shareholders’ equity’, ‘shareholders’ means holders of HSBC Holdings ordinary shares and those preference shares classified as equity. The abbreviations ‘US$m’ and ‘US$bn’ represent millions and billions (thousands of millions) of US dollars, respectively.
Interim financial statements and notes
HSBC’s Interim Consolidated Financial Statements and Notes thereon, as set out on pages 206 to 268, have been prepared in accordance with the Disclosure Rules and Transparency Rules of the Financial Conduct Authority and International Accounting Standard (‘IAS’) 34 ‘Interim Financial Reporting’ as issued by the International Accounting Standards Board (‘IASB’) and as endorsed by the European Union (‘EU’). The consolidated financial statements of HSBC at 31 December 2013 were prepared in accordance with International Financial Reporting Standards (‘IFRSs’) as issued by the IASB, and as endorsed by the EU. EU-endorsed IFRSs may differ from IFRSs as issued by the IASB if, at any point in time, new or amended IFRSs have not been endorsed by the EU. At 31 December 2013, there were no unendorsed standards effective for the year ended 31 December 2013 affecting the consolidated financial statements at that date, and there was no difference between IFRSs endorsed by the EUand IFRSs issued by the IASB in terms of their application to HSBC. Accordingly, HSBC’s financial statements for the year ended 31 December 2013 were prepared in accordance with IFRSs as issued by the IASB. At 30 June 2014, there were no unendorsed standards effective for the period ended 30 June 2014 affecting these interim consolidated financial statements, and there was no difference between IFRSs endorsed by the EU and IFRSs issued by the IASB in terms of their application to HSBC.
HSBC uses the US dollar as its presentation currency because the US dollar and currencies linked to it form the major currency bloc in which HSBC transacts and funds its business. Unless otherwise stated, the information presented in this document has been measured in accordance with IFRSs.
When reference to ‘underlying’ is made in tables or commentaries, the comparative information has been expressed at constant currency (see page 19), the impact of fair value movements in respect of credit spread changes on HSBC’s own debt has been eliminated and the effects of acquisitions, disposals and dilutions have been adjusted as reconciled on page 22. Underlying return on risk-weighted assets (‘RoRWA’) is defined and reconciled on page 43.
Contents
Overview
Who we are ............................................................................ 1
Our purpose ........................................................................... 1
Highlights .............................................................................. 2
Group Chairman’s Statement ................................................ 4
Group Chief Executive’s Business Review .......................... 6
Value creation and long-term sustainability ......................... 8
Our strategy ........................................................................... 9
Business and operating models ............................................. 11
Global Standards .................................................................... 14
Risk ........................................................................................ 16
Interim Management Report
Financial summary1 ............................................................... 19
Global businesses1 ................................................................. 45
Geographical regions1 ............................................................ 61
Other information .................................................................. 95
Risk1 ....................................................................................... 99
Capital1 ................................................................................... 175
Board of Directors and Senior Management 199
Financial Statements
Financial statements .............................................................. 206
Notes on the financial statements1 ......................................... 214
Directors’ Responsibility Statement ...................................... 269
Independent Review Report by KPMG Audit Plc to
HSBC Holdings plc ........................................................... 270
Additional Information
Shareholder information1 ....................................................... 271
Cautionary statement regarding forward-looking statements ... 280
Abbreviations ......................................................................... 281
Glossary ................................................................................. 284
Index ...................................................................................... 293
1 Detailed contents are provided on the referenced pages.
Cover images: internationalisation of the renminbi
The images show the views from HSBC’s head offices in Shanghai, Hong Kong and London – the three cities that are key to the development of China’s currency, the renminbi (‘RMB’). The growth of the RMB is set to be a defining theme of the 21st century. HSBC has RMB capabilities in over 50 countries and territories worldwide, where our customers can count on an expert service.
1
Ove
rvie
w
Inte
rim
Man
agem
ent
Rep
ort
D
irec
tors
Fi
nan
cial
Sta
tem
ents
A
dd
itio
nal
Info
rmat
ion
Who we are
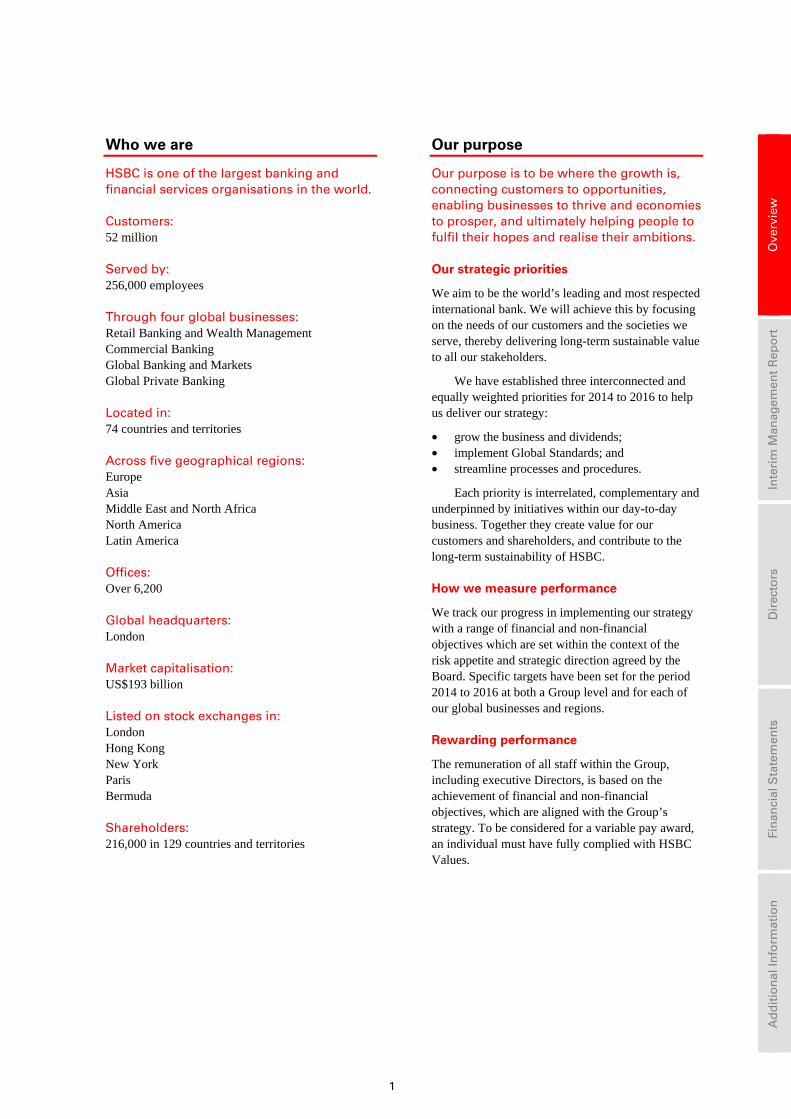
HSBC is one of the largest banking and financial services organisations in the world.
Customers: 52 million Served by: 256,000 employees Through four global businesses: Retail Banking and Wealth Management Commercial Banking Global Banking and Markets Global Private Banking Located in: 74 countries and territories Across five geographical regions: Europe Asia Middle East and North Africa North America Latin America Offices: Over 6,200 Global headquarters: London Market capitalisation: US$193 billion Listed on stock exchanges in: London Hong Kong New York Paris Bermuda Shareholders: 216,000 in 129 countries and territories
Our purpose
Our purpose is to be where the growth is, connecting customers to opportunities, enabling businesses to thrive and economies to prosper, and ultimately helping people to fulfil their hopes and realise their ambitions.
Our strategic priorities
We aim to be the world’s leading and most respected international bank. We will achieve this by focusing on the needs of our customers and the societies we serve, thereby delivering long-term sustainable value to all our stakeholders.
We have established three interconnected and equally weighted priorities for 2014 to 2016 to help us deliver our strategy:
• grow the business and dividends; • implement Global Standards; and • streamline processes and procedures.
Each priority is interrelated, complementary and underpinned by initiatives within our day-to-day business. Together they create value for our customers and shareholders, and contribute to the long-term sustainability of HSBC.
How we measure performance
We track our progress in implementing our strategy with a range of financial and non-financial objectives which are set within the context of the risk appetite and strategic direction agreed by the Board. Specific targets have been set for the period 2014 to 2016 at both a Group level and for each of our global businesses and regions.
Rewarding performance
The remuneration of all staff within the Group, including executive Directors, is based on the achievement of financial and non-financial objectives, which are aligned with the Group’s strategy. To be considered for a variable pay award, an individual must have fully complied with HSBC Values.
H S B C H O L D I N G S P L C
Overview Highlights
2
Highlights
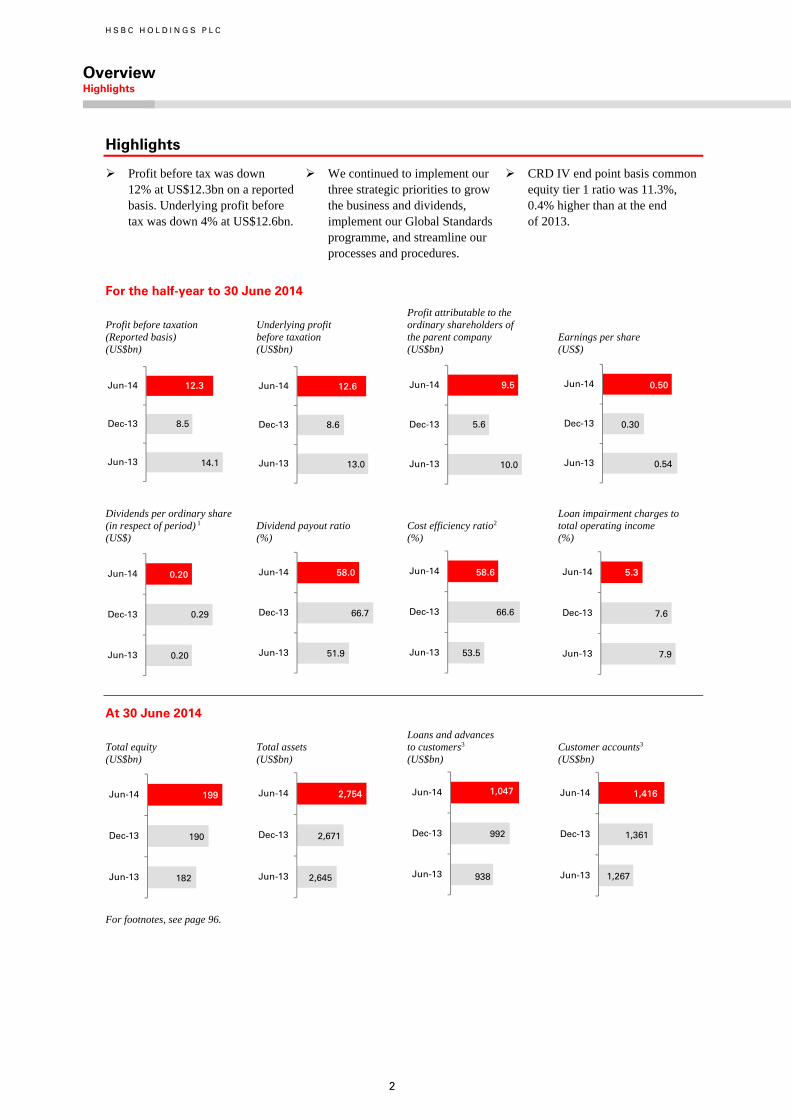
Profit before tax was down 12% at US$12.3bn on a reported basis. Underlying profit before tax was down 4% at US$12.6bn.
We continued to implement our three strategic priorities to grow the business and dividends, implement our Global Standards programme, and streamline our processes and procedures.
CRD IV end point basis common equity tier 1 ratio was 11.3%, 0.4% higher than at the end of 2013.
For the half-year to 30 June 2014
Profit before taxation (Reported basis) (US$bn)
Underlying profit before taxation (US$bn)
Profit attributable to the ordinary shareholders of the parent company (US$bn)
Earnings per share (US$)
Dividends per ordinary share (in respect of period) 1 (US$)
Dividend payout ratio (%)
Cost efficiency ratio2 (%)
Loan impairment charges to total operating income (%)
At 30 June 2014
Total equity (US$bn)
Total assets (US$bn)
Loans and advances to customers3 (US$bn)
Customer accounts3 (US$bn)
For footnotes, see page 96.
Jun-13
Dec-13
Jun-14
8.5
14.1
12.3
Jun-13
Dec-13
Jun-14
8.6
13.0
12.6
Jun-13
Dec-13
Jun-14
5.6
10.0
9.5
Jun-13
Dec-13
Jun-14
0.30
0.54
0.50
Jun-13
Dec-13
Jun-14
0.29
0.20
0.20
Jun-13
Dec-13
Jun-14
51.9
66.7
58.0
Jun-13
Dec-13
Jun-14
53.5
66.6
58.6
Jun-13
Dec-13
Jun-14
7.9
7.6
5.3
Jun-13
Dec-13
Jun-14
182
190
199
Jun-13
Dec-13
Jun-14
2,671
2,645
2,754
Jun-13
Dec-13
Jun-14
992
938
1,047
Jun-13
Dec-13
Jun-14
1,267
1,361
1,416
3
Ove
rvie
w
Inte
rim
Man
agem
ent
Rep
ort
D
irec
tors
Fi
nan
cial
Sta
tem
ents
A
dd
itio
nal
Info
rmat
ion
Annualised return on average ordinary shareholders’ equity4
(%) Half-year to:
Post-tax return on average total assets (%) Half-year to:
Ratio of customer advances to customer accounts3 (%)
Capital, leverage and return ratios
Common equity tier 1 ratio (end point) (%)
Common equity tier 1 ratio
(year 1 transition) (%)
Total capital ratio (year 1 transition) (%)
Risk-weighted assets (US$bn)
CR
D IV
5
Core tier 1 ratio (%)
Total capital ratio
(%) Risk-weighted assets
(US$bn)
Bas
el 2
.55
Pre-tax return on average RWAs6
(%) Half-year to:
Estimated leverage ratio7 (%)
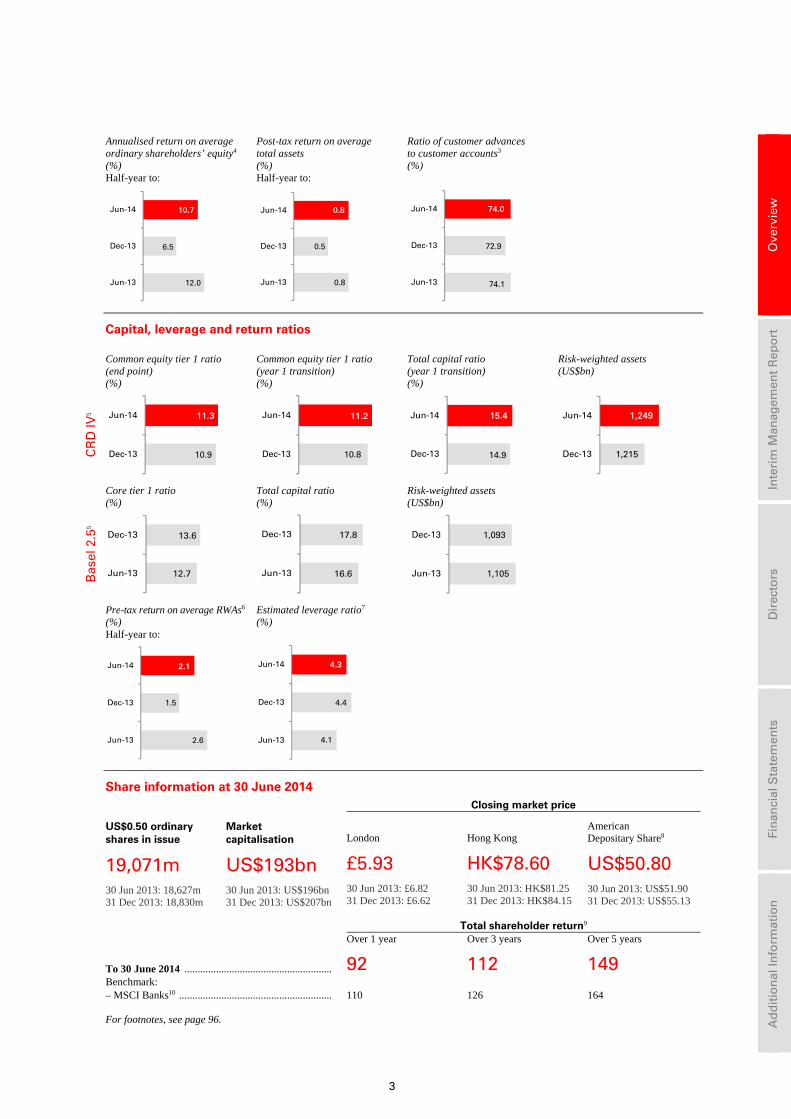
Share information at 30 June 2014 Closing market price
US$0.50 ordinary shares in issue
19,071m 30 Jun 2013: 18,627m 31 Dec 2013: 18,830m
Market capitalisation
US$193bn 30 Jun 2013: US$196bn 31 Dec 2013: US$207bn
London
£5.93 30 Jun 2013: £6.82 31 Dec 2013: £6.62
Hong Kong
HK$78.60 30 Jun 2013: HK$81.25 31 Dec 2013: HK$84.15
American Depositary Share8
US$50.80 30 Jun 2013: US$51.90 31 Dec 2013: US$55.13
Total shareholder return9
Over 1 year Over 3 years Over 5 years
To 30 June 2014 ........................................................ 92 112 149 Benchmark: – MSCI Banks10 .......................................................... 110 126 164
For footnotes, see page 96.
Jun-13
Dec-13
Jun-14
12.0
6.5
10.7
Jun-13
Dec-13
Jun-14
0.5
0.8
0.8
Jun-13
Dec-13
Jun-14
74.1
72.9
74.0
Dec-13
Jun-14
10.9
11.3
Dec-13
Jun-14
10.8
11.2
Dec-13
Jun-14
14.9
15.4
Dec-13
Jun-14 1,249
1,215
Jun-13
Dec-13
12.7
13.6
Jun-13
Dec-13
16.6
17.8
Jun-13
Dec-13 1,093
1,105
Jun-13
Dec-13
Jun-14 2.1
1.5
2.6 Jun-13
Dec-13
Jun-14 4.3
4.4
4.1
H S B C H O L D I N G S P L C
Overview Group Chairman’s Statement
4
Group Chairman’s Statement
In the first half of 2014, against a backdrop of continuing low interest rates and reduced financial market volumes, HSBC produced a suitably well-balanced financial performance. This was achieved while continuing to invest significant time and resources in reshaping the Group to meet the heightened and evolving expectations of our regulators and of the communities we serve. At a time of residual concerns over the sustainability of economic growth in many major markets and with heightened geopolitical tensions apparent, the Board supported management’s view that this was not the time to expand risk appetite to offset the effect of lower revenues arising from business disposals and legacy portfolio run-off.
Pre-tax profits on a reported basis were US$12.3bn, US$1.7bn or 12% less than in the first half of 2013. On an underlying basis, profit before tax was 4% behind the comparable period, with the major business contributor being lower revenues from traded markets. Earnings per ordinary share were US$0.50 (2013: US$0.54), amply covering the first two dividends in respect of 2014 of US$0.20, which were consistent with those of last year at the same stage.
These results illustrate the challenge of funding a considerable expansion of Risk and Compliance resources as well as the operational and structural changes needed to address new regulatory and public policy requirements at a time of limited revenue growth opportunities. That we have been able to hold growth in underlying costs to 2% is attributable to further good progress with regard to systems and process re-engineering and simplification, as well as continuing cost discipline.
Business disposals and portfolio run-off do, however, contribute positively to internal capital
generation. This, together with capital generated from operating performance and the benefit of scrip dividends, contributed to a further strengthening of the Group’s capital position. At 30 June 2014, our end point common equity tier 1 ratio improved to 11.3% compared with 10.9% at the beginning of the year and 10.1% a year ago.
The ‘Group Chief Executive’s Business Review’ draws out the highlights of business performance in the first half of 2014. I want to highlight three points which arise both from industry and our own re-shaping.
Execution challenges are necessarily the primary focus of Board oversight
The demands now being placed on the human capital of the firm and on our operational and systems capabilities are unprecedented. The cumulative workload arising from a regulatory reform programme that is unfortunately increasingly fragmented, often extraterritorial, still evolving and still adding definition is hugely consumptive of resources that would otherwise be customer facing. Add to this recent obligations to perform highly granular multiple stress tests which are inconsistent in definition and scenarios between major jurisdictions and so require considerable duplication of effort; recently announced significant wholesale market practice and competition reviews in the UK; reorganising the financial, operational and structural framework of the Group to respond to evolving thinking on cross-border resolution protocols; and, finally, planning what will be a multi-year project to separate and establish the ring-fenced bank in the UK, and the dimension of the execution risk is obvious.
To be clear, we are committed and resourced to deliver all of the above. But there is extremely limited spare capacity. Prioritisation, which is clearly critical, will require support and guidance from public policy and regulatory bodies, particularly in the UK, regarding the juxtaposition of the recently announced competition review and preparation for the creation of the ring-fenced bank. Equally important is delivery of the stated intention of the Financial Stability Board and the G20 to seek to draw a close on fresh regulatory initiatives by the end of this year.
Retention of our human capital is essential
Following on from the above it is also obvious how critical it is that we retain the goodwill and commitment of all of our staff as we plan and deliver the above transformation agenda alongside ‘business as usual’ support for our customers in satisfying their business and personal needs. I do not think we have ever had to ask so much of so many. The commitment
5
Ove
rvie
w
In
teri
m M
anag
emen
t R
epo
rt
Dir
ecto
rs
Fin
anci
al S
tate
men
ts
Ad
dit
ion
al In
form
atio
n
and loyalty we receive is recognised with deep gratitude by executive management and the Board. We cannot, however, be complacent that this can be taken for granted. We face growing fatigue within critical functions as well as increased market competition for trained staff from other financial institutions facing similar resource challenges. This is adding to cost pressures both from increased salaries as market rates increase, and from investment in training and systems support to improve productivity. This underscores the importance of finalising the regulatory reform agenda in the near term.
Growing danger of risk aversion and financial exclusion
We continue to make good progress with implementing Global Standards, aiming to deliver a consistent approach to risk management, particularly in relation to financial crime risk. Success will be reflected in reduced incidence and severity of future customer redress and less exposure to regulatory and legal penalties. Recent high profile financial penalties and legal proceedings initiated against individuals are serving their intended purpose of highlighting the risks, both to shareholders’ capital and to staff held responsible, of future infringement. Today, no one in our industry can fail to be aware of the heightened expectations of society regarding the role of banks in supporting economic activity; nor can they be unaware of the potential penalties for failing to live up to these expectations, particularly regarding conduct issues or breach of trust.
Greater focus on conduct and financial crime risks at all levels of the firm globally is clearly the right response to past shortcomings. There is, however, an observable and growing danger of disproportionate risk aversion creeping into decision-making in our businesses as individuals, facing uncertainty as to what may be criticised with hindsight and perceiving a zero tolerance of error, seek to protect themselves and the firm from future censure. We can address this behaviour through training and leadership, but we also need clarity from public policy and regulatory bodies over their expectations in this regard. Unwarranted risk aversion threatens to restrict access to the formal financial system to many who could benefit from it and risks unwinding parts of the ecosystem of networks and relationships that support global trade and investment.
Board changes
Since we reported to shareholders at the Annual General Meeting there have been two further changes to the Board, both announced on 1 August.
We are delighted to welcome Heidi Miller to the Board and to the Group Risk and Conduct & Values Committees with effect from 1 September. Heidi brings to the Board extensive international banking and finance experience developed in a career spanning over 30 years in some of the largest and most complex banking organisations.
As President of International at JPMorgan Chase & Co. from 2010 to 2012, Heidi had responsibility for leading the bank’s global expansion and international business strategy across the Investment Bank and Asset Management divisions, as well as for the Treasury and Securities Services division, which she had run for the previous six years. Other former roles include Chief Financial Officer at both Bank One Corporation and Citigroup Inc.
Marvin Cheung, who has decided to retire for personal reasons, will be sorely missed. Marvin has served on the Board and on the Audit Committee since 2009, contributing great technical accounting and audit skills as well as a deep understanding of Hong Kong and mainland China issues. On behalf of the Board I want to thank him for his contribution over many years and wish him well for the future.
Looking forward
Notwithstanding the challenges before us, I am confident that the business model outlined in the Group Chief Executive’s Business Review has further potential, and that we have the leadership and capabilities throughout the firm to make the most of that potential to the benefit of all our stakeholders. Although we spend much time grappling with the technicalities of the outstanding regulatory agenda, we never lose sight of why it is urgent we implement the required changes. In summary, we need to energise our staff with the prospect of rebalancing their workloads – away from looking back and away from embedding new requirements and training – and on to supporting the investment needed to stimulate growth, on to the design of new products to better manage risk, on to more exciting use of the new technologies that will allow people greater and cheaper access to a wider range of well-designed financial services, and on to the innovation that will help people deal with retirement through more efficient management of, and access to, their savings and investments.
D J Flint, Group Chairman 4 August 2014

H S B C H O L D I N G S P L C
Overview (continued) Group Chief Executive’s Business Review
6
Group Chief Executive’s Business Review
2014 marks the start of the next phase of the implementation of our strategy. Against the backdrop of continuing regulatory change highlighted in the Group Chairman’s statement, in the first six months of the year we continued to implement our three equal priorities to grow the business and dividends, implement our Global Standards programme, and streamline our processes and procedures.
Reported profit before tax was US$12.3bn, US$1.7bn lower than the equivalent period in 2013, as last year’s first half benefited from higher gains from disposals and reclassifications, principally with respect to Hang Seng Bank’s investment in Industrial Bank.
Underlying profit before tax was US$12.6bn, US$0.5bn lower than the prior year, and was affected by a number of significant items. Excluding these, profit before tax was US$0.4bn higher. Return on average ordinary shareholders’ equity was 10.7%.
Commercial Banking revenue continued to grow, with a good performance in Asia.
Global Banking and Markets, with its differentiated business model, was affected by low market volatility and client activity in our Markets business; however, we increased our market share in debt and equity capital markets, mergers and acquisitions, and lending.
Retail Banking and Wealth Management underlying revenue, excluding significant items, was lower primarily reflecting the run-off of our US Consumer Mortgage Lending portfolio. In our Principal business, also excluding significant items, underlying revenue was broadly unchanged.
Loan impairment charges fell and we continued to closely manage our costs while investing further in our Risk and Compliance functions and Global Standards, in line with our strategy.
Our capital position remained strong and our CRD IV end point basis common equity tier 1 ratio improved to 11.3% compared with the year-end position of 10.9%.
A universal bank with an unrivalled global network
The course that we first charted for the Group in 2011 to capitalise on the growth of global trade and capital flows, and economic development in developing markets remains firmly in place. These trends play naturally to the strengths of HSBC’s global network and to the benefits of our universal banking model.
Between 2011 and 2013, we re-modelled the Group to meet the requirements of our strategy. This meant selling or exiting non-strategic businesses and running down our legacy portfolios, as well as changing aspects of the way we do business. Whilst we have foregone a substantial amount of revenue through this process, it has created a more coherent, logical and stronger bank with a solid platform for growth.
HSBC today is a universal bank with a presence in 74 markets, including all of the top 15 countries by GDP. Our universal banking model gives us two major advantages in our pursuit of a greater share of the market.
First, it enables us to offer an integrated service between our global businesses and geographies.
Secondly, it increases our resilience as a Group and our ability to react to local circumstances and policy developments, whilst adhering to global standards.
By emphasising the connectedness of our global businesses and our international network, and applying the benefits of our scale on a local basis, we are able to provide a service that is responsive and tailored to the needs of our clients.
The strength of this model is reflected in the naming of HSBC as the Best Emerging Markets Bank and the Best Bank in Asia at the Euromoney Awards for Excellence 2014.
Capitalising on our network
Our ongoing task is to apply these strengths to replace the revenue foregone as a result of the sale or closure of non-strategic businesses, the reduction of
7
Ove
rvie
w
In
teri
m M
anag
emen
t R
epo
rt
Dir
ecto
rs
Fin
anci
al S
tate
men
ts
Ad
dit
ion
al In
form
atio
n
risk in our ongoing business, the run-off of our legacy portfolios, and the adverse effect of the low interest rate environment since the financial crisis.
A large portion of this revenue has already been replaced organically, and over the next three years we will continue to invest in the higher growth areas of our business, centred on our unique international network.
This network is HSBC’s biggest competitive strength. Developed over nearly 150 years, it is highly distinctive, difficult to replicate and ideally positioned for the world’s top trade corridors.
A significant proportion of revenue in our global businesses arises from strategic product areas that benefit from our international network and collaboration between our global businesses.
These product areas – Global Trade and Receivables Finance; Payments and Cash Management; Foreign Exchange; and renminbi services – are our investment priorities for the next three years. They embody HSBC’s strengths in that they cut across global businesses and rely on superior connectivity to capture market share and deliver growth and scale.
Global Trade and Receivables Finance is an area of natural strength for HSBC in which we have continued to increase our market share. In the first half of 2014, we maximised the benefits of our network to win a number of high profile deals and began to reorganise our operating platforms for Receivables Finance on a regional basis. This allows us to provide a faster, more efficient service, benefiting our clients as well as our business.
Payments and Cash Management is a strong and stable provider of profit growth for the Group. Between 2011 and 2013 we grew our market share in PCM from 8% to 10.9%. In the first half of 2014, we increased new customer mandates by 19% compared with the same period in 2013, and delivered improved client coverage, including in the United States and mainland China. Expanding our reach should enable us to improve our market position further in future periods.
In Foreign Exchange, we are investing to prepare our business for the future by upgrading our platforms. With the opportunities afforded by our network, this establishes a base that should enable us to increase our share of the foreign exchange market beyond the gains made in the first three years of our strategy. Our market share has increased to 7.1% and we are optimistic about future growth.
HSBC has a major position in renminbi services which reflects our significant presence in the major renminbi hubs of Hong Kong, London, Shanghai and Singapore. We consolidated that position in the first half of 2014. HSBC ranked first across all eight categories in Asiamoney’s Offshore RMB Poll 2014 and was voted the Best Overall Offshore RMB Products/Services provider for the third successive year.
Our investment in these products is supported by investment in countries that bridge trade and capital flows – such as Germany, the United States and mainland China – and large city clusters which contain deep international revenue pools.
We believe this investment will lead to growth in profits and increased dividends for our shareholders. We are pursuing these alongside our equal priorities to implement our Global Standards programme and streamline our processes and procedures.
Business outlook
We remain broadly positive about the economic outlook for the majority of our home and priority markets. The UK in particular should maintain a firm recovery. We have slightly increased our forecasts for mainland China GDP growth in 2014 to 7.5% and expect Hong Kong to benefit from export growth in the second half of the year. Growth in Latin America remains muted. Our Middle East business continues to perform well, albeit overshadowed by regional uncertainties.
There are indications that interest rates could start to rise as early as the fourth quarter of 2014 in the UK and the first half of 2015 in the US, which given the size of our commercial surplus has positive implications for our revenues.
Whilst regulatory uncertainty persists, our balance sheet remains strong. Our ability to generate capital continues to support our progressive dividend policy. We remain well placed to meet expected future capital requirements, to continue to deliver an attractive total shareholder return and to establish HSBC as the world’s leading international bank.
S T Gulliver, Group Chief Executive 4 August 2014
H S B C H O L D I N G S P L C
Overview (continued) Value creation and long-term sustainability / Our strategy
8
Value creation and long-term sustainability
Through our principal activities – making payments, holding savings, providing finance and managing risks – we play a central role in society and in the economic system. Our target is to build and maintain a business which is sustainable in the long term.
How we create value
Banks play a crucial role in the economic and social system, creating value for many parties in different ways. We provide a facility for customers to securely and conveniently deposit their savings. We allow funds to flow from savers and investors to borrowers, either directly or through the capital markets. The borrowers then use these loans or other forms of credit to buy goods or invest in businesses. By these means, we help the economy to convert savings which may be individually short-term into financing which is, in aggregate, longer term. We bring together investors and people looking for investment funding and we develop new financial products. We also facilitate personal and commercial transactions by acting as payment agent both within countries and internationally. Through these activities, we take on risks which we then manage and reflect in our prices.
Our direct lending includes residential and commercial mortgages and overdrafts, and term loan facilities. We finance importers and exporters engaged in international trade and provide advances to companies secured on amounts owed to them by their customers.
We also offer additional financial products and services including broking, asset management, financial advisory services, life insurance, corporate finance, securities services and alternative investments. We make markets in financial assets so that investors have confidence in efficient pricing and the availability of buyers and sellers. We provide these products for clients ranging from governments to large and mid-market corporates, small and medium-sized enterprises, high net worth individuals and retail customers. We help customers raise financing from external investors in debt and equity capital markets. We create liquidity and price transparency in these securities allowing investors to buy and sell them on the secondary market. We exchange national currencies, helping international trade.
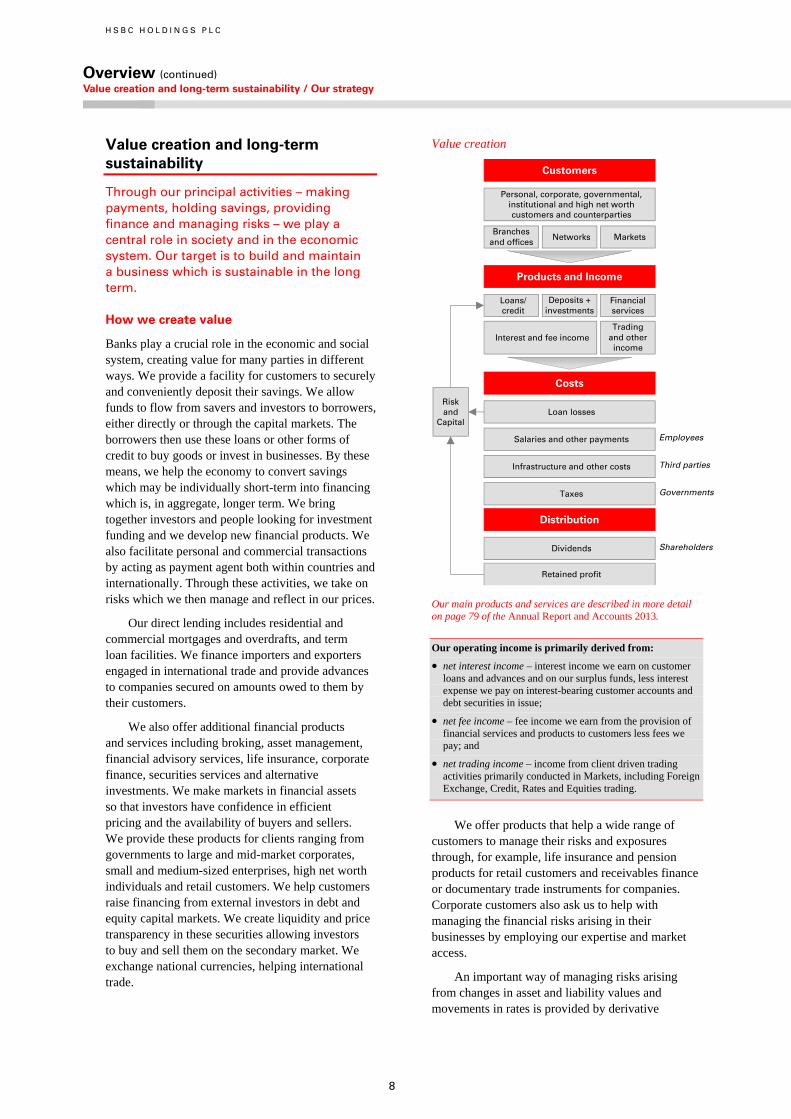
Value creation
Our main products and services are described in more detail on page 79 of the Annual Report and Accounts 2013.
Our operating income is primarily derived from:
• net interest income – interest income we earn on customer loans and advances and on our surplus funds, less interest expense we pay on interest-bearing customer accounts and debt securities in issue;
• net fee income – fee income we earn from the provision of financial services and products to customers less fees we pay; and
• net trading income – income from client driven trading activities primarily conducted in Markets, including Foreign Exchange, Credit, Rates and Equities trading.
We offer products that help a wide range of customers to manage their risks and exposures through, for example, life insurance and pension products for retail customers and receivables finance or documentary trade instruments for companies. Corporate customers also ask us to help with managing the financial risks arising in their businesses by employing our expertise and market access.
An important way of managing risks arising from changes in asset and liability values and movements in rates is provided by derivative
Customers
Branchesand offices Networks Markets
Personal, corporate, governmental, institutional and high net worth customers and counterparties
Products and Income
Loans/credit
Deposits +investments
Financial services
Interest and fee incomeTrading
and otherincome
Costs
Loan losses
Salaries and other payments
Infrastructure and other costs
Taxes
Dividends
Retained profit
Riskand
Capital
Employees
Third parties
Governments
Shareholders
Distribution

9
Ove
rvie
w
In
teri
m M
anag
emen
t R
epo
rt
D
irec
tors
Fin
anci
al S
tate
men
ts
A
dd
itio
nal
Info
rmat
ion
products such as forwards, futures, swaps and options. In this connection, we are an active market-maker and derivative counterparty. Customers use derivatives to manage their risks, for example, by:
• using forward foreign currency contracts to hedge their income from export sales or costs of imported materials;
• using an inflation swap to hedge future inflation-linked liabilities, for example, for pension payments;
• transforming variable payments of debt interest into fixed rate payments, or vice versa; or
• providing investors with hedges against movements in markets or particular stocks.
We charge customers a margin, representing the difference between the price charged to the customer and the theoretical cost of executing an offsetting hedge in the market. We retain that margin, which represents a profit to the Group, at maturity of the transaction if the risk management of the position has been effective.
We then use derivatives along with other financial instruments to constrain the risks arising from customer business within risk limits. Normally, we will have customers both buying and selling relevant instruments so our focus is then on managing any residual risks through transactions with other dealers or professional counterparties. Where we do not fully hedge the residual risks we may gain or lose money as market movements affect the net value of the portfolio.
Stress tests and other risk management techniques are also used to ensure that potential losses remain within our risk appetite under a wide range of potential market scenarios.
In addition, we manage risks within HSBC, including those which arise from the business we do with customers.
Long-term sustainability
At HSBC, we understand that the success of our business is closely connected to the economic, environmental and social landscape in which we operate. For us, long-term corporate sustainability means achieving a sustainable return on equity and profit growth so that we can continue to reward shareholders and employees, build long-lasting relationships with customers and suppliers, pay taxes and duties in the countries in which we operate, and invest in communities for future growth. The way we do business is as important as what we do: our
responsibilities to our customers, employees and shareholders as well as to the countries and communities in which we operate go far beyond simply being profitable.
Continuing financial success depends, in part, on our ability to identify and address environmental, social and ethical developments which present risks or opportunities for the business. It also depends on the consistent implementation of the highest standards everywhere we operate to detect, deter and protect against financial crime. Our response to these factors shapes our reputation, drives employee engagement and affects the riskiness of the business, and can help reduce costs and secure new revenue streams.
Our international network and the long-established position of many of our businesses in HSBC’s home and priority growth markets, when combined with our wide-ranging portfolio of products and services, differentiate HSBC from our competitors and give our business and operating models an inherent resilience. This has enabled the Group to remain profitable and grow through the most turbulent of times for our industry, and we are confident that the models will continue to stand us in good stead in the future and will underpin the achievement of our strategic priorities.
Our strategy
Our strategy is designed to ensure we have a sustainable business for the long term.
Long-term trends
Our strategy is aligned to two long-term trends.
• The world economy is becoming ever more connected, with growth in world trade and cross-border capital flows continuing to outstrip growth in average gross domestic product. Over the next decade we expect 35 markets to generate 90% of world trade growth with a similar degree of concentration in cross-border capital flows.
• Of the world’s top 30 economies, we expect those of Asia, Latin America, the Middle East and Africa to have increased by around fourfold in size by 2050, benefiting from demographics and urbanisation. By this time they will be larger than those of Europe and North America combined. By 2050, we expect 18 of the 30 largest economies will be from Asia, Latin America or the Middle East and Africa.
H S B C H O L D I N G S P L C
Overview (continued) Our strategy / Business and operating models
10
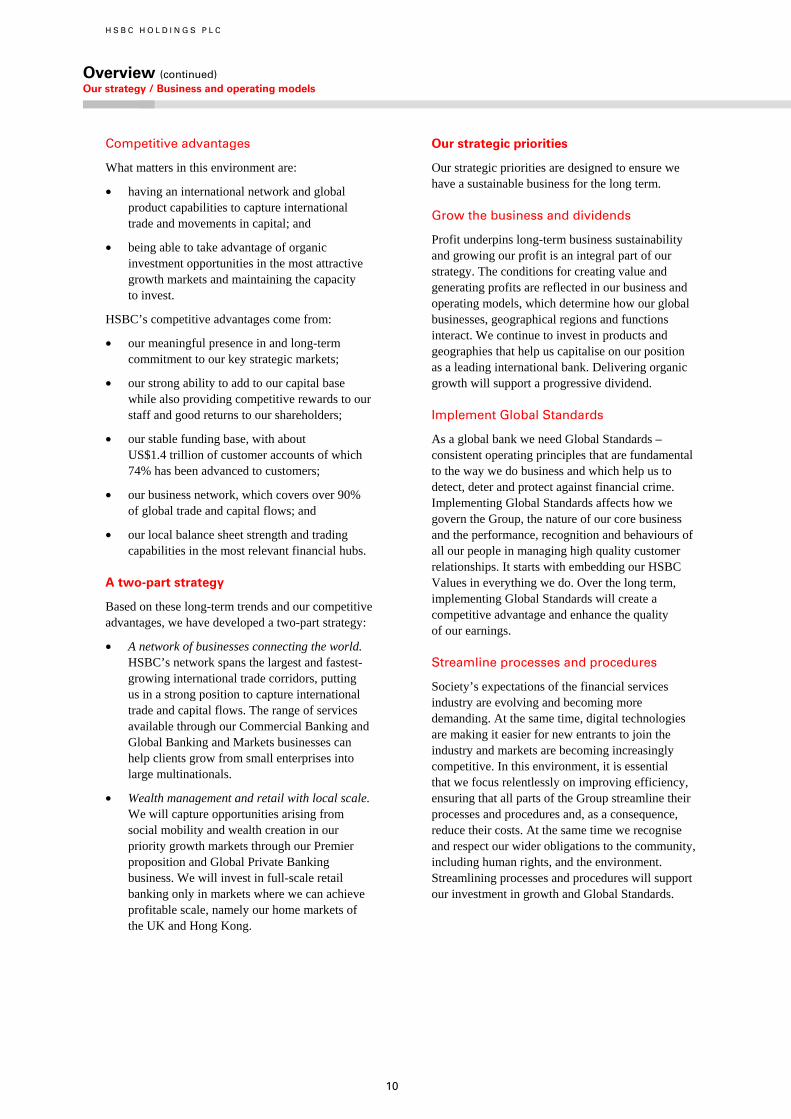
Competitive advantages
What matters in this environment are:
• having an international network and global product capabilities to capture international trade and movements in capital; and
• being able to take advantage of organic investment opportunities in the most attractive growth markets and maintaining the capacity to invest.
HSBC’s competitive advantages come from:
• our meaningful presence in and long-term commitment to our key strategic markets;
• our strong ability to add to our capital base while also providing competitive rewards to our staff and good returns to our shareholders;
• our stable funding base, with about US$1.4 trillion of customer accounts of which 74% has been advanced to customers;
• our business network, which covers over 90% of global trade and capital flows; and
• our local balance sheet strength and trading capabilities in the most relevant financial hubs.
A two-part strategy
Based on these long-term trends and our competitive advantages, we have developed a two-part strategy:
• A network of businesses connecting the world. HSBC’s network spans the largest and fastest-growing international trade corridors, putting us in a strong position to capture international trade and capital flows. The range of services available through our Commercial Banking and Global Banking and Markets businesses can help clients grow from small enterprises into large multinationals.
• Wealth management and retail with local scale. We will capture opportunities arising from social mobility and wealth creation in our priority growth markets through our Premier proposition and Global Private Banking business. We will invest in full-scale retail banking only in markets where we can achieve profitable scale, namely our home markets of the UK and Hong Kong.
Our strategic priorities
Our strategic priorities are designed to ensure we have a sustainable business for the long term.
Grow the business and dividends
Profit underpins long-term business sustainability and growing our profit is an integral part of our strategy. The conditions for creating value and generating profits are reflected in our business and operating models, which determine how our global businesses, geographical regions and functions interact. We continue to invest in products and geographies that help us capitalise on our position as a leading international bank. Delivering organic growth will support a progressive dividend.
Implement Global Standards
As a global bank we need Global Standards – consistent operating principles that are fundamental to the way we do business and which help us to detect, deter and protect against financial crime. Implementing Global Standards affects how we govern the Group, the nature of our core business and the performance, recognition and behaviours of all our people in managing high quality customer relationships. It starts with embedding our HSBC Values in everything we do. Over the long term, implementing Global Standards will create a competitive advantage and enhance the quality of our earnings.
Streamline processes and procedures
Society’s expectations of the financial services industry are evolving and becoming more demanding. At the same time, digital technologies are making it easier for new entrants to join the industry and markets are becoming increasingly competitive. In this environment, it is essential that we focus relentlessly on improving efficiency, ensuring that all parts of the Group streamline their processes and procedures and, as a consequence, reduce their costs. At the same time we recognise and respect our wider obligations to the community, including human rights, and the environment. Streamlining processes and procedures will support our investment in growth and Global Standards.
11
Ove
rvie
w
In
teri
m M
anag
emen
t R
epo
rt
D
irec
tors
Fin
anci
al S
tate
men
ts
A
dd
itio
nal
Info
rmat
ion
Business and operating models
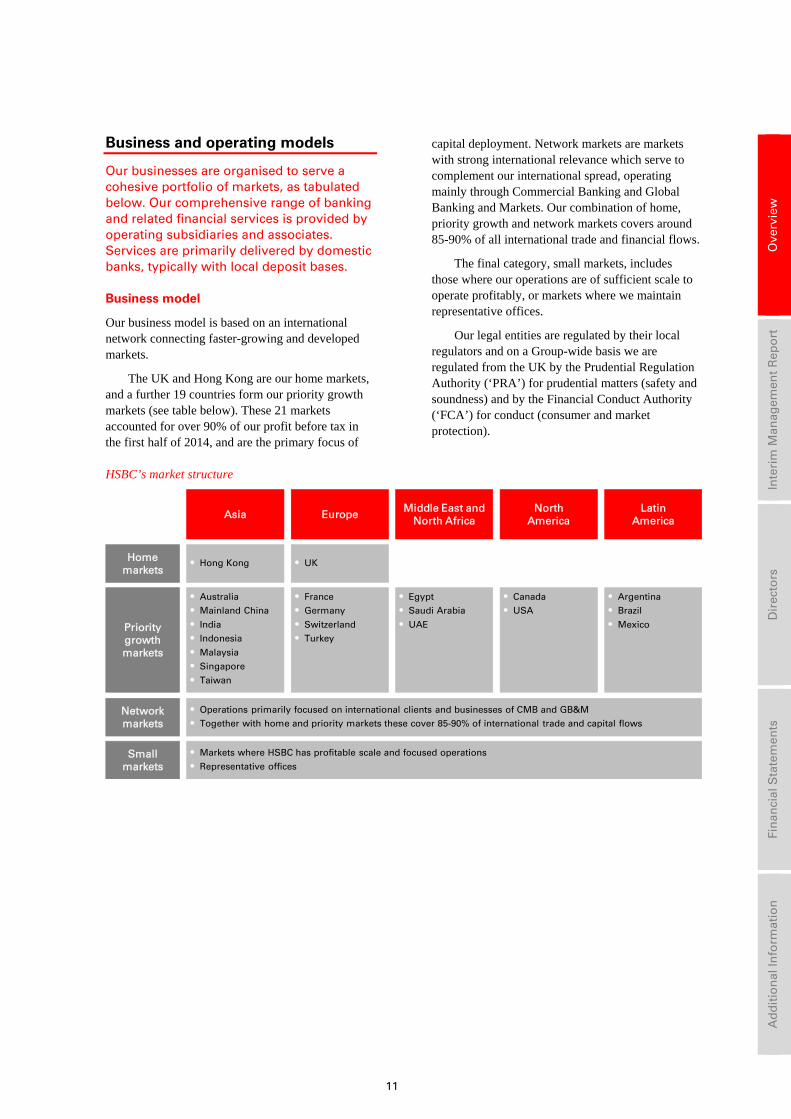
Our businesses are organised to serve a cohesive portfolio of markets, as tabulated below. Our comprehensive range of banking and related financial services is provided by operating subsidiaries and associates. Services are primarily delivered by domestic banks, typically with local deposit bases.
Business model
Our business model is based on an international network connecting faster-growing and developed markets.
The UK and Hong Kong are our home markets, and a further 19 countries form our priority growth markets (see table below). These 21 markets accounted for over 90% of our profit before tax in the first half of 2014, and are the primary focus of
capital deployment. Network markets are markets with strong international relevance which serve to complement our international spread, operating mainly through Commercial Banking and Global Banking and Markets. Our combination of home, priority growth and network markets covers around 85-90% of all international trade and financial flows.
The final category, small markets, includes those where our operations are of sufficient scale to operate profitably, or markets where we maintain representative offices.
Our legal entities are regulated by their local regulators and on a Group-wide basis we are regulated from the UK by the Prudential Regulation Authority (‘PRA’) for prudential matters (safety and soundness) and by the Financial Conduct Authority (‘FCA’) for conduct (consumer and market protection).
HSBC’s market structure
Homemarkets
Asia
• Hong Kong
Europe Middle East and North Africa
NorthAmerica
LatinAmerica
Prioritygrowthmarkets
Networkmarkets
Smallmarkets
• UK
• Australia• Mainland China
• India• Indonesia
• Malaysia
• Singapore
• Taiwan
• Operations primarily focused on international clients and businesses of CMB and GB&M• Together with home and priority markets these cover 85-90% of international trade and capital flows
• Markets where HSBC has profitable scale and focused operations
• Representative offices
• France• Germany
• Switzerland• Turkey
• Egypt• Saudi Arabia
• UAE
• Canada• USA
• Argentina• Brazil
• Mexico
H S B C H O L D I N G S P L C
Overview (continued) Business and operating models
12
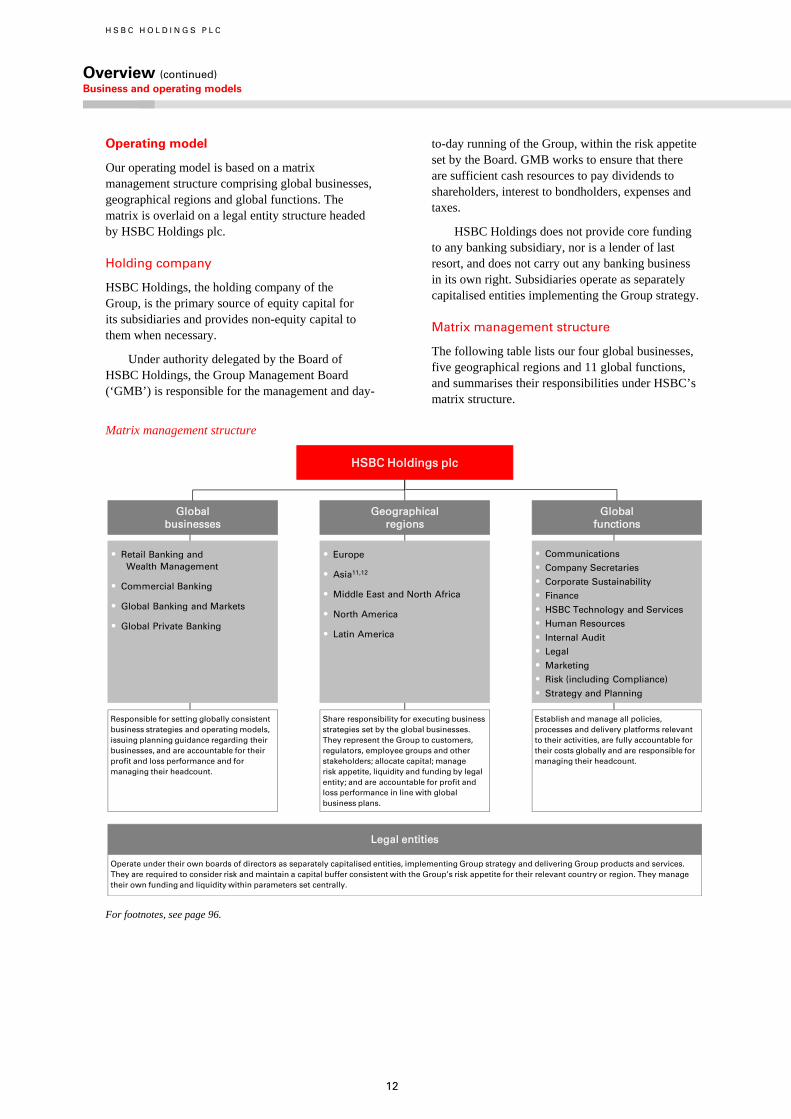
Operating model
Our operating model is based on a matrix management structure comprising global businesses, geographical regions and global functions. The matrix is overlaid on a legal entity structure headed by HSBC Holdings plc.
Holding company
HSBC Holdings, the holding company of the Group, is the primary source of equity capital for its subsidiaries and provides non-equity capital to them when necessary.
Under authority delegated by the Board of HSBC Holdings, the Group Management Board (‘GMB’) is responsible for the management and day-
to-day running of the Group, within the risk appetite set by the Board. GMB works to ensure that there are sufficient cash resources to pay dividends to shareholders, interest to bondholders, expenses and taxes.
HSBC Holdings does not provide core funding to any banking subsidiary, nor is a lender of last resort, and does not carry out any banking business in its own right. Subsidiaries operate as separately capitalised entities implementing the Group strategy.
Matrix management structure
The following table lists our four global businesses, five geographical regions and 11 global functions, and summarises their responsibilities under HSBC’s matrix structure.
Matrix management structure
For footnotes, see page 96.
• Retail Banking andWealth Management
• Commercial Banking
• Global Banking and Markets
• Global Private Banking
Globalbusinesses
Globalfunctions
• Communications
• Company Secretaries
• Corporate Sustainability
• Finance
• HSBC Technology and Services
• Human Resources
• Internal Audit
• Legal
• Marketing
• Risk (including Compliance)
• Strategy and Planning
Establish and manage all policies, processes and delivery platforms relevant to their activities, are fully accountable for their costs globally and are responsible for managing their headcount.
Responsible for setting globally consistent business strategies and operating models, issuing planning guidance regarding their businesses, and are accountable for their profit and loss performance and for managing their headcount.
Legal entities
Operate under their own boards of directors as separately capitalised entities, implementing Group strategy and delivering Group products and services. They are required to consider risk and maintain a capital buffer consistent with the Group’s risk appetite for their relevant country or region. They manage their own funding and liquidity within parameters set centrally.
HSBC Holdings plc
Geographicalregions
• Europe
• Asia11,12
• Middle East and North Africa
• North America
• Latin America
Share responsibility for executing business strategies set by the global businesses. They represent the Group to customers, regulators, employee groups and other stakeholders; allocate capital; manage risk appetite, liquidity and funding by legal entity; and are accountable for profit and loss performance in line with global business plans.
13
Ove
rvie
w
In
teri
m M
anag
emen
t R
epo
rt
D
irec
tors
Fin
anci
al S
tate
men
ts
A
dd
itio
nal
Info
rmat
ion
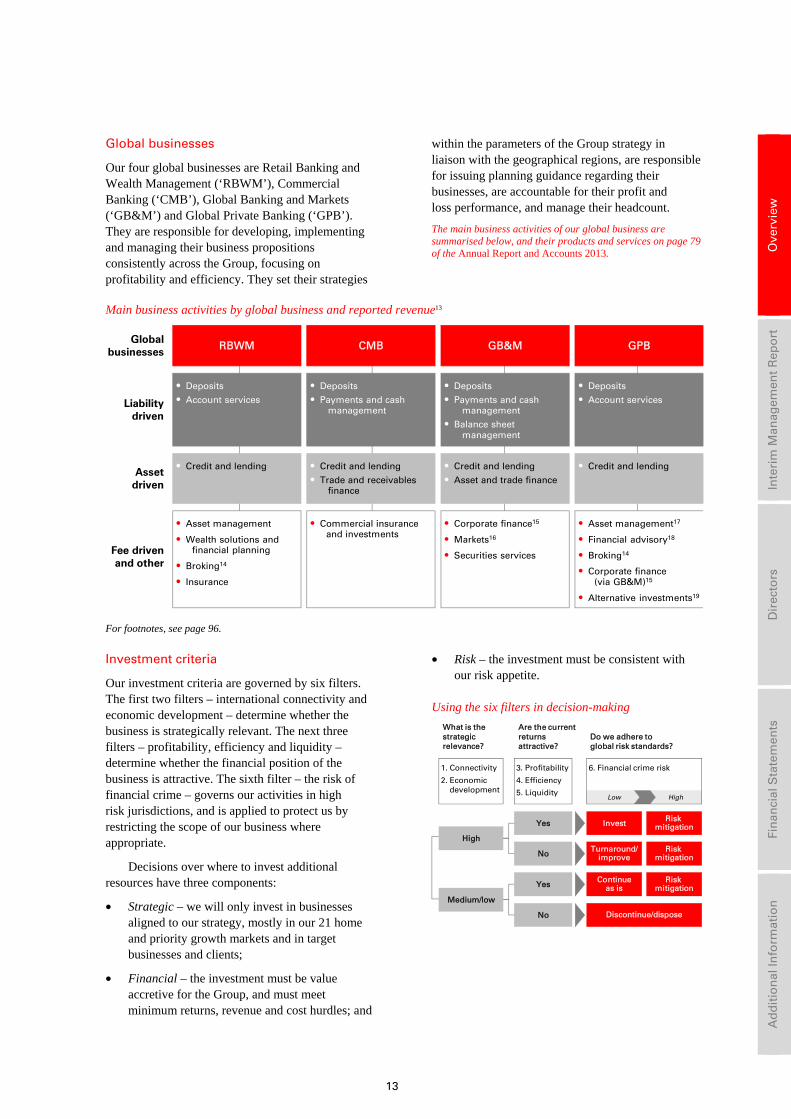
Global businesses
Our four global businesses are Retail Banking and Wealth Management (‘RBWM’), Commercial Banking (‘CMB’), Global Banking and Markets (‘GB&M’) and Global Private Banking (‘GPB’). They are responsible for developing, implementing and managing their business propositions consistently across the Group, focusing on profitability and efficiency. They set their strategies
within the parameters of the Group strategy in liaison with the geographical regions, are responsible for issuing planning guidance regarding their businesses, are accountable for their profit and loss performance, and manage their headcount.
The main business activities of our global business are summarised below, and their products and services on page 79 of the Annual Report and Accounts 2013.
Main business activities by global business and reported revenue13
For footnotes, see page 96.
Investment criteria
Our investment criteria are governed by six filters. The first two filters – international connectivity and economic development – determine whether the business is strategically relevant. The next three filters – profitability, efficiency and liquidity – determine whether the financial position of the business is attractive. The sixth filter – the risk of financial crime – governs our activities in high risk jurisdictions, and is applied to protect us by restricting the scope of our business where appropriate.
Decisions over where to invest additional resources have three components:
• Strategic – we will only invest in businesses aligned to our strategy, mostly in our 21 home and priority growth markets and in target businesses and clients;
• Financial – the investment must be value accretive for the Group, and must meet minimum returns, revenue and cost hurdles; and
• Risk – the investment must be consistent with our risk appetite.
Using the six filters in decision-making
RBWM CMB GB&M GPB
• Deposits
• Account services
• Deposits
• Payments and cash management
• Deposits
• Payments and cash management
• Balance sheetmanagement
• Deposits
• Account services
Globalbusinesses
Liabilitydriven
• Credit and lending • Credit and lending
• Trade and receivables finance
• Credit and lending
• Asset and trade finance
• Credit and lendingAsset
driven
• Asset management
• Wealth solutions andfinancial planning
• Broking14
• Insurance
• Commercial insurance and investments
• Corporate finance15
• Markets16
• Securities services
• Asset management17
• Financial advisory18
• Broking14
• Corporate finance (via GB&M)15
• Alternative investments19
Fee drivenand other
What is the strategic relevance?
Are the currentreturns attractive?
Do we adhere to global risk standards?
1. Connectivity
2. Economic development
3. Profitability
4. Efficiency
5. Liquidity
Yes Invest
Turnaround/improve
Continueas is
No
Yes
No
High
Medium/low
Discontinue/dispose
Low High
6. Financial crime risk
Risk mitigation
Risk mitigation
Risk mitigation
H S B C H O L D I N G S P L C
Overview (continued) Global Standards > Governance framework / The Monitor / HSBC Values
14
Global Standards
We have developed Global Standards shaped by the highest or most effective standards of financial crime compliance available in any jurisdiction where HSBC operates and are now in the process of deploying these globally on a consistent basis.
By definition, the impact of Global Standards is organisation-wide, and the principal means by which we drive consistently high standards is through universal application of our HSBC Values, strong systems of governance and the behaviours, performance and recognition of all our people in managing high quality customer relationships.
In line with our ambition to be recognised as the world’s leading international bank, we aspire to set the industry standard for knowing our customers and detecting, deterring and protecting against financial crime. As international markets become more interconnected and complex and as threats to the global financial system grow, we are strengthening further the policies and practices which govern how we do business and with whom.
We greatly value our reputation. Our success over the years is due in no small part to our reputation for trustworthiness and integrity. In areas where we have fallen short in recent years – in the application of our standards and in our ability to identify and so prevent misuse and abuse of the financial system through our networks – we have moved immediately to strengthen our governance processes and have committed to adopt and enforce the highest or most effective financial crime compliance standards across HSBC.
We continue to reinforce the status and significance of compliance and adherence to our Global Standards by building strong internal controls, developing world class capabilities through communication, training and assurance programmes to make sure employees understand and can meet their responsibilities, and redesigning core elements of how we assess and reward senior executives.
We see the implementation of Global Standards as a source of competitive advantage. Global Standards allow us to:
• strengthen our response to the ongoing threat of financial crime;
• make consistent – and therefore simplify – the ways by which we monitor and enforce high standards at HSBC;
• strengthen policies and processes that govern how we do business and with whom; and
• ensure that we consistently apply our HSBC Values.
We expect our Global Standards to underpin our business practices now and in the future. Initially, we are concentrating on transforming how we detect, deter and protect against financial crime. We are implementing a more consistent, comprehensive approach to assessing financial crime risk in order to help protect our customers, our employees and the financial system as a whole.
Governance framework
Following Board approval of HSBC’s global anti-money laundering (‘AML’) and sanctions policies in January 2014, the programme to implement Global Standards is transitioning from the design phase into deployment.
The global businesses and Financial Crime Compliance organisation, supported by HSBC Technology and Services, are formally accountable for delivering business procedures, controls and the associated operating environment to implement our new policies within each global business and jurisdiction.
To ensure that programme governance reflects this shift in accountability, we have revised the composition of the Global Standards Execution Committee to include the Chief Executive Officers of each global business, under the chairmanship of the Group Chief Risk Officer.
Correspondingly, and to promote closer integration with business as usual, a report on the implementation of Global Standards has now become a standing item at the Group’s Risk Management Meeting. This replaces the Global Standards Steering Meeting (formerly a meeting of the GMB). The Financial System Vulnerabilities Committee and the Board continue to receive regular reports on the Global Standards programme.
The process of embedding Global Standards and the supporting controls and capabilities that allow the business to identify and mitigate financial crime risk has begun. The implementation programme is focused on the following four areas, as described on page 24 of the Annual Report and Accounts 2013:
• data readiness; • customer due diligence; • financial crime compliance; and • financial intelligence.
15
Ove
rvie
w
In
teri
m M
anag
emen
t R
epo
rt
D
irec
tors
Fin
anci
al S
tate
men
ts
A
dd
itio
nal
Info
rmat
ion
Risk appetite
Over the longer term, the sustainable operation of financial crime risk controls as part of our everyday business is governed according to our global Financial Crime Risk Appetite Statement. The overarching approach and appetite to financial crime risk is that we will not tolerate operating without the appropriate systems and controls in place to prevent and detect financial crime and will not conduct business with individuals or entities we believe are engaged in illicit behaviour.
Enterprise-wide risk assessment
We have established an annual process for conducting enterprise-wide assessments of our risks and controls related to sanctions and AML compliance. The outcome of these assessments forms the basis for risk management planning, prioritisation and resource allocation.
The Monitor
Under the agreements entered into with the US Department of Justice (‘DoJ’), the FCA (formerly the FSA) and the US Federal Reserve Board (‘FRB’) in 2012, including the five-year Deferred Prosecution Agreement (‘US DPA’), it was agreed that an independent compliance monitor (‘the Monitor’) would be appointed to evaluate our progress in fully implementing our obligations and produce regular assessments of the effectiveness of our Compliance function.
Michael Cherkasky began his work as the Monitor in July 2013, charged with evaluating and reporting upon the effectiveness of the Group’s internal controls, policies and procedures as they relate to ongoing compliance with applicable AML, sanctions, terrorist financing and proliferation financing obligations, over a five-year period.
The Monitor’s work is proceeding as expected, consistent with the timelines and requirements set forth in the relevant agreements. HSBC is taking concerted action to remediate AML and sanctions compliance deficiencies and to implement Global Standards. We recognise we are only at the start of a long journey, being just over a year into our US DPA. We look forward to maintaining a strong, collaborative relationship with the Monitor and his team.
HSBC Values
Embedding HSBC Values in every decision and every interaction with customers and with each other
is a top priority for the Group and is shaping the way we do business.
The role of HSBC values in daily operating practice is fundamental to our culture, and is particularly important in the light of developments in regulatory policy, investor confidence and society’s expectations of banks.
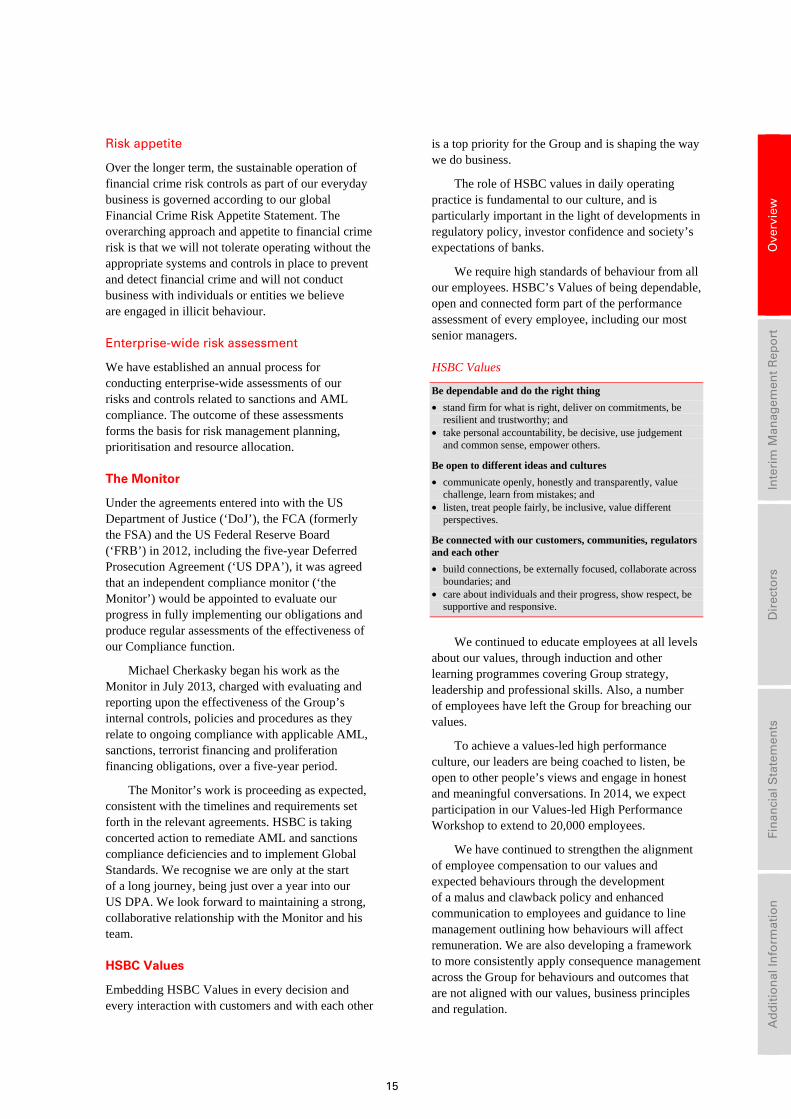
We require high standards of behaviour from all our employees. HSBC’s Values of being dependable, open and connected form part of the performance assessment of every employee, including our most senior managers.
HSBC Values
Be dependable and do the right thing
• stand firm for what is right, deliver on commitments, be resilient and trustworthy; and
• take personal accountability, be decisive, use judgement and common sense, empower others.
Be open to different ideas and cultures
• communicate openly, honestly and transparently, value challenge, learn from mistakes; and
• listen, treat people fairly, be inclusive, value different perspectives.
Be connected with our customers, communities, regulators and each other
• build connections, be externally focused, collaborate across boundaries; and
• care about individuals and their progress, show respect, be supportive and responsive.
We continued to educate employees at all levels about our values, through induction and other learning programmes covering Group strategy, leadership and professional skills. Also, a number of employees have left the Group for breaching our values.
To achieve a values-led high performance culture, our leaders are being coached to listen, be open to other people’s views and engage in honest and meaningful conversations. In 2014, we expect participation in our Values-led High Performance Workshop to extend to 20,000 employees.
We have continued to strengthen the alignment of employee compensation to our values and expected behaviours through the development of a malus and clawback policy and enhanced communication to employees and guidance to line management outlining how behaviours will affect remuneration. We are also developing a framework to more consistently apply consequence management across the Group for behaviours and outcomes that are not aligned with our values, business principles and regulation.
H S B C H O L D I N G S P L C
Overview (continued) Risk > Risk factors / Top and emerging risks
16
Risk
As a provider of banking and financial services, risk is at the core of our day-to-day activities.
All our activities involve, to varying degrees, the measurement, evaluation, acceptance and management of risk or combinations of risks which we assess on a Group-wide basis.
Our risk culture is fundamental to the delivery of the Group’s strategic priorities. It may be characterised as conservative, control-based and collegiate. It is reinforced by our HSBC Values and our Global Standards, and forms the basis on which our risk appetite is established. Our risk
management framework is employed at all levels of the organisation, and is instrumental in aligning the behaviour of individuals with the Group’s attitude to assuming and managing risk and ensuring that our risk profile is aligned to our risk appetite. The main elements that underpin our risk culture are described on page 39 of the Annual Report and Accounts 2013.
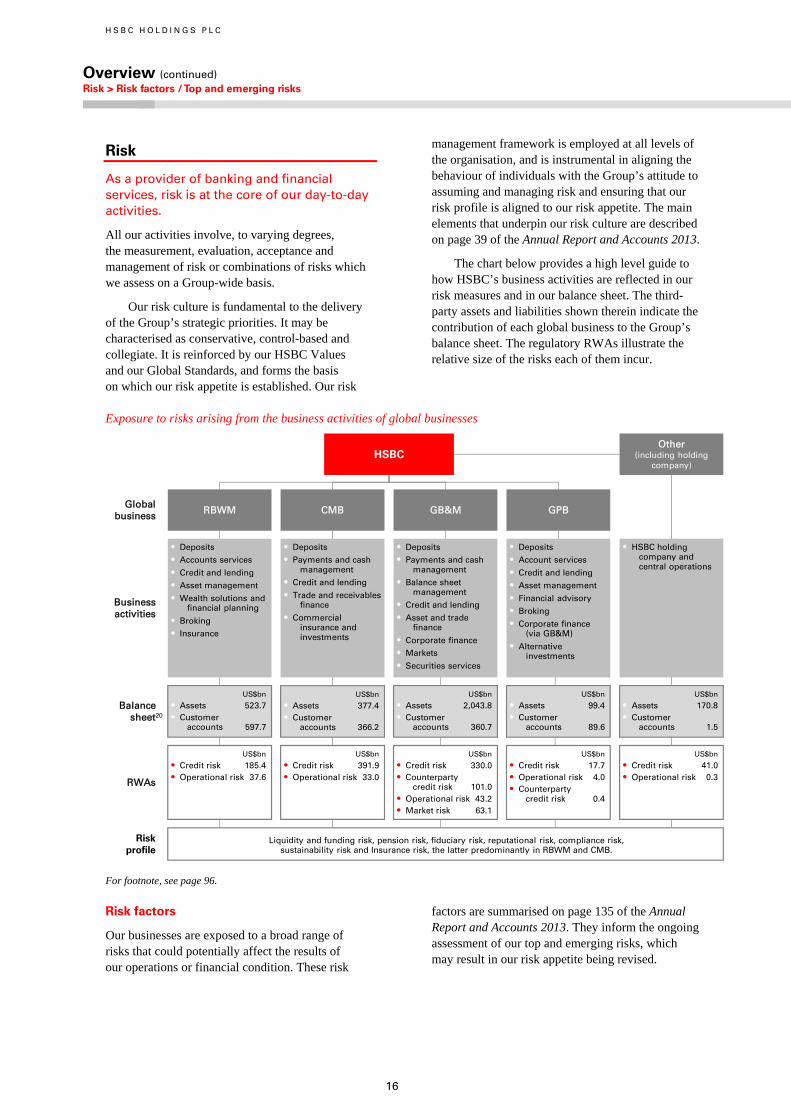
The chart below provides a high level guide to how HSBC’s business activities are reflected in our risk measures and in our balance sheet. The third-party assets and liabilities shown therein indicate the contribution of each global business to the Group’s balance sheet. The regulatory RWAs illustrate the relative size of the risks each of them incur.
Exposure to risks arising from the business activities of global businesses
For footnote, see page 96.
Risk factors
Our businesses are exposed to a broad range of risks that could potentially affect the results of our operations or financial condition. These risk
factors are summarised on page 135 of the Annual Report and Accounts 2013. They inform the ongoing assessment of our top and emerging risks, which may result in our risk appetite being revised.
Globalbusiness
Businessactivities
Riskprofile
Balancesheet20
RBWM CMB GB&M GPB
HSBC
• HSBC holding company andcentral operations
• Deposits• Accounts services
• Credit and lending• Asset management
• Wealth solutions and financial planning
• Broking• Insurance
• Deposits• Payments and cash
management
• Credit and lending
• Trade and receivables finance
• Commercial insurance and investments
• Deposits• Payments and cash
management
• Balance sheetmanagement
• Credit and lending
• Asset and trade finance
• Corporate finance• Markets
• Securities services
• Deposits• Account services
• Credit and lending• Asset management
• Financial advisory
• Broking
• Corporate finance (via GB&M)
• Alternative investments
US$bn
• Assets 523.7• Customer
accounts 597.7
US$bn
• Assets 377.4• Customer
accounts 366.2
US$bn
• Assets 2,043.8• Customer
accounts 360.7
US$bn
• Assets 99.4• Customer
accounts 89.6
US$bn
• Assets 170.8• Customer
accounts 1.5
Liquidity and funding risk, pension risk, fiduciary risk, reputational risk, compliance risk, sustainability risk and Insurance risk, the latter predominantly in RBWM and CMB.
US$bn
• Credit risk 185.4• Operational risk 37.6
US$bn
• Credit risk 391.9• Operational risk 33.0
US$bn
• Credit risk 330.0• Counterparty
credit risk 101.0• Operational risk 43.2• Market risk 63.1
US$bn
• Credit risk 17.7• Operational risk 4.0• Counterparty
credit risk 0.4
US$bn
• Credit risk 41.0• Operational risk 0.3
Other(including holding
company)
RWAs
17
Ove
rvie
w
In
teri
m M
anag
emen
t R
epo
rt
D
irec
tors
Fin
anci
al S
tate
men
ts
A
dd
itio
nal
Info
rmat
ion
Top and emerging risks
Identifying and monitoring top and emerging risks are integral to our approach to risk management. We define a ‘top risk’ as being a current, emerged risk which has arisen across any of our risk categories, global businesses or regions and has the potential to have a material impact on our financial results or our reputation and the sustainability of our long-term business model, and which may form and crystallise within a one-year horizon. We consider an ‘emerging risk’ to be one with potentially significant but uncertain outcomes which may form and crystallise beyond a one-year horizon, in the event of which it could have a material effect on our ability to achieve our long-term strategy.
Our top and emerging risk framework enables us to identify and manage current and forward-looking risks to ensure our risk appetite remains appropriate.
Top and emerging risks fall under the following three categories:
• macroeconomic and geopolitical risk;
• macro-prudential, regulatory and legal risks to our business model; and
• risks related to our business operations, governance and internal control systems.
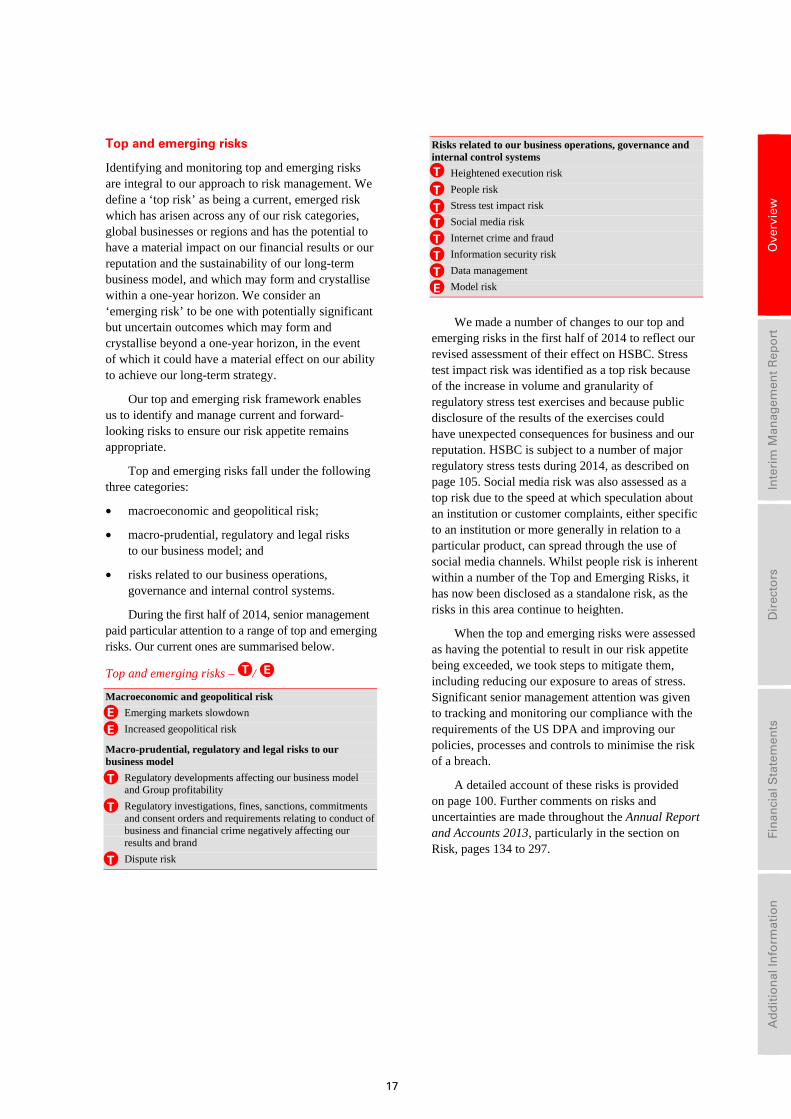
During the first half of 2014, senior management paid particular attention to a range of top and emerging risks. Our current ones are summarised below.
Top and emerging risks – /
Macroeconomic and geopolitical risk
E Emerging markets slowdown
E Increased geopolitical risk
Macro-prudential, regulatory and legal risks to our business model
T Regulatory developments affecting our business model and Group profitability
T Regulatory investigations, fines, sanctions, commitments and consent orders and requirements relating to conduct of business and financial crime negatively affecting our results and brand
T Dispute risk
Risks related to our business operations, governance and internal control systems
T Heightened execution risk
T People risk
T Stress test impact risk
T Social media risk
T Internet crime and fraud
T Information security risk
T Data management
T Model risk
We made a number of changes to our top and emerging risks in the first half of 2014 to reflect our revised assessment of their effect on HSBC. Stress test impact risk was identified as a top risk because of the increase in volume and granularity of regulatory stress test exercises and because public disclosure of the results of the exercises could have unexpected consequences for business and our reputation. HSBC is subject to a number of major regulatory stress tests during 2014, as described on page 105. Social media risk was also assessed as a top risk due to the speed at which speculation about an institution or customer complaints, either specific to an institution or more generally in relation to a particular product, can spread through the use of social media channels. Whilst people risk is inherent within a number of the Top and Emerging Risks, it has now been disclosed as a standalone risk, as the risks in this area continue to heighten.
When the top and emerging risks were assessed as having the potential to result in our risk appetite being exceeded, we took steps to mitigate them, including reducing our exposure to areas of stress. Significant senior management attention was given to tracking and monitoring our compliance with the requirements of the US DPA and improving our policies, processes and controls to minimise the risk of a breach.
A detailed account of these risks is provided on page 100. Further comments on risks and uncertainties are made throughout the Annual Report and Accounts 2013, particularly in the section on Risk, pages 134 to 297.
T E
T
T
T
E E
ETTTT
T
T
T
H S B C H O L D I N G S P L C
Overview (continued) Risk > Risk appetite
18
Risk appetite
The Group’s Risk Appetite Statement (‘RAS’) describes the types and quantum of risks that we are willing to accept in achieving our medium and long-term strategic objectives. It is approved by the Board on the advice of the Group Risk Committee.
The RAS is a key component of our risk management framework, guides the annual planning process by defining the desired forward-looking risk profile of the Group in achieving our strategic objectives, and plays an important role in our six filters process. Our risk appetite may be revised in response to our assessment of the top and emerging risks we have identified.
Global businesses and geographical regions are required to align their risk appetite statements to the Group’s RAS.
Quantitative and qualitative metrics are measured and monitored in ten key categories: returns, capital, liquidity and funding, securitisations, cost of risk, intra-Group lending, strategic investments, risk categories like credit, market and operational risk, risk diversification and concentration, and financial crime compliance. Measurement against the metrics:
• guides underlying business activity, ensuring it is aligned to risk appetite statements;
• informs risk-adjusted remuneration;
• enables the key underlying assumptions to be monitored and, where necessary, adjusted through subsequent business planning cycles; and
• allows the business decisions needed to mitigate risk to be promptly identified.
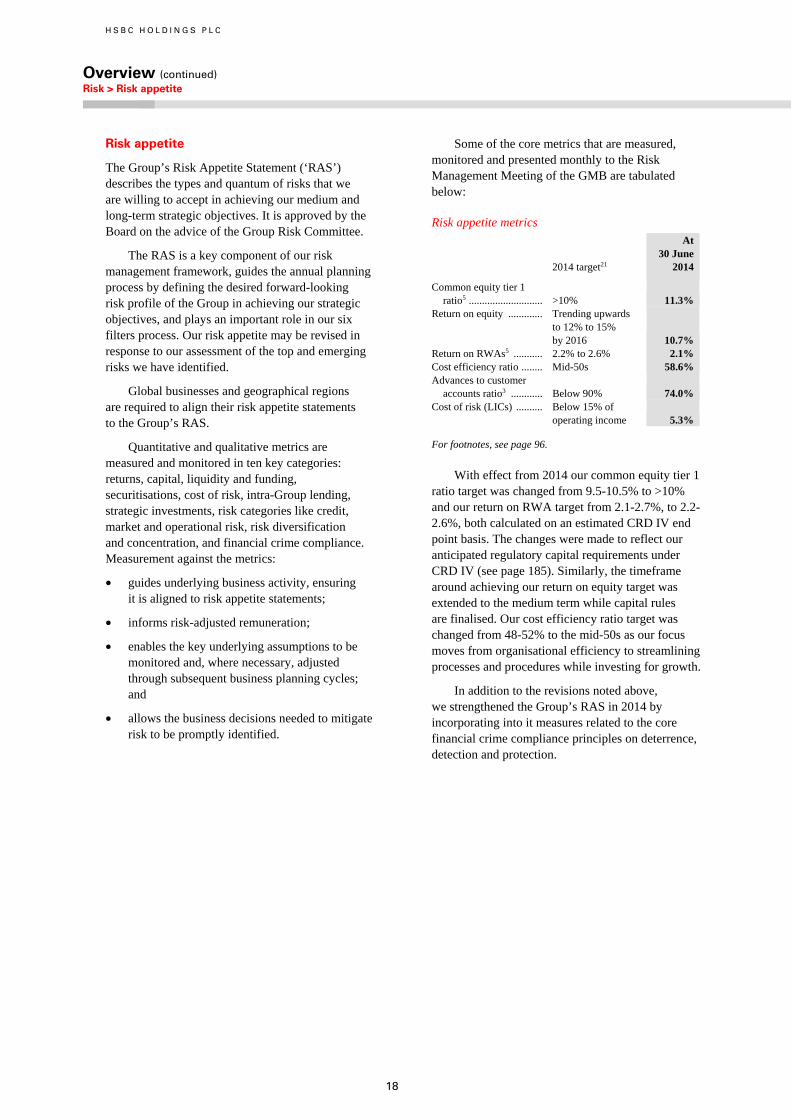
Some of the core metrics that are measured, monitored and presented monthly to the Risk Management Meeting of the GMB are tabulated below:
Risk appetite metrics
2014 target21
At30 June
2014
Common equity tier 1 ratio5 ............................ >10%
11.3%
Return on equity ............. Trending upwards to 12% to 15% by 2016
10.7% Return on RWAs5 ........... 2.2% to 2.6% 2.1% Cost efficiency ratio ........ Mid-50s 58.6% Advances to customer
accounts ratio3 ............ Below 90%
74.0% Cost of risk (LICs) .......... Below 15% of
operating income
5.3%
For footnotes, see page 96.
With effect from 2014 our common equity tier 1 ratio target was changed from 9.5-10.5% to >10% and our return on RWA target from 2.1-2.7%, to 2.2-2.6%, both calculated on an estimated CRD IV end point basis. The changes were made to reflect our anticipated regulatory capital requirements under CRD IV (see page 185). Similarly, the timeframe around achieving our return on equity target was extended to the medium term while capital rules are finalised. Our cost efficiency ratio target was changed from 48-52% to the mid-50s as our focus moves from organisational efficiency to streamlining processes and procedures while investing for growth.
In addition to the revisions noted above, we strengthened the Group’s RAS in 2014 by incorporating into it measures related to the core financial crime compliance principles on deterrence, detection and protection.
H S B C H O L D I N G S P L C
Interim Management Report Financial summary > Use of non-GAAP financial measures
19
Ove
rvie
w
In
teri
m M
anag
emen
t R
epo
rt
D
irec
tors
Fin
anci
al S
tate
men
ts
A
dd
itio
nal
Info
rmat
ion
Financial summary Use of non-GAAP financial measures ...................... 19
Constant currency ......................................................... 19
Underlying performance ............................................... 22
Consolidated income statement ................................. 25
Group performance by income and expense item ... 28
Net interest income ....................................................... 28
Net fee income .............................................................. 29
Net trading income ....................................................... 30
Net income/(expense) from financial instruments designated at fair value ............................................. 31
Gains less losses from financial investments ............... 32
Net earned insurance premiums ................................... 32
Other operating income ................................................ 33
Net insurance claims incurred and movement in liabilities to policyholders ........................................ 34
Loan impairment charges and other credit risk provisions ................................................................. 34
Operating expenses ....................................................... 35
Share of profit in associates and joint ventures ............ 36
Tax expense .................................................................. 37
Consolidated balance sheet ........................................ 38
Movement from 31 December 2013 to 30 June 2014 .. 39
Reconciliation of RoRWA measures ......................... 43
Use of non-GAAP financial measures
Our reported results are prepared in accordance with IFRSs as detailed in the Financial Statements starting on page 206. In measuring our performance, the financial measures that we use include those which have been derived from our reported results in order to eliminate factors which distort period-on-period comparisons. These are considered non-GAAP financial measures. Non-GAAP financial measures that we use throughout our Financial Review are described below. Other non-GAAP financial measures are described and reconciled to the closest reported financial measure when used.
Constant currency
Constant currency adjusts the period-on-period effects of foreign currency translation differences on performance by comparing reported results for the half-year to 30 June 2014 with reported results for the half-years to 30 June 2013 and 31 December 2013 retranslated at average exchange rates for the half-year to 30 June 2014. Except where stated otherwise, commentaries are on a constant currency basis, as reconciled in the table overleaf.
The foreign currency translation differences reflect the period-on-period movements of the US dollar against most major currencies.
We exclude the translation differences because we consider the like-for-like basis of constant currency financial measures more appropriately reflects changes due to operating performance.
Constant currency
Constant currency comparatives for the half-years to 30 June 2013 and 31 December 2013 referred to in the commentaries below are computed by retranslating into US dollars for non-US dollar branches, subsidiaries, joint ventures and associates:
• the income statements for the half-years to 30 June 2013 and 31 December 2013 at the average rates of exchange for the half-year to 30 June 2014; and
• the balance sheets at 30 June 2013 and 31 December 2013 at the prevailing rates of exchange at 30 June 2014.
No adjustment has been made to the exchange rates used to translate assets and liabilities denominated in foreign currency into the functional currencies of any HSBC branches, subsidiaries, joint ventures or associates.
When reference is made to ‘constant currency’ in tables or commentaries, comparative data reported in the functional currencies of HSBC’s operations have been translated at the appropriate exchange rates applied in the current period on the basis described above.
H S B C H O L D I N G S P L C
Interim Management Report (continued) Financial summary > Use of non-GAAP financial measures
20
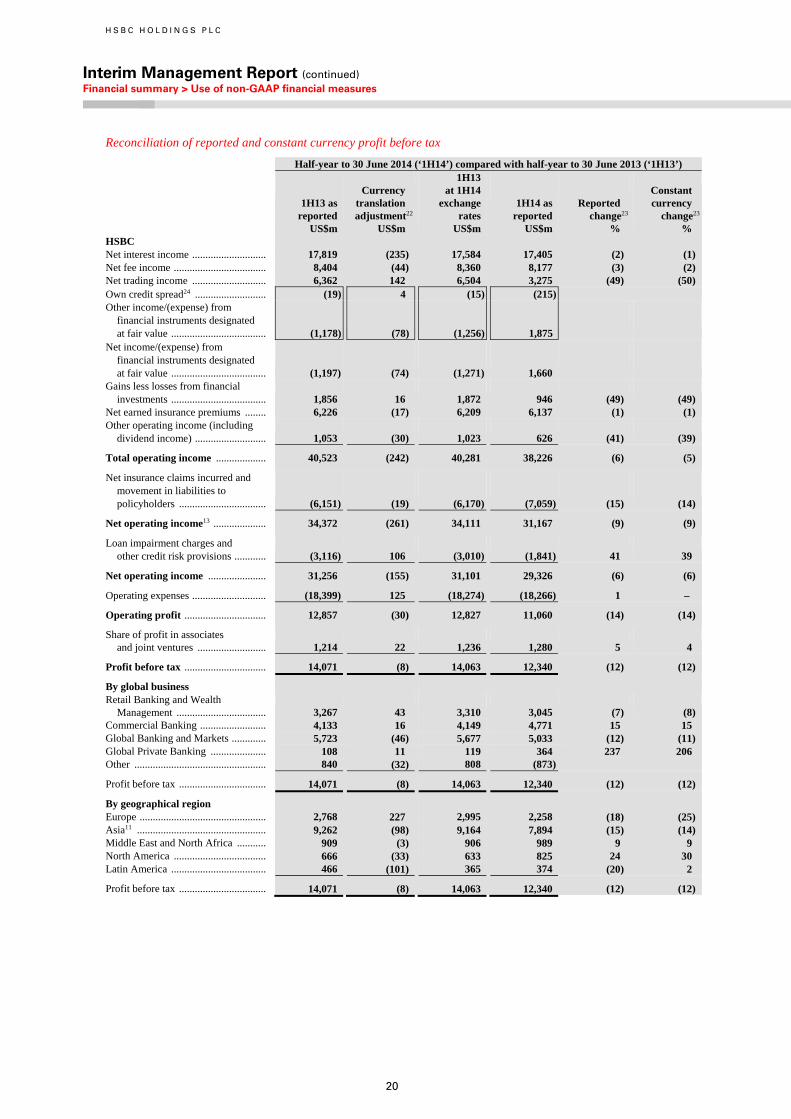
Reconciliation of reported and constant currency profit before tax
Half-year to 30 June 2014 (‘1H14’) compared with half-year to 30 June 2013 (‘1H13’)
1H13 as reported US$m
Currency translation adjustment22
US$m
1H13 at 1H14 exchange rates US$m
1H14 as reported US$m
Reported change23
%
Constant currency change23
% HSBC Net interest income ............................ 17,819 (235) 17,584 17,405 (2) (1) Net fee income ................................... 8,404 (44) 8,360 8,177 (3) (2) Net trading income ............................ 6,362 142 6,504 3,275 (49) (50) Own credit spread24 ........................... (19) 4 (15) (215) Other income/(expense) from
financial instruments designated at fair value .................................... (1,178) (78) (1,256) 1,875
Net income/(expense) from financial instruments designated at fair value .................................... (1,197) (74) (1,271) 1,660
Gains less losses from financial investments .................................... 1,856 16 1,872 946 (49) (49)
Net earned insurance premiums ........ 6,226 (17) 6,209 6,137 (1) (1) Other operating income (including
dividend income) ........................... 1,053 (30) 1,023 626 (41) (39)
Total operating income ................... 40,523 (242) 40,281 38,226 (6) (5)
Net insurance claims incurred and movement in liabilities to policyholders ................................. (6,151) (19) (6,170) (7,059) (15) (14)
Net operating income13 .................... 34,372 (261) 34,111 31,167 (9) (9)
Loan impairment charges and other credit risk provisions ............ (3,116) 106 (3,010) (1,841) 41 39
Net operating income ...................... 31,256 (155) 31,101 29,326 (6) (6)
Operating expenses ............................ (18,399) 125 (18,274) (18,266) 1 –
Operating profit ............................... 12,857 (30) 12,827 11,060 (14) (14)
Share of profit in associates and joint ventures .......................... 1,214 22 1,236 1,280 5 4
Profit before tax ............................... 14,071 (8) 14,063 12,340 (12) (12)
By global business Retail Banking and Wealth
Management .................................. 3,267 43 3,310 3,045 (7) (8) Commercial Banking ......................... 4,133 16 4,149 4,771 15 15 Global Banking and Markets ............. 5,723 (46) 5,677 5,033 (12) (11) Global Private Banking ..................... 108 11 119 364 237 206 Other .................................................. 840 (32) 808 (873)
Profit before tax ................................. 14,071 (8) 14,063 12,340 (12) (12)
By geographical region Europe ................................................ 2,768 227 2,995 2,258 (18) (25) Asia11 ................................................. 9,262 (98) 9,164 7,894 (15) (14) Middle East and North Africa ........... 909 (3) 906 989 9 9 North America ................................... 666 (33) 633 825 24 30 Latin America .................................... 466 (101) 365 374 (20) 2
Profit before tax ................................. 14,071 (8) 14,063 12,340 (12) (12)
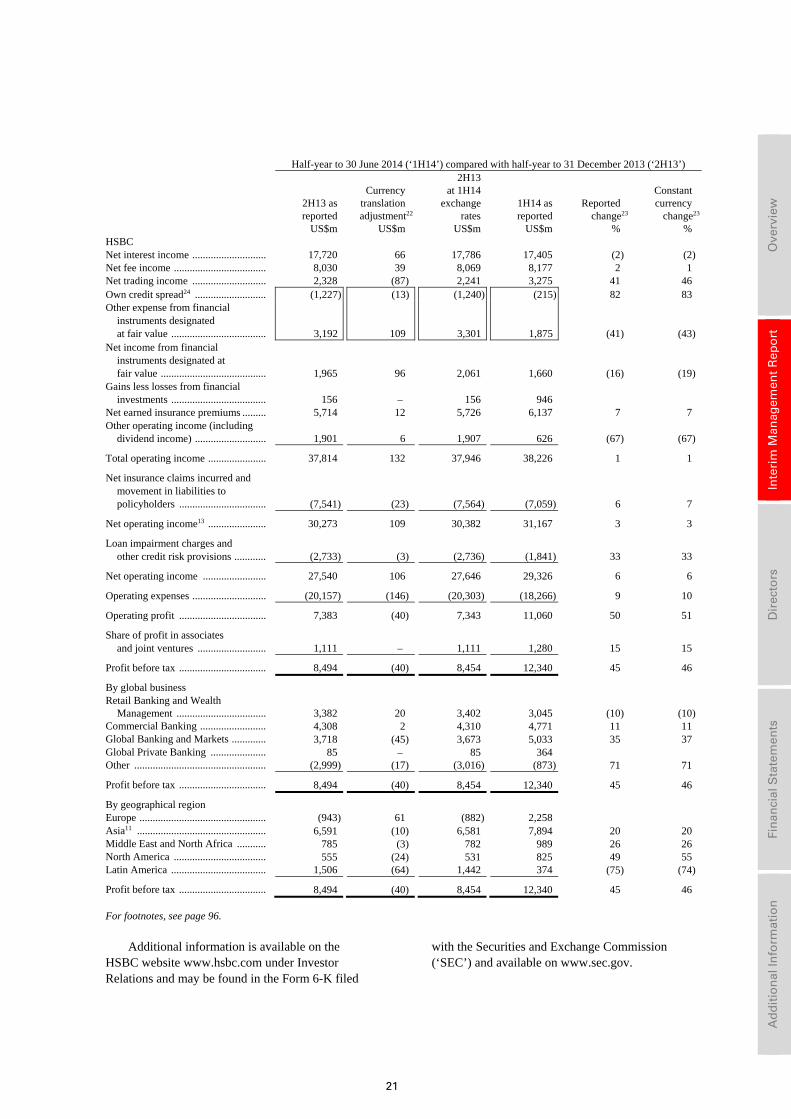
21
Ove
rvie
w
In
teri
m M
anag
emen
t R
epo
rt
D
irec
tors
Fin
anci
al S
tate
men
ts
A
dd
itio
nal
Info
rmat
ion
Half-year to 30 June 2014 (‘1H14’) compared with half-year to 31 December 2013 (‘2H13’)
2H13 as reported US$m
Currency translation adjustment22
US$m
2H13 at 1H14 exchange rates US$m
1H14 as reported US$m
Reported change23
%
Constant currency change23
% HSBC Net interest income ............................ 17,720 66 17,786 17,405 (2) (2) Net fee income ................................... 8,030 39 8,069 8,177 2 1 Net trading income ............................ 2,328 (87) 2,241 3,275 41 46 Own credit spread24 ........................... (1,227) (13) (1,240) (215) 82 83 Other expense from financial
instruments designated at fair value .................................... 3,192 109 3,301 1,875 (41) (43)
Net income from financial instruments designated at fair value ........................................ 1,965 96 2,061 1,660 (16) (19)
Gains less losses from financial investments .................................... 156 – 156 946
Net earned insurance premiums ......... 5,714 12 5,726 6,137 7 7 Other operating income (including
dividend income) ........................... 1,901 6 1,907 626 (67) (67)
Total operating income ...................... 37,814 132 37,946 38,226 1 1
Net insurance claims incurred and movement in liabilities to policyholders ................................. (7,541) (23) (7,564) (7,059) 6 7
Net operating income13 ...................... 30,273 109 30,382 31,167 3 3
Loan impairment charges and other credit risk provisions ............ (2,733) (3) (2,736) (1,841) 33 33
Net operating income ........................ 27,540 106 27,646 29,326 6 6
Operating expenses ............................ (20,157) (146) (20,303) (18,266) 9 10
Operating profit ................................. 7,383 (40) 7,343 11,060 50 51
Share of profit in associates and joint ventures .......................... 1,111 – 1,111 1,280 15 15
Profit before tax ................................. 8,494 (40) 8,454 12,340 45 46
By global business Retail Banking and Wealth
Management .................................. 3,382 20 3,402 3,045 (10) (10) Commercial Banking ......................... 4,308 2 4,310 4,771 11 11 Global Banking and Markets ............. 3,718 (45) 3,673 5,033 35 37 Global Private Banking ..................... 85 – 85 364 Other .................................................. (2,999) (17) (3,016) (873) 71 71
Profit before tax ................................. 8,494 (40) 8,454 12,340 45 46
By geographical region Europe ................................................ (943) 61 (882) 2,258 Asia11 ................................................. 6,591 (10) 6,581 7,894 20 20 Middle East and North Africa ........... 785 (3) 782 989 26 26 North America ................................... 555 (24) 531 825 49 55 Latin America .................................... 1,506 (64) 1,442 374 (75) (74)
Profit before tax ................................. 8,494 (40) 8,454 12,340 45 46
For footnotes, see page 96.
Additional information is available on the HSBC website www.hsbc.com under Investor Relations and may be found in the Form 6-K filed
with the Securities and Exchange Commission (‘SEC’) and available on www.sec.gov.
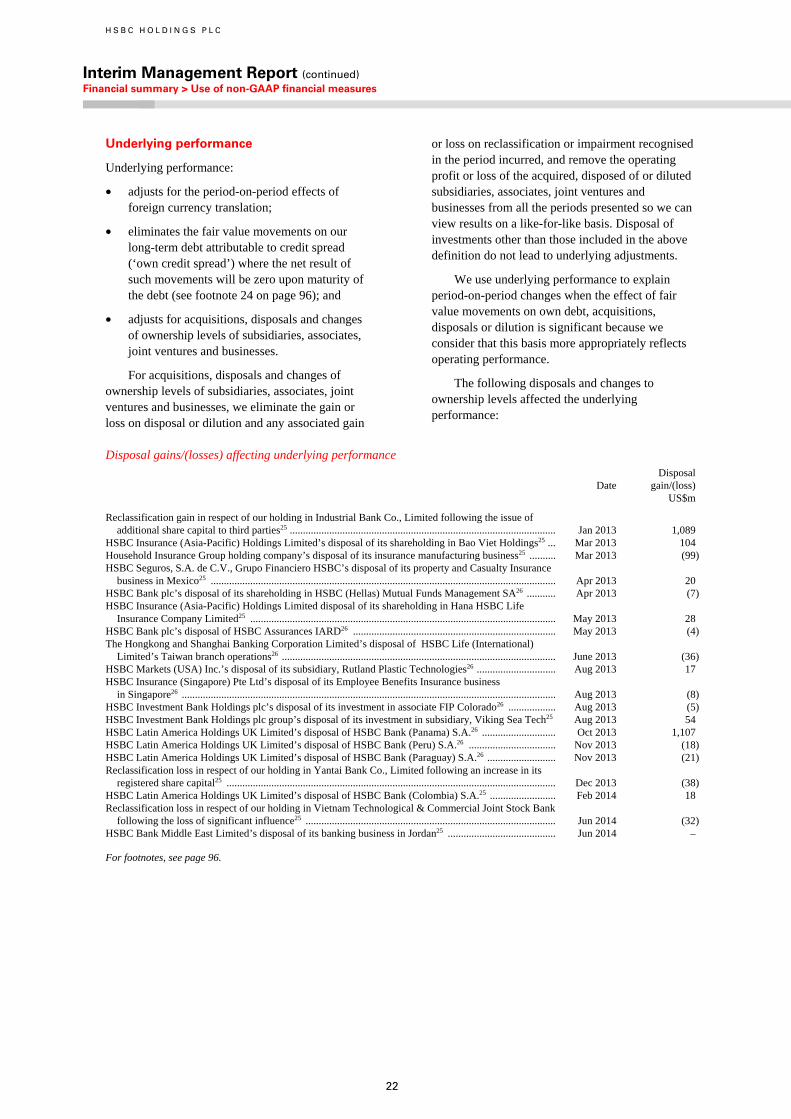
H S B C H O L D I N G S P L C
Interim Management Report (continued) Financial summary > Use of non-GAAP financial measures
22
Underlying performance
Underlying performance:
• adjusts for the period-on-period effects of foreign currency translation;
• eliminates the fair value movements on our long-term debt attributable to credit spread (‘own credit spread’) where the net result of such movements will be zero upon maturity of the debt (see footnote 24 on page 96); and
• adjusts for acquisitions, disposals and changes of ownership levels of subsidiaries, associates, joint ventures and businesses.
For acquisitions, disposals and changes of ownership levels of subsidiaries, associates, joint ventures and businesses, we eliminate the gain or loss on disposal or dilution and any associated gain
or loss on reclassification or impairment recognised in the period incurred, and remove the operating profit or loss of the acquired, disposed of or diluted subsidiaries, associates, joint ventures and businesses from all the periods presented so we can view results on a like-for-like basis. Disposal of investments other than those included in the above definition do not lead to underlying adjustments.
We use underlying performance to explain period-on-period changes when the effect of fair value movements on own debt, acquisitions, disposals or dilution is significant because we consider that this basis more appropriately reflects operating performance.
The following disposals and changes to ownership levels affected the underlying performance:
Disposal gains/(losses) affecting underlying performance
Date Disposal gain/(loss)
US$m
Reclassification gain in respect of our holding in Industrial Bank Co., Limited following the issue of additional share capital to third parties25 ..................................................................................................... Jan 2013 1,089
HSBC Insurance (Asia-Pacific) Holdings Limited’s disposal of its shareholding in Bao Viet Holdings25 ... Mar 2013 104Household Insurance Group holding company’s disposal of its insurance manufacturing business25 .......... Mar 2013 (99)HSBC Seguros, S.A. de C.V., Grupo Financiero HSBC’s disposal of its property and Casualty Insurance
business in Mexico25 ................................................................................................................................... Apr 2013 20HSBC Bank plc’s disposal of its shareholding in HSBC (Hellas) Mutual Funds Management SA26 ........... Apr 2013 (7)HSBC Insurance (Asia-Pacific) Holdings Limited disposal of its shareholding in Hana HSBC Life
Insurance Company Limited25 .................................................................................................................... May 2013 28HSBC Bank plc’s disposal of HSBC Assurances IARD26 ............................................................................. May 2013 (4)The Hongkong and Shanghai Banking Corporation Limited’s disposal of HSBC Life (International)
Limited’s Taiwan branch operations26 ........................................................................................................ June 2013 (36)HSBC Markets (USA) Inc.’s disposal of its subsidiary, Rutland Plastic Technologies26 .............................. Aug 2013 17HSBC Insurance (Singapore) Pte Ltd’s disposal of its Employee Benefits Insurance business
in Singapore26 .............................................................................................................................................. Aug 2013 (8)HSBC Investment Bank Holdings plc’s disposal of its investment in associate FIP Colorado26 .................. Aug 2013 (5)HSBC Investment Bank Holdings plc group’s disposal of its investment in subsidiary, Viking Sea Tech25 Aug 2013 54 HSBC Latin America Holdings UK Limited’s disposal of HSBC Bank (Panama) S.A.26 ............................ Oct 2013 1,107HSBC Latin America Holdings UK Limited’s disposal of HSBC Bank (Peru) S.A.26 ................................. Nov 2013 (18)HSBC Latin America Holdings UK Limited’s disposal of HSBC Bank (Paraguay) S.A.26 .......................... Nov 2013 (21)Reclassification loss in respect of our holding in Yantai Bank Co., Limited following an increase in its
registered share capital25 ............................................................................................................................. Dec 2013 (38)HSBC Latin America Holdings UK Limited’s disposal of HSBC Bank (Colombia) S.A.25 ......................... Feb 2014 18 Reclassification loss in respect of our holding in Vietnam Technological & Commercial Joint Stock Bank
following the loss of significant influence25 ............................................................................................... Jun 2014 (32)HSBC Bank Middle East Limited’s disposal of its banking business in Jordan25 ......................................... Jun 2014 –
For footnotes, see page 96.
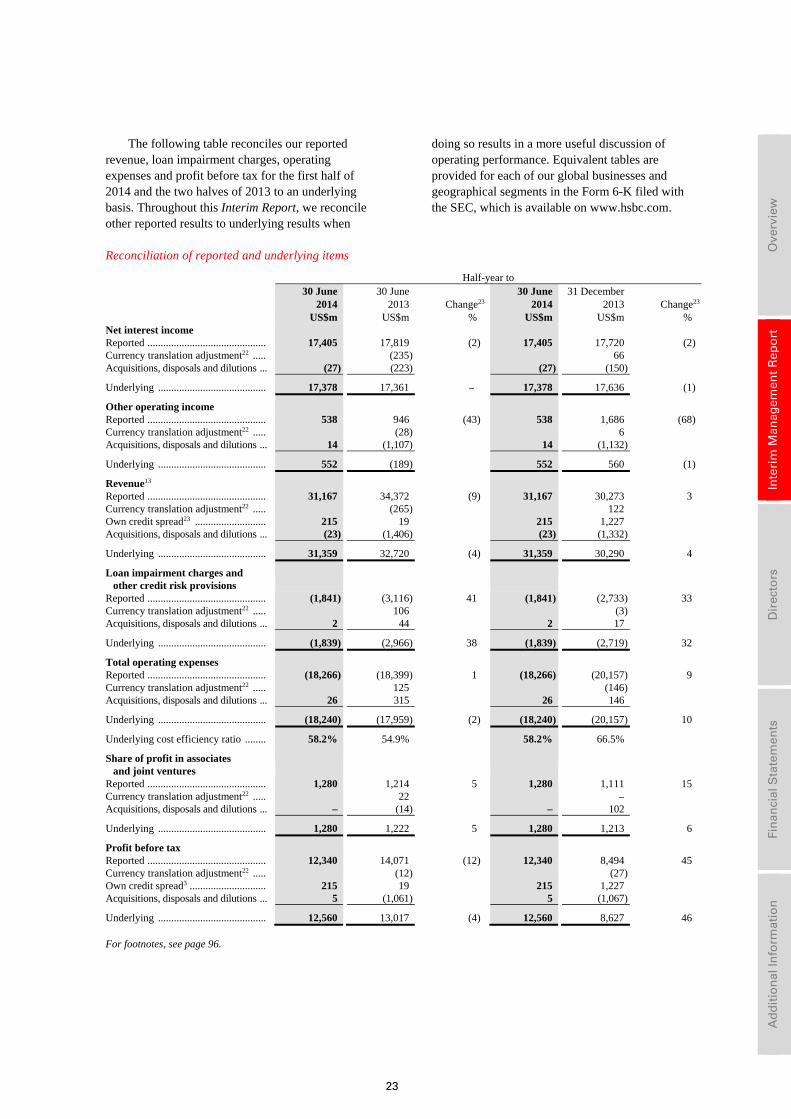
23
Ove
rvie
w
In
teri
m M
anag
emen
t R
epo
rt
D
irec
tors
Fin
anci
al S
tate
men
ts
A
dd
itio
nal
Info
rmat
ion
The following table reconciles our reported revenue, loan impairment charges, operating expenses and profit before tax for the first half of 2014 and the two halves of 2013 to an underlying basis. Throughout this Interim Report, we reconcile other reported results to underlying results when
doing so results in a more useful discussion of operating performance. Equivalent tables are provided for each of our global businesses and geographical segments in the Form 6-K filed with the SEC, which is available on www.hsbc.com.
Reconciliation of reported and underlying items
Half-year to
30 June 2014
30 June 2013 Change23
30 June 2014
31 December 2013 Change23
US$m US$m % US$m US$m % Net interest income Reported ............................................. 17,405 17,819 (2) 17,405 17,720 (2)Currency translation adjustment22 ..... (235) 66 Acquisitions, disposals and dilutions ... (27) (223) (27) (150)
Underlying ......................................... 17,378 17,361 – 17,378 17,636 (1)
Other operating income Reported ............................................. 538 946 (43) 538 1,686 (68)Currency translation adjustment22 ..... (28) 6 Acquisitions, disposals and dilutions ... 14 (1,107) 14 (1,132)
Underlying ......................................... 552 (189) 552 560 (1)
Revenue13 Reported ............................................. 31,167 34,372 (9) 31,167 30,273 3 Currency translation adjustment22 ..... (265) 122 Own credit spread23 ........................... 215 19 215 1,227 Acquisitions, disposals and dilutions ... (23) (1,406) (23) (1,332)
Underlying ......................................... 31,359 32,720 (4) 31,359 30,290 4
Loan impairment charges and other credit risk provisions
Reported ............................................. (1,841) (3,116) 41 (1,841) (2,733) 33 Currency translation adjustment22 ..... 106 (3) Acquisitions, disposals and dilutions ... 2 44 2 17
Underlying ......................................... (1,839) (2,966) 38 (1,839) (2,719) 32
Total operating expenses Reported ............................................. (18,266) (18,399) 1 (18,266) (20,157) 9 Currency translation adjustment22 ..... 125 (146) Acquisitions, disposals and dilutions ... 26 315 26 146
Underlying ......................................... (18,240) (17,959) (2) (18,240) (20,157) 10
Underlying cost efficiency ratio ........ 58.2% 54.9% 58.2% 66.5%
Share of profit in associates and joint ventures
Reported ............................................. 1,280 1,214 5 1,280 1,111 15 Currency translation adjustment22 ..... 22 – Acquisitions, disposals and dilutions ... – (14) – 102
Underlying ......................................... 1,280 1,222 5 1,280 1,213 6
Profit before tax Reported ............................................. 12,340 14,071 (12) 12,340 8,494 45 Currency translation adjustment22 ..... (12) (27) Own credit spread3 ............................. 215 19 215 1,227 Acquisitions, disposals and dilutions ... 5 (1,061) 5 (1,067)
Underlying ......................................... 12,560 13,017 (4) 12,560 8,627 46
For footnotes, see page 96.
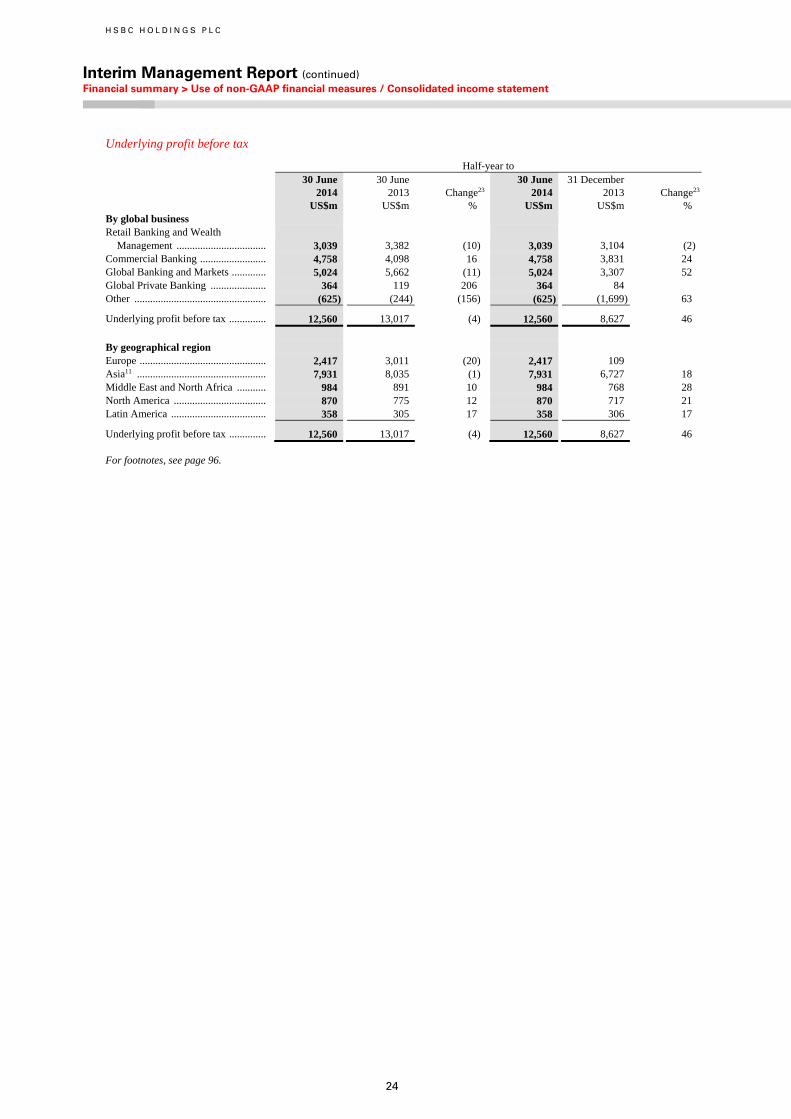
H S B C H O L D I N G S P L C
Interim Management Report (continued) Financial summary > Use of non-GAAP financial measures / Consolidated income statement
24
Underlying profit before tax
Half-year to
30 June 2014
30 June 2013 Change23
30 June 2014
31 December 2013 Change23
US$m US$m % US$m US$m % By global business Retail Banking and Wealth
Management .................................. 3,039 3,382 (10) 3,039 3,104 (2) Commercial Banking ......................... 4,758 4,098 16 4,758 3,831 24 Global Banking and Markets ............. 5,024 5,662 (11) 5,024 3,307 52 Global Private Banking ..................... 364 119 206 364 84 Other .................................................. (625) (244) (156) (625) (1,699) 63
Underlying profit before tax .............. 12,560 13,017 (4) 12,560 8,627 46
By geographical region Europe ................................................ 2,417 3,011 (20) 2,417 109 Asia11 ................................................. 7,931 8,035 (1) 7,931 6,727 18 Middle East and North Africa ........... 984 891 10 984 768 28 North America ................................... 870 775 12 870 717 21 Latin America .................................... 358 305 17 358 306 17
Underlying profit before tax .............. 12,560 13,017 (4) 12,560 8,627 46
For footnotes, see page 96.
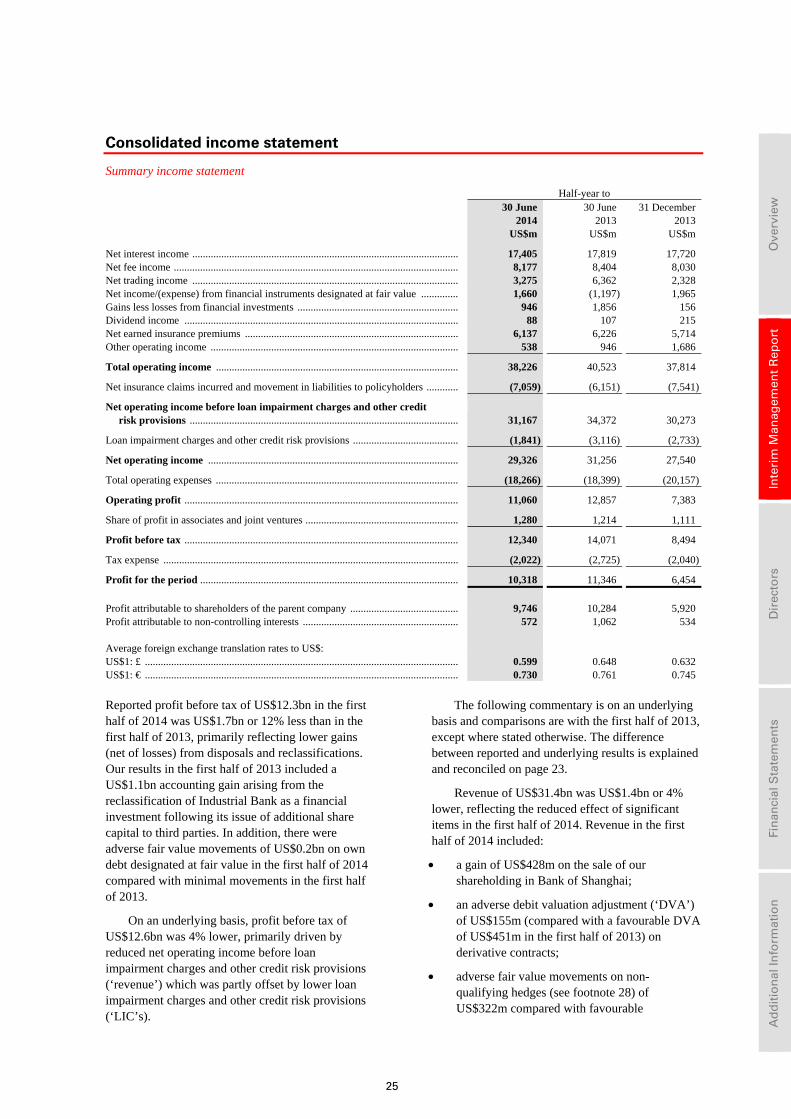
25
Ove
rvie
w
In
teri
m M
anag
emen
t R
epo
rt
D
irec
tors
Fin
anci
al S
tate
men
ts
A
dd
itio
nal
Info
rmat
ion
Consolidated income statement
Summary income statement
Half-year to
30 June 2014
30 June 2013
31 December 2013
US$m US$m US$m
Net interest income ..................................................................................................... 17,405 17,819 17,720 Net fee income ............................................................................................................ 8,177 8,404 8,030 Net trading income ..................................................................................................... 3,275 6,362 2,328 Net income/(expense) from financial instruments designated at fair value .............. 1,660 (1,197) 1,965 Gains less losses from financial investments ............................................................. 946 1,856 156 Dividend income ........................................................................................................ 88 107 215 Net earned insurance premiums ................................................................................. 6,137 6,226 5,714 Other operating income .............................................................................................. 538 946 1,686
Total operating income ............................................................................................ 38,226 40,523 37,814
Net insurance claims incurred and movement in liabilities to policyholders ............ (7,059) (6,151) (7,541)
Net operating income before loan impairment charges and other credit risk provisions ...................................................................................................... 31,167 34,372 30,273
Loan impairment charges and other credit risk provisions ........................................ (1,841) (3,116) (2,733)
Net operating income ............................................................................................... 29,326 31,256 27,540
Total operating expenses ............................................................................................ (18,266) (18,399) (20,157)
Operating profit ........................................................................................................ 11,060 12,857 7,383
Share of profit in associates and joint ventures .......................................................... 1,280 1,214 1,111
Profit before tax ........................................................................................................ 12,340 14,071 8,494
Tax expense ................................................................................................................ (2,022) (2,725) (2,040)
Profit for the period .................................................................................................. 10,318 11,346 6,454
Profit attributable to shareholders of the parent company ......................................... 9,746 10,284 5,920 Profit attributable to non-controlling interests ........................................................... 572 1,062 534 Average foreign exchange translation rates to US$: US$1: £ ....................................................................................................................... 0.599 0.648 0.632 US$1: € ....................................................................................................................... 0.730 0.761 0.745
Reported profit before tax of US$12.3bn in the first half of 2014 was US$1.7bn or 12% less than in the first half of 2013, primarily reflecting lower gains (net of losses) from disposals and reclassifications. Our results in the first half of 2013 included a US$1.1bn accounting gain arising from the reclassification of Industrial Bank as a financial investment following its issue of additional share capital to third parties. In addition, there were adverse fair value movements of US$0.2bn on own debt designated at fair value in the first half of 2014 compared with minimal movements in the first half of 2013.
On an underlying basis, profit before tax of US$12.6bn was 4% lower, primarily driven by reduced net operating income before loan impairment charges and other credit risk provisions (‘revenue’) which was partly offset by lower loan impairment charges and other credit risk provisions (‘LIC’s).
The following commentary is on an underlying basis and comparisons are with the first half of 2013, except where stated otherwise. The difference between reported and underlying results is explained and reconciled on page 23.
Revenue of US$31.4bn was US$1.4bn or 4% lower, reflecting the reduced effect of significant items in the first half of 2014. Revenue in the first half of 2014 included:
• a gain of US$428m on the sale of our shareholding in Bank of Shanghai;
• an adverse debit valuation adjustment (‘DVA’) of US$155m (compared with a favourable DVA of US$451m in the first half of 2013) on derivative contracts;
• adverse fair value movements on non-qualifying hedges (see footnote 28) of US$322m compared with favourable
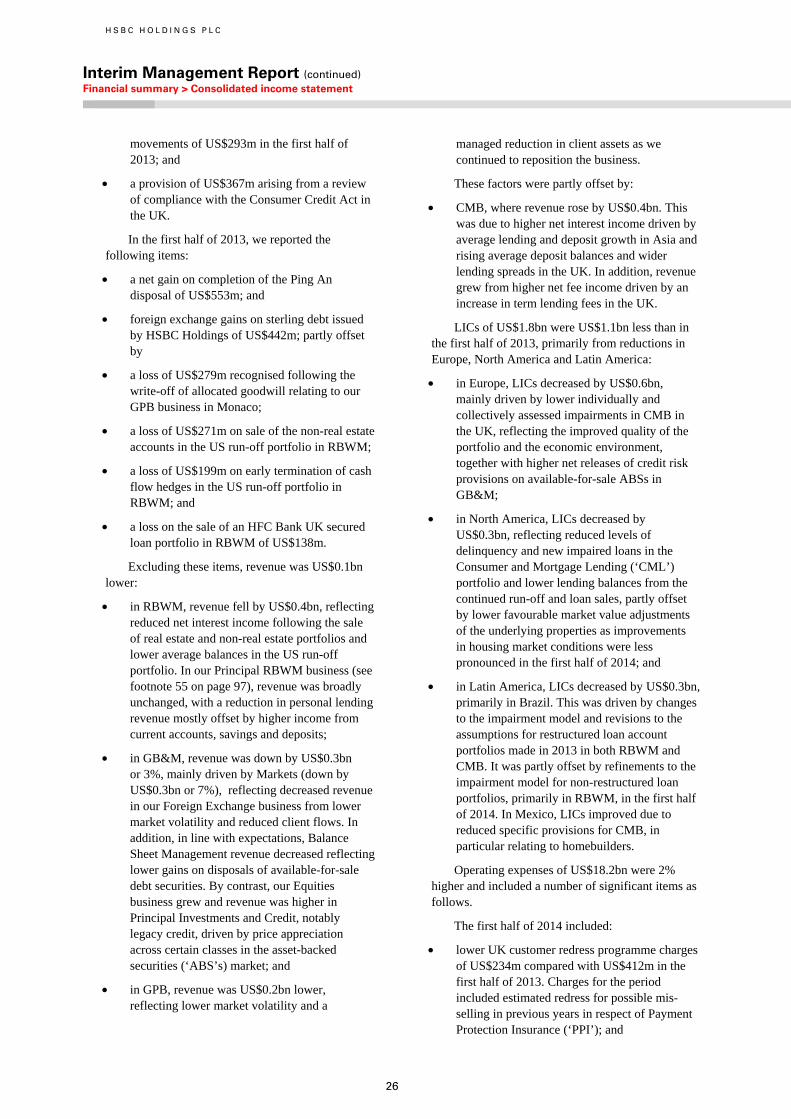
H S B C H O L D I N G S P L C
Interim Management Report (continued) Financial summary > Consolidated income statement
26
movements of US$293m in the first half of 2013; and
• a provision of US$367m arising from a review of compliance with the Consumer Credit Act in the UK.
In the first half of 2013, we reported the following items:
• a net gain on completion of the Ping An disposal of US$553m; and
• foreign exchange gains on sterling debt issued by HSBC Holdings of US$442m; partly offset by
• a loss of US$279m recognised following the write-off of allocated goodwill relating to our GPB business in Monaco;
• a loss of US$271m on sale of the non-real estate accounts in the US run-off portfolio in RBWM;
• a loss of US$199m on early termination of cash flow hedges in the US run-off portfolio in RBWM; and
• a loss on the sale of an HFC Bank UK secured loan portfolio in RBWM of US$138m.
Excluding these items, revenue was US$0.1bn lower:
• in RBWM, revenue fell by US$0.4bn, reflecting reduced net interest income following the sale of real estate and non-real estate portfolios and lower average balances in the US run-off portfolio. In our Principal RBWM business (see footnote 55 on page 97), revenue was broadly unchanged, with a reduction in personal lending revenue mostly offset by higher income from current accounts, savings and deposits;
• in GB&M, revenue was down by US$0.3bn or 3%, mainly driven by Markets (down by US$0.3bn or 7%), reflecting decreased revenue in our Foreign Exchange business from lower market volatility and reduced client flows. In addition, in line with expectations, Balance Sheet Management revenue decreased reflecting lower gains on disposals of available-for-sale debt securities. By contrast, our Equities business grew and revenue was higher in Principal Investments and Credit, notably legacy credit, driven by price appreciation across certain classes in the asset-backed securities (‘ABS’s) market; and
• in GPB, revenue was US$0.2bn lower, reflecting lower market volatility and a
managed reduction in client assets as we continued to reposition the business.
These factors were partly offset by:
• CMB, where revenue rose by US$0.4bn. This was due to higher net interest income driven by average lending and deposit growth in Asia and rising average deposit balances and wider lending spreads in the UK. In addition, revenue grew from higher net fee income driven by an increase in term lending fees in the UK.
LICs of US$1.8bn were US$1.1bn less than in the first half of 2013, primarily from reductions in Europe, North America and Latin America:
• in Europe, LICs decreased by US$0.6bn, mainly driven by lower individually and collectively assessed impairments in CMB in the UK, reflecting the improved quality of the portfolio and the economic environment, together with higher net releases of credit risk provisions on available-for-sale ABSs in GB&M;
• in North America, LICs decreased by US$0.3bn, reflecting reduced levels of delinquency and new impaired loans in the Consumer and Mortgage Lending (‘CML’) portfolio and lower lending balances from the continued run-off and loan sales, partly offset by lower favourable market value adjustments of the underlying properties as improvements in housing market conditions were less pronounced in the first half of 2014; and
• in Latin America, LICs decreased by US$0.3bn, primarily in Brazil. This was driven by changes to the impairment model and revisions to the assumptions for restructured loan account portfolios made in 2013 in both RBWM and CMB. It was partly offset by refinements to the impairment model for non-restructured loan portfolios, primarily in RBWM, in the first half of 2014. In Mexico, LICs improved due to reduced specific provisions for CMB, in particular relating to homebuilders.
Operating expenses of US$18.2bn were 2% higher and included a number of significant items as follows.
The first half of 2014 included:
• lower UK customer redress programme charges of US$234m compared with US$412m in the first half of 2013. Charges for the period included estimated redress for possible mis-selling in previous years in respect of Payment Protection Insurance (‘PPI’); and
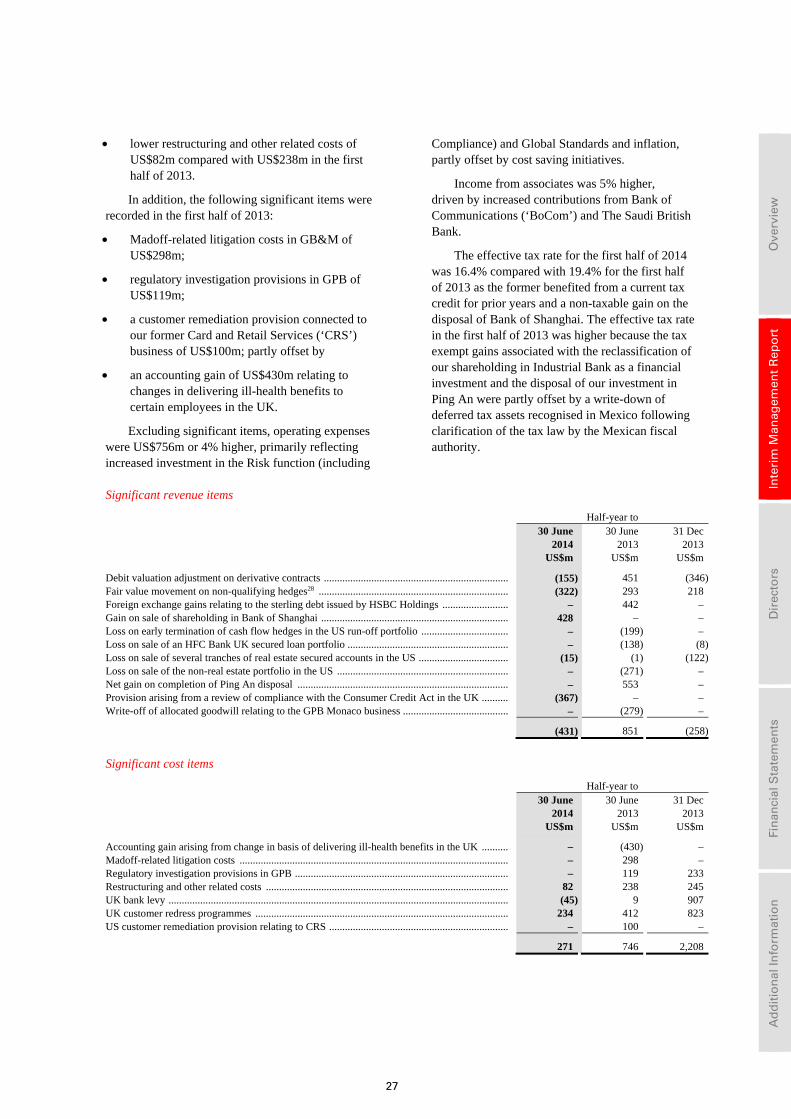
27
Ove
rvie
w
In
teri
m M
anag
emen
t R
epo
rt
D
irec
tors
Fin
anci
al S
tate
men
ts
A
dd
itio
nal
Info
rmat
ion
• lower restructuring and other related costs of US$82m compared with US$238m in the first half of 2013.
In addition, the following significant items were recorded in the first half of 2013:
• Madoff-related litigation costs in GB&M of US$298m;
• regulatory investigation provisions in GPB of US$119m;
• a customer remediation provision connected to our former Card and Retail Services (‘CRS’) business of US$100m; partly offset by
• an accounting gain of US$430m relating to changes in delivering ill-health benefits to certain employees in the UK.
Excluding significant items, operating expenses were US$756m or 4% higher, primarily reflecting increased investment in the Risk function (including
Compliance) and Global Standards and inflation, partly offset by cost saving initiatives.
Income from associates was 5% higher, driven by increased contributions from Bank of Communications (‘BoCom’) and The Saudi British Bank.
The effective tax rate for the first half of 2014 was 16.4% compared with 19.4% for the first half of 2013 as the former benefited from a current tax credit for prior years and a non-taxable gain on the disposal of Bank of Shanghai. The effective tax rate in the first half of 2013 was higher because the tax exempt gains associated with the reclassification of our shareholding in Industrial Bank as a financial investment and the disposal of our investment in Ping An were partly offset by a write-down of deferred tax assets recognised in Mexico following clarification of the tax law by the Mexican fiscal authority.
Significant revenue items
Half-year to 30 June 30 June 31 Dec 2014 2013 2013 US$m US$m US$m
Debit valuation adjustment on derivative contracts ...................................................................... (155) 451 (346)Fair value movement on non-qualifying hedges28 ........................................................................ (322) 293 218Foreign exchange gains relating to the sterling debt issued by HSBC Holdings ......................... – 442 –Gain on sale of shareholding in Bank of Shanghai ....................................................................... 428 – –Loss on early termination of cash flow hedges in the US run-off portfolio ................................. – (199) –Loss on sale of an HFC Bank UK secured loan portfolio ............................................................. – (138) (8)Loss on sale of several tranches of real estate secured accounts in the US .................................. (15) (1) (122)Loss on sale of the non-real estate portfolio in the US ................................................................. – (271) –Net gain on completion of Ping An disposal ................................................................................ – 553 –Provision arising from a review of compliance with the Consumer Credit Act in the UK .......... (367) – –Write-off of allocated goodwill relating to the GPB Monaco business ........................................ – (279) –
(431) 851 (258)
Significant cost items
Half-year to 30 June 30 June 31 Dec 2014 2013 2013 US$m US$m US$m
Accounting gain arising from change in basis of delivering ill-health benefits in the UK .......... – (430) –Madoff-related litigation costs ...................................................................................................... – 298 –Regulatory investigation provisions in GPB ................................................................................. – 119 233Restructuring and other related costs ............................................................................................ 82 238 245UK bank levy ................................................................................................................................. (45) 9 907UK customer redress programmes ................................................................................................ 234 412 823US customer remediation provision relating to CRS .................................................................... – 100 –
271 746 2,208
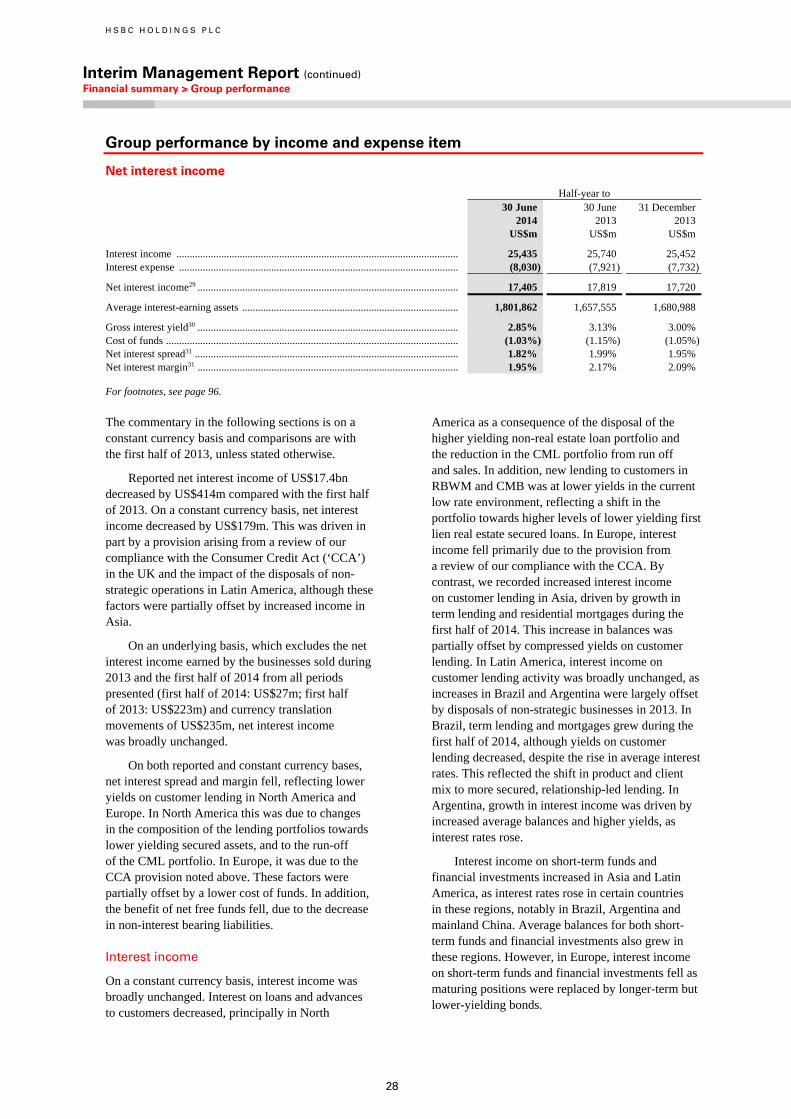
H S B C H O L D I N G S P L C
Interim Management Report (continued) Financial summary > Group performance
28
Group performance by income and expense item
Net interest income
Half-year to 30 June
2014 30 June 2013
31 December 2013
US$m US$m US$m
Interest income ........................................................................................................... 25,435 25,740 25,452 Interest expense .......................................................................................................... (8,030) (7,921) (7,732)
Net interest income29 ................................................................................................... 17,405 17,819 17,720
Average interest-earning assets .................................................................................. 1,801,862 1,657,555 1,680,988
Gross interest yield30 ................................................................................................... 2.85% 3.13% 3.00% Cost of funds ............................................................................................................... (1.03%) (1.15%) (1.05%)Net interest spread31 .................................................................................................... 1.82% 1.99% 1.95% Net interest margin31 ................................................................................................... 1.95% 2.17% 2.09%
For footnotes, see page 96.
The commentary in the following sections is on a constant currency basis and comparisons are with the first half of 2013, unless stated otherwise.
Reported net interest income of US$17.4bn decreased by US$414m compared with the first half of 2013. On a constant currency basis, net interest income decreased by US$179m. This was driven in part by a provision arising from a review of our compliance with the Consumer Credit Act (‘CCA’) in the UK and the impact of the disposals of non-strategic operations in Latin America, although these factors were partially offset by increased income in Asia.
On an underlying basis, which excludes the net interest income earned by the businesses sold during 2013 and the first half of 2014 from all periods presented (first half of 2014: US$27m; first half of 2013: US$223m) and currency translation movements of US$235m, net interest income was broadly unchanged.
On both reported and constant currency bases, net interest spread and margin fell, reflecting lower yields on customer lending in North America and Europe. In North America this was due to changes in the composition of the lending portfolios towards lower yielding secured assets, and to the run-off of the CML portfolio. In Europe, it was due to the CCA provision noted above. These factors were partially offset by a lower cost of funds. In addition, the benefit of net free funds fell, due to the decrease in non-interest bearing liabilities.
Interest income
On a constant currency basis, interest income was broadly unchanged. Interest on loans and advances to customers decreased, principally in North
America as a consequence of the disposal of the higher yielding non-real estate loan portfolio and the reduction in the CML portfolio from run off and sales. In addition, new lending to customers in RBWM and CMB was at lower yields in the current low rate environment, reflecting a shift in the portfolio towards higher levels of lower yielding first lien real estate secured loans. In Europe, interest income fell primarily due to the provision from a review of our compliance with the CCA. By contrast, we recorded increased interest income on customer lending in Asia, driven by growth in term lending and residential mortgages during the first half of 2014. This increase in balances was partially offset by compressed yields on customer lending. In Latin America, interest income on customer lending activity was broadly unchanged, as increases in Brazil and Argentina were largely offset by disposals of non-strategic businesses in 2013. In Brazil, term lending and mortgages grew during the first half of 2014, although yields on customer lending decreased, despite the rise in average interest rates. This reflected the shift in product and client mix to more secured, relationship-led lending. In Argentina, growth in interest income was driven by increased average balances and higher yields, as interest rates rose.
Interest income on short-term funds and financial investments increased in Asia and Latin America, as interest rates rose in certain countries in these regions, notably in Brazil, Argentina and mainland China. Average balances for both short-term funds and financial investments also grew in these regions. However, in Europe, interest income on short-term funds and financial investments fell as maturing positions were replaced by longer-term but lower-yielding bonds.
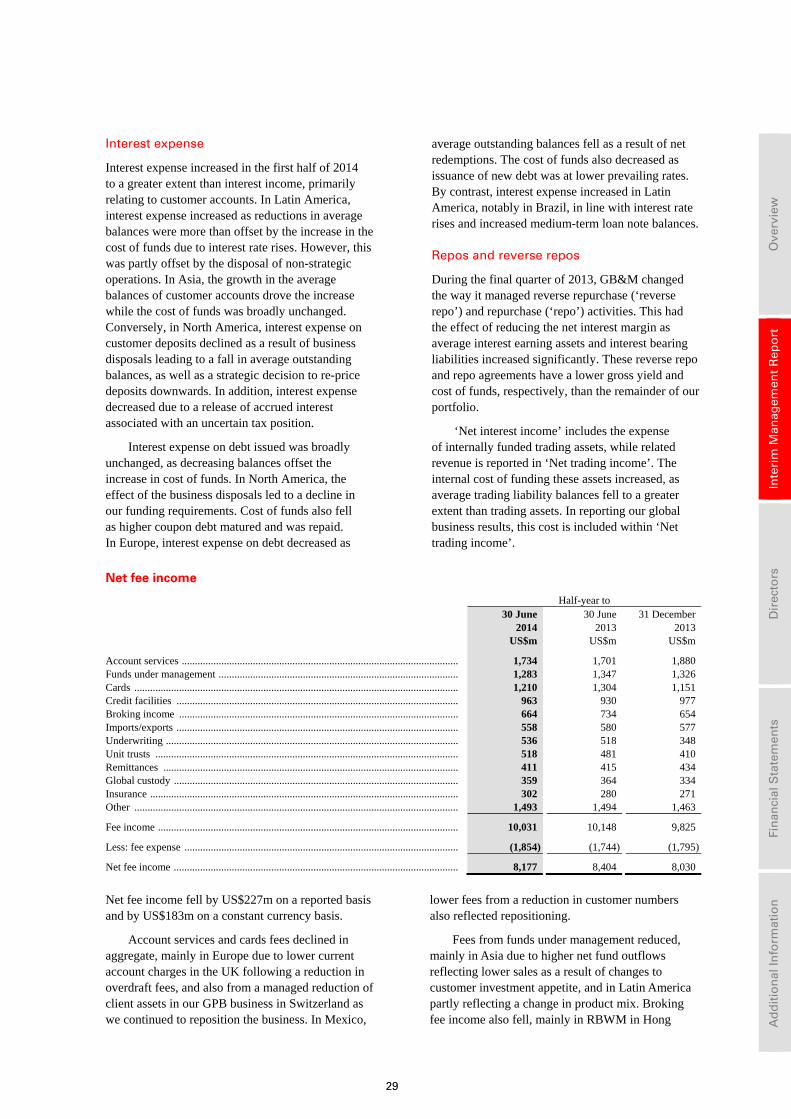
29
Ove
rvie
w
In
teri
m M
anag
emen
t R
epo
rt
D
irec
tors
Fin
anci
al S
tate
men
ts
A
dd
itio
nal
Info
rmat
ion
Interest expense
Interest expense increased in the first half of 2014 to a greater extent than interest income, primarily relating to customer accounts. In Latin America, interest expense increased as reductions in average balances were more than offset by the increase in the cost of funds due to interest rate rises. However, this was partly offset by the disposal of non-strategic operations. In Asia, the growth in the average balances of customer accounts drove the increase while the cost of funds was broadly unchanged. Conversely, in North America, interest expense on customer deposits declined as a result of business disposals leading to a fall in average outstanding balances, as well as a strategic decision to re-price deposits downwards. In addition, interest expense decreased due to a release of accrued interest associated with an uncertain tax position.
Interest expense on debt issued was broadly unchanged, as decreasing balances offset the increase in cost of funds. In North America, the effect of the business disposals led to a decline in our funding requirements. Cost of funds also fell as higher coupon debt matured and was repaid. In Europe, interest expense on debt decreased as
average outstanding balances fell as a result of net redemptions. The cost of funds also decreased as issuance of new debt was at lower prevailing rates. By contrast, interest expense increased in Latin America, notably in Brazil, in line with interest rate rises and increased medium-term loan note balances.
Repos and reverse repos
During the final quarter of 2013, GB&M changed the way it managed reverse repurchase (‘reverse repo’) and repurchase (‘repo’) activities. This had the effect of reducing the net interest margin as average interest earning assets and interest bearing liabilities increased significantly. These reverse repo and repo agreements have a lower gross yield and cost of funds, respectively, than the remainder of our portfolio.
‘Net interest income’ includes the expense of internally funded trading assets, while related revenue is reported in ‘Net trading income’. The internal cost of funding these assets increased, as average trading liability balances fell to a greater extent than trading assets. In reporting our global business results, this cost is included within ‘Net trading income’.
Net fee income
Half-year to 30 June
2014US$m
30 June 2013
US$m
31 December2013
US$m
Account services ......................................................................................................... 1,734 1,701 1,880 Funds under management ........................................................................................... 1,283 1,347 1,326 Cards ........................................................................................................................... 1,210 1,304 1,151 Credit facilities ........................................................................................................... 963 930 977 Broking income .......................................................................................................... 664 734 654 Imports/exports ........................................................................................................... 558 580 577 Underwriting ............................................................................................................... 536 518 348 Unit trusts ................................................................................................................... 518 481 410 Remittances ................................................................................................................ 411 415 434 Global custody ............................................................................................................ 359 364 334 Insurance ..................................................................................................................... 302 280 271 Other ........................................................................................................................... 1,493 1,494 1,463
Fee income .................................................................................................................. 10,031 10,148 9,825
Less: fee expense ........................................................................................................ (1,854) (1,744) (1,795)
Net fee income ............................................................................................................ 8,177 8,404 8,030
Net fee income fell by US$227m on a reported basis and by US$183m on a constant currency basis.
Account services and cards fees declined in aggregate, mainly in Europe due to lower current account charges in the UK following a reduction in overdraft fees, and also from a managed reduction of client assets in our GPB business in Switzerland as we continued to reposition the business. In Mexico,
lower fees from a reduction in customer numbers also reflected repositioning.
Fees from funds under management reduced, mainly in Asia due to higher net fund outflows reflecting lower sales as a result of changes to customer investment appetite, and in Latin America partly reflecting a change in product mix. Broking fee income also fell, mainly in RBWM in Hong
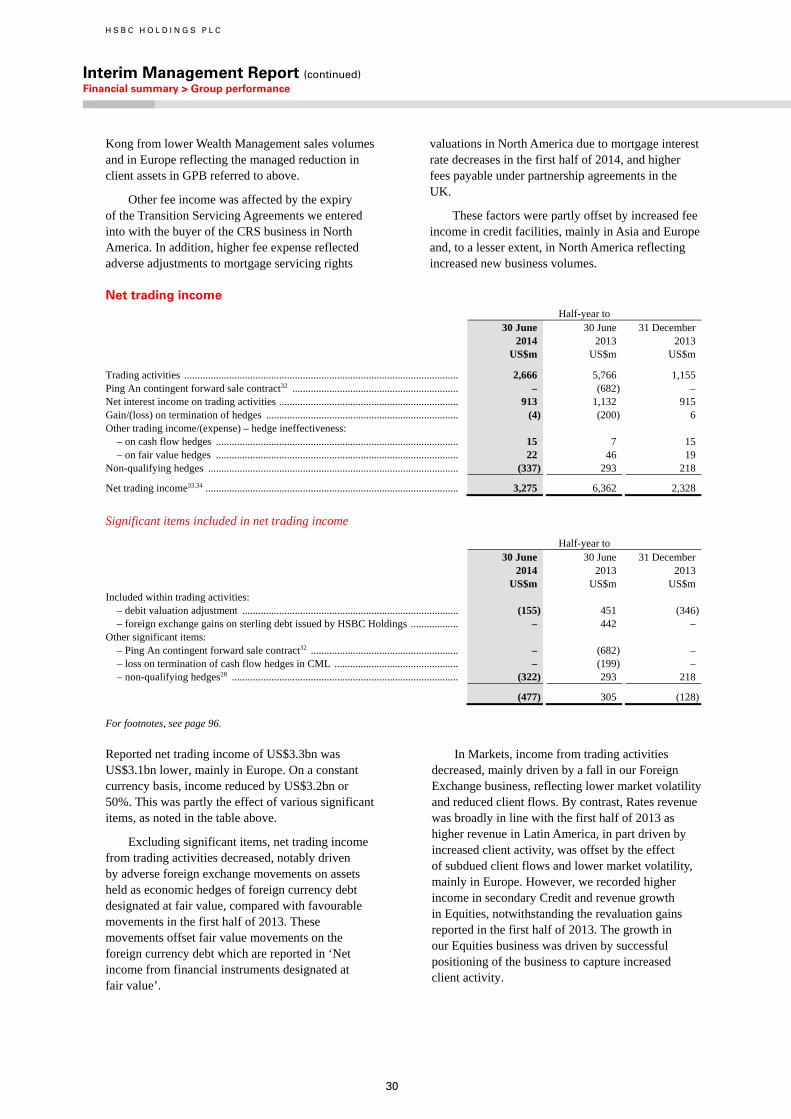
H S B C H O L D I N G S P L C
Interim Management Report (continued) Financial summary > Group performance
30
Kong from lower Wealth Management sales volumes and in Europe reflecting the managed reduction in client assets in GPB referred to above.
Other fee income was affected by the expiry of the Transition Servicing Agreements we entered into with the buyer of the CRS business in North America. In addition, higher fee expense reflected adverse adjustments to mortgage servicing rights
valuations in North America due to mortgage interest rate decreases in the first half of 2014, and higher fees payable under partnership agreements in the UK.
These factors were partly offset by increased fee income in credit facilities, mainly in Asia and Europe and, to a lesser extent, in North America reflecting increased new business volumes.
Net trading income Half-year to 30 June
2014 US$m
30 June 2013 US$m
31 December 2013 US$m
Trading activities ........................................................................................................ 2,666 5,766 1,155 Ping An contingent forward sale contract32 ............................................................... – (682) – Net interest income on trading activities .................................................................... 913 1,132 915 Gain/(loss) on termination of hedges ......................................................................... (4) (200) 6 Other trading income/(expense) – hedge ineffectiveness:
– on cash flow hedges ............................................................................................ 15 7 15 – on fair value hedges ............................................................................................ 22 46 19
Non-qualifying hedges ............................................................................................... (337) 293 218
Net trading income33,34 ................................................................................................ 3,275 6,362 2,328
Significant items included in net trading income
Half-year to
30 June 2014
30 June 2013
31 December 2013
US$m US$m US$m Included within trading activities:
– debit valuation adjustment .................................................................................. (155) 451 (346)– foreign exchange gains on sterling debt issued by HSBC Holdings .................. – 442 –
Other significant items: – Ping An contingent forward sale contract32 ........................................................ – (682) – – loss on termination of cash flow hedges in CML ............................................... – (199) – – non-qualifying hedges28 ...................................................................................... (322) 293 218
(477) 305 (128)
For footnotes, see page 96.
Reported net trading income of US$3.3bn was US$3.1bn lower, mainly in Europe. On a constant currency basis, income reduced by US$3.2bn or 50%. This was partly the effect of various significant items, as noted in the table above.
Excluding significant items, net trading income from trading activities decreased, notably driven by adverse foreign exchange movements on assets held as economic hedges of foreign currency debt designated at fair value, compared with favourable movements in the first half of 2013. These movements offset fair value movements on the foreign currency debt which are reported in ‘Net income from financial instruments designated at fair value’.
In Markets, income from trading activities decreased, mainly driven by a fall in our Foreign Exchange business, reflecting lower market volatility and reduced client flows. By contrast, Rates revenue was broadly in line with the first half of 2013 as higher revenue in Latin America, in part driven by increased client activity, was offset by the effect of subdued client flows and lower market volatility, mainly in Europe. However, we recorded higher income in secondary Credit and revenue growth in Equities, notwithstanding the revaluation gains reported in the first half of 2013. The growth in our Equities business was driven by successful positioning of the business to capture increased client activity.
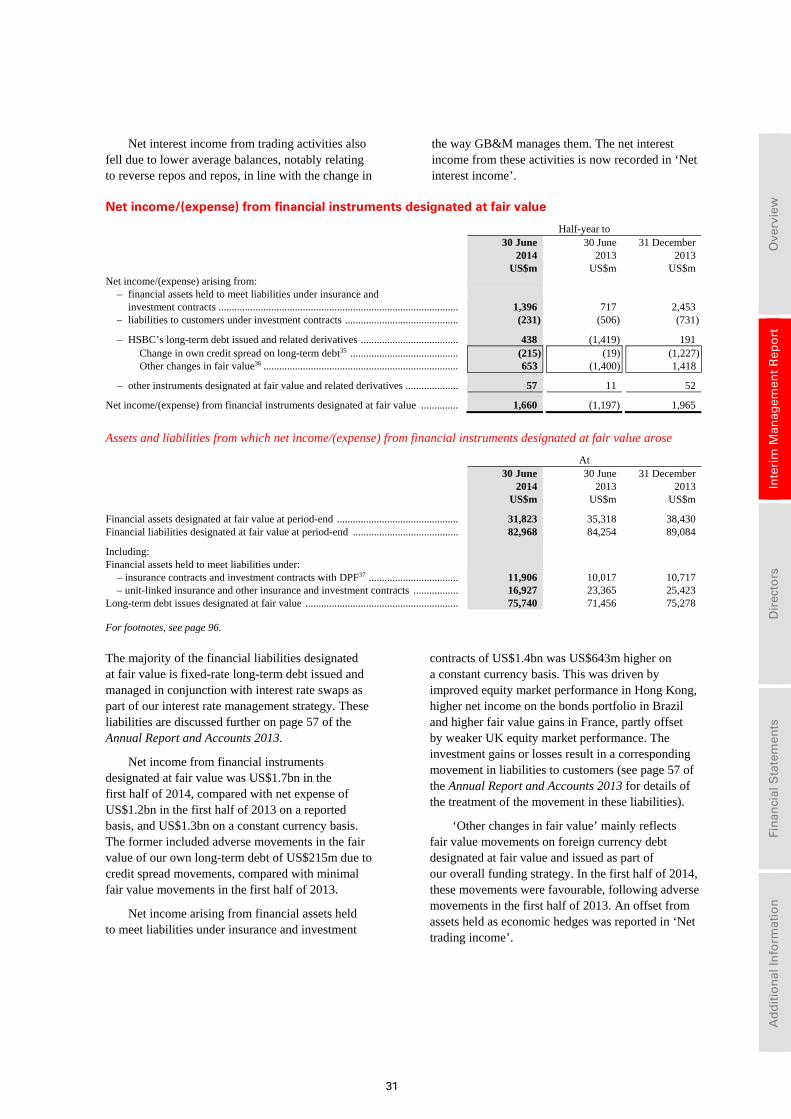
31
Ove
rvie
w
In
teri
m M
anag
emen
t R
epo
rt
D
irec
tors
Fin
anci
al S
tate
men
ts
A
dd
itio
nal
Info
rmat
ion
Net interest income from trading activities also fell due to lower average balances, notably relating to reverse repos and repos, in line with the change in
the way GB&M manages them. The net interest income from these activities is now recorded in ‘Net interest income’.
Net income/(expense) from financial instruments designated at fair value
Half-year to 30 June
2014US$m
30 June 2013
US$m
31 December2013
US$m Net income/(expense) arising from:
– financial assets held to meet liabilities under insurance and investment contracts ........................................................................................... 1,396 717 2,453
– liabilities to customers under investment contracts ........................................... (231) (506) (731)
– HSBC’s long-term debt issued and related derivatives ..................................... 438 (1,419) 191 Change in own credit spread on long-term debt35 ......................................... (215) (19) (1,227)Other changes in fair value36 .......................................................................... 653 (1,400) 1,418
– other instruments designated at fair value and related derivatives .................... 57 11 52
Net income/(expense) from financial instruments designated at fair value .............. 1,660 (1,197) 1,965
Assets and liabilities from which net income/(expense) from financial instruments designated at fair value arose
At 30 June 30 June 31 December 2014
US$m 2013
US$m 2013
US$m
Financial assets designated at fair value at period-end .............................................. 31,823 35,318 38,430 Financial liabilities designated at fair value at period-end ........................................ 82,968 84,254 89,084
Including: Financial assets held to meet liabilities under:
– insurance contracts and investment contracts with DPF37 .................................. 11,906 10,017 10,717 – unit-linked insurance and other insurance and investment contracts ................. 16,927 23,365 25,423
Long-term debt issues designated at fair value .......................................................... 75,740 71,456 75,278
For footnotes, see page 96.
The majority of the financial liabilities designated at fair value is fixed-rate long-term debt issued and managed in conjunction with interest rate swaps as part of our interest rate management strategy. These liabilities are discussed further on page 57 of the Annual Report and Accounts 2013.
Net income from financial instruments designated at fair value was US$1.7bn in the first half of 2014, compared with net expense of US$1.2bn in the first half of 2013 on a reported basis, and US$1.3bn on a constant currency basis. The former included adverse movements in the fair value of our own long-term debt of US$215m due to credit spread movements, compared with minimal fair value movements in the first half of 2013.
Net income arising from financial assets held to meet liabilities under insurance and investment
contracts of US$1.4bn was US$643m higher on a constant currency basis. This was driven by improved equity market performance in Hong Kong, higher net income on the bonds portfolio in Brazil and higher fair value gains in France, partly offset by weaker UK equity market performance. The investment gains or losses result in a corresponding movement in liabilities to customers (see page 57 of the Annual Report and Accounts 2013 for details of the treatment of the movement in these liabilities).
‘Other changes in fair value’ mainly reflects fair value movements on foreign currency debt designated at fair value and issued as part of our overall funding strategy. In the first half of 2014, these movements were favourable, following adverse movements in the first half of 2013. An offset from assets held as economic hedges was reported in ‘Net trading income’.
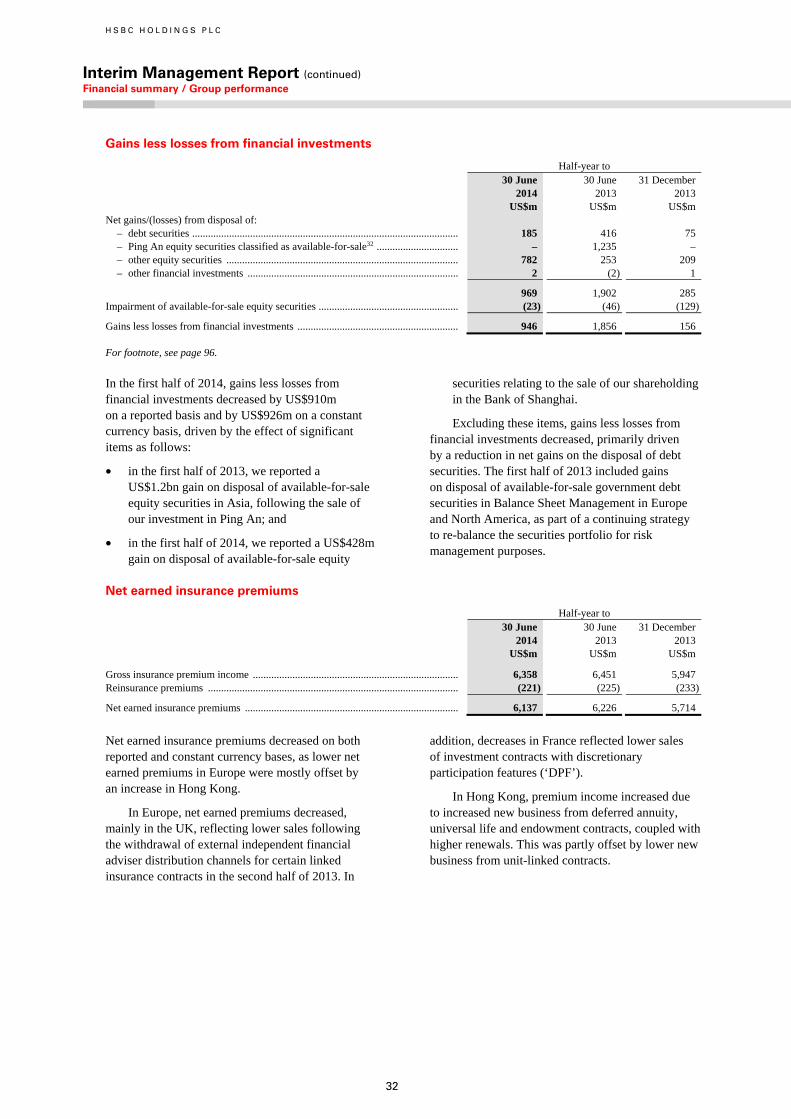
H S B C H O L D I N G S P L C
Interim Management Report (continued) Financial summary / Group performance
32
Gains less losses from financial investments
Half-year to 30 June
2014US$m
30 June 2013
US$m
31 December2013
US$m Net gains/(losses) from disposal of:
– debt securities ..................................................................................................... 185 416 75 – Ping An equity securities classified as available-for-sale32 ............................... – 1,235 – – other equity securities ........................................................................................ 782 253 209 – other financial investments ................................................................................ 2 (2) 1
969 1,902 285 Impairment of available-for-sale equity securities ..................................................... (23) (46) (129)
Gains less losses from financial investments ............................................................. 946 1,856 156
For footnote, see page 96.
In the first half of 2014, gains less losses from financial investments decreased by US$910m on a reported basis and by US$926m on a constant currency basis, driven by the effect of significant items as follows:
• in the first half of 2013, we reported a US$1.2bn gain on disposal of available-for-sale equity securities in Asia, following the sale of our investment in Ping An; and
• in the first half of 2014, we reported a US$428m gain on disposal of available-for-sale equity
securities relating to the sale of our shareholding in the Bank of Shanghai.
Excluding these items, gains less losses from financial investments decreased, primarily driven by a reduction in net gains on the disposal of debt securities. The first half of 2013 included gains on disposal of available-for-sale government debt securities in Balance Sheet Management in Europe and North America, as part of a continuing strategy to re-balance the securities portfolio for risk management purposes.
Net earned insurance premiums
Half-year to 30 June
2014US$m
30 June 2013
US$m
31 December2013
US$m
Gross insurance premium income .............................................................................. 6,358 6,451 5,947 Reinsurance premiums ............................................................................................... (221) (225) (233)
Net earned insurance premiums ................................................................................. 6,137 6,226 5,714
Net earned insurance premiums decreased on both reported and constant currency bases, as lower net earned premiums in Europe were mostly offset by an increase in Hong Kong.
In Europe, net earned premiums decreased, mainly in the UK, reflecting lower sales following the withdrawal of external independent financial adviser distribution channels for certain linked insurance contracts in the second half of 2013. In
addition, decreases in France reflected lower sales of investment contracts with discretionary participation features (‘DPF’).
In Hong Kong, premium income increased due to increased new business from deferred annuity, universal life and endowment contracts, coupled with higher renewals. This was partly offset by lower new business from unit-linked contracts.
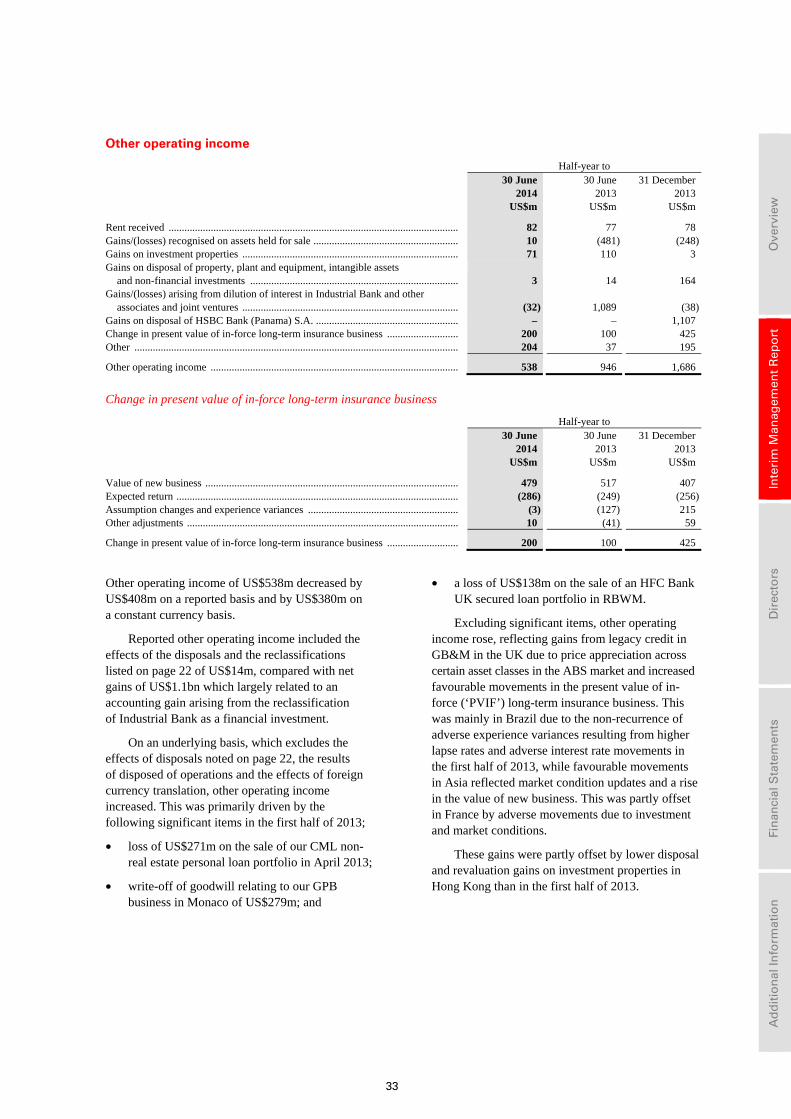
33
Ove
rvie
w
In
teri
m M
anag
emen
t R
epo
rt
D
irec
tors
Fin
anci
al S
tate
men
ts
A
dd
itio
nal
Info
rmat
ion
Other operating income
Half-year to 30 June
2014US$m
30 June 2013
US$m
31 December2013
US$m
Rent received .............................................................................................................. 82 77 78 Gains/(losses) recognised on assets held for sale ....................................................... 10 (481) (248)Gains on investment properties .................................................................................. 71 110 3 Gains on disposal of property, plant and equipment, intangible assets
and non-financial investments ............................................................................... 3 14 164 Gains/(losses) arising from dilution of interest in Industrial Bank and other
associates and joint ventures .................................................................................. (32)
1,089 (38)Gains on disposal of HSBC Bank (Panama) S.A. ...................................................... – – 1,107 Change in present value of in-force long-term insurance business ........................... 200 100 425 Other ........................................................................................................................... 204 37 195
Other operating income .............................................................................................. 538 946 1,686
Change in present value of in-force long-term insurance business
Half-year to 30 June
2014US$m
30 June 2013
US$m
31 December2013
US$m
Value of new business ................................................................................................ 479 517 407 Expected return ........................................................................................................... (286) (249) (256)Assumption changes and experience variances ......................................................... (3) (127) 215 Other adjustments ....................................................................................................... 10 (41) 59
Change in present value of in-force long-term insurance business ........................... 200 100 425
Other operating income of US$538m decreased by US$408m on a reported basis and by US$380m on a constant currency basis.
Reported other operating income included the effects of the disposals and the reclassifications listed on page 22 of US$14m, compared with net gains of US$1.1bn which largely related to an accounting gain arising from the reclassification of Industrial Bank as a financial investment.
On an underlying basis, which excludes the effects of disposals noted on page 22, the results of disposed of operations and the effects of foreign currency translation, other operating income increased. This was primarily driven by the following significant items in the first half of 2013;
• loss of US$271m on the sale of our CML non-real estate personal loan portfolio in April 2013;
• write-off of goodwill relating to our GPB business in Monaco of US$279m; and
• a loss of US$138m on the sale of an HFC Bank UK secured loan portfolio in RBWM.
Excluding significant items, other operating income rose, reflecting gains from legacy credit in GB&M in the UK due to price appreciation across certain asset classes in the ABS market and increased favourable movements in the present value of in-force (‘PVIF’) long-term insurance business. This was mainly in Brazil due to the non-recurrence of adverse experience variances resulting from higher lapse rates and adverse interest rate movements in the first half of 2013, while favourable movements in Asia reflected market condition updates and a rise in the value of new business. This was partly offset in France by adverse movements due to investment and market conditions.
These gains were partly offset by lower disposal and revaluation gains on investment properties in Hong Kong than in the first half of 2013.
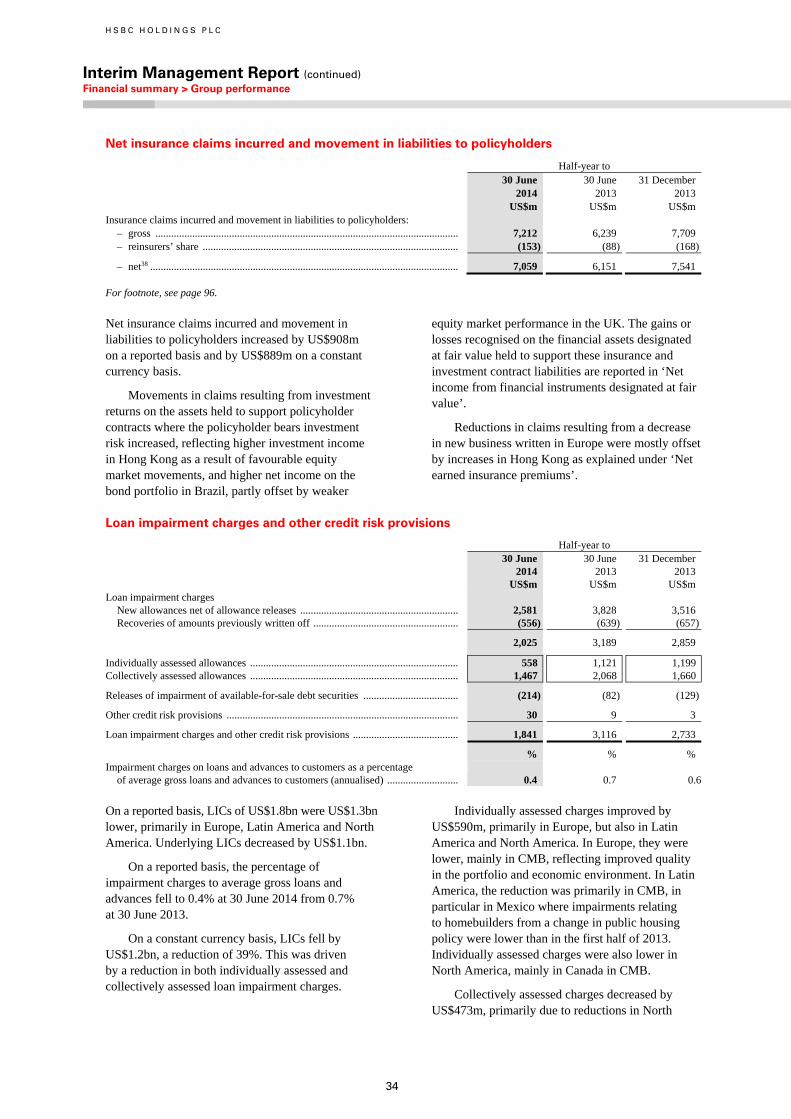
H S B C H O L D I N G S P L C
Interim Management Report (continued) Financial summary > Group performance
34
Net insurance claims incurred and movement in liabilities to policyholders
Half-year to 30 June
2014US$m
30 June 2013
US$m
31 December2013
US$m Insurance claims incurred and movement in liabilities to policyholders:
– gross ................................................................................................................... 7,212 6,239 7,709 – reinsurers’ share ................................................................................................. (153) (88) (168)
– net38 ..................................................................................................................... 7,059 6,151 7,541
For footnote, see page 96.
Net insurance claims incurred and movement in liabilities to policyholders increased by US$908m on a reported basis and by US$889m on a constant currency basis.
Movements in claims resulting from investment returns on the assets held to support policyholder contracts where the policyholder bears investment risk increased, reflecting higher investment income in Hong Kong as a result of favourable equity market movements, and higher net income on the bond portfolio in Brazil, partly offset by weaker
equity market performance in the UK. The gains or losses recognised on the financial assets designated at fair value held to support these insurance and investment contract liabilities are reported in ‘Net income from financial instruments designated at fair value’.
Reductions in claims resulting from a decrease in new business written in Europe were mostly offset by increases in Hong Kong as explained under ‘Net earned insurance premiums’.
Loan impairment charges and other credit risk provisions
Half-year to 30 June
2014US$m
30 June 2013
US$m
31 December2013
US$m Loan impairment charges
New allowances net of allowance releases ............................................................ 2,581 3,828 3,516 Recoveries of amounts previously written off ....................................................... (556) (639) (657)
2,025 3,189 2,859
Individually assessed allowances ............................................................................... 558 1,121 1,199Collectively assessed allowances ............................................................................... 1,467 2,068 1,660
Releases of impairment of available-for-sale debt securities .................................... (214) (82) (129)
Other credit risk provisions ........................................................................................ 30 9 3
Loan impairment charges and other credit risk provisions ........................................ 1,841 3,116 2,733
% % % Impairment charges on loans and advances to customers as a percentage
of average gross loans and advances to customers (annualised) ........................... 0.4 0.7 0.6
On a reported basis, LICs of US$1.8bn were US$1.3bn lower, primarily in Europe, Latin America and North America. Underlying LICs decreased by US$1.1bn.
On a reported basis, the percentage of impairment charges to average gross loans and advances fell to 0.4% at 30 June 2014 from 0.7% at 30 June 2013.
On a constant currency basis, LICs fell by US$1.2bn, a reduction of 39%. This was driven by a reduction in both individually assessed and collectively assessed loan impairment charges.
Individually assessed charges improved by US$590m, primarily in Europe, but also in Latin America and North America. In Europe, they were lower, mainly in CMB, reflecting improved quality in the portfolio and economic environment. In Latin America, the reduction was primarily in CMB, in particular in Mexico where impairments relating to homebuilders from a change in public housing policy were lower than in the first half of 2013. Individually assessed charges were also lower in North America, mainly in Canada in CMB.
Collectively assessed charges decreased by US$473m, primarily due to reductions in North
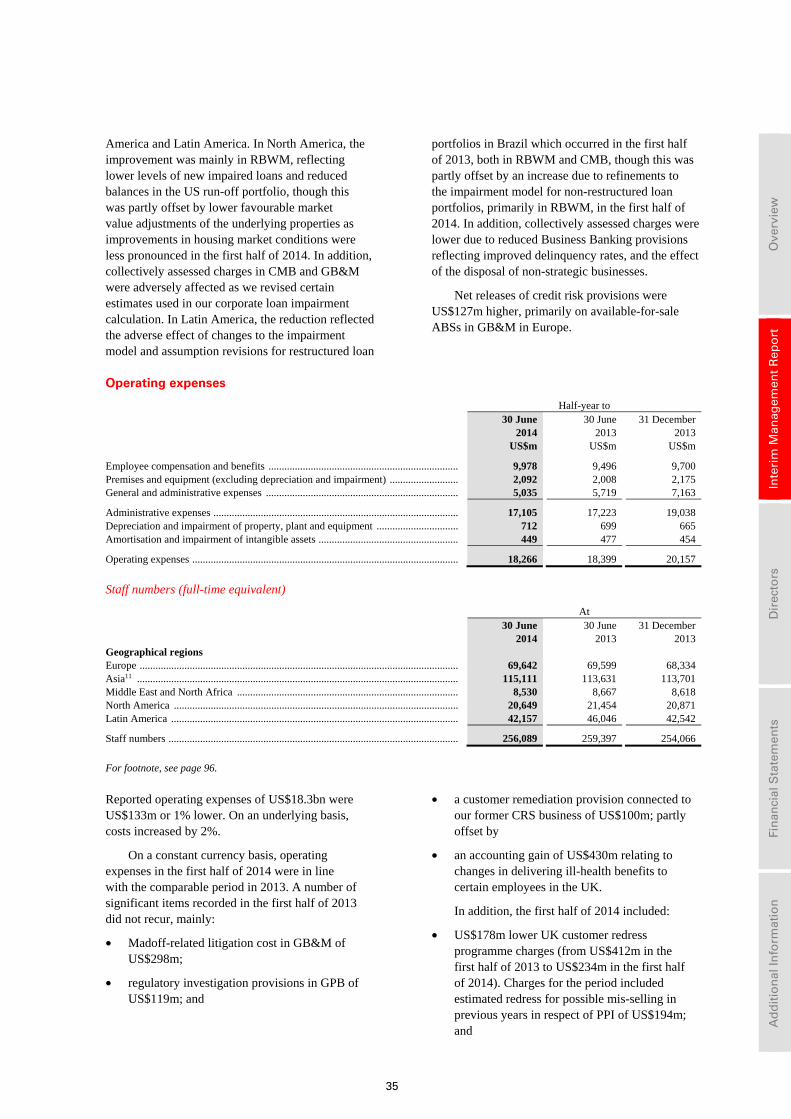
35
Ove
rvie
w
In
teri
m M
anag
emen
t R
epo
rt
D
irec
tors
Fin
anci
al S
tate
men
ts
A
dd
itio
nal
Info
rmat
ion
America and Latin America. In North America, the improvement was mainly in RBWM, reflecting lower levels of new impaired loans and reduced balances in the US run-off portfolio, though this was partly offset by lower favourable market value adjustments of the underlying properties as improvements in housing market conditions were less pronounced in the first half of 2014. In addition, collectively assessed charges in CMB and GB&M were adversely affected as we revised certain estimates used in our corporate loan impairment calculation. In Latin America, the reduction reflected the adverse effect of changes to the impairment model and assumption revisions for restructured loan
portfolios in Brazil which occurred in the first half of 2013, both in RBWM and CMB, though this was partly offset by an increase due to refinements to the impairment model for non-restructured loan portfolios, primarily in RBWM, in the first half of 2014. In addition, collectively assessed charges were lower due to reduced Business Banking provisions reflecting improved delinquency rates, and the effect of the disposal of non-strategic businesses.
Net releases of credit risk provisions were US$127m higher, primarily on available-for-sale ABSs in GB&M in Europe.
Operating expenses
Half-year to 30 June
2014 30 June
2013 31 December
2013 US$m US$m US$m
Employee compensation and benefits ........................................................................ 9,978 9,496 9,700 Premises and equipment (excluding depreciation and impairment) .......................... 2,092 2,008 2,175 General and administrative expenses ......................................................................... 5,035 5,719 7,163
Administrative expenses ............................................................................................. 17,105 17,223 19,038 Depreciation and impairment of property, plant and equipment ............................... 712 699 665 Amortisation and impairment of intangible assets ..................................................... 449 477 454
Operating expenses ..................................................................................................... 18,266 18,399 20,157
Staff numbers (full-time equivalent)
At 30 June
2014 30 June
2013 31 December
2013 Geographical regions Europe ......................................................................................................................... 69,642 69,599 68,334 Asia11 .......................................................................................................................... 115,111 113,631 113,701 Middle East and North Africa .................................................................................... 8,530 8,667 8,618 North America ............................................................................................................ 20,649 21,454 20,871 Latin America ............................................................................................................. 42,157 46,046 42,542
Staff numbers .............................................................................................................. 256,089 259,397 254,066
For footnote, see page 96.
Reported operating expenses of US$18.3bn were US$133m or 1% lower. On an underlying basis, costs increased by 2%.
On a constant currency basis, operating expenses in the first half of 2014 were in line with the comparable period in 2013. A number of significant items recorded in the first half of 2013 did not recur, mainly:
• Madoff-related litigation cost in GB&M of US$298m;
• regulatory investigation provisions in GPB of US$119m; and
• a customer remediation provision connected to our former CRS business of US$100m; partly offset by
• an accounting gain of US$430m relating to changes in delivering ill-health benefits to certain employees in the UK.
In addition, the first half of 2014 included:
• US$178m lower UK customer redress programme charges (from US$412m in the first half of 2013 to US$234m in the first half of 2014). Charges for the period included estimated redress for possible mis-selling in previous years in respect of PPI of US$194m; and
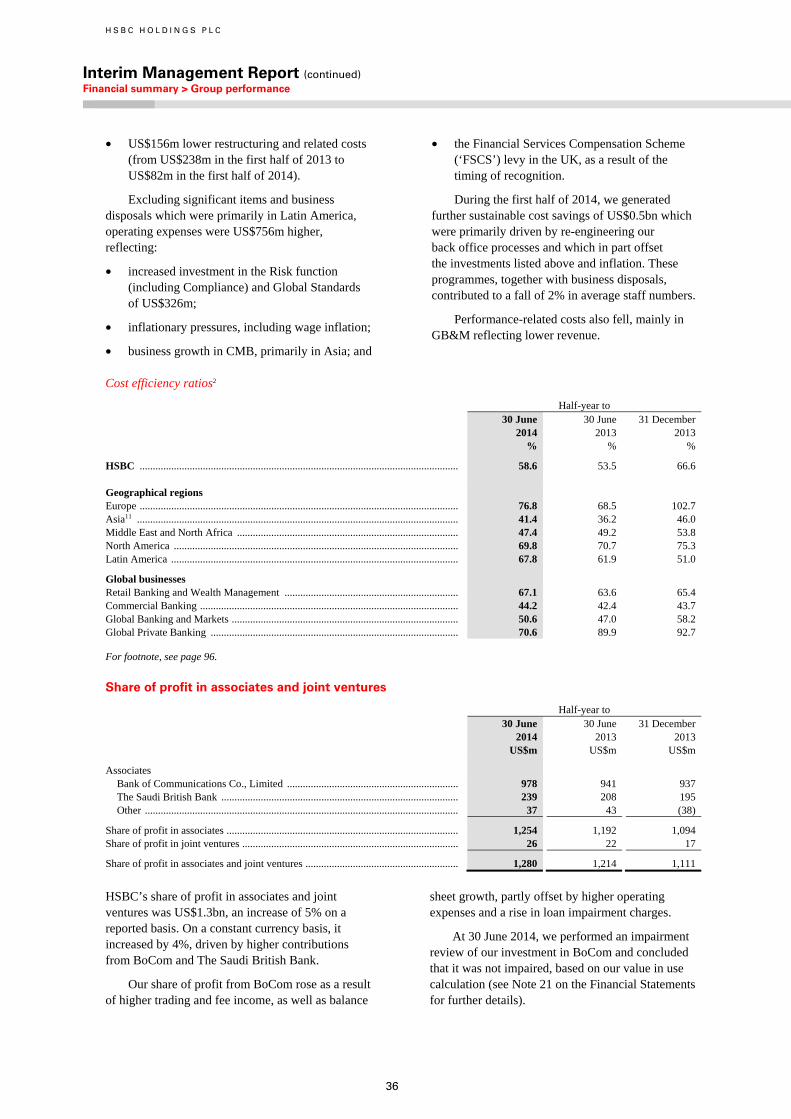
H S B C H O L D I N G S P L C
Interim Management Report (continued) Financial summary > Group performance
36
• US$156m lower restructuring and related costs (from US$238m in the first half of 2013 to US$82m in the first half of 2014).
Excluding significant items and business disposals which were primarily in Latin America, operating expenses were US$756m higher, reflecting:
• increased investment in the Risk function (including Compliance) and Global Standards of US$326m;
• inflationary pressures, including wage inflation;
• business growth in CMB, primarily in Asia; and
• the Financial Services Compensation Scheme (‘FSCS’) levy in the UK, as a result of the timing of recognition.
During the first half of 2014, we generated further sustainable cost savings of US$0.5bn which were primarily driven by re-engineering our back office processes and which in part offset the investments listed above and inflation. These programmes, together with business disposals, contributed to a fall of 2% in average staff numbers.
Performance-related costs also fell, mainly in GB&M reflecting lower revenue.
Cost efficiency ratios2
Half-year to
30 June
2014 30 June
2013 31 December
2013 % % %
HSBC ......................................................................................................................... 58.6 53.5 66.6 Geographical regions Europe ......................................................................................................................... 76.8 68.5 102.7 Asia11 .......................................................................................................................... 41.4 36.2 46.0 Middle East and North Africa .................................................................................... 47.4 49.2 53.8 North America ............................................................................................................ 69.8 70.7 75.3 Latin America ............................................................................................................. 67.8 61.9 51.0
Global businesses Retail Banking and Wealth Management .................................................................. 67.1 63.6 65.4 Commercial Banking .................................................................................................. 44.2 42.4 43.7 Global Banking and Markets ...................................................................................... 50.6 47.0 58.2 Global Private Banking .............................................................................................. 70.6 89.9 92.7
For footnote, see page 96.
Share of profit in associates and joint ventures
Half-year to 30 June
2014US$m
30 June 2013
US$m
31 December2013
US$m
Associates Bank of Communications Co., Limited ................................................................. 978 941 937 The Saudi British Bank .......................................................................................... 239 208 195 Other ....................................................................................................................... 37 43 (38)
Share of profit in associates ........................................................................................ 1,254 1,192 1,094 Share of profit in joint ventures .................................................................................. 26 22 17
Share of profit in associates and joint ventures .......................................................... 1,280 1,214 1,111
HSBC’s share of profit in associates and joint ventures was US$1.3bn, an increase of 5% on a reported basis. On a constant currency basis, it increased by 4%, driven by higher contributions from BoCom and The Saudi British Bank.
Our share of profit from BoCom rose as a result of higher trading and fee income, as well as balance
sheet growth, partly offset by higher operating expenses and a rise in loan impairment charges.
At 30 June 2014, we performed an impairment review of our investment in BoCom and concluded that it was not impaired, based on our value in use calculation (see Note 21 on the Financial Statements for further details).
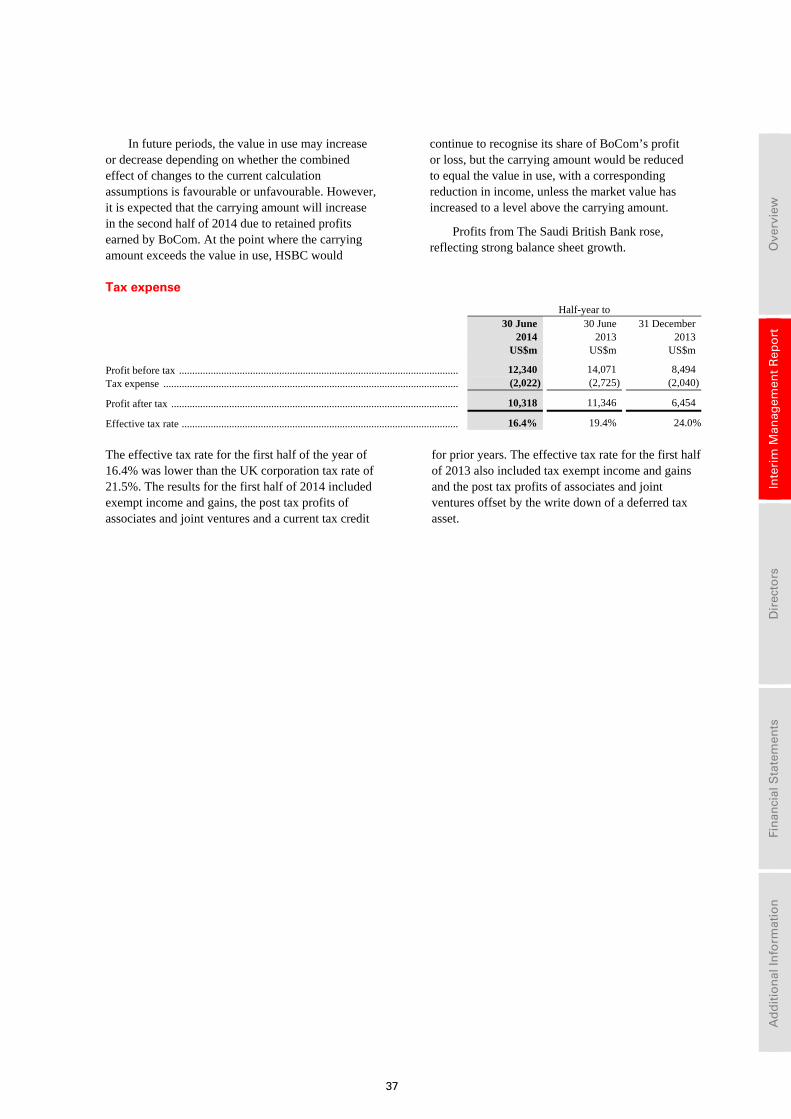
37
Ove
rvie
w
In
teri
m M
anag
emen
t R
epo
rt
D
irec
tors
Fin
anci
al S
tate
men
ts
A
dd
itio
nal
Info
rmat
ion
In future periods, the value in use may increase or decrease depending on whether the combined effect of changes to the current calculation assumptions is favourable or unfavourable. However, it is expected that the carrying amount will increase in the second half of 2014 due to retained profits earned by BoCom. At the point where the carrying amount exceeds the value in use, HSBC would
continue to recognise its share of BoCom’s profit or loss, but the carrying amount would be reduced to equal the value in use, with a corresponding reduction in income, unless the market value has increased to a level above the carrying amount.
Profits from The Saudi British Bank rose, reflecting strong balance sheet growth.
Tax expense
Half-year to 30 June 30 June 31 December 2014
US$m 2013
US$m 2013
US$m
Profit before tax .......................................................................................................... 12,340 14,071 8,494 Tax expense ................................................................................................................ (2,022) (2,725) (2,040)
Profit after tax ............................................................................................................. 10,318 11,346 6,454
Effective tax rate ......................................................................................................... 16.4% 19.4% 24.0%
The effective tax rate for the first half of the year of 16.4% was lower than the UK corporation tax rate of 21.5%. The results for the first half of 2014 included exempt income and gains, the post tax profits of associates and joint ventures and a current tax credit
for prior years. The effective tax rate for the first half of 2013 also included tax exempt income and gains and the post tax profits of associates and joint ventures offset by the write down of a deferred tax asset.
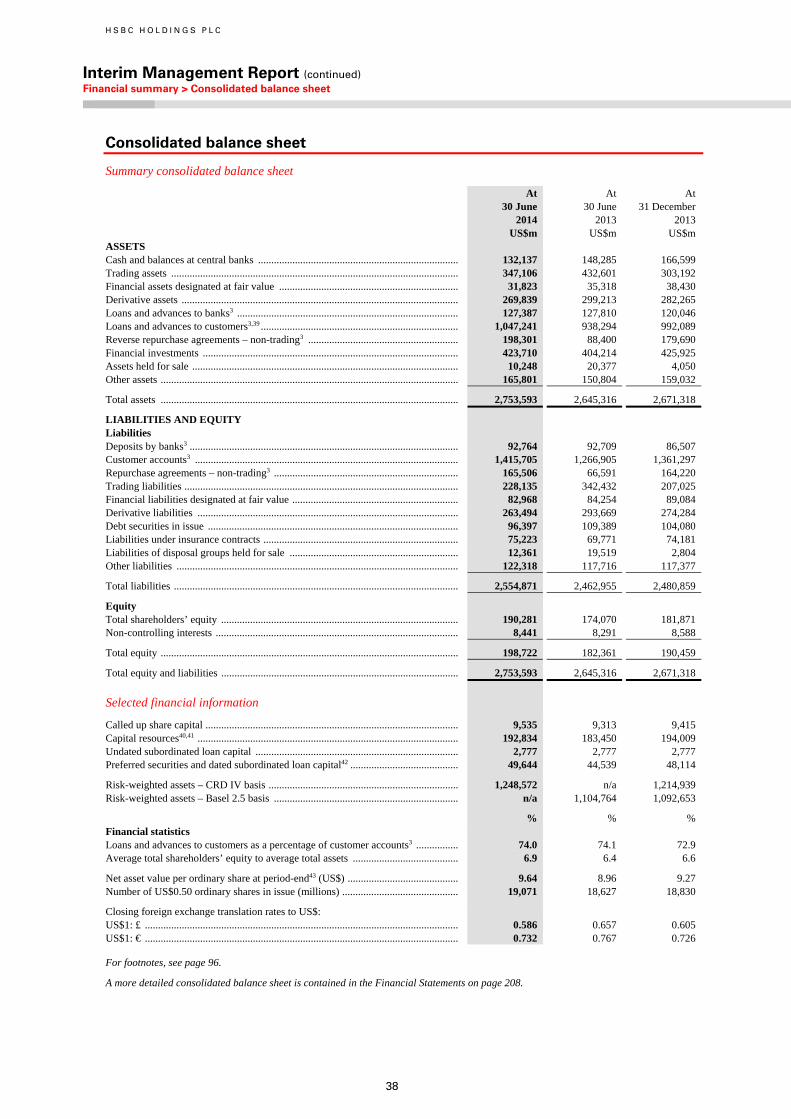
H S B C H O L D I N G S P L C
Interim Management Report (continued) Financial summary > Consolidated balance sheet
38
Consolidated balance sheet
Summary consolidated balance sheet
At30 June
2014US$m
At 30 June
2013 US$m
At 31 December
2013US$m
ASSETS Cash and balances at central banks ............................................................................ 132,137 148,285 166,599 Trading assets ............................................................................................................. 347,106 432,601 303,192 Financial assets designated at fair value .................................................................... 31,823 35,318 38,430 Derivative assets ......................................................................................................... 269,839 299,213 282,265 Loans and advances to banks3 .................................................................................... 127,387 127,810 120,046 Loans and advances to customers3,39 ........................................................................... 1,047,241 938,294 992,089 Reverse repurchase agreements – non-trading3 ......................................................... 198,301 88,400 179,690 Financial investments ................................................................................................. 423,710 404,214 425,925 Assets held for sale ..................................................................................................... 10,248 20,377 4,050 Other assets ................................................................................................................. 165,801 150,804 159,032
Total assets ................................................................................................................. 2,753,593 2,645,316 2,671,318
LIABILITIES AND EQUITY Liabilities Deposits by banks3 ...................................................................................................... 92,764 92,709 86,507 Customer accounts3 .................................................................................................... 1,415,705 1,266,905 1,361,297 Repurchase agreements – non-trading3 ...................................................................... 165,506 66,591 164,220 Trading liabilities ........................................................................................................ 228,135 342,432 207,025 Financial liabilities designated at fair value ............................................................... 82,968 84,254 89,084 Derivative liabilities ................................................................................................... 263,494 293,669 274,284 Debt securities in issue ............................................................................................... 96,397 109,389 104,080 Liabilities under insurance contracts .......................................................................... 75,223 69,771 74,181 Liabilities of disposal groups held for sale ................................................................ 12,361 19,519 2,804 Other liabilities ........................................................................................................... 122,318 117,716 117,377
Total liabilities ............................................................................................................ 2,554,871 2,462,955 2,480,859
Equity Total shareholders’ equity .......................................................................................... 190,281 174,070 181,871 Non-controlling interests ............................................................................................ 8,441 8,291 8,588
Total equity ................................................................................................................. 198,722 182,361 190,459
Total equity and liabilities .......................................................................................... 2,753,593 2,645,316 2,671,318
Selected financial information
Called up share capital ................................................................................................ 9,535 9,313 9,415 Capital resources40,41 ................................................................................................... 192,834 183,450 194,009 Undated subordinated loan capital ............................................................................. 2,777 2,777 2,777 Preferred securities and dated subordinated loan capital42 ......................................... 49,644 44,539 48,114
Risk-weighted assets – CRD IV basis ........................................................................ 1,248,572 n/a 1,214,939 Risk-weighted assets – Basel 2.5 basis ...................................................................... n/a 1,104,764 1,092,653
% % % Financial statistics Loans and advances to customers as a percentage of customer accounts3 ................ 74.0 74.1 72.9 Average total shareholders’ equity to average total assets ........................................ 6.9 6.4 6.6
Net asset value per ordinary share at period-end43 (US$) .......................................... 9.64 8.96 9.27 Number of US$0.50 ordinary shares in issue (millions) ............................................ 19,071 18,627 18,830
Closing foreign exchange translation rates to US$: US$1: £ ....................................................................................................................... 0.586 0.657 0.605 US$1: € ....................................................................................................................... 0.732 0.767 0.726
For footnotes, see page 96.
A more detailed consolidated balance sheet is contained in the Financial Statements on page 208.
39
Ove
rvie
w
In
teri
m M
anag
emen
t R
epo
rt
D
irec
tors
Fin
anci
al S
tate
men
ts
A
dd
itio
nal
Info
rmat
ion
Movement from 31 December 2013 to 30 June 2014
Total reported assets were US$2.8 trillion, 3% higher than at 31 December 2013. On a constant currency basis, total assets were US$50bn or 2% higher.
Our balance sheet remains strong with a ratio of customer advances to customer accounts of 74%. Customer advances grew by US$41bn, mainly driven by a rise in term lending in Asia. Customer accounts grew by US$38bn, mainly in Asia and Europe.
The following commentary is on a constant currency basis.
Assets
Cash and balances at central banks decreased by US$37bn, notably in Europe, in part reflecting net redemptions of debt and reductions in repurchase agreements.
Trading assets increased by 13%, mainly driven by a rise in settlement accounts, notably in Europe. These balances vary according to customer trading activity, which is typically lower at the end of the year. There were increased holdings of debt securities in Asia. In Europe, holdings of equity securities also increased, reflecting growth in our Equities business, although we recorded a reduction in reverse repos held for trading.
Financial assets designated at fair value decreased by US$7.3bn, notably in Europe, largely from the transfer to ‘Assets held for sale’ of balances relating to the UK Pension business of HSBC Life (UK) Limited.
Derivative assets decreased by 6%, notably in Europe relating to interest rate contracts reflecting movements in yield curves. In Asia, foreign exchange derivative contracts also decreased, in part due to maturities.
Loans and advances to banks increased by US$6.8bn, mainly from higher placements with financial institutions in Europe, the Middle East and North Africa and Latin America.
Loans and advances to customers increased by US$41bn or 4%, largely from growth in Asia and, to a lesser extent, in Europe. In Asia, term lending to CMB and GB&M customers grew, with the latter notably relating to our Capital Financing business. Mortgage balances also increased, mainly in Hong Kong, mainland China and Taiwan. In Europe, there was a rise in corporate overdraft balances, mainly in GB&M, in accounts which are structured to allow
customer corporate treasury functions to benefit from net interest arrangements but where net settlement is not intended to occur, together with a corresponding rise in current accounts, as noted below. In addition, there was an increase from our Capital Financing business. Lending in North America was broadly unchanged, as growth in balances with CMB and GB&M customers was offset by a decline in RBWM, reflecting the continued reduction in the US run-off portfolio and the transfer to ‘Assets held for sale’ of US first lien mortgage balances.
Assets held for sale increased by US$6.2bn driven by the transfer of balances relating to the UK Pension business of HSBC Life (UK) Limited, and the transfer of US first lien mortgage balances.
Liabilities
Customer accounts increased by US$38bn or 3% notably in Asia and Europe. In Asia, customer account balances increased, reflecting growth in our Payments and Cash Management business in GB&M and CMB together with a rise in RBWM, in part reflecting new Premier customers. In Europe, balances increased in RBWM reflecting customers’ continued preference for holding balances in current and savings accounts. In addition, current accounts grew mainly in GB&M, in line with the increase in corporate overdraft balances as noted above in ‘Loans and advances to customers’, and in part from growth in Payments and Cash Management.
Trading liabilities rose by 9%, notably in Europe where an increase in settlement accounts reflected client activity levels, and in Asia, where there were increased positions, partly offset by a reduction in repurchase agreements held for trading.
Financial liabilities designated at fair value reduced by 8%, mainly in Europe from the transfer to ‘Liabilities held for sale’ of balances relating to the UK Pension business of HSBC Life (UK) Limited.
The reduction in derivative liabilities was in line with that of ‘Derivative assets’ as the underlying risk is broadly matched.
Debt securities in issue decreased by 9%, mainly in Europe driven by maturing debt that was not replaced.
Liabilities for disposal groups held for sale increased by US$9.5bn, mainly from the transfer of balances relating to the UK Pension business of HSBC Life (UK) Limited.
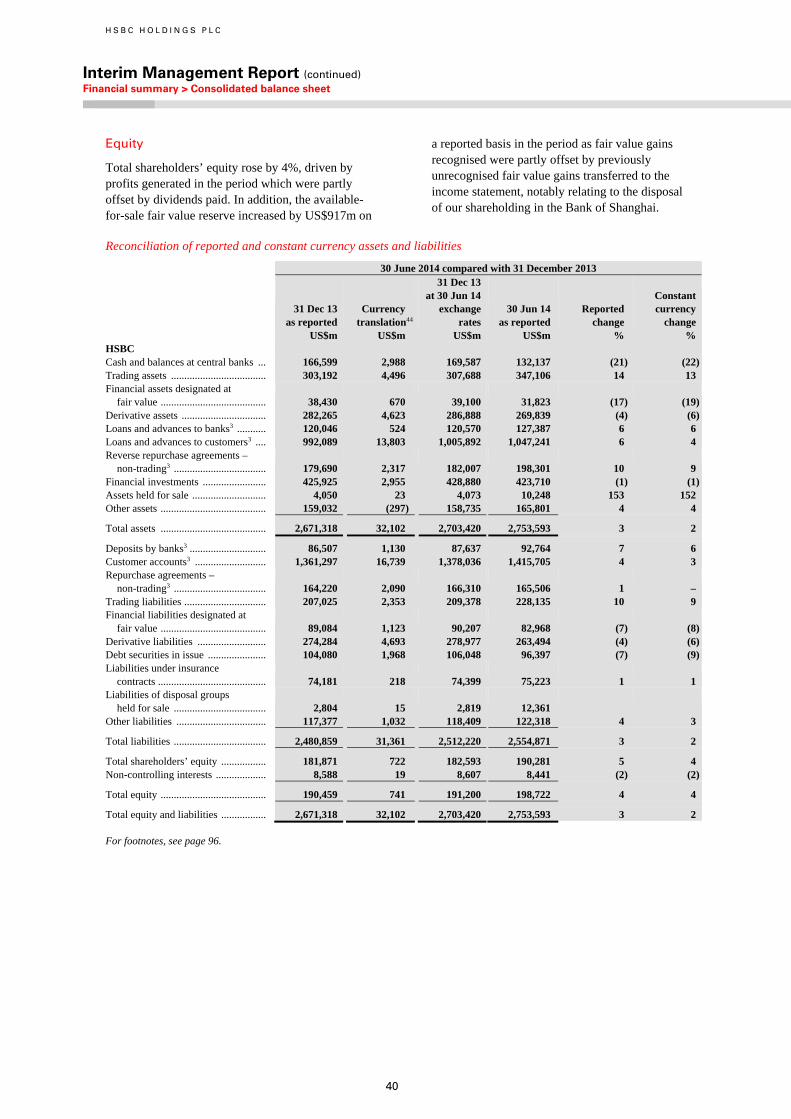
H S B C H O L D I N G S P L C
Interim Management Report (continued) Financial summary > Consolidated balance sheet
40
Equity
Total shareholders’ equity rose by 4%, driven by profits generated in the period which were partly offset by dividends paid. In addition, the available-for-sale fair value reserve increased by US$917m on
a reported basis in the period as fair value gains recognised were partly offset by previously unrecognised fair value gains transferred to the income statement, notably relating to the disposal of our shareholding in the Bank of Shanghai.
Reconciliation of reported and constant currency assets and liabilities
30 June 2014 compared with 31 December 2013
31 Dec 13 as reported US$m
Currency translation44
US$m
31 Dec 13 at 30 Jun 14 exchange rates US$m
30 Jun 14 as reported US$m
Reported change %
Constant currency change %
HSBC Cash and balances at central banks ... 166,599 2,988 169,587 132,137 (21) (22)Trading assets .................................... 303,192 4,496 307,688 347,106 14 13 Financial assets designated at
fair value ........................................ 38,430 670 39,100 31,823 (17) (19)Derivative assets ................................ 282,265 4,623 286,888 269,839 (4) (6)Loans and advances to banks3 ........... 120,046 524 120,570 127,387 6 6 Loans and advances to customers3 .... 992,089 13,803 1,005,892 1,047,241 6 4 Reverse repurchase agreements –
non-trading3 ................................... 179,690 2,317 182,007 198,301 10 9 Financial investments ........................ 425,925 2,955 428,880 423,710 (1) (1)Assets held for sale ............................ 4,050 23 4,073 10,248 153 152 Other assets ........................................ 159,032 (297) 158,735 165,801 4 4
Total assets ........................................ 2,671,318 32,102 2,703,420 2,753,593 3 2
Deposits by banks3 ............................. 86,507 1,130 87,637 92,764 7 6 Customer accounts3 ........................... 1,361,297 16,739 1,378,036 1,415,705 4 3 Repurchase agreements –
non-trading3 ................................... 164,220 2,090 166,310 165,506 1 – Trading liabilities ............................... 207,025 2,353 209,378 228,135 10 9 Financial liabilities designated at
fair value ........................................ 89,084 1,123 90,207 82,968 (7) (8)Derivative liabilities .......................... 274,284 4,693 278,977 263,494 (4) (6)Debt securities in issue ...................... 104,080 1,968 106,048 96,397 (7) (9)Liabilities under insurance
contracts ......................................... 74,181 218 74,399 75,223 1 1 Liabilities of disposal groups
held for sale ................................... 2,804 15 2,819 12,361 Other liabilities .................................. 117,377 1,032 118,409 122,318 4 3
Total liabilities ................................... 2,480,859 31,361 2,512,220 2,554,871 3 2
Total shareholders’ equity ................. 181,871 722 182,593 190,281 5 4 Non-controlling interests ................... 8,588 19 8,607 8,441 (2) (2)
Total equity ........................................ 190,459 741 191,200 198,722 4 4
Total equity and liabilities ................. 2,671,318 32,102 2,703,420 2,753,593 3 2
For footnotes, see page 96.
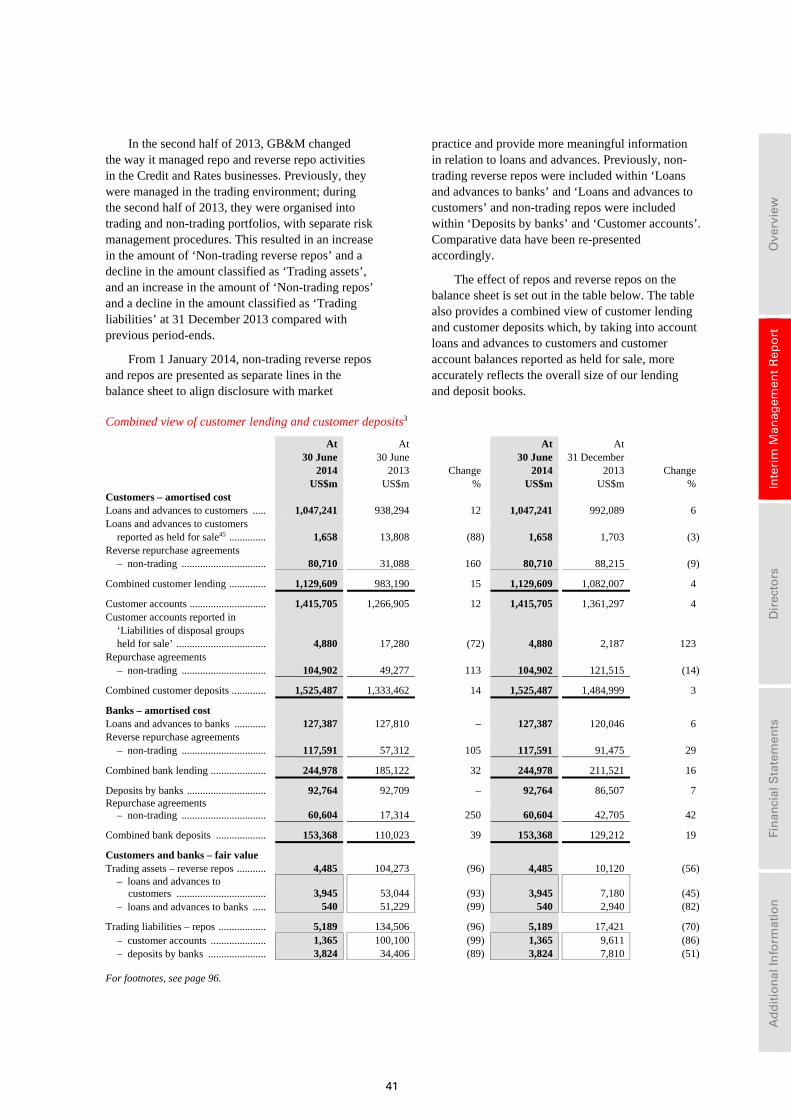
41
Ove
rvie
w
In
teri
m M
anag
emen
t R
epo
rt
D
irec
tors
Fin
anci
al S
tate
men
ts
A
dd
itio
nal
Info
rmat
ion
In the second half of 2013, GB&M changed the way it managed repo and reverse repo activities in the Credit and Rates businesses. Previously, they were managed in the trading environment; during the second half of 2013, they were organised into trading and non-trading portfolios, with separate risk management procedures. This resulted in an increase in the amount of ‘Non-trading reverse repos’ and a decline in the amount classified as ‘Trading assets’, and an increase in the amount of ‘Non-trading repos’ and a decline in the amount classified as ‘Trading liabilities’ at 31 December 2013 compared with previous period-ends.
From 1 January 2014, non-trading reverse repos and repos are presented as separate lines in the balance sheet to align disclosure with market
practice and provide more meaningful information in relation to loans and advances. Previously, non-trading reverse repos were included within ‘Loans and advances to banks’ and ‘Loans and advances to customers’ and non-trading repos were included within ‘Deposits by banks’ and ‘Customer accounts’. Comparative data have been re-presented accordingly.
The effect of repos and reverse repos on the balance sheet is set out in the table below. The table also provides a combined view of customer lending and customer deposits which, by taking into account loans and advances to customers and customer account balances reported as held for sale, more accurately reflects the overall size of our lending and deposit books.
Combined view of customer lending and customer deposits3
At 30 June 2014
At 30 June 2013 Change
At 30 June 2014
At31 December
2013 Change US$m US$m % US$m US$m %
Customers – amortised cost Loans and advances to customers ..... 1,047,241 938,294 12 1,047,241 992,089 6 Loans and advances to customers
reported as held for sale45 .............. 1,658 13,808 (88) 1,658 1,703 (3)Reverse repurchase agreements
– non-trading ................................ 80,710 31,088 160 80,710 88,215 (9)
Combined customer lending .............. 1,129,609 983,190 15 1,129,609 1,082,007 4
Customer accounts ............................. 1,415,705 1,266,905 12 1,415,705 1,361,297 4 Customer accounts reported in
‘Liabilities of disposal groups held for sale’ .................................. 4,880 17,280 (72) 4,880 2,187 123
Repurchase agreements – non-trading ................................ 104,902 49,277 113 104,902 121,515 (14)
Combined customer deposits ............. 1,525,487 1,333,462 14 1,525,487 1,484,999 3
Banks – amortised cost Loans and advances to banks ............ 127,387 127,810 – 127,387 120,046 6 Reverse repurchase agreements
– non-trading ................................ 117,591 57,312 105 117,591 91,475 29
Combined bank lending ..................... 244,978 185,122 32 244,978 211,521 16
Deposits by banks .............................. 92,764 92,709 – 92,764 86,507 7 Repurchase agreements
– non-trading ................................ 60,604 17,314 250 60,604 42,705 42
Combined bank deposits ................... 153,368 110,023 39 153,368 129,212 19
Customers and banks – fair value Trading assets – reverse repos ........... 4,485 104,273 (96) 4,485 10,120 (56)
– loans and advances to customers .................................. 3,945 53,044 (93) 3,945 7,180 (45)
– loans and advances to banks ..... 540 51,229 (99) 540 2,940 (82)
Trading liabilities – repos .................. 5,189 134,506 (96) 5,189 17,421 (70)– customer accounts ..................... 1,365 100,100 (99) 1,365 9,611 (86)– deposits by banks ...................... 3,824 34,406 (89) 3,824 7,810 (51)
For footnotes, see page 96.
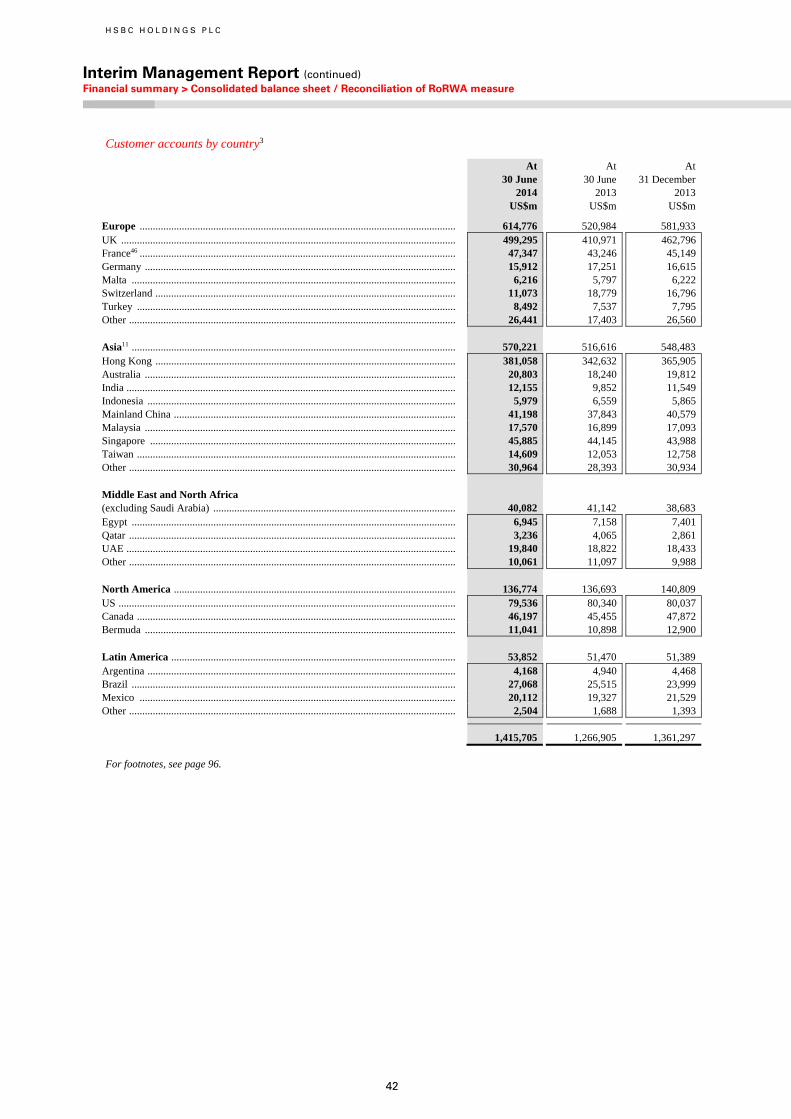
H S B C H O L D I N G S P L C
Interim Management Report (continued) Financial summary > Consolidated balance sheet / Reconciliation of RoRWA measure
42
Customer accounts by country3
At 30 June
2014US$m
At 30 June
2013 US$m
At 31 December
2013 US$m
Europe ........................................................................................................................ 614,776 520,984 581,933 UK ............................................................................................................................... 499,295 410,971 462,796 France46 ........................................................................................................................ 47,347 43,246 45,149 Germany ...................................................................................................................... 15,912 17,251 16,615 Malta ........................................................................................................................... 6,216 5,797 6,222 Switzerland .................................................................................................................. 11,073 18,779 16,796 Turkey ......................................................................................................................... 8,492 7,537 7,795 Other ............................................................................................................................ 26,441 17,403 26,560 Asia11 ........................................................................................................................... 570,221 516,616 548,483 Hong Kong .................................................................................................................. 381,058 342,632 365,905 Australia ...................................................................................................................... 20,803 18,240 19,812 India ............................................................................................................................. 12,155 9,852 11,549 Indonesia ..................................................................................................................... 5,979 6,559 5,865 Mainland China ........................................................................................................... 41,198 37,843 40,579 Malaysia ...................................................................................................................... 17,570 16,899 17,093 Singapore .................................................................................................................... 45,885 44,145 43,988 Taiwan ......................................................................................................................... 14,609 12,053 12,758 Other ............................................................................................................................ 30,964 28,393 30,934 Middle East and North Africa (excluding Saudi Arabia) ............................................................................................ 40,082 41,142 38,683 Egypt ........................................................................................................................... 6,945 7,158 7,401 Qatar ............................................................................................................................ 3,236 4,065 2,861 UAE ............................................................................................................................. 19,840 18,822 18,433 Other ............................................................................................................................ 10,061 11,097 9,988 North America ........................................................................................................... 136,774 136,693 140,809 US ................................................................................................................................ 79,536 80,340 80,037 Canada ......................................................................................................................... 46,197 45,455 47,872 Bermuda ...................................................................................................................... 11,041 10,898 12,900 Latin America ............................................................................................................ 53,852 51,470 51,389 Argentina ..................................................................................................................... 4,168 4,940 4,468 Brazil ........................................................................................................................... 27,068 25,515 23,999 Mexico ........................................................................................................................ 20,112 19,327 21,529 Other ............................................................................................................................ 2,504 1,688 1,393
1,415,705 1,266,905 1,361,297
For footnotes, see page 96.
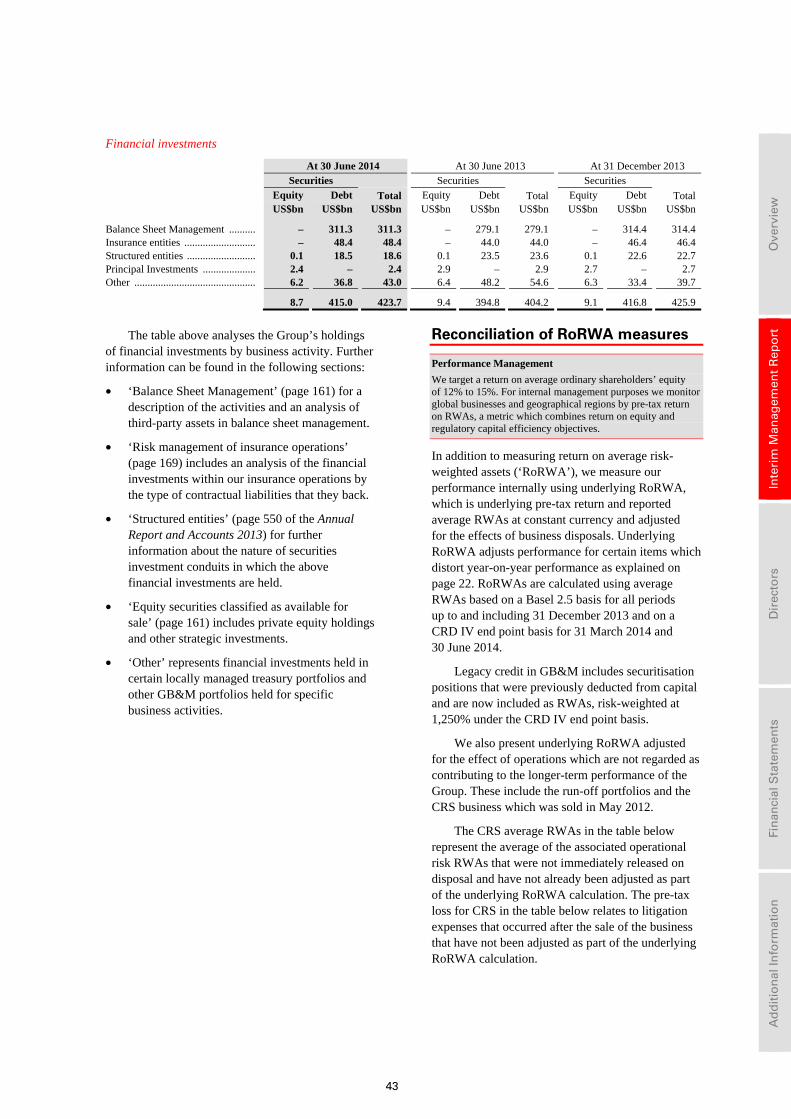
43
Ove
rvie
w
In
teri
m M
anag
emen
t R
epo
rt
D
irec
tors
Fin
anci
al S
tate
men
ts
A
dd
itio
nal
Info
rmat
ion
Financial investments
At 30 June 2014 At 30 June 2013 At 31 December 2013
Securities Securities Securities Equity Debt Total Equity Debt Total Equity Debt Total
US$bn US$bn US$bn US$bn US$bn US$bn US$bn US$bn US$bn
Balance Sheet Management .......... – 311.3 311.3 – 279.1 279.1 – 314.4 314.4 Insurance entities ........................... – 48.4 48.4 – 44.0 44.0 – 46.4 46.4 Structured entities .......................... 0.1 18.5 18.6 0.1 23.5 23.6 0.1 22.6 22.7 Principal Investments .................... 2.4 – 2.4 2.9 – 2.9 2.7 – 2.7 Other .............................................. 6.2 36.8 43.0 6.4 48.2 54.6 6.3 33.4 39.7
8.7 415.0 423.7 9.4 394.8 404.2 9.1 416.8 425.9
The table above analyses the Group’s holdings of financial investments by business activity. Further information can be found in the following sections:
• ‘Balance Sheet Management’ (page 161) for a description of the activities and an analysis of third-party assets in balance sheet management.
• ‘Risk management of insurance operations’ (page 169) includes an analysis of the financial investments within our insurance operations by the type of contractual liabilities that they back.
• ‘Structured entities’ (page 550 of the Annual Report and Accounts 2013) for further information about the nature of securities investment conduits in which the above financial investments are held.
• ‘Equity securities classified as available for sale’ (page 161) includes private equity holdings and other strategic investments.
• ‘Other’ represents financial investments held in certain locally managed treasury portfolios and other GB&M portfolios held for specific business activities.
Reconciliation of RoRWA measures
Performance Management
We target a return on average ordinary shareholders’ equity of 12% to 15%. For internal management purposes we monitor global businesses and geographical regions by pre-tax return on RWAs, a metric which combines return on equity and regulatory capital efficiency objectives.
In addition to measuring return on average risk- weighted assets (‘RoRWA’), we measure our performance internally using underlying RoRWA, which is underlying pre-tax return and reported average RWAs at constant currency and adjusted for the effects of business disposals. Underlying RoRWA adjusts performance for certain items which distort year-on-year performance as explained on page 22. RoRWAs are calculated using average RWAs based on a Basel 2.5 basis for all periods up to and including 31 December 2013 and on a CRD IV end point basis for 31 March 2014 and 30 June 2014.
Legacy credit in GB&M includes securitisation positions that were previously deducted from capital and are now included as RWAs, risk-weighted at 1,250% under the CRD IV end point basis.
We also present underlying RoRWA adjusted for the effect of operations which are not regarded as contributing to the longer-term performance of the Group. These include the run-off portfolios and the CRS business which was sold in May 2012.
The CRS average RWAs in the table below represent the average of the associated operational risk RWAs that were not immediately released on disposal and have not already been adjusted as part of the underlying RoRWA calculation. The pre-tax loss for CRS in the table below relates to litigation expenses that occurred after the sale of the business that have not been adjusted as part of the underlying RoRWA calculation.
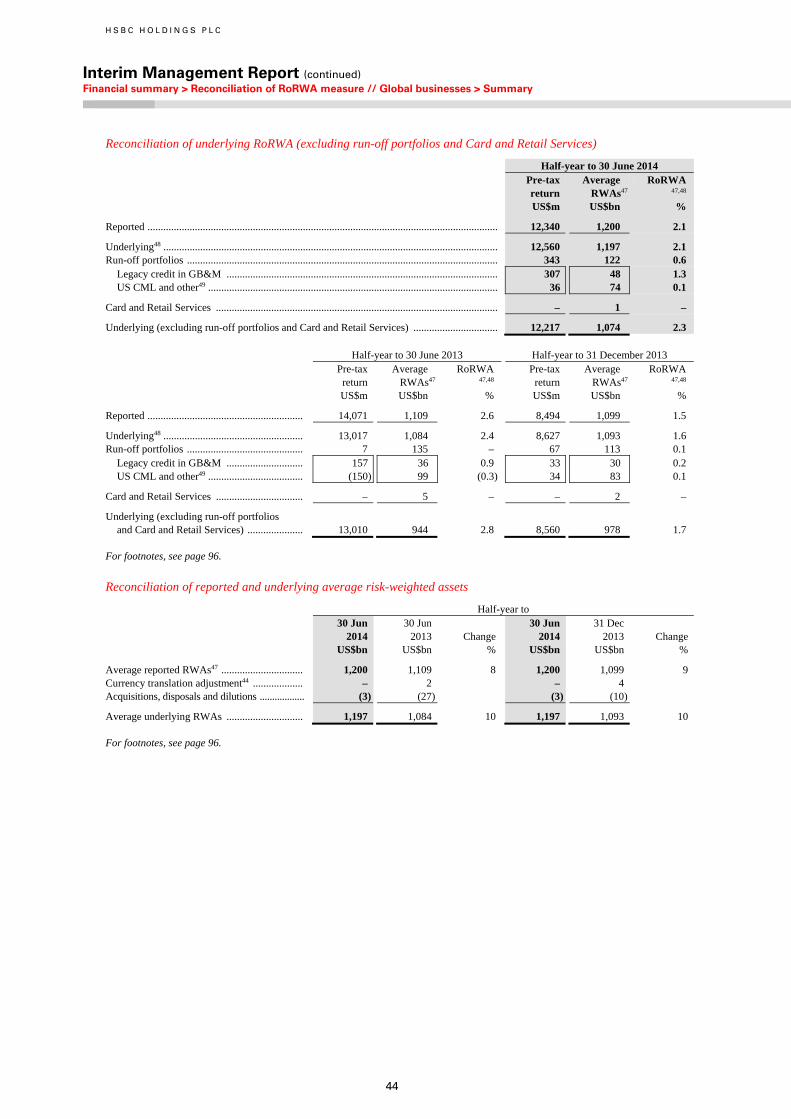
H S B C H O L D I N G S P L C
Interim Management Report (continued) Financial summary > Reconciliation of RoRWA measure // Global businesses > Summary
44
Reconciliation of underlying RoRWA (excluding run-off portfolios and Card and Retail Services)
Half-year to 30 June 2014 Pre-tax
return Average RWAs47
RoRWA 47,48
US$m US$bn %
Reported ..................................................................................................................................... 12,340 1,200 2.1
Underlying48 ............................................................................................................................... 12,560 1,197 2.1 Run-off portfolios ...................................................................................................................... 343 122 0.6
Legacy credit in GB&M ....................................................................................................... 307 48 1.3 US CML and other49 .............................................................................................................. 36 74 0.1
Card and Retail Services ........................................................................................................... – 1 –
Underlying (excluding run-off portfolios and Card and Retail Services) ................................ 12,217 1,074 2.3 Half-year to 30 June 2013 Half-year to 31 December 2013 Pre-tax
return Average RWAs47
RoRWA 47,48
Pre-tax return
Average RWAs47
RoRWA 47,48
US$m US$bn % US$m US$bn %
Reported ........................................................... 14,071 1,109 2.6 8,494 1,099 1.5
Underlying48 ..................................................... 13,017 1,084 2.4 8,627 1,093 1.6 Run-off portfolios ............................................ 7 135 – 67 113 0.1
Legacy credit in GB&M ............................. 157 36 0.9 33 30 0.2 US CML and other49 .................................... (150) 99 (0.3) 34 83 0.1
Card and Retail Services ................................. – 5 – – 2 –
Underlying (excluding run-off portfolios and Card and Retail Services) ..................... 13,010 944 2.8 8,560 978 1.7
For footnotes, see page 96.
Reconciliation of reported and underlying average risk-weighted assets
Half-year to
30 Jun 2014
30 Jun 2013 Change
30 Jun 2014
31 Dec 2013 Change
US$bn US$bn % US$bn US$bn %
Average reported RWAs47 ............................... 1,200 1,109 8 1,200 1,099 9 Currency translation adjustment44 ................... – 2 – 4 Acquisitions, disposals and dilutions .................. (3) (27) (3) (10)
Average underlying RWAs ............................. 1,197 1,084 10 1,197 1,093 10
For footnotes, see page 96.
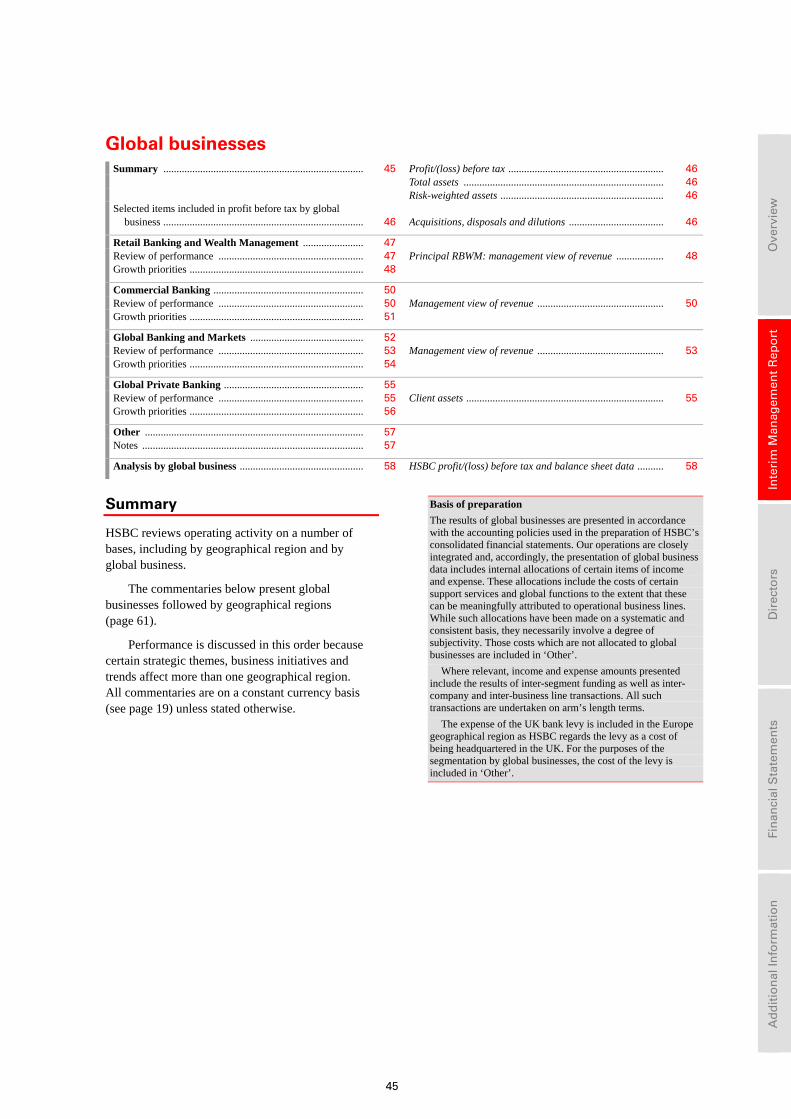
45
Ove
rvie
w
In
teri
m M
anag
emen
t R
epo
rt
D
irec
tors
Fin
anci
al S
tate
men
ts
A
dd
itio
nal
Info
rmat
ion
Global businesses Summary ............................................................................ 45 Profit/(loss) before tax ........................................................... 46 Total assets ............................................................................ 46 Risk-weighted assets .............................................................. 46Selected items included in profit before tax by global
business ............................................................................ 46 Acquisitions, disposals and dilutions .................................... 46
Retail Banking and Wealth Management ....................... 47 Review of performance ....................................................... 47 Principal RBWM: management view of revenue .................. 48Growth priorities .................................................................. 48
Commercial Banking ......................................................... 50 Review of performance ....................................................... 50 Management view of revenue ................................................ 50Growth priorities .................................................................. 51
Global Banking and Markets ........................................... 52 Review of performance ....................................................... 53 Management view of revenue ................................................ 53Growth priorities .................................................................. 54
Global Private Banking ..................................................... 55 Review of performance ....................................................... 55 Client assets ........................................................................... 55Growth priorities .................................................................. 56
Other ................................................................................... 57 Notes .................................................................................... 57
Analysis by global business ............................................... 58 HSBC profit/(loss) before tax and balance sheet data .......... 58
Summary
HSBC reviews operating activity on a number of bases, including by geographical region and by global business.
The commentaries below present global businesses followed by geographical regions (page 61).
Performance is discussed in this order because certain strategic themes, business initiatives and trends affect more than one geographical region. All commentaries are on a constant currency basis (see page 19) unless stated otherwise.
Basis of preparation
The results of global businesses are presented in accordance with the accounting policies used in the preparation of HSBC’s consolidated financial statements. Our operations are closely integrated and, accordingly, the presentation of global business data includes internal allocations of certain items of income and expense. These allocations include the costs of certain support services and global functions to the extent that these can be meaningfully attributed to operational business lines. While such allocations have been made on a systematic and consistent basis, they necessarily involve a degree of subjectivity. Those costs which are not allocated to global businesses are included in ‘Other’.
Where relevant, income and expense amounts presented include the results of inter-segment funding as well as inter-company and inter-business line transactions. All such transactions are undertaken on arm’s length terms.
The expense of the UK bank levy is included in the Europe geographical region as HSBC regards the levy as a cost of being headquartered in the UK. For the purposes of the segmentation by global businesses, the cost of the levy is included in ‘Other’.
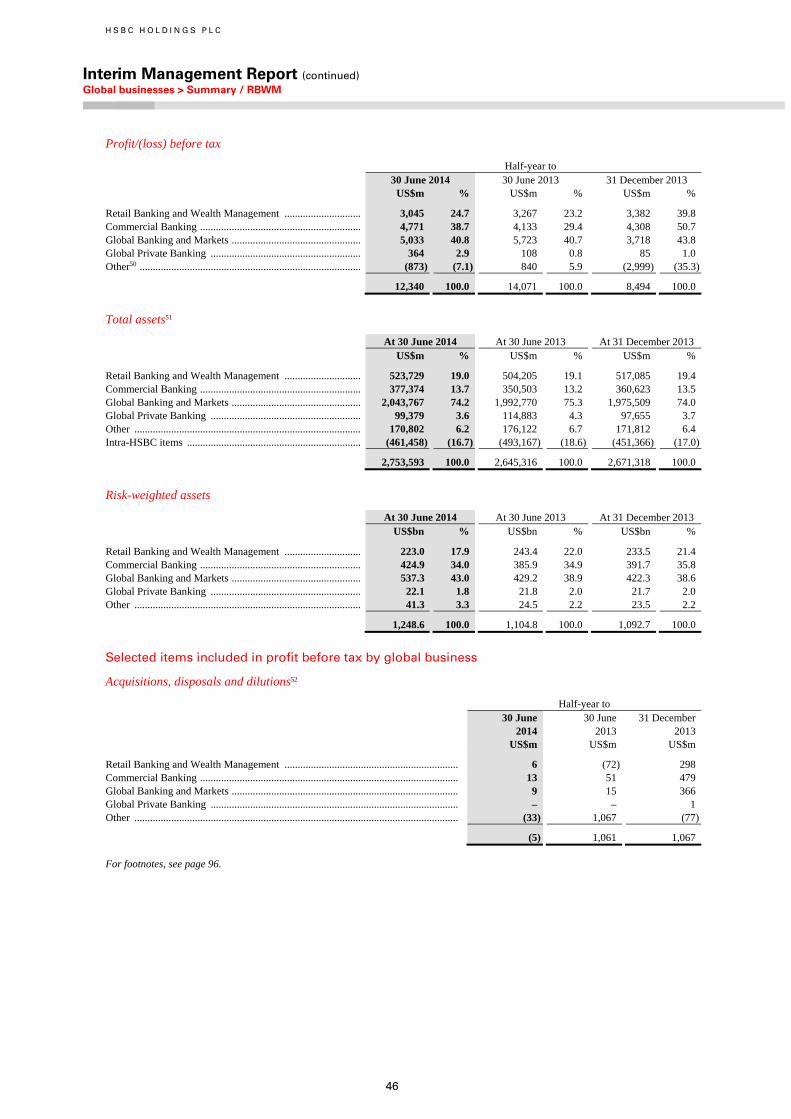
H S B C H O L D I N G S P L C
Interim Management Report (continued) Global businesses > Summary / RBWM
46
Profit/(loss) before tax
Half-year to 30 June 2014 30 June 2013 31 December 2013 US$m % US$m % US$m %
Retail Banking and Wealth Management ............................. 3,045 24.7 3,267 23.2 3,382 39.8 Commercial Banking ............................................................. 4,771 38.7 4,133 29.4 4,308 50.7 Global Banking and Markets ................................................. 5,033 40.8 5,723 40.7 3,718 43.8 Global Private Banking ......................................................... 364 2.9 108 0.8 85 1.0 Other50 .................................................................................... (873) (7.1) 840 5.9 (2,999) (35.3)
12,340 100.0 14,071 100.0 8,494 100.0
Total assets51
At 30 June 2014 At 30 June 2013 At 31 December 2013 US$m % US$m % US$m %
Retail Banking and Wealth Management ............................. 523,729 19.0 504,205 19.1 517,085 19.4 Commercial Banking ............................................................. 377,374 13.7 350,503 13.2 360,623 13.5 Global Banking and Markets ................................................. 2,043,767 74.2 1,992,770 75.3 1,975,509 74.0 Global Private Banking ......................................................... 99,379 3.6 114,883 4.3 97,655 3.7 Other ...................................................................................... 170,802 6.2 176,122 6.7 171,812 6.4 Intra-HSBC items .................................................................. (461,458) (16.7) (493,167) (18.6) (451,366) (17.0)
2,753,593 100.0 2,645,316 100.0 2,671,318 100.0
Risk-weighted assets
At 30 June 2014 At 30 June 2013 At 31 December 2013 US$bn % US$bn % US$bn %
Retail Banking and Wealth Management ............................. 223.0 17.9 243.4 22.0 233.5 21.4 Commercial Banking ............................................................. 424.9 34.0 385.9 34.9 391.7 35.8 Global Banking and Markets ................................................. 537.3 43.0 429.2 38.9 422.3 38.6 Global Private Banking ......................................................... 22.1 1.8 21.8 2.0 21.7 2.0 Other ...................................................................................... 41.3 3.3 24.5 2.2 23.5 2.2
1,248.6 100.0 1,104.8 100.0 1,092.7 100.0
Selected items included in profit before tax by global business
Acquisitions, disposals and dilutions52
Half-year to 30 June 30 June 31 December 2014 2013 2013 US$m US$m US$m
Retail Banking and Wealth Management .................................................................. 6 (72) 298 Commercial Banking .................................................................................................. 13 51 479 Global Banking and Markets ...................................................................................... 9 15 366 Global Private Banking .............................................................................................. – – 1 Other ........................................................................................................................... (33) 1,067 (77)
(5) 1,061 1,067
For footnotes, see page 96.
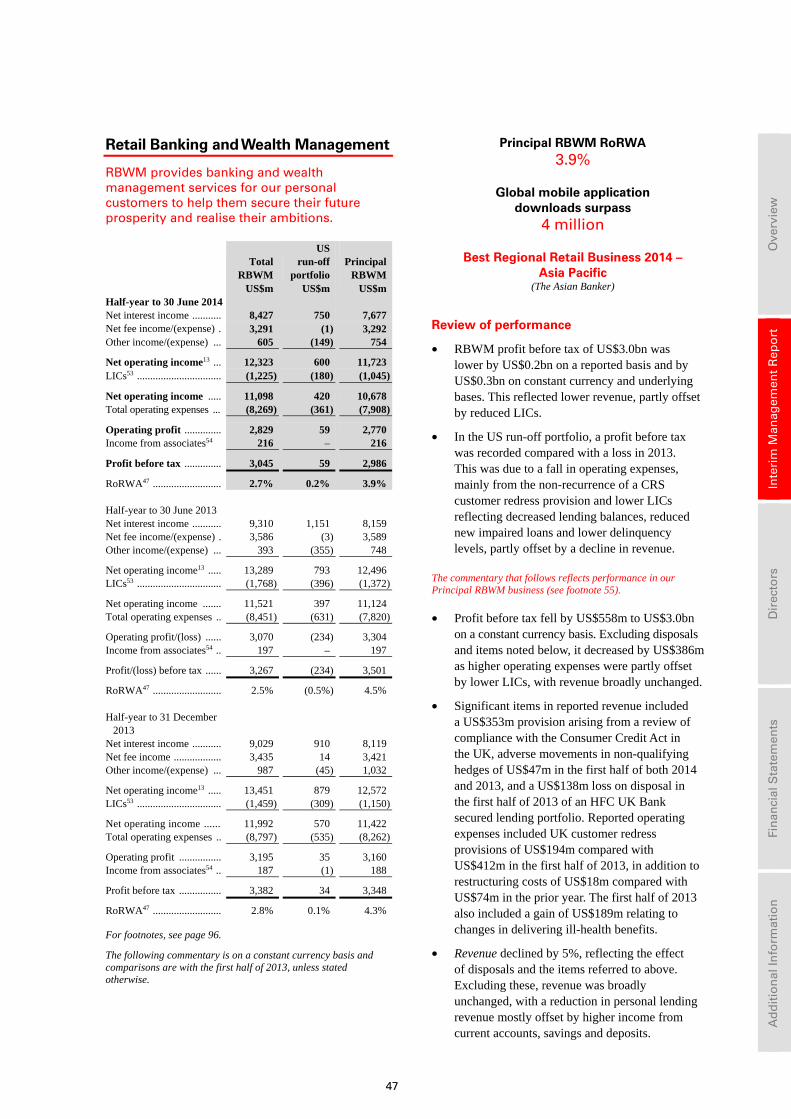
47
Ove
rvie
w
In
teri
m M
anag
emen
t R
epo
rt
D
irec
tors
Fin
anci
al S
tate
men
ts
A
dd
itio
nal
Info
rmat
ion
Retail Banking and Wealth Management
RBWM provides banking and wealth management services for our personal customers to help them secure their future prosperity and realise their ambitions.
Total
RBWM
USrun-off
portfolio Principal
RBWM US$m US$m US$m Half-year to 30 June 2014 Net interest income ........... 8,427 750 7,677 Net fee income/(expense) . 3,291 (1) 3,292 Other income/(expense) ... 605 (149) 754
Net operating income13 ... 12,323 600 11,723 LICs53 ................................ (1,225) (180) (1,045)
Net operating income ..... 11,098 420 10,678 Total operating expenses ... (8,269) (361) (7,908)
Operating profit .............. 2,829 59 2,770 Income from associates54 216 – 216
Profit before tax .............. 3,045 59 2,986
RoRWA47 .......................... 2.7% 0.2% 3.9% Half-year to 30 June 2013 Net interest income ........... 9,310 1,151 8,159 Net fee income/(expense) . 3,586 (3) 3,589 Other income/(expense) ... 393 (355) 748
Net operating income13 ..... 13,289 793 12,496 LICs53 ................................ (1,768) (396) (1,372)
Net operating income ....... 11,521 397 11,124 Total operating expenses .. (8,451) (631) (7,820)
Operating profit/(loss) ...... 3,070 (234) 3,304 Income from associates54 .. 197 – 197
Profit/(loss) before tax ...... 3,267 (234) 3,501
RoRWA47 .......................... 2.5% (0.5%) 4.5% Half-year to 31 December
2013 Net interest income ........... 9,029 910 8,119 Net fee income .................. 3,435 14 3,421 Other income/(expense) ... 987 (45) 1,032
Net operating income13 ..... 13,451 879 12,572 LICs53 ................................ (1,459) (309) (1,150)
Net operating income ...... 11,992 570 11,422 Total operating expenses .. (8,797) (535) (8,262)
Operating profit ................ 3,195 35 3,160 Income from associates54 .. 187 (1) 188
Profit before tax ................ 3,382 34 3,348
RoRWA47 .......................... 2.8% 0.1% 4.3%
For footnotes, see page 96.
The following commentary is on a constant currency basis and comparisons are with the first half of 2013, unless stated otherwise.
Principal RBWM RoRWA 3.9%
Global mobile application downloads surpass
4 million
Best Regional Retail Business 2014 – Asia Pacific
(The Asian Banker)
Review of performance
• RBWM profit before tax of US$3.0bn was lower by US$0.2bn on a reported basis and by US$0.3bn on constant currency and underlying bases. This reflected lower revenue, partly offset by reduced LICs.
• In the US run-off portfolio, a profit before tax was recorded compared with a loss in 2013. This was due to a fall in operating expenses, mainly from the non-recurrence of a CRS customer redress provision and lower LICs reflecting decreased lending balances, reduced new impaired loans and lower delinquency levels, partly offset by a decline in revenue.
The commentary that follows reflects performance in our Principal RBWM business (see footnote 55).
• Profit before tax fell by US$558m to US$3.0bn on a constant currency basis. Excluding disposals and items noted below, it decreased by US$386m as higher operating expenses were partly offset by lower LICs, with revenue broadly unchanged.
• Significant items in reported revenue included a US$353m provision arising from a review of compliance with the Consumer Credit Act in the UK, adverse movements in non-qualifying hedges of US$47m in the first half of both 2014 and 2013, and a US$138m loss on disposal in the first half of 2013 of an HFC UK Bank secured lending portfolio. Reported operating expenses included UK customer redress provisions of US$194m compared with US$412m in the first half of 2013, in addition to restructuring costs of US$18m compared with US$74m in the prior year. The first half of 2013 also included a gain of US$189m relating to changes in delivering ill-health benefits.
• Revenue declined by 5%, reflecting the effect of disposals and the items referred to above. Excluding these, revenue was broadly unchanged, with a reduction in personal lending revenue mostly offset by higher income from current accounts, savings and deposits.
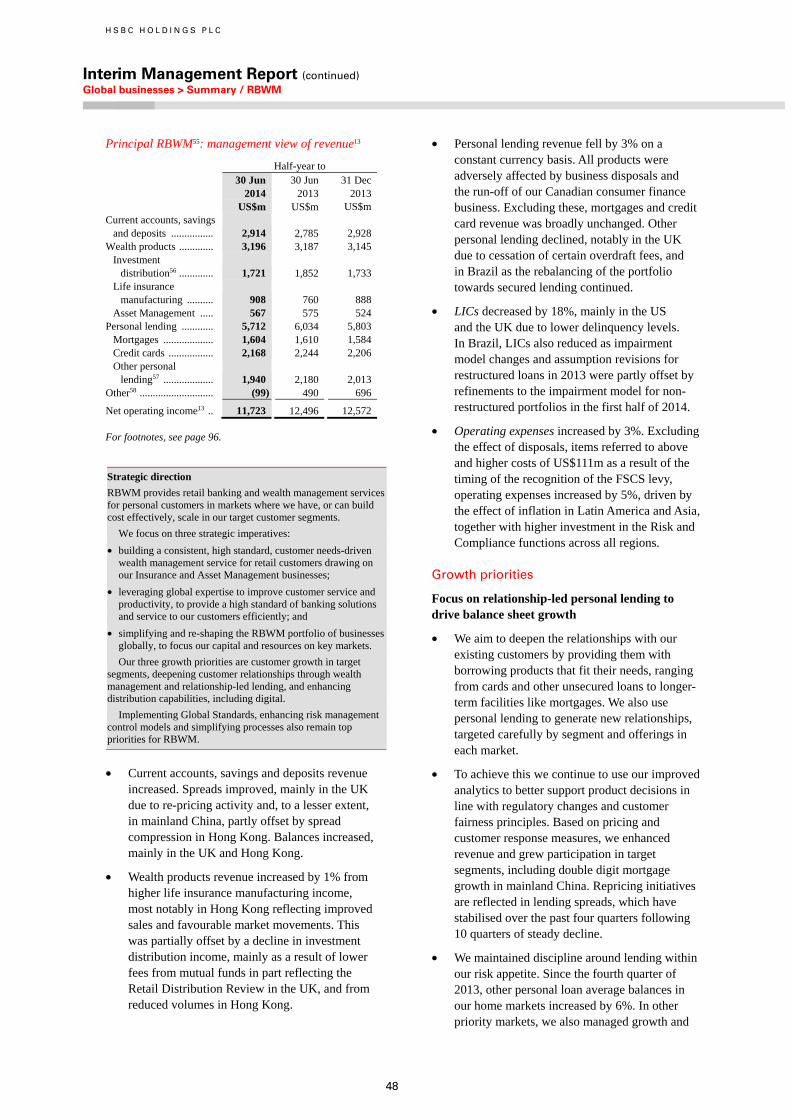
H S B C H O L D I N G S P L C
Interim Management Report (continued) Global businesses > Summary / RBWM
48
Principal RBWM55: management view of revenue13
Half-year to 30 Jun 30 Jun 31 Dec 2014 2013 2013 US$m US$m US$m Current accounts, savings
and deposits ................ 2,914 2,785 2,928 Wealth products ............. 3,196 3,187 3,145
Investment distribution56 ............. 1,721 1,852 1,733
Life insurance manufacturing .......... 908 760 888
Asset Management ..... 567 575 524 Personal lending ............ 5,712 6,034 5,803
Mortgages ................... 1,604 1,610 1,584 Credit cards ................. 2,168 2,244 2,206 Other personal
lending57 ................... 1,940 2,180 2,013 Other58 ............................ (99) 490 696
Net operating income13 .. 11,723 12,496 12,572
For footnotes, see page 96.
Strategic direction
RBWM provides retail banking and wealth management services for personal customers in markets where we have, or can build cost effectively, scale in our target customer segments.
We focus on three strategic imperatives:
• building a consistent, high standard, customer needs-driven wealth management service for retail customers drawing on our Insurance and Asset Management businesses;
• leveraging global expertise to improve customer service and productivity, to provide a high standard of banking solutions and service to our customers efficiently; and
• simplifying and re-shaping the RBWM portfolio of businesses globally, to focus our capital and resources on key markets.
Our three growth priorities are customer growth in target segments, deepening customer relationships through wealth management and relationship-led lending, and enhancing distribution capabilities, including digital.
Implementing Global Standards, enhancing risk management control models and simplifying processes also remain top priorities for RBWM.
• Current accounts, savings and deposits revenue
increased. Spreads improved, mainly in the UK due to re-pricing activity and, to a lesser extent, in mainland China, partly offset by spread compression in Hong Kong. Balances increased, mainly in the UK and Hong Kong.
• Wealth products revenue increased by 1% from higher life insurance manufacturing income, most notably in Hong Kong reflecting improved sales and favourable market movements. This was partially offset by a decline in investment distribution income, mainly as a result of lower fees from mutual funds in part reflecting the Retail Distribution Review in the UK, and from reduced volumes in Hong Kong.
• Personal lending revenue fell by 3% on a constant currency basis. All products were adversely affected by business disposals and the run-off of our Canadian consumer finance business. Excluding these, mortgages and credit card revenue was broadly unchanged. Other personal lending declined, notably in the UK due to cessation of certain overdraft fees, and in Brazil as the rebalancing of the portfolio towards secured lending continued.
• LICs decreased by 18%, mainly in the US and the UK due to lower delinquency levels. In Brazil, LICs also reduced as impairment model changes and assumption revisions for restructured loans in 2013 were partly offset by refinements to the impairment model for non-restructured portfolios in the first half of 2014.
• Operating expenses increased by 3%. Excluding the effect of disposals, items referred to above and higher costs of US$111m as a result of the timing of the recognition of the FSCS levy, operating expenses increased by 5%, driven by the effect of inflation in Latin America and Asia, together with higher investment in the Risk and Compliance functions across all regions.
Growth priorities
Focus on relationship-led personal lending to drive balance sheet growth
• We aim to deepen the relationships with our existing customers by providing them with borrowing products that fit their needs, ranging from cards and other unsecured loans to longer-term facilities like mortgages. We also use personal lending to generate new relationships, targeted carefully by segment and offerings in each market.
• To achieve this we continue to use our improved analytics to better support product decisions in line with regulatory changes and customer fairness principles. Based on pricing and customer response measures, we enhanced revenue and grew participation in target segments, including double digit mortgage growth in mainland China. Repricing initiatives are reflected in lending spreads, which have stabilised over the past four quarters following 10 quarters of steady decline.
• We maintained discipline around lending within our risk appetite. Since the fourth quarter of 2013, other personal loan average balances in our home markets increased by 6%. In other priority markets, we also managed growth and
49
Ove
rvie
w
In
teri
m M
anag
emen
t R
epo
rt
D
irec
tors
Fin
anci
al S
tate
men
ts
A
dd
itio
nal
Info
rmat
ion
rebalanced portfolios towards secured loans, increasing mortgage average balances by 2%. This was achieved with lower LICs in the first half of 2014 than in the second half of 2013.
• In January 2014, we introduced a new discretionary incentive framework for our Retail Banking front-line staff. Similar to the framework launched for Wealth Management relationship managers (‘RM’s) in 2013, this new plan removes the formulaic link between product sales and variable pay for a further 50,000 front-line staff. Implementation contributed to a slowdown in revenue growth, though we expect it to enhance the quality of revenue ultimately. Customer recommendation levels improved in several markets in the first half of 2014, with the volume of complaints related to products and services decreasing by more than 10% globally compared with the second half of 2013.
Continue to develop Wealth Management with focus on growing customer balances
• We remain committed to capturing opportunities from wealth creation, primarily through our Premier offering. Our approach has been informed by the emerging conduct risk agenda, and we have taken proactive measures, including the implementation of our Wealth incentive framework, to reposition the business.
• We continued to invest in our Premier offering and delivered new platforms and digital capabilities to enhance the end-to-end delivery process and customer experience. In addition, we improved RM productivity through new training programmes and development tools. Client contact and coverage rates increased since the beginning of the year with higher numbers of client appointments, financial reviews and needs fulfilled per RM.
Develop digital capabilities to support customers and reduce cost
• At June 2014, worldwide downloads of our global mobile application, now with enriched functionality, reached 4.3m with almost 2m in the first half of the year.
• The migration of customers to digital channels continued to progress. In the UK, we launched ‘Paym’, a service which provides customers with the ability to register and make payments using a mobile phone number as a proxy for their bank account. In the US, we launched ‘Mobile Check Deposit’ which allows customers to deposit a cheque by taking a picture of it with their phone. These enhancements reflect our continued commitment to improving the customer experience while streamlining processes.
• Across our priority markets, between December 2013 and May 2014, the monthly average sales and transaction revenue through digital channels increased by 12%.
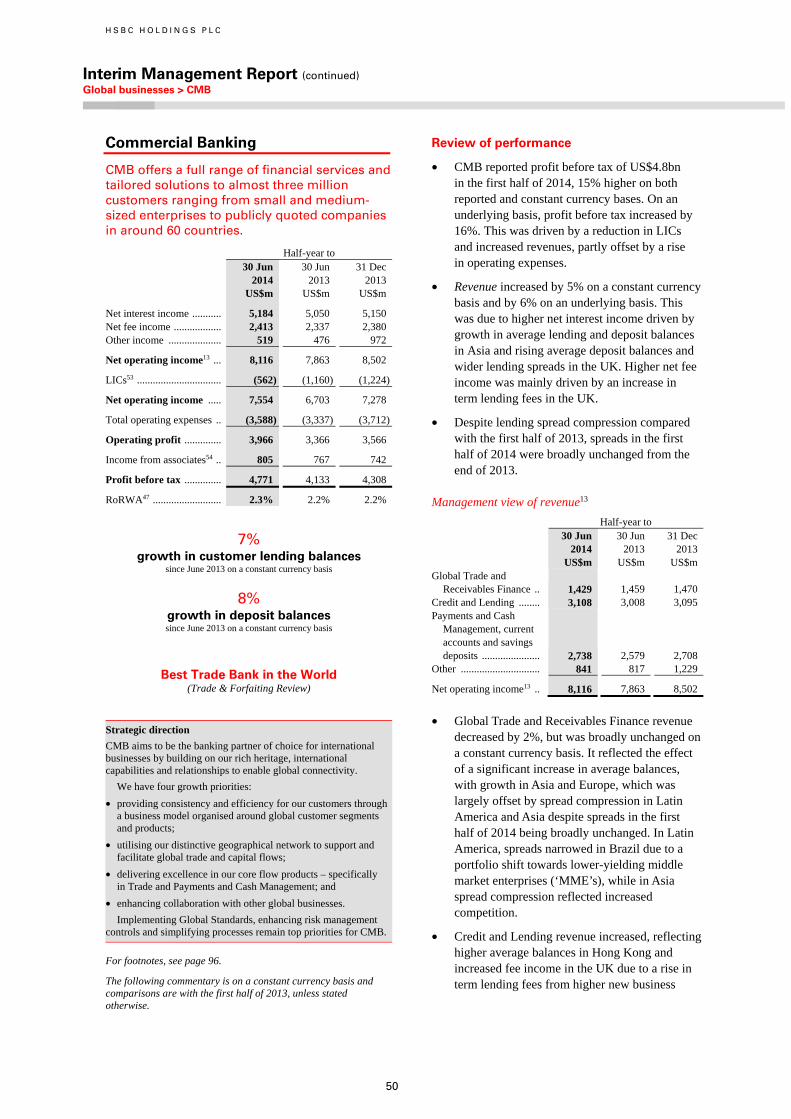
H S B C H O L D I N G S P L C
Interim Management Report (continued) Global businesses > CMB
50
Commercial Banking
CMB offers a full range of financial services and tailored solutions to almost three million customers ranging from small and medium-sized enterprises to publicly quoted companies in around 60 countries.
Half-year to 30 Jun 30 Jun 31 Dec 2014 2013 2013 US$m US$m US$m
Net interest income ........... 5,184 5,050 5,150 Net fee income .................. 2,413 2,337 2,380 Other income .................... 519 476 972
Net operating income13 ... 8,116 7,863 8,502
LICs53 ................................ (562) (1,160) (1,224)
Net operating income ..... 7,554 6,703 7,278
Total operating expenses .. (3,588) (3,337) (3,712)
Operating profit .............. 3,966 3,366 3,566
Income from associates54 .. 805 767 742
Profit before tax .............. 4,771 4,133 4,308
RoRWA47 .......................... 2.3% 2.2% 2.2%
7% growth in customer lending balances
since June 2013 on a constant currency basis
8% growth in deposit balances since June 2013 on a constant currency basis
Best Trade Bank in the World (Trade & Forfaiting Review)
Strategic direction
CMB aims to be the banking partner of choice for international businesses by building on our rich heritage, international capabilities and relationships to enable global connectivity.
We have four growth priorities:
• providing consistency and efficiency for our customers through a business model organised around global customer segments and products;
• utilising our distinctive geographical network to support and facilitate global trade and capital flows;
• delivering excellence in our core flow products – specifically in Trade and Payments and Cash Management; and
• enhancing collaboration with other global businesses.
Implementing Global Standards, enhancing risk management controls and simplifying processes remain top priorities for CMB.
For footnotes, see page 96.
The following commentary is on a constant currency basis and comparisons are with the first half of 2013, unless stated otherwise.
Review of performance
• CMB reported profit before tax of US$4.8bn in the first half of 2014, 15% higher on both reported and constant currency bases. On an underlying basis, profit before tax increased by 16%. This was driven by a reduction in LICs and increased revenues, partly offset by a rise in operating expenses.
• Revenue increased by 5% on a constant currency basis and by 6% on an underlying basis. This was due to higher net interest income driven by growth in average lending and deposit balances in Asia and rising average deposit balances and wider lending spreads in the UK. Higher net fee income was mainly driven by an increase in term lending fees in the UK.
• Despite lending spread compression compared with the first half of 2013, spreads in the first half of 2014 were broadly unchanged from the end of 2013.
Management view of revenue13
Half-year to 30 Jun
2014 30 Jun 2013
31 Dec 2013
US$m US$m US$m Global Trade and
Receivables Finance .. 1,429 1,459 1,470 Credit and Lending ........ 3,108 3,008 3,095 Payments and Cash
Management, current accounts and savings deposits ...................... 2,738 2,579 2,708
Other .............................. 841 817 1,229
Net operating income13 .. 8,116 7,863 8,502
• Global Trade and Receivables Finance revenue
decreased by 2%, but was broadly unchanged on a constant currency basis. It reflected the effect of a significant increase in average balances, with growth in Asia and Europe, which was largely offset by spread compression in Latin America and Asia despite spreads in the first half of 2014 being broadly unchanged. In Latin America, spreads narrowed in Brazil due to a portfolio shift towards lower-yielding middle market enterprises (‘MME’s), while in Asia spread compression reflected increased competition.
• Credit and Lending revenue increased, reflecting higher average balances in Hong Kong and increased fee income in the UK due to a rise in term lending fees from higher new business
51
Ove
rvie
w
In
teri
m M
anag
emen
t R
epo
rt
D
irec
tors
Fin
anci
al S
tate
men
ts
A
dd
itio
nal
Info
rmat
ion
volumes. This was partly offset by spread compression in Latin America, in Brazil, as discussed above and in Mexico due to the repositioning of the business.
• Payments and Cash Management revenue also increased. This reflected strong deposit growth, notably in the UK and Hong Kong, which was driven by increased transaction volumes supported by our focus on international customers. Deposit spreads remained broadly unchanged.
• LICs decreased by US$580m, mainly in Europe and Latin America. Lower LICs in Europe reflected a reduction in individually assessed loan impairment charges, mainly in the UK and Spain. In Latin America, a reduction in LICs was driven by lower collectively assessed impairments in Brazil, mainly due to impairment model changes and assumption revisions for restructured loans in the Business Banking portfolios in 2013, while, in Mexico, individually assessed charges reduced, in particular relating to homebuilders. Additionally, in North America, lower LICs were due to lower individually assessed impairment charges in Canada, partly offset by a rise in LICs in the US as we revised certain estimates used in our corporate loan impairment calculation.
• Operating expenses increased by 10%, including the non-recurrence of an accounting gain of US$160m arising from a change in the basis of delivering ill health benefits in the first half of 2013. Excluding this gain, operating expenses were higher, mainly due to inflationary pressures in Asia and Latin America, the latter largely attributable to union-agreed salary increases in Brazil. Higher costs in Asia also reflected business growth, including increased staff numbers.
• Income from associates increased by 4%, as we benefited from the improved performance of The Saudi British Bank and BoCom due to balance sheet growth.
Growth priorities
Providing consistency through a globally led business model
• We continued to invest in providing global product coverage for our business segments. This will enable us to achieve greater consistency and transparency in servicing our customers’ needs while managing risk more efficiently.
• New leadership and a more defined global strategy within our large corporate and MME segments enabled us to improve client coverage. We appointed a new Global Head of International Subsidiary Banking to drive investment in supporting our international customers across our network. In addition, we redefined our large corporate segment, focusing on a smaller number of higher value clients in 14 priority markets, and accelerated market penetration in our six key MME markets (Hong Kong, the UK, Canada, the US, Mexico and Brazil).
• In conjunction with GB&M, we acted as sole financial adviser for an Asian client’s first strategic acquisition outside their home market. This demonstrated our ability to meet the needs of a large corporate client by executing a substantial and complex multi-jurisdictional transaction.
• In Business Banking, we launched the international RMs’ model into more of our priority markets in the first half of this year. We expect the number of international RMs to increase by approximately 20% in 2014, supporting small and medium-sized enterprise (‘SME’) clients with their international growth aspirations. We launched five major campaigns in the first half of 2014 to help SME customers achieve their growth ambitions and assist businesses looking to expand overseas, including funds in the UK, France, the US, Canada and Australia totalling US$14bn.
Utilising our geographical network to support our customers’ international growth ambitions
• HSBC’s geographical reach at either end of the top 20 global trade corridors has helped us win a number of high profile deals, including a mandate to provide supply chain finance across nine countries for a large consumer brands client.
• Our operating platforms for Receivables Finance are being consolidated into regional hubs, with Europe and Asia completed in the first half of 2014. This offers us the ability to deploy these capabilities rapidly into new markets, providing better risk management and lower operating costs.
Delivering excellence in our core products
• HSBC is one of the largest trade finance banks in the world with access to more than 70% of
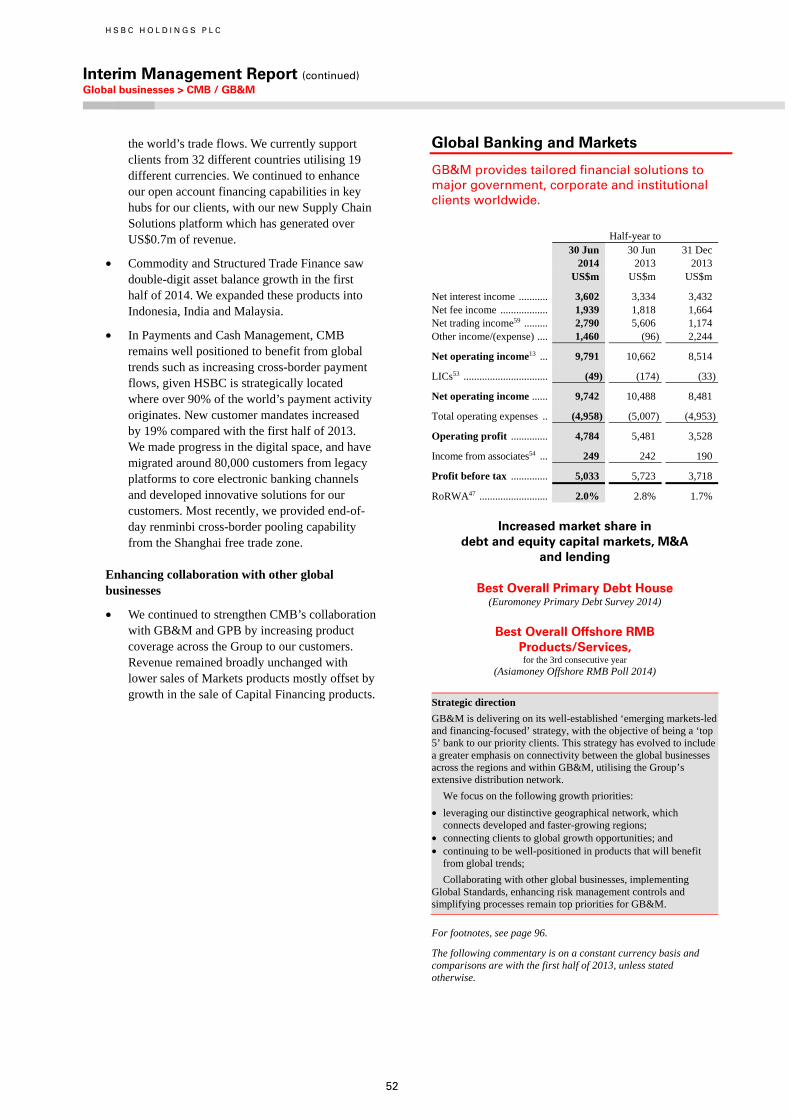
H S B C H O L D I N G S P L C
Interim Management Report (continued) Global businesses > CMB / GB&M
52
the world’s trade flows. We currently support clients from 32 different countries utilising 19 different currencies. We continued to enhance our open account financing capabilities in key hubs for our clients, with our new Supply Chain Solutions platform which has generated over US$0.7m of revenue.
• Commodity and Structured Trade Finance saw double-digit asset balance growth in the first half of 2014. We expanded these products into Indonesia, India and Malaysia.
• In Payments and Cash Management, CMB remains well positioned to benefit from global trends such as increasing cross-border payment flows, given HSBC is strategically located where over 90% of the world’s payment activity originates. New customer mandates increased by 19% compared with the first half of 2013. We made progress in the digital space, and have migrated around 80,000 customers from legacy platforms to core electronic banking channels and developed innovative solutions for our customers. Most recently, we provided end-of-day renminbi cross-border pooling capability from the Shanghai free trade zone.
Enhancing collaboration with other global businesses
• We continued to strengthen CMB’s collaboration with GB&M and GPB by increasing product coverage across the Group to our customers. Revenue remained broadly unchanged with lower sales of Markets products mostly offset by growth in the sale of Capital Financing products.
Global Banking and Markets
GB&M provides tailored financial solutions to major government, corporate and institutional clients worldwide.
Half-year to 30 Jun 30 Jun 31 Dec 2014 2013 2013 US$m US$m US$m
Net interest income ........... 3,602 3,334 3,432 Net fee income .................. 1,939 1,818 1,664 Net trading income59 ......... 2,790 5,606 1,174 Other income/(expense) .... 1,460 (96) 2,244
Net operating income13 ... 9,791 10,662 8,514
LICs53 ................................ (49) (174) (33)
Net operating income ...... 9,742 10,488 8,481
Total operating expenses .. (4,958) (5,007) (4,953)
Operating profit .............. 4,784 5,481 3,528
Income from associates54 ... 249 242 190
Profit before tax .............. 5,033 5,723 3,718
RoRWA47 .......................... 2.0% 2.8% 1.7%
Increased market share in debt and equity capital markets, M&A
and lending
Best Overall Primary Debt House (Euromoney Primary Debt Survey 2014)
Best Overall Offshore RMB Products/Services, for the 3rd consecutive year
(Asiamoney Offshore RMB Poll 2014)
Strategic direction
GB&M is delivering on its well-established ‘emerging markets-led and financing-focused’ strategy, with the objective of being a ‘top 5’ bank to our priority clients. This strategy has evolved to include a greater emphasis on connectivity between the global businesses across the regions and within GB&M, utilising the Group’s extensive distribution network.
We focus on the following growth priorities:
• leveraging our distinctive geographical network, which connects developed and faster-growing regions;
• connecting clients to global growth opportunities; and • continuing to be well-positioned in products that will benefit
from global trends;
Collaborating with other global businesses, implementing Global Standards, enhancing risk management controls and simplifying processes remain top priorities for GB&M.
For footnotes, see page 96.
The following commentary is on a constant currency basis and comparisons are with the first half of 2013, unless stated otherwise.
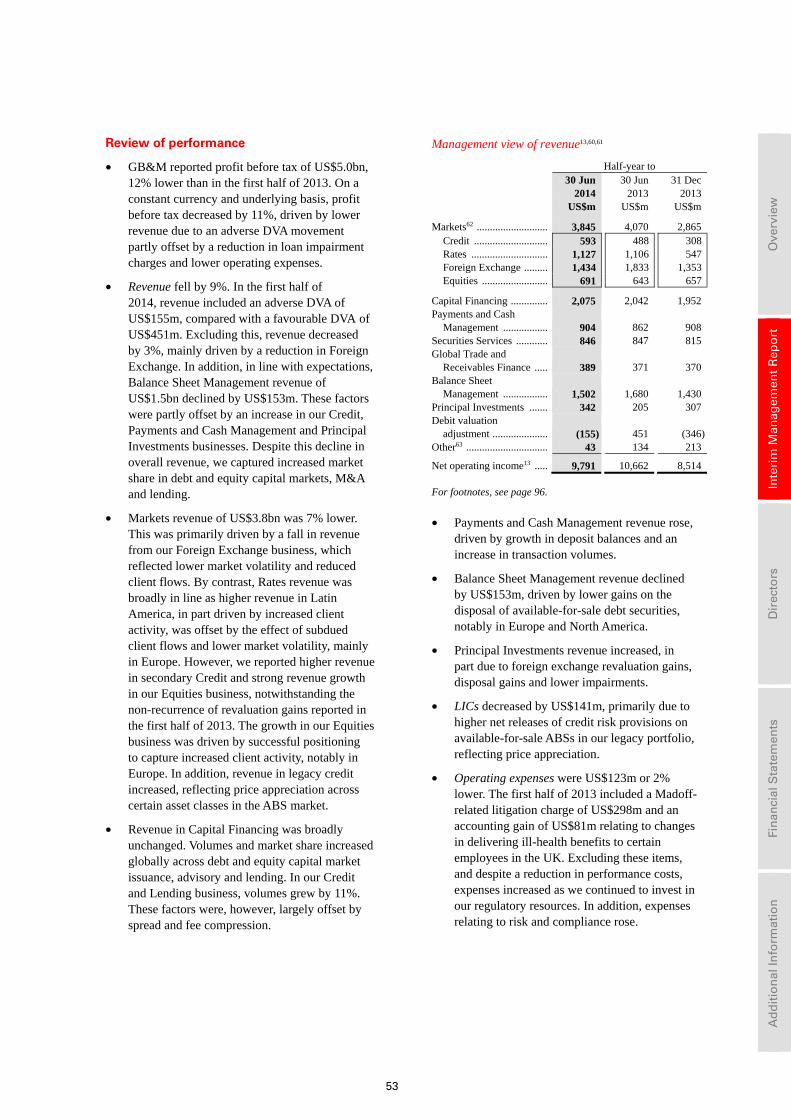
53
Ove
rvie
w
In
teri
m M
anag
emen
t R
epo
rt
D
irec
tors
Fin
anci
al S
tate
men
ts
A
dd
itio
nal
Info
rmat
ion
Review of performance
• GB&M reported profit before tax of US$5.0bn, 12% lower than in the first half of 2013. On a constant currency and underlying basis, profit before tax decreased by 11%, driven by lower revenue due to an adverse DVA movement partly offset by a reduction in loan impairment charges and lower operating expenses.
• Revenue fell by 9%. In the first half of 2014, revenue included an adverse DVA of US$155m, compared with a favourable DVA of US$451m. Excluding this, revenue decreased by 3%, mainly driven by a reduction in Foreign Exchange. In addition, in line with expectations, Balance Sheet Management revenue of US$1.5bn declined by US$153m. These factors were partly offset by an increase in our Credit, Payments and Cash Management and Principal Investments businesses. Despite this decline in overall revenue, we captured increased market share in debt and equity capital markets, M&A and lending.
• Markets revenue of US$3.8bn was 7% lower. This was primarily driven by a fall in revenue from our Foreign Exchange business, which reflected lower market volatility and reduced client flows. By contrast, Rates revenue was broadly in line as higher revenue in Latin America, in part driven by increased client activity, was offset by the effect of subdued client flows and lower market volatility, mainly in Europe. However, we reported higher revenue in secondary Credit and strong revenue growth in our Equities business, notwithstanding the non-recurrence of revaluation gains reported in the first half of 2013. The growth in our Equities business was driven by successful positioning to capture increased client activity, notably in Europe. In addition, revenue in legacy credit increased, reflecting price appreciation across certain asset classes in the ABS market.
• Revenue in Capital Financing was broadly unchanged. Volumes and market share increased globally across debt and equity capital market issuance, advisory and lending. In our Credit and Lending business, volumes grew by 11%. These factors were, however, largely offset by spread and fee compression.
Management view of revenue13,60,61
Half-year to 30 Jun
2014 30 Jun 2013
31 Dec 2013
US$m US$m US$m
Markets62 ........................... 3,845 4,070 2,865 Credit ............................ 593 488 308Rates ............................. 1,127 1,106 547Foreign Exchange ......... 1,434 1,833 1,353Equities ......................... 691 643 657
Capital Financing .............. 2,075 2,042 1,952 Payments and Cash
Management ................. 904 862 908 Securities Services ............ 846 847 815 Global Trade and
Receivables Finance ..... 389 371 370 Balance Sheet
Management ................. 1,502 1,680 1,430 Principal Investments ....... 342 205 307 Debit valuation
adjustment ..................... (155) 451 (346)Other63 ............................... 43 134 213
Net operating income13 ..... 9,791 10,662 8,514
For footnotes, see page 96.
• Payments and Cash Management revenue rose, driven by growth in deposit balances and an increase in transaction volumes.
• Balance Sheet Management revenue declined by US$153m, driven by lower gains on the disposal of available-for-sale debt securities, notably in Europe and North America.
• Principal Investments revenue increased, in part due to foreign exchange revaluation gains, disposal gains and lower impairments.
• LICs decreased by US$141m, primarily due to higher net releases of credit risk provisions on available-for-sale ABSs in our legacy portfolio, reflecting price appreciation.
• Operating expenses were US$123m or 2% lower. The first half of 2013 included a Madoff-related litigation charge of US$298m and an accounting gain of US$81m relating to changes in delivering ill-health benefits to certain employees in the UK. Excluding these items, and despite a reduction in performance costs, expenses increased as we continued to invest in our regulatory resources. In addition, expenses relating to risk and compliance rose.
H S B C H O L D I N G S P L C
Interim Management Report (continued) Global businesses > GB&M/GPB
54
Growth priorities
Leveraging our distinctive geographical network which connects developed and faster-growing regions
• We remain strongly positioned to service the needs of our multinational clients. We were recently successful in a competitive pan-Asian tender and we now serve as universal bank for the production and distribution hub in mainland China of a new European corporate client, with opportunities for further expansion in Asia and into Latin America. Our ability to win mandates like this demonstrates the value of our distinctive geographical network to our clients.
• Our long-standing cross-border coverage and our ability to execute multi-faceted transactions also attracted new financing and advisory mandates, including those won through collaboration with CMB. This helped clients to grow their business activities, and contributed to increasing our market share in several product categories including mergers and acquisitions and debt and equity capital markets.
Connecting clients to global growth opportunities
• Our Payments and Cash Management business benefited from volume growth and delivered improved client coverage. During the first half of 2014, the business expanded its Global Liquidity Solutions offering into the US, mainland China and certain European countries and is now active in 50 markets.
• We remain focused on our Foreign Exchange business and continue to improve our distribution platforms, electronic pricing and risk management capabilities, to ensure that we remain well positioned to capture increases in market share and volume growth.
Continuing to be well positioned in products that will benefit from global trends
• Capturing new opportunities arising from the internationalisation of the renminbi remains a key growth priority for GB&M, as demand for the currency outside Asia-Pacific grows. We are investing to build on the strength of our offering and to maintain our global leadership position. In April 2014, we announced the appointment of a new Global Head of Renminbi Business Development to deliver our strategic priorities in this growing market.
• Our Securities Services business became the first custodian to service London-based renminbi-qualified institutional investors, following regulatory approval to open up mainland China’s securities markets to overseas investors.
• We are well placed to benefit from companies increasingly looking to raise finance directly from the debt capital markets. In March 2014, for the first time, we were recognised by Bloomberg as the top international bond provider and also maintained leading positions in euro market and emerging market debt issuance, with market share increases in the noted categories.
• With governments increasingly requiring financing solutions for infrastructure development and institutional investors seeking long-term real assets, infrastructure finance continues to migrate from banks to capital markets. Our project finance team is actively capturing opportunities and delivered several successful transactions including arranging financing for a UK-based infrastructure project which also featured a direct investment by a UK pension fund.
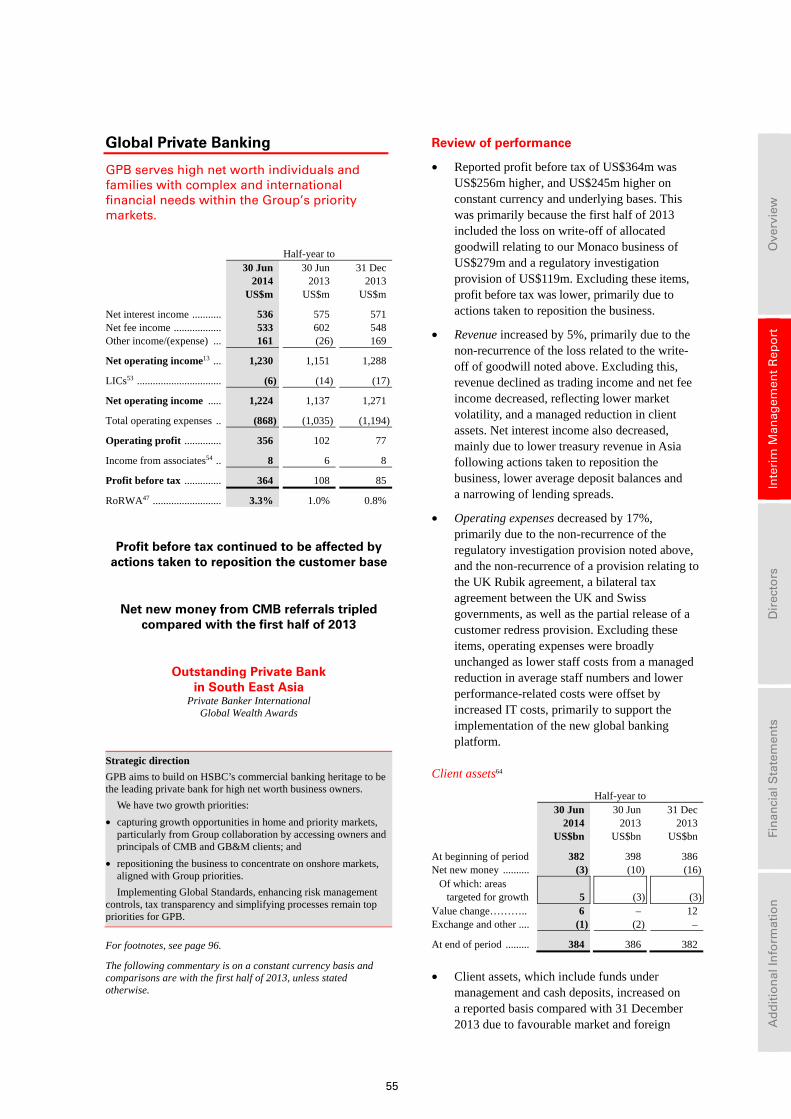
55
Ove
rvie
w
In
teri
m M
anag
emen
t R
epo
rt
D
irec
tors
Fin
anci
al S
tate
men
ts
A
dd
itio
nal
Info
rmat
ion
Global Private Banking
GPB serves high net worth individuals and families with complex and international financial needs within the Group’s priority markets.
Half-year to 30 Jun 30 Jun 31 Dec 2014 2013 2013 US$m US$m US$m
Net interest income ........... 536 575 571 Net fee income .................. 533 602 548 Other income/(expense) ... 161 (26) 169
Net operating income13 ... 1,230 1,151 1,288
LICs53 ................................ (6) (14) (17)
Net operating income ..... 1,224 1,137 1,271
Total operating expenses .. (868) (1,035) (1,194)
Operating profit .............. 356 102 77
Income from associates54 .. 8 6 8
Profit before tax .............. 364 108 85
RoRWA47 .......................... 3.3% 1.0% 0.8%
Profit before tax continued to be affected by actions taken to reposition the customer base
Net new money from CMB referrals tripled compared with the first half of 2013
Outstanding Private Bank in South East Asia
Private Banker International Global Wealth Awards
Strategic direction
GPB aims to build on HSBC’s commercial banking heritage to be the leading private bank for high net worth business owners.
We have two growth priorities:
• capturing growth opportunities in home and priority markets, particularly from Group collaboration by accessing owners and principals of CMB and GB&M clients; and
• repositioning the business to concentrate on onshore markets, aligned with Group priorities.
Implementing Global Standards, enhancing risk management controls, tax transparency and simplifying processes remain top priorities for GPB.
For footnotes, see page 96.
The following commentary is on a constant currency basis and comparisons are with the first half of 2013, unless stated otherwise.
Review of performance
• Reported profit before tax of US$364m was US$256m higher, and US$245m higher on constant currency and underlying bases. This was primarily because the first half of 2013 included the loss on write-off of allocated goodwill relating to our Monaco business of US$279m and a regulatory investigation provision of US$119m. Excluding these items, profit before tax was lower, primarily due to actions taken to reposition the business.
• Revenue increased by 5%, primarily due to the non-recurrence of the loss related to the write-off of goodwill noted above. Excluding this, revenue declined as trading income and net fee income decreased, reflecting lower market volatility, and a managed reduction in client assets. Net interest income also decreased, mainly due to lower treasury revenue in Asia following actions taken to reposition the business, lower average deposit balances and a narrowing of lending spreads.
• Operating expenses decreased by 17%, primarily due to the non-recurrence of the regulatory investigation provision noted above, and the non-recurrence of a provision relating to the UK Rubik agreement, a bilateral tax agreement between the UK and Swiss governments, as well as the partial release of a customer redress provision. Excluding these items, operating expenses were broadly unchanged as lower staff costs from a managed reduction in average staff numbers and lower performance-related costs were offset by increased IT costs, primarily to support the implementation of the new global banking platform.
Client assets64
Half-year to
30 Jun 2014
30 Jun 2013
31 Dec 2013
US$bn US$bn US$bn
At beginning of period 382 398 386 Net new money .......... (3) (10) (16)
Of which: areas targeted for growth 5 (3) (3)
Value change……….. 6 – 12 Exchange and other .... (1) (2) –
At end of period ......... 384 386 382
• Client assets, which include funds under
management and cash deposits, increased on a reported basis compared with 31 December 2013 due to favourable market and foreign
H S B C H O L D I N G S P L C
Interim Management Report (continued) Global businesses > GPB/Other
56
exchange movements, partly offset by negative net new money and the effect of the disposal of our HSBC Trinkaus & Burkhardt AG business in Luxembourg. Negative net new money of US$3bn was mainly driven by the continued repositioning of our business. However, we attracted positive net new money of US$5bn in areas that we have targeted for growth, including our home and priority markets and the high net worth client segment.
• Our return on assets, defined as the percentage of revenue to average client assets, was 65bps in the first half of 2014 compared with 59bps. The increase was primarily due to the non-recurrence of the write-off relating to goodwill noted above. Excluding the effect of this item, our return on assets was 8bps lower in the first half of 2014, reflecting the fall in revenue. Our client return on assets, which excludes treasury and capital revenue, was 4bps lower in the first half of 2013 at 60bps.
Growth priorities
Capturing growth in our home and priority markets and focusing on collaboration revenues
• We enhanced our approach to collaborating with other global businesses in line with our aspiration to be the preferred private bank for the owners and principals of our CMB and GB&M clients. We are moving away from a traditional ‘referral’ model, adopting a more coordinated and systematic approach for clients who need both private and corporate coverage, supported by more effective marketing, communications, awareness and training. This resulted in net new money from CMB referrals more than tripling compared with the first half of 2013.
• In addition, we formalised and implemented the Global Priority Clients initiative, a collaborative venture between GPB, GB&M and CMB for the Group’s most significant dual banked clients. This gathered momentum in the first half of 2014 as we identified over 60
large relationships that could benefit from an enhanced coverage, creating significant incremental revenue opportunities.
• We expanded our product offering with investment opportunities in three new Alternatives products, comprising two private equity funds and a real estate portfolio. In addition, we strengthened our investment group with the implementation of Global Product Lines, which allow us to offer a consistent global proposition for key products and utilise more efficiently GB&M and Global Asset Management services and products.
Repositioning the business
• We continued to reposition the GPB business model and client base in the first half of 2014, primarily by reviewing our portfolio and ensuring that all clients comply with Global Standards, including financial crime compliance and tax transparency standards.
• We remain focused on clients with wider Group connectivity who meet our segmentation thresholds within our home and priority markets, while also reducing the number of clients in non-priority markets. In line with this strategy, we agreed to sell a portfolio of private banking assets of clients in non-priority markets booked in Switzerland to LGT Bank (Switzerland) Ltd. The portfolio had client assets of US$12.5bn at 31 December 2013, representing 15% of client assets in Switzerland, and we reclassified the associated balances to held for sale at 30 June 2014. This transaction is expected to complete in the second half of 2014.
• The replacement of GPB’s multiple IT platforms with a new single banking platform is under way. This will deliver improved efficiency, an enhanced proposition and a consistent client experience globally. The initial roll-out, including Switzerland, is expected in the second half of 2015.
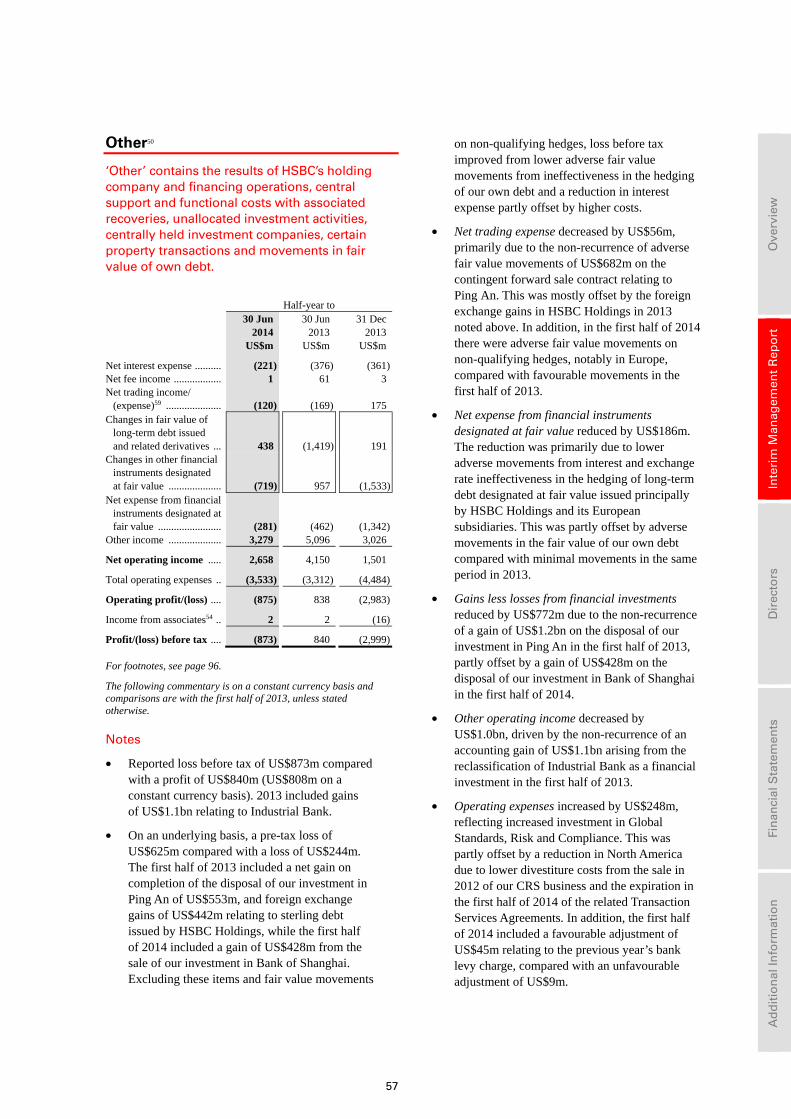
57
Ove
rvie
w
In
teri
m M
anag
emen
t R
epo
rt
D
irec
tors
Fin
anci
al S
tate
men
ts
A
dd
itio
nal
Info
rmat
ion
Other50
‘Other’ contains the results of HSBC’s holding company and financing operations, central support and functional costs with associated recoveries, unallocated investment activities, centrally held investment companies, certain property transactions and movements in fair value of own debt.
Half-year to 30 Jun 30 Jun 31 Dec 2014 2013 2013 US$m US$m US$m
Net interest expense .......... (221) (376) (361)Net fee income .................. 1 61 3 Net trading income/
(expense)59 ..................... (120) (169) 175 Changes in fair value of
long-term debt issued and related derivatives ... 438 (1,419) 191
Changes in other financial instruments designated at fair value .................... (719) 957 (1,533)
Net expense from financial instruments designated at fair value ........................ (281) (462) (1,342)
Other income .................... 3,279 5,096 3,026
Net operating income ..... 2,658 4,150 1,501
Total operating expenses .. (3,533) (3,312) (4,484)
Operating profit/(loss) .... (875) 838 (2,983)
Income from associates54 .. 2 2 (16)
Profit/(loss) before tax .... (873) 840 (2,999)
For footnotes, see page 96.
The following commentary is on a constant currency basis and comparisons are with the first half of 2013, unless stated otherwise. Notes
• Reported loss before tax of US$873m compared with a profit of US$840m (US$808m on a constant currency basis). 2013 included gains of US$1.1bn relating to Industrial Bank.
• On an underlying basis, a pre-tax loss of US$625m compared with a loss of US$244m. The first half of 2013 included a net gain on completion of the disposal of our investment in Ping An of US$553m, and foreign exchange gains of US$442m relating to sterling debt issued by HSBC Holdings, while the first half of 2014 included a gain of US$428m from the sale of our investment in Bank of Shanghai. Excluding these items and fair value movements
on non-qualifying hedges, loss before tax improved from lower adverse fair value movements from ineffectiveness in the hedging of our own debt and a reduction in interest expense partly offset by higher costs.
• Net trading expense decreased by US$56m, primarily due to the non-recurrence of adverse fair value movements of US$682m on the contingent forward sale contract relating to Ping An. This was mostly offset by the foreign exchange gains in HSBC Holdings in 2013 noted above. In addition, in the first half of 2014 there were adverse fair value movements on non-qualifying hedges, notably in Europe, compared with favourable movements in the first half of 2013.
• Net expense from financial instruments designated at fair value reduced by US$186m. The reduction was primarily due to lower adverse movements from interest and exchange rate ineffectiveness in the hedging of long-term debt designated at fair value issued principally by HSBC Holdings and its European subsidiaries. This was partly offset by adverse movements in the fair value of our own debt compared with minimal movements in the same period in 2013.
• Gains less losses from financial investments reduced by US$772m due to the non-recurrence of a gain of US$1.2bn on the disposal of our investment in Ping An in the first half of 2013, partly offset by a gain of US$428m on the disposal of our investment in Bank of Shanghai in the first half of 2014.
• Other operating income decreased by US$1.0bn, driven by the non-recurrence of an accounting gain of US$1.1bn arising from the reclassification of Industrial Bank as a financial investment in the first half of 2013.
• Operating expenses increased by US$248m, reflecting increased investment in Global Standards, Risk and Compliance. This was partly offset by a reduction in North America due to lower divestiture costs from the sale in 2012 of our CRS business and the expiration in the first half of 2014 of the related Transaction Services Agreements. In addition, the first half of 2014 included a favourable adjustment of US$45m relating to the previous year’s bank levy charge, compared with an unfavourable adjustment of US$9m.
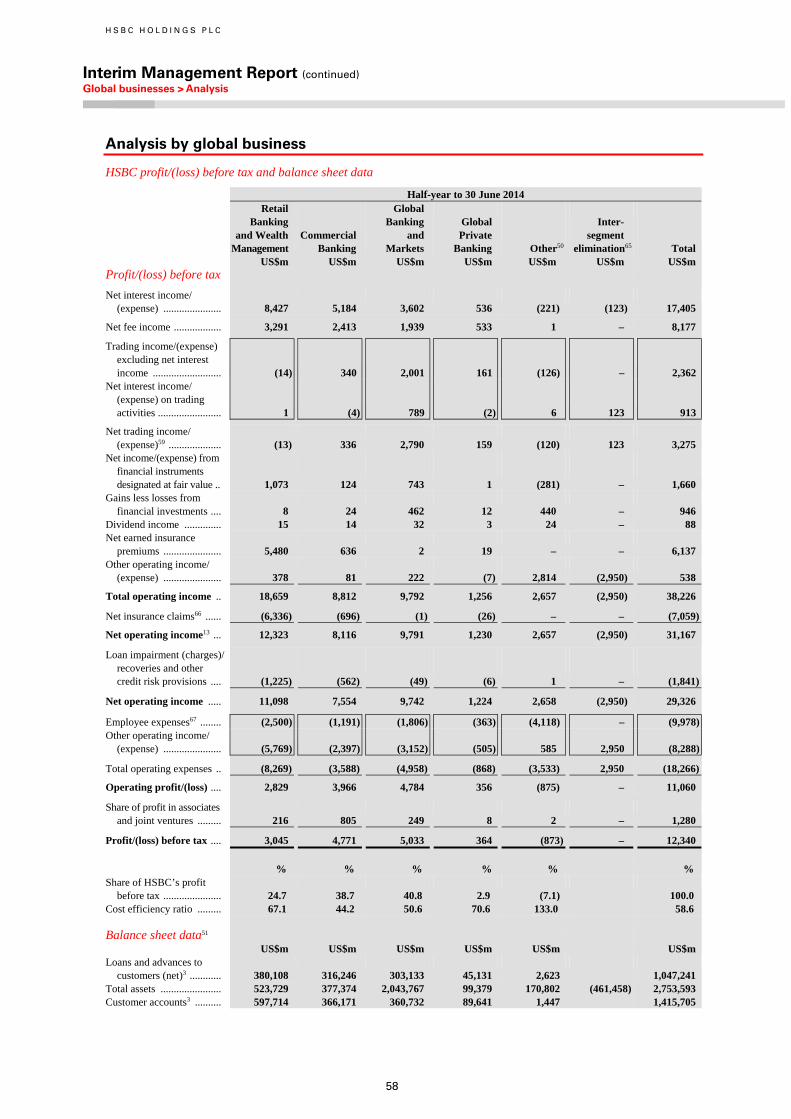
H S B C H O L D I N G S P L C
Interim Management Report (continued) Global businesses > Analysis
58
Analysis by global business
HSBC profit/(loss) before tax and balance sheet data
Half-year to 30 June 2014
Retail Banking and Wealth Management US$m
Commercial Banking US$m
Global Banking
and Markets
US$m
GlobalPrivate
Banking US$m
Other50
US$m
Inter- segment elimination65
US$m Total US$m
Profit/(loss) before tax
Net interest income/ (expense) ...................... 8,427 5,184 3,602 536 (221) (123) 17,405
Net fee income .................. 3,291 2,413 1,939 533 1 – 8,177
Trading income/(expense) excluding net interest income .......................... (14) 340 2,001 161 (126) – 2,362
Net interest income/ (expense) on trading activities ........................ 1 (4) 789 (2) 6 123 913
Net trading income/ (expense)59 .................... (13) 336 2,790 159 (120) 123 3,275
Net income/(expense) from financial instruments designated at fair value .. 1,073 124 743 1 (281) – 1,660
Gains less losses from financial investments .... 8 24 462 12 440 – 946
Dividend income .............. 15 14 32 3 24 – 88 Net earned insurance
premiums ...................... 5,480 636 2 19 – – 6,137 Other operating income/
(expense) ...................... 378 81 222 (7) 2,814 (2,950) 538
Total operating income .. 18,659 8,812 9,792 1,256 2,657 (2,950) 38,226
Net insurance claims66 ...... (6,336) (696) (1) (26) – – (7,059)
Net operating income13 ... 12,323 8,116 9,791 1,230 2,657 (2,950) 31,167
Loan impairment (charges)/ recoveries and other credit risk provisions .... (1,225) (562) (49) (6) 1 – (1,841)
Net operating income ..... 11,098 7,554 9,742 1,224 2,658 (2,950) 29,326
Employee expenses67 ........ (2,500) (1,191) (1,806) (363) (4,118) – (9,978)Other operating income/
(expense) ...................... (5,769) (2,397) (3,152) (505) 585 2,950 (8,288)
Total operating expenses .. (8,269) (3,588) (4,958) (868) (3,533) 2,950 (18,266)
Operating profit/(loss) .... 2,829 3,966 4,784 356 (875) – 11,060
Share of profit in associates and joint ventures ......... 216 805 249 8 2 – 1,280
Profit/(loss) before tax .... 3,045 4,771 5,033 364 (873) – 12,340
% % % % % % Share of HSBC’s profit
before tax ...................... 24.7 38.7 40.8 2.9 (7.1) 100.0 Cost efficiency ratio ......... 67.1 44.2 50.6 70.6 133.0 58.6 Balance sheet data51 US$m US$m US$m US$m US$m US$m Loans and advances to
customers (net)3 ............ 380,108 316,246 303,133 45,131 2,623 1,047,241 Total assets ....................... 523,729 377,374 2,043,767 99,379 170,802 (461,458) 2,753,593 Customer accounts3 .......... 597,714 366,171 360,732 89,641 1,447 1,415,705
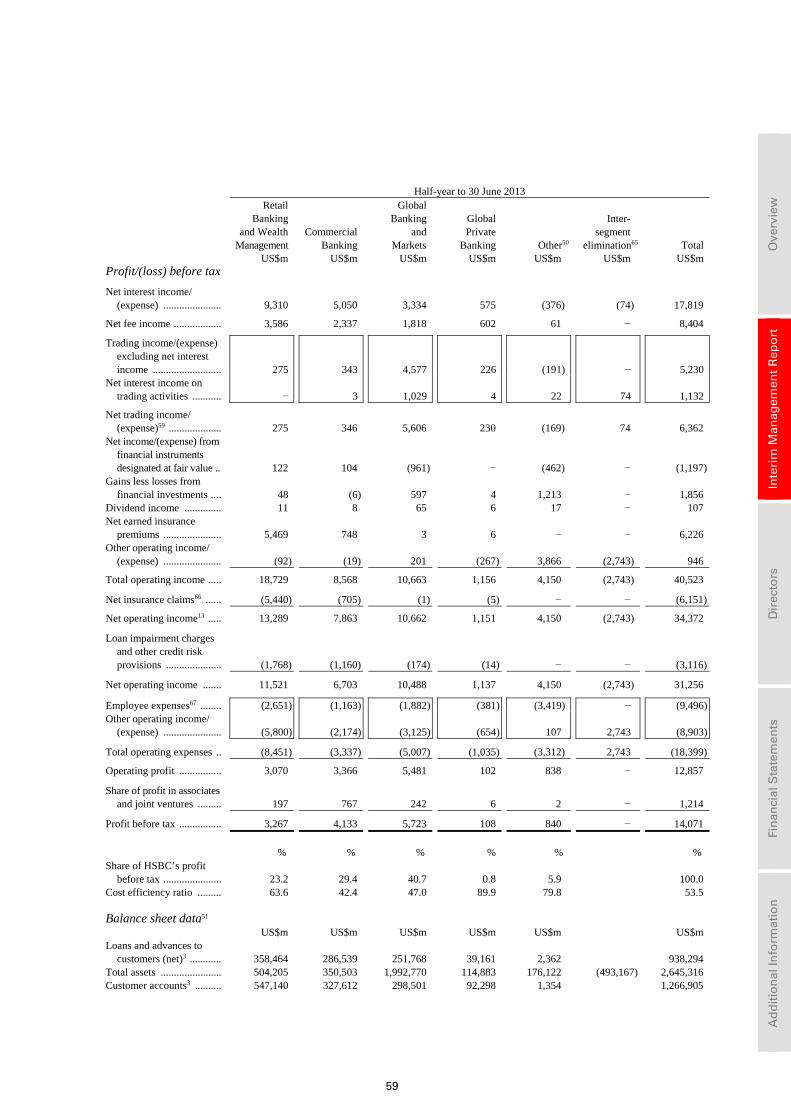
59
Ove
rvie
w
In
teri
m M
anag
emen
t R
epo
rt
D
irec
tors
Fin
anci
al S
tate
men
ts
A
dd
itio
nal
Info
rmat
ion
Half-year to 30 June 2013
Retail Banking and Wealth
Management US$m
Commercial Banking US$m
Global Banking
and Markets
US$m
GlobalPrivate
Banking US$m
Other50
US$m
Inter- segment elimination65
US$m Total US$m
Profit/(loss) before tax
Net interest income/ (expense) ...................... 9,310 5,050 3,334 575 (376) (74) 17,819
Net fee income .................. 3,586 2,337 1,818 602 61 − 8,404
Trading income/(expense) excluding net interest income .......................... 275 343 4,577 226 (191) − 5,230
Net interest income on trading activities ........... − 3 1,029 4 22 74 1,132
Net trading income/ (expense)59 .................... 275 346 5,606 230 (169) 74 6,362
Net income/(expense) from financial instruments designated at fair value .. 122 104 (961) − (462) − (1,197)
Gains less losses from financial investments .... 48 (6) 597 4 1,213 − 1,856
Dividend income .............. 11 8 65 6 17 − 107 Net earned insurance
premiums ...................... 5,469 748 3 6 − − 6,226 Other operating income/
(expense) ...................... (92) (19) 201 (267) 3,866 (2,743) 946
Total operating income ..... 18,729 8,568 10,663 1,156 4,150 (2,743) 40,523
Net insurance claims66 ...... (5,440) (705) (1) (5) − − (6,151)
Net operating income13 ..... 13,289 7,863 10,662 1,151 4,150 (2,743) 34,372
Loan impairment charges and other credit risk provisions ..................... (1,768) (1,160) (174) (14) − − (3,116)
Net operating income ....... 11,521 6,703 10,488 1,137 4,150 (2,743) 31,256
Employee expenses67 ........ (2,651) (1,163) (1,882) (381) (3,419) − (9,496)Other operating income/
(expense) ...................... (5,800) (2,174) (3,125) (654) 107 2,743 (8,903)
Total operating expenses .. (8,451) (3,337) (5,007) (1,035) (3,312) 2,743 (18,399)
Operating profit ................ 3,070 3,366 5,481 102 838 − 12,857
Share of profit in associates and joint ventures ......... 197 767 242 6 2 − 1,214
Profit before tax ................ 3,267 4,133 5,723 108 840 − 14,071
% % % % % % Share of HSBC’s profit
before tax ...................... 23.2 29.4 40.7 0.8 5.9 100.0 Cost efficiency ratio ......... 63.6 42.4 47.0 89.9 79.8 53.5 Balance sheet data51 US$m US$m US$m US$m US$m US$m Loans and advances to
customers (net)3 ............ 358,464 286,539 251,768 39,161 2,362 938,294 Total assets ....................... 504,205 350,503 1,992,770 114,883 176,122 (493,167) 2,645,316 Customer accounts3 .......... 547,140 327,612 298,501 92,298 1,354 1,266,905
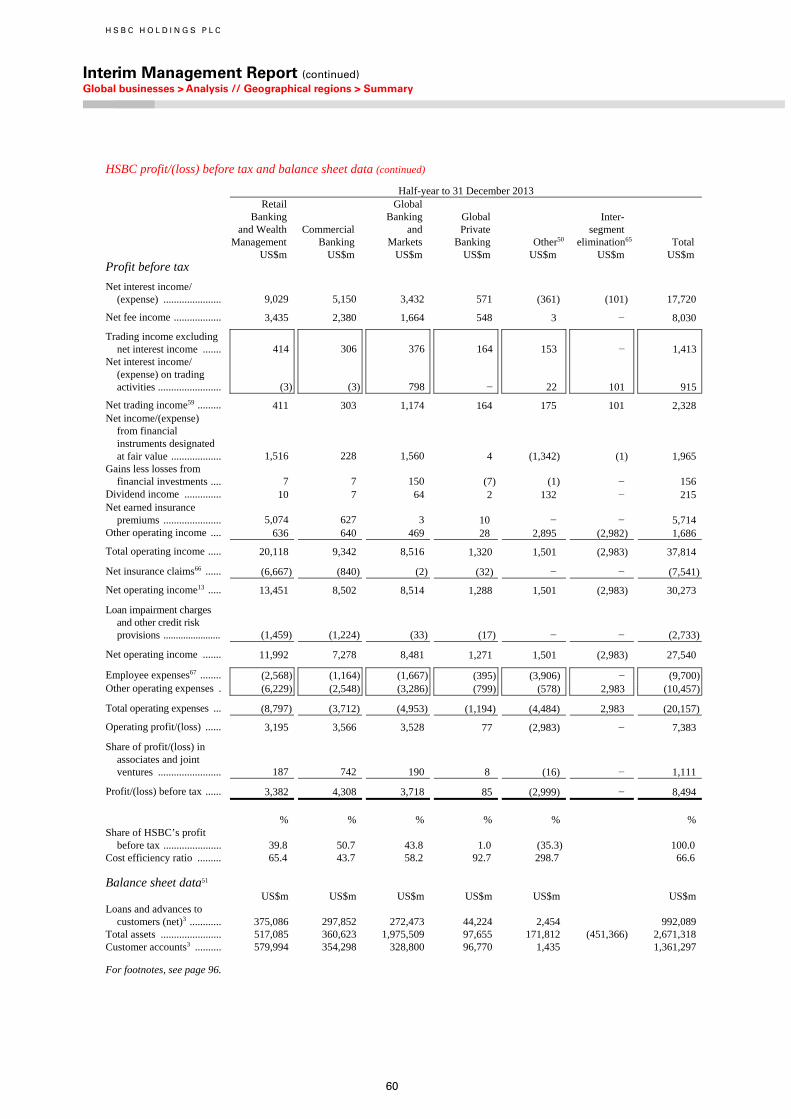
H S B C H O L D I N G S P L C
Interim Management Report (continued) Global businesses > Analysis // Geographical regions > Summary
60
HSBC profit/(loss) before tax and balance sheet data (continued)
Half-year to 31 December 2013
Retail Banking and Wealth Management
US$m
Commercial Banking US$m
Global Banking and Markets
US$m
Global Private Banking
US$m Other50
US$m
Inter- segment elimination65
US$m Total US$m
Profit before tax
Net interest income/ (expense) ...................... 9,029 5,150 3,432 571 (361) (101) 17,720
Net fee income .................. 3,435 2,380 1,664 548 3 − 8,030
Trading income excluding net interest income ....... 414 306 376 164 153 − 1,413
Net interest income/ (expense) on trading activities ........................ (3) (3) 798 − 22 101 915
Net trading income59 ......... 411 303 1,174 164 175 101 2,328 Net income/(expense)
from financial instruments designated at fair value ................... 1,516 228 1,560 4 (1,342) (1) 1,965
Gains less losses from financial investments .... 7 7 150 (7) (1) − 156
Dividend income .............. 10 7 64 2 132 − 215Net earned insurance
premiums ...................... 5,074 627 3 10 − − 5,714Other operating income .... 636 640 469 28 2,895 (2,982) 1,686
Total operating income ..... 20,118 9,342 8,516 1,320 1,501 (2,983) 37,814
Net insurance claims66 ...... (6,667) (840) (2) (32) − − (7,541)
Net operating income13 ..... 13,451 8,502 8,514 1,288 1,501 (2,983) 30,273
Loan impairment charges and other credit risk provisions ....................... (1,459) (1,224) (33) (17) − − (2,733)
Net operating income ....... 11,992 7,278 8,481 1,271 1,501 (2,983) 27,540
Employee expenses67 ........ (2,568) (1,164) (1,667) (395) (3,906) − (9,700)Other operating expenses . (6,229) (2,548) (3,286) (799) (578) 2,983 (10,457)
Total operating expenses ... (8,797) (3,712) (4,953) (1,194) (4,484) 2,983 (20,157)
Operating profit/(loss) ...... 3,195 3,566 3,528 77 (2,983) − 7,383
Share of profit/(loss) in associates and joint ventures ........................ 187 742 190 8 (16) − 1,111
Profit/(loss) before tax ...... 3,382 4,308 3,718 85 (2,999) − 8,494 % % % % % % Share of HSBC’s profit
before tax ...................... 39.8 50.7 43.8 1.0 (35.3) 100.0Cost efficiency ratio ......... 65.4 43.7 58.2 92.7 298.7 66.6 Balance sheet data51 US$m US$m US$m US$m US$m US$m Loans and advances to
customers (net)3 ............ 375,086 297,852 272,473 44,224 2,454 992,089Total assets ....................... 517,085 360,623 1,975,509 97,655 171,812 (451,366) 2,671,318 Customer accounts3 .......... 579,994 354,298 328,800 96,770 1,435 1,361,297
For footnotes, see page 96.
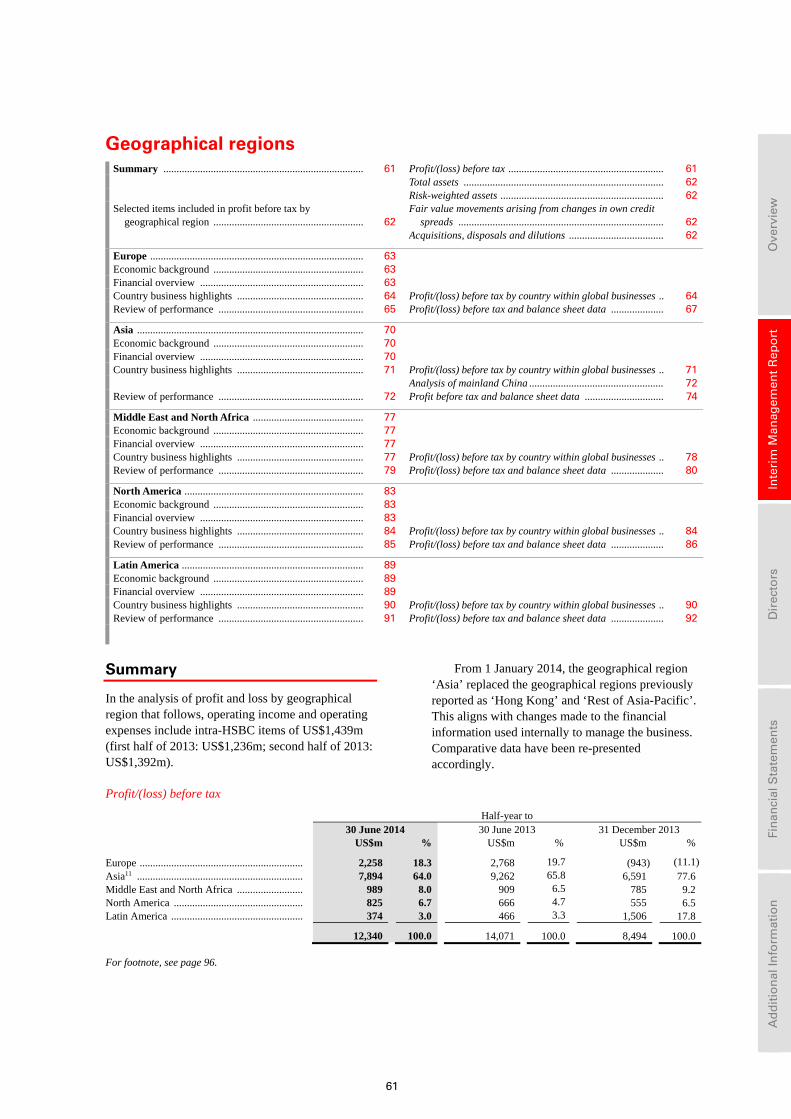
61
Ove
rvie
w
In
teri
m M
anag
emen
t R
epo
rt
D
irec
tors
Fin
anci
al S
tate
men
ts
A
dd
itio
nal
Info
rmat
ion
Geographical regions Summary ............................................................................ 61 Profit/(loss) before tax ........................................................... 61 Total assets ............................................................................ 62 Risk-weighted assets .............................................................. 62Selected items included in profit before tax by
geographical region ......................................................... 62Fair value movements arising from changes in own credit
spreads .............................................................................. 62 Acquisitions, disposals and dilutions .................................... 62
Europe ................................................................................. 63 Economic background ......................................................... 63 Financial overview .............................................................. 63 Country business highlights ................................................ 64 Profit/(loss) before tax by country within global businesses .. 64Review of performance ....................................................... 65 Profit/(loss) before tax and balance sheet data .................... 67
Asia ...................................................................................... 70 Economic background ......................................................... 70 Financial overview .............................................................. 70 Country business highlights ................................................ 71 Profit/(loss) before tax by country within global businesses .. 71 Analysis of mainland China ................................................... 72Review of performance ....................................................... 72 Profit before tax and balance sheet data .............................. 74
Middle East and North Africa .......................................... 77 Economic background ......................................................... 77 Financial overview .............................................................. 77 Country business highlights ................................................ 77 Profit/(loss) before tax by country within global businesses .. 78Review of performance ....................................................... 79 Profit/(loss) before tax and balance sheet data .................... 80
North America .................................................................... 83 Economic background ......................................................... 83 Financial overview .............................................................. 83 Country business highlights ................................................ 84 Profit/(loss) before tax by country within global businesses .. 84Review of performance ....................................................... 85 Profit/(loss) before tax and balance sheet data .................... 86
Latin America ..................................................................... 89 Economic background ......................................................... 89 Financial overview .............................................................. 89 Country business highlights ................................................ 90 Profit/(loss) before tax by country within global businesses .. 90Review of performance ....................................................... 91 Profit/(loss) before tax and balance sheet data .................... 92
Summary
In the analysis of profit and loss by geographical region that follows, operating income and operating expenses include intra-HSBC items of US$1,439m (first half of 2013: US$1,236m; second half of 2013: US$1,392m).
From 1 January 2014, the geographical region ‘Asia’ replaced the geographical regions previously reported as ‘Hong Kong’ and ‘Rest of Asia-Pacific’. This aligns with changes made to the financial information used internally to manage the business. Comparative data have been re-presented accordingly.
Profit/(loss) before tax
Half-year to 30 June 2014 30 June 2013 31 December 2013 US$m % US$m % US$m %
Europe .............................................................. 2,258 18.3 2,768 19.7 (943) (11.1)Asia11 ............................................................... 7,894 64.0 9,262 65.8 6,591 77.6 Middle East and North Africa ......................... 989 8.0 909 6.5 785 9.2 North America ................................................. 825 6.7 666 4.7 555 6.5 Latin America .................................................. 374 3.0 466 3.3 1,506 17.8
12,340 100.0 14,071 100.0 8,494 100.0
For footnote, see page 96.
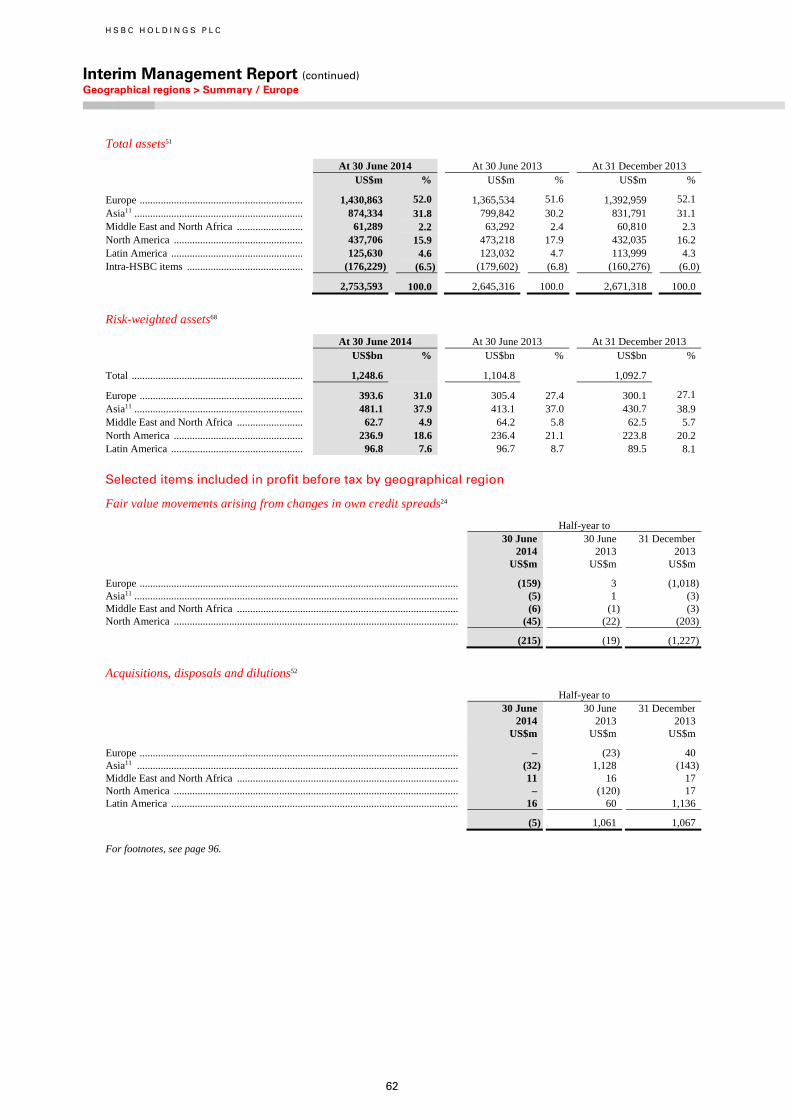
H S B C H O L D I N G S P L C
Interim Management Report (continued) Geographical regions > Summary / Europe
62
Total assets51
At 30 June 2014 At 30 June 2013 At 31 December 2013 US$m % US$m % US$m %
Europe .............................................................. 1,430,863 52.0 1,365,534 51.6 1,392,959 52.1 Asia11 ................................................................ 874,334 31.8 799,842 30.2 831,791 31.1 Middle East and North Africa ......................... 61,289 2.2 63,292 2.4 60,810 2.3 North America ................................................. 437,706 15.9 473,218 17.9 432,035 16.2 Latin America .................................................. 125,630 4.6 123,032 4.7 113,999 4.3 Intra-HSBC items ............................................ (176,229) (6.5) (179,602) (6.8) (160,276) (6.0)
2,753,593 100.0 2,645,316 100.0 2,671,318 100.0
Risk-weighted assets68
At 30 June 2014 At 30 June 2013 At 31 December 2013 US$bn % US$bn % US$bn %
Total ................................................................. 1,248.6 1,104.8 1,092.7
Europe .............................................................. 393.6 31.0 305.4 27.4 300.1 27.1 Asia11 ................................................................ 481.1 37.9 413.1 37.0 430.7 38.9 Middle East and North Africa ......................... 62.7 4.9 64.2 5.8 62.5 5.7 North America ................................................. 236.9 18.6 236.4 21.1 223.8 20.2 Latin America .................................................. 96.8 7.6 96.7 8.7 89.5 8.1
Selected items included in profit before tax by geographical region
Fair value movements arising from changes in own credit spreads24
Half-year to 30 June 30 June 31 December 2014 2013 2013 US$m US$m US$m
Europe ......................................................................................................................... (159) 3 (1,018)Asia11 ........................................................................................................................... (5) 1 (3)Middle East and North Africa .................................................................................... (6) (1) (3)North America ............................................................................................................ (45) (22) (203)
(215) (19) (1,227)
Acquisitions, disposals and dilutions52
Half-year to 30 June 30 June 31 December 2014 2013 2013 US$m US$m US$m
Europe ......................................................................................................................... – (23) 40Asia11 .......................................................................................................................... (32) 1,128 (143)Middle East and North Africa .................................................................................... 11 16 17North America ............................................................................................................ – (120) 17Latin America ............................................................................................................. 16 60 1,136
(5) 1,061 1,067
For footnotes, see page 96.
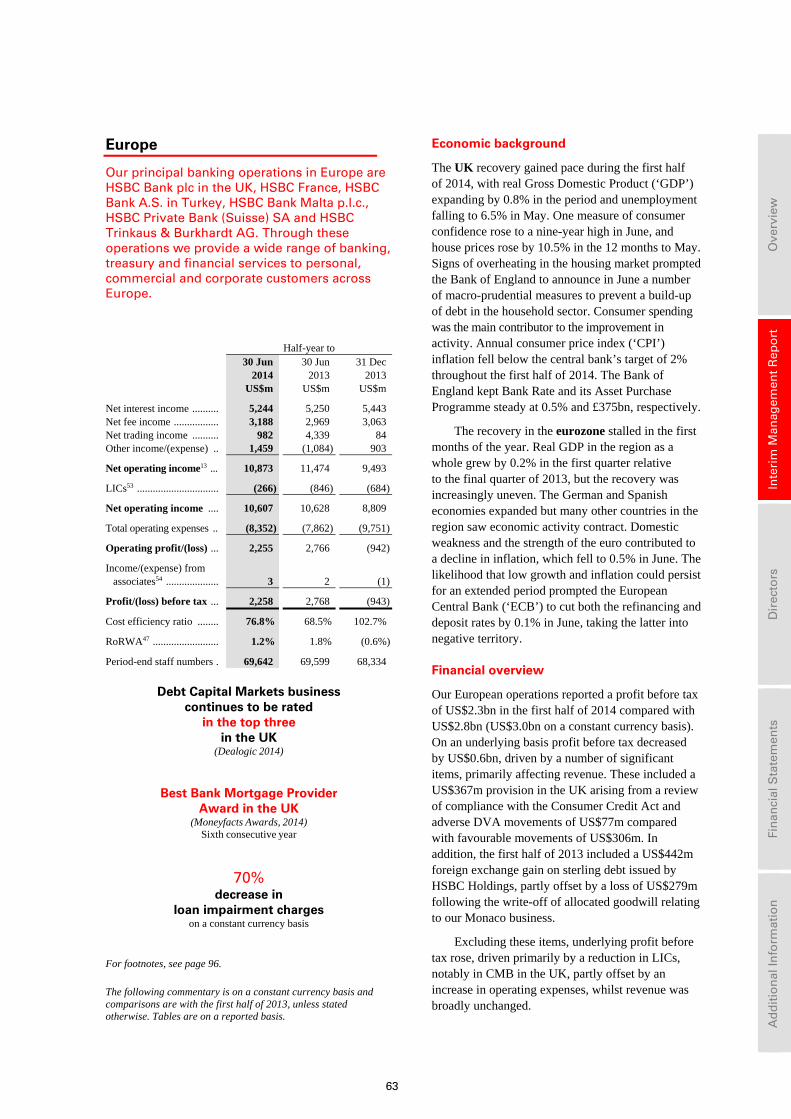
63
Ove
rvie
w
In
teri
m M
anag
emen
t R
epo
rt
D
irec
tors
Fin
anci
al S
tate
men
ts
A
dd
itio
nal
Info
rmat
ion
Europe
Our principal banking operations in Europe are HSBC Bank plc in the UK, HSBC France, HSBC Bank A.S. in Turkey, HSBC Bank Malta p.l.c., HSBC Private Bank (Suisse) SA and HSBC Trinkaus & Burkhardt AG. Through these operations we provide a wide range of banking, treasury and financial services to personal, commercial and corporate customers across Europe.
Half-year to 30 Jun 30 Jun 31 Dec 2014 2013 2013 US$m US$m US$m
Net interest income .......... 5,244 5,250 5,443 Net fee income ................. 3,188 2,969 3,063 Net trading income .......... 982 4,339 84 Other income/(expense) .. 1,459 (1,084) 903
Net operating income13 ... 10,873 11,474 9,493
LICs53 ............................... (266) (846) (684)
Net operating income .... 10,607 10,628 8,809
Total operating expenses .. (8,352) (7,862) (9,751)
Operating profit/(loss) ... 2,255 2,766 (942)
Income/(expense) from associates54 .................... 3 2 (1)
Profit/(loss) before tax ... 2,258 2,768 (943)
Cost efficiency ratio ........ 76.8% 68.5% 102.7%
RoRWA47 ......................... 1.2% 1.8% (0.6%)
Period-end staff numbers . 69,642 69,599 68,334
Debt Capital Markets business continues to be rated
in the top three in the UK
(Dealogic 2014)
Best Bank Mortgage Provider Award in the UK
(Moneyfacts Awards, 2014) Sixth consecutive year
70% decrease in
loan impairment charges on a constant currency basis
For footnotes, see page 96.
The following commentary is on a constant currency basis and comparisons are with the first half of 2013, unless stated otherwise. Tables are on a reported basis.
Economic background
The UK recovery gained pace during the first half of 2014, with real Gross Domestic Product (‘GDP’) expanding by 0.8% in the period and unemployment falling to 6.5% in May. One measure of consumer confidence rose to a nine-year high in June, and house prices rose by 10.5% in the 12 months to May. Signs of overheating in the housing market prompted the Bank of England to announce in June a number of macro-prudential measures to prevent a build-up of debt in the household sector. Consumer spending was the main contributor to the improvement in activity. Annual consumer price index (‘CPI’) inflation fell below the central bank’s target of 2% throughout the first half of 2014. The Bank of England kept Bank Rate and its Asset Purchase Programme steady at 0.5% and £375bn, respectively.
The recovery in the eurozone stalled in the first months of the year. Real GDP in the region as a whole grew by 0.2% in the first quarter relative to the final quarter of 2013, but the recovery was increasingly uneven. The German and Spanish economies expanded but many other countries in the region saw economic activity contract. Domestic weakness and the strength of the euro contributed to a decline in inflation, which fell to 0.5% in June. The likelihood that low growth and inflation could persist for an extended period prompted the European Central Bank (‘ECB’) to cut both the refinancing and deposit rates by 0.1% in June, taking the latter into negative territory.
Financial overview
Our European operations reported a profit before tax of US$2.3bn in the first half of 2014 compared with US$2.8bn (US$3.0bn on a constant currency basis). On an underlying basis profit before tax decreased by US$0.6bn, driven by a number of significant items, primarily affecting revenue. These included a US$367m provision in the UK arising from a review of compliance with the Consumer Credit Act and adverse DVA movements of US$77m compared with favourable movements of US$306m. In addition, the first half of 2013 included a US$442m foreign exchange gain on sterling debt issued by HSBC Holdings, partly offset by a loss of US$279m following the write-off of allocated goodwill relating to our Monaco business.
Excluding these items, underlying profit before tax rose, driven primarily by a reduction in LICs, notably in CMB in the UK, partly offset by an increase in operating expenses, whilst revenue was broadly unchanged.
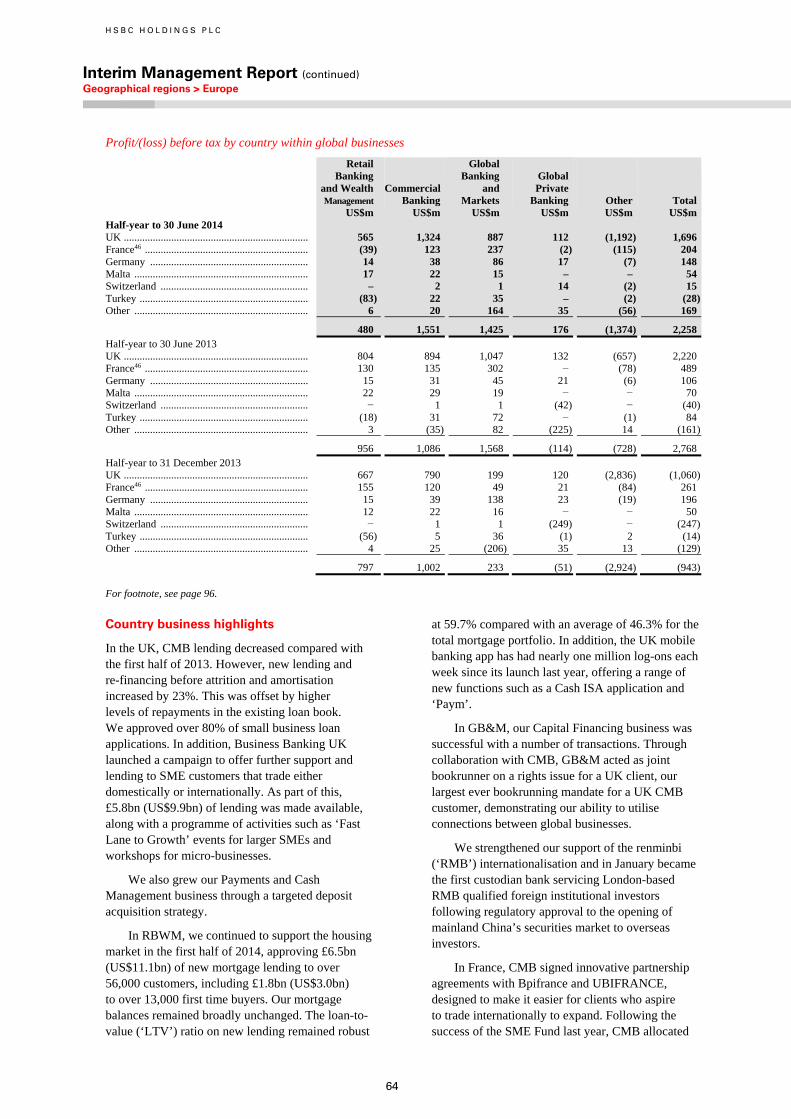
H S B C H O L D I N G S P L C
Interim Management Report (continued) Geographical regions > Europe
64
Profit/(loss) before tax by country within global businesses
Retail Banking and Wealth Management US$m
Commercial Banking US$m
Global Banking and Markets US$m
Global Private Banking US$m
Other US$m
Total US$m
Half-year to 30 June 2014 UK ...................................................................... 565 1,324 887 112 (1,192) 1,696France46 .............................................................. (39) 123 237 (2) (115) 204Germany ............................................................ 14 38 86 17 (7) 148Malta .................................................................. 17 22 15 – – 54Switzerland ........................................................ – 2 1 14 (2) 15Turkey ................................................................ (83) 22 35 – (2) (28)Other .................................................................. 6 20 164 35 (56) 169
480 1,551 1,425 176 (1,374) 2,258Half-year to 30 June 2013 UK ...................................................................... 804 894 1,047 132 (657) 2,220 France46 .............................................................. 130 135 302 − (78) 489 Germany ............................................................ 15 31 45 21 (6) 106 Malta .................................................................. 22 29 19 − − 70 Switzerland ........................................................ − 1 1 (42) − (40)Turkey ................................................................ (18) 31 72 − (1) 84 Other .................................................................. 3 (35) 82 (225) 14 (161)
956 1,086 1,568 (114) (728) 2,768 Half-year to 31 December 2013 UK ...................................................................... 667 790 199 120 (2,836) (1,060)France46 .............................................................. 155 120 49 21 (84) 261Germany ............................................................ 15 39 138 23 (19) 196Malta .................................................................. 12 22 16 − − 50Switzerland ........................................................ − 1 1 (249) − (247)Turkey ................................................................ (56) 5 36 (1) 2 (14)Other .................................................................. 4 25 (206) 35 13 (129)
797 1,002 233 (51) (2,924) (943)
For footnote, see page 96.
Country business highlights
In the UK, CMB lending decreased compared with the first half of 2013. However, new lending and re-financing before attrition and amortisation increased by 23%. This was offset by higher levels of repayments in the existing loan book. We approved over 80% of small business loan applications. In addition, Business Banking UK launched a campaign to offer further support and lending to SME customers that trade either domestically or internationally. As part of this, £5.8bn (US$9.9bn) of lending was made available, along with a programme of activities such as ‘Fast Lane to Growth’ events for larger SMEs and workshops for micro-businesses.
We also grew our Payments and Cash Management business through a targeted deposit acquisition strategy.
In RBWM, we continued to support the housing market in the first half of 2014, approving £6.5bn (US$11.1bn) of new mortgage lending to over 56,000 customers, including £1.8bn (US$3.0bn) to over 13,000 first time buyers. Our mortgage balances remained broadly unchanged. The loan-to-value (‘LTV’) ratio on new lending remained robust
at 59.7% compared with an average of 46.3% for the total mortgage portfolio. In addition, the UK mobile banking app has had nearly one million log-ons each week since its launch last year, offering a range of new functions such as a Cash ISA application and ‘Paym’.
In GB&M, our Capital Financing business was successful with a number of transactions. Through collaboration with CMB, GB&M acted as joint bookrunner on a rights issue for a UK client, our largest ever bookrunning mandate for a UK CMB customer, demonstrating our ability to utilise connections between global businesses.
We strengthened our support of the renminbi (‘RMB’) internationalisation and in January became the first custodian bank servicing London-based RMB qualified foreign institutional investors following regulatory approval to the opening of mainland China’s securities market to overseas investors.
In France, CMB signed innovative partnership agreements with Bpifrance and UBIFRANCE, designed to make it easier for clients who aspire to trade internationally to expand. Following the success of the SME Fund last year, CMB allocated
65
Ove
rvie
w
In
teri
m M
anag
emen
t R
epo
rt
D
irec
tors
Fin
anci
al S
tate
men
ts
A
dd
itio
nal
Info
rmat
ion
another €1.5bn (US$2.0bn) to support customers seeking international growth, approving €0.9bn (US$1.2bn) of lending in the first half of 2014. In RBWM, we continued to focus on growing the home loans proposition by generating high quality new business and long-term relationships with affluent clients, increasing average balances by US$3.3bn.
We continued our growth initiative in Germany with the aim of positioning the corporate banking business as the ‘Leading International Bank’ by extending our product offerings to internationally operating middle market enterprises (Mittelstand) and international corporations.
In Turkey, RBWM launched a new transactional offering campaign ‘Big Step’, attracting over 59,000 customers in the first half of the year. CMB set up a strategic partnership with the Exporters’ Association for customers seeking to trade internationally and embarked upon a programme of structural optimisation of the branch network to drive efficiencies. In addition across CMB Europe, our Trade business embarked on a series of initiatives to enable customers to fulfil their international trade ambitions, which included the roll out of trade academies and the launch of ‘Trade Radar’ communications in local languages. In Switzerland, we continued to reposition the GPB business and focused on growth through the high net worth client segment.
Review of performance
The following commentary is on a constant currency basis and comparisons are with the first half of 2013, unless stated otherwise.
Net interest income decreased by US$0.3bn, primarily due to a provision in the UK arising from a review of compliance with the Consumer Credit Act. Excluding this, net interest income was broadly unchanged as an increase in the UK was offset by a decrease in Turkey.
In the UK, excluding the provision noted above, net interest income increased in GB&M, CMB and RBWM. In GB&M, there was an increase in Capital Financing from growth in volumes, notwithstanding continuing spread compression, and in Balance Sheet Management from rising average balances in liquid asset portfolios. In CMB, net interest income rose due to higher spreads in term lending and deposit volume growth in Payments and Cash Management, although term lending volumes fell, while in RBWM the increase was from growth in deposit volumes and widening deposit spreads, despite narrower lending spreads.
These factors were broadly offset by a decrease in net interest income in Turkey due to interest rate caps on cards and overdrafts imposed by the local regulator.
Net fee income increased marginally, as increases in the UK and Turkey were partly offset by decreases in Switzerland.
In the UK, net fee income in GB&M increased, primarily due to a reduction in fees paid to other regions due to lower activity in Markets. In Capital Financing, the effects of market share and volume gains were broadly offset by fee compression. We also recorded a rise in fees in CMB due to increased volumes of new business lending in the large corporate and mid-market segments. By contrast, there was a decrease in RBWM as a result of higher fees payable under partnership agreements, along with lower investment and overdraft fees.
In Turkey, net fee income rose from growth in card fees. However, in Switzerland in GPB, net fee income decreased, reflecting a reduction in client assets as we continued to reposition the business.
Net trading income decreased by US$3.6bn to US$1.0bn. This included the effects of a number of significant items including:
• adverse movements on non-qualifying hedges of US$144m compared with favourable movements of US$98m in the first half of 2013;
• adverse movements on a DVA of US$77m, compared with favourable movements of US$306m; and
• a foreign exchange gain on sterling debt issued by HSBC Holdings of US$442m in the first half of 2013, which did not recur.
Excluding these items, trading income decreased, primarily in the UK, driven by adverse foreign exchange movements on assets held as economic hedges of foreign currency debt designated at fair value compared with favourable movements in the first half of 2013, with the offset reported in ‘Net income from financial instruments designated at fair value’.
In addition, net trading income in Markets declined, primarily in Foreign Exchange and, to a lesser extent, in Rates, reflecting lower market volatility and reduced client flows. These were partially offset by an increase in Equities, notwithstanding revaluation gains reported in the first half of 2013, as we successfully positioned the business to capture increased client activity.
H S B C H O L D I N G S P L C
Interim Management Report (continued) Geographical regions > Europe
66
Net income from financial instruments designated at fair value was US$1.0bn compared with net expense of US$1.0bn. In the UK, in the first half of 2014 we reported adverse movements on the fair value of our own debt, compared with minimal movements in the first half of 2013.
Excluding this, net income rose, driven by favourable foreign exchange movements on foreign currency debt compared with adverse movements last year.
In addition, there were favourable fair value movements from interest and exchange rate ineffectiveness in the hedging of long-term debt issued principally by HSBC Holdings in 2014, compared with adverse movements in 2013.
Other operating income increased by US$584m, primarily driven by a number of significant items in the first half of 2013:
• a loss following the write-off of allocated goodwill relating to our Monaco business; and
• a loss on the disposal of an HFC Bank secured loan portfolio in the UK.
Excluding these items, other operating income rose as we reported gains from legacy credit in the UK in GB&M reflecting price appreciation across certain asset classes in the ABS market.
LICs decreased by 70% to US$0.3bn, as decreases in the UK and Spain were partially offset by increases in Turkey and France. In the UK, individually and collectively assessed loan impairment charges in CMB fell, reflecting the enhanced quality of the portfolio and improved economic environment. GB&M recorded higher net releases of credit risk provisions on available-for-sale ABSs, mainly reflecting price appreciation on
the legacy portfolio. Loan impairment charges in RBWM also decreased as a result of the improved economic environment and customer behaviour. In Spain, loan impairment charges decreased, as economic conditions improved.
These factors were partially offset by increases in Turkey in RBWM, driven by the growth in the portfolio and the increase in card delinquency rates, and in France in GB&M, from an increase in individually assessed provisions relating to a small number of customers.
Operating expenses were broadly unchanged and included several significant items recorded in the first half of 2013 including:
• Madoff-related litigation charges in GB&M in Ireland (US$298m); and
• a provision in respect of regulatory investigations in GPB in Switzerland (US$119m); partly offset by
• the non-recurrence of the benefit of an accounting gain relating to changes in delivering ill-health benefits to certain employees in the UK (US$430m).
In addition, operating expenses in the first half of 2014 included:
• a reduction of US$178m in charges in the UK relating to customer redress programmes (see page 243 for further details);
• lower restructuring costs of US$50m; and
• adjustments relating to the prior year UK bank levy charges (2014: US$45m credit; 2013 US$9m charge).
Excluding these items, operating expenses increased as a result of the timing of the recognition of the FSCS levy and increased Risk and Compliance expenses in line with the implementation of Global Standards, despite sustainable costs savings of over US$260m.
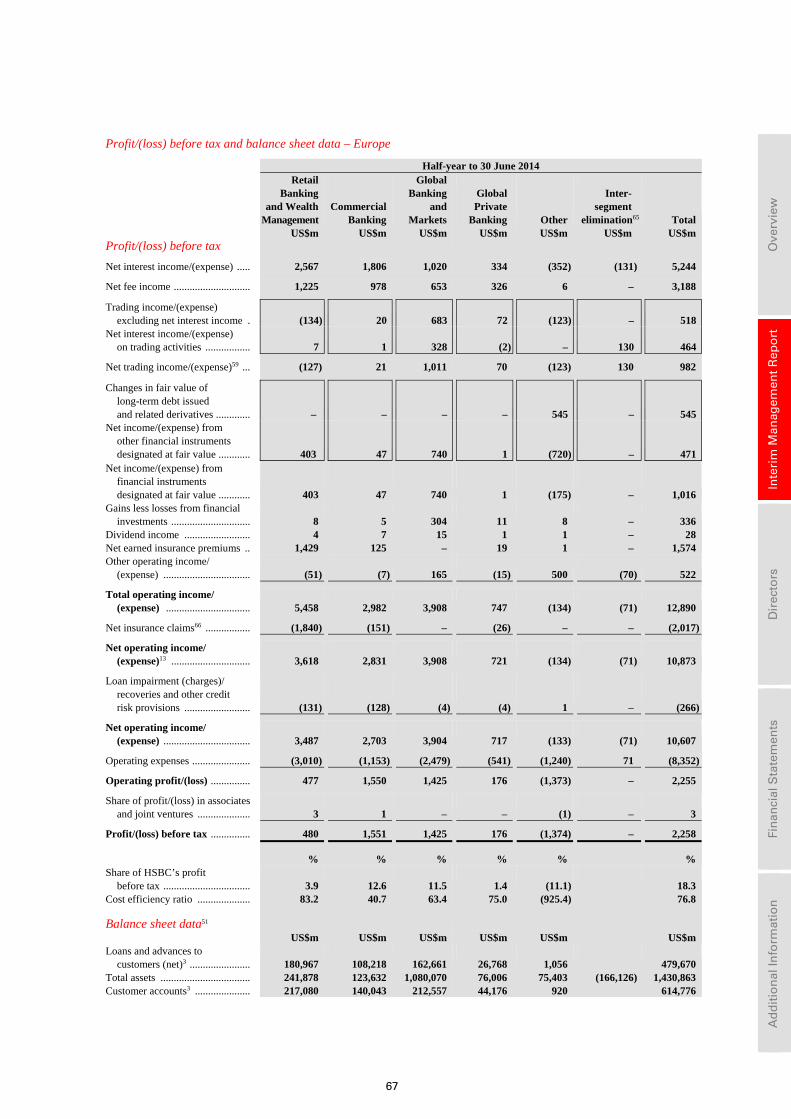
67
Ove
rvie
w
In
teri
m M
anag
emen
t R
epo
rt
D
irec
tors
Fin
anci
al S
tate
men
ts
A
dd
itio
nal
Info
rmat
ion
Profit/(loss) before tax and balance sheet data – Europe
Half-year to 30 June 2014
Retail Banking and Wealth Management US$m
Commercial Banking US$m
Global Banking and Markets US$m
Global Private Banking US$m
Other
US$m
Inter- segment elimination65
US$m Total US$m
Profit/(loss) before tax
Net interest income/(expense) ..... 2,567 1,806 1,020 334 (352) (131) 5,244
Net fee income ............................. 1,225 978 653 326 6 – 3,188
Trading income/(expense) excluding net interest income . (134) 20 683 72 (123) – 518
Net interest income/(expense) on trading activities ................. 7 1 328 (2) – 130 464
Net trading income/(expense)59 ... (127) 21 1,011 70 (123) 130 982
Changes in fair value of long-term debt issued and related derivatives ............. – – – – 545 – 545
Net income/(expense) from other financial instruments designated at fair value ............ 403 47 740 1 (720) – 471
Net income/(expense) from financial instruments designated at fair value ............ 403 47 740 1 (175) – 1,016
Gains less losses from financial investments .............................. 8 5 304 11 8 – 336
Dividend income ......................... 4 7 15 1 1 – 28 Net earned insurance premiums .. 1,429 125 – 19 1 – 1,574 Other operating income/
(expense) ................................. (51) (7) 165 (15) 500 (70) 522
Total operating income/ (expense) ................................ 5,458 2,982 3,908 747 (134) (71) 12,890
Net insurance claims66 ................. (1,840) (151) – (26) – – (2,017)
Net operating income/ (expense)13 .............................. 3,618 2,831 3,908 721 (134) (71) 10,873
Loan impairment (charges)/ recoveries and other credit risk provisions ......................... (131) (128) (4) (4) 1 – (266)
Net operating income/ (expense) ................................. 3,487 2,703 3,904 717 (133) (71) 10,607
Operating expenses ...................... (3,010) (1,153) (2,479) (541) (1,240) 71 (8,352)
Operating profit/(loss) ............... 477 1,550 1,425 176 (1,373) – 2,255
Share of profit/(loss) in associates and joint ventures .................... 3 1 – – (1) – 3
Profit/(loss) before tax ............... 480 1,551 1,425 176 (1,374) – 2,258
% % % % % % Share of HSBC’s profit
before tax ................................. 3.9 12.6 11.5 1.4 (11.1) 18.3 Cost efficiency ratio .................... 83.2 40.7 63.4 75.0 (925.4) 76.8 Balance sheet data51 US$m US$m US$m US$m US$m US$m Loans and advances to
customers (net)3 ....................... 180,967 108,218 162,661 26,768 1,056 479,670 Total assets .................................. 241,878 123,632 1,080,070 76,006 75,403 (166,126) 1,430,863 Customer accounts3 ..................... 217,080 140,043 212,557 44,176 920 614,776
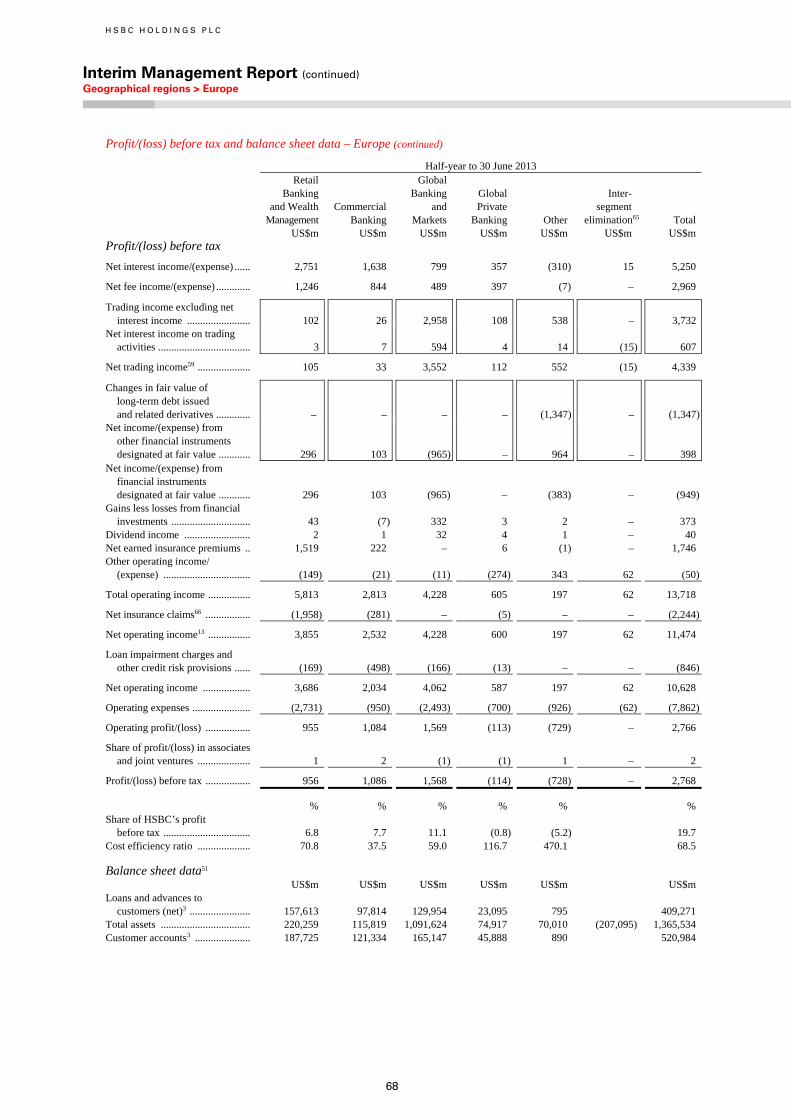
H S B C H O L D I N G S P L C
Interim Management Report (continued) Geographical regions > Europe
68
Profit/(loss) before tax and balance sheet data – Europe (continued)
Half-year to 30 June 2013
Retail Banking and Wealth
Management US$m
Commercial Banking US$m
Global Banking and Markets US$m
Global Private Banking US$m
Other
US$m
Inter- segment elimination65
US$m Total US$m
Profit/(loss) before tax
Net interest income/(expense) ...... 2,751 1,638 799 357 (310) 15 5,250
Net fee income/(expense) ............. 1,246 844 489 397 (7) – 2,969
Trading income excluding net interest income ........................ 102 26 2,958 108 538 – 3,732
Net interest income on trading activities ................................... 3 7 594 4 14 (15) 607
Net trading income59 .................... 105 33 3,552 112 552 (15) 4,339
Changes in fair value of long-term debt issued and related derivatives ............. – – – – (1,347) – (1,347)
Net income/(expense) from other financial instruments designated at fair value ............ 296 103 (965) – 964 – 398
Net income/(expense) from financial instruments designated at fair value ............ 296 103 (965) – (383) – (949)
Gains less losses from financial investments .............................. 43 (7) 332 3 2 – 373
Dividend income ......................... 2 1 32 4 1 – 40 Net earned insurance premiums .. 1,519 222 – 6 (1) – 1,746 Other operating income/
(expense) ................................. (149) (21) (11) (274) 343 62 (50)
Total operating income ................ 5,813 2,813 4,228 605 197 62 13,718
Net insurance claims66 ................. (1,958) (281) – (5) – – (2,244)
Net operating income13 ................ 3,855 2,532 4,228 600 197 62 11,474
Loan impairment charges and other credit risk provisions ...... (169) (498) (166) (13) – – (846)
Net operating income .................. 3,686 2,034 4,062 587 197 62 10,628
Operating expenses ...................... (2,731) (950) (2,493) (700) (926) (62) (7,862)
Operating profit/(loss) ................. 955 1,084 1,569 (113) (729) – 2,766
Share of profit/(loss) in associates and joint ventures .................... 1 2 (1) (1) 1 – 2
Profit/(loss) before tax ................. 956 1,086 1,568 (114) (728) – 2,768
% % % % % % Share of HSBC’s profit
before tax ................................. 6.8 7.7 11.1 (0.8) (5.2) 19.7 Cost efficiency ratio .................... 70.8 37.5 59.0 116.7 470.1 68.5 Balance sheet data51 US$m US$m US$m US$m US$m US$m Loans and advances to
customers (net)3 ....................... 157,613 97,814 129,954 23,095 795 409,271 Total assets .................................. 220,259 115,819 1,091,624 74,917 70,010 (207,095) 1,365,534 Customer accounts3 ..................... 187,725 121,334 165,147 45,888 890 520,984
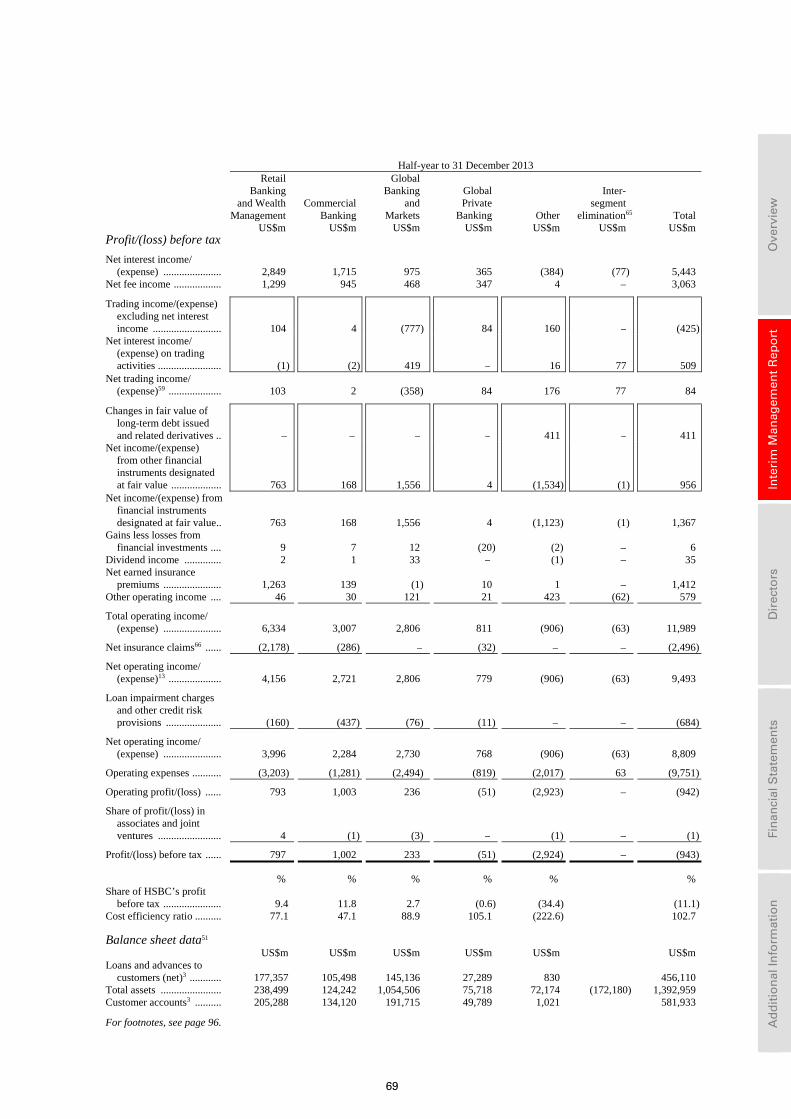
69
Ove
rvie
w
In
teri
m M
anag
emen
t R
epo
rt
D
irec
tors
Fin
anci
al S
tate
men
ts
A
dd
itio
nal
Info
rmat
ion
Half-year to 31 December 2013
Retail Banking and Wealth Management
US$m
Commercial Banking US$m
Global Banking and Markets
US$m
GlobalPrivate
BankingUS$m
Other
US$m
Inter- segment elimination65
US$m Total US$m
Profit/(loss) before tax
Net interest income/ (expense) ...................... 2,849 1,715 975 365 (384) (77) 5,443
Net fee income .................. 1,299 945 468 347 4 – 3,063
Trading income/(expense) excluding net interest income .......................... 104 4 (777) 84 160 – (425)
Net interest income/ (expense) on trading activities ........................ (1) (2) 419 – 16 77 509
Net trading income/ (expense)59 .................... 103 2 (358) 84 176 77 84
Changes in fair value of long-term debt issued and related derivatives .. – – – – 411 – 411
Net income/(expense) from other financial instruments designated at fair value ................... 763 168 1,556 4 (1,534) (1) 956
Net income/(expense) from financial instruments designated at fair value .. 763 168 1,556 4 (1,123) (1) 1,367
Gains less losses from financial investments .... 9 7 12 (20) (2) – 6
Dividend income .............. 2 1 33 – (1) – 35Net earned insurance
premiums ...................... 1,263 139 (1) 10 1 – 1,412Other operating income .... 46 30 121 21 423 (62) 579
Total operating income/ (expense) ...................... 6,334 3,007 2,806 811 (906) (63) 11,989
Net insurance claims66 ...... (2,178) (286) – (32) – – (2,496)
Net operating income/ (expense)13 .................... 4,156 2,721 2,806 779 (906) (63) 9,493
Loan impairment charges and other credit risk provisions ..................... (160)
(437) (76) (11) – – (684)
Net operating income/ (expense) ...................... 3,996 2,284 2,730 768 (906) (63) 8,809
Operating expenses ........... (3,203) (1,281) (2,494) (819) (2,017) 63 (9,751)
Operating profit/(loss) ...... 793 1,003 236 (51) (2,923) – (942)
Share of profit/(loss) in associates and joint ventures ........................ 4 (1) (3) – (1) – (1)
Profit/(loss) before tax ...... 797 1,002 233 (51) (2,924) – (943) % % % % % %Share of HSBC’s profit
before tax ...................... 9.4 11.8 2.7 (0.6) (34.4) (11.1)Cost efficiency ratio .......... 77.1 47.1 88.9 105.1 (222.6) 102.7 Balance sheet data51 US$m US$m US$m US$m US$m US$mLoans and advances to
customers (net)3 ............ 177,357 105,498 145,136 27,289 830 456,110Total assets ....................... 238,499 124,242 1,054,506 75,718 72,174 (172,180) 1,392,959Customer accounts3 .......... 205,288 134,120 191,715 49,789 1,021 581,933
For footnotes, see page 96.
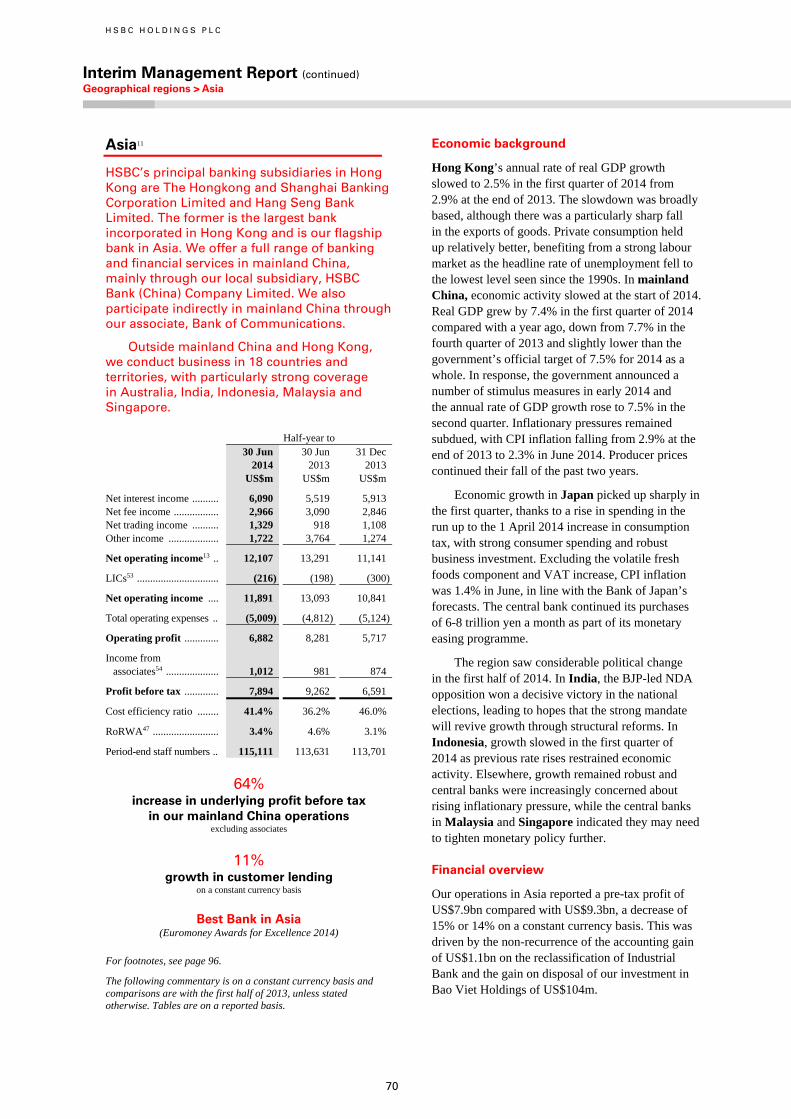
H S B C H O L D I N G S P L C
Interim Management Report (continued) Geographical regions > Asia
70
Asia11
HSBC’s principal banking subsidiaries in Hong Kong are The Hongkong and Shanghai Banking Corporation Limited and Hang Seng Bank Limited. The former is the largest bank incorporated in Hong Kong and is our flagship bank in Asia. We offer a full range of banking and financial services in mainland China, mainly through our local subsidiary, HSBC Bank (China) Company Limited. We also participate indirectly in mainland China through our associate, Bank of Communications.
Outside mainland China and Hong Kong, we conduct business in 18 countries and territories, with particularly strong coverage in Australia, India, Indonesia, Malaysia and Singapore.
Half-year to 30 Jun 30 Jun 31 Dec 2014 2013 2013 US$m US$m US$m
Net interest income .......... 6,090 5,519 5,913 Net fee income ................. 2,966 3,090 2,846 Net trading income .......... 1,329 918 1,108 Other income ................... 1,722 3,764 1,274
Net operating income13 .. 12,107 13,291 11,141
LICs53 ............................... (216) (198) (300)
Net operating income .... 11,891 13,093 10,841
Total operating expenses .. (5,009) (4,812) (5,124)
Operating profit ............. 6,882 8,281 5,717
Income from associates54 .................... 1,012 981 874
Profit before tax ............. 7,894 9,262 6,591
Cost efficiency ratio ........ 41.4% 36.2% 46.0%
RoRWA47 ......................... 3.4% 4.6% 3.1%
Period-end staff numbers .. 115,111 113,631 113,701
64% increase in underlying profit before tax
in our mainland China operations excluding associates
11% growth in customer lending
on a constant currency basis
Best Bank in Asia (Euromoney Awards for Excellence 2014)
For footnotes, see page 96.
The following commentary is on a constant currency basis and comparisons are with the first half of 2013, unless stated otherwise. Tables are on a reported basis.
Economic background
Hong Kong’s annual rate of real GDP growth slowed to 2.5% in the first quarter of 2014 from 2.9% at the end of 2013. The slowdown was broadly based, although there was a particularly sharp fall in the exports of goods. Private consumption held up relatively better, benefiting from a strong labour market as the headline rate of unemployment fell to the lowest level seen since the 1990s. In mainland China, economic activity slowed at the start of 2014. Real GDP grew by 7.4% in the first quarter of 2014 compared with a year ago, down from 7.7% in the fourth quarter of 2013 and slightly lower than the government’s official target of 7.5% for 2014 as a whole. In response, the government announced a number of stimulus measures in early 2014 and the annual rate of GDP growth rose to 7.5% in the second quarter. Inflationary pressures remained subdued, with CPI inflation falling from 2.9% at the end of 2013 to 2.3% in June 2014. Producer prices continued their fall of the past two years.
Economic growth in Japan picked up sharply in the first quarter, thanks to a rise in spending in the run up to the 1 April 2014 increase in consumption tax, with strong consumer spending and robust business investment. Excluding the volatile fresh foods component and VAT increase, CPI inflation was 1.4% in June, in line with the Bank of Japan’s forecasts. The central bank continued its purchases of 6-8 trillion yen a month as part of its monetary easing programme.
The region saw considerable political change in the first half of 2014. In India, the BJP-led NDA opposition won a decisive victory in the national elections, leading to hopes that the strong mandate will revive growth through structural reforms. In Indonesia, growth slowed in the first quarter of 2014 as previous rate rises restrained economic activity. Elsewhere, growth remained robust and central banks were increasingly concerned about rising inflationary pressure, while the central banks in Malaysia and Singapore indicated they may need to tighten monetary policy further.
Financial overview
Our operations in Asia reported a pre-tax profit of US$7.9bn compared with US$9.3bn, a decrease of 15% or 14% on a constant currency basis. This was driven by the non-recurrence of the accounting gain of US$1.1bn on the reclassification of Industrial Bank and the gain on disposal of our investment in Bao Viet Holdings of US$104m.
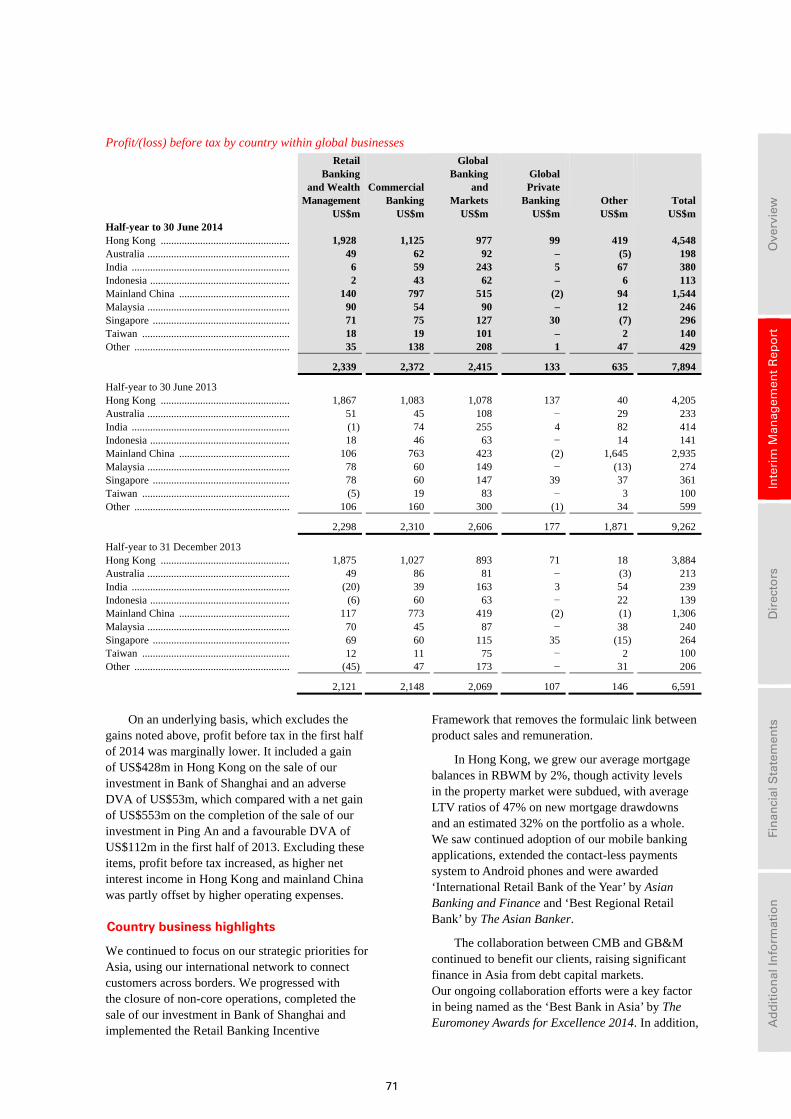
71
Ove
rvie
w
In
teri
m M
anag
emen
t R
epo
rt
D
irec
tors
Fin
anci
al S
tate
men
ts
A
dd
itio
nal
Info
rmat
ion
Profit/(loss) before tax by country within global businesses
Retail Banking and Wealth Management US$m
Commercial Banking US$m
Global Banking and Markets US$m
Global Private Banking US$m
Other US$m
Total US$m
Half-year to 30 June 2014 Hong Kong ................................................. 1,928 1,125 977 99 419 4,548 Australia ...................................................... 49 62 92 – (5) 198 India ............................................................ 6 59 243 5 67 380 Indonesia ..................................................... 2 43 62 – 6 113 Mainland China .......................................... 140 797 515 (2) 94 1,544 Malaysia ...................................................... 90 54 90 – 12 246 Singapore .................................................... 71 75 127 30 (7) 296 Taiwan ........................................................ 18 19 101 – 2 140 Other ........................................................... 35 138 208 1 47 429
2,339 2,372 2,415 133 635 7,894
Half-year to 30 June 2013 Hong Kong ................................................. 1,867 1,083 1,078 137 40 4,205 Australia ...................................................... 51 45 108 − 29 233 India ............................................................ (1) 74 255 4 82 414 Indonesia ..................................................... 18 46 63 − 14 141 Mainland China .......................................... 106 763 423 (2) 1,645 2,935 Malaysia ...................................................... 78 60 149 − (13) 274 Singapore .................................................... 78 60 147 39 37 361 Taiwan ........................................................ (5) 19 83 − 3 100 Other ........................................................... 106 160 300 (1) 34 599
2,298 2,310 2,606 177 1,871 9,262
Half-year to 31 December 2013 Hong Kong ................................................. 1,875 1,027 893 71 18 3,884 Australia ...................................................... 49 86 81 − (3) 213 India ............................................................ (20) 39 163 3 54 239 Indonesia ..................................................... (6) 60 63 − 22 139 Mainland China .......................................... 117 773 419 (2) (1) 1,306 Malaysia ...................................................... 70 45 87 − 38 240 Singapore .................................................... 69 60 115 35 (15) 264 Taiwan ........................................................ 12 11 75 − 2 100 Other ........................................................... (45) 47 173 − 31 206
2,121 2,148 2,069 107 146 6,591
On an underlying basis, which excludes the
gains noted above, profit before tax in the first half of 2014 was marginally lower. It included a gain of US$428m in Hong Kong on the sale of our investment in Bank of Shanghai and an adverse DVA of US$53m, which compared with a net gain of US$553m on the completion of the sale of our investment in Ping An and a favourable DVA of US$112m in the first half of 2013. Excluding these items, profit before tax increased, as higher net interest income in Hong Kong and mainland China was partly offset by higher operating expenses.
Country business highlights
We continued to focus on our strategic priorities for Asia, using our international network to connect customers across borders. We progressed with the closure of non-core operations, completed the sale of our investment in Bank of Shanghai and implemented the Retail Banking Incentive
Framework that removes the formulaic link between product sales and remuneration.
In Hong Kong, we grew our average mortgage balances in RBWM by 2%, though activity levels in the property market were subdued, with average LTV ratios of 47% on new mortgage drawdowns and an estimated 32% on the portfolio as a whole. We saw continued adoption of our mobile banking applications, extended the contact-less payments system to Android phones and were awarded ‘International Retail Bank of the Year’ by Asian Banking and Finance and ‘Best Regional Retail Bank’ by The Asian Banker.
The collaboration between CMB and GB&M continued to benefit our clients, raising significant finance in Asia from debt capital markets. Our ongoing collaboration efforts were a key factor in being named as the ‘Best Bank in Asia’ by The Euromoney Awards for Excellence 2014. In addition,
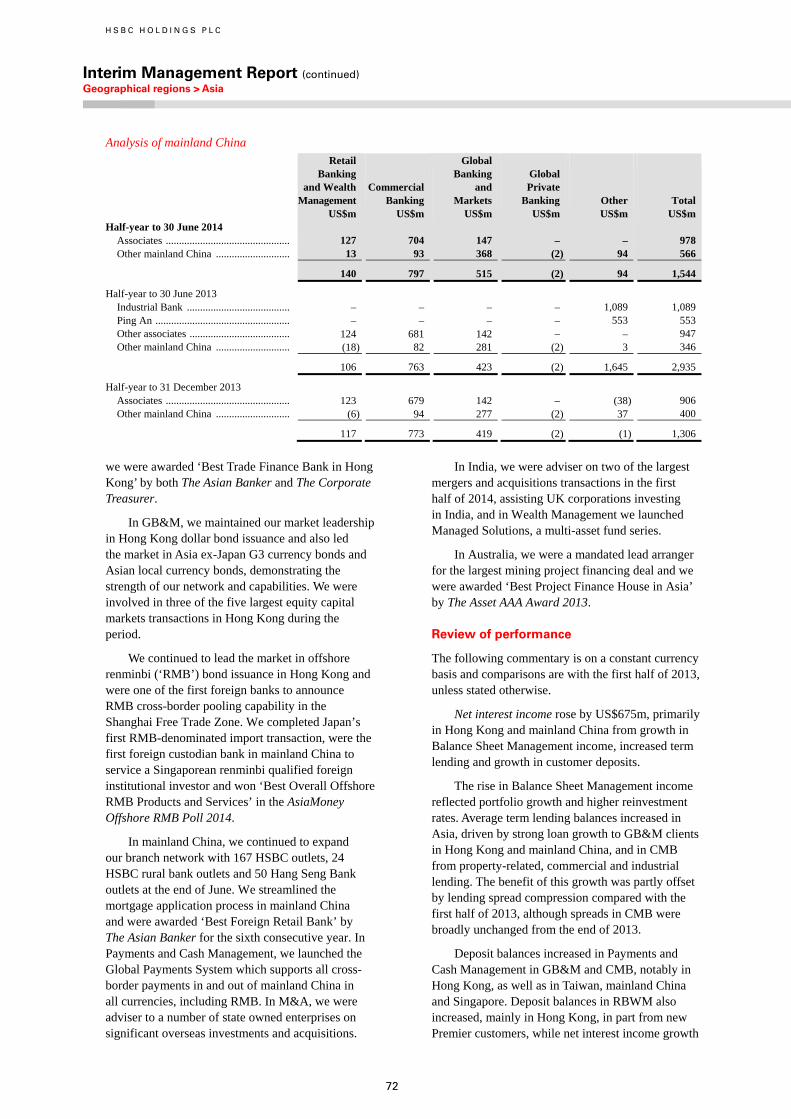
H S B C H O L D I N G S P L C
Interim Management Report (continued) Geographical regions > Asia
72
Analysis of mainland China
Retail Banking and Wealth Management US$m
Commercial Banking US$m
Global Banking and Markets US$m
Global Private Banking US$m
Other US$m
Total US$m
Half-year to 30 June 2014 Associates ............................................... 127 704 147 – – 978 Other mainland China ............................ 13 93 368 (2) 94 566
140 797 515 (2) 94 1,544
Half-year to 30 June 2013 Industrial Bank ....................................... – – – – 1,089 1,089 Ping An ................................................... – – – – 553 553 Other associates ...................................... 124 681 142 – – 947 Other mainland China ............................ (18) 82 281 (2) 3 346
106 763 423 (2) 1,645 2,935
Half-year to 31 December 2013 Associates ............................................... 123 679 142 – (38) 906 Other mainland China ............................ (6) 94 277 (2) 37 400
117 773 419 (2) (1) 1,306
we were awarded ‘Best Trade Finance Bank in Hong Kong’ by both The Asian Banker and The Corporate Treasurer.
In GB&M, we maintained our market leadership in Hong Kong dollar bond issuance and also led the market in Asia ex-Japan G3 currency bonds and Asian local currency bonds, demonstrating the strength of our network and capabilities. We were involved in three of the five largest equity capital markets transactions in Hong Kong during the period.
We continued to lead the market in offshore renminbi (‘RMB’) bond issuance in Hong Kong and were one of the first foreign banks to announce RMB cross-border pooling capability in the Shanghai Free Trade Zone. We completed Japan’s first RMB-denominated import transaction, were the first foreign custodian bank in mainland China to service a Singaporean renminbi qualified foreign institutional investor and won ‘Best Overall Offshore RMB Products and Services’ in the AsiaMoney Offshore RMB Poll 2014.
In mainland China, we continued to expand our branch network with 167 HSBC outlets, 24 HSBC rural bank outlets and 50 Hang Seng Bank outlets at the end of June. We streamlined the mortgage application process in mainland China and were awarded ‘Best Foreign Retail Bank’ by The Asian Banker for the sixth consecutive year. In Payments and Cash Management, we launched the Global Payments System which supports all cross-border payments in and out of mainland China in all currencies, including RMB. In M&A, we were adviser to a number of state owned enterprises on significant overseas investments and acquisitions.
In India, we were adviser on two of the largest mergers and acquisitions transactions in the first half of 2014, assisting UK corporations investing in India, and in Wealth Management we launched Managed Solutions, a multi-asset fund series.
In Australia, we were a mandated lead arranger for the largest mining project financing deal and we were awarded ‘Best Project Finance House in Asia’ by The Asset AAA Award 2013.
Review of performance
The following commentary is on a constant currency basis and comparisons are with the first half of 2013, unless stated otherwise.
Net interest income rose by US$675m, primarily in Hong Kong and mainland China from growth in Balance Sheet Management income, increased term lending and growth in customer deposits.
The rise in Balance Sheet Management income reflected portfolio growth and higher reinvestment rates. Average term lending balances increased in Asia, driven by strong loan growth to GB&M clients in Hong Kong and mainland China, and in CMB from property-related, commercial and industrial lending. The benefit of this growth was partly offset by lending spread compression compared with the first half of 2013, although spreads in CMB were broadly unchanged from the end of 2013.
Deposit balances increased in Payments and Cash Management in GB&M and CMB, notably in Hong Kong, as well as in Taiwan, mainland China and Singapore. Deposit balances in RBWM also increased, mainly in Hong Kong, in part from new Premier customers, while net interest income growth
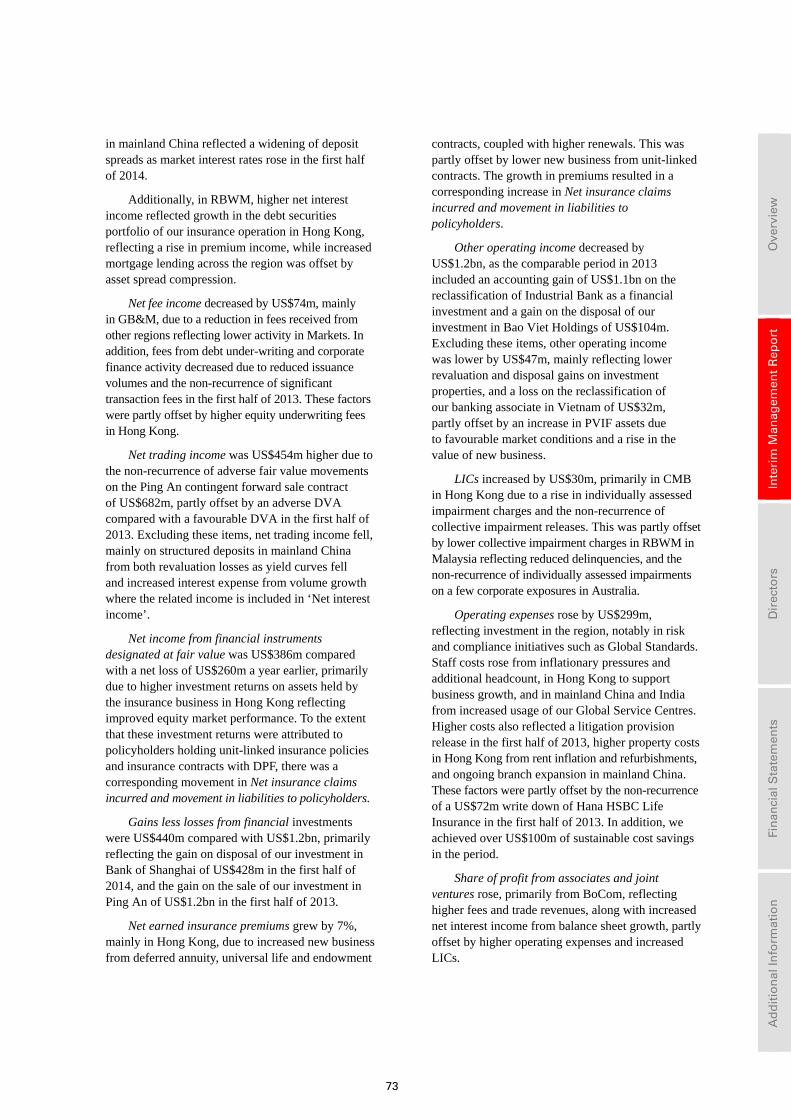
73
Ove
rvie
w
In
teri
m M
anag
emen
t R
epo
rt
D
irec
tors
Fin
anci
al S
tate
men
ts
A
dd
itio
nal
Info
rmat
ion
in mainland China reflected a widening of deposit spreads as market interest rates rose in the first half of 2014.
Additionally, in RBWM, higher net interest income reflected growth in the debt securities portfolio of our insurance operation in Hong Kong, reflecting a rise in premium income, while increased mortgage lending across the region was offset by asset spread compression.
Net fee income decreased by US$74m, mainly in GB&M, due to a reduction in fees received from other regions reflecting lower activity in Markets. In addition, fees from debt under-writing and corporate finance activity decreased due to reduced issuance volumes and the non-recurrence of significant transaction fees in the first half of 2013. These factors were partly offset by higher equity underwriting fees in Hong Kong.
Net trading income was US$454m higher due to the non-recurrence of adverse fair value movements on the Ping An contingent forward sale contract of US$682m, partly offset by an adverse DVA compared with a favourable DVA in the first half of 2013. Excluding these items, net trading income fell, mainly on structured deposits in mainland China from both revaluation losses as yield curves fell and increased interest expense from volume growth where the related income is included in ‘Net interest income’.
Net income from financial instruments designated at fair value was US$386m compared with a net loss of US$260m a year earlier, primarily due to higher investment returns on assets held by the insurance business in Hong Kong reflecting improved equity market performance. To the extent that these investment returns were attributed to policyholders holding unit-linked insurance policies and insurance contracts with DPF, there was a corresponding movement in Net insurance claims incurred and movement in liabilities to policyholders.
Gains less losses from financial investments were US$440m compared with US$1.2bn, primarily reflecting the gain on disposal of our investment in Bank of Shanghai of US$428m in the first half of 2014, and the gain on the sale of our investment in Ping An of US$1.2bn in the first half of 2013.
Net earned insurance premiums grew by 7%, mainly in Hong Kong, due to increased new business from deferred annuity, universal life and endowment
contracts, coupled with higher renewals. This was partly offset by lower new business from unit-linked contracts. The growth in premiums resulted in a corresponding increase in Net insurance claims incurred and movement in liabilities to policyholders.
Other operating income decreased by US$1.2bn, as the comparable period in 2013 included an accounting gain of US$1.1bn on the reclassification of Industrial Bank as a financial investment and a gain on the disposal of our investment in Bao Viet Holdings of US$104m. Excluding these items, other operating income was lower by US$47m, mainly reflecting lower revaluation and disposal gains on investment properties, and a loss on the reclassification of our banking associate in Vietnam of US$32m, partly offset by an increase in PVIF assets due to favourable market conditions and a rise in the value of new business.
LICs increased by US$30m, primarily in CMB in Hong Kong due to a rise in individually assessed impairment charges and the non-recurrence of collective impairment releases. This was partly offset by lower collective impairment charges in RBWM in Malaysia reflecting reduced delinquencies, and the non-recurrence of individually assessed impairments on a few corporate exposures in Australia.
Operating expenses rose by US$299m, reflecting investment in the region, notably in risk and compliance initiatives such as Global Standards. Staff costs rose from inflationary pressures and additional headcount, in Hong Kong to support business growth, and in mainland China and India from increased usage of our Global Service Centres. Higher costs also reflected a litigation provision release in the first half of 2013, higher property costs in Hong Kong from rent inflation and refurbishments, and ongoing branch expansion in mainland China. These factors were partly offset by the non-recurrence of a US$72m write down of Hana HSBC Life Insurance in the first half of 2013. In addition, we achieved over US$100m of sustainable cost savings in the period.
Share of profit from associates and joint ventures rose, primarily from BoCom, reflecting higher fees and trade revenues, along with increased net interest income from balance sheet growth, partly offset by higher operating expenses and increased LICs.
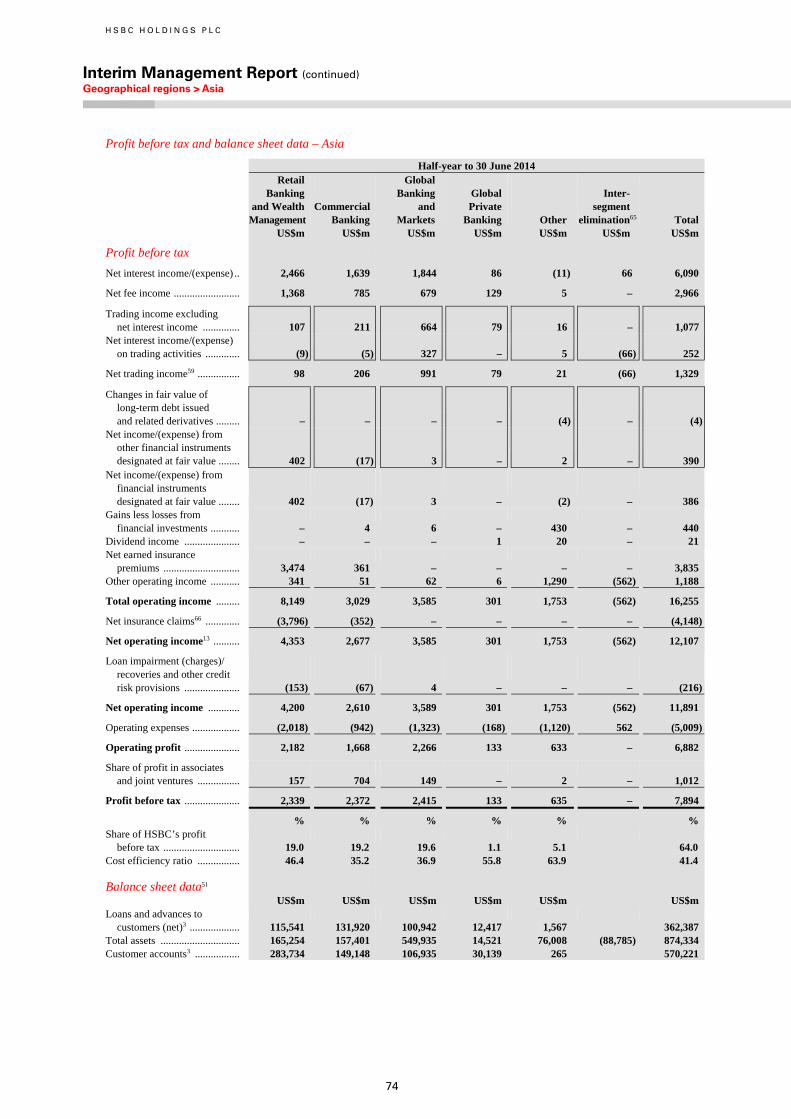
H S B C H O L D I N G S P L C
Interim Management Report (continued) Geographical regions > Asia
74
Profit before tax and balance sheet data – Asia
Half-year to 30 June 2014
Retail Banking and Wealth Management US$m
Commercial Banking US$m
Global Banking and Markets US$m
Global Private Banking US$m
Other US$m
Inter- segment elimination65 US$m
Total US$m
Profit before tax
Net interest income/(expense) .. 2,466 1,639 1,844 86 (11) 66 6,090
Net fee income ......................... 1,368 785 679 129 5 – 2,966
Trading income excluding net interest income .............. 107 211 664 79 16 – 1,077
Net interest income/(expense) on trading activities ............. (9) (5) 327 – 5 (66) 252
Net trading income59 ................ 98 206 991 79 21 (66) 1,329
Changes in fair value of long-term debt issued and related derivatives ......... – – – – (4) – (4)
Net income/(expense) from other financial instruments designated at fair value ........ 402 (17) 3 – 2 – 390
Net income/(expense) from financial instruments designated at fair value ........ 402 (17) 3 – (2) – 386
Gains less losses from financial investments ........... – 4 6 – 430 – 440
Dividend income ..................... – – – 1 20 – 21 Net earned insurance
premiums ............................. 3,474 361 – – – – 3,835 Other operating income ........... 341 51 62 6 1,290 (562) 1,188
Total operating income ......... 8,149 3,029 3,585 301 1,753 (562) 16,255
Net insurance claims66 ............. (3,796) (352) – – – – (4,148)
Net operating income13 .......... 4,353 2,677 3,585 301 1,753 (562) 12,107
Loan impairment (charges)/ recoveries and other credit risk provisions ..................... (153) (67) 4 – – – (216)
Net operating income ............ 4,200 2,610 3,589 301 1,753 (562) 11,891
Operating expenses .................. (2,018) (942) (1,323) (168) (1,120) 562 (5,009)
Operating profit ..................... 2,182 1,668 2,266 133 633 – 6,882
Share of profit in associates and joint ventures ................ 157 704 149 – 2 – 1,012
Profit before tax ..................... 2,339 2,372 2,415 133 635 – 7,894
% % % % % % Share of HSBC’s profit
before tax ............................. 19.0 19.2 19.6 1.1 5.1 64.0 Cost efficiency ratio ................ 46.4 35.2 36.9 55.8 63.9 41.4 Balance sheet data51 US$m US$m US$m US$m US$m US$m Loans and advances to
customers (net)3 ................... 115,541 131,920 100,942 12,417 1,567 362,387 Total assets .............................. 165,254 157,401 549,935 14,521 76,008 (88,785) 874,334 Customer accounts3 ................. 283,734 149,148 106,935 30,139 265 570,221
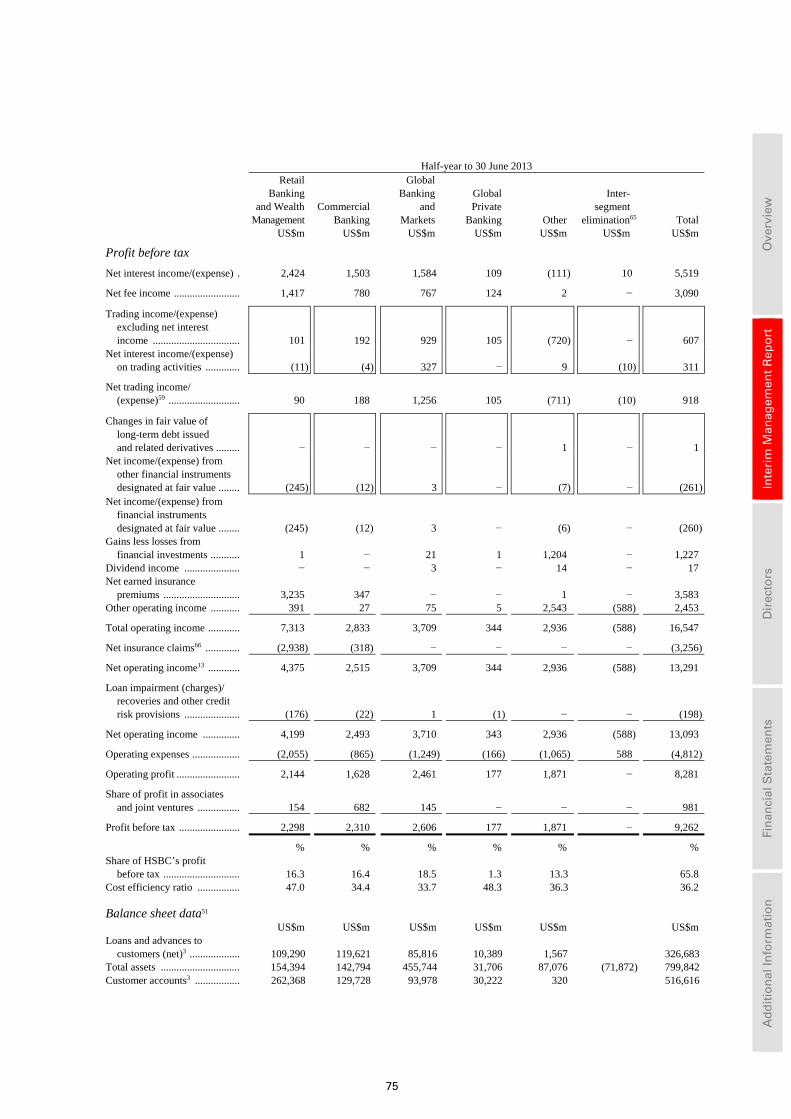
75
Ove
rvie
w
In
teri
m M
anag
emen
t R
epo
rt
D
irec
tors
Fin
anci
al S
tate
men
ts
A
dd
itio
nal
Info
rmat
ion
Half-year to 30 June 2013
Retail Banking and Wealth Management US$m
Commercial Banking US$m
Global Banking and Markets US$m
Global Private Banking US$m
Other US$m
Inter- segment elimination65 US$m
Total US$m
Profit before tax
Net interest income/(expense) . 2,424 1,503 1,584 109 (111) 10 5,519
Net fee income ......................... 1,417 780 767 124 2 − 3,090
Trading income/(expense) excluding net interest income ................................. 101 192 929 105 (720) − 607
Net interest income/(expense) on trading activities ............. (11) (4) 327 − 9 (10) 311
Net trading income/ (expense)59 ........................... 90 188 1,256 105 (711) (10) 918
Changes in fair value of long-term debt issued and related derivatives ......... − − − − 1 − 1
Net income/(expense) from other financial instruments designated at fair value ........ (245) (12) 3 − (7) − (261)
Net income/(expense) from financial instruments designated at fair value ........ (245) (12) 3 − (6) − (260)
Gains less losses from financial investments ........... 1 − 21 1 1,204 − 1,227
Dividend income ..................... − − 3 − 14 − 17 Net earned insurance
premiums ............................. 3,235 347 − − 1 − 3,583 Other operating income ........... 391 27 75 5 2,543 (588) 2,453
Total operating income ............ 7,313 2,833 3,709 344 2,936 (588) 16,547
Net insurance claims66 ............. (2,938) (318) − − − − (3,256)
Net operating income13 ............ 4,375 2,515 3,709 344 2,936 (588) 13,291
Loan impairment (charges)/ recoveries and other credit risk provisions ..................... (176) (22) 1 (1) − − (198)
Net operating income .............. 4,199 2,493 3,710 343 2,936 (588) 13,093
Operating expenses .................. (2,055) (865) (1,249) (166) (1,065) 588 (4,812)
Operating profit ........................ 2,144 1,628 2,461 177 1,871 − 8,281
Share of profit in associates and joint ventures ................ 154 682 145 − − − 981
Profit before tax ....................... 2,298 2,310 2,606 177 1,871 − 9,262
% % % % % % Share of HSBC’s profit
before tax ............................. 16.3 16.4 18.5 1.3 13.3 65.8 Cost efficiency ratio ................ 47.0 34.4 33.7 48.3 36.3 36.2 Balance sheet data51 US$m US$m US$m US$m US$m US$m Loans and advances to
customers (net)3 ................... 109,290 119,621 85,816 10,389 1,567 326,683Total assets .............................. 154,394 142,794 455,744 31,706 87,076 (71,872) 799,842 Customer accounts3 ................. 262,368 129,728 93,978 30,222 320 516,616
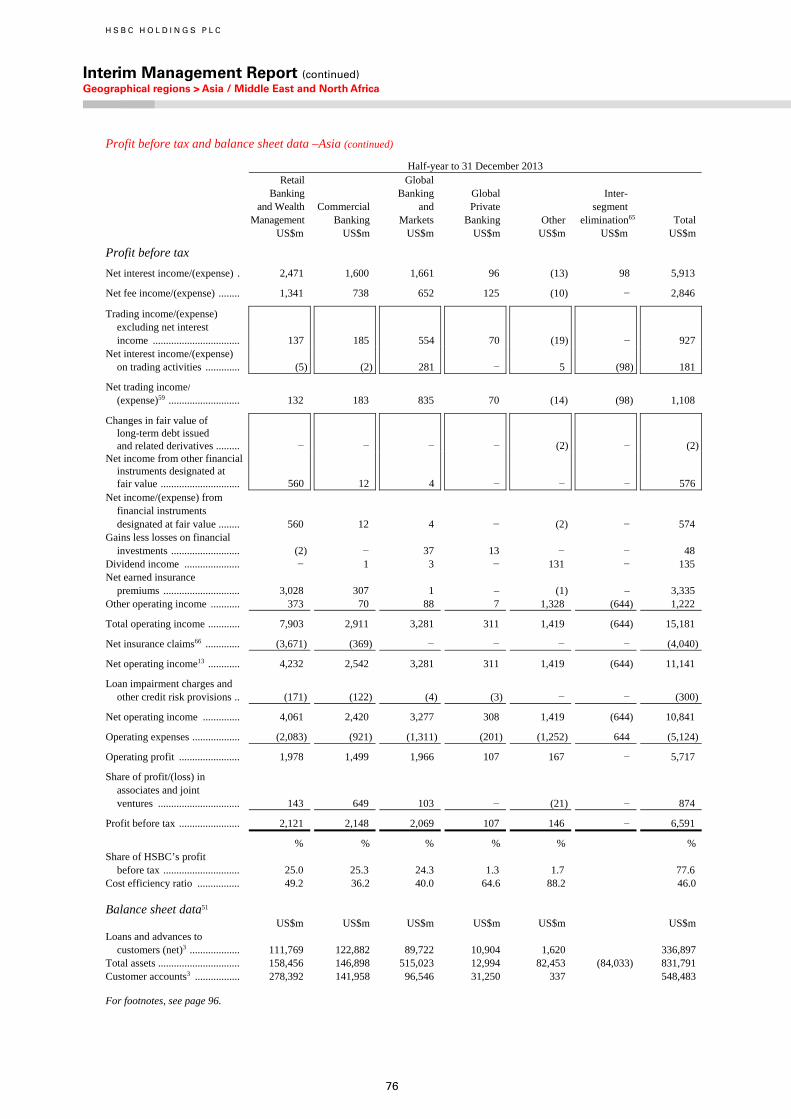
H S B C H O L D I N G S P L C
Interim Management Report (continued) Geographical regions > Asia / Middle East and North Africa
76
Profit before tax and balance sheet data –Asia (continued)
Half-year to 31 December 2013
Retail Banking and Wealth Management US$m
Commercial Banking US$m
Global Banking and Markets US$m
Global Private Banking US$m
Other US$m
Inter- segment elimination65 US$m
Total US$m
Profit before tax
Net interest income/(expense) . 2,471 1,600 1,661 96 (13) 98 5,913
Net fee income/(expense) ........ 1,341 738 652 125 (10) − 2,846
Trading income/(expense) excluding net interest income ................................. 137 185 554 70 (19) − 927
Net interest income/(expense) on trading activities ............. (5) (2) 281 − 5 (98) 181
Net trading income/ (expense)59 ........................... 132 183 835 70 (14) (98) 1,108
Changes in fair value of long-term debt issued and related derivatives ......... − − − − (2) − (2)
Net income from other financial instruments designated at fair value .............................. 560 12 4 − − − 576
Net income/(expense) from financial instruments designated at fair value ........ 560 12 4 − (2) − 574
Gains less losses on financial investments .......................... (2) − 37 13 − − 48
Dividend income ..................... − 1 3 − 131 − 135 Net earned insurance
premiums ............................. 3,028 307 1 – (1) – 3,335 Other operating income ........... 373 70 88 7 1,328 (644) 1,222
Total operating income ............ 7,903 2,911 3,281 311 1,419 (644) 15,181
Net insurance claims66 ............. (3,671) (369) − − − − (4,040)
Net operating income13 ............ 4,232 2,542 3,281 311 1,419 (644) 11,141
Loan impairment charges and other credit risk provisions .. (171) (122) (4) (3) − − (300)
Net operating income .............. 4,061 2,420 3,277 308 1,419 (644) 10,841
Operating expenses .................. (2,083) (921) (1,311) (201) (1,252) 644 (5,124)
Operating profit ....................... 1,978 1,499 1,966 107 167 − 5,717
Share of profit/(loss) in associates and joint ventures ............................... 143 649 103 − (21) − 874
Profit before tax ....................... 2,121 2,148 2,069 107 146 − 6,591
% % % % % % Share of HSBC’s profit
before tax ............................. 25.0 25.3 24.3 1.3 1.7 77.6 Cost efficiency ratio ................ 49.2 36.2 40.0 64.6 88.2 46.0 Balance sheet data51 US$m US$m US$m US$m US$m US$m Loans and advances to
customers (net)3 ................... 111,769 122,882 89,722 10,904 1,620 336,897 Total assets ............................... 158,456 146,898 515,023 12,994 82,453 (84,033) 831,791 Customer accounts3 ................. 278,392 141,958 96,546 31,250 337 548,483
For footnotes, see page 96.
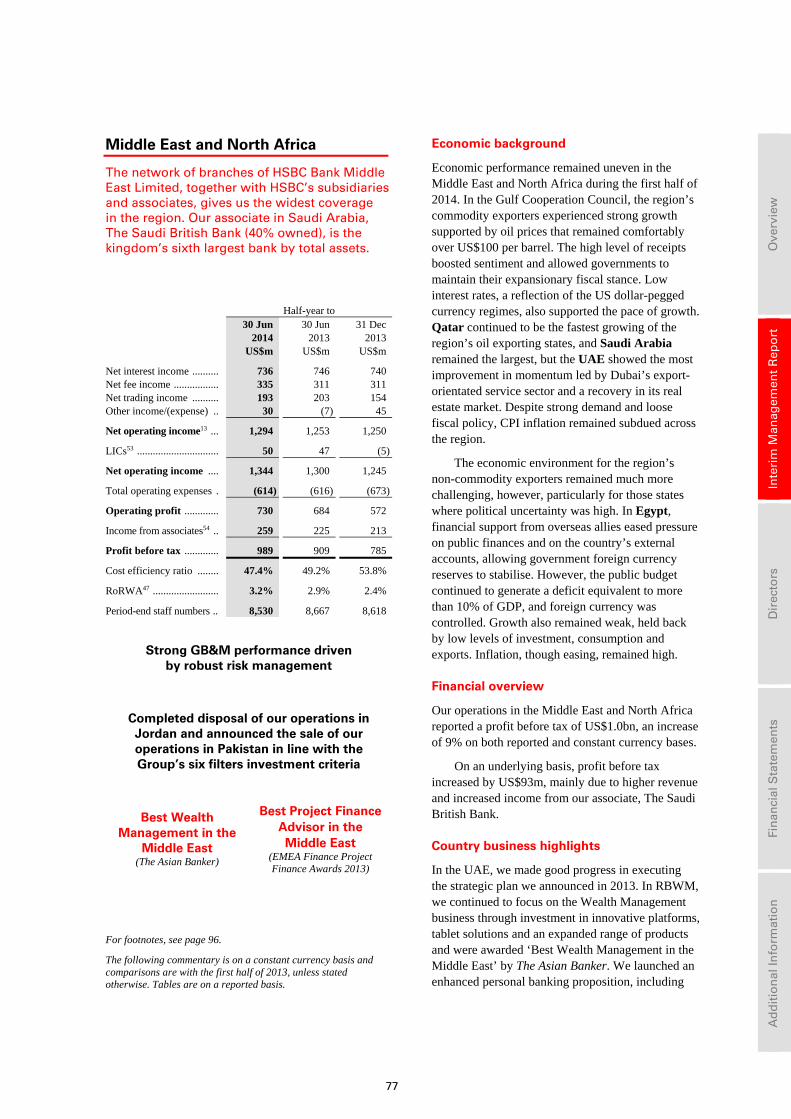
77
Ove
rvie
w
In
teri
m M
anag
emen
t R
epo
rt
D
irec
tors
Fin
anci
al S
tate
men
ts
A
dd
itio
nal
Info
rmat
ion
Middle East and North Africa
The network of branches of HSBC Bank Middle East Limited, together with HSBC’s subsidiaries and associates, gives us the widest coverage in the region. Our associate in Saudi Arabia, The Saudi British Bank (40% owned), is the kingdom’s sixth largest bank by total assets.
Half-year to 30 Jun 30 Jun 31 Dec 2014 2013 2013 US$m US$m US$m
Net interest income .......... 736 746 740 Net fee income ................. 335 311 311 Net trading income .......... 193 203 154 Other income/(expense) .. 30 (7) 45
Net operating income13 ... 1,294 1,253 1,250
LICs53 ............................... 50 47 (5)
Net operating income .... 1,344 1,300 1,245
Total operating expenses . (614) (616) (673)
Operating profit ............. 730 684 572
Income from associates54 .. 259 225 213
Profit before tax ............. 989 909 785
Cost efficiency ratio ........ 47.4% 49.2% 53.8%
RoRWA47 ......................... 3.2% 2.9% 2.4%
Period-end staff numbers .. 8,530 8,667 8,618
Strong GB&M performance driven by robust risk management
Completed disposal of our operations in Jordan and announced the sale of our operations in Pakistan in line with the Group’s six filters investment criteria
Best Wealth Management in the
Middle East (The Asian Banker)
Best Project Finance Advisor in the Middle East
(EMEA Finance Project Finance Awards 2013)
For footnotes, see page 96.
The following commentary is on a constant currency basis and comparisons are with the first half of 2013, unless stated otherwise. Tables are on a reported basis.
Economic background
Economic performance remained uneven in the Middle East and North Africa during the first half of 2014. In the Gulf Cooperation Council, the region’s commodity exporters experienced strong growth supported by oil prices that remained comfortably over US$100 per barrel. The high level of receipts boosted sentiment and allowed governments to maintain their expansionary fiscal stance. Low interest rates, a reflection of the US dollar-pegged currency regimes, also supported the pace of growth. Qatar continued to be the fastest growing of the region’s oil exporting states, and Saudi Arabia remained the largest, but the UAE showed the most improvement in momentum led by Dubai’s export-orientated service sector and a recovery in its real estate market. Despite strong demand and loose fiscal policy, CPI inflation remained subdued across the region.
The economic environment for the region’s non-commodity exporters remained much more challenging, however, particularly for those states where political uncertainty was high. In Egypt, financial support from overseas allies eased pressure on public finances and on the country’s external accounts, allowing government foreign currency reserves to stabilise. However, the public budget continued to generate a deficit equivalent to more than 10% of GDP, and foreign currency was controlled. Growth also remained weak, held back by low levels of investment, consumption and exports. Inflation, though easing, remained high.
Financial overview
Our operations in the Middle East and North Africa reported a profit before tax of US$1.0bn, an increase of 9% on both reported and constant currency bases.
On an underlying basis, profit before tax increased by US$93m, mainly due to higher revenue and increased income from our associate, The Saudi British Bank.
Country business highlights
In the UAE, we made good progress in executing the strategic plan we announced in 2013. In RBWM, we continued to focus on the Wealth Management business through investment in innovative platforms, tablet solutions and an expanded range of products and were awarded ‘Best Wealth Management in the Middle East’ by The Asian Banker. We launched an enhanced personal banking proposition, including
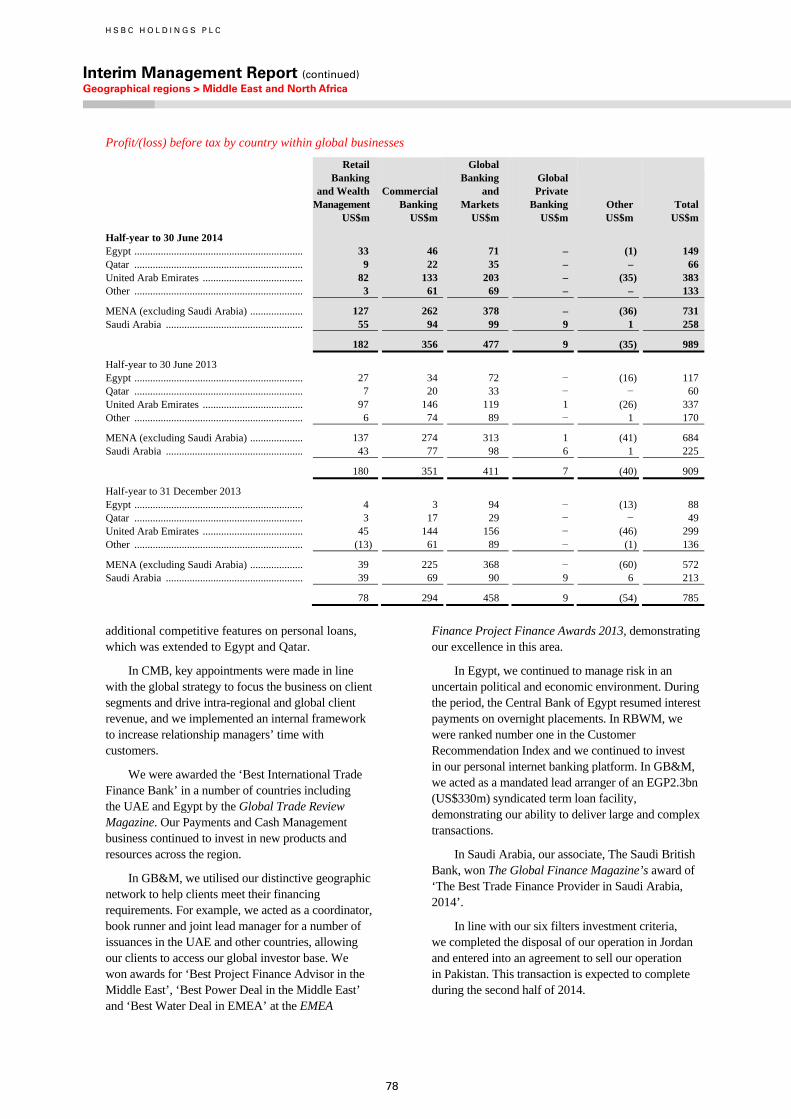
H S B C H O L D I N G S P L C
Interim Management Report (continued) Geographical regions > Middle East and North Africa
78
Profit/(loss) before tax by country within global businesses
Retail Banking and Wealth Management US$m
Commercial Banking US$m
Global Banking and Markets US$m
Global Private Banking US$m
Other US$m
Total US$m
Half-year to 30 June 2014 Egypt ................................................................ 33 46 71 – (1) 149 Qatar ................................................................ 9 22 35 – – 66 United Arab Emirates ...................................... 82 133 203 – (35) 383 Other ................................................................ 3 61 69 – – 133
MENA (excluding Saudi Arabia) .................... 127 262 378 – (36) 731 Saudi Arabia .................................................... 55 94 99 9 1 258
182 356 477 9 (35) 989
Half-year to 30 June 2013 Egypt ................................................................ 27 34 72 − (16) 117 Qatar ................................................................ 7 20 33 − − 60 United Arab Emirates ...................................... 97 146 119 1 (26) 337 Other ................................................................ 6 74 89 − 1 170
MENA (excluding Saudi Arabia) .................... 137 274 313 1 (41) 684 Saudi Arabia .................................................... 43 77 98 6 1 225
180 351 411 7 (40) 909
Half-year to 31 December 2013 Egypt ................................................................ 4 3 94 − (13) 88 Qatar ................................................................ 3 17 29 − − 49 United Arab Emirates ...................................... 45 144 156 − (46) 299 Other ................................................................ (13) 61 89 − (1) 136
MENA (excluding Saudi Arabia) .................... 39 225 368 − (60) 572 Saudi Arabia .................................................... 39 69 90 9 6 213
78 294 458 9 (54) 785
additional competitive features on personal loans, which was extended to Egypt and Qatar.
In CMB, key appointments were made in line with the global strategy to focus the business on client segments and drive intra-regional and global client revenue, and we implemented an internal framework to increase relationship managers’ time with customers.
We were awarded the ‘Best International Trade Finance Bank’ in a number of countries including the UAE and Egypt by the Global Trade Review Magazine. Our Payments and Cash Management business continued to invest in new products and resources across the region.
In GB&M, we utilised our distinctive geographic network to help clients meet their financing requirements. For example, we acted as a coordinator, book runner and joint lead manager for a number of issuances in the UAE and other countries, allowing our clients to access our global investor base. We won awards for ‘Best Project Finance Advisor in the Middle East’, ‘Best Power Deal in the Middle East’ and ‘Best Water Deal in EMEA’ at the EMEA
Finance Project Finance Awards 2013, demonstrating our excellence in this area.
In Egypt, we continued to manage risk in an uncertain political and economic environment. During the period, the Central Bank of Egypt resumed interest payments on overnight placements. In RBWM, we were ranked number one in the Customer Recommendation Index and we continued to invest in our personal internet banking platform. In GB&M, we acted as a mandated lead arranger of an EGP2.3bn (US$330m) syndicated term loan facility, demonstrating our ability to deliver large and complex transactions.
In Saudi Arabia, our associate, The Saudi British Bank, won The Global Finance Magazine’s award of ‘The Best Trade Finance Provider in Saudi Arabia, 2014’.
In line with our six filters investment criteria, we completed the disposal of our operation in Jordan and entered into an agreement to sell our operation in Pakistan. This transaction is expected to complete during the second half of 2014.
79
Ove
rvie
w
In
teri
m M
anag
emen
t R
epo
rt
D
irec
tors
Fin
anci
al S
tate
men
ts
A
dd
itio
nal
Info
rmat
ion
Review of performance
The following commentary is on a constant currency basis and comparisons are with the first half of 2013, unless stated otherwise.
Net interest income was broadly unchanged. Increases in the UAE, primarily in RBWM due to an increase in residential mortgage balances, reflected growth in the property market and improved deposit spreads as a result of re-pricing initiatives. This was partly offset by reduced revenue from lower lending balances and spreads in CMB, reflecting a highly liquid and competitive market. In addition, income increased in Kuwait due to the restructuring of a small number of specific customer loans. These factors were broadly offset by a decrease in Egypt, primarily in CMB from lower customer deposit and lending balances, and in GB&M from declining spreads and lower balances on the available-for-sale portfolio, offset in part by the resumption of interest on overnight placements with the Central Bank of Egypt. In Jordan, net interest income decreased following the announcement to dispose of the business.
Net fee income increased by 8%, primarily in the UAE. In GB&M, net fee income was higher, driven by increased flows in our Equities business which in part reflected the upgrade of the UAE to ‘Emerging Markets’ status in the MSCI index. In addition, there was an increase in advisory mandates in Project and Export Finance in Capital Financing. This was partially offset by lower fees in RBWM relating to our Insurance and Wealth Management businesses following various repositioning initiatives.
Net trading income decreased by 5%, primarily in Algeria following regulatory restrictions on foreign exchange spreads charged on corporate customer transactions. This was coupled with a decrease in Qatar from lower foreign exchange revenues reflecting a reduction in trading volumes from GB&M customers. These factors were partly offset by increased net trading income in the UAE due to higher CVA releases on trading positions relating to a small number of exposures in GB&M.
Gains less losses from financial investments increased by US$21m, mainly in Egypt, due to the non-recurrence of the loss on disposal of available-for-sale debt securities in the first half of 2013.
Net loan impairment releases were higher by US$3m, primarily in the UAE driven by net releases of individually assessed allowances in GB&M. However, this was offset in part by lower impairment releases for a small number of UAE-related exposures.
Operating expenses were broadly unchanged. In Egypt, expenses decreased due to the non-recurrence of charges relating to changes in the interpretation of tax regulations. This was partly offset by increased expenses in the UAE, driven by wage inflation, investment in the Risk and Compliance functions, higher customer facing staff in RBWM and increased service and product support staff in CMB. In addition, expenses increased in Qatar due to wage inflation.
Share of profits from associates and joint ventures increased by 15%, mainly from The Saudi British Bank. This was driven by higher revenue resulting from strong balance sheet growth, and the management of costs and risks.
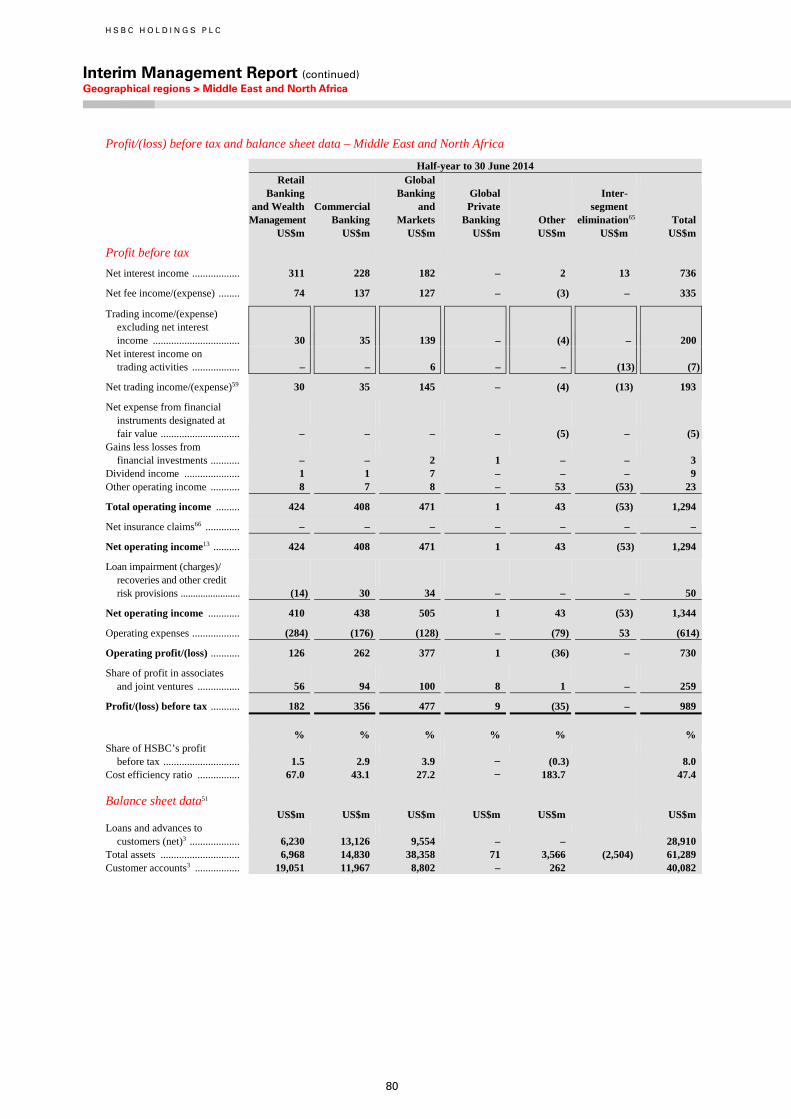
H S B C H O L D I N G S P L C
Interim Management Report (continued) Geographical regions > Middle East and North Africa
80
Profit/(loss) before tax and balance sheet data – Middle East and North Africa
Half-year to 30 June 2014
Retail Banking and Wealth Management US$m
Commercial Banking US$m
Global Banking and Markets US$m
Global Private Banking US$m
Other US$m
Inter- segment elimination65 US$m
Total US$m
Profit before tax
Net interest income .................. 311 228 182 – 2 13 736
Net fee income/(expense) ........ 74 137 127 – (3) – 335
Trading income/(expense) excluding net interest income ................................. 30 35 139 – (4) – 200
Net interest income on trading activities .................. – – 6 – – (13) (7)
Net trading income/(expense)59 30 35 145 – (4) (13) 193
Net expense from financial instruments designated at fair value .............................. – – – – (5) – (5)
Gains less losses from financial investments ........... – – 2 1 – – 3
Dividend income ..................... 1 1 7 – – – 9 Other operating income ........... 8 7 8 – 53 (53) 23
Total operating income ......... 424 408 471 1 43 (53) 1,294
Net insurance claims66 ............. – – – – – – –
Net operating income13 .......... 424 408 471 1 43 (53) 1,294
Loan impairment (charges)/ recoveries and other credit risk provisions ........................ (14) 30 34 – – – 50
Net operating income ............ 410 438 505 1 43 (53) 1,344
Operating expenses .................. (284) (176) (128) – (79) 53 (614)
Operating profit/(loss) ........... 126 262 377 1 (36) – 730
Share of profit in associates and joint ventures ................ 56 94 100 8 1 – 259
Profit/(loss) before tax ........... 182 356 477 9 (35) – 989
% % % % % % Share of HSBC’s profit
before tax ............................. 1.5 2.9 3.9 − (0.3) 8.0 Cost efficiency ratio ................ 67.0 43.1 27.2 − 183.7 47.4 Balance sheet data51 US$m US$m US$m US$m US$m US$m Loans and advances to
customers (net)3 ................... 6,230 13,126 9,554 – – 28,910 Total assets .............................. 6,968 14,830 38,358 71 3,566 (2,504) 61,289 Customer accounts3 ................. 19,051 11,967 8,802 – 262 40,082
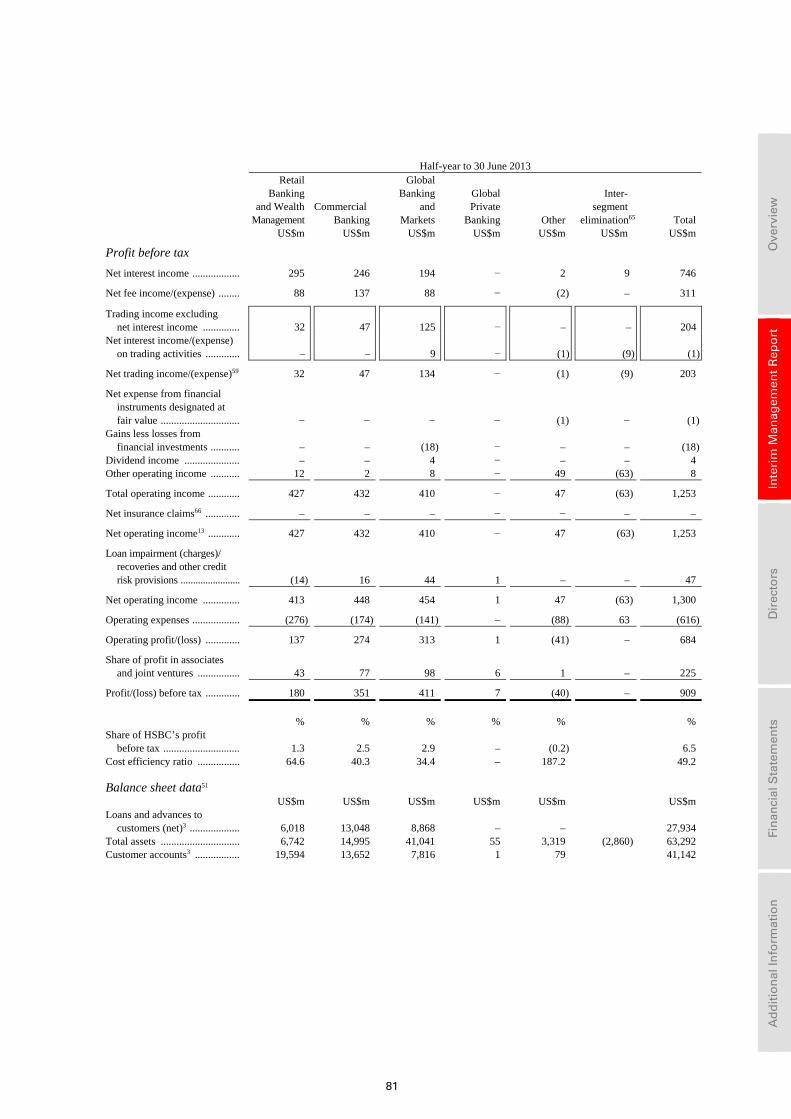
81
Ove
rvie
w
In
teri
m M
anag
emen
t R
epo
rt
D
irec
tors
Fin
anci
al S
tate
men
ts
A
dd
itio
nal
Info
rmat
ion
Half-year to 30 June 2013
Retail Banking and Wealth Management US$m
Commercial Banking US$m
Global Banking and Markets US$m
Global Private Banking US$m
Other US$m
Inter- segment elimination65 US$m
Total US$m
Profit before tax
Net interest income .................. 295 246 194 − 2 9 746
Net fee income/(expense) ........ 88 137 88 − (2) – 311
Trading income excluding net interest income .............. 32 47 125 − – – 204
Net interest income/(expense) on trading activities ............. – – 9 − (1) (9) (1)
Net trading income/(expense)59 32 47 134 − (1) (9) 203
Net expense from financial instruments designated at fair value .............................. − − − − (1) − (1)
Gains less losses from financial investments ........... – – (18) − – – (18)
Dividend income ..................... – – 4 − – – 4 Other operating income ........... 12 2 8 − 49 (63) 8
Total operating income ............ 427 432 410 − 47 (63) 1,253
Net insurance claims66 ............. – – – − − – –
Net operating income13 ............ 427 432 410 − 47 (63) 1,253
Loan impairment (charges)/ recoveries and other credit risk provisions ........................ (14) 16 44 1 – – 47
Net operating income .............. 413 448 454 1 47 (63) 1,300
Operating expenses .................. (276) (174) (141) – (88) 63 (616)
Operating profit/(loss) ............. 137 274 313 1 (41) – 684
Share of profit in associates and joint ventures ................ 43 77 98 6 1 – 225
Profit/(loss) before tax ............. 180 351 411 7 (40) – 909
% % % % % % Share of HSBC’s profit
before tax ............................. 1.3 2.5 2.9 – (0.2) 6.5 Cost efficiency ratio ................ 64.6 40.3 34.4 – 187.2 49.2 Balance sheet data51 US$m US$m US$m US$m US$m US$m Loans and advances to
customers (net)3 ................... 6,018 13,048 8,868 – – 27,934 Total assets .............................. 6,742 14,995 41,041 55 3,319 (2,860) 63,292 Customer accounts3 ................. 19,594 13,652 7,816 1 79 41,142
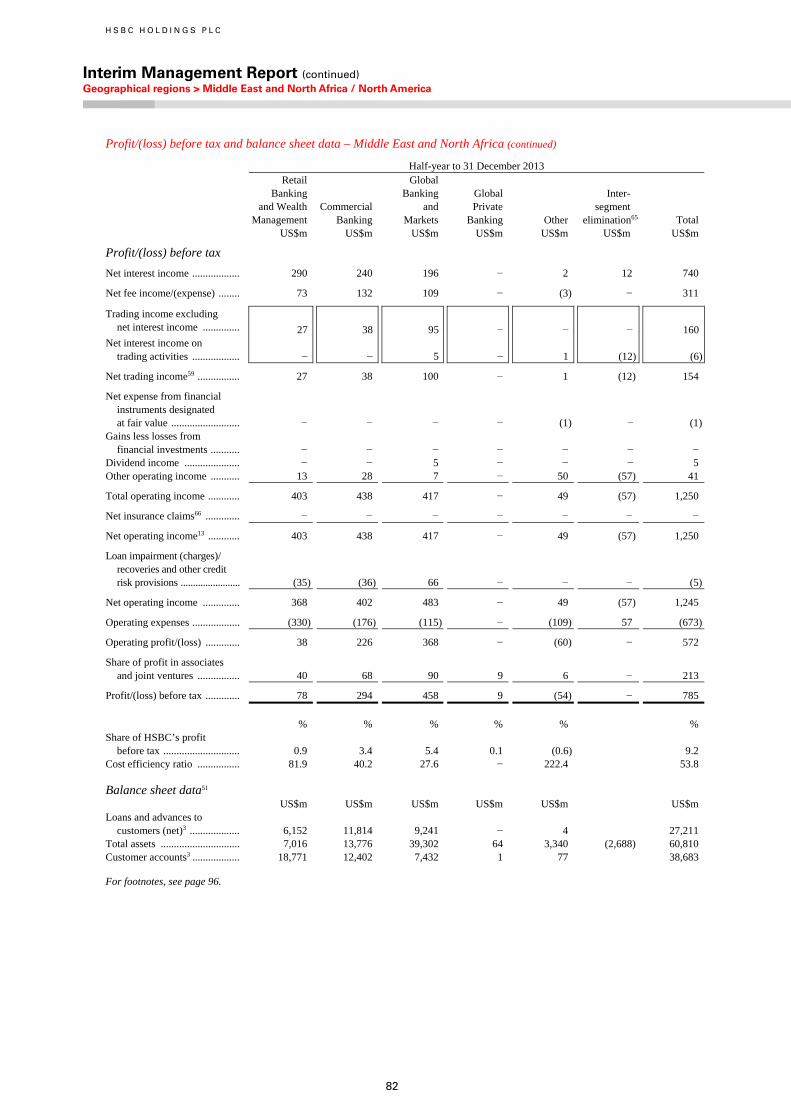
H S B C H O L D I N G S P L C
Interim Management Report (continued) Geographical regions > Middle East and North Africa / North America
82
Profit/(loss) before tax and balance sheet data – Middle East and North Africa (continued)
Half-year to 31 December 2013
Retail Banking and Wealth Management US$m
Commercial Banking US$m
Global Banking and Markets US$m
Global Private Banking US$m
Other US$m
Inter- segment elimination65 US$m
Total US$m
Profit/(loss) before tax
Net interest income .................. 290 240 196 − 2 12 740
Net fee income/(expense) ........ 73 132 109 − (3) − 311
Trading income excluding net interest income .............. 27 38 95 − − − 160
Net interest income on trading activities .................. − − 5 − 1 (12) (6)
Net trading income59 ................ 27 38 100 − 1 (12) 154
Net expense from financial instruments designated at fair value .......................... − − − − (1) − (1)
Gains less losses from financial investments ........... − − − − − − −
Dividend income ..................... − − 5 − − − 5 Other operating income ........... 13 28 7 − 50 (57) 41
Total operating income ............ 403 438 417 − 49 (57) 1,250
Net insurance claims66 ............. − − − − − − −
Net operating income13 ............ 403 438 417 − 49 (57) 1,250
Loan impairment (charges)/ recoveries and other credit risk provisions ........................ (35) (36) 66 − − − (5)
Net operating income .............. 368 402 483 − 49 (57) 1,245
Operating expenses .................. (330) (176) (115) − (109) 57 (673)
Operating profit/(loss) ............. 38 226 368 − (60) − 572
Share of profit in associates and joint ventures ................ 40 68 90 9 6 − 213
Profit/(loss) before tax ............. 78 294 458 9 (54) − 785
% % % % % % Share of HSBC’s profit
before tax ............................. 0.9 3.4 5.4 0.1 (0.6) 9.2 Cost efficiency ratio ................ 81.9 40.2 27.6 − 222.4 53.8 Balance sheet data51 US$m US$m US$m US$m US$m US$m Loans and advances to
customers (net)3 ................... 6,152 11,814 9,241 − 4 27,211 Total assets .............................. 7,016 13,776 39,302 64 3,340 (2,688) 60,810 Customer accounts3 .................. 18,771 12,402 7,432 1 77 38,683
For footnotes, see page 96.
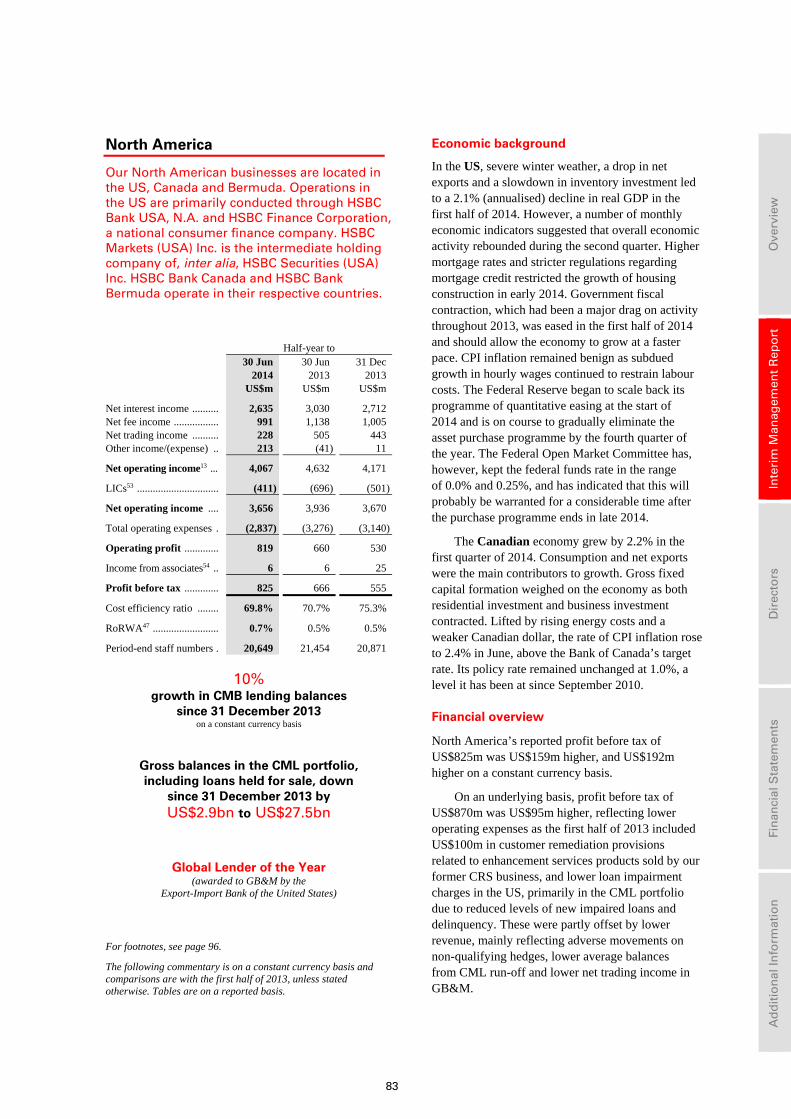
83
Ove
rvie
w
In
teri
m M
anag
emen
t R
epo
rt
D
irec
tors
Fin
anci
al S
tate
men
ts
A
dd
itio
nal
Info
rmat
ion
North America
Our North American businesses are located in the US, Canada and Bermuda. Operations in the US are primarily conducted through HSBC Bank USA, N.A. and HSBC Finance Corporation, a national consumer finance company. HSBC Markets (USA) Inc. is the intermediate holding company of, inter alia, HSBC Securities (USA) Inc. HSBC Bank Canada and HSBC Bank Bermuda operate in their respective countries.
Half-year to 30 Jun 30 Jun 31 Dec 2014 2013 2013 US$m US$m US$m
Net interest income .......... 2,635 3,030 2,712 Net fee income ................. 991 1,138 1,005 Net trading income .......... 228 505 443 Other income/(expense) .. 213 (41) 11
Net operating income13 ... 4,067 4,632 4,171
LICs53 ............................... (411) (696) (501)
Net operating income .... 3,656 3,936 3,670
Total operating expenses . (2,837) (3,276) (3,140)
Operating profit ............. 819 660 530
Income from associates54 .. 6 6 25
Profit before tax ............. 825 666 555
Cost efficiency ratio ........ 69.8% 70.7% 75.3%
RoRWA47 ......................... 0.7% 0.5% 0.5%
Period-end staff numbers . 20,649 21,454 20,871
10% growth in CMB lending balances
since 31 December 2013 on a constant currency basis
Gross balances in the CML portfolio, including loans held for sale, down
since 31 December 2013 by US$2.9bn to US$27.5bn
Global Lender of the Year (awarded to GB&M by the
Export-Import Bank of the United States)
For footnotes, see page 96.
The following commentary is on a constant currency basis and comparisons are with the first half of 2013, unless stated otherwise. Tables are on a reported basis.
Economic background
In the US, severe winter weather, a drop in net exports and a slowdown in inventory investment led to a 2.1% (annualised) decline in real GDP in the first half of 2014. However, a number of monthly economic indicators suggested that overall economic activity rebounded during the second quarter. Higher mortgage rates and stricter regulations regarding mortgage credit restricted the growth of housing construction in early 2014. Government fiscal contraction, which had been a major drag on activity throughout 2013, was eased in the first half of 2014 and should allow the economy to grow at a faster pace. CPI inflation remained benign as subdued growth in hourly wages continued to restrain labour costs. The Federal Reserve began to scale back its programme of quantitative easing at the start of 2014 and is on course to gradually eliminate the asset purchase programme by the fourth quarter of the year. The Federal Open Market Committee has, however, kept the federal funds rate in the range of 0.0% and 0.25%, and has indicated that this will probably be warranted for a considerable time after the purchase programme ends in late 2014.
The Canadian economy grew by 2.2% in the first quarter of 2014. Consumption and net exports were the main contributors to growth. Gross fixed capital formation weighed on the economy as both residential investment and business investment contracted. Lifted by rising energy costs and a weaker Canadian dollar, the rate of CPI inflation rose to 2.4% in June, above the Bank of Canada’s target rate. Its policy rate remained unchanged at 1.0%, a level it has been at since September 2010.
Financial overview
North America’s reported profit before tax of US$825m was US$159m higher, and US$192m higher on a constant currency basis.
On an underlying basis, profit before tax of US$870m was US$95m higher, reflecting lower operating expenses as the first half of 2013 included US$100m in customer remediation provisions related to enhancement services products sold by our former CRS business, and lower loan impairment charges in the US, primarily in the CML portfolio due to reduced levels of new impaired loans and delinquency. These were partly offset by lower revenue, mainly reflecting adverse movements on non-qualifying hedges, lower average balances from CML run-off and lower net trading income in GB&M.
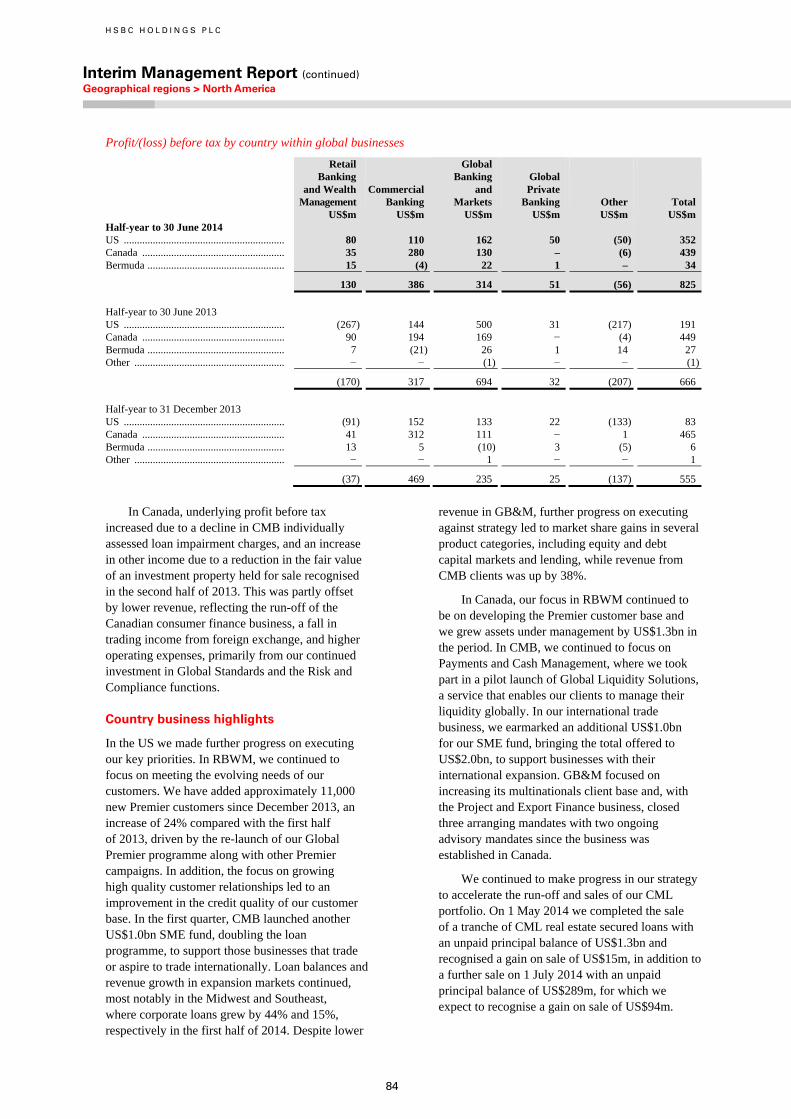
H S B C H O L D I N G S P L C
Interim Management Report (continued) Geographical regions > North America
84
Profit/(loss) before tax by country within global businesses
Retail Banking and Wealth Management US$m
Commercial Banking US$m
Global Banking and Markets US$m
Global Private Banking US$m
Other US$m
Total US$m
Half-year to 30 June 2014 US ............................................................. 80 110 162 50 (50) 352 Canada ...................................................... 35 280 130 – (6) 439 Bermuda .................................................... 15 (4) 22 1 – 34
130 386 314 51 (56) 825 Half-year to 30 June 2013 US ............................................................. (267) 144 500 31 (217) 191 Canada ...................................................... 90 194 169 − (4) 449 Bermuda .................................................... 7 (21) 26 1 14 27Other ......................................................... − − (1) − − (1)
(170) 317 694 32 (207) 666 Half-year to 31 December 2013 US ............................................................. (91) 152 133 22 (133) 83 Canada ...................................................... 41 312 111 − 1 465Bermuda .................................................... 13 5 (10) 3 (5) 6Other ......................................................... − − 1 − − 1
(37) 469 235 25 (137) 555
In Canada, underlying profit before tax
increased due to a decline in CMB individually assessed loan impairment charges, and an increase in other income due to a reduction in the fair value of an investment property held for sale recognised in the second half of 2013. This was partly offset by lower revenue, reflecting the run-off of the Canadian consumer finance business, a fall in trading income from foreign exchange, and higher operating expenses, primarily from our continued investment in Global Standards and the Risk and Compliance functions.
Country business highlights
In the US we made further progress on executing our key priorities. In RBWM, we continued to focus on meeting the evolving needs of our customers. We have added approximately 11,000 new Premier customers since December 2013, an increase of 24% compared with the first half of 2013, driven by the re-launch of our Global Premier programme along with other Premier campaigns. In addition, the focus on growing high quality customer relationships led to an improvement in the credit quality of our customer base. In the first quarter, CMB launched another US$1.0bn SME fund, doubling the loan programme, to support those businesses that trade or aspire to trade internationally. Loan balances and revenue growth in expansion markets continued, most notably in the Midwest and Southeast, where corporate loans grew by 44% and 15%, respectively in the first half of 2014. Despite lower
revenue in GB&M, further progress on executing against strategy led to market share gains in several product categories, including equity and debt capital markets and lending, while revenue from CMB clients was up by 38%.
In Canada, our focus in RBWM continued to be on developing the Premier customer base and we grew assets under management by US$1.3bn in the period. In CMB, we continued to focus on Payments and Cash Management, where we took part in a pilot launch of Global Liquidity Solutions, a service that enables our clients to manage their liquidity globally. In our international trade business, we earmarked an additional US$1.0bn for our SME fund, bringing the total offered to US$2.0bn, to support businesses with their international expansion. GB&M focused on increasing its multinationals client base and, with the Project and Export Finance business, closed three arranging mandates with two ongoing advisory mandates since the business was established in Canada.
We continued to make progress in our strategy to accelerate the run-off and sales of our CML portfolio. On 1 May 2014 we completed the sale of a tranche of CML real estate secured loans with an unpaid principal balance of US$1.3bn and recognised a gain on sale of US$15m, in addition to a further sale on 1 July 2014 with an unpaid principal balance of US$289m, for which we expect to recognise a gain on sale of US$94m.
85
Ove
rvie
w
In
teri
m M
anag
emen
t R
epo
rt
D
irec
tors
Fin
anci
al S
tate
men
ts
A
dd
itio
nal
Info
rmat
ion
We identified real estate secured loan balances with unpaid principal of US$2.4bn that we plan to actively market in multiple transactions over the next 15 months. The estimated fair value of these loans was approximately US$5m greater than their carrying value at 30 June 2014. During July 2014, we commenced active marketing to sell a portion of our real estate secured loans with an unpaid principal balance of US$1.1bn, and expect to complete the sale of these loans in the fourth quarter of 2014.
Review of performance
The following commentary is on a constant currency basis and comparisons are with the first half of 2013, unless stated otherwise.
Net interest income decreased by 12% to US$2.6bn, reflecting portfolio disposals including the sale of the CML non-real estate personal loan portfolio in April 2013, and lower average lending balances from the continued run-off of the CML portfolio and the Consumer Finance business in Canada. This was partly offset by a release of accrued interest associated with uncertain tax positions, and growth in CMB driven by increased lending balances in expansion markets.
Net fee income decreased by 11% to US$1.0bn, primarily due to adverse adjustments to mortgage servicing rights valuations due to mortgage interest rate decreases compared with increases in the same period in 2013, and the expiry of the Transition Servicing Agreements with the buyer of the CRS business.
Net trading income was US$270m or 54% lower, primarily due to adverse fair value movements on non-qualifying hedges in HSBC Finance of US$188m following a decrease in long-term interest rates, compared with favourable movements of US$263m in the first half of 2013. The decrease was partly offset by the non-recurrence of a loss of US$199m in the first half of 2013 related to the early termination of qualifying accounting hedges as a result of changes in funding, and lower provisions for mortgage loan repurchase obligations related to loans previously sold.
Net trading income decreased in GB&M as a result of unfavourable fair value movements on structured liabilities, lower foreign exchange and metals revenue as a result of reduced trading volume and low volatility, a fall in Credit trading revenue driven by lower monoline reserve releases in the legacy portfolio, and the non-recurrence of revaluation gains on securities in the first half of
2013. Net trading income was also negatively affected by the performance of economic hedges used to manage interest rate risk, reflecting unfavourable interest rate movements.
Gains less losses from financial investments were US$118m, a decrease of 46% as Balance Sheet Management reported lower gains on sales of available-for-sale debt securities as a result of our ongoing portfolio repositioning for risk management purposes. This was partly offset by gains on the sale of private equity investments.
Other operating income was US$170m compared with an expense of US$224m in the first half of 2013. The movement reflected the non-recurrence of the US$370m loss on sales of the CML non-real estate personal loan portfolio and our US insurance business in the first half of 2013.
LICs decreased by US$275m to US$411m, mainly in the US, due to reduced levels of delinquency and new impaired loans in the CML portfolio and a fall in lending balances from continued run-off and loan sales, partly offset by lower favourable market value adjustments of underlying properties as improvements in housing market conditions were less pronounced in the first half of 2014. In Canada, loan impairment charges decreased by US$80m, mainly in CMB reflecting lower individually assessed charges. These factors were partly offset by an increase in the US of US$93m, including US$72m in CMB and US$20m in GB&M, as we revised certain estimates used in our corporate loan impairment calculation. In addition, GB&M recorded a rise in loan impairment charges due to higher individually assessed charges on a specific exposure reflecting a deterioration in the underlying asset values and, to a lesser extent, the revaluation of a loan held for sale.
Operating expenses decreased by 12% to US$2.8bn, reflecting the non-recurrence of US$100m in customer remediation provisions in the first half of 2013 related to enhancement services products sold by our former CRS business, reduced average staff numbers and costs resulting from the continued run-off and sales of our CML portfolio, and lower divestiture costs related to the sale in 2012 of our CRS business. Costs also declined as the former Cards business reached the end of the Transition Servicing Agreements, and mortgage foreclosure remediation costs reduced following the 2013 Independent Foreclosure Review Settlement Agreement. We also achieved over US$90m of sustainable cost savings, primarily reflecting organisational effectiveness initiatives.
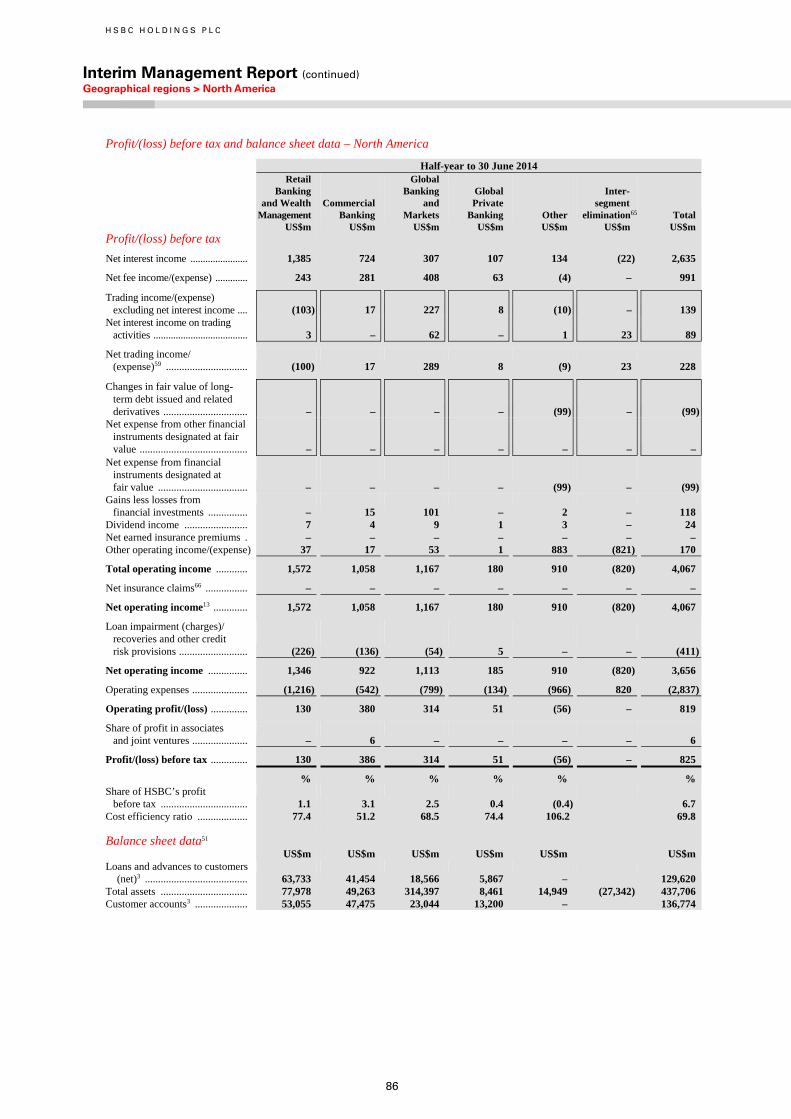
H S B C H O L D I N G S P L C
Interim Management Report (continued) Geographical regions > North America
86
Profit/(loss) before tax and balance sheet data – North America
Half-year to 30 June 2014
Retail Banking and Wealth Management US$m
Commercial Banking US$m
Global Banking
and Markets US$m
GlobalPrivate
Banking US$m
Other
US$m
Inter- segment elimination65
US$m Total US$m
Profit/(loss) before tax
Net interest income ....................... 1,385 724 307 107 134 (22) 2,635
Net fee income/(expense) ............. 243 281 408 63 (4) – 991
Trading income/(expense) excluding net interest income .... (103) 17 227 8 (10) – 139
Net interest income on trading activities ...................................... 3 – 62 – 1 23 89
Net trading income/ (expense)59 ............................... (100) 17 289 8 (9) 23 228
Changes in fair value of long- term debt issued and related derivatives ................................ – – – – (99) – (99)
Net expense from other financial instruments designated at fair value ......................................... – – – – – – –
Net expense from financial instruments designated at fair value .................................. – – – – (99) – (99)
Gains less losses from financial investments ............... – 15 101 – 2 – 118
Dividend income ........................ 7 4 9 1 3 – 24 Net earned insurance premiums . – – – – – – – Other operating income/(expense) 37 17 53 1 883 (821) 170
Total operating income ............ 1,572 1,058 1,167 180 910 (820) 4,067
Net insurance claims66 ................ – – – – – – –
Net operating income13 ............. 1,572 1,058 1,167 180 910 (820) 4,067
Loan impairment (charges)/ recoveries and other credit risk provisions .......................... (226) (136) (54) 5 – – (411)
Net operating income ............... 1,346 922 1,113 185 910 (820) 3,656
Operating expenses ..................... (1,216) (542) (799) (134) (966) 820 (2,837)
Operating profit/(loss) .............. 130 380 314 51 (56) – 819
Share of profit in associates and joint ventures ..................... – 6 – – – – 6
Profit/(loss) before tax .............. 130 386 314 51 (56) – 825
% % % % % % Share of HSBC’s profit
before tax ................................. 1.1 3.1 2.5 0.4 (0.4) 6.7 Cost efficiency ratio ................... 77.4 51.2 68.5 74.4 106.2 69.8 Balance sheet data51 US$m US$m US$m US$m US$m US$m Loans and advances to customers
(net)3 ....................................... 63,733 41,454 18,566 5,867 – 129,620 Total assets ................................. 77,978 49,263 314,397 8,461 14,949 (27,342) 437,706 Customer accounts3 .................... 53,055 47,475 23,044 13,200 – 136,774
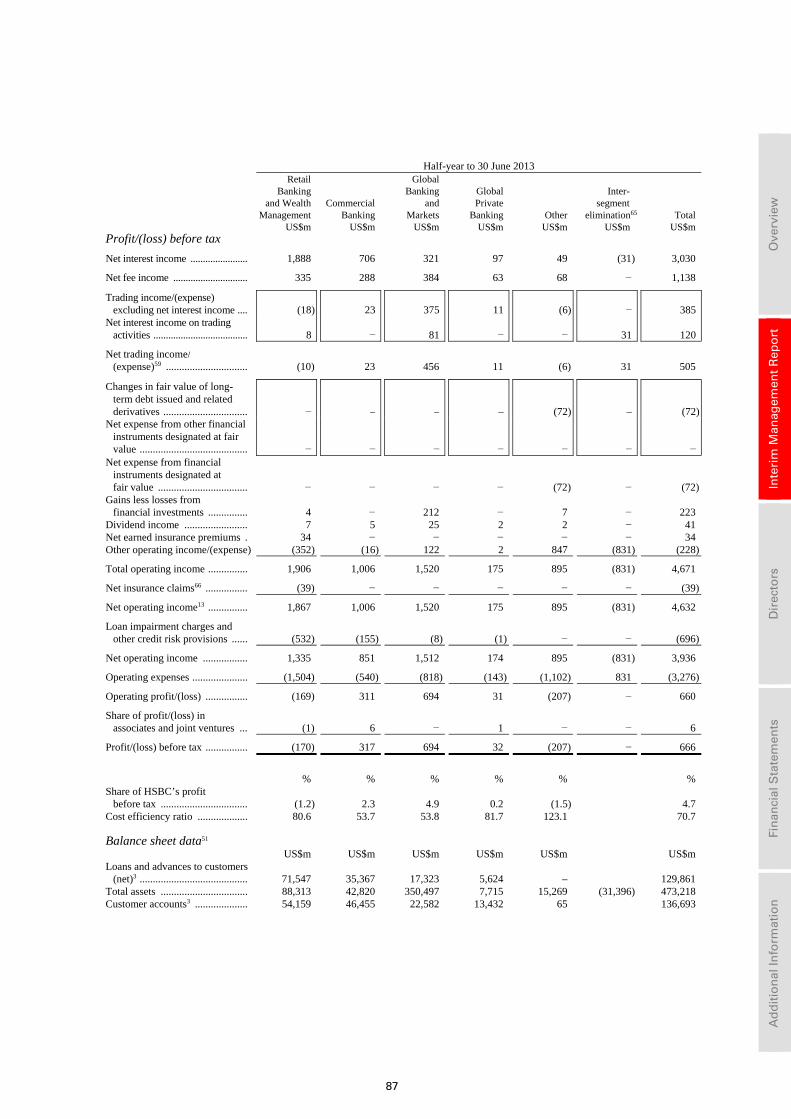
87
Ove
rvie
w
In
teri
m M
anag
emen
t R
epo
rt
D
irec
tors
Fin
anci
al S
tate
men
ts
A
dd
itio
nal
Info
rmat
ion
Half-year to 30 June 2013
Retail Banking and Wealth Management US$m
Commercial Banking US$m
Global Banking
and Markets US$m
GlobalPrivate
Banking US$m
Other
US$m
Inter- segment elimination65
US$m Total US$m
Profit/(loss) before tax
Net interest income ....................... 1,888 706 321 97 49 (31) 3,030
Net fee income .............................. 335 288 384 63 68 − 1,138
Trading income/(expense) excluding net interest income .... (18) 23 375 11 (6) − 385
Net interest income on trading activities ...................................... 8 − 81 − − 31 120
Net trading income/ (expense)59 ............................... (10) 23 456 11 (6) 31 505
Changes in fair value of long- term debt issued and related derivatives ................................ − – – – (72) – (72)
Net expense from other financial instruments designated at fair value ......................................... − − − − − − −
Net expense from financial instruments designated at fair value .................................. − − − − (72) − (72)
Gains less losses from financial investments ............... 4 − 212 − 7 − 223
Dividend income ........................ 7 5 25 2 2 − 41 Net earned insurance premiums . 34 − − − − − 34 Other operating income/(expense) (352) (16) 122 2 847 (831) (228)
Total operating income ............... 1,906 1,006 1,520 175 895 (831) 4,671
Net insurance claims66 ................ (39) − − − − − (39)
Net operating income13 ............... 1,867 1,006 1,520 175 895 (831) 4,632
Loan impairment charges and other credit risk provisions ...... (532) (155) (8) (1) − − (696)
Net operating income ................. 1,335 851 1,512 174 895 (831) 3,936
Operating expenses ..................... (1,504) (540) (818) (143) (1,102) 831 (3,276)
Operating profit/(loss) ................ (169) 311 694 31 (207) − 660
Share of profit/(loss) in associates and joint ventures ... (1) 6 − 1 − − 6
Profit/(loss) before tax ................ (170) 317 694 32 (207) − 666
% % % % % % Share of HSBC’s profit
before tax ................................. (1.2) 2.3 4.9 0.2 (1.5) 4.7 Cost efficiency ratio ................... 80.6 53.7 53.8 81.7 123.1 70.7 Balance sheet data51 US$m US$m US$m US$m US$m US$m Loans and advances to customers
(net)3 ......................................... 71,547 35,367 17,323 5,624 – 129,861 Total assets ................................. 88,313 42,820 350,497 7,715 15,269 (31,396) 473,218 Customer accounts3 .................... 54,159 46,455 22,582 13,432 65 136,693
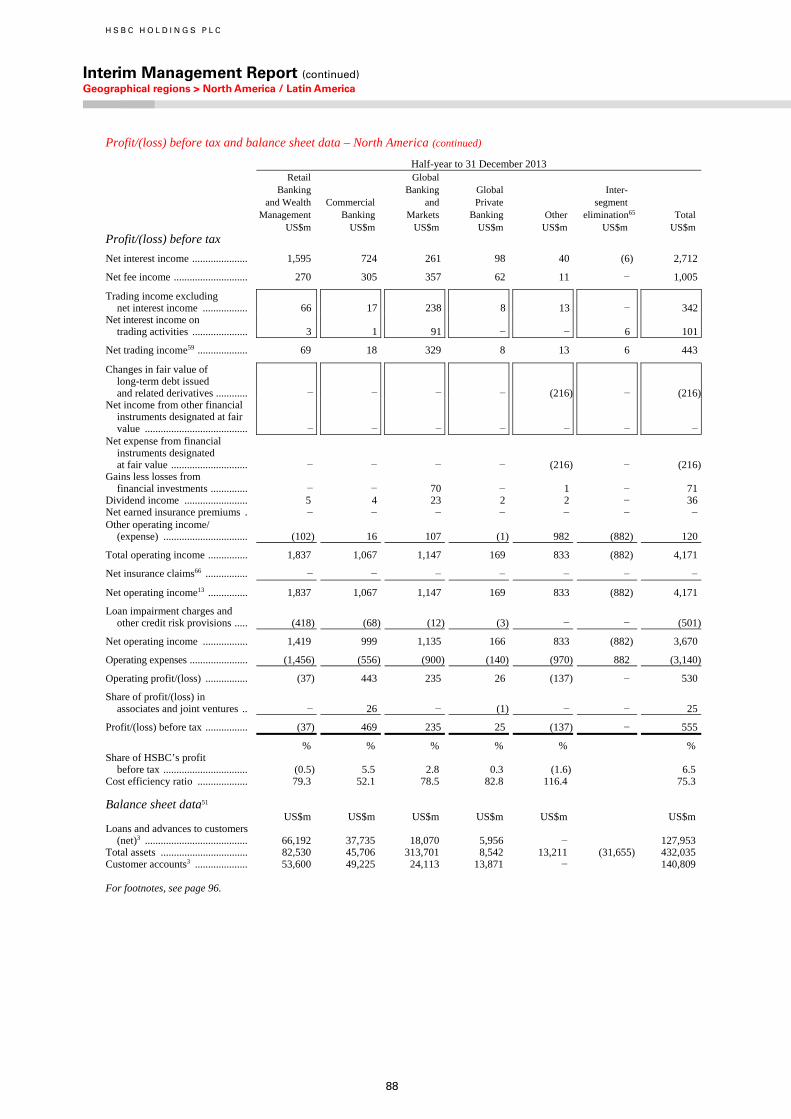
H S B C H O L D I N G S P L C
Interim Management Report (continued) Geographical regions > North America / Latin America
88
Profit/(loss) before tax and balance sheet data – North America (continued)
Half-year to 31 December 2013
Retail Banking and Wealth Management US$m
Commercial Banking US$m
Global Banking
and Markets US$m
GlobalPrivate
Banking US$m
Other
US$m
Inter- segment elimination65 US$m
Total US$m
Profit/(loss) before tax
Net interest income ..................... 1,595 724 261 98 40 (6) 2,712
Net fee income ............................ 270 305 357 62 11 − 1,005
Trading income excluding net interest income ................. 66 17 238 8 13 − 342
Net interest income on trading activities ..................... 3 1 91 − − 6 101
Net trading income59 ................... 69 18 329 8 13 6 443
Changes in fair value of long-term debt issued and related derivatives ............ − − − − (216) − (216)
Net income from other financial instruments designated at fair value ....................................... − − − − − − −
Net expense from financial instruments designated at fair value ............................. − − − − (216) − (216)
Gains less losses from financial investments .............. − − 70 − 1 − 71
Dividend income ........................ 5 4 23 2 2 − 36Net earned insurance premiums . − − − − − − −Other operating income/
(expense) ................................ (102) 16 107 (1) 982 (882) 120
Total operating income ............... 1,837 1,067 1,147 169 833 (882) 4,171
Net insurance claims66 ................ − − − − − − −
Net operating income13 ............... 1,837 1,067 1,147 169 833 (882) 4,171
Loan impairment charges and other credit risk provisions ..... (418) (68) (12) (3) − − (501)
Net operating income ................. 1,419 999 1,135 166 833 (882) 3,670
Operating expenses ...................... (1,456) (556) (900) (140) (970) 882 (3,140)
Operating profit/(loss) ................ (37) 443 235 26 (137) − 530
Share of profit/(loss) in associates and joint ventures .. − 26 − (1) − − 25
Profit/(loss) before tax ................ (37) 469 235 25 (137) − 555
% % % % % %Share of HSBC’s profit
before tax ................................ (0.5) 5.5 2.8 0.3 (1.6) 6.5Cost efficiency ratio ................... 79.3 52.1 78.5 82.8 116.4 75.3 Balance sheet data51 US$m US$m US$m US$m US$m US$mLoans and advances to customers
(net)3 ....................................... 66,192 37,735 18,070 5,956 − 127,953Total assets ................................. 82,530 45,706 313,701 8,542 13,211 (31,655) 432,035Customer accounts3 .................... 53,600 49,225 24,113 13,871 − 140,809
For footnotes, see page 96.
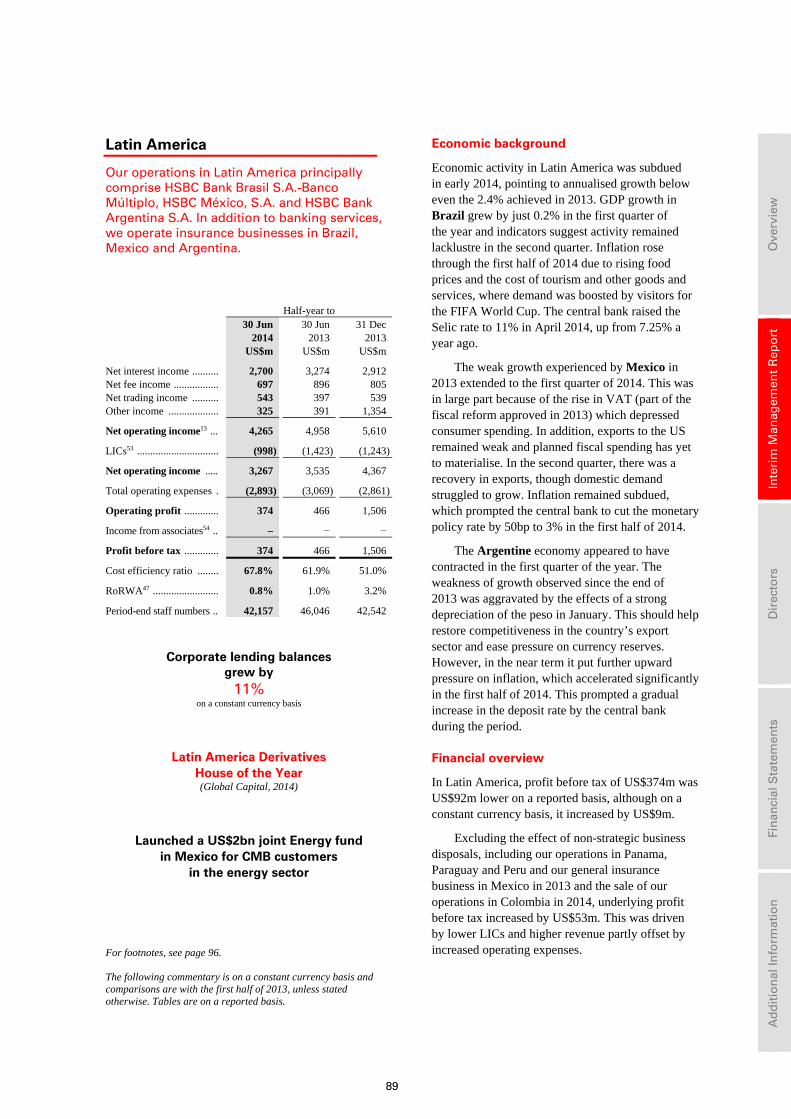
89
Ove
rvie
w
In
teri
m M
anag
emen
t R
epo
rt
D
irec
tors
Fin
anci
al S
tate
men
ts
A
dd
itio
nal
Info
rmat
ion
Latin America
Our operations in Latin America principally comprise HSBC Bank Brasil S.A.-Banco Múltiplo, HSBC México, S.A. and HSBC Bank Argentina S.A. In addition to banking services, we operate insurance businesses in Brazil, Mexico and Argentina.
Half-year to 30 Jun 30 Jun 31 Dec 2014 2013 2013 US$m US$m US$m
Net interest income .......... 2,700 3,274 2,912 Net fee income ................. 697 896 805 Net trading income .......... 543 397 539 Other income ................... 325 391 1,354
Net operating income13 ... 4,265 4,958 5,610
LICs53 ............................... (998) (1,423) (1,243)
Net operating income ..... 3,267 3,535 4,367
Total operating expenses . (2,893) (3,069) (2,861)
Operating profit ............. 374 466 1,506
Income from associates54 .. – − −
Profit before tax ............. 374 466 1,506
Cost efficiency ratio ........ 67.8% 61.9% 51.0%
RoRWA47 ......................... 0.8% 1.0% 3.2%
Period-end staff numbers .. 42,157 46,046 42,542
Corporate lending balances grew by
11% on a constant currency basis
Latin America Derivatives House of the Year (Global Capital, 2014)
Launched a US$2bn joint Energy fund in Mexico for CMB customers
in the energy sector
For footnotes, see page 96.
The following commentary is on a constant currency basis and comparisons are with the first half of 2013, unless stated otherwise. Tables are on a reported basis.
Economic background
Economic activity in Latin America was subdued in early 2014, pointing to annualised growth below even the 2.4% achieved in 2013. GDP growth in Brazil grew by just 0.2% in the first quarter of the year and indicators suggest activity remained lacklustre in the second quarter. Inflation rose through the first half of 2014 due to rising food prices and the cost of tourism and other goods and services, where demand was boosted by visitors for the FIFA World Cup. The central bank raised the Selic rate to 11% in April 2014, up from 7.25% a year ago.
The weak growth experienced by Mexico in 2013 extended to the first quarter of 2014. This was in large part because of the rise in VAT (part of the fiscal reform approved in 2013) which depressed consumer spending. In addition, exports to the US remained weak and planned fiscal spending has yet to materialise. In the second quarter, there was a recovery in exports, though domestic demand struggled to grow. Inflation remained subdued, which prompted the central bank to cut the monetary policy rate by 50bp to 3% in the first half of 2014.
The Argentine economy appeared to have contracted in the first quarter of the year. The weakness of growth observed since the end of 2013 was aggravated by the effects of a strong depreciation of the peso in January. This should help restore competitiveness in the country’s export sector and ease pressure on currency reserves. However, in the near term it put further upward pressure on inflation, which accelerated significantly in the first half of 2014. This prompted a gradual increase in the deposit rate by the central bank during the period.
Financial overview
In Latin America, profit before tax of US$374m was US$92m lower on a reported basis, although on a constant currency basis, it increased by US$9m.
Excluding the effect of non-strategic business disposals, including our operations in Panama, Paraguay and Peru and our general insurance business in Mexico in 2013 and the sale of our operations in Colombia in 2014, underlying profit before tax increased by US$53m. This was driven by lower LICs and higher revenue partly offset by increased operating expenses.
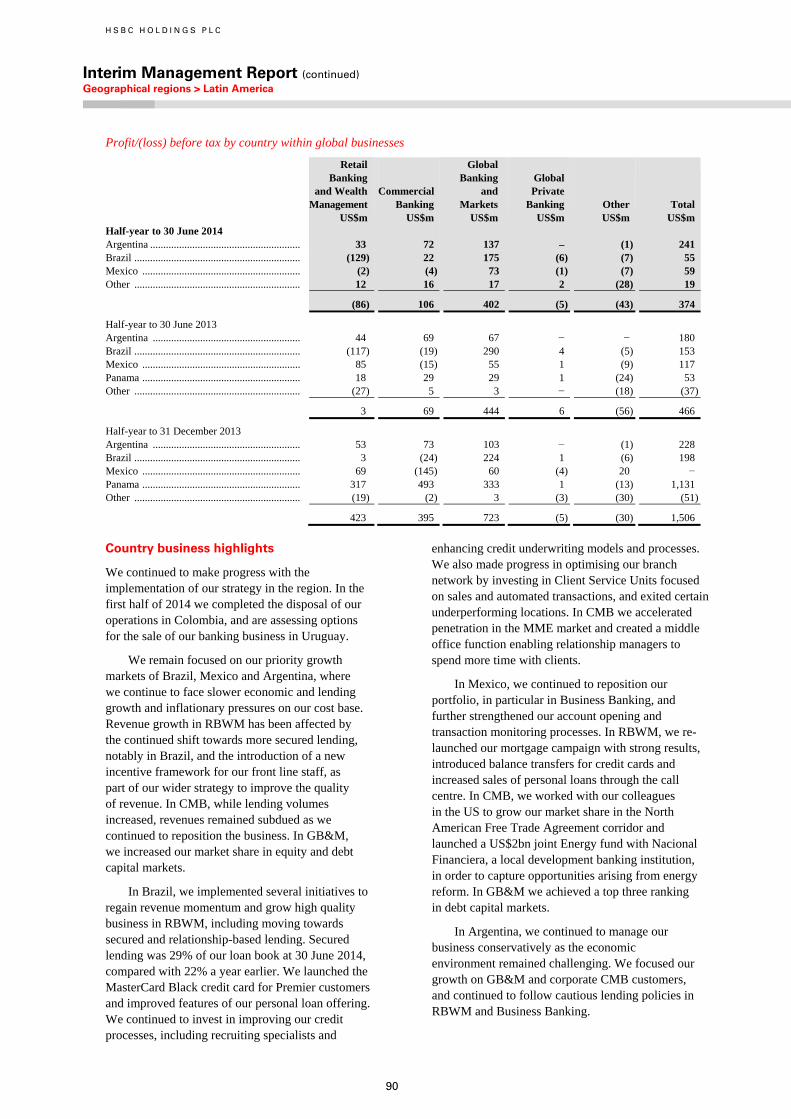
H S B C H O L D I N G S P L C
Interim Management Report (continued) Geographical regions > Latin America
90
Profit/(loss) before tax by country within global businesses
Retail Banking and Wealth Management US$m
Commercial Banking US$m
Global Banking and Markets US$m
Global Private Banking US$m
Other US$m
Total US$m
Half-year to 30 June 2014 Argentina ......................................................... 33 72 137 – (1) 241 Brazil ............................................................... (129) 22 175 (6) (7) 55 Mexico ............................................................ (2) (4) 73 (1) (7) 59 Other ............................................................... 12 16 17 2 (28) 19
(86) 106 402 (5) (43) 374
Half-year to 30 June 2013 Argentina ........................................................ 44 69 67 − − 180 Brazil ............................................................... (117) (19) 290 4 (5) 153 Mexico ............................................................ 85 (15) 55 1 (9) 117 Panama ............................................................ 18 29 29 1 (24) 53 Other ............................................................... (27) 5 3 − (18) (37)
3 69 444 6 (56) 466
Half-year to 31 December 2013 Argentina ........................................................ 53 73 103 − (1) 228 Brazil ............................................................... 3 (24) 224 1 (6) 198 Mexico ............................................................ 69 (145) 60 (4) 20 − Panama ............................................................ 317 493 333 1 (13) 1,131 Other ............................................................... (19) (2) 3 (3) (30) (51)
423 395 723 (5) (30) 1,506
Country business highlights
We continued to make progress with the implementation of our strategy in the region. In the first half of 2014 we completed the disposal of our operations in Colombia, and are assessing options for the sale of our banking business in Uruguay.
We remain focused on our priority growth markets of Brazil, Mexico and Argentina, where we continue to face slower economic and lending growth and inflationary pressures on our cost base. Revenue growth in RBWM has been affected by the continued shift towards more secured lending, notably in Brazil, and the introduction of a new incentive framework for our front line staff, as part of our wider strategy to improve the quality of revenue. In CMB, while lending volumes increased, revenues remained subdued as we continued to reposition the business. In GB&M, we increased our market share in equity and debt capital markets.
In Brazil, we implemented several initiatives to regain revenue momentum and grow high quality business in RBWM, including moving towards secured and relationship-based lending. Secured lending was 29% of our loan book at 30 June 2014, compared with 22% a year earlier. We launched the MasterCard Black credit card for Premier customers and improved features of our personal loan offering. We continued to invest in improving our credit processes, including recruiting specialists and
enhancing credit underwriting models and processes. We also made progress in optimising our branch network by investing in Client Service Units focused on sales and automated transactions, and exited certain underperforming locations. In CMB we accelerated penetration in the MME market and created a middle office function enabling relationship managers to spend more time with clients.
In Mexico, we continued to reposition our portfolio, in particular in Business Banking, and further strengthened our account opening and transaction monitoring processes. In RBWM, we re-launched our mortgage campaign with strong results, introduced balance transfers for credit cards and increased sales of personal loans through the call centre. In CMB, we worked with our colleagues in the US to grow our market share in the North American Free Trade Agreement corridor and launched a US$2bn joint Energy fund with Nacional Financiera, a local development banking institution, in order to capture opportunities arising from energy reform. In GB&M we achieved a top three ranking in debt capital markets.
In Argentina, we continued to manage our business conservatively as the economic environment remained challenging. We focused our growth on GB&M and corporate CMB customers, and continued to follow cautious lending policies in RBWM and Business Banking.
91
Ove
rvie
w
In
teri
m M
anag
emen
t R
epo
rt
D
irec
tors
Fin
anci
al S
tate
men
ts
A
dd
itio
nal
Info
rmat
ion
Review of performance
The following commentary is on a constant currency basis and comparisons are with the first half of 2013, unless stated otherwise.
Net interest income decreased by US$206m, driven by the effect of the disposals of non-strategic businesses completed during 2013 and reductions in Brazil and Mexico, partly offset by growth in Argentina.
In Brazil, the reduction was mainly in GB&M, driven by increased costs of funding in Balance Sheet Management due to higher interest rates. In CMB and RBWM, net interest income also decreased, reflecting lower revenue from Business Banking and a move towards lower yielding MMEs in CMB, and a change in the product mix towards lower yielding, more secured lending in RBWM.
In Mexico, net interest income decreased in CMB due to a reduction in average lending balances, notably in Business Banking as we continued to reposition the business and in relation to homebuilders following the impairment of some of these loans, coupled with narrower deposit spreads following a decrease in interest rates. In RBWM, net interest income improved, reflecting growth in average lending balances, though this was partly offset by spread compression on deposits.
Net interest income in Argentina increased due to higher average lending and deposit balances across all global businesses and wider spreads due to an increase in interest rates.
Net fee income decreased by 12%. In Brazil fee income was lower in RBWM across a number of products, in part reflecting a change in mix and strong market competition. In Mexico, fees were lower in both RBWM and CMB as a result of lower Account Services and Payments and Cash Management (‘PCM’) fees reflecting fewer customers, as we continued to reposition the business. The reduction in net fee income was also affected by the sale of our non-strategic businesses. These factors were partly offset by an increase in PCM, deposits and trade services-related fees in Argentina following business growth.
Net trading income increased by US$201m, primarily reflecting favourable results in GB&M in Argentina, as well as higher Rates revenue in Brazil, in part reflecting increased client activity, and in Mexico.
Net income from financial instruments designated at fair value increased by US$295m, notably in Brazil, as a result of higher net income on the bonds portfolio held by the insurance business. To the extent that these investment gains were attributed to policyholders there was a corresponding movement in Net insurance claims incurred and movement in liabilities to policyholders.
Net earned insurance premiums decreased by 4%, driven by the disposal of our operations in Panama and the sale of our general insurance business in Mexico, coupled with lower sales of life products in Mexico. The reduction in net earned insurance premiums resulted in a corresponding decrease in Net insurance claims incurred and movement in liabilities to policyholders.
Other operating income increased by US$79m, mainly driven by minimal movements in the PVIF asset in the first half of 2014, compared with a significant reduction a year ago which reflected adverse lapse experience and interest rate movements. Other operating income also increased due to the net favourable effect of disposals of our non-strategic businesses.
LICs decreased by US$298m, primarily in Brazil. This was driven by changes to the impairment model and assumption revisions for restructured loan account portfolios which occurred in 2013 in both RBWM and CMB. This was partly offset by refinements to the impairment model for non-restructured loans, notably in RBWM, during the first half of 2014. In addition, Business Banking provisions reduced, reflecting improved delinquency rates.
In Mexico, LICs improved due to lower individually assessed charges in CMB, in particular relating to homebuilders, and in GB&M. In RBWM, LICs increased due to higher credit card, mortgages and personal lending balances.
LICs were also positively affected by the disposals of non-strategic businesses in the region.
Operating expenses increased by US$157m, primarily in Brazil and Argentina, due to union-agreed salary increases, inflationary pressures and an accelerated depreciation charge in Brazil. The increase was partly offset by the effect of disposals of non-strategic businesses along with continued strict cost control and progress with our strategic focus on streamlining, which resulted in sustainable cost savings of US$66m.
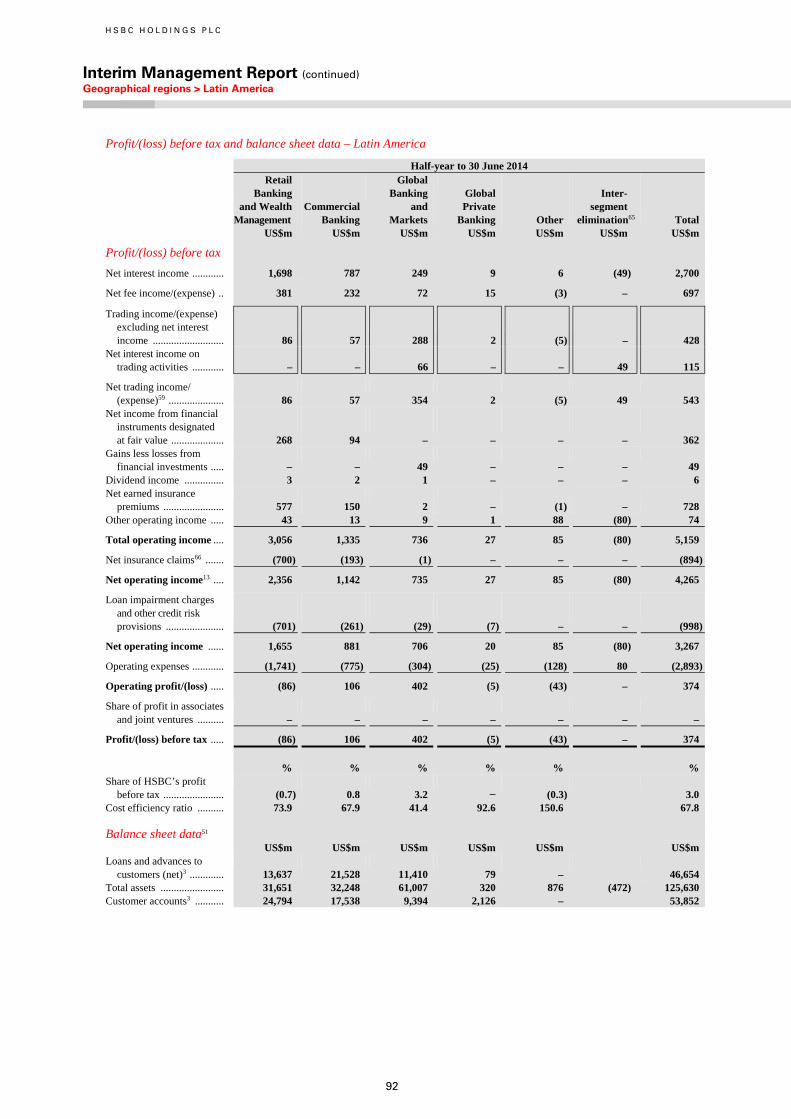
H S B C H O L D I N G S P L C
Interim Management Report (continued) Geographical regions > Latin America
92
Profit/(loss) before tax and balance sheet data – Latin America
Half-year to 30 June 2014
Retail Banking and Wealth Management US$m
Commercial Banking US$m
Global Banking and Markets US$m
Global Private Banking US$m
Other US$m
Inter- segment elimination65 US$m
Total US$m
Profit/(loss) before tax
Net interest income ............ 1,698 787 249 9 6 (49) 2,700
Net fee income/(expense) .. 381 232 72 15 (3) – 697
Trading income/(expense) excluding net interest income ........................... 86 57 288 2 (5) – 428
Net interest income on trading activities ............ – – 66 – – 49 115
Net trading income/ (expense)59 ..................... 86 57 354 2 (5) 49 543
Net income from financial instruments designated at fair value .................... 268 94 – – – – 362
Gains less losses from financial investments ..... – – 49 – – – 49
Dividend income ............... 3 2 1 – – – 6 Net earned insurance
premiums ....................... 577 150 2 – (1) – 728 Other operating income ..... 43 13 9 1 88 (80) 74
Total operating income .... 3,056 1,335 736 27 85 (80) 5,159
Net insurance claims66 ....... (700) (193) (1) – – – (894)
Net operating income13 .... 2,356 1,142 735 27 85 (80) 4,265
Loan impairment charges and other credit risk provisions ...................... (701) (261) (29) (7) – – (998)
Net operating income ...... 1,655 881 706 20 85 (80) 3,267
Operating expenses ............ (1,741) (775) (304) (25) (128) 80 (2,893)
Operating profit/(loss) ..... (86) 106 402 (5) (43) – 374
Share of profit in associates and joint ventures .......... – – – – – – –
Profit/(loss) before tax ..... (86) 106 402 (5) (43) – 374
% % % % % % Share of HSBC’s profit
before tax ....................... (0.7) 0.8 3.2 − (0.3) 3.0 Cost efficiency ratio .......... 73.9 67.9 41.4 92.6 150.6 67.8 Balance sheet data51 US$m US$m US$m US$m US$m US$m Loans and advances to
customers (net)3 ............. 13,637 21,528 11,410 79 – 46,654 Total assets ........................ 31,651 32,248 61,007 320 876 (472) 125,630 Customer accounts3 ........... 24,794 17,538 9,394 2,126 – 53,852
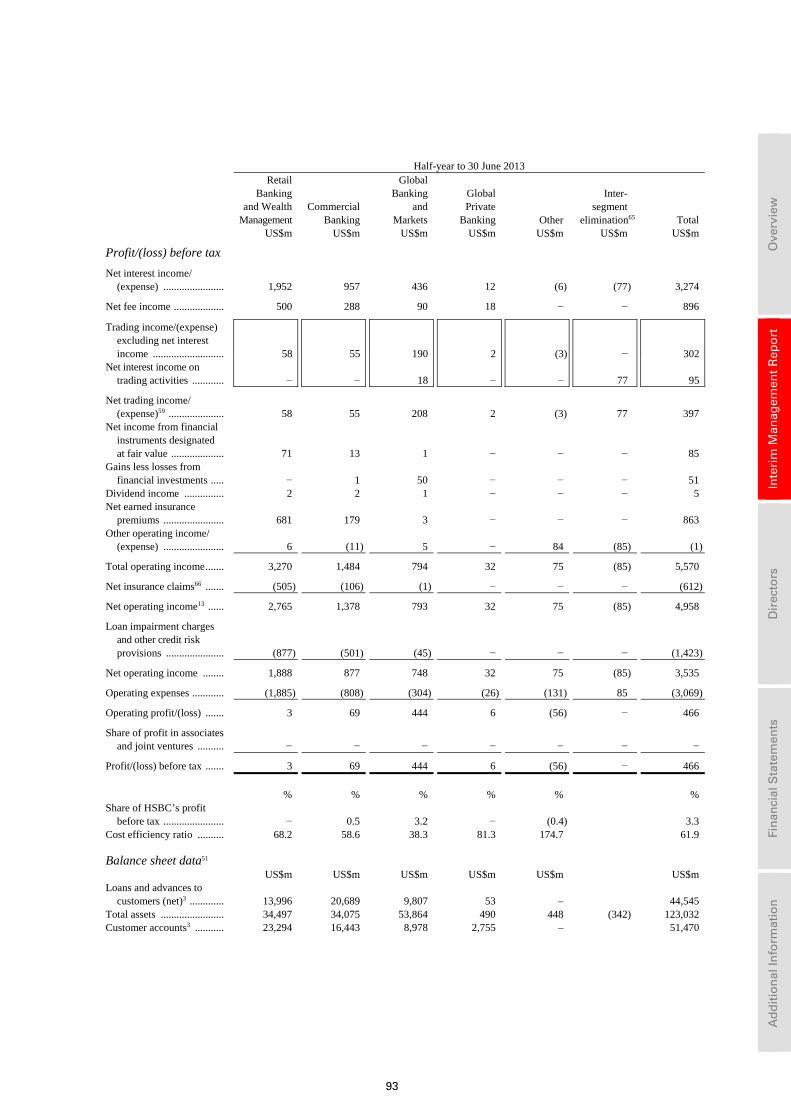
93
Ove
rvie
w
In
teri
m M
anag
emen
t R
epo
rt
D
irec
tors
Fin
anci
al S
tate
men
ts
A
dd
itio
nal
Info
rmat
ion
Half-year to 30 June 2013
Retail Banking and Wealth Management US$m
Commercial Banking US$m
Global Banking and Markets US$m
Global Private Banking US$m
Other US$m
Inter- segment elimination65 US$m
Total US$m
Profit/(loss) before tax
Net interest income/ (expense) ....................... 1,952 957 436 12 (6) (77) 3,274
Net fee income ................... 500 288 90 18 − − 896
Trading income/(expense) excluding net interest income ........................... 58 55 190 2 (3) − 302
Net interest income on trading activities ............ − − 18 − − 77 95
Net trading income/ (expense)59 ..................... 58 55 208 2 (3) 77 397
Net income from financial instruments designated at fair value .................... 71 13 1 − − − 85
Gains less losses from financial investments ..... − 1 50 − − − 51
Dividend income ............... 2 2 1 − − − 5 Net earned insurance
premiums ....................... 681 179 3 − − − 863 Other operating income/
(expense) ....................... 6 (11) 5 − 84 (85) (1)
Total operating income ....... 3,270 1,484 794 32 75 (85) 5,570
Net insurance claims66 ....... (505) (106) (1) − − − (612)
Net operating income13 ...... 2,765 1,378 793 32 75 (85) 4,958
Loan impairment charges and other credit risk provisions ...................... (877) (501) (45) − − − (1,423)
Net operating income ........ 1,888 877 748 32 75 (85) 3,535
Operating expenses ............ (1,885) (808) (304) (26) (131) 85 (3,069)
Operating profit/(loss) ....... 3 69 444 6 (56) − 466
Share of profit in associates and joint ventures .......... − − − − − − −
Profit/(loss) before tax ....... 3 69 444 6 (56) − 466
% % % % % % Share of HSBC’s profit
before tax ....................... − 0.5 3.2 − (0.4) 3.3 Cost efficiency ratio .......... 68.2 58.6 38.3 81.3 174.7 61.9 Balance sheet data51 US$m US$m US$m US$m US$m US$m Loans and advances to
customers (net)3 ............. 13,996 20,689 9,807 53 – 44,545 Total assets ........................ 34,497 34,075 53,864 490 448 (342) 123,032 Customer accounts3 ........... 23,294 16,443 8,978 2,755 – 51,470
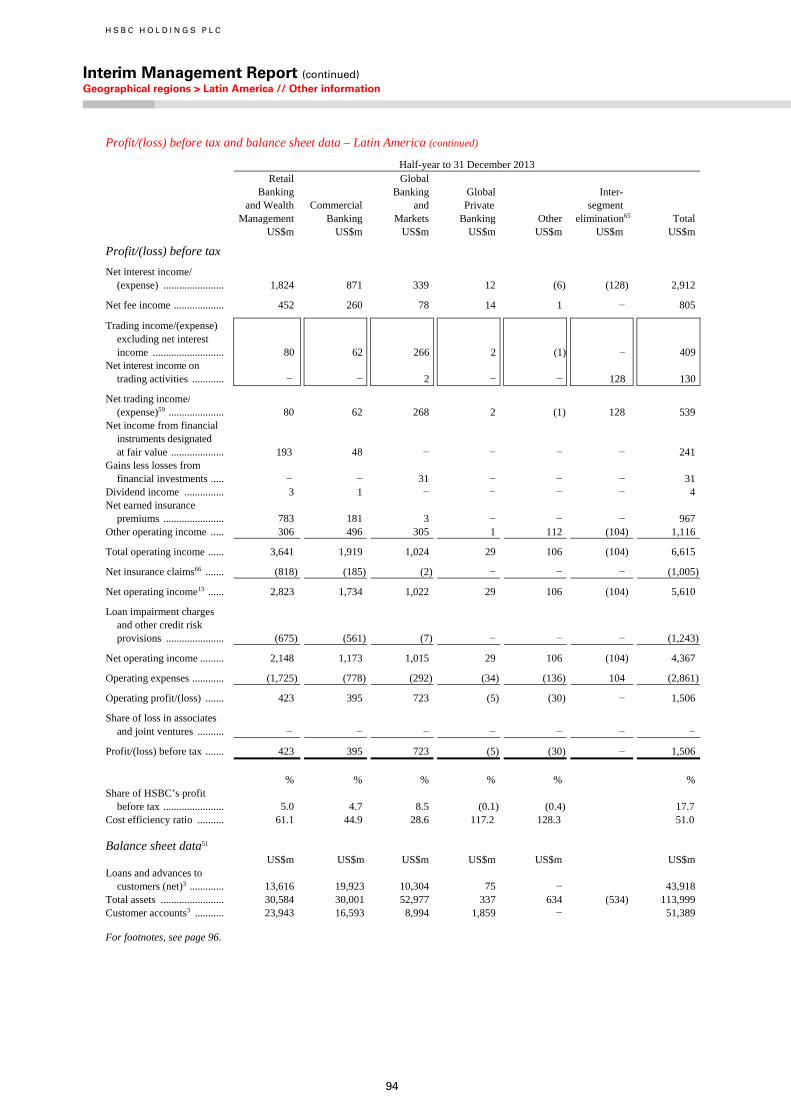
H S B C H O L D I N G S P L C
Interim Management Report (continued) Geographical regions > Latin America // Other information
94
Profit/(loss) before tax and balance sheet data – Latin America (continued)
Half-year to 31 December 2013
Retail Banking and Wealth Management US$m
Commercial Banking US$m
Global Banking and Markets US$m
GlobalPrivate
Banking US$m
Other
US$m
Inter- segment elimination65 US$m
Total US$m
Profit/(loss) before tax
Net interest income/ (expense) ....................... 1,824 871 339 12 (6) (128) 2,912
Net fee income ................... 452 260 78 14 1 − 805
Trading income/(expense) excluding net interest income ........................... 80 62 266 2 (1) − 409
Net interest income on trading activities ............ − − 2 − − 128 130
Net trading income/ (expense)59 ..................... 80 62 268 2 (1) 128 539
Net income from financial instruments designated at fair value .................... 193 48 − − − − 241
Gains less losses from financial investments ..... − − 31 − − − 31
Dividend income ............... 3 1 − − − − 4Net earned insurance
premiums ....................... 783 181 3 − − − 967Other operating income ..... 306 496 305 1 112 (104) 1,116
Total operating income ...... 3,641 1,919 1,024 29 106 (104) 6,615
Net insurance claims66 ....... (818) (185) (2) − − − (1,005)
Net operating income13 ...... 2,823 1,734 1,022 29 106 (104) 5,610
Loan impairment charges and other credit risk provisions ...................... (675) (561) (7) − − − (1,243)
Net operating income ......... 2,148 1,173 1,015 29 106 (104) 4,367
Operating expenses ............ (1,725) (778) (292) (34) (136) 104 (2,861)
Operating profit/(loss) ....... 423 395 723 (5) (30) − 1,506
Share of loss in associates and joint ventures .......... − − − − − − −
Profit/(loss) before tax ....... 423 395 723 (5) (30) − 1,506
% % % % % %Share of HSBC’s profit
before tax ....................... 5.0 4.7 8.5 (0.1) (0.4) 17.7 Cost efficiency ratio .......... 61.1 44.9 28.6 117.2 128.3 51.0 Balance sheet data51 US$m US$m US$m US$m US$m US$mLoans and advances to
customers (net)3 ............. 13,616 19,923 10,304 75 − 43,918Total assets ........................ 30,584 30,001 52,977 337 634 (534) 113,999Customer accounts3 ........... 23,943 16,593 8,994 1,859 − 51,389
For footnotes, see page 96.
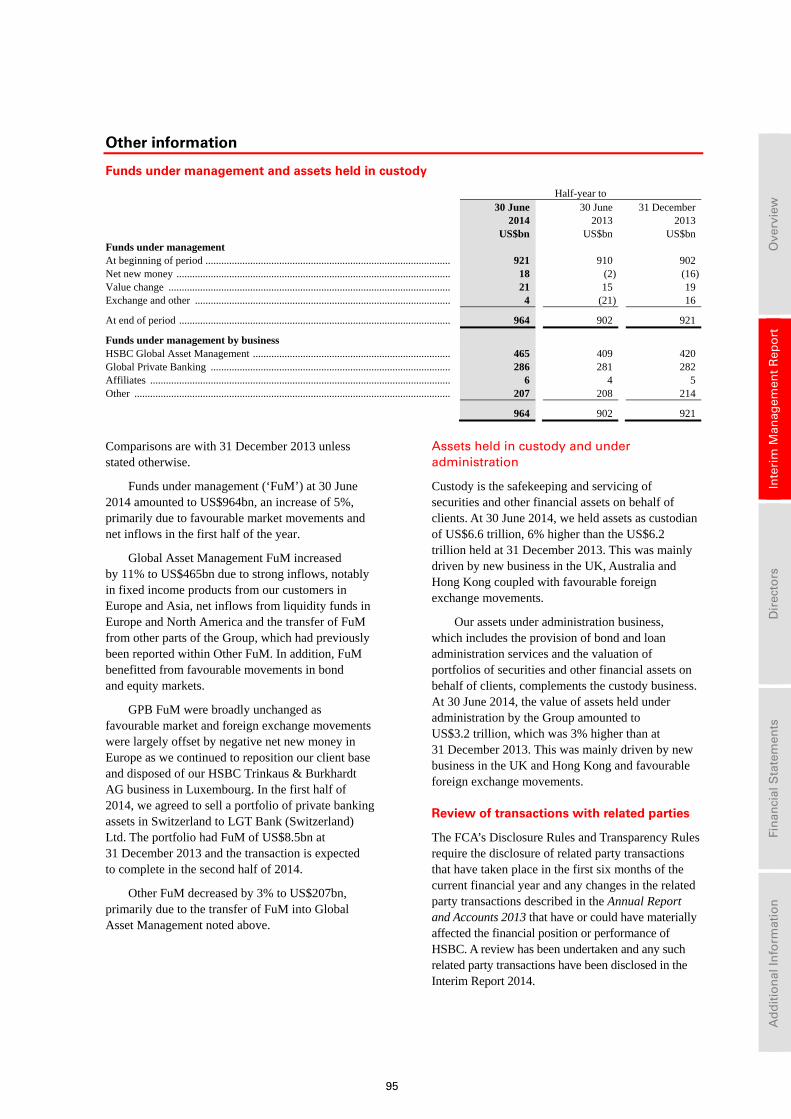
95
Ove
rvie
w
In
teri
m M
anag
emen
t R
epo
rt
D
irec
tors
Fin
anci
al S
tate
men
ts
A
dd
itio
nal
Info
rmat
ion
Other information
Funds under management and assets held in custody
Half-year to 30 June
2014 30 June
2013 31 December
2013 US$bn US$bn US$bn Funds under management At beginning of period ............................................................................................. 921 910 902 Net new money ........................................................................................................ 18 (2) (16)Value change ........................................................................................................... 21 15 19 Exchange and other ................................................................................................. 4 (21) 16
At end of period ....................................................................................................... 964 902 921
Funds under management by business HSBC Global Asset Management ........................................................................... 465 409 420 Global Private Banking ........................................................................................... 286 281 282 Affiliates .................................................................................................................. 6 4 5 Other ........................................................................................................................ 207 208 214
964 902 921
Comparisons are with 31 December 2013 unless stated otherwise.
Funds under management (‘FuM’) at 30 June 2014 amounted to US$964bn, an increase of 5%, primarily due to favourable market movements and net inflows in the first half of the year.
Global Asset Management FuM increased by 11% to US$465bn due to strong inflows, notably in fixed income products from our customers in Europe and Asia, net inflows from liquidity funds in Europe and North America and the transfer of FuM from other parts of the Group, which had previously been reported within Other FuM. In addition, FuM benefitted from favourable movements in bond and equity markets.
GPB FuM were broadly unchanged as favourable market and foreign exchange movements were largely offset by negative net new money in Europe as we continued to reposition our client base and disposed of our HSBC Trinkaus & Burkhardt AG business in Luxembourg. In the first half of 2014, we agreed to sell a portfolio of private banking assets in Switzerland to LGT Bank (Switzerland) Ltd. The portfolio had FuM of US$8.5bn at 31 December 2013 and the transaction is expected to complete in the second half of 2014.
Other FuM decreased by 3% to US$207bn, primarily due to the transfer of FuM into Global Asset Management noted above.
Assets held in custody and under administration
Custody is the safekeeping and servicing of securities and other financial assets on behalf of clients. At 30 June 2014, we held assets as custodian of US$6.6 trillion, 6% higher than the US$6.2 trillion held at 31 December 2013. This was mainly driven by new business in the UK, Australia and Hong Kong coupled with favourable foreign exchange movements.
Our assets under administration business, which includes the provision of bond and loan administration services and the valuation of portfolios of securities and other financial assets on behalf of clients, complements the custody business. At 30 June 2014, the value of assets held under administration by the Group amounted to US$3.2 trillion, which was 3% higher than at 31 December 2013. This was mainly driven by new business in the UK and Hong Kong and favourable foreign exchange movements.
Review of transactions with related parties
The FCA’s Disclosure Rules and Transparency Rules require the disclosure of related party transactions that have taken place in the first six months of the current financial year and any changes in the related party transactions described in the Annual Report and Accounts 2013 that have or could have materially affected the financial position or performance of HSBC. A review has been undertaken and any such related party transactions have been disclosed in the Interim Report 2014.
H S B C H O L D I N G S P L C
Interim Management Report (continued) Footnotes
96
Footnotes to pages 2 to 95
Financial highlights
1 Dividends recognised in the financial statements are dividends per ordinary share declared in the period and are not dividends in respect of, or for, the period.
2 The cost efficiency ratio is defined as total operating expenses divided by net operating income before loan impairment charges and other credit risk provisions.
3 From 1 January 2014, non-trading reverse repos and repos are presented as separate lines in the balance sheet. Previously, non-trading reverse repos were included within ‘Loans and advances to banks’ and ‘Loans and advances to customers’ and non-trading repos were included within ‘Deposits by banks’ and ‘Customer accounts’. Comparative data have been re-presented accordingly. Non-trading reverse repos and repos have been presented as separate lines in the balance sheet to align disclosure with market practice and provide more meaningful information in relation to loans and advances. The extent to which reverse repos and repos represent loans to/from customers and banks is set out in Note 11 on the Financial Statements.
4 The return on average ordinary shareholders’ equity is defined as profit attributable to shareholders of the parent company divided by average ordinary shareholders’ equity.
5 On 1 January 2014, CRD IV came into force and capital and RWAs at 30 June 2014 are calculated and presented on this basis. Prior to this date, capital and RWAs were calculated and presented on a Basel 2.5 basis. In addition, capital and RWAs at 31 December 2013 were also estimated based on the Group’s interpretation of final CRD IV legislation and final rules issued by the PRA.
6 Pre-tax return on average risk-weighted assets (‘RWA’s) is calculated using average RWAs based on a Basel 2.5 basis for all periods up to and including 31 December 2013 and on a CRD IV end point basis for 31 March 2014 and 30 June 2014.
7 The basis of calculation of the June 2014 leverage ratio has changed from previous disclosures based on the approach prescribed by the PRA. For further details of the leverage ratio, see page 186.
8 Each ADS represents five ordinary shares. 9 Total shareholder return is defined as the growth in share value and declared dividend income during the relevant period. 10 The Morgan Stanley Capital International World Banks Index.
Business and operating models
11 From 1 January 2014, the geographical region ‘Asia’ replaced the geographical regions previously reported as ‘Hong Kong’ and ‘Rest of Asia-Pacific’ (see Note 23 on the Financial Statements for further details). Comparative data have been re-presented to reflect this change.
12 The reporting structure of Hong Kong and the rest of Asia is aligned to the regional Asia management structure. 13 Net operating income before loan impairment charges and other credit risk provisions, also referred to as revenue. 14 Intermediation of securities, funds and insurance products, including Securities Services in GB&M. 15 Merger and acquisition, event and project financing, and co-investments in GPB. 16 Including Foreign Exchange, Rates, Credit and Equities. 17 Including portfolio management. 18 Including private trust and estate planning (for financial and non-financial assets). 19 Including hedge funds, real estate and private equity. 20 The sum of balances presented does not agree to consolidated amounts because inter-company eliminations are not presented here. 21 Targets for 2014-16 were announced at our Investor Update in May 2013.
Reconciliations of constant currency profit before tax
22 ‘Currency translation adjustment’ is the effect of translating the results of subsidiaries and associates for the previous half-years at the average rates of exchange applicable in the current half-year.
23 Positive numbers are favourable: negative numbers are unfavourable. 24 Changes in fair value due to movements in own credit spread on long-term debt issued. This does not include the fair value changes
due to own credit risk in respect of trading liabilities or derivative liabilities. 25 The operating results of these disposals were removed from underlying results in addition to disposal gains and losses. 26 The operating results of these disposals were not removed from underlying results as they were not significant. 27 Other income in this context comprises net trading income, net income/(expense) from other financial instruments designated at fair
value, gains less losses from financial investments, dividend income, net earned insurance premiums and other operating income less net insurance claims incurred and movement in liabilities to policyholders.
28 Excludes items where there are substantial offsets in the income statement for the same period.
Financial summary
29 Net interest income includes the cost of internally funding trading assets, while the related revenues are reported in net trading income. In our global business results, the total cost of funding trading assets is included within Global Banking and Markets’ net trading income as an interest expense.
30 Gross interest yield is the average annualised interest rate earned on average interest-earning assets (‘AIEA’). 31 Net interest spread is the difference between the average annualised interest rate earned on AIEA, net of amortised premiums and
loan fees, and the average annualised interest rate payable on average interest-bearing funds. Net interest margin is net interest income expressed as an annualised percentage of AIEA.
32 The accounting for the disposal of our interest in Ping An is described on page 521 of the Annual Report and Accounts 2013. In the first half of 2013, we recognised a net gain on the completion of the Ping An disposal of US$553m which offset the US$553m loss on the contingent forward sale contract recognised in the second half of 2012. The gain of US$553m represented the net effect of the US$1,235m gain on derecognition of the Ping An equity securities classified as available-for-sale investments and recorded in ‘Gains less losses from financial investments’, offset by the US$682m adverse change in fair value of the contingent forward sale contract in the period to the point of delivery of the equity securities recorded in ‘Net trading income’.
97
Ove
rvie
w
In
teri
m M
anag
emen
t R
epo
rt
D
irec
tors
Fin
anci
al S
tate
men
ts
A
dd
itio
nal
Info
rmat
ion
33 The cost of internal funding of trading assets was US$123m (first half of 2013: US$74m; second half of 2013: US$101m) and is excluded from the reported ‘Net trading income’ line and included in ‘Net interest income’. However, this cost is reinstated in ‘Net trading income’ in our global business reporting.
34 Net trading income includes an unfavourable movement of US$28m (first half of 2013: favourable movement of US$4m; second half of 2013: unfavourable movement of US$70m) associated with changes in the fair value of issued structured notes and other hybrid instrument liabilities derived from movements in HSBC issuance spreads.
35 The change in fair value related to movements in the Group’s credit spread on long-term debt resulted in an expense of US$215m in the first half of 2014 (first half of 2013: expense of US$19m; second half of 2013: expense of US$1.2bn).
36 Other changes in fair value include gains and losses arising from changes in the fair value of derivatives that are managed in conjunction with HSBC’s long-term debt issued.
37 Discretionary participation features. 38 Net insurance claims incurred and movement in liabilities to policyholders arise from both life and non-life insurance business.
For non-life business, amounts reported represent the cost of claims paid during the year and the estimated cost of incurred claims. For life business, the main element of claims is the liability to policyholders created on the initial underwriting of the policy and any subsequent movement in the liability that arises, primarily from the attribution of investment performance to savings-related policies. Consequently, claims rise in line with increases in sales of savings-related business and with investment market growth.
Consolidated balance sheet
39 Net of impairment allowances. 40 On 1 January 2014, CRD IV came into force and capital resources at 30 June 2014 are calculated and presented on this basis. Prior
to this date, capital resources were calculated and presented on a Basel 2.5 basis. 41 Capital resources are total regulatory capital, the calculation of which is set out on page 186. 42 Includes perpetual preferred securities. 43 The definition of net asset value per share is total shareholders’ equity, less non-cumulative preference shares and capital securities,
divided by the number of ordinary shares in issue. 44 ‘Currency translation’ is the effect of translating the assets and liabilities of subsidiaries and associates for the previous year-end at
the rates of exchange applicable at the current period-end. 45 See Note 13 on the Financial Statements. 46 France primarily comprises the domestic operations of HSBC France, HSBC Assurances Vie and the Paris branch of HSBC Bank plc.
Reconciliation of RoRWA measures
47 Risk-weighted assets (‘RWA’s) and pre-tax return on average risk-weighted assets (‘RoRWA’). 48 Underlying RoRWA is calculated using underlying pre-tax return and reported average RWAs at constant currency and adjusted for
the effects of business disposals. 49 Other includes treasury services related to the US Consumer Mortgage Lending business and commercial operations in run-off. US
CML includes loan portfolios within the run-off business that are designated ‘held for sale’.
Analyses by global business and by geographical region
50 The main items reported under ‘Other’ are the results of HSBC’s holding company and financing operations, which includes net interest earned on free capital held centrally, operating costs incurred by the head office operations in providing stewardship and central management services to HSBC, along with the costs incurred by the Group Service Centres and Shared Service Organisations and associated recoveries. The results also include fines and penalties as part of the settlement of investigations into past inadequate compliance with anti-money laundering and sanctions laws, the UK bank levy together with unallocated investment activities, centrally held investment companies, gains arising from the dilution of interests in associates and joint ventures and certain property transactions. In addition, ‘Other’ also includes part of the movement in the fair value of long-term debt designated at fair value (the remainder of the Group’s movement on own debt is included in GB&M).
51 Assets by geographical region and global business include intra-HSBC items. These items are eliminated, where appropriate, under the headings ‘Intra-HSBC items’ or ‘Inter-segment elimination’.
52 For divested businesses, this includes the gain or loss on disposal and material results of operations as described on page 22. 53 Loan impairment charges and other credit risk provisions. 54 Share of profit in associates and joint ventures. 55 The Principal RBWM business measure excludes the effects of the US run-off portfolio and the disposed-of US CRS business.
Concentrating on the Principal RBWM business allows management to identify material changes in the ongoing business and assess the factors and trends which are expected to have a material effect on it in future years. Tables which reconcile reported RBWM financial measures to Principal RBWM financial measures are provided in the Form 6-K filed with the SEC, which is available on www.hsbc.com.
56 ‘Investment distribution’ includes Investments, which comprises mutual funds (HSBC manufactured and third party), structured products and securities trading, and Wealth Insurance distribution, consisting of HSBC manufactured and third-party life, pension and investment insurance products.
57 ‘Other personal lending’ includes personal non-residential closed-end loans and personal overdrafts. 58 ‘Other’ includes the distribution and manufacturing (where applicable) of retail and credit protection insurance, any gains or losses
on business disposals, movements in non-qualifying hedges, losses arising from a review of compliance with the Consumer Credit Act in the UK in 2014 and loss on disposal of HFC UK Bank secured lending portfolio in 2013.
59 In the analysis of global businesses, net trading income/(expense) comprises all gains and losses from changes in the fair value of financial assets and financial liabilities classified as held for trading, related external and internal interest income and interest expense, and dividends received; in the statutory presentation internal interest income and expense are eliminated.
60 The management view of income reflects the new management structure of GB&M which has been in place since 12 August 2013. Comparatives have been re-presented for this change.
61 Figures on a reported basis, unless otherwise stated. 62 In the first half of 2014, Markets included an unfavourable value movement of US$28m on structured liabilities (first half of 2013:
favourable fair value movement of US$4m; second half of 2013: adverse fair value movement of US$70m).

H S B C H O L D I N G S P L C
Interim Management Report (continued) Footnotes // Risk > Risk profile
98
63 ‘Other’ in GB&M includes net interest earned on free capital held in the global business not assigned to products, gains resulting from business disposals. Within the management view of total operating income, notional tax credits are allocated to the businesses to reflect the economic benefit generated by certain activities which is not reflected within operating income, for example notional credits on income earned from tax-exempt investments where the economic benefit of the activity is reflected in tax expense. In order to reflect the total operating income on an IFRS basis, the offset to these tax credits are included within ‘Other’.
64 ‘Client assets’ are translated at the rates of exchange applicable for their respective period-ends, with the effects of currency translation reported separately. The main components of client assets are funds under management, which are not reported on the Group’s balance sheet, and customer deposits, which are reported on the Group’s balance sheet. Client assets at 30 June 2014 included US$12bn (31 December 2013: US$12.5bn) of client assets held for sale.
65 Inter-segment elimination comprises (i) the costs of shared services and Group Service Centres included within ‘Other’ which are recovered from global businesses, and (ii) the intra-segment funding costs of trading activities undertaken within GB&M. HSBC’s Balance Sheet Management business, reported within GB&M, provides funding to the trading businesses. To report GB&M’s net trading income on a fully funded basis, ‘Net interest income/(expense)’ and ‘Net interest income/(expense) on trading activities’ are grossed up to reflect internal funding transactions prior to their elimination in the inter-segment column.
66 Net insurance claims incurred and movement in liabilities to policyholders. 67 ‘Employee expenses’ comprises costs directly incurred by each global business. The reallocation and recharging of employee and
other expenses directly incurred in the ‘Other’ category is shown in ‘Other operating expenses’. 68 RWAs are non-additive across geographical regions due to market risk diversification effects within the Group.
99
Ove
rvie
w
In
teri
m M
anag
emen
t R
epo
rt
D
irec
tors
Fin
anci
al S
tate
men
ts
A
dd
itio
nal
Info
rmat
ion
Risk Risk profile ................................................................. 99
Managing risk ............................................................ 100
Top and emerging risks ............................................ 100
Macroeconomic and geopolitical risk ......................... 100 Macro-prudential, regulatory and legal risks
to our business model ............................................. 101 Risks related to our business operations, governance
and internal control systems ................................... 104
Areas of special interest ............................................ 107 Financial crime compliance and regulatory
compliance .............................................................. 107 Regulatory stress tests ................................................. 108
Credit risk .................................................................. 109
Liquidity and funding ............................................... 148
Market risk ................................................................ 157
Operational risk ........................................................ 165
Compliance risk .......................................................... 166
Reputational risk ......................................................... 168
Risk management of insurance operations ............ 169
There have been no material changes to our policies and practices regarding risk management and governance as described in the Annual Report and Accounts 2013 except that new enhanced global AML and sanctions policies and a globally consistent approach to the risk management of conduct were approved by the Board in the first half of 2014 as described in Compliance risk on page 166. In addition, the Financial Intelligence Unit was established in the Security and Fraud Risk and Financial Crime Compliance functions as described under Operational risk on page 165.
A description of the principal risks and uncertainties for the remaining six months of the financial year is on page 100.
A summary of our current policies and practices regarding risk is provided in the Appendix to Risk on page 266 of the Annual Report and Accounts 2013.
Risk profile
Managing our risk profile
• A strong balance sheet is core to our philosophy.
• Our portfolios remain aligned to our risk appetite and strategy.
• Our risk management framework is supported by robust forward-looking risk identification.
Maintaining capital strength and strong liquidity position
• Our common equity end point tier 1 capital ratio remains strong at 11.3%.
• We have sustained our strong liquidity position throughout the first half of 2014.
• The ratio of customer advances to deposits remains significantly below 90%.
Strong governance
• Robust risk governance and accountability is embedded across the Group.
• The Board, advised by the Group Risk Committee, approves our risk appetite.
• Our Regulatory Compliance and Financial Crime Compliance functions provide intense focus on these areas.
• Our global risk operating model supports adherence to globally consistent standards and risk management policies across the Group.
Our top and emerging risks
• Macroeconomic and geopolitical risk.
• Macro-prudential, regulatory and legal risks to our business model.
• Risks related to our business operations, governance and internal control systems.
H S B C H O L D I N G S P L C
Interim Management Report (continued) Risk > Managing risk / Top and emerging risks
100
Managing risk
Robust risk governance and accountability are embedded throughout the Group, fostering a continuous monitoring of the risk environment and an integrated evaluation of risks and their interactions.
Our risk governance framework ensures the appropriate oversight of and accountability for the effective management of risk, including financial crime risk, at Group, regional and global business levels.
Our risk profile is underpinned by our core philosophy of maintaining a strong balance sheet and liquidity position, and capital strength. We continued to sustain a conservative risk profile during the first half of 2014 by managing and, where appropriate, reducing exposure to the most likely areas of stress:
• we managed selectively our exposure to sovereign debt and bank counterparties to ensure that the overall quality of the portfolio remained strong;
• we regularly assessed higher-risk countries and adjusted our risk appetite and exposures accordingly;
• we repositioned certain portfolios through our six filters process (see page 13) and our focus on selected products or customer segments;
• we made our client selection filters more robust in managing the risk of financial crime; and
• we mitigated risks, for example reputational and operational, when they were forecast to exceed our risk appetite.
The diversification of our lending portfolio across global businesses and regions, together with our broad range of products, ensured that we were not overly dependent on a limited number of countries or markets to generate income and growth.
Top and emerging risks
During the first half of 2014, senior management paid particular attention to a number of top and emerging risks.
Our approach to identifying and monitoring top and emerging risks is described on page 17. Our current ones are as follows:
Macroeconomic and geopolitical risk
Emerging markets slowdown
Increased geopolitical risk
Emerging markets slowdown
Economic growth in emerging markets remained weak in the first half of 2014. Monetary policy in a number of emerging markets was restrictive to counter the risk of capital outflows which could have had negative effects on economic growth. Political tensions in certain countries, including Syria, Ukraine and Thailand, deterred investors and increased the risk that they would fail to meet financing requirements. Forthcoming elections in a number of countries may increase instability and put pressure on currencies.
In mainland China, whilst the absolute level of GDP growth remained relatively high, the rate of growth declined more sharply than expected as a result of tighter central government controls over local government finances and the shadow banking sector. The economic situation in Argentina remained challenging following the devaluation of the peso in early 2014, the US Supreme Court’s decision to oblige Argentina to repay hold-out debt holders and the subsequent technical default by the country.
Potential impact on HSBC
• We earn a significant proportion of our profits from our operations in emerging markets. HSBC’s results could be adversely affected by a prolonged slowdown in emerging market growth.
• Global trade and capital flows may contract as a result of weaker economic growth in emerging markets, the introduction of protectionist measures, the emergence of geopolitical risks or increasing redenomination risk. This may also curtail our profitability.
Mitigating actions
• We closely monitor developments in emerging markets to ensure trends are identified, the implications for specific customers or customer segments are assessed and appropriate action is taken as circumstances evolve.
• We have conducted a number of stress tests to assess the effect of changes in economic conditions in Asia, and particularly in mainland China, on our operations. These factored in a China hard landing scenario (see page 139 of
E
E
E
101
Ove
rvie
w
In
teri
m M
anag
emen
t R
epo
rt
D
irec
tors
Fin
anci
al S
tate
men
ts
A
dd
itio
nal
Info
rmat
ion
the Annual Report and Accounts 2013). In the first half of 2014, we ran a further stress test which assumed a significant deceleration of growth in mainland China and a sharp contraction in Hong Kong (see page 108).
Increased geopolitical risk
Our operations are exposed to risks arising from political instability and civil unrest in a number of countries, which may have a wider effect on regional stability and regional and global economies.
Geopolitical risk rose in the first half of 2014 as a result of the crisis in Ukraine and the possibility of military escalation and/or civil war. Further sanctions against the Russian government remain a possibility, which could affect foreign investment in Russia.
Geopolitical risk remained high in the Middle East with the crisis between Israel and Palestine, unrest in Egypt, the civil war in Syria and the conflict in Iraq. Negotiations continued on restricting the scope of Iranian nuclear activities, which add to the risks in the region.
In Asia, there was no easing in the maritime sovereignty disputes involving mainland China and Japan as the Chinese government sought to extend its influence over the South and East China Seas.
In Turkey, the continued political uncertainty led to market volatility and placed the currency under pressure.
Potential impact on HSBC
• Our results are subject to the risk of loss from unfavourable political developments, currency fluctuations, social instability and changes in government policies on matters such as expropriation, authorisations, international ownership, interest-rate caps, foreign exchange transferability and tax in the jurisdictions in which we operate. Actual conflict could put our staff in danger and bring physical damage to our assets.
Mitigating actions
• We monitor the geopolitical and economic outlook, in particular in countries where we have material exposures and a physical presence. Our internal credit risk rating of sovereign counterparties takes these factors into account and drives our appetite for conducting business in those countries. Where necessary, we adjust our country limits and exposures to reflect our appetite and mitigate risks as appropriate.
• Our sanctions screening processes and governance have been strengthened through our Global Standards programme.
Macro-prudential, regulatory and legal risks to our business model
Regulatory developments affecting our business model and Group profitability
Regulatory investigations, fines, sanctions, commitments and consent orders and requirements relating to conduct of business and financial crime negatively affecting our results and brand
Dispute risk
Financial service providers face increasingly stringent and costly regulatory and supervisory requirements, particularly in the areas of capital and liquidity management, conduct of business, operational structures and the integrity of financial services delivery. Increased government intervention and control over financial institutions, together with measures to reduce systemic risk, may significantly alter the competitive landscape locally, regionally and/or globally for some or all of the Group’s businesses. These measures may be introduced as formal requirements in a super-equivalent manner and to differing timetables by regulatory regimes.
Regulatory developments affecting our business model and Group profitability
Several regulatory changes are likely to affect the activities both of the Group as a whole and of some or all of our principal subsidiaries. These changes include:
• the UK’s Financial Services (Banking Reform) Act 2013 which gave effect to the recommendations of the Independent Commission on Banking (‘ICB’) in relation to the ring-fencing of our UK retail banking activities from wholesale banking, together with the structural separation of other activities as envisaged in the legislation and rules adopted in the US (including the Volcker Rule adopted in December 2013 under the Dodd-Frank Act) and potential changes across the EU (including a proposed Regulation on structural measures for EU credit institutions);
• requirements flowing from arrangements for the recovery and resolution of the Group and its individual operating entities, which may have different effects in different countries;
• the implementation of extra-territorial laws,
E T
T
T
T
H S B C H O L D I N G S P L C
Interim Management Report (continued) Risk > Top and emerging risks
102
including the Foreign Account Tax Compliance Act (‘FATCA’) and other related initiatives to share tax information such as those pursued by the OECD;
• changes in the regime for the operation of capital markets, notably mandatory central clearing of over the counter (‘OTC’) derivatives, including under the Dodd-Frank Act and the EU’s European Market Infrastructure Regulation (‘EMIR’);
• changes arising from the increasing focus by regulators on how institutions conduct business, particularly with regard to the delivery of fair outcomes for customers, promoting effective competition in the interests of consumers (including the recently announced proposals for an investigation by the UK Competition and Markets Authority on the personal current account and SME banking market in the UK) and ensuring the orderly and transparent operation of global financial markets. Focus also increases on remuneration and on increasing management accountability, the latter to meet requirements under CRD IV and the UK Banking Reform Act;
• the implementation of significant parts of CRD IV which are yet to be finalised and applied, notably the UK application of the capital buffer framework and its interaction with Pillar 2 and the Financial Policy Committee’s (‘FPC’s) July 2014 consultation on proposals for the development of a UK leverage ratio;
• the ECB Asset Quality Review (‘AQR’), which may require a substantial recapitalisation among eurozone banks;
• the tightening by regulators in a number of countries of credit controls on mortgage lending and unsecured portfolios; and
• the continued risk of further changes to regulation relating to taxes affecting financial service providers, including financial transaction taxes.
Potential impact on HSBC
• Proposed changes in and/or the implementation of regulations including mandatory central clearing of OTC derivatives, EMIR, ring-fencing and similar requirements, the Volcker Rule, recovery and resolution plans, FATCA and findings from competition orientated enquiries and investigations may affect the manner in which we conduct our activities and how the Group is structured. These measures
have the potential to increase our cost of doing business and curtail the types of business we can carry out, with the consequent risk of decreased profitability.
• Mandatory central clearing of OTC derivatives also brings new risks to HSBC in our role as a clearing member, as we will be required to underwrite losses incurred by central clearing counterparties from the default of other clearing members and their clients. Hence central clearing brings with it a new element of interconnectedness between clearing members and clients which we believe may increase rather than reduce our exposure to systemic risk.
• Increased regulation of conduct of business (including incentive structures and remuneration) and management accountability may affect the industry in areas such as employee recruitment and retention, product pricing and profitability in both retail and wholesale markets. HSBC’s businesses may be affected by these developments.
• Potential market disruption from the AQR, including the possible re-emergence of concerns over the eurozone, may affect us directly through our exposure to eurozone banks and sovereigns, and indirectly should there be any diminution in economic activity in the eurozone.
Mitigating actions
• We are engaged closely with governments and regulators in the countries in which we operate to help ensure that the new requirements are considered properly and can be implemented in an effective manner.
• We are focused on developing a global approach to the risk management of conduct and have established a Conduct & Values Committee as a sub-committee of the Board to oversee the framework and its implementation across the Group.
• We have enhanced our governance around central clearing counterparties and appointed specialists to manage the associated liquidity and collateral risks.
Regulatory investigations, fines, sanctions, commitments and consent orders and requirements relating to conduct of business and financial crime negatively affecting our results and brand
Financial service providers are at risk of regulatory sanctions or fines related to conduct of business and financial crime. The incidence of regulatory
T
103
Ove
rvie
w
In
teri
m M
anag
emen
t R
epo
rt
D
irec
tors
Fin
anci
al S
tate
men
ts
A
dd
itio
nal
Info
rmat
ion
proceedings and other adversarial proceedings against financial service firms is increasing.
Regulatory commitments and consent orders
In December 2012, HSBC Holdings, HSBC North America Holdings Inc. (‘HNAH’), and HSBC Bank USA, N.A. (‘HSBC Bank USA’) entered into agreements with US and UK authorities in relation to investigations regarding past inadequate compliance with AML and sanctions laws. Among other agreements, HSBC Holdings and HSBC Bank USA entered into a five-year deferred prosecution agreement (‘US DPA’) with the US Department of Justice (‘DoJ’) and HSBC Holdings entered into a two-year DPA with the District Attorney of New York County (the ‘DANY DPA’). HSBC Holdings also entered into an undertaking with the FSA (revised as the ‘FCA Direction’ following the UK regulatory restructuring in April 2013) to comply with certain forward-looking obligations with respect to AML and sanctions requirements. In addition, HSBC Holdings entered into a cease and desist order with the US Federal Reserve Board (‘FRB’) with respect to compliance with US AML and sanctions requirements.
The agreements with the DoJ and the FRB and the FCA Direction require us to retain an independent monitor to evaluate our progress in fully implementing our obligations and produce regular assessments of the effectiveness of our Financial Crime Compliance function. The Monitor is discussed on page 15.
HSBC Bank USA is also subject to an agreement entered into with the Office of the Comptroller of the Currency (‘OCC’) in December 2012, the Gramm-Leach-Bliley Act Agreement (‘GLBA Agreement’). See pages 144 and 556 of the Annual Report and Accounts 2013 for further information on the GLBA Agreement and other consent orders, respectively.
Potential impact on HSBC
• It is difficult to predict the outcome of the regulatory proceedings involving our businesses. Unfavourable outcomes may have a material adverse effect on our reputation, brand and results, including loss of business and withdrawal of funding.
• Our significant involvement in facilitating international capital flows and trade exposes the Group to the risk of financial crime or inadvertently breaching restrictions and sanctions imposed by the Office of Foreign Assets Control (‘OFAC’) and other regulators.
• Breach of the US DPA at any time during its term may allow the DoJ to prosecute HSBC Holdings or HSBC Bank USA in relation to the matters which are the subject of the US DPA. Breach of the DANY DPA may allow the District Attorney of New York County to prosecute HSBC Holdings in relation to the matters which are the subject of that DPA.
• Failure to comply with the requirements of consent orders or the GLBA within the time periods specified in them or otherwise as may be extended, could result in supervisory action (see page 145 of the Annual Report and Accounts 2013 for more information about the consequences of not complying with the GLBA) Any such action could have a material adverse effect on the consolidated results and operation of HSBC.
Mitigating actions
• Steps to address many of the requirements of the DPAs, the FCA Direction, the GLBA Agreement and associated regulatory agreements have either already been taken or are under way in consultation with the relevant regulatory agencies. These include simplifying the Group’s control structure, strengthening the governance structure with new leadership appointments, revising key policies and implementing consistent procedures and controls shaped by the highest or most effective standards available in any location where the Group operates to detect, deter and protect against financial crime through our Global Standards programme. In addition, we have substantially increased spending and staffing in the Financial Crime Compliance and Regulatory Compliance functions in the past few years.
• There can be no assurance that these remedial measures taken to date will be effective or that we will not have to take additional remedial measures in the future to comply with the terms of the DPAs, the FCA Direction or the GLBA Agreement.
Conduct of business
Regulators in the UK and other countries have continued to increase their focus on ‘conduct’ matters including sales processes and incentives (including remuneration practices), product and investment suitability and more general conduct of business and market conduct concerns.
H S B C H O L D I N G S P L C
Interim Management Report (continued) Risk > Top and emerging risks
104
In the UK, the FCA are making increasing use of existing and new powers of intervention and enforcement, including powers to consider past business undertaken and implement customer compensation and redress schemes or other, potentially significant, remedial work. They are also regulating areas of activity not previously regulated by them, such as consumer credit, and considering competition issues in the markets they regulate. Additionally, the FCA and other regulators increasingly take actions in response to customer complaints or where they see poor customer outcomes, either specific to an institution or more generally in relation to a particular product. There have been recent examples of this approach by regulators in the context of the possible mis-selling of PPI, of interest rate hedging products for SMEs and of wealth management products.
The Group also continues to be subject to a number of other regulatory proceedings, including investigations and reviews by various national regulatory, competition and enforcement authorities related to certain past submissions made by panel banks and the process for making submissions in connection with the setting of Libor, Euribor and other benchmark interest rates. There are also investigations into currency benchmarks and credit default swaps.
Potential impact on HSBC
• Regulators in the UK and other countries may identify future industry-wide mis-selling, market conduct or other issues that could affect the Group. This may lead from time to time to significant direct costs or liabilities and/or changes in the practices of such businesses. Also, decisions taken by bodies such as the Financial Ombudsman Service in the UK (or similar overseas bodies) in relation to customer complaints could, if applied to a wider class or grouping of customers, have a material adverse effect on the operating results, financial condition and prospects of the Group.
Mitigating actions
• Programmes to actively manage and mitigate conduct risk have been initiated in all global businesses and functions.
• Incentive plans introduced in RBWM in 2013 and 2014 have removed the formulaic link between product sales and variable pay, focusing instead on relationship management activities that support meeting customer needs, improving customer outcomes and sales quality.
• HSBC and its subsidiaries are cooperating fully with all regulatory investigations and reviews.
Dispute risk
HSBC is party to legal proceedings and regulatory matters in a number of jurisdictions arising out of its normal business operations. Further details are provided in Note 25 on the Financial Statements.
Potential impact on HSBC
• Dispute risk gives rise to potential financial loss and significant reputational damage which could adversely affect customer and investor confidence.
Mitigating actions
• We continue to focus on identifying emerging regulatory and judicial trends in order to limit exposure to litigation or regulatory enforcement action in the future.
• We are enhancing our financial crime and regulatory compliance controls and resources.
Risks related to our business operations, governance and internal control systems
Heightened execution risk
People risk
Stress test impact risk
Social media risk
Internet crime and fraud
Information security risk
Data management
Model risk
Heightened execution risk
HSBC is facing heightened execution risk due to a number of factors including the volume and complexity of projects needed to meet regulatory requirements and support business initiatives which are moving into implementation phases in 2014; the degree of organisational change, including the restructuring of our Compliance function into two distinct sub-functions, Financial Crime Compliance and Regulatory Compliance; and external factors, including the challenging macroeconomic environment and the extent and pace of regulatory change. In addition, the implementation of our strategy to simplify our business, which involves withdrawing from certain markets, presents disposal risks.
T
E
T
T
T
T
T
T
T
T
105
Ove
rvie
w
In
teri
m M
anag
emen
t R
epo
rt
D
irec
tors
Fin
anci
al S
tate
men
ts
A
dd
itio
nal
Info
rmat
ion
Potential impact on HSBC
• These factors may affect the successful delivery of our strategic priorities.
• The potential risks of disposals include regulatory breaches, industrial action, loss of key personnel and interruption to systems and processes during business transformation. They can have both financial and reputational implications.
Mitigating actions
• We have strengthened our prioritisation and governance processes for significant projects and have invested in our project implementation and IT capabilities.
• Risks related to organisational change and disposals are subject to close management oversight.
• Our planning and stress testing processes consider the effect of potential internal risks or risks arising from the external environment on our earnings and capital position and actions by management to mitigate them.
• People risk
The demands being placed on the human capital of the Group are unprecedented. The cumulative workload arising from a regulatory reform programme that is often extra-territorial and still evolving is hugely consumptive of human resources, placing increasingly complex and conflicting demands on a workforce where the expert capability set is in short supply and globally mobile.
Potential impact on HSBC
• Changes in remuneration policy and practice resulting from the new regulations under CRD IV apply globally to all employees of EU headquartered banks. The key change is the application of a cap on variable pay that can be paid to any ‘material risk-taker’ (being employees who have been identified as having a material impact on the institution’s risk profile). This presents significant challenges for HSBC given the fact that as a worldwide business, a significant number of our material risk takers are based outside the EU.
• The proposals for a senior persons regime are being made to set clearer expectations of the behaviour of both senior and more junior employees.
• The PRA consultation on clawback proposes extending the Remuneration Code to require all PRA-authorised firms to amend employment contracts to be able to apply clawback to vested variable remuneration on a Group-wide basis.
• Implementing organisational changes to support the Group’s strategy has the potential to lead to increased staff turnover.
Mitigating actions
• The changes in remuneration under the new CRD IV regulations has necessitated a review of our remuneration policy, especially the balance between fixed and variable pay, to ensure we can remain competitive on a total compensation basis and retain our key talent.
• Risks related to organisational change and disposals are subject to close management oversight.
• We continue to increase the level of specialist resources within Financial Crime Compliance, Regulatory Compliance and stress testing.
Stress test impact risk
The quantity, granularity and timelines of major regulatory stress test programmes give rise to a range of risks including:
• governance, organisation and people risk, due to the concurrent nature of the stress test exercises;
• data risk, arising from the unprecedented volume and granularity of data requested as part of these programmes;
• model risk, due to the significant increase in the number of models used by the Group, the speed with which they have been introduced and the extended use of models in new areas;
• regulatory and consent order risk, which may arise should regulators identify deficiencies in our stress test results and processes;
• capital planning risk, should regulators’ assessment of stress test results lead to them objecting to planned capital actions, including the payment of dividends;
• execution risk, due to the number and complexity of stress tests under way at the same time;
• disclosure risk, as the publication of stress test results by regulators may have an unexpected effect on a bank’s business and/or reputation; and
T
T
H S B C H O L D I N G S P L C
Interim Management Report (continued) Risk > Top and emerging risks / Areas of special interest
106
• counterparty and market disruption risk, which could arise should a number of banks fail the stress test exercises.
Potential impact on HSBC
• Banks will be assessed against qualitative as well as quantitative standards and may be judged to fall short against either. If such an event were to arise for HSBC or one of its regulated entities, regulators have a number of options to remedy or mitigate the perceived failing.
• HNAH is required to re-submit its capital plan and make improvements to its stress testing processes following the FRB’s objection to its capital plan on qualitative grounds (see page 108).
Mitigating actions
• We created a Stress Testing Management Board with appropriate subordinate Steering Committees in early 2014, chaired by the Group Finance Director, to ensure appropriate senior management oversight and governance of the stress test programmes. Updates are provided at each meeting of the Risk Management Meeting of the GMB and the Group Risk Committee.
Social media risk
The rapid growth of social media increases the risk that speculation about HSBC or customer complaints, either specific to HSBC or more generally in relation to a particular product, may be spread through the use of these channels.
Potential impact on HSBC
• This could have an adverse effect on our reputation and brand and potentially our share price.
Mitigating actions
• We monitor social media activity globally, using a dedicated software platform. This enables us to identify, manage and respond to issues where required.
Internet crime and fraud
With the ever-growing acceptance of, and demand for, internet and mobile services by customers, HSBC is increasingly exposed to fraudulent and criminal activities via these channels. We also face the risk of breakdowns in processes or procedures
and systems failure or unavailability, and our business is subject to disruption from events that are wholly or partially beyond our control, such as internet crime and acts of terrorism.
Potential impact on HSBC
• Internet crime and fraud could result in financial loss and/or customer data and sensitive information being compromised. They may also give rise to losses in service to customers. The same threats apply equally when we rely on external suppliers or vendors to provide services to us and our customers.
Mitigating actions
• We continually assess these threats as they evolve and adapt our controls to mitigate them.
• We have increased our defences through enhanced monitoring and have implemented additional controls, such as two-factor authentication, to reduce the possibility of losses from fraud.
Information security risk
The security of our information and technology infrastructure is crucial for maintaining our banking applications and processes while protecting our customers and the HSBC reputation and brand. HSBC and other multinational organisations continue to be the targets of cyber-attacks, which may disrupt services including the availability of our external facing websites, compromise organisational and customer information or expose security weaknesses.
Potential impact on HSBC
• Information security risk gives rise to potential financial loss and reputational damage which could adversely affect customer and investor confidence. Loss of customer data would also result in regulatory breaches which could result in fines and penalties being incurred.
Mitigating actions
• We have invested significantly in addressing this risk through increased training to raise staff awareness of the requirements, enhanced multi-layered controls protecting our information and technical infrastructure, and heightened monitoring and management of potential cyber-attacks.
T
T
T
T
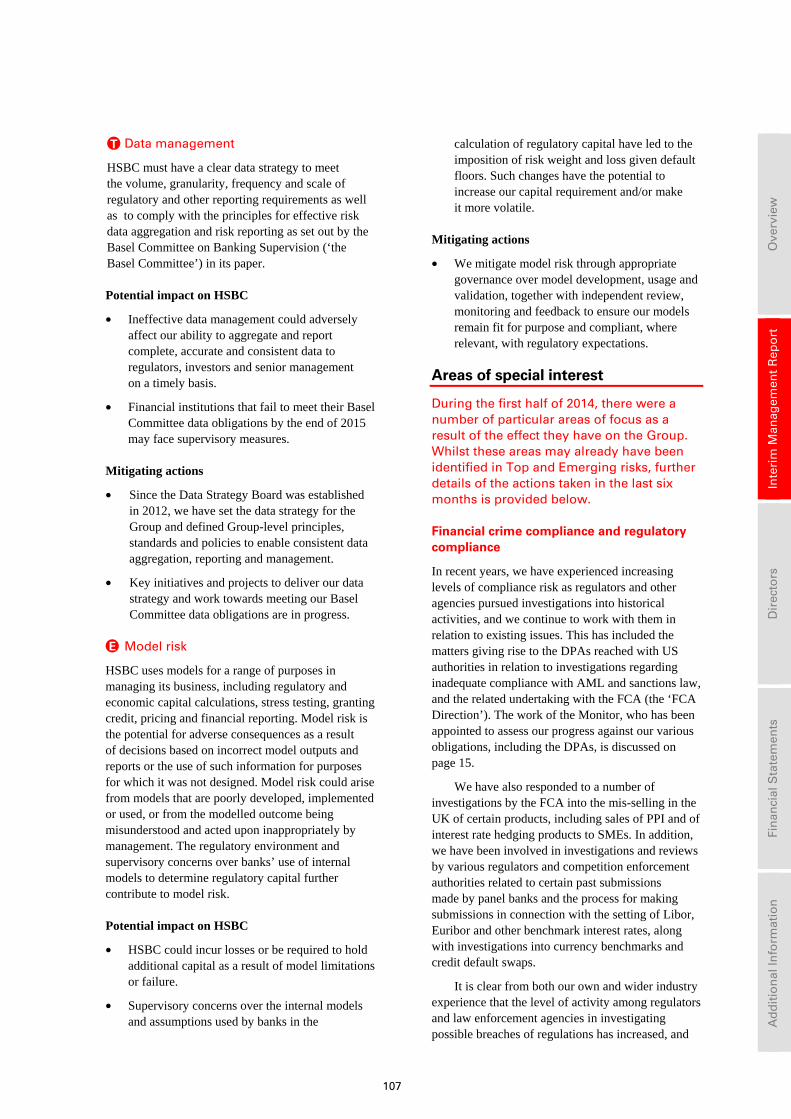
107
Ove
rvie
w
In
teri
m M
anag
emen
t R
epo
rt
D
irec
tors
Fin
anci
al S
tate
men
ts
A
dd
itio
nal
Info
rmat
ion
Data management
HSBC must have a clear data strategy to meet the volume, granularity, frequency and scale of regulatory and other reporting requirements as well as to comply with the principles for effective risk data aggregation and risk reporting as set out by the Basel Committee on Banking Supervision (‘the Basel Committee’) in its paper.
Potential impact on HSBC
• Ineffective data management could adversely affect our ability to aggregate and report complete, accurate and consistent data to regulators, investors and senior management on a timely basis.
• Financial institutions that fail to meet their Basel Committee data obligations by the end of 2015 may face supervisory measures.
Mitigating actions
• Since the Data Strategy Board was established in 2012, we have set the data strategy for the Group and defined Group-level principles, standards and policies to enable consistent data aggregation, reporting and management.
• Key initiatives and projects to deliver our data strategy and work towards meeting our Basel Committee data obligations are in progress.
Model risk
HSBC uses models for a range of purposes in managing its business, including regulatory and economic capital calculations, stress testing, granting credit, pricing and financial reporting. Model risk is the potential for adverse consequences as a result of decisions based on incorrect model outputs and reports or the use of such information for purposes for which it was not designed. Model risk could arise from models that are poorly developed, implemented or used, or from the modelled outcome being misunderstood and acted upon inappropriately by management. The regulatory environment and supervisory concerns over banks’ use of internal models to determine regulatory capital further contribute to model risk.
Potential impact on HSBC
• HSBC could incur losses or be required to hold additional capital as a result of model limitations or failure.
• Supervisory concerns over the internal models and assumptions used by banks in the
calculation of regulatory capital have led to the imposition of risk weight and loss given default floors. Such changes have the potential to increase our capital requirement and/or make it more volatile.
Mitigating actions
• We mitigate model risk through appropriate governance over model development, usage and validation, together with independent review, monitoring and feedback to ensure our models remain fit for purpose and compliant, where relevant, with regulatory expectations.
Areas of special interest
During the first half of 2014, there were a number of particular areas of focus as a result of the effect they have on the Group. Whilst these areas may already have been identified in Top and Emerging risks, further details of the actions taken in the last six months is provided below.
Financial crime compliance and regulatory compliance
In recent years, we have experienced increasing levels of compliance risk as regulators and other agencies pursued investigations into historical activities, and we continue to work with them in relation to existing issues. This has included the matters giving rise to the DPAs reached with US authorities in relation to investigations regarding inadequate compliance with AML and sanctions law, and the related undertaking with the FCA (the ‘FCA Direction’). The work of the Monitor, who has been appointed to assess our progress against our various obligations, including the DPAs, is discussed on page 15.
We have also responded to a number of investigations by the FCA into the mis-selling in the UK of certain products, including sales of PPI and of interest rate hedging products to SMEs. In addition, we have been involved in investigations and reviews by various regulators and competition enforcement authorities related to certain past submissions made by panel banks and the process for making submissions in connection with the setting of Libor, Euribor and other benchmark interest rates, along with investigations into currency benchmarks and credit default swaps.
It is clear from both our own and wider industry experience that the level of activity among regulators and law enforcement agencies in investigating possible breaches of regulations has increased, and
T
E
H S B C H O L D I N G S P L C
Interim Management Report (continued) Risk > Areas of special interest / Credit risk
108
that the direct and indirect costs of such breaches can be significant. Coupled with a substantial rise in the volume of new regulation, much of which has some element of extra-territorial reach, and the geographical spread of our businesses, we believe that the level of inherent compliance risk that we face as a Group will continue to remain high for the foreseeable future.
Further information about our compliance risk management and the changes being made may be found on page 166.
Regulatory stress tests
We are subject to regulatory stress testing in many jurisdictions, which have increased both in frequency and in the granularity of information required by supervisors. These exercises are designed to assess the resilience of banks to adverse market developments and ensure that they have robust, forward-looking capital planning processes that account for their unique risks and include among others, the programmes of the FRB, the European Banking Authority (‘EBA’), the ECB, the PRA, and the HKMA.
HNAH participated in the Comprehensive Capital Analysis and Review (‘CCAR’) and Dodd-Frank Stress Testing (‘DFAST’) programmes of the FRB and HSBC Bank USA in the OCC’s DFAST programme. HNAH and HSBC Bank USA made submissions under these programmes on 6 January 2014. On 26 March 2014, the FRB informed HNAH that it objected to HNAH’s capital plan on qualitative grounds and a resubmission of its capital plan is required by 5 January 2015 together with improvements to its stress testing processes. However, the FRB approved the capital actions included in HNAH’s CCAR submission and HNAH may proceed with the payment of dividends on the outstanding preferred shares and trust preferred securities of HNAH and its subsidiaries. HNAH also made its mid-cycle DFAST submission in July 2014.
The Group is taking part in the PRA concurrent stress test programme involving all major UK banks. This exercise comprised the EBA base scenario and a stress scenario reflecting the vulnerabilities facing the UK banking system, including significant declines in the value of sterling, residential and commercial property prices and bond and equity
prices, along with a downturn in economic activity and rising unemployment. We made our submission to the PRA at the end of June 2014. The Group also participates in the complementary programme of regular data provision to the Bank of England under its Firm Data Submission Framework.
In addition, we are taking part in the stress test exercise run by the EBA. The base scenario covers a wide range of risks including credit, market, securitisation, sovereign and funding risks. The adverse macro-economic scenario includes country-specific shocks to sovereign bond spreads, short-term interest rates and residential property prices together with a decline in world trade, currency depreciation in Central and Eastern Europe and slow-downs or contractions in GDP growth around the world.
HSBC France and HSBC Malta are participating in the AQR, run as part of the ECB’s comprehensive assessment prior to inception of the Single Supervisory Mechanism. The AQR involved the submission of loan tapes and a detailed file review. HSBC France and HSBC Malta are now subject to the ECB’s stress testing process, which is currently under way using the EBA scenarios.
The Hongkong and Shanghai Banking Corporation participated in the HKMA stress test exercise in the first half of 2014. The HKMA stress scenario envisaged a significant deceleration of growth in mainland China and a sharper contraction in Hong Kong.
Disclosures by regulators of their evaluation of these exercises are expected to be announced later in the year and we expect to be assessed on both a quantitative and qualitative basis, the latter focusing on our portfolio quality, data provision, stress testing capability and internal management processes.
Stress testing is an increasingly important tool for regulators to assess vulnerabilities in the banking sector and in individual banks, the results of which could have a significant effect on minimum capital requirements, risk and capital management practices and planned capital actions including the payment of dividends going forward.
A summary of our stress testing and scenario analysis programme is provided on page 139 of the Annual Report and Accounts 2013.
109
Ove
rvie
w
In
teri
m M
anag
emen
t R
epo
rt
D
irec
tors
Fin
anci
al S
tate
men
ts
A
dd
itio
nal
Info
rmat
ion
Credit risk
Credit risk in the first half of 2014 ................................... 110 Loans and advances excluding held for sale: total exposure, impairment allowances and charges ................ 110
Credit exposure .................................................................. 111 Maximum exposure to credit risk ........................................ 111 Maximum exposure to credit risk .......................................... 112
Total personal lending ....................................................... 113Mortgage lending ................................................................. 113 Other personal lending ......................................................... 113 Total personal lending ........................................................... 113Non-US mortgage lending ................................................... 114 Mortgage lending products ................................................... 115Mortgage lending in the US ................................................. 116 HSBC Finance US CML – residential mortgages ................. 116 HSBC Finance: foreclosed properties in the US .................. 117 Trends in two months and over contractual delinquency
in the US ............................................................................ 117
Wholesale lending .............................................................. 118 Total wholesale lending ......................................................... 118Corporate and commercial ................................................... 120
Credit quality of financial instruments ............................ 120 Distribution of financial instruments by credit quality ......... 121Past due but not impaired gross financial instruments ........ 124 Past due but not impaired loans and advances to
customers and banks by geographical region .................. 124
Ageing analysis of days past due but not impaired gross
financial instruments ......................................................... 125Renegotiated loans and forbearance .................................... 126 Renegotiated loans and advances to customers .................... 126
Renegotiated loans and advances to customers by
geographical region .......................................................... 127HSBC Finance loan modifications and re-ageing .................. 128 Gross loan portfolio of HSBC Finance real estate
secured balances ............................................................... 129
Movement in HSBC Finance renegotiated real estate
balances ............................................................................. 129
Number of renegotiated real estate secured accounts
remaining in HSBC Finance’s portfolio ........................... 129
Impaired loans .................................................................... 129 Impaired loans and advances to customers and banks by industry sector ................................................................... 130
Impairment of loans and advances ....................................... 130 Impairment allowances on loans and advances to customers by geographical region .................................... 131
Net loan impairment charge to the income statement by geographical region .......................................................... 132
LICs by geographical region ................................................. 132 LICs by industry ..................................................................... 132Loan impairment in the first half of 2014 ............................ 133 Movement in impairment allowances on loans and
advances to customers and banks ..................................... 134
Charge for impairment losses as a percentage of average gross loans and advances to customers by geographical region ................................................................................. 135
Reconciliation of reported and constant currency changes
by geographical region ..................................................... 135
Concentration of exposure ................................................ 136Financial investments ........................................................... 136 Trading assets ....................................................................... 136 Trading assets ........................................................................ 136Derivatives ........................................................................... 136Loans and advances ............................................................. 136 Gross loans and advances by industry sector ....................... 137
Gross loans and advances to customers by industry sector
and by geographical region .............................................. 138 Loans and advances to banks by geographical region ......... 139 Reverse repos – non-trading by geographical region ........... 139 Gross loans and advances to customers by country ............. 140
Securitisation exposures and other structured products .......................................................................... 143 Overall exposure of HSBC .................................................... 143
Movement in the available-for-sale reserve .......................... 143 Carrying amount of HSBC’s consolidated holdings of ABSs,
and direct lending held at fair value through profit or loss 144Representations and warranties related to
mortgage sales and securitisation activities ..................... 147
H S B C H O L D I N G S P L C
Interim Management Report (continued) Risk > Credit risk > In 1H14 / Credit exposure
110
Credit risk is the risk of financial loss if a customer or counterparty fails to meet an obligation under a contract. It arises principally from direct lending, trade finance and leasing business, but also from certain other products such as guarantees and credit derivatives and from holding assets in the form of debt securities.
There have been no material changes to our policies and practices for the management of credit risk as described in the Annual Report and Accounts 2013. Following the change in balance sheet presentation explained on page 41, non-trading reverse repos are shown separately on the face of the balance sheet and are no longer included in ‘Loans and advances to customers’ and ‘Loans and advances to banks’. Comparative data have been re-presented accordingly. As a result, any analysis that references loans and advances to customers or banks excludes non-trading reverse repos to customers or banks, respectively. The amount of the non-trading reverse repos to customers and banks is set out on page 121.
A summary of our current policies and practices regarding credit risk is provided in the Appendix to Risk on page 266 of the Annual Report and Accounts 2013.
Credit risk in the first half of 2014
Total exposure to credit risk increased in the first half of 2014 with gross loans and advances of US$1,189bn recorded at 30 June 2014, compared with US$1,127bn at 31 December 2013.
During the first half of 2014, there was an overall increase in loans and advances of US$61bn which was accompanied by an overall decrease in impairment allowances of US$1.2bn, principally reflecting run-off of the CML portfolios within North America.
The following commentary is on a constant currency basis.
Total personal lending of US$416bn at 30 June 2014, was broadly unchanged from 31 December 2013. Decreases in lending balances in North America due to the continued run-off of the CML portfolio were partly offset by increases in residential mortgage balances in Asia and Latin America.
Total wholesale lending increased to US$773bn at 30 June 2014 from US$725bn at the end of 2013, due to increases in Asia and Europe. In Asia, lending grew across a number of sectors reflecting continued buoyancy in credit market activity. In Europe, the increases were principally driven by a rise in
Loans and advances excluding held for sale: total exposure, impairment allowances and charges
30 Jun 2014
30 Jun 2013
31 Dec 2013
US$bn US$bn US$bn At end of period: Gross loans and advances
– personal lending (A) .. 415.8 394.5 410.7 – wholesale lending (B) 772.9 687.2 716.6
Total (C)1 ........................... 1,188.7 1,081.7 1,127.3
Impairment allowances – personal lending (a) ... 5.9 7.4 6.6 – wholesale lending (b) 8.1 8.2 8.6
Total (c)1 ............................ 14.0 15.6 15.2
(a) as a percentage of (A)1 .. 1.42 1.88 1.61 (b) as a percentage of (B)1 .. 1.05 1.19 1.20 (c) as a percentage of (C)1 .. 1.18 1.44 1.35
Loans and advances net of impairment allowances1 1,174.7
1,066.1 1,112.1
For half-year ended: Impairment charges
– personal lending ........ 1.2 1.8 1.4 – wholesale lending ...... 0.8 1.4 1.4
Total ................................... 2.0 3.2 2.8
For footnote, see page 172.
corporate overdraft balances, mainly in GB&M, in accounts which are structured to allow customer corporate treasury functions to benefit from net interest arrangements but where net settlement is not intended to occur, together with a corresponding rise in current accounts.
Impairment allowances fell from US$15.4bn at the end of 2013 to US$14bn at 30 June 2014. In personal lending, impairment allowances decreased by US$0.8bn, principally due to the run-off of the CML portfolio within North America. In wholesale lending, impairment allowances decreased by US$0.6bn, mainly in Europe, due to amounts written off and a reduction in new impairment allowances reflecting an improved economic environment.
Loan impairment charges in the first half of 2014 decreased to US$2.0bn from US$3.1bn in the first half of 2013. In personal lending, loan impairment charges decreased by US$0.5bn, mainly in North America and Latin America.
In wholesale lending, loan impairment charges reduced by US$0.6bn, mainly driven by lower individually assessed impairment charges. However, during the first half of 2014, in North America, we revised certain estimates used in our corporate loan collective impairment calculation to better reflect inherent losses in a growing loan portfolio. This resulted in an increase to our allowance for credit losses of approximately US$93m for these loans.
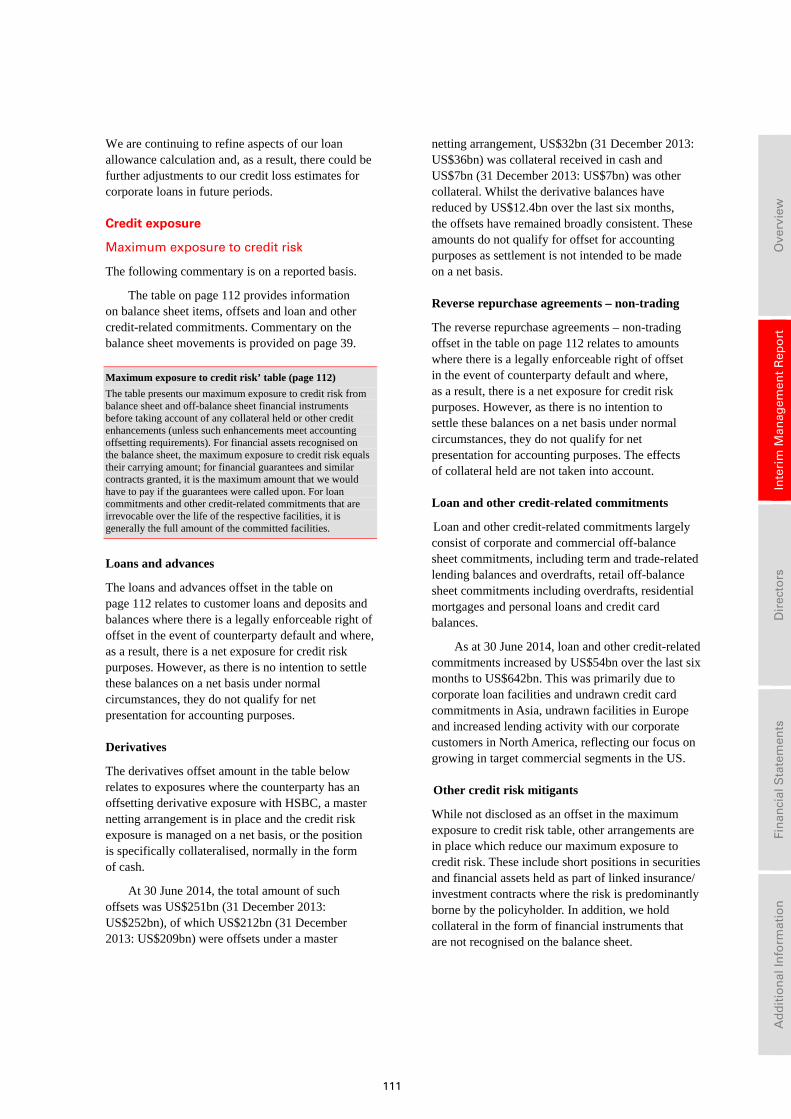
111
Ove
rvie
w
In
teri
m M
anag
emen
t R
epo
rt
D
irec
tors
Fin
anci
al S
tate
men
ts
A
dd
itio
nal
Info
rmat
ion
We are continuing to refine aspects of our loan allowance calculation and, as a result, there could be further adjustments to our credit loss estimates for corporate loans in future periods.
Credit exposure
Maximum exposure to credit risk
The following commentary is on a reported basis.
The table on page 112 provides information on balance sheet items, offsets and loan and other credit-related commitments. Commentary on the balance sheet movements is provided on page 39.
Maximum exposure to credit risk’ table (page 112)
The table presents our maximum exposure to credit risk from balance sheet and off-balance sheet financial instruments before taking account of any collateral held or other credit enhancements (unless such enhancements meet accounting offsetting requirements). For financial assets recognised on the balance sheet, the maximum exposure to credit risk equals their carrying amount; for financial guarantees and similar contracts granted, it is the maximum amount that we would have to pay if the guarantees were called upon. For loan commitments and other credit-related commitments that are irrevocable over the life of the respective facilities, it is generally the full amount of the committed facilities.
Loans and advances
The loans and advances offset in the table on page 112 relates to customer loans and deposits and balances where there is a legally enforceable right of offset in the event of counterparty default and where, as a result, there is a net exposure for credit risk purposes. However, as there is no intention to settle these balances on a net basis under normal circumstances, they do not qualify for net presentation for accounting purposes.
Derivatives
The derivatives offset amount in the table below relates to exposures where the counterparty has an offsetting derivative exposure with HSBC, a master netting arrangement is in place and the credit risk exposure is managed on a net basis, or the position is specifically collateralised, normally in the form of cash.
At 30 June 2014, the total amount of such offsets was US$251bn (31 December 2013: US$252bn), of which US$212bn (31 December 2013: US$209bn) were offsets under a master
netting arrangement, US$32bn (31 December 2013: US$36bn) was collateral received in cash and US$7bn (31 December 2013: US$7bn) was other collateral. Whilst the derivative balances have reduced by US$12.4bn over the last six months, the offsets have remained broadly consistent. These amounts do not qualify for offset for accounting purposes as settlement is not intended to be made on a net basis.
Reverse repurchase agreements – non-trading
The reverse repurchase agreements – non-trading offset in the table on page 112 relates to amounts where there is a legally enforceable right of offset in the event of counterparty default and where, as a result, there is a net exposure for credit risk purposes. However, as there is no intention to settle these balances on a net basis under normal circumstances, they do not qualify for net presentation for accounting purposes. The effects of collateral held are not taken into account.
Loan and other credit-related commitments
Loan and other credit-related commitments largely consist of corporate and commercial off-balance sheet commitments, including term and trade-related lending balances and overdrafts, retail off-balance sheet commitments including overdrafts, residential mortgages and personal loans and credit card balances.
As at 30 June 2014, loan and other credit-related commitments increased by US$54bn over the last six months to US$642bn. This was primarily due to corporate loan facilities and undrawn credit card commitments in Asia, undrawn facilities in Europe and increased lending activity with our corporate customers in North America, reflecting our focus on growing in target commercial segments in the US.
Other credit risk mitigants
While not disclosed as an offset in the maximum exposure to credit risk table, other arrangements are in place which reduce our maximum exposure to credit risk. These include short positions in securities and financial assets held as part of linked insurance/ investment contracts where the risk is predominantly borne by the policyholder. In addition, we hold collateral in the form of financial instruments that are not recognised on the balance sheet.
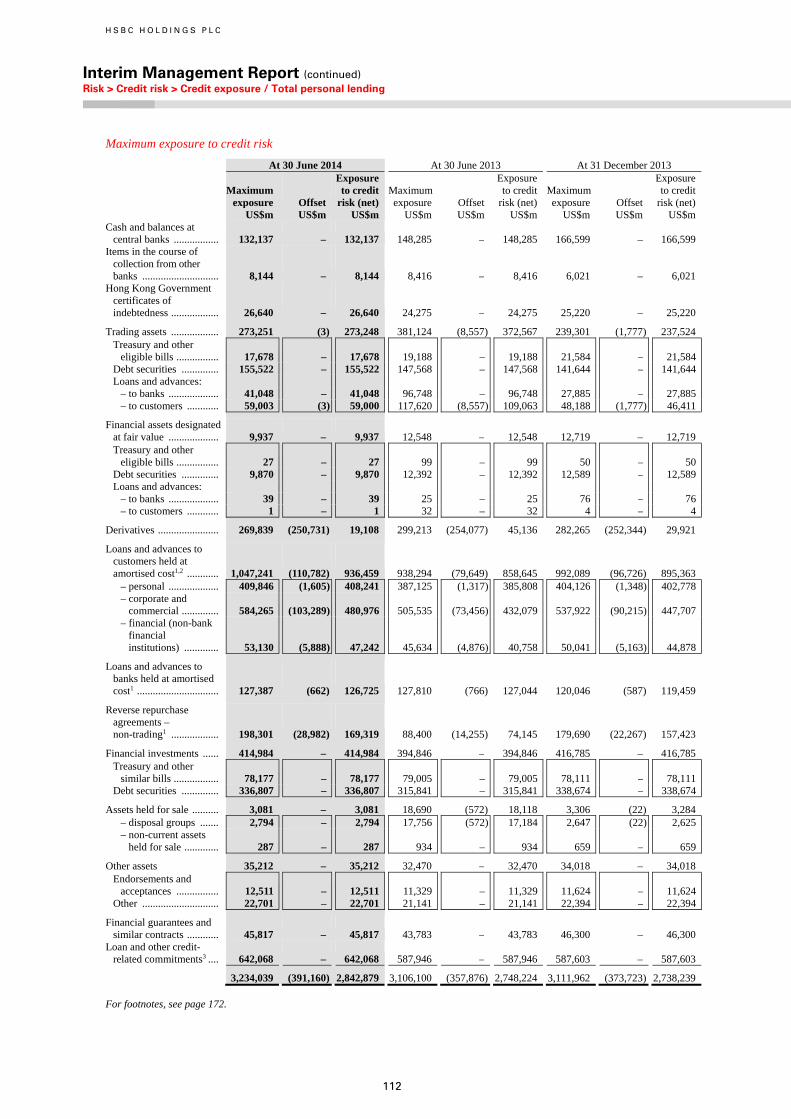
H S B C H O L D I N G S P L C
Interim Management Report (continued) Risk > Credit risk > Credit exposure / Total personal lending
112
Maximum exposure to credit risk
At 30 June 2014 At 30 June 2013 At 31 December 2013
Maximum exposure Offset
Exposure to credit risk (net)
Maximumexposure Offset
Exposure to credit risk (net)
Maximum exposure Offset
Exposure to credit risk (net)
US$m US$m US$m US$m US$m US$m US$m US$m US$mCash and balances at
central banks ................. 132,137 – 132,137 148,285 – 148,285 166,599 – 166,599Items in the course of
collection from other banks ............................. 8,144 – 8,144 8,416 – 8,416 6,021 – 6,021
Hong Kong Government certificates of indebtedness .................. 26,640 – 26,640 24,275 – 24,275 25,220 – 25,220
Trading assets .................. 273,251 (3) 273,248 381,124 (8,557) 372,567 239,301 (1,777) 237,524Treasury and other
eligible bills ................ 17,678 – 17,678 19,188 – 19,188 21,584 – 21,584Debt securities .............. 155,522 – 155,522 147,568 – 147,568 141,644 – 141,644Loans and advances:
– to banks ................... 41,048 – 41,048 96,748 – 96,748 27,885 – 27,885– to customers ............ 59,003 (3) 59,000 117,620 (8,557) 109,063 48,188 (1,777) 46,411
Financial assets designated at fair value ................... 9,937 – 9,937 12,548 – 12,548 12,719 – 12,719Treasury and other
eligible bills ................ 27 – 27 99 – 99 50 – 50Debt securities .............. 9,870 – 9,870 12,392 – 12,392 12,589 – 12,589Loans and advances:
– to banks ................... 39 – 39 25 – 25 76 – 76– to customers ............ 1 – 1 32 – 32 4 – 4
Derivatives ....................... 269,839 (250,731) 19,108 299,213 (254,077) 45,136 282,265 (252,344) 29,921
Loans and advances to customers held at amortised cost1,2 ............ 1,047,241 (110,782) 936,459 938,294 (79,649) 858,645 992,089 (96,726) 895,363
– personal ................... 409,846 (1,605) 408,241 387,125 (1,317) 385,808 404,126 (1,348) 402,778– corporate and commercial .............. 584,265 (103,289) 480,976 505,535 (73,456) 432,079 537,922 (90,215) 447,707– financial (non-bank financial institutions) ............. 53,130 (5,888) 47,242 45,634 (4,876) 40,758 50,041 (5,163) 44,878
Loans and advances to banks held at amortised cost1 ............................... 127,387 (662) 126,725 127,810 (766) 127,044 120,046 (587) 119,459
Reverse repurchase agreements – non-trading1 .................. 198,301 (28,982) 169,319 88,400 (14,255) 74,145 179,690 (22,267) 157,423
Financial investments ...... 414,984 – 414,984 394,846 – 394,846 416,785 – 416,785Treasury and other
similar bills ................. 78,177 – 78,177 79,005 – 79,005 78,111 – 78,111Debt securities .............. 336,807 – 336,807 315,841 – 315,841 338,674 – 338,674
Assets held for sale .......... 3,081 – 3,081 18,690 (572) 18,118 3,306 (22) 3,284– disposal groups ....... 2,794 – 2,794 17,756 (572) 17,184 2,647 (22) 2,625– non-current assets held for sale ............. 287 – 287 934 – 934 659 – 659
Other assets 35,212 – 35,212 32,470 – 32,470 34,018 – 34,018Endorsements and
acceptances ................ 12,511 – 12,511 11,329 – 11,329 11,624 – 11,624Other ............................. 22,701 – 22,701 21,141 – 21,141 22,394 – 22,394
Financial guarantees and similar contracts ............ 45,817 – 45,817 43,783 – 43,783 46,300 – 46,300
Loan and other credit- related commitments3 .... 642,068 – 642,068 587,946 – 587,946 587,603 – 587,603
3,234,039 (391,160) 2,842,879 3,106,100 (357,876) 2,748,224 3,111,962 (373,723) 2,738,239
For footnotes, see page 172.
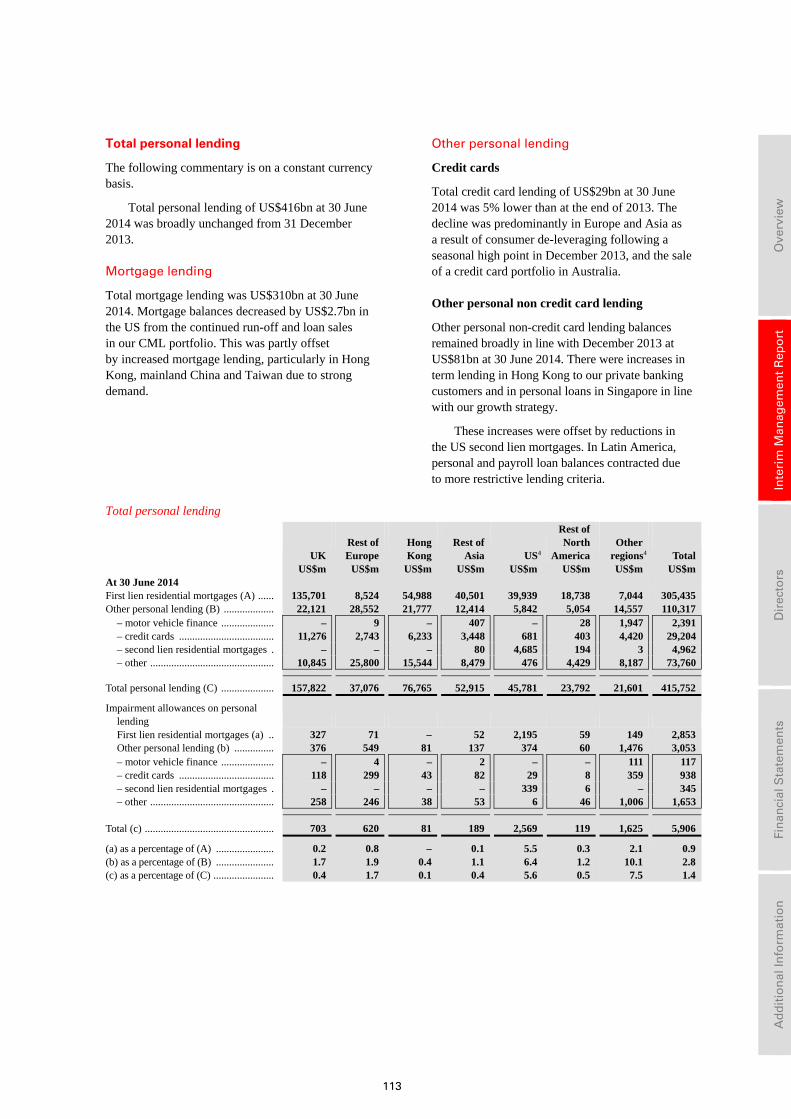
113
Ove
rvie
w
In
teri
m M
anag
emen
t R
epo
rt
D
irec
tors
Fin
anci
al S
tate
men
ts
A
dd
itio
nal
Info
rmat
ion
Total personal lending
The following commentary is on a constant currency basis.
Total personal lending of US$416bn at 30 June 2014 was broadly unchanged from 31 December 2013.
Mortgage lending
Total mortgage lending was US$310bn at 30 June 2014. Mortgage balances decreased by US$2.7bn in the US from the continued run-off and loan sales in our CML portfolio. This was partly offset by increased mortgage lending, particularly in Hong Kong, mainland China and Taiwan due to strong demand.
Other personal lending
Credit cards
Total credit card lending of US$29bn at 30 June 2014 was 5% lower than at the end of 2013. The decline was predominantly in Europe and Asia as a result of consumer de-leveraging following a seasonal high point in December 2013, and the sale of a credit card portfolio in Australia.
Other personal non credit card lending
Other personal non-credit card lending balances remained broadly in line with December 2013 at US$81bn at 30 June 2014. There were increases in term lending in Hong Kong to our private banking customers and in personal loans in Singapore in line with our growth strategy.
These increases were offset by reductions in the US second lien mortgages. In Latin America, personal and payroll loan balances contracted due to more restrictive lending criteria.
Total personal lending
UK Rest of Europe
Hong Kong
Rest of Asia US4
Rest of North America
Other regions4 Total
US$m US$m US$m US$m US$m US$m US$m US$m At 30 June 2014 First lien residential mortgages (A) ...... 135,701 8,524 54,988 40,501 39,939 18,738 7,044 305,435 Other personal lending (B) ................... 22,121 28,552 21,777 12,414 5,842 5,054 14,557 110,317
– motor vehicle finance .................... – 9 – 407 – 28 1,947 2,391– credit cards .................................... 11,276 2,743 6,233 3,448 681 403 4,420 29,204– second lien residential mortgages . – – – 80 4,685 194 3 4,962– other ............................................... 10,845 25,800 15,544 8,479 476 4,429 8,187 73,760
Total personal lending (C) .................... 157,822 37,076 76,765 52,915 45,781 23,792 21,601 415,752
Impairment allowances on personal lending
First lien residential mortgages (a) .. 327 71 – 52 2,195 59 149 2,853 Other personal lending (b) ............... 376 549 81 137 374 60 1,476 3,053 – motor vehicle finance .................... – 4 – 2 – – 111 117– credit cards .................................... 118 299 43 82 29 8 359 938– second lien residential mortgages . – – – – 339 6 – 345– other ............................................... 258 246 38 53 6 46 1,006 1,653
Total (c) ................................................. 703 620 81 189 2,569 119 1,625 5,906
(a) as a percentage of (A) ...................... 0.2 0.8 – 0.1 5.5 0.3 2.1 0.9 (b) as a percentage of (B) ...................... 1.7 1.9 0.4 1.1 6.4 1.2 10.1 2.8 (c) as a percentage of (C) ....................... 0.4 1.7 0.1 0.4 5.6 0.5 7.5 1.4
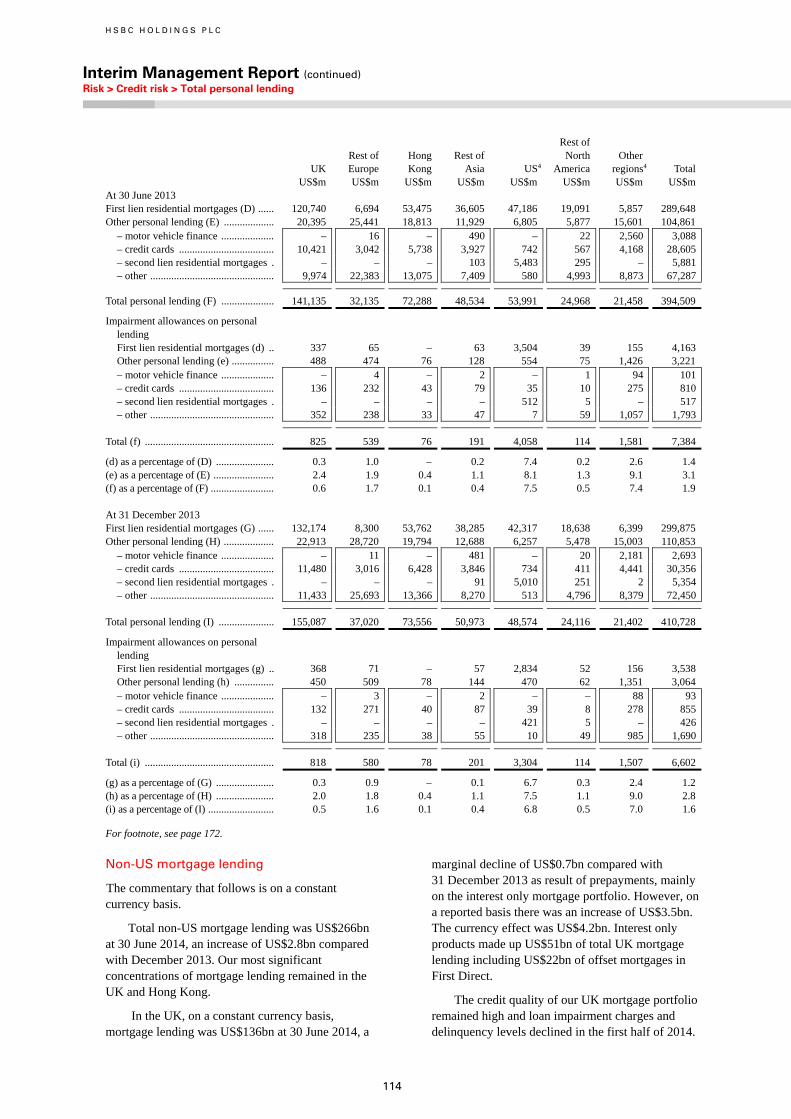
H S B C H O L D I N G S P L C
Interim Management Report (continued) Risk > Credit risk > Total personal lending
114
UK Rest of Europe
Hong Kong
Rest of Asia US4
Rest of North America
Other regions4 Total
US$m US$m US$m US$m US$m US$m US$m US$m At 30 June 2013 First lien residential mortgages (D) ...... 120,740 6,694 53,475 36,605 47,186 19,091 5,857 289,648 Other personal lending (E) ................... 20,395 25,441 18,813 11,929 6,805 5,877 15,601 104,861
– motor vehicle finance .................... – 16 – 490 – 22 2,560 3,088– credit cards .................................... 10,421 3,042 5,738 3,927 742 567 4,168 28,605– second lien residential mortgages . – – – 103 5,483 295 – 5,881– other ............................................... 9,974 22,383 13,075 7,409 580 4,993 8,873 67,287
Total personal lending (F) .................... 141,135 32,135 72,288 48,534 53,991 24,968 21,458 394,509
Impairment allowances on personal lending
First lien residential mortgages (d) .. 337 65 – 63 3,504 39 155 4,163 Other personal lending (e) ................ 488 474 76 128 554 75 1,426 3,221 – motor vehicle finance .................... – 4 – 2 – 1 94 101– credit cards .................................... 136 232 43 79 35 10 275 810– second lien residential mortgages . – – – – 512 5 – 517– other ............................................... 352 238 33 47 7 59 1,057 1,793
Total (f) ................................................. 825 539 76 191 4,058 114 1,581 7,384
(d) as a percentage of (D) ...................... 0.3 1.0 – 0.2 7.4 0.2 2.6 1.4 (e) as a percentage of (E) ....................... 2.4 1.9 0.4 1.1 8.1 1.3 9.1 3.1 (f) as a percentage of (F) ........................ 0.6 1.7 0.1 0.4 7.5 0.5 7.4 1.9 At 31 December 2013 First lien residential mortgages (G) ...... 132,174 8,300 53,762 38,285 42,317 18,638 6,399 299,875 Other personal lending (H) ................... 22,913 28,720 19,794 12,688 6,257 5,478 15,003 110,853
– motor vehicle finance .................... – 11 – 481 – 20 2,181 2,693– credit cards .................................... 11,480 3,016 6,428 3,846 734 411 4,441 30,356– second lien residential mortgages . – – – 91 5,010 251 2 5,354– other ............................................... 11,433 25,693 13,366 8,270 513 4,796 8,379 72,450
Total personal lending (I) ..................... 155,087 37,020 73,556 50,973 48,574 24,116 21,402 410,728
Impairment allowances on personal lending
First lien residential mortgages (g) .. 368 71 – 57 2,834 52 156 3,538 Other personal lending (h) ............... 450 509 78 144 470 62 1,351 3,064 – motor vehicle finance .................... – 3 – 2 – – 88 93– credit cards .................................... 132 271 40 87 39 8 278 855– second lien residential mortgages . – – – – 421 5 – 426– other ............................................... 318 235 38 55 10 49 985 1,690
Total (i) ................................................. 818 580 78 201 3,304 114 1,507 6,602
(g) as a percentage of (G) ...................... 0.3 0.9 – 0.1 6.7 0.3 2.4 1.2 (h) as a percentage of (H) ...................... 2.0 1.8 0.4 1.1 7.5 1.1 9.0 2.8 (i) as a percentage of (I) ......................... 0.5 1.6 0.1 0.4 6.8 0.5 7.0 1.6
For footnote, see page 172.
Non-US mortgage lending
The commentary that follows is on a constant currency basis.
Total non-US mortgage lending was US$266bn at 30 June 2014, an increase of US$2.8bn compared with December 2013. Our most significant concentrations of mortgage lending remained in the UK and Hong Kong.
In the UK, on a constant currency basis, mortgage lending was US$136bn at 30 June 2014, a
marginal decline of US$0.7bn compared with 31 December 2013 as result of prepayments, mainly on the interest only mortgage portfolio. However, on a reported basis there was an increase of US$3.5bn. The currency effect was US$4.2bn. Interest only products made up US$51bn of total UK mortgage lending including US$22bn of offset mortgages in First Direct.
The credit quality of our UK mortgage portfolio remained high and loan impairment charges and delinquency levels declined in the first half of 2014.
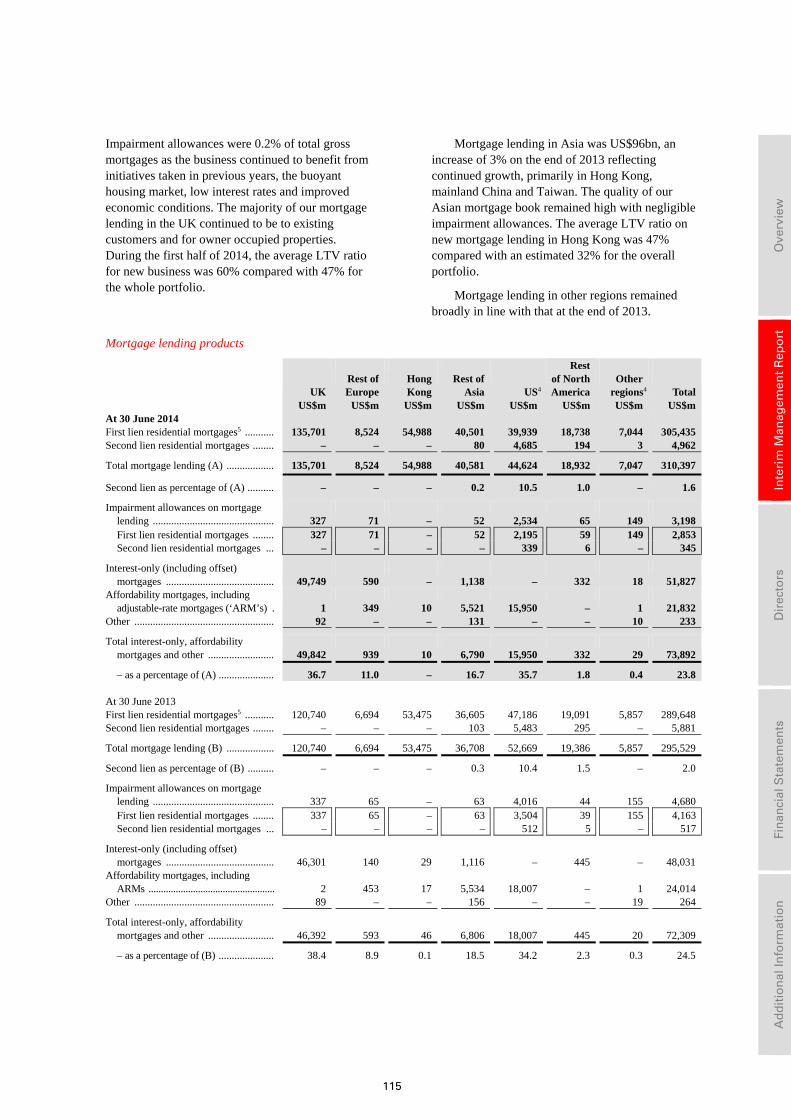
115
Ove
rvie
w
In
teri
m M
anag
emen
t R
epo
rt
D
irec
tors
Fin
anci
al S
tate
men
ts
A
dd
itio
nal
Info
rmat
ion
Impairment allowances were 0.2% of total gross mortgages as the business continued to benefit from initiatives taken in previous years, the buoyant housing market, low interest rates and improved economic conditions. The majority of our mortgage lending in the UK continued to be to existing customers and for owner occupied properties. During the first half of 2014, the average LTV ratio for new business was 60% compared with 47% for the whole portfolio.
Mortgage lending in Asia was US$96bn, an increase of 3% on the end of 2013 reflecting continued growth, primarily in Hong Kong, mainland China and Taiwan. The quality of our Asian mortgage book remained high with negligible impairment allowances. The average LTV ratio on new mortgage lending in Hong Kong was 47% compared with an estimated 32% for the overall portfolio.
Mortgage lending in other regions remained broadly in line with that at the end of 2013.
Mortgage lending products
UK Rest of Europe
Hong Kong
Rest of Asia US4
Rest of North America
Other regions4 Total
US$m US$m US$m US$m US$m US$m US$m US$m At 30 June 2014 First lien residential mortgages5 ........... 135,701 8,524 54,988 40,501 39,939 18,738 7,044 305,435 Second lien residential mortgages ........ – – – 80 4,685 194 3 4,962
Total mortgage lending (A) .................. 135,701 8,524 54,988 40,581 44,624 18,932 7,047 310,397
Second lien as percentage of (A) .......... – – – 0.2 10.5 1.0 – 1.6
Impairment allowances on mortgage lending .............................................. 327 71 – 52 2,534 65 149 3,198 First lien residential mortgages ........ 327 71 – 52 2,195 59 149 2,853Second lien residential mortgages ... – – – – 339 6 – 345
Interest-only (including offset) mortgages ......................................... 49,749 590 – 1,138 – 332 18 51,827
Affordability mortgages, including adjustable-rate mortgages (‘ARM’s) . 1 349 10 5,521 15,950 – 1 21,832
Other ..................................................... 92 – – 131 – – 10 233
Total interest-only, affordability mortgages and other ......................... 49,842 939 10 6,790 15,950 332 29 73,892
– as a percentage of (A) ..................... 36.7 11.0 – 16.7 35.7 1.8 0.4 23.8 At 30 June 2013 First lien residential mortgages5 ........... 120,740 6,694 53,475 36,605 47,186 19,091 5,857 289,648 Second lien residential mortgages ........ – – – 103 5,483 295 – 5,881
Total mortgage lending (B) .................. 120,740 6,694 53,475 36,708 52,669 19,386 5,857 295,529
Second lien as percentage of (B) .......... – – – 0.3 10.4 1.5 – 2.0
Impairment allowances on mortgage lending .............................................. 337 65 – 63 4,016 44 155 4,680 First lien residential mortgages ........ 337 65 – 63 3,504 39 155 4,163Second lien residential mortgages ... – – – – 512 5 – 517
Interest-only (including offset) mortgages ......................................... 46,301 140 29 1,116 – 445 – 48,031
Affordability mortgages, including ARMs ................................................... 2 453 17 5,534 18,007 – 1 24,014
Other ..................................................... 89 – – 156 – – 19 264
Total interest-only, affordability mortgages and other ......................... 46,392 593 46 6,806 18,007 445 20 72,309
– as a percentage of (B) ..................... 38.4 8.9 0.1 18.5 34.2 2.3 0.3 24.5
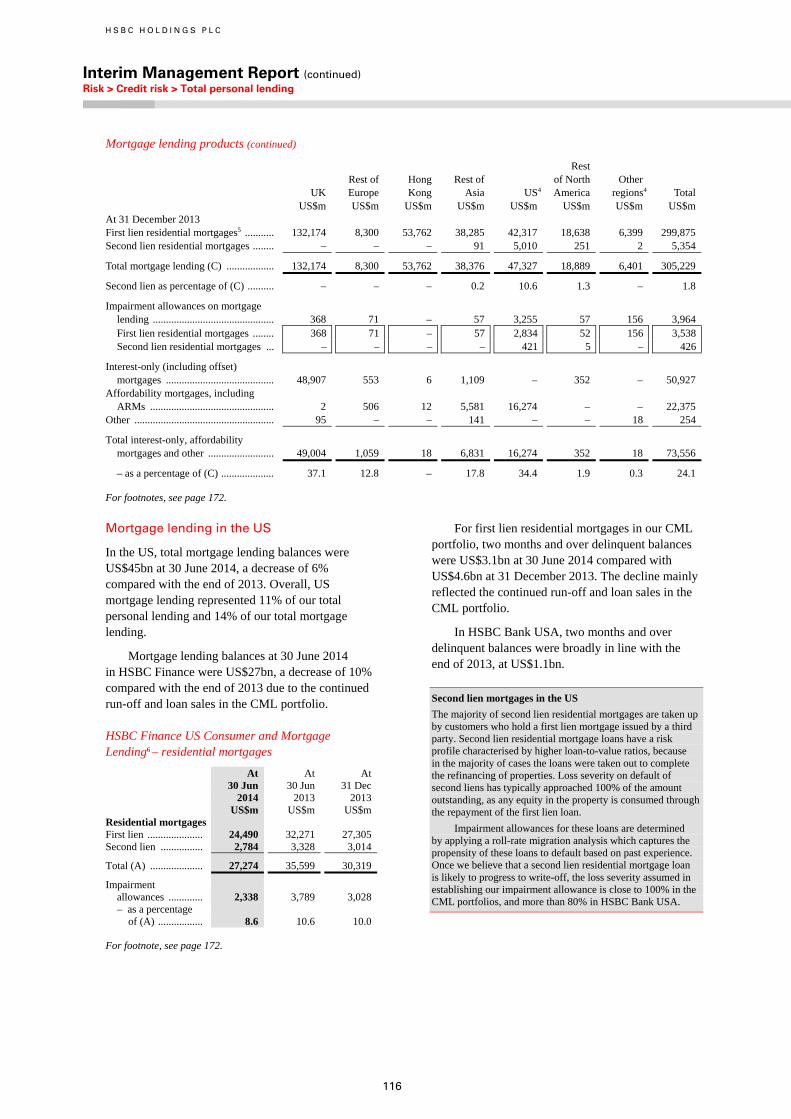
H S B C H O L D I N G S P L C
Interim Management Report (continued) Risk > Credit risk > Total personal lending
116
Mortgage lending products (continued)
UK Rest of Europe
Hong Kong
Rest of Asia US4
Rest of North America
Other regions4 Total
US$m US$m US$m US$m US$m US$m US$m US$m At 31 December 2013 First lien residential mortgages5 ........... 132,174 8,300 53,762 38,285 42,317 18,638 6,399 299,875 Second lien residential mortgages ........ – – – 91 5,010 251 2 5,354
Total mortgage lending (C) .................. 132,174 8,300 53,762 38,376 47,327 18,889 6,401 305,229
Second lien as percentage of (C) .......... – – – 0.2 10.6 1.3 – 1.8
Impairment allowances on mortgage lending .............................................. 368 71 – 57 3,255 57 156 3,964 First lien residential mortgages ........ 368 71 – 57 2,834 52 156 3,538Second lien residential mortgages ... – – – – 421 5 – 426
Interest-only (including offset) mortgages ......................................... 48,907 553 6 1,109 – 352 – 50,927
Affordability mortgages, including ARMs ............................................... 2 506 12 5,581 16,274 – – 22,375
Other ..................................................... 95 – – 141 – – 18 254
Total interest-only, affordability mortgages and other ......................... 49,004 1,059 18 6,831 16,274 352 18 73,556
– as a percentage of (C) .................... 37.1 12.8 – 17.8 34.4 1.9 0.3 24.1
For footnotes, see page 172.
Mortgage lending in the US
In the US, total mortgage lending balances were US$45bn at 30 June 2014, a decrease of 6% compared with the end of 2013. Overall, US mortgage lending represented 11% of our total personal lending and 14% of our total mortgage lending.
Mortgage lending balances at 30 June 2014 in HSBC Finance were US$27bn, a decrease of 10% compared with the end of 2013 due to the continued run-off and loan sales in the CML portfolio.
HSBC Finance US Consumer and Mortgage Lending6 – residential mortgages
At 30 Jun 2014
At 30 Jun 2013
At 31 Dec 2013
US$m US$m US$mResidential mortgages First lien ..................... 24,490 32,271 27,305Second lien ................ 2,784 3,328 3,014
Total (A) .................... 27,274 35,599 30,319
Impairment allowances ............. 2,338 3,789 3,028– as a percentage
of (A) ................. 8.6 10.6 10.0
For footnote, see page 172.
For first lien residential mortgages in our CML portfolio, two months and over delinquent balances were US$3.1bn at 30 June 2014 compared with US$4.6bn at 31 December 2013. The decline mainly reflected the continued run-off and loan sales in the CML portfolio.
In HSBC Bank USA, two months and over delinquent balances were broadly in line with the end of 2013, at US$1.1bn.
Second lien mortgages in the US
The majority of second lien residential mortgages are taken up by customers who hold a first lien mortgage issued by a third party. Second lien residential mortgage loans have a risk profile characterised by higher loan-to-value ratios, because in the majority of cases the loans were taken out to complete the refinancing of properties. Loss severity on default of second liens has typically approached 100% of the amount outstanding, as any equity in the property is consumed through the repayment of the first lien loan.
Impairment allowances for these loans are determined by applying a roll-rate migration analysis which captures the propensity of these loans to default based on past experience. Once we believe that a second lien residential mortgage loan is likely to progress to write-off, the loss severity assumed in establishing our impairment allowance is close to 100% in the CML portfolios, and more than 80% in HSBC Bank USA.
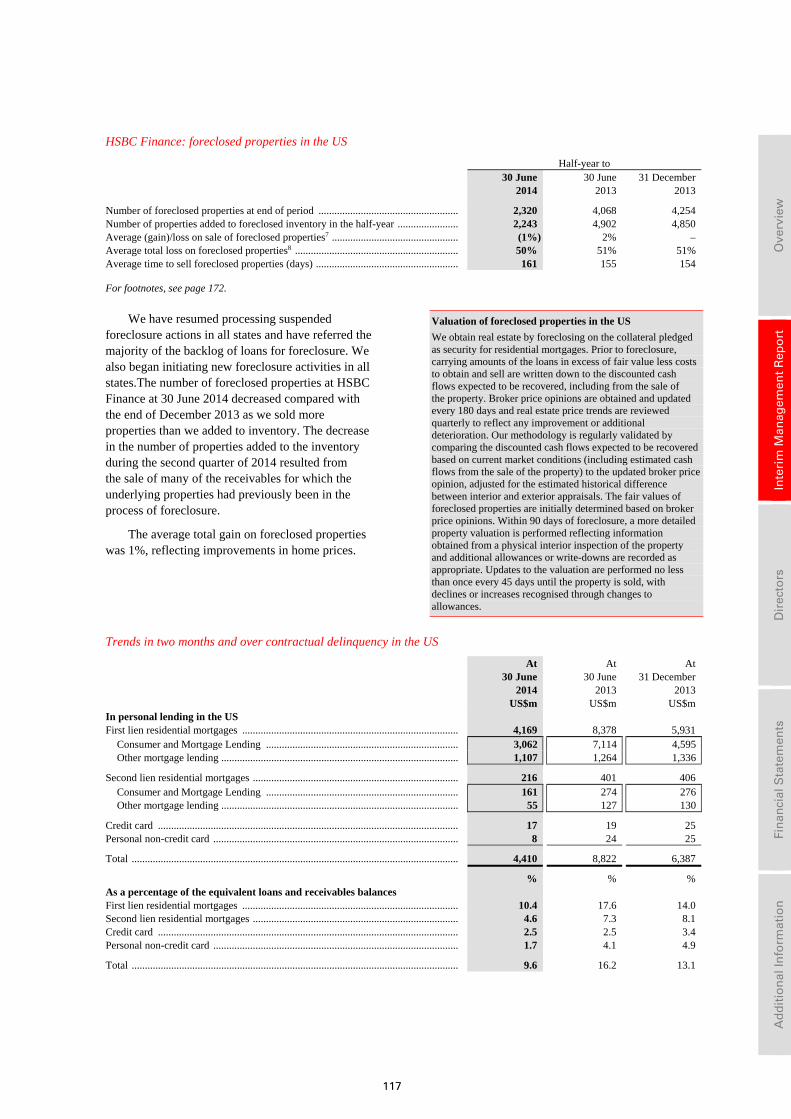
117
Ove
rvie
w
In
teri
m M
anag
emen
t R
epo
rt
D
irec
tors
Fin
anci
al S
tate
men
ts
A
dd
itio
nal
Info
rmat
ion
HSBC Finance: foreclosed properties in the US
Half-year to 30 June 30 June 31 December 2014 2013 2013
Number of foreclosed properties at end of period ..................................................... 2,320 4,068 4,254 Number of properties added to foreclosed inventory in the half-year ....................... 2,243 4,902 4,850 Average (gain)/loss on sale of foreclosed properties7 ................................................ (1%) 2% – Average total loss on foreclosed properties8 .............................................................. 50% 51% 51% Average time to sell foreclosed properties (days) ...................................................... 161 155 154
For footnotes, see page 172.
We have resumed processing suspended foreclosure actions in all states and have referred the majority of the backlog of loans for foreclosure. We also began initiating new foreclosure activities in all states.The number of foreclosed properties at HSBC Finance at 30 June 2014 decreased compared with the end of December 2013 as we sold more properties than we added to inventory. The decrease in the number of properties added to the inventory during the second quarter of 2014 resulted from the sale of many of the receivables for which the underlying properties had previously been in the process of foreclosure.
The average total gain on foreclosed properties was 1%, reflecting improvements in home prices.
Valuation of foreclosed properties in the US
We obtain real estate by foreclosing on the collateral pledged as security for residential mortgages. Prior to foreclosure, carrying amounts of the loans in excess of fair value less costs to obtain and sell are written down to the discounted cash flows expected to be recovered, including from the sale of the property. Broker price opinions are obtained and updated every 180 days and real estate price trends are reviewed quarterly to reflect any improvement or additional deterioration. Our methodology is regularly validated by comparing the discounted cash flows expected to be recovered based on current market conditions (including estimated cash flows from the sale of the property) to the updated broker price opinion, adjusted for the estimated historical difference between interior and exterior appraisals. The fair values of foreclosed properties are initially determined based on broker price opinions. Within 90 days of foreclosure, a more detailed property valuation is performed reflecting information obtained from a physical interior inspection of the property and additional allowances or write-downs are recorded as appropriate. Updates to the valuation are performed no less than once every 45 days until the property is sold, with declines or increases recognised through changes to allowances.
Trends in two months and over contractual delinquency in the US
At 30 June 2014
At 30 June 2013
At 31 December 2013
US$m US$m US$m In personal lending in the US First lien residential mortgages .................................................................................. 4,169 8,378 5,931
Consumer and Mortgage Lending ......................................................................... 3,062 7,114 4,595Other mortgage lending .......................................................................................... 1,107 1,264 1,336
Second lien residential mortgages .............................................................................. 216 401 406 Consumer and Mortgage Lending ......................................................................... 161 274 276Other mortgage lending .......................................................................................... 55 127 130
Credit card .................................................................................................................. 17 19 25 Personal non-credit card ............................................................................................. 8 24 25
Total ............................................................................................................................ 4,410 8,822 6,387
% % % As a percentage of the equivalent loans and receivables balances First lien residential mortgages .................................................................................. 10.4 17.6 14.0 Second lien residential mortgages .............................................................................. 4.6 7.3 8.1 Credit card .................................................................................................................. 2.5 2.5 3.4 Personal non-credit card ............................................................................................. 1.7 4.1 4.9
Total ............................................................................................................................ 9.6 16.2 13.1
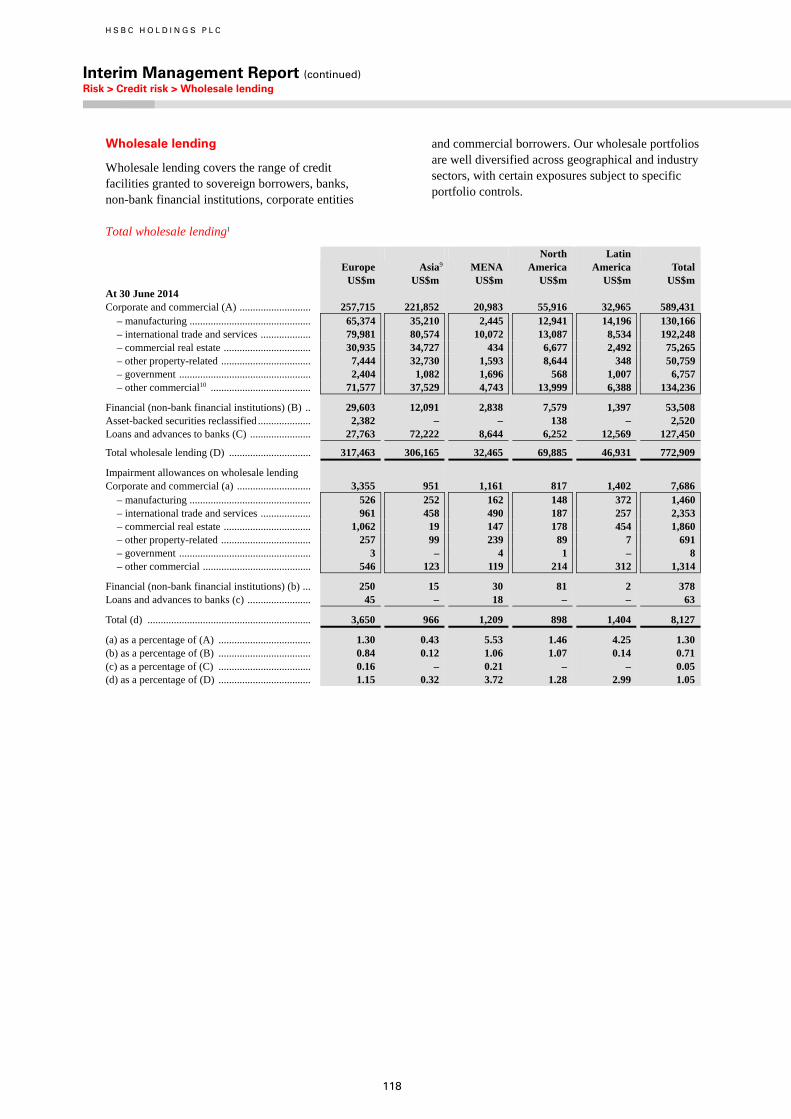
H S B C H O L D I N G S P L C
Interim Management Report (continued) Risk > Credit risk > Wholesale lending
118
Wholesale lending
Wholesale lending covers the range of credit facilities granted to sovereign borrowers, banks, non-bank financial institutions, corporate entities
and commercial borrowers. Our wholesale portfolios are well diversified across geographical and industry sectors, with certain exposures subject to specific portfolio controls.
Total wholesale lending1
Europe Asia9 MENA
North America
Latin America Total
US$m US$m US$m US$m US$m US$m At 30 June 2014 Corporate and commercial (A) ........................... 257,715 221,852 20,983 55,916 32,965 589,431
– manufacturing .............................................. 65,374 35,210 2,445 12,941 14,196 130,166– international trade and services ................... 79,981 80,574 10,072 13,087 8,534 192,248– commercial real estate ................................. 30,935 34,727 434 6,677 2,492 75,265– other property-related .................................. 7,444 32,730 1,593 8,644 348 50,759– government .................................................. 2,404 1,082 1,696 568 1,007 6,757– other commercial10 ...................................... 71,577 37,529 4,743 13,999 6,388 134,236
Financial (non-bank financial institutions) (B) .. 29,603 12,091 2,838 7,579 1,397 53,508 Asset-backed securities reclassified .................... 2,382 – – 138 – 2,520 Loans and advances to banks (C) ....................... 27,763 72,222 8,644 6,252 12,569 127,450
Total wholesale lending (D) ............................... 317,463 306,165 32,465 69,885 46,931 772,909
Impairment allowances on wholesale lending Corporate and commercial (a) ............................ 3,355 951 1,161 817 1,402 7,686
– manufacturing .............................................. 526 252 162 148 372 1,460– international trade and services ................... 961 458 490 187 257 2,353– commercial real estate ................................. 1,062 19 147 178 454 1,860– other property-related .................................. 257 99 239 89 7 691– government .................................................. 3 – 4 1 – 8– other commercial ......................................... 546 123 119 214 312 1,314
Financial (non-bank financial institutions) (b) ... 250 15 30 81 2 378 Loans and advances to banks (c) ........................ 45 – 18 – – 63
Total (d) .............................................................. 3,650 966 1,209 898 1,404 8,127
(a) as a percentage of (A) ................................... 1.30 0.43 5.53 1.46 4.25 1.30 (b) as a percentage of (B) ................................... 0.84 0.12 1.06 1.07 0.14 0.71 (c) as a percentage of (C) ................................... 0.16 – 0.21 – – 0.05 (d) as a percentage of (D) ................................... 1.15 0.32 3.72 1.28 2.99 1.05
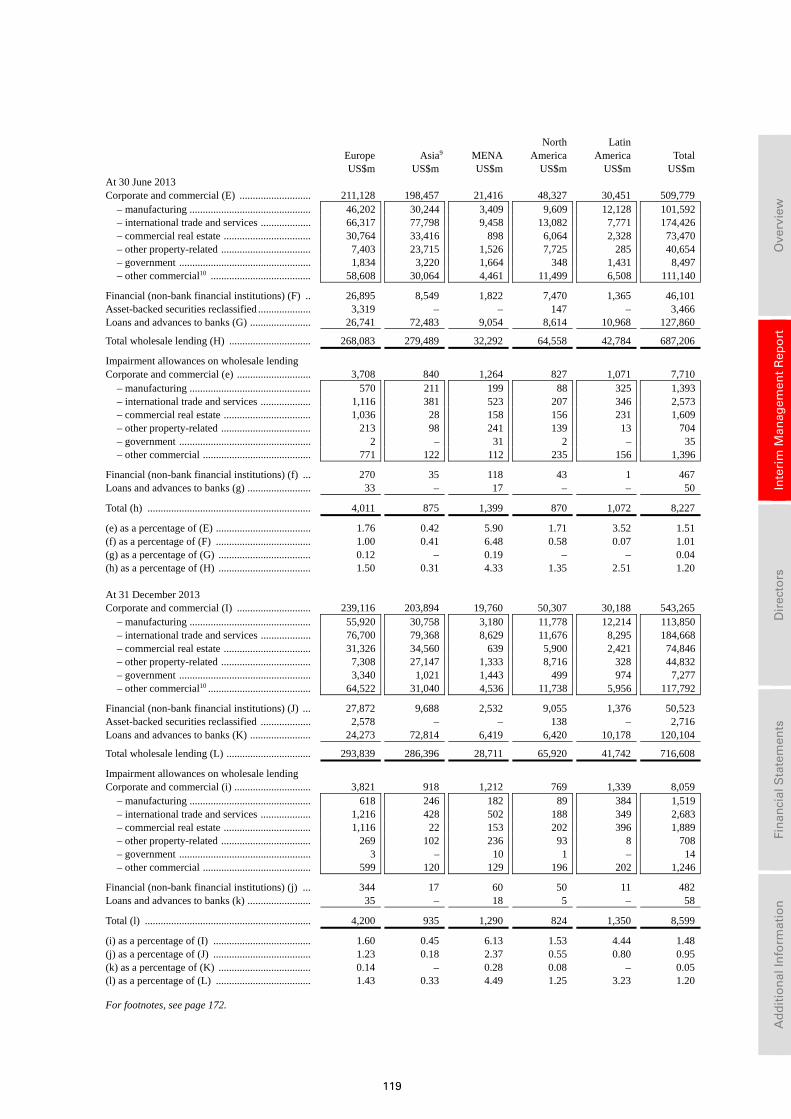
119
Ove
rvie
w
In
teri
m M
anag
emen
t R
epo
rt
D
irec
tors
Fin
anci
al S
tate
men
ts
A
dd
itio
nal
Info
rmat
ion
Europe Asia9 MENA
North America
Latin America Total
US$m US$m US$m US$m US$m US$m At 30 June 2013 Corporate and commercial (E) ........................... 211,128 198,457 21,416 48,327 30,451 509,779
– manufacturing .............................................. 46,202 30,244 3,409 9,609 12,128 101,592– international trade and services ................... 66,317 77,798 9,458 13,082 7,771 174,426– commercial real estate ................................. 30,764 33,416 898 6,064 2,328 73,470– other property-related .................................. 7,403 23,715 1,526 7,725 285 40,654– government .................................................. 1,834 3,220 1,664 348 1,431 8,497– other commercial10 ...................................... 58,608 30,064 4,461 11,499 6,508 111,140
Financial (non-bank financial institutions) (F) .. 26,895 8,549 1,822 7,470 1,365 46,101 Asset-backed securities reclassified .................... 3,319 – – 147 – 3,466 Loans and advances to banks (G) ....................... 26,741 72,483 9,054 8,614 10,968 127,860
Total wholesale lending (H) ............................... 268,083 279,489 32,292 64,558 42,784 687,206
Impairment allowances on wholesale lending Corporate and commercial (e) ............................ 3,708 840 1,264 827 1,071 7,710
– manufacturing .............................................. 570 211 199 88 325 1,393– international trade and services ................... 1,116 381 523 207 346 2,573– commercial real estate ................................. 1,036 28 158 156 231 1,609– other property-related .................................. 213 98 241 139 13 704– government .................................................. 2 – 31 2 – 35– other commercial ......................................... 771 122 112 235 156 1,396
Financial (non-bank financial institutions) (f) ... 270 35 118 43 1 467 Loans and advances to banks (g) ........................ 33 – 17 – – 50
Total (h) .............................................................. 4,011 875 1,399 870 1,072 8,227
(e) as a percentage of (E) .................................... 1.76 0.42 5.90 1.71 3.52 1.51 (f) as a percentage of (F) .................................... 1.00 0.41 6.48 0.58 0.07 1.01 (g) as a percentage of (G) ................................... 0.12 – 0.19 – – 0.04 (h) as a percentage of (H) ................................... 1.50 0.31 4.33 1.35 2.51 1.20 At 31 December 2013 Corporate and commercial (I) ............................ 239,116 203,894 19,760 50,307 30,188 543,265
– manufacturing .............................................. 55,920 30,758 3,180 11,778 12,214 113,850– international trade and services ................... 76,700 79,368 8,629 11,676 8,295 184,668– commercial real estate ................................. 31,326 34,560 639 5,900 2,421 74,846– other property-related .................................. 7,308 27,147 1,333 8,716 328 44,832– government .................................................. 3,340 1,021 1,443 499 974 7,277– other commercial10 ....................................... 64,522 31,040 4,536 11,738 5,956 117,792
Financial (non-bank financial institutions) (J) ... 27,872 9,688 2,532 9,055 1,376 50,523 Asset-backed securities reclassified ................... 2,578 – – 138 – 2,716 Loans and advances to banks (K) ....................... 24,273 72,814 6,419 6,420 10,178 120,104
Total wholesale lending (L) ................................ 293,839 286,396 28,711 65,920 41,742 716,608
Impairment allowances on wholesale lending Corporate and commercial (i) ............................. 3,821 918 1,212 769 1,339 8,059
– manufacturing .............................................. 618 246 182 89 384 1,519– international trade and services ................... 1,216 428 502 188 349 2,683– commercial real estate ................................. 1,116 22 153 202 396 1,889– other property-related .................................. 269 102 236 93 8 708– government .................................................. 3 – 10 1 – 14– other commercial ......................................... 599 120 129 196 202 1,246
Financial (non-bank financial institutions) (j) ... 344 17 60 50 11 482 Loans and advances to banks (k) ........................ 35 – 18 5 – 58
Total (l) ............................................................... 4,200 935 1,290 824 1,350 8,599
(i) as a percentage of (I) ..................................... 1.60 0.45 6.13 1.53 4.44 1.48 (j) as a percentage of (J) ..................................... 1.23 0.18 2.37 0.55 0.80 0.95 (k) as a percentage of (K) ................................... 0.14 – 0.28 0.08 – 0.05 (l) as a percentage of (L) .................................... 1.43 0.33 4.49 1.25 3.23 1.20
For footnotes, see page 172.
H S B C H O L D I N G S P L C
Interim Management Report (continued) Risk > Credit risk > Wholesale lending / Credit quality of financial instruments
120
The commentary that follows is on a constant currency basis.
Corporate and commercial
Corporate and commercial lending, excluding commercial real estate and other property-related lending, represented 44% of total gross loans and advances to customers compared with 42% at 31 December 2013. The increase of US$34bn was driven by lending within manufacturing, transport and other subsectors within Asia and increases in manufacturing and other commercial portfolios within Europe, where this was principally driven by a rise in corporate overdraft balances, mainly in GB&M, in accounts which are structured to allow customer corporate treasury functions to benefit from net interest arrangements but where net settlement is not intended to occur, together with a corresponding rise in current accounts.
The aggregate of our commercial real estate and other property-related lending was US$126bn at 30 June 2014, an increase of US$5.3bn relative to 31 December 2013, but still representing an overall 12% of total loans and advances to customers.
Commercial real estate
Our exposure to commercial real estate lending continued to be concentrated in Asia, the UK and North America. The improvements in commercial real estate markets noted in 2013 continued into 2014.
Refinance risk in commercial real estate
Refinance risk is described on page 272 of the Annual Report and Accounts 2013. This risk is
subject to close scrutiny in key commercial real estate markets.
Liquidity continued to improve further in 2014, as a wider range of funding sources returned to the market. There are now many refinancing opportunities with evidence of pressure on pricing.
On a reported basis, at 31 June 2014, we had US$22bn (31 December 2013: US$22bn) of commercial real estate loans in the UK of which US$5.8bn (31 December 2013: US$6.8bn) were due to be refinanced within the next 12 months. Of these balances, cases subject to close monitoring in our Loan Management unit amounted to US$2.0bn (31 December 2013: US$2.4bn). US$1.6bn (31 December 2013: US$1.6bn) were disclosed as impaired with impairment allowances of US$0.7bn (31 December 2013: US$0.6bn). Where these loans are not considered impaired it is because there is sufficient evidence to indicate that the associated contractual cash flows will be recovered or that the loans will not need to be refinanced on terms we would consider below market norms.
Credit quality of financial instruments
We assess credit quality on all financial instruments which bear credit risk. The distribution of financial instruments by credit quality is tabulated below. The five classifications describing the credit quality of our lending, debt securities portfolios and derivatives are set out in the Appendix to Risk on page 267 of the Annual Report and Accounts 2013. Additional credit quality information in respect of our consolidated holdings of ABSs is provided on page 143.
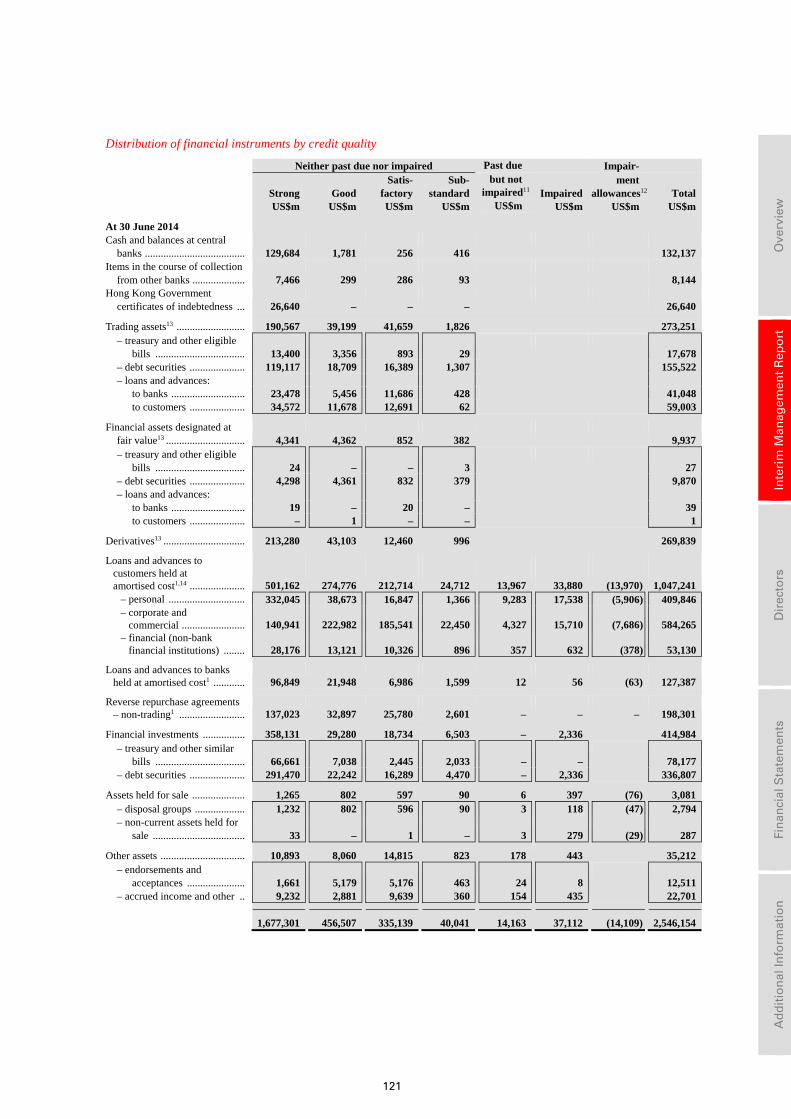
121
Ove
rvie
w
In
teri
m M
anag
emen
t R
epo
rt
D
irec
tors
Fin
anci
al S
tate
men
ts
A
dd
itio
nal
Info
rmat
ion
Distribution of financial instruments by credit quality
Neither past due nor impaired Past due Impair- Satis- Sub- but not ment Strong Good factory standard impaired11 Impaired allowances12 Total US$m US$m US$m US$m US$m US$m US$m US$m
At 30 June 2014 Cash and balances at central
banks ...................................... 129,684 1,781 256 416 132,137 Items in the course of collection
from other banks .................... 7,466 299 286 93 8,144 Hong Kong Government
certificates of indebtedness ... 26,640 – – – 26,640
Trading assets13 .......................... 190,567 39,199 41,659 1,826 273,251 – treasury and other eligible
bills .................................. 13,400 3,356 893 29 17,678– debt securities ..................... 119,117 18,709 16,389 1,307 155,522– loans and advances:
to banks ............................ 23,478 5,456 11,686 428 41,048to customers ..................... 34,572 11,678 12,691 62 59,003
Financial assets designated at fair value13 .............................. 4,341 4,362 852 382 9,937 – treasury and other eligible
bills .................................. 24 – – 3 27– debt securities ..................... 4,298 4,361 832 379 9,870– loans and advances:
to banks ............................ 19 – 20 – 39to customers ..................... – 1 – – 1
Derivatives13 ............................... 213,280 43,103 12,460 996 269,839
Loans and advances to customers held at amortised cost1,14 ..................... 501,162 274,776 212,714 24,712 13,967 33,880 (13,970) 1,047,241
– personal ............................. 332,045 38,673 16,847 1,366 9,283 17,538 (5,906) 409,846– corporate and commercial ........................ 140,941 222,982 185,541 22,450 4,327 15,710 (7,686) 584,265– financial (non-bank financial institutions) ........ 28,176 13,121 10,326 896 357 632 (378) 53,130
Loans and advances to banks held at amortised cost1 ............ 96,849 21,948 6,986 1,599 12 56 (63) 127,387
Reverse repurchase agreements – non-trading1 ......................... 137,023 32,897 25,780 2,601 – – – 198,301
Financial investments ................ 358,131 29,280 18,734 6,503 – 2,336 414,984 – treasury and other similar
bills .................................. 66,661 7,038 2,445 2,033 – – 78,177– debt securities ..................... 291,470 22,242 16,289 4,470 – 2,336 336,807
Assets held for sale .................... 1,265 802 597 90 6 397 (76) 3,081 – disposal groups ................... 1,232 802 596 90 3 118 (47) 2,794– non-current assets held for
sale ................................... 33 – 1 – 3 279 (29) 287
Other assets ................................ 10,893 8,060 14,815 823 178 443 35,212 – endorsements and
acceptances ...................... 1,661 5,179 5,176 463 24 8 12,511– accrued income and other .. 9,232 2,881 9,639 360 154 435 22,701
1,677,301 456,507 335,139 40,041 14,163 37,112 (14,109) 2,546,154
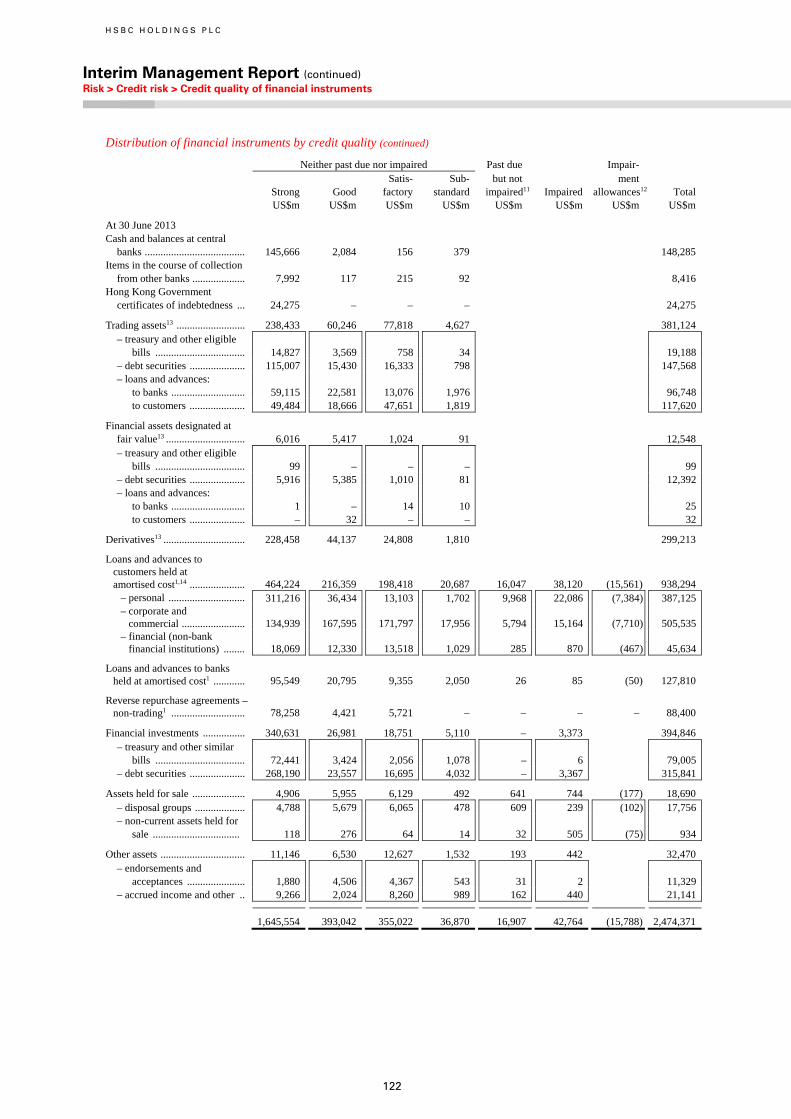
H S B C H O L D I N G S P L C
Interim Management Report (continued) Risk > Credit risk > Credit quality of financial instruments
122
Distribution of financial instruments by credit quality (continued)
Neither past due nor impaired Past due Impair- Satis- Sub- but not ment Strong Good factory standard impaired11 Impaired allowances12 Total US$m US$m US$m US$m US$m US$m US$m US$m
At 30 June 2013 Cash and balances at central
banks ...................................... 145,666 2,084 156 379 148,285 Items in the course of collection
from other banks .................... 7,992 117 215 92 8,416 Hong Kong Government
certificates of indebtedness ... 24,275 – – – 24,275
Trading assets13 .......................... 238,433 60,246 77,818 4,627 381,124 – treasury and other eligible
bills .................................. 14,827 3,569 758 34 19,188– debt securities ..................... 115,007 15,430 16,333 798 147,568– loans and advances:
to banks ............................ 59,115 22,581 13,076 1,976 96,748to customers ..................... 49,484 18,666 47,651 1,819 117,620
Financial assets designated at fair value13 .............................. 6,016 5,417 1,024 91 12,548 – treasury and other eligible
bills .................................. 99 – – – 99– debt securities ..................... 5,916 5,385 1,010 81 12,392– loans and advances:
to banks ............................ 1 – 14 10 25to customers ..................... – 32 – – 32
Derivatives13 ............................... 228,458 44,137 24,808 1,810 299,213
Loans and advances to customers held at amortised cost1,14 ..................... 464,224 216,359 198,418 20,687 16,047 38,120 (15,561) 938,294
– personal ............................. 311,216 36,434 13,103 1,702 9,968 22,086 (7,384) 387,125– corporate and commercial ........................ 134,939 167,595 171,797 17,956 5,794 15,164 (7,710) 505,535– financial (non-bank financial institutions) ........ 18,069 12,330 13,518 1,029 285 870 (467) 45,634
Loans and advances to banks held at amortised cost1 ............ 95,549 20,795 9,355 2,050 26 85 (50) 127,810
Reverse repurchase agreements – non-trading1 ............................ 78,258 4,421 5,721 – – – – 88,400
Financial investments ................ 340,631 26,981 18,751 5,110 – 3,373 394,846 – treasury and other similar
bills .................................. 72,441 3,424 2,056 1,078 – 6 79,005– debt securities ..................... 268,190 23,557 16,695 4,032 – 3,367 315,841
Assets held for sale .................... 4,906 5,955 6,129 492 641 744 (177) 18,690 – disposal groups ................... 4,788 5,679 6,065 478 609 239 (102) 17,756– non-current assets held for
sale ................................. 118 276 64 14 32 505 (75) 934
Other assets ................................ 11,146 6,530 12,627 1,532 193 442 32,470 – endorsements and
acceptances ...................... 1,880 4,506 4,367 543 31 2 11,329– accrued income and other .. 9,266 2,024 8,260 989 162 440 21,141
1,645,554 393,042 355,022 36,870 16,907 42,764 (15,788) 2,474,371
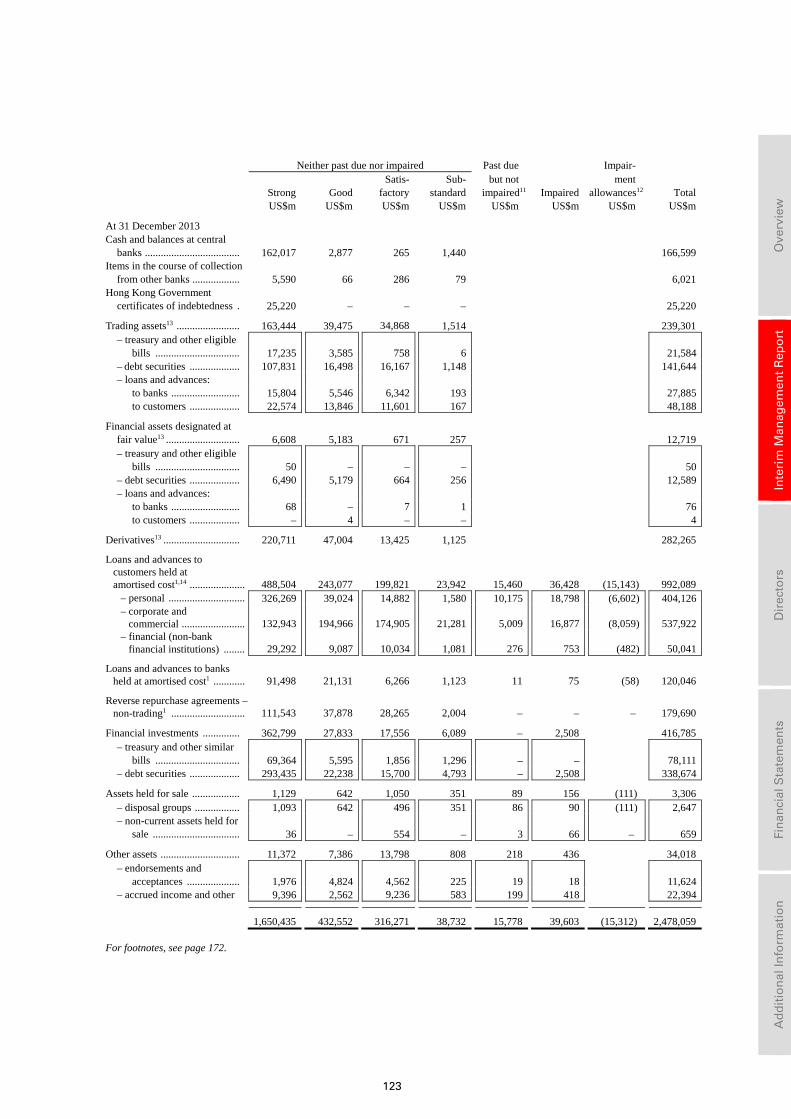
123
Ove
rvie
w
In
teri
m M
anag
emen
t R
epo
rt
D
irec
tors
Fin
anci
al S
tate
men
ts
A
dd
itio
nal
Info
rmat
ion
Neither past due nor impaired Past due Impair- Satis- Sub- but not ment Strong Good factory standard impaired11 Impaired allowances12 Total US$m US$m US$m US$m US$m US$m US$m US$m
At 31 December 2013 Cash and balances at central
banks .................................... 162,017 2,877 265 1,440 166,599 Items in the course of collection
from other banks .................. 5,590 66 286 79 6,021 Hong Kong Government
certificates of indebtedness . 25,220 – – – 25,220
Trading assets13 ........................ 163,444 39,475 34,868 1,514 239,301 – treasury and other eligible
bills ................................ 17,235 3,585 758 6 21,584– debt securities ................... 107,831 16,498 16,167 1,148 141,644– loans and advances:
to banks .......................... 15,804 5,546 6,342 193 27,885to customers ................... 22,574 13,846 11,601 167 48,188
Financial assets designated at fair value13 ............................ 6,608 5,183 671 257 12,719 – treasury and other eligible
bills ................................ 50 – – – 50– debt securities ................... 6,490 5,179 664 256 12,589– loans and advances:
to banks .......................... 68 – 7 1 76to customers ................... – 4 – – 4
Derivatives13 ............................. 220,711 47,004 13,425 1,125 282,265
Loans and advances to customers held at amortised cost1,14 ..................... 488,504 243,077 199,821 23,942 15,460 36,428 (15,143) 992,089
– personal ............................. 326,269 39,024 14,882 1,580 10,175 18,798 (6,602) 404,126– corporate and commercial ........................ 132,943 194,966 174,905 21,281 5,009 16,877 (8,059) 537,922– financial (non-bank financial institutions) ........ 29,292 9,087 10,034 1,081 276 753 (482) 50,041
Loans and advances to banks held at amortised cost1 ............ 91,498 21,131 6,266 1,123 11 75 (58) 120,046
Reverse repurchase agreements – non-trading1 ............................ 111,543 37,878 28,265 2,004 – – – 179,690
Financial investments .............. 362,799 27,833 17,556 6,089 – 2,508 416,785 – treasury and other similar
bills ................................ 69,364 5,595 1,856 1,296 – – 78,111– debt securities ................... 293,435 22,238 15,700 4,793 – 2,508 338,674
Assets held for sale .................. 1,129 642 1,050 351 89 156 (111) 3,306 – disposal groups ................. 1,093 642 496 351 86 90 (111) 2,647– non-current assets held for
sale ................................. 36 – 554 – 3 66 – 659
Other assets .............................. 11,372 7,386 13,798 808 218 436 34,018 – endorsements and
acceptances .................... 1,976 4,824 4,562 225 19 18 11,624– accrued income and other 9,396 2,562 9,236 583 199 418 22,394
1,650,435 432,552 316,271 38,732 15,778 39,603 (15,312) 2,478,059
For footnotes, see page 172.

H S B C H O L D I N G S P L C
Interim Management Report (continued) Risk > Credit risk > Credit quality of financial instruments
124
The commentary that follows is on a reported basis.
The balance of credit risk-bearing financial instruments at 30 June 2014 was US$2,546bn, of which US$1,677bn or 66% were classified as ‘strong’ (31 December 2013: 67%). The proportion of financial instruments classified as ‘good’ and ‘satisfactory’ remained broadly unchanged at 18% and 13%, respectively. The proportion of ‘sub-standard’ financial instruments remained low at 2% at 30 June 2014.
Loans and advances held at amortised cost were US$1,175bn, a US$63bn increase over the US$1,112bn at 31 December 2013. At 30 June 2014, 76% of these balances were classified as either ‘strong’ or ‘good’, broadly in line with the end of 2013.
The majority of the Group’s exposure to financial investments was in the form of available-for-sale debt securities issued by government and government agencies classified as ‘strong’. At
30 June 2014 this amounted to 86% of the total, broadly similar to 31 December 2013.
Trading assets increased by US$34bn to US$273bn at 30 June 2014, broadly reflecting the same credit quality distribution as at 31 December 2013.
Derivative assets fell by US$12bn with credit quality distribution remaining broadly consistent with 31 December 2013.
Cash and balances at central banks reduced by US$34bn to US$132bn at 30 June 2014, principally in Europe, driven by the redeployment of surplus funds.
Past due but not impaired gross financial instruments
The definition of past due but not impaired loans is set out on page 172 of the Annual Report and Accounts 2013.
Past due but not impaired loans and advances to customers and banks by geographical region
Europe Asia9 MENA North America
Latin America Total
US$m US$m US$m US$m US$m US$m At 30 June 2014 Banks .................................................................. – 12 – – – 12
Customers ........................................................... 2,717 4,244 872 4,303 1,831 13,967 – personal ...................................................... 1,395 2,860 198 3,679 1,151 9,283– corporate and commercial .......................... 1,316 1,192 640 516 663 4,327– financial (non-bank financial
institutions) ................................................. 6 192 34 108 17 357
2,717 4,256 872 4,303 1,831 13,979
At 30 June 2013 Banks .................................................................. 16 10 – – – 26
Customers ........................................................... 2,043 4,135 1,001 6,930 1,938 16,047 – personal ...................................................... 1,210 2,648 227 4,585 1,298 9,968 – corporate and commercial .......................... 822 1,275 723 2,340 634 5,794 – financial (non-bank financial
institutions) ................................................. 11 212 51 5 6 285
2,059 4,145 1,001 6,930 1,938 16,073
At 31 December 2013 Banks .................................................................. – 11 – – – 11
Customers ........................................................... 2,399 4,211 757 6,453 1,640 15,460– personal ...................................................... 1,287 2,764 174 4,817 1,133 10,175– corporate and commercial .......................... 1,092 1,197 580 1,635 505 5,009– financial (non-bank financial
institutions) ................................................. 20 250 3 1 2 276
2,399 4,222 757 6,453 1,640 15,471
For footnote, see page 172.
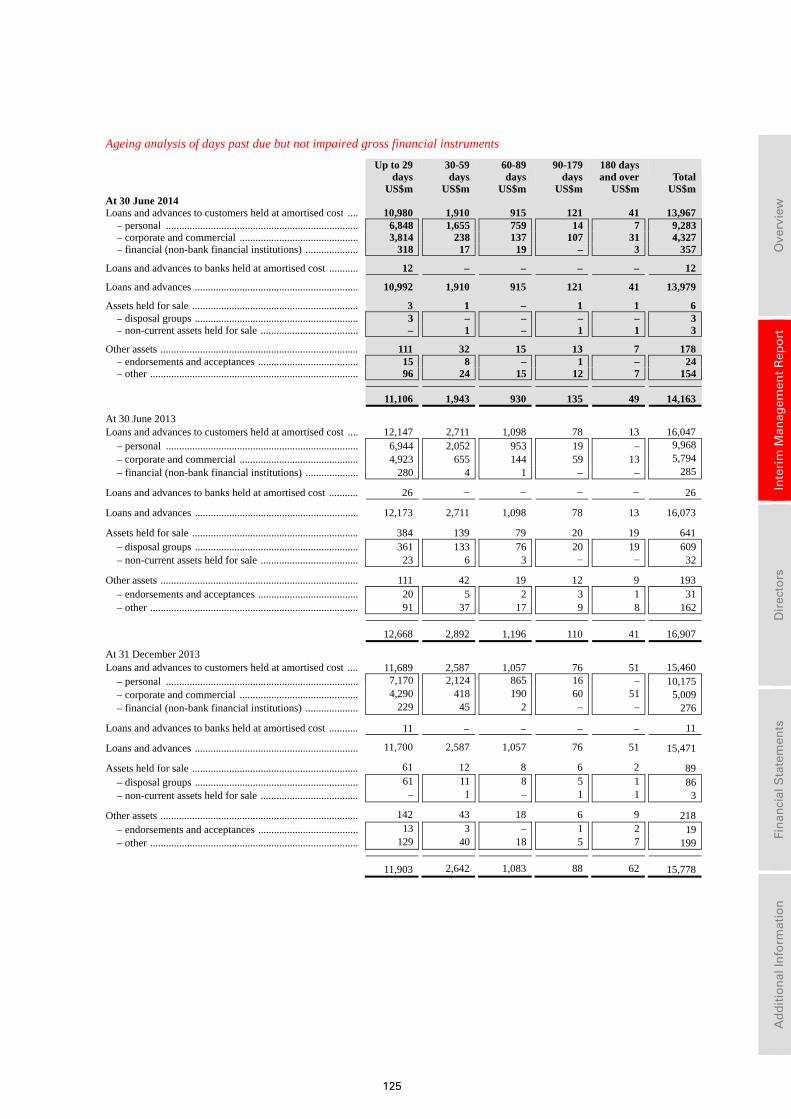
125
Ove
rvie
w
In
teri
m M
anag
emen
t R
epo
rt
D
irec
tors
Fin
anci
al S
tate
men
ts
A
dd
itio
nal
Info
rmat
ion
Ageing analysis of days past due but not impaired gross financial instruments
Up to 29 days
30-59 days
60-89 days
90-179 days
180 days and over Total
US$m US$m US$m US$m US$m US$mAt 30 June 2014 Loans and advances to customers held at amortised cost .... 10,980 1,910 915 121 41 13,967
– personal ......................................................................... 6,848 1,655 759 14 7 9,283– corporate and commercial ............................................. 3,814 238 137 107 31 4,327– financial (non-bank financial institutions) .................... 318 17 19 – 3 357
Loans and advances to banks held at amortised cost ........... 12 – – – – 12
Loans and advances .............................................................. 10,992 1,910 915 121 41 13,979
Assets held for sale ............................................................... 3 1 – 1 1 6– disposal groups .............................................................. 3 – – – – 3– non-current assets held for sale ..................................... – 1 – 1 1 3
Other assets ........................................................................... 111 32 15 13 7 178– endorsements and acceptances ...................................... 15 8 – 1 – 24– other ............................................................................... 96 24 15 12 7 154
11,106 1,943 930 135 49 14,163
At 30 June 2013 Loans and advances to customers held at amortised cost .... 12,147 2,711 1,098 78 13 16,047
– personal ......................................................................... 6,944 2,052 953 19 – 9,968– corporate and commercial ............................................. 4,923 655 144 59 13 5,794– financial (non-bank financial institutions) .................... 280 4 1 – – 285
Loans and advances to banks held at amortised cost ........... 26 − − − − 26
Loans and advances .............................................................. 12,173 2,711 1,098 78 13 16,073
Assets held for sale ............................................................... 384 139 79 20 19 641 – disposal groups .............................................................. 361 133 76 20 19 609– non-current assets held for sale ..................................... 23 6 3 − − 32
Other assets ........................................................................... 111 42 19 12 9 193 – endorsements and acceptances ...................................... 20 5 2 3 1 31– other ............................................................................... 91 37 17 9 8 162
12,668 2,892 1,196 110 41 16,907
At 31 December 2013 Loans and advances to customers held at amortised cost .... 11,689 2,587 1,057 76 51 15,460
– personal ......................................................................... 7,170 2,124 865 16 – 10,175– corporate and commercial ............................................. 4,290 418 190 60 51 5,009– financial (non-bank financial institutions) .................... 229 45 2 – – 276
Loans and advances to banks held at amortised cost ........... 11 – – – – 11
Loans and advances .............................................................. 11,700 2,587 1,057 76 51 15,471
Assets held for sale ............................................................... 61 12 8 6 2 89 – disposal groups .............................................................. 61 11 8 5 1 86– non-current assets held for sale ..................................... – 1 – 1 1 3
Other assets ........................................................................... 142 43 18 6 9 218 – endorsements and acceptances ...................................... 13 3 – 1 2 19– other ............................................................................... 129 40 18 5 7 199
11,903 2,642 1,083 88 62 15,778
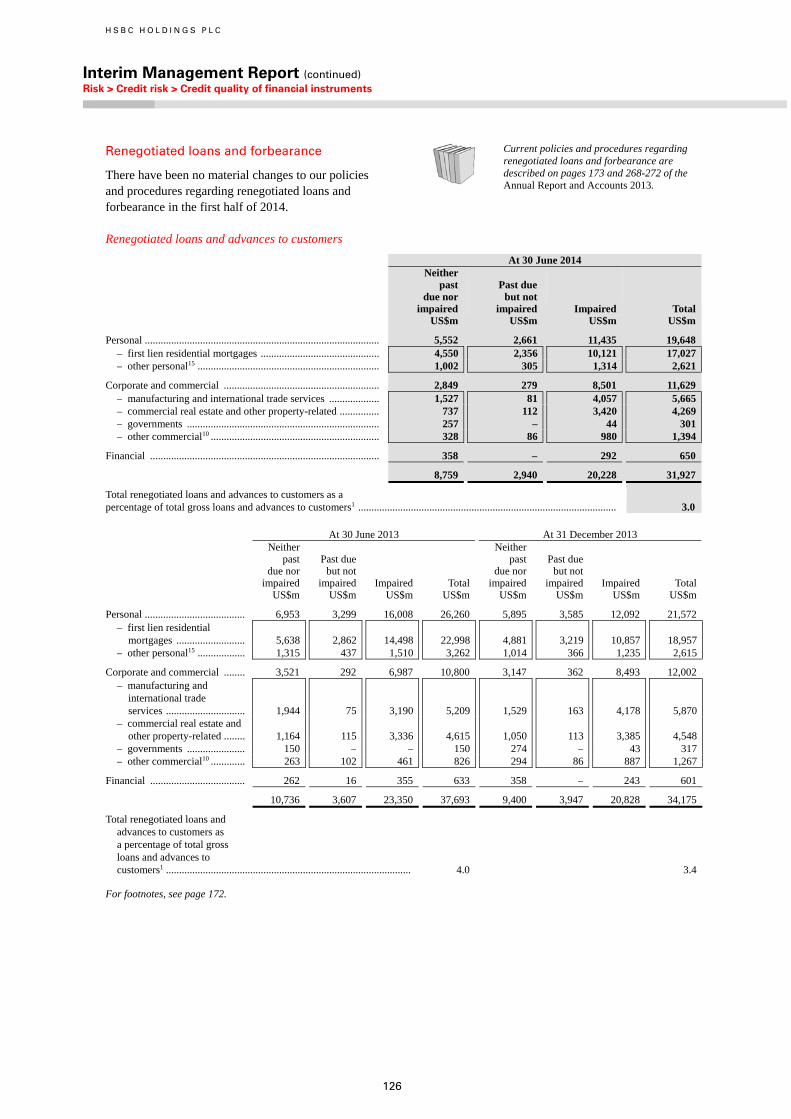
H S B C H O L D I N G S P L C
Interim Management Report (continued) Risk > Credit risk > Credit quality of financial instruments
126
Renegotiated loans and forbearance
There have been no material changes to our policies and procedures regarding renegotiated loans and forbearance in the first half of 2014.
Current policies and procedures regarding renegotiated loans and forbearance are described on pages 173 and 268-272 of the Annual Report and Accounts 2013.
Renegotiated loans and advances to customers
At 30 June 2014 Neither
past due nor impaired
Past due but not impaired Impaired Total
US$m US$m US$m US$m
Personal ......................................................................................... 5,552 2,661 11,435 19,648 – first lien residential mortgages ............................................. 4,550 2,356 10,121 17,027– other personal15 ..................................................................... 1,002 305 1,314 2,621
Corporate and commercial ........................................................... 2,849 279 8,501 11,629 – manufacturing and international trade services ................... 1,527 81 4,057 5,665– commercial real estate and other property-related ............... 737 112 3,420 4,269– governments ......................................................................... 257 – 44 301– other commercial10 ................................................................ 328 86 980 1,394
Financial ....................................................................................... 358 – 292 650
8,759 2,940 20,228 31,927
Total renegotiated loans and advances to customers as a percentage of total gross loans and advances to customers1 .................................................................................................. 3.0 At 30 June 2013 At 31 December 2013 Neither
past due nor impaired
Past due but not impaired Impaired Total
Neither past due nor
impaired
Past due but not
impaired Impaired Total US$m US$m US$m US$m US$m US$m US$m US$m
Personal ...................................... 6,953 3,299 16,008 26,260 5,895 3,585 12,092 21,572 – first lien residential
mortgages .......................... 5,638 2,862 14,498 22,998 4,881 3,219 10,857 18,957– other personal15 .................. 1,315 437 1,510 3,262 1,014 366 1,235 2,615
Corporate and commercial ........ 3,521 292 6,987 10,800 3,147 362 8,493 12,002 – manufacturing and
international trade services .............................. 1,944 75 3,190 5,209 1,529 163 4,178 5,870
– commercial real estate and other property-related ........ 1,164 115 3,336 4,615 1,050 113 3,385 4,548
– governments ...................... 150 – – 150 274 – 43 317– other commercial10 ............. 263 102 461 826 294 86 887 1,267
Financial .................................... 262 16 355 633 358 – 243 601
10,736 3,607 23,350 37,693 9,400 3,947 20,828 34,175
Total renegotiated loans and advances to customers as a percentage of total gross loans and advances to customers1 ............................................................................................. 4.0 3.4
For footnotes, see page 172.
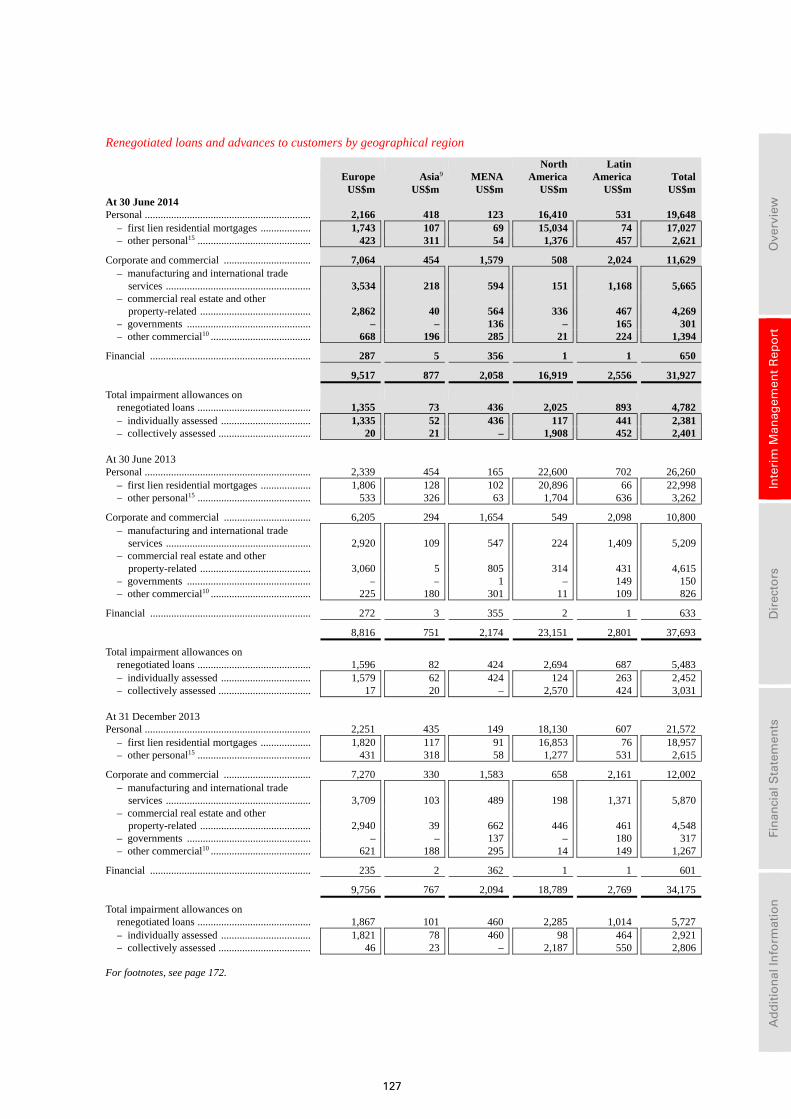
127
Ove
rvie
w
In
teri
m M
anag
emen
t R
epo
rt
D
irec
tors
Fin
anci
al S
tate
men
ts
A
dd
itio
nal
Info
rmat
ion
Renegotiated loans and advances to customers by geographical region
Europe Asia9 MENA North America
Latin America Total
US$m US$m US$m US$m US$m US$m At 30 June 2014 Personal ............................................................... 2,166 418 123 16,410 531 19,648
– first lien residential mortgages ................... 1,743 107 69 15,034 74 17,027– other personal15 ........................................... 423 311 54 1,376 457 2,621
Corporate and commercial ................................. 7,064 454 1,579 508 2,024 11,629– manufacturing and international trade
services ....................................................... 3,534 218 594 151 1,168 5,665– commercial real estate and other
property-related .......................................... 2,862 40 564 336 467 4,269– governments ............................................... – – 136 – 165 301– other commercial10 ...................................... 668 196 285 21 224 1,394
Financial ............................................................. 287 5 356 1 1 650
9,517 877 2,058 16,919 2,556 31,927
Total impairment allowances on renegotiated loans ........................................... 1,355 73 436 2,025 893 4,782 – individually assessed .................................. 1,335 52 436 117 441 2,381– collectively assessed ................................... 20 21 – 1,908 452 2,401
At 30 June 2013 Personal ............................................................... 2,339 454 165 22,600 702 26,260
– first lien residential mortgages ................... 1,806 128 102 20,896 66 22,998 – other personal15 ........................................... 533 326 63 1,704 636 3,262
Corporate and commercial ................................. 6,205 294 1,654 549 2,098 10,800 – manufacturing and international trade
services ....................................................... 2,920 109 547 224 1,409 5,209 – commercial real estate and other
property-related .......................................... 3,060 5 805 314 431 4,615 – governments ............................................... – – 1 – 149 150 – other commercial10 ...................................... 225 180 301 11 109 826
Financial ............................................................. 272 3 355 2 1 633
8,816 751 2,174 23,151 2,801 37,693
Total impairment allowances on renegotiated loans ........................................... 1,596 82 424 2,694 687 5,483– individually assessed .................................. 1,579 62 424 124 263 2,452– collectively assessed ................................... 17 20 – 2,570 424 3,031
At 31 December 2013 Personal ............................................................... 2,251 435 149 18,130 607 21,572
– first lien residential mortgages ................... 1,820 117 91 16,853 76 18,957– other personal15 ........................................... 431 318 58 1,277 531 2,615
Corporate and commercial ................................. 7,270 330 1,583 658 2,161 12,002 – manufacturing and international trade
services ....................................................... 3,709 103 489 198 1,371 5,870– commercial real estate and other
property-related .......................................... 2,940 39 662 446 461 4,548– governments ............................................... – – 137 – 180 317– other commercial10 ...................................... 621 188 295 14 149 1,267
Financial ............................................................. 235 2 362 1 1 601
9,756 767 2,094 18,789 2,769 34,175
Total impairment allowances on renegotiated loans ........................................... 1,867 101 460 2,285 1,014 5,727– individually assessed .................................. 1,821 78 460 98 464 2,921– collectively assessed ................................... 46 23 – 2,187 550 2,806
For footnotes, see page 172.
H S B C H O L D I N G S P L C
Interim Management Report (continued) Risk > Credit risk > Credit quality of financial instruments / Impaired loans
128
The following commentary is on a reported basis.
In the first half of 2014 renegotiated loans declined by US$2.2bn to US$32bn at 30 June 2014 (31 December 2013: US$34bn). The most significant portfolio of renegotiated loans remained in North America, substantially all of which were retail loans held by HSBC Finance.
The next largest portfolio of renegotiated loans was in Europe, largely concentrated in the commercial real estate and other property sectors at 30% (31 December 2013: 30%) and the manufacturing and international trade service sectors at 37% (31 December 2013: 38%).
In the corporate and commercial sector, renegotiated loans reduced by 3.1% compared with the end of 2013.
HSBC Finance loan modifications and re-ageing
Types of loan renegotiation programme in HSBC Finance
• A temporary modification is a change to the contractual terms of a loan that results in the giving up of a right to contractual cash flows over a pre-defined period. With a temporary modification the loan is expected to revert back to the original contractual terms, including the interest rate charged, after the modification period. An example is reduced interest payments.
A substantial number of HSBC Finance modifications involve interest rate reductions. These modifications lower the amount of interest income HSBC Finance is contractually entitled to receive in future periods. Historically, modifications have generally been for six months, although extended modification periods are now more common.
Loans that have been re-aged are classified as impaired with the exception of first-time loan re-ages that were less than 60 days past due at the time of re-age. These remain classified as impaired until they have demonstrated a history of payment performance against their original contracted terms for at least 12 months.
• A permanent modification is a change to the contractual terms of a loan that results in giving up a right to contractual cash flows over the life of the loan. An example is a permanent reduction in the interest rate charged.
Permanent or long-term modifications which are due to an underlying hardship event remain classified as impaired for their full life.
• The term ‘re-age’ describes a renegotiation by which the contractual delinquency status of a loan is reset to current after demonstrating payment performance. The overdue principal and/or interest is deferred and paid at a later date. Loan re-ageing enables customers who have been unable to make a small number of payments to have their loan delinquency status reset to current so that their credit score is not affected by the overdue balances.
Loans that have been re-aged remain classified as impaired until they have demonstrated a history of payment performance against the original contractual terms for at least 12 months.
A temporary or permanent modification may also lead to a re-ageing of a loan although a loan may be re-aged without any modification to its original terms and conditions.
Where loans have been granted multiple concessions, subject to the qualifying criteria discussed below, the concession is deemed to have been made due to concern regarding the borrower’s ability to pay, and the loan is disclosed as impaired. The loan remains disclosed as impaired from that date forward until the borrower has demonstrated a history of repayment performance for the period of time required for either modifications or re-ages, as described above.
HSBC Finance maintains loan modification and re-age (‘loan renegotiation’) programmes in order to manage customer relationships, improve collection opportunities and, if possible, avoid foreclosure. The volume of loans that qualify for modification has reduced significantly in recent years. We expect this trend to continue as HSBC Finance believes the percentage of its customers with unmodified loans who would benefit from loan modification in a way that would avoid non-payment of future cash flows is decreasing. In addition, volumes of new loan modifications are expected to decrease due to improvements in economic conditions and the continued run-off of the CML portfolio.
Qualifying criteria
For an account to qualify for renegotiation it must meet certain criteria. However, HSBC Finance retains the right to decline a renegotiation. The extent to which HSBC Finance renegotiates accounts that are eligible under its existing policies will vary depending upon its view of prevailing economic conditions and other factors which may change from year to year. In addition, exceptions to policies and practices may be made in specific situations in response to legal or regulatory agreements or orders.
Renegotiated real estate secured and personal lending receivables are not eligible for a subsequent renegotiation for twelve or six months, respectively, with a maximum of five renegotiations permitted within a five-year period. Borrowers must be approved for a modification and generally make two minimum qualifying monthly payments within 60 days to activate a modification.
In certain circumstances where the debt has been restructured in bankruptcy proceedings, fewer or no payments may be required. Accounts whose borrowers are subject to a Chapter 13 plan filed with a bankruptcy court generally may be re-aged upon receipt of one qualifying payment, whereas accounts whose borrowers have filed for Chapter 7 bankruptcy protection may be re-aged upon receipt of a signed reaffirmation agreement. In addition, for some products, accounts may be re-aged without receipt of a payment in certain special circumstances (e.g. in the event of a natural disaster or a hardship programme).
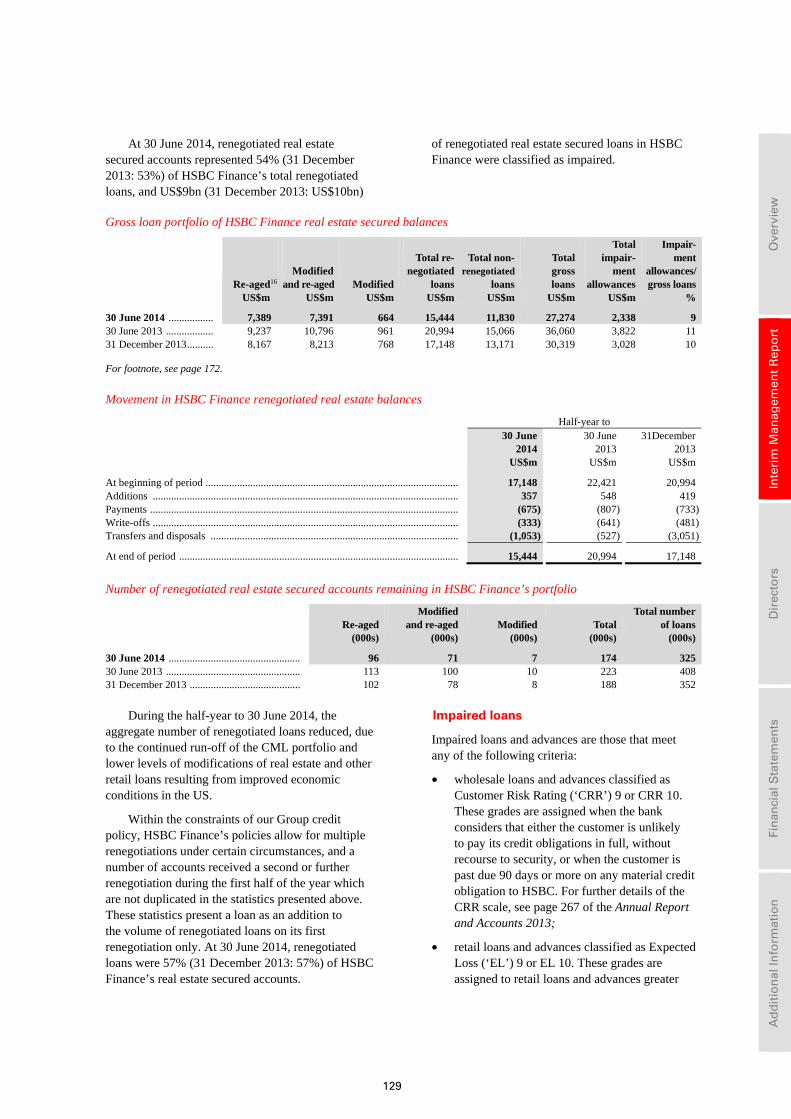
129
Ove
rvie
w
In
teri
m M
anag
emen
t R
epo
rt
D
irec
tors
Fin
anci
al S
tate
men
ts
A
dd
itio
nal
Info
rmat
ion
At 30 June 2014, renegotiated real estate secured accounts represented 54% (31 December 2013: 53%) of HSBC Finance’s total renegotiated loans, and US$9bn (31 December 2013: US$10bn)
of renegotiated real estate secured loans in HSBC Finance were classified as impaired.
Gross loan portfolio of HSBC Finance real estate secured balances
Re-aged16 Modified
and re-aged Modified
Total re-negotiated
loans
Total non- renegotiated
loans
Total gross loans
Total impair-
ment allowances
Impair- ment
allowances/gross loans
US$m US$m US$m US$m US$m US$m US$m %
30 June 2014 ................. 7,389 7,391 664 15,444 11,830 27,274 2,338 9 30 June 2013 .................. 9,237 10,796 961 20,994 15,066 36,060 3,822 11 31 December 2013 .......... 8,167 8,213 768 17,148 13,171 30,319 3,028 10
For footnote, see page 172.
Movement in HSBC Finance renegotiated real estate balances
Half-year to
30 June 2014
30 June 2013
31December 2013
US$m US$m US$m
At beginning of period ................................................................................................ 17,148 22,421 20,994 Additions .................................................................................................................... 357 548 419 Payments ..................................................................................................................... (675) (807) (733)Write-offs .................................................................................................................... (333) (641) (481)Transfers and disposals .............................................................................................. (1,053) (527) (3,051)
At end of period .......................................................................................................... 15,444 20,994 17,148
Number of renegotiated real estate secured accounts remaining in HSBC Finance’s portfolio
Re-aged
Modified and re-aged Modified Total
Total numberof loans
(000s) (000s) (000s) (000s) (000s)
30 June 2014 .................................................. 96 71 7 174 325 30 June 2013 ................................................... 113 100 10 223 408 31 December 2013 .......................................... 102 78 8 188 352
During the half-year to 30 June 2014, the
aggregate number of renegotiated loans reduced, due to the continued run-off of the CML portfolio and lower levels of modifications of real estate and other retail loans resulting from improved economic conditions in the US.
Within the constraints of our Group credit policy, HSBC Finance’s policies allow for multiple renegotiations under certain circumstances, and a number of accounts received a second or further renegotiation during the first half of the year which are not duplicated in the statistics presented above. These statistics present a loan as an addition to the volume of renegotiated loans on its first renegotiation only. At 30 June 2014, renegotiated loans were 57% (31 December 2013: 57%) of HSBC Finance’s real estate secured accounts.
Impaired loans
Impaired loans and advances are those that meet any of the following criteria:
• wholesale loans and advances classified as Customer Risk Rating (‘CRR’) 9 or CRR 10. These grades are assigned when the bank considers that either the customer is unlikely to pay its credit obligations in full, without recourse to security, or when the customer is past due 90 days or more on any material credit obligation to HSBC. For further details of the CRR scale, see page 267 of the Annual Report and Accounts 2013;
• retail loans and advances classified as Expected Loss (‘EL’) 9 or EL 10. These grades are assigned to retail loans and advances greater
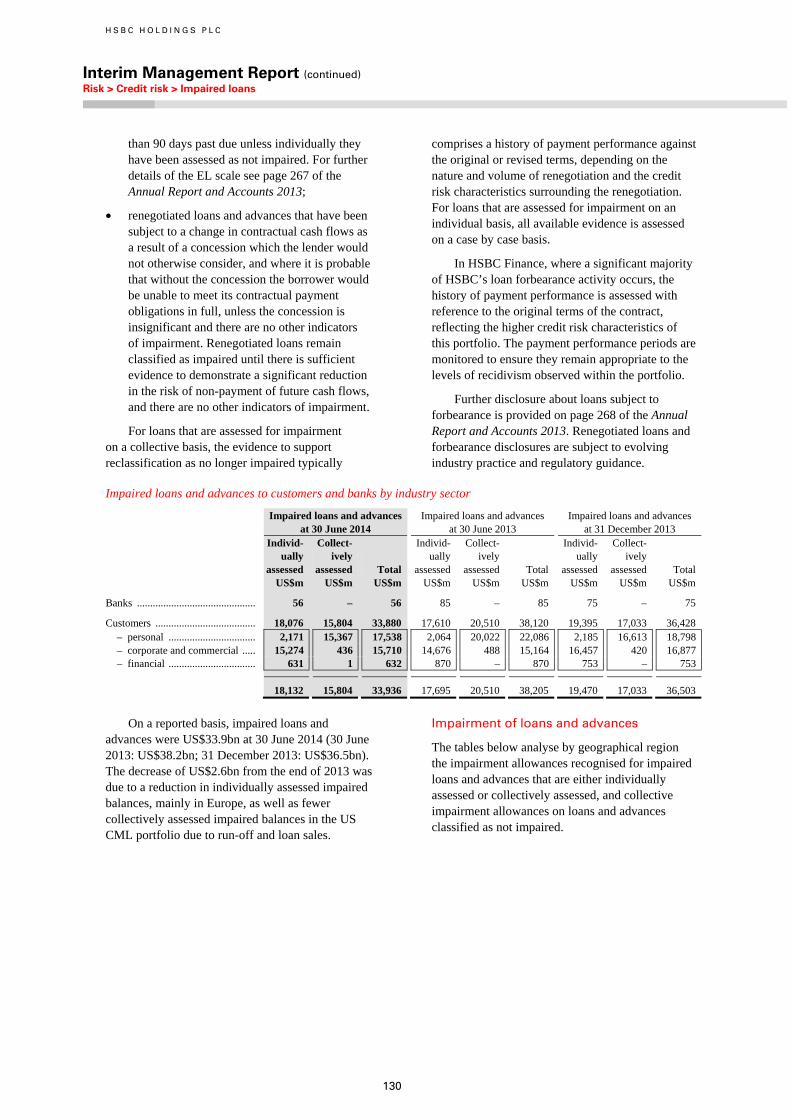
H S B C H O L D I N G S P L C
Interim Management Report (continued) Risk > Credit risk > Impaired loans
130
than 90 days past due unless individually they have been assessed as not impaired. For further details of the EL scale see page 267 of the Annual Report and Accounts 2013;
• renegotiated loans and advances that have been subject to a change in contractual cash flows as a result of a concession which the lender would not otherwise consider, and where it is probable that without the concession the borrower would be unable to meet its contractual payment obligations in full, unless the concession is insignificant and there are no other indicators of impairment. Renegotiated loans remain classified as impaired until there is sufficient evidence to demonstrate a significant reduction in the risk of non-payment of future cash flows, and there are no other indicators of impairment.
For loans that are assessed for impairment on a collective basis, the evidence to support reclassification as no longer impaired typically
comprises a history of payment performance against the original or revised terms, depending on the nature and volume of renegotiation and the credit risk characteristics surrounding the renegotiation. For loans that are assessed for impairment on an individual basis, all available evidence is assessed on a case by case basis.
In HSBC Finance, where a significant majority of HSBC’s loan forbearance activity occurs, the history of payment performance is assessed with reference to the original terms of the contract, reflecting the higher credit risk characteristics of this portfolio. The payment performance periods are monitored to ensure they remain appropriate to the levels of recidivism observed within the portfolio.
Further disclosure about loans subject to forbearance is provided on page 268 of the Annual Report and Accounts 2013. Renegotiated loans and forbearance disclosures are subject to evolving industry practice and regulatory guidance.
Impaired loans and advances to customers and banks by industry sector
Impaired loans and advances at 30 June 2014
Impaired loans and advancesat 30 June 2013
Impaired loans and advances at 31 December 2013
Individ- ually assessed
Collect- ively assessed Total
Individ- ually assessed
Collect- ively assessed Total
Individ- ually assessed
Collect- ively assessed
Total US$m US$m US$m US$m US$m US$m US$m US$m US$m
Banks ............................................. 56 – 56 85 – 85 75 – 75
Customers ...................................... 18,076 15,804 33,880 17,610 20,510 38,120 19,395 17,033 36,428 – personal ................................. 2,171 15,367 17,538 2,064 20,022 22,086 2,185 16,613 18,798– corporate and commercial ..... 15,274 436 15,710 14,676 488 15,164 16,457 420 16,877– financial ................................. 631 1 632 870 – 870 753 – 753
18,132 15,804 33,936 17,695 20,510 38,205 19,470 17,033 36,503
On a reported basis, impaired loans and
advances were US$33.9bn at 30 June 2014 (30 June 2013: US$38.2bn; 31 December 2013: US$36.5bn). The decrease of US$2.6bn from the end of 2013 was due to a reduction in individually assessed impaired balances, mainly in Europe, as well as fewer collectively assessed impaired balances in the US CML portfolio due to run-off and loan sales.
Impairment of loans and advances
The tables below analyse by geographical region the impairment allowances recognised for impaired loans and advances that are either individually assessed or collectively assessed, and collective impairment allowances on loans and advances classified as not impaired.
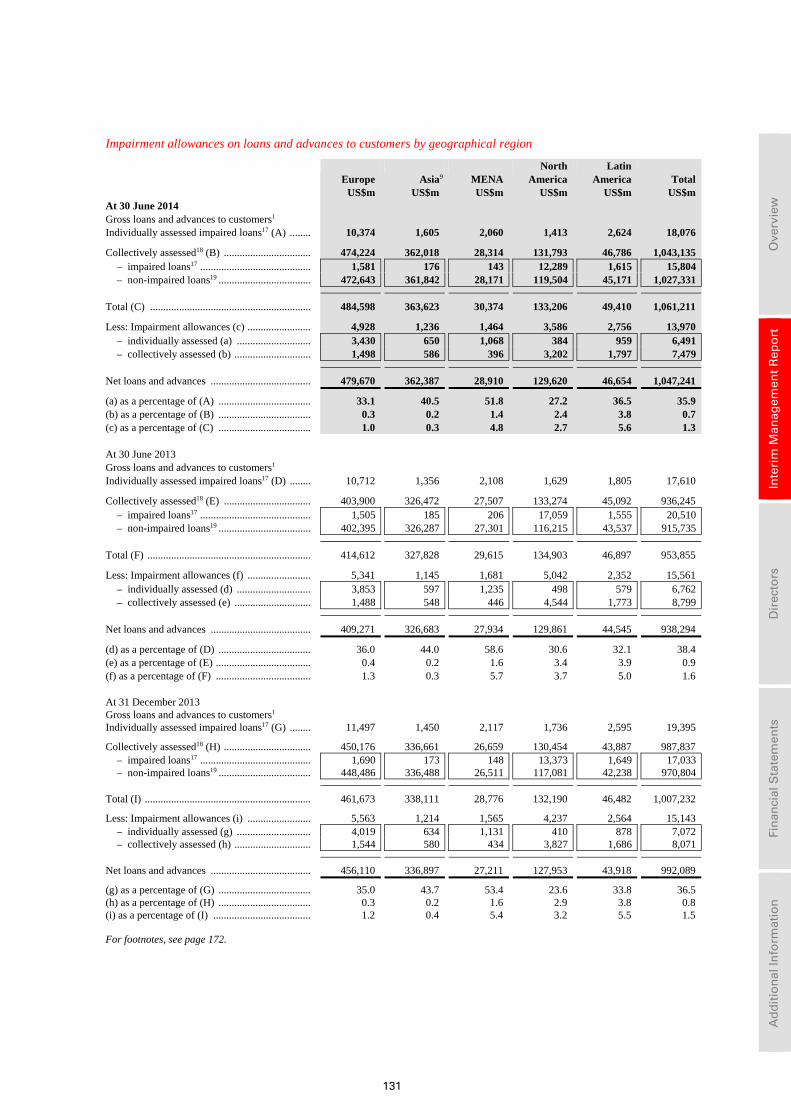
131
Ove
rvie
w
In
teri
m M
anag
emen
t R
epo
rt
D
irec
tors
Fin
anci
al S
tate
men
ts
A
dd
itio
nal
Info
rmat
ion
Impairment allowances on loans and advances to customers by geographical region
Europe Asia9 MENA
North America
Latin America Total
US$m US$m US$m US$m US$m US$m At 30 June 2014 Gross loans and advances to customers1 Individually assessed impaired loans17 (A) ........ 10,374 1,605 2,060 1,413 2,624 18,076
Collectively assessed18 (B) ................................. 474,224 362,018 28,314 131,793 46,786 1,043,135 – impaired loans17 .......................................... 1,581 176 143 12,289 1,615 15,804– non-impaired loans19 ................................... 472,643 361,842 28,171 119,504 45,171 1,027,331
Total (C) ............................................................. 484,598 363,623 30,374 133,206 49,410 1,061,211
Less: Impairment allowances (c) ........................ 4,928 1,236 1,464 3,586 2,756 13,970 – individually assessed (a) ............................ 3,430 650 1,068 384 959 6,491– collectively assessed (b) ............................. 1,498 586 396 3,202 1,797 7,479
Net loans and advances ...................................... 479,670 362,387 28,910 129,620 46,654 1,047,241
(a) as a percentage of (A) ................................... 33.1 40.5 51.8 27.2 36.5 35.9 (b) as a percentage of (B) ................................... 0.3 0.2 1.4 2.4 3.8 0.7 (c) as a percentage of (C) ................................... 1.0 0.3 4.8 2.7 5.6 1.3
At 30 June 2013 Gross loans and advances to customers1 Individually assessed impaired loans17 (D) ........ 10,712 1,356 2,108 1,629 1,805 17,610
Collectively assessed18 (E) ................................. 403,900 326,472 27,507 133,274 45,092 936,245 – impaired loans17 .......................................... 1,505 185 206 17,059 1,555 20,510– non-impaired loans19 ................................... 402,395 326,287 27,301 116,215 43,537 915,735
Total (F) .............................................................. 414,612 327,828 29,615 134,903 46,897 953,855
Less: Impairment allowances (f) ........................ 5,341 1,145 1,681 5,042 2,352 15,561 – individually assessed (d) ............................ 3,853 597 1,235 498 579 6,762– collectively assessed (e) ............................. 1,488 548 446 4,544 1,773 8,799
Net loans and advances ...................................... 409,271 326,683 27,934 129,861 44,545 938,294
(d) as a percentage of (D) ................................... 36.0 44.0 58.6 30.6 32.1 38.4 (e) as a percentage of (E) .................................... 0.4 0.2 1.6 3.4 3.9 0.9 (f) as a percentage of (F) .................................... 1.3 0.3 5.7 3.7 5.0 1.6 At 31 December 2013 Gross loans and advances to customers1 Individually assessed impaired loans17 (G) ........ 11,497 1,450 2,117 1,736 2,595 19,395
Collectively assessed18 (H) ................................. 450,176 336,661 26,659 130,454 43,887 987,837 – impaired loans17 .......................................... 1,690 173 148 13,373 1,649 17,033– non-impaired loans19 ................................... 448,486 336,488 26,511 117,081 42,238 970,804
Total (I) ............................................................... 461,673 338,111 28,776 132,190 46,482 1,007,232
Less: Impairment allowances (i) ........................ 5,563 1,214 1,565 4,237 2,564 15,143– individually assessed (g) ............................ 4,019 634 1,131 410 878 7,072– collectively assessed (h) ............................. 1,544 580 434 3,827 1,686 8,071
Net loans and advances ...................................... 456,110 336,897 27,211 127,953 43,918 992,089
(g) as a percentage of (G) ................................... 35.0 43.7 53.4 23.6 33.8 36.5(h) as a percentage of (H) ................................... 0.3 0.2 1.6 2.9 3.8 0.8(i) as a percentage of (I) ..................................... 1.2 0.4 5.4 3.2 5.5 1.5
For footnotes, see page 172.
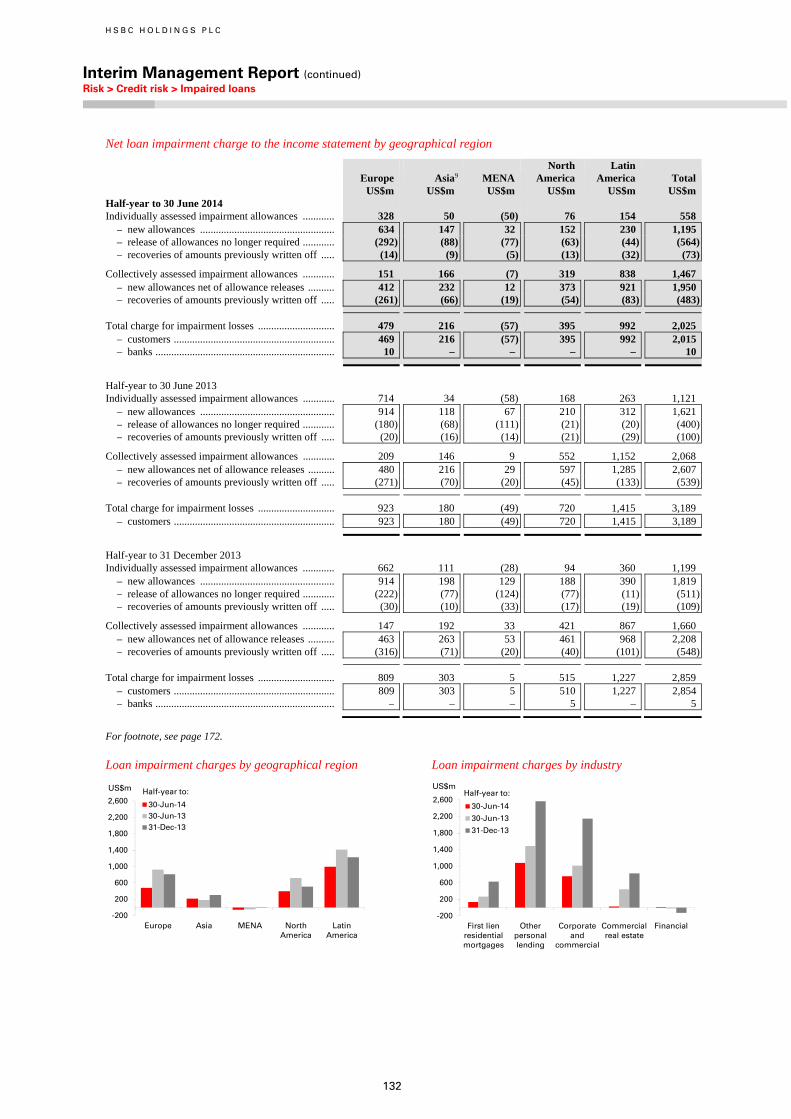
H S B C H O L D I N G S P L C
Interim Management Report (continued) Risk > Credit risk > Impaired loans
132
Net loan impairment charge to the income statement by geographical region
Europe Asia9 MENA North America
Latin America Total
US$m US$m US$m US$m US$m US$m Half-year to 30 June 2014 Individually assessed impairment allowances ............ 328 50 (50) 76 154 558
– new allowances ................................................... 634 147 32 152 230 1,195– release of allowances no longer required ............ (292) (88) (77) (63) (44) (564)– recoveries of amounts previously written off ..... (14) (9) (5) (13) (32) (73)
Collectively assessed impairment allowances ............ 151 166 (7) 319 838 1,467 – new allowances net of allowance releases .......... 412 232 12 373 921 1,950– recoveries of amounts previously written off ..... (261) (66) (19) (54) (83) (483)
Total charge for impairment losses ............................. 479 216 (57) 395 992 2,025 – customers ............................................................. 469 216 (57) 395 992 2,015– banks .................................................................... 10 – – – – 10
Half-year to 30 June 2013 Individually assessed impairment allowances ............ 714 34 (58) 168 263 1,121
– new allowances ................................................... 914 118 67 210 312 1,621 – release of allowances no longer required ............ (180) (68) (111) (21) (20) (400)– recoveries of amounts previously written off ..... (20) (16) (14) (21) (29) (100)
Collectively assessed impairment allowances ............ 209 146 9 552 1,152 2,068 – new allowances net of allowance releases .......... 480 216 29 597 1,285 2,607 – recoveries of amounts previously written off ..... (271) (70) (20) (45) (133) (539)
Total charge for impairment losses ............................. 923 180 (49) 720 1,415 3,189 – customers ............................................................. 923 180 (49) 720 1,415 3,189
Half-year to 31 December 2013 Individually assessed impairment allowances ............ 662 111 (28) 94 360 1,199
– new allowances ................................................... 914 198 129 188 390 1,819– release of allowances no longer required ............ (222) (77) (124) (77) (11) (511)– recoveries of amounts previously written off ..... (30) (10) (33) (17) (19) (109)
Collectively assessed impairment allowances ............ 147 192 33 421 867 1,660– new allowances net of allowance releases .......... 463 263 53 461 968 2,208– recoveries of amounts previously written off ..... (316) (71) (20) (40) (101) (548)
Total charge for impairment losses ............................. 809 303 5 515 1,227 2,859– customers ............................................................. 809 303 5 510 1,227 2,854– banks .................................................................... – – – 5 – 5
For footnote, see page 172.
Loan impairment charges by geographical region
Loan impairment charges by industry
-200
200
600
1,000
1,400
1,800
2,200
2,600
Europe Asia MENA NorthAmerica
LatinAmerica
30-Jun-1430-Jun-1331-Dec-13
US$m Half-year to:
-200
200
600
1,000
1,400
1,800
2,200
2,600
First lienresidentialmortgages
Otherpersonallending
Corporateand
commercial
Commercialreal estate
Financial
30-Jun-14
30-Jun-13
31-Dec-13
US$mHalf-year to:
133
Ove
rvie
w
In
teri
m M
anag
emen
t R
epo
rt
D
irec
tors
Fin
anci
al S
tate
men
ts
A
dd
itio
nal
Info
rmat
ion
Loan impairment in the first half of 2014
On a reported basis, loan impairment allowances at 30 June 2014 were US$14.0bn, an 8% decrease compared with the end of 2013. Impaired loans were US$33.9bn, US$2.6bn lower than the balance at 31 December 2013.
The following commentary is on a constant currency basis.
The reduction in loan impairment allowances was mainly due to lower individually assessed new allowances in Europe, as well as a decrease in collectively assessed new allowances in North America and Latin America.
Releases and recoveries of US$1.1bn were 7% higher than in the first half of 2013 due to reduced delinquency and improved market conditions in Europe and higher releases of individually assessed allowances in North America.
In Europe, new loan impairment allowances were US$1.0bn, a 29% decrease on the first half of 2013 with a reduction in both individually and collectively assessed allowances, primarily in the UK, notably in the commercial and corporate sectors, reflecting improved quality in the portfolio and the economic environment.
Impaired loans of US$12.0bn at 30 June 2014 were 11% lower than at 31 December 2013, primarily in the corporate and commercial sectors.
Releases and recoveries in Europe were US$567m, a rise of 13% compared with the first half of 2013, primarily due to higher releases in the corporate and commercial sectors in the UK.
In Asia, new impairment allowances were US$379m, an increase of US$62m from the first half of 2013 due to an increase in individually assessed allowances against a small number of CMB exposures in Hong Kong, as well as higher new collective allowances net of releases as a result of higher releases in the previous year which reflected an overall improvement in the loan portfolio and growth in lending balances.
Impaired loans of US$1.8bn at 30 June 2014 were 8% higher than at 31 December 2013, mainly relating to corporate and commercial exposures in Indonesia, Hong Kong and Malaysia.
Releases and recoveries in the region were US$163m, an increase of 10% compared with the first half of 2013, due to higher individual releases.
In the Middle East and North Africa, new loan impairment allowances were US$44m, a decrease of
US$52m compared with the first half of 2013 reflecting lower individually and collectively assessed new allowances in the UAE.
Impaired loans of US$2.2bn at 30 June 2014 were 3% lower than at 31 December 2013, mainly due to a decrease in individually assessed corporate and commercial loans as a result of ongoing loan recoveries.
Releases and recoveries in the region were US$101m, a fall of 31% compared with the first half of 2013, primarily due to fewer significant one-off recoveries.
In North America, new loan impairment allowances decreased by 34% to US$525m. This was driven by reduced collectively assessed new allowances as a result of the continued run-off of the CML portfolio though this was partly offset by lower favourable market value adjustments of the underlying properties as improvements in housing market conditions were less pronounced in the first half of 2014. In addition, collectively assessed allowances increased in CMB and GB&M as we revised certain estimates used in our corporate loan impairment calculation. Individually assessed new allowances also reduced in Canada in CMB.
Impaired loans fell by 9% from the end of 2013 to US$13.7bn, driven by the continued run-off of the CML portfolio and loan sales.
Releases and recoveries in North America were US$130m, a 49% increase compared with the first half of 2013, driven by releases of individually assessed allowances in the wholesale portfolio, due to upgrades of certain customers in the US, and higher releases relating to CMB clients in Canada.
In Latin America, new impairment allowances fell by 21% to US$1.2bn, driven by lower collectively assessed new allowances in Brazil reflecting the change to the impairment model and assumption revisions for restructured loan portfolios in both RBWM and CMB, which occurred in the first half of 2013, though this was partly offset by an increase due to refinements to the impairment model for non-restructured loan portfolios, primarily in RBWM, in the first half of 2014. Individually assessed new allowances also reduced, notably in Mexico, reflecting lower new allowances in CMB, in particular relating to homebuilders.
Impaired loans fell by 4% from the end of 2013 to US$4.2bn, notably in Brazil. This was largely due to the settlement of a significant individually assessed corporate account.
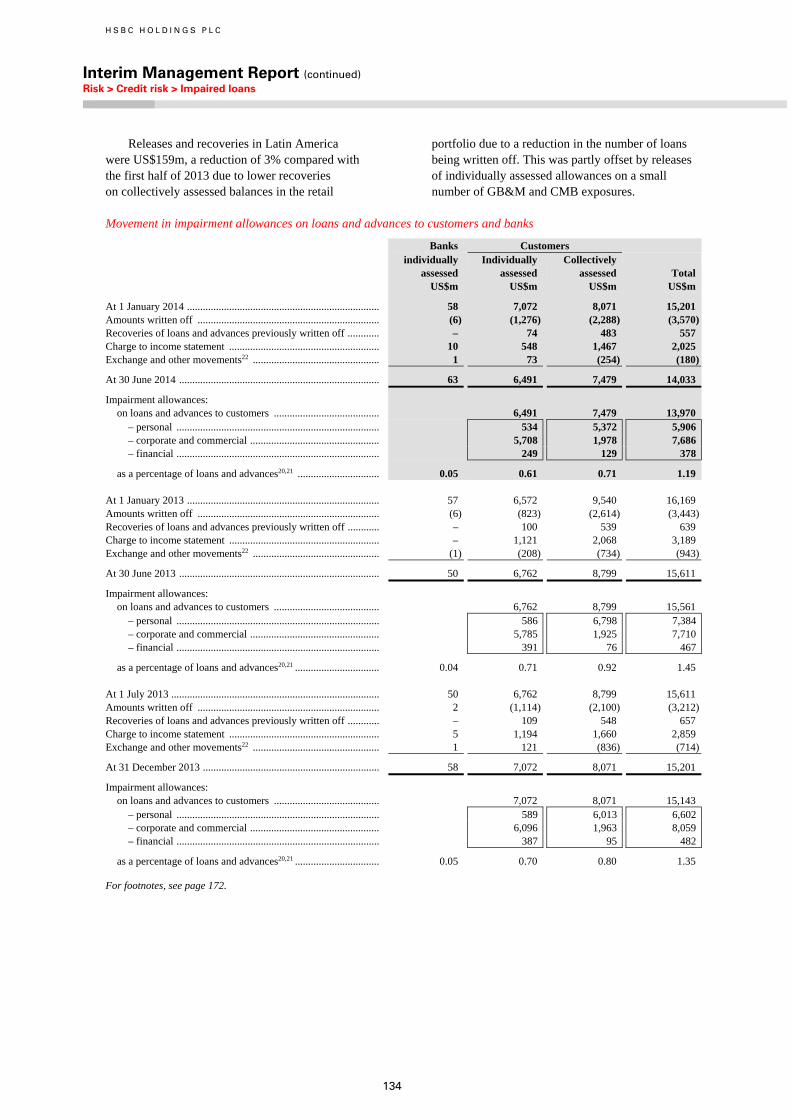
H S B C H O L D I N G S P L C
Interim Management Report (continued) Risk > Credit risk > Impaired loans
134
Releases and recoveries in Latin America were US$159m, a reduction of 3% compared with the first half of 2013 due to lower recoveries on collectively assessed balances in the retail
portfolio due to a reduction in the number of loans being written off. This was partly offset by releases of individually assessed allowances on a small number of GB&M and CMB exposures.
Movement in impairment allowances on loans and advances to customers and banks
Banks Customers individually
assessed Individually assessed
Collectively assessed Total
US$m US$m US$m US$m
At 1 January 2014 ......................................................................... 58 7,072 8,071 15,201 Amounts written off ..................................................................... (6) (1,276) (2,288) (3,570)Recoveries of loans and advances previously written off ............ – 74 483 557 Charge to income statement ......................................................... 10 548 1,467 2,025 Exchange and other movements22 ................................................ 1 73 (254) (180)
At 30 June 2014 ............................................................................ 63 6,491 7,479 14,033
Impairment allowances: on loans and advances to customers ........................................ 6,491 7,479 13,970
– personal ............................................................................. 534 5,372 5,906– corporate and commercial ................................................. 5,708 1,978 7,686– financial ............................................................................. 249 129 378
as a percentage of loans and advances20,21 ............................... 0.05 0.61 0.71 1.19 At 1 January 2013 ......................................................................... 57 6,572 9,540 16,169 Amounts written off ..................................................................... (6) (823) (2,614) (3,443)Recoveries of loans and advances previously written off ............ – 100 539 639 Charge to income statement ......................................................... – 1,121 2,068 3,189 Exchange and other movements22 ................................................ (1) (208) (734) (943)
At 30 June 2013 ............................................................................ 50 6,762 8,799 15,611
Impairment allowances: on loans and advances to customers ........................................ 6,762 8,799 15,561
– personal ............................................................................. 586 6,798 7,384– corporate and commercial ................................................. 5,785 1,925 7,710– financial ............................................................................. 391 76 467
as a percentage of loans and advances20,21 ................................ 0.04 0.71 0.92 1.45 At 1 July 2013 ............................................................................... 50 6,762 8,799 15,611 Amounts written off ..................................................................... 2 (1,114) (2,100) (3,212)Recoveries of loans and advances previously written off ............ – 109 548 657 Charge to income statement ......................................................... 5 1,194 1,660 2,859 Exchange and other movements22 ................................................ 1 121 (836) (714)
At 31 December 2013 ................................................................... 58 7,072 8,071 15,201
Impairment allowances: on loans and advances to customers ........................................ 7,072 8,071 15,143
– personal ............................................................................. 589 6,013 6,602– corporate and commercial ................................................. 6,096 1,963 8,059– financial ............................................................................. 387 95 482
as a percentage of loans and advances20,21 ................................ 0.05 0.70 0.80 1.35
For footnotes, see page 172.
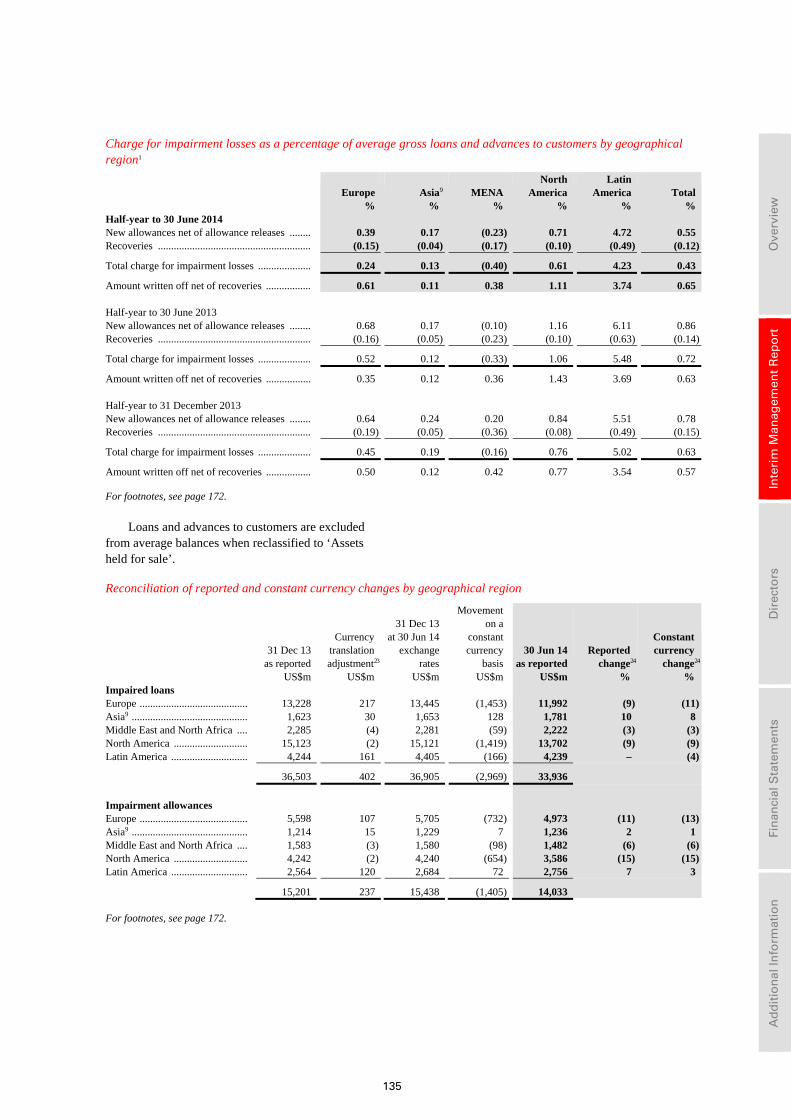
135
Ove
rvie
w
In
teri
m M
anag
emen
t R
epo
rt
D
irec
tors
Fin
anci
al S
tate
men
ts
A
dd
itio
nal
Info
rmat
ion
Charge for impairment losses as a percentage of average gross loans and advances to customers by geographical region1
Europe Asia9 MENA North America
Latin America Total
% % % % % % Half-year to 30 June 2014 New allowances net of allowance releases ........ 0.39 0.17 (0.23) 0.71 4.72 0.55 Recoveries .......................................................... (0.15) (0.04) (0.17) (0.10) (0.49) (0.12)
Total charge for impairment losses .................... 0.24 0.13 (0.40) 0.61 4.23 0.43
Amount written off net of recoveries ................. 0.61 0.11 0.38 1.11 3.74 0.65 Half-year to 30 June 2013 New allowances net of allowance releases ........ 0.68 0.17 (0.10) 1.16 6.11 0.86 Recoveries .......................................................... (0.16) (0.05) (0.23) (0.10) (0.63) (0.14)
Total charge for impairment losses .................... 0.52 0.12 (0.33) 1.06 5.48 0.72
Amount written off net of recoveries ................. 0.35 0.12 0.36 1.43 3.69 0.63 Half-year to 31 December 2013 New allowances net of allowance releases ........ 0.64 0.24 0.20 0.84 5.51 0.78 Recoveries .......................................................... (0.19) (0.05) (0.36) (0.08) (0.49) (0.15)
Total charge for impairment losses .................... 0.45 0.19 (0.16) 0.76 5.02 0.63
Amount written off net of recoveries ................. 0.50 0.12 0.42 0.77 3.54 0.57
For footnotes, see page 172.
Loans and advances to customers are excluded from average balances when reclassified to ‘Assets held for sale’. Reconciliation of reported and constant currency changes by geographical region
31 Dec 13 as reported
Currency translation adjustment23
31 Dec 13 at 30 Jun 14 exchange rates
Movement on a constant currency basis
30 Jun 14 as reported
Reported change24
Constant currency change24
US$m US$m US$m US$m US$m % % Impaired loans Europe ......................................... 13,228 217 13,445 (1,453) 11,992 (9) (11)Asia9 ............................................ 1,623 30 1,653 128 1,781 10 8 Middle East and North Africa .... 2,285 (4) 2,281 (59) 2,222 (3) (3)North America ............................ 15,123 (2) 15,121 (1,419) 13,702 (9) (9)Latin America ............................. 4,244 161 4,405 (166) 4,239 – (4)
36,503 402 36,905 (2,969) 33,936
Impairment allowances Europe ......................................... 5,598 107 5,705 (732) 4,973 (11) (13)Asia9 ............................................ 1,214 15 1,229 7 1,236 2 1 Middle East and North Africa .... 1,583 (3) 1,580 (98) 1,482 (6) (6)North America ............................ 4,242 (2) 4,240 (654) 3,586 (15) (15)Latin America ............................. 2,564 120 2,684 72 2,756 7 3
15,201 237 15,438 (1,405) 14,033
For footnotes, see page 172.
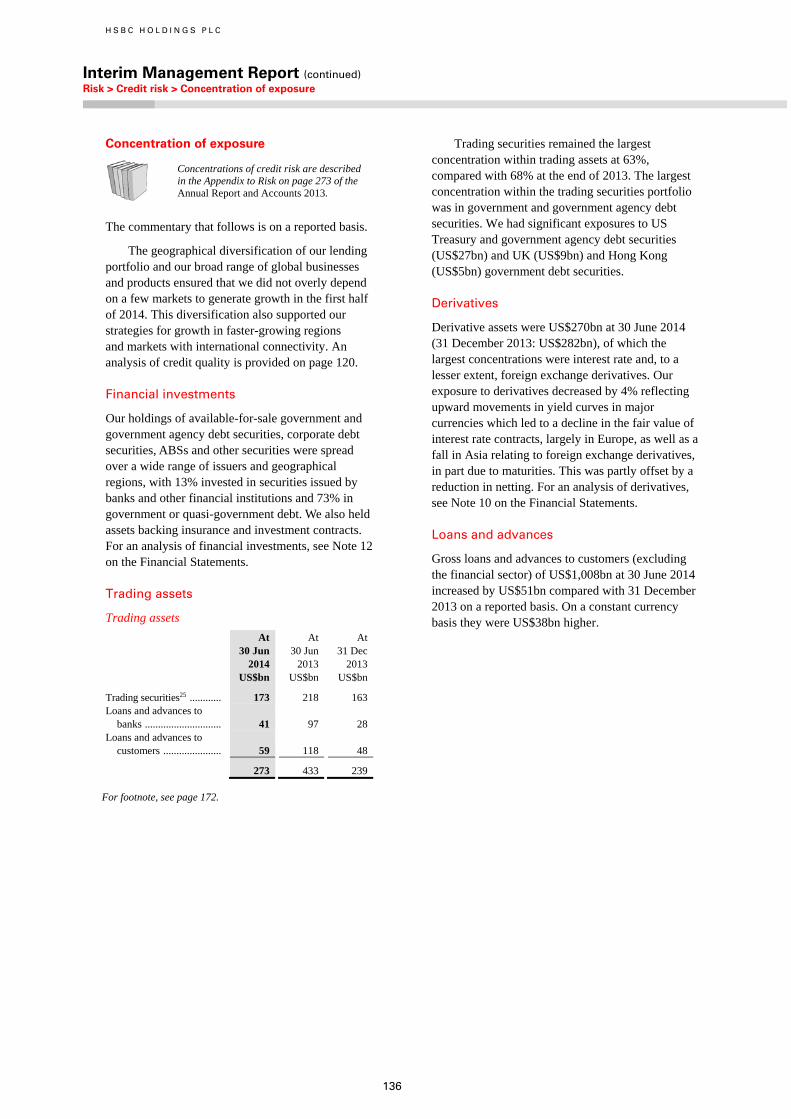
H S B C H O L D I N G S P L C
Interim Management Report (continued) Risk > Credit risk > Concentration of exposure
136
Concentration of exposure
Concentrations of credit risk are described in the Appendix to Risk on page 273 of the Annual Report and Accounts 2013.
The commentary that follows is on a reported basis.
The geographical diversification of our lending portfolio and our broad range of global businesses and products ensured that we did not overly depend on a few markets to generate growth in the first half of 2014. This diversification also supported our strategies for growth in faster-growing regions and markets with international connectivity. An analysis of credit quality is provided on page 120.
Financial investments
Our holdings of available-for-sale government and government agency debt securities, corporate debt securities, ABSs and other securities were spread over a wide range of issuers and geographical regions, with 13% invested in securities issued by banks and other financial institutions and 73% in government or quasi-government debt. We also held assets backing insurance and investment contracts. For an analysis of financial investments, see Note 12 on the Financial Statements.
Trading assets
Trading assets
At 30 Jun
At 30 Jun
At 31 Dec
2014 2013 2013 US$bn US$bn US$bn
Trading securities25 ............ 173 218 163 Loans and advances to
banks ............................. 41 97 28 Loans and advances to
customers ...................... 59 118 48
273 433 239
For footnote, see page 172.
Trading securities remained the largest concentration within trading assets at 63%, compared with 68% at the end of 2013. The largest concentration within the trading securities portfolio was in government and government agency debt securities. We had significant exposures to US Treasury and government agency debt securities (US$27bn) and UK (US$9bn) and Hong Kong (US$5bn) government debt securities.
Derivatives
Derivative assets were US$270bn at 30 June 2014 (31 December 2013: US$282bn), of which the largest concentrations were interest rate and, to a lesser extent, foreign exchange derivatives. Our exposure to derivatives decreased by 4% reflecting upward movements in yield curves in major currencies which led to a decline in the fair value of interest rate contracts, largely in Europe, as well as a fall in Asia relating to foreign exchange derivatives, in part due to maturities. This was partly offset by a reduction in netting. For an analysis of derivatives, see Note 10 on the Financial Statements.
Loans and advances
Gross loans and advances to customers (excluding the financial sector) of US$1,008bn at 30 June 2014 increased by US$51bn compared with 31 December 2013 on a reported basis. On a constant currency basis they were US$38bn higher.
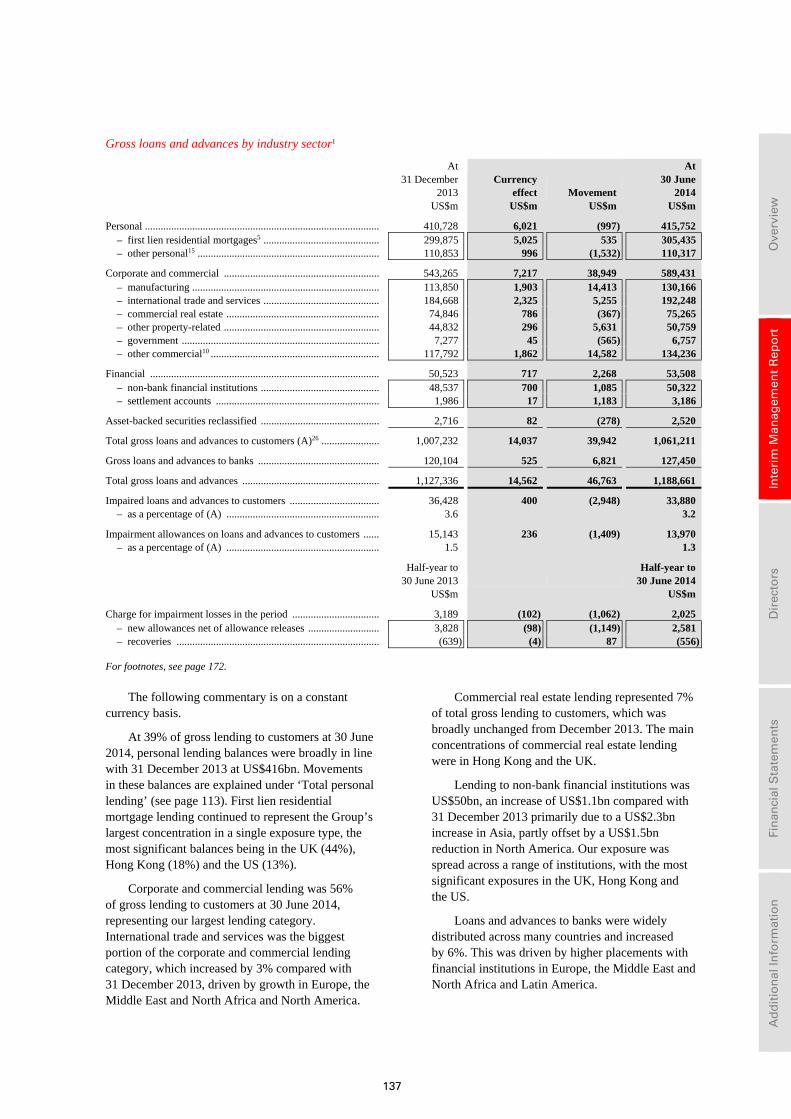
137
Ove
rvie
w
In
teri
m M
anag
emen
t R
epo
rt
D
irec
tors
Fin
anci
al S
tate
men
ts
A
dd
itio
nal
Info
rmat
ion
Gross loans and advances by industry sector1
At 31 December 2013
Currency effect Movement
At 30 June 2014
US$m US$m US$m US$m
Personal ......................................................................................... 410,728 6,021 (997) 415,752 – first lien residential mortgages5 ............................................ 299,875 5,025 535 305,435– other personal15 ..................................................................... 110,853 996 (1,532) 110,317
Corporate and commercial ........................................................... 543,265 7,217 38,949 589,431 – manufacturing ....................................................................... 113,850 1,903 14,413 130,166– international trade and services ............................................ 184,668 2,325 5,255 192,248– commercial real estate .......................................................... 74,846 786 (367) 75,265– other property-related ........................................................... 44,832 296 5,631 50,759– government ........................................................................... 7,277 45 (565) 6,757– other commercial10 ................................................................ 117,792 1,862 14,582 134,236
Financial ....................................................................................... 50,523 717 2,268 53,508 – non-bank financial institutions ............................................. 48,537 700 1,085 50,322– settlement accounts .............................................................. 1,986 17 1,183 3,186
Asset-backed securities reclassified ............................................. 2,716 82 (278) 2,520
Total gross loans and advances to customers (A)26 ...................... 1,007,232 14,037 39,942 1,061,211
Gross loans and advances to banks .............................................. 120,104 525 6,821 127,450
Total gross loans and advances .................................................... 1,127,336 14,562 46,763 1,188,661
Impaired loans and advances to customers .................................. 36,428 400 (2,948) 33,880 – as a percentage of (A) .......................................................... 3.6 3.2
Impairment allowances on loans and advances to customers ...... 15,143 236 (1,409) 13,970 – as a percentage of (A) .......................................................... 1.5 1.3
Half-year to 30 June 2013
Half-year to 30 June 2014
US$m US$m
Charge for impairment losses in the period ................................. 3,189 (102) (1,062) 2,025 – new allowances net of allowance releases ........................... 3,828 (98) (1,149) 2,581– recoveries ............................................................................. (639) (4) 87 (556)
For footnotes, see page 172.
The following commentary is on a constant currency basis.
At 39% of gross lending to customers at 30 June 2014, personal lending balances were broadly in line with 31 December 2013 at US$416bn. Movements in these balances are explained under ‘Total personal lending’ (see page 113). First lien residential mortgage lending continued to represent the Group’s largest concentration in a single exposure type, the most significant balances being in the UK (44%), Hong Kong (18%) and the US (13%).
Corporate and commercial lending was 56% of gross lending to customers at 30 June 2014, representing our largest lending category. International trade and services was the biggest portion of the corporate and commercial lending category, which increased by 3% compared with 31 December 2013, driven by growth in Europe, the Middle East and North Africa and North America.
Commercial real estate lending represented 7% of total gross lending to customers, which was broadly unchanged from December 2013. The main concentrations of commercial real estate lending were in Hong Kong and the UK.
Lending to non-bank financial institutions was US$50bn, an increase of US$1.1bn compared with 31 December 2013 primarily due to a US$2.3bn increase in Asia, partly offset by a US$1.5bn reduction in North America. Our exposure was spread across a range of institutions, with the most significant exposures in the UK, Hong Kong and the US.
Loans and advances to banks were widely distributed across many countries and increased by 6%. This was driven by higher placements with financial institutions in Europe, the Middle East and North Africa and Latin America.
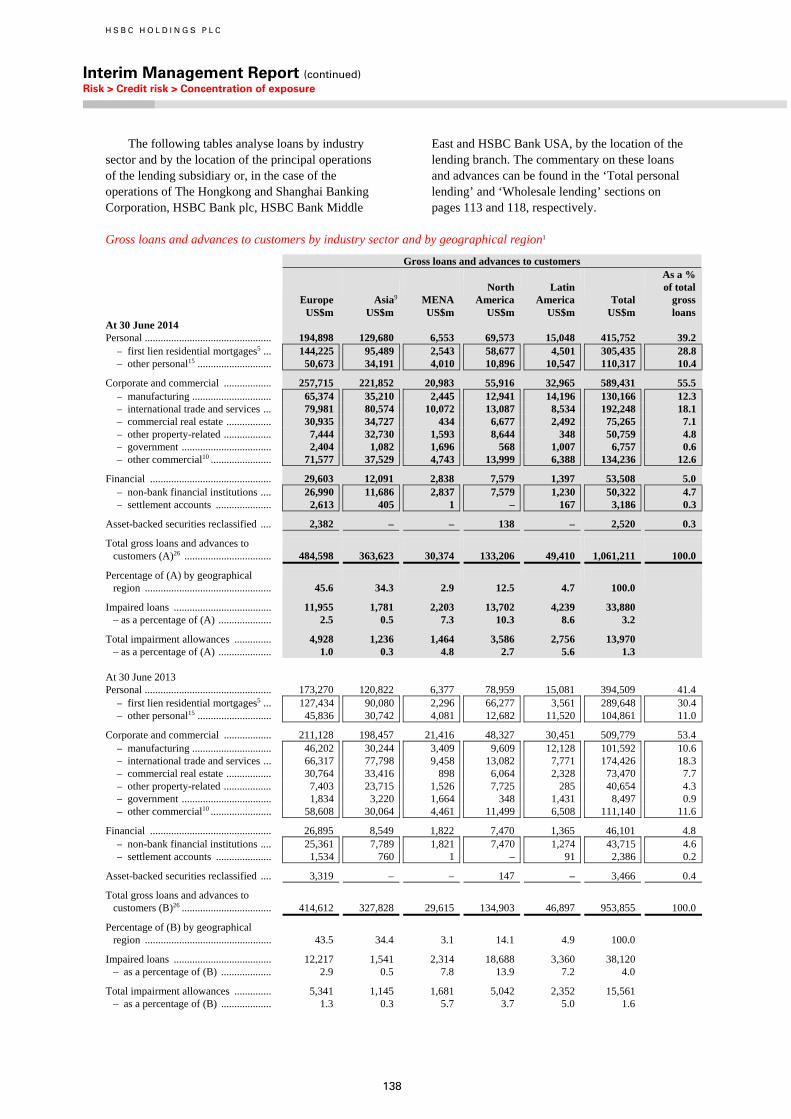
H S B C H O L D I N G S P L C
Interim Management Report (continued) Risk > Credit risk > Concentration of exposure
138
The following tables analyse loans by industry sector and by the location of the principal operations of the lending subsidiary or, in the case of the operations of The Hongkong and Shanghai Banking Corporation, HSBC Bank plc, HSBC Bank Middle
East and HSBC Bank USA, by the location of the lending branch. The commentary on these loans and advances can be found in the ‘Total personal lending’ and ‘Wholesale lending’ sections on pages 113 and 118, respectively.
Gross loans and advances to customers by industry sector and by geographical region1
Gross loans and advances to customers
Europe Asia9 MENA North America
Latin America Total
As a % of total gross
US$m US$m US$m US$m US$m US$m loans At 30 June 2014 Personal ................................................ 194,898 129,680 6,553 69,573 15,048 415,752 39.2
– first lien residential mortgages5 ... 144,225 95,489 2,543 58,677 4,501 305,435 28.8 – other personal15 ............................ 50,673 34,191 4,010 10,896 10,547 110,317 10.4
Corporate and commercial .................. 257,715 221,852 20,983 55,916 32,965 589,431 55.5 – manufacturing .............................. 65,374 35,210 2,445 12,941 14,196 130,166 12.3 – international trade and services ... 79,981 80,574 10,072 13,087 8,534 192,248 18.1 – commercial real estate ................. 30,935 34,727 434 6,677 2,492 75,265 7.1 – other property-related .................. 7,444 32,730 1,593 8,644 348 50,759 4.8 – government .................................. 2,404 1,082 1,696 568 1,007 6,757 0.6 – other commercial10 ....................... 71,577 37,529 4,743 13,999 6,388 134,236 12.6
Financial .............................................. 29,603 12,091 2,838 7,579 1,397 53,508 5.0 – non-bank financial institutions .... 26,990 11,686 2,837 7,579 1,230 50,322 4.7 – settlement accounts ..................... 2,613 405 1 – 167 3,186 0.3
Asset-backed securities reclassified .... 2,382 – – 138 – 2,520 0.3
Total gross loans and advances to customers (A)26 ................................. 484,598 363,623 30,374 133,206 49,410 1,061,211 100.0
Percentage of (A) by geographical region ................................................ 45.6 34.3 2.9 12.5 4.7 100.0
Impaired loans ..................................... 11,955 1,781 2,203 13,702 4,239 33,880 – as a percentage of (A) .................... 2.5 0.5 7.3 10.3 8.6 3.2
Total impairment allowances .............. 4,928 1,236 1,464 3,586 2,756 13,970 – as a percentage of (A) .................... 1.0 0.3 4.8 2.7 5.6 1.3
At 30 June 2013 Personal ................................................ 173,270 120,822 6,377 78,959 15,081 394,509 41.4
– first lien residential mortgages5 ... 127,434 90,080 2,296 66,277 3,561 289,648 30.4– other personal15 ............................ 45,836 30,742 4,081 12,682 11,520 104,861 11.0
Corporate and commercial .................. 211,128 198,457 21,416 48,327 30,451 509,779 53.4– manufacturing .............................. 46,202 30,244 3,409 9,609 12,128 101,592 10.6– international trade and services ... 66,317 77,798 9,458 13,082 7,771 174,426 18.3– commercial real estate ................. 30,764 33,416 898 6,064 2,328 73,470 7.7 – other property-related .................. 7,403 23,715 1,526 7,725 285 40,654 4.3– government .................................. 1,834 3,220 1,664 348 1,431 8,497 0.9– other commercial10 ....................... 58,608 30,064 4,461 11,499 6,508 111,140 11.6
Financial .............................................. 26,895 8,549 1,822 7,470 1,365 46,101 4.8– non-bank financial institutions .... 25,361 7,789 1,821 7,470 1,274 43,715 4.6– settlement accounts ..................... 1,534 760 1 – 91 2,386 0.2
Asset-backed securities reclassified .... 3,319 – – 147 – 3,466 0.4
Total gross loans and advances to customers (B)26 .................................. 414,612 327,828 29,615 134,903 46,897 953,855 100.0
Percentage of (B) by geographical region ................................................ 43.5 34.4 3.1 14.1 4.9 100.0
Impaired loans ..................................... 12,217 1,541 2,314 18,688 3,360 38,120 – as a percentage of (B) ................... 2.9 0.5 7.8 13.9 7.2 4.0
Total impairment allowances .............. 5,341 1,145 1,681 5,042 2,352 15,561 – as a percentage of (B) ................... 1.3 0.3 5.7 3.7 5.0 1.6
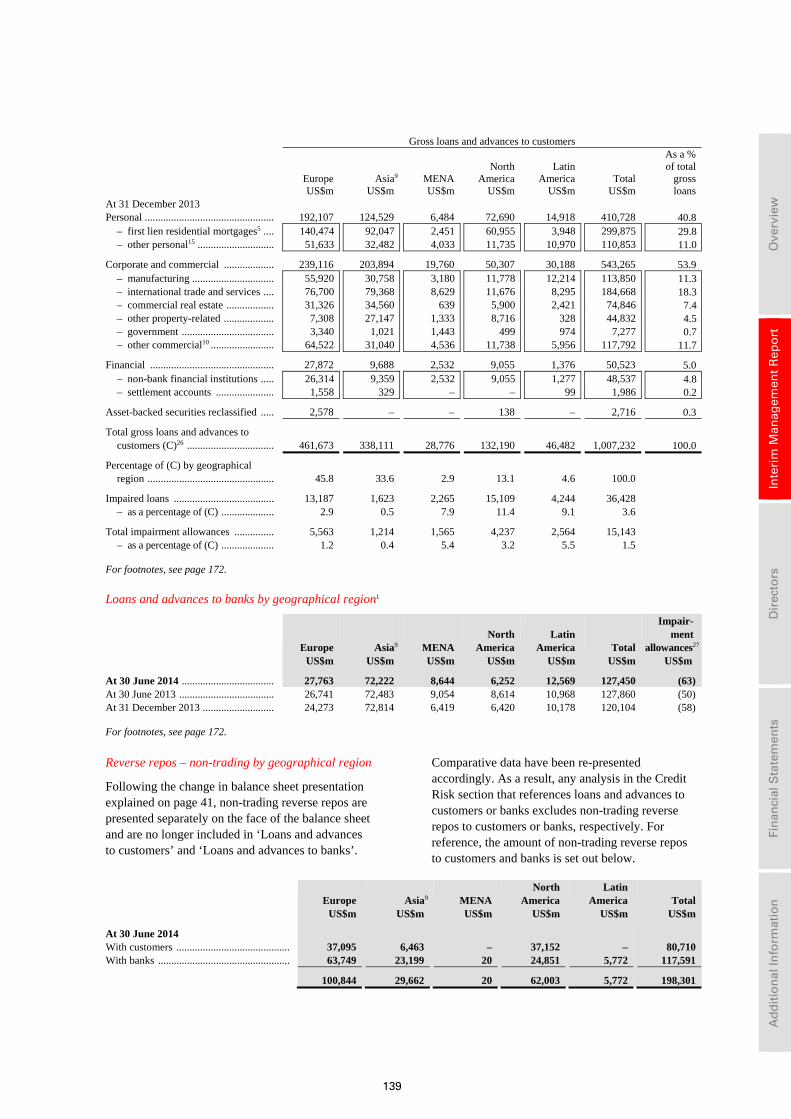
139
Ove
rvie
w
In
teri
m M
anag
emen
t R
epo
rt
D
irec
tors
Fin
anci
al S
tate
men
ts
A
dd
itio
nal
Info
rmat
ion
Gross loans and advances to customers
Europe Asia9 MENA North
America Latin
America Total
As a % of total gross
US$m US$m US$m US$m US$m US$m loansAt 31 December 2013 Personal ................................................. 192,107 124,529 6,484 72,690 14,918 410,728 40.8
– first lien residential mortgages5 .... 140,474 92,047 2,451 60,955 3,948 299,875 29.8– other personal15 ............................. 51,633 32,482 4,033 11,735 10,970 110,853 11.0
Corporate and commercial ................... 239,116 203,894 19,760 50,307 30,188 543,265 53.9– manufacturing ............................... 55,920 30,758 3,180 11,778 12,214 113,850 11.3– international trade and services .... 76,700 79,368 8,629 11,676 8,295 184,668 18.3– commercial real estate .................. 31,326 34,560 639 5,900 2,421 74,846 7.4– other property-related ................... 7,308 27,147 1,333 8,716 328 44,832 4.5– government ................................... 3,340 1,021 1,443 499 974 7,277 0.7– other commercial10 ........................ 64,522 31,040 4,536 11,738 5,956 117,792 11.7
Financial ............................................... 27,872 9,688 2,532 9,055 1,376 50,523 5.0– non-bank financial institutions ..... 26,314 9,359 2,532 9,055 1,277 48,537 4.8– settlement accounts ...................... 1,558 329 – – 99 1,986 0.2
Asset-backed securities reclassified ..... 2,578 – – 138 – 2,716 0.3
Total gross loans and advances to customers (C)26 ................................. 461,673 338,111 28,776 132,190 46,482 1,007,232 100.0
Percentage of (C) by geographical region ................................................ 45.8 33.6 2.9 13.1 4.6 100.0
Impaired loans ...................................... 13,187 1,623 2,265 15,109 4,244 36,428 – as a percentage of (C) .................... 2.9 0.5 7.9 11.4 9.1 3.6
Total impairment allowances ............... 5,563 1,214 1,565 4,237 2,564 15,143 – as a percentage of (C) .................... 1.2 0.4 5.4 3.2 5.5 1.5
For footnotes, see page 172.
Loans and advances to banks by geographical region1
Europe Asia9 MENA North America
Latin America Total
Impair- ment allowances27
US$m US$m US$m US$m US$m US$m US$m
At 30 June 2014 ................................... 27,763 72,222 8,644 6,252 12,569 127,450 (63) At 30 June 2013 .................................... 26,741 72,483 9,054 8,614 10,968 127,860 (50) At 31 December 2013 ........................... 24,273 72,814 6,419 6,420 10,178 120,104 (58)
For footnotes, see page 172.
Reverse repos – non-trading by geographical region
Following the change in balance sheet presentation explained on page 41, non-trading reverse repos are presented separately on the face of the balance sheet and are no longer included in ‘Loans and advances to customers’ and ‘Loans and advances to banks’.
Comparative data have been re-presented accordingly. As a result, any analysis in the Credit Risk section that references loans and advances to customers or banks excludes non-trading reverse repos to customers or banks, respectively. For reference, the amount of non-trading reverse repos to customers and banks is set out below.
Europe Asia9 MENA North America
Latin America Total
US$m US$m US$m US$m US$m US$m
At 30 June 2014 With customers ........................................... 37,095 6,463 – 37,152 – 80,710 With banks .................................................. 63,749 23,199 20 24,851 5,772 117,591
100,844 29,662 20 62,003 5,772 198,301
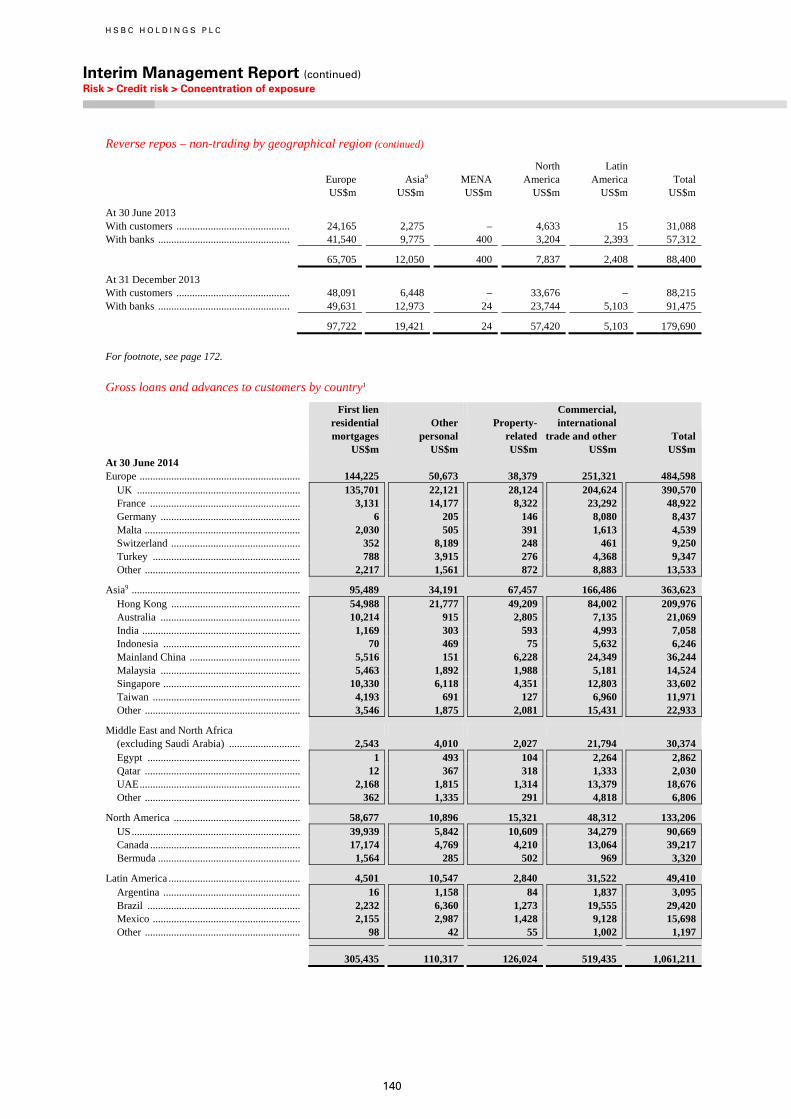
H S B C H O L D I N G S P L C
Interim Management Report (continued) Risk > Credit risk > Concentration of exposure
140
Reverse repos – non-trading by geographical region (continued)
Europe Asia9 MENA North America
Latin America Total
US$m US$m US$m US$m US$m US$m
At 30 June 2013 With customers ........................................... 24,165 2,275 – 4,633 15 31,088 With banks .................................................. 41,540 9,775 400 3,204 2,393 57,312
65,705 12,050 400 7,837 2,408 88,400
At 31 December 2013 With customers ........................................... 48,091 6,448 – 33,676 – 88,215 With banks .................................................. 49,631 12,973 24 23,744 5,103 91,475
97,722 19,421 24 57,420 5,103 179,690
For footnote, see page 172.
Gross loans and advances to customers by country1
First lien residential mortgages US$m
Other personal US$m
Property- related US$m
Commercial, international trade and other US$m
Total US$m
At 30 June 2014 Europe ............................................................. 144,225 50,673 38,379 251,321 484,598
UK .............................................................. 135,701 22,121 28,124 204,624 390,570France ......................................................... 3,131 14,177 8,322 23,292 48,922Germany ..................................................... 6 205 146 8,080 8,437Malta ........................................................... 2,030 505 391 1,613 4,539Switzerland ................................................. 352 8,189 248 461 9,250Turkey ........................................................ 788 3,915 276 4,368 9,347Other ........................................................... 2,217 1,561 872 8,883 13,533
Asia9 ................................................................ 95,489 34,191 67,457 166,486 363,623 Hong Kong ................................................. 54,988 21,777 49,209 84,002 209,976Australia ..................................................... 10,214 915 2,805 7,135 21,069India ............................................................ 1,169 303 593 4,993 7,058Indonesia .................................................... 70 469 75 5,632 6,246Mainland China .......................................... 5,516 151 6,228 24,349 36,244Malaysia ..................................................... 5,463 1,892 1,988 5,181 14,524Singapore .................................................... 10,330 6,118 4,351 12,803 33,602Taiwan ........................................................ 4,193 691 127 6,960 11,971Other ........................................................... 3,546 1,875 2,081 15,431 22,933
Middle East and North Africa (excluding Saudi Arabia) ........................... 2,543 4,010 2,027 21,794 30,374 Egypt .......................................................... 1 493 104 2,264 2,862Qatar ........................................................... 12 367 318 1,333 2,030UAE ............................................................. 2,168 1,815 1,314 13,379 18,676Other ........................................................... 362 1,335 291 4,818 6,806
North America ................................................ 58,677 10,896 15,321 48,312 133,206 US ................................................................ 39,939 5,842 10,609 34,279 90,669Canada ......................................................... 17,174 4,769 4,210 13,064 39,217Bermuda ...................................................... 1,564 285 502 969 3,320
Latin America .................................................. 4,501 10,547 2,840 31,522 49,410 Argentina .................................................... 16 1,158 84 1,837 3,095Brazil .......................................................... 2,232 6,360 1,273 19,555 29,420Mexico ........................................................ 2,155 2,987 1,428 9,128 15,698Other ........................................................... 98 42 55 1,002 1,197
305,435 110,317 126,024 519,435 1,061,211
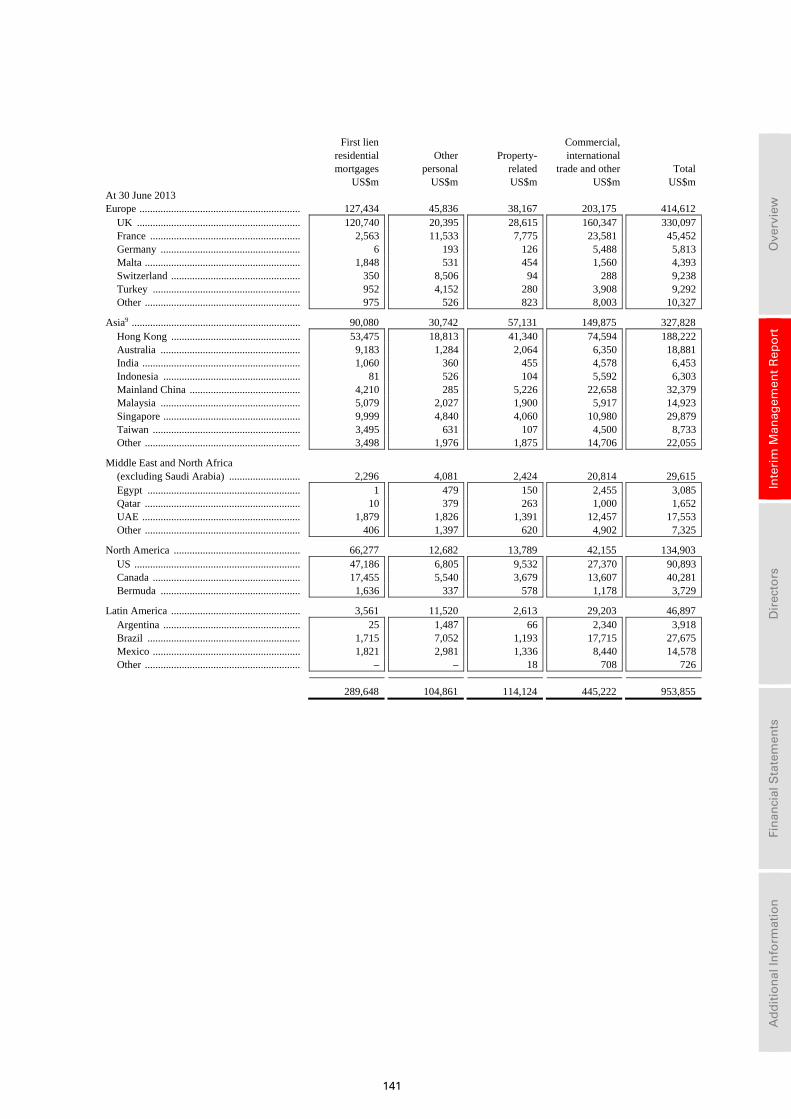
141
Ove
rvie
w
In
teri
m M
anag
emen
t R
epo
rt
D
irec
tors
Fin
anci
al S
tate
men
ts
A
dd
itio
nal
Info
rmat
ion
First lien residential mortgages US$m
Other personal US$m
Property- related US$m
Commercial, international trade and other US$m
Total US$m
At 30 June 2013 Europe ............................................................. 127,434 45,836 38,167 203,175 414,612
UK .............................................................. 120,740 20,395 28,615 160,347 330,097France ......................................................... 2,563 11,533 7,775 23,581 45,452Germany ..................................................... 6 193 126 5,488 5,813Malta ........................................................... 1,848 531 454 1,560 4,393Switzerland ................................................. 350 8,506 94 288 9,238Turkey ........................................................ 952 4,152 280 3,908 9,292Other ........................................................... 975 526 823 8,003 10,327
Asia9 ................................................................ 90,080 30,742 57,131 149,875 327,828 Hong Kong ................................................. 53,475 18,813 41,340 74,594 188,222Australia ..................................................... 9,183 1,284 2,064 6,350 18,881India ............................................................ 1,060 360 455 4,578 6,453Indonesia .................................................... 81 526 104 5,592 6,303Mainland China .......................................... 4,210 285 5,226 22,658 32,379Malaysia ..................................................... 5,079 2,027 1,900 5,917 14,923Singapore .................................................... 9,999 4,840 4,060 10,980 29,879Taiwan ........................................................ 3,495 631 107 4,500 8,733Other ........................................................... 3,498 1,976 1,875 14,706 22,055
Middle East and North Africa (excluding Saudi Arabia) ........................... 2,296 4,081 2,424 20,814 29,615 Egypt .......................................................... 1 479 150 2,455 3,085Qatar ........................................................... 10 379 263 1,000 1,652UAE ............................................................ 1,879 1,826 1,391 12,457 17,553Other ........................................................... 406 1,397 620 4,902 7,325
North America ................................................ 66,277 12,682 13,789 42,155 134,903 US ............................................................... 47,186 6,805 9,532 27,370 90,893Canada ........................................................ 17,455 5,540 3,679 13,607 40,281Bermuda ..................................................... 1,636 337 578 1,178 3,729
Latin America ................................................. 3,561 11,520 2,613 29,203 46,897 Argentina .................................................... 25 1,487 66 2,340 3,918Brazil .......................................................... 1,715 7,052 1,193 17,715 27,675Mexico ........................................................ 1,821 2,981 1,336 8,440 14,578Other ........................................................... – – 18 708 726
289,648 104,861 114,124 445,222 953,855
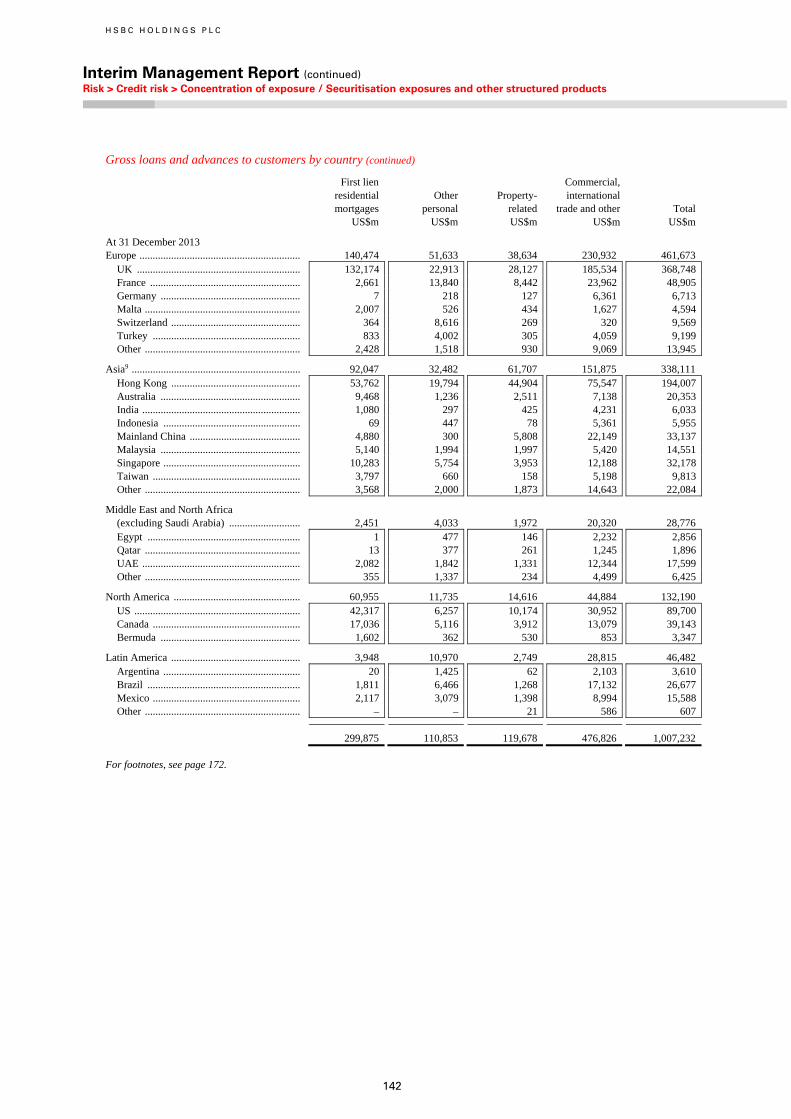
H S B C H O L D I N G S P L C
Interim Management Report (continued) Risk > Credit risk > Concentration of exposure / Securitisation exposures and other structured products
142
Gross loans and advances to customers by country (continued)
First lien residential mortgages US$m
Other personal US$m
Property- related US$m
Commercial, international trade and other US$m
Total US$m
At 31 December 2013 Europe ............................................................. 140,474 51,633 38,634 230,932 461,673
UK .............................................................. 132,174 22,913 28,127 185,534 368,748France ......................................................... 2,661 13,840 8,442 23,962 48,905Germany ..................................................... 7 218 127 6,361 6,713Malta ........................................................... 2,007 526 434 1,627 4,594Switzerland ................................................. 364 8,616 269 320 9,569Turkey ........................................................ 833 4,002 305 4,059 9,199Other ........................................................... 2,428 1,518 930 9,069 13,945
Asia9 ................................................................ 92,047 32,482 61,707 151,875 338,111 Hong Kong ................................................. 53,762 19,794 44,904 75,547 194,007Australia ..................................................... 9,468 1,236 2,511 7,138 20,353India ............................................................ 1,080 297 425 4,231 6,033Indonesia .................................................... 69 447 78 5,361 5,955Mainland China .......................................... 4,880 300 5,808 22,149 33,137Malaysia ..................................................... 5,140 1,994 1,997 5,420 14,551Singapore .................................................... 10,283 5,754 3,953 12,188 32,178Taiwan ........................................................ 3,797 660 158 5,198 9,813Other ........................................................... 3,568 2,000 1,873 14,643 22,084
Middle East and North Africa (excluding Saudi Arabia) ........................... 2,451 4,033 1,972 20,320 28,776 Egypt .......................................................... 1 477 146 2,232 2,856Qatar ........................................................... 13 377 261 1,245 1,896UAE ............................................................ 2,082 1,842 1,331 12,344 17,599Other ........................................................... 355 1,337 234 4,499 6,425
North America ................................................ 60,955 11,735 14,616 44,884 132,190 US ............................................................... 42,317 6,257 10,174 30,952 89,700Canada ........................................................ 17,036 5,116 3,912 13,079 39,143Bermuda ..................................................... 1,602 362 530 853 3,347
Latin America ................................................. 3,948 10,970 2,749 28,815 46,482 Argentina .................................................... 20 1,425 62 2,103 3,610Brazil .......................................................... 1,811 6,466 1,268 17,132 26,677Mexico ........................................................ 2,117 3,079 1,398 8,994 15,588Other ........................................................... – – 21 586 607
299,875 110,853 119,678 476,826 1,007,232
For footnotes, see page 172.
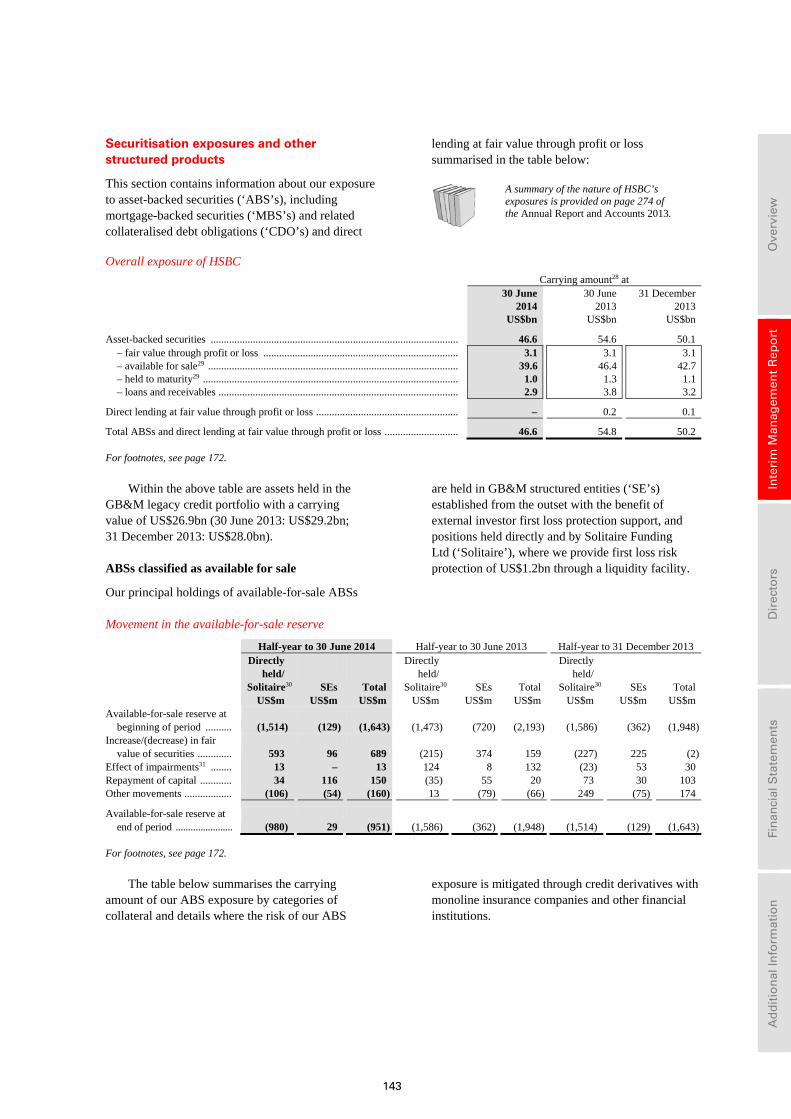
143
Ove
rvie
w
In
teri
m M
anag
emen
t R
epo
rt
D
irec
tors
Fin
anci
al S
tate
men
ts
A
dd
itio
nal
Info
rmat
ion
Securitisation exposures and other structured products
This section contains information about our exposure to asset-backed securities (‘ABS’s), including mortgage-backed securities (‘MBS’s) and related collateralised debt obligations (‘CDO’s) and direct
lending at fair value through profit or loss summarised in the table below:
A summary of the nature of HSBC’s exposures is provided on page 274 of the Annual Report and Accounts 2013.
Overall exposure of HSBC
Carrying amount28 at
30 June 2014
30 June 2013
31 December 2013
US$bn US$bn US$bn
Asset-backed securities .............................................................................................. 46.6 54.6 50.1 – fair value through profit or loss .......................................................................... 3.1 3.1 3.1– available for sale29 ............................................................................................... 39.6 46.4 42.7– held to maturity29 ................................................................................................. 1.0 1.3 1.1– loans and receivables ........................................................................................... 2.9 3.8 3.2
Direct lending at fair value through profit or loss ...................................................... – 0.2 0.1
Total ABSs and direct lending at fair value through profit or loss ............................ 46.6 54.8 50.2
For footnotes, see page 172.
Within the above table are assets held in the GB&M legacy credit portfolio with a carrying value of US$26.9bn (30 June 2013: US$29.2bn; 31 December 2013: US$28.0bn).
ABSs classified as available for sale
Our principal holdings of available-for-sale ABSs
are held in GB&M structured entities (‘SE’s) established from the outset with the benefit of external investor first loss protection support, and positions held directly and by Solitaire Funding Ltd (‘Solitaire’), where we provide first loss risk protection of US$1.2bn through a liquidity facility.
Movement in the available-for-sale reserve
Half-year to 30 June 2014 Half-year to 30 June 2013 Half-year to 31 December 2013
Directly held/ Solitaire30 SEs Total
Directly held/ Solitaire30 SEs Total
Directly held/ Solitaire30 SEs Total
US$m US$m US$m US$m US$m US$m US$m US$m US$m Available-for-sale reserve at
beginning of period .......... (1,514) (129) (1,643) (1,473) (720) (2,193) (1,586) (362) (1,948)Increase/(decrease) in fair
value of securities ............. 593 96 689 (215) 374 159 (227) 225 (2)Effect of impairments31 ........ 13 – 13 124 8 132 (23) 53 30 Repayment of capital ............ 34 116 150 (35) 55 20 73 30 103 Other movements .................. (106) (54) (160) 13 (79) (66) 249 (75) 174
Available-for-sale reserve at end of period ....................... (980) 29 (951) (1,586) (362) (1,948) (1,514) (129) (1,643)
For footnotes, see page 172.
The table below summarises the carrying amount of our ABS exposure by categories of collateral and details where the risk of our ABS
exposure is mitigated through credit derivatives with monoline insurance companies and other financial institutions.
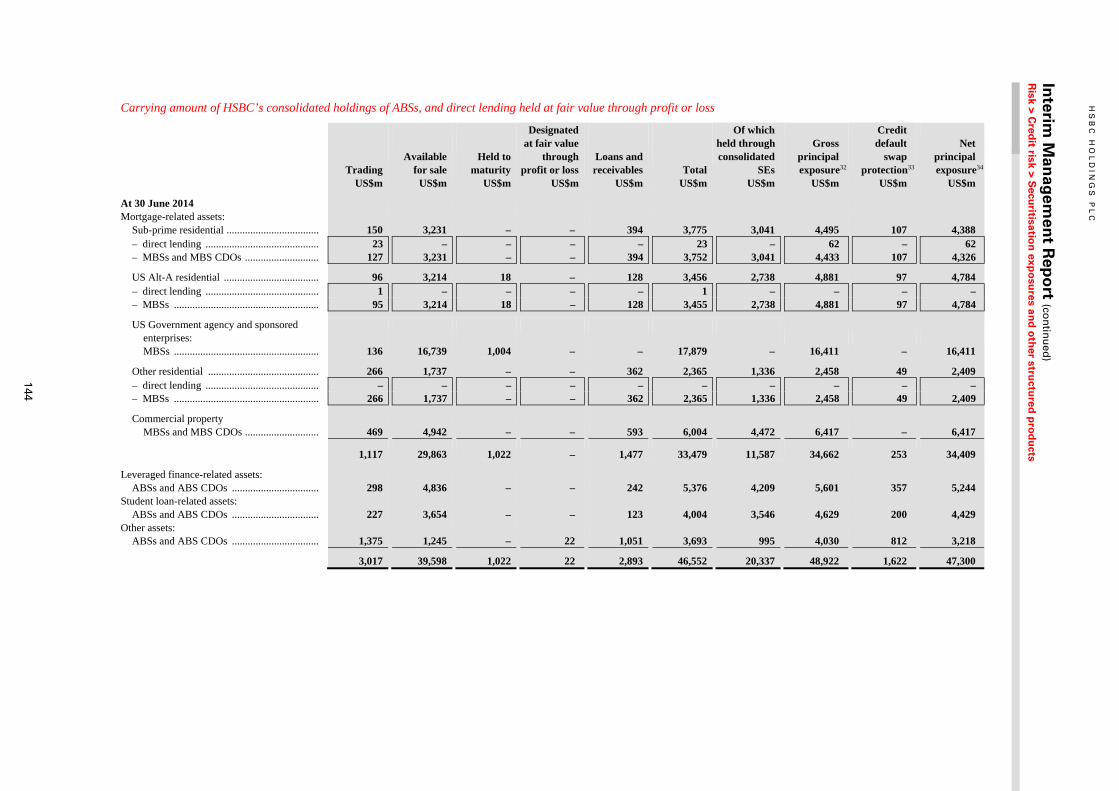
HS
BC
HO
LD
ING
S P
LC
Interim
Man
agem
ent R
epo
rt (con
tinu
ed)
Risk > C
redit risk > S
ecuritisatio
n exp
osu
res and
oth
er structu
red p
rod
ucts
144
Carrying amount of HSBC’s consolidated holdings of ABSs, and direct lending held at fair value through profit or loss
Trading Available for sale
Held to maturity
Designated at fair value through profit or loss
Loans and receivables Total
Of whichheld through consolidated SEs
Gross principal exposure32
Credit default swap protection33
Net principal exposure34
US$m US$m US$m US$m US$m US$m US$m US$m US$m US$m
At 30 June 2014 Mortgage-related assets:
Sub-prime residential ................................... 150 3,231 – – 394 3,775 3,041 4,495 107 4,388 – direct lending ........................................... 23 – – – – 23 – 62 – 62 – MBSs and MBS CDOs ............................ 127 3,231 – – 394 3,752 3,041 4,433 107 4,326
US Alt-A residential .................................... 96 3,214 18 – 128 3,456 2,738 4,881 97 4,784 – direct lending ........................................... 1 – – – – 1 – – – – – MBSs ....................................................... 95 3,214 18 – 128 3,455 2,738 4,881 97 4,784
US Government agency and sponsored enterprises:
MBSs ....................................................... 136 16,739 1,004 – – 17,879 – 16,411 – 16,411
Other residential .......................................... 266 1,737 – – 362 2,365 1,336 2,458 49 2,409 – direct lending ........................................... – – – – – – – – – – – MBSs ....................................................... 266 1,737 – – 362 2,365 1,336 2,458 49 2,409
Commercial property MBSs and MBS CDOs ............................ 469 4,942 – – 593 6,004 4,472 6,417 – 6,417
1,117 29,863 1,022 – 1,477 33,479 11,587 34,662 253 34,409
Leveraged finance-related assets: ABSs and ABS CDOs ................................. 298 4,836 – – 242 5,376 4,209 5,601 357 5,244
Student loan-related assets: ABSs and ABS CDOs ................................. 227 3,654 – – 123 4,004 3,546 4,629 200 4,429
Other assets: ABSs and ABS CDOs ................................. 1,375 1,245 – 22 1,051 3,693 995 4,030 812 3,218
3,017 39,598 1,022 22 2,893 46,552 20,337 48,922 1,622 47,300
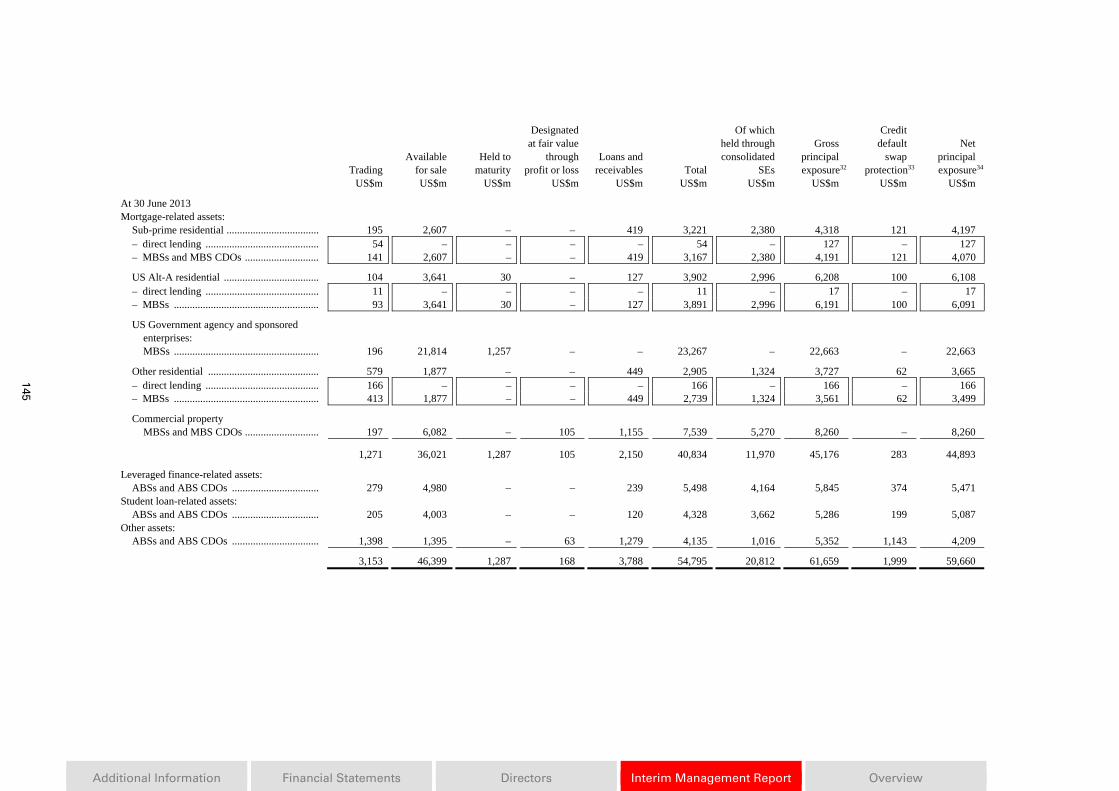
Additional Information Financial Statements Directors Interim Management Report Overview
145
Trading Available for sale
Held to maturity
Designated at fair value through profit or loss
Loans and receivables Total
Of which held through consolidated SEs
Gross principal exposure32
Credit default swap protection33
Net principal exposure34
US$m US$m US$m US$m US$m US$m US$m US$m US$m US$m
At 30 June 2013 Mortgage-related assets:
Sub-prime residential ................................... 195 2,607 – – 419 3,221 2,380 4,318 121 4,197 – direct lending ........................................... 54 – – – – 54 – 127 – 127 – MBSs and MBS CDOs ............................ 141 2,607 – – 419 3,167 2,380 4,191 121 4,070
US Alt-A residential .................................... 104 3,641 30 – 127 3,902 2,996 6,208 100 6,108 – direct lending ........................................... 11 – – – – 11 – 17 – 17 – MBSs ....................................................... 93 3,641 30 – 127 3,891 2,996 6,191 100 6,091
US Government agency and sponsored enterprises:
MBSs ....................................................... 196 21,814 1,257 – – 23,267 – 22,663 – 22,663
Other residential .......................................... 579 1,877 – – 449 2,905 1,324 3,727 62 3,665 – direct lending ........................................... 166 – – – – 166 – 166 – 166 – MBSs ....................................................... 413 1,877 – – 449 2,739 1,324 3,561 62 3,499
Commercial property MBSs and MBS CDOs ............................ 197 6,082 – 105 1,155 7,539 5,270 8,260 – 8,260
1,271 36,021 1,287 105 2,150 40,834 11,970 45,176 283 44,893
Leveraged finance-related assets: ABSs and ABS CDOs ................................. 279 4,980 – – 239 5,498 4,164 5,845 374 5,471
Student loan-related assets: ABSs and ABS CDOs ................................. 205 4,003 – – 120 4,328 3,662 5,286 199 5,087
Other assets: ABSs and ABS CDOs ................................. 1,398 1,395 – 63 1,279 4,135 1,016 5,352 1,143 4,209
3,153 46,399 1,287 168 3,788 54,795 20,812 61,659 1,999 59,660
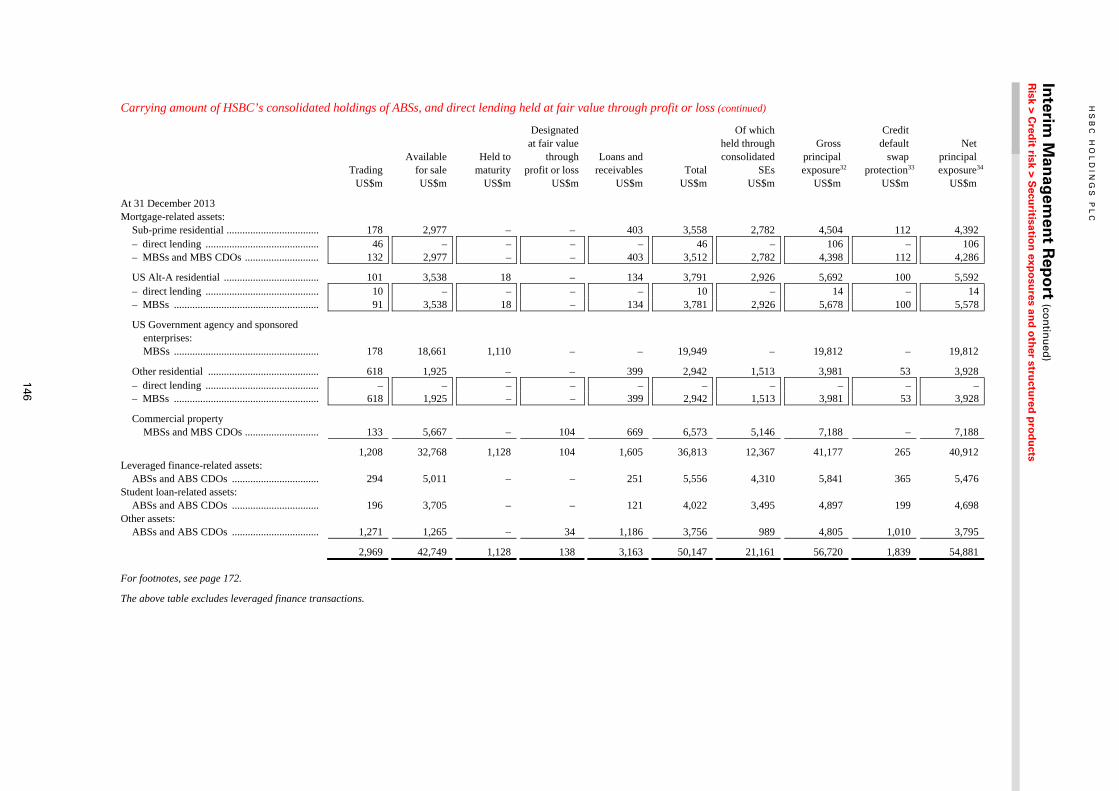
HS
BC
HO
LD
ING
S P
LC
Interim
Man
agem
ent R
epo
rt (con
tinu
ed)
Risk > C
redit risk > S
ecuritisatio
n exp
osu
res and
oth
er structu
red p
rod
ucts
146
Carrying amount of HSBC’s consolidated holdings of ABSs, and direct lending held at fair value through profit or loss (continued)
Trading Available for sale
Held to maturity
Designated at fair value through profit or loss
Loans and receivables Total
Of which held through consolidated SEs
Gross principal exposure32
Credit default swap protection33
Net principal exposure34
US$m US$m US$m US$m US$m US$m US$m US$m US$m US$m
At 31 December 2013 Mortgage-related assets:
Sub-prime residential ................................... 178 2,977 – – 403 3,558 2,782 4,504 112 4,392 – direct lending ........................................... 46 – – – – 46 – 106 – 106– MBSs and MBS CDOs ............................ 132 2,977 – – 403 3,512 2,782 4,398 112 4,286
US Alt-A residential .................................... 101 3,538 18 – 134 3,791 2,926 5,692 100 5,592 – direct lending ........................................... 10 – – – – 10 – 14 – 14– MBSs ....................................................... 91 3,538 18 – 134 3,781 2,926 5,678 100 5,578
US Government agency and sponsored enterprises:
MBSs ....................................................... 178 18,661 1,110 – – 19,949 – 19,812 – 19,812
Other residential .......................................... 618 1,925 – – 399 2,942 1,513 3,981 53 3,928 – direct lending ........................................... – – – – – – – – – –– MBSs ....................................................... 618 1,925 – – 399 2,942 1,513 3,981 53 3,928
Commercial property MBSs and MBS CDOs ............................ 133 5,667 – 104 669 6,573 5,146 7,188 – 7,188
1,208 32,768 1,128 104 1,605 36,813 12,367 41,177 265 40,912 Leveraged finance-related assets:
ABSs and ABS CDOs ................................. 294 5,011 – – 251 5,556 4,310 5,841 365 5,476 Student loan-related assets:
ABSs and ABS CDOs ................................. 196 3,705 – – 121 4,022 3,495 4,897 199 4,698 Other assets:
ABSs and ABS CDOs ................................. 1,271 1,265 – 34 1,186 3,756 989 4,805 1,010 3,795
2,969 42,749 1,128 138 3,163 50,147 21,161 56,720 1,839 54,881
For footnotes, see page 172.
The above table excludes leveraged finance transactions.
147
Ove
rvie
w
In
teri
m M
anag
emen
t R
epo
rt
D
irec
tors
Fin
anci
al S
tate
men
ts
A
dd
itio
nal
Info
rmat
ion
Representations and warranties related to mortgage sales and securitisation activities
We have been involved in various activities related to the sale and securitisation of residential mortgages, that are not recognised on our balance sheet. These activities include:
• the purchase of US$24bn of third-party originated mortgages by HSBC Bank USA and the securitisation of these by HSBC Securities (USA) Inc. (‘HSI’) between 2005 and 2007;
• HSI acting as underwriter for third-party issuance of private label MBSs with an original issuance value of US$37bn, most of which were sub-prime; and
• the origination and sale by HSBC Bank USA of mortgage loans, primarily to government sponsored entities.
In selling and securitising mortgage loans, various representations and warranties may be made to purchasers of the mortgage loans and MBSs. When purchasing and securitising mortgages originated by third-parties and underwriting third-party MBSs, the obligation to repurchase loans in the event of a breach of loan level representations and warranties resides predominantly with the organisation that originated the loan.
Participants in the US mortgage securitisation market that purchased and repackaged whole loans, such as servicers, originators, underwriters, trustees or sponsors of securitisations have been the subject of lawsuits and governmental and regulatory investigations and inquiries. Further details are provided in Note 25 on the Financial Statements.
At 30 June 2014, a liability of US$34m (30 June 2013: US$217m; 31 December 2013: US$99m) was recognised in respect of various representations and warranties relating to the origination and sale by HSBC Bank USA of mortgage loans, primarily to government sponsored entities. These relate to, among other things, the ownership of the loans, the validity of the liens, the loan selection and origination process, and compliance with the origination criteria established by the agencies. In the event of a breach of its representations and warranties, HSBC Bank USA may be obliged to repurchase the loans with identified defects or to indemnify the buyers. The estimated liability was based on the level of outstanding repurchase demands, the level of outstanding requests for loan files and the expected future repurchase demands in respect of mortgages sold to date which were either two or more payments delinquent or might become delinquent at an estimated conversion rate. Repurchase demands of US$3m were outstanding at 30 June 2014 (30 June 2013: US$53m; 31 December 2013: US$44m).
H S B C H O L D I N G S P L C
Interim Management Report (continued) Risk > Liquidity and funding > In 1H14 / Management of risk
148
Liquidity and funding
Liquidity and funding in the first half of 2014 ............... 148 Customer deposit markets ................................................... 148 Wholesale funding markets ................................................. 149 Liquidity regulation ............................................................. 149
Management of liquidity and funding risk ..................... 149 Advances to core funding ratio ............................................ 149 Advances to core funding ratios ............................................ 149Stressed coverage ratios ...................................................... 149 Stressed one-month and three-month coverage ratios .......... 150Liquid assets of HSBC’s principal operating entities ......... 150 Liquid assets of HSBC’s principal entities ............................ 150Net contractual cash flows ................................................... 151 Net cash flows for interbank and intra-Group loans and
deposits and reverse repo, repo and short positions ........ 151
Contingent liquidity risk arising from committed lending facilities ............................................................. 152
The Group’s contractual undrawn exposures monitored under the contingent liquidity risk limit structure ............ 152
Sources of funding ............................................................. 152 Consolidated funding sources and uses ................................ 153Repos and stock lending ...................................................... 153 Cross-border, intra-Group and cross-currency liquidity
and funding risk ............................................................... 154
Wholesale term debt maturity profile ............................. 154 Wholesale funding principal cash flows payable by HSBC under financial liabilities by remaining contractual maturities ........................................................................... 155
Liquidity risk is the risk that the Group does not have sufficient financial resources to meet its obligations as they fall due, or will have to do so at an excessive cost. The risk arises from mismatches in the timing of cash flows.
There were no material changes to our policies and practices for the management of liquidity and funding risks in the first half of 2014.
Following the change in balance sheet presentation explained on page 41, the advances to deposits ratio now excludes non-trading reverse repos and repos with customers. The change had no effect on the 31 December 2013 ratio as disclosed.
A summary of our current policies and practices regarding liquidity and funding is provided on page 276 of the Annual Report and Accounts 2013.
Our liquidity and funding risk management framework
The objective of our liquidity framework is to allow us to withstand very severe liquidity stresses. It is designed to be adaptable to changing business models, markets and regulations.
Our liquidity and funding risk management framework requires:
• liquidity to be managed by operating entities on a stand-alone basis with no implicit reliance on the Group or central banks;
• all operating entities to comply with their limits for the advances to core funding ratio; and
• all operating entities to maintain a positive stressed cash flow position out to three months under prescribed Group stress scenarios.
Further details of the metrics are provided on page 276 of the Annual Report and Accounts 2013.
Liquidity and funding in the first half of 2014
The liquidity position of the Group remained strong in the first half of 2014, as demonstrated by the key liquidity and funding metrics presented below. During the first half of 2014, customer accounts increased by 4% (US$54bn) while loans and advances to customers increased by 6% (US$55bn), leading to a small increase in our advances to deposits ratio to 74% (30 June 2013: 74%; 31 December 2013: 73%).
Customer deposit markets
Retail Banking and Wealth Management: RBWM customer balances increased by 3% in the first half of 2014, primarily reflecting strong growth in the two home markets of the UK and Hong Kong, and in the rest of Asia. This growth was partially offset by reductions in deposit balances in North America.
Commercial Banking: Customer accounts rose by 3% in the first half of 2014, notably in Asia and Europe reflecting higher balances in our Payments and Cash Management business.
Global Banking and Markets: Customer accounts increased by 10% in the first half of 2014, notably in Asia and Europe. In Europe the increase was mainly due to a rise in corporate overdraft balances in accounts which are structured to allow customer corporate treasury functions to benefit from net interest arrangements but where net settlement is not intended to occur. In Asia, customers account balances increased, reflecting growth in our Payments and Cash Management business.
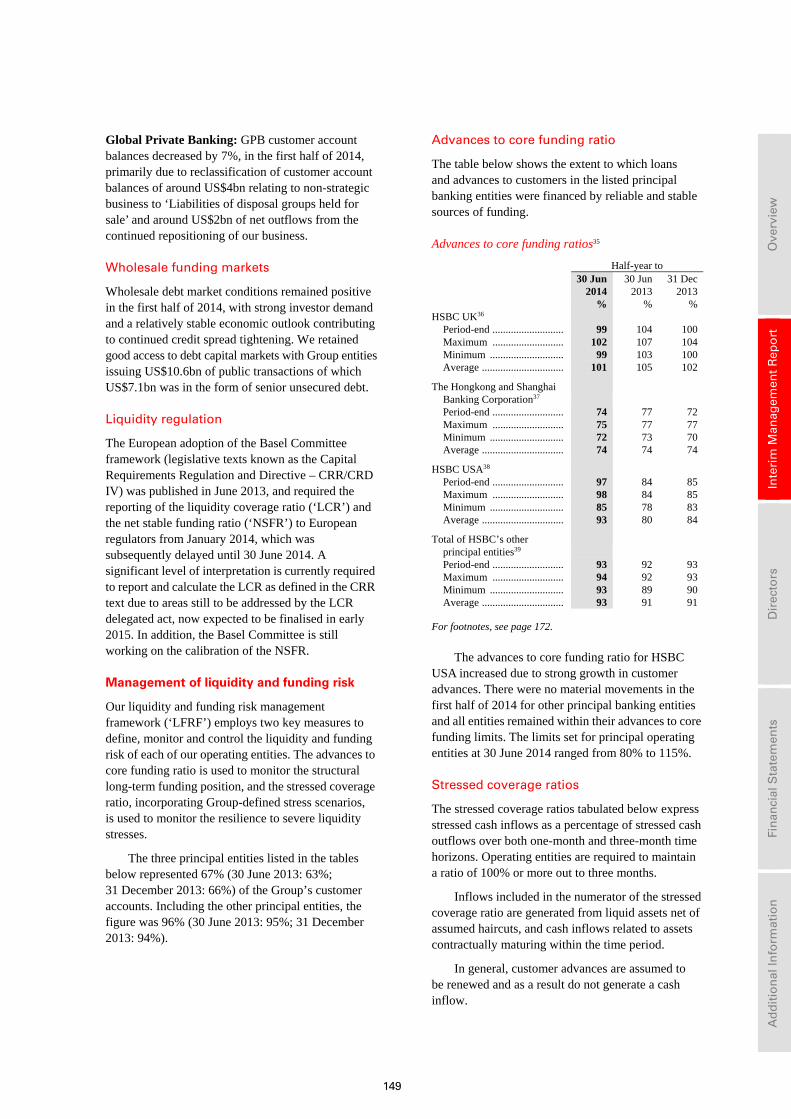
149
Ove
rvie
w
In
teri
m M
anag
emen
t R
epo
rt
D
irec
tors
Fin
anci
al S
tate
men
ts
A
dd
itio
nal
Info
rmat
ion
Global Private Banking: GPB customer account balances decreased by 7%, in the first half of 2014, primarily due to reclassification of customer account balances of around US$4bn relating to non-strategic business to ‘Liabilities of disposal groups held for sale’ and around US$2bn of net outflows from the continued repositioning of our business.
Wholesale funding markets
Wholesale debt market conditions remained positive in the first half of 2014, with strong investor demand and a relatively stable economic outlook contributing to continued credit spread tightening. We retained good access to debt capital markets with Group entities issuing US$10.6bn of public transactions of which US$7.1bn was in the form of senior unsecured debt.
Liquidity regulation
The European adoption of the Basel Committee framework (legislative texts known as the Capital Requirements Regulation and Directive – CRR/CRD IV) was published in June 2013, and required the reporting of the liquidity coverage ratio (‘LCR’) and the net stable funding ratio (‘NSFR’) to European regulators from January 2014, which was subsequently delayed until 30 June 2014. A significant level of interpretation is currently required to report and calculate the LCR as defined in the CRR text due to areas still to be addressed by the LCR delegated act, now expected to be finalised in early 2015. In addition, the Basel Committee is still working on the calibration of the NSFR.
Management of liquidity and funding risk
Our liquidity and funding risk management framework (‘LFRF’) employs two key measures to define, monitor and control the liquidity and funding risk of each of our operating entities. The advances to core funding ratio is used to monitor the structural long-term funding position, and the stressed coverage ratio, incorporating Group-defined stress scenarios, is used to monitor the resilience to severe liquidity stresses.
The three principal entities listed in the tables below represented 67% (30 June 2013: 63%; 31 December 2013: 66%) of the Group’s customer accounts. Including the other principal entities, the figure was 96% (30 June 2013: 95%; 31 December 2013: 94%).
Advances to core funding ratio
The table below shows the extent to which loans and advances to customers in the listed principal banking entities were financed by reliable and stable sources of funding.
Advances to core funding ratios35
Half-year to
30 Jun 2014
30 Jun 2013
31 Dec 2013
% % %HSBC UK36
Period-end ........................... 99 104 100 Maximum ........................... 102 107 104Minimum ............................ 99 103 100Average ............................... 101 105 102
The Hongkong and Shanghai Banking Corporation37
Period-end ........................... 74 77 72 Maximum ........................... 75 77 77Minimum ............................ 72 73 70Average ............................... 74 74 74
HSBC USA38 Period-end ........................... 97 84 85Maximum ........................... 98 84 85 Minimum ............................ 85 78 83Average ............................... 93 80 84
Total of HSBC’s other principal entities39
Period-end ........................... 93 92 93Maximum ........................... 94 92 93 Minimum ............................ 93 89 90Average ............................... 93 91 91
For footnotes, see page 172.
The advances to core funding ratio for HSBC USA increased due to strong growth in customer advances. There were no material movements in the first half of 2014 for other principal banking entities and all entities remained within their advances to core funding limits. The limits set for principal operating entities at 30 June 2014 ranged from 80% to 115%.
Stressed coverage ratios
The stressed coverage ratios tabulated below express stressed cash inflows as a percentage of stressed cash outflows over both one-month and three-month time horizons. Operating entities are required to maintain a ratio of 100% or more out to three months.
Inflows included in the numerator of the stressed coverage ratio are generated from liquid assets net of assumed haircuts, and cash inflows related to assets contractually maturing within the time period.
In general, customer advances are assumed to be renewed and as a result do not generate a cash inflow.
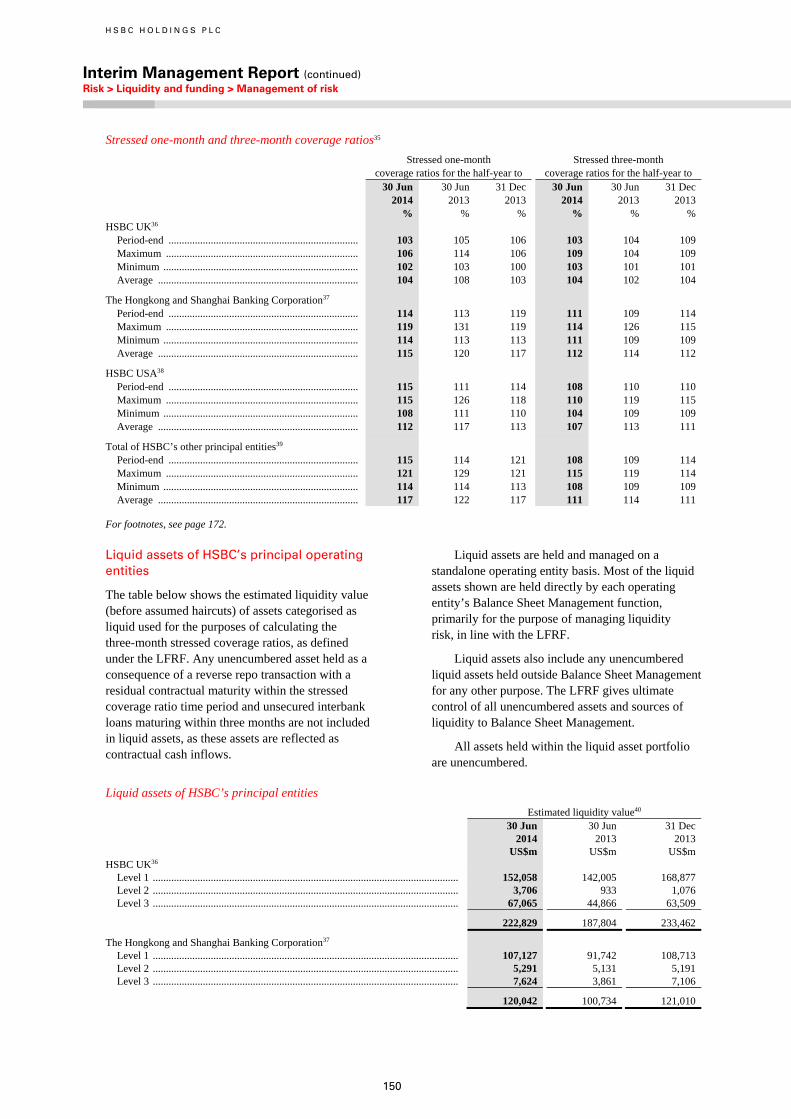
H S B C H O L D I N G S P L C
Interim Management Report (continued) Risk > Liquidity and funding > Management of risk
150
Stressed one-month and three-month coverage ratios35
Stressed one-month
coverage ratios for the half-year to Stressed three-month
coverage ratios for the half-year to 30 Jun 30 Jun 31 Dec 30 Jun 30 Jun 31 Dec 2014 2013 2013 2014 2013 2013 % % % % % % HSBC UK36
Period-end ........................................................................ 103 105 106 103 104 109 Maximum ......................................................................... 106 114 106 109 104 109 Minimum .......................................................................... 102 103 100 103 101 101 Average ............................................................................ 104 108 103 104 102 104
The Hongkong and Shanghai Banking Corporation37 Period-end ........................................................................ 114 113 119 111 109 114 Maximum ......................................................................... 119 131 119 114 126 115 Minimum .......................................................................... 114 113 113 111 109 109 Average ............................................................................ 115 120 117 112 114 112
HSBC USA38 Period-end ........................................................................ 115 111 114 108 110 110 Maximum ......................................................................... 115 126 118 110 119 115 Minimum .......................................................................... 108 111 110 104 109 109 Average ............................................................................ 112 117 113 107 113 111
Total of HSBC’s other principal entities39 Period-end ........................................................................ 115 114 121 108 109 114 Maximum ......................................................................... 121 129 121 115 119 114 Minimum .......................................................................... 114 114 113 108 109 109 Average ............................................................................ 117 122 117 111 114 111
For footnotes, see page 172.
Liquid assets of HSBC’s principal operating entities
The table below shows the estimated liquidity value (before assumed haircuts) of assets categorised as liquid used for the purposes of calculating the three-month stressed coverage ratios, as defined under the LFRF. Any unencumbered asset held as a consequence of a reverse repo transaction with a residual contractual maturity within the stressed coverage ratio time period and unsecured interbank loans maturing within three months are not included in liquid assets, as these assets are reflected as contractual cash inflows.
Liquid assets are held and managed on a standalone operating entity basis. Most of the liquid assets shown are held directly by each operating entity’s Balance Sheet Management function, primarily for the purpose of managing liquidity risk, in line with the LFRF.
Liquid assets also include any unencumbered liquid assets held outside Balance Sheet Management for any other purpose. The LFRF gives ultimate control of all unencumbered assets and sources of liquidity to Balance Sheet Management.
All assets held within the liquid asset portfolio are unencumbered.
Liquid assets of HSBC’s principal entities
Estimated liquidity value40
30 Jun 2014
30 Jun 2013
31 Dec 2013
US$m US$m US$m HSBC UK36
Level 1 .................................................................................................................... 152,058 142,005 168,877 Level 2 .................................................................................................................... 3,706 933 1,076 Level 3 .................................................................................................................... 67,065 44,866 63,509
222,829 187,804 233,462
The Hongkong and Shanghai Banking Corporation37 Level 1 .................................................................................................................... 107,127 91,742 108,713 Level 2 .................................................................................................................... 5,291 5,131 5,191 Level 3 .................................................................................................................... 7,624 3,861 7,106
120,042 100,734 121,010
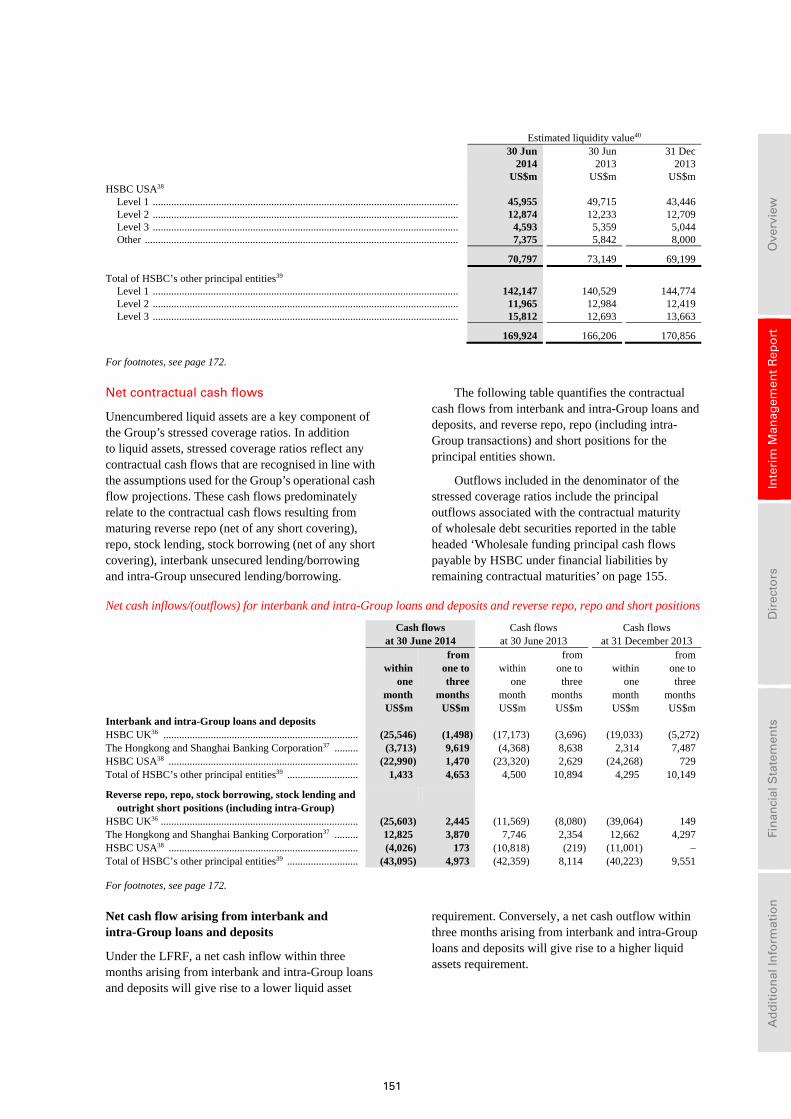
151
Ove
rvie
w
In
teri
m M
anag
emen
t R
epo
rt
D
irec
tors
Fin
anci
al S
tate
men
ts
A
dd
itio
nal
Info
rmat
ion
Estimated liquidity value40
30 Jun 2014
30 Jun 2013
31 Dec 2013
US$m US$m US$mHSBC USA38
Level 1 .................................................................................................................... 45,955 49,715 43,446 Level 2 .................................................................................................................... 12,874 12,233 12,709Level 3 .................................................................................................................... 4,593 5,359 5,044Other ....................................................................................................................... 7,375 5,842 8,000
70,797 73,149 69,199
Total of HSBC’s other principal entities39 Level 1 .................................................................................................................... 142,147 140,529 144,774 Level 2 .................................................................................................................... 11,965 12,984 12,419Level 3 .................................................................................................................... 15,812 12,693 13,663
169,924 166,206 170,856
For footnotes, see page 172.
Net contractual cash flows
Unencumbered liquid assets are a key component of the Group’s stressed coverage ratios. In addition to liquid assets, stressed coverage ratios reflect any contractual cash flows that are recognised in line with the assumptions used for the Group’s operational cash flow projections. These cash flows predominately relate to the contractual cash flows resulting from maturing reverse repo (net of any short covering), repo, stock lending, stock borrowing (net of any short covering), interbank unsecured lending/borrowing and intra-Group unsecured lending/borrowing.
The following table quantifies the contractual cash flows from interbank and intra-Group loans and deposits, and reverse repo, repo (including intra- Group transactions) and short positions for the principal entities shown.
Outflows included in the denominator of the stressed coverage ratios include the principal outflows associated with the contractual maturity of wholesale debt securities reported in the table headed ‘Wholesale funding principal cash flows payable by HSBC under financial liabilities by remaining contractual maturities’ on page 155.
Net cash inflows/(outflows) for interbank and intra-Group loans and deposits and reverse repo, repo and short positions
Cash flows Cash flows Cash flows at 30 June 2014 at 30 June 2013 at 31 December 2013
within one month
from one to three months
within one month
from one to three months
within one month
from one to three months
US$m US$m US$m US$m US$m US$m Interbank and intra-Group loans and deposits HSBC UK36 .......................................................................... (25,546) (1,498) (17,173) (3,696) (19,033) (5,272)The Hongkong and Shanghai Banking Corporation37 ......... (3,713) 9,619 (4,368) 8,638 2,314 7,487 HSBC USA38 ........................................................................ (22,990) 1,470 (23,320) 2,629 (24,268) 729 Total of HSBC’s other principal entities39 ........................... 1,433 4,653 4,500 10,894 4,295 10,149
Reverse repo, repo, stock borrowing, stock lending and outright short positions (including intra-Group)
HSBC UK36 ........................................................................... (25,603) 2,445 (11,569) (8,080) (39,064) 149 The Hongkong and Shanghai Banking Corporation37 ......... 12,825 3,870 7,746 2,354 12,662 4,297 HSBC USA38 ........................................................................ (4,026) 173 (10,818) (219) (11,001) – Total of HSBC’s other principal entities39 ........................... (43,095) 4,973 (42,359) 8,114 (40,223) 9,551
For footnotes, see page 172.
Net cash flow arising from interbank and intra-Group loans and deposits
Under the LFRF, a net cash inflow within three months arising from interbank and intra-Group loans and deposits will give rise to a lower liquid asset
requirement. Conversely, a net cash outflow within three months arising from interbank and intra-Group loans and deposits will give rise to a higher liquid assets requirement.
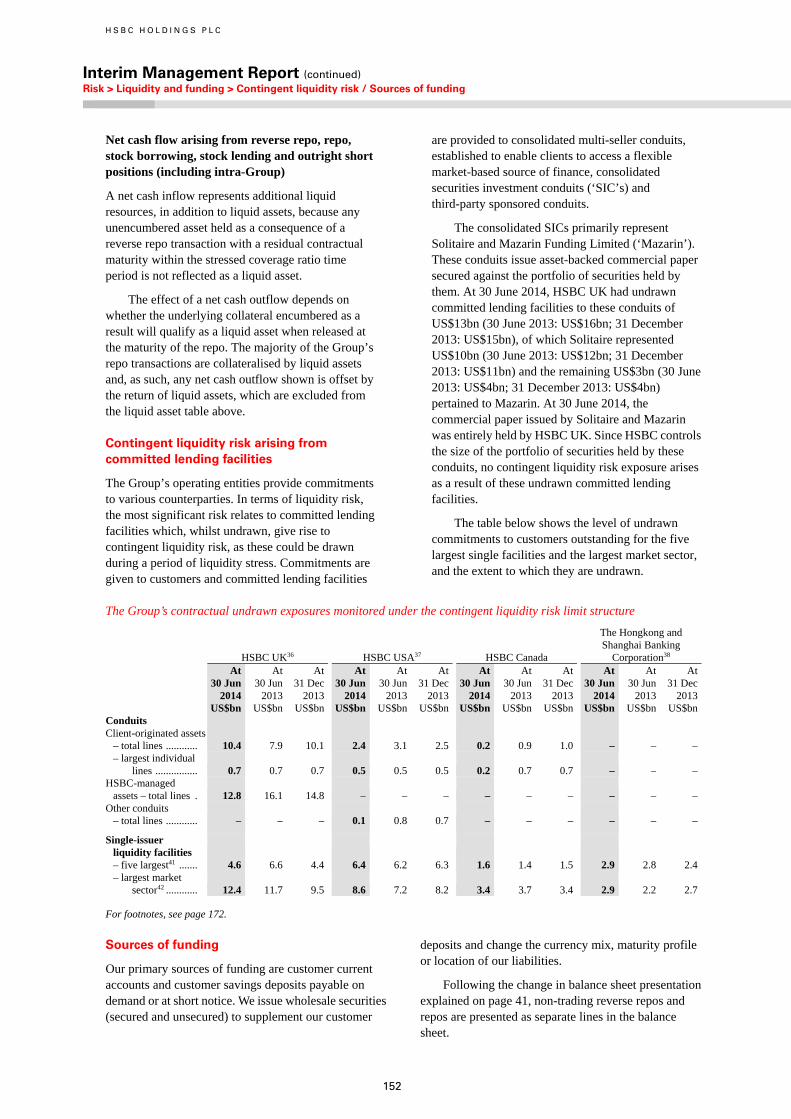
H S B C H O L D I N G S P L C
Interim Management Report (continued) Risk > Liquidity and funding > Contingent liquidity risk / Sources of funding
152
Net cash flow arising from reverse repo, repo, stock borrowing, stock lending and outright short positions (including intra-Group)
A net cash inflow represents additional liquid resources, in addition to liquid assets, because any unencumbered asset held as a consequence of a reverse repo transaction with a residual contractual maturity within the stressed coverage ratio time period is not reflected as a liquid asset.
The effect of a net cash outflow depends on whether the underlying collateral encumbered as a result will qualify as a liquid asset when released at the maturity of the repo. The majority of the Group’s repo transactions are collateralised by liquid assets and, as such, any net cash outflow shown is offset by the return of liquid assets, which are excluded from the liquid asset table above.
Contingent liquidity risk arising from committed lending facilities
The Group’s operating entities provide commitments to various counterparties. In terms of liquidity risk, the most significant risk relates to committed lending facilities which, whilst undrawn, give rise to contingent liquidity risk, as these could be drawn during a period of liquidity stress. Commitments are given to customers and committed lending facilities
are provided to consolidated multi-seller conduits, established to enable clients to access a flexible market-based source of finance, consolidated securities investment conduits (‘SIC’s) and third-party sponsored conduits.
The consolidated SICs primarily represent Solitaire and Mazarin Funding Limited (‘Mazarin’). These conduits issue asset-backed commercial paper secured against the portfolio of securities held by them. At 30 June 2014, HSBC UK had undrawn committed lending facilities to these conduits of US$13bn (30 June 2013: US$16bn; 31 December 2013: US$15bn), of which Solitaire represented US$10bn (30 June 2013: US$12bn; 31 December 2013: US$11bn) and the remaining US$3bn (30 June 2013: US$4bn; 31 December 2013: US$4bn) pertained to Mazarin. At 30 June 2014, the commercial paper issued by Solitaire and Mazarin was entirely held by HSBC UK. Since HSBC controls the size of the portfolio of securities held by these conduits, no contingent liquidity risk exposure arises as a result of these undrawn committed lending facilities.
The table below shows the level of undrawn commitments to customers outstanding for the five largest single facilities and the largest market sector, and the extent to which they are undrawn.
The Group’s contractual undrawn exposures monitored under the contingent liquidity risk limit structure
HSBC UK36 HSBC USA37 HSBC Canada
The Hongkong and Shanghai Banking
Corporation38
At 30 Jun 2014
At 30 Jun 2013
At 31 Dec 2013
At 30 Jun 2014
At 30 Jun
2013
At 31 Dec
2013
At 30 Jun 2014
At 30 Jun
2013
At 31 Dec
2013
At 30 Jun 2014
At 30 Jun 2013
At 31 Dec
2013 US$bn US$bn US$bn US$bn US$bn US$bn US$bn US$bn US$bn US$bn US$bn US$bnConduits Client-originated assets
– total lines ............ 10.4 7.9 10.1 2.4 3.1 2.5 0.2 0.9 1.0 – – –– largest individual
lines ................ 0.7 0.7 0.7 0.5 0.5 0.5 0.2 0.7 0.7 – – –HSBC-managed
assets – total lines . 12.8 16.1 14.8 – – – – – – – – –Other conduits
– total lines ............ – – – 0.1 0.8 0.7 – – – – – –
Single-issuer liquidity facilities – five largest41 ....... 4.6 6.6 4.4 6.4 6.2 6.3 1.6 1.4 1.5 2.9 2.8 2.4– largest market
sector42 ............ 12.4 11.7 9.5 8.6 7.2 8.2 3.4 3.7 3.4 2.9 2.2 2.7
For footnotes, see page 172.
Sources of funding
Our primary sources of funding are customer current accounts and customer savings deposits payable on demand or at short notice. We issue wholesale securities (secured and unsecured) to supplement our customer
deposits and change the currency mix, maturity profile or location of our liabilities.
Following the change in balance sheet presentation explained on page 41, non-trading reverse repos and repos are presented as separate lines in the balance sheet.
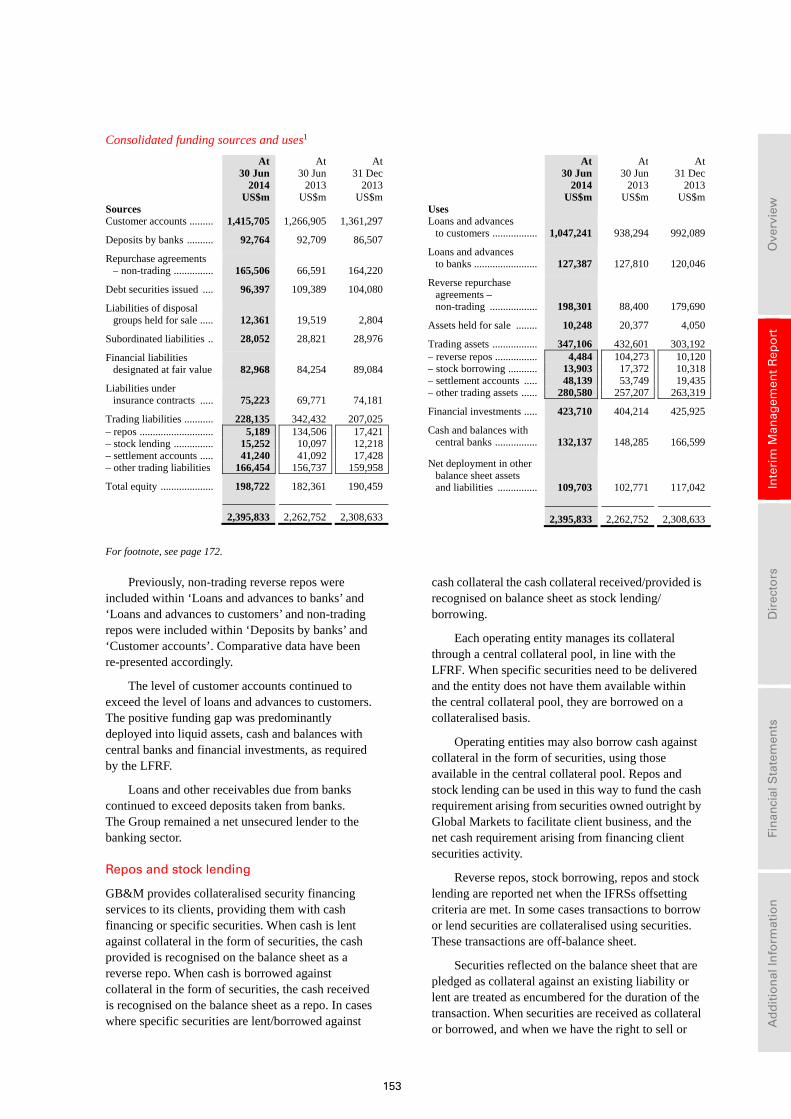
153
Ove
rvie
w
In
teri
m M
anag
emen
t R
epo
rt
D
irec
tors
Fin
anci
al S
tate
men
ts
A
dd
itio
nal
Info
rmat
ion
Consolidated funding sources and uses1
At At At 30 Jun 30 Jun 31 Dec 2014 2013 2013 US$m US$m US$mSources Customer accounts ......... 1,415,705 1,266,905 1,361,297
Deposits by banks .......... 92,764 92,709 86,507
Repurchase agreements – non-trading ............... 165,506 66,591 164,220
Debt securities issued .... 96,397 109,389 104,080
Liabilities of disposal groups held for sale ..... 12,361 19,519 2,804
Subordinated liabilities .. 28,052 28,821 28,976
Financial liabilities designated at fair value 82,968 84,254 89,084
Liabilities under insurance contracts ..... 75,223 69,771 74,181
Trading liabilities ........... 228,135 342,432 207,025– repos ............................ 5,189 134,506 17,421– stock lending ............... 15,252 10,097 12,218– settlement accounts ..... 41,240 41,092 17,428– other trading liabilities 166,454 156,737 159,958
Total equity .................... 198,722 182,361 190,459
2,395,833 2,262,752 2,308,633
At At At30 Jun 30 Jun 31 Dec
2014 2013 2013 US$m US$m US$mUses Loans and advances
to customers ................. 1,047,241 938,294 992,089
Loans and advances to banks ........................ 127,387 127,810 120,046
Reverse repurchase agreements – non-trading .................. 198,301 88,400 179,690
Assets held for sale ........ 10,248 20,377 4,050
Trading assets ................. 347,106 432,601 303,192– reverse repos ................ 4,484 104,273 10,120– stock borrowing ........... 13,903 17,372 10,318– settlement accounts ..... 48,139 53,749 19,435– other trading assets ...... 280,580 257,207 263,319
Financial investments ..... 423,710 404,214 425,925
Cash and balances with central banks ................ 132,137 148,285 166,599
Net deployment in other balance sheet assets and liabilities ............... 109,703 102,771 117,042
2,395,833 2,262,752 2,308,633
For footnote, see page 172.
Previously, non-trading reverse repos were included within ‘Loans and advances to banks’ and ‘Loans and advances to customers’ and non-trading repos were included within ‘Deposits by banks’ and ‘Customer accounts’. Comparative data have been re-presented accordingly.
The level of customer accounts continued to exceed the level of loans and advances to customers. The positive funding gap was predominantly deployed into liquid assets, cash and balances with central banks and financial investments, as required by the LFRF.
Loans and other receivables due from banks continued to exceed deposits taken from banks. The Group remained a net unsecured lender to the banking sector.
Repos and stock lending
GB&M provides collateralised security financing services to its clients, providing them with cash financing or specific securities. When cash is lent against collateral in the form of securities, the cash provided is recognised on the balance sheet as a reverse repo. When cash is borrowed against collateral in the form of securities, the cash received is recognised on the balance sheet as a repo. In cases where specific securities are lent/borrowed against
cash collateral the cash collateral received/provided is recognised on balance sheet as stock lending/ borrowing.
Each operating entity manages its collateral through a central collateral pool, in line with the LFRF. When specific securities need to be delivered and the entity does not have them available within the central collateral pool, they are borrowed on a collateralised basis.
Operating entities may also borrow cash against collateral in the form of securities, using those available in the central collateral pool. Repos and stock lending can be used in this way to fund the cash requirement arising from securities owned outright by Global Markets to facilitate client business, and the net cash requirement arising from financing client securities activity.
Reverse repos, stock borrowing, repos and stock lending are reported net when the IFRSs offsetting criteria are met. In some cases transactions to borrow or lend securities are collateralised using securities. These transactions are off-balance sheet.
Securities reflected on the balance sheet that are pledged as collateral against an existing liability or lent are treated as encumbered for the duration of the transaction. When securities are received as collateral or borrowed, and when we have the right to sell or
H S B C H O L D I N G S P L C
Interim Management Report (continued) Risk > Liquidity and funding > Sources of risk / Wholesale term debt maturity profile
154
re-pledge them, they are reflected as available and unencumbered for the duration of the transaction, unless re-pledged or sold.
In the normal course of business we do not seek to utilise repo financing as a source of funding to finance customer assets, beyond the collateralised security financing activities within Global Markets described above.
The original contractual maturity of reverse repo, stock borrowing, repo and stock lending is short term with the vast majority of transactions being for less than 90 days.
The residual contractual maturity profile of the balance sheet is set out on in Note 17 on the Financial Statements.
Any security accepted as collateral for a reverse repo or stock borrowing transaction must be of very high quality and its value subject to an appropriate haircut. Securities borrowed under reverse repo or stock borrowing transactions can only be recognised as part of the liquidity asset buffer for the duration of the transactions and only if the security received is eligible under the liquid asset policy within the LFRF.
Credit controls are in place to ensure that the fair value of any collateral received remains appropriate to collateralise the cash or fair value of securities given.
In the second half of 2013, GB&M changed the way it managed repo and reverse repo activities in the Credit and Rates businesses. Previously, they were managed in the trading environment; during the second half of 2013, they were organised into trading and non-trading portfolios, with separate risk management procedures. This resulted in an increase in the amount of ‘Non-trading reverse repos’ and a decline in the amount classified as ‘Trading assets’, and an increase in the amount of ‘Non-trading repos’ and a decline in the amount classified as ‘Trading liabilities’ at 31 December 2013 compared with previous period-ends.
Cross-border, intra-Group and cross-currency liquidity and funding risk
The stand-alone operating entity approach to liquidity and funding mandated by the LFRF restricts the exposure of our operating entities to the risks that can arise from extensive reliance on cross-border funding. Operating entities manage their funding sources locally, focusing predominantly on the local customer deposit base. The RBWM, CMB and GPB customer relationships that give rise to core deposits within an operating entity generally reflect a local customer relationship with that operating entity. Access to public debt markets is co-ordinated globally by the Global Head of Balance Sheet Management and the Group Treasurer with Group ALCO monitoring all
planned public debt issuance on a monthly basis. As a general principle, operating entities are only permitted to issue in their local currencies and are encouraged to focus on local private placements. The public issuance of debt instruments in foreign currency is tightly controlled and generally restricted to HSBC Holdings and HSBC Bank plc.
A central principle of LFRF is that operating entities place no future reliance on other Group entities. However, operating entities may, at their discretion, utilise their respective committed facilities from other Group entities if necessary. In addition, intra-Group large exposure limits are applied by national regulators to individual legal entities locally, restricting the unsecured exposures of legal entities to the rest of the Group to a percentage of the lender’s regulatory capital.
Our LFRF also considers the ability of each entity to continue to access foreign exchange markets under stress when a surplus in one currency is used to meet a deficit in another currency, for example, by using the foreign currency swap markets. Where appropriate, operating entities are required to monitor stressed coverage ratios and advance to core funding ratios for non-local currencies and set limits for them. Foreign currency swap markets in currency pairs settled through the Continuous Link Settlement Bank are considered to be extremely deep and liquid and it is assumed that capacity to access these markets is not exposed to idiosyncratic risks.
For the majority of operating entities within the Group, the only significant non-local currency (i.e. exceeding 10% of balance sheet liabilities) is the US dollar. The euro is an additional significant non-local currency for HSBC UK and offshore renminbi is significant for The Hongkong and Shanghai Banking Corporation. Singapore dollars and Indian rupees are also material currencies for The Hongkong and Shanghai Banking Corporation, but these currencies are managed onshore within the local country branch operations on a stand-alone branch basis.
Wholesale term debt maturity profile
The maturity profile of the Group’s wholesale term debt obligations is set out below in the table headed ‘Wholesale funding principal cash flows payable by HSBC under financial liabilities by remaining contractual maturities’.
The balances in the table will not agree directly with those in our consolidated balance sheet as the table presents gross cash flows relating to principal payments and not the balance sheet carrying value, which includes debt securities and subordinated liabilities measured at fair value.
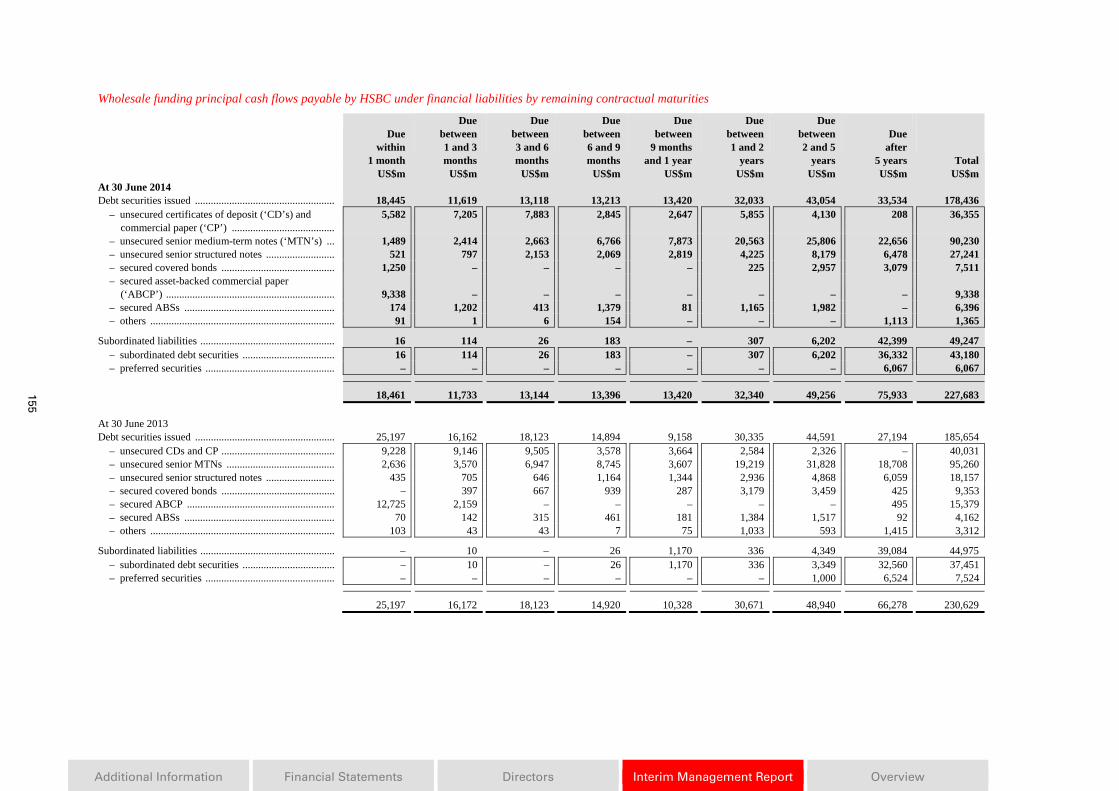
155
Additional Information Financial Statements Directors Interim Management Report Overview
Wholesale funding principal cash flows payable by HSBC under financial liabilities by remaining contractual maturities
Duewithin
1 month
Duebetween1 and 3months
Duebetween3 and 6months
Due between 6 and 9 months
Duebetween
9 monthsand 1 year
Duebetween1 and 2
years
Duebetween2 and 5
years
Dueafter
5 years Total US$m US$m US$m US$m US$m US$m US$m US$m US$m At 30 June 2014 Debt securities issued ..................................................... 18,445 11,619 13,118 13,213 13,420 32,033 43,054 33,534 178,436
– unsecured certificates of deposit (‘CD’s) and commercial paper (‘CP’) .......................................
5,582 7,205 7,883 2,845 2,647 5,855 4,130 208 36,355
– unsecured senior medium-term notes (‘MTN’s) ... 1,489 2,414 2,663 6,766 7,873 20,563 25,806 22,656 90,230– unsecured senior structured notes .......................... 521 797 2,153 2,069 2,819 4,225 8,179 6,478 27,241– secured covered bonds ........................................... 1,250 – – – – 225 2,957 3,079 7,511– secured asset-backed commercial paper
(‘ABCP’) ................................................................ 9,338 – – – – – – – 9,338– secured ABSs ......................................................... 174 1,202 413 1,379 81 1,165 1,982 – 6,396– others ...................................................................... 91 1 6 154 – – – 1,113 1,365
Subordinated liabilities ................................................... 16 114 26 183 – 307 6,202 42,399 49,247 – subordinated debt securities ................................... 16 114 26 183 – 307 6,202 36,332 43,180– preferred securities ................................................. – – – – – – – 6,067 6,067
18,461 11,733 13,144 13,396 13,420 32,340 49,256 75,933 227,683
At 30 June 2013 Debt securities issued ..................................................... 25,197 16,162 18,123 14,894 9,158 30,335 44,591 27,194 185,654
– unsecured CDs and CP ........................................... 9,228 9,146 9,505 3,578 3,664 2,584 2,326 – 40,031– unsecured senior MTNs ......................................... 2,636 3,570 6,947 8,745 3,607 19,219 31,828 18,708 95,260– unsecured senior structured notes .......................... 435 705 646 1,164 1,344 2,936 4,868 6,059 18,157– secured covered bonds ........................................... – 397 667 939 287 3,179 3,459 425 9,353– secured ABCP ........................................................ 12,725 2,159 – – – – – 495 15,379– secured ABSs ......................................................... 70 142 315 461 181 1,384 1,517 92 4,162– others ...................................................................... 103 43 43 7 75 1,033 593 1,415 3,312
Subordinated liabilities ................................................... – 10 – 26 1,170 336 4,349 39,084 44,975 – subordinated debt securities ................................... – 10 – 26 1,170 336 3,349 32,560 37,451– preferred securities ................................................. – – – – – – 1,000 6,524 7,524
25,197 16,172 18,123 14,920 10,328 30,671 48,940 66,278 230,629
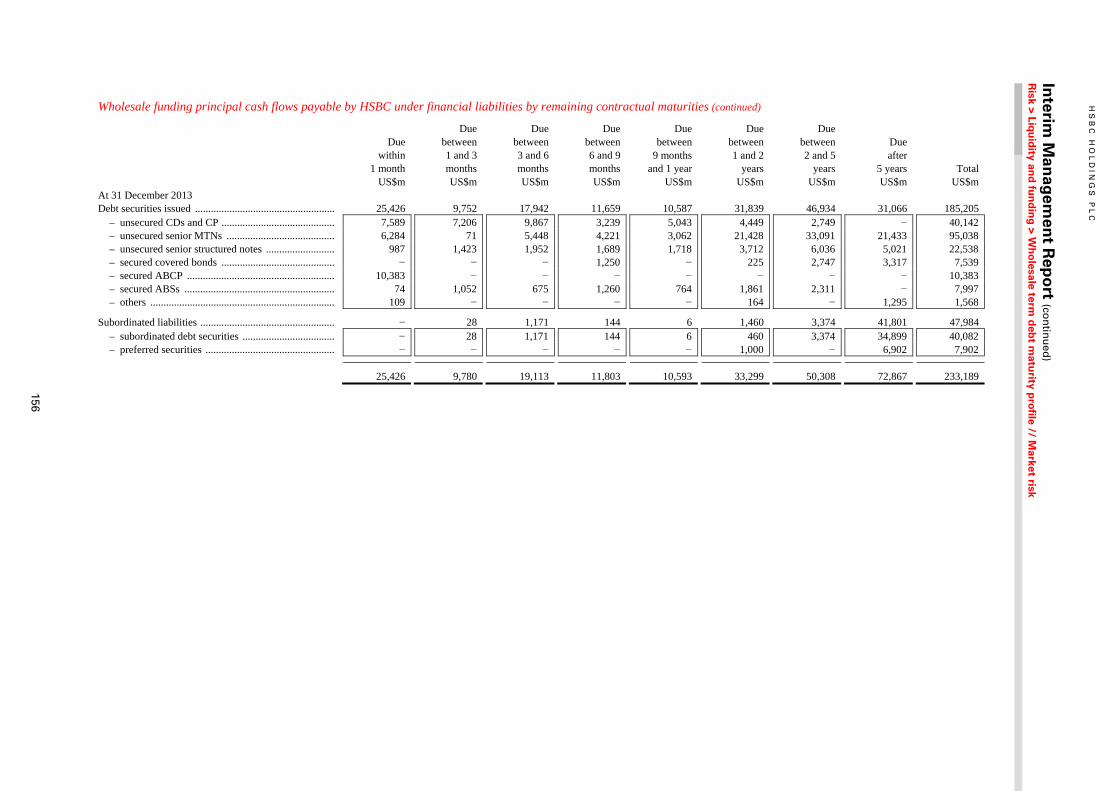
HS
BC
HO
LD
ING
S P
LC
Interim
Man
agem
ent R
epo
rt (con
tinu
ed)
Risk > Liq
uid
ity and
fun
din
g > W
ho
lesale term d
ebt m
aturity p
rofile // M
arket risk
156
Wholesale funding principal cash flows payable by HSBC under financial liabilities by remaining contractual maturities (continued)
Due
within 1 month
Due between 1 and 3 months
Due between 3 and 6 months
Due between 6 and 9 months
Due between
9 months and 1 year
Due between 1 and 2
years
Due between 2 and 5
years
Due after
5 years Total US$m US$m US$m US$m US$m US$m US$m US$m US$m At 31 December 2013 Debt securities issued ..................................................... 25,426 9,752 17,942 11,659 10,587 31,839 46,934 31,066 185,205
– unsecured CDs and CP ........................................... 7,589 7,206 9,867 3,239 5,043 4,449 2,749 − 40,142 – unsecured senior MTNs ......................................... 6,284 71 5,448 4,221 3,062 21,428 33,091 21,433 95,038 – unsecured senior structured notes .......................... 987 1,423 1,952 1,689 1,718 3,712 6,036 5,021 22,538 – secured covered bonds ........................................... − − − 1,250 − 225 2,747 3,317 7,539 – secured ABCP ........................................................ 10,383 − − − − − − − 10,383 – secured ABSs ......................................................... 74 1,052 675 1,260 764 1,861 2,311 − 7,997 – others ...................................................................... 109 − − − − 164 − 1,295 1,568
Subordinated liabilities ................................................... − 28 1,171 144 6 1,460 3,374 41,801 47,984 – subordinated debt securities ................................... − 28 1,171 144 6 460 3,374 34,899 40,082 – preferred securities ................................................. − − − − − 1,000 − 6,902 7,902
25,426 9,780 19,113 11,803 10,593 33,299 50,308 72,867 233,189
157
Ove
rvie
w
In
teri
m M
anag
emen
t R
epo
rt
D
irec
tors
Fin
anci
al S
tate
men
ts
A
dd
itio
nal
Info
rmat
ion
Market risk
Market risk in the first half of 2014 ................................. 158
Trading portfolios .............................................................. 158 Value at risk of the trading portfolios .................................. 158 Trading value at risk ............................................................. 158 Daily VaR (trading portfolios) .............................................. 158 VaR by risk type for trading activities ................................... 158
Backtesting of trading VaR against hypothetical profit
and loss for the Group ...................................................... 159Stressed value at risk of the trading portfolio ..................... 159 Stressed value at risk (1-day equivalent) .............................. 160
Non-trading portfolios ....................................................... 160 Value at risk of the non-trading portfolios .......................... 160 Non-trading value at risk ...................................................... 160 Daily VaR (non-trading portfolios) ....................................... 160 VaR by risk type for non-trading activities ........................... 160Credit spread risk for available-for-sale debt securities ...... 161
Equity securities classified as available for sale ............. 161 Fair value of equity securities ............................................... 161
Structural foreign exchange exposures ........................... 161
Non-trading interest rate risk ........................................... 161
Balance Sheet Management .............................................. 161 Third-party assets in Balance Sheet Management ................ 162
Sensitivity of net interest income ...................................... 162 Sensitivity of projected net interest income ........................... 163 Sensitivity of reported reserves to interest rate movements ... 163
Defined benefit pension schemes ...................................... 164 HSBC’s defined benefit pension schemes .............................. 164
Additional market risk measures applicable only to the parent company ....................................................... 164
Foreign exchange risk .......................................................... 164 HSBC Holdings – foreign exchange VaR .............................. 164Interest rate repricing gap table ........................................... 164 Repricing gap analysis of HSBC Holdings ........................... 164
Market risk is the risk that movements in market factors will reduce our income or the value of our portfolios including foreign exchange rates and commodity prices, interest rates, credit spreads and equity prices.
There have been no significant changes to our policies and practices for the management of market risk as described in the Annual Report and Accounts 2013.
Exposure to market risk
Exposure to market risk is separated into two portfolios:
• Trading portfolios comprise positions arising from the market-making and warehousing of customer-derived positions. The interest rate risk on fixed-rate securities issued by HSBC Holdings is not included in Group VaR. The management of this risk is described on page 164.
• Non-trading portfolios comprise positions that primarily arise from the interest rate management of our retail and commercial banking assets and liabilities, financial investments designated as available for sale and held to maturity, and exposures arising from our insurance operations (see page 169).
Monitoring and limiting market risk exposures
Our objective is to manage and control market risk exposures while maintaining a market profile consistent with our risk appetite.
We use a range of tools to monitor and limit market risk exposures, including:
• sensitivity measures include sensitivity of net interest income and sensitivity for structural foreign exchange, which are used to monitor the market risk positions within each risk type;
• value at risk (‘VaR’) is a technique that estimates the potential losses that could occur on risk positions as a result of movements in market rates and prices over a specified time horizon and to a given level of confidence; and
• in recognition of VaR’s limitations we augment VaR with stress testing to evaluate the potential impact on portfolio values of more extreme, though plausible, events or movements in a set of financial variables. Examples of scenarios reflecting current market concerns are the slowdown in mainland China and the potential effects of a sovereign debt default, including its wider contagion effects.
A summary of our current policies and practices regarding market risk is provided on page 281 of the Annual Report and Accounts 2013.
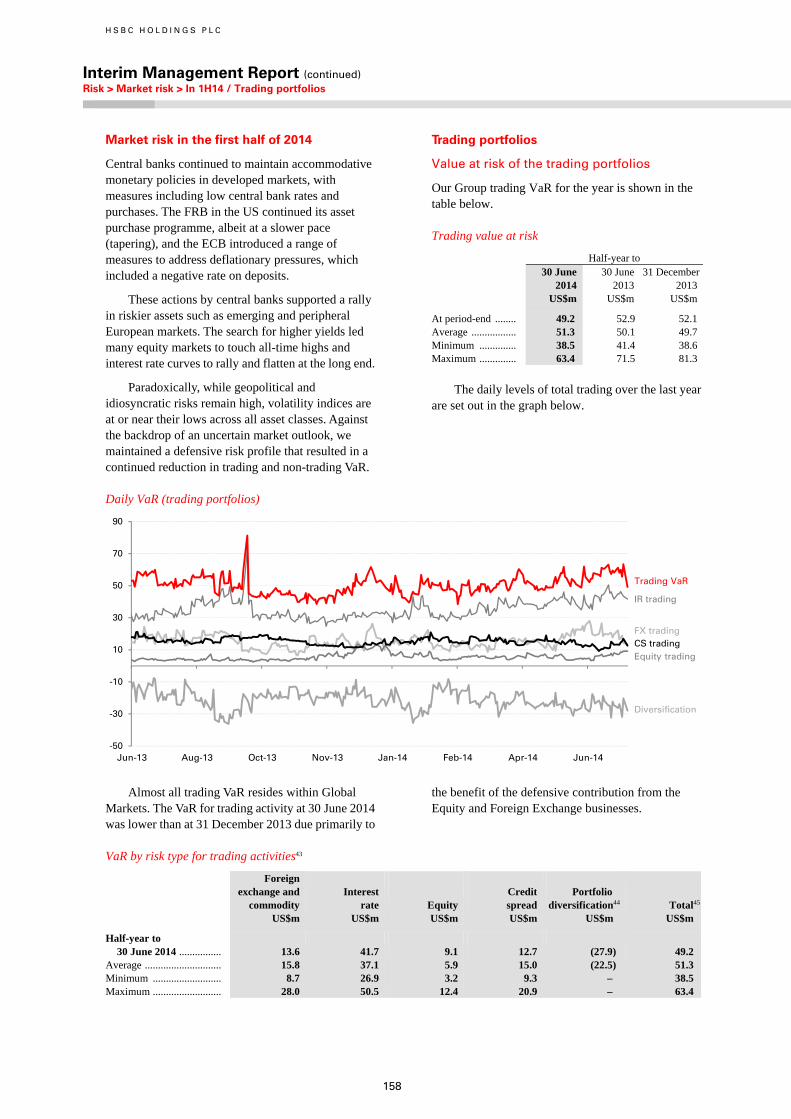
H S B C H O L D I N G S P L C
Interim Management Report (continued) Risk > Market risk > In 1H14 / Trading portfolios
158
Market risk in the first half of 2014
Central banks continued to maintain accommodative monetary policies in developed markets, with measures including low central bank rates and purchases. The FRB in the US continued its asset purchase programme, albeit at a slower pace (tapering), and the ECB introduced a range of measures to address deflationary pressures, which included a negative rate on deposits.
These actions by central banks supported a rally in riskier assets such as emerging and peripheral European markets. The search for higher yields led many equity markets to touch all-time highs and interest rate curves to rally and flatten at the long end.
Paradoxically, while geopolitical and idiosyncratic risks remain high, volatility indices are at or near their lows across all asset classes. Against the backdrop of an uncertain market outlook, we maintained a defensive risk profile that resulted in a continued reduction in trading and non-trading VaR.
Trading portfolios
Value at risk of the trading portfolios
Our Group trading VaR for the year is shown in the table below.
Trading value at risk
Half-year to 30 June
2014 30 June 2013
31 December 2013
US$m US$m US$m
At period-end ........ 49.2 52.9 52.1 Average ................. 51.3 50.1 49.7 Minimum .............. 38.5 41.4 38.6 Maximum .............. 63.4 71.5 81.3
The daily levels of total trading over the last year are set out in the graph below.
Daily VaR (trading portfolios)
Almost all trading VaR resides within Global
Markets. The VaR for trading activity at 30 June 2014 was lower than at 31 December 2013 due primarily to
the benefit of the defensive contribution from the Equity and Foreign Exchange businesses.
VaR by risk type for trading activities43
Foreign exchange and commodity
Interest rate Equity
Credit spread
Portfolio diversification44
Total45
US$m US$m US$m US$m US$m US$m
Half-year to 30 June 2014 ................ 13.6 41.7 9.1 12.7 (27.9)
49.2
Average ............................. 15.8 37.1 5.9 15.0 (22.5) 51.3 Minimum .......................... 8.7 26.9 3.2 9.3 – 38.5 Maximum .......................... 28.0 50.5 12.4 20.9 – 63.4
-50
-30
-10
10
30
50
70
90
Jun-13 Aug-13 Oct-13 Nov-13 Jan-14 Feb-14 Apr-14 Jun-14
Trading VaR
IR trading
CS tradingFX trading
Equity trading
Diversification
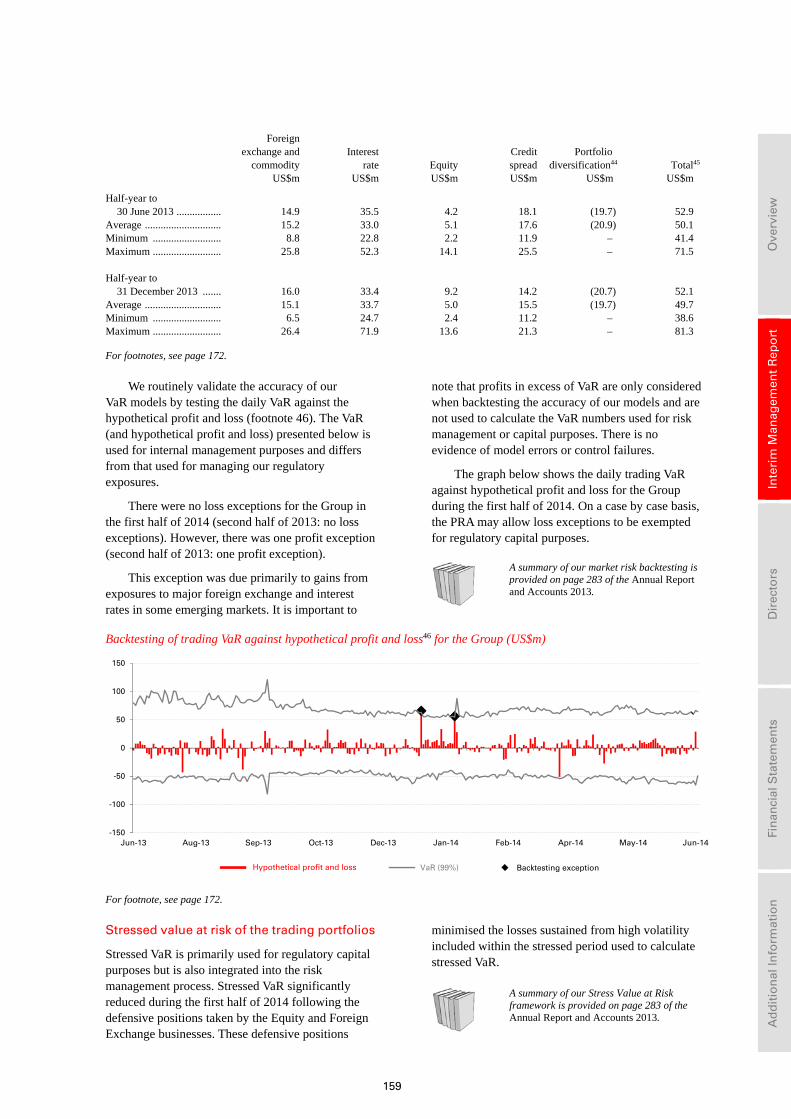
159
Ove
rvie
w
In
teri
m M
anag
emen
t R
epo
rt
D
irec
tors
Fin
anci
al S
tate
men
ts
A
dd
itio
nal
Info
rmat
ion
Foreign exchange and commodity
Interest rate Equity
Credit spread
Portfolio diversification44
Total45
US$m US$m US$m US$m US$m US$m
Half-year to 30 June 2013 ................. 14.9 35.5 4.2 18.1 (19.7)
52.9
Average ............................. 15.2 33.0 5.1 17.6 (20.9) 50.1 Minimum .......................... 8.8 22.8 2.2 11.9 – 41.4 Maximum .......................... 25.8 52.3 14.1 25.5 – 71.5 Half-year to
31 December 2013 ....... 16.0 33.4 9.2 14.2 (20.7) 52.1
Average ............................. 15.1 33.7 5.0 15.5 (19.7) 49.7 Minimum .......................... 6.5 24.7 2.4 11.2 – 38.6 Maximum .......................... 26.4 71.9 13.6 21.3 – 81.3
For footnotes, see page 172.
We routinely validate the accuracy of our VaR models by testing the daily VaR against the hypothetical profit and loss (footnote 46). The VaR (and hypothetical profit and loss) presented below is used for internal management purposes and differs from that used for managing our regulatory exposures.
There were no loss exceptions for the Group in the first half of 2014 (second half of 2013: no loss exceptions). However, there was one profit exception (second half of 2013: one profit exception).
This exception was due primarily to gains from exposures to major foreign exchange and interest rates in some emerging markets. It is important to
note that profits in excess of VaR are only considered when backtesting the accuracy of our models and are not used to calculate the VaR numbers used for risk management or capital purposes. There is no evidence of model errors or control failures.
The graph below shows the daily trading VaR against hypothetical profit and loss for the Group during the first half of 2014. On a case by case basis, the PRA may allow loss exceptions to be exempted for regulatory capital purposes.
A summary of our market risk backtesting is provided on page 283 of the Annual Report and Accounts 2013.
Backtesting of trading VaR against hypothetical profit and loss46 for the Group (US$m)
For footnote, see page 172.
Stressed value at risk of the trading portfolios
Stressed VaR is primarily used for regulatory capital purposes but is also integrated into the risk management process. Stressed VaR significantly reduced during the first half of 2014 following the defensive positions taken by the Equity and Foreign Exchange businesses. These defensive positions
minimised the losses sustained from high volatility included within the stressed period used to calculate stressed VaR.
A summary of our Stress Value at Risk framework is provided on page 283 of the Annual Report and Accounts 2013.
-150
-100
-50
0
50
100
150
Jun-13 Aug-13 Sep-13 Oct-13 Dec-13 Jan-14 Feb-14 Apr-14 May-14 Jun-14
Backtesting exceptionVaR (99%)Hypothetical profit and loss
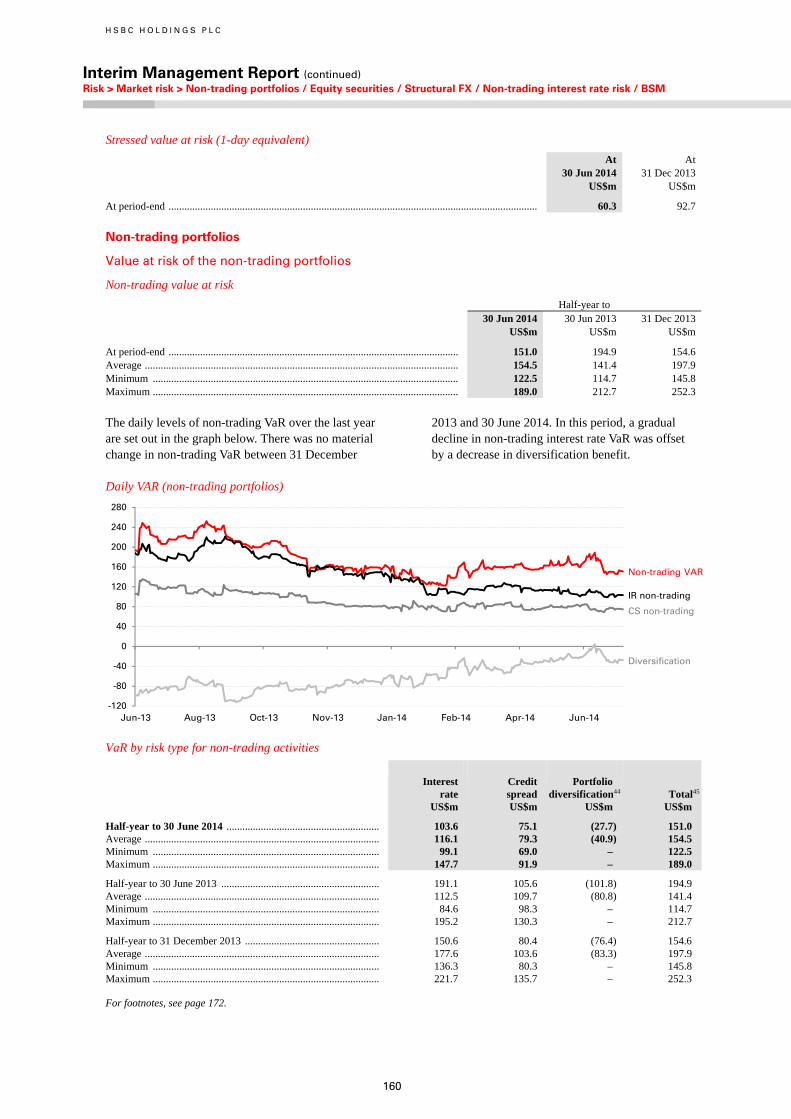
H S B C H O L D I N G S P L C
Interim Management Report (continued) Risk > Market risk > Non-trading portfolios / Equity securities / Structural FX / Non-trading interest rate risk / BSM
160
Stressed value at risk (1-day equivalent)
At At 30 Jun 2014 31 Dec 2013 US$m US$m
At period-end ............................................................................................................................................ 60.3 92.7
Non-trading portfolios
Value at risk of the non-trading portfolios
Non-trading value at risk
Half-year to 30 Jun 2014 30 Jun 2013 31 Dec 2013 US$m US$m US$m
At period-end .............................................................................................................. 151.0 194.9 154.6 Average ....................................................................................................................... 154.5 141.4 197.9 Minimum .................................................................................................................... 122.5 114.7 145.8 Maximum .................................................................................................................... 189.0 212.7 252.3
The daily levels of non-trading VaR over the last year are set out in the graph below. There was no material change in non-trading VaR between 31 December
2013 and 30 June 2014. In this period, a gradual decline in non-trading interest rate VaR was offset by a decrease in diversification benefit.
Daily VAR (non-trading portfolios)
VaR by risk type for non-trading activities
Interest rate
Credit spread
Portfolio diversification44 Total45
US$m US$m US$m US$m
Half-year to 30 June 2014 .......................................................... 103.6 75.1 (27.7) 151.0 Average ......................................................................................... 116.1 79.3 (40.9) 154.5 Minimum ...................................................................................... 99.1 69.0 – 122.5 Maximum ...................................................................................... 147.7 91.9 – 189.0
Half-year to 30 June 2013 ............................................................ 191.1 105.6 (101.8) 194.9Average ......................................................................................... 112.5 109.7 (80.8) 141.4 Minimum ...................................................................................... 84.6 98.3 – 114.7Maximum ...................................................................................... 195.2 130.3 – 212.7
Half-year to 31 December 2013 ................................................... 150.6 80.4 (76.4) 154.6 Average ......................................................................................... 177.6 103.6 (83.3) 197.9Minimum ...................................................................................... 136.3 80.3 – 145.8Maximum ...................................................................................... 221.7 135.7 – 252.3
For footnotes, see page 172.
-120
-80
-40
0
40
80
120
160
200
240
280
Jun-13 Aug-13 Oct-13 Nov-13 Jan-14 Feb-14 Apr-14 Jun-14
Non-trading VAR
Diversification
IR non-trading
CS non-trading
161
Ove
rvie
w
In
teri
m M
anag
emen
t R
epo
rt
D
irec
tors
Fin
anci
al S
tate
men
ts
A
dd
itio
nal
Info
rmat
ion
Most of the Group non-trading VaR relates to Balance Sheet Management or local treasury management functions. Contributions to Group non-trading VaR are driven by interest rates and credit spread risks arising from all global businesses. There is no commodity risk in the non-trading portfolios. The decrease of non-trading VaR during the first half of 2014 was due mainly to the effect of lower levels of volatility in interest rates utilized in the VaR calculations.
A summary of our non-trading framework is provided on page 285 of the Annual Report and Accounts 2013.
The management of interest rate risk in the banking book is described further in ‘Non-trading interest rate risk’ below, including the role of Balance Sheet Management.
Non-trading VaR excludes equity risk on available-for-sale securities, structural foreign exchange risk and interest rate risk on fixed rate securities issued by HSBC Holdings, the management of which is described in the relevant sections below. These sections together describe the scope of HSBC’s management of market risks in non-trading books.
Credit spread risk for available-for-sale debt securities
Credit spread VaR for available-for-sale debt securities, excluding those held in insurance operations, is included in the Group non-trading VaR. However, SICs are not included.
At 30 June 2014, the sensitivity of equity capital to the effect of movements in credit spreads on our available-for-sale debt securities based on credit spread VaR was US$114m (30 June 2013: US$126m; 31 December 2013: US$113m) including the gross exposure for the SICs consolidated within our balance sheet. This sensitivity was calculated before taking into account losses which would have been absorbed by the capital note holders.
At 30 June 2014, the capital note holders would absorb the first US$1.8bn (30 June 2013: US$2.2bn; 31 December 2013: US$2.3bn) of any losses incurred by the SICs before we incur any losses on the senior notes held.
Equity securities classified as available for sale
Fair values of equity securities
At 30 Jun 2014
At 30 Jun 2013
At 31 Dec 2013
US$bn US$bn US$bn
Private equity holdings47 .... 2.4 2.9 2.7Funds invested for short-
term cash management .. – 0.1 –Investment to facilitate
ongoing business48 ......... 1.2 1.1 1.2 Other strategic investments 5.1 5.3 5.2
8.7 9.4 9.1
For footnotes, see page 172.
The fair values of the equity securities classified as available for sale can fluctuate considerably. The table above sets out the maximum possible loss on shareholders’ equity from available-for-sale equity securities. The decrease in private equity is due to the disposal of direct investments and private equity fund holdings.
Structural foreign exchange exposures
Our policies and procedures for managing structural foreign exchange exposures are described on page 285 in the Annual Report and Accounts 2013.
Non-trading interest rate risk
Our policies and procedures for managing non-trading interest rate risk are described on page 285 in the Annual Report and Accounts 2013.
Balance Sheet Management
Our Balance Sheet Management framework is described on page 238 in the Annual Report and Accounts 2013.
Balance Sheet Management (‘BSM’) invests in highly-rated liquid assets in line with the Group’s liquid asset policy. The majority of the liquidity is invested in central bank deposits and government, supranational and agency securities with most of the remainder held in short-term interbank and central bank loans.
H S B C H O L D I N G S P L C
Interim Management Report (continued) Risk > Market risk > BSM / Sensitivity of NII
162
Third-party assets in BSM decreased by 3% during the first half of 2014. Deposits with central banks reduced by US$26bn, predominantly in Europe due to a combination of reduced repo activity and a reduction in balances with the ECB as deposit rates became negative. Deployment of commercial surplus via reverse repurchase agreements increased by US$11bn, mainly through Asia. Third-party assets in Balance Sheet Management
At 30 Jun 2014
At 30 Jun 2013
At 31 Dec 2013
US$m US$m US$m
Cash and balances at central banks .................. 107,698 118,139 134,086
Trading assets .................... 5,673 7,830 5,547 Financial assets designated
at fair value .................... 70 73 72 Loans and advances1
– to banks ....................... 61,277 59,548 59,355 – to customers ................ 1,871 17,792 2,146
Reverse repurchase agreements ..................... 69,844 21,660 58,968
Financial investments ........ 311,333 279,051 314,427 Other .................................. 1,420 3,284 3,700
559,186 507,377 578,301
For footnote, see page 172.
Withdrawable central bank deposits are accounted for as cash balances. Interbank loans, statutory central bank reserves and loans to central banks are accounted for as loans and advances to banks. BSM’s holdings of securities are accounted for as available-for-sale or, to a lesser extent, held-to- maturity assets.
Statutory central bank reserves are not recognised as liquid assets. The statutory reserves that would be released in line with the Group’s stressed customer deposit outflow assumptions are reflected as stressed inflows.
BSM is permitted to use derivatives as part of its mandate to manage interest rate risk. Derivative activity is predominantly through the use of vanilla interest rate swaps which are part of cash flow hedging and fair value hedging relationships.
Credit risk in BSM is predominantly limited to short-term bank exposure created by interbank lending, and exposure to central banks and high quality sovereigns, supranationals or agencies which constitute the majority of BSM’s liquidity portfolio. BSM does not manage the structural credit risk of any Group entity balance sheets.
BSM is permitted to enter into single name and index credit derivatives activity, but it does so to manage credit risk on the exposure specific to its securities portfolio in limited circumstances only.
The risk limits are extremely restricted and closely monitored. At 30 June 2014 and 31 December 2013 BSM had no open credit derivative index risk.
VaR is calculated on both trading and non-trading positions held in BSM by applying the same methodology used in the Global Markets business and for market risk control purposes.
BSM holds trading portfolio instruments in only very limited circumstances. Positions and the associated VaR were not significant during the first half of 2014.
Sensitivity of net interest income
The table below sets out the effect on our future net interest income of an incremental 25 basis points parallel rise or fall in all yield curves worldwide at the beginning of each quarter during the 12 months from 1 July 2014. The sensitivities shown represent the change in the base case projected net interest income that would be expected under the two rate scenarios assuming that all other non-interest rate risk variables remain constant, and there are no management actions. In deriving our base case net interest income projections the re-pricing rate of assets and liabilities used is derived from current yield curves.
These figures incorporate the effect of any option features in the underlying exposures. Assuming no management response, a sequence of such rises would increase planned net interest income for the 12 months to 30 June 2015 by US$979m (to 31 December 2014: US$938m), while a sequence of such falls would decrease planned net interest income by US$1,746m (31 December 2014: US$1,734m).
163
Ove
rvie
w
In
teri
m M
anag
emen
t R
epo
rt
D
irec
tors
Fin
anci
al S
tate
men
ts
A
dd
itio
nal
Info
rmat
ion
Sensitivity of projected net interest income49
US dollar bloc
Rest of Americas bloc
Hong Kong dollar bloc
Rest of Asia bloc
Sterling bloc
Euro bloc
Total US$m US$m US$m US$m US$m US$m US$m Change in July 2014 to June 2015
projected net interest income arising from a shift in yield curves at the beginning of each quarter of:
+ 25 basis points ............................... 54 26 293 252 451 (97) 979 – 25 basis points ............................... (308) (37) (450) (235) (691) (25) (1,746)
Change in January 2014 to December 2014 projected net interest income arising from a shift in yield curves at the beginning of each quarter of:
+ 25 basis points ............................... (107) 12 327 236 598 (128) 938 – 25 basis points ............................... (291) (23) (412) (233) (761) (14) (1,734)
Change in July 2013 to June 2014 projected net interest income arising from a shift in yield curves at the beginning of each quarter of:
+ 25 basis points ............................... 112 56 283 152 593 (41) 1,155 – 25 basis points ............................... (351) (65) (399) (181) (524) (24) (1,544)
For footnote, see page 172.
The interest rate sensitivities set out in the table above are indicative and based on simplified scenarios. The limitations of this analysis are discussed on page 286 of the Annual Report and Accounts 2013. Net interest income and its associated sensitivity as reflected above include the expense of funding trading assets, while related revenue is reported in ‘Net trading income’.
We monitor the sensitivity of reported reserves to interest rate movements on a monthly basis by assessing the expected reduction in valuation of available-for-sale portfolios and cash flow hedges
due to parallel movements of plus or minus 100bps in all yield curves. These particular exposures form only a part of our overall interest rate exposures. The accounting treatment of our remaining interest rate exposures, while economically largely offsetting the exposures shown in the above table, does not require revaluation movements to go to reserves.
The table below describes the sensitivity of our reported reserves to the stipulated movements in yield curves and the maximum and minimum month-end figures during the period. The sensitivities are indicative and based on simplified scenarios.
Sensitivity of reported reserves to interest rate movements49
Impact in the preceding 6 months
US$m Maximum US$m
Minimum US$m
At 30 June 2014 + 100 basis point parallel move in all yield curves .................................................... (5,157) (5,212) (5,066)As a percentage of total shareholders’ equity ............................................................ (2.7%) (2.7%) (2.7%)
– 100 basis point parallel move in all yield curves .................................................... 4,730 4,915 4,730 As a percentage of total shareholders’ equity ............................................................ (2.5%) (2.6%) (2.5%)
At 30 June 2013 + 100 basis point parallel move in all yield curves .................................................... (5,991) (5,991) (5,507)As a percentage of total shareholders’ equity ............................................................ (3.4%) (3.4%) (3.2%)
– 100 basis point parallel move in all yield curves .................................................... 5,752 5,752 4,910 As a percentage of total shareholders’ equity ............................................................ 3.3% 3.3% 2.8%
At 31 December 2013 + 100 basis point parallel move in all yield curves .................................................... (5,762) (5,992) (5,762)As a percentage of total shareholders’ equity ............................................................ (3.2%) (3.3%) (3.2%)
– 100 basis point parallel move in all yield curves .................................................... 5,634 5,786 5,633 As a percentage of total shareholders’ equity ............................................................ 3.1% 3.2% 3.1%
For footnote, see page 172.
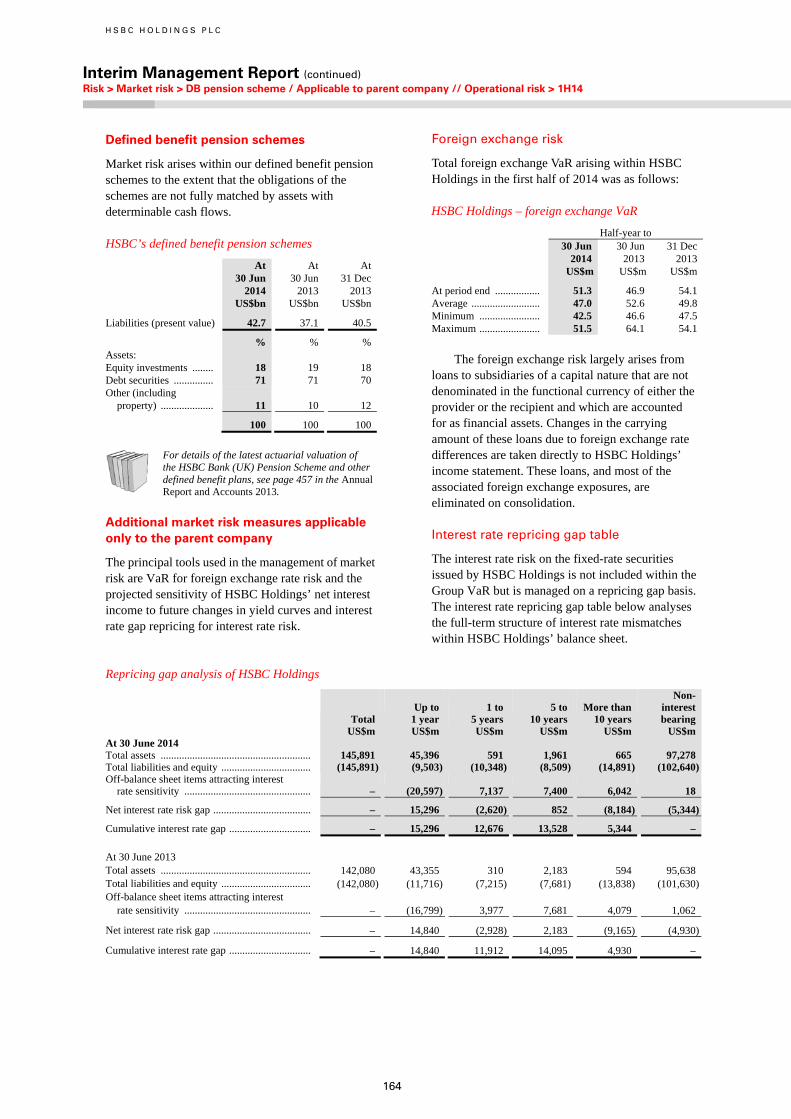
H S B C H O L D I N G S P L C
Interim Management Report (continued) Risk > Market risk > DB pension scheme / Applicable to parent company // Operational risk > 1H14
164
Defined benefit pension schemes
Market risk arises within our defined benefit pension schemes to the extent that the obligations of the schemes are not fully matched by assets with determinable cash flows.
HSBC’s defined benefit pension schemes
At 30 Jun 2014
At 30 Jun 2013
At 31 Dec
2013 US$bn US$bn US$bn
Liabilities (present value) 42.7 37.1 40.5
% % %Assets: Equity investments ........ 18 19 18Debt securities ............... 71 71 70Other (including
property) .................... 11 10 12
100 100 100
For details of the latest actuarial valuation of the HSBC Bank (UK) Pension Scheme and other defined benefit plans, see page 457 in the Annual Report and Accounts 2013.
Additional market risk measures applicable only to the parent company
The principal tools used in the management of market risk are VaR for foreign exchange rate risk and the projected sensitivity of HSBC Holdings’ net interest income to future changes in yield curves and interest rate gap repricing for interest rate risk.
Foreign exchange risk
Total foreign exchange VaR arising within HSBC Holdings in the first half of 2014 was as follows:
HSBC Holdings – foreign exchange VaR
Half-year to 30 Jun 2014
30 Jun 2013
31 Dec 2013
US$m US$m US$m
At period end ................. 51.3 46.9 54.1Average .......................... 47.0 52.6 49.8Minimum ....................... 42.5 46.6 47.5 Maximum ....................... 51.5 64.1 54.1
The foreign exchange risk largely arises from
loans to subsidiaries of a capital nature that are not denominated in the functional currency of either the provider or the recipient and which are accounted for as financial assets. Changes in the carrying amount of these loans due to foreign exchange rate differences are taken directly to HSBC Holdings’ income statement. These loans, and most of the associated foreign exchange exposures, are eliminated on consolidation.
Interest rate repricing gap table
The interest rate risk on the fixed-rate securities issued by HSBC Holdings is not included within the Group VaR but is managed on a repricing gap basis. The interest rate repricing gap table below analyses the full-term structure of interest rate mismatches within HSBC Holdings’ balance sheet.
Repricing gap analysis of HSBC Holdings
Total Up to 1 year
1 to 5 years
5 to 10 years
More than 10 years
Non- interest bearing
US$m US$m US$m US$m US$m US$mAt 30 June 2014 Total assets ......................................................... 145,891 45,396 591 1,961 665 97,278Total liabilities and equity .................................. (145,891) (9,503) (10,348) (8,509) (14,891) (102,640)Off-balance sheet items attracting interest
rate sensitivity ................................................ – (20,597) 7,137 7,400 6,042 18
Net interest rate risk gap ..................................... – 15,296 (2,620) 852 (8,184) (5,344)
Cumulative interest rate gap ............................... – 15,296 12,676 13,528 5,344 –
At 30 June 2013 Total assets ......................................................... 142,080 43,355 310 2,183 594 95,638Total liabilities and equity .................................. (142,080) (11,716) (7,215) (7,681) (13,838) (101,630)Off-balance sheet items attracting interest
rate sensitivity ................................................ – (16,799) 3,977 7,681 4,079 1,062
Net interest rate risk gap ..................................... – 14,840 (2,928) 2,183 (9,165) (4,930)
Cumulative interest rate gap ............................... – 14,840 11,912 14,095 4,930 –
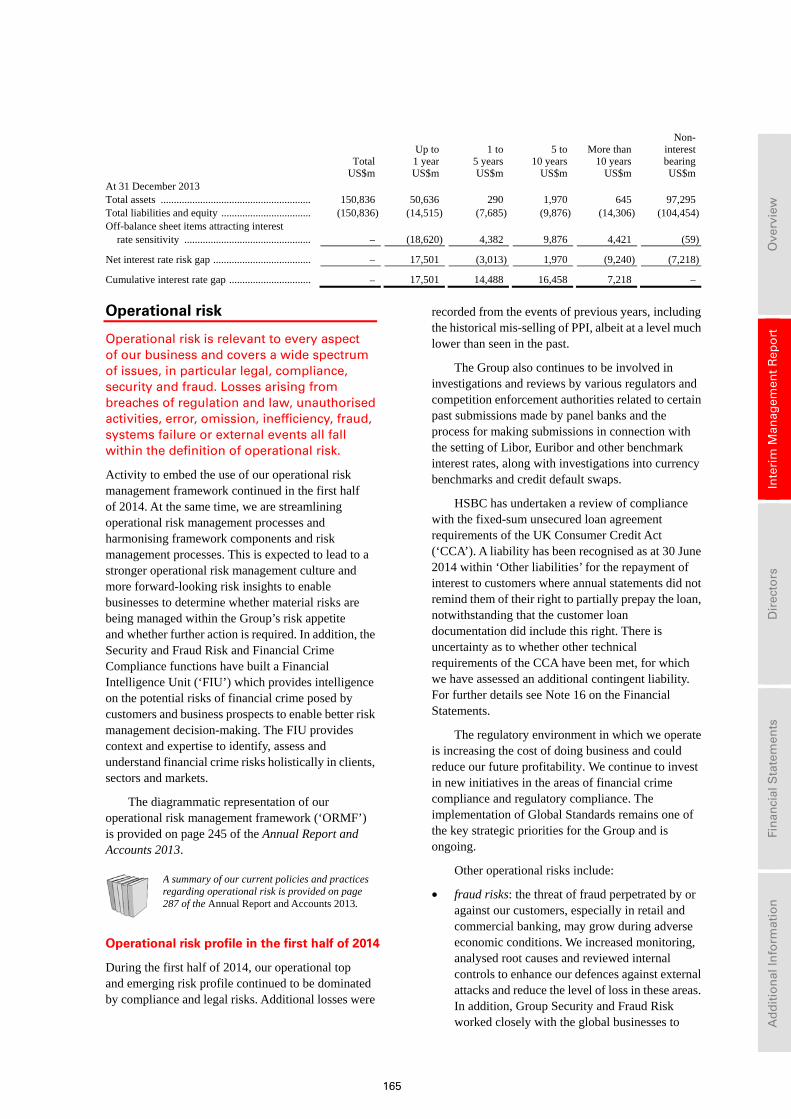
165
Ove
rvie
w
In
teri
m M
anag
emen
t R
epo
rt
D
irec
tors
Fin
anci
al S
tate
men
ts
A
dd
itio
nal
Info
rmat
ion
Total Up to
1 year 1 to
5 years 5 to
10 years More than 10 years
Non- interest bearing
US$m US$m US$m US$m US$m US$mAt 31 December 2013 Total assets ......................................................... 150,836 50,636 290 1,970 645 97,295 Total liabilities and equity .................................. (150,836) (14,515) (7,685) (9,876) (14,306) (104,454)Off-balance sheet items attracting interest
rate sensitivity ................................................ – (18,620) 4,382 9,876 4,421 (59)
Net interest rate risk gap ..................................... – 17,501 (3,013) 1,970 (9,240) (7,218)
Cumulative interest rate gap ............................... – 17,501 14,488 16,458 7,218 –
Operational risk
Operational risk is relevant to every aspect of our business and covers a wide spectrum of issues, in particular legal, compliance, security and fraud. Losses arising from breaches of regulation and law, unauthorised activities, error, omission, inefficiency, fraud, systems failure or external events all fall within the definition of operational risk.
Activity to embed the use of our operational risk management framework continued in the first half of 2014. At the same time, we are streamlining operational risk management processes and harmonising framework components and risk management processes. This is expected to lead to a stronger operational risk management culture and more forward-looking risk insights to enable businesses to determine whether material risks are being managed within the Group’s risk appetite and whether further action is required. In addition, the Security and Fraud Risk and Financial Crime Compliance functions have built a Financial Intelligence Unit (‘FIU’) which provides intelligence on the potential risks of financial crime posed by customers and business prospects to enable better risk management decision-making. The FIU provides context and expertise to identify, assess and understand financial crime risks holistically in clients, sectors and markets.
The diagrammatic representation of our operational risk management framework (‘ORMF’) is provided on page 245 of the Annual Report and Accounts 2013.
A summary of our current policies and practices regarding operational risk is provided on page 287 of the Annual Report and Accounts 2013.
Operational risk profile in the first half of 2014
During the first half of 2014, our operational top and emerging risk profile continued to be dominated by compliance and legal risks. Additional losses were
recorded from the events of previous years, including the historical mis-selling of PPI, albeit at a level much lower than seen in the past.
The Group also continues to be involved in investigations and reviews by various regulators and competition enforcement authorities related to certain past submissions made by panel banks and the process for making submissions in connection with the setting of Libor, Euribor and other benchmark interest rates, along with investigations into currency benchmarks and credit default swaps.
HSBC has undertaken a review of compliance with the fixed-sum unsecured loan agreement requirements of the UK Consumer Credit Act (‘CCA’). A liability has been recognised as at 30 June 2014 within ‘Other liabilities’ for the repayment of interest to customers where annual statements did not remind them of their right to partially prepay the loan, notwithstanding that the customer loan documentation did include this right. There is uncertainty as to whether other technical requirements of the CCA have been met, for which we have assessed an additional contingent liability. For further details see Note 16 on the Financial Statements.
The regulatory environment in which we operate is increasing the cost of doing business and could reduce our future profitability. We continue to invest in new initiatives in the areas of financial crime compliance and regulatory compliance. The implementation of Global Standards remains one of the key strategic priorities for the Group and is ongoing.
Other operational risks include:
• fraud risks: the threat of fraud perpetrated by or against our customers, especially in retail and commercial banking, may grow during adverse economic conditions. We increased monitoring, analysed root causes and reviewed internal controls to enhance our defences against external attacks and reduce the level of loss in these areas. In addition, Group Security and Fraud Risk worked closely with the global businesses to
H S B C H O L D I N G S P L C
Interim Management Report (continued) Risk > Operational risk / Compliance risk
166
continually assess these threats as they evolved and adapt our controls to mitigate these risks;
• level of change creating operational complexity: The Global Risk function is engaged with business management in business transformation initiatives to ensure robust internal controls are maintained, including through participation in all relevant management committees. The Global Transactions Team has developed an enhanced risk management framework to be applied to the management of disposal risks;
• information security: the security of our information and technology infrastructure is crucial for maintaining our banking applications and processes while protecting our customers and the HSBC brand. A failure of our defences against such attacks could result in financial loss and the loss of customer data and other sensitive information which could undermine both our reputation and our ability to retain the trust of our customers. In common with other banks and multinational organisations, we continue to be a target of distributed denial of service (‘DDoS’) attacks which impact the availability of customer-facing websites. No evidence of customer data being breached was discovered in the first half of 2014 as a result of these attacks.
This area will continue to be a focus of ongoing initiatives to strengthen the control environment. Significant investment has already been made in enhancing controls, including increased training to raise staff awareness of the requirements, improved controls around data access and heightened monitoring of potential DDoS attacks.
The Cyber Intelligence and Threat team continued to develop our intelligence-driven responses to these attacks based on lessons learnt from previous attacks and through information sharing with other financial institutions, government agencies and external intelligence providers. We continued to refine our operational processes and contingency plans; and
• vendor risk management: we remain focused on the management of vendor risks and the roll out of a global performance tracking process with our most important suppliers is ongoing.
Other operational risks are also monitored and managed through the use of the ORMF, including investments made to further improve the resilience of our payments infrastructure.
Legal proceedings are discussed in Note 25 on the Financial Statements and further details regarding compliance risk are set out below.
Compliance risk
Compliance risk is the risk that we fail to observe the letter and spirit of all relevant laws, codes, rules, regulations and standards of good market practice, and incur fines and penalties and suffer damage to our business as a consequence.
All Group companies and employees are required to observe the letter and spirit of all relevant laws, codes, rules, regulations and standards of good market practice.
In line with our ambition to be the world’s leading international bank, we have committed to adopt and adhere to industry-leading compliance standards across the Group. One of the ways to achieve this is to ensure that we put in place a robust compliance risk management infrastructure.
We have now completed the restructuring of our previous Compliance sub-function within Global Risk into two new sub-functions: Financial Crime Compliance and Regulatory Compliance, jointly supported by Compliance Shared Services. The new structure allows us to:
• manage different types of regulatory and financial crime compliance risk more effectively;
• focus our efforts appropriately in addressing the issues highlighted by regulatory investigations and reviews, internal audits and risk assessments of past business activities; and
• ensure we have in place clear, robust accountability and appropriate expertise and processes for all areas of compliance risk.
Financial Crime Compliance sets policy and manages risks in the following areas:
• anti-money laundering, counter terrorist financing and proliferation finance;
• sanctions; and
• anti-bribery and corruption.
Regulatory Compliance sets policy and manages risks in the following areas:
• conduct of business;
• market conduct; and
• other applicable laws, rules and regulations.
A Financial Crime Risk Appetite Statement was approved by the Board in October 2013. A financial crime-based component has been embedded in Group Strategy, determining what business HSBC does,
167
Ove
rvie
w
In
teri
m M
anag
emen
t R
epo
rt
D
irec
tors
Fin
anci
al S
tate
men
ts
A
dd
itio
nal
Info
rmat
ion
with whom and in which markets. An enhanced global AML policy, incorporating risk appetite, was approved by the Board in January 2014. The policy adopts and enforces the highest or most effective standards globally, including a globally consistent approach to knowing and retaining our customers.
The AML policy is being implemented in phases through the development and application of minimum standards of procedure to manage AML compliance in our global businesses. The overriding policy objective is for every employee to conduct ‘the right kind of business’, which will be a recurring theme across all pillars of the AML programme and engagement campaign.
Conducting customer due diligence is one of the fundamental ways in which we understand and manage financial crime risk. Enhanced minimum standards for customer due diligence procedures covering the majority of our customer types were completed and approved in 2013. Implementation of these procedures began in February 2014 in the UAE.
Similarly, in January 2014, the Board approved an enhanced global sanctions policy, which is informed by the sanctions laws and regulations of the EU, Hong Kong, the UK and the US. The policy defines the Group’s risk appetite in dealing with sanctioned individuals, entities and countries over and above compliance with applicable sanctions laws and regulations.
The policy will be implemented through the development and maintenance of global business operating procedures. To assist in this, an analysis is being conducted to understand where there are gaps in current business operating procedures and processes compared with new policy requirements or where local laws or regulations conflict with or exceed global policy requirements.
In May 2014, the Board approved a globally consistent approach to the risk management of conduct which defines how we will deliver fair outcomes for our customers and undertake orderly and transparent operations in financial markets. Implementation of our conduct approach will be managed through the global lines of business and functions, which will perform a gap analysis to determine where current policy, processes and practices may require enhancement to meet our required outcomes.
We continue to invest in the Compliance sub-functions to ensure that, through their operation and the execution of the Group strategy, including measures to implement Global Standards, we are well positioned to meet increased levels of regulation and scrutiny from regulators and law enforcement agencies. In addition, the measures we have put in place are designed to ensure we have the appropriate people, processes and procedures to manage evolving markets, emerging risks and new products and business.
Our focus on compliance issues is reinforced by the Financial System Vulnerabilities Committee, which reports to the Board on matters relating to financial crime and financial system abuse and provides a forward-looking perspective on financial crime risk. In addition, the Conduct & Values Committee reports to the Board on matters relating to responsible business conduct and adherence to HSBC’s Values.
It is clear that the level of inherent compliance risk that we face will continue to remain high for the foreseeable future. However, we consider that good progress is being made and will continue to be made in ensuring that we are well placed to effectively manage those risks.
Whistleblowing
The HSBC Group operates a global Compliance Disclosure Line (telephone and email) which is available to allow employees to make disclosures when the normal channels for airing grievances or concerns are unavailable or inappropriate.
The Compliance Disclosure Line is available to capture employee concerns on a number of matters, including breaches of law or regulation, allegations of bribery and corruption, failure to comply with Group policies, suspicions of money laundering, breaches of internal controls and fraud or deliberate error in the financial records of any Group company. Global Regulatory Compliance is responsible for the operation of the Compliance Disclosure Line and the handling of disclosure cases. Each case is reviewed and referred for appropriate investigation. The disclosure is acknowledged (when contact details are provided) and the employee is advised when the investigation has been concluded. Global Regulatory Compliance may also be made aware of whistleblowing cases raised directly with senior executives, line managers, Human Resources and Security and Fraud, and will investigate accordingly.
H S B C H O L D I N G S P L C
Interim Management Report (continued) Risk > Reputational risk / Insurance operations > Bancassurance / 1H14 / Asset and liability matching
168
Additional local whistleblowing lines are in place in several countries, operated by Security and Fraud, Human Resources and Regulatory Compliance. When such lines are established, processes are put in place to escalate relevant disclosures made on the local whistleblowing lines to Global Regulatory Compliance or Financial Crime Compliance. Global Regulatory Compliance also monitors an external email address for complaints regarding accounting and internal financial controls or auditing matters ([email protected] highlighted under Investor Relations and Governance on www.hsbc.com). Cases received are escalated to the Group Chief Accounting Officer, Group Finance Director and Group Chief Executive as appropriate.
Reputational risk
Reputational risk can arise from issues, activities and associations that might pose a threat to the reputation of the Group, locally, regionally or internationally.
We continue to take steps to tackle the root causes of the deficiencies that, amongst other things, led to the Group entering into DPAs with various US authorities in relation to investigations regarding inadequate compliance with AML and sanctions law in December 2012.
A number of measures to address the requirements of the DPAs and otherwise to enhance our AML and sanctions compliance framework have been taken and/or are ongoing. These measures, which should also serve over time to enhance our reputational risk management, include the following:
• simplifying our business through the ongoing implementation of our Group strategy, including the adoption of a global financial crime risk filter, which should help to standardise our approach to doing business in higher risk countries;
• a substantial increase in resources and investment allocated to the two Compliance sub-functions (see ‘Compliance risk’ above);
• an increase in dedicated reputational risk resources in each region in which we operate and the introduction of a central case management and tracking process for reputational risk and client relationship matters;
• the creation of combined Reputational Risk and Client Selection committees within the global businesses with a clear process to escalate and address matters at the appropriate level;
• the continued provision of training and communication about the HSBC Values programme that defines the way everyone in the Group should act and seeks to ensure that the Values are embedded into our business as usual operations; and
• the ongoing development and implementation of Global Standards around financial crime compliance, which underpin our business. This includes ensuring globally consistent application of policies that govern AML and sanctions compliance provisions.
We have a zero tolerance for knowingly engaging in any business, activity or association where foreseeable reputational damage has not been considered and mitigated. There must be no barriers to open discussion and the escalation of issues that could impact negatively on HSBC. While there is a level of risk in every aspect of business activity, appropriate consideration of potential harm to HSBC’s good name must be a part of all business decisions.
Detecting and preventing illicit actors’ access to the global financial system calls for constant vigilance and we will continue to cooperate closely with all governments to achieve success. This is integral to the execution of our strategy, to HSBC Values and to preserving and enhancing our reputation.
The reputational risk policies and practices remain materially unchanged from those reported on page 294 of the Annual Report and Accounts 2013.
169
Ove
rvie
w
In
teri
m M
anag
emen
t R
epo
rt
D
irec
tors
Fin
anci
al S
tate
men
ts
A
dd
itio
nal
Info
rmat
ion
Risk management of insurance operations
HSBC’s bancassurance model ................................... 169
Risk management of insurance operations in the first half of 2014 ...................................................... 169
Asset and liability matching ....................................... 169 – Balance sheet of insurance manufacturing
subsidiaries by type of contract ............................ 170
Insurance risk .............................................................. 171 Analysis of life insurance risk – liabilities under
insurance contracts ................................................... 172
The majority of the risk in our insurance business derives from manufacturing activities and can be categorised as insurance risk and financial risk. Insurance risk is the risk, other than financial risk, of loss transferred from the holder of the insurance contract to the issuer (HSBC). Financial risks include market risk, credit risk and liquidity risk. There have been no material changes to our policies and practices for the management of risks arising in the insurance operations.
A summary of HSBC’s policies and practices regarding the risk management of insurance operations, and the main contracts we manufacture, are provided in the Appendix to Risk on page 290 of the Annual Report and Accounts 2013.
HSBC’s bancassurance model
We operate an integrated bancassurance model which provides insurance products principally for customers with whom we have a banking relationship. Insurance products are sold through all global businesses, but predominantly by RBWM and CMB, through our branches and direct channels worldwide.
The insurance contracts we sell relate to the underlying needs of our banking customers, which we can identify from our point-of-sale contacts and customer knowledge. The majority of sales are of savings and investment products and term and credit life contracts. By focusing largely on personal and SME lines of business we are able to optimise volumes and diversify individual insurance risks.
Where we have operational scale and risk appetite, mostly in life insurance, these insurance products are manufactured by HSBC subsidiaries. Manufacturing insurance allows us to retain the
risks and rewards associated with writing insurance contracts by keeping part of the underwriting profit, investment income and distribution commission within the Group.
Where we do not have the risk appetite or operational scale to be an effective insurance manufacturer, we engage with a handful of leading external insurance companies in order to provide insurance products to our customers through our banking network and direct channels. These arrangements are generally structured with our exclusive strategic partners and earn the Group a combination of commissions, fees and a share of profits.
We distribute insurance products in all of our geographical regions. We have core life insurance manufacturing entities, the majority of which are direct subsidiaries of legal banking entities, in seven countries (Argentina, Brazil, Mexico, France, the UK, Hong Kong and Singapore). There are also life insurance manufacturing subsidiaries in mainland China, Ireland (in run-off), Malaysia and Malta.
Risk management of insurance operations in the first half of 2014
The risk profile of our life insurance manufacturing businesses did not change materially during the first half of 2014 despite the increase in liabilities under insurance contracts to US$75bn (2013: US$74bn). This growth in liabilities largely resulted from new premiums received during 2014 and market value gains on underlying financial assets, partially offset by the transfer of some of these liabilities to ‘Liabilities of disposal groups held for sale’ during the period when HSBC entered into an agreement to sell its UK Pensions business.
Asset and liability matching
A principal tool used to manage exposures to both financial and insurance risk, in particular for life insurance contracts, is asset and liability matching. In many markets in which we operate it is neither possible nor appropriate to follow a perfect asset and liability matching strategy. For long-dated non-linked contracts, in particular, this results in a duration mismatch between assets and liabilities. We therefore structure portfolios to support projected liabilities from non-linked contracts.
In the absence of insurable events occurring, unit-linked contracts match assets more directly with liabilities. This results in the policyholder bearing the majority of the financial risk exposure.
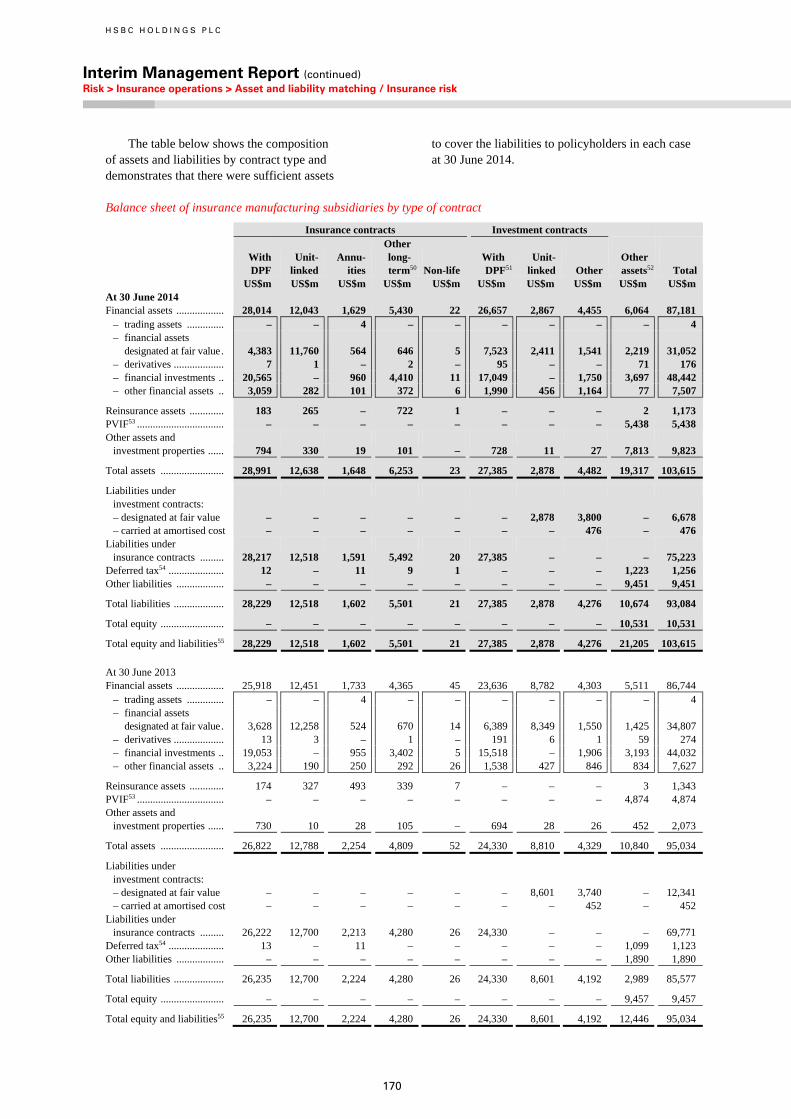
H S B C H O L D I N G S P L C
Interim Management Report (continued) Risk > Insurance operations > Asset and liability matching / Insurance risk
170
The table below shows the composition of assets and liabilities by contract type and demonstrates that there were sufficient assets
to cover the liabilities to policyholders in each case at 30 June 2014.
Balance sheet of insurance manufacturing subsidiaries by type of contract
Insurance contracts Investment contracts
With DPF
Unit- linked
Annu- ities
Otherlong- term50
Unit- linked
Other
Other assets52 Total Non-life
With DPF51
US$m US$m US$m US$m US$m US$m US$m US$m US$m US$m At 30 June 2014 Financial assets .................. 28,014 12,043 1,629 5,430 22 26,657 2,867 4,455 6,064 87,181
– trading assets .............. – – 4 – – – – – – 4 – financial assets
designated at fair value . 4,383 11,760 564 646 5 7,523 2,411 1,541 2,219 31,052 – derivatives ................... 7 1 – 2 – 95 – – 71 176 – financial investments .. 20,565 – 960 4,410 11 17,049 – 1,750 3,697 48,442 – other financial assets .. 3,059 282 101 372 6 1,990 456 1,164 77 7,507
Reinsurance assets ............. 183 265 – 722 1 – – – 2 1,173 PVIF53 ................................. – – – – – – – – 5,438 5,438 Other assets and
investment properties ...... 794 330 19 101 – 728 11 27 7,813 9,823
Total assets ........................ 28,991 12,638 1,648 6,253 23 27,385 2,878 4,482 19,317 103,615
Liabilities under investment contracts: – designated at fair value – – – – – – 2,878 3,800 – 6,678 – carried at amortised cost – – – – – – – 476 – 476
Liabilities under insurance contracts ......... 28,217 12,518 1,591 5,492 20 27,385 – – – 75,223
Deferred tax54 ..................... 12 – 11 9 1 – – – 1,223 1,256 Other liabilities .................. – – – – – – – – 9,451 9,451
Total liabilities ................... 28,229 12,518 1,602 5,501 21 27,385 2,878 4,276 10,674 93,084
Total equity ........................ – – – – – – – – 10,531 10,531
Total equity and liabilities55 28,229 12,518 1,602 5,501 21 27,385 2,878 4,276 21,205 103,615
At 30 June 2013 Financial assets .................. 25,918 12,451 1,733 4,365 45 23,636 8,782 4,303 5,511 86,744
– trading assets .............. – – 4 – – – – – – 4 – financial assets
designated at fair value . 3,628 12,258 524 670 14 6,389 8,349 1,550 1,425 34,807 – derivatives ................... 13 3 – 1 – 191 6 1 59 274 – financial investments .. 19,053 – 955 3,402 5 15,518 – 1,906 3,193 44,032 – other financial assets .. 3,224 190 250 292 26 1,538 427 846 834 7,627
Reinsurance assets ............. 174 327 493 339 7 – – – 3 1,343 PVIF53 ................................. – – – – – – – – 4,874 4,874 Other assets and
investment properties ...... 730 10 28 105 – 694 28 26 452 2,073
Total assets ........................ 26,822 12,788 2,254 4,809 52 24,330 8,810 4,329 10,840 95,034
Liabilities under investment contracts: – designated at fair value – – – – – – 8,601 3,740 – 12,341 – carried at amortised cost – – – – – – – 452 – 452
Liabilities under insurance contracts ......... 26,222 12,700 2,213 4,280 26 24,330 – – – 69,771
Deferred tax54 ..................... 13 – 11 – – – – – 1,099 1,123 Other liabilities .................. – – – – – – – – 1,890 1,890
Total liabilities ................... 26,235 12,700 2,224 4,280 26 24,330 8,601 4,192 2,989 85,577
Total equity ........................ – – – – – – – – 9,457 9,457
Total equity and liabilities55 26,235 12,700 2,224 4,280 26 24,330 8,601 4,192 12,446 95,034
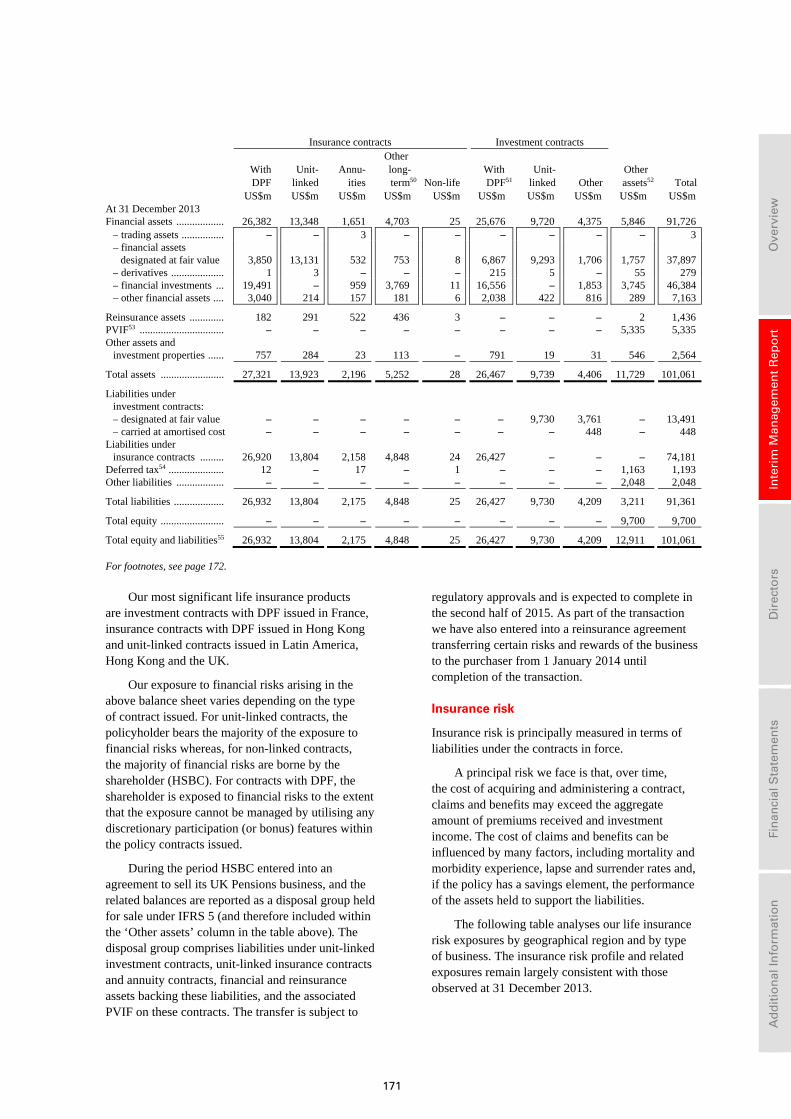
171
Ove
rvie
w
In
teri
m M
anag
emen
t R
epo
rt
D
irec
tors
Fin
anci
al S
tate
men
ts
A
dd
itio
nal
Info
rmat
ion
Insurance contracts Investment contracts
With DPF
Unit- linked
Annu- ities
Other long- term50
Unit- linked
Other
Other assets52 Total Non-life
With DPF51
US$m US$m US$m US$m US$m US$m US$m US$m US$m US$m At 31 December 2013 Financial assets .................. 26,382 13,348 1,651 4,703 25 25,676 9,720 4,375 5,846 91,726
– trading assets ................ – – 3 – – – – – – 3– financial assets
designated at fair value 3,850 13,131 532 753 8 6,867 9,293 1,706 1,757 37,897– derivatives .................... 1 3 – – – 215 5 – 55 279– financial investments ... 19,491 – 959 3,769 11 16,556 – 1,853 3,745 46,384– other financial assets .... 3,040 214 157 181 6 2,038 422 816 289 7,163
Reinsurance assets ............. 182 291 522 436 3 – – – 2 1,436PVIF53 ................................ – – – – – – – – 5,335 5,335 Other assets and
investment properties ...... 757 284 23 113 – 791 19 31 546 2,564
Total assets ........................ 27,321 13,923 2,196 5,252 28 26,467 9,739 4,406 11,729 101,061
Liabilities under investment contracts: – designated at fair value – – – – – – 9,730 3,761 – 13,491– carried at amortised cost – – – – – – – 448 – 448
Liabilities under insurance contracts ......... 26,920 13,804 2,158 4,848 24 26,427 – – – 74,181
Deferred tax54 ..................... 12 – 17 – 1 – – – 1,163 1,193Other liabilities .................. – – – – – – – – 2,048 2,048
Total liabilities ................... 26,932 13,804 2,175 4,848 25 26,427 9,730 4,209 3,211 91,361
Total equity ........................ – – – – – – – – 9,700 9,700
Total equity and liabilities55 26,932 13,804 2,175 4,848 25 26,427 9,730 4,209 12,911 101,061
For footnotes, see page 172.
Our most significant life insurance products are investment contracts with DPF issued in France, insurance contracts with DPF issued in Hong Kong and unit-linked contracts issued in Latin America, Hong Kong and the UK.
Our exposure to financial risks arising in the above balance sheet varies depending on the type of contract issued. For unit-linked contracts, the policyholder bears the majority of the exposure to financial risks whereas, for non-linked contracts, the majority of financial risks are borne by the shareholder (HSBC). For contracts with DPF, the shareholder is exposed to financial risks to the extent that the exposure cannot be managed by utilising any discretionary participation (or bonus) features within the policy contracts issued.
During the period HSBC entered into an agreement to sell its UK Pensions business, and the related balances are reported as a disposal group held for sale under IFRS 5 (and therefore included within the ‘Other assets’ column in the table above). The disposal group comprises liabilities under unit-linked investment contracts, unit-linked insurance contracts and annuity contracts, financial and reinsurance assets backing these liabilities, and the associated PVIF on these contracts. The transfer is subject to
regulatory approvals and is expected to complete in the second half of 2015. As part of the transaction we have also entered into a reinsurance agreement transferring certain risks and rewards of the business to the purchaser from 1 January 2014 until completion of the transaction.
Insurance risk
Insurance risk is principally measured in terms of liabilities under the contracts in force.
A principal risk we face is that, over time, the cost of acquiring and administering a contract, claims and benefits may exceed the aggregate amount of premiums received and investment income. The cost of claims and benefits can be influenced by many factors, including mortality and morbidity experience, lapse and surrender rates and, if the policy has a savings element, the performance of the assets held to support the liabilities.
The following table analyses our life insurance risk exposures by geographical region and by type of business. The insurance risk profile and related exposures remain largely consistent with those observed at 31 December 2013.
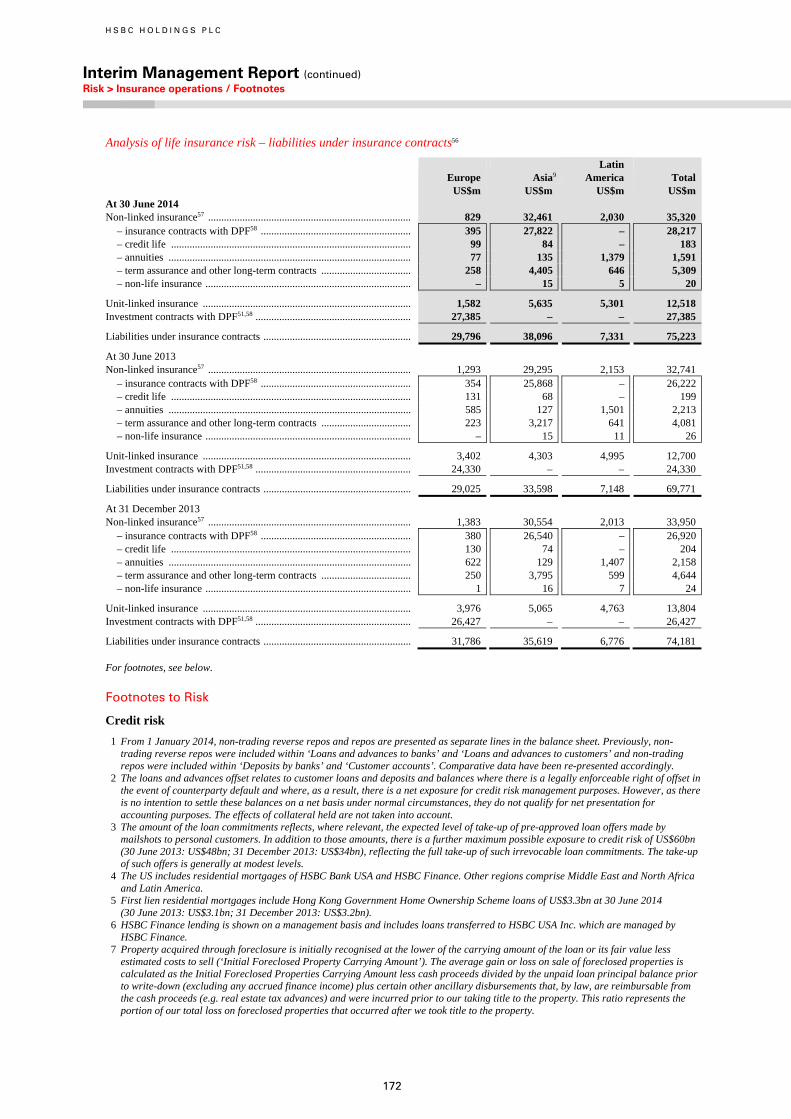
H S B C H O L D I N G S P L C
Interim Management Report (continued) Risk > Insurance operations / Footnotes
172
Analysis of life insurance risk – liabilities under insurance contracts56
Europe Asia9
Latin America Total
US$m US$m US$m US$m At 30 June 2014 Non-linked insurance57 ............................................................................. 829 32,461 2,030 35,320
– insurance contracts with DPF58 ......................................................... 395 27,822 – 28,217– credit life ........................................................................................... 99 84 – 183– annuities ............................................................................................ 77 135 1,379 1,591– term assurance and other long-term contracts .................................. 258 4,405 646 5,309– non-life insurance .............................................................................. – 15 5 20
Unit-linked insurance ............................................................................... 1,582 5,635 5,301 12,518 Investment contracts with DPF51,58 ........................................................... 27,385 – – 27,385
Liabilities under insurance contracts ........................................................ 29,796 38,096 7,331 75,223
At 30 June 2013 Non-linked insurance57 ............................................................................. 1,293 29,295 2,153 32,741
– insurance contracts with DPF58 ......................................................... 354 25,868 – 26,222– credit life ........................................................................................... 131 68 – 199– annuities ............................................................................................ 585 127 1,501 2,213– term assurance and other long-term contracts .................................. 223 3,217 641 4,081– non-life insurance .............................................................................. – 15 11 26
Unit-linked insurance ............................................................................... 3,402 4,303 4,995 12,700 Investment contracts with DPF51,58 ........................................................... 24,330 – – 24,330
Liabilities under insurance contracts ........................................................ 29,025 33,598 7,148 69,771
At 31 December 2013 Non-linked insurance57 ............................................................................. 1,383 30,554 2,013 33,950
– insurance contracts with DPF58 ......................................................... 380 26,540 – 26,920– credit life ........................................................................................... 130 74 – 204– annuities ............................................................................................ 622 129 1,407 2,158– term assurance and other long-term contracts .................................. 250 3,795 599 4,644– non-life insurance .............................................................................. 1 16 7 24
Unit-linked insurance ............................................................................... 3,976 5,065 4,763 13,804 Investment contracts with DPF51,58 ........................................................... 26,427 – – 26,427
Liabilities under insurance contracts ........................................................ 31,786 35,619 6,776 74,181
For footnotes, see below.
Footnotes to Risk
Credit risk
1 From 1 January 2014, non-trading reverse repos and repos are presented as separate lines in the balance sheet. Previously, non-trading reverse repos were included within ‘Loans and advances to banks’ and ‘Loans and advances to customers’ and non-trading repos were included within ‘Deposits by banks’ and ‘Customer accounts’. Comparative data have been re-presented accordingly.
2 The loans and advances offset relates to customer loans and deposits and balances where there is a legally enforceable right of offset in the event of counterparty default and where, as a result, there is a net exposure for credit risk management purposes. However, as there is no intention to settle these balances on a net basis under normal circumstances, they do not qualify for net presentation for accounting purposes. The effects of collateral held are not taken into account.
3 The amount of the loan commitments reflects, where relevant, the expected level of take-up of pre-approved loan offers made by mailshots to personal customers. In addition to those amounts, there is a further maximum possible exposure to credit risk of US$60bn (30 June 2013: US$48bn; 31 December 2013: US$34bn), reflecting the full take-up of such irrevocable loan commitments. The take-up of such offers is generally at modest levels.
4 The US includes residential mortgages of HSBC Bank USA and HSBC Finance. Other regions comprise Middle East and North Africa and Latin America.
5 First lien residential mortgages include Hong Kong Government Home Ownership Scheme loans of US$3.3bn at 30 June 2014 (30 June 2013: US$3.1bn; 31 December 2013: US$3.2bn).
6 HSBC Finance lending is shown on a management basis and includes loans transferred to HSBC USA Inc. which are managed by HSBC Finance.
7 Property acquired through foreclosure is initially recognised at the lower of the carrying amount of the loan or its fair value less estimated costs to sell (‘Initial Foreclosed Property Carrying Amount’). The average gain or loss on sale of foreclosed properties is calculated as the Initial Foreclosed Properties Carrying Amount less cash proceeds divided by the unpaid loan principal balance prior to write-down (excluding any accrued finance income) plus certain other ancillary disbursements that, by law, are reimbursable from the cash proceeds (e.g. real estate tax advances) and were incurred prior to our taking title to the property. This ratio represents the portion of our total loss on foreclosed properties that occurred after we took title to the property.
173
Ove
rvie
w
In
teri
m M
anag
emen
t R
epo
rt
D
irec
tors
Fin
anci
al S
tate
men
ts
A
dd
itio
nal
Info
rmat
ion
8 The average total loss on foreclosed properties includes both the loss on sale of the foreclosed property as discussed in footnote 6 and the cumulative write-downs recognised on the loans up to the time we took title to the property. This calculation of the average total loss on foreclosed properties uses the unpaid loan principal balance prior to write-down (excluding any accrued finance income) plus certain other ancillary disbursements that, by law, are reimbursable from the cash proceeds (e.g. real estate tax advances) and were incurred prior to our taking title to the property.
9 From 1 January 2014, the geographical region ‘Asia’ replaced the geographical regions previously reported as ‘Hong Kong’ and ‘Rest of Asia-Pacific’ (see Note 23 on the Financial Statements for further details). Comparative data have been re-presented to reflect this change.
10 ‘Other commercial loans and advances’ includes advances in respect of agriculture, transport, energy and utilities. 11 For the purpose of this disclosure, retail loans which are past due up to 89 days and are not otherwise classified as impaired in
accordance with our disclosure convention (see page 185 in the Annual Report and Accounts 2013), are not disclosed within the expected loss (‘EL’) grade to which they relate, but are separately classified as past due but not impaired.
12 Impairment allowances are not reported for financial instruments whereby the carrying amount is reduced directly for impairment and not through the use of an allowance account.
13 Impairment is not measured for assets held in trading portfolios or designated at fair value as assets in such portfolios are managed according to movements in fair value, and the fair value movement is taken directly to the income statement. Consequently, we report all such balances under ‘Neither past due nor impaired’.
14 Loans and advances to customers include asset-backed securities that have been externally rated as strong (30 June 2014: US$1.8bn; 30 June 2013: US$2.0bn; 31 December 2013: US$1.7bn), good (30 June 2014: US$88m; 30 June 2013: US$348m; 31 December 2013: US$255m), satisfactory (30 June 2014: US$54m; 30 June 2013: US$338m; 31 December 2013: US$200m), sub-standard (30 June 2014: US$220m; 30 June 2013: US$493m; 31 December 2013: US$283m) and impaired (30 June 2014: US$321m; 30 June 2013: US$246m; 31 December 2013: US$259m).
15 Other personal loans and advances include second lien mortgages and other property-related lending. 16 Included in this category are loans of US$1.8bn (30 June 2013: US$2.1bn; 31 December 2013: US$1.9bn) that have been re-aged
once and were less than 60 days past due at the point of re-age. These loans are not classified as impaired following re-age due to the overall expectation that these customers will perform on the original contractual terms of their borrowing in the future.
17 Impaired loans and advances are those classified as CRR 9, CRR 10, EL 9 or EL 10, retail loans 90 days or more past due, unless individually they have been assessed as not impaired (see page 272 in the Annual Report and Accounts 2013, ‘Past due but not impaired gross financial instruments’) and renegotiated loans and advances meeting the criteria to be disclosed as impaired (see page 130).
18 Collectively assessed loans and advances comprise homogeneous groups of loans that are not considered individually significant, and loans subject to individual assessment where no impairment has been identified on an individual basis, but on which a collective impairment allowance has been calculated to reflect losses which have been incurred but not yet identified.
19 Collectively assessed loans and advances not impaired are those classified as CRR1 to CRR8 and EL1 to EL8 but excluding retail loans 90 days past due and renegotiated loans and advances meeting the criteria to be disclosed as impaired.
20 Net of settlement accounts and stock borrowings. 21 As a percentage of loans and advances to banks and loans and advances to customers, as applicable. 22 Included within ‘Exchange and other movements’ is US$0.2bn of impairment allowances reclassified to held for sale (30 June 2013:
nil; 31 December 2013: US$0.6bn). 23 ‘Currency translation adjustment’ is the effect of translating the results of subsidiaries and associates for the previous period at the
average rates of exchange applicable in the current period. 24 Negative numbers are favourable: positive numbers are unfavourable. 25 Equity securities not included. 26 Included within ‘Total gross loans and advances to customers’ is credit card lending of US$29.4bn (30 June 2013: US$28.9bn;
31 December 2013: US$30.6bn). 27 The impairment allowances on loans and advances to banks at 30 June 2014 and 30 June 2013 relate to the geographical regions,
Europe and Middle East and North Africa (31 December 2013: Europe, Middle East and North Africa and North America). 28 Carrying amount of the net principal exposure. 29 Includes holdings of ABSs issued by The Federal Home Loan Mortgage Corporation (‘Freddie Mac’) and The Federal National
Mortgage Association (‘Fannie Mae’). 30 ‘Directly held’ includes assets held by Solitaire where we provide first loss protection and assets held directly by the Group. 31 ‘Effect of impairments’ represents the reduction or increase in the reserve on initial impairment and subsequent reversal of impairment
of the asset. 32 The gross principal is the redemption amount on maturity or, in the case of an amortising instrument, the sum of the future redemption
amounts through the residual life of the security. 33 A credit default swap (‘CDS’) gross protection is the gross principal of the underlying instrument that is protected by CDSs. 34 Net principal exposure is the gross principal amount of assets that are not protected by CDSs. It includes assets that benefit from
monoline protection, except where this protection is purchased with a CDS.
Liquidity and funding
35 The most favourable metrics are a smaller advances to core funding and a larger stressed one month coverage ratio. 36 HSBC UK comprises five legal entities; HSBC Bank plc (including all overseas branches), Marks and Spencer Financial Services
Limited, HSBC Private Bank (UK) Ltd, HFC Bank Ltd and HSBC Trust Company (UK) Limited, managed as a single operating entity, in line with the application of UK liquidity regulation as agreed with the PRA.
37 The Hongkong and Shanghai Banking Corporation represents the bank in Hong Kong including all overseas branches. Each branch is monitored and controlled for liquidity and funding risk purposes as a stand-alone operating entity.
38 HSBC USA represents the HSBC USA Inc. consolidated group; predominantly HSBC USA Inc. and HSBC Bank USA, NA. The HSBC USA Inc. consolidated group is managed as a single operating entity.
39 The total shown for other principal entities represents the combined position of all the other operating entities overseen directly by the Risk Management Meeting of the GMB.
40 Estimated liquidity value represents the expected realisable value of assets prior to management assumed haircuts. 41 The undrawn balance for the five largest committed liquidity facilities provided to customers other than facilities to conduits.
H S B C H O L D I N G S P L C
Interim Management Report (continued) Risk > Footnotes // Capital
174
42 The undrawn balance for the total of all committed liquidity facilities provided to the largest market sector, other than facilities to conduits.
Market risk
43 Trading portfolios comprise positions arising from the market-making and warehousing of customer-derived positions. 44 Portfolio diversification is the market risk dispersion effect of holding a portfolio containing different risk types. It represents the
reduction in unsystematic market risk that occurs when combining a number of different risk types, for example, interest rate, equity and foreign exchange, together in one portfolio. It is measured as the difference between the sum of the VaR by individual risk type and the combined total VaR. A negative number represents the benefit of portfolio diversification. As the maximum and minimum occur on different days for different risk types, it is not meaningful to calculate a portfolio diversification benefit for these measures.
45 The total VaR is non-additive across risk types due to diversification effects. 46 Hypothetical profit and loss is calculated by applying the day’s market moves to the previous day’s portfolio. Hypothetical profit and
loss excludes non-trading revenues such as fees and commissions, portfolio changes (e.g. new or expired deals) and carry (e.g. funding costs).
47 Investments in private equity are primarily made through managed funds that are subject to limits on the amount of investment. Potential new commitments are subject to risk appraisal to ensure that industry and geographical concentrations remain within acceptable levels for the portfolio as a whole. Regular reviews are performed to substantiate the valuation of the investments within the portfolio.
48 Investments held to facilitate ongoing business include holdings in government-sponsored enterprises and local stock exchanges. 49 Instead of assuming that all interest rates move together, we group our interest rate exposures into currency blocs whose rates are
considered likely to move together.
Risk management of insurance operations
50 Other-long term includes term assurance, credit life insurance and universal life insurance. 51 Although investment contracts with DPF are financial instruments, HSBC continues to account for them as insurance contracts as
permitted by IFRS 4. 52 The Other assets column shows shareholder assets as well as assets and liabilities classified as held for sale. The majority of the assets
for insurance businesses classified as held for sale are reported as ‘Other assets and investment properties’ and totalled US$7.3bn at 30 June 2014 (30 June 2013: US$0.1bn; 31 December 2013: nil). The majority of these assets were debt and equity securities. All liabilities for insurance businesses classified as held for sale are reported in ‘Other liabilities’ and totalled US$7.4bn at 30 June 2014 (30 June 2013: US$0.1bn; 31 December 2013: nil). The majority of these liabilities were liabilities under insurance contracts and liabilities under investment contracts.
53 Present value of in-force long-term insurance contracts and investment contracts with DPF. 54 Deferred tax includes the deferred tax liabilities arising on recognition of PVIF. 55 Does not include associated insurance company SABB Takaful Company or joint venture insurance company Canara HSBC Oriental
Bank of Commerce Life Insurance Company Limited. 56 HSBC has no insurance manufacturing subsidiaries in North America or the Middle East and North Africa. 57 Non-linked insurance includes remaining non-life business. 58 Insurance contracts and investment contracts with discretionary participation features (‘DPF’) can give policyholders the contractual
right to receive, as a supplement to their guaranteed benefits, additional benefits that may be a significant portion of the total contractual benefits, but whose amount and timing are determined by HSBC. These additional benefits are contractually based on the performance of a specified pool of contracts or assets, or the profit of the company issuing the contracts.
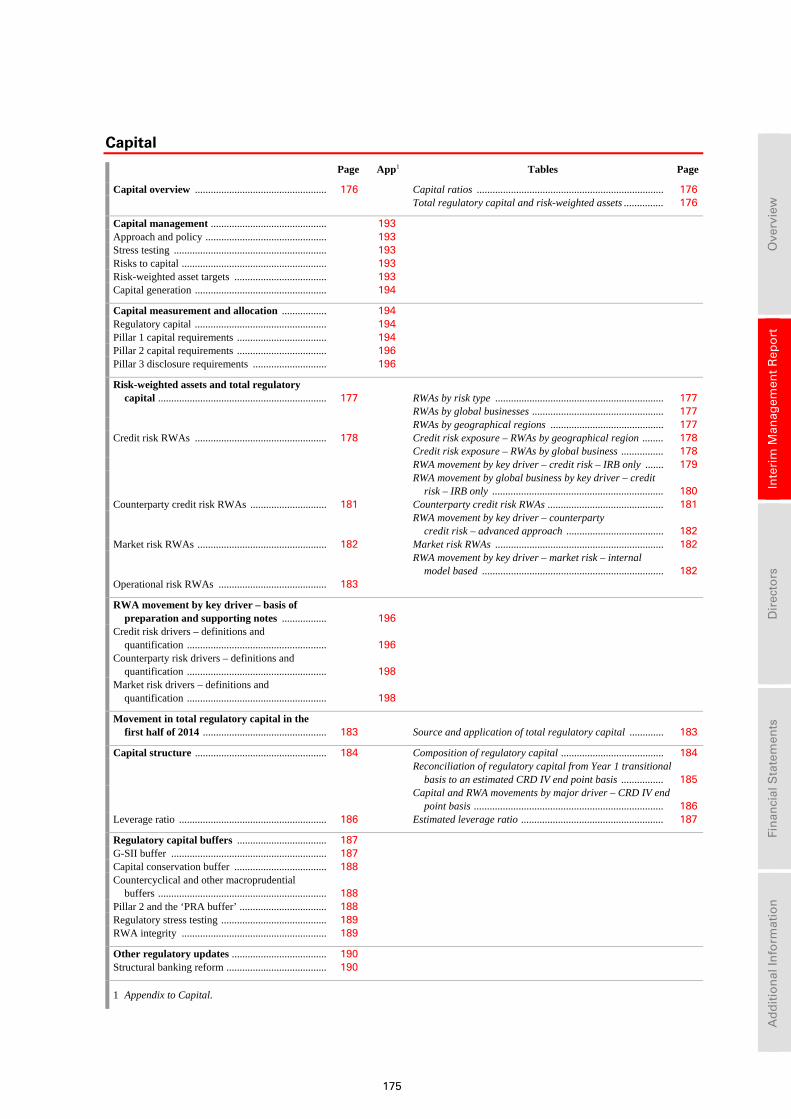
175
Ove
rvie
w
In
teri
m M
anag
emen
t R
epo
rt
D
irec
tors
Fin
anci
al S
tate
men
ts
A
dd
itio
nal
Info
rmat
ion
Capital
Page App1 Tables Page
Capital overview .................................................. 176 Capital ratios ....................................................................... 176 Total regulatory capital and risk-weighted assets ............... 176
Capital management ............................................ 193 Approach and policy .............................................. 193 Stress testing .......................................................... 193 Risks to capital ....................................................... 193 Risk-weighted asset targets ................................... 193 Capital generation .................................................. 194
Capital measurement and allocation ................. 194 Regulatory capital .................................................. 194 Pillar 1 capital requirements .................................. 194 Pillar 2 capital requirements .................................. 196 Pillar 3 disclosure requirements ............................ 196
Risk-weighted assets and total regulatory capital ................................................................ 177 RWAs by risk type ................................................................ 177
RWAs by global businesses .................................................. 177 RWAs by geographical regions ........................................... 177Credit risk RWAs .................................................. 178 Credit risk exposure – RWAs by geographical region ........ 178 Credit risk exposure – RWAs by global business ................ 178 RWA movement by key driver – credit risk – IRB only ....... 179
RWA movement by global business by key driver – credit
risk – IRB only ................................................................. 180Counterparty credit risk RWAs ............................. 181 Counterparty credit risk RWAs ............................................ 181
RWA movement by key driver – counterparty
credit risk – advanced approach ..................................... 182Market risk RWAs ................................................. 182 Market risk RWAs ................................................................ 182
RWA movement by key driver – market risk – internal
model based ..................................................................... 182Operational risk RWAs ......................................... 183
RWA movement by key driver – basis of preparation and supporting notes ................. 196
Credit risk drivers – definitions and quantification ..................................................... 196
Counterparty risk drivers – definitions and quantification ..................................................... 198
Market risk drivers – definitions and quantification ..................................................... 198
Movement in total regulatory capital in the first half of 2014 ............................................... 183 Source and application of total regulatory capital ............. 183
Capital structure .................................................. 184 Composition of regulatory capital ....................................... 184
Reconciliation of regulatory capital from Year 1 transitional
basis to an estimated CRD IV end point basis ................ 185
Capital and RWA movements by major driver – CRD IV end
point basis ........................................................................ 186Leverage ratio ........................................................ 186 Estimated leverage ratio ...................................................... 187
Regulatory capital buffers .................................. 187 G-SII buffer ........................................................... 187 Capital conservation buffer ................................... 188 Countercyclical and other macroprudential
buffers ................................................................ 188 Pillar 2 and the ‘PRA buffer’ ................................. 188 Regulatory stress testing ........................................ 189 RWA integrity ....................................................... 189
Other regulatory updates .................................... 190 Structural banking reform ...................................... 190
1 Appendix to Capital.
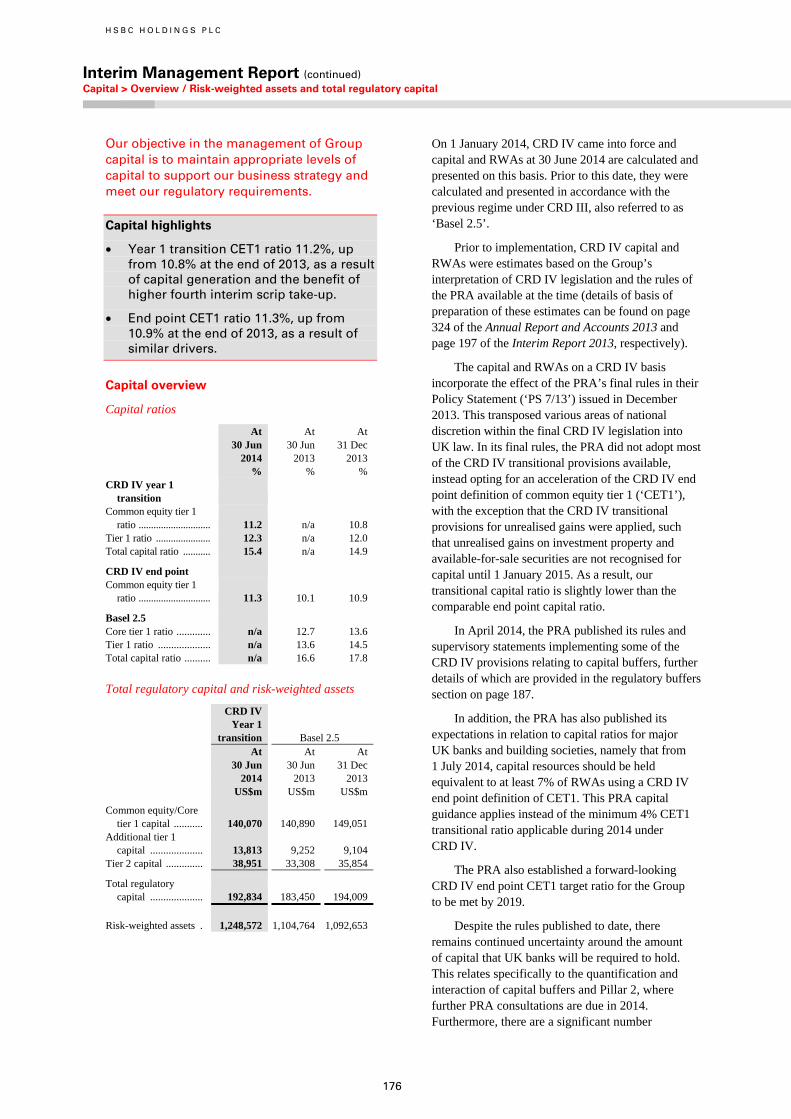
H S B C H O L D I N G S P L C
Interim Management Report (continued) Capital > Overview / Risk-weighted assets and total regulatory capital
176
Our objective in the management of Group capital is to maintain appropriate levels of capital to support our business strategy and meet our regulatory requirements.
Capital highlights
• Year 1 transition CET1 ratio 11.2%, up from 10.8% at the end of 2013, as a result of capital generation and the benefit of higher fourth interim scrip take-up.
• End point CET1 ratio 11.3%, up from 10.9% at the end of 2013, as a result of similar drivers.
Capital overview
Capital ratios
At At At 30 Jun 30 Jun 31 Dec 2014 2013 2013 % % % CRD IV year 1
transition Common equity tier 1
ratio ............................. 11.2 n/a 10.8 Tier 1 ratio ...................... 12.3 n/a 12.0 Total capital ratio ........... 15.4 n/a 14.9
CRD IV end point Common equity tier 1
ratio ............................. 11.3 10.1 10.9
Basel 2.5 Core tier 1 ratio ............. n/a 12.7 13.6 Tier 1 ratio .................... n/a 13.6 14.5 Total capital ratio .......... n/a 16.6 17.8
Total regulatory capital and risk-weighted assets
CRD IV
Basel 2.5 Year 1
transition
At At At 30 Jun 30 Jun 31 Dec 2014 2013 2013 US$m US$m US$m
Common equity/Core tier 1 capital ........... 140,070 140,890 149,051
Additional tier 1 capital .................... 13,813 9,252 9,104
Tier 2 capital .............. 38,951 33,308 35,854
Total regulatory capital .................... 192,834 183,450 194,009
Risk-weighted assets . 1,248,572 1,104,764 1,092,653
On 1 January 2014, CRD IV came into force and capital and RWAs at 30 June 2014 are calculated and presented on this basis. Prior to this date, they were calculated and presented in accordance with the previous regime under CRD III, also referred to as ‘Basel 2.5’.
Prior to implementation, CRD IV capital and RWAs were estimates based on the Group’s interpretation of CRD IV legislation and the rules of the PRA available at the time (details of basis of preparation of these estimates can be found on page 324 of the Annual Report and Accounts 2013 and page 197 of the Interim Report 2013, respectively).
The capital and RWAs on a CRD IV basis incorporate the effect of the PRA’s final rules in their Policy Statement (‘PS 7/13’) issued in December 2013. This transposed various areas of national discretion within the final CRD IV legislation into UK law. In its final rules, the PRA did not adopt most of the CRD IV transitional provisions available, instead opting for an acceleration of the CRD IV end point definition of common equity tier 1 (‘CET1’), with the exception that the CRD IV transitional provisions for unrealised gains were applied, such that unrealised gains on investment property and available-for-sale securities are not recognised for capital until 1 January 2015. As a result, our transitional capital ratio is slightly lower than the comparable end point capital ratio.
In April 2014, the PRA published its rules and supervisory statements implementing some of the CRD IV provisions relating to capital buffers, further details of which are provided in the regulatory buffers section on page 187.
In addition, the PRA has also published its expectations in relation to capital ratios for major UK banks and building societies, namely that from 1 July 2014, capital resources should be held equivalent to at least 7% of RWAs using a CRD IV end point definition of CET1. This PRA capital guidance applies instead of the minimum 4% CET1 transitional ratio applicable during 2014 under CRD IV.
The PRA also established a forward-looking CRD IV end point CET1 target ratio for the Group to be met by 2019.
Despite the rules published to date, there remains continued uncertainty around the amount of capital that UK banks will be required to hold. This relates specifically to the quantification and interaction of capital buffers and Pillar 2, where further PRA consultations are due in 2014. Furthermore, there are a significant number
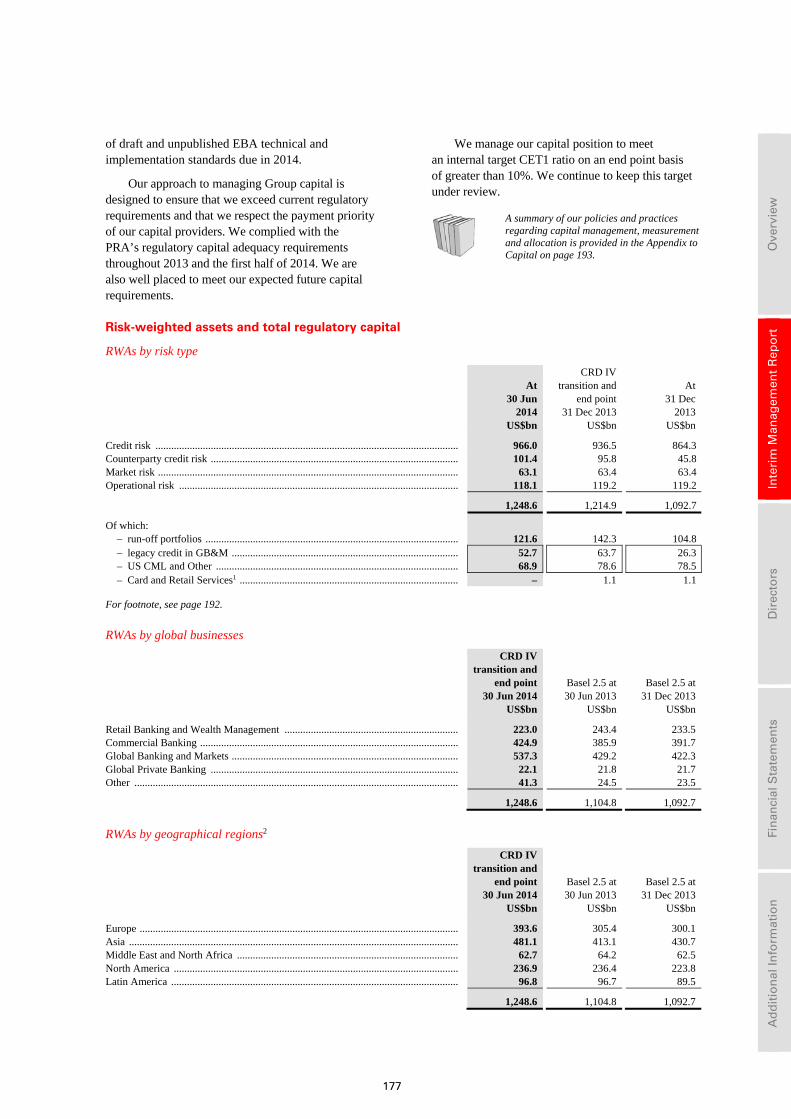
177
Ove
rvie
w
In
teri
m M
anag
emen
t R
epo
rt
D
irec
tors
Fin
anci
al S
tate
men
ts
A
dd
itio
nal
Info
rmat
ion
of draft and unpublished EBA technical and implementation standards due in 2014.
Our approach to managing Group capital is designed to ensure that we exceed current regulatory requirements and that we respect the payment priority of our capital providers. We complied with the PRA’s regulatory capital adequacy requirements throughout 2013 and the first half of 2014. We are also well placed to meet our expected future capital requirements.
We manage our capital position to meet an internal target CET1 ratio on an end point basis of greater than 10%. We continue to keep this target under review.
A summary of our policies and practices regarding capital management, measurement and allocation is provided in the Appendix to Capital on page 193.
Risk-weighted assets and total regulatory capital
RWAs by risk type
CRD IV At transition and At 30 Jun end point 31 Dec 2014 31 Dec 2013 2013 US$bn US$bn US$bn
Credit risk ................................................................................................................... 966.0 936.5 864.3Counterparty credit risk .............................................................................................. 101.4 95.8 45.8Market risk .................................................................................................................. 63.1 63.4 63.4Operational risk .......................................................................................................... 118.1 119.2 119.2
1,248.6 1,214.9 1,092.7
Of which: – run-off portfolios ................................................................................................ 121.6 142.3 104.8– legacy credit in GB&M ...................................................................................... 52.7 63.7 26.3– US CML and Other ............................................................................................ 68.9 78.6 78.5– Card and Retail Services1 ................................................................................... – 1.1 1.1
For footnote, see page 192.
RWAs by global businesses
CRD IV transition and
end point Basel 2.5 at
Basel 2.5 at 30 Jun 2014 30 Jun 2013 31 Dec 2013 US$bn US$bn US$bn
Retail Banking and Wealth Management .................................................................. 223.0 243.4 233.5 Commercial Banking .................................................................................................. 424.9 385.9 391.7 Global Banking and Markets ...................................................................................... 537.3 429.2 422.3 Global Private Banking .............................................................................................. 22.1 21.8 21.7 Other ........................................................................................................................... 41.3 24.5 23.5
1,248.6 1,104.8 1,092.7
RWAs by geographical regions2
CRD IV transition and
end point Basel 2.5 at
Basel 2.5 at 30 Jun 2014 30 Jun 2013 31 Dec 2013 US$bn US$bn US$bn
Europe ......................................................................................................................... 393.6 305.4 300.1 Asia ............................................................................................................................. 481.1 413.1 430.7 Middle East and North Africa .................................................................................... 62.7 64.2 62.5 North America ............................................................................................................ 236.9 236.4 223.8 Latin America ............................................................................................................. 96.8 96.7 89.5
1,248.6 1,104.8 1,092.7
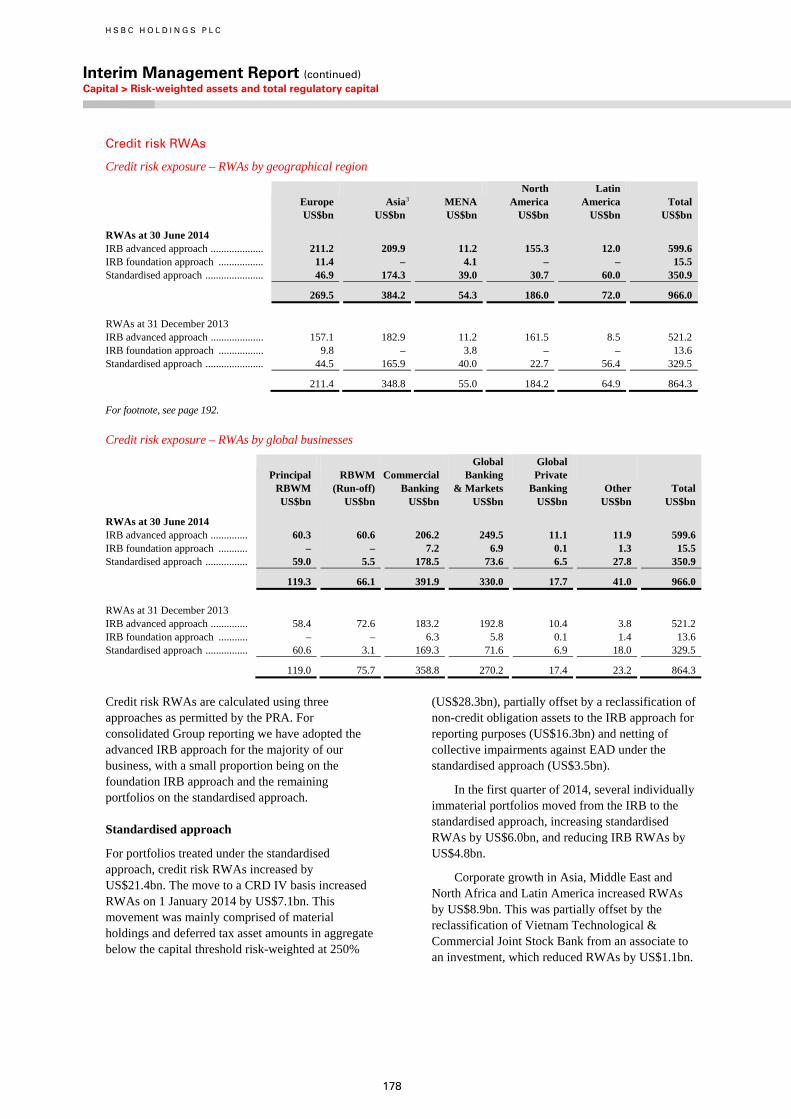
H S B C H O L D I N G S P L C
Interim Management Report (continued) Capital > Risk-weighted assets and total regulatory capital
178
Credit risk RWAs
Credit risk exposure – RWAs by geographical region
Europe Asia3 MENA North
America Latin
America Total US$bn US$bn US$bn US$bn US$bn US$bn
RWAs at 30 June 2014 IRB advanced approach .................... 211.2 209.9 11.2 155.3 12.0 599.6 IRB foundation approach ................. 11.4 – 4.1 – – 15.5 Standardised approach ...................... 46.9 174.3 39.0 30.7 60.0 350.9
269.5 384.2 54.3 186.0 72.0 966.0
RWAs at 31 December 2013 IRB advanced approach .................... 157.1 182.9 11.2 161.5 8.5 521.2 IRB foundation approach ................. 9.8 – 3.8 – – 13.6 Standardised approach ...................... 44.5 165.9 40.0 22.7 56.4 329.5
211.4 348.8 55.0 184.2 64.9 864.3
For footnote, see page 192.
Credit risk exposure – RWAs by global businesses
Principal
RBWM RBWM
(Run-off) Commercial
Banking
GlobalBanking
& Markets
Global Private
Banking Other Total US$bn US$bn US$bn US$bn US$bn US$bn US$bn
RWAs at 30 June 2014 IRB advanced approach .............. 60.3 60.6 206.2 249.5 11.1 11.9 599.6 IRB foundation approach ........... – – 7.2 6.9 0.1 1.3 15.5 Standardised approach ................ 59.0 5.5 178.5 73.6 6.5 27.8 350.9
119.3 66.1 391.9 330.0 17.7 41.0 966.0
RWAs at 31 December 2013 IRB advanced approach .............. 58.4 72.6 183.2 192.8 10.4 3.8 521.2 IRB foundation approach ........... – – 6.3 5.8 0.1 1.4 13.6 Standardised approach ................ 60.6 3.1 169.3 71.6 6.9 18.0 329.5
119.0 75.7 358.8 270.2 17.4 23.2 864.3
Credit risk RWAs are calculated using three approaches as permitted by the PRA. For consolidated Group reporting we have adopted the advanced IRB approach for the majority of our business, with a small proportion being on the foundation IRB approach and the remaining portfolios on the standardised approach.
Standardised approach
For portfolios treated under the standardised approach, credit risk RWAs increased by US$21.4bn. The move to a CRD IV basis increased RWAs on 1 January 2014 by US$7.1bn. This movement was mainly comprised of material holdings and deferred tax asset amounts in aggregate below the capital threshold risk-weighted at 250%
(US$28.3bn), partially offset by a reclassification of non-credit obligation assets to the IRB approach for reporting purposes (US$16.3bn) and netting of collective impairments against EAD under the standardised approach (US$3.5bn).
In the first quarter of 2014, several individually immaterial portfolios moved from the IRB to the standardised approach, increasing standardised RWAs by US$6.0bn, and reducing IRB RWAs by US$4.8bn.
Corporate growth in Asia, Middle East and North Africa and Latin America increased RWAs by US$8.9bn. This was partially offset by the reclassification of Vietnam Technological & Commercial Joint Stock Bank from an associate to an investment, which reduced RWAs by US$1.1bn.
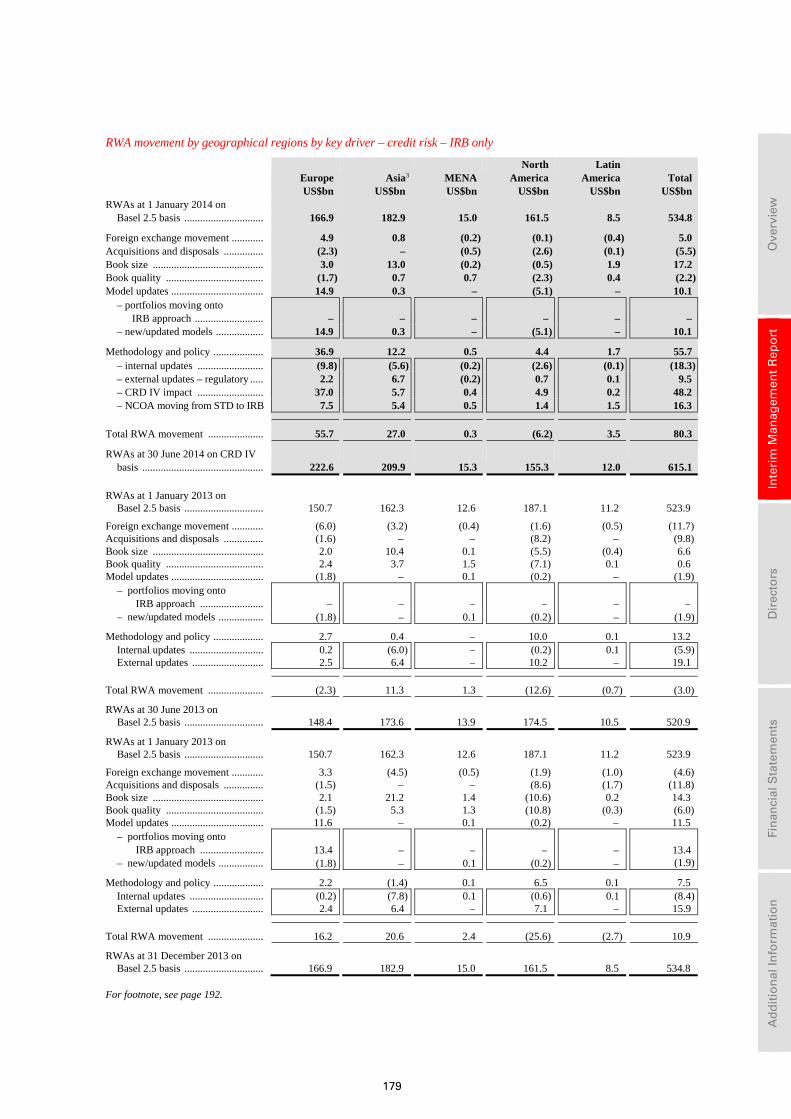
179
Ove
rvie
w
In
teri
m M
anag
emen
t R
epo
rt
D
irec
tors
Fin
anci
al S
tate
men
ts
A
dd
itio
nal
Info
rmat
ion
RWA movement by geographical regions by key driver – credit risk – IRB only
Europe Asia3 MENA North
America Latin
America Total US$bn US$bn US$bn US$bn US$bn US$bn RWAs at 1 January 2014 on
Basel 2.5 basis .............................. 166.9 182.9 15.0 161.5 8.5 534.8
Foreign exchange movement ............ 4.9 0.8 (0.2) (0.1) (0.4) 5.0 Acquisitions and disposals ............... (2.3) – (0.5) (2.6) (0.1) (5.5)Book size .......................................... 3.0 13.0 (0.2) (0.5) 1.9 17.2 Book quality ..................................... (1.7) 0.7 0.7 (2.3) 0.4 (2.2)Model updates ................................... 14.9 0.3 – (5.1) – 10.1
– portfolios moving onto IRB approach .......................... – – – – – –
– new/updated models .................. 14.9 0.3 – (5.1) – 10.1
Methodology and policy ................... 36.9 12.2 0.5 4.4 1.7 55.7 – internal updates ......................... (9.8) (5.6) (0.2) (2.6) (0.1) (18.3)– external updates – regulatory ..... 2.2 6.7 (0.2) 0.7 0.1 9.5 – CRD IV impact ......................... 37.0 5.7 0.4 4.9 0.2 48.2 – NCOA moving from STD to IRB 7.5 5.4 0.5 1.4 1.5 16.3
Total RWA movement ..................... 55.7 27.0 0.3 (6.2) 3.5 80.3
RWAs at 30 June 2014 on CRD IV basis .............................................. 222.6 209.9 15.3 155.3 12.0 615.1
RWAs at 1 January 2013 on
Basel 2.5 basis .............................. 150.7 162.3 12.6 187.1 11.2 523.9
Foreign exchange movement ............ (6.0) (3.2) (0.4) (1.6) (0.5) (11.7)Acquisitions and disposals ............... (1.6) – – (8.2) – (9.8)Book size .......................................... 2.0 10.4 0.1 (5.5) (0.4) 6.6Book quality ..................................... 2.4 3.7 1.5 (7.1) 0.1 0.6Model updates ................................... (1.8) – 0.1 (0.2) – (1.9)
– portfolios moving onto IRB approach ........................ – – – – – –
– new/updated models ................. (1.8) – 0.1 (0.2) – (1.9)
Methodology and policy ................... 2.7 0.4 – 10.0 0.1 13.2Internal updates ............................ 0.2 (6.0) – (0.2) 0.1 (5.9)External updates ........................... 2.5 6.4 – 10.2 – 19.1
Total RWA movement ..................... (2.3) 11.3 1.3 (12.6) (0.7) (3.0)
RWAs at 30 June 2013 on Basel 2.5 basis .............................. 148.4 173.6 13.9 174.5 10.5 520.9
RWAs at 1 January 2013 on Basel 2.5 basis .............................. 150.7 162.3 12.6 187.1 11.2 523.9
Foreign exchange movement ............ 3.3 (4.5) (0.5) (1.9) (1.0) (4.6)Acquisitions and disposals ............... (1.5) – – (8.6) (1.7) (11.8)Book size .......................................... 2.1 21.2 1.4 (10.6) 0.2 14.3Book quality ..................................... (1.5) 5.3 1.3 (10.8) (0.3) (6.0)Model updates ................................... 11.6 – 0.1 (0.2) – 11.5
– portfolios moving onto IRB approach ........................ 13.4 – – – – 13.4
– new/updated models ................. (1.8) – 0.1 (0.2) – (1.9)
Methodology and policy ................... 2.2 (1.4) 0.1 6.5 0.1 7.5Internal updates ............................ (0.2) (7.8) 0.1 (0.6) 0.1 (8.4)External updates ........................... 2.4 6.4 – 7.1 – 15.9
Total RWA movement ..................... 16.2 20.6 2.4 (25.6) (2.7) 10.9
RWAs at 31 December 2013 on Basel 2.5 basis .............................. 166.9 182.9 15.0 161.5 8.5 534.8
For footnote, see page 192.
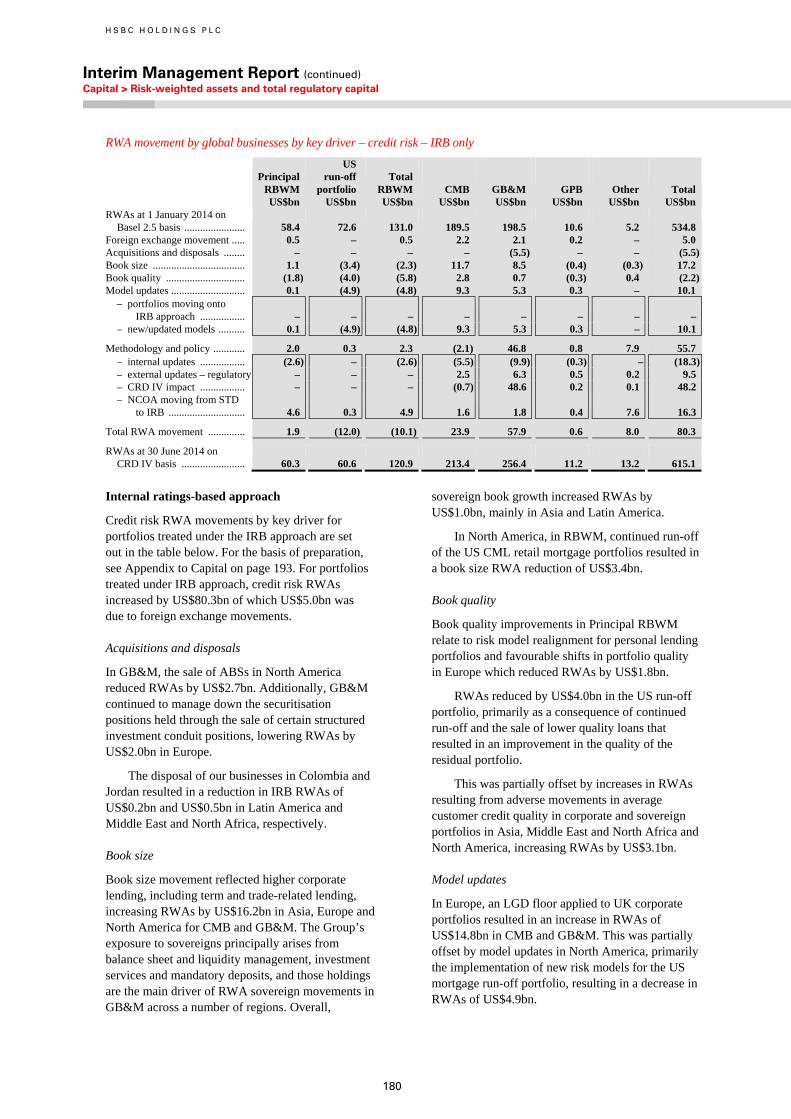
H S B C H O L D I N G S P L C
Interim Management Report (continued) Capital > Risk-weighted assets and total regulatory capital
180
RWA movement by global businesses by key driver – credit risk – IRB only
Principal RBWM
US run-off portfolio
Total RBWM CMB GB&M GPB Other Total
US$bn US$bn US$bn US$bn US$bn US$bn US$bn US$bn RWAs at 1 January 2014 on
Basel 2.5 basis ....................... 58.4 72.6 131.0 189.5 198.5 10.6 5.2 534.8 Foreign exchange movement ..... 0.5 – 0.5 2.2 2.1 0.2 – 5.0 Acquisitions and disposals ........ – – – – (5.5) – – (5.5)Book size ................................... 1.1 (3.4) (2.3) 11.7 8.5 (0.4) (0.3) 17.2 Book quality .............................. (1.8) (4.0) (5.8) 2.8 0.7 (0.3) 0.4 (2.2)Model updates ............................ 0.1 (4.9) (4.8) 9.3 5.3 0.3 – 10.1
– portfolios moving onto IRB approach ................. – – – – – – – –
– new/updated models .......... 0.1 (4.9) (4.8) 9.3 5.3 0.3 – 10.1
Methodology and policy ............ 2.0 0.3 2.3 (2.1) 46.8 0.8 7.9 55.7 – internal updates ................. (2.6) – (2.6) (5.5) (9.9) (0.3) – (18.3)– external updates – regulatory – – – 2.5 6.3 0.5 0.2 9.5– CRD IV impact ................. – – – (0.7) 48.6 0.2 0.1 48.2– NCOA moving from STD
to IRB ............................. 4.6 0.3 4.9 1.6 1.8 0.4 7.6 16.3
Total RWA movement .............. 1.9 (12.0) (10.1) 23.9 57.9 0.6 8.0 80.3
RWAs at 30 June 2014 on CRD IV basis ........................ 60.3 60.6 120.9 213.4 256.4 11.2 13.2 615.1
Internal ratings-based approach
Credit risk RWA movements by key driver for portfolios treated under the IRB approach are set out in the table below. For the basis of preparation, see Appendix to Capital on page 193. For portfolios treated under IRB approach, credit risk RWAs increased by US$80.3bn of which US$5.0bn was due to foreign exchange movements.
Acquisitions and disposals
In GB&M, the sale of ABSs in North America reduced RWAs by US$2.7bn. Additionally, GB&M continued to manage down the securitisation positions held through the sale of certain structured investment conduit positions, lowering RWAs by US$2.0bn in Europe.
The disposal of our businesses in Colombia and Jordan resulted in a reduction in IRB RWAs of US$0.2bn and US$0.5bn in Latin America and Middle East and North Africa, respectively.
Book size
Book size movement reflected higher corporate lending, including term and trade-related lending, increasing RWAs by US$16.2bn in Asia, Europe and North America for CMB and GB&M. The Group’s exposure to sovereigns principally arises from balance sheet and liquidity management, investment services and mandatory deposits, and those holdings are the main driver of RWA sovereign movements in GB&M across a number of regions. Overall,
sovereign book growth increased RWAs by US$1.0bn, mainly in Asia and Latin America.
In North America, in RBWM, continued run-off of the US CML retail mortgage portfolios resulted in a book size RWA reduction of US$3.4bn.
Book quality
Book quality improvements in Principal RBWM relate to risk model realignment for personal lending portfolios and favourable shifts in portfolio quality in Europe which reduced RWAs by US$1.8bn.
RWAs reduced by US$4.0bn in the US run-off portfolio, primarily as a consequence of continued run-off and the sale of lower quality loans that resulted in an improvement in the quality of the residual portfolio.
This was partially offset by increases in RWAs resulting from adverse movements in average customer credit quality in corporate and sovereign portfolios in Asia, Middle East and North Africa and North America, increasing RWAs by US$3.1bn.
Model updates
In Europe, an LGD floor applied to UK corporate portfolios resulted in an increase in RWAs of US$14.8bn in CMB and GB&M. This was partially offset by model updates in North America, primarily the implementation of new risk models for the US mortgage run-off portfolio, resulting in a decrease in RWAs of US$4.9bn.
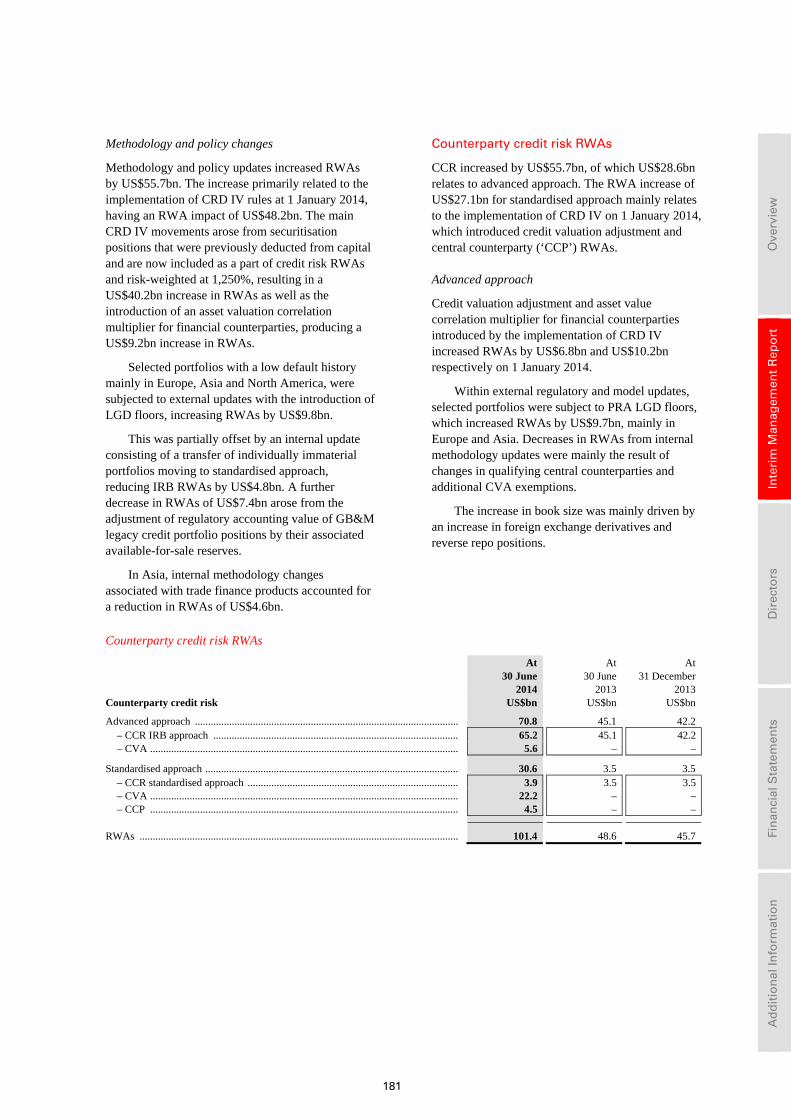
181
Ove
rvie
w
In
teri
m M
anag
emen
t R
epo
rt
D
irec
tors
Fin
anci
al S
tate
men
ts
A
dd
itio
nal
Info
rmat
ion
Methodology and policy changes
Methodology and policy updates increased RWAs by US$55.7bn. The increase primarily related to the implementation of CRD IV rules at 1 January 2014, having an RWA impact of US$48.2bn. The main CRD IV movements arose from securitisation positions that were previously deducted from capital and are now included as a part of credit risk RWAs and risk-weighted at 1,250%, resulting in a US$40.2bn increase in RWAs as well as the introduction of an asset valuation correlation multiplier for financial counterparties, producing a US$9.2bn increase in RWAs.
Selected portfolios with a low default history mainly in Europe, Asia and North America, were subjected to external updates with the introduction of LGD floors, increasing RWAs by US$9.8bn.
This was partially offset by an internal update consisting of a transfer of individually immaterial portfolios moving to standardised approach, reducing IRB RWAs by US$4.8bn. A further decrease in RWAs of US$7.4bn arose from the adjustment of regulatory accounting value of GB&M legacy credit portfolio positions by their associated available-for-sale reserves.
In Asia, internal methodology changes associated with trade finance products accounted for a reduction in RWAs of US$4.6bn.
Counterparty credit risk RWAs
CCR increased by US$55.7bn, of which US$28.6bn relates to advanced approach. The RWA increase of US$27.1bn for standardised approach mainly relates to the implementation of CRD IV on 1 January 2014, which introduced credit valuation adjustment and central counterparty (‘CCP’) RWAs.
Advanced approach
Credit valuation adjustment and asset value correlation multiplier for financial counterparties introduced by the implementation of CRD IV increased RWAs by US$6.8bn and US$10.2bn respectively on 1 January 2014.
Within external regulatory and model updates, selected portfolios were subject to PRA LGD floors, which increased RWAs by US$9.7bn, mainly in Europe and Asia. Decreases in RWAs from internal methodology updates were mainly the result of changes in qualifying central counterparties and additional CVA exemptions.
The increase in book size was mainly driven by an increase in foreign exchange derivatives and reverse repo positions.
Counterparty credit risk RWAs
At At At 30 June 30 June 31 December 2014 2013 2013 Counterparty credit risk US$bn US$bn US$bn
Advanced approach .................................................................................................... 70.8 45.1 42.2 – CCR IRB approach ............................................................................................. 65.2 45.1 42.2– CVA ..................................................................................................................... 5.6 – –
Standardised approach ................................................................................................ 30.6 3.5 3.5 – CCR standardised approach ................................................................................ 3.9 3.5 3.5– CVA ..................................................................................................................... 22.2 – –– CCP ..................................................................................................................... 4.5 – –
RWAs ......................................................................................................................... 101.4 48.6 45.7
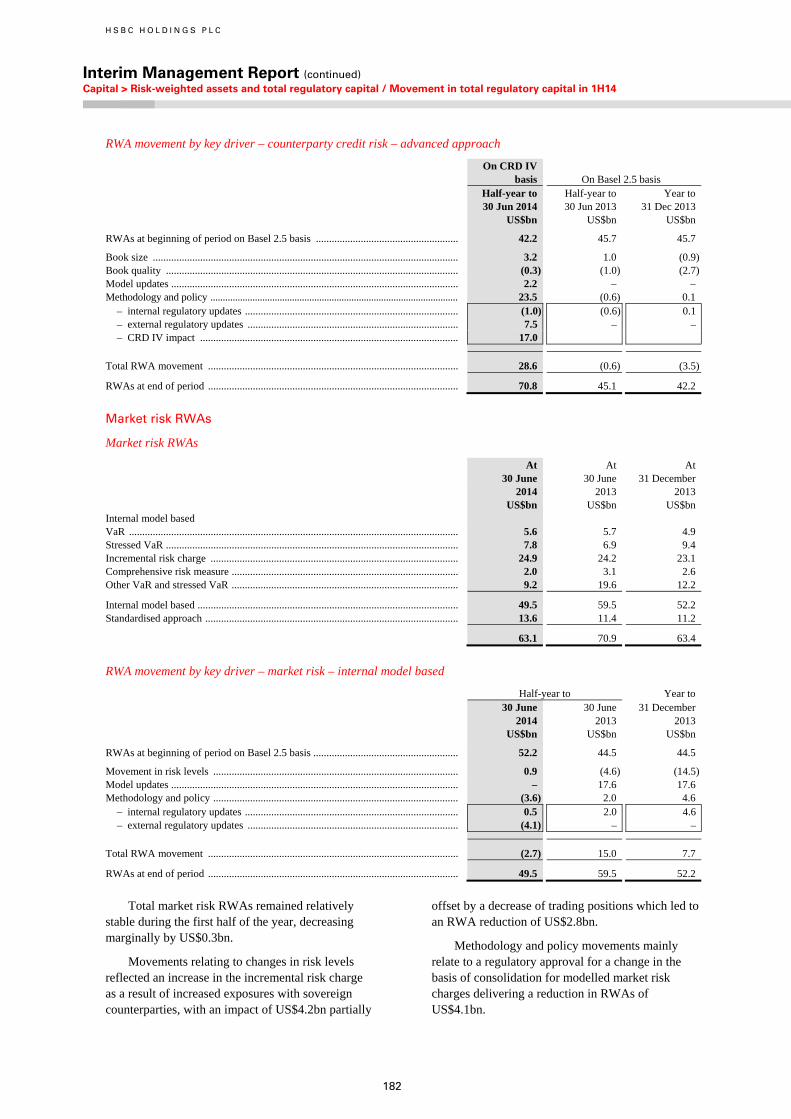
H S B C H O L D I N G S P L C
Interim Management Report (continued) Capital > Risk-weighted assets and total regulatory capital / Movement in total regulatory capital in 1H14
182
RWA movement by key driver – counterparty credit risk – advanced approach
On CRD IV basis On Basel 2.5 basis
Half-year to Half-year to Year to 30 Jun 2014 30 Jun 2013 31 Dec 2013 US$bn US$bn US$bn
RWAs at beginning of period on Basel 2.5 basis ...................................................... 42.2 45.7 45.7
Book size .................................................................................................................... 3.2 1.0 (0.9)Book quality ............................................................................................................... (0.3) (1.0) (2.7)Model updates ............................................................................................................. 2.2 – – Methodology and policy .................................................................................................... 23.5 (0.6) 0.1
– internal regulatory updates ................................................................................. (1.0) (0.6) 0.1– external regulatory updates ................................................................................ 7.5 – –– CRD IV impact .................................................................................................. 17.0
Total RWA movement ............................................................................................... 28.6 (0.6) (3.5)
RWAs at end of period ............................................................................................... 70.8 45.1 42.2
Market risk RWAs
Market risk RWAs
At At At 30 June 30 June 31 December 2014 2013 2013 US$bn US$bn US$bn Internal model based VaR ............................................................................................................................. 5.6 5.7 4.9 Stressed VaR ............................................................................................................... 7.8 6.9 9.4 Incremental risk charge .............................................................................................. 24.9 24.2 23.1 Comprehensive risk measure ...................................................................................... 2.0 3.1 2.6 Other VaR and stressed VaR ...................................................................................... 9.2 19.6 12.2
Internal model based ................................................................................................... 49.5 59.5 52.2 Standardised approach ................................................................................................ 13.6 11.4 11.2
63.1 70.9 63.4
RWA movement by key driver – market risk – internal model based
Half-year to Year to 30 June 30 June 31 December 2014 2013 2013 US$bn US$bn US$bn
RWAs at beginning of period on Basel 2.5 basis ....................................................... 52.2 44.5 44.5
Movement in risk levels ............................................................................................. 0.9 (4.6) (14.5)Model updates ............................................................................................................. – 17.6 17.6 Methodology and policy ............................................................................................. (3.6) 2.0 4.6
– internal regulatory updates ................................................................................. 0.5 2.0 4.6– external regulatory updates ................................................................................ (4.1) – –
Total RWA movement ............................................................................................... (2.7) 15.0 7.7
RWAs at end of period ............................................................................................... 49.5 59.5 52.2
Total market risk RWAs remained relatively
stable during the first half of the year, decreasing marginally by US$0.3bn.
Movements relating to changes in risk levels reflected an increase in the incremental risk charge as a result of increased exposures with sovereign counterparties, with an impact of US$4.2bn partially
offset by a decrease of trading positions which led to an RWA reduction of US$2.8bn.
Methodology and policy movements mainly relate to a regulatory approval for a change in the basis of consolidation for modelled market risk charges delivering a reduction in RWAs of US$4.1bn.
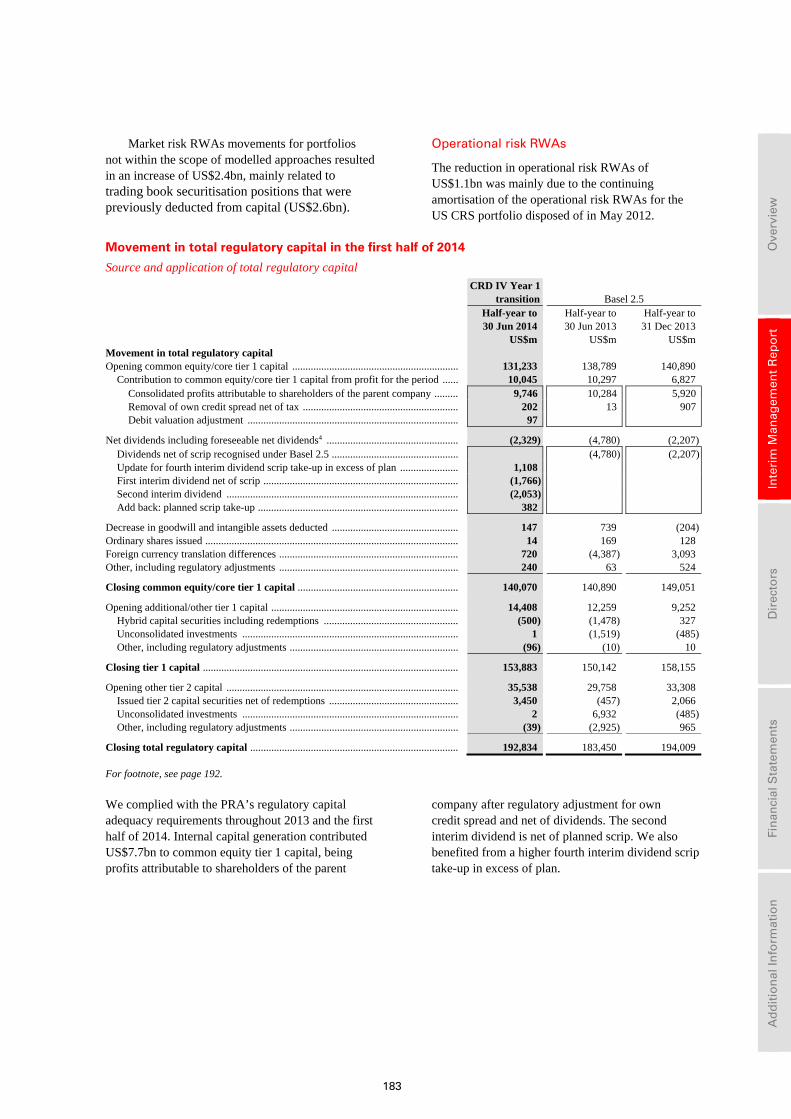
183
Ove
rvie
w
In
teri
m M
anag
emen
t R
epo
rt
D
irec
tors
Fin
anci
al S
tate
men
ts
A
dd
itio
nal
Info
rmat
ion
Market risk RWAs movements for portfolios not within the scope of modelled approaches resulted in an increase of US$2.4bn, mainly related to trading book securitisation positions that were previously deducted from capital (US$2.6bn).
Operational risk RWAs
The reduction in operational risk RWAs of US$1.1bn was mainly due to the continuing amortisation of the operational risk RWAs for the US CRS portfolio disposed of in May 2012.
Movement in total regulatory capital in the first half of 2014
Source and application of total regulatory capital
CRD IV Year 1 transition Basel 2.5
Half-year to 30 Jun 2014 US$m
Half-year to 30 Jun 2013 US$m
Half-year to 31 Dec 2013 US$m
Movement in total regulatory capital Opening common equity/core tier 1 capital ............................................................... 131,233 138,789 140,890
Contribution to common equity/core tier 1 capital from profit for the period ...... 10,045 10,297 6,827 Consolidated profits attributable to shareholders of the parent company ......... 9,746 10,284 5,920Removal of own credit spread net of tax ........................................................... 202 13 907Debit valuation adjustment ................................................................................ 97
Net dividends including foreseeable net dividends4 .................................................. (2,329) (4,780) (2,207)Dividends net of scrip recognised under Basel 2.5 ................................................ (4,780) (2,207)Update for fourth interim dividend scrip take-up in excess of plan ...................... 1,108 First interim dividend net of scrip .......................................................................... (1,766) Second interim dividend ........................................................................................ (2,053) Add back: planned scrip take-up ............................................................................ 382
Decrease in goodwill and intangible assets deducted ................................................ 147 739 (204)Ordinary shares issued ................................................................................................ 14 169 128 Foreign currency translation differences .................................................................... 720 (4,387) 3,093 Other, including regulatory adjustments .................................................................... 240 63 524
Closing common equity/core tier 1 capital ............................................................. 140,070 140,890 149,051
Opening additional/other tier 1 capital ....................................................................... 14,408 12,259 9,252 Hybrid capital securities including redemptions ................................................... (500) (1,478) 327 Unconsolidated investments .................................................................................. 1 (1,519) (485)Other, including regulatory adjustments ................................................................ (96) (10) 10
Closing tier 1 capital ................................................................................................. 153,883 150,142 158,155
Opening other tier 2 capital ........................................................................................ 35,538 29,758 33,308 Issued tier 2 capital securities net of redemptions ................................................. 3,450 (457) 2,066 Unconsolidated investments .................................................................................. 2 6,932 (485)Other, including regulatory adjustments ................................................................ (39) (2,925) 965
Closing total regulatory capital ............................................................................... 192,834 183,450 194,009
For footnote, see page 192.
We complied with the PRA’s regulatory capital adequacy requirements throughout 2013 and the first half of 2014. Internal capital generation contributed US$7.7bn to common equity tier 1 capital, being profits attributable to shareholders of the parent
company after regulatory adjustment for own credit spread and net of dividends. The second interim dividend is net of planned scrip. We also benefited from a higher fourth interim dividend scrip take-up in excess of plan.
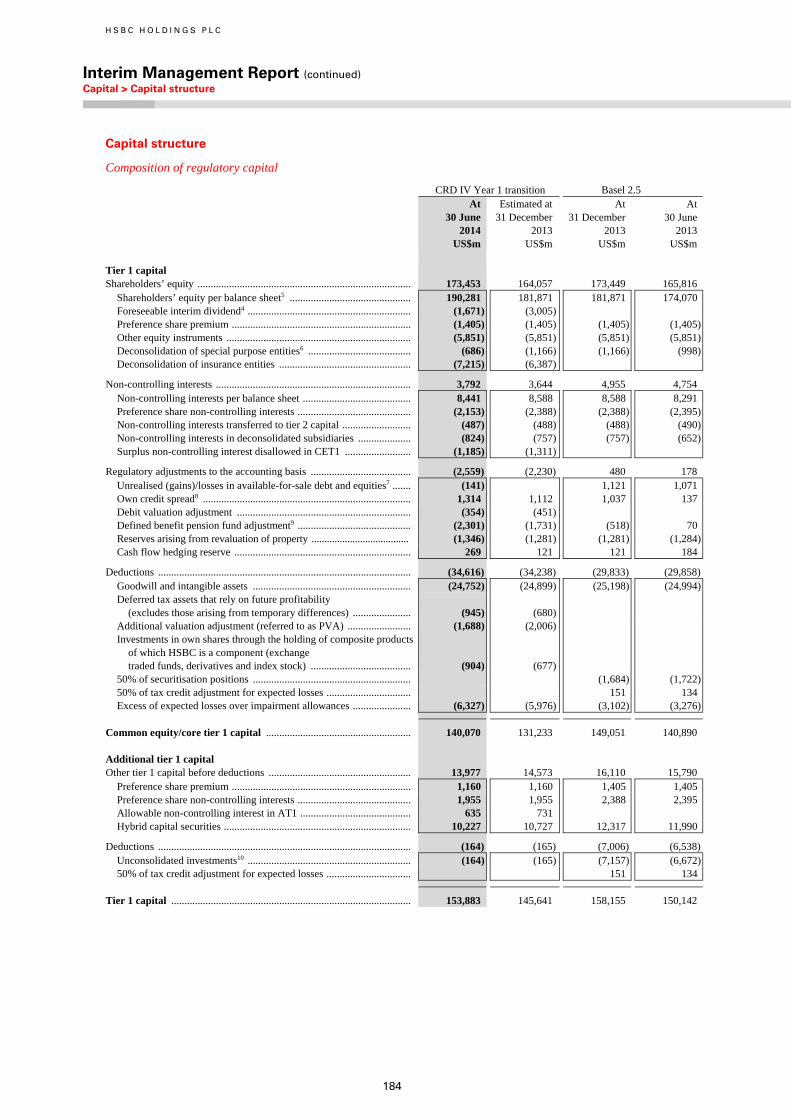
H S B C H O L D I N G S P L C
Interim Management Report (continued) Capital > Capital structure
184
Capital structure
Composition of regulatory capital
CRD IV Year 1 transition Basel 2.5 At 30 June 2014 US$m
Estimated at 31 December 2013 US$m
At 31 December 2013 US$m
At 30 June 2013 US$m
Tier 1 capital Shareholders’ equity ................................................................................. 173,453 164,057 173,449 165,816
Shareholders’ equity per balance sheet5 .............................................. 190,281 181,871 181,871 174,070Foreseeable interim dividend4 .............................................................. (1,671) (3,005) Preference share premium .................................................................... (1,405) (1,405) (1,405) (1,405)Other equity instruments ...................................................................... (5,851) (5,851) (5,851) (5,851)Deconsolidation of special purpose entities6 ....................................... (686) (1,166) (1,166) (998)Deconsolidation of insurance entities .................................................. (7,215) (6,387)
Non-controlling interests .......................................................................... 3,792 3,644 4,955 4,754 Non-controlling interests per balance sheet ......................................... 8,441 8,588 8,588 8,291Preference share non-controlling interests ........................................... (2,153) (2,388) (2,388) (2,395)Non-controlling interests transferred to tier 2 capital .......................... (487) (488) (488) (490)Non-controlling interests in deconsolidated subsidiaries .................... (824) (757) (757) (652)Surplus non-controlling interest disallowed in CET1 ......................... (1,185) (1,311)
Regulatory adjustments to the accounting basis ...................................... (2,559) (2,230) 480 178 Unrealised (gains)/losses in available-for-sale debt and equities7 ....... (141) 1,121 1,071Own credit spread8 ............................................................................... 1,314 1,112 1,037 137Debit valuation adjustment .................................................................. (354) (451) Defined benefit pension fund adjustment9 ........................................... (2,301) (1,731) (518) 70Reserves arising from revaluation of property ...................................... (1,346) (1,281) (1,281) (1,284)Cash flow hedging reserve ................................................................... 269 121 121 184
Deductions ................................................................................................ (34,616) (34,238) (29,833) (29,858)Goodwill and intangible assets ............................................................ (24,752) (24,899) (25,198) (24,994)Deferred tax assets that rely on future profitability
(excludes those arising from temporary differences) ...................... (945) (680) Additional valuation adjustment (referred to as PVA) ........................ (1,688) (2,006) Investments in own shares through the holding of composite products
of which HSBC is a component (exchange traded funds, derivatives and index stock) ...................................... (904) (677)
50% of securitisation positions ............................................................ (1,684) (1,722)50% of tax credit adjustment for expected losses ................................ 151 134Excess of expected losses over impairment allowances ...................... (6,327) (5,976) (3,102) (3,276)
Common equity/core tier 1 capital ....................................................... 140,070 131,233 149,051 140,890 Additional tier 1 capital Other tier 1 capital before deductions ...................................................... 13,977 14,573 16,110 15,790
Preference share premium .................................................................... 1,160 1,160 1,405 1,405Preference share non-controlling interests ........................................... 1,955 1,955 2,388 2,395Allowable non-controlling interest in AT1 .......................................... 635 731 Hybrid capital securities ....................................................................... 10,227 10,727 12,317 11,990
Deductions ................................................................................................ (164) (165) (7,006) (6,538)Unconsolidated investments10 .............................................................. (164) (165) (7,157) (6,672)50% of tax credit adjustment for expected losses ................................ 151 134
Tier 1 capital ........................................................................................... 153,883 145,641 158,155 150,142
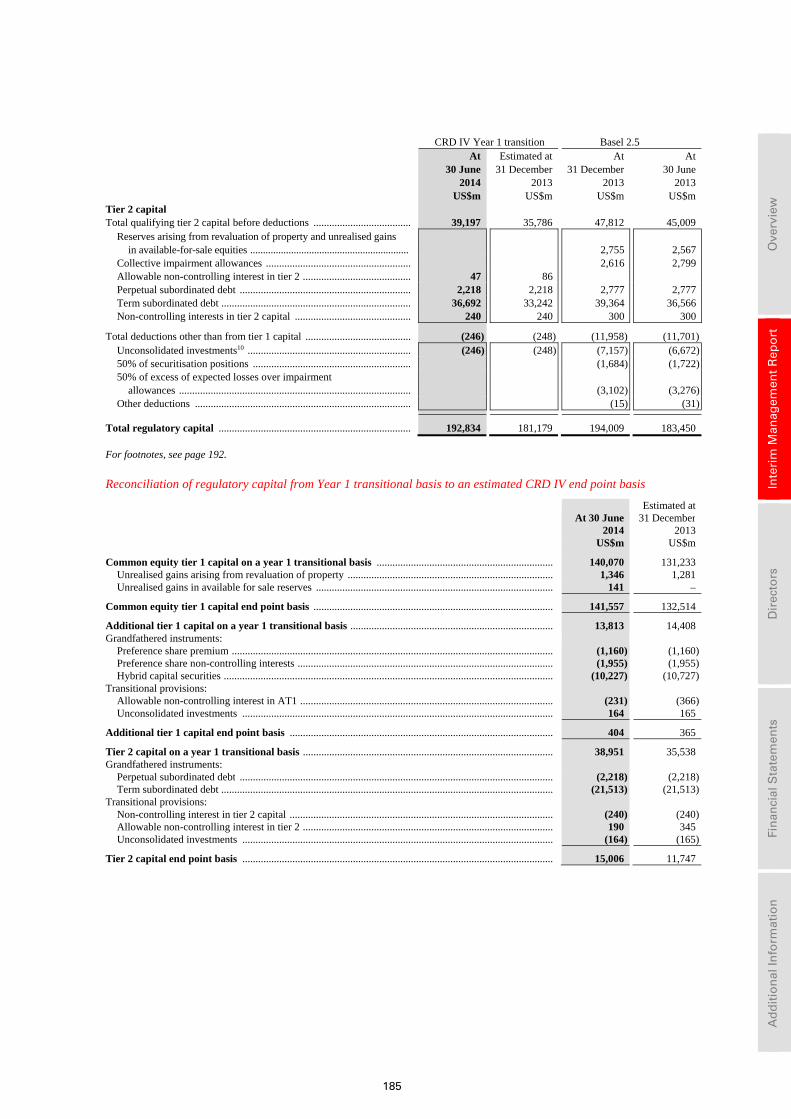
185
Ove
rvie
w
In
teri
m M
anag
emen
t R
epo
rt
D
irec
tors
Fin
anci
al S
tate
men
ts
A
dd
itio
nal
Info
rmat
ion
CRD IV Year 1 transition Basel 2.5 At 30 June 2014 US$m
Estimated at 31 December 2013 US$m
At 31 December 2013 US$m
At 30 June 2013 US$m
Tier 2 capital Total qualifying tier 2 capital before deductions ..................................... 39,197 35,786 47,812 45,009
Reserves arising from revaluation of property and unrealised gains in available-for-sale equities .............................................................. 2,755 2,567
Collective impairment allowances ....................................................... 2,616 2,799Allowable non-controlling interest in tier 2 ......................................... 47 86 Perpetual subordinated debt ................................................................. 2,218 2,218 2,777 2,777Term subordinated debt ........................................................................ 36,692 33,242 39,364 36,566Non-controlling interests in tier 2 capital ............................................ 240 240 300 300
Total deductions other than from tier 1 capital ........................................ (246) (248) (11,958) (11,701)Unconsolidated investments10 .............................................................. (246) (248) (7,157) (6,672)50% of securitisation positions ............................................................ (1,684) (1,722)50% of excess of expected losses over impairment
allowances ........................................................................................ (3,102) (3,276)Other deductions .................................................................................. (15) (31)
Total regulatory capital ......................................................................... 192,834 181,179 194,009 183,450
For footnotes, see page 192.
Reconciliation of regulatory capital from Year 1 transitional basis to an estimated CRD IV end point basis
At 30 June Estimated at 31 December
2014 2013 US$m US$m
Common equity tier 1 capital on a year 1 transitional basis ................................................................... 140,070 131,233Unrealised gains arising from revaluation of property .............................................................................. 1,346 1,281 Unrealised gains in available for sale reserves .......................................................................................... 141 –
Common equity tier 1 capital end point basis ........................................................................................... 141,557 132,514
Additional tier 1 capital on a year 1 transitional basis ............................................................................. 13,813 14,408 Grandfathered instruments:
Preference share premium .......................................................................................................................... (1,160) (1,160)Preference share non-controlling interests ................................................................................................. (1,955) (1,955)Hybrid capital securities ............................................................................................................................. (10,227) (10,727)
Transitional provisions: Allowable non-controlling interest in AT1 ................................................................................................ (231) (366)Unconsolidated investments ...................................................................................................................... 164 165
Additional tier 1 capital end point basis .................................................................................................... 404 365
Tier 2 capital on a year 1 transitional basis ............................................................................................... 38,951 35,538 Grandfathered instruments:
Perpetual subordinated debt ....................................................................................................................... (2,218) (2,218)Term subordinated debt .............................................................................................................................. (21,513) (21,513)
Transitional provisions: Non-controlling interest in tier 2 capital .................................................................................................... (240) (240)Allowable non-controlling interest in tier 2 ............................................................................................... 190 345 Unconsolidated investments ...................................................................................................................... (164) (165)
Tier 2 capital end point basis ...................................................................................................................... 15,006 11,747
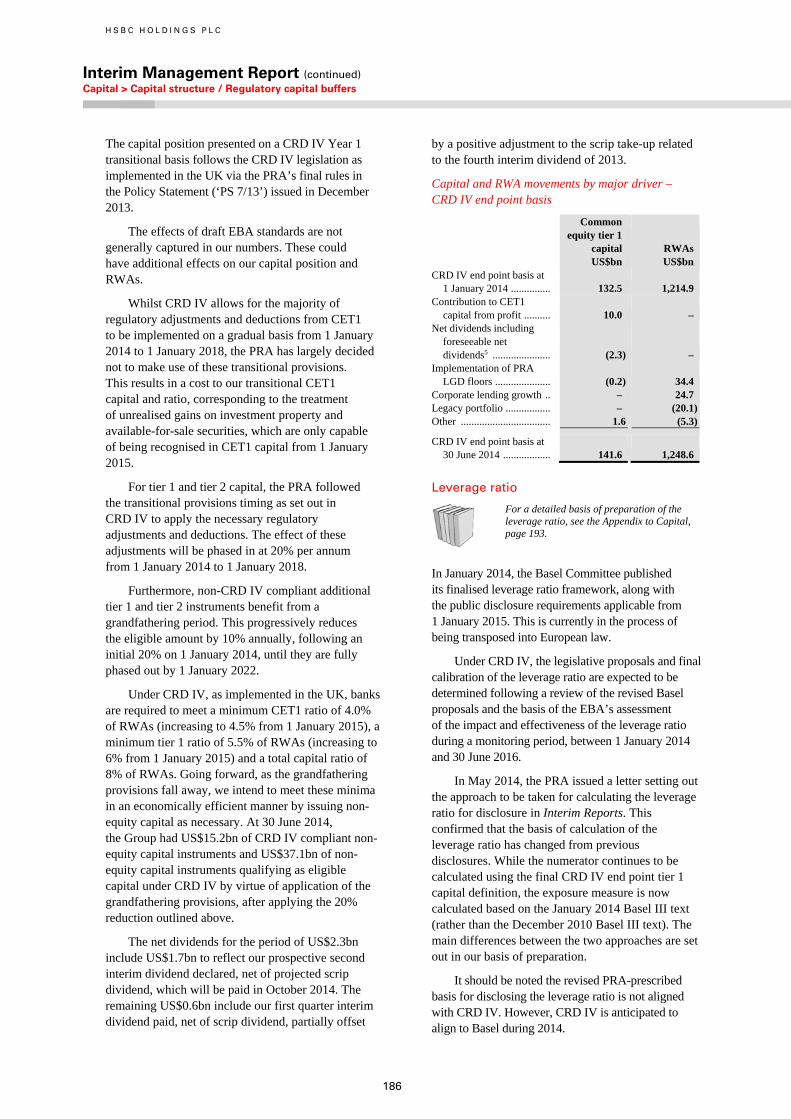
H S B C H O L D I N G S P L C
Interim Management Report (continued) Capital > Capital structure / Regulatory capital buffers
186
The capital position presented on a CRD IV Year 1 transitional basis follows the CRD IV legislation as implemented in the UK via the PRA’s final rules in the Policy Statement (‘PS 7/13’) issued in December 2013.
The effects of draft EBA standards are not generally captured in our numbers. These could have additional effects on our capital position and RWAs.
Whilst CRD IV allows for the majority of regulatory adjustments and deductions from CET1 to be implemented on a gradual basis from 1 January 2014 to 1 January 2018, the PRA has largely decided not to make use of these transitional provisions. This results in a cost to our transitional CET1 capital and ratio, corresponding to the treatment of unrealised gains on investment property and available-for-sale securities, which are only capable of being recognised in CET1 capital from 1 January 2015.
For tier 1 and tier 2 capital, the PRA followed the transitional provisions timing as set out in CRD IV to apply the necessary regulatory adjustments and deductions. The effect of these adjustments will be phased in at 20% per annum from 1 January 2014 to 1 January 2018.
Furthermore, non-CRD IV compliant additional tier 1 and tier 2 instruments benefit from a grandfathering period. This progressively reduces the eligible amount by 10% annually, following an initial 20% on 1 January 2014, until they are fully phased out by 1 January 2022.
Under CRD IV, as implemented in the UK, banks are required to meet a minimum CET1 ratio of 4.0% of RWAs (increasing to 4.5% from 1 January 2015), a minimum tier 1 ratio of 5.5% of RWAs (increasing to 6% from 1 January 2015) and a total capital ratio of 8% of RWAs. Going forward, as the grandfathering provisions fall away, we intend to meet these minima in an economically efficient manner by issuing non-equity capital as necessary. At 30 June 2014, the Group had US$15.2bn of CRD IV compliant non-equity capital instruments and US$37.1bn of non-equity capital instruments qualifying as eligible capital under CRD IV by virtue of application of the grandfathering provisions, after applying the 20% reduction outlined above.
The net dividends for the period of US$2.3bn include US$1.7bn to reflect our prospective second interim dividend declared, net of projected scrip dividend, which will be paid in October 2014. The remaining US$0.6bn include our first quarter interim dividend paid, net of scrip dividend, partially offset
by a positive adjustment to the scrip take-up related to the fourth interim dividend of 2013.
Capital and RWA movements by major driver – CRD IV end point basis
Common equity tier 1
capital RWAs US$bn US$bn CRD IV end point basis at
1 January 2014 ............... 132.5 1,214.9 Contribution to CET1
capital from profit .......... 10.0 – Net dividends including
foreseeable net dividends5 ...................... (2.3) –
Implementation of PRA LGD floors ..................... (0.2) 34.4
Corporate lending growth .. – 24.7 Legacy portfolio ................. – (20.1)Other .................................. 1.6 (5.3)
CRD IV end point basis at 30 June 2014 .................. 141.6 1,248.6
Leverage ratio
For a detailed basis of preparation of the leverage ratio, see the Appendix to Capital, page 193.
In January 2014, the Basel Committee published its finalised leverage ratio framework, along with the public disclosure requirements applicable from 1 January 2015. This is currently in the process of being transposed into European law.
Under CRD IV, the legislative proposals and final calibration of the leverage ratio are expected to be determined following a review of the revised Basel proposals and the basis of the EBA’s assessment of the impact and effectiveness of the leverage ratio during a monitoring period, between 1 January 2014 and 30 June 2016.
In May 2014, the PRA issued a letter setting out the approach to be taken for calculating the leverage ratio for disclosure in Interim Reports. This confirmed that the basis of calculation of the leverage ratio has changed from previous disclosures. While the numerator continues to be calculated using the final CRD IV end point tier 1 capital definition, the exposure measure is now calculated based on the January 2014 Basel III text (rather than the December 2010 Basel III text). The main differences between the two approaches are set out in our basis of preparation.
It should be noted the revised PRA-prescribed basis for disclosing the leverage ratio is not aligned with CRD IV. However, CRD IV is anticipated to align to Basel during 2014.
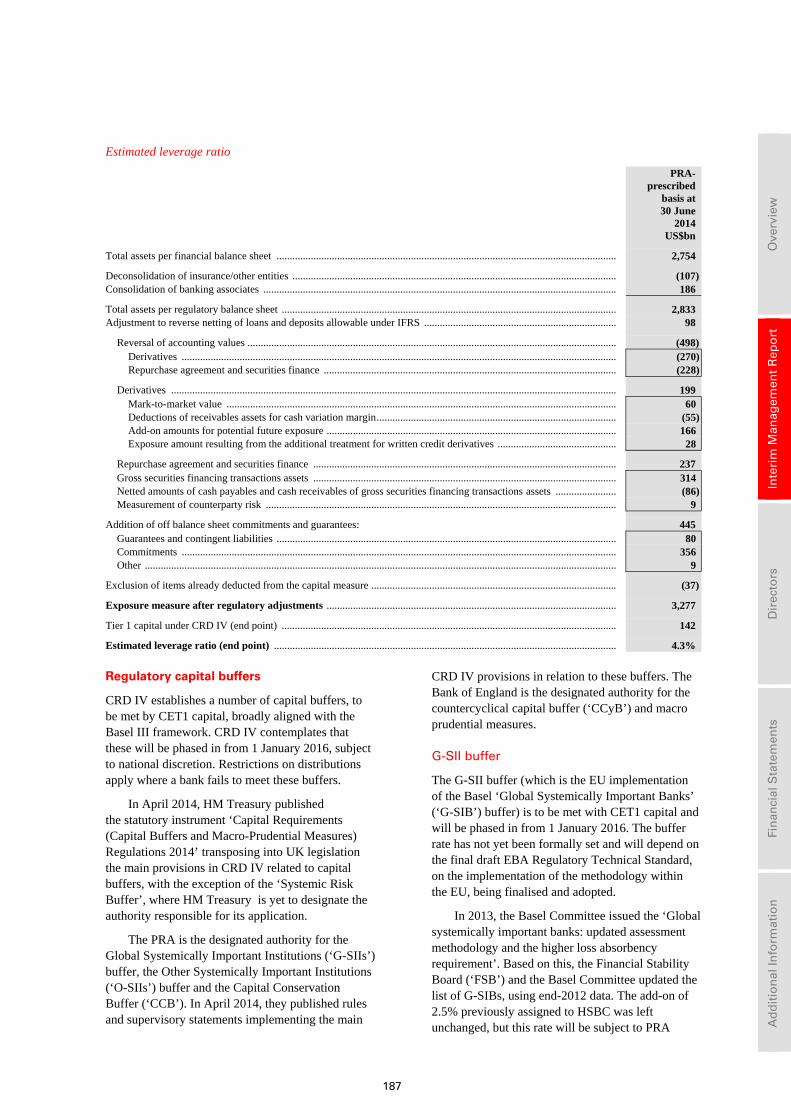
187
Ove
rvie
w
In
teri
m M
anag
emen
t R
epo
rt
D
irec
tors
Fin
anci
al S
tate
men
ts
A
dd
itio
nal
Info
rmat
ion
Estimated leverage ratio
PRA- prescribed basis at
30 June 2014 US$bn
Total assets per financial balance sheet ................................................................................................................................. 2,754
Deconsolidation of insurance/other entities ........................................................................................................................... (107)Consolidation of banking associates ...................................................................................................................................... 186
Total assets per regulatory balance sheet ............................................................................................................................... 2,833 Adjustment to reverse netting of loans and deposits allowable under IFRS ......................................................................... 98
Reversal of accounting values ............................................................................................................................................ (498)Derivatives ..................................................................................................................................................................... (270)Repurchase agreement and securities finance ............................................................................................................... (228)
Derivatives ......................................................................................................................................................................... 199 Mark-to-market value .................................................................................................................................................... 60Deductions of receivables assets for cash variation margin ........................................................................................... (55)Add-on amounts for potential future exposure .............................................................................................................. 166Exposure amount resulting from the additional treatment for written credit derivatives ............................................. 28
Repurchase agreement and securities finance ................................................................................................................... 237 Gross securities financing transactions assets ................................................................................................................... 314Netted amounts of cash payables and cash receivables of gross securities financing transactions assets ....................... (86)Measurement of counterparty risk ..................................................................................................................................... 9
Addition of off balance sheet commitments and guarantees: 445 Guarantees and contingent liabilities ................................................................................................................................. 80Commitments ..................................................................................................................................................................... 356Other ................................................................................................................................................................................... 9
Exclusion of items already deducted from the capital measure ............................................................................................. (37)
Exposure measure after regulatory adjustments .............................................................................................................. 3,277
Tier 1 capital under CRD IV (end point) ............................................................................................................................... 142
Estimated leverage ratio (end point) .................................................................................................................................. 4.3%
Regulatory capital buffers
CRD IV establishes a number of capital buffers, to be met by CET1 capital, broadly aligned with the Basel III framework. CRD IV contemplates that these will be phased in from 1 January 2016, subject to national discretion. Restrictions on distributions apply where a bank fails to meet these buffers.
In April 2014, HM Treasury published the statutory instrument ‘Capital Requirements (Capital Buffers and Macro-Prudential Measures) Regulations 2014’ transposing into UK legislation the main provisions in CRD IV related to capital buffers, with the exception of the ‘Systemic Risk Buffer’, where HM Treasury is yet to designate the authority responsible for its application.
The PRA is the designated authority for the Global Systemically Important Institutions (‘G-SIIs’) buffer, the Other Systemically Important Institutions (‘O-SIIs’) buffer and the Capital Conservation Buffer (‘CCB’). In April 2014, they published rules and supervisory statements implementing the main
CRD IV provisions in relation to these buffers. The Bank of England is the designated authority for the countercyclical capital buffer (‘CCyB’) and macro prudential measures.
G-SII buffer
The G-SII buffer (which is the EU implementation of the Basel ‘Global Systemically Important Banks’ (‘G-SIB’) buffer) is to be met with CET1 capital and will be phased in from 1 January 2016. The buffer rate has not yet been formally set and will depend on the final draft EBA Regulatory Technical Standard, on the implementation of the methodology within the EU, being finalised and adopted.
In 2013, the Basel Committee issued the ‘Global systemically important banks: updated assessment methodology and the higher loss absorbency requirement’. Based on this, the Financial Stability Board (‘FSB’) and the Basel Committee updated the list of G-SIBs, using end-2012 data. The add-on of 2.5% previously assigned to HSBC was left unchanged, but this rate will be subject to PRA
H S B C H O L D I N G S P L C
Interim Management Report (continued) Capital > Regulatory capital buffers
188
confirmation later in 2014, after the assessment using end-2013 data has been carried out.
Following direction from the PRA to UK banks in their Supervisory Statement issued in April 2014, and in accordance with the EBA final draft Implementing Technical Standard and guidelines published in June 2014, we disclosed in July 2014 the EBA template showing the values used for the identification and scoring process which underpins our G-SIB designation. The template can be found on our website using the following link http://www.hsbc.com/investor-relations/financial-and-regulatory-reports.
Capital conservation buffer
The CCB was designed to ensure banks build up capital outside periods of stress that can be drawn down when losses are incurred and is set at 2.5% of RWAs. The PRA will phase-in this buffer from 1 January 2016 to 1 January 2019.
Countercyclical and other macro-prudential buffers
CRD IV contemplates a cyclical buffer in line with Basel III, in the form of an institution-specific CCyB, to protect against future losses where unsustainable levels of leverage, debt or credit growth pose a systemic threat. In addition to the buffers as defined under Basel III, CRD IV contemplates the application of increased requirements to address macro-prudential or systemic risk, including the setting of macro-prudential measures such as increasing capital requirements for specific sectors of the economy.
The FPC is responsible for related policy decisions, including setting the CCyB rate and the use of direction powers over sectoral capital requirements (‘SCRs’). The UK legislation enabled use of the CCyB and SCR tools from 1 May 2014. Application of buffer rates set by regulatory authorities outside the UK before 1 January 2016 requires recognition and confirmation by the FPC. Beyond this date reciprocity mechanisms will apply.
In January 2014, the FPC issued a policy statement on its powers to supplement capital requirements, through the use of the CCyB and the SCR tools. The CCyB allows the FPC to raise capital requirements above the micro-prudential level for all exposures to borrowers in the UK. The SCR is a more targeted tool which allows the FPC to increase capital requirements above minimum regulatory standards for exposures to three broad sectors judged to pose a risk to the stability of the financial system as a whole: residential and commercial property; and
other parts of the financial sector, potentially on a global basis.
In June 2014, the FPC set the CCyB rate for UK exposures at 0% but later in the year will consider its approach for recognition of CCyB rates in other countries. Should a CCyB be required, it is expected to be set in the range of 0-2.5% of relevant credit exposures RWAs, although it is uncapped. The institution-specific CCyB rate for the Group will be based on the weighted average of the CCyB rates that apply in the jurisdictions where relevant credit exposures are located. The SCR tool is not currently deployed.
In addition to the measures above, CRD IV sets out a systemic risk buffer (‘SRB’) for the financial sector as a whole, or one or more sub-sectors, to be deployed as necessary by each EU member state with a view to mitigate structural macro-prudential risk. It is expected that, if such a risk was found to be prevalent, the SRB would be set at a minimum of 1% based on the exposures to which it would apply. This is not restricted to exposures within the member state itself and to the extent it would apply at a global level, it is expected that the higher of the G-SII and the SRB would apply. This buffer is yet to be transposed into UK legislation.
Restrictions on capital distributions apply if the bank’s CET1 capital falls below the level of its combined buffer, defined as the total of the CCB, the CCyB, the G-SII and the SRB (as these become applicable).
Pillar 2 and the ‘PRA buffer’
To implement the CRD IV capital buffers in the UK, the PRA issued an initial consultation in 2013, proposing changes to the Pillar 2 framework and explaining its interaction with the buffers. Under the Pillar 2 framework, banks are already required to hold capital in respect of the internal capital adequacy assessment and supervisory review which leads to a final determination by the PRA of individual capital guidance under Pillar 2A. This is currently met by total capital, and in accordance with PS 7/13, is now proposed to be met 56% by CET1 from 1 January 2015.
The PRA further proposed to introduce a PRA buffer, to replace the current capital planning buffer (‘CPB’) (known as Pillar 2B), also to be held in the form of CET1 capital. The PRA buffer is intended to be calculated independently and then compared with the extent to which other CRD IV buffers may already cover the same risks. Depending upon the business undertaken by an individual firm, the PRA has stated its expectation that the capital
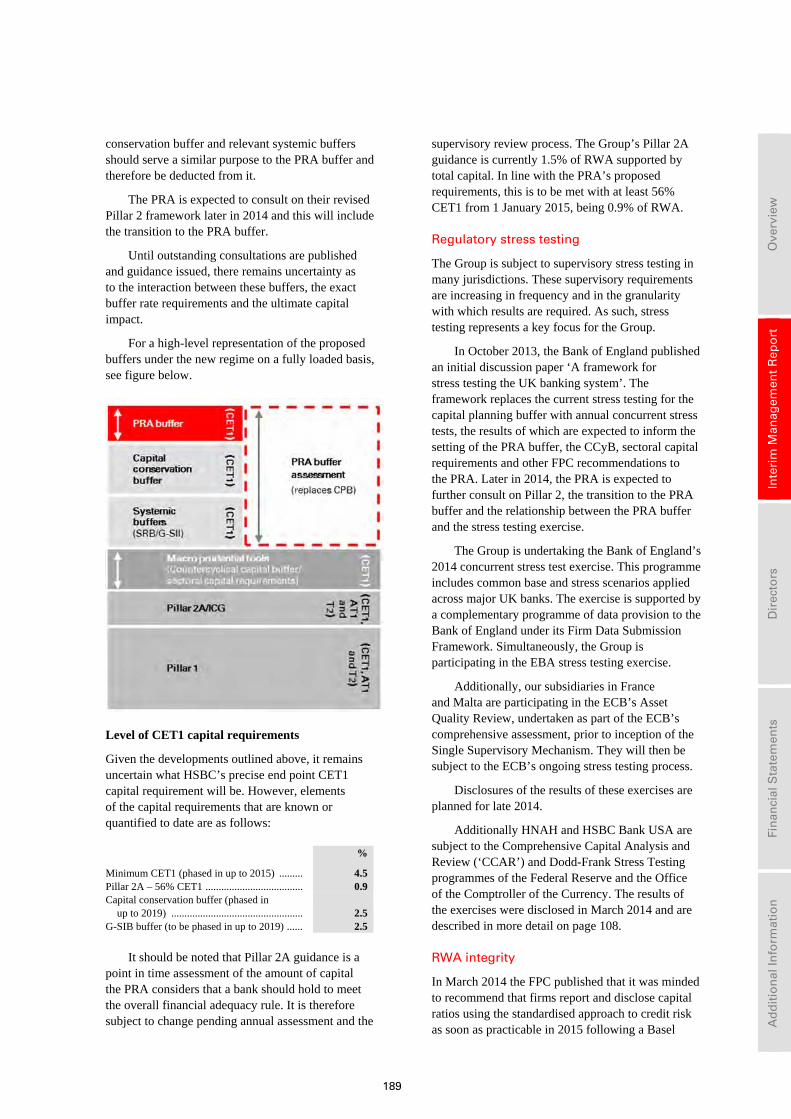
189
Ove
rvie
w
In
teri
m M
anag
emen
t R
epo
rt
D
irec
tors
Fin
anci
al S
tate
men
ts
A
dd
itio
nal
Info
rmat
ion
conservation buffer and relevant systemic buffers should serve a similar purpose to the PRA buffer and therefore be deducted from it.
The PRA is expected to consult on their revised Pillar 2 framework later in 2014 and this will include the transition to the PRA buffer.
Until outstanding consultations are published and guidance issued, there remains uncertainty as to the interaction between these buffers, the exact buffer rate requirements and the ultimate capital impact.
For a high-level representation of the proposed buffers under the new regime on a fully loaded basis, see figure below.
Level of CET1 capital requirements
Given the developments outlined above, it remains uncertain what HSBC’s precise end point CET1 capital requirement will be. However, elements of the capital requirements that are known or quantified to date are as follows:
%
Minimum CET1 (phased in up to 2015) ......... 4.5 Pillar 2A – 56% CET1 ..................................... 0.9 Capital conservation buffer (phased in
up to 2019) .................................................. 2.5 G-SIB buffer (to be phased in up to 2019) ...... 2.5
It should be noted that Pillar 2A guidance is a point in time assessment of the amount of capital the PRA considers that a bank should hold to meet the overall financial adequacy rule. It is therefore subject to change pending annual assessment and the
supervisory review process. The Group’s Pillar 2A guidance is currently 1.5% of RWA supported by total capital. In line with the PRA’s proposed requirements, this is to be met with at least 56% CET1 from 1 January 2015, being 0.9% of RWA.
Regulatory stress testing
The Group is subject to supervisory stress testing in many jurisdictions. These supervisory requirements are increasing in frequency and in the granularity with which results are required. As such, stress testing represents a key focus for the Group.
In October 2013, the Bank of England published an initial discussion paper ‘A framework for stress testing the UK banking system’. The framework replaces the current stress testing for the capital planning buffer with annual concurrent stress tests, the results of which are expected to inform the setting of the PRA buffer, the CCyB, sectoral capital requirements and other FPC recommendations to the PRA. Later in 2014, the PRA is expected to further consult on Pillar 2, the transition to the PRA buffer and the relationship between the PRA buffer and the stress testing exercise.
The Group is undertaking the Bank of England’s 2014 concurrent stress test exercise. This programme includes common base and stress scenarios applied across major UK banks. The exercise is supported by a complementary programme of data provision to the Bank of England under its Firm Data Submission Framework. Simultaneously, the Group is participating in the EBA stress testing exercise.
Additionally, our subsidiaries in France and Malta are participating in the ECB’s Asset Quality Review, undertaken as part of the ECB’s comprehensive assessment, prior to inception of the Single Supervisory Mechanism. They will then be subject to the ECB’s ongoing stress testing process.
Disclosures of the results of these exercises are planned for late 2014.
Additionally HNAH and HSBC Bank USA are subject to the Comprehensive Capital Analysis and Review (‘CCAR’) and Dodd-Frank Stress Testing programmes of the Federal Reserve and the Office of the Comptroller of the Currency. The results of the exercises were disclosed in March 2014 and are described in more detail on page 108.
RWA integrity
In March 2014 the FPC published that it was minded to recommend that firms report and disclose capital ratios using the standardised approach to credit risk as soon as practicable in 2015 following a Basel
H S B C H O L D I N G S P L C
Interim Management Report (continued) Capital > Other regulatory updates
190
review of the standardised approach to credit risk. The latter is yet to be published and its recommendations are unknown.
In May 2014, the EBA published a consultation on benchmarks of internal approaches for calculating own funds requirements for credit and market risk exposures (RWAs). This follows a series of benchmarking exercises run in 2013 to better understand the drivers of differences observed in RWAs across EU institutions. The future annual benchmarking exercise outlined in the consultation paper aims to improve the comparability of capital requirements calculated using internal modelled approaches and will be used by regulators to inform their policy decisions.
Other regulatory updates
In December 2013, the PRA issued its Supervisory Statement SS13/13 in relation to Market Risk. This requires firms to identify risks not adequately captured by models and to hold additional funds against those under its Risks not in VaR (‘RNIV’) framework. In assessing these risks, no offsetting or diversification will be allowed across risk factors.
In March 2014, the EBA published a final draft regulatory technical standard on prudent valuation. We await the adoption of the finalised standard by the European Commission later in 2014.
In June 2014, the EBA and Basel Committee each issued a consultation on Pillar 3 requirements. The EBA consultation addresses how institutions should apply considerations of materiality, confidentiality and proprietary information in relation to disclosure, as well as how they should assess the appropriate frequency of their disclosures. The Basel consultation proposes increased use of standardised templates to enhance comparability in banks’ risk and capital disclosures, as well as a selective approach to increased frequency.
In June 2014, the PRA issued its consultation CP12/14. Two changes to the credit risk rules are being proposed. The first is a proposal that the PRA will not grant advanced internal ratings-based (‘AIRB’) approach permissions in relation to exposures to central governments, public sector entities, central banks and financial sector entities and instead require calculation under the foundation approach from June 2015. The second is a proposal to introduce stricter criteria for the application of a 50% risk weight to certain commercial real estate (‘CRE’) exposures located in non-EEA countries dependent upon loss rates prevalent in these jurisdictions over a representative period. We are carrying out a detailed review of the consultation.
Also, in July 2014, the FPC issued a consultation on the design of a leverage ratio framework for the UK. The consultation makes a range of proposals including that the leverage framework include a minimum leverage ratio, a leverage conservation buffer, a supplementary leverage ratio for a subset of firms such as ring-fenced banks and/or G-SIBs, and the ability for the leverage ratio to vary over time in a countercyclical manner. An infringement of these leverage buffers above the minimum leverage ratio would restrict distributions. It also considers that the minimum leverage ratio may need to be met predominantly with CET1. In addition, the leverage buffers are proposed to be met with CET1, in line with the quality of capital for the risk-weighted buffers. The FPC is of the preliminary view that it should be granted powers of direction over all components of the leverage ratio framework not determined under EU legislation and that these powers should apply as soon as practicable.
Structural banking reform
UK
In December 2013, the UK’s Financial Services (Banking Reform) Act 2013 received Royal Assent. It implements the recommendations of the ICB and of the Parliamentary Commission on Banking Standards, which inter alia establish a framework for ‘ring-fencing’ UK retail banking in separately incorporated banking entities (‘ring-fenced banks’) from trading activities, and sets out requirements for loss absorbency in the form of equity capital and loss absorbing debt. The PRA, subject to the approval of HM Treasury, is empowered to require banking groups to restructure their operations if it considers that the operation of the ring-fence in a group is proving to be ineffective. The exercise of these powers may lead to groups being required to split their retail and investment banking operations into separate corporate groups. In July 2014, final secondary legislation, in the form of the Financial Services and Markets Act 2000 (Excluded Activities and Prohibitions) Order 2014 and the Financial Services and Markets Act 2000 (Ring-Fenced Bodies and Core Activities) Order 2014 (‘the orders’) setting out further details were published. The orders include provisions detailing the requirement that the deposits of certain UK individuals and organisations be housed in ring-fenced banks. In addition, the orders place restrictions on the activities and geographical scope of ring-fenced banks. Regulatory rules from supervisory authorities are not yet available. The UK government intends to complete
191
Ove
rvie
w
In
teri
m M
anag
emen
t R
epo
rt
D
irec
tors
Fin
anci
al S
tate
men
ts
A
dd
itio
nal
Info
rmat
ion
the legislative process by the end of this Parliament in May 2015 and to have reforms in place by 2019.
The UK Financial Services (Banking Reform) Act 2013 also creates a ‘bail-in’ mechanism as an additional resolution tool alongside existing options to transfer all or part of the bank to a private sector purchaser, to transfer parts of the bank to a new ‘bridge’ bank which is later sold or takes the bank into temporary public sector ownership. In a ‘bail-in’, shareholders and creditors in the bank have their investments written down in value or converted into new interests (such as new shares) without the bank being placed in liquidation. This allows the bank to continue to provide its core banking services without interruption and ensures that the solvency of the bank is addressed without taxpayer support, while also allowing the Bank of England to provide temporary funding to this newly solvent bank. Certain liabilities including deposits protected by the Financial Services Compensation Scheme are excluded from bail-in. It is intended that these bail-in provisions will be consistent with the EU Recovery and Resolution Directive once it comes into force.
In June 2014, the final text of the Banking Recovery and Resolution Directive was published in the EU’s Official Journal. In July 2014, both HM Treasury and the PRA published consultation papers to transpose and implement the Directive requirements into UK law and rules. The finalised requirements are expected to be in place by 31 December 2014.
Eurozone
In February 2012, the European Commission appointed a High Level Expert Group under the Governor of the Bank of Finland, Erkki Liikanen, to consider potential structural changes in banks within the EU. The group recommended, inter alia, the ring-fencing of certain market-making and trading activities from the deposit-taking and retail payments activities of major banks and possible amendments to the use of bail-in instruments as a resolution tool, as well as a number of other comments.
In January 2014, following a consultation period, the European Commission published its own legislative proposals on the structural reform of the European banking sector which would prohibit proprietary trading in financial instruments and commodities, and enable supervisors to require trading activities such as market-making, complex derivatives and securitisation operations to be undertaken in a separate subsidiary from deposit taking activities.
The ring-fenced deposit taking entity would be subject to separation from the trading entity including capital and management structures, issuance of own debt and arms-length transactions between entities.
The proposals allow for derogation from these requirements for super-equivalent national regimes. On the current basis, it is understood that non-EEA subsidiaries of the Group which could be separately resolved without a threat to the financial stability of the EU would be excluded from the proposals.
The proposals will now be subject to discussion in the European Parliament and the Council and are not expected to be finalised in 2014. The implementation date for any separation under the final rules would depend upon the date on which the final legislation is agreed. The EU proposal contains a provision which would permit derogation by member states which have implemented their own structural reform legislation, subject to meeting certain conditions. This derogation could benefit the UK, which has passed the UK Financial Services (Banking Reform) Act 2013, and France and Germany, which have enacted structural reform. However, it is possible that the proposed derogation will not be enacted. The interaction between the EU proposals and the US Volker Rule has still to be clarified. The G20 has asked the FSB, in collaboration with the International Monetary Fund and the OECD, to assess the cross-border consistency and global financial stability implications of structural measures, to be completed by the end of 2014.

H S B C H O L D I N G S P L C
Interim Management Report (continued) Capital > Footnotes / Appendix to capital
192
Footnotes to Capital
1 Operational risk RWAs, under the standardised approach, are calculated using an average of the last three years’ revenues. For business disposals, the operational risk RWAs are not removed immediately on disposal, but diminish over a period of time. The RWAs for the CRS business represent the remaining operational risk RWAs for the business.
2 RWAs are non-additive across geographical regions due to market risk diversification effects within the Group. 3 From 1 January 2014, the geographical region ‘Asia’ replaced the geographical regions previously reported as ‘Hong Kong’ and ‘Rest
of Asia-Pacific’ (see Note 23 on the Financial Statements for further details). Comparative data have been re-presented to reflect this change.
4 This includes dividends on ordinary shares, quarterly dividends on preference shares and coupons on capital securities, classified as equity.
5 Includes externally verified profits for the half-year to 30 June 2014. 6 Mainly comprises unrealised gains/losses in available-for-sale debt securities related to SPEs. 7 Unrealised gains/losses in available-for-sale securities are net of tax. 8 Includes own credit spread on trading liabilities. 9 Under Basel 2.5 rules, any defined benefit asset is derecognised and a defined benefit liability may be substituted with the additional
funding that will be paid into the relevant schemes over the following five-year period. 10 Mainly comprise investments in insurance entities.
193
Ove
rvie
w
In
teri
m M
anag
emen
t R
epo
rt
D
irec
tors
Fin
anci
al S
tate
men
ts
A
dd
itio
nal
Info
rmat
ion
Appendix to Capital Capital management and capital measurement and allocation
Capital management
Approach and policy
Our approach to capital management is driven by our strategic and organisational requirements, taking into account the regulatory, economic and commercial environment in which we operate. Pre-tax return on risk-weighted assets (‘RoRWA’) is an operational metric by which the global businesses are managed on a day-to-day basis. The metric combines return on equity and regulatory capital efficiency objectives. It is our objective to maintain a strong capital base to support the risks inherent in our business and invest in accordance with our six filters framework, exceeding both consolidated and local regulatory capital requirements at all times.
Our policy on capital management is underpinned by a capital management framework which enables us to manage our capital in a consistent manner. The framework, which is approved by the GMB annually, incorporates a number of different capital measures including market capitalisation, invested capital, economic capital and regulatory capital. In accordance with PRA regulations we set our capital ratio target on an end point CRD IV CET1 basis.
Capital measures
• market capitalisation is the stock market value of HSBC;
• invested capital is the equity capital invested in HSBC by our shareholders, adjusted for certain reserves and goodwill previously amortised or written off;
• economic capital is the internally calculated capital requirement which we deem necessary to support the risks to which we are exposed; and
• regulatory capital is the capital which we are required to hold in accordance with the rules established by the PRA for the consolidated Group and by our local regulators for individual Group companies.
Our assessment of capital adequacy is aligned to our assessment of risks, including: credit, market, operational, interest rate risk in the banking book, pension fund, insurance, structural foreign exchange risk and residual risks.
Stress testing
In addition to our internal stress tests, the Group is subject to supervisory stress testing in many jurisdictions. Supervisory requirements are increasing in frequency and in the granularity with which the results are required. These exercises include the programmes of the PRA, the Federal Reserve Board, the EBA, the ECB and the Hong Kong Monetary Authority, as well as stress tests undertaken in other jurisdictions. We take into account the results of all such regulatory stress testing when assessing our internal capital requirements.
Risks to capital
Outside the stress-testing framework, a list of top and emerging risks is regularly evaluated for their effect on our CET1 capital ratio. In addition, other risks may be identified which have the potential to affect our RWAs and/or capital position. These risks are also included in the evaluation of risks to capital. The downside or upside scenarios are assessed against our capital management objectives and mitigating actions are assigned as necessary. The responsibility for global capital allocation principles and decisions rests with the GMB. Through our internal governance processes, we seek to maintain discipline over our investment and capital allocation decisions and seek to ensure that returns on investment are adequate after taking into account capital costs. Our strategy is to allocate capital to businesses and entities on the basis of their ability to achieve established RoRWA objectives and their regulatory and economic capital requirements.
Risk-weighted asset targets
RWA targets for our global businesses are established in accordance with the Group’s strategic direction and risk appetite, and approved through the Group’s annual planning process. As these targets are deployed to lower levels of management, action plans for implementation are developed. These may include growth strategies; active portfolio management; restructuring; business and/or customer-level reviews; RWA efficiency and optimisation initiatives and
H S B C H O L D I N G S P L C
Interim Management Report (continued) Appendix to Capital
194
risk-mitigation. Our capital management process is articulated in the annual Group capital plan which is approved by the Board.
Business performance against RWA targets is monitored through regular reporting to the Group Holdings ALCO. The management of capital deductions is also addressed in the RWA monitoring framework through additional notional charges for these items.
Analysis is undertaken in the RWA monitoring framework to identify the key drivers of movements in the position, such as book size and book quality. Particular attention is paid to identifying and segmenting items within the day-to-day control of the business and those items that are driven by changes in risk models or regulatory methodology.
Capital generation
HSBC Holdings is the primary provider of equity capital to its subsidiaries and also provides them with non-equity capital where necessary. These investments are substantially funded by HSBC Holdings’ own capital issuance and profit retention. As part of its capital management process, HSBC Holdings seeks to maintain a prudent balance between the composition of its capital and its investment in subsidiaries.
Capital measurement and allocation
The PRA supervises HSBC on a consolidated basis and therefore receives information on the capital adequacy of, and sets capital requirements for, the Group as a whole. Individual banking subsidiaries are directly regulated by their local banking supervisors, who set and monitor their capital adequacy requirements. In 2013, we calculated capital at a Group level using the Basel II framework as amended for CRD III, commonly known as Basel 2.5, and also estimated capital on an end point CRD IV basis. From 1 January 2014, our capital at Group level is calculated under the CRD IV and supplemented by PRA rules to effect the transposition of directive requirements.
Our policy and practice in capital measurement and allocation at Group level is underpinned by the CRD IV rules. However, local regulators are at different stages of implementation and some local reporting is still on a Basel I basis, notably in the US where they are also parallel running on a Basel III basis. In most jurisdictions, non-banking financial subsidiaries are also subject to the supervision and capital requirements of local regulatory authorities.
The Basel III framework, similarly to Basel II, is structured around three ‘pillars’: minimum capital requirements, supervisory review process and market discipline. The CRD IV legislation implemented Basel III in the EU and, in the UK, the ‘PRA rulebook CRR Firms Instrument 2013’ transposed the various national discretions under the CRD IV legislation into UK law. The CRD IV and PRA legislation came into force on 1 January 2014.
Regulatory capital
For regulatory purposes, our capital base is divided into three main categories, namely Common Equity Tier 1, Additional Tier 1 and Tier 2, depending on the degree of permanency and loss absorbency exhibited.
• Common equity tier 1 capital is the highest quality form of capital, comprising shareholders’ equity and related non-controlling interests (subject to limits). Under CRD IV various capital deductions and regulatory adjustments are made against these items which are treated differently for the purposes of capital adequacy – these include deductions for goodwill and intangible assets, deferred tax assets that rely on future profitability, negative amounts resulting from the calculation of expected loss amounts under IRB and defined benefit pension fund assets.
• Additional tier 1 capital comprises qualifying non-common equity capital instruments and related share premium; it also includes qualifying instruments issued by subsidiaries subject to certain limits. Holdings of additional tier 1 instruments of financial sector entities are deducted.
• Tier 2 capital comprises qualifying capital instruments and subordinated loans, related share premium and qualifying tier 2 capital instruments issued by subsidiaries subject to limits. Holdings of tier 2 capital of financial sector entities are deducted.
Pillar 1 capital requirements
Pillar 1 covers the capital resources requirements for credit risk, market risk and operational risk. Credit risk includes counterparty credit risk and securitisation requirements. These requirements are expressed in terms of RWAs.
195
Ove
rvie
w
In
teri
m M
anag
emen
t R
epo
rt
D
irec
tors
Fin
anci
al S
tate
men
ts
A
dd
itio
nal
Info
rmat
ion
Credit risk capital requirements
CRD IV applies three approaches of increasing sophistication to the calculation of Pillar 1 credit risk capital requirements. The most basic, the standardised approach, requires banks to use external credit ratings to determine the risk weightings applied to rated counterparties. Other counterparties are grouped into broad categories and standardised risk weightings are applied to these categories. The next level, the internal ratings-based (‘IRB’) foundation approach, allows banks to calculate their credit risk capital requirements on the basis of their internal assessment of a counterparty’s probability of default (‘PD’), but their estimates of exposure at default (‘EAD’) and loss given default (‘LGD’) are subject to standard supervisory parameters. Finally, the IRB advanced approach allows banks to use their own internal assessment in both determining PD and quantifying EAD and LGD.
The capital resources requirement, which is intended to cover unexpected losses, is derived from a formula specified in the regulatory rules which incorporates PD, LGD, EAD and other variables such as maturity and correlation. Expected losses under the IRB approaches are calculated by multiplying PD by EAD and LGD. Expected losses are deducted from capital to the extent that they exceed total accounting impairment allowances.
For credit risk we have adopted the IRB advanced approach for the majority of our portfolios, with the remainder on either IRB foundation or standardised approaches.
Under our CRD IV rollout plans, a number of our Group companies and portfolios are in transition to advanced IRB approaches. At the end of the first half of 2014, global models for sovereigns, banks, large corporates as well as portfolios in most of Europe, Asia and North America were on advanced IRB approaches. Others remain on the standardised or foundation approaches pending definition of local regulations or model approval, or under exemptions from IRB treatment.
• Counterparty credit risk
CCR arises for OTC derivatives and securities financing transactions. It is calculated in both the trading and non-trading books and is the risk that the counterparty to a transaction may default before completing the satisfactory settlement of the transaction. Three approaches to calculating CCR and determining exposure values are defined by CRD IV: standardised, mark-to-market and internal model method. These exposure values are used to determine capital requirements under one of the credit risk approaches: standardised, IRB foundation and IRB advanced.
We use the mark-to-market and internal model method approaches for CCR. Our longer-term aim is to migrate more positions from the mark-to-market to the internal model method approach.
In addition, CRD IV applies a capital requirement for CVA risk. Where we have both specific risk VaR approval and internal model method approval for a product, the CVA VaR approach has been used to calculate the CVA capital charge. Where we do not hold both approvals, the standardised approach has been applied.
• Securitisation
Securitisation positions are held in both the trading and non-trading books. For non-trading book securitisation positions, CRD IV specifies two methods for calculating credit risk requirements, the standardised and the IRB approaches. Both rely on the mapping of rating agency credit ratings to risk weights, which range from 7% to 1,250%.
Within the IRB approach, we use the ratings-based method for the majority of our non-trading book securitisation positions, and the internal assessment approach for unrated liquidity facilities and programme-wide enhancements for asset-backed securitisations.
The majority of securitisation positions in the trading book are treated for capital purposes as if they are held in the non-trading book under the standardised or IRB approaches. Other traded securitisation positions, known as correlation trading, are treated under an internal model approach approved by the PRA.
Market risk capital requirement
The market risk capital requirement is measured using internal market risk models where approved by the PRA, or the PRA’s standard rules. Our internal market risk models comprise VaR, stressed VaR, incremental risk charge and the comprehensive risk measure.
H S B C H O L D I N G S P L C
Interim Management Report (continued) Appendix to Capital
196
Operational risk capital requirement
CRD IV includes a capital requirement for operational risk, again utilising three levels of sophistication. The capital required under the basic indicator approach is a simple percentage of gross revenues, whereas under the standardised approach it is one of three different percentages of total operating income less insurance premiums allocated to each of eight defined business lines. Both these approaches use an average of the last three financial years’ revenues. Finally, the advanced measurement approach uses banks’ own statistical analysis and modelling of operational risk data to determine capital requirements. We have adopted the standardised approach in determining our operational risk capital requirements.
Pillar 2 capital requirements
We conduct an internal capital adequacy assessment process (‘ICAAP’) to determine a forward looking assessment of our capital requirements given our business strategy, risk profile, risk appetite and capital plan. This process incorporates the Group’s risk management processes and governance framework. A range of stress tests are applied to our base capital plan. These, coupled with our economic capital framework and other risk management practices, are used to assess our internal capital adequacy requirements.
The ICAAP is examined by the PRA as part of its supervisory review and evaluation process, which occurs periodically to enable the regulator to define the individual capital guidance or minimum capital requirements for HSBC and our capital planning buffer where required.
Pillar 3 disclosure requirements
Pillar 3 of the Basel regulatory framework is related to market discipline and aims to make firms more transparent by requiring them to publish, at least annually, wide-ranging information on their risks and capital, and how these are managed. Our Pillar 3 Disclosures 2013 are published on our website, www.hsbc.com, under Investor Relations.
RWA movement by key driver – basis of preparation and supporting notes
Credit risk drivers – definitions and quantification
The causal analysis of RWA movements splits the total movement in IRB RWAs into six drivers, described below. The first four relate to specific, identifiable and measurable changes. The remaining two, book size and book quality, are derived after accounting for movements in the first four specific drivers.
1. Foreign exchange movements
This is the movement in RWAs as a result of changes in the exchange rate between the functional currency of the HSBC company owning each portfolio and US dollars, being our presentation currency for consolidated reporting. We hedge structural foreign exchange exposures only in limited circumstances. Our structural foreign exchange exposures are managed with the primary objective of ensuring, where practical, that our consolidated capital ratios and the capital ratios of individual banking subsidiaries are largely protected from the effect of changes in exchange rates. This is usually achieved by ensuring that, for each subsidiary bank, the ratio of structural exposures in a given currency to risk-weighted assets denominated in that currency is broadly equal to the capital ratio of the subsidiary in question.
2. Acquisitions and disposals
This is the movement in RWAs as a result of the disposal or acquisition of business operations. This can be whole businesses or parts of a business. The movement in RWAs is quantified based on the credit risk exposures as at the end of the month preceding a disposal or following an acquisition.
3. Model updates
New/updated models
RWA movements arising from the implementation of new models and from changes to existing parameter models are allocated to this driver. This figure will also include changes which arise following review of modelling
197
Ove
rvie
w
In
teri
m M
anag
emen
t R
epo
rt
D
irec
tors
Fin
anci
al S
tate
men
ts
A
dd
itio
nal
Info
rmat
ion
assumptions. Where a model recalibration reflects an update to more recent performance data, the resulting RWA changes are not assigned here, but instead reported under book quality.
RWA changes are estimated based on the impact assessments made in the testing phase prior to implementation. These values are used to simulate the impact of new or updated models on the portfolio at the point of implementation, assuming there were no major changes in the portfolio from the testing phase to implementation phase.
Portfolios moving onto IRB approach
Where a portfolio moves from the standardised approach to the IRB approach, the RWA movement by key driver statement shows the increase in IRB RWAs, but does not show the corresponding reduction in standardised approach RWAs as its scope is limited to IRB only.
The movement in RWAs is quantified at the date at which the IRB approach is applied, and not during the testing phase as with a new/updated model.
4. Methodology and policy
Internal regulatory updates
This captures the RWA impact resulting from changing the internal treatment of exposures. This may include, but is not limited to, a portfolio or a part of one moving from an existing IRB model onto a standardised model, identification of netting and credit risk mitigation.
External regulatory updates
This specifies the impact resulting from additional or changing regulatory requirements. This includes, but is not limited to, regulatory-prescribed changes to the RWA calculation. The movement in RWAs is quantified by comparing the RWAs calculated for that portfolio under the old and the new requirements.
5. Book size
RWA movements attributed to this driver are those we would expect to experience for the given movement in exposure, as measured by EAD adjusted for eligible cash collateral for businesses which are managed on a basis net of collateral, assuming a stable risk profile. These RWA movements arise in the normal course of business, such as growth in credit exposures or reduction in book size from run-offs and write-offs.
The RWA movement is quantified as follows:
• RWA and EAD changes captured in the four drivers above are excluded from the total movements to create an adjusted movement in EAD and RWA for the period.
• The average RWA to EAD percentage is calculated for the opening position and is applied to the adjusted movement in EAD. This results in an estimated book size RWA movement based on the assumption that the EAD to RWA percentage is constant throughout the period.
As the calculation relies on averaging, the output is dependent upon the degree of portfolio aggregation and the number of discrete time periods for which the calculation is undertaken. For each quarter of 2013 this calculation was performed for each HSBC company with an IRB portfolio by global businesses, split by the main Basel categories of credit exposures, as described in the table below:
Basel categories of IRB credit exposures within HSBC
Central governments and central banks Corporate foundation IRB Qualifying revolving retail exposures
Institutions Other advanced IRB Retail SME
Corporate advanced IRB Retail mortgages Other retail
The total of the results is shown in book size within the RWA movement by key driver table.
6. Book quality
This represents RWA movements resulting from changes in the underlying credit quality of customers. These are caused by changes to IRB risk parameters which arise from actions such as, but not limited to, model recalibration, change in counterparty external rating, or the influence of new lending on the average quality of the book. The
H S B C H O L D I N G S P L C
Interim Management Report (continued) Appendix to Capital
198
change in RWAs attributable to book quality is calculated as the balance of RWA movements after taking account of all drivers described above. The RWA movement by key driver statement includes only movements which are calculated under the IRB approach. Certain classes of credit risk exposure are treated as capital deductions and therefore reductions are not shown in this statement. If the treatment of a credit risk exposure changes from RWA to capital deduction in the period, then only the reduction in RWAs would appear in the RWA movement by key driver tables. In this instance, a reduction in RWAs does not necessarily indicate an improvement in the capital position.
Counterparty risk drivers – definitions and quantification
The RWA movement by key driver for counterparty credit risk calculates the credit risk drivers 5 and 6 at a more granular level, by using transaction level details provided by regional sites. ‘Foreign exchange movement’ is not a reported layer for counterparty risk drivers, as there is cross currency netting across the portfolio.
Market risk drivers – definitions and quantification
The RWA movement by key driver for market risk combines the credit risk drivers 5 and 6 into a single driver called ‘Movements in risk levels’.
Leverage ratio: basis of preparation
The numerator, capital measure, is calculated using the ‘end point’ definition of tier 1 capital applicable from 1 January 2022, which is set out in the final CRD IV rules. This is supplemented with the EBA’s Own Funds’ RTS to the extent that these have been published in the Official Journal of the European Commission as at the reporting date, as well as making reference to the PRA Rulebook where appropriate. The denominator, exposure measure, is calculated according to the January 2014 Basel III leverage ratio framework, the instructions provided in March 2014 for the Basel III Quantitative Impact Study, its related Frequently Asked Questions and the PRA’s guidance on the methodologies used there. This revised Basel III leverage ratio framework follows the same scope of regulatory consolidation as is used for the risk-based capital framework, which differs to the 2010 Basel text that required banks to include items using their accounting balance sheet. The exposure measure generally follows the accounting value, adjusted as follows:
• on-balance sheet, non-derivative exposures are included in the exposure measure net of specific provisions or accounting valuation adjustments (e.g. accounting credit valuation adjustments);
• netting of loans and deposits is not allowed; • the scope of netting for derivatives is extended to all scenarios where we would recognise a netting agreement
for regulatory purposes; • compared with the Basel 2010 text, the Basel 2014 text appears to permit the offsetting of cash variation margin
against derivative assets and liabilities in circumstances where we would recognise offset for regulatory purposes. This is subject to certain additional conditions including the requirement that the margin be exchanged daily and be in the same currency as the currency of settlement of the derivative contract. For these purposes we have considered this to include any currency that can be used to make payments under the derivative contract, the governing qualifying master netting agreement, or its associated credit support annex;
• the approach to netting securities financing transactions (‘SFT’s) is aligned to that permitted under IFRS, though for leverage purposes there is an additional add-on to the extent that an SFT is under collateralised. This represents a stricter requirement compared with the Basel 2010 text;
• the inclusion of potential future exposure add-ons for both OTC and exchange-traded derivatives; • the notional amount of written credit derivatives is included in the exposure measure, subject to offsets for
purchased protection. This represents a stricter requirement compared with the Basel 2010 text; • off-balance sheet items are converted into credit exposure equivalents through the use of credit conversion
factors (‘CCF’s). The Basel 2010 text required that off-balance sheet items are included in full except for commitments that are unconditionally cancellable at any time by HSBC without prior notice, where only 10% of the exposures are included. This has changed under the Basel 2014 text which now includes a CCF of 20% and 50% for certain exposures; and
• the exclusion of items deducted from the end point tier 1 capital such as goodwill and intangible assets.
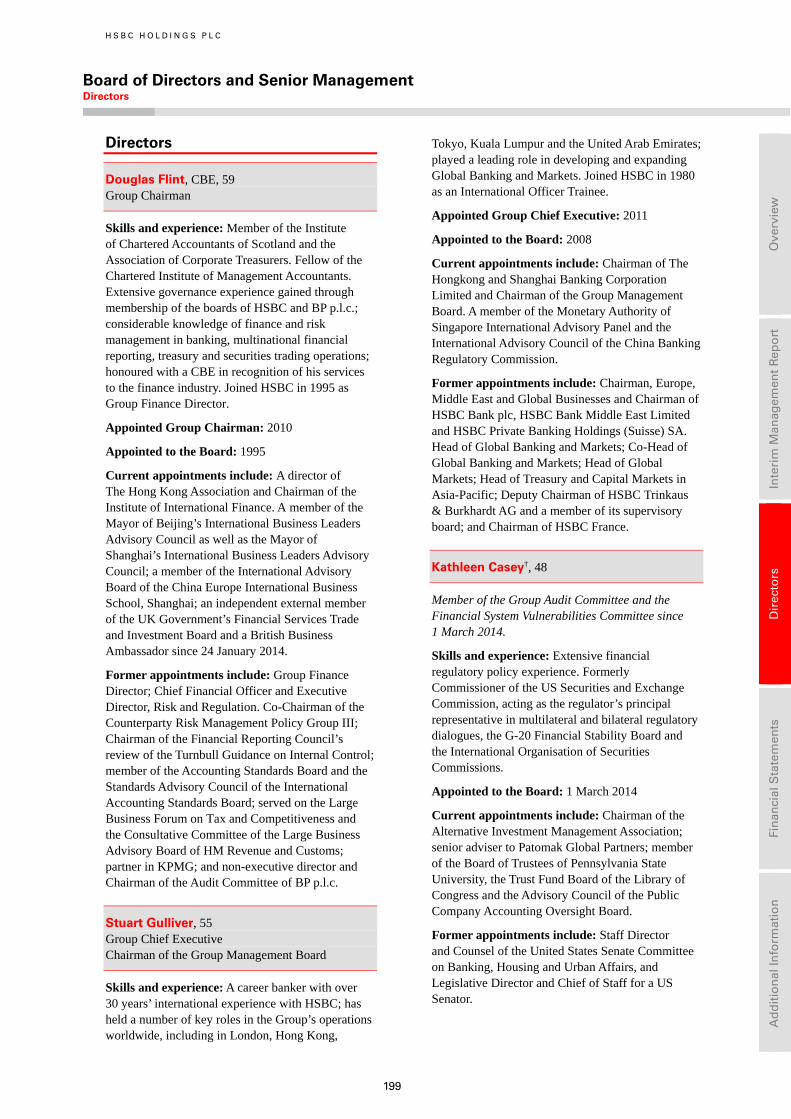
H S B C H O L D I N G S P L C
Board of Directors and Senior Management Directors
199
Ove
rvie
w
In
teri
m M
anag
emen
t R
epo
rt
D
irec
tors
Fin
anci
al S
tate
men
ts
A
dd
itio
nal
Info
rmat
ion
Directors
Douglas Flint, CBE, 59 Group Chairman
Skills and experience: Member of the Institute of Chartered Accountants of Scotland and the Association of Corporate Treasurers. Fellow of the Chartered Institute of Management Accountants. Extensive governance experience gained through membership of the boards of HSBC and BP p.l.c.; considerable knowledge of finance and risk management in banking, multinational financial reporting, treasury and securities trading operations; honoured with a CBE in recognition of his services to the finance industry. Joined HSBC in 1995 as Group Finance Director.
Appointed Group Chairman: 2010
Appointed to the Board: 1995
Current appointments include: A director of The Hong Kong Association and Chairman of the Institute of International Finance. A member of the Mayor of Beijing’s International Business Leaders Advisory Council as well as the Mayor of Shanghai’s International Business Leaders Advisory Council; a member of the International Advisory Board of the China Europe International Business School, Shanghai; an independent external member of the UK Government’s Financial Services Trade and Investment Board and a British Business Ambassador since 24 January 2014.
Former appointments include: Group Finance Director; Chief Financial Officer and Executive Director, Risk and Regulation. Co-Chairman of the Counterparty Risk Management Policy Group III; Chairman of the Financial Reporting Council’s review of the Turnbull Guidance on Internal Control; member of the Accounting Standards Board and the Standards Advisory Council of the International Accounting Standards Board; served on the Large Business Forum on Tax and Competitiveness and the Consultative Committee of the Large Business Advisory Board of HM Revenue and Customs; partner in KPMG; and non-executive director and Chairman of the Audit Committee of BP p.l.c.
Stuart Gulliver, 55 Group Chief Executive Chairman of the Group Management Board
Skills and experience: A career banker with over 30 years’ international experience with HSBC; has held a number of key roles in the Group’s operations worldwide, including in London, Hong Kong,
Tokyo, Kuala Lumpur and the United Arab Emirates; played a leading role in developing and expanding Global Banking and Markets. Joined HSBC in 1980 as an International Officer Trainee.
Appointed Group Chief Executive: 2011
Appointed to the Board: 2008
Current appointments include: Chairman of The Hongkong and Shanghai Banking Corporation Limited and Chairman of the Group Management Board. A member of the Monetary Authority of Singapore International Advisory Panel and the International Advisory Council of the China Banking Regulatory Commission.
Former appointments include: Chairman, Europe, Middle East and Global Businesses and Chairman of HSBC Bank plc, HSBC Bank Middle East Limited and HSBC Private Banking Holdings (Suisse) SA. Head of Global Banking and Markets; Co-Head of Global Banking and Markets; Head of Global Markets; Head of Treasury and Capital Markets in Asia-Pacific; Deputy Chairman of HSBC Trinkaus & Burkhardt AG and a member of its supervisory board; and Chairman of HSBC France.
Kathleen Casey†, 48
Member of the Group Audit Committee and the Financial System Vulnerabilities Committee since 1 March 2014.
Skills and experience: Extensive financial regulatory policy experience. Formerly Commissioner of the US Securities and Exchange Commission, acting as the regulator’s principal representative in multilateral and bilateral regulatory dialogues, the G-20 Financial Stability Board and the International Organisation of Securities Commissions.
Appointed to the Board: 1 March 2014
Current appointments include: Chairman of the Alternative Investment Management Association; senior adviser to Patomak Global Partners; member of the Board of Trustees of Pennsylvania State University, the Trust Fund Board of the Library of Congress and the Advisory Council of the Public Company Accounting Oversight Board.
Former appointments include: Staff Director and Counsel of the United States Senate Committee on Banking, Housing and Urban Affairs, and Legislative Director and Chief of Staff for a US Senator.
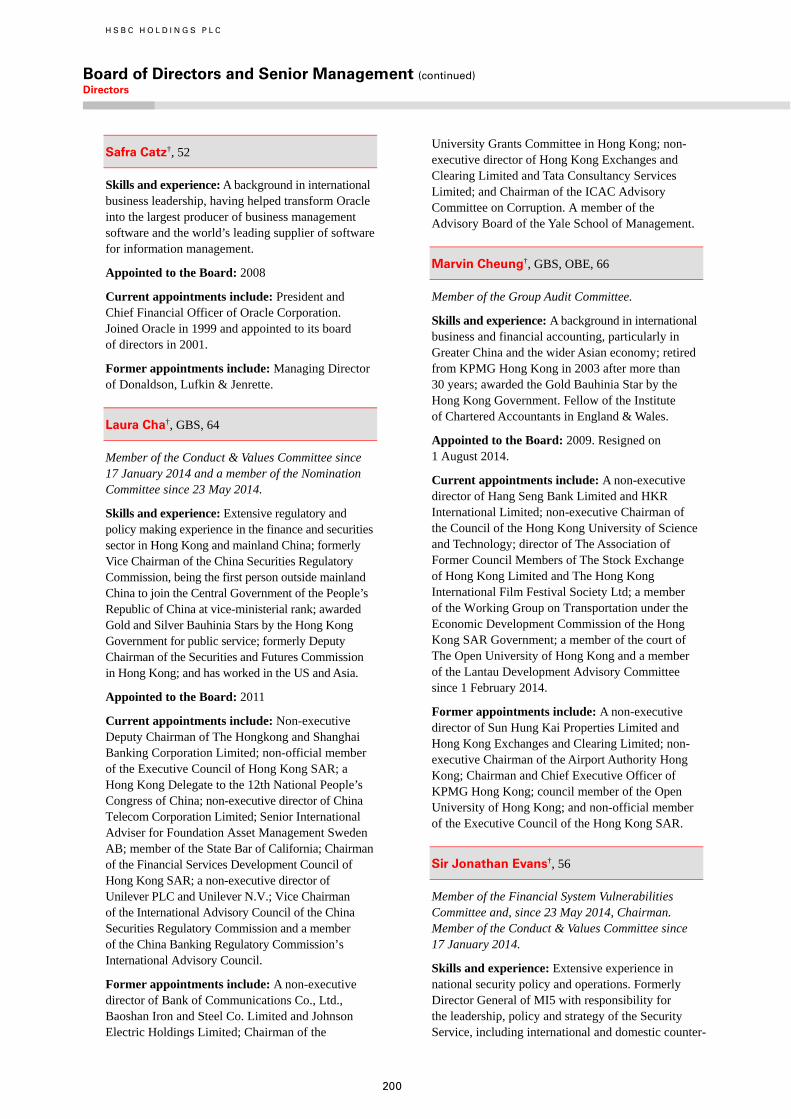
H S B C H O L D I N G S P L C
Board of Directors and Senior Management (continued) Directors
200
Safra Catz†, 52
Skills and experience: A background in international business leadership, having helped transform Oracle into the largest producer of business management software and the world’s leading supplier of software for information management.
Appointed to the Board: 2008
Current appointments include: President and Chief Financial Officer of Oracle Corporation. Joined Oracle in 1999 and appointed to its board of directors in 2001.
Former appointments include: Managing Director of Donaldson, Lufkin & Jenrette.
Laura Cha†, GBS, 64
Member of the Conduct & Values Committee since 17 January 2014 and a member of the Nomination Committee since 23 May 2014.
Skills and experience: Extensive regulatory and policy making experience in the finance and securities sector in Hong Kong and mainland China; formerly Vice Chairman of the China Securities Regulatory Commission, being the first person outside mainland China to join the Central Government of the People’s Republic of China at vice-ministerial rank; awarded Gold and Silver Bauhinia Stars by the Hong Kong Government for public service; formerly Deputy Chairman of the Securities and Futures Commission in Hong Kong; and has worked in the US and Asia.
Appointed to the Board: 2011
Current appointments include: Non-executive Deputy Chairman of The Hongkong and Shanghai Banking Corporation Limited; non-official member of the Executive Council of Hong Kong SAR; a Hong Kong Delegate to the 12th National People’s Congress of China; non-executive director of China Telecom Corporation Limited; Senior International Adviser for Foundation Asset Management Sweden AB; member of the State Bar of California; Chairman of the Financial Services Development Council of Hong Kong SAR; a non-executive director of Unilever PLC and Unilever N.V.; Vice Chairman of the International Advisory Council of the China Securities Regulatory Commission and a member of the China Banking Regulatory Commission’s International Advisory Council.
Former appointments include: A non-executive director of Bank of Communications Co., Ltd., Baoshan Iron and Steel Co. Limited and Johnson Electric Holdings Limited; Chairman of the
University Grants Committee in Hong Kong; non-executive director of Hong Kong Exchanges and Clearing Limited and Tata Consultancy Services Limited; and Chairman of the ICAC Advisory Committee on Corruption. A member of the Advisory Board of the Yale School of Management.
Marvin Cheung†, GBS, OBE, 66
Member of the Group Audit Committee.
Skills and experience: A background in international business and financial accounting, particularly in Greater China and the wider Asian economy; retired from KPMG Hong Kong in 2003 after more than 30 years; awarded the Gold Bauhinia Star by the Hong Kong Government. Fellow of the Institute of Chartered Accountants in England & Wales.
Appointed to the Board: 2009. Resigned on 1 August 2014.
Current appointments include: A non-executive director of Hang Seng Bank Limited and HKR International Limited; non-executive Chairman of the Council of the Hong Kong University of Science and Technology; director of The Association of Former Council Members of The Stock Exchange of Hong Kong Limited and The Hong Kong International Film Festival Society Ltd; a member of the Working Group on Transportation under the Economic Development Commission of the Hong Kong SAR Government; a member of the court of The Open University of Hong Kong and a member of the Lantau Development Advisory Committee since 1 February 2014.
Former appointments include: A non-executive director of Sun Hung Kai Properties Limited and Hong Kong Exchanges and Clearing Limited; non-executive Chairman of the Airport Authority Hong Kong; Chairman and Chief Executive Officer of KPMG Hong Kong; council member of the Open University of Hong Kong; and non-official member of the Executive Council of the Hong Kong SAR.
Sir Jonathan Evans†, 56
Member of the Financial System Vulnerabilities Committee and, since 23 May 2014, Chairman. Member of the Conduct & Values Committee since 17 January 2014.
Skills and experience: Extensive experience in national security policy and operations. Formerly Director General of MI5 with responsibility for the leadership, policy and strategy of the Security Service, including international and domestic counter-
201
Ove
rvie
w
In
teri
m M
anag
emen
t R
epo
rt
D
irec
tors
Fin
anci
al S
tate
men
ts
A
dd
itio
nal
Info
rmat
ion
terrorism, counter-espionage and counter-proliferation activities and cyber security. Responsibility for the oversight of the Joint Terrorist Analysis Centre and the Centre for the Protection of National Infrastructure and attended the National Security Council.
Appointed to the Board: 2013
Current appointments include: Senior associate of Accenture plc; a member of the advisory board of Darktrace Limited; a non-executive director of the UK National Crime Agency; and an adviser to Facewatch Limited.
Former appointments include: Various positions in the UK Security Service over a 30-year career, including: Director General; Deputy Director General; Director of International Counter-Terrorism; and Head of the Security Service’s Secretariat.
Joachim Faber†, 64
Chairman of the Group Risk Committee.
Skills and experience: A background in banking and asset management with significant international experience, having worked in Germany, Tokyo, New York and London. Former Chief Executive Officer of Allianz Global Investors AG and member of the management board of Allianz SE; 14 years’ experience with Citigroup Inc. holding positions in Trading and Project Finance and as Head of Capital Markets for Europe, North America and Japan. Has a doctorate from the University of Administrative Sciences in Speyer, Germany.
Appointed to the Board: 2012
Current appointments include: Chairman of the supervisory board of Deutsche Börse AG; Chairman of the Shareholder Committee of Joh A. Benckiser SARL; independent director of Coty Inc.; director of Allianz France S.A.; member of the advisory boards of the Siemens Group Pension Board, the European School for Management and Technology; and council member of The Hongkong – Europe Business Council.
Former appointments include: Chairman of Allianz Global Investors Kapitalanlagegesellschaft and Allianz Global Investors Deutschland GmbH; Chairman of the board of Allianz Global Investors SGR; member of the board of Allianz SpA, Allianz Investment Management GmbH and Allianz Climate Solutions GmbH and of the supervisory board of Bayerische Bӧrse AG; and member of the supervisory board and Chairman of the audit and risk committee of OSRAM Licht AG; member of the
German Council for Sustainable Development.
Rona Fairhead†, CBE, 52
Chairman of the Financial System Vulnerabilities Committee until 23 May 2014, and a member thereafter. Member of the Nomination Committee.
Skills and experience: A background in international industry, publishing, finance and general management. Formerly Chairman and CEO of the Financial Times Group Limited responsible for its strategy, management and operations and Finance Director of Pearson plc with responsibility for overseeing the day-to-day running of the finance function and directly responsible for global financial reporting and control, tax and treasury. Has a Master’s in Business Administration from the Harvard Business School.
Appointed to the Board: 2004
Current appointments include: Chairman of HSBC North America Holdings Inc. since 1 January 2014. A non-executive member of the board of the UK Government’s Cabinet Office; a non-executive director of The Economist Newspaper Limited; a British Business Ambassador since 24 January 2014; and a non-executive director of PepsiCo Inc. since 13 March 2014.
Former appointments include: Executive Vice President, Strategy and Group Control of Imperial Chemical Industries plc; Finance Director of Pearson plc; and Chairman and director of Interactive Data Corporation. Chairman and CEO of Financial Times Group Limited and director of Pearson plc.
Renato Fassbind†, 59
Member and, since 23 May 2014, Chairman of the Group Audit Committee. Member of the Group Remuneration Committee.
Skills and experience: A background in financial accounting and international business. Formerly Chief Financial Officer of Credit Suisse Group AG and ABB Group. Has a Master’s in Business Administration and a PhD in Economics from the University of Zurich.
Appointed to the Board: 2013
Current appointments include: Vice Chairman of the supervisory board, chairman of the audit committee and member of the compensation committee of Swiss Reinsurance Company; member of the supervisory board and audit committee of Kühne + Nagel International AG; independent director of Oanda Corporation and Ahaus Alstaetter
H S B C H O L D I N G S P L C
Board of Directors and Senior Management (continued) Directors
202
Eisenbahn; and member of the supervisory board of the Swiss Federal Audit Oversight Authority.
Former appointments include: Chief Financial Officer of Credit Suisse Group AG; Senior Adviser to the Chief Executive, Credit Suisse Group AG; Chief Executive Officer of Diethelm Keller Group; Chief Financial Officer of ABB Group; Chairman of ABB (Switzerland) AG and DKSH AG; and a member of the supervisory board of Winterthur Insurance Company.
Sam Laidlaw†, 58
Member of the Group Remuneration Committee and, since 23 May 2014, member of the Nomination Committee.
Skills and experience: Significant international experience, particularly in the energy sector, having had responsibility for businesses in four continents. Qualified solicitor and Master’s in Business Administration from INSEAD.
Appointed to the Board: 2008
Current appointments include: Chief Executive Officer of Centrica plc; and lead non-executive board member of the UK Department for Transport.
Former appointments include: Executive Vice President of Chevron Corporation; non-executive director of Hanson PLC; Chief Executive Officer of Enterprise Oil plc; President and Chief Operating Officer of Amerada Hess Corporation; and a member of the UK Prime Minister’s Business Advisory Group.
John Lipsky†, 67
Member of the Group Risk Committee, the Nomination Committee and, since 23 May 2014, the Group Remuneration Committee.
Skills and experience: International experience having worked in Chile, New York, Washington and London and interacted with financial institutions, central banks and governments in many countries. Served at the International Monetary Fund as First Deputy Managing Director, Acting Managing Director and as Special Adviser. Has a PhD from Stanford University.
Appointed to the Board: 2012
Current appointments include: Senior Fellow, Foreign Policy Institute at the Paul H. Nitze School
of Advanced International Studies, Johns Hopkins University. Co-chairman of the Aspen Institute Program on the World Economy; director of the National Bureau of Economic Research and the Center for Global Development; and member of the advisory board of the Stanford Institute for Economic Policy Research and the Council on Foreign Relations. Global Policy Adviser for Anderson Global Macro, LLC and Chairman of World Economic Forum’s Global Agenda Council on the International Monetary System.
Former appointments include: Vice Chairman of J P Morgan Investment Bank; director of the American Council on Germany and the Japan Society; and a trustee of the Economic Club of New York.
Rachel Lomax†, 69
Chairman of the Conduct & Values Committee since 17 January 2014. Member of the Group Audit Committee and Group Risk Committee.
Skills and experience: Experience in both the public and private sectors and a deep knowledge of the operation of the UK Government and financial system.
Appointed to the Board: 2008
Current appointments include: Chairman of the International Regulatory Strategy Group; a director of TheCityUK; a non-executive director of Arcus European Infrastructure Fund GP LLP and Heathrow Airport Holdings Limited; member of the Council of Imperial College, London; President of the Institute of Fiscal Studies; a director of Bruegel, a Brussels-based European think tank; a Trustee of the Ditchley Foundation; and a non-executive director and chairman of the corporate responsibility committee of Serco Group plc since 3 March 2014.
Former appointments include: Deputy Governor, Monetary Stability, at the Bank of England and member of the Monetary Policy Committee; Permanent Secretary at the UK Government Departments for Transport and Work and Pensions and the Welsh Office; and Vice President and Chief of Staff to the President of the World Bank. A non-executive director of Reinsurance Group of America Inc. and The Scottish American Investment Company PLC.
203
Ove
rvie
w
In
teri
m M
anag
emen
t R
epo
rt
D
irec
tors
Fin
anci
al S
tate
men
ts
A
dd
itio
nal
Info
rmat
ion
Iain Mackay, 52 Group Finance Director
Skills and experience: Extensive financial and international experience, having worked in London, Paris, US, Africa and Asia. Member of the Institute of Chartered Accountants of Scotland. Joined HSBC in 2007 as Chief Financial Officer of HSBC North America Holdings Inc.
Appointed to the Board: 2010
Current appointments include: A member of the Group Management Board.
Former appointments include: A director of Hang Seng Bank Limited; Chief Financial Officer, Asia-Pacific; Chief Financial Officer, HSBC North America Holdings Inc; Vice President and Chief Financial Officer of GE Consumer Finance and Vice President and Chief Financial Officer of GE Healthcare – Global Diagnostic Imaging.
Marc Moses, 56 Group Chief Risk Officer
Skills and experience: Member of the Institute of Chartered Accountants of England and Wales. Extensive risk management and financial experience. Joined HSBC in 2005 as Chief Financial and Risk Officer, Global Banking and Markets.
Appointed to the Board: 1 January 2014
Current appointments include: A member of the Group Management Board. A director of HSBC Private Bank (Suisse) SA and HSBC Private Banking Holdings (Suisse) SA.
Former appointments include: Chief Financial and Risk Officer, Global Banking and Markets and director of HSBC Insurance (Bermuda) Limited. Formerly European chief financial officer at JP Morgan and audit partner at PricewaterhouseCoopers.
Sir Simon Robertson†, 73 Deputy Chairman and senior independent non-executive Director
Chairman of the Nomination Committee and the Group Remuneration Committee. Member of the Financial System Vulnerabilities Committee.
Skills and experience: A background in international corporate advisory work with a wealth of experience in mergers and acquisitions, merchant banking, investment banking and financial markets; honoured with a knighthood in recognition of his services to business; extensive international experience having worked in France, Germany, the UK and the US.
Appointed Senior Independent Director: 2007
Appointed Deputy Chairman: 2010
Appointed to the Board: 2006
Current appointments include: The founding member of Simon Robertson Associates LLP; a non-executive director of Berry Bros. & Rudd Limited, The Economist Newspaper Limited and Troy Asset Management; and trustee of the Eden Project Trust and the Royal Opera House Endowment Fund.
Former appointments include: Managing Director of Goldman Sachs International; Chairman of Dresdner Kleinwort Benson; non-executive director of Royal Opera House, Covent Garden Limited and NewShore Partners Limited; and non-executive Chairman of Rolls-Royce Holdings plc.
Jonathan Symonds†, CBE, 55
A member of the Group Remuneration Committee and Conduct & Values Committee since 14 April 2014.
Skills and experience: Extensive international financial experience, having worked in the UK, US and Switzerland. Fellow of the Institute of Chartered Accountants in England & Wales.
Appointed to the Board: 14 April 2014
Current appointments include: Chairman of HSBC Bank plc. A non-executive director of Genomics England Limited. Innocoll Inc. since 23 May 2014 and Proteus Digital Health since 2 June 2014.
Former appointments include: Chief Financial Officer of Novartis AG; partner and managing director of Goldman Sachs; Chief Financial Officer of AstraZeneca plc and a partner of KPMG. A non-executive director and Chairman of the Audit Committee of Diageo plc.
† Independent non-executive Director.

H S B C H O L D I N G S P L C
Board of Directors and Senior Management (continued) Secretary / Group Managing Directors
204
Secretary
Ben Mathews, 47 Group Company Secretary
Joined HSBC on 11 June 2013 and became Group Company Secretary on 1 July 2013. Fellow of the Institute of Chartered Secretaries and Administrators. Former appointments include: Group Company Secretary of Rio Tinto plc and Group Company Secretary of BG Group plc.
Group Managing Directors
Ann Almeida, 58 Group Head of Human Resources and Corporate Sustainability
Joined HSBC in 1992. A Group Managing Director since 2008. Former HSBC appointments include: Global Head of Human Resources for Global Banking and Markets, Global Private Banking, Global Transaction Banking and HSBC Amanah.
Samir Assaf, 54 Chief Executive, Global Banking and Markets
Joined HSBC in 1994. A Group Managing Director since 2011. Chairman of HSBC France and director of HSBC Trinkaus & Burkhardt AG. Former HSBC appointments include: director of HSBC Global Asset Management Limited and of HSBC Bank Egypt S.A.E.; Head of Global Markets; and Head of Global Markets for Europe, Middle East and Africa.
Peter Boyles, 58 Chief Executive of Global Private Banking
Joined HSBC in 1975. A Group Managing Director since October 2013. A director of HSBC Global Asset Management Limited since April 2013. Former HSBC appointments include: Chief Executive of HSBC France and Continental Europe and a director of HSBC Bank plc. Ceased to be director of HSBC Bank Malta p.l.c in March 2013 and director of HSBC Trinkaus & Burkhardt AG in August 2013.
Simon Cooper, 46 Chief Executive, Global Commercial Banking
Joined HSBC in 1989. A Group Managing Director and Chief Executive of Global Commercial Banking since October 2013. A director of HSBC Bank plc since April 2013. Former HSBC appointments include: Chief Executive of HSBC Bank Middle East, Chief Executive of HSBC Korea and Head of Corporate and Investment Banking of HSBC Singapore. Ceased to be Chairman of HSBC Bank Egypt S.A.E in June 2013, director of The Saudi British Bank in September 2013, Deputy Chairman and Chief Executive of HSBC Bank Middle East Limited in October 2013, director and Chairman of HSBC Bank Oman in October 2013 and a director of HSBC Bank Middle East Limited on 13 February 2014.
Irene Dorner, 59 President and Chief Executive Officer of HSBC USA (due to retire on 1 November 2014)
Joined HSBC in 1986. A Group Managing Director since February 2013. Chairman of HSBC Bank USA, National Association and HSBC USA Inc.; President and Chief Executive Officer of HSBC North America Inc. Former HSBC appointments include: Chairman of HSBC Amanah Malaysia Berhad and HSBC Amanah Takaful (Malaysia) Sendirian Berhad; Deputy Chairman and Chief Executive of HSBC Bank Malaysia Berhad; Chief Operating Officer, Treasury and Capital Markets; General Manager of Marketing, General Manager of Human Resources; and General Manager of Premier and Wealth Management, HSBC Bank plc.
John Flint, 46 Chief Executive, Retail Banking and Wealth Management
Joined HSBC in 1989. A Group Managing Director since January 2013. A director of HSBC Private Banking Holdings (Suisse) SA since June 2013. Formerly a Director of HSBC Bank Canada. Former HSBC appointments include: Chief of Staff to the Group Chief Executive and Group Head of Strategy and Planning; Chief Executive Officer, HSBC Global Asset Management; Group Treasurer; and Deputy Head of Global Markets.

205
Ove
rvie
w
In
teri
m M
anag
emen
t R
epo
rt
D
irec
tors
Fin
anci
al S
tate
men
ts
A
dd
itio
nal
Info
rmat
ion
Pam Kaur, 50 Group Head of Internal Audit
Joined HSBC and became a Group Managing Director in April 2013. A co-opted member of The Institute of Chartered Accountants in England & Wales since May 2013. Former appointments include: Global Head of Group Audit for Deutsche Bank AG; Chief Financial Officer and Chief Operating Officer, Restructuring and Risk Division, Royal Bank of Scotland Group plc; Group Head of Compliance and Anti-Money Laundering, Lloyds TSB; and Global Director of Compliance, Global Consumer Group, Citigroup.
Alan Keir, 55 Chief Executive, HSBC Bank plc
Joined HSBC in 1981. A Group Managing Director since 2011. Group Managing Director, Europe Middle East & Africa and Chief Executive of HSBC Bank plc since October 2013. A Director of HSBC Bank Middle East Limited since February 2014, a director of HSBC Trinkaus & Burkhardt AG since August 2013 and a director of HSBC France since December 2013. Former HSBC appointments include: Global Head, Global Commercial Banking.
Stuart Levey, 51 Chief Legal Officer
Joined HSBC and became a Group Managing Director in January 2012. Former appointments include: Under Secretary for Terrorism and Financial Intelligence in the US Department of Treasury; Senior Fellow for National Security and Financial Integrity at the Council on Foreign Relations; Principal Associate Deputy Attorney General at the US Department of Justice; and Partner at Miller, Cassidy, Larroca & Lewin LLP and Baker Botts LLP.
Antonio Losada, 59 Chief Executive, Latin America and the Caribbean
Joined HSBC in 1973. A Group Managing Director since December 2012. Ceased to be Chairman of HSBC Bank (Panama) S.A. in October 2013. A director of HSBC Bank Argentina S.A., HSBC Mexico, S.A., Institucion de Banca Multiple, Grupo Financiero HSBC and Grupo Financiero HSBC, S.A. de C.V. Director of HSBC North America Holdings since January 2014. Former HSBC appointments include: Chief Executive Officer, HSBC Argentina; and Deputy Head, Personal Financial Services, Brazil.
Sean O’Sullivan, 58 Group Chief Operating Officer
Joined HSBC in 1980. A Group Managing Director since 2011. Former HSBC appointments include: Group Chief Technology and Services Officer; director and Chief Operating Officer of HSBC Bank plc; and Chief Operating Officer of HSBC Bank Canada.
Peter Wong, 62 Deputy Chairman and Chief Executive, The Hongkong and Shanghai Banking Corporation Limited
Joined HSBC in 2005. A Group Managing Director since 2010. Chairman of HSBC Bank (China) Company Limited and HSBC Bank Malaysia Berhad. A non-executive director of Hang Seng Bank Limited and Bank of Communications Co. Ltd. An independent non-executive director of Cathay Pacific Airways Limited. Former appointments include: Vice Chairman of HSBC Bank (Vietnam) Ltd; director of HSBC Bank Australia Limited; and a director of Ping An Insurance (Group) Company of China, Ltd.
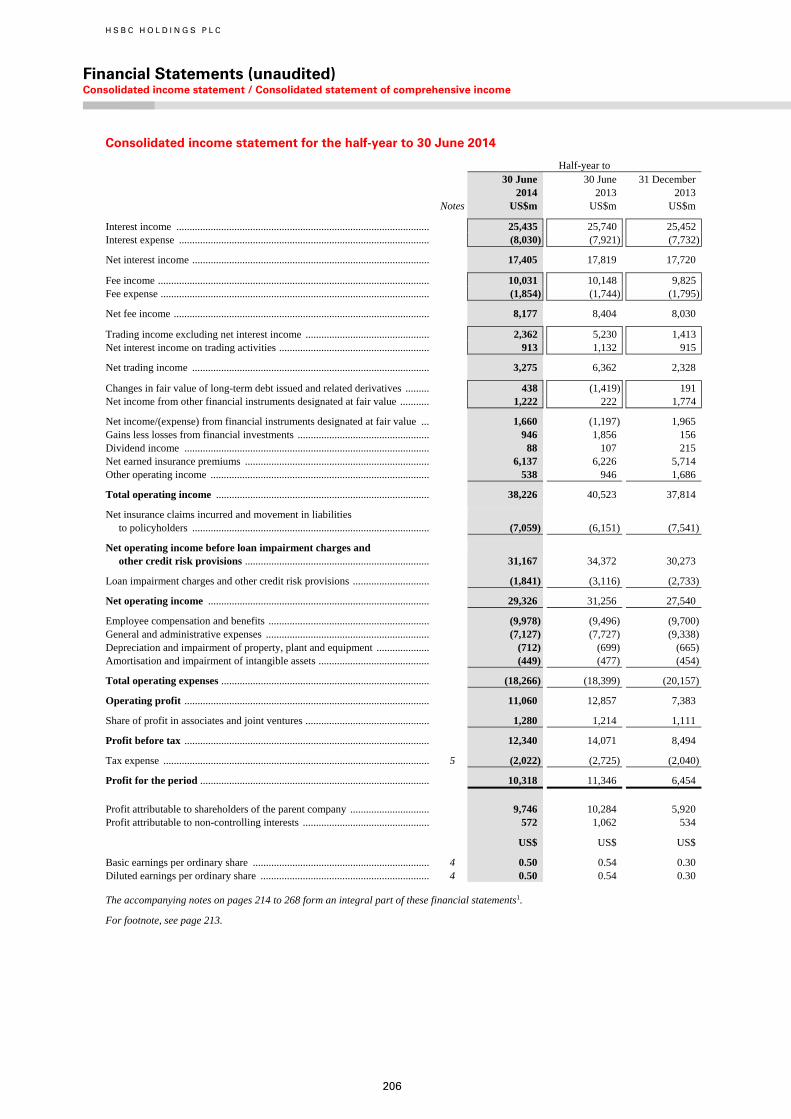
H S B C H O L D I N G S P L C
Financial Statements (unaudited) Consolidated income statement / Consolidated statement of comprehensive income
206
Consolidated income statement for the half-year to 30 June 2014
Half-year to
30 June 2014
30 June 2013
31 December 2013
Notes US$m US$m US$m
Interest income ................................................................................................ 25,435 25,740 25,452Interest expense ............................................................................................... (8,030) (7,921) (7,732)
Net interest income .......................................................................................... 17,405 17,819 17,720
Fee income ....................................................................................................... 10,031 10,148 9,825Fee expense ...................................................................................................... (1,854) (1,744) (1,795)
Net fee income ................................................................................................. 8,177 8,404 8,030
Trading income excluding net interest income ............................................... 2,362 5,230 1,413Net interest income on trading activities ......................................................... 913 1,132 915
Net trading income .......................................................................................... 3,275 6,362 2,328
Changes in fair value of long-term debt issued and related derivatives ......... 438 (1,419) 191Net income from other financial instruments designated at fair value ........... 1,222 222 1,774
Net income/(expense) from financial instruments designated at fair value ... 1,660 (1,197) 1,965 Gains less losses from financial investments .................................................. 946 1,856 156 Dividend income ............................................................................................. 88 107 215 Net earned insurance premiums ...................................................................... 6,137 6,226 5,714 Other operating income ................................................................................... 538 946 1,686
Total operating income ................................................................................. 38,226 40,523 37,814
Net insurance claims incurred and movement in liabilities to policyholders .......................................................................................... (7,059) (6,151) (7,541)
Net operating income before loan impairment charges and other credit risk provisions ...................................................................... 31,167 34,372 30,273
Loan impairment charges and other credit risk provisions ............................. (1,841) (3,116) (2,733)
Net operating income .................................................................................... 29,326 31,256 27,540
Employee compensation and benefits ............................................................. (9,978) (9,496) (9,700)General and administrative expenses .............................................................. (7,127) (7,727) (9,338)Depreciation and impairment of property, plant and equipment .................... (712) (699) (665)Amortisation and impairment of intangible assets .......................................... (449) (477) (454)
Total operating expenses ............................................................................... (18,266) (18,399) (20,157)
Operating profit ............................................................................................. 11,060 12,857 7,383
Share of profit in associates and joint ventures ............................................... 1,280 1,214 1,111
Profit before tax ............................................................................................. 12,340 14,071 8,494
Tax expense ..................................................................................................... 5 (2,022) (2,725) (2,040)
Profit for the period ....................................................................................... 10,318 11,346 6,454
Profit attributable to shareholders of the parent company .............................. 9,746 10,284 5,920 Profit attributable to non-controlling interests ................................................ 572 1,062 534
US$ US$ US$
Basic earnings per ordinary share ................................................................... 4 0.50 0.54 0.30 Diluted earnings per ordinary share ................................................................ 4 0.50 0.54 0.30
The accompanying notes on pages 214 to 268 form an integral part of these financial statements1.
For footnote, see page 213.
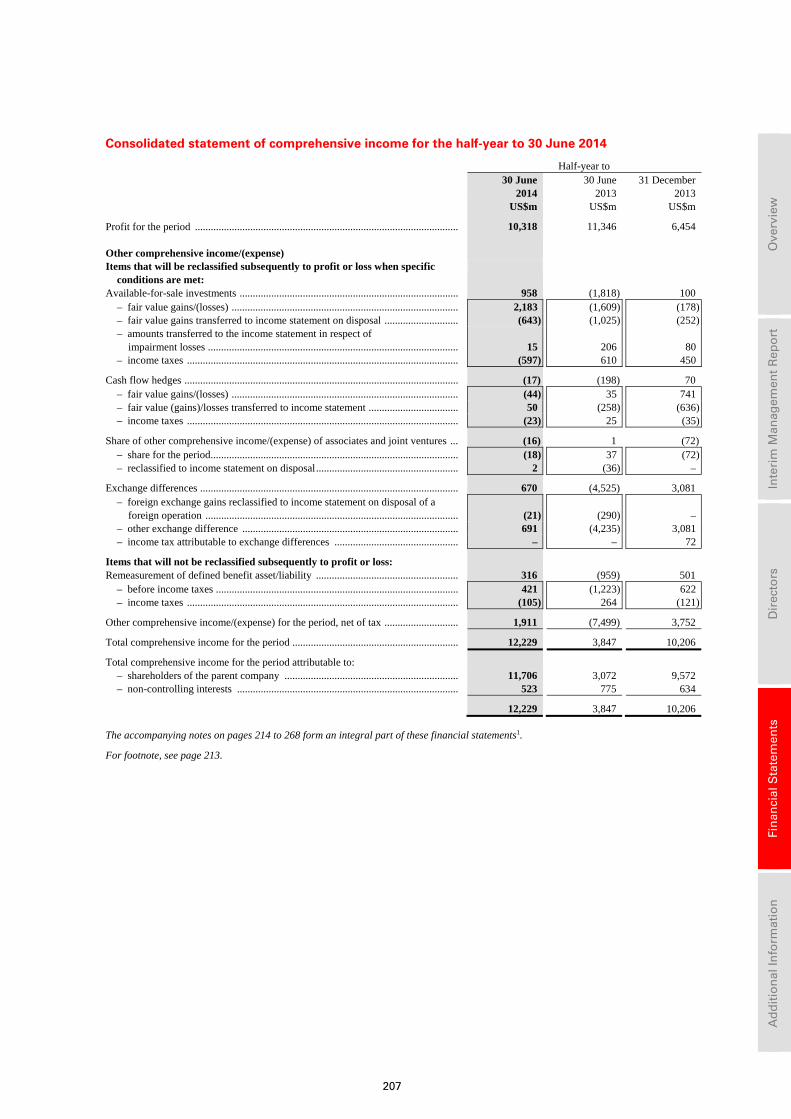
207
Ove
rvie
w
In
teri
m M
anag
emen
t R
epo
rt
D
irec
tors
Fin
anci
al S
tate
men
ts
A
dd
itio
nal
Info
rmat
ion
Consolidated statement of comprehensive income for the half-year to 30 June 2014
Half-year to 30 June 30 June 31 December 2014 2013 2013
US$m US$m US$m
Profit for the period .................................................................................................... 10,318 11,346 6,454 Other comprehensive income/(expense) Items that will be reclassified subsequently to profit or loss when specific
conditions are met: Available-for-sale investments ................................................................................... 958 (1,818) 100
– fair value gains/(losses) ...................................................................................... 2,183 (1,609) (178)– fair value gains transferred to income statement on disposal ............................ (643) (1,025) (252)– amounts transferred to the income statement in respect of
impairment losses ............................................................................................... 15 206 80– income taxes ....................................................................................................... (597) 610 450
Cash flow hedges ........................................................................................................ (17) (198) 70 – fair value gains/(losses) ...................................................................................... (44) 35 741– fair value (gains)/losses transferred to income statement .................................. 50 (258) (636)– income taxes ....................................................................................................... (23) 25 (35)
Share of other comprehensive income/(expense) of associates and joint ventures ... (16) 1 (72)– share for the period .............................................................................................. (18) 37 (72)– reclassified to income statement on disposal ...................................................... 2 (36) –
Exchange differences .................................................................................................. 670 (4,525) 3,081 – foreign exchange gains reclassified to income statement on disposal of a
foreign operation ................................................................................................ (21) (290) –– other exchange difference .................................................................................. 691 (4,235) 3,081– income tax attributable to exchange differences ............................................... – – 72
Items that will not be reclassified subsequently to profit or loss: Remeasurement of defined benefit asset/liability ...................................................... 316 (959) 501
– before income taxes ............................................................................................ 421 (1,223) 622– income taxes ....................................................................................................... (105) 264 (121)
Other comprehensive income/(expense) for the period, net of tax ............................ 1,911 (7,499) 3,752
Total comprehensive income for the period ............................................................... 12,229 3,847 10,206
Total comprehensive income for the period attributable to: – shareholders of the parent company .................................................................. 11,706 3,072 9,572 – non-controlling interests .................................................................................... 523 775 634
12,229 3,847 10,206
The accompanying notes on pages 214 to 268 form an integral part of these financial statements1.
For footnote, see page 213.
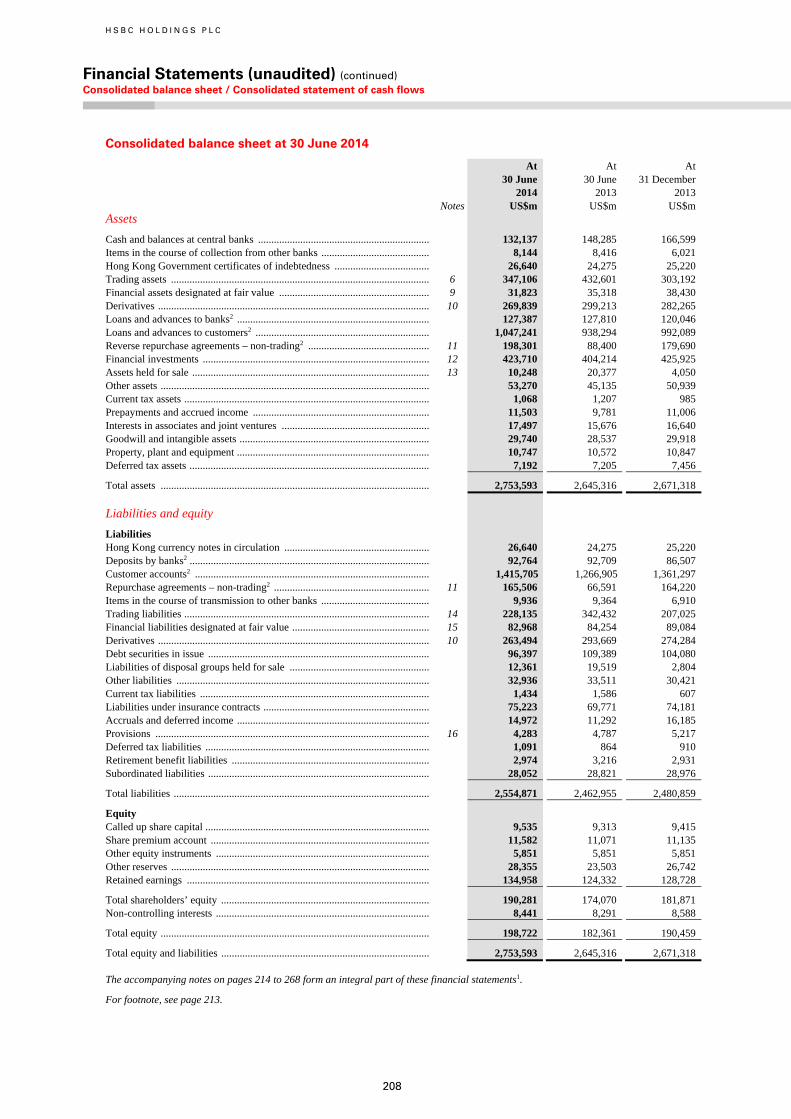
H S B C H O L D I N G S P L C
Financial Statements (unaudited) (continued) Consolidated balance sheet / Consolidated statement of cash flows
208
Consolidated balance sheet at 30 June 2014
At 30 June
At 30 June
At 31 December
2014 2013 2013 Notes US$m US$m US$m Assets
Cash and balances at central banks ................................................................. 132,137 148,285 166,599 Items in the course of collection from other banks ......................................... 8,144 8,416 6,021 Hong Kong Government certificates of indebtedness .................................... 26,640 24,275 25,220 Trading assets .................................................................................................. 6 347,106 432,601 303,192 Financial assets designated at fair value ......................................................... 9 31,823 35,318 38,430 Derivatives ....................................................................................................... 10 269,839 299,213 282,265 Loans and advances to banks2 ......................................................................... 127,387 127,810 120,046 Loans and advances to customers2 .................................................................. 1,047,241 938,294 992,089 Reverse repurchase agreements – non-trading2 .............................................. 11 198,301 88,400 179,690 Financial investments ...................................................................................... 12 423,710 404,214 425,925 Assets held for sale .......................................................................................... 13 10,248 20,377 4,050 Other assets ...................................................................................................... 53,270 45,135 50,939 Current tax assets ............................................................................................. 1,068 1,207 985 Prepayments and accrued income ................................................................... 11,503 9,781 11,006 Interests in associates and joint ventures ........................................................ 17,497 15,676 16,640 Goodwill and intangible assets ........................................................................ 29,740 28,537 29,918 Property, plant and equipment ......................................................................... 10,747 10,572 10,847 Deferred tax assets ........................................................................................... 7,192 7,205 7,456
Total assets ...................................................................................................... 2,753,593 2,645,316 2,671,318
Liabilities and equity
Liabilities Hong Kong currency notes in circulation ....................................................... 26,640 24,275 25,220 Deposits by banks2 ........................................................................................... 92,764 92,709 86,507 Customer accounts2 ......................................................................................... 1,415,705 1,266,905 1,361,297 Repurchase agreements – non-trading2 ........................................................... 11 165,506 66,591 164,220 Items in the course of transmission to other banks ......................................... 9,936 9,364 6,910 Trading liabilities ............................................................................................. 14 228,135 342,432 207,025 Financial liabilities designated at fair value .................................................... 15 82,968 84,254 89,084 Derivatives ....................................................................................................... 10 263,494 293,669 274,284 Debt securities in issue .................................................................................... 96,397 109,389 104,080 Liabilities of disposal groups held for sale ..................................................... 12,361 19,519 2,804 Other liabilities ................................................................................................ 32,936 33,511 30,421 Current tax liabilities ....................................................................................... 1,434 1,586 607 Liabilities under insurance contracts ............................................................... 75,223 69,771 74,181 Accruals and deferred income ......................................................................... 14,972 11,292 16,185 Provisions ........................................................................................................ 16 4,283 4,787 5,217 Deferred tax liabilities ..................................................................................... 1,091 864 910 Retirement benefit liabilities ........................................................................... 2,974 3,216 2,931 Subordinated liabilities .................................................................................... 28,052 28,821 28,976
Total liabilities ................................................................................................. 2,554,871 2,462,955 2,480,859
Equity Called up share capital ..................................................................................... 9,535 9,313 9,415 Share premium account ................................................................................... 11,582 11,071 11,135 Other equity instruments ................................................................................. 5,851 5,851 5,851 Other reserves .................................................................................................. 28,355 23,503 26,742 Retained earnings ............................................................................................ 134,958 124,332 128,728
Total shareholders’ equity ............................................................................... 190,281 174,070 181,871 Non-controlling interests ................................................................................. 8,441 8,291 8,588
Total equity ...................................................................................................... 198,722 182,361 190,459
Total equity and liabilities ............................................................................... 2,753,593 2,645,316 2,671,318
The accompanying notes on pages 214 to 268 form an integral part of these financial statements1.
For footnote, see page 213.
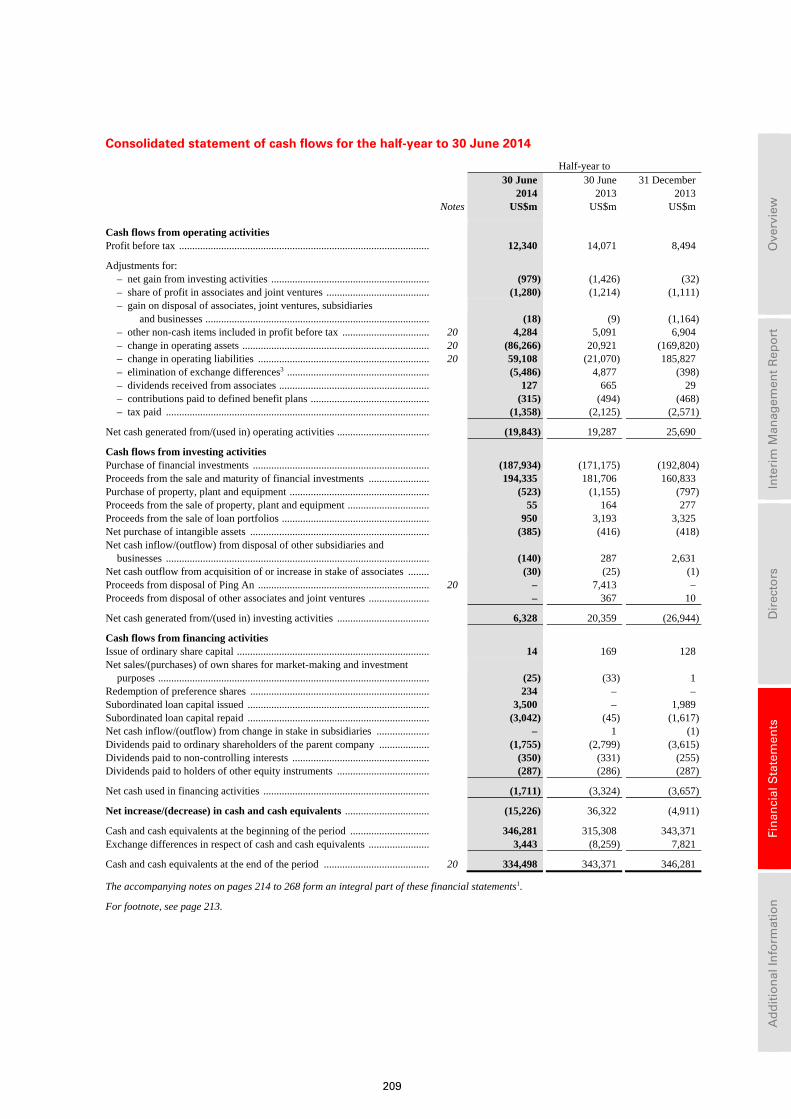
209
Ove
rvie
w
In
teri
m M
anag
emen
t R
epo
rt
D
irec
tors
Fin
anci
al S
tate
men
ts
A
dd
itio
nal
Info
rmat
ion
Consolidated statement of cash flows for the half-year to 30 June 2014
Half-year to
30 June 2014
30 June 2013
31 December 2013
Notes US$m US$m US$m
Cash flows from operating activities Profit before tax ............................................................................................... 12,340 14,071 8,494
Adjustments for: – net gain from investing activities ............................................................ (979) (1,426) (32)– share of profit in associates and joint ventures ....................................... (1,280) (1,214) (1,111)– gain on disposal of associates, joint ventures, subsidiaries
and businesses ..................................................................................... (18) (9) (1,164)– other non-cash items included in profit before tax ................................. 20 4,284 5,091 6,904 – change in operating assets ....................................................................... 20 (86,266) 20,921 (169,820)– change in operating liabilities ................................................................. 20 59,108 (21,070) 185,827 – elimination of exchange differences3 ...................................................... (5,486) 4,877 (398)– dividends received from associates ......................................................... 127 665 29 – contributions paid to defined benefit plans ............................................. (315) (494) (468)– tax paid .................................................................................................... (1,358) (2,125) (2,571)
Net cash generated from/(used in) operating activities ................................... (19,843) 19,287 25,690
Cash flows from investing activities Purchase of financial investments ................................................................... (187,934) (171,175) (192,804)Proceeds from the sale and maturity of financial investments ....................... 194,335 181,706 160,833 Purchase of property, plant and equipment ..................................................... (523) (1,155) (797)Proceeds from the sale of property, plant and equipment ............................... 55 164 277 Proceeds from the sale of loan portfolios ........................................................ 950 3,193 3,325 Net purchase of intangible assets .................................................................... (385) (416) (418)Net cash inflow/(outflow) from disposal of other subsidiaries and
businesses .................................................................................................... (140) 287 2,631 Net cash outflow from acquisition of or increase in stake of associates ........ (30) (25) (1)Proceeds from disposal of Ping An ................................................................. 20 – 7,413 – Proceeds from disposal of other associates and joint ventures ....................... – 367 10
Net cash generated from/(used in) investing activities ................................... 6,328 20,359 (26,944)
Cash flows from financing activities Issue of ordinary share capital ......................................................................... 14 169 128 Net sales/(purchases) of own shares for market-making and investment
purposes ....................................................................................................... (25) (33) 1 Redemption of preference shares .................................................................... 234 – – Subordinated loan capital issued ..................................................................... 3,500 – 1,989 Subordinated loan capital repaid ..................................................................... (3,042) (45) (1,617)Net cash inflow/(outflow) from change in stake in subsidiaries .................... – 1 (1)Dividends paid to ordinary shareholders of the parent company ................... (1,755) (2,799) (3,615)Dividends paid to non-controlling interests .................................................... (350) (331) (255)Dividends paid to holders of other equity instruments ................................... (287) (286) (287)
Net cash used in financing activities ............................................................... (1,711) (3,324) (3,657)
Net increase/(decrease) in cash and cash equivalents ................................ (15,226) 36,322 (4,911)
Cash and cash equivalents at the beginning of the period .............................. 346,281 315,308 343,371 Exchange differences in respect of cash and cash equivalents ....................... 3,443 (8,259) 7,821
Cash and cash equivalents at the end of the period ........................................ 20 334,498 343,371 346,281
The accompanying notes on pages 214 to 268 form an integral part of these financial statements1.
For footnote, see page 213.
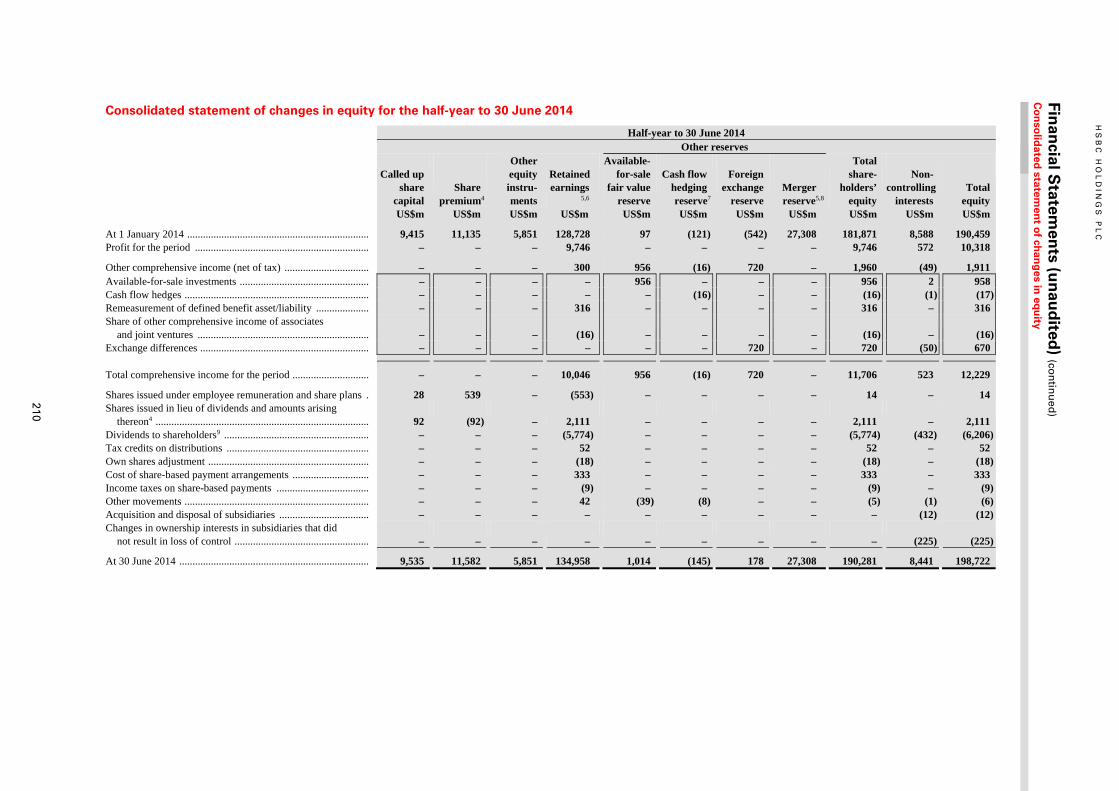
HS
BC
HO
LD
ING
S P
LC
Finan
cial Statem
ents (u
nau
dited
) (con
tinu
ed)
Co
nso
lidated
statemen
t of ch
ang
es in eq
uity
210
Consolidated statement of changes in equity for the half-year to 30 June 2014
Half-year to 30 June 2014 Other reserves
Called up share capital
Share premium4
Other equity instru- ments
Retained earnings 5,6
Available- for-sale fair value reserve
Cash flow hedging reserve7
Foreign exchange reserve
Merger reserve5,8
Total share- holders’ equity
Non-controlling interests
Total equity
US$m US$m US$m US$m US$m US$m US$m US$m US$m US$m US$m
At 1 January 2014 ..................................................................... 9,415 11,135 5,851 128,728 97 (121) (542) 27,308 181,871 8,588 190,459 Profit for the period .................................................................. – – – 9,746 – – – – 9,746 572 10,318
Other comprehensive income (net of tax) ................................ – – – 300 956 (16) 720 – 1,960 (49) 1,911 Available-for-sale investments ................................................. – – – – 956 – – – 956 2 958 Cash flow hedges ...................................................................... – – – – – (16) – – (16) (1) (17) Remeasurement of defined benefit asset/liability .................... – – – 316 – – – – 316 – 316 Share of other comprehensive income of associates
and joint ventures ................................................................. – – – (16) – – – – (16) – (16) Exchange differences ................................................................ – – – – – – 720 – 720 (50) 670
Total comprehensive income for the period ............................. – – – 10,046 956 (16) 720 – 11,706 523 12,229
Shares issued under employee remuneration and share plans . 28 539 – (553) – – – – 14 – 14 Shares issued in lieu of dividends and amounts arising
thereon4 ................................................................................. 92 (92) – 2,111 – – – – 2,111 – 2,111 Dividends to shareholders9 ....................................................... – – – (5,774) – – – – (5,774) (432) (6,206) Tax credits on distributions ...................................................... – – – 52 – – – – 52 – 52 Own shares adjustment ............................................................. – – – (18) – – – – (18) – (18) Cost of share-based payment arrangements ............................. – – – 333 – – – – 333 – 333 Income taxes on share-based payments ................................... – – – (9) – – – – (9) – (9) Other movements ...................................................................... – – – 42 (39) (8) – – (5) (1) (6) Acquisition and disposal of subsidiaries .................................. – – – – – – – – – (12) (12) Changes in ownership interests in subsidiaries that did
not result in loss of control ................................................... – – – – – – – – – (225) (225)
At 30 June 2014 ........................................................................ 9,535 11,582 5,851 134,958 1,014 (145) 178 27,308 190,281 8,441 198,722
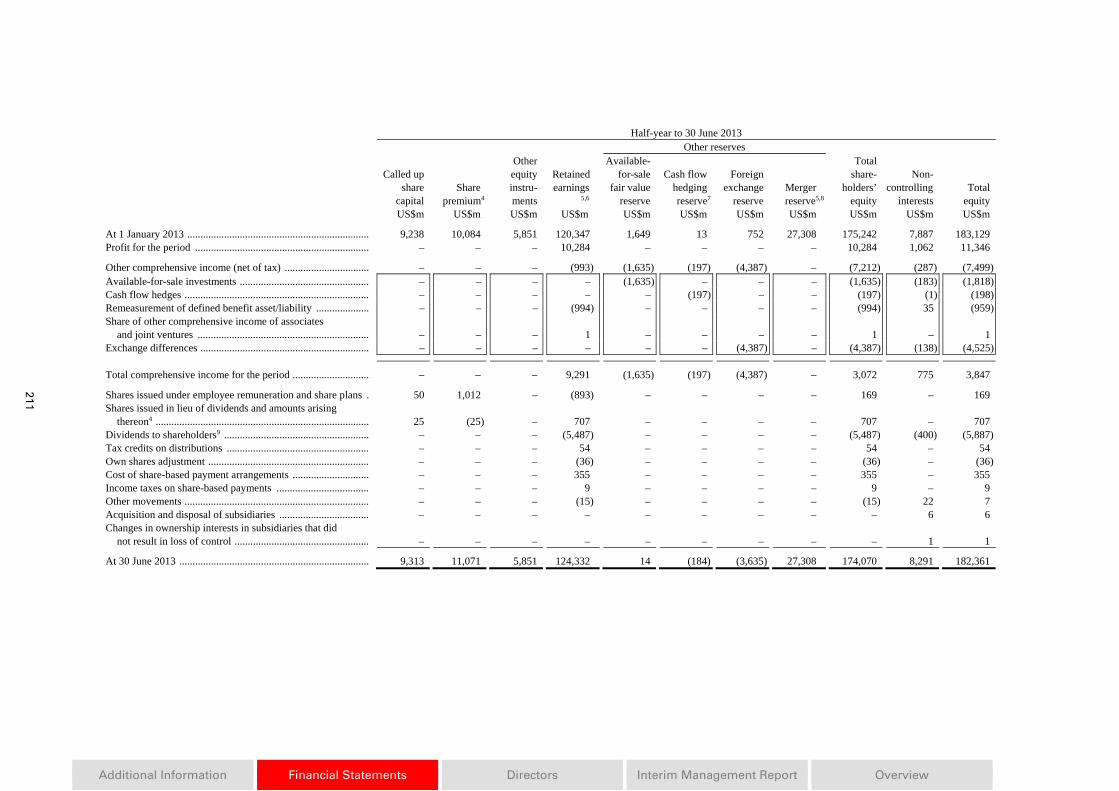
Additional Information
Financial Statements Directors
Interim Management Report Overview
211
Half-year to 30 June 2013 Other reserves
Called up share capital
Share premium4
Other equity instru- ments
Retained earnings 5,6
Available- for-sale fair value reserve
Cash flow hedging reserve7
Foreign exchange reserve
Merger reserve5,8
Total share- holders’ equity
Non- controlling interests
Total equity
US$m US$m US$m US$m US$m US$m US$m US$m US$m US$m US$m
At 1 January 2013 ..................................................................... 9,238 10,084 5,851 120,347 1,649 13 752 27,308 175,242 7,887 183,129 Profit for the period .................................................................. – – – 10,284 – – – – 10,284 1,062 11,346
Other comprehensive income (net of tax) ................................ – – – (993) (1,635) (197) (4,387) – (7,212) (287) (7,499) Available-for-sale investments ................................................. – – – – (1,635) – – – (1,635) (183) (1,818) Cash flow hedges ...................................................................... – – – – – (197) – – (197) (1) (198) Remeasurement of defined benefit asset/liability .................... – – – (994) – – – – (994) 35 (959) Share of other comprehensive income of associates
and joint ventures ................................................................. – – – 1 – – – – 1 – 1 Exchange differences ................................................................ – – – – – – (4,387) – (4,387) (138) (4,525)
Total comprehensive income for the period ............................. – – – 9,291 (1,635) (197) (4,387) – 3,072 775 3,847
Shares issued under employee remuneration and share plans . 50 1,012 – (893) – – – – 169 – 169 Shares issued in lieu of dividends and amounts arising
thereon4 ................................................................................. 25 (25) – 707 – – – – 707 – 707 Dividends to shareholders9 ....................................................... – – – (5,487) – – – – (5,487) (400) (5,887) Tax credits on distributions ...................................................... – – – 54 – – – – 54 – 54 Own shares adjustment ............................................................. – – – (36) – – – – (36) – (36) Cost of share-based payment arrangements ............................. – – – 355 – – – – 355 – 355 Income taxes on share-based payments ................................... – – – 9 – – – – 9 – 9 Other movements ...................................................................... – – – (15) – – – – (15) 22 7 Acquisition and disposal of subsidiaries .................................. – – – – – – – – – 6 6 Changes in ownership interests in subsidiaries that did
not result in loss of control ................................................... – – – – – – – – – 1 1
At 30 June 2013 ........................................................................ 9,313 11,071 5,851 124,332 14 (184) (3,635) 27,308 174,070 8,291 182,361
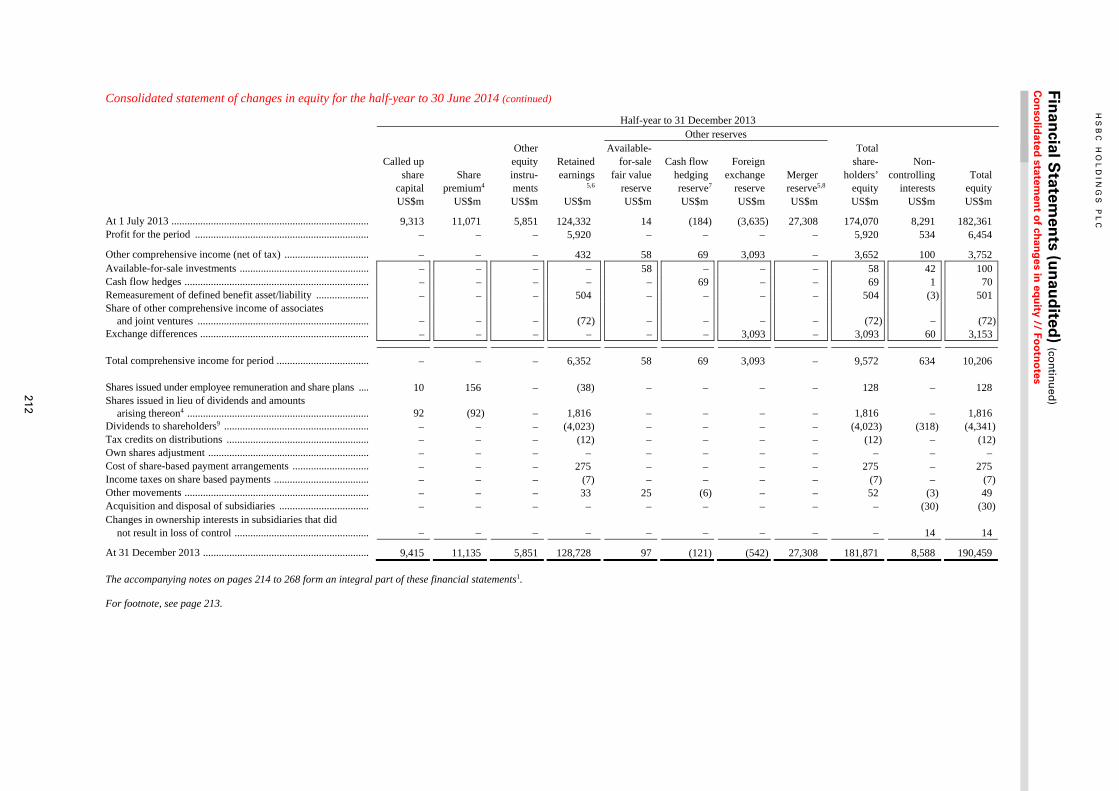
HS
BC
HO
LD
ING
S P
LC
Finan
cial Statem
ents (u
nau
dited
) (con
tinu
ed)
Co
nso
lidated
statemen
t of ch
ang
es in eq
uity // Fo
otn
otes
212
Consolidated statement of changes in equity for the half-year to 30 June 2014 (continued) Half-year to 31 December 2013
Other reserves
Called up share capital
Share premium4
Other equity instru- ments
Retained earnings 5,6
Available- for-sale fair value reserve
Cash flow hedging reserve7
Foreign exchange reserve
Merger reserve5,8
Total share- holders’ equity
Non- controlling interests
Total equity
US$m US$m US$m US$m US$m US$m US$m US$m US$m US$m US$m
At 1 July 2013 ........................................................................... 9,313 11,071 5,851 124,332 14 (184) (3,635) 27,308 174,070 8,291 182,361 Profit for the period .................................................................. – – – 5,920 – – – – 5,920 534 6,454
Other comprehensive income (net of tax) ................................ – – – 432 58 69 3,093 – 3,652 100 3,752 Available-for-sale investments ................................................. – – – – 58 – – – 58 42 100 Cash flow hedges ...................................................................... – – – – – 69 – – 69 1 70 Remeasurement of defined benefit asset/liability .................... – – – 504 – – – – 504 (3) 501 Share of other comprehensive income of associates
and joint ventures ................................................................. – – – (72) – – – – (72) – (72) Exchange differences ................................................................ – – – – – – 3,093 – 3,093 60 3,153
Total comprehensive income for period ................................... – – – 6,352 58 69 3,093 – 9,572 634 10,206 Shares issued under employee remuneration and share plans .... 10 156 – (38) – – – – 128 – 128 Shares issued in lieu of dividends and amounts
arising thereon4 ..................................................................... 92 (92) – 1,816 – – – – 1,816 – 1,816 Dividends to shareholders9 ....................................................... – – – (4,023) – – – – (4,023) (318) (4,341) Tax credits on distributions ...................................................... – – – (12) – – – – (12) – (12) Own shares adjustment ............................................................. – – – – – – – – – – – Cost of share-based payment arrangements ............................. – – – 275 – – – – 275 – 275 Income taxes on share based payments .................................... – – – (7) – – – – (7) – (7) Other movements ...................................................................... – – – 33 25 (6) – – 52 (3) 49 Acquisition and disposal of subsidiaries .................................. – – – – – – – – – (30) (30) Changes in ownership interests in subsidiaries that did
not result in loss of control ................................................... – – – – – – – – – 14 14
At 31 December 2013 ............................................................... 9,415 11,135 5,851 128,728 97 (121) (542) 27,308 181,871 8,588 190,459
The accompanying notes on pages 214 to 268 form an integral part of these financial statements1.
For footnote, see page 213.
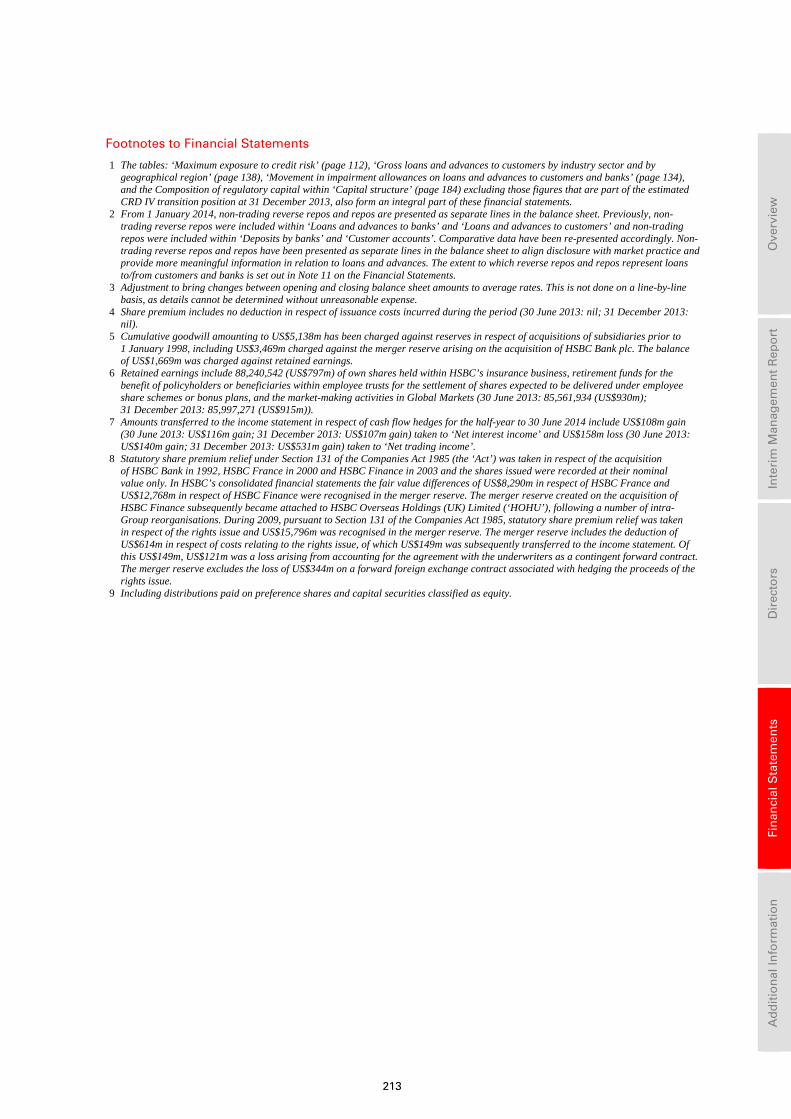
213
Ove
rvie
w
In
teri
m M
anag
emen
t R
epo
rt
D
irec
tors
Fin
anci
al S
tate
men
ts
A
dd
itio
nal
Info
rmat
ion
Footnotes to Financial Statements
1 The tables: ‘Maximum exposure to credit risk’ (page 112), ‘Gross loans and advances to customers by industry sector and by geographical region’ (page 138), ‘Movement in impairment allowances on loans and advances to customers and banks’ (page 134), and the Composition of regulatory capital within ‘Capital structure’ (page 184) excluding those figures that are part of the estimated CRD IV transition position at 31 December 2013, also form an integral part of these financial statements.
2 From 1 January 2014, non-trading reverse repos and repos are presented as separate lines in the balance sheet. Previously, non-trading reverse repos were included within ‘Loans and advances to banks’ and ‘Loans and advances to customers’ and non-trading repos were included within ‘Deposits by banks’ and ‘Customer accounts’. Comparative data have been re-presented accordingly. Non-trading reverse repos and repos have been presented as separate lines in the balance sheet to align disclosure with market practice and provide more meaningful information in relation to loans and advances. The extent to which reverse repos and repos represent loans to/from customers and banks is set out in Note 11 on the Financial Statements.
3 Adjustment to bring changes between opening and closing balance sheet amounts to average rates. This is not done on a line-by-line basis, as details cannot be determined without unreasonable expense.
4 Share premium includes no deduction in respect of issuance costs incurred during the period (30 June 2013: nil; 31 December 2013: nil).
5 Cumulative goodwill amounting to US$5,138m has been charged against reserves in respect of acquisitions of subsidiaries prior to 1 January 1998, including US$3,469m charged against the merger reserve arising on the acquisition of HSBC Bank plc. The balance of US$1,669m was charged against retained earnings.
6 Retained earnings include 88,240,542 (US$797m) of own shares held within HSBC’s insurance business, retirement funds for the benefit of policyholders or beneficiaries within employee trusts for the settlement of shares expected to be delivered under employee share schemes or bonus plans, and the market-making activities in Global Markets (30 June 2013: 85,561,934 (US$930m); 31 December 2013: 85,997,271 (US$915m)).
7 Amounts transferred to the income statement in respect of cash flow hedges for the half-year to 30 June 2014 include US$108m gain (30 June 2013: US$116m gain; 31 December 2013: US$107m gain) taken to ‘Net interest income’ and US$158m loss (30 June 2013: US$140m gain; 31 December 2013: US$531m gain) taken to ‘Net trading income’.
8 Statutory share premium relief under Section 131 of the Companies Act 1985 (the ‘Act’) was taken in respect of the acquisition of HSBC Bank in 1992, HSBC France in 2000 and HSBC Finance in 2003 and the shares issued were recorded at their nominal value only. In HSBC’s consolidated financial statements the fair value differences of US$8,290m in respect of HSBC France and US$12,768m in respect of HSBC Finance were recognised in the merger reserve. The merger reserve created on the acquisition of HSBC Finance subsequently became attached to HSBC Overseas Holdings (UK) Limited (‘HOHU’), following a number of intra-Group reorganisations. During 2009, pursuant to Section 131 of the Companies Act 1985, statutory share premium relief was taken in respect of the rights issue and US$15,796m was recognised in the merger reserve. The merger reserve includes the deduction of US$614m in respect of costs relating to the rights issue, of which US$149m was subsequently transferred to the income statement. Of this US$149m, US$121m was a loss arising from accounting for the agreement with the underwriters as a contingent forward contract. The merger reserve excludes the loss of US$344m on a forward foreign exchange contract associated with hedging the proceeds of the rights issue.
9 Including distributions paid on preference shares and capital securities classified as equity.
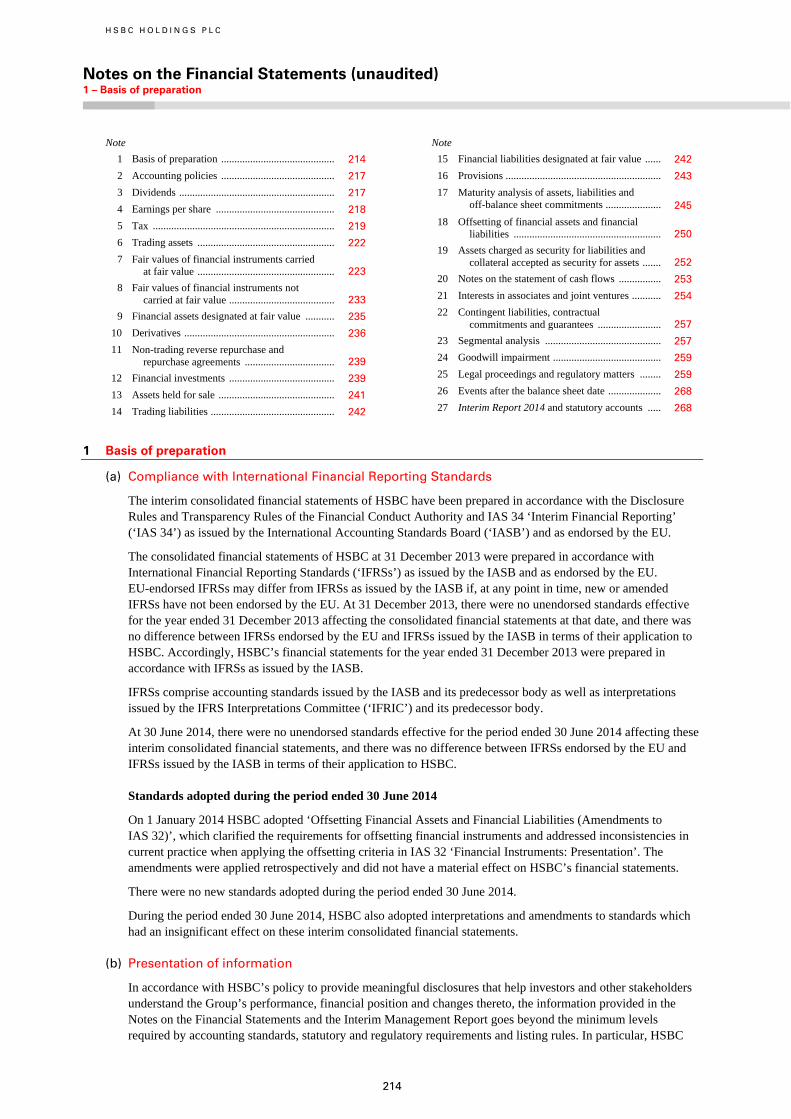
H S B C H O L D I N G S P L C
Notes on the Financial Statements (unaudited) 1 – Basis of preparation
214
Note
1 Basis of preparation ........................................... 214
2 Accounting policies ........................................... 217
3 Dividends ........................................................... 217
4 Earnings per share ............................................. 218
5 Tax ..................................................................... 219
6 Trading assets .................................................... 222
7 Fair values of financial instruments carried at fair value .................................................... 223
8 Fair values of financial instruments not carried at fair value ........................................ 233
9 Financial assets designated at fair value ........... 235
10 Derivatives ......................................................... 236
11 Non-trading reverse repurchase and repurchase agreements .................................. 239
12 Financial investments ........................................ 239
13 Assets held for sale ............................................ 241
14 Trading liabilities ............................................... 242
Note
15 Financial liabilities designated at fair value ...... 242
16 Provisions ........................................................... 243
17 Maturity analysis of assets, liabilities and off-balance sheet commitments ..................... 245
18 Offsetting of financial assets and financial liabilities ........................................................ 250
19 Assets charged as security for liabilities and collateral accepted as security for assets ....... 252
20 Notes on the statement of cash flows ................ 253
21 Interests in associates and joint ventures ........... 254
22 Contingent liabilities, contractual commitments and guarantees ........................ 257
23 Segmental analysis ............................................ 257
24 Goodwill impairment ......................................... 259
25 Legal proceedings and regulatory matters ........ 259
26 Events after the balance sheet date .................... 268
27 Interim Report 2014 and statutory accounts ..... 268
1 Basis of preparation
(a) Compliance with International Financial Reporting Standards
The interim consolidated financial statements of HSBC have been prepared in accordance with the Disclosure Rules and Transparency Rules of the Financial Conduct Authority and IAS 34 ‘Interim Financial Reporting’ (‘IAS 34’) as issued by the International Accounting Standards Board (‘IASB’) and as endorsed by the EU.
The consolidated financial statements of HSBC at 31 December 2013 were prepared in accordance with International Financial Reporting Standards (‘IFRSs’) as issued by the IASB and as endorsed by the EU. EU-endorsed IFRSs may differ from IFRSs as issued by the IASB if, at any point in time, new or amended IFRSs have not been endorsed by the EU. At 31 December 2013, there were no unendorsed standards effective for the year ended 31 December 2013 affecting the consolidated financial statements at that date, and there was no difference between IFRSs endorsed by the EU and IFRSs issued by the IASB in terms of their application to HSBC. Accordingly, HSBC’s financial statements for the year ended 31 December 2013 were prepared in accordance with IFRSs as issued by the IASB.
IFRSs comprise accounting standards issued by the IASB and its predecessor body as well as interpretations issued by the IFRS Interpretations Committee (‘IFRIC’) and its predecessor body.
At 30 June 2014, there were no unendorsed standards effective for the period ended 30 June 2014 affecting these interim consolidated financial statements, and there was no difference between IFRSs endorsed by the EU and IFRSs issued by the IASB in terms of their application to HSBC.
Standards adopted during the period ended 30 June 2014
On 1 January 2014 HSBC adopted ‘Offsetting Financial Assets and Financial Liabilities (Amendments to IAS 32)’, which clarified the requirements for offsetting financial instruments and addressed inconsistencies in current practice when applying the offsetting criteria in IAS 32 ‘Financial Instruments: Presentation’. The amendments were applied retrospectively and did not have a material effect on HSBC’s financial statements.
There were no new standards adopted during the period ended 30 June 2014.
During the period ended 30 June 2014, HSBC also adopted interpretations and amendments to standards which had an insignificant effect on these interim consolidated financial statements.
(b) Presentation of information
In accordance with HSBC’s policy to provide meaningful disclosures that help investors and other stakeholders understand the Group’s performance, financial position and changes thereto, the information provided in the Notes on the Financial Statements and the Interim Management Report goes beyond the minimum levels required by accounting standards, statutory and regulatory requirements and listing rules. In particular, HSBC
215
Ove
rvie
w
In
teri
m M
anag
emen
t R
epo
rt
D
irec
tors
Fin
anci
al S
tate
men
ts
A
dd
itio
nal
Info
rmat
ion
follows the British Bankers’ Association Code for Financial Reporting Disclosure (‘the BBA Code’). The BBA Code aims to increase the quality and comparability of banks’ disclosures and sets out five disclosure principles together with supporting guidance. In line with the principles of the BBA Code, HSBC assesses the applicability and relevance of good practice recommendations issued from time to time by relevant regulators and standard setters, enhancing disclosures where appropriate.
HSBC’s consolidated financial statements are presented in US dollars. HSBC Holdings’ functional currency is also the US dollar because the US dollar and currencies linked to it are the most significant currencies relevant to the underlying transactions, events and conditions of its subsidiaries, as well as representing a significant proportion of its funds generated from financing activities. HSBC uses the US dollar as its presentation currency in its consolidated financial statements because the US dollar and currencies linked to it form the major currency bloc in which HSBC transacts and funds its business.
(c) Use of estimates and assumptions
The preparation of financial information requires the use of estimates and assumptions about future conditions. The use of available information and the application of judgement are inherent in the formation of estimates; actual results in the future may differ from those reported. Management believes that HSBC’s critical accounting policies where judgement is necessarily applied are those which relate to impairment of loans and advances, goodwill impairment, the valuation of financial instruments, deferred tax assets, provisions for liabilities and interests in associates. These critical accounting policies are described on pages 72 to 76 of the Annual Report and Accounts 2013.
(d) Consolidation
The interim consolidated financial statements of HSBC comprise the financial statements of HSBC Holdings and its subsidiaries. The method adopted by HSBC to consolidate its subsidiaries is described on page 430 of the Annual Report and Accounts 2013.
(e) Future accounting developments
In addition to the projects to complete financial instrument accounting, discussed below, the IASB is working on projects on insurance and lease accounting which could represent significant changes to accounting requirements in the future.
Standards and amendments issued by the IASB but not endorsed by the EU
In May 2014, the IASB issued IFRS 15 ‘Revenue from Contracts with Customers’. The standard is effective for annual periods beginning on or after 1 January 2017 with early adoption permitted. IFRS 15 provides a principles-based approach for revenue recognition, and introduces the concept of recognising revenue for obligations as they are satisfied. The standard should be applied retrospectively, with certain practical expedients available. HSBC is currently assessing the impact of this standard but it is not practicable to quantify the effect as at the date of the publication of these interim financial statements.
In July 2014, the IASB issued IFRS 9 ‘Financial Instruments’, which is the comprehensive standard to replace IAS 39 ‘Financial Instruments: Recognition and Measurement’, and includes requirements for classification and measurement of financial assets and liabilities, impairment of financial assets and hedge accounting.
Classification and measurement
The classification and measurement of financial assets will depend on the entity’s business model for their management and their contractual cash flow characteristics and result in financial assets being at amortised cost, fair value through OCI (‘FVOCI’) or fair value through profit or loss. In many instances, the classification and measurement outcomes will be similar to IAS 39, although differences will arise, for example, since IFRS 9 does not apply embedded derivative accounting to financial assets and equity securities will be measured at fair value through profit or loss or, in limited circumstances, at fair value through OCI. The combined effect of the application of the business model and the contractual cash flow characteristics tests may result in some differences in population of financial assets measured at amortised cost or fair value compared with IAS 39. The classification of financial liabilities is essentially unchanged, except that, for certain liabilities measured at fair value, gains or losses relating to changes in the entity’s own credit risk are to be included in OCI.
H S B C H O L D I N G S P L C
Notes on the Financial Statements (unaudited) (continued) 1 – Basis of preparation / 2 – Accounting policies / 3 – Dividends
216
Impairment
The impairment requirements apply to financial assets measured at amortised cost and FVOCI, and lease receivables and certain loan commitments and financial guarantee contracts. At initial recognition, allowance (or provision in the case of commitments and guarantees) is required for expected credit losses (‘ECL’) resulting from default events that are possible within the next 12 months (‘12 month ECL’). In the event of a significant increase in credit risk, allowance (or provision) is required for ECL resulting from all possible default events over the expected life of the financial instrument (‘lifetime ECL’).
The assessment of whether credit risk has increased significantly since initial recognition is performed for each reporting period by considering the probability of default occurring over the remaining life of the financial instrument, rather than by considering an increase in ECL.
The assessment of credit risk, as well as the estimation of ECL, are required to be unbiased, probability-weighted and should incorporate all available information which is relevant to the assessment, including information about past events, current conditions and reasonable and supportable forecasts of future events and economic conditions at the reporting date. In addition, the estimation of ECL should take into account the time value of money. As a result, the recognition and measurement of impairment is intended to be more forward-looking than under IAS 39 and the resulting impairment charge will tend to be more volatile. It will also tend to result in an increase in the total level of impairment allowances, since all financial assets will be assessed for at least 12-month ECL and the population of financial assets to which lifetime ECL applies is likely to be larger than the population for which there is objective evidence of impairment in accordance with IAS 39.
Hedge accounting
The general hedge accounting requirements aim to simplify hedge accounting, creating a stronger link between it and risk management strategy and permitting the former to be applied to a greater variety of hedging instruments and risks. The standard does not explicitly address macro hedge accounting strategies, which are being considered in a separate project. To remove the risk of any conflict between existing macro hedge accounting practice and the new general hedge accounting requirements, IFRS 9 includes an accounting policy choice to remain with IAS 39 hedge accounting.
The classification and measurement and impairment requirements are applied retrospectively by adjusting the opening balance sheet at 1 January 2018, with no requirement to restate comparative periods. Hedge accounting is applied prospectively from that date.
The mandatory application date for the standard as a whole is 1 January 2018, but it is possible to apply the revised presentation for certain liabilities measured at fair value from an earlier date. HSBC intends to revise the presentation of fair value gains and losses relating to the entity’s own credit risk on certain liabilities as soon as permitted by EU law. If this presentation was applied at 30 June 2014, the effect would be to increase profit before tax by US$215m and reduce other comprehensive income by the same amount with no effect on net assets.
HSBC is currently assessing the impact that the rest of IFRS 9 will have on the financial statements through a group-wide project which has been in place since 2012, but due to the complexity of the classification and measurement, impairment, and hedge accounting requirements and their inter-relationships, it is not possible at this stage to quantify the potential effect.
(f) Changes in composition of the Group
There were no material changes in the composition of the Group.
(g) Changes in presentation
The interim consolidated financial statements report operating segment information based on geographical areas. Previously, Hong Kong and Rest of Asia-Pacific were reported separately but, as explained in Note 23, from the first half of 2014 they are presented together as the Asia segment.
From 1 January 2014, HSBC has chosen to present non-trading reverse repos and repos separately on the face of the balance sheet. These items are classified for accounting purposes as loans and receivables or financial liabilities measured at amortised cost. Previously, they were presented on an aggregate basis together with other
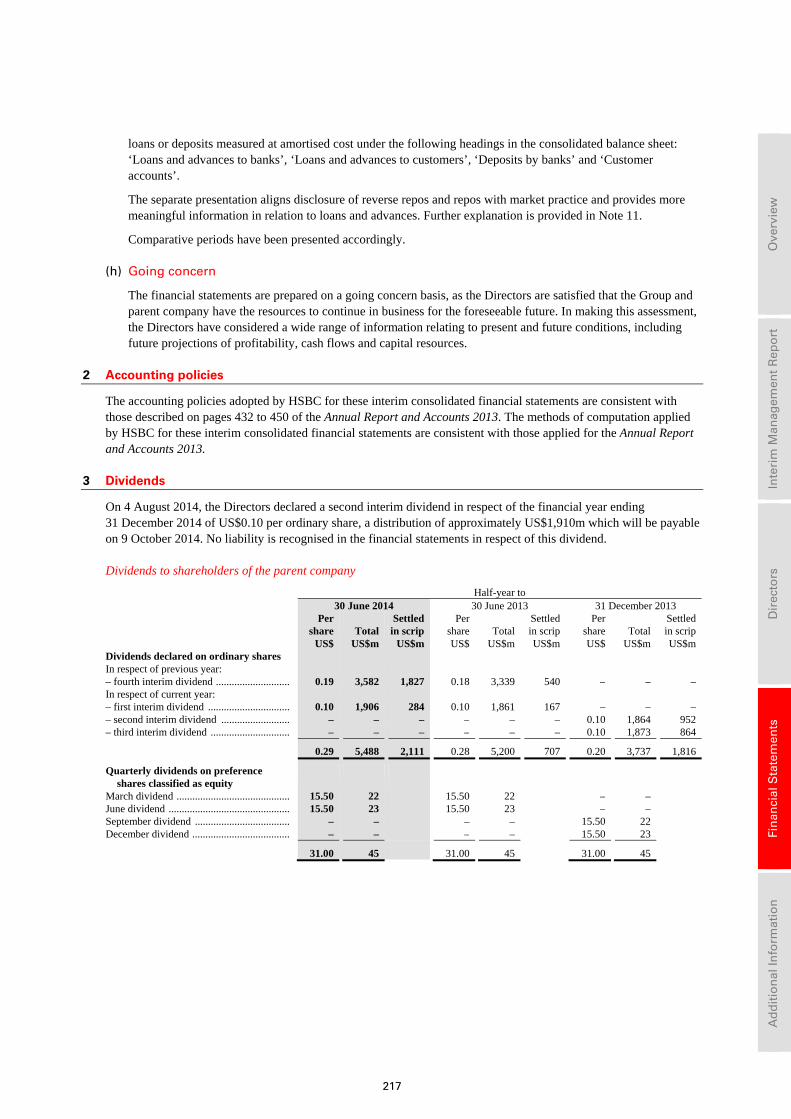
217
Ove
rvie
w
In
teri
m M
anag
emen
t R
epo
rt
D
irec
tors
Fin
anci
al S
tate
men
ts
A
dd
itio
nal
Info
rmat
ion
loans or deposits measured at amortised cost under the following headings in the consolidated balance sheet: ‘Loans and advances to banks’, ‘Loans and advances to customers’, ‘Deposits by banks’ and ‘Customer accounts’.
The separate presentation aligns disclosure of reverse repos and repos with market practice and provides more meaningful information in relation to loans and advances. Further explanation is provided in Note 11.
Comparative periods have been presented accordingly.
(h) Going concern
The financial statements are prepared on a going concern basis, as the Directors are satisfied that the Group and parent company have the resources to continue in business for the foreseeable future. In making this assessment, the Directors have considered a wide range of information relating to present and future conditions, including future projections of profitability, cash flows and capital resources.
2 Accounting policies
The accounting policies adopted by HSBC for these interim consolidated financial statements are consistent with those described on pages 432 to 450 of the Annual Report and Accounts 2013. The methods of computation applied by HSBC for these interim consolidated financial statements are consistent with those applied for the Annual Report and Accounts 2013.
3 Dividends
On 4 August 2014, the Directors declared a second interim dividend in respect of the financial year ending 31 December 2014 of US$0.10 per ordinary share, a distribution of approximately US$1,910m which will be payable on 9 October 2014. No liability is recognised in the financial statements in respect of this dividend. Dividends to shareholders of the parent company
Half-year to30 June 2014 30 June 2013 31 December 2013
Per share US$
Total US$m
Settled in scrip US$m
Per share
US$ Total
US$m
Settled in scrip
US$m
Per share US$
Total US$m
Settled in scrip
US$mDividends declared on ordinary shares In respect of previous year: – fourth interim dividend ............................ 0.19 3,582 1,827 0.18 3,339 540 – – –In respect of current year: – first interim dividend ............................... 0.10 1,906 284 0.10 1,861 167 – – – – second interim dividend .......................... – – – – – – 0.10 1,864 952– third interim dividend .............................. – – – – – – 0.10 1,873 864
0.29 5,488 2,111 0.28 5,200 707 0.20 3,737 1,816
Quarterly dividends on preference shares classified as equity
March dividend ........................................... 15.50 22 15.50 22 – – June dividend .............................................. 15.50 23 15.50 23 – – September dividend .................................... – – – – 15.50 22 December dividend ..................................... – – – – 15.50 23
31.00 45 31.00 45 31.00 45
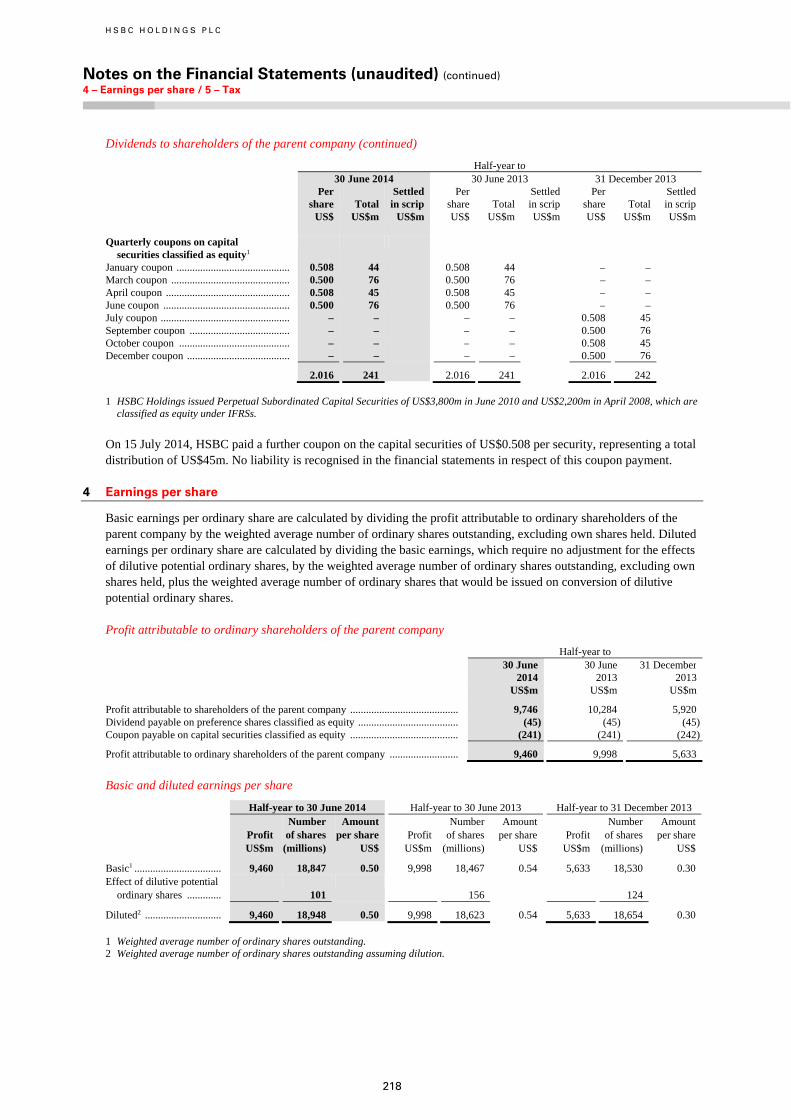
H S B C H O L D I N G S P L C
Notes on the Financial Statements (unaudited) (continued) 4 – Earnings per share / 5 – Tax
218
Dividends to shareholders of the parent company (continued)
Half-year to30 June 2014 30 June 2013 31 December 2013
Per share US$
Total US$m
Settled in scrip US$m
Per share
US$ Total
US$m
Settled in scrip
US$m
Per share US$
Total US$m
Settled in scrip
US$m
Quarterly coupons on capital securities classified as equity1
January coupon ........................................... 0.508 44 0.508 44 – – March coupon ............................................. 0.500 76 0.500 76 – – April coupon ............................................... 0.508 45 0.508 45 – – June coupon ................................................ 0.500 76 0.500 76 – – July coupon ................................................. – – – – 0.508 45 September coupon ...................................... – – – – 0.500 76 October coupon .......................................... – – – – 0.508 45 December coupon ....................................... – – – – 0.500 76
2.016 241 2.016 241 2.016 242
1 HSBC Holdings issued Perpetual Subordinated Capital Securities of US$3,800m in June 2010 and US$2,200m in April 2008, which are classified as equity under IFRSs.
On 15 July 2014, HSBC paid a further coupon on the capital securities of US$0.508 per security, representing a total distribution of US$45m. No liability is recognised in the financial statements in respect of this coupon payment.
4 Earnings per share
Basic earnings per ordinary share are calculated by dividing the profit attributable to ordinary shareholders of the parent company by the weighted average number of ordinary shares outstanding, excluding own shares held. Diluted earnings per ordinary share are calculated by dividing the basic earnings, which require no adjustment for the effects of dilutive potential ordinary shares, by the weighted average number of ordinary shares outstanding, excluding own shares held, plus the weighted average number of ordinary shares that would be issued on conversion of dilutive potential ordinary shares.
Profit attributable to ordinary shareholders of the parent company
Half-year to 30 June 30 June 31 December 2014 2013 2013 US$m US$m US$m
Profit attributable to shareholders of the parent company ......................................... 9,746 10,284 5,920 Dividend payable on preference shares classified as equity ...................................... (45) (45) (45)Coupon payable on capital securities classified as equity ......................................... (241) (241) (242)
Profit attributable to ordinary shareholders of the parent company .......................... 9,460 9,998 5,633
Basic and diluted earnings per share
Half-year to 30 June 2014 Half-year to 30 June 2013 Half-year to 31 December 2013
Profit US$m
Number of shares (millions)
Amount per share US$
Profit US$m
Number of shares (millions)
Amount per share US$
Profit US$m
Number of shares (millions)
Amount per share US$
Basic1 ................................. 9,460 18,847 0.50 9,998 18,467 0.54 5,633 18,530 0.30 Effect of dilutive potential
ordinary shares ............. 101 156 124
Diluted2 ............................. 9,460 18,948 0.50 9,998 18,623 0.54 5,633 18,654 0.30
1 Weighted average number of ordinary shares outstanding. 2 Weighted average number of ordinary shares outstanding assuming dilution.
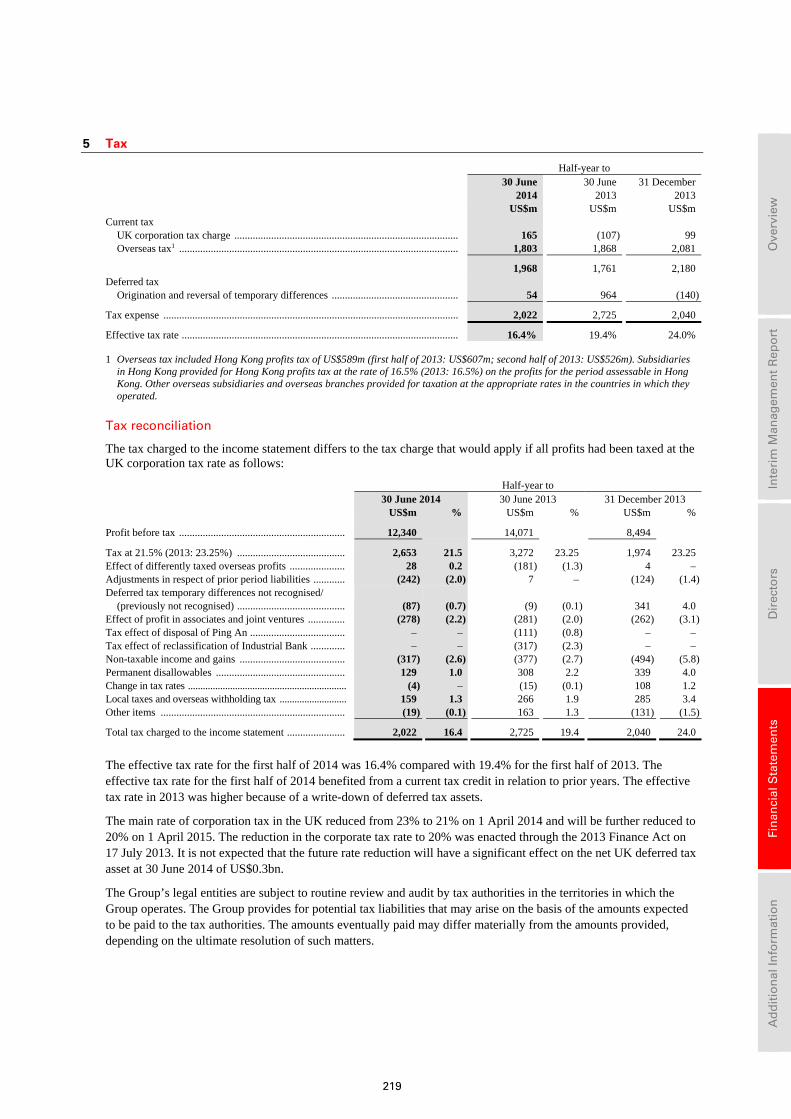
219
Ove
rvie
w
In
teri
m M
anag
emen
t R
epo
rt
D
irec
tors
Fin
anci
al S
tate
men
ts
A
dd
itio
nal
Info
rmat
ion
5 Tax
Half-year to 30 June 30 June 31 December 2014 2013 2013 US$m US$m US$m Current tax
UK corporation tax charge ..................................................................................... 165 (107) 99 Overseas tax1 .......................................................................................................... 1,803 1,868 2,081
1,968 1,761 2,180 Deferred tax
Origination and reversal of temporary differences ................................................ 54 964 (140)
Tax expense ................................................................................................................ 2,022 2,725 2,040
Effective tax rate ......................................................................................................... 16.4% 19.4% 24.0%
1 Overseas tax included Hong Kong profits tax of US$589m (first half of 2013: US$607m; second half of 2013: US$526m). Subsidiaries in Hong Kong provided for Hong Kong profits tax at the rate of 16.5% (2013: 16.5%) on the profits for the period assessable in Hong Kong. Other overseas subsidiaries and overseas branches provided for taxation at the appropriate rates in the countries in which they operated.
Tax reconciliation
The tax charged to the income statement differs to the tax charge that would apply if all profits had been taxed at the UK corporation tax rate as follows:
Half-year to 30 June 2014 30 June 2013 31 December 2013 US$m % US$m % US$m %
Profit before tax ............................................................... 12,340 14,071 8,494
Tax at 21.5% (2013: 23.25%) ......................................... 2,653 21.5 3,272 23.25 1,974 23.25 Effect of differently taxed overseas profits ..................... 28 0.2 (181) (1.3) 4 – Adjustments in respect of prior period liabilities ............ (242) (2.0) 7 – (124) (1.4)Deferred tax temporary differences not recognised/
(previously not recognised) ......................................... (87) (0.7) (9) (0.1) 341 4.0 Effect of profit in associates and joint ventures .............. (278) (2.2) (281) (2.0) (262) (3.1)Tax effect of disposal of Ping An .................................... – – (111) (0.8) – – Tax effect of reclassification of Industrial Bank ............. – – (317) (2.3) – – Non-taxable income and gains ........................................ (317) (2.6) (377) (2.7) (494) (5.8)Permanent disallowables ................................................. 129 1.0 308 2.2 339 4.0 Change in tax rates ................................................................ (4) – (15) (0.1) 108 1.2 Local taxes and overseas withholding tax ........................... 159 1.3 266 1.9 285 3.4 Other items ...................................................................... (19) (0.1) 163 1.3 (131) (1.5)
Total tax charged to the income statement ...................... 2,022 16.4 2,725 19.4 2,040 24.0
The effective tax rate for the first half of 2014 was 16.4% compared with 19.4% for the first half of 2013. The effective tax rate for the first half of 2014 benefited from a current tax credit in relation to prior years. The effective tax rate in 2013 was higher because of a write-down of deferred tax assets.
The main rate of corporation tax in the UK reduced from 23% to 21% on 1 April 2014 and will be further reduced to 20% on 1 April 2015. The reduction in the corporate tax rate to 20% was enacted through the 2013 Finance Act on 17 July 2013. It is not expected that the future rate reduction will have a significant effect on the net UK deferred tax asset at 30 June 2014 of US$0.3bn.
The Group’s legal entities are subject to routine review and audit by tax authorities in the territories in which the Group operates. The Group provides for potential tax liabilities that may arise on the basis of the amounts expected to be paid to the tax authorities. The amounts eventually paid may differ materially from the amounts provided, depending on the ultimate resolution of such matters.
H S B C H O L D I N G S P L C
Notes on the Financial Statements (unaudited) (continued) 5 – Tax
220
Deferred taxation
Net deferred tax assets totalled US$6.1bn at 30 June 2014 (30 June 2013: US$6.3bn; 31 December 2013: US$6.5bn). The main items to note were as follows:
US
The net deferred tax asset relating to HSBC’s operations in the US was US$4.1bn (30 June 2013: US$4.3bn; 31 December 2013: US$4.4bn). The deferred tax assets included in this total reflected the carry forward of tax losses and tax credits of US$1.1bn (30 June 2013: US$0.2bn; 31 December 2013: US$0.7bn), deductible temporary differences in respect of loan impairment allowances of US$1.0bn (30 June 2013: US$1.5bn; 31 December 2013: US$1.2bn) and other temporary differences of US$2.0bn (30 June 2013: US$2.6bn; 31 December 2013: US$2.5bn).
Deductions for loan impairments for US tax purposes generally occur when the impaired loan is charged off or, if earlier, when the impaired loan is sold. The tax deduction is often in the period subsequent to that in which the impairment is recognised for accounting purposes. As a result, the amount of the associated deferred tax asset should generally move in line with the impairment allowance balance.
On the evidence available, including historical levels of profitability, management projections of future income and HSBC Holdings’ commitment to continue to retain sufficient capital in North America to recover the deferred tax asset, it is expected there will be sufficient taxable income generated by the business to realise these assets. Management projections of profits from the US operations are prepared for a 10-year period and include assumptions about the future housing market and US economic conditions, including unemployment levels.
Management projections of profits from the US operations currently indicate that tax losses and tax credits will be fully recovered by 2017. The current level of the deferred tax asset in respect of loan impairment allowances and other deductible temporary differences is also projected to reduce over the next four years.
As there has been a recent history of losses in HSBC’s US operations, management’s analysis of the recognition of these deferred tax assets significantly discounts any future expected profits from the US operations and relies on capital support from HSBC Holdings, including tax planning strategies implemented in relation to such support. The principal strategy involves generating future taxable profits through the retention of capital in the US in excess of normal regulatory requirements in order to reduce deductible funding expenses or otherwise deploy such capital to increase levels of taxable income. As financial performance in our US operations improves, it is expected that projected future profits from US operations will be relied on in the evaluation of the recognition of the deferred tax asset in future periods as the sustainability of the improving financial performance is demonstrated.
Brazil
The net deferred tax asset relating to HSBC’s operations in Brazil was US$1.2bn (30 June 2013: US$1.1bn; 31 December 2013: US$1.0bn). The deferred tax assets included in this total reflected the carry forward of tax losses and tax credits of US$0.2bn (30 June 2013: nil; 31 December 2013: US$0.1bn), deductible temporary differences in respect of loan impairment allowances of US$0.8bn (30 June 2013: US$0.9bn; 31 December 2013: US$0.7bn) and other temporary differences of US$0.2bn (30 June 2013: US$0.2bn; 31 December 2013: US$0.2bn).
Deductions for loan impairments for Brazilian tax purposes generally occur when the impaired loan is charged off, often in a period subsequent to that in which the impairment is recognised for accounting purposes. As a result, the amount of the associated deferred tax asset should generally move in line with the impairment allowance balance.
Management projections of profits from the Brazilian operations currently indicate that the tax losses and other temporary differences will be fully recovered within the next 10 years. Loan impairment deductions are recognised for tax purposes typically within 24 months of accounting recognition.
In light of the recent occurrence of tax losses, the recognition of deferred tax assets in Brazil takes into consideration both the reliance placed on management’s projection of income and on the use of general strategies such as corporate reorganisations and other initiatives to improve the profitability of our Brazilian operations from a tax perspective.
Mexico
The net deferred tax asset relating to HSBC’s operations in Mexico was US$0.5bn at 30 June 2014 (30 June 2013: US$0.4bn; 31 December 2013: US$0.5bn).

221
Ove
rvie
w
In
teri
m M
anag
emen
t R
epo
rt
D
irec
tors
Fin
anci
al S
tate
men
ts
A
dd
itio
nal
Info
rmat
ion
The deferred tax assets included in this total related primarily to deductible temporary differences in respect of accounting provisions for impaired loans. The annual deduction for loan impairment charges was historically capped under Mexican legislation at 2.5% of the average qualifying loan portfolio. The balance is carried forward to future years without expiry.
Following the clarification of tax law by the Mexican fiscal authority during 2013, management’s analysis of the recognition of these deferred tax assets relies on the primary strategy of selling certain loan portfolios, the losses on which are deductible for tax in Mexico when sold. Any such deductions for tax would lead to the reversal of the carried forward loan impairment provision recognised for deferred tax purposes.
On the evidence available, including historical and projected levels of loan portfolio sales and profitability, it is expected that the business will realise these assets over the next five years.
In September 2013, the Mexican Government proposed a number of tax reforms that were approved by the Chamber of Senate in October 2013 and published in the Official Gazette in December 2013. The tax reforms include a new basis of tax deduction for loan impairment charges that will allow banks to recognise tax deductions as and when loans are written off the balance sheet. The reforms also brought in transitional rules to allow banks to continue to claim any unclaimed deductions with regard to the 2.5% pool as at 31 December 2013. On 4 July 2014, the Mexican Government issued rule I.3.22.5 of the Miscellaneous Tax Resolution that clarified the treatment of the transitional rules but had no impact on the deferred tax assets held in our operations in Mexico.
There are no material carried forward tax losses or tax credits recognised within the Group’s deferred tax assets in Mexico.
UK
The net deferred tax asset relating to HSBC’s operations in the UK was US$0.3bn (30 June 2013: US$0.5bn; 31 December 2013: US$0.4bn). The deferred tax assets included in this total related primarily to other temporary differences.
On the evidence available, including historical levels of profitability and management projections of future income, it is expected that there will be sufficient taxable income generated by the business to recover the net deferred tax asset within the next 10 years.
There are no material carried forward tax losses or tax credits recognised within the Group’s deferred tax assets in the UK.
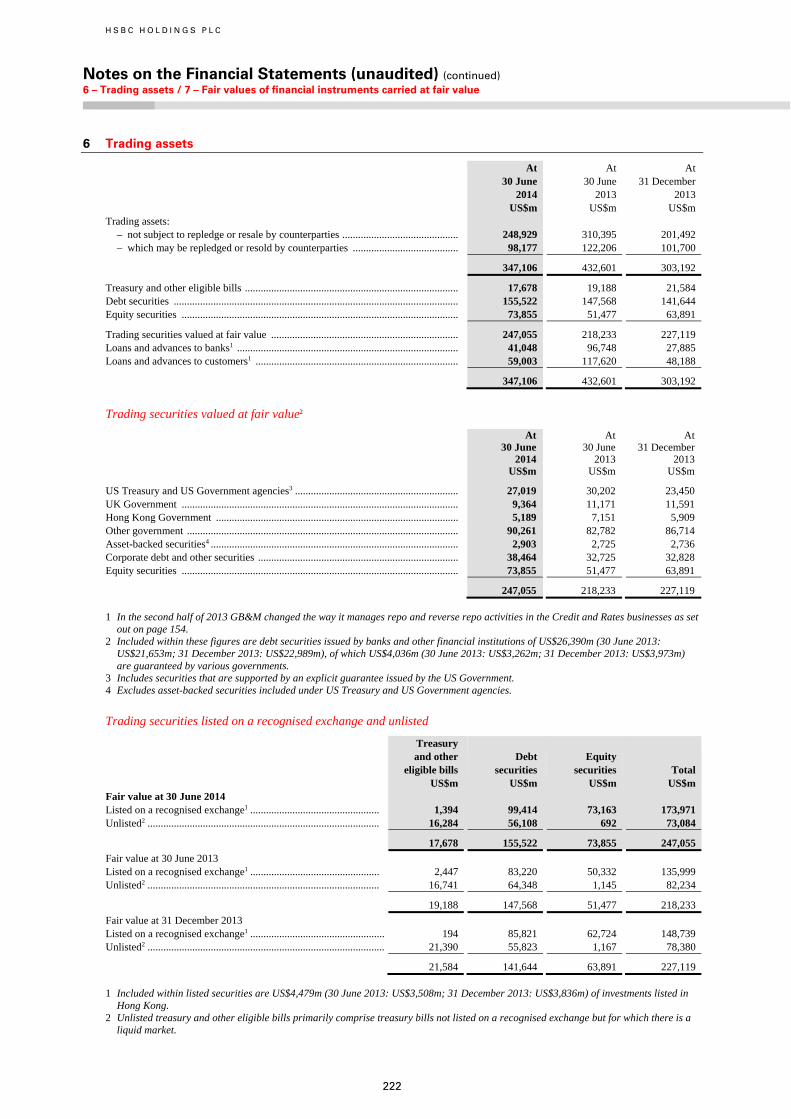
H S B C H O L D I N G S P L C
Notes on the Financial Statements (unaudited) (continued) 6 – Trading assets / 7 – Fair values of financial instruments carried at fair value
222
6 Trading assets
At 30 June 2014
At 30 June 2013
At 31 December 2013
US$m US$m US$m Trading assets:
– not subject to repledge or resale by counterparties ............................................ 248,929 310,395 201,492 – which may be repledged or resold by counterparties ........................................ 98,177 122,206 101,700
347,106 432,601 303,192
Treasury and other eligible bills ................................................................................. 17,678 19,188 21,584 Debt securities ............................................................................................................ 155,522 147,568 141,644 Equity securities ......................................................................................................... 73,855 51,477 63,891
Trading securities valued at fair value ....................................................................... 247,055 218,233 227,119 Loans and advances to banks1 .................................................................................... 41,048 96,748 27,885 Loans and advances to customers1 ............................................................................. 59,003 117,620 48,188
347,106 432,601 303,192
Trading securities valued at fair value2
At 30 June 2014
At 30 June
2013
At 31 December 2013
US$m US$m US$m
US Treasury and US Government agencies3 .............................................................. 27,019 30,202 23,450 UK Government ......................................................................................................... 9,364 11,171 11,591 Hong Kong Government ............................................................................................ 5,189 7,151 5,909 Other government ....................................................................................................... 90,261 82,782 86,714 Asset-backed securities4 .............................................................................................. 2,903 2,725 2,736 Corporate debt and other securities ............................................................................ 38,464 32,725 32,828 Equity securities ......................................................................................................... 73,855 51,477 63,891
247,055 218,233 227,119
1 In the second half of 2013 GB&M changed the way it manages repo and reverse repo activities in the Credit and Rates businesses as set out on page 154.
2 Included within these figures are debt securities issued by banks and other financial institutions of US$26,390m (30 June 2013: US$21,653m; 31 December 2013: US$22,989m), of which US$4,036m (30 June 2013: US$3,262m; 31 December 2013: US$3,973m) are guaranteed by various governments.
3 Includes securities that are supported by an explicit guarantee issued by the US Government. 4 Excludes asset-backed securities included under US Treasury and US Government agencies.
Trading securities listed on a recognised exchange and unlisted
Treasury and other eligible bills
Debt securities
Equity securities
Total
US$m US$m US$m US$m Fair value at 30 June 2014 Listed on a recognised exchange1 ................................................. 1,394 99,414 73,163 173,971 Unlisted2 ........................................................................................ 16,284 56,108 692 73,084
17,678 155,522 73,855 247,055
Fair value at 30 June 2013 Listed on a recognised exchange1 ................................................. 2,447 83,220 50,332 135,999 Unlisted2 ........................................................................................ 16,741 64,348 1,145 82,234
19,188 147,568 51,477 218,233
Fair value at 31 December 2013 Listed on a recognised exchange1 ................................................... 194 85,821 62,724 148,739 Unlisted2 .......................................................................................... 21,390 55,823 1,167 78,380
21,584 141,644 63,891 227,119
1 Included within listed securities are US$4,479m (30 June 2013: US$3,508m; 31 December 2013: US$3,836m) of investments listed in Hong Kong.
2 Unlisted treasury and other eligible bills primarily comprise treasury bills not listed on a recognised exchange but for which there is a liquid market.
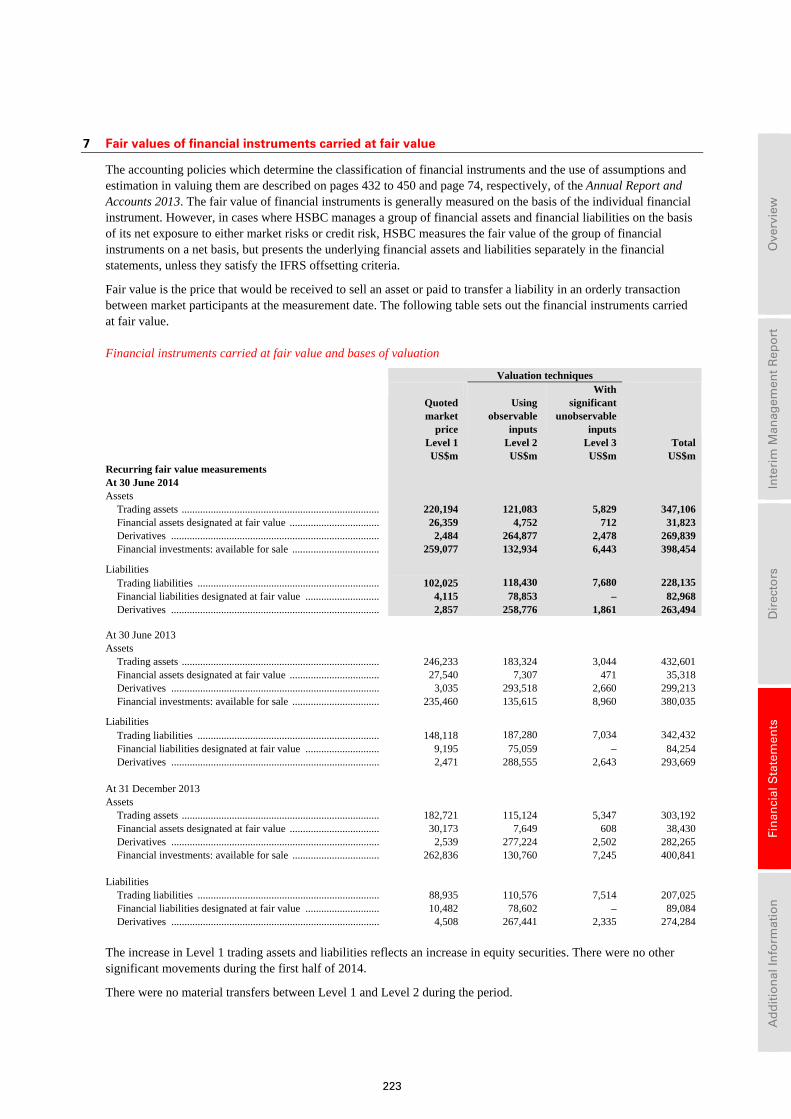
223
Ove
rvie
w
In
teri
m M
anag
emen
t R
epo
rt
D
irec
tors
Fin
anci
al S
tate
men
ts
A
dd
itio
nal
Info
rmat
ion
7 Fair values of financial instruments carried at fair value
The accounting policies which determine the classification of financial instruments and the use of assumptions and estimation in valuing them are described on pages 432 to 450 and page 74, respectively, of the Annual Report and Accounts 2013. The fair value of financial instruments is generally measured on the basis of the individual financial instrument. However, in cases where HSBC manages a group of financial assets and financial liabilities on the basis of its net exposure to either market risks or credit risk, HSBC measures the fair value of the group of financial instruments on a net basis, but presents the underlying financial assets and liabilities separately in the financial statements, unless they satisfy the IFRS offsetting criteria.
Fair value is the price that would be received to sell an asset or paid to transfer a liability in an orderly transaction between market participants at the measurement date. The following table sets out the financial instruments carried at fair value.
Financial instruments carried at fair value and bases of valuation
Valuation techniques
Quotedmarket
priceLevel 1
Usingobservable
inputsLevel 2
With significant
unobservable inputs
Level 3 Total US$m US$m US$m US$m Recurring fair value measurements At 30 June 2014 Assets
Trading assets ........................................................................... 220,194 121,083 5,829 347,106 Financial assets designated at fair value .................................. 26,359 4,752 712 31,823 Derivatives ............................................................................... 2,484 264,877 2,478 269,839 Financial investments: available for sale ................................. 259,077 132,934 6,443 398,454
Liabilities Trading liabilities ..................................................................... 102,025 118,430 7,680 228,135 Financial liabilities designated at fair value ............................ 4,115 78,853 – 82,968 Derivatives ............................................................................... 2,857 258,776 1,861 263,494
At 30 June 2013 Assets
Trading assets ........................................................................... 246,233 183,324 3,044 432,601 Financial assets designated at fair value .................................. 27,540 7,307 471 35,318 Derivatives ............................................................................... 3,035 293,518 2,660 299,213 Financial investments: available for sale ................................. 235,460 135,615 8,960 380,035
Liabilities Trading liabilities ..................................................................... 148,118 187,280 7,034 342,432 Financial liabilities designated at fair value ............................ 9,195 75,059 – 84,254 Derivatives ............................................................................... 2,471 288,555 2,643 293,669
At 31 December 2013 Assets
Trading assets ........................................................................... 182,721 115,124 5,347 303,192 Financial assets designated at fair value .................................. 30,173 7,649 608 38,430 Derivatives ............................................................................... 2,539 277,224 2,502 282,265 Financial investments: available for sale ................................. 262,836 130,760 7,245 400,841
Liabilities
Trading liabilities ..................................................................... 88,935 110,576 7,514 207,025 Financial liabilities designated at fair value ............................ 10,482 78,602 – 89,084 Derivatives ............................................................................... 4,508 267,441 2,335 274,284
The increase in Level 1 trading assets and liabilities reflects an increase in equity securities. There were no other significant movements during the first half of 2014.
There were no material transfers between Level 1 and Level 2 during the period.
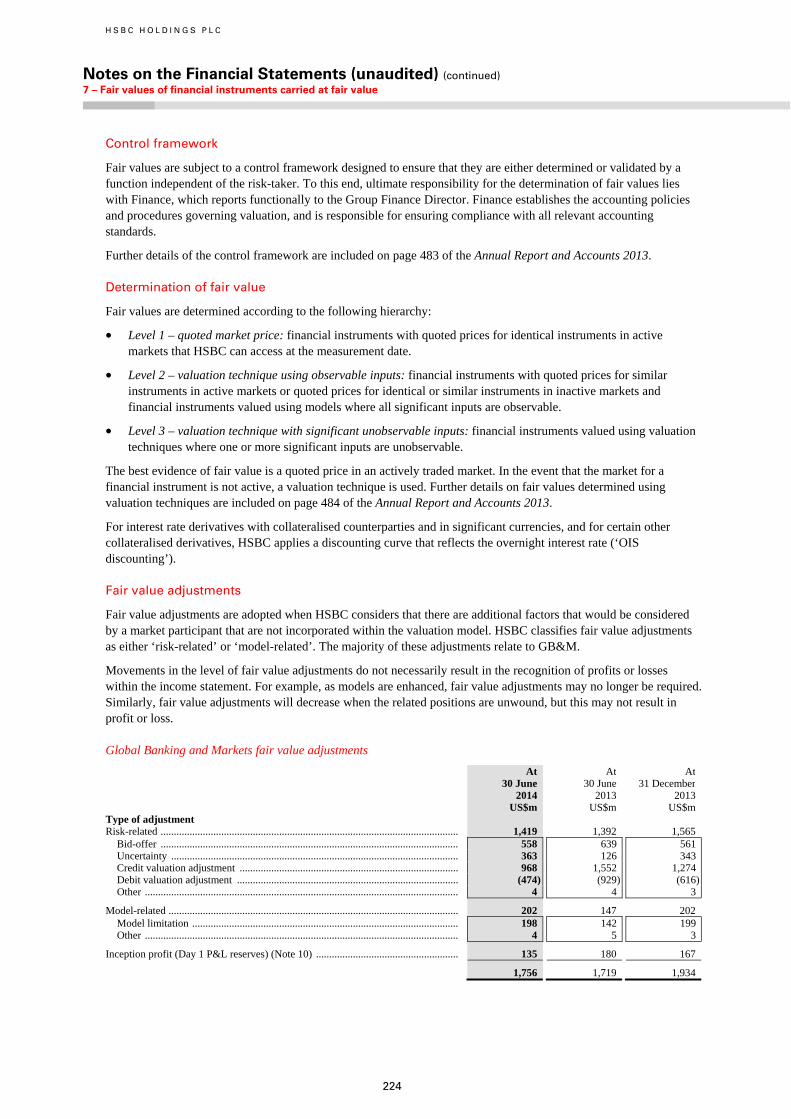
H S B C H O L D I N G S P L C
Notes on the Financial Statements (unaudited) (continued) 7 – Fair values of financial instruments carried at fair value
224
Control framework
Fair values are subject to a control framework designed to ensure that they are either determined or validated by a function independent of the risk-taker. To this end, ultimate responsibility for the determination of fair values lies with Finance, which reports functionally to the Group Finance Director. Finance establishes the accounting policies and procedures governing valuation, and is responsible for ensuring compliance with all relevant accounting standards.
Further details of the control framework are included on page 483 of the Annual Report and Accounts 2013.
Determination of fair value
Fair values are determined according to the following hierarchy:
• Level 1 – quoted market price: financial instruments with quoted prices for identical instruments in active markets that HSBC can access at the measurement date.
• Level 2 – valuation technique using observable inputs: financial instruments with quoted prices for similar instruments in active markets or quoted prices for identical or similar instruments in inactive markets and financial instruments valued using models where all significant inputs are observable.
• Level 3 – valuation technique with significant unobservable inputs: financial instruments valued using valuation techniques where one or more significant inputs are unobservable.
The best evidence of fair value is a quoted price in an actively traded market. In the event that the market for a financial instrument is not active, a valuation technique is used. Further details on fair values determined using valuation techniques are included on page 484 of the Annual Report and Accounts 2013.
For interest rate derivatives with collateralised counterparties and in significant currencies, and for certain other collateralised derivatives, HSBC applies a discounting curve that reflects the overnight interest rate (‘OIS discounting’).
Fair value adjustments
Fair value adjustments are adopted when HSBC considers that there are additional factors that would be considered by a market participant that are not incorporated within the valuation model. HSBC classifies fair value adjustments as either ‘risk-related’ or ‘model-related’. The majority of these adjustments relate to GB&M.
Movements in the level of fair value adjustments do not necessarily result in the recognition of profits or losses within the income statement. For example, as models are enhanced, fair value adjustments may no longer be required. Similarly, fair value adjustments will decrease when the related positions are unwound, but this may not result in profit or loss.
Global Banking and Markets fair value adjustments
At At At 30 June 30 June 31 December 2014 2013 2013 US$m US$m US$m
Type of adjustment Risk-related ................................................................................................................. 1,419 1,392 1,565
Bid-offer ................................................................................................................. 558 639 561Uncertainty ............................................................................................................. 363 126 343Credit valuation adjustment ................................................................................... 968 1,552 1,274Debit valuation adjustment .................................................................................... (474) (929) (616)Other ....................................................................................................................... 4 4 3
Model-related .............................................................................................................. 202 147 202Model limitation ..................................................................................................... 198 142 199Other ....................................................................................................................... 4 5 3
Inception profit (Day 1 P&L reserves) (Note 10) ...................................................... 135 180 167
1,756 1,719 1,934
225
Ove
rvie
w
In
teri
m M
anag
emen
t R
epo
rt
D
irec
tors
Fin
anci
al S
tate
men
ts
A
dd
itio
nal
Info
rmat
ion
Fair value adjustments declined by US$178m during the period. The most significant movement was a decrease of US$306m in respect of the credit valuation adjustment, as a result of the narrowing of counterparty and market credit default swap spreads. This was partially offset by a decrease of US$142m in debit valuation adjustment, as a result of the narrowing of HSBC credit default swap spreads.
Detailed descriptions of risk-related and model-related adjustments are provided on pages 485 and 486 of the Annual Report and Accounts 2013.
Credit valuation adjustment/debit valuation adjustment methodology
HSBC calculates a separate credit valuation adjustment (‘CVA’) and debit valuation adjustment (‘DVA’) for each HSBC legal entity, and within each entity for each counterparty to which the entity has exposure.
HSBC calculates the CVA by applying the probability of default (‘PD’) of the counterparty, conditional on the non-default of HSBC, to HSBC’s expected positive exposure to the counterparty and multiplying the result by the loss expected in the event of default. Conversely, HSBC calculates the DVA by applying the PD of HSBC, conditional on the non-default of the counterparty, to the expected positive exposure of the counterparty to HSBC and multiplying by the loss expected in the event of default. Both calculations are performed over the life of the potential exposure.
For most products HSBC uses a simulation methodology to calculate the expected positive exposure to a counterparty. This incorporates a range of potential exposures across the portfolio of transactions with the counterparty over the life of the portfolio. The simulation methodology includes credit mitigants such as counterparty netting agreements and collateral agreements with the counterparty. A standard loss given default (‘LGD’) assumption of 60% is generally adopted for developed market exposures, and 75% for emerging market exposures. Alternative loss given default assumptions may be adopted where both the nature of the exposure and the available data support this.
For certain types of exotic derivatives where the products are not currently supported by the simulation, or for derivative exposures in smaller trading locations where the simulation tool is not yet available, HSBC adopts alternative methodologies. These may involve mapping to the results for similar products from the simulation tool or, where the mapping approach is not appropriate, using a simplified methodology which generally follows the same principles as the simulation methodology. The calculation is applied at a trade level, with more limited recognition of credit mitigants such as netting or collateral agreements than is used in the simulation methodology.
The methodologies do not, in general, account for ‘wrong-way risk’. Wrong-way risk arises when the underlying value of the derivative prior to any CVA is positively correlated to the probability of default by the counterparty. When there is significant wrong-way risk, a trade-specific approach is applied to reflect the wrong-way risk within the valuation.
With the exception of certain central clearing parties, HSBC includes all third-party counterparties in the CVA and DVA calculations and does not net these adjustments across HSBC Group entities. HSBC reviews and refines the CVA and DVA methodologies on an ongoing basis.
Valuation of uncollateralised derivatives
HSBC values uncollateralised derivatives by discounting expected future cash flows at a benchmark interest rate, typically Libor or its equivalent. This approach has historically been adopted across the industry, and has therefore been an appropriate basis for fair value. HSBC and other industry participants are currently considering whether it appropriately reflects the manner in which the derivatives are funded, which may occur at rates other than interbank offer rates. No consensus has yet emerged on how such funding should be reflected in the fair value measurement for uncollateralised derivatives. In the future, and possibly in the second half of 2014, HSBC may adopt a ‘funding fair value adjustment’ to reflect funding of uncollateralised derivatives at rates other than interbank offer rates.
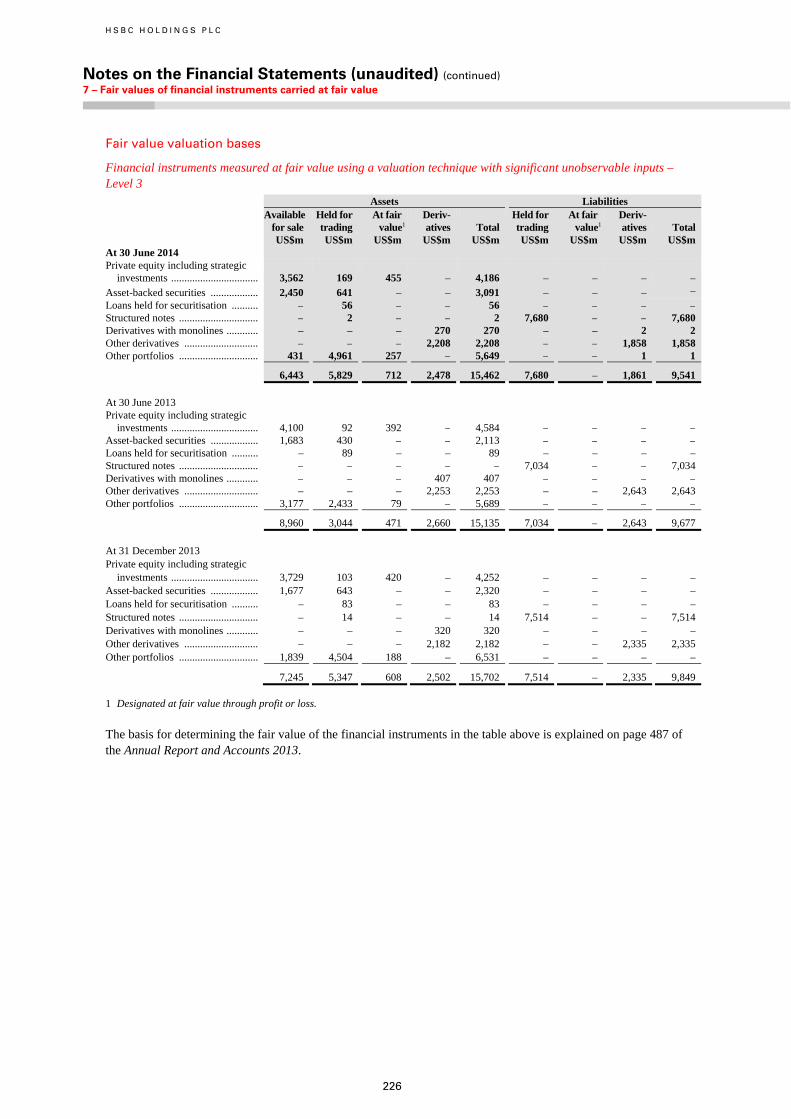
H S B C H O L D I N G S P L C
Notes on the Financial Statements (unaudited) (continued) 7 – Fair values of financial instruments carried at fair value
226
Fair value valuation bases
Financial instruments measured at fair value using a valuation technique with significant unobservable inputs – Level 3 Assets Liabilities
Available for sale
Held for trading
At fair value1
Deriv- atives Total
Held for trading
At fair value1
Deriv- atives
Total
US$m US$m US$m US$m US$m US$m US$m US$m US$m At 30 June 2014 Private equity including strategic
investments ................................. 3,562 169 455 – 4,186 – – – – Asset-backed securities .................. 2,450 641 – – 3,091 – – – – Loans held for securitisation .......... – 56 – – 56 – – – – Structured notes .............................. – 2 – – 2 7,680 – – 7,680 Derivatives with monolines ............ – – – 270 270 – – 2 2 Other derivatives ............................ – – – 2,208 2,208 – – 1,858 1,858 Other portfolios .............................. 431 4,961 257 – 5,649 – – 1 1
6,443 5,829 712 2,478 15,462 7,680 – 1,861 9,541 At 30 June 2013 Private equity including strategic
investments ................................. 4,100 92 392 – 4,584 – – – –Asset-backed securities .................. 1,683 430 – – 2,113 – – – –Loans held for securitisation .......... – 89 – – 89 – – – – Structured notes .............................. – – – – – 7,034 – – 7,034Derivatives with monolines ............ – – – 407 407 – – – –Other derivatives ............................ – – – 2,253 2,253 – – 2,643 2,643 Other portfolios .............................. 3,177 2,433 79 – 5,689 – – – –
8,960 3,044 471 2,660 15,135 7,034 – 2,643 9,677 At 31 December 2013 Private equity including strategic
investments ................................. 3,729 103 420 – 4,252 – – – – Asset-backed securities .................. 1,677 643 – – 2,320 – – – – Loans held for securitisation .......... – 83 – – 83 – – – – Structured notes .............................. – 14 – – 14 7,514 – – 7,514 Derivatives with monolines ............ – – – 320 320 – – – – Other derivatives ............................ – – – 2,182 2,182 – – 2,335 2,335 Other portfolios .............................. 1,839 4,504 188 – 6,531 – – – –
7,245 5,347 608 2,502 15,702 7,514 – 2,335 9,849
1 Designated at fair value through profit or loss.
The basis for determining the fair value of the financial instruments in the table above is explained on page 487 of the Annual Report and Accounts 2013.
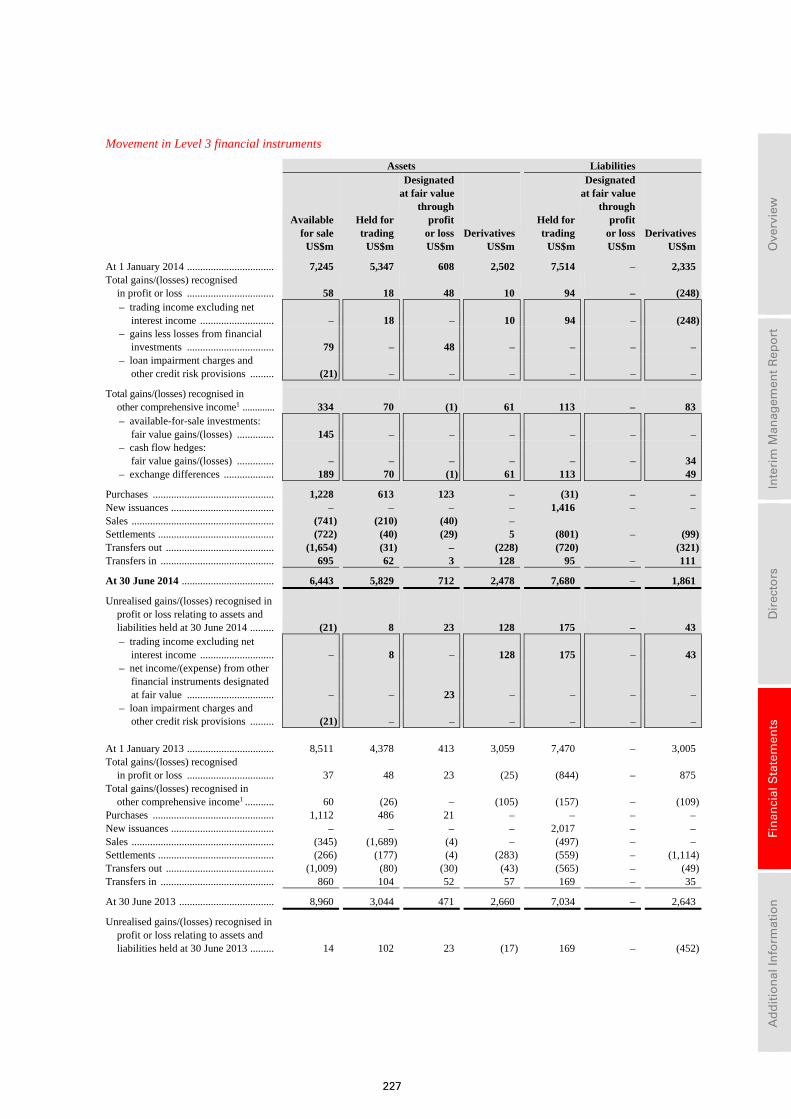
227
Ove
rvie
w
In
teri
m M
anag
emen
t R
epo
rt
D
irec
tors
Fin
anci
al S
tate
men
ts
A
dd
itio
nal
Info
rmat
ion
Movement in Level 3 financial instruments
Assets Liabilities
Available for sale
Held for trading
Designated at fair value through profit or loss Derivatives
Held for trading
Designated at fair value through profit or loss Derivatives
US$m US$m US$m US$m US$m US$m US$m
At 1 January 2014 ................................. 7,245 5,347 608 2,502 7,514 – 2,335 Total gains/(losses) recognised
in profit or loss ................................. 58 18 48 10 94 – (248)– trading income excluding net
interest income ............................ – 18 – 10 94 – (248)– gains less losses from financial
investments ................................. 79 – 48 – – – –– loan impairment charges and
other credit risk provisions ......... (21) – – – – – –
Total gains/(losses) recognised in other comprehensive income1 ............. 334 70 (1) 61 113 – 83 – available-for-sale investments:
fair value gains/(losses) .............. 145 – – – – – –– cash flow hedges:
fair value gains/(losses) .............. – – – – – – 34– exchange differences ................... 189 70 (1) 61 113 49
Purchases .............................................. 1,228 613 123 – (31) – – New issuances ....................................... – – – – 1,416 – – Sales ...................................................... (741) (210) (40) – Settlements ............................................ (722) (40) (29) 5 (801) – (99)Transfers out ......................................... (1,654) (31) – (228) (720) (321)Transfers in ........................................... 695 62 3 128 95 – 111
At 30 June 2014 ................................... 6,443 5,829 712 2,478 7,680 – 1,861
Unrealised gains/(losses) recognised in profit or loss relating to assets and liabilities held at 30 June 2014 ......... (21) 8 23 128 175 – 43 – trading income excluding net
interest income ............................ – 8 – 128 175 – 43– net income/(expense) from other
financial instruments designated at fair value ................................. – – 23 – – – –
– loan impairment charges and other credit risk provisions ......... (21) – – – – – –
At 1 January 2013 ................................. 8,511 4,378 413 3,059 7,470 – 3,005 Total gains/(losses) recognised
in profit or loss ................................. 37 48 23 (25) (844) – 875 Total gains/(losses) recognised in
other comprehensive income1 ........... 60 (26) – (105) (157) – (109)Purchases .............................................. 1,112 486 21 – – – – New issuances ....................................... – – – – 2,017 – – Sales ...................................................... (345) (1,689) (4) – (497) – – Settlements ............................................ (266) (177) (4) (283) (559) – (1,114)Transfers out ......................................... (1,009) (80) (30) (43) (565) – (49)Transfers in ........................................... 860 104 52 57 169 – 35
At 30 June 2013 .................................... 8,960 3,044 471 2,660 7,034 – 2,643
Unrealised gains/(losses) recognised in profit or loss relating to assets and liabilities held at 30 June 2013 ......... 14 102 23 (17) 169 – (452)
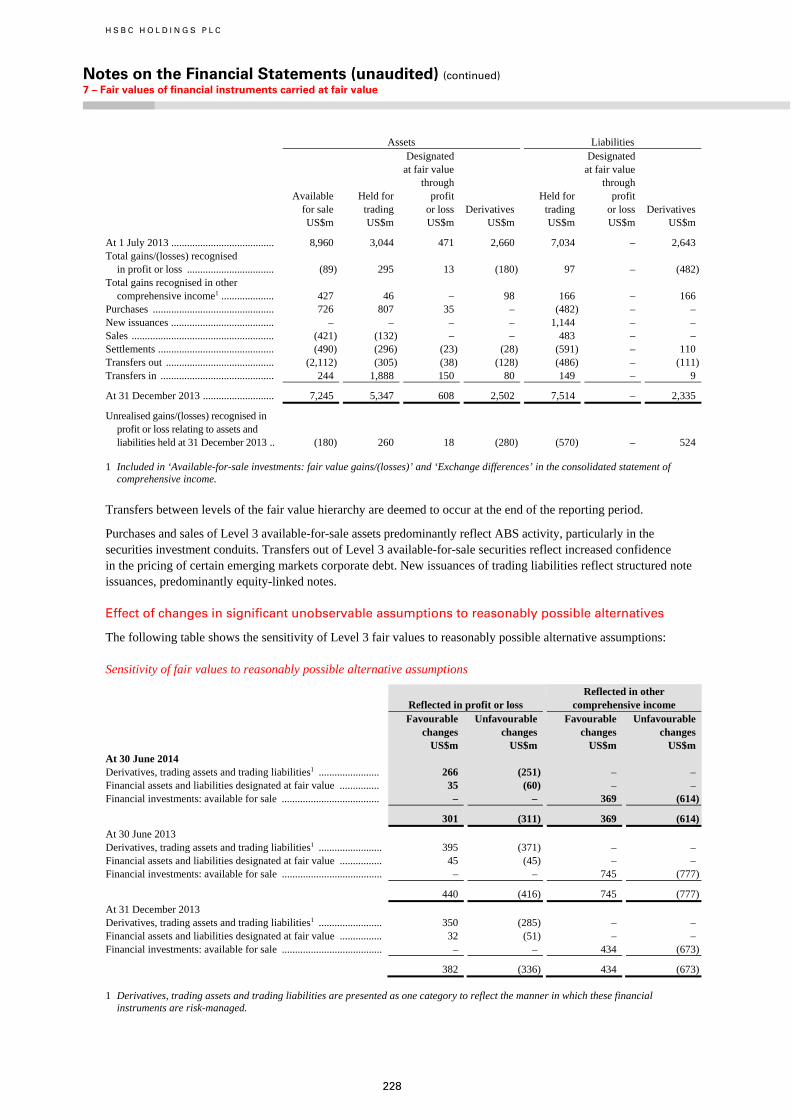
H S B C H O L D I N G S P L C
Notes on the Financial Statements (unaudited) (continued) 7 – Fair values of financial instruments carried at fair value
228
Assets Liabilities
Available for sale
Held for trading
Designated at fair value through profit or loss Derivatives
Held for trading
Designated at fair value through profit or loss Derivatives
US$m US$m US$m US$m US$m US$m US$m
At 1 July 2013 ....................................... 8,960 3,044 471 2,660 7,034 – 2,643 Total gains/(losses) recognised
in profit or loss ................................. (89) 295 13 (180) 97 – (482)Total gains recognised in other
comprehensive income1 .................... 427 46 – 98 166 – 166 Purchases .............................................. 726 807 35 – (482) – – New issuances ....................................... – – – – 1,144 – – Sales ...................................................... (421) (132) – – 483 – – Settlements ............................................ (490) (296) (23) (28) (591) – 110 Transfers out ......................................... (2,112) (305) (38) (128) (486) – (111)Transfers in ........................................... 244 1,888 150 80 149 – 9
At 31 December 2013 ........................... 7,245 5,347 608 2,502 7,514 – 2,335
Unrealised gains/(losses) recognised in profit or loss relating to assets and liabilities held at 31 December 2013 .. (180) 260 18 (280) (570) – 524
1 Included in ‘Available-for-sale investments: fair value gains/(losses)’ and ‘Exchange differences’ in the consolidated statement of comprehensive income.
Transfers between levels of the fair value hierarchy are deemed to occur at the end of the reporting period.
Purchases and sales of Level 3 available-for-sale assets predominantly reflect ABS activity, particularly in the securities investment conduits. Transfers out of Level 3 available-for-sale securities reflect increased confidence in the pricing of certain emerging markets corporate debt. New issuances of trading liabilities reflect structured note issuances, predominantly equity-linked notes.
Effect of changes in significant unobservable assumptions to reasonably possible alternatives
The following table shows the sensitivity of Level 3 fair values to reasonably possible alternative assumptions:
Sensitivity of fair values to reasonably possible alternative assumptions
Reflected in profit or loss Reflected in other
comprehensive income
Favourable changes
Unfavourable changes
Favourable changes
Unfavourable changes
US$m US$m US$m US$m At 30 June 2014 Derivatives, trading assets and trading liabilities1 ....................... 266 (251) – – Financial assets and liabilities designated at fair value ............... 35 (60) – – Financial investments: available for sale ..................................... – – 369 (614)
301 (311) 369 (614)
At 30 June 2013 Derivatives, trading assets and trading liabilities1 ........................ 395 (371) – – Financial assets and liabilities designated at fair value ................ 45 (45) – – Financial investments: available for sale ...................................... – – 745 (777)
440 (416) 745 (777)
At 31 December 2013 Derivatives, trading assets and trading liabilities1 ........................ 350 (285) – – Financial assets and liabilities designated at fair value ................ 32 (51) – – Financial investments: available for sale ...................................... – – 434 (673)
382 (336) 434 (673)
1 Derivatives, trading assets and trading liabilities are presented as one category to reflect the manner in which these financial instruments are risk-managed.
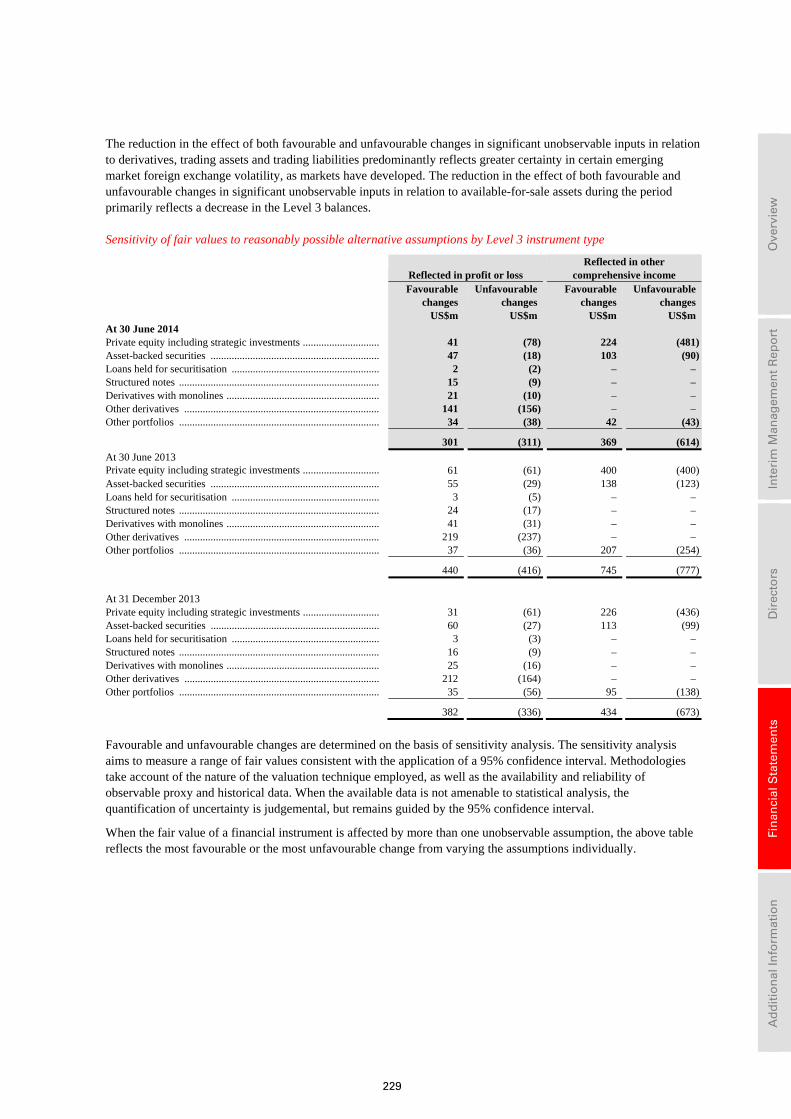
229
Ove
rvie
w
In
teri
m M
anag
emen
t R
epo
rt
D
irec
tors
Fin
anci
al S
tate
men
ts
A
dd
itio
nal
Info
rmat
ion
The reduction in the effect of both favourable and unfavourable changes in significant unobservable inputs in relation to derivatives, trading assets and trading liabilities predominantly reflects greater certainty in certain emerging market foreign exchange volatility, as markets have developed. The reduction in the effect of both favourable and unfavourable changes in significant unobservable inputs in relation to available-for-sale assets during the period primarily reflects a decrease in the Level 3 balances.
Sensitivity of fair values to reasonably possible alternative assumptions by Level 3 instrument type
Reflected in profit or loss Reflected in other
comprehensive income
Favourable changes
Unfavourable changes
Favourable changes
Unfavourable changes
US$m US$m US$m US$m At 30 June 2014 Private equity including strategic investments ............................. 41 (78) 224 (481)Asset-backed securities ................................................................ 47 (18) 103 (90)Loans held for securitisation ........................................................ 2 (2) – – Structured notes ............................................................................ 15 (9) – – Derivatives with monolines .......................................................... 21 (10) – – Other derivatives .......................................................................... 141 (156) – – Other portfolios ............................................................................ 34 (38) 42 (43)
301 (311) 369 (614)
At 30 June 2013 Private equity including strategic investments ............................. 61 (61) 400 (400)Asset-backed securities ................................................................ 55 (29) 138 (123)Loans held for securitisation ........................................................ 3 (5) – – Structured notes ............................................................................ 24 (17) – – Derivatives with monolines .......................................................... 41 (31) – – Other derivatives .......................................................................... 219 (237) – – Other portfolios ............................................................................ 37 (36) 207 (254)
440 (416) 745 (777)
At 31 December 2013 Private equity including strategic investments ............................. 31 (61) 226 (436)Asset-backed securities ................................................................ 60 (27) 113 (99)Loans held for securitisation ........................................................ 3 (3) – – Structured notes ............................................................................ 16 (9) – – Derivatives with monolines .......................................................... 25 (16) – – Other derivatives .......................................................................... 212 (164) – – Other portfolios ............................................................................ 35 (56) 95 (138)
382 (336) 434 (673)
Favourable and unfavourable changes are determined on the basis of sensitivity analysis. The sensitivity analysis aims to measure a range of fair values consistent with the application of a 95% confidence interval. Methodologies take account of the nature of the valuation technique employed, as well as the availability and reliability of observable proxy and historical data. When the available data is not amenable to statistical analysis, the quantification of uncertainty is judgemental, but remains guided by the 95% confidence interval.
When the fair value of a financial instrument is affected by more than one unobservable assumption, the above table reflects the most favourable or the most unfavourable change from varying the assumptions individually.
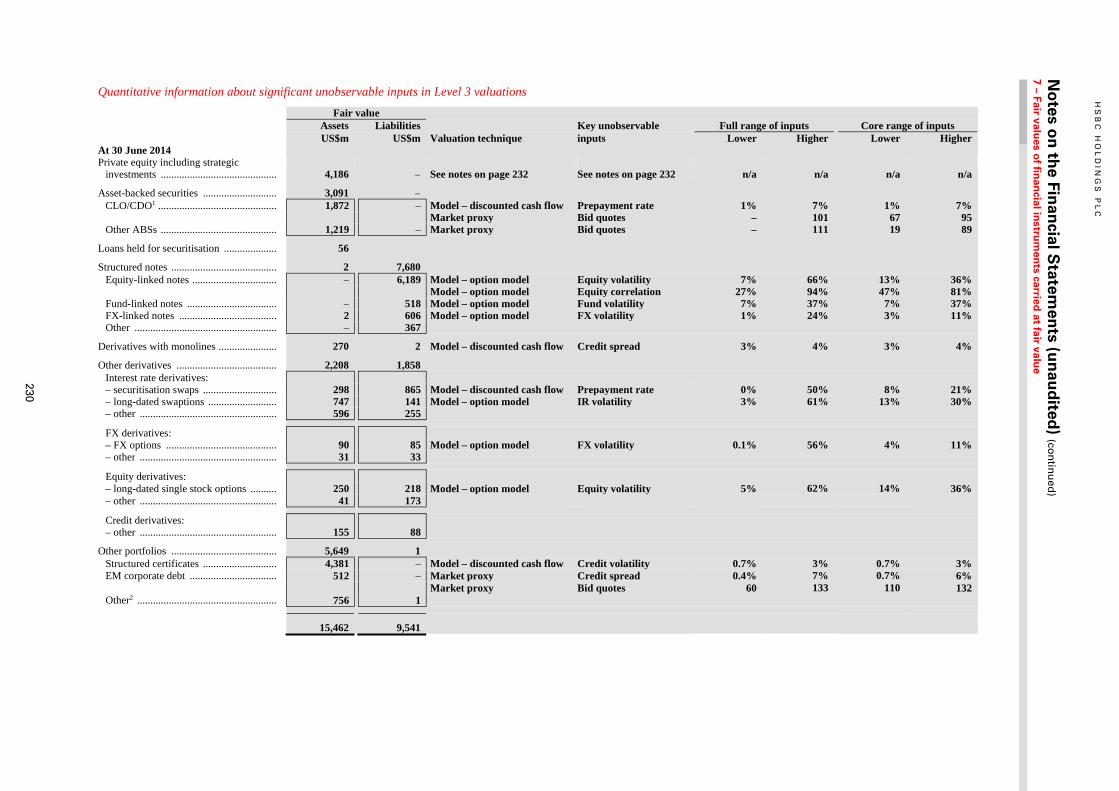
230
HS
BC
HO
LD
ING
S P
LC
N
otes o
n th
e Finan
cial Statem
ents (u
nau
dited
) (con
tinu
ed)
7 – Fair values o
f finan
cial instru
men
ts carried at fair valu
e
Quantitative information about significant unobservable inputs in Level 3 valuations
Fair value Assets Liabilities Key unobservable Full range of inputs Core range of inputs US$m US$m Valuation technique inputs Lower Higher Lower HigherAt 30 June 2014Private equity including strategic
investments ............................................ 4,186 – See notes on page 232 See notes on page 232 n/a n/a n/a n/a
Asset-backed securities ............................ 3,091 –CLO/CDO1 ............................................. 1,872 – Model – discounted cash flow Prepayment rate 1% 7% 1% 7%
Market proxy Bid quotes – 101 67 95Other ABSs ............................................ 1,219 – Market proxy Bid quotes – 111 19 89
Loans held for securitisation .................... 56
Structured notes ........................................ 2 7,680Equity-linked notes ................................ – 6,189 Model – option model Equity volatility 7% 66% 13% 36% Model – option model Equity correlation 27% 94% 47% 81%Fund-linked notes .................................. – 518 Model – option model Fund volatility 7% 37% 7% 37%FX-linked notes ..................................... 2 606 Model – option model FX volatility 1% 24% 3% 11%Other ...................................................... – 367
Derivatives with monolines ...................... 270 2 Model – discounted cash flow Credit spread 3% 4% 3% 4%
Other derivatives ...................................... 2,208 1,858Interest rate derivatives:– securitisation swaps ............................ 298 865 Model – discounted cash flow Prepayment rate 0% 50% 8% 21%– long-dated swaptions .......................... 747 141 Model – option model IR volatility 3% 61% 13% 30%– other .................................................... 596 255
FX derivatives:– FX options .......................................... 90 85 Model – option model FX volatility 0.1% 56% 4% 11%– other .................................................... 31 33
Equity derivatives:– long-dated single stock options .......... 250 218 Model – option model Equity volatility 5% 62% 14% 36% – other .................................................... 41 173
Credit derivatives:– other .................................................... 155 88
Other portfolios ........................................ 5,649 1Structured certificates ............................ 4,381 – Model – discounted cash flow Credit volatility 0.7% 3% 0.7% 3%EM corporate debt ................................. 512 – Market proxy Credit spread 0.4% 7% 0.7% 6% Market proxy Bid quotes 60 133 110 132 Other2 ..................................................... 756 1
15,462 9,541
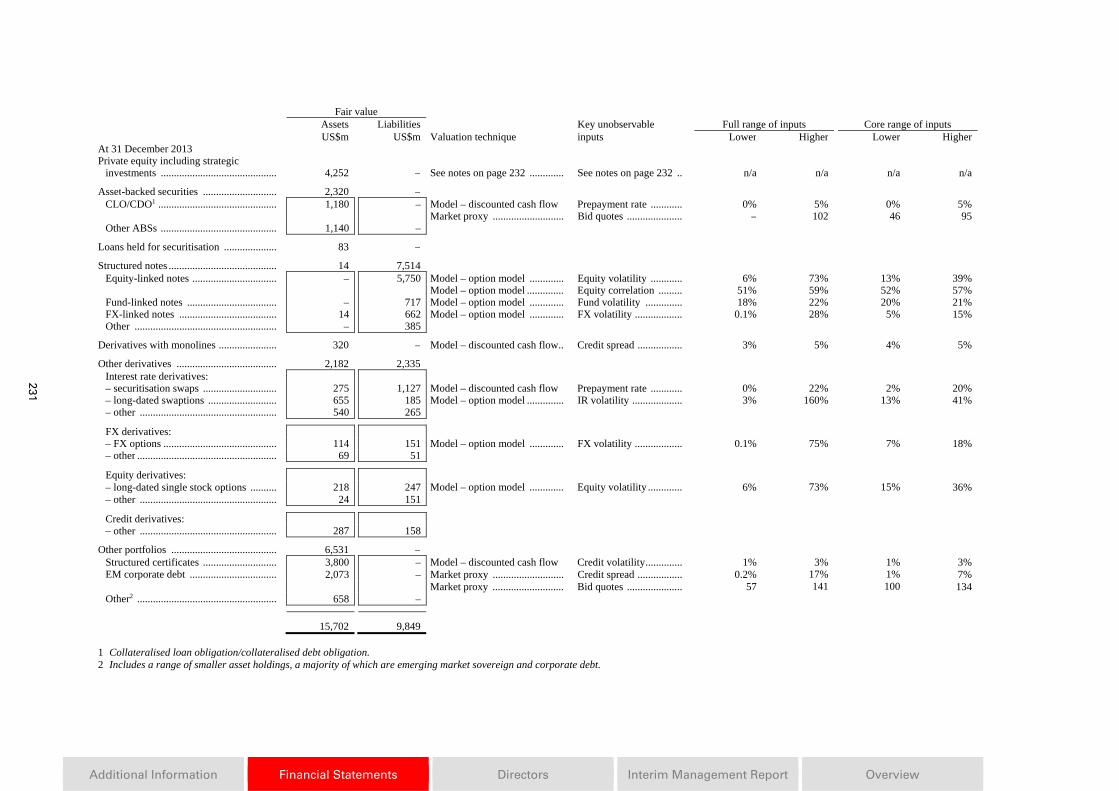
231
Additional Information Financial Statements Directors Interim Management Report Overview
Fair value Assets Liabilities Key unobservable Full range of inputs Core range of inputs US$m US$m Valuation technique inputs Lower Higher Lower HigherAt 31 December 2013Private equity including strategic
investments ............................................ 4,252 – See notes on page 232 ............. See notes on page 232 .. n/a n/a n/a n/a
Asset-backed securities ............................ 2,320 –CLO/CDO1 ............................................. 1,180 – Model – discounted cash flow Prepayment rate ............ 0% 5% 0% 5%
Market proxy ........................... Bid quotes ..................... – 102 46 95Other ABSs ............................................ 1,140 –
Loans held for securitisation .................... 83 –
Structured notes ......................................... 14 7,514Equity-linked notes ................................ – 5,750 Model – option model ............. Equity volatility ............ 6% 73% 13% 39% Model – option model .............. Equity correlation ......... 51% 59% 52% 57%Fund-linked notes .................................. – 717 Model – option model ............. Fund volatility .............. 18% 22% 20% 21%FX-linked notes ..................................... 14 662 Model – option model ............. FX volatility .................. 0.1% 28% 5% 15%Other ...................................................... – 385
Derivatives with monolines ...................... 320 – Model – discounted cash flow.. Credit spread ................. 3% 5% 4% 5%
Other derivatives ...................................... 2,182 2,335Interest rate derivatives:– securitisation swaps ............................ 275 1,127 Model – discounted cash flow Prepayment rate ............ 0% 22% 2% 20%– long-dated swaptions .......................... 655 185 Model – option model .............. IR volatility ................... 3% 160% 13% 41%– other .................................................... 540 265
FX derivatives:– FX options ........................................... 114 151 Model – option model ............. FX volatility .................. 0.1% 75% 7% 18%– other ..................................................... 69 51
Equity derivatives:– long-dated single stock options .......... 218 247 Model – option model ............. Equity volatility ............. 6% 73% 15% 36%– other .................................................... 24 151
Credit derivatives:– other .................................................... 287 158
Other portfolios ........................................ 6,531 –Structured certificates ............................ 3,800 – Model – discounted cash flow Credit volatility .............. 1% 3% 1% 3%EM corporate debt ................................. 2,073 – Market proxy ........................... Credit spread ................. 0.2% 17% 1% 7% Market proxy ........................... Bid quotes ..................... 57 141 100 134Other2 ..................................................... 658 –
15,702 9,849
1 Collateralised loan obligation/collateralised debt obligation. 2 Includes a range of smaller asset holdings, a majority of which are emerging market sovereign and corporate debt.
H S B C H O L D I N G S P L C
Notes on the Financial Statements (unaudited) (continued) 7 – Fair values of financial instruments carried at FV / 8 – Fair values of financial instruments not carried at FV
232
Key unobservable inputs to Level 3 financial instruments
The table above lists key unobservable inputs to Level 3 financial instruments, and provides the range of those inputs as at 30 June 2014. The core range of inputs is the estimated range within which 90% of the inputs fall. A further description of the categories of key unobservable inputs is given below.
Private equity including strategic investments
HSBC’s private equity and strategic investments are generally classified as available for sale and are not traded in active markets. In the absence of an active market, an investment’s fair value is estimated on the basis of an analysis of the investee’s financial position and results, risk profile, prospects and other factors, as well as by reference to market valuations for similar entities quoted in an active market, or the price at which similar companies have changed ownership. Given the bespoke nature of the analysis in respect of each holding, it is not practical to quote a range of key unobservable inputs.
Prepayment rates
Prepayment rates are a measure of the anticipated future speed at which a loan portfolio will be repaid in advance of the due date. Prepayment rates are an important input into modelled values of ABSs. A modelled price may be used where insufficient observable market prices exist to enable a market price to be determined directly. Prepayment rates are also an important input into the valuation of derivatives linked to securitisations. For example, so-called securitisation swaps have a notional value that is linked to the size of the outstanding loan portfolio in a securitisation, which may fall as prepayments occur. Prepayment rates vary according to the nature of the loan portfolio, and expectations of future market conditions. For example, current prepayment rates in US residential mortgage-backed securities would generally be expected to rise as the US economy improves. Prepayment rates may be estimated using a variety of evidence, such as prepayment rates implied from proxy observable security prices, current or historical prepayment rates and macroeconomic modelling.
Market proxy
Market proxy pricing may be used for an instrument for which specific market pricing is not available, but evidence is available in respect of instruments that have some characteristics in common. In certain cases it might be possible to identify a specific proxy, but more generally evidence across a wider range of instruments will be used to understand the factors that influence current market pricing and the manner of that influence. For example, in the collateralised loan obligation market it may be possible to establish that A-rated securities exhibit prices in a range, and to isolate key factors that influence the position within the range. Applying this to a specific A-rated security within HSBC’s portfolio allows assignment of a price.
The range of prices used as inputs into a market proxy pricing methodology may therefore be wide. This range is not indicative of the uncertainty associated with the price derived for an individual security.
Volatility
Volatility is a measure of the anticipated future variability of a market price. Volatility tends to increase in stressed market conditions and decrease in calmer market conditions. Volatility is an important input in the pricing of options. In general, the higher the volatility, the more expensive the option will be. This reflects both the higher probability of an increased return from the option, and the potentially higher costs that HSBC may incur in hedging the risks associated with the option. If option prices become more expensive, this will increase the value of HSBC’s long option positions (i.e. the positions in which HSBC has purchased options), while HSBC’s short option positions (i.e. the positions in which HSBC has sold options) will suffer losses.
Volatility varies by underlying reference market price, and by strike and maturity of the option. Volatility also varies over time. As a result, it is difficult to make general statements regarding volatility levels. For example, while it is generally the case that foreign exchange volatilities are lower than equity volatilities, there may be examples in particular currency pairs or for particular equities where this is not the case.
Certain volatilities, typically those of a longer-dated nature, are unobservable. The unobservable volatility is then estimated from observable data. For example, longer-dated volatilities may be extrapolated from shorter-dated volatilities.
233
Ove
rvie
w
In
teri
m M
anag
emen
t R
epo
rt
D
irec
tors
Fin
anci
al S
tate
men
ts
A
dd
itio
nal
Info
rmat
ion
The range of unobservable volatilities quoted in the table on page 230 reflects the wide variation in volatility inputs by reference market price. For example, foreign exchange volatilities for a pegged currency may be very low, whereas for non-managed currencies the foreign exchange volatility may be higher. As a further example, volatilities for deep-in-the-money or deep-out-of-the-money equity options may be significantly higher than at-the-money options. The core range is significantly narrower than the full range because these examples with extreme volatilities occur relatively rarely within the HSBC portfolio. For any single unobservable volatility, the uncertainty in the volatility determination is significantly less than the range quoted above.
Correlation
Correlation is a measure of the inter-relationship between two market prices. Correlation is a number between minus one and one. A positive correlation implies that the two market prices tend to move in the same direction, with a correlation of one implying that they always move in the same direction. A negative correlation implies that the two market prices tend to move in opposite directions, with a correlation of minus one implying that the two market prices always move in opposite directions.
Correlation is used to value more complex instruments where the payout is dependent upon more than one market price. For example, an equity basket option has a payout that is dependent upon the performance of a basket of single stocks, and the correlation between the price movements of those stocks will be an input to the valuation. This is referred to as equity-equity correlation. There are a wide range of instruments for which correlation is an input, and consequently a wide range of both same-asset correlations (e.g. equity-equity correlation) and cross-asset correlations (e.g. foreign exchange rate-interest rate correlation) used. In general, the range of same-asset correlations will be narrower than the range of cross-asset correlations.
Correlation may be unobservable. Unobservable correlations may be estimated based upon a range of evidence, including consensus pricing services, HSBC trade prices, proxy correlations and examination of historical price relationships.
The range of unobservable correlations quoted in the table reflects the wide variation in correlation inputs by market price pair. For any single unobservable correlation, the uncertainty in the correlation determination is likely to be less than the range quoted above.
Credit spread
Credit spread is the premium over a benchmark interest rate required by the market to accept lower credit quality. In a discounted cash flow model, the credit spread increases the discount factors applied to future cash flows, thereby reducing the value of an asset. Credit spreads may be implied from market prices. Credit spreads may not be observable in more illiquid markets.
Inter-relationships between key unobservable inputs
Key unobservable inputs to Level 3 financial instruments may not be independent of each other. As described above, market variables may be correlated. This correlation typically reflects the manner in which different markets tend to react to macroeconomic or other events. For example, improving economic conditions may lead to a ‘risk on’ market, in which prices of risky assets such as equities and high yield bonds will rise, while ‘safe haven’ assets such as gold and US Treasuries decline. Furthermore, the impact of changing market variables upon the HSBC portfolio will depend upon HSBC’s net risk position in respect of each variable. For example, increasing high-yield bond prices will benefit long high-yield bond positions, but the value of any credit derivative protection held against those bonds will fall.
8 Fair values of financial instruments not carried at fair value
The accounting policies which determine the classification of financial instruments and the use of assumptions and estimation in valuing them are described on pages 432 to 450 and page 74, respectively, of the Annual Report and Accounts 2013.
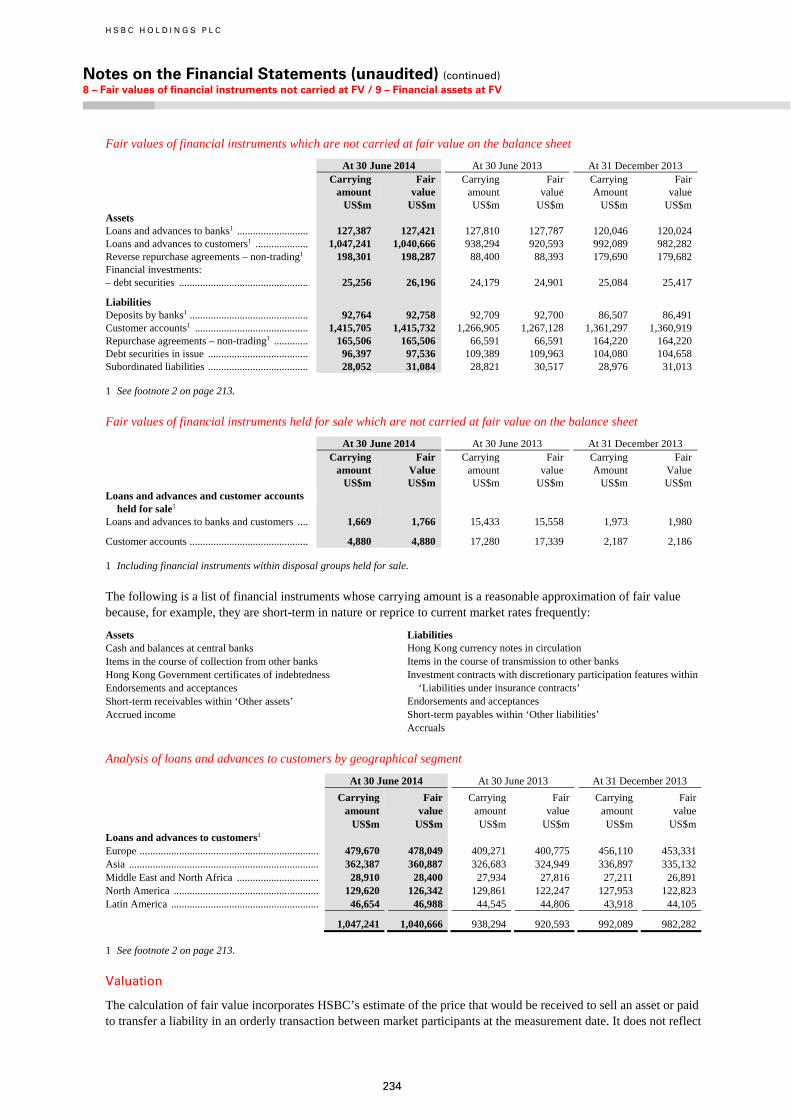
H S B C H O L D I N G S P L C
Notes on the Financial Statements (unaudited) (continued) 8 – Fair values of financial instruments not carried at FV / 9 – Financial assets at FV
234
Fair values of financial instruments which are not carried at fair value on the balance sheet
At 30 June 2014 At 30 June 2013 At 31 December 2013
Carrying amount
Fair value
Carrying amount
Fair value
Carrying Amount
Fair value
US$m US$m US$m US$m US$m US$m Assets Loans and advances to banks1 ........................... 127,387 127,421 127,810 127,787 120,046 120,024 Loans and advances to customers1 .................... 1,047,241 1,040,666 938,294 920,593 992,089 982,282 Reverse repurchase agreements – non-trading1 198,301 198,287 88,400 88,393 179,690 179,682 Financial investments: – debt securities ................................................. 25,256 26,196 24,179 24,901 25,084 25,417
Liabilities Deposits by banks1 ............................................. 92,764 92,758 92,709 92,700 86,507 86,491 Customer accounts1 ........................................... 1,415,705 1,415,732 1,266,905 1,267,128 1,361,297 1,360,919 Repurchase agreements – non-trading1 ............. 165,506 165,506 66,591 66,591 164,220 164,220 Debt securities in issue ...................................... 96,397 97,536 109,389 109,963 104,080 104,658 Subordinated liabilities ...................................... 28,052 31,084 28,821 30,517 28,976 31,013
1 See footnote 2 on page 213.
Fair values of financial instruments held for sale which are not carried at fair value on the balance sheet
At 30 June 2014 At 30 June 2013 At 31 December 2013
Carrying amount
Fair Value
Carrying amount
Fair value
Carrying Amount
Fair Value
US$m US$m US$m US$m US$m US$m Loans and advances and customer accounts
held for sale1
Loans and advances to banks and customers .... 1,669 1,766 15,433 15,558 1,973 1,980
Customer accounts ............................................. 4,880 4,880 17,280 17,339 2,187 2,186
1 Including financial instruments within disposal groups held for sale.
The following is a list of financial instruments whose carrying amount is a reasonable approximation of fair value because, for example, they are short-term in nature or reprice to current market rates frequently:
Assets LiabilitiesCash and balances at central banks Hong Kong currency notes in circulation Items in the course of collection from other banks Items in the course of transmission to other banks Hong Kong Government certificates of indebtedness Investment contracts with discretionary participation features withinEndorsements and acceptances ‘Liabilities under insurance contracts’ Short-term receivables within ‘Other assets’ Endorsements and acceptances Accrued income Short-term payables within ‘Other liabilities’ Accruals
Analysis of loans and advances to customers by geographical segment
At 30 June 2014 At 30 June 2013 At 31 December 2013
Carrying amount
Fair value
Carrying amount
Fair value
Carrying amount
Fair value
US$m US$m US$m US$m US$m US$mLoans and advances to customers1 Europe .................................................................... 479,670 478,049 409,271 400,775 456,110 453,331Asia ........................................................................ 362,387 360,887 326,683 324,949 336,897 335,132Middle East and North Africa ............................... 28,910 28,400 27,934 27,816 27,211 26,891North America ....................................................... 129,620 126,342 129,861 122,247 127,953 122,823Latin America ........................................................ 46,654 46,988 44,545 44,806 43,918 44,105
1,047,241 1,040,666 938,294 920,593 992,089 982,282
1 See footnote 2 on page 213.
Valuation
The calculation of fair value incorporates HSBC’s estimate of the price that would be received to sell an asset or paid to transfer a liability in an orderly transaction between market participants at the measurement date. It does not reflect
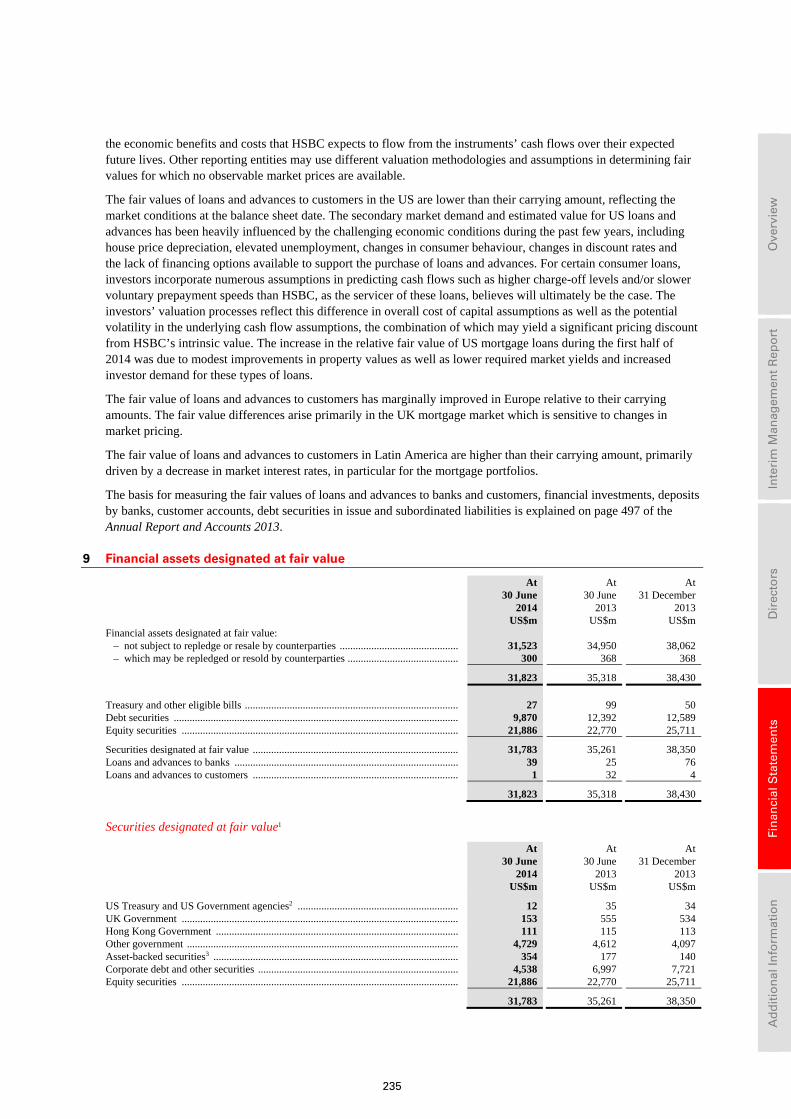
235
Ove
rvie
w
In
teri
m M
anag
emen
t R
epo
rt
D
irec
tors
Fin
anci
al S
tate
men
ts
A
dd
itio
nal
Info
rmat
ion
the economic benefits and costs that HSBC expects to flow from the instruments’ cash flows over their expected future lives. Other reporting entities may use different valuation methodologies and assumptions in determining fair values for which no observable market prices are available.
The fair values of loans and advances to customers in the US are lower than their carrying amount, reflecting the market conditions at the balance sheet date. The secondary market demand and estimated value for US loans and advances has been heavily influenced by the challenging economic conditions during the past few years, including house price depreciation, elevated unemployment, changes in consumer behaviour, changes in discount rates and the lack of financing options available to support the purchase of loans and advances. For certain consumer loans, investors incorporate numerous assumptions in predicting cash flows such as higher charge-off levels and/or slower voluntary prepayment speeds than HSBC, as the servicer of these loans, believes will ultimately be the case. The investors’ valuation processes reflect this difference in overall cost of capital assumptions as well as the potential volatility in the underlying cash flow assumptions, the combination of which may yield a significant pricing discount from HSBC’s intrinsic value. The increase in the relative fair value of US mortgage loans during the first half of 2014 was due to modest improvements in property values as well as lower required market yields and increased investor demand for these types of loans.
The fair value of loans and advances to customers has marginally improved in Europe relative to their carrying amounts. The fair value differences arise primarily in the UK mortgage market which is sensitive to changes in market pricing.
The fair value of loans and advances to customers in Latin America are higher than their carrying amount, primarily driven by a decrease in market interest rates, in particular for the mortgage portfolios.
The basis for measuring the fair values of loans and advances to banks and customers, financial investments, deposits by banks, customer accounts, debt securities in issue and subordinated liabilities is explained on page 497 of the Annual Report and Accounts 2013.
9 Financial assets designated at fair value
At 30 June 2014
At 30 June
2013
At 31 December 2013
US$m US$m US$mFinancial assets designated at fair value: – not subject to repledge or resale by counterparties ............................................. 31,523 34,950 38,062 – which may be repledged or resold by counterparties .......................................... 300 368 368
31,823 35,318 38,430 Treasury and other eligible bills ................................................................................. 27 99 50Debt securities ............................................................................................................ 9,870 12,392 12,589 Equity securities ......................................................................................................... 21,886 22,770 25,711
Securities designated at fair value .............................................................................. 31,783 35,261 38,350 Loans and advances to banks ..................................................................................... 39 25 76Loans and advances to customers .............................................................................. 1 32 4
31,823 35,318 38,430
Securities designated at fair value1
At 30 June 2014
At 30 June
2013
At 31 December 2013
US$m US$m US$m
US Treasury and US Government agencies2 ............................................................. 12 35 34 UK Government ......................................................................................................... 153 555 534Hong Kong Government ............................................................................................ 111 115 113Other government ....................................................................................................... 4,729 4,612 4,097 Asset-backed securities3 ............................................................................................. 354 177 140Corporate debt and other securities ............................................................................ 4,538 6,997 7,721Equity securities ......................................................................................................... 21,886 22,770 25,711
31,783 35,261 38,350
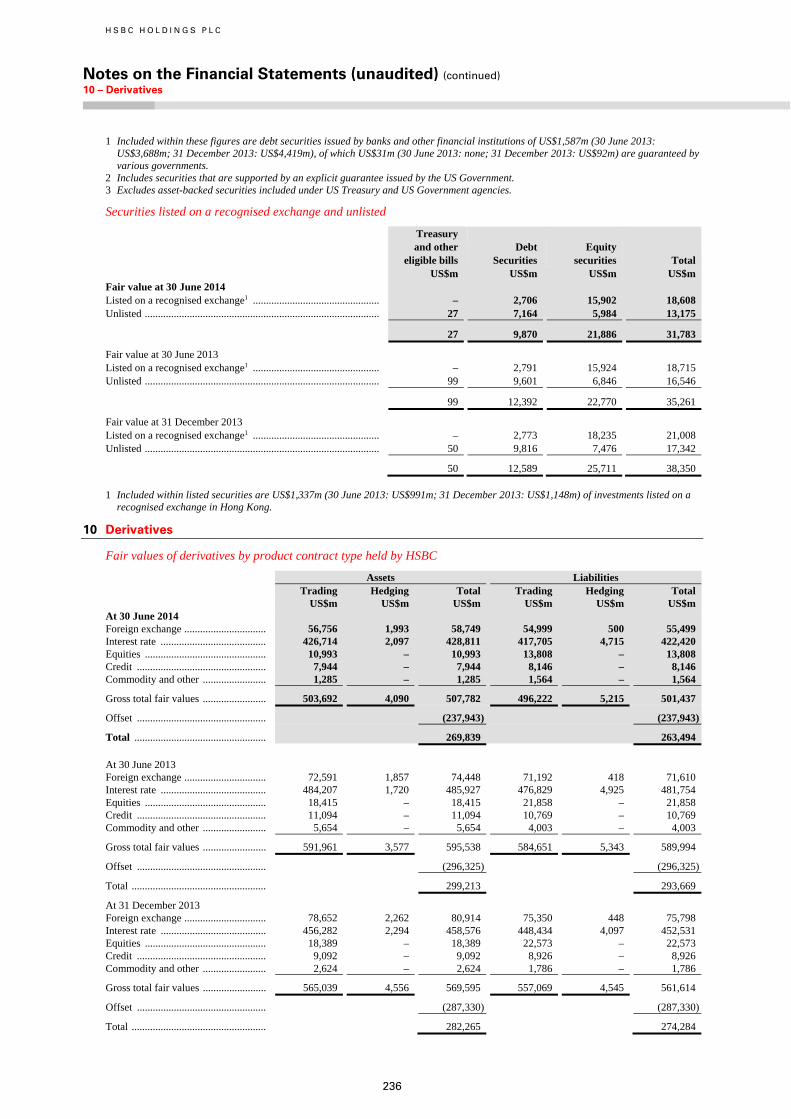
H S B C H O L D I N G S P L C
Notes on the Financial Statements (unaudited) (continued) 10 – Derivatives
236
1 Included within these figures are debt securities issued by banks and other financial institutions of US$1,587m (30 June 2013: US$3,688m; 31 December 2013: US$4,419m), of which US$31m (30 June 2013: none; 31 December 2013: US$92m) are guaranteed by various governments.
2 Includes securities that are supported by an explicit guarantee issued by the US Government. 3 Excludes asset-backed securities included under US Treasury and US Government agencies.
Securities listed on a recognised exchange and unlisted
Treasury and other eligible bills
Debt Securities
Equity securities
Total US$m US$m US$m US$m Fair value at 30 June 2014 Listed on a recognised exchange1 ................................................ – 2,706 15,902 18,608 Unlisted ......................................................................................... 27 7,164 5,984 13,175
27 9,870 21,886 31,783
Fair value at 30 June 2013 Listed on a recognised exchange1 ................................................ – 2,791 15,924 18,715 Unlisted ......................................................................................... 99 9,601 6,846 16,546
99 12,392 22,770 35,261
Fair value at 31 December 2013 Listed on a recognised exchange1 ................................................ – 2,773 18,235 21,008 Unlisted ......................................................................................... 50 9,816 7,476 17,342
50 12,589 25,711 38,350
1 Included within listed securities are US$1,337m (30 June 2013: US$991m; 31 December 2013: US$1,148m) of investments listed on a recognised exchange in Hong Kong.
10 Derivatives
Fair values of derivatives by product contract type held by HSBC
Assets Liabilities Trading Hedging Total Trading Hedging Total US$m US$m US$m US$m US$m US$m At 30 June 2014 Foreign exchange ............................... 56,756 1,993 58,749 54,999 500 55,499 Interest rate ........................................ 426,714 2,097 428,811 417,705 4,715 422,420 Equities .............................................. 10,993 – 10,993 13,808 – 13,808 Credit ................................................. 7,944 – 7,944 8,146 – 8,146 Commodity and other ........................ 1,285 – 1,285 1,564 – 1,564
Gross total fair values ........................ 503,692 4,090 507,782 496,222 5,215 501,437
Offset ................................................. (237,943) (237,943)
Total .................................................. 269,839 263,494 At 30 June 2013 Foreign exchange ............................... 72,591 1,857 74,448 71,192 418 71,610Interest rate ........................................ 484,207 1,720 485,927 476,829 4,925 481,754 Equities .............................................. 18,415 – 18,415 21,858 – 21,858Credit ................................................. 11,094 – 11,094 10,769 – 10,769Commodity and other ........................ 5,654 – 5,654 4,003 – 4,003
Gross total fair values ........................ 591,961 3,577 595,538 584,651 5,343 589,994
Offset ................................................. (296,325) (296,325)
Total ................................................... 299,213 293,669
At 31 December 2013 Foreign exchange ............................... 78,652 2,262 80,914 75,350 448 75,798 Interest rate ........................................ 456,282 2,294 458,576 448,434 4,097 452,531Equities .............................................. 18,389 – 18,389 22,573 – 22,573Credit ................................................. 9,092 – 9,092 8,926 – 8,926 Commodity and other ........................ 2,624 – 2,624 1,786 – 1,786
Gross total fair values ........................ 565,039 4,556 569,595 557,069 4,545 561,614
Offset ................................................. (287,330) (287,330)
Total ................................................... 282,265 274,284
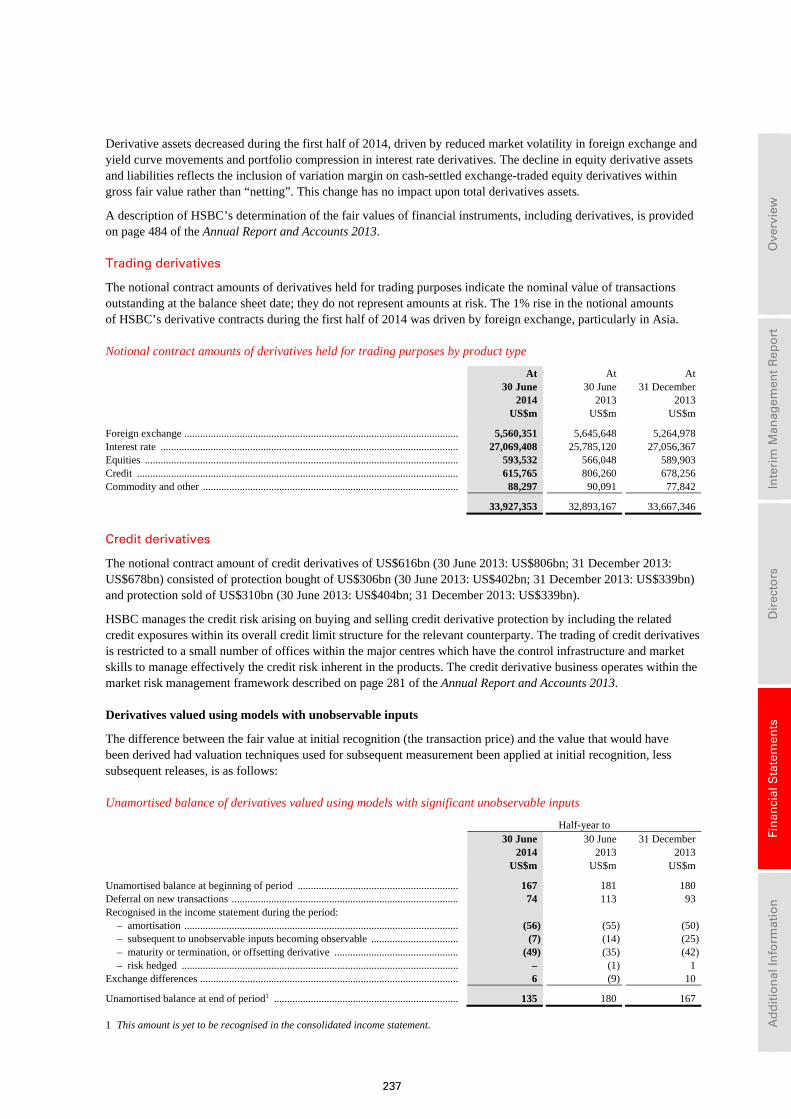
237
Ove
rvie
w
In
teri
m M
anag
emen
t R
epo
rt
D
irec
tors
Fin
anci
al S
tate
men
ts
A
dd
itio
nal
Info
rmat
ion
Derivative assets decreased during the first half of 2014, driven by reduced market volatility in foreign exchange and yield curve movements and portfolio compression in interest rate derivatives. The decline in equity derivative assets and liabilities reflects the inclusion of variation margin on cash-settled exchange-traded equity derivatives within gross fair value rather than “netting”. This change has no impact upon total derivatives assets.
A description of HSBC’s determination of the fair values of financial instruments, including derivatives, is provided on page 484 of the Annual Report and Accounts 2013.
Trading derivatives
The notional contract amounts of derivatives held for trading purposes indicate the nominal value of transactions outstanding at the balance sheet date; they do not represent amounts at risk. The 1% rise in the notional amounts of HSBC’s derivative contracts during the first half of 2014 was driven by foreign exchange, particularly in Asia.
Notional contract amounts of derivatives held for trading purposes by product type
At 30 June 2014
At 30 June 2013
At 31 December 2013
US$m US$m US$m
Foreign exchange ........................................................................................................ 5,560,351 5,645,648 5,264,978 Interest rate ................................................................................................................. 27,069,408 25,785,120 27,056,367 Equities ....................................................................................................................... 593,532 566,048 589,903 Credit .......................................................................................................................... 615,765 806,260 678,256 Commodity and other ................................................................................................. 88,297 90,091 77,842
33,927,353 32,893,167 33,667,346
Credit derivatives
The notional contract amount of credit derivatives of US$616bn (30 June 2013: US$806bn; 31 December 2013: US$678bn) consisted of protection bought of US$306bn (30 June 2013: US$402bn; 31 December 2013: US$339bn) and protection sold of US$310bn (30 June 2013: US$404bn; 31 December 2013: US$339bn).
HSBC manages the credit risk arising on buying and selling credit derivative protection by including the related credit exposures within its overall credit limit structure for the relevant counterparty. The trading of credit derivatives is restricted to a small number of offices within the major centres which have the control infrastructure and market skills to manage effectively the credit risk inherent in the products. The credit derivative business operates within the market risk management framework described on page 281 of the Annual Report and Accounts 2013.
Derivatives valued using models with unobservable inputs
The difference between the fair value at initial recognition (the transaction price) and the value that would have been derived had valuation techniques used for subsequent measurement been applied at initial recognition, less subsequent releases, is as follows:
Unamortised balance of derivatives valued using models with significant unobservable inputs
Half-year to
30 June 2014
30 June 2013
31 December 2013
US$m US$m US$m
Unamortised balance at beginning of period ............................................................. 167 181 180 Deferral on new transactions ...................................................................................... 74 113 93 Recognised in the income statement during the period:
– amortisation ........................................................................................................ (56) (55) (50)– subsequent to unobservable inputs becoming observable ................................. (7) (14) (25)– maturity or termination, or offsetting derivative ............................................... (49) (35) (42)– risk hedged ......................................................................................................... – (1) 1
Exchange differences .................................................................................................. 6 (9) 10
Unamortised balance at end of period1 ...................................................................... 135 180 167
1 This amount is yet to be recognised in the consolidated income statement.
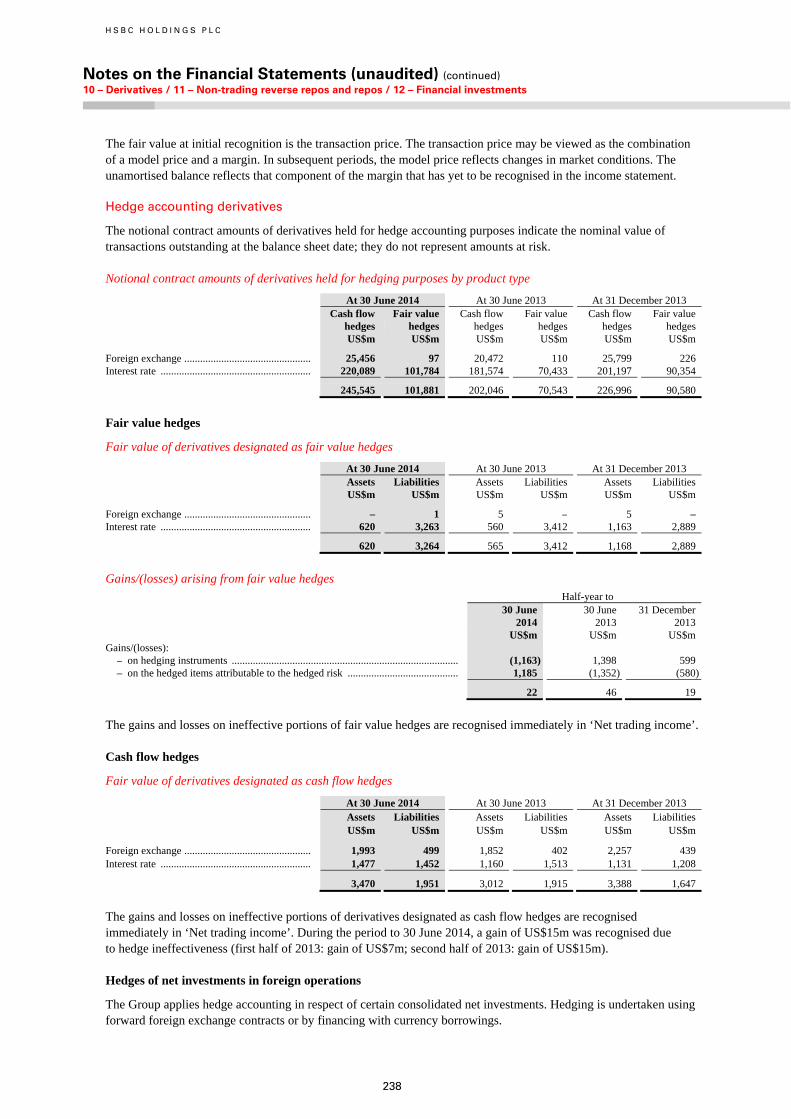
H S B C H O L D I N G S P L C
Notes on the Financial Statements (unaudited) (continued) 10 – Derivatives / 11 – Non-trading reverse repos and repos / 12 – Financial investments
238
The fair value at initial recognition is the transaction price. The transaction price may be viewed as the combination of a model price and a margin. In subsequent periods, the model price reflects changes in market conditions. The unamortised balance reflects that component of the margin that has yet to be recognised in the income statement.
Hedge accounting derivatives
The notional contract amounts of derivatives held for hedge accounting purposes indicate the nominal value of transactions outstanding at the balance sheet date; they do not represent amounts at risk.
Notional contract amounts of derivatives held for hedging purposes by product type
At 30 June 2014 At 30 June 2013 At 31 December 2013 Cash flow
hedges Fair value
hedges Cash flow
hedges Fair value
hedges Cash flow
hedges Fair value
hedges US$m US$m US$m US$m US$m US$m
Foreign exchange ................................................ 25,456 97 20,472 110 25,799 226Interest rate ......................................................... 220,089 101,784 181,574 70,433 201,197 90,354
245,545 101,881 202,046 70,543 226,996 90,580
Fair value hedges
Fair value of derivatives designated as fair value hedges
At 30 June 2014 At 30 June 2013 At 31 December 2013 Assets Liabilities Assets Liabilities Assets Liabilities US$m US$m US$m US$m US$m US$m
Foreign exchange ................................................ – 1 5 – 5 –Interest rate ......................................................... 620 3,263 560 3,412 1,163 2,889
620 3,264 565 3,412 1,168 2,889
Gains/(losses) arising from fair value hedges Half-year to
30 June 2014
30 June 2013
31 December 2013
US$m US$m US$m Gains/(losses):
– on hedging instruments ...................................................................................... (1,163) 1,398 599– on the hedged items attributable to the hedged risk .......................................... 1,185 (1,352) (580)
22 46 19
The gains and losses on ineffective portions of fair value hedges are recognised immediately in ‘Net trading income’.
Cash flow hedges
Fair value of derivatives designated as cash flow hedges
At 30 June 2014 At 30 June 2013 At 31 December 2013 Assets Liabilities Assets Liabilities Assets Liabilities US$m US$m US$m US$m US$m US$m
Foreign exchange ................................................ 1,993 499 1,852 402 2,257 439 Interest rate ......................................................... 1,477 1,452 1,160 1,513 1,131 1,208
3,470 1,951 3,012 1,915 3,388 1,647
The gains and losses on ineffective portions of derivatives designated as cash flow hedges are recognised immediately in ‘Net trading income’. During the period to 30 June 2014, a gain of US$15m was recognised due to hedge ineffectiveness (first half of 2013: gain of US$7m; second half of 2013: gain of US$15m).
Hedges of net investments in foreign operations
The Group applies hedge accounting in respect of certain consolidated net investments. Hedging is undertaken using forward foreign exchange contracts or by financing with currency borrowings.
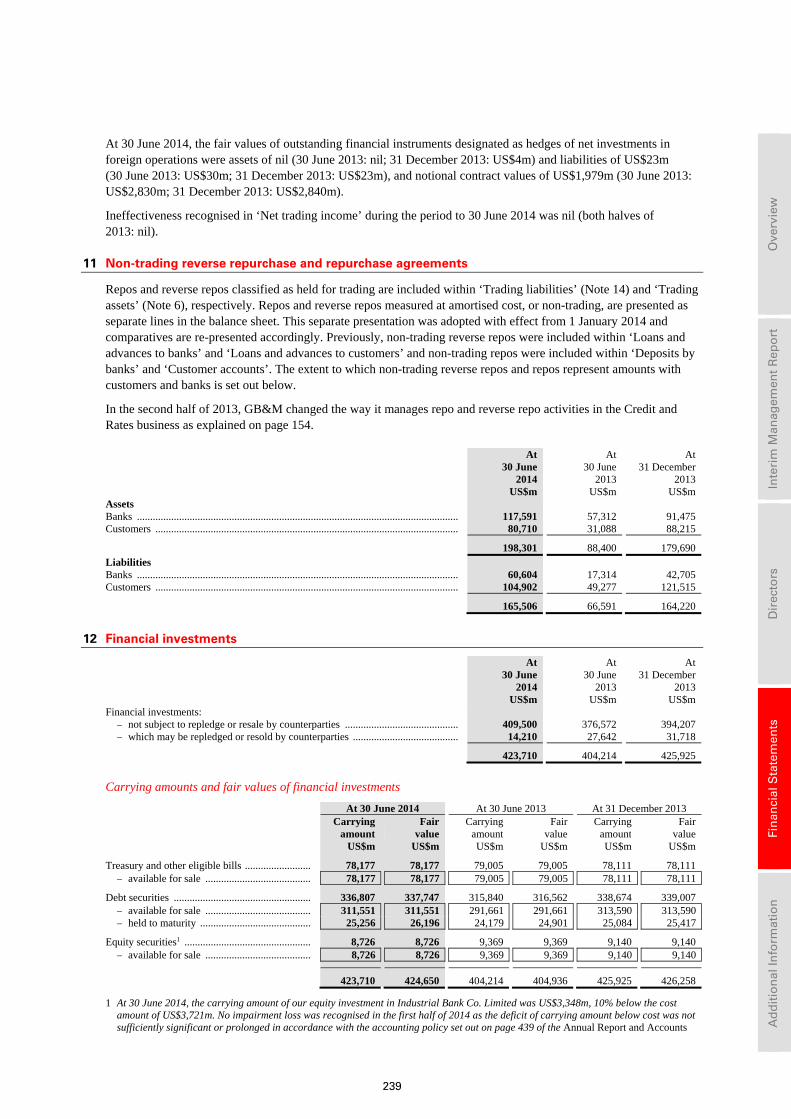
239
Ove
rvie
w
In
teri
m M
anag
emen
t R
epo
rt
D
irec
tors
Fin
anci
al S
tate
men
ts
A
dd
itio
nal
Info
rmat
ion
At 30 June 2014, the fair values of outstanding financial instruments designated as hedges of net investments in foreign operations were assets of nil (30 June 2013: nil; 31 December 2013: US$4m) and liabilities of US$23m (30 June 2013: US$30m; 31 December 2013: US$23m), and notional contract values of US$1,979m (30 June 2013: US$2,830m; 31 December 2013: US$2,840m).
Ineffectiveness recognised in ‘Net trading income’ during the period to 30 June 2014 was nil (both halves of 2013: nil).
11 Non-trading reverse repurchase and repurchase agreements
Repos and reverse repos classified as held for trading are included within ‘Trading liabilities’ (Note 14) and ‘Trading assets’ (Note 6), respectively. Repos and reverse repos measured at amortised cost, or non-trading, are presented as separate lines in the balance sheet. This separate presentation was adopted with effect from 1 January 2014 and comparatives are re-presented accordingly. Previously, non-trading reverse repos were included within ‘Loans and advances to banks’ and ‘Loans and advances to customers’ and non-trading repos were included within ‘Deposits by banks’ and ‘Customer accounts’. The extent to which non-trading reverse repos and repos represent amounts with customers and banks is set out below.
In the second half of 2013, GB&M changed the way it manages repo and reverse repo activities in the Credit and Rates business as explained on page 154.
At 30 June 2014
At 30 June
2013
At 31 December 2013
US$m US$m US$mAssets Banks .......................................................................................................................... 117,591 57,312 91,475Customers ................................................................................................................... 80,710 31,088 88,215
198,301 88,400 179,690Liabilities Banks .......................................................................................................................... 60,604 17,314 42,705Customers ................................................................................................................... 104,902 49,277 121,515
165,506 66,591 164,220
12 Financial investments
At 30 June 2014
At 30 June
2013
At 31 December 2013
US$m US$m US$mFinancial investments:
– not subject to repledge or resale by counterparties ........................................... 409,500 376,572 394,207– which may be repledged or resold by counterparties ........................................ 14,210 27,642 31,718
423,710 404,214 425,925
Carrying amounts and fair values of financial investments
At 30 June 2014 At 30 June 2013 At 31 December 2013 Carrying
amount Fair value
Carryingamount
Fair value
Carrying amount
Fair value
US$m US$m US$m US$m US$m US$m
Treasury and other eligible bills ......................... 78,177 78,177 79,005 79,005 78,111 78,111– available for sale ........................................ 78,177 78,177 79,005 79,005 78,111 78,111
Debt securities .................................................... 336,807 337,747 315,840 316,562 338,674 339,007– available for sale ........................................ 311,551 311,551 291,661 291,661 313,590 313,590– held to maturity .......................................... 25,256 26,196 24,179 24,901 25,084 25,417
Equity securities1 ................................................ 8,726 8,726 9,369 9,369 9,140 9,140– available for sale ........................................ 8,726 8,726 9,369 9,369 9,140 9,140
423,710 424,650 404,214 404,936 425,925 426,258
1 At 30 June 2014, the carrying amount of our equity investment in Industrial Bank Co. Limited was US$3,348m, 10% below the cost amount of US$3,721m. No impairment loss was recognised in the first half of 2014 as the deficit of carrying amount below cost was not sufficiently significant or prolonged in accordance with the accounting policy set out on page 439 of the Annual Report and Accounts
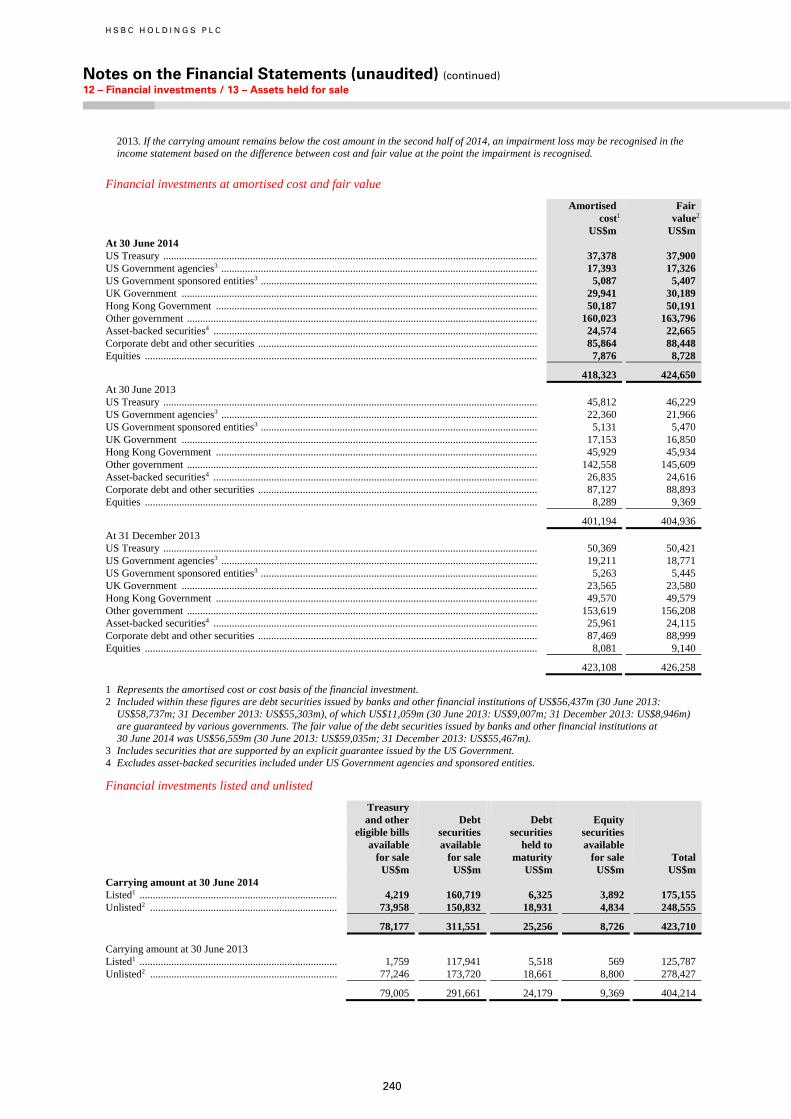
H S B C H O L D I N G S P L C
Notes on the Financial Statements (unaudited) (continued) 12 – Financial investments / 13 – Assets held for sale
240
2013. If the carrying amount remains below the cost amount in the second half of 2014, an impairment loss may be recognised in the income statement based on the difference between cost and fair value at the point the impairment is recognised.
Financial investments at amortised cost and fair value
Amortised cost1
Fair value2
US$m US$m At 30 June 2014 US Treasury .............................................................................................................................................. 37,378 37,900 US Government agencies3 ........................................................................................................................ 17,393 17,326 US Government sponsored entities3 ......................................................................................................... 5,087 5,407 UK Government ....................................................................................................................................... 29,941 30,189 Hong Kong Government .......................................................................................................................... 50,187 50,191 Other government ..................................................................................................................................... 160,023 163,796 Asset-backed securities4 ........................................................................................................................... 24,574 22,665 Corporate debt and other securities .......................................................................................................... 85,864 88,448 Equities ..................................................................................................................................................... 7,876 8,728
418,323 424,650 At 30 June 2013 US Treasury .............................................................................................................................................. 45,812 46,229US Government agencies3 ........................................................................................................................ 22,360 21,966 US Government sponsored entities3 ......................................................................................................... 5,131 5,470 UK Government ....................................................................................................................................... 17,153 16,850Hong Kong Government .......................................................................................................................... 45,929 45,934 Other government ..................................................................................................................................... 142,558 145,609 Asset-backed securities4 ........................................................................................................................... 26,835 24,616Corporate debt and other securities .......................................................................................................... 87,127 88,893 Equities ..................................................................................................................................................... 8,289 9,369
401,194 404,936 At 31 December 2013 US Treasury .............................................................................................................................................. 50,369 50,421 US Government agencies3 ........................................................................................................................ 19,211 18,771 US Government sponsored entities3 ......................................................................................................... 5,263 5,445UK Government ....................................................................................................................................... 23,565 23,580 Hong Kong Government .......................................................................................................................... 49,570 49,579 Other government ..................................................................................................................................... 153,619 156,208Asset-backed securities4 ........................................................................................................................... 25,961 24,115 Corporate debt and other securities .......................................................................................................... 87,469 88,999 Equities ..................................................................................................................................................... 8,081 9,140
423,108 426,258
1 Represents the amortised cost or cost basis of the financial investment. 2 Included within these figures are debt securities issued by banks and other financial institutions of US$56,437m (30 June 2013:
US$58,737m; 31 December 2013: US$55,303m), of which US$11,059m (30 June 2013: US$9,007m; 31 December 2013: US$8,946m) are guaranteed by various governments. The fair value of the debt securities issued by banks and other financial institutions at 30 June 2014 was US$56,559m (30 June 2013: US$59,035m; 31 December 2013: US$55,467m).
3 Includes securities that are supported by an explicit guarantee issued by the US Government. 4 Excludes asset-backed securities included under US Government agencies and sponsored entities.
Financial investments listed and unlisted
Treasury and other eligible bills available for sale
Debt securities available for sale
Debt securities held to maturity
Equity securities available for sale
Total US$m US$m US$m US$m US$m Carrying amount at 30 June 2014 Listed1 ........................................................................... 4,219 160,719 6,325 3,892 175,155 Unlisted2 ....................................................................... 73,958 150,832 18,931 4,834 248,555
78,177 311,551 25,256 8,726 423,710
Carrying amount at 30 June 2013 Listed1 ........................................................................... 1,759 117,941 5,518 569 125,787 Unlisted2 ....................................................................... 77,246 173,720 18,661 8,800 278,427
79,005 291,661 24,179 9,369 404,214
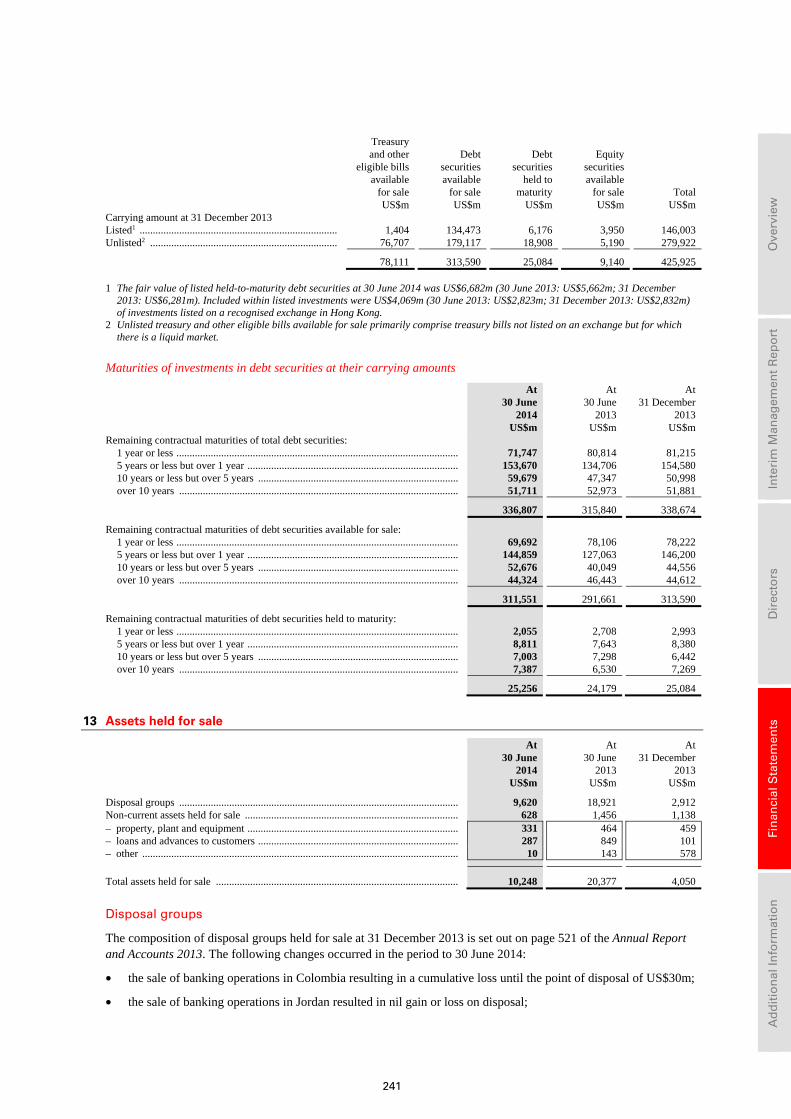
241
Ove
rvie
w
In
teri
m M
anag
emen
t R
epo
rt
D
irec
tors
Fin
anci
al S
tate
men
ts
A
dd
itio
nal
Info
rmat
ion
Treasury and other eligible bills available for sale
Debt securities available for sale
Debt securities held to maturity
Equity securities available for sale
Total US$m US$m US$m US$m US$mCarrying amount at 31 December 2013 Listed1 ........................................................................... 1,404 134,473 6,176 3,950 146,003 Unlisted2 ....................................................................... 76,707 179,117 18,908 5,190 279,922
78,111 313,590 25,084 9,140 425,925
1 The fair value of listed held-to-maturity debt securities at 30 June 2014 was US$6,682m (30 June 2013: US$5,662m; 31 December 2013: US$6,281m). Included within listed investments were US$4,069m (30 June 2013: US$2,823m; 31 December 2013: US$2,832m) of investments listed on a recognised exchange in Hong Kong.
2 Unlisted treasury and other eligible bills available for sale primarily comprise treasury bills not listed on an exchange but for which there is a liquid market.
Maturities of investments in debt securities at their carrying amounts
At 30 June 2014
At 30 June
2013
At 31 December 2013
US$m US$m US$m Remaining contractual maturities of total debt securities:
1 year or less ........................................................................................................... 71,747 80,814 81,2155 years or less but over 1 year ................................................................................ 153,670 134,706 154,58010 years or less but over 5 years ............................................................................ 59,679 47,347 50,998 over 10 years .......................................................................................................... 51,711 52,973 51,881
336,807 315,840 338,674
Remaining contractual maturities of debt securities available for sale: 1 year or less ........................................................................................................... 69,692 78,106 78,2225 years or less but over 1 year ................................................................................ 144,859 127,063 146,200 10 years or less but over 5 years ............................................................................ 52,676 40,049 44,556over 10 years .......................................................................................................... 44,324 46,443 44,612
311,551 291,661 313,590
Remaining contractual maturities of debt securities held to maturity: 1 year or less ........................................................................................................... 2,055 2,708 2,993 5 years or less but over 1 year ................................................................................ 8,811 7,643 8,38010 years or less but over 5 years ............................................................................ 7,003 7,298 6,442over 10 years .......................................................................................................... 7,387 6,530 7,269
25,256 24,179 25,084
13 Assets held for sale
At 30 June 2014
At 30 June
2013
At 31 December 2013
US$m US$m US$m
Disposal groups .......................................................................................................... 9,620 18,921 2,912Non-current assets held for sale ................................................................................. 628 1,456 1,138– property, plant and equipment ................................................................................ 331 464 459– loans and advances to customers ............................................................................ 287 849 101– other ........................................................................................................................ 10 143 578
Total assets held for sale ............................................................................................ 10,248 20,377 4,050
Disposal groups
The composition of disposal groups held for sale at 31 December 2013 is set out on page 521 of the Annual Report and Accounts 2013. The following changes occurred in the period to 30 June 2014:
• the sale of banking operations in Colombia resulting in a cumulative loss until the point of disposal of US$30m;
• the sale of banking operations in Jordan resulted in nil gain or loss on disposal;
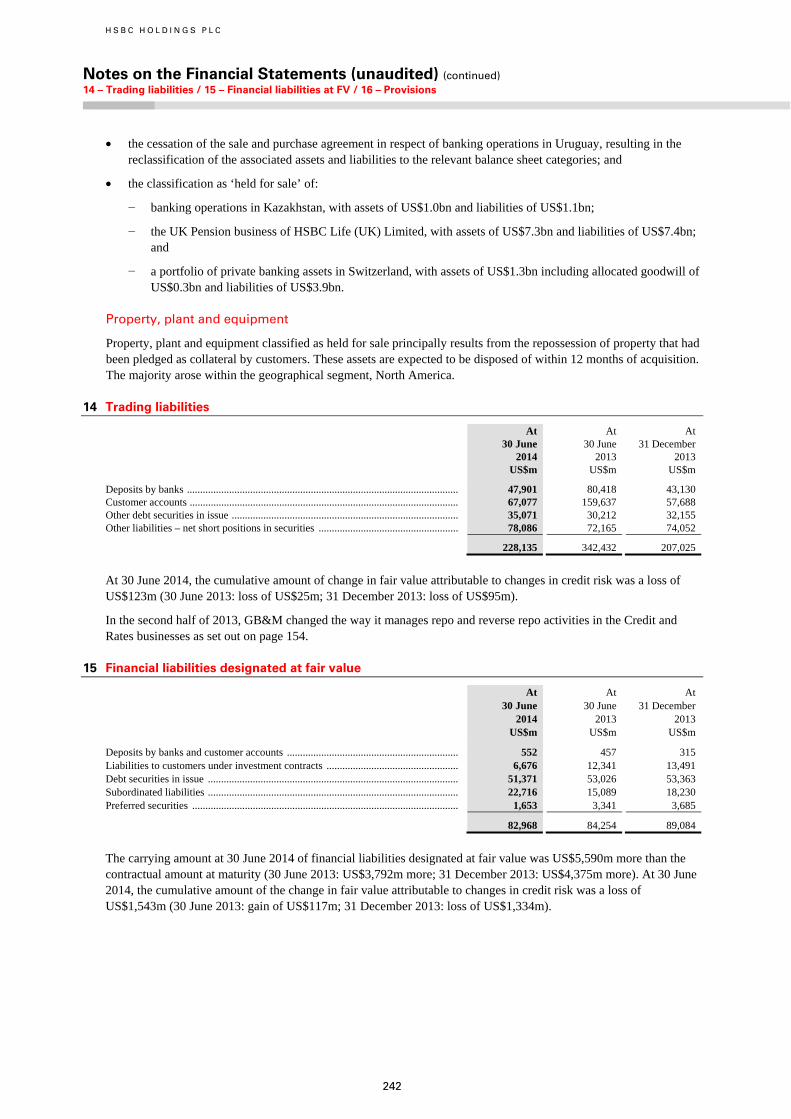
H S B C H O L D I N G S P L C
Notes on the Financial Statements (unaudited) (continued) 14 – Trading liabilities / 15 – Financial liabilities at FV / 16 – Provisions
242
• the cessation of the sale and purchase agreement in respect of banking operations in Uruguay, resulting in the reclassification of the associated assets and liabilities to the relevant balance sheet categories; and
• the classification as ‘held for sale’ of:
− banking operations in Kazakhstan, with assets of US$1.0bn and liabilities of US$1.1bn;
− the UK Pension business of HSBC Life (UK) Limited, with assets of US$7.3bn and liabilities of US$7.4bn; and
− a portfolio of private banking assets in Switzerland, with assets of US$1.3bn including allocated goodwill of US$0.3bn and liabilities of US$3.9bn.
Property, plant and equipment
Property, plant and equipment classified as held for sale principally results from the repossession of property that had been pledged as collateral by customers. These assets are expected to be disposed of within 12 months of acquisition. The majority arose within the geographical segment, North America.
14 Trading liabilities
At 30 June 2014
At 30 June 2013
At 31 December 2013
US$m US$m US$m
Deposits by banks ....................................................................................................... 47,901 80,418 43,130 Customer accounts ...................................................................................................... 67,077 159,637 57,688 Other debt securities in issue ...................................................................................... 35,071 30,212 32,155 Other liabilities – net short positions in securities ..................................................... 78,086 72,165 74,052
228,135 342,432 207,025
At 30 June 2014, the cumulative amount of change in fair value attributable to changes in credit risk was a loss of US$123m (30 June 2013: loss of US$25m; 31 December 2013: loss of US$95m).
In the second half of 2013, GB&M changed the way it manages repo and reverse repo activities in the Credit and Rates businesses as set out on page 154.
15 Financial liabilities designated at fair value
At 30 June 2014
At 30 June 2013
At 31 December 2013
US$m US$m US$m
Deposits by banks and customer accounts ................................................................. 552 457 315 Liabilities to customers under investment contracts .................................................. 6,676 12,341 13,491 Debt securities in issue ............................................................................................... 51,371 53,026 53,363 Subordinated liabilities ............................................................................................... 22,716 15,089 18,230 Preferred securities ..................................................................................................... 1,653 3,341 3,685
82,968 84,254 89,084
The carrying amount at 30 June 2014 of financial liabilities designated at fair value was US$5,590m more than the contractual amount at maturity (30 June 2013: US$3,792m more; 31 December 2013: US$4,375m more). At 30 June 2014, the cumulative amount of the change in fair value attributable to changes in credit risk was a loss of US$1,543m (30 June 2013: gain of US$117m; 31 December 2013: loss of US$1,334m).
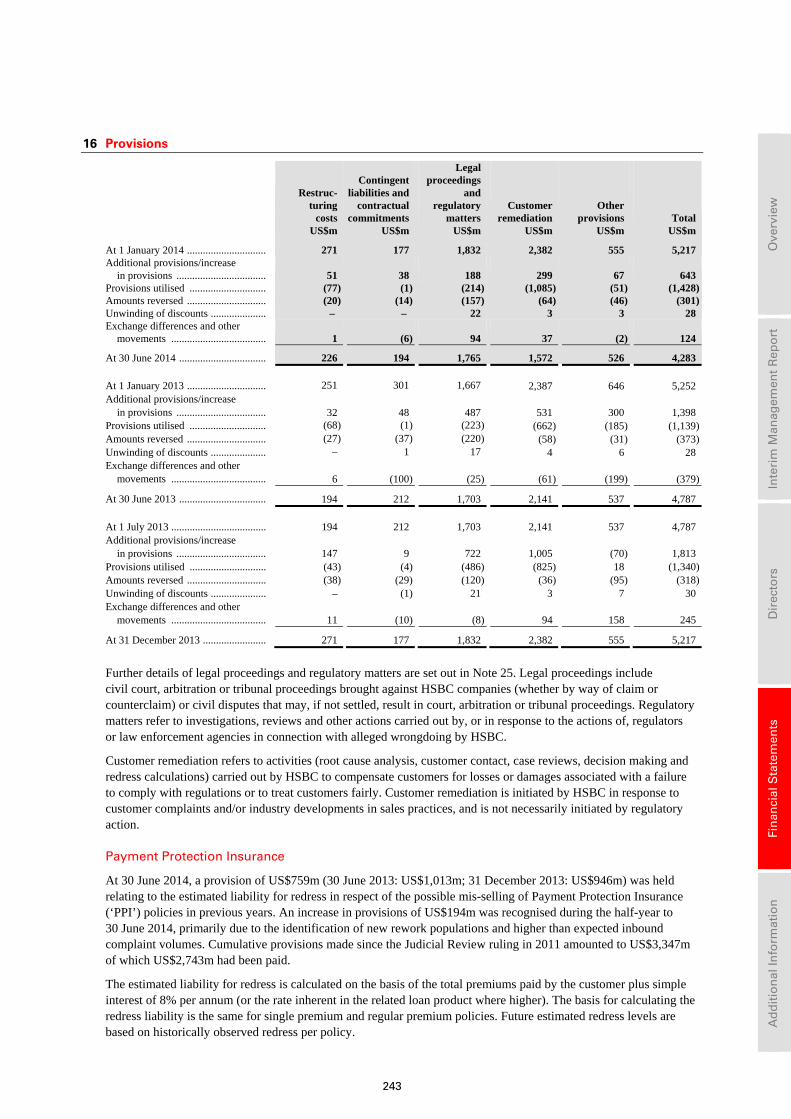
243
Ove
rvie
w
In
teri
m M
anag
emen
t R
epo
rt
D
irec
tors
Fin
anci
al S
tate
men
ts
A
dd
itio
nal
Info
rmat
ion
16 Provisions
Restruc-turing
costs
Contingentliabilities and
contractualcommitments
Legalproceedings
andregulatory
matters Customer
remediation Other
provisions Total US$m US$m US$m US$m US$m US$m
At 1 January 2014 .............................. 271 177 1,832 2,382 555 5,217 Additional provisions/increase
in provisions .................................. 51 38 188 299 67 643 Provisions utilised ............................. (77) (1) (214) (1,085) (51) (1,428)Amounts reversed .............................. (20) (14) (157) (64) (46) (301)Unwinding of discounts ..................... – – 22 3 3 28 Exchange differences and other
movements .................................... 1 (6) 94 37 (2) 124
At 30 June 2014 ................................. 226 194 1,765 1,572 526 4,283 At 1 January 2013 .............................. 251 301 1,667 2,387 646 5,252 Additional provisions/increase
in provisions .................................. 32 48 487 531 300 1,398 Provisions utilised ............................. (68) (1) (223) (662) (185) (1,139)Amounts reversed .............................. (27) (37) (220) (58) (31) (373)Unwinding of discounts ..................... – 1 17 4 6 28 Exchange differences and other
movements .................................... 6 (100) (25) (61) (199) (379)
At 30 June 2013 ................................. 194 212 1,703 2,141 537 4,787 At 1 July 2013 .................................... 194 212 1,703 2,141 537 4,787 Additional provisions/increase
in provisions .................................. 147 9 722 1,005 (70) 1,813 Provisions utilised ............................. (43) (4) (486) (825) 18 (1,340)Amounts reversed .............................. (38) (29) (120) (36) (95) (318)Unwinding of discounts ..................... – (1) 21 3 7 30 Exchange differences and other
movements .................................... 11 (10) (8) 94 158 245
At 31 December 2013 ........................ 271 177 1,832 2,382 555 5,217
Further details of legal proceedings and regulatory matters are set out in Note 25. Legal proceedings include civil court, arbitration or tribunal proceedings brought against HSBC companies (whether by way of claim or counterclaim) or civil disputes that may, if not settled, result in court, arbitration or tribunal proceedings. Regulatory matters refer to investigations, reviews and other actions carried out by, or in response to the actions of, regulators or law enforcement agencies in connection with alleged wrongdoing by HSBC.
Customer remediation refers to activities (root cause analysis, customer contact, case reviews, decision making and redress calculations) carried out by HSBC to compensate customers for losses or damages associated with a failure to comply with regulations or to treat customers fairly. Customer remediation is initiated by HSBC in response to customer complaints and/or industry developments in sales practices, and is not necessarily initiated by regulatory action.
Payment Protection Insurance
At 30 June 2014, a provision of US$759m (30 June 2013: US$1,013m; 31 December 2013: US$946m) was held relating to the estimated liability for redress in respect of the possible mis-selling of Payment Protection Insurance (‘PPI’) policies in previous years. An increase in provisions of US$194m was recognised during the half-year to 30 June 2014, primarily due to the identification of new rework populations and higher than expected inbound complaint volumes. Cumulative provisions made since the Judicial Review ruling in 2011 amounted to US$3,347m of which US$2,743m had been paid.
The estimated liability for redress is calculated on the basis of the total premiums paid by the customer plus simple interest of 8% per annum (or the rate inherent in the related loan product where higher). The basis for calculating the redress liability is the same for single premium and regular premium policies. Future estimated redress levels are based on historically observed redress per policy.
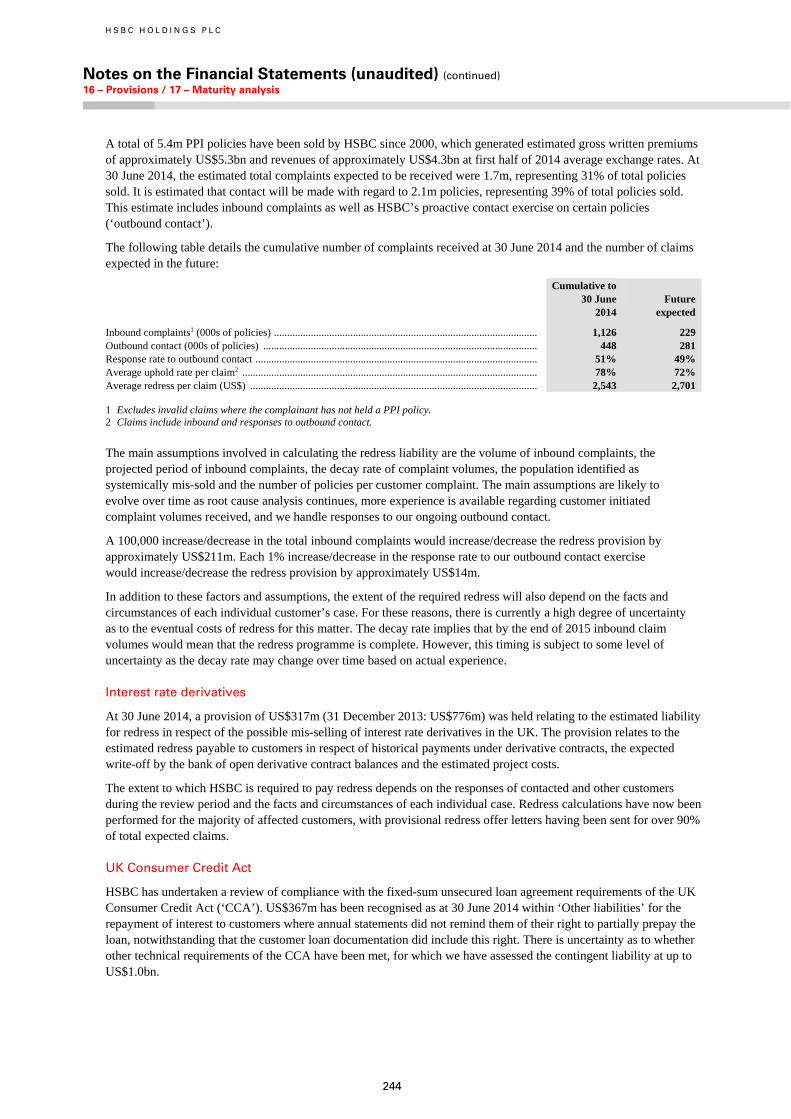
H S B C H O L D I N G S P L C
Notes on the Financial Statements (unaudited) (continued) 16 – Provisions / 17 – Maturity analysis
244
A total of 5.4m PPI policies have been sold by HSBC since 2000, which generated estimated gross written premiums of approximately US$5.3bn and revenues of approximately US$4.3bn at first half of 2014 average exchange rates. At 30 June 2014, the estimated total complaints expected to be received were 1.7m, representing 31% of total policies sold. It is estimated that contact will be made with regard to 2.1m policies, representing 39% of total policies sold. This estimate includes inbound complaints as well as HSBC’s proactive contact exercise on certain policies (‘outbound contact’).
The following table details the cumulative number of complaints received at 30 June 2014 and the number of claims expected in the future:
Cumulative to 30 June 2014
Future expected
Inbound complaints1 (000s of policies) .................................................................................................... 1,126 229 Outbound contact (000s of policies) ........................................................................................................ 448 281 Response rate to outbound contact ........................................................................................................... 51% 49% Average uphold rate per claim2 ................................................................................................................ 78% 72% Average redress per claim (US$) ............................................................................................................. 2,543 2,701
1 Excludes invalid claims where the complainant has not held a PPI policy. 2 Claims include inbound and responses to outbound contact.
The main assumptions involved in calculating the redress liability are the volume of inbound complaints, the projected period of inbound complaints, the decay rate of complaint volumes, the population identified as systemically mis-sold and the number of policies per customer complaint. The main assumptions are likely to evolve over time as root cause analysis continues, more experience is available regarding customer initiated complaint volumes received, and we handle responses to our ongoing outbound contact.
A 100,000 increase/decrease in the total inbound complaints would increase/decrease the redress provision by approximately US$211m. Each 1% increase/decrease in the response rate to our outbound contact exercise would increase/decrease the redress provision by approximately US$14m.
In addition to these factors and assumptions, the extent of the required redress will also depend on the facts and circumstances of each individual customer’s case. For these reasons, there is currently a high degree of uncertainty as to the eventual costs of redress for this matter. The decay rate implies that by the end of 2015 inbound claim volumes would mean that the redress programme is complete. However, this timing is subject to some level of uncertainty as the decay rate may change over time based on actual experience.
Interest rate derivatives
At 30 June 2014, a provision of US$317m (31 December 2013: US$776m) was held relating to the estimated liability for redress in respect of the possible mis-selling of interest rate derivatives in the UK. The provision relates to the estimated redress payable to customers in respect of historical payments under derivative contracts, the expected write-off by the bank of open derivative contract balances and the estimated project costs.
The extent to which HSBC is required to pay redress depends on the responses of contacted and other customers during the review period and the facts and circumstances of each individual case. Redress calculations have now been performed for the majority of affected customers, with provisional redress offer letters having been sent for over 90% of total expected claims.
UK Consumer Credit Act
HSBC has undertaken a review of compliance with the fixed-sum unsecured loan agreement requirements of the UK Consumer Credit Act (‘CCA’). US$367m has been recognised as at 30 June 2014 within ‘Other liabilities’ for the repayment of interest to customers where annual statements did not remind them of their right to partially prepay the loan, notwithstanding that the customer loan documentation did include this right. There is uncertainty as to whether other technical requirements of the CCA have been met, for which we have assessed the contingent liability at up to US$1.0bn.
245
Ove
rvie
w
In
teri
m M
anag
emen
t R
epo
rt
D
irec
tors
Fin
anci
al S
tate
men
ts
A
dd
itio
nal
Info
rmat
ion
Brazilian labour, civil and fiscal claims
Within ‘Legal proceedings and regulatory matters’ in the table on page 243 are labour, civil and fiscal litigation provisions of US$404m (30 June 2013: US$484m; 31 December 2013: US$500m). Of these provisions, US$256m (30 June 2013: US$255m; 31 December 2013: US$232m) was in respect of labour and overtime litigation claims brought by past employees against HSBC operations in Brazil following their departure from the bank. The main assumptions involved in estimating the liability are the expected number of departing employees, individual salary levels and the facts and circumstances of each individual case.
17 Maturity analysis of assets, liabilities and off-balance sheet commitments
The table on page 246 provides an analysis of consolidated total assets, liabilities and off-balance sheet commitments by residual contractual maturity at the balance sheet date. Asset and liability balances are included in the maturity analysis as follows:
• except for reverse repos, repos and debt securities in issue, trading assets and liabilities (including trading derivatives) are included in the ‘Due less than one month’ time bucket, and not by contractual maturity, because trading balances are typically held for short periods of time;
• financial assets and liabilities with no contractual maturity (such as equity securities) are included in the ‘Due over five years’ time bucket. Undated or perpetual instruments are classified on the basis of the contractual notice period which the counterparty of the instrument is entitled to give. Where there is no contractual notice period, undated or perpetual contracts are included in the ‘Due over five years’ time bucket;
• non-financial assets and liabilities with no contractual maturity (such as property, plant and equipment, goodwill and intangible assets, current and deferred tax assets and liabilities and retirement benefit liabilities) are included in the ‘Due over five years’ time bucket;
• financial instruments included within assets and liabilities of disposal groups held for sale are classified on the basis of the contractual maturity of the underlying instruments and not on the basis of the disposal transaction; and
• liabilities under insurance contracts are included in the ‘Due over five years’ time bucket. Liabilities under investment contracts are classified in accordance with their contractual maturity. Undated investment contracts are classified on the basis of the contractual notice period investors are entitled to give. Where there is no contractual notice period, undated contracts are included in the ‘Due over five years’ time bucket.
Loan and other credit-related commitments are classified on the basis of the earliest date they can be drawn down.
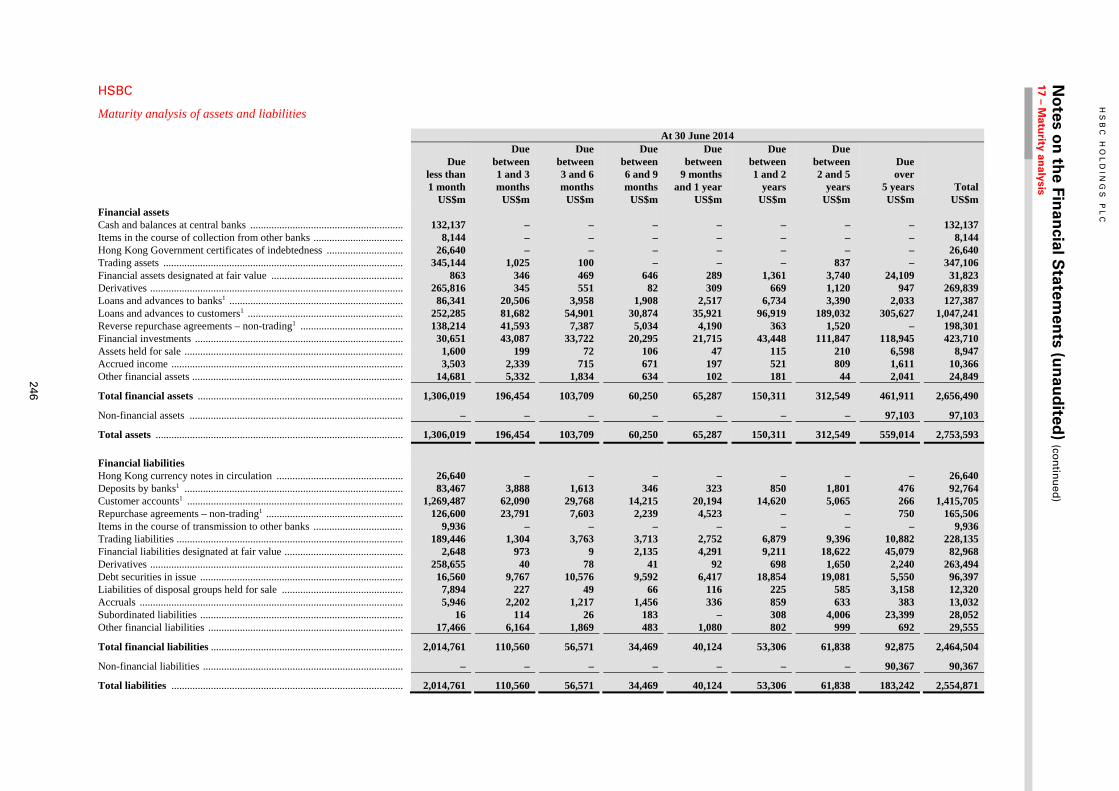
246
HS
BC
HO
LD
ING
S P
LC
N
otes o
n th
e Finan
cial Statem
ents (u
nau
dited
) (con
tinu
ed)
17 – Matu
rity analysis
HSBC
Maturity analysis of assets and liabilities
At 30 June 2014
Due less than 1 month
Due between 1 and 3 months
Due between 3 and 6 months
Due between 6 and 9 months
Due between 9 months and 1 year
Due between 1 and 2 years
Due between 2 and 5 years
Due over 5 years Total
US$m US$m US$m US$m US$m US$m US$m US$m US$m Financial assets Cash and balances at central banks .......................................................... 132,137 – – – – – – – 132,137 Items in the course of collection from other banks .................................. 8,144 – – – – – – – 8,144 Hong Kong Government certificates of indebtedness ............................. 26,640 – – – – – – – 26,640 Trading assets ........................................................................................... 345,144 1,025 100 – – – 837 – 347,106 Financial assets designated at fair value .................................................. 863 346 469 646 289 1,361 3,740 24,109 31,823 Derivatives ................................................................................................ 265,816 345 551 82 309 669 1,120 947 269,839 Loans and advances to banks1 .................................................................. 86,341 20,506 3,958 1,908 2,517 6,734 3,390 2,033 127,387 Loans and advances to customers1 ........................................................... 252,285 81,682 54,901 30,874 35,921 96,919 189,032 305,627 1,047,241 Reverse repurchase agreements – non-trading1 ....................................... 138,214 41,593 7,387 5,034 4,190 363 1,520 – 198,301 Financial investments ............................................................................... 30,651 43,087 33,722 20,295 21,715 43,448 111,847 118,945 423,710 Assets held for sale ................................................................................... 1,600 199 72 106 47 115 210 6,598 8,947 Accrued income ........................................................................................ 3,503 2,339 715 671 197 521 809 1,611 10,366 Other financial assets ................................................................................ 14,681 5,332 1,834 634 102 181 44 2,041 24,849
Total financial assets .............................................................................. 1,306,019 196,454 103,709 60,250 65,287 150,311 312,549 461,911 2,656,490
Non-financial assets ................................................................................. – – – – – – – 97,103 97,103
Total assets .............................................................................................. 1,306,019 196,454 103,709 60,250 65,287 150,311 312,549 559,014 2,753,593
Financial liabilities Hong Kong currency notes in circulation ................................................ 26,640 – – – – – – – 26,640 Deposits by banks1 ................................................................................... 83,467 3,888 1,613 346 323 850 1,801 476 92,764 Customer accounts1 .................................................................................. 1,269,487 62,090 29,768 14,215 20,194 14,620 5,065 266 1,415,705 Repurchase agreements – non-trading1 .................................................... 126,600 23,791 7,603 2,239 4,523 – – 750 165,506 Items in the course of transmission to other banks .................................. 9,936 – – – – – – – 9,936 Trading liabilities ...................................................................................... 189,446 1,304 3,763 3,713 2,752 6,879 9,396 10,882 228,135 Financial liabilities designated at fair value ............................................. 2,648 973 9 2,135 4,291 9,211 18,622 45,079 82,968 Derivatives ................................................................................................ 258,655 40 78 41 92 698 1,650 2,240 263,494 Debt securities in issue ............................................................................. 16,560 9,767 10,576 9,592 6,417 18,854 19,081 5,550 96,397 Liabilities of disposal groups held for sale .............................................. 7,894 227 49 66 116 225 585 3,158 12,320 Accruals .................................................................................................... 5,946 2,202 1,217 1,456 336 859 633 383 13,032 Subordinated liabilities ............................................................................. 16 114 26 183 – 308 4,006 23,399 28,052 Other financial liabilities .......................................................................... 17,466 6,164 1,869 483 1,080 802 999 692 29,555
Total financial liabilities ......................................................................... 2,014,761 110,560 56,571 34,469 40,124 53,306 61,838 92,875 2,464,504
Non-financial liabilities ............................................................................ – – – – – – – 90,367 90,367
Total liabilities ........................................................................................ 2,014,761 110,560 56,571 34,469 40,124 53,306 61,838 183,242 2,554,871
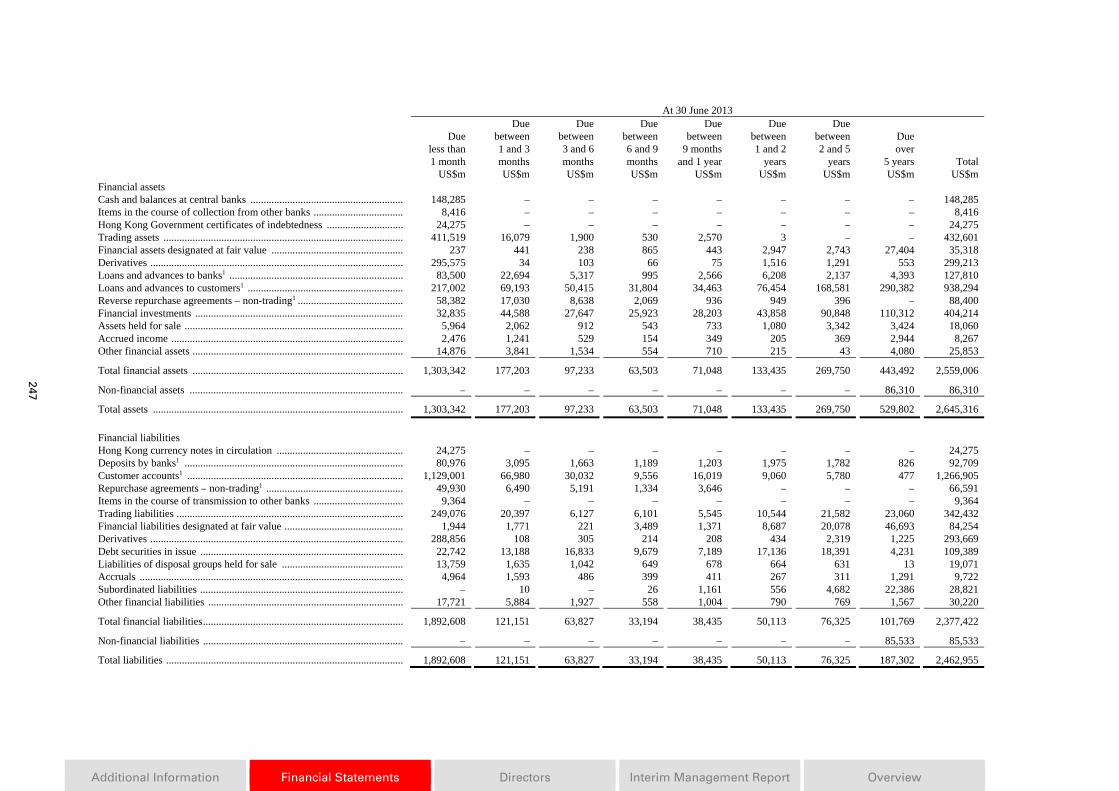
247
Additional Information Financial Statements Directors Interim Management Report Overview
At 30 June 2013
Due less than
1 month
Due between 1 and 3
months
Due between 3 and 6
months
Due between 6 and 9
months
Due between 9 months
and 1 year
Due between 1 and 2
years
Due between 2 and 5
years
Due over
5 years TotalUS$m US$m US$m US$m US$m US$m US$m US$m US$m
Financial assetsCash and balances at central banks .......................................................... 148,285 – – – – – – – 148,285Items in the course of collection from other banks .................................. 8,416 – – – – – – – 8,416 Hong Kong Government certificates of indebtedness ............................. 24,275 – – – – – – – 24,275Trading assets ........................................................................................... 411,519 16,079 1,900 530 2,570 3 – – 432,601Financial assets designated at fair value .................................................. 237 441 238 865 443 2,947 2,743 27,404 35,318 Derivatives ................................................................................................ 295,575 34 103 66 75 1,516 1,291 553 299,213Loans and advances to banks1 .................................................................. 83,500 22,694 5,317 995 2,566 6,208 2,137 4,393 127,810Loans and advances to customers1 ........................................................... 217,002 69,193 50,415 31,804 34,463 76,454 168,581 290,382 938,294 Reverse repurchase agreements – non-trading1 ........................................ 58,382 17,030 8,638 2,069 936 949 396 – 88,400Financial investments ............................................................................... 32,835 44,588 27,647 25,923 28,203 43,858 90,848 110,312 404,214Assets held for sale ................................................................................... 5,964 2,062 912 543 733 1,080 3,342 3,424 18,060 Accrued income ........................................................................................ 2,476 1,241 529 154 349 205 369 2,944 8,267Other financial assets ................................................................................ 14,876 3,841 1,534 554 710 215 43 4,080 25,853
Total financial assets ................................................................................ 1,303,342 177,203 97,233 63,503 71,048 133,435 269,750 443,492 2,559,006
Non-financial assets ................................................................................. – – – – – – – 86,310 86,310
Total assets ............................................................................................... 1,303,342 177,203 97,233 63,503 71,048 133,435 269,750 529,802 2,645,316
Financial liabilitiesHong Kong currency notes in circulation ................................................ 24,275 – – – – – – – 24,275Deposits by banks1 ................................................................................... 80,976 3,095 1,663 1,189 1,203 1,975 1,782 826 92,709 Customer accounts1 .................................................................................. 1,129,001 66,980 30,032 9,556 16,019 9,060 5,780 477 1,266,905Repurchase agreements – non-trading1 .................................................... 49,930 6,490 5,191 1,334 3,646 – – – 66,591Items in the course of transmission to other banks .................................. 9,364 – – – – – – – 9,364 Trading liabilities ...................................................................................... 249,076 20,397 6,127 6,101 5,545 10,544 21,582 23,060 342,432Financial liabilities designated at fair value ............................................. 1,944 1,771 221 3,489 1,371 8,687 20,078 46,693 84,254Derivatives ................................................................................................ 288,856 108 305 214 208 434 2,319 1,225 293,669 Debt securities in issue ............................................................................. 22,742 13,188 16,833 9,679 7,189 17,136 18,391 4,231 109,389Liabilities of disposal groups held for sale .............................................. 13,759 1,635 1,042 649 678 664 631 13 19,071Accruals .................................................................................................... 4,964 1,593 486 399 411 267 311 1,291 9,722 Subordinated liabilities ............................................................................. – 10 – 26 1,161 556 4,682 22,386 28,821Other financial liabilities .......................................................................... 17,721 5,884 1,927 558 1,004 790 769 1,567 30,220
Total financial liabilities ............................................................................ 1,892,608 121,151 63,827 33,194 38,435 50,113 76,325 101,769 2,377,422
Non-financial liabilities ............................................................................ – – – – – – – 85,533 85,533
Total liabilities .......................................................................................... 1,892,608 121,151 63,827 33,194 38,435 50,113 76,325 187,302 2,462,955
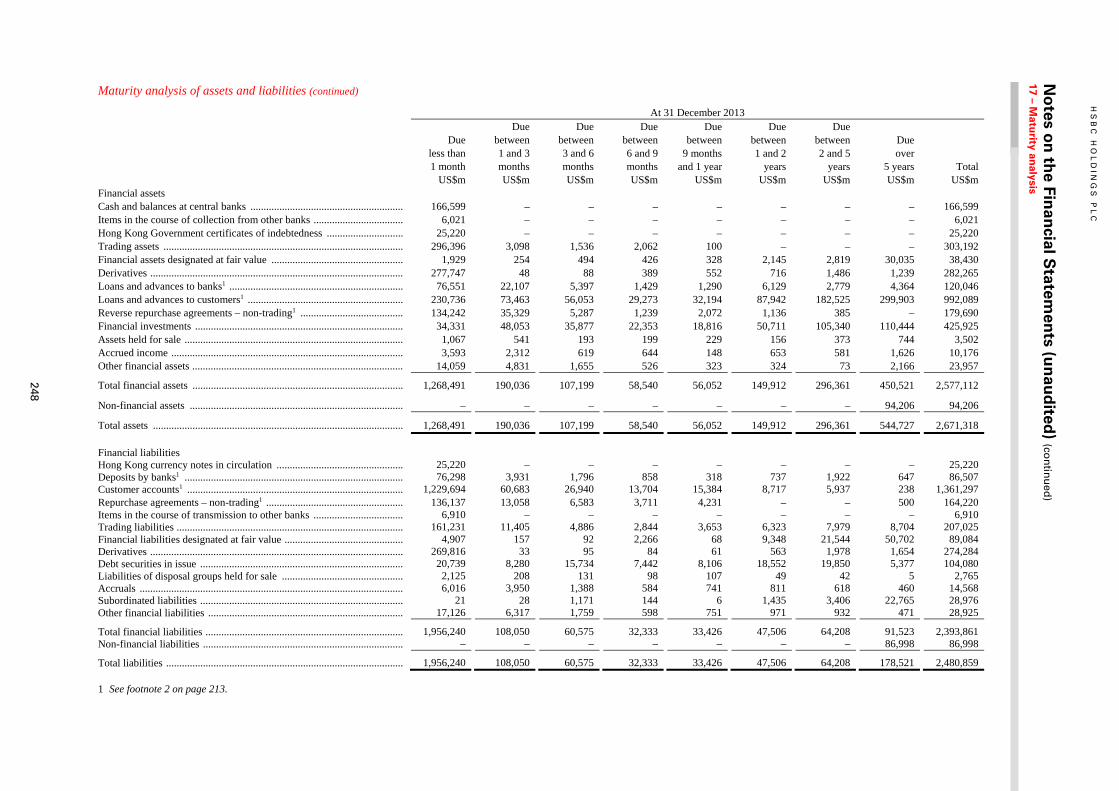
HS
BC
HO
LD
ING
S P
LC
N
otes o
n th
e Finan
cial Statem
ents (u
nau
dited
) (con
tinu
ed)
17 – Matu
rity analysis
248
Maturity analysis of assets and liabilities (continued)
At 31 December 2013
Due less than 1 month
Due between 1 and 3 months
Due between 3 and 6 months
Due between 6 and 9 months
Due between 9 months and 1 year
Due between 1 and 2 years
Due between 2 and 5 years
Due over 5 years Total
US$m US$m US$m US$m US$m US$m US$m US$m US$m Financial assets Cash and balances at central banks .......................................................... 166,599 – – – – – – – 166,599 Items in the course of collection from other banks .................................. 6,021 – – – – – – – 6,021 Hong Kong Government certificates of indebtedness ............................. 25,220 – – – – – – – 25,220 Trading assets ........................................................................................... 296,396 3,098 1,536 2,062 100 – – – 303,192 Financial assets designated at fair value .................................................. 1,929 254 494 426 328 2,145 2,819 30,035 38,430 Derivatives ................................................................................................ 277,747 48 88 389 552 716 1,486 1,239 282,265 Loans and advances to banks1 .................................................................. 76,551 22,107 5,397 1,429 1,290 6,129 2,779 4,364 120,046 Loans and advances to customers1 ........................................................... 230,736 73,463 56,053 29,273 32,194 87,942 182,525 299,903 992,089 Reverse repurchase agreements – non-trading1 ....................................... 134,242 35,329 5,287 1,239 2,072 1,136 385 – 179,690 Financial investments ............................................................................... 34,331 48,053 35,877 22,353 18,816 50,711 105,340 110,444 425,925 Assets held for sale ................................................................................... 1,067 541 193 199 229 156 373 744 3,502 Accrued income ........................................................................................ 3,593 2,312 619 644 148 653 581 1,626 10,176 Other financial assets ................................................................................ 14,059 4,831 1,655 526 323 324 73 2,166 23,957
Total financial assets ................................................................................ 1,268,491 190,036 107,199 58,540 56,052 149,912 296,361 450,521 2,577,112
Non-financial assets ................................................................................. – – – – – – – 94,206 94,206
Total assets ............................................................................................... 1,268,491 190,036 107,199 58,540 56,052 149,912 296,361 544,727 2,671,318
Financial liabilitiesHong Kong currency notes in circulation ................................................ 25,220 – – – – – – – 25,220 Deposits by banks1 ................................................................................... 76,298 3,931 1,796 858 318 737 1,922 647 86,507 Customer accounts1 .................................................................................. 1,229,694 60,683 26,940 13,704 15,384 8,717 5,937 238 1,361,297 Repurchase agreements – non-trading1 .................................................... 136,137 13,058 6,583 3,711 4,231 – – 500 164,220 Items in the course of transmission to other banks .................................. 6,910 – – – – – – – 6,910 Trading liabilities ...................................................................................... 161,231 11,405 4,886 2,844 3,653 6,323 7,979 8,704 207,025 Financial liabilities designated at fair value ............................................. 4,907 157 92 2,266 68 9,348 21,544 50,702 89,084 Derivatives ................................................................................................ 269,816 33 95 84 61 563 1,978 1,654 274,284 Debt securities in issue ............................................................................. 20,739 8,280 15,734 7,442 8,106 18,552 19,850 5,377 104,080 Liabilities of disposal groups held for sale .............................................. 2,125 208 131 98 107 49 42 5 2,765 Accruals .................................................................................................... 6,016 3,950 1,388 584 741 811 618 460 14,568 Subordinated liabilities ............................................................................. 21 28 1,171 144 6 1,435 3,406 22,765 28,976 Other financial liabilities .......................................................................... 17,126 6,317 1,759 598 751 971 932 471 28,925
Total financial liabilities ........................................................................... 1,956,240 108,050 60,575 32,333 33,426 47,506 64,208 91,523 2,393,861 Non-financial liabilities ............................................................................ – – – – – – – 86,998 86,998
Total liabilities .......................................................................................... 1,956,240 108,050 60,575 32,333 33,426 47,506 64,208 178,521 2,480,859
1 See footnote 2 on page 213.
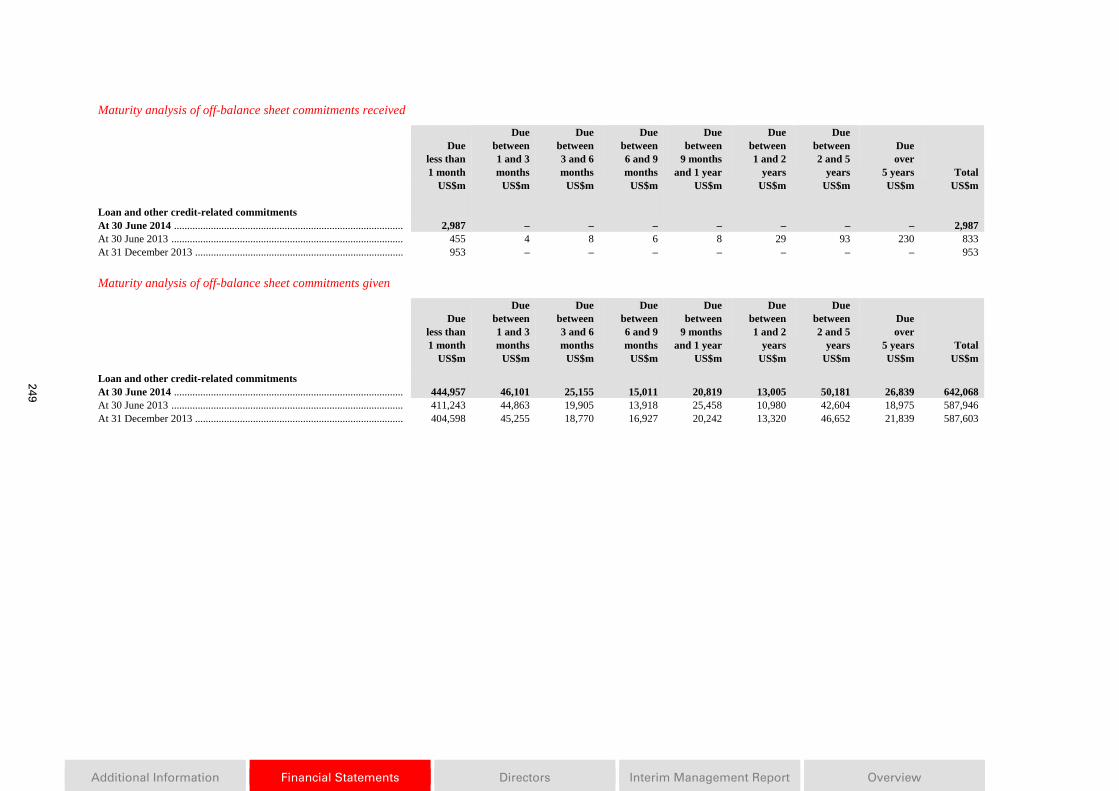
Additional Information Financial Statements Directors Interim Management Report Overview
249
Maturity analysis of off-balance sheet commitments received
Due less than 1 month
Due between 1 and 3 months
Due between 3 and 6 months
Due between 6 and 9 months
Due between 9 months and 1 year
Due between 1 and 2 years
Due between 2 and 5 years
Due over 5 years Total
US$m US$m US$m US$m US$m US$m US$m US$m US$m Loan and other credit-related commitments At 30 June 2014 ....................................................................................... 2,987 – – – – – – – 2,987 At 30 June 2013 ........................................................................................ 455 4 8 6 8 29 93 230 833 At 31 December 2013 ............................................................................... 953 – – – – – – – 953
Maturity analysis of off-balance sheet commitments given
Due less than 1 month
Due between 1 and 3 months
Due between 3 and 6 months
Due between 6 and 9 months
Due between 9 months and 1 year
Due between 1 and 2 years
Due between 2 and 5 years
Due over 5 years Total
US$m US$m US$m US$m US$m US$m US$m US$m US$m
Loan and other credit-related commitments At 30 June 2014 ....................................................................................... 444,957 46,101 25,155 15,011 20,819 13,005 50,181 26,839 642,068 At 30 June 2013 ........................................................................................ 411,243 44,863 19,905 13,918 25,458 10,980 42,604 18,975 587,946 At 31 December 2013 ............................................................................... 404,598 45,255 18,770 16,927 20,242 13,320 46,652 21,839 587,603
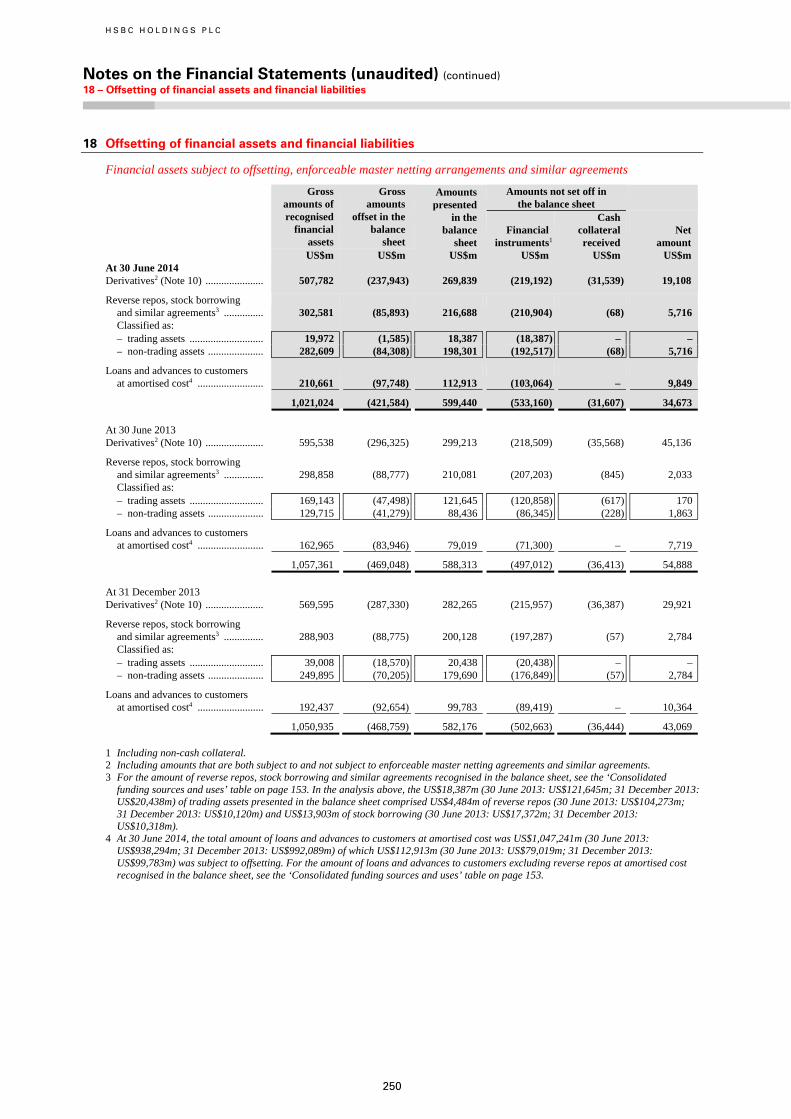
H S B C H O L D I N G S P L C
Notes on the Financial Statements (unaudited) (continued) 18 – Offsetting of financial assets and financial liabilities
250
18 Offsetting of financial assets and financial liabilities
Financial assets subject to offsetting, enforceable master netting arrangements and similar agreements
Gross
amounts ofrecognised
financialassets
Grossamounts
offset in thebalance
sheet
Amountspresented
in thebalance
sheet
Amounts not set off in the balance sheet
Financial
instruments1
Cash collateral
received Net
amount US$m US$m US$m US$m US$m US$m At 30 June 2014 Derivatives2 (Note 10) ...................... 507,782 (237,943) 269,839 (219,192) (31,539) 19,108
Reverse repos, stock borrowing and similar agreements3 ............... 302,581 (85,893) 216,688 (210,904) (68) 5,716 Classified as: – trading assets ............................ 19,972 (1,585) 18,387 (18,387) – –– non-trading assets ..................... 282,609 (84,308) 198,301 (192,517) (68) 5,716
Loans and advances to customers at amortised cost4 ......................... 210,661 (97,748) 112,913 (103,064) – 9,849
1,021,024 (421,584) 599,440 (533,160) (31,607) 34,673 At 30 June 2013 Derivatives2 (Note 10) ...................... 595,538 (296,325) 299,213 (218,509) (35,568) 45,136
Reverse repos, stock borrowing and similar agreements3 ............... 298,858 (88,777) 210,081 (207,203) (845) 2,033 Classified as: – trading assets ............................ 169,143 (47,498) 121,645 (120,858) (617) 170 – non-trading assets ..................... 129,715 (41,279) 88,436 (86,345) (228) 1,863
Loans and advances to customers at amortised cost4 ......................... 162,965 (83,946) 79,019 (71,300) – 7,719
1,057,361 (469,048) 588,313 (497,012) (36,413) 54,888 At 31 December 2013 Derivatives2 (Note 10) ...................... 569,595 (287,330) 282,265 (215,957) (36,387) 29,921
Reverse repos, stock borrowing and similar agreements3 ............... 288,903 (88,775) 200,128 (197,287) (57) 2,784 Classified as: – trading assets ............................ 39,008 (18,570) 20,438 (20,438) – –– non-trading assets ..................... 249,895 (70,205) 179,690 (176,849) (57) 2,784
Loans and advances to customers at amortised cost4 ......................... 192,437 (92,654) 99,783 (89,419) – 10,364
1,050,935 (468,759) 582,176 (502,663) (36,444) 43,069
1 Including non-cash collateral. 2 Including amounts that are both subject to and not subject to enforceable master netting agreements and similar agreements. 3 For the amount of reverse repos, stock borrowing and similar agreements recognised in the balance sheet, see the ‘Consolidated
funding sources and uses’ table on page 153. In the analysis above, the US$18,387m (30 June 2013: US$121,645m; 31 December 2013: US$20,438m) of trading assets presented in the balance sheet comprised US$4,484m of reverse repos (30 June 2013: US$104,273m; 31 December 2013: US$10,120m) and US$13,903m of stock borrowing (30 June 2013: US$17,372m; 31 December 2013: US$10,318m).
4 At 30 June 2014, the total amount of loans and advances to customers at amortised cost was US$1,047,241m (30 June 2013: US$938,294m; 31 December 2013: US$992,089m) of which US$112,913m (30 June 2013: US$79,019m; 31 December 2013: US$99,783m) was subject to offsetting. For the amount of loans and advances to customers excluding reverse repos at amortised cost recognised in the balance sheet, see the ‘Consolidated funding sources and uses’ table on page 153.
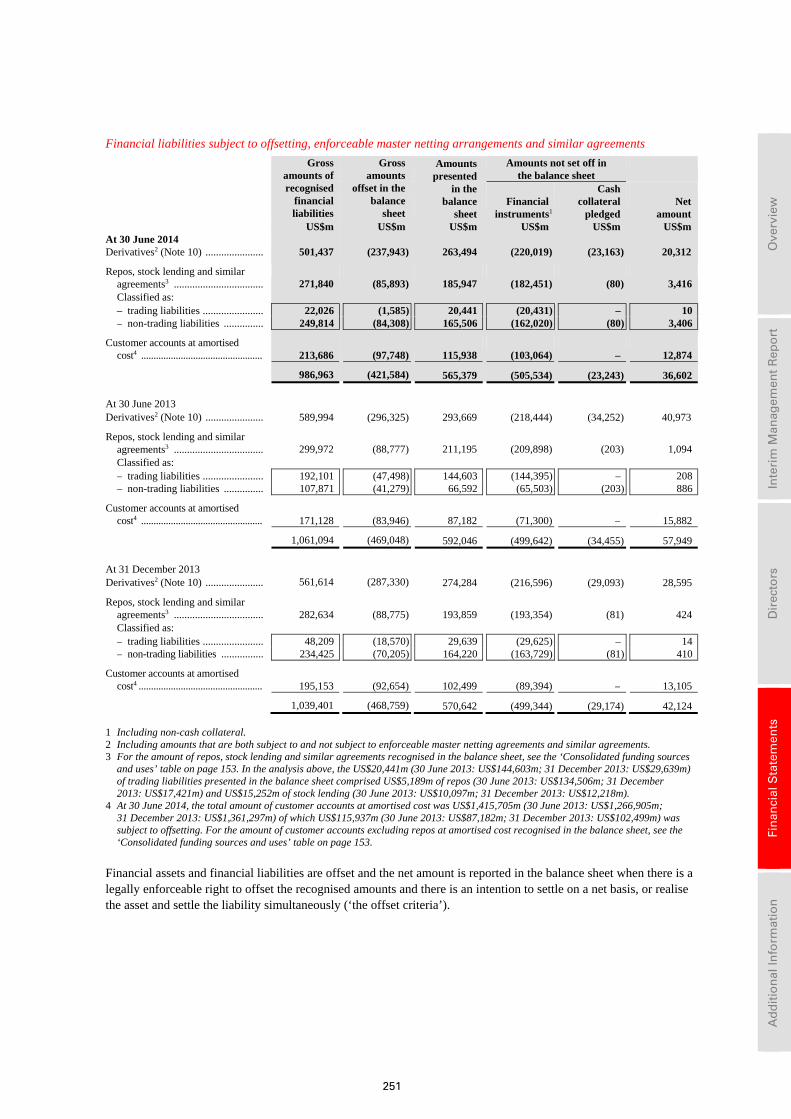
251
Ove
rvie
w
In
teri
m M
anag
emen
t R
epo
rt
D
irec
tors
Fin
anci
al S
tate
men
ts
A
dd
itio
nal
Info
rmat
ion
Financial liabilities subject to offsetting, enforceable master netting arrangements and similar agreements
Gross
amounts ofrecognised
financialliabilities
Grossamounts
offset in thebalance
sheet
Amountspresented
in thebalance
sheet
Amounts not set off in the balance sheet
Financial
instruments1
Cash collateral
pledged Net
amount US$m US$m US$m US$m US$m US$m At 30 June 2014 Derivatives2 (Note 10) ...................... 501,437 (237,943) 263,494 (220,019) (23,163) 20,312
Repos, stock lending and similar agreements3 .................................. 271,840 (85,893) 185,947 (182,451) (80) 3,416 Classified as: – trading liabilities ....................... 22,026 (1,585) 20,441 (20,431) – 10 – non-trading liabilities ............... 249,814 (84,308) 165,506 (162,020) (80) 3,406
Customer accounts at amortised cost4 ................................................. 213,686 (97,748) 115,938 (103,064) – 12,874
986,963 (421,584) 565,379 (505,534) (23,243) 36,602
At 30 June 2013 Derivatives2 (Note 10) ...................... 589,994 (296,325) 293,669 (218,444) (34,252) 40,973
Repos, stock lending and similar agreements3 .................................. 299,972 (88,777) 211,195 (209,898) (203) 1,094 Classified as: – trading liabilities ....................... 192,101 (47,498) 144,603 (144,395) – 208 – non-trading liabilities ............... 107,871 (41,279) 66,592 (65,503) (203) 886
Customer accounts at amortised cost4 ................................................. 171,128 (83,946) 87,182 (71,300) – 15,882
1,061,094 (469,048) 592,046 (499,642) (34,455) 57,949
At 31 December 2013 Derivatives2 (Note 10) ...................... 561,614 (287,330) 274,284 (216,596) (29,093) 28,595
Repos, stock lending and similar agreements3 .................................. 282,634 (88,775) 193,859 (193,354) (81) 424 Classified as: – trading liabilities ....................... 48,209 (18,570) 29,639 (29,625) – 14 – non-trading liabilities ................ 234,425 (70,205) 164,220 (163,729) (81) 410
Customer accounts at amortised cost4 .................................................. 195,153 (92,654) 102,499 (89,394) – 13,105
1,039,401 (468,759) 570,642 (499,344) (29,174) 42,124
1 Including non-cash collateral. 2 Including amounts that are both subject to and not subject to enforceable master netting agreements and similar agreements. 3 For the amount of repos, stock lending and similar agreements recognised in the balance sheet, see the ‘Consolidated funding sources
and uses’ table on page 153. In the analysis above, the US$20,441m (30 June 2013: US$144,603m; 31 December 2013: US$29,639m) of trading liabilities presented in the balance sheet comprised US$5,189m of repos (30 June 2013: US$134,506m; 31 December 2013: US$17,421m) and US$15,252m of stock lending (30 June 2013: US$10,097m; 31 December 2013: US$12,218m).
4 At 30 June 2014, the total amount of customer accounts at amortised cost was US$1,415,705m (30 June 2013: US$1,266,905m; 31 December 2013: US$1,361,297m) of which US$115,937m (30 June 2013: US$87,182m; 31 December 2013: US$102,499m) was subject to offsetting. For the amount of customer accounts excluding repos at amortised cost recognised in the balance sheet, see the ‘Consolidated funding sources and uses’ table on page 153.
Financial assets and financial liabilities are offset and the net amount is reported in the balance sheet when there is a legally enforceable right to offset the recognised amounts and there is an intention to settle on a net basis, or realise the asset and settle the liability simultaneously (‘the offset criteria’).
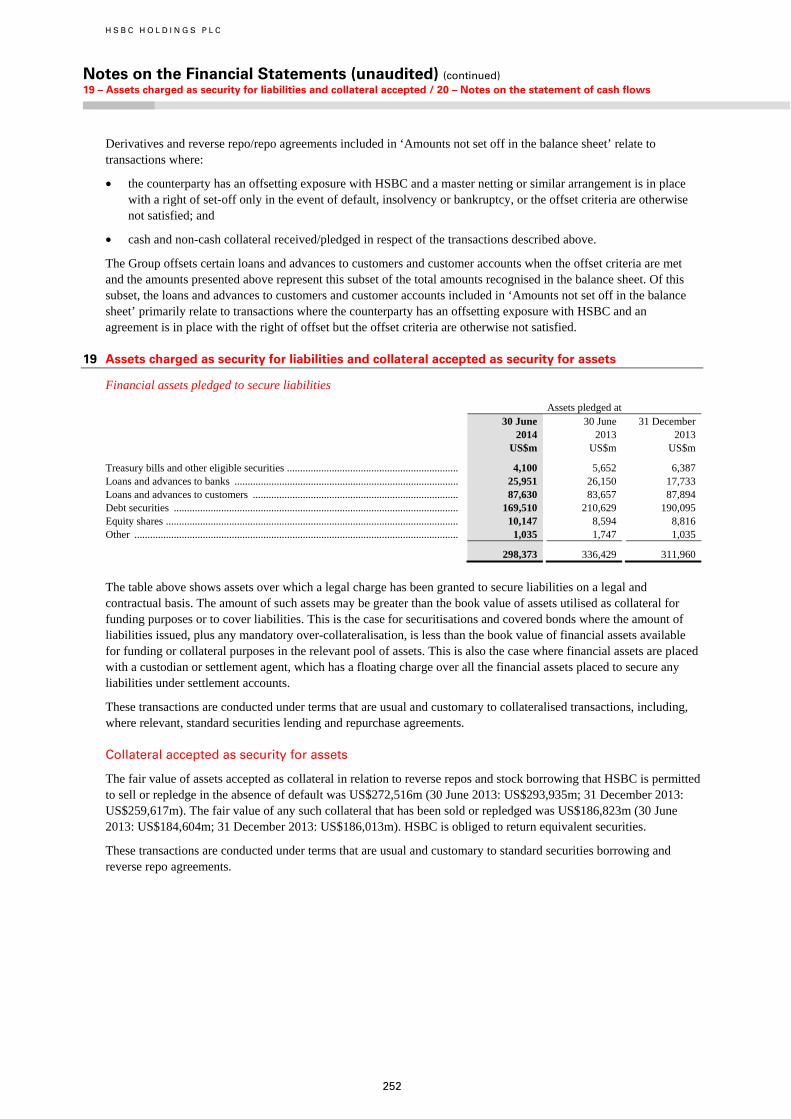
H S B C H O L D I N G S P L C
Notes on the Financial Statements (unaudited) (continued) 19 – Assets charged as security for liabilities and collateral accepted / 20 – Notes on the statement of cash flows
252
Derivatives and reverse repo/repo agreements included in ‘Amounts not set off in the balance sheet’ relate to transactions where:
• the counterparty has an offsetting exposure with HSBC and a master netting or similar arrangement is in place with a right of set-off only in the event of default, insolvency or bankruptcy, or the offset criteria are otherwise not satisfied; and
• cash and non-cash collateral received/pledged in respect of the transactions described above.
The Group offsets certain loans and advances to customers and customer accounts when the offset criteria are met and the amounts presented above represent this subset of the total amounts recognised in the balance sheet. Of this subset, the loans and advances to customers and customer accounts included in ‘Amounts not set off in the balance sheet’ primarily relate to transactions where the counterparty has an offsetting exposure with HSBC and an agreement is in place with the right of offset but the offset criteria are otherwise not satisfied.
19 Assets charged as security for liabilities and collateral accepted as security for assets
Financial assets pledged to secure liabilities
Assets pledged at 30 June 30 June 31 December 2014 2013 2013 US$m US$m US$m
Treasury bills and other eligible securities ................................................................. 4,100 5,652 6,387 Loans and advances to banks ..................................................................................... 25,951 26,150 17,733 Loans and advances to customers .............................................................................. 87,630 83,657 87,894 Debt securities ............................................................................................................ 169,510 210,629 190,095 Equity shares ............................................................................................................... 10,147 8,594 8,816 Other ........................................................................................................................... 1,035 1,747 1,035
298,373 336,429 311,960
The table above shows assets over which a legal charge has been granted to secure liabilities on a legal and contractual basis. The amount of such assets may be greater than the book value of assets utilised as collateral for funding purposes or to cover liabilities. This is the case for securitisations and covered bonds where the amount of liabilities issued, plus any mandatory over-collateralisation, is less than the book value of financial assets available for funding or collateral purposes in the relevant pool of assets. This is also the case where financial assets are placed with a custodian or settlement agent, which has a floating charge over all the financial assets placed to secure any liabilities under settlement accounts.
These transactions are conducted under terms that are usual and customary to collateralised transactions, including, where relevant, standard securities lending and repurchase agreements.
Collateral accepted as security for assets
The fair value of assets accepted as collateral in relation to reverse repos and stock borrowing that HSBC is permitted to sell or repledge in the absence of default was US$272,516m (30 June 2013: US$293,935m; 31 December 2013: US$259,617m). The fair value of any such collateral that has been sold or repledged was US$186,823m (30 June 2013: US$184,604m; 31 December 2013: US$186,013m). HSBC is obliged to return equivalent securities.
These transactions are conducted under terms that are usual and customary to standard securities borrowing and reverse repo agreements.
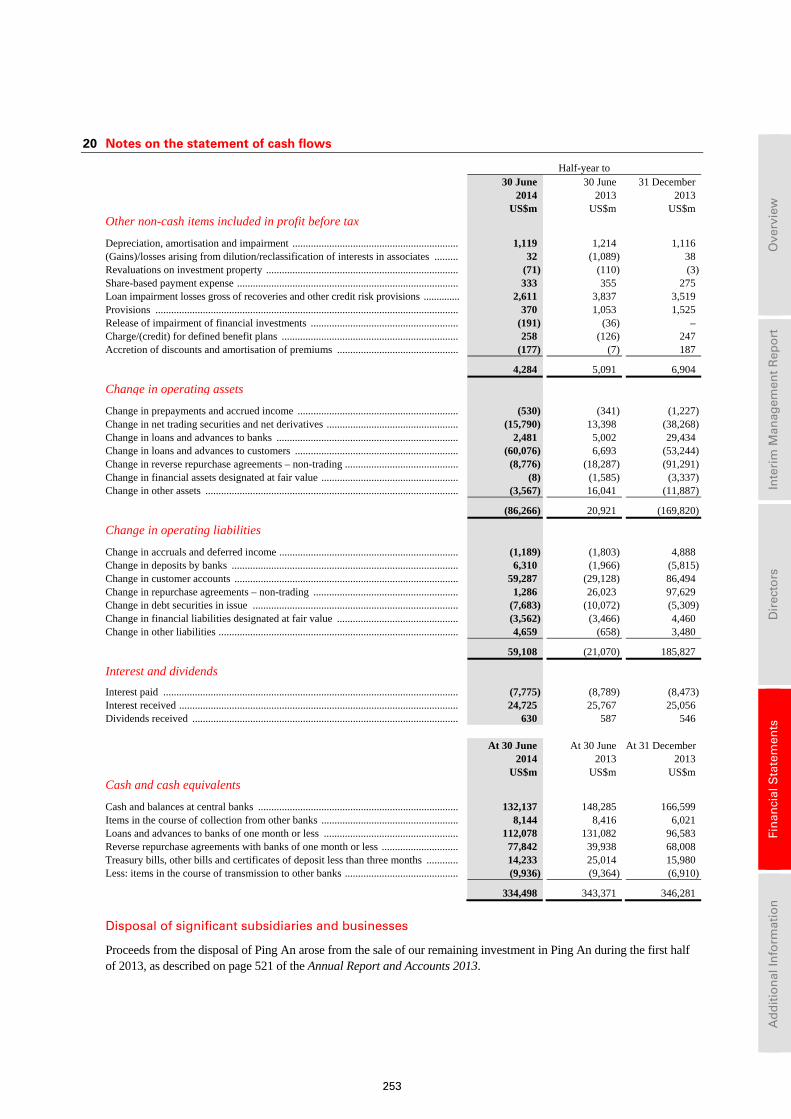
253
Ove
rvie
w
In
teri
m M
anag
emen
t R
epo
rt
D
irec
tors
Fin
anci
al S
tate
men
ts
A
dd
itio
nal
Info
rmat
ion
20 Notes on the statement of cash flows
Half-year to 30 June
2014 30 June 2013
31 December 2013
US$m US$m US$m Other non-cash items included in profit before tax
Depreciation, amortisation and impairment ............................................................... 1,119 1,214 1,116 (Gains)/losses arising from dilution/reclassification of interests in associates ......... 32 (1,089) 38 Revaluations on investment property ......................................................................... (71) (110) (3)Share-based payment expense .................................................................................... 333 355 275 Loan impairment losses gross of recoveries and other credit risk provisions .............. 2,611 3,837 3,519 Provisions ................................................................................................................... 370 1,053 1,525 Release of impairment of financial investments ........................................................ (191) (36) – Charge/(credit) for defined benefit plans ................................................................... 258 (126) 247 Accretion of discounts and amortisation of premiums .............................................. (177) (7) 187
4,284 5,091 6,904
Change in operating assets
Change in prepayments and accrued income ............................................................. (530) (341) (1,227)Change in net trading securities and net derivatives .................................................. (15,790) 13,398 (38,268)Change in loans and advances to banks ..................................................................... 2,481 5,002 29,434 Change in loans and advances to customers .............................................................. (60,076) 6,693 (53,244)Change in reverse repurchase agreements – non-trading ........................................... (8,776) (18,287) (91,291)Change in financial assets designated at fair value .................................................... (8) (1,585) (3,337)Change in other assets ................................................................................................ (3,567) 16,041 (11,887)
(86,266) 20,921 (169,820)
Change in operating liabilities
Change in accruals and deferred income .................................................................... (1,189) (1,803) 4,888 Change in deposits by banks ...................................................................................... 6,310 (1,966) (5,815)Change in customer accounts ..................................................................................... 59,287 (29,128) 86,494 Change in repurchase agreements – non-trading ....................................................... 1,286 26,023 97,629 Change in debt securities in issue .............................................................................. (7,683) (10,072) (5,309)Change in financial liabilities designated at fair value .............................................. (3,562) (3,466) 4,460 Change in other liabilities ........................................................................................... 4,659 (658) 3,480
59,108 (21,070) 185,827
Interest and dividends
Interest paid ................................................................................................................ (7,775) (8,789) (8,473)Interest received .......................................................................................................... 24,725 25,767 25,056 Dividends received ..................................................................................................... 630 587 546 At 30 June
2014 At 30 June 2013
At 31 December 2013
US$m US$m US$m Cash and cash equivalents
Cash and balances at central banks ............................................................................ 132,137 148,285 166,599 Items in the course of collection from other banks .................................................... 8,144 8,416 6,021 Loans and advances to banks of one month or less ................................................... 112,078 131,082 96,583 Reverse repurchase agreements with banks of one month or less ............................. 77,842 39,938 68,008 Treasury bills, other bills and certificates of deposit less than three months ............ 14,233 25,014 15,980 Less: items in the course of transmission to other banks ........................................... (9,936) (9,364) (6,910)
334,498 343,371 346,281
Disposal of significant subsidiaries and businesses
Proceeds from the disposal of Ping An arose from the sale of our remaining investment in Ping An during the first half of 2013, as described on page 521 of the Annual Report and Accounts 2013.
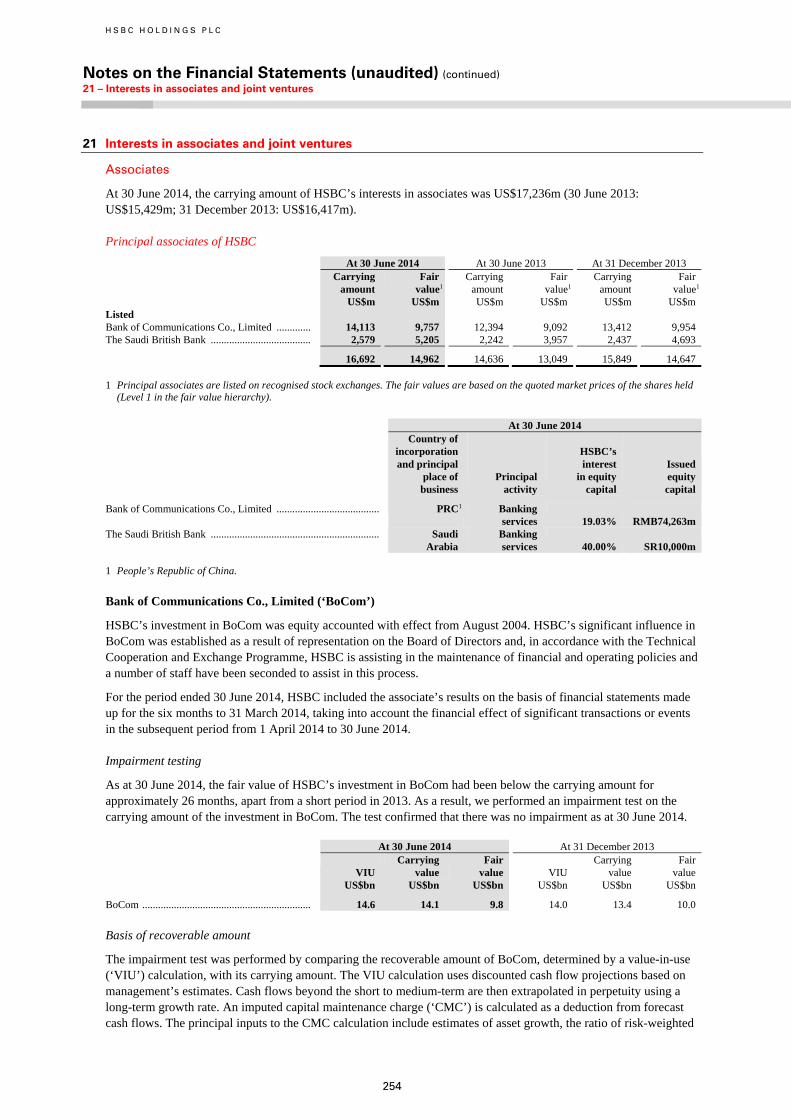
H S B C H O L D I N G S P L C
Notes on the Financial Statements (unaudited) (continued) 21 – Interests in associates and joint ventures
254
21 Interests in associates and joint ventures
Associates
At 30 June 2014, the carrying amount of HSBC’s interests in associates was US$17,236m (30 June 2013: US$15,429m; 31 December 2013: US$16,417m).
Principal associates of HSBC
At 30 June 2014 At 30 June 2013 At 31 December 2013
Carrying amount
Fair
value1 Carrying
amount Fair
value1 Carrying amount
Fair value1
US$m US$m US$m US$m US$m US$m Listed Bank of Communications Co., Limited ............. 14,113 9,757 12,394 9,092 13,412 9,954The Saudi British Bank ...................................... 2,579 5,205 2,242 3,957 2,437 4,693
16,692 14,962 14,636 13,049 15,849 14,647
1 Principal associates are listed on recognised stock exchanges. The fair values are based on the quoted market prices of the shares held (Level 1 in the fair value hierarchy).
At 30 June 2014
Country of incorporation and principal place of business
Principal activity
HSBC’s interest in equity capital
Issued equity capital
Bank of Communications Co., Limited ....................................... PRC1 Banking services 19.03%
RMB74,263m
The Saudi British Bank ................................................................ Saudi Arabia
Banking services 40.00%
SR10,000m
1 People’s Republic of China.
Bank of Communications Co., Limited (‘BoCom’)
HSBC’s investment in BoCom was equity accounted with effect from August 2004. HSBC’s significant influence in BoCom was established as a result of representation on the Board of Directors and, in accordance with the Technical Cooperation and Exchange Programme, HSBC is assisting in the maintenance of financial and operating policies and a number of staff have been seconded to assist in this process.
For the period ended 30 June 2014, HSBC included the associate’s results on the basis of financial statements made up for the six months to 31 March 2014, taking into account the financial effect of significant transactions or events in the subsequent period from 1 April 2014 to 30 June 2014.
Impairment testing
As at 30 June 2014, the fair value of HSBC’s investment in BoCom had been below the carrying amount for approximately 26 months, apart from a short period in 2013. As a result, we performed an impairment test on the carrying amount of the investment in BoCom. The test confirmed that there was no impairment as at 30 June 2014.
At 30 June 2014 At 31 December 2013
VIU Carrying value
Fair value VIU
Carrying value
Fair value
US$bn US$bn US$bn US$bn US$bn US$bn
BoCom ................................................................ 14.6 14.1 9.8 14.0 13.4 10.0
Basis of recoverable amount
The impairment test was performed by comparing the recoverable amount of BoCom, determined by a value-in-use (‘VIU’) calculation, with its carrying amount. The VIU calculation uses discounted cash flow projections based on management’s estimates. Cash flows beyond the short to medium-term are then extrapolated in perpetuity using a long-term growth rate. An imputed capital maintenance charge (‘CMC’) is calculated as a deduction from forecast cash flows. The principal inputs to the CMC calculation include estimates of asset growth, the ratio of risk-weighted
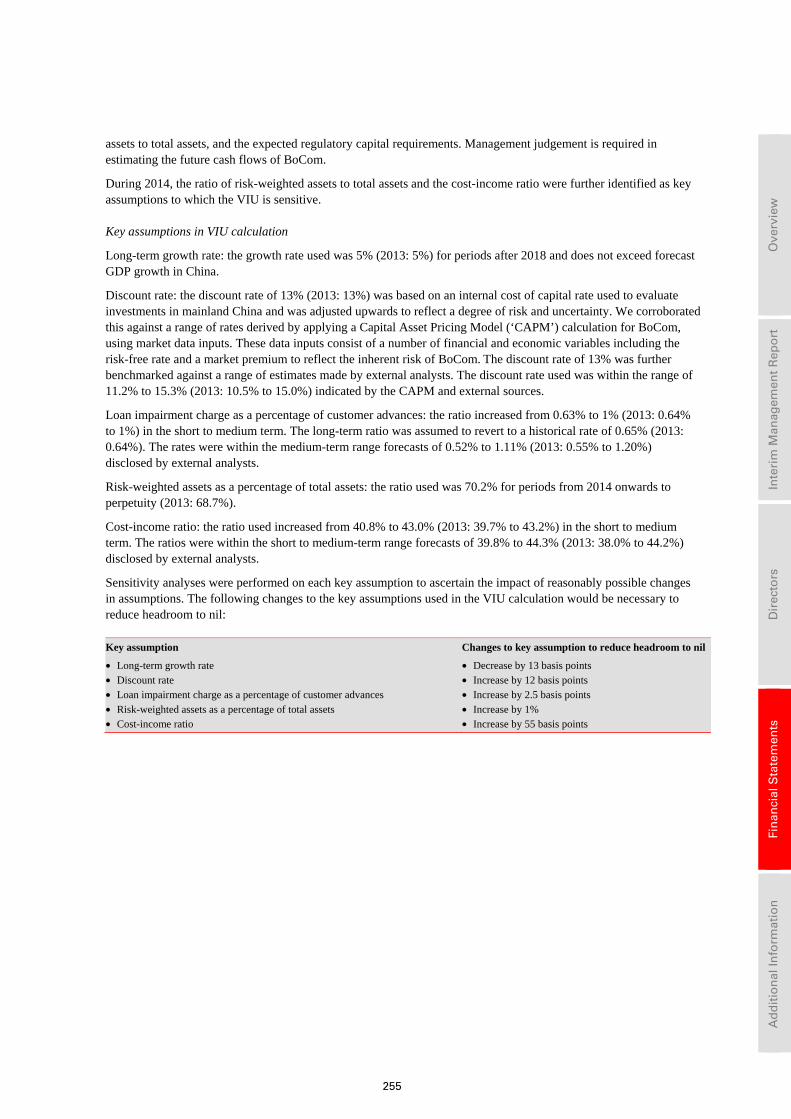
255
Ove
rvie
w
In
teri
m M
anag
emen
t R
epo
rt
D
irec
tors
Fin
anci
al S
tate
men
ts
A
dd
itio
nal
Info
rmat
ion
assets to total assets, and the expected regulatory capital requirements. Management judgement is required in estimating the future cash flows of BoCom.
During 2014, the ratio of risk-weighted assets to total assets and the cost-income ratio were further identified as key assumptions to which the VIU is sensitive.
Key assumptions in VIU calculation
Long-term growth rate: the growth rate used was 5% (2013: 5%) for periods after 2018 and does not exceed forecast GDP growth in China.
Discount rate: the discount rate of 13% (2013: 13%) was based on an internal cost of capital rate used to evaluate investments in mainland China and was adjusted upwards to reflect a degree of risk and uncertainty. We corroborated this against a range of rates derived by applying a Capital Asset Pricing Model (‘CAPM’) calculation for BoCom, using market data inputs. These data inputs consist of a number of financial and economic variables including the risk-free rate and a market premium to reflect the inherent risk of BoCom. The discount rate of 13% was further benchmarked against a range of estimates made by external analysts. The discount rate used was within the range of 11.2% to 15.3% (2013: 10.5% to 15.0%) indicated by the CAPM and external sources.
Loan impairment charge as a percentage of customer advances: the ratio increased from 0.63% to 1% (2013: 0.64% to 1%) in the short to medium term. The long-term ratio was assumed to revert to a historical rate of 0.65% (2013: 0.64%). The rates were within the medium-term range forecasts of 0.52% to 1.11% (2013: 0.55% to 1.20%) disclosed by external analysts.
Risk-weighted assets as a percentage of total assets: the ratio used was 70.2% for periods from 2014 onwards to perpetuity (2013: 68.7%).
Cost-income ratio: the ratio used increased from 40.8% to 43.0% (2013: 39.7% to 43.2%) in the short to medium term. The ratios were within the short to medium-term range forecasts of 39.8% to 44.3% (2013: 38.0% to 44.2%) disclosed by external analysts.
Sensitivity analyses were performed on each key assumption to ascertain the impact of reasonably possible changes in assumptions. The following changes to the key assumptions used in the VIU calculation would be necessary to reduce headroom to nil:
Key assumption Changes to key assumption to reduce headroom to nil
• Long-term growth rate • Discount rate • Loan impairment charge as a percentage of customer advances • Risk-weighted assets as a percentage of total assets • Cost-income ratio
• Decrease by 13 basis points • Increase by 12 basis points • Increase by 2.5 basis points • Increase by 1% • Increase by 55 basis points
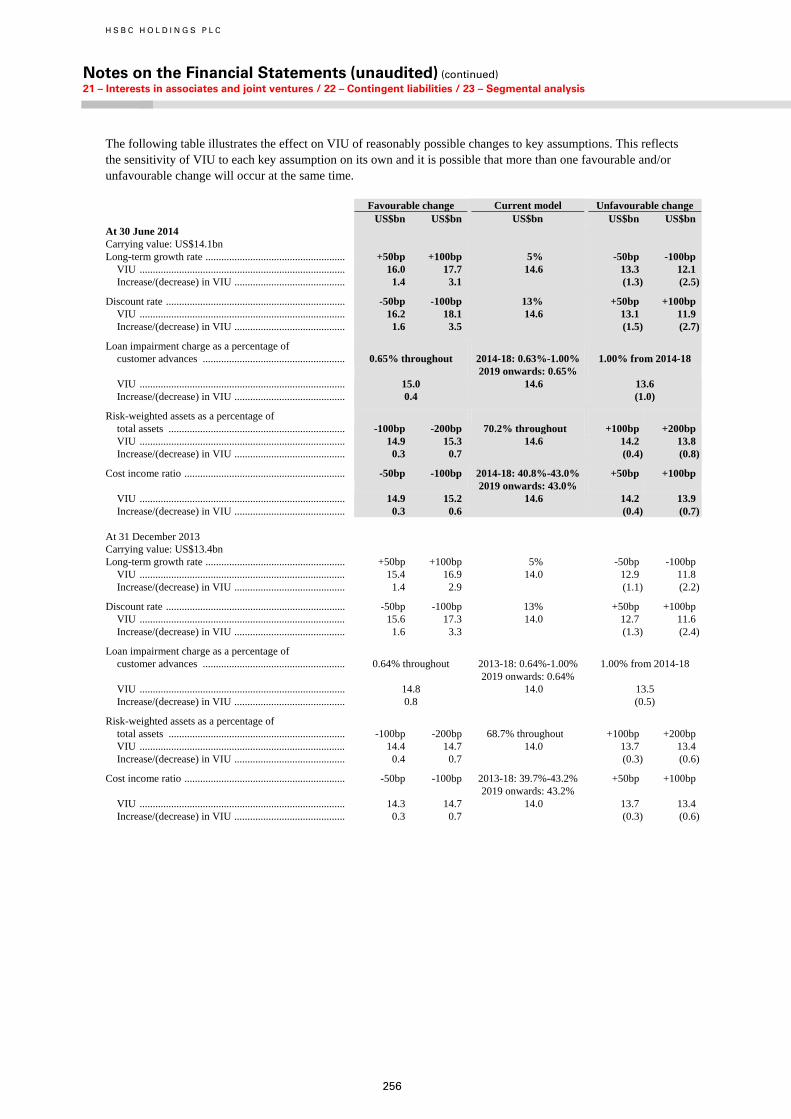
H S B C H O L D I N G S P L C
Notes on the Financial Statements (unaudited) (continued) 21 – Interests in associates and joint ventures / 22 – Contingent liabilities / 23 – Segmental analysis
256
The following table illustrates the effect on VIU of reasonably possible changes to key assumptions. This reflects the sensitivity of VIU to each key assumption on its own and it is possible that more than one favourable and/or unfavourable change will occur at the same time.
Favourable change Current model Unfavourable change US$bn US$bn US$bn US$bn US$bn At 30 June 2014 Carrying value: US$14.1bn Long-term growth rate ..................................................... +50bp +100bp 5% -50bp -100bp
VIU .............................................................................. 16.0 17.7 14.6 13.3 12.1 Increase/(decrease) in VIU .......................................... 1.4 3.1 (1.3) (2.5)
Discount rate .................................................................... -50bp -100bp 13% +50bp +100bp VIU .............................................................................. 16.2 18.1 14.6 13.1 11.9 Increase/(decrease) in VIU .......................................... 1.6 3.5 (1.5) (2.7)
Loan impairment charge as a percentage of customer advances ......................................................
0.65% throughout
2014-18: 0.63%-1.00% 2019 onwards: 0.65%
1.00% from 2014-18
VIU .............................................................................. 15.0 14.6 13.6 Increase/(decrease) in VIU .......................................... 0.4 (1.0)
Risk-weighted assets as a percentage of total assets ................................................................... -100bp -200bp 70.2% throughout
+100bp +200bp
VIU .............................................................................. 14.9 15.3 14.6 14.2 13.8 Increase/(decrease) in VIU .......................................... 0.3 0.7 (0.4) (0.8)
Cost income ratio ............................................................. -50bp -100bp 2014-18: 40.8%-43.0% 2019 onwards: 43.0%
+50bp +100bp
VIU .............................................................................. 14.9 15.2 14.6 14.2 13.9 Increase/(decrease) in VIU .......................................... 0.3 0.6 (0.4) (0.7)
At 31 December 2013 Carrying value: US$13.4bn Long-term growth rate ..................................................... +50bp +100bp 5% -50bp -100bp
VIU .............................................................................. 15.4 16.9 14.0 12.9 11.8 Increase/(decrease) in VIU .......................................... 1.4 2.9 (1.1) (2.2)
Discount rate .................................................................... -50bp -100bp 13% +50bp +100bpVIU .............................................................................. 15.6 17.3 14.0 12.7 11.6 Increase/(decrease) in VIU .......................................... 1.6 3.3 (1.3) (2.4)
Loan impairment charge as a percentage of customer advances ......................................................
0.64% throughout
2013-18: 0.64%-1.00% 2019 onwards: 0.64%
1.00% from 2014-18
VIU .............................................................................. 14.8 14.0 13.5Increase/(decrease) in VIU .......................................... 0.8 (0.5)
Risk-weighted assets as a percentage of total assets ................................................................... -100bp -200bp 68.7% throughout
+100bp +200bp
VIU .............................................................................. 14.4 14.7 14.0 13.7 13.4 Increase/(decrease) in VIU .......................................... 0.4 0.7 (0.3) (0.6)
Cost income ratio ............................................................. -50bp -100bp 2013-18: 39.7%-43.2% 2019 onwards: 43.2%
+50bp +100bp
VIU .............................................................................. 14.3 14.7 14.0 13.7 13.4Increase/(decrease) in VIU .......................................... 0.3 0.7 (0.3) (0.6)
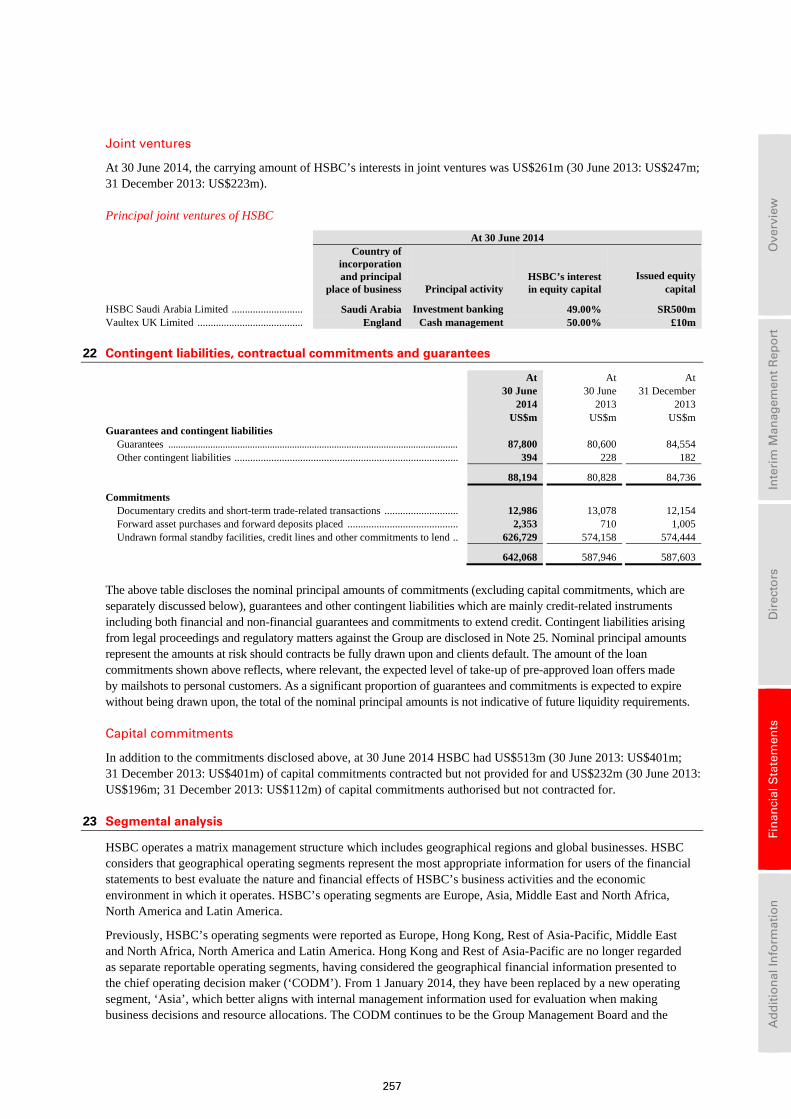
257
Ove
rvie
w
In
teri
m M
anag
emen
t R
epo
rt
D
irec
tors
Fin
anci
al S
tate
men
ts
A
dd
itio
nal
Info
rmat
ion
Joint ventures
At 30 June 2014, the carrying amount of HSBC’s interests in joint ventures was US$261m (30 June 2013: US$247m; 31 December 2013: US$223m).
Principal joint ventures of HSBC
At 30 June 2014
Country of incorporation and principal place of business Principal activity
HSBC’s interest in equity capital
Issued equitycapital
HSBC Saudi Arabia Limited ........................... Saudi Arabia Investment banking 49.00% SR500m Vaultex UK Limited ........................................ England Cash management 50.00% £10m
22 Contingent liabilities, contractual commitments and guarantees
At 30 June 2014
At 30 June 2013
At 31 December 2013
US$m US$m US$m Guarantees and contingent liabilities
Guarantees ..................................................................................................................... 87,800 80,600 84,554 Other contingent liabilities ..................................................................................... 394 228 182
88,194 80,828 84,736
Commitments Documentary credits and short-term trade-related transactions ............................ 12,986 13,078 12,154 Forward asset purchases and forward deposits placed .......................................... 2,353 710 1,005 Undrawn formal standby facilities, credit lines and other commitments to lend .. 626,729 574,158 574,444
642,068 587,946 587,603
The above table discloses the nominal principal amounts of commitments (excluding capital commitments, which are separately discussed below), guarantees and other contingent liabilities which are mainly credit-related instruments including both financial and non-financial guarantees and commitments to extend credit. Contingent liabilities arising from legal proceedings and regulatory matters against the Group are disclosed in Note 25. Nominal principal amounts represent the amounts at risk should contracts be fully drawn upon and clients default. The amount of the loan commitments shown above reflects, where relevant, the expected level of take-up of pre-approved loan offers made by mailshots to personal customers. As a significant proportion of guarantees and commitments is expected to expire without being drawn upon, the total of the nominal principal amounts is not indicative of future liquidity requirements.
Capital commitments
In addition to the commitments disclosed above, at 30 June 2014 HSBC had US$513m (30 June 2013: US$401m; 31 December 2013: US$401m) of capital commitments contracted but not provided for and US$232m (30 June 2013: US$196m; 31 December 2013: US$112m) of capital commitments authorised but not contracted for.
23 Segmental analysis
HSBC operates a matrix management structure which includes geographical regions and global businesses. HSBC considers that geographical operating segments represent the most appropriate information for users of the financial statements to best evaluate the nature and financial effects of HSBC’s business activities and the economic environment in which it operates. HSBC’s operating segments are Europe, Asia, Middle East and North Africa, North America and Latin America.
Previously, HSBC’s operating segments were reported as Europe, Hong Kong, Rest of Asia-Pacific, Middle East and North Africa, North America and Latin America. Hong Kong and Rest of Asia-Pacific are no longer regarded as separate reportable operating segments, having considered the geographical financial information presented to the chief operating decision maker (‘CODM’). From 1 January 2014, they have been replaced by a new operating segment, ‘Asia’, which better aligns with internal management information used for evaluation when making business decisions and resource allocations. The CODM continues to be the Group Management Board and the
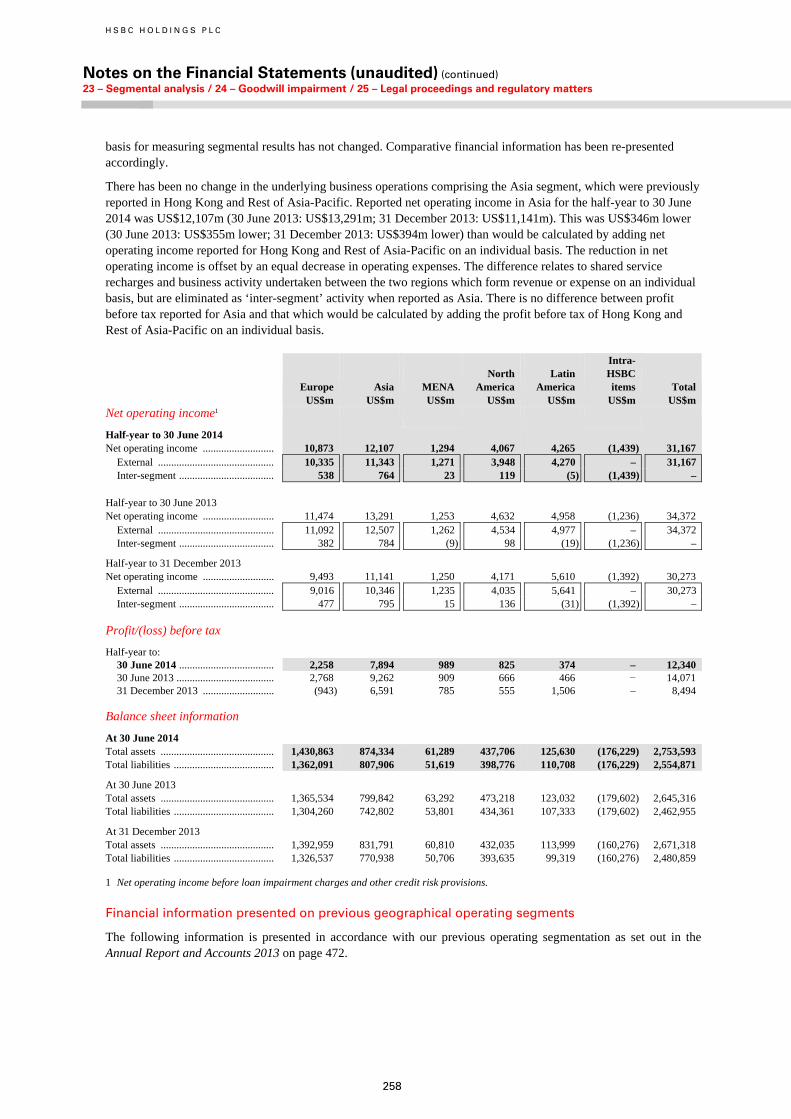
H S B C H O L D I N G S P L C
Notes on the Financial Statements (unaudited) (continued) 23 – Segmental analysis / 24 – Goodwill impairment / 25 – Legal proceedings and regulatory matters
258
basis for measuring segmental results has not changed. Comparative financial information has been re-presented accordingly.
There has been no change in the underlying business operations comprising the Asia segment, which were previously reported in Hong Kong and Rest of Asia-Pacific. Reported net operating income in Asia for the half-year to 30 June 2014 was US$12,107m (30 June 2013: US$13,291m; 31 December 2013: US$11,141m). This was US$346m lower (30 June 2013: US$355m lower; 31 December 2013: US$394m lower) than would be calculated by adding net operating income reported for Hong Kong and Rest of Asia-Pacific on an individual basis. The reduction in net operating income is offset by an equal decrease in operating expenses. The difference relates to shared service recharges and business activity undertaken between the two regions which form revenue or expense on an individual basis, but are eliminated as ‘inter-segment’ activity when reported as Asia. There is no difference between profit before tax reported for Asia and that which would be calculated by adding the profit before tax of Hong Kong and Rest of Asia-Pacific on an individual basis.
Europe Asia MENA North America
Latin America
Intra- HSBC items
Total US$m US$m US$m US$m US$m US$m US$m Net operating income1
Half-year to 30 June 2014 Net operating income ........................... 10,873 12,107 1,294 4,067 4,265 (1,439) 31,167
External ............................................ 10,335 11,343 1,271 3,948 4,270 – 31,167 Inter-segment .................................... 538 764 23 119 (5) (1,439) –
Half-year to 30 June 2013 Net operating income ........................... 11,474 13,291 1,253 4,632 4,958 (1,236) 34,372
External ............................................ 11,092 12,507 1,262 4,534 4,977 – 34,372 Inter-segment .................................... 382 784 (9) 98 (19) (1,236) –
Half-year to 31 December 2013 Net operating income ........................... 9,493 11,141 1,250 4,171 5,610 (1,392) 30,273
External ............................................ 9,016 10,346 1,235 4,035 5,641 – 30,273Inter-segment .................................... 477 795 15 136 (31) (1,392) –
Profit/(loss) before tax
Half-year to: 30 June 2014 .................................... 2,258 7,894 989 825 374 – 12,340 30 June 2013 ..................................... 2,768 9,262 909 666 466 − 14,071 31 December 2013 ........................... (943) 6,591 785 555 1,506 – 8,494
Balance sheet information
At 30 June 2014 Total assets ........................................... 1,430,863 874,334 61,289 437,706 125,630 (176,229) 2,753,593 Total liabilities ...................................... 1,362,091 807,906 51,619 398,776 110,708 (176,229) 2,554,871
At 30 June 2013 Total assets ........................................... 1,365,534 799,842 63,292 473,218 123,032 (179,602) 2,645,316 Total liabilities ...................................... 1,304,260 742,802 53,801 434,361 107,333 (179,602) 2,462,955
At 31 December 2013 Total assets ........................................... 1,392,959 831,791 60,810 432,035 113,999 (160,276) 2,671,318 Total liabilities ...................................... 1,326,537 770,938 50,706 393,635 99,319 (160,276) 2,480,859
1 Net operating income before loan impairment charges and other credit risk provisions.
Financial information presented on previous geographical operating segments
The following information is presented in accordance with our previous operating segmentation as set out in the Annual Report and Accounts 2013 on page 472.
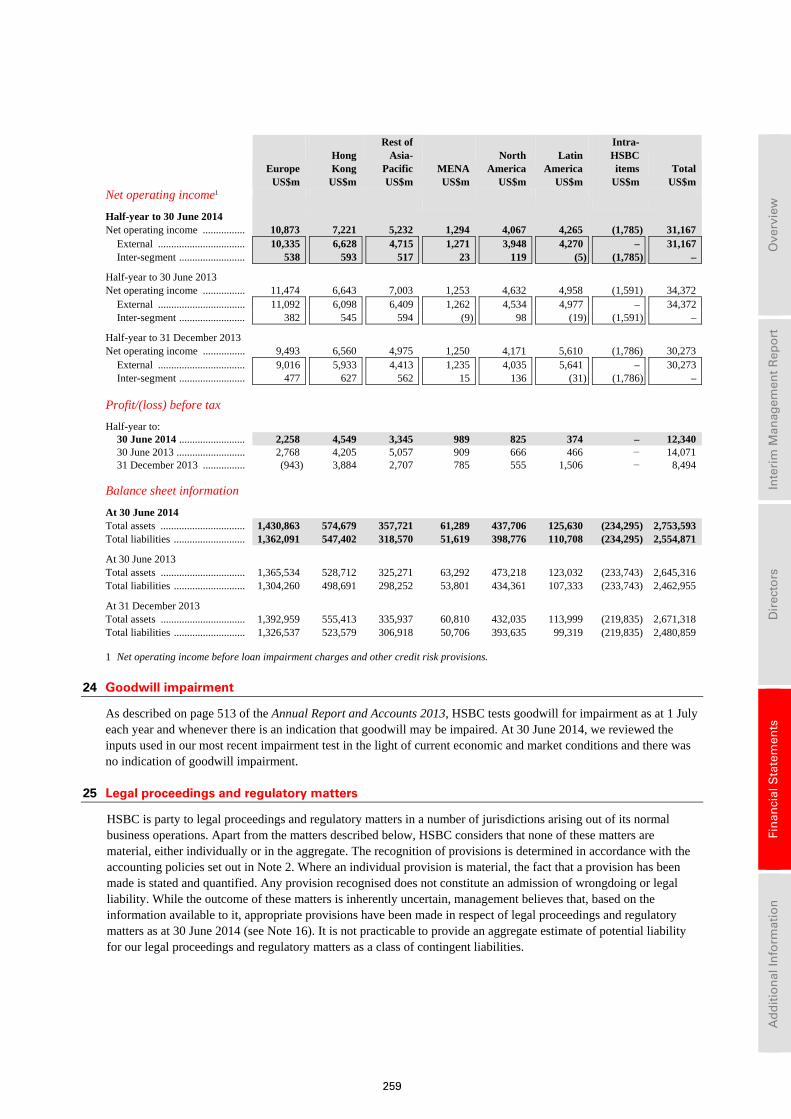
259
Ove
rvie
w
In
teri
m M
anag
emen
t R
epo
rt
D
irec
tors
Fin
anci
al S
tate
men
ts
A
dd
itio
nal
Info
rmat
ion
Europe Hong Kong
Rest of Asia- Pacific MENA
North America
Latin America
Intra- HSBC items
Total US$m US$m US$m US$m US$m US$m US$m US$m Net operating income1
Half-year to 30 June 2014 Net operating income ................ 10,873 7,221 5,232 1,294 4,067 4,265 (1,785) 31,167
External ................................. 10,335 6,628 4,715 1,271 3,948 4,270 – 31,167 Inter-segment ......................... 538 593 517 23 119 (5) (1,785) –
Half-year to 30 June 2013 Net operating income ................ 11,474 6,643 7,003 1,253 4,632 4,958 (1,591) 34,372
External ................................. 11,092 6,098 6,409 1,262 4,534 4,977 – 34,372 Inter-segment ......................... 382 545 594 (9) 98 (19) (1,591) –
Half-year to 31 December 2013 Net operating income ................ 9,493 6,560 4,975 1,250 4,171 5,610 (1,786) 30,273
External ................................. 9,016 5,933 4,413 1,235 4,035 5,641 – 30,273Inter-segment ......................... 477 627 562 15 136 (31) (1,786) –
Profit/(loss) before tax
Half-year to:
30 June 2014 ......................... 2,258 4,549 3,345 989 825 374 – 12,340 30 June 2013 .......................... 2,768 4,205 5,057 909 666 466 − 14,071 31 December 2013 ................ (943) 3,884 2,707 785 555 1,506 − 8,494
Balance sheet information
At 30 June 2014 Total assets ................................ 1,430,863 574,679 357,721 61,289 437,706 125,630 (234,295) 2,753,593 Total liabilities ........................... 1,362,091 547,402 318,570 51,619 398,776 110,708 (234,295) 2,554,871
At 30 June 2013 Total assets ................................ 1,365,534 528,712 325,271 63,292 473,218 123,032 (233,743) 2,645,316 Total liabilities ........................... 1,304,260 498,691 298,252 53,801 434,361 107,333 (233,743) 2,462,955
At 31 December 2013 Total assets ................................ 1,392,959 555,413 335,937 60,810 432,035 113,999 (219,835) 2,671,318 Total liabilities ........................... 1,326,537 523,579 306,918 50,706 393,635 99,319 (219,835) 2,480,859
1 Net operating income before loan impairment charges and other credit risk provisions.
24 Goodwill impairment
As described on page 513 of the Annual Report and Accounts 2013, HSBC tests goodwill for impairment as at 1 July each year and whenever there is an indication that goodwill may be impaired. At 30 June 2014, we reviewed the inputs used in our most recent impairment test in the light of current economic and market conditions and there was no indication of goodwill impairment.
25 Legal proceedings and regulatory matters
HSBC is party to legal proceedings and regulatory matters in a number of jurisdictions arising out of its normal business operations. Apart from the matters described below, HSBC considers that none of these matters are material, either individually or in the aggregate. The recognition of provisions is determined in accordance with the accounting policies set out in Note 2. Where an individual provision is material, the fact that a provision has been made is stated and quantified. Any provision recognised does not constitute an admission of wrongdoing or legal liability. While the outcome of these matters is inherently uncertain, management believes that, based on the information available to it, appropriate provisions have been made in respect of legal proceedings and regulatory matters as at 30 June 2014 (see Note 16). It is not practicable to provide an aggregate estimate of potential liability for our legal proceedings and regulatory matters as a class of contingent liabilities.
H S B C H O L D I N G S P L C
Notes on the Financial Statements (unaudited) (continued) 25 – Legal proceedings and regulatory matters
260
Securities litigation
As a result of an August 2002 restatement of previously reported consolidated financial statements and other corporate events, including the 2002 settlement with 46 states and the District of Columbia relating to real estate lending practices, Household International and certain former officers were named as defendants in a class action lawsuit, Jaffe v. Household International, Inc., et al. (N.D. Ill. No. 02 C5893), filed on 19 August 2002 in the US District Court for the Northern District of Illinois (the ‘Illinois District Court’). The complaint asserted claims under § 10 and § 20 of the Securities Exchange Act of 1934 and alleged that the defendants knowingly or recklessly made false and misleading statements of material fact relating to Household International’s Consumer Lending operations, including collections, sales and lending practices, some of which ultimately led to the 2002 state settlement agreement, and facts relating to accounting practices evidenced by the restatement. Ultimately, a class was certified on behalf of all persons who acquired and disposed of Household International common stock between 30 July 1999 and 11 October 2002.
A jury trial concluded in April 2009, which was decided partly in favour of the plaintiffs. Various legal challenges to the verdict were raised in post-trial briefing.
In December 2011, following the submission of claim forms by class members, the Court-appointed claims administrator to the Illinois District Court reported that the total number of claims that generated an allowed loss was 45,921, and that the aggregate amount of these claims was approximately US$2.2bn. The defendants filed legal challenges regarding the presumption of reliance as to the class and compliance with the claim form requirements, which the Illinois District Court, in September 2012, rejected for the most part. The Illinois District Court directed further proceedings before a court-appointed Special Master to address certain claims submission issues.
On 4 October 2013, the Illinois District Court denied the defendants’ additional post-trial motions for judgement as a matter of law or, in the alternative, for a new trial, and granted plaintiffs’ motions for a partial final judgement and awarded pre-judgement interest at the prime rate, compounded annually. Subsequently, on 17 October 2013, the Illinois District Court entered a partial final judgement against the defendants in the amount of approximately US$2.5bn. In addition to the partial judgement that has been entered, there also remain approximately US$625m in claims, prior to imposition of pre-judgement interest, that still are subject to objections that have not yet been ruled upon by the Illinois District Court.
The defendants have filed a Notice of Appeal of the partial final judgement, and oral argument was heard by the US Court of Appeals for the Seventh Circuit on 29 May 2014. We await a decision from the appellate court. The defendants have also filed a Supersedeas Bond in the approximate amount of the judgement (US$2.5bn) in order to stay execution on the judgement pending appeal. Despite the jury verdict, the various rulings of the Illinois District Court, and the partial final judgement, we continue to believe that we have meritorious grounds for relief on appeal. The timing and outcome of the ultimate resolution of this matter is uncertain.
Given the complexity and uncertainties associated with the actual determination of damages, including the outcome of any appeals, there is a wide range of possible damages. If the Court of Appeals rejects or only partially accepts our arguments, the amount of damages, based upon that partial final judgement, and other pending claims and the application of pre-judgement interest on those pending claims, may lie in a range from a relatively insignificant amount to an amount up to or exceeding US$3.6bn. Once a judgement is entered (such as the approximately US$2.5bn partial final judgement entered on 17 October 2013), post-judgement interest accrues on the judgement at a rate equal to the weekly average of the one-year constant maturity treasury yield as published by the Federal Reserve System. A provision has been made based on management’s best estimate of probable outflows.
Bernard L. Madoff Investment Securities LLC
In December 2008, Bernard L. Madoff (‘Madoff’) was arrested for running a Ponzi scheme, and a trustee was appointed for the liquidation of his firm, Bernard L. Madoff Investment Securities LLC (‘Madoff Securities’), an SEC-registered broker-dealer and investment adviser. Since his appointment, the trustee has been recovering assets and processing claims of Madoff Securities customers. Madoff subsequently pleaded guilty to various charges and is serving a 150-year prison sentence. He has acknowledged, in essence, that while purporting to invest his customers’ money in securities and, upon request, return their profits and principal, he in fact never invested in securities and used other customers’ money to fulfil requests for the return of profits and principal. Other individuals associated with Madoff Securities have also pleaded guilty, and several former employees of Madoff Securities were recently convicted at trial in the US and are awaiting sentencing.
261
Ove
rvie
w
In
teri
m M
anag
emen
t R
epo
rt
D
irec
tors
Fin
anci
al S
tate
men
ts
A
dd
itio
nal
Info
rmat
ion
Various non-US HSBC companies provided custodial, administration and similar services to a number of funds incorporated outside the US whose assets were invested with Madoff Securities. Based on information provided by Madoff Securities, as at 30 November 2008, the purported aggregate value of these funds was US$8.4bn, an amount that includes fictitious profits reported by Madoff. Based on information available to HSBC, we have estimated that the funds’ actual transfers to Madoff Securities minus their actual withdrawals from Madoff Securities during the time that HSBC serviced the funds totalled approximately US$4bn.
Plaintiffs (including funds, fund investors, and the Madoff Securities trustee) have commenced Madoff-related proceedings against numerous defendants in a multitude of jurisdictions. Various HSBC companies have been named as defendants in suits in the US, Ireland, Luxembourg and other jurisdictions. Certain suits (which include US putative class actions) allege that the HSBC defendants knew or should have known of Madoff’s fraud and breached various duties to the funds and fund investors.
In December 2011, claims against HSBC and other defendants by fund investors in three related putative class actions pending in the US District Court for the Southern District of New York (the ‘New York District Court’) were dismissed on grounds of forum non conveniens. In September 2013, the US Court of Appeals for the Second Circuit affirmed the dismissal of the claims. The plaintiffs filed a petition for panel rehearing, and rehearing en banc. In May 2014, the Court of Appeals denied the request for panel rehearing. The request for rehearing en banc remains pending.
The Madoff Securities trustee has commenced suits against various HSBC companies in the US Bankruptcy Court and in the English High Court. The US action (which also names certain funds, investment managers, and other non-HSBC companies and individuals) sought US$9bn in damages and additional recoveries from HSBC and the various non-HSBC co-defendants and alleged that HSBC aided and abetted Madoff’s fraud and breach of fiduciary duty. In July 2011, the New York District Court dismissed the trustee’s various common law claims on the grounds that the trustee lacks standing to assert them, and that dismissal was affirmed in a decision issued by the US Court of Appeals for the Second Circuit in June 2013. On 30 June 2014, the US Supreme Court denied the trustee’s petition for writ of certiorari, rendering final the dismissal of the trustee’s common law claims.
The trustee’s remaining US claims seek, pursuant to US bankruptcy law, recovery of unspecified amounts received by HSBC from funds invested with Madoff, including amounts that HSBC received when it redeemed units HSBC held in the various funds in connection with financing transactions HSBC had entered into with various clients, as well as fees earned by HSBC for providing custodial, administrative and similar services to the funds. These claims were withdrawn from the US Bankruptcy Court to the New York District Court in order to decide certain preliminary legal questions. The last of those questions was decided by the New York District Court on 7 July 2014, when the New York District Court ruled that the US Bankruptcy Code does not provide the trustee with a right to recover money that was transferred between foreign entities, even if that money is ultimately traceable to Madoff Securities. This decision, as well as the other New York District Court rulings, are subject to appeal and have not been applied to the facts of the trustee’s cases against HSBC, so their impact on the trustee’s remaining claims is uncertain.
The trustee’s English action seeks recovery of unspecified transfers of money from Madoff Securities to or through HSBC, on the ground that the HSBC defendants actually or constructively knew of Madoff’s fraud. HSBC has not been served with the trustee’s English action.
Between October 2009 and April 2012, Fairfield Sentry Limited, Fairfield Sigma Limited and Fairfield Lambda Limited (collectively, ‘Fairfield’), funds whose assets were directly or indirectly invested with Madoff Securities, commenced multiple suits in the British Virgin Islands (‘BVI’) and the US against numerous fund shareholders, including various HSBC companies that acted as nominees for clients of HSBC’s private banking business and other clients who invested in the Fairfield funds. The Fairfield actions seek restitution of amounts paid to the defendants in connection with share redemptions, on the ground that such payments were made by mistake, based on inflated net asset values resulting from Madoff’s fraud, and some actions also seek recovery of the share redemptions under BVI insolvency law. The UK Privy Council on 16 April 2014 issued a decision that the funds’ net asset values were binding despite Madoff Securities’ fraud and dismissed the BVI common law claims. An application seeking to remove the foreign representative’s authority to pursue the US actions is pending with the BVI court. The Fairfield actions in the US remain stayed in the US Bankruptcy Court pending action on the part of the foreign representative to lift the stay and further developments in the BVI litigation.
There are many factors that may affect the range of possible outcomes, and the resulting financial impact, of the various Madoff-related proceedings, including but not limited to the circumstances of the fraud, the multiple jurisdictions in which the proceedings have been brought and the number of different plaintiffs and defendants in
H S B C H O L D I N G S P L C
Notes on the Financial Statements (unaudited) (continued) 25 – Legal proceedings and regulatory matters
262
such proceedings. For these reasons, among others, it is not practicable at this time for HSBC to estimate reliably the aggregate liabilities, or ranges of liabilities, that might arise as a result of all such claims, but they could be significant. In any event, HSBC considers that it has good defences to these claims and will continue to defend them vigorously.
US mortgage-related investigations
In April 2011, following completion of a broad horizontal review of industry residential mortgage foreclosure practices, HSBC Bank USA entered into a consent cease and desist order with the Office of the Comptroller of the Currency (‘OCC’), and HSBC Finance and HSBC North America Holdings Inc. (‘HNAH’) entered into a similar consent order with the Federal Reserve Board (‘FRB’) (together with the OCC order, the ‘Servicing Consent Orders’). These consent orders require prescribed actions to address the deficiencies noted in the joint examination and described in the consent orders. HSBC Bank USA, HSBC Finance and HNAH continue to work with the OCC and the FRB to align their processes with the requirements of the consent orders and are implementing operational changes as required.
The Servicing Consent Orders required an independent review of foreclosures pending or completed between January 2009 and December 2010 (the ‘Independent Foreclosure Review’) to determine if any borrower was financially injured as a result of an error in the foreclosure process. As required by the Servicing Consent Orders, an independent consultant was retained to conduct that review.
On 28 February 2013, HSBC Bank USA entered into an agreement with the OCC, and HSBC Finance and HNAH entered into an agreement with the FRB (together, the ‘IFR Settlement Agreements’), pursuant to which the Independent Foreclosure Review has ceased and been replaced by a broader framework under which HSBC and 12 other participating servicers will, in the aggregate, provide in excess of US$9.3bn in cash payments and other assistance to help eligible borrowers. Pursuant to the IFR Settlement Agreements, HNAH has made a cash payment of US$96m into a fund used to make payments to borrowers that were in active foreclosure during 2009 and 2010, and in addition, is providing other assistance (e.g. loan modifications) to help eligible borrowers. Borrowers who receive compensation will not be required to execute a release or waiver of rights and will not be precluded from pursuing litigation concerning foreclosure or other mortgage servicing practices. For participating servicers, including HSBC Bank USA and HSBC Finance, fulfilment of the terms of the IFR Settlement Agreements will satisfy the Independent Foreclosure Review requirements of the Servicing Consent Orders, including the wind-down of the Independent Foreclosure Review.
The Servicing Consent Orders do not preclude additional enforcement actions against HSBC Bank USA, HSBC Finance or HNAH by bank regulatory, governmental or law enforcement agencies, such as the US Department of Justice (‘DoJ’) or State Attorneys General, which could include the imposition of civil money penalties and other sanctions relating to the activities that are the subject of the Servicing Consent Orders. Pursuant to the IFR Settlement Agreement with the OCC, however, the OCC has agreed that it will not assess civil money penalties or initiate any further enforcement action with respect to past mortgage servicing and foreclosure-related practices addressed in the Servicing Consent Orders, provided the terms of the IFR Settlement Agreement are fulfilled. The OCC’s agreement not to assess civil money penalties is further conditioned on HNAH making payments or providing borrower assistance pursuant to any agreement that may be entered into with the DoJ in connection with the servicing of residential mortgage loans within two years. The FRB has agreed that any assessment of civil money penalties by the FRB will reflect a number of adjustments, including amounts expended in consumer relief and payments made pursuant to any agreement that may be entered into with the DoJ in connection with the servicing of residential mortgage loans. In addition, the IFR Settlement Agreements do not preclude private litigation concerning these practices.
Separate from the Servicing Consent Orders and the settlement related to the Independent Foreclosure Review discussed above, in February 2012, five of the largest US mortgage servicers (not including any HSBC companies) reached a settlement with the DoJ, the US Department of Housing and Urban Development and State Attorneys General of 49 states with respect to foreclosure and other mortgage servicing practices. Following this settlement, these government agencies initiated discussions with other mortgage industry servicers. HNAH, HSBC Bank USA and HSBC Finance have had discussions with US bank regulators and other governmental agencies regarding a potential resolution. Any such settlement, however, may not completely preclude other enforcement actions by state or federal agencies, regulators or law enforcement bodies related to foreclosure and other mortgage servicing practices including, but not limited to, matters relating to the securitisation of mortgages for investors. These
263
Ove
rvie
w
In
teri
m M
anag
emen
t R
epo
rt
D
irec
tors
Fin
anci
al S
tate
men
ts
A
dd
itio
nal
Info
rmat
ion
practices have in the past resulted in private litigation, and such a settlement would not preclude further private litigation concerning these practices.
US mortgage securitisation activity and litigation
HSBC Bank USA has been involved as a sponsor/seller of loans used to facilitate whole loan securitisations underwritten by HSBC Securities (USA) Inc. (‘HSI’). During 2005-2007, HSBC Bank USA purchased and sold US$24bn of such loans to HSI which were subsequently securitised and sold by HSI to third parties. The outstanding principal balance on these loans was approximately US$6.5bn and US$6bn as at 31 December 2013 and 30 June 2014, respectively.
Participants in the US mortgage securitisation market that purchased and repackaged whole loans have been the subject of lawsuits and governmental and regulatory investigations and inquiries, which have been directed at groups within the US mortgage market such as servicers, originators, underwriters, trustees or sponsors of securitisations, and at particular participants within these groups. As the industry’s residential mortgage foreclosure issues continue, HSBC Bank USA has taken title to an increasing number of foreclosed homes as trustee on behalf of various securitisation trusts. As nominal record owner of these properties, HSBC Bank USA has been sued by municipalities and tenants alleging various violations of law, including laws regarding property upkeep and tenants’ rights. While HSBC believes and continues to maintain that the obligations at issue and the related liability are properly those of the servicer of each trust, HSBC continues to receive significant and adverse publicity in connection with these and similar matters, including foreclosures that are serviced by others in the name of ‘HSBC, as trustee’.
In June 2014, a lawsuit was filed in New York State court against HSBC Bank USA as trustee of 264 trusts (the ‘Trusts’). Similar lawsuits were filed simultaneously against other non-HSBC financial institutions that served as mortgage securitisation pool trustees. The plaintiffs are investors in the trusts and include, among others, BlackRock and PIMCO funds. The lawsuits are brought derivatively on behalf of the trusts. The complaint against HSBC Bank USA alleges that the Trusts have sustained losses in collateral value of over US$32bn. The lawsuit seeks unspecified damages resulting from an alleged breach of the US Trust Indenture Act, breach of fiduciary duties, and negligence. This action is at an early stage.
Various HSBC companies have also been named as defendants in a number of actions in connection with residential mortgage-backed securities (‘RMBS’) offerings, which generally allege that the offering documents for securities issued by securitisation trusts contained material misstatements and omissions, including statements regarding the underwriting standards governing the underlying mortgage loans. These include an action filed in September 2011 by the Federal Housing Finance Agency (‘FHFA’), acting in its capacity as conservator for the Federal National Mortgage Association (‘Fannie Mae’) and the Federal Home Loan Mortgage Corporation (‘Freddie Mac’) in the New York District Court against HSBC Bank USA, HNAH, HSI and HSI Asset Securitization (‘HASCO’) and five former and current officers and directors of HASCO, seeking damages or rescission of mortgage-backed securities purchased by Fannie Mae and Freddie Mac that were either underwritten or sponsored by HSBC companies. The aggregate unpaid principal balance of the securities was approximately US$1.5bn as at 30 June 2014.
This action, captioned Federal Housing Finance Agency, as Conservator for the Federal National Mortgage Association and the Federal Home Loan Mortgage Corporation v. HSBC North America Holdings Inc., et al. (S.D.N.Y. No. CV 11-6189-LAK), is one of a series of similar actions filed against 17 financial institutions alleging violations of federal and state securities laws in connection with the sale of private-label RMBS purchased by Fannie Mae and Freddie Mac, primarily from 2005 to 2008. These actions were transferred to a single judge, who directed the defendant in the first-filed matter, UBS, to file a motion to dismiss. In May 2012, the New York District Court issued its decision denying the motion to dismiss FHFA’s securities law claims and granting the motion to dismiss FHFA’s negligent misrepresentation claims. The New York District Court’s ruling formed the basis for rulings on the other matters, including the action filed against HSBC Bank USA and its affiliates. On 5 April 2013, the US Court of Appeals for the Second Circuit affirmed the ruling of the New York District Court. In January 2013, the FHFA parties met with the Magistrate Judge to discuss how to structure mediation. Since that time, a number of the FHFA defendants have resolved their lawsuits.
Discovery in HSBC’s case continues. Factual discovery closed in December 2013. Expert discovery is scheduled to continue through August 2014. Various defendants’ motions for summary judgement and other applications have been fully briefed and are currently pending before the court. A trial is currently scheduled to begin on 29 September 2014. These dates are subject to change by the court.
H S B C H O L D I N G S P L C
Notes on the Financial Statements (unaudited) (continued) 25 – Legal proceedings and regulatory matters
264
The timing and outcome of this matter are uncertain. It is possible that HSBC could be found liable to pay damages; and based upon the information currently available, it is possible that those damages could be as high as US$1.6bn.
HSBC Bank USA, HSBC Finance and Decision One Mortgage Company LLC (a subsidiary of HSBC Finance) have been named as defendants in a number of mortgage loan repurchase actions brought by trustees of securitisation trusts. In the aggregate, these actions seek to have the HSBC defendants repurchase mortgage loans, or pay compensatory damages in lieu of repurchase, totalling at least US$1bn. Motions to dismiss are fully briefed and pending in two of the actions. HSBC Finance was dismissed, on motion, as a defendant in the third action but the case remains pending against Decision One Mortgage Company LLC.
In December 2010 and February 2011, HSBC Bank USA received subpoenas from the SEC seeking production of documents and information relating to its involvement and the involvement of its affiliates in specified private-label RMBS transactions as an issuer, sponsor, underwriter, depositor, trustee, custodian or servicer. HSBC Bank USA has also had preliminary contacts with other governmental authorities in February 2012 exploring the role of trustees in private-label RMBS transactions. In February 2011, HSBC Bank USA also received a subpoena from the US Attorney’s Office for the Southern District of New York seeking production of documents and information relating to loss mitigation efforts with respect to residential mortgages in the State of New York. In January 2012, HSI was served with a Civil Investigative Demand from the Massachusetts State Attorney General seeking documents, information and testimony related to the sale of RMBS to public and private customers in the State of Massachusetts from January 2005 to the present.
HSBC expects this level of focus on mortgage securitisations to continue. As a result, HSBC companies may be subject to additional claims, litigation and governmental and regulatory scrutiny related to its participation in the US mortgage securitisation market, either individually or as a member of a group.
The timing and outcome of the ultimate resolution of these matters, and the amount of any possible obligations, are highly uncertain.
Anti-money laundering and sanctions-related
In October 2010, HSBC Bank USA entered into a consent cease and desist order with the OCC, and HNAH entered into a consent cease and desist order with the FRB (the ‘Orders’). These Orders required improvements to establish an effective compliance risk management programme across HSBC’s US businesses, including risk management related to US Bank Secrecy Act (‘BSA’) and anti-money laundering (‘AML’) compliance. Steps continue to be taken to address the requirements of the Orders to ensure compliance, and that effective policies and procedures are maintained.
In addition, in December 2012, HSBC Holdings, HNAH and HSBC Bank USA entered into agreements with US and UK government agencies regarding past inadequate compliance with the BSA and AML and sanctions laws. Among those agreements, HSBC Holdings and HSBC Bank USA entered into a five-year deferred prosecution agreement with the DoJ, the US Attorney’s Office for the Eastern District of New York, and the US Attorney’s Office for the Northern District of West Virginia (the ‘US DPA’); HSBC Holdings entered into a two-year deferred prosecution agreement with the New York County District Attorney (the ‘DANY DPA’); and HSBC Holdings consented to a cease and desist order and HSBC Holdings and HNAH consented to a civil money penalty order with the FRB. In addition, HSBC Bank USA entered into a civil money penalty order with FinCEN and a separate civil money penalty order with the OCC. HSBC Holdings also entered into an agreement with the Office of Foreign Assets Control (‘OFAC’) regarding historical transactions involving parties subject to OFAC sanctions and an undertaking with the UK Financial Conduct Authority (‘FCA’), to comply with certain forward-looking AML- and sanctions-related obligations.
Under these agreements, HSBC Holdings and HSBC Bank USA made payments totalling US$1.9bn to US authorities and are continuing to comply with ongoing obligations. On 1 July 2013, the US District Court for the Eastern District of New York approved the US DPA and retained authority to oversee implementation of that agreement. Under the agreements with the DoJ, FCA, and FRB, an independent monitor (who is, for FCA purposes, a ‘skilled person’ under Section 166 of the Financial Services and Markets Act) will evaluate and regularly assess the effectiveness of HSBC’s AML and sanctions compliance function and HSBC’s progress in implementing its remedial obligations under the agreements. The monitorship, which began on 22 July 2013, is proceeding as anticipated.
265
Ove
rvie
w
In
teri
m M
anag
emen
t R
epo
rt
D
irec
tors
Fin
anci
al S
tate
men
ts
A
dd
itio
nal
Info
rmat
ion
If HSBC Holdings and HSBC Bank USA fulfil all of the requirements imposed by the US DPA, the DoJ charges against those entities will be dismissed at the end of the five-year period of that agreement. Similarly, if HSBC Holdings fulfils all of the requirements imposed by the DANY DPA, DANY’s charges against it will be dismissed at the end of the two-year period of that agreement. The DoJ may prosecute HSBC Holdings or HSBC Bank USA in relation to the matters that are the subject of the US DPA if HSBC Holdings or HSBC Bank USA breaches the terms of the US DPA, and DANY may prosecute HSBC Holdings in relation to the matters which are subject of the DANY DPA if HSBC Holdings violates the terms of the DANY DPA.
HSBC Bank USA also entered into a separate consent order with the OCC requiring it to correct the circumstances and conditions as noted in the OCC’s then most recent report of examination, and imposing certain restrictions on HSBC Bank USA directly or indirectly acquiring control of, or holding an interest in, any new financial subsidiary, or commencing a new activity in its existing financial subsidiary, unless it receives prior approval from the OCC. HSBC Bank USA also entered into a separate consent order with the OCC requiring it to adopt an enterprise-wide compliance programme.
The settlement with US and UK authorities does not preclude private litigation relating to, among other things, HSBC’s compliance with applicable AML, BSA and sanctions laws or other regulatory or law enforcement actions for AML, BSA or sanctions matters not covered by the various agreements.
On 7 May 2014, a shareholder derivative action was filed by a shareholder of HSBC Holdings purportedly on behalf of HSBC Holdings, HSBC Bank USA, HNAH and HSBC USA Inc. in New York State Supreme Court against the directors, certain officers and certain former directors and officers of those HSBC companies, alleging that those directors and officers breached their fiduciary duties to the companies and caused a waste of corporate assets by allegedly permitting and/or causing the conduct underlying the US DPA. This action is at an early stage.
Tax and broker-dealer investigations
HSBC continues to cooperate in ongoing investigations by the DoJ and the US Internal Revenue Service regarding whether certain HSBC companies and employees acted appropriately in relation to certain customers who had US tax reporting requirements. In connection with these investigations, HSBC Private Bank Suisse SA, with due regard for Swiss law, has produced records and other documents to the DoJ and is cooperating with its investigation. In August 2013, the DoJ informed HSBC Private Bank Suisse SA that it is not eligible for the ‘Program for Non-Prosecution Agreements or Non-Target Letters for Swiss Banks’ since a formal investigation had been authorised. The DoJ also requested additional information from HSBC Private Bank Suisse SA and other Swiss banks regarding the transfer of assets to and from US person-related accounts and employees who serviced those accounts. HSBC Private Bank Suisse SA is preparing this data, in a manner consistent with Swiss law.
Other HSBC companies are also cooperating with the relevant US authorities, including with respect to US-based clients of an HSBC company in India. In April 2011, HSBC Bank USA received a summons from the US Internal Revenue Service directing HSBC Bank USA to produce records with respect to US-based clients of an HSBC company in India. HSBC Bank USA has cooperated fully by providing responsive documents in its possession in the US to the US Internal Revenue Service.
Also in April 2011, HSBC Bank USA received a subpoena from the SEC directing HSBC Bank USA to produce records in the US related to, among other things, HSBC Private Bank Suisse SA’s cross-border policies and procedures and adherence to US broker-dealer and investment adviser rules and regulations when dealing with US resident clients. HSBC Bank USA continues to cooperate with the SEC. In addition, HSBC Private Bank Suisse SA, with due regard for Swiss law, has produced records and other documents to the SEC and is cooperating with the SEC’s investigation.
In addition, HSBC has been informed that magistrates in Belgium and France are conducting inquiries regarding whether HSBC Private Bank Suisse SA acted appropriately in relation to certain customers who had Belgian and French tax reporting requirements, respectively.
Based on the facts currently known, with respect to each of these investigations, there is a high degree of uncertainty as to the terms on which the ongoing investigations will be resolved and the timing of such resolution, including the amounts of fines and/or penalties. As matters progress, it is possible that the fines and/or penalties imposed could be significant.
H S B C H O L D I N G S P L C
Notes on the Financial Statements (unaudited) (continued) 25 – Legal proceedings and regulatory matters
266
London interbank offered rates, European interbank offered rates and other benchmark interest rate investigations and litigation
Various regulators and competition and enforcement authorities around the world, including in the UK, the US, the EU, Switzerland, Thailand, South Korea, Australia and elsewhere, are conducting investigations and reviews related to certain past submissions made by panel banks and the processes for making submissions in connection with the setting of London interbank offered rates (‘Libor’), European interbank offered rates (‘Euribor’) and other benchmark interest rates. As certain HSBC companies are members of such panels, HSBC has been the subject of regulatory demands for information and is cooperating with those investigations and reviews.
On 4 December 2013, the European Commission (the ‘Commission’) announced that it had imposed fines on eight financial institutions under its cartel settlement procedure for their participation in illegal activity related to euro interest rate derivatives and/or yen interest rate derivatives. Although HSBC was not one of the financial institutions fined, the Commission announced that it had opened proceedings against HSBC in connection with its Euribor-related investigation of euro interest rate derivatives only. This investigation will continue under the standard Commission cartel procedure. On 20 May 2014, HSBC received a Statement of Objections from the Commission, alleging anti-competitive practices in connection with the pricing of euro interest rate derivatives. The Statement of Objections sets out the Commission’s preliminary views and does not prejudge the final outcome of its investigation. HSBC intends to respond to the Commission’s Statement of Objections in due course.
Based on the facts currently known, with respect to each of these ongoing regulatory investigations, reviews and proceedings, there is a high degree of uncertainty as to the terms on which the ongoing investigations, reviews or proceedings will be resolved and the timing of such resolution, including the amounts of fines and/or penalties. As matters progress, it is possible that the fines and/or penalties imposed could be significant.
In addition, HSBC and other panel banks have been named as defendants in a number of private lawsuits filed in the US with respect to the setting of US dollar Libor. These lawsuits include individual and putative class actions, most of which have been transferred and/or consolidated for pre-trial purposes before the New York District Court. The complaints in those actions assert claims against HSBC and other US dollar Libor panel banks under various US laws, including US antitrust and racketeering laws, the US Commodity Exchange Act (‘CEA’), and state law.
In March 2013, the New York District Court overseeing the consolidated proceedings that encompass a number of pending actions related to US dollar Libor issued an opinion and order in the six oldest actions, dismissing the plaintiffs’ federal and state antitrust claims, racketeering claims, and unjust enrichment claims in their entirety, but allowing certain of their CEA claims that were not barred by the applicable statute of limitations to proceed. Some of those plaintiffs appealed the New York District Court’s decision to the US Court of Appeals for the Second Circuit, which later dismissed those appeals on the ground that they were premature. The Court of Appeals also denied the plaintiffs’ subsequent motion for reconsideration. On 30 June 2014, the US Supreme Court agreed to hear the plaintiffs’ appeal from the Court of Appeals’ decision.
Other plaintiffs sought to file amended complaints in the New York District Court to assert additional allegations, and the defendants filed motions to dismiss those amended complaints. On 23 June 2014, the New York District Court issued an opinion and order that, among other things, denied the plaintiffs’ request for leave to amend their complaints to assert additional theories of Libor manipulation against HSBC and certain banks, but granted leave to assert such manipulation claims against two other banks; and granted defendants’ motion to dismiss certain additional claims under the CEA as barred by the applicable statute of limitations. Proceedings with respect to all other actions in the consolidated proceedings were stayed pending this decision, and the New York District Court has not yet ruled on whether and to what extent those other actions may now proceed.
Separately, HSBC and other panel banks have also been named as defendants in a putative class action filed in the New York District Court on behalf of persons who transacted in euroyen futures and options contracts related to the euroyen Tokyo interbank offered rate (‘Tibor’). The complaint alleges, amongst other things, misconduct related to euroyen Tibor, although HSBC is not a member of the Japanese Bankers Association’s euroyen Tibor panel, as well as Japanese yen Libor, in violation of US antitrust laws, the CEA, and state law. In April 2013, the plaintiff filed a second amended complaint, which the defendants moved to dismiss. On 29 March 2014, the New York District Court issued an opinion dismissing the plaintiffs’ claims under the US antitrust laws and state law and sustaining their claims under the CEA. HSBC has moved for reconsideration of that aspect of the opinion sustaining the CEA claims, and that motion remains pending. On 17 June 2014, the plaintiffs moved for leave to file a third amended complaint. HSBC expects to respond to the plaintiffs’ motion in due course.
267
Ove
rvie
w
In
teri
m M
anag
emen
t R
epo
rt
D
irec
tors
Fin
anci
al S
tate
men
ts
A
dd
itio
nal
Info
rmat
ion
In November 2013, HSBC and other panel banks were named as defendants in a putative class action filed in the New York District Court on behalf of persons who transacted in euro futures contracts and other financial instruments related to Euribor. The complaint alleges, amongst other things, misconduct related to Euribor in violation of US antitrust laws, the CEA, and state law. On 2 May 2014, the plaintiffs filed a second amended complaint, and subsequently sought and received leave to file a third amended complaint. By order of the court, the deadline for filing the third amended complaint has been stayed until 9 September 2014 or subsequent order of the court.
Based on the facts currently known, it is not practicable at this time for HSBC to predict the resolution of these private lawsuits, including the timing and potential impact on HSBC.
Foreign exchange rate investigations and litigation
Various regulators and competition and enforcement authorities around the world, including in the UK, the US, the EU, Hong Kong and elsewhere, are conducting investigations and reviews into a number of firms, including HSBC, related to trading on the foreign exchange markets. HSBC and its affiliates in relevant jurisdictions are cooperating with these investigations and reviews. These investigations and reviews are ongoing, and based on the facts currently known there is a high degree of uncertainty as to the terms on which they will be resolved and the timing of such resolutions, including the amounts of fines and/or penalties. As matters progress, it is possible that the fines and/or penalties imposed could be significant.
In addition, in late 2013 and early 2014, HSBC and a number of other banks were named as defendants in various putative class actions filed in the New York District Court on behalf of persons who executed foreign currency trades that settled on the basis of foreign exchange rates published by WM/Reuters or that otherwise occurred during the time periods when the WM/Reuters rates were being set. The complaints allege, amongst other things, that the defendants conspired to manipulate the WM/Reuters foreign exchange rates in violation of US antitrust laws. In February 2014, the New York District Court appointed interim lead class counsel on behalf of putative class members in the US, and such counsel filed a consolidated amended complaint on 31 March 2014. A separate putative class action is also pending on behalf of a putative class comprised of Norwegian citizens. HSBC and other defendants filed motions to dismiss both actions on 30 May 2014. Those motions remain pending.
Based on the facts currently known, it is not practicable at this time for HSBC to predict the resolution of these private lawsuits, including the timing and potential impact on HSBC.
Gold and silver fix-related litigation
Since March 2014, numerous putative class actions have been filed in the US District Courts for the Southern District of New York, the District of New Jersey and the Northern District of California naming HSBC and a number of other members of The London Gold Market Fixing Ltd as defendants. The complaints allege that, from January 2004 to the present, defendants conspired to manipulate the price of gold and gold derivatives during the afternoon London gold fix in order to reap profits on proprietary trades. Plaintiffs have filed a motion for transfer with the Judicial Panel on Multi-District Litigation requesting assignment to and consolidation in the New York District Court. That motion is pending.
In July 2014, putative class actions were filed in the US District Court for the Southern and Eastern Districts of New York naming HSBC and the other members of The London Silver Market Fixing Ltd as defendants. The complaints allege that, from January 2007 to the present, defendants conspired to manipulate the price of physical silver and silver derivatives for their collective benefit in violation of the US Commodity Exchange Act and US antitrust laws. These actions are at a very early stage.
Based on the facts currently known, it is not practicable at this time for HSBC to predict the resolution of these private lawsuits, including the timing and potential impact on HSBC.
Credit default swap regulatory investigation and litigation
In July 2013, HSBC received a Statement of Objections from the Commission relating to its ongoing investigation of alleged anti-competitive activity by a number of market participants in the credit derivatives market between 2006 and 2009. The Statement of Objections sets out the Commission’s preliminary views and does not prejudge the final outcome of its investigation. HSBC has submitted a response and attended an oral hearing in May 2014 at which the other defendants were also present. Following the oral hearing, the Commission decided to conduct a further
H S B C H O L D I N G S P L C
Notes on the Financial Statements (unaudited) (continued) 25 – Legal proceedings / 26 – Events after balance sheet date / 27 – Interim Report 2014
268
investigation phase before deciding whether or how to proceed with the case. HSBC is cooperating with this further investigation. Based on the facts currently known, it is not practicable at this time for HSBC to predict the resolution of this matter, including the timing or potential impact on HSBC.
In addition, HSBC Bank USA, HSBC Holdings and HSBC Bank have been named as defendants, among others, in numerous putative class actions filed in the New York District Court and the Illinois District Court. These class actions allege that the defendants, which include ISDA, Markit and several financial institutions, conspired to restrain trade in violation of the federal antitrust laws by, among other things, restricting access to credit default swap pricing exchanges and blocking new entrants into the exchange market, with the purpose and effect of artificially inflating the bid/ask spread paid to buy and sell credit default swaps in the US. The plaintiffs in these suits purport to represent a class of all persons who purchased credit default swaps from or sold credit default swaps to defendants primarily in the US.
On 16 October 2013, the Judicial Panel on Multi-District Litigation ordered that all cases be consolidated in the New York District Court as In re Credit Default Swaps Antitrust Litigation (MDL No. 2476). On 5 December 2013, the New York District Court held its initial pre-trial conference, at which time it selected lead interim class counsel and set a schedule for the filing of an amended consolidated complaint and motions to dismiss that complaint. The amended consolidated complaint was filed on 31 January 2014, naming HSBC Bank USA and HSBC Bank as defendants, among others. Following the filing of defendants’ motions to dismiss in March 2014, plaintiffs filed a second amended consolidated complaint on 11 April 2014. Defendants moved to dismiss that second amended consolidated complaint on 23 May 2014. That motion remains pending.
Based on the facts currently known, it is not practicable at this time for HSBC to predict the resolution of these private lawsuits, including the timing and potential impact on HSBC.
Economic plans: HSBC Bank Brasil S.A.
In the mid-1980s and early 1990s, certain economic plans were introduced by the government of Brazil to reduce escalating inflation. The implementation of these plans adversely impacted savings account holders, thousands of which consequently commenced legal proceedings against financial institutions in Brazil, including HSBC Bank Brasil S.A. (‘HSBC Brazil’), alleging, among other things, that savings account balances were adjusted by a different price index than that contractually agreed, which caused them a loss of income. Certain of these cases have reached the Brazilian Supreme Court (the ‘Supreme Court’). The proceedings in the Supreme Court were due to commence in February 2014 but have since been postponed without a scheduled start date. The Supreme Court has suspended all cases pending before lower courts until it delivers a final judgement on the constitutionality of the changes resulting from the economic plans. It is anticipated that the outcome of the Supreme Court’s final judgement will set a precedent for all cases pending before the lower courts. Separately, the Brazilian Superior Civil Court (the ‘Superior Civil Court’) is considering matters relating to, among other things, contractual and punitive interest rates to be applied to calculate any loss of income.
There is a high degree of uncertainty as to the terms on which the proceedings in the Supreme Court and Superior Civil Court will be resolved and the timing of such resolutions, including the amount of losses HSBC Brazil may be liable to pay in the event of an unfavourable judgement. Such losses may lie in a range from a relatively insignificant amount to an amount up to US$838m, although the upper end of this range is considered unlikely.
26 Events after the balance sheet date
A second interim dividend for the financial year ending 31 December 2014 was declared by the Directors on 4 August 2014, as described in Note 3.
27 Interim Report 2014 and statutory accounts
The information in this Interim Report 2014 is unaudited and does not constitute statutory accounts within the meaning of section 434 of the Companies Act 2006. The Interim Report 2014 was approved by the Board of Directors on 4 August 2014. The statutory accounts for the year ended 31 December 2013 have been delivered to the Registrar of Companies in England and Wales in accordance with section 447 of the Companies Act 2006. The auditor has reported on those accounts. Its report was unqualified; did not include a reference to any matters to which the auditors drew attention by way of emphasis without qualifying their report; and did not contain a statement under section 498(2) or (3) of the Companies Act 2006.
H S B C H O L D I N G S P L C
Statement of Directors’ Responsibilities Statement
269
Ove
rvie
w
In
teri
m M
anag
emen
t R
epo
rt
D
irec
tors
Fin
anci
al S
tate
men
ts
A
dd
itio
nal
Info
rmat
ion
The Directors, who are required to prepare the financial statements on a going concern basis unless it is not appropriate, are satisfied that the Group has the resources to continue in business for the foreseeable future and that the financial statements continue to be prepared on a going concern basis.
The Directors, the names of whom are set out on pages 199 to 203 of this Interim Report1, confirm that to the best of their knowledge:
• the condensed set of financial statements has been prepared in accordance with IAS 34 ‘Interim Financial Reporting’ as adopted by the EU;
• the Interim Report includes a fair review of the information required by:
(a) DTR 4.2.7R of the Disclosure Rules and Transparency Rules, being an indication of important events that have occurred during the first six months of the financial year ending 31 December 2014 and their impact on the condensed set of financial statements; and a description of the principal risks and uncertainties for the remaining six months of the financial year; and
(b) DTR 4.2.8R of the Disclosure Rules and Transparency Rules, being (i) related party transactions that have taken place in the first six months of the financial year ending 31 December 2014 which have materially affected the financial position or performance of HSBC during that period; and (ii) any changes in the related parties transactions described in the Annual Report and Accounts 2013 that could materially affect the financial position or performance of HSBC during the first six months of the financial year ending 31 December 2014.
On behalf of the Board D J Flint Group Chairman
4 August 2014
1 Other than Marvin Cheung who was not a Director at the date of approval of the Interim Report 2014.
H S B C H O L D I N G S P L C
Independent Review Report by KPMG Audit Plc to HSBC Holdings plc Review report
270
Introduction
We have been engaged by HSBC Holdings plc (‘the Company’) to review the condensed set of financial statements in the half-yearly financial report for the six months ended 30 June 2014 set out on pages 206 to 268 which comprise the consolidated income statement, consolidated statement of comprehensive income, consolidated balance sheet, consolidated statement of cash flows, consolidated statement of changes in equity and related notes. We have read the other information contained in the Interim Report 2014 and considered whether it contains any apparent misstatements or material inconsistencies with the information in the condensed set of financial statements.
This report is made solely to the Company in accordance with the terms of our engagement to assist the Company in meeting the requirements of the Disclosure Rules and Transparency Rules (‘DTR’) of the UK’s Financial Conduct Authority (‘the UK FCA’). Our review has been undertaken so that we might state to the Company those matters we are required to state to it in this report and for no other purpose. To the fullest extent permitted by law, we do not accept or assume responsibility to anyone other than the Company for our review work, for this report, or for the conclusions we have reached.
Directors’ responsibilities
The Interim Report 2014 is the responsibility of, and has been approved by, the Directors. The Directors are responsible for preparing the Interim Report 2014 in accordance with the DTR of the UK FCA. As disclosed in Note 1, the annual financial statements of the Company are prepared in accordance with IFRSs as adopted by the EU. The condensed set of financial statements included in the Interim Report 2014 has been prepared in accordance with IAS 34 Interim Financial Reporting as adopted by the EU.
Our responsibility
Our responsibility is to express to the Company a conclusion on the condensed set of financial statements in the Interim Report 2014 based on our review.
Scope of review
We conducted our review in accordance with International Standard on Review Engagements (UK and Ireland) 2410 Review of Interim Financial Information Performed by the Independent Auditor of the Entity issued by the Auditing Practices Board for use in the UK. A review of interim financial information consists of making enquiries, primarily of persons responsible for financial and accounting matters, and applying analytical and other review procedures. A review is substantially less in scope than an audit conducted in accordance with International Standards on Auditing (UK and Ireland) and consequently does not enable us to obtain assurance that we would become aware of all significant matters that might be identified in an audit. Accordingly, we do not express an audit opinion.
Conclusion
Based on our review, nothing has come to our attention that causes us to believe that the condensed set of financial statements in the Interim Report 2014 for the six months ended 30 June 2014 is not prepared, in all material respects, in accordance with IAS 34 as adopted by the EU and the DTR of the UK FCA.
Guy Bainbridge For and on behalf of KPMG Audit Plc Chartered Accountants London, England 4 August 2014
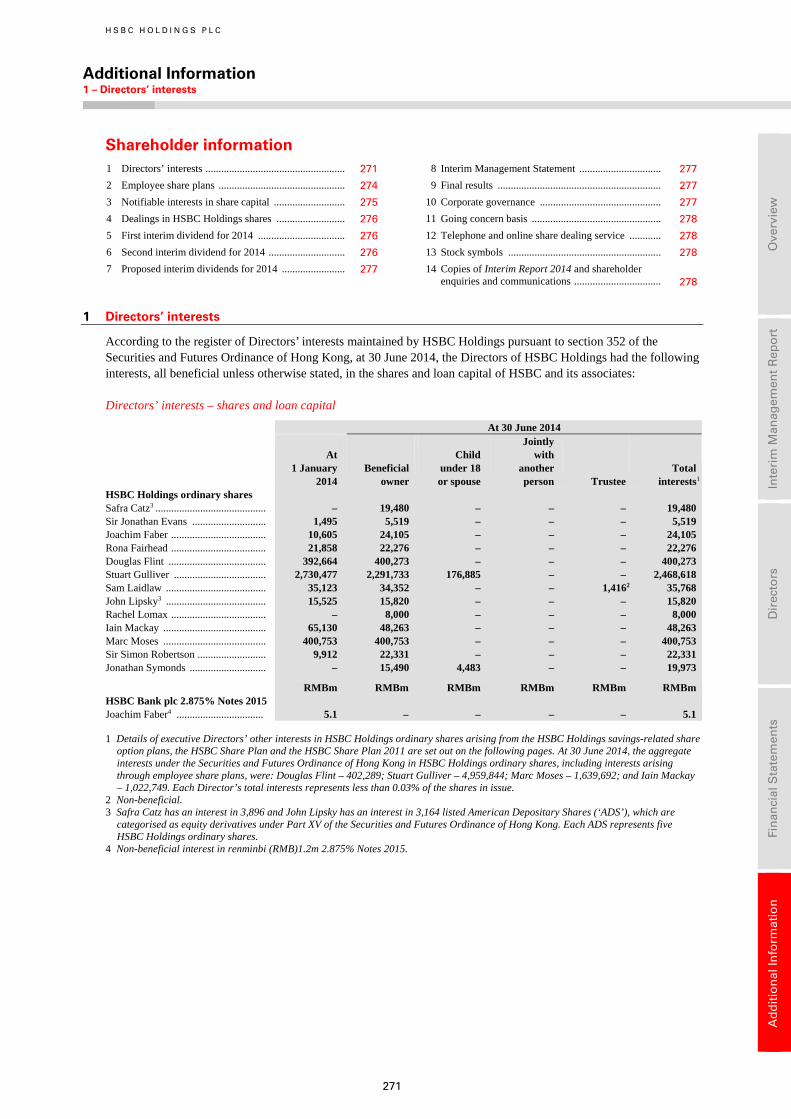
H S B C H O L D I N G S P L C
Additional Information 1 – Directors’ interests
271
Ove
rvie
w
In
teri
m M
anag
emen
t R
epo
rt
D
irec
tors
Fin
anci
al S
tate
men
ts
A
dd
itio
nal
Info
rmat
ion
Shareholder information 1 Directors’ interests ..................................................... 271 8 Interim Management Statement ............................... 277
2 Employee share plans ................................................ 274 9 Final results .............................................................. 277
3 Notifiable interests in share capital ........................... 275 10 Corporate governance .............................................. 277
4 Dealings in HSBC Holdings shares .......................... 276 11 Going concern basis ................................................. 278
5 First interim dividend for 2014 ................................. 276 12 Telephone and online share dealing service ............ 278
6 Second interim dividend for 2014 ............................. 276 13 Stock symbols .......................................................... 278
7 Proposed interim dividends for 2014 ........................ 277 14 Copies of Interim Report 2014 and shareholder enquiries and communications ................................. 278
1 Directors’ interests
According to the register of Directors’ interests maintained by HSBC Holdings pursuant to section 352 of the Securities and Futures Ordinance of Hong Kong, at 30 June 2014, the Directors of HSBC Holdings had the following interests, all beneficial unless otherwise stated, in the shares and loan capital of HSBC and its associates:
Directors’ interests – shares and loan capital
At 30 June 2014
At 1 January 2014
Beneficial owner
Child under 18 or spouse
Jointlywith
anotherperson Trustee
Total interests1
HSBC Holdings ordinary shares Safra Catz3 .......................................... – 19,480 – – – 19,480 Sir Jonathan Evans ............................ 1,495 5,519 – – – 5,519 Joachim Faber .................................... 10,605 24,105 – – – 24,105 Rona Fairhead .................................... 21,858 22,276 – – – 22,276 Douglas Flint ..................................... 392,664 400,273 – – – 400,273 Stuart Gulliver ................................... 2,730,477 2,291,733 176,885 – – 2,468,618 Sam Laidlaw ...................................... 35,123 34,352 – – 1,4162 35,768 John Lipsky3 ...................................... 15,525 15,820 – – – 15,820 Rachel Lomax .................................... – 8,000 – – – 8,000 Iain Mackay ....................................... 65,130 48,263 – – – 48,263 Marc Moses ....................................... 400,753 400,753 – – – 400,753 Sir Simon Robertson .......................... 9,912 22,331 – – – 22,331 Jonathan Symonds ............................. – 15,490 4,483 – – 19,973
RMBm RMBm RMBm RMBm RMBm RMBm HSBC Bank plc 2.875% Notes 2015 Joachim Faber4 ................................. 5.1 – – – – 5.1
1 Details of executive Directors’ other interests in HSBC Holdings ordinary shares arising from the HSBC Holdings savings-related share option plans, the HSBC Share Plan and the HSBC Share Plan 2011 are set out on the following pages. At 30 June 2014, the aggregate interests under the Securities and Futures Ordinance of Hong Kong in HSBC Holdings ordinary shares, including interests arising through employee share plans, were: Douglas Flint – 402,289; Stuart Gulliver – 4,959,844; Marc Moses – 1,639,692; and Iain Mackay – 1,022,749. Each Director’s total interests represents less than 0.03% of the shares in issue.
2 Non-beneficial. 3 Safra Catz has an interest in 3,896 and John Lipsky has an interest in 3,164 listed American Depositary Shares (‘ADS’), which are
categorised as equity derivatives under Part XV of the Securities and Futures Ordinance of Hong Kong. Each ADS represents five HSBC Holdings ordinary shares.
4 Non-beneficial interest in renminbi (RMB)1.2m 2.875% Notes 2015.
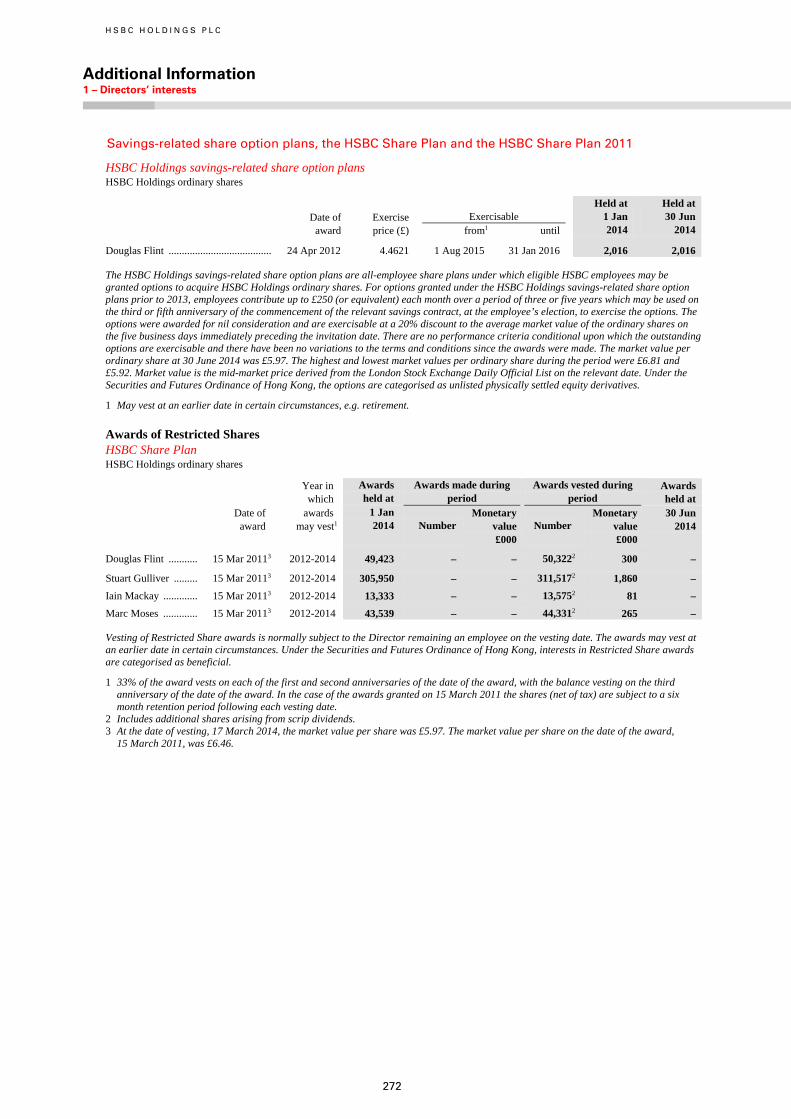
H S B C H O L D I N G S P L C
Additional Information 1 – Directors’ interests
272
Savings-related share option plans, the HSBC Share Plan and the HSBC Share Plan 2011
HSBC Holdings savings-related share option plans HSBC Holdings ordinary shares
Date of award
Exercise price (£)
Held at 1 Jan 2014
Held at 30 Jun 2014
Exercisable from1 until
Douglas Flint ....................................... 24 Apr 2012 4.4621 1 Aug 2015 31 Jan 2016 2,016 2,016
The HSBC Holdings savings-related share option plans are all-employee share plans under which eligible HSBC employees may be granted options to acquire HSBC Holdings ordinary shares. For options granted under the HSBC Holdings savings-related share option plans prior to 2013, employees contribute up to £250 (or equivalent) each month over a period of three or five years which may be used on the third or fifth anniversary of the commencement of the relevant savings contract, at the employee’s election, to exercise the options. The options were awarded for nil consideration and are exercisable at a 20% discount to the average market value of the ordinary shares on the five business days immediately preceding the invitation date. There are no performance criteria conditional upon which the outstanding options are exercisable and there have been no variations to the terms and conditions since the awards were made. The market value per ordinary share at 30 June 2014 was £5.97. The highest and lowest market values per ordinary share during the period were £6.81 and £5.92. Market value is the mid-market price derived from the London Stock Exchange Daily Official List on the relevant date. Under the Securities and Futures Ordinance of Hong Kong, the options are categorised as unlisted physically settled equity derivatives.
1 May vest at an earlier date in certain circumstances, e.g. retirement.
Awards of Restricted Shares HSBC Share Plan HSBC Holdings ordinary shares
Year in Awards Awards made during Awards vested during Awards which held at period period held at Date of awards 1 Jan Monetary Monetary 30 Jun award may vest1 2014 Number value Number value 2014 £000 £000
Douglas Flint ........... 15 Mar 20113 2012-2014 49,423 – – 50,3222 300 –
Stuart Gulliver ......... 15 Mar 20113 2012-2014 305,950 – – 311,5172 1,860 –
Iain Mackay ............. 15 Mar 20113 2012-2014 13,333 – – 13,5752 81 –
Marc Moses ............. 15 Mar 20113 2012-2014 43,539 – – 44,3312 265 –
Vesting of Restricted Share awards is normally subject to the Director remaining an employee on the vesting date. The awards may vest at an earlier date in certain circumstances. Under the Securities and Futures Ordinance of Hong Kong, interests in Restricted Share awards are categorised as beneficial.
1 33% of the award vests on each of the first and second anniversaries of the date of the award, with the balance vesting on the third anniversary of the date of the award. In the case of the awards granted on 15 March 2011 the shares (net of tax) are subject to a six month retention period following each vesting date.
2 Includes additional shares arising from scrip dividends. 3 At the date of vesting, 17 March 2014, the market value per share was £5.97. The market value per share on the date of the award,
15 March 2011, was £6.46.
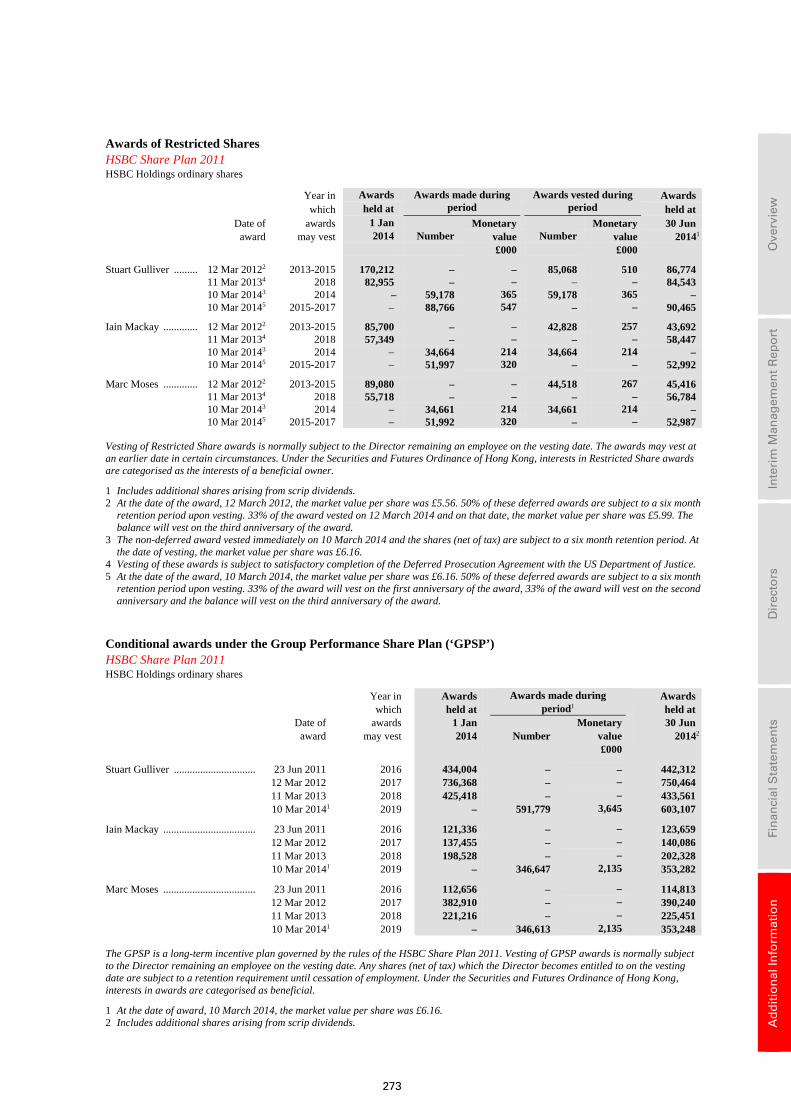
273
Ove
rvie
w
In
teri
m M
anag
emen
t R
epo
rt
D
irec
tors
Fin
anci
al S
tate
men
ts
A
dd
itio
nal
Info
rmat
ion
Awards of Restricted Shares HSBC Share Plan 2011 HSBC Holdings ordinary shares
Year in Awards Awards made during period
Awards vested during period
Awards which held at held at Date of awards 1 Jan Monetary Monetary 30 Jun award may vest 2014 Number value Number value 20141
£000 £000
Stuart Gulliver ......... 12 Mar 20122 2013-2015 170,212 – – 85,068 510 86,774 11 Mar 20134 2018 82,955 – – – – 84,543 10 Mar 20143 2014 – 59,178 365 59,178 365 – 10 Mar 20145 2015-2017 – 88,766 547 – – 90,465
Iain Mackay ............. 12 Mar 20122 2013-2015 85,700 – – 42,828 257 43,692 11 Mar 20134 2018 57,349 – – – – 58,447 10 Mar 20143 2014 – 34,664 214 34,664 214 – 10 Mar 20145 2015-2017 – 51,997 320 – – 52,992
Marc Moses ............. 12 Mar 20122 2013-2015 89,080 – – 44,518 267 45,416 11 Mar 20134 2018 55,718 – – – – 56,784 10 Mar 20143 2014 – 34,661 214 34,661 214 – 10 Mar 20145 2015-2017 – 51,992 320 – – 52,987
Vesting of Restricted Share awards is normally subject to the Director remaining an employee on the vesting date. The awards may vest at an earlier date in certain circumstances. Under the Securities and Futures Ordinance of Hong Kong, interests in Restricted Share awards are categorised as the interests of a beneficial owner.
1 Includes additional shares arising from scrip dividends. 2 At the date of the award, 12 March 2012, the market value per share was £5.56. 50% of these deferred awards are subject to a six month
retention period upon vesting. 33% of the award vested on 12 March 2014 and on that date, the market value per share was £5.99. The balance will vest on the third anniversary of the award.
3 The non-deferred award vested immediately on 10 March 2014 and the shares (net of tax) are subject to a six month retention period. At the date of vesting, the market value per share was £6.16.
4 Vesting of these awards is subject to satisfactory completion of the Deferred Prosecution Agreement with the US Department of Justice. 5 At the date of the award, 10 March 2014, the market value per share was £6.16. 50% of these deferred awards are subject to a six month
retention period upon vesting. 33% of the award will vest on the first anniversary of the award, 33% of the award will vest on the second anniversary and the balance will vest on the third anniversary of the award.
Conditional awards under the Group Performance Share Plan (‘GPSP’) HSBC Share Plan 2011 HSBC Holdings ordinary shares
Date of award
Year in which awards may vest
Awards held at 1 Jan 2014
Awards made during
period1 Awards
held at 30 Jun 20142
Monetary Number value £000
Stuart Gulliver ............................... 23 Jun 2011 2016 434,004 – – 442,312 12 Mar 2012 2017 736,368 – – 750,464 11 Mar 2013 2018 425,418 – – 433,561 10 Mar 20141 2019 – 591,779 3,645 603,107
Iain Mackay ................................... 23 Jun 2011 2016 121,336 – – 123,659 12 Mar 2012 2017 137,455 – – 140,086 11 Mar 2013 2018 198,528 – – 202,328 10 Mar 20141 2019 – 346,647 2,135 353,282
Marc Moses ................................... 23 Jun 2011 2016 112,656 – – 114,813 12 Mar 2012 2017 382,910 – – 390,240 11 Mar 2013 2018 221,216 – – 225,451 10 Mar 20141 2019 – 346,613 2,135 353,248
The GPSP is a long-term incentive plan governed by the rules of the HSBC Share Plan 2011. Vesting of GPSP awards is normally subject to the Director remaining an employee on the vesting date. Any shares (net of tax) which the Director becomes entitled to on the vesting date are subject to a retention requirement until cessation of employment. Under the Securities and Futures Ordinance of Hong Kong, interests in awards are categorised as beneficial.
1 At the date of award, 10 March 2014, the market value per share was £6.16. 2 Includes additional shares arising from scrip dividends.
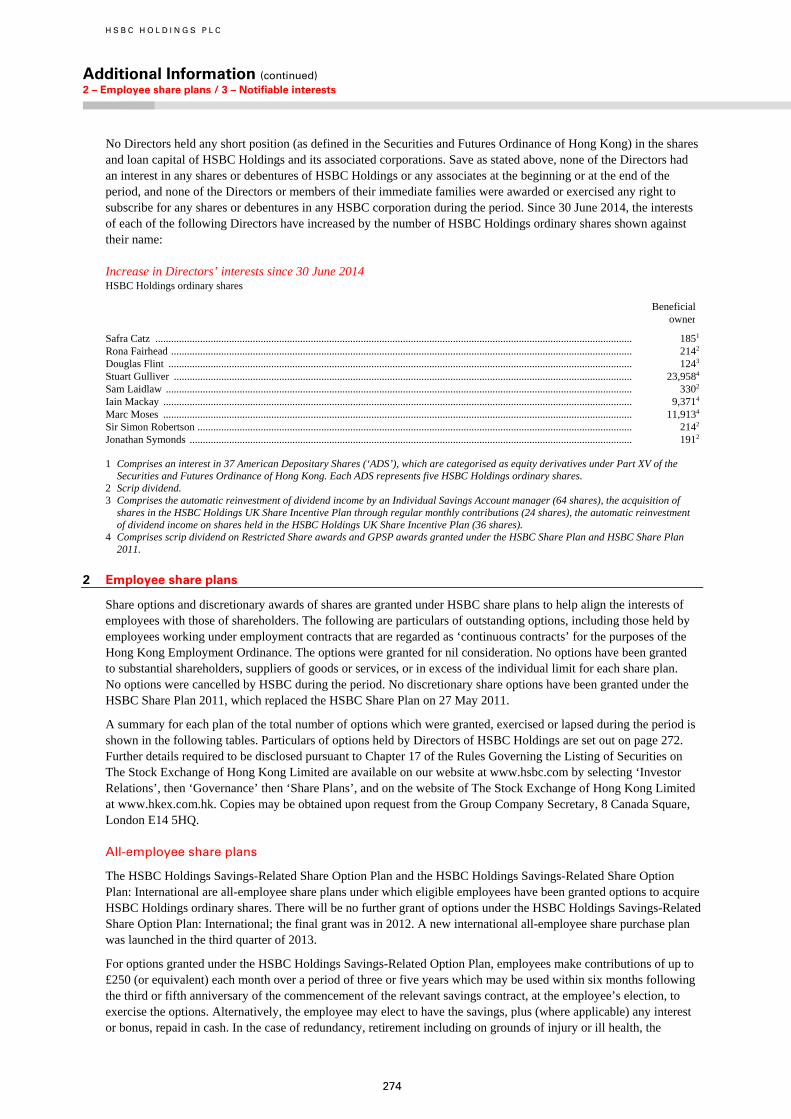
H S B C H O L D I N G S P L C
Additional Information (continued) 2 – Employee share plans / 3 – Notifiable interests
274
No Directors held any short position (as defined in the Securities and Futures Ordinance of Hong Kong) in the shares and loan capital of HSBC Holdings and its associated corporations. Save as stated above, none of the Directors had an interest in any shares or debentures of HSBC Holdings or any associates at the beginning or at the end of the period, and none of the Directors or members of their immediate families were awarded or exercised any right to subscribe for any shares or debentures in any HSBC corporation during the period. Since 30 June 2014, the interests of each of the following Directors have increased by the number of HSBC Holdings ordinary shares shown against their name:
Increase in Directors’ interests since 30 June 2014 HSBC Holdings ordinary shares
Beneficial owner
Safra Catz ..................................................................................................................................................................................... 1851
Rona Fairhead ............................................................................................................................................................................... 2142
Douglas Flint ................................................................................................................................................................................ 1243
Stuart Gulliver .............................................................................................................................................................................. 23,9584
Sam Laidlaw ................................................................................................................................................................................. 3302
Iain Mackay .................................................................................................................................................................................. 9,3714
Marc Moses .................................................................................................................................................................................. 11,9134
Sir Simon Robertson ..................................................................................................................................................................... 2142
Jonathan Symonds ........................................................................................................................................................................ 1912
1 Comprises an interest in 37 American Depositary Shares (‘ADS’), which are categorised as equity derivatives under Part XV of the Securities and Futures Ordinance of Hong Kong. Each ADS represents five HSBC Holdings ordinary shares.
2 Scrip dividend. 3 Comprises the automatic reinvestment of dividend income by an Individual Savings Account manager (64 shares), the acquisition of
shares in the HSBC Holdings UK Share Incentive Plan through regular monthly contributions (24 shares), the automatic reinvestment of dividend income on shares held in the HSBC Holdings UK Share Incentive Plan (36 shares).
4 Comprises scrip dividend on Restricted Share awards and GPSP awards granted under the HSBC Share Plan and HSBC Share Plan 2011.
2 Employee share plans
Share options and discretionary awards of shares are granted under HSBC share plans to help align the interests of employees with those of shareholders. The following are particulars of outstanding options, including those held by employees working under employment contracts that are regarded as ‘continuous contracts’ for the purposes of the Hong Kong Employment Ordinance. The options were granted for nil consideration. No options have been granted to substantial shareholders, suppliers of goods or services, or in excess of the individual limit for each share plan. No options were cancelled by HSBC during the period. No discretionary share options have been granted under the HSBC Share Plan 2011, which replaced the HSBC Share Plan on 27 May 2011.
A summary for each plan of the total number of options which were granted, exercised or lapsed during the period is shown in the following tables. Particulars of options held by Directors of HSBC Holdings are set out on page 272. Further details required to be disclosed pursuant to Chapter 17 of the Rules Governing the Listing of Securities on The Stock Exchange of Hong Kong Limited are available on our website at www.hsbc.com by selecting ‘Investor Relations’, then ‘Governance’ then ‘Share Plans’, and on the website of The Stock Exchange of Hong Kong Limited at www.hkex.com.hk. Copies may be obtained upon request from the Group Company Secretary, 8 Canada Square, London E14 5HQ.
All-employee share plans
The HSBC Holdings Savings-Related Share Option Plan and the HSBC Holdings Savings-Related Share Option Plan: International are all-employee share plans under which eligible employees have been granted options to acquire HSBC Holdings ordinary shares. There will be no further grant of options under the HSBC Holdings Savings-Related Share Option Plan: International; the final grant was in 2012. A new international all-employee share purchase plan was launched in the third quarter of 2013.
For options granted under the HSBC Holdings Savings-Related Option Plan, employees make contributions of up to £250 (or equivalent) each month over a period of three or five years which may be used within six months following the third or fifth anniversary of the commencement of the relevant savings contract, at the employee’s election, to exercise the options. Alternatively, the employee may elect to have the savings, plus (where applicable) any interest or bonus, repaid in cash. In the case of redundancy, retirement including on grounds of injury or ill health, the
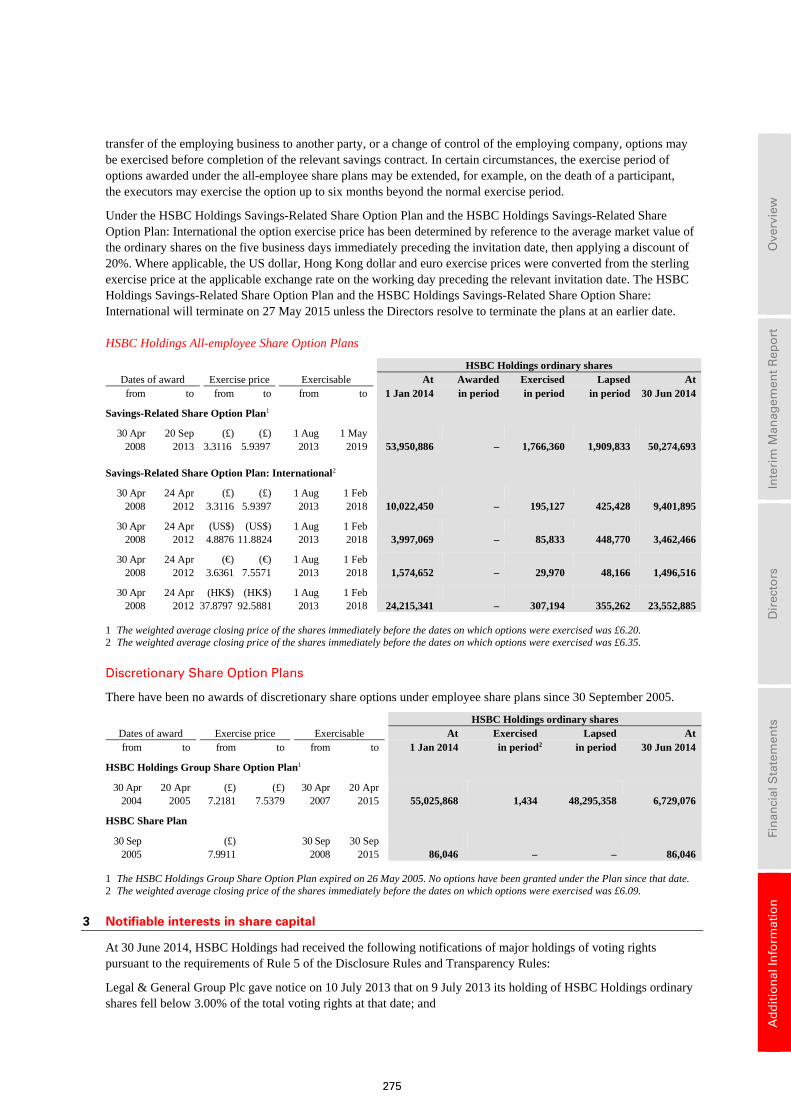
275
Ove
rvie
w
In
teri
m M
anag
emen
t R
epo
rt
D
irec
tors
Fin
anci
al S
tate
men
ts
A
dd
itio
nal
Info
rmat
ion
transfer of the employing business to another party, or a change of control of the employing company, options may be exercised before completion of the relevant savings contract. In certain circumstances, the exercise period of options awarded under the all-employee share plans may be extended, for example, on the death of a participant, the executors may exercise the option up to six months beyond the normal exercise period.
Under the HSBC Holdings Savings-Related Share Option Plan and the HSBC Holdings Savings-Related Share Option Plan: International the option exercise price has been determined by reference to the average market value of the ordinary shares on the five business days immediately preceding the invitation date, then applying a discount of 20%. Where applicable, the US dollar, Hong Kong dollar and euro exercise prices were converted from the sterling exercise price at the applicable exchange rate on the working day preceding the relevant invitation date. The HSBC Holdings Savings-Related Share Option Plan and the HSBC Holdings Savings-Related Share Option Share: International will terminate on 27 May 2015 unless the Directors resolve to terminate the plans at an earlier date.
HSBC Holdings All-employee Share Option Plans
HSBC Holdings ordinary shares Dates of award Exercise price Exercisable At Awarded Exercised Lapsed At
from to from to from to 1 Jan 2014 in period in period in period 30 Jun 2014
Savings-Related Share Option Plan1
30 Apr 2008
20 Sep 2013
(£)3.3116
(£) 5.9397
1 Aug 2013
1 May 2019 53,950,886 – 1,766,360 1,909,833 50,274,693
Savings-Related Share Option Plan: International2
30 Apr 2008
24 Apr 2012
(£) 3.3116
(£) 5.9397
1 Aug 2013
1 Feb 2018 10,022,450 – 195,127 425,428 9,401,895
30 Apr 2008
24 Apr 2012
(US$) 4.8876
(US$) 11.8824
1 Aug 2013
1 Feb 2018 3,997,069 – 85,833 448,770 3,462,466
30 Apr 2008
24 Apr 2012
(€) 3.6361
(€) 7.5571
1 Aug 2013
1 Feb 2018 1,574,652 – 29,970 48,166 1,496,516
30 Apr 2008
24 Apr 2012
(HK$)37.8797
(HK$) 92.5881
1 Aug 2013
1 Feb 2018 24,215,341 – 307,194 355,262 23,552,885
1 The weighted average closing price of the shares immediately before the dates on which options were exercised was £6.20. 2 The weighted average closing price of the shares immediately before the dates on which options were exercised was £6.35.
Discretionary Share Option Plans
There have been no awards of discretionary share options under employee share plans since 30 September 2005.
HSBC Holdings ordinary shares Dates of award Exercise price Exercisable At Exercised Lapsed At
from to from to from to 1 Jan 2014 in period2 in period 30 Jun 2014
HSBC Holdings Group Share Option Plan1
30 Apr 2004
20 Apr 2005
(£) 7.2181
(£) 7.5379
30 Apr 2007
20 Apr 2015 55,025,868 1,434 48,295,358 6,729,076
HSBC Share Plan
30 Sep 2005
(£) 7.9911
30 Sep 2008
30 Sep 2015 86,046 – – 86,046
1 The HSBC Holdings Group Share Option Plan expired on 26 May 2005. No options have been granted under the Plan since that date. 2 The weighted average closing price of the shares immediately before the dates on which options were exercised was £6.09.
3 Notifiable interests in share capital
At 30 June 2014, HSBC Holdings had received the following notifications of major holdings of voting rights pursuant to the requirements of Rule 5 of the Disclosure Rules and Transparency Rules:
Legal & General Group Plc gave notice on 10 July 2013 that on 9 July 2013 its holding of HSBC Holdings ordinary shares fell below 3.00% of the total voting rights at that date; and
H S B C H O L D I N G S P L C
Additional Information (continued) 4 – Dealings / 5 – First interim / 6 – Second interim / 7 – Dividends / 8 – IMS / 9 – Final results / 10 – Corporate governance
276
• BlackRock, Inc. gave notice on 9 December 2009 that on 7 December 2009 it had the following: an indirect interest in HSBC Holdings ordinary shares of 1,142,439,457; qualifying financial instruments with 705,100 voting rights that may be acquired if the instruments are exercised or converted; and financial instruments with similar economic effect to qualifying financial instruments which refer to 234,880 voting rights, each representing 6.56%, 0.0041% and 0.0013%, respectively, of the total voting rights at that date.
At 30 June 2014, according to the register maintained by HSBC Holdings pursuant to section 336 of the Securities and Futures Ordinance of Hong Kong:
• JPMorgan Chase & Co. gave notice on 29 May 2014 that on 27 May 2014 it had the following interests in HSBC Holdings ordinary shares: a long position of 1,282,599,404 shares; a short position of 129,880,547 shares; and a lending pool of 867,737,345 shares, each representing 6.72%, 0.68% and 4.55%, respectively, of the ordinary shares in issue at that date; and
• BlackRock, Inc. gave notice on 8 January 2013 that on 3 January 2013 it had the following interests in HSBC Holdings ordinary shares: a long position of 1,110,172,768 shares and a short position of 35,234,325 shares, each representing 6.00% and 0.19%, respectively, of the ordinary shares in issue at that date.
4 Dealings in HSBC Holdings shares
Except for dealings as intermediaries by HSBC Bank plc and The Hongkong and Shanghai Banking Corporation Limited, which are members of a European Economic Area exchange, neither HSBC Holdings nor any of its subsidiaries have purchased, sold or redeemed any of its listed securities during the six months to 30 June 2014.
5 First interim dividend for 2014
The first interim dividend for 2014 of US$0.10 per ordinary share was paid on 10 July 2014.
6 Second interim dividend for 2014
On 4 August 2014, the Directors declared a second interim dividend for 2014 of US$0.10 per ordinary share. The second interim dividend will be payable on 9 October 2014 to holders of record on 21 August 2014 on the Hong Kong Overseas Branch Register and to holders of record on 22 August 2014 on the Principal Register in the United Kingdom or the Bermuda Overseas Branch Register. The dividend will be payable in cash, US dollars, sterling or Hong Kong dollars, or a combination of these currencies, at the forward exchange rates quoted by HSBC Bank plc in London at or about 11.00am on 29 September 2014. A scrip dividend will also be offered. Particulars of these arrangements will be sent to shareholders on or about 3 September 2014 and elections must be received by 25 September 2014.
The dividend will be payable on ordinary shares held through Euroclear France, the settlement and central depositary system for Euronext Paris, on 9 October 2014 to the holders of record on 22 August 2014. The dividend will be payable by Euroclear France in cash, in euros, at the forward exchange rate quoted by HSBC France on 29 September 2014, or as a scrip dividend. Particulars of these arrangements will be announced through Euronext Paris on 5 August 2014 and 28 August 2014.
The dividend will be payable on ADSs, each of which represents five ordinary shares, on 9 October 2014 to holders of record on 22 August 2014. The dividend of US$0.50 per ADS will be payable by the depositary in cash, in US dollars or as a scrip dividend of new ADSs. Elections must be received by the depositary on or before 19 September 2014. Alternatively, the cash dividend may be invested in additional ADSs for participants in the dividend reinvestment plan operated by the depositary.
Ordinary shares will be quoted ex-dividend in London, Hong Kong, Paris and Bermuda on 20 August 2014. The ADSs will be quoted ex-dividend in New York on 20 August 2014.
Any person who has acquired ordinary shares registered on the Hong Kong Overseas Branch Register but who has not lodged the share transfer with the Hong Kong Branch Registrar should do so before 4.00pm on 21 August 2014 in order to receive the dividend.
Any person who has acquired ordinary shares registered on the Principal Register in the United Kingdom or on the Bermuda Overseas Branch Register but who has not lodged the share transfer with the Principal Registrar or the
277
Ove
rvie
w
In
teri
m M
anag
emen
t R
epo
rt
D
irec
tors
Fin
anci
al S
tate
men
ts
A
dd
itio
nal
Info
rmat
ion
Bermuda Overseas Branch Registrar respectively, should do so before 4.00pm on 22 August 2014 in order to receive the dividend.
Removals of ordinary shares may not be made to or from the Hong Kong Overseas Branch Register on 22 August 2014. Accordingly, any person who wishes to remove ordinary shares to the Hong Kong Overseas Branch Register must lodge the removal request with the Principal Registrar in the United Kingdom or the Bermuda Branch Registrar by 4.00pm on 20 August 2014. Any person who wishes to remove ordinary shares from the Hong Kong Overseas Branch Register must lodge the removal request with the Hong Kong Branch Registrar by 4.00pm on 21 August 2014.
Transfers of ADSs must be lodged with the depositary by 12 noon on 22 August 2014 in order to receive the dividend.
7 Proposed interim dividends for 2014
The Board has adopted a policy of paying quarterly dividends on the ordinary shares. Under this policy it is intended to have a pattern of three equal interim dividends with a variable fourth interim dividend. The timetables for dividends payable on the ordinary shares in respect of 2014 that have not yet been declared are expected to be as follows:
Third interim dividend for 2014
Fourth interim dividend for 2014
Announcement .................................................................................................................. 6 October 2014 23 February 2015 Shares quoted ex-dividend in London, Hong Kong, Paris and Bermuda ........................ 23 October 2014 12 March 2015 ADSs quoted ex-dividend in New York .......................................................................... 22 October 2014 11 March 2015 Record date in London, Hong Kong, New York, Paris and Bermuda ............................. 24 October 2014 13 March 2015 Payment date ..................................................................................................................... 10 December 2014 7 May 2015
8 Interim Management Statement
An Interim Management Statement for the three-month period ending 30 September 2014 is expected to be issued on 3 November 2014.
9 Final results
The results for the year to 31 December 2014 are expected to be announced on 23 February 2015.
10 Corporate governance
HSBC is committed to high standards of corporate governance.
Throughout the six months to 30 June 2014, HSBC Holdings has complied with the applicable code provisions of: (i) The UK Corporate Governance Code issued by the Financial Reporting Council and (ii) the Hong Kong Corporate Governance Code set out in Appendix 14 to the Rules Governing the Listing of Securities on The Stock Exchange of Hong Kong Limited, save that the Group Risk Committee (all the members of which are independent non-executive Directors), which was established in accordance with the recommendations of the review on corporate governance in UK banks and other financial industry entities (‘The Walker Report’), is responsible for the oversight of internal control (other than internal controls over financial reporting) and risk management systems (Hong Kong Corporate Governance Code provision C.3.3 paragraphs (f), (g) and (h)). In the absence of the Group Risk Committee, these matters would be the responsibility of the Group Audit Committee. The UK Corporate Governance Code is available at www.frc.org.uk and the Hong Kong Corporate Governance Code is available at www.hkex.com.hk.
The Board of HSBC Holdings has adopted a code of conduct for transactions in HSBC Group securities by Directors. The code of conduct complies with The Model Code in the Listing Rules of the Financial Conduct Authority and with The Model Code for Securities Transactions by Directors of Listed Issuers (‘Hong Kong Model Code’) set out in the Rules Governing the Listing of Securities on The Stock Exchange of Hong Kong Limited, save that The Stock Exchange of Hong Kong Limited has granted certain waivers from strict compliance with the Hong Kong Model Code. The waivers granted by The Stock Exchange of Hong Kong Limited primarily take into account accepted practices in the UK, particularly in respect of employee share plans. Following a specific enquiry, each Director has confirmed that he or she has complied with the code of conduct for transactions in HSBC Group securities throughout the period.
H S B C H O L D I N G S P L C
Additional Information (continued) 11 – Going concern / 12 – Share dealing / 13 – Stock symbols / 14 – Shareholder enquiries
278
There have been no material changes to the information disclosed in the Annual Report and Accounts 2013 in respect of the number and remuneration of employees, remuneration policies, bonus and share option plans and training schemes.
The biographies of Directors on pages 199 to 203 include changes during 2014 and the updated information required pursuant to rule 13.51B (1) of the Rules Governing the Listing of Securities on The Stock Exchange of Hong Kong Limited.
11 Going concern basis
As mentioned in Note 1 Basis of preparation on page 214, the financial statements are prepared on the going concern basis, as the Directors are satisfied that the Group has the resources to continue in business for the foreseeable future. In making this assessment, the Directors have considered a wide range of information relating to present and future conditions, including projections of profitability, cash flows and capital resources. Further information relevant to the assessment is provided elsewhere in this Interim Report 2014.
In particular, HSBC’s principal activities, business and operating models, strategic direction and top and emerging risks are addressed in the ‘Overview’ section; a financial summary, including a review of the consolidated income statement and consolidated balance sheet, is provided in the ‘Interim Management Report’ section; HSBC’s objectives, policies and processes for managing credit, liquidity and market risk are described in the ‘Risk’ section; and HSBC’s approach to capital management and allocation is described in the ‘Capital’ section.
12 Telephone and online share dealing service
For shareholders on the Principal Register who are resident in the UK, Channel Islands or Isle of Man with a UK, Channel Islands or Isle of Man postal address, and who hold an HSBC Bank personal current account, the HSBC InvestDirect share dealing service is available for buying and selling HSBC Holdings ordinary shares. Details are available from: HSBC InvestDirect, PO Box 1683, Frobisher House, Nelson Gate, Southampton, SO15 9DG, UK telephone: 08456 002 469, overseas telephone: +44 (0) 1226 261090, web: www.hsbc.co.uk/shares.
13 Stock symbols
HSBC Holdings plc ordinary shares trade under the following stock symbols:
London Stock Exchange HSBA Hong Kong Stock Exchange 5 New York Stock Exchange (ADS) HSBC Euronext Paris HSB Bermuda Stock Exchange HSBC.BH
14 Copies of the Interim Report 2014 and shareholder enquiries and communications
Further copies of the Interim Report 2014 may be obtained from Global Communications, HSBC Holdings plc, 8 Canada Square, London E14 5HQ, United Kingdom; from Communications (Asia), The Hongkong and Shanghai Banking Corporation Limited, 1 Queen’s Road Central, Hong Kong; or from Global Publishing Services, HSBC – North America, 7th Floor, 10 East 40th Street, New York, 10018, USA. The Interim Report 2014 may also be downloaded from the HSBC website, www.hsbc.com.
Shareholders may at any time choose to receive corporate communications in printed form or to receive notifications of their availability on HSBC’s website. To receive future notifications of the availability of a corporate communication on HSBC’s website by email, or to revoke or amend an instruction to receive such notifications by email, go to www.hsbc.com/ecomms. If you provide an email address to receive electronic communications from HSBC, we will also send notifications of your dividend entitlements by email. If you received a notification of the availability of this document on HSBC’s website and would like to receive a printed copy of it or, if you would like to receive future corporate communications in printed form, please write or send an email (quoting your shareholder reference number) to the appropriate Registrar at the address given below. Printed copies will be provided without charge.
Any enquiries relating to your shareholdings on the share register, for example transfers of shares, change of name or address, lost share certificates or dividend cheques, should be sent to the Registrar at the address given below. The
279
Ove
rvie
w
In
teri
m M
anag
emen
t R
epo
rt
D
irec
tors
Fin
anci
al S
tate
men
ts
A
dd
itio
nal
Info
rmat
ion
Registrar offers an online facility, Investor Centre, which enables shareholders to manage their shareholding electronically.
Principal Register Hong Kong Overseas Branch Register Bermuda Overseas Branch Register
Computershare Investor Services PLC The Pavilions Bridgwater Road Bristol BS99 6ZZ United Kingdom Telephone: +44 (0) 870 702 0137 Email via website: www.investorcentre.co.uk/contactus Investor Centre: www.investorcentre.co.uk
Computershare Hong Kong Investor Services Limited
Rooms 1712-1716, 17th Floor Hopewell Centre 183 Queen’s Road East Hong Kong Telephone: +852 2862 8555 Email: [email protected] Investor Centre: www.investorcentre.com/hk
Investor Relations Team HSBC Bank Bermuda Limited 6 Front Street Hamilton HM 11 Bermuda Telephone: +1 441 299 6737 Email: [email protected] Investor Centre: www.investorcentre.co.uk/bm
Any enquiries relating to ADSs should be sent to the depositary at:
BNY Mellon Shareowner Services PO Box 30170 College Station, TX 77842-3170 USA
Overnight correspondence should be sent to:
BNY Mellon Shareowner Services 211 Quality Circle, Suite 210 College Station, TX 77845
Telephone (US): +1 877 283 5786 Telephone (international): +1 201 680 6825 Email: [email protected] Website: www.mybnymdr.com
Any enquiries relating to shares held through Euroclear France, the settlement and central depositary system for NYSE Euronext Paris, should be sent to the paying agent:
HSBC France 103, avenue des Champs Elysées 75419 Paris Cedex 08 France Telephone: +33 1 40 70 22 56 Email: [email protected] Website: www.hsbc.fr
A Chinese translation of this and future documents may be obtained on request from the Registrar. Please also contact the Registrar if you have received a Chinese translation of this document and do not wish to receive such translations in future.
Persons whose shares are held on their behalf by another person may have been nominated to receive communications from HSBC pursuant to section 146 of the UK Companies Act 2006 (‘nominated person’). The main point of contact for a nominated person remains the registered shareholder (for example your stockbroker, investment manager, custodian or other person who manages the investment on your behalf). Any changes or queries relating to a nominated person’s personal details and holding (including any administration thereof) must continue to be directed to the registered shareholder and not HSBC’s Registrar. The only exception is where HSBC, in exercising one of its powers under the UK Companies Act 2006, writes to nominated persons directly for a response.
H S B C H O L D I N G S P L C
Additional Information (continued) Cautionary statement // Abbreviations
280
Cautionary statement regarding forward-looking statements
The Interim Report 2014 contains certain forward-looking statements with respect to HSBC’s financial condition, results of operations and business.
Statements that are not historical facts, including statements about HSBC’s beliefs and expectations, are forward-looking statements. Words such as ‘expects’, ‘anticipates’, ‘intends’, ‘plans’, ‘believes’, ‘seeks’, ‘estimates’, ‘potential’ and ‘reasonably possible’, variations of these words and similar expressions are intended to identify forward-looking statements. These statements are based on current plans, estimates and projections, and therefore undue reliance should not be placed on them. Forward-looking statements speak only as of the date they are made. HSBC makes no commitment to revise or update any forward-looking statements to reflect events or circumstances occurring or existing after the date of any forward-looking statements.
Written and/or oral forward-looking statements may also be made in the periodic reports to the US Securities and Exchange Commission, summary financial statements to shareholders, proxy statements, offering circulars and prospectuses, press releases and other written materials, and in oral statements made by HSBC’s Directors, officers or employees to third parties, including financial analysts.
Forward-looking statements involve inherent risks and uncertainties. Readers are cautioned that a number of factors could cause actual results to differ, in some instances materially, from those anticipated or implied in any forward-looking statement. These include, but are not limited to:
• changes in general economic conditions in the markets in which we operate, such as continuing or deepening recessions and fluctuations in employment beyond those factored into consensus forecasts; changes in foreign exchange rates and interest rates; volatility in equity markets; lack of liquidity in wholesale funding markets; illiquidity and downward price pressure in national real estate markets; adverse changes in central banks’ policies with respect to the provision of liquidity support to financial markets; heightened market concerns over sovereign creditworthiness in over-indebted countries; adverse changes in the funding status of public or private defined benefit pensions;
and consumer perception as to the continuing availability of credit and price competition in the market segments we serve;
• changes in government policy and regulation, including the monetary, interest rate and other policies of central banks and other regulatory authorities; initiatives to change the size, scope of activities and interconnectedness of financial institutions in connection with the implementation of stricter regulation of financial institutions in key markets worldwide; revised capital and liquidity benchmarks which could serve to deleverage bank balance sheets and lower returns available from the current business model and portfolio mix; imposition of levies or taxes designed to change business mix and risk appetite; the practices, pricing or responsibilities of financial institutions serving their consumer markets; expropriation, nationalisation, confiscation of assets and changes in legislation relating to foreign ownership; changes in bankruptcy legislation in the principal markets in which we operate and the consequences thereof; general changes in government policy that may significantly influence investor decisions; extraordinary government actions as a result of current market turmoil; other unfavourable political or diplomatic developments producing social instability or legal uncertainty which in turn may affect demand for our products and services; the costs, effects and outcomes of product regulatory reviews, actions or litigation, including any additional compliance requirements; and the effects of competition in the markets where we operate including increased competition from non-bank financial services companies, including securities firms; and
• factors specific to HSBC, including our success in adequately identifying the risks we face, such as the incidence of loan losses or delinquency, and managing those risks (through account management, hedging and other techniques). Effective risk management depends on, among other things, our ability through stress testing and other techniques to prepare for events that cannot be captured by the statistical models it uses; and our success in addressing operational, legal and regulatory, and litigation challenges, notably compliance with the DPAs.
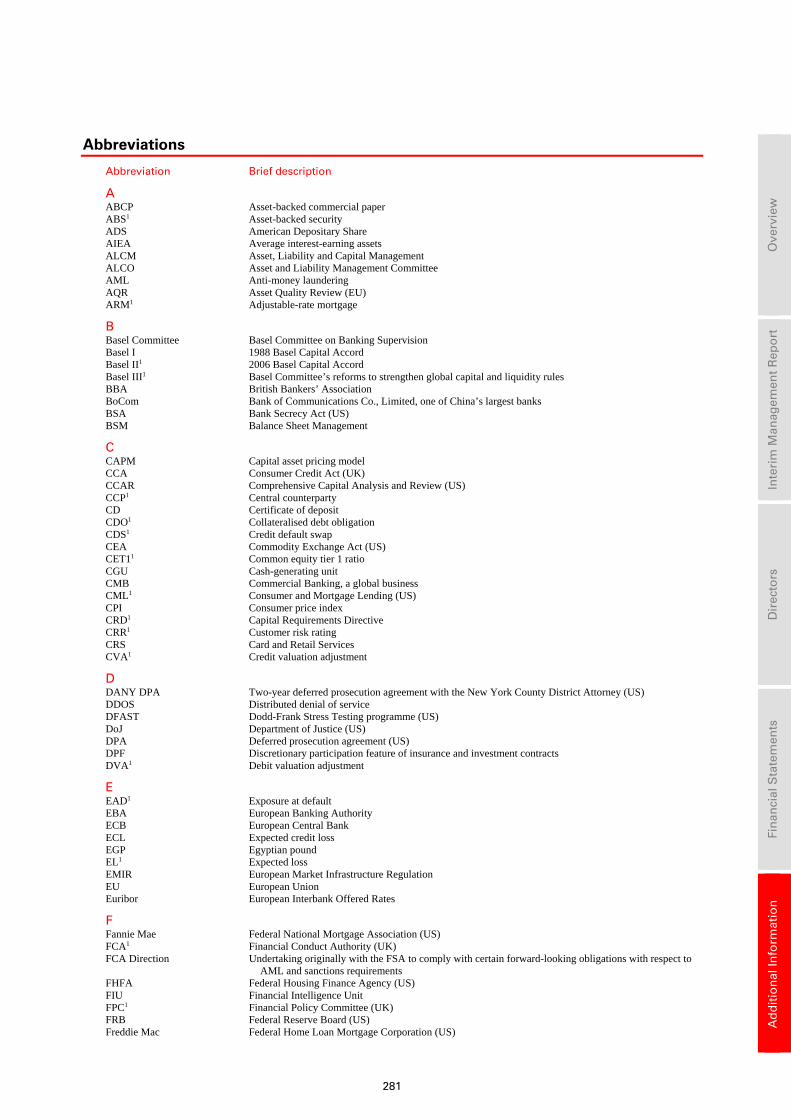
281
Ove
rvie
w
In
teri
m M
anag
emen
t R
epo
rt
D
irec
tors
Fin
anci
al S
tate
men
ts
A
dd
itio
nal
Info
rmat
ion
Abbreviations
Abbreviation Brief description
A
ABCP Asset-backed commercial paper ABS1 Asset-backed security ADS American Depositary Share AIEA Average interest-earning assets ALCM Asset, Liability and Capital Management ALCO Asset and Liability Management Committee AML Anti-money laundering AQR Asset Quality Review (EU) ARM1 Adjustable-rate mortgage
B Basel Committee Basel Committee on Banking Supervision Basel I 1988 Basel Capital Accord Basel II1 2006 Basel Capital Accord Basel III1 Basel Committee’s reforms to strengthen global capital and liquidity rules BBA British Bankers’ Association BoCom Bank of Communications Co., Limited, one of China’s largest banks BSA Bank Secrecy Act (US) BSM Balance Sheet Management
C CAPM Capital asset pricing model CCA Consumer Credit Act (UK) CCAR Comprehensive Capital Analysis and Review (US) CCP1 Central counterparty CD Certificate of deposit CDO1 Collateralised debt obligation CDS1 Credit default swap CEA Commodity Exchange Act (US) CET11 Common equity tier 1 ratio CGU Cash-generating unit CMB Commercial Banking, a global business CML1 Consumer and Mortgage Lending (US) CPI Consumer price index CRD1 Capital Requirements Directive CRR1 Customer risk rating CRS Card and Retail Services CVA1 Credit valuation adjustment
D DANY DPA Two-year deferred prosecution agreement with the New York County District Attorney (US) DDOS Distributed denial of service DFAST Dodd-Frank Stress Testing programme (US) DoJ Department of Justice (US) DPA Deferred prosecution agreement (US) DPF Discretionary participation feature of insurance and investment contracts DVA1 Debit valuation adjustment
E EAD1 Exposure at default EBA European Banking Authority ECB European Central Bank ECL Expected credit loss EGP Egyptian pound EL1 Expected loss EMIR European Market Infrastructure Regulation EU European Union Euribor European Interbank Offered Rates
F Fannie Mae Federal National Mortgage Association (US) FCA1 Financial Conduct Authority (UK) FCA Direction Undertaking originally with the FSA to comply with certain forward-looking obligations with respect to
AML and sanctions requirements FHFA Federal Housing Finance Agency (US) FIU Financial Intelligence Unit FPC1 Financial Policy Committee (UK) FRB Federal Reserve Board (US) Freddie Mac Federal Home Loan Mortgage Corporation (US)
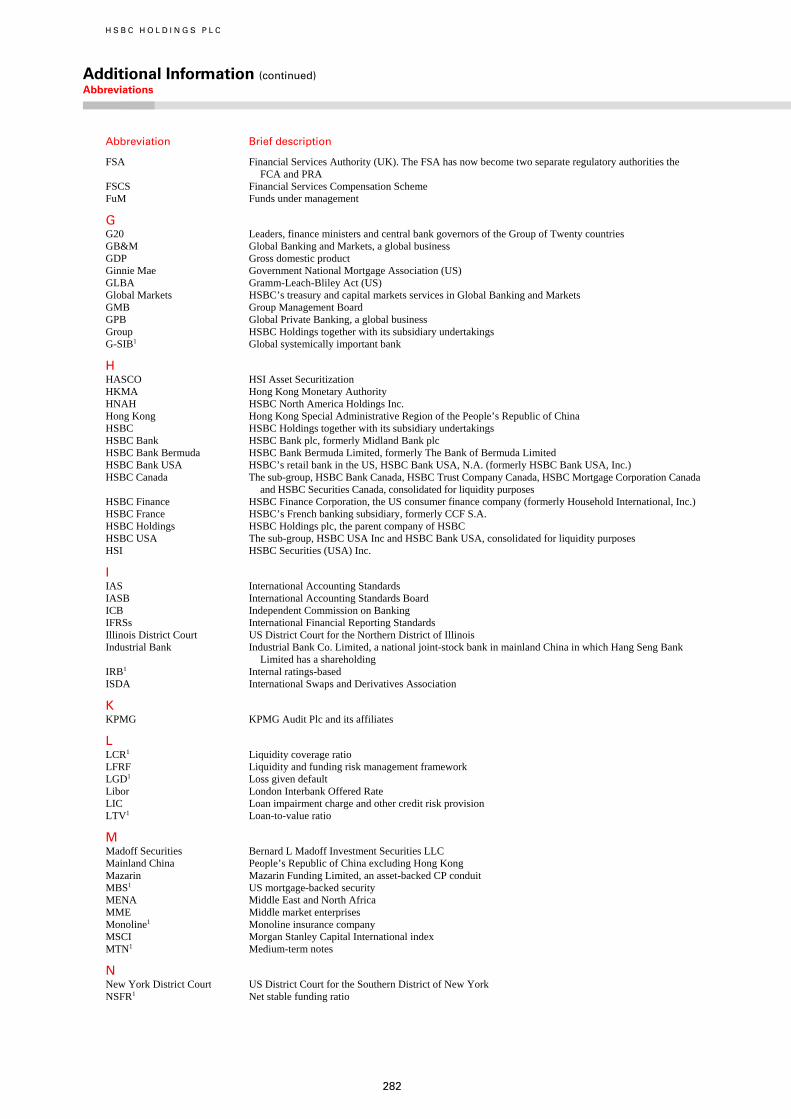
H S B C H O L D I N G S P L C
Additional Information (continued) Abbreviations
282
Abbreviation Brief description
FSA Financial Services Authority (UK). The FSA has now become two separate regulatory authorities the FCA and PRA
FSCS Financial Services Compensation Scheme FuM Funds under management
G G20 Leaders, finance ministers and central bank governors of the Group of Twenty countries GB&M Global Banking and Markets, a global business GDP Gross domestic product Ginnie Mae Government National Mortgage Association (US) GLBA Gramm-Leach-Bliley Act (US) Global Markets HSBC’s treasury and capital markets services in Global Banking and Markets GMB Group Management Board GPB Global Private Banking, a global business Group HSBC Holdings together with its subsidiary undertakings G-SIB1 Global systemically important bank
H HASCO HSI Asset Securitization HKMA Hong Kong Monetary Authority HNAH HSBC North America Holdings Inc. Hong Kong Hong Kong Special Administrative Region of the People’s Republic of China HSBC HSBC Holdings together with its subsidiary undertakings HSBC Bank HSBC Bank plc, formerly Midland Bank plc HSBC Bank Bermuda HSBC Bank Bermuda Limited, formerly The Bank of Bermuda Limited HSBC Bank USA HSBC’s retail bank in the US, HSBC Bank USA, N.A. (formerly HSBC Bank USA, Inc.) HSBC Canada The sub-group, HSBC Bank Canada, HSBC Trust Company Canada, HSBC Mortgage Corporation Canada
and HSBC Securities Canada, consolidated for liquidity purposes HSBC Finance HSBC Finance Corporation, the US consumer finance company (formerly Household International, Inc.) HSBC France HSBC’s French banking subsidiary, formerly CCF S.A. HSBC Holdings HSBC Holdings plc, the parent company of HSBC HSBC USA The sub-group, HSBC USA Inc and HSBC Bank USA, consolidated for liquidity purposes HSI HSBC Securities (USA) Inc.
I IAS International Accounting Standards IASB International Accounting Standards Board ICB Independent Commission on Banking IFRSs International Financial Reporting Standards Illinois District Court US District Court for the Northern District of Illinois Industrial Bank Industrial Bank Co. Limited, a national joint-stock bank in mainland China in which Hang Seng Bank
Limited has a shareholding IRB1 Internal ratings-based ISDA International Swaps and Derivatives Association
K KPMG KPMG Audit Plc and its affiliates
L LCR1 Liquidity coverage ratio LFRF Liquidity and funding risk management framework LGD1 Loss given default Libor London Interbank Offered Rate LIC Loan impairment charge and other credit risk provision LTV1 Loan-to-value ratio
M
Madoff Securities Bernard L Madoff Investment Securities LLC Mainland China People’s Republic of China excluding Hong Kong Mazarin Mazarin Funding Limited, an asset-backed CP conduit MBS1 US mortgage-backed security MENA Middle East and North Africa MME Middle market enterprises Monoline1 Monoline insurance company MSCI Morgan Stanley Capital International index MTN1 Medium-term notes
N
New York District Court US District Court for the Southern District of New York NSFR1 Net stable funding ratio
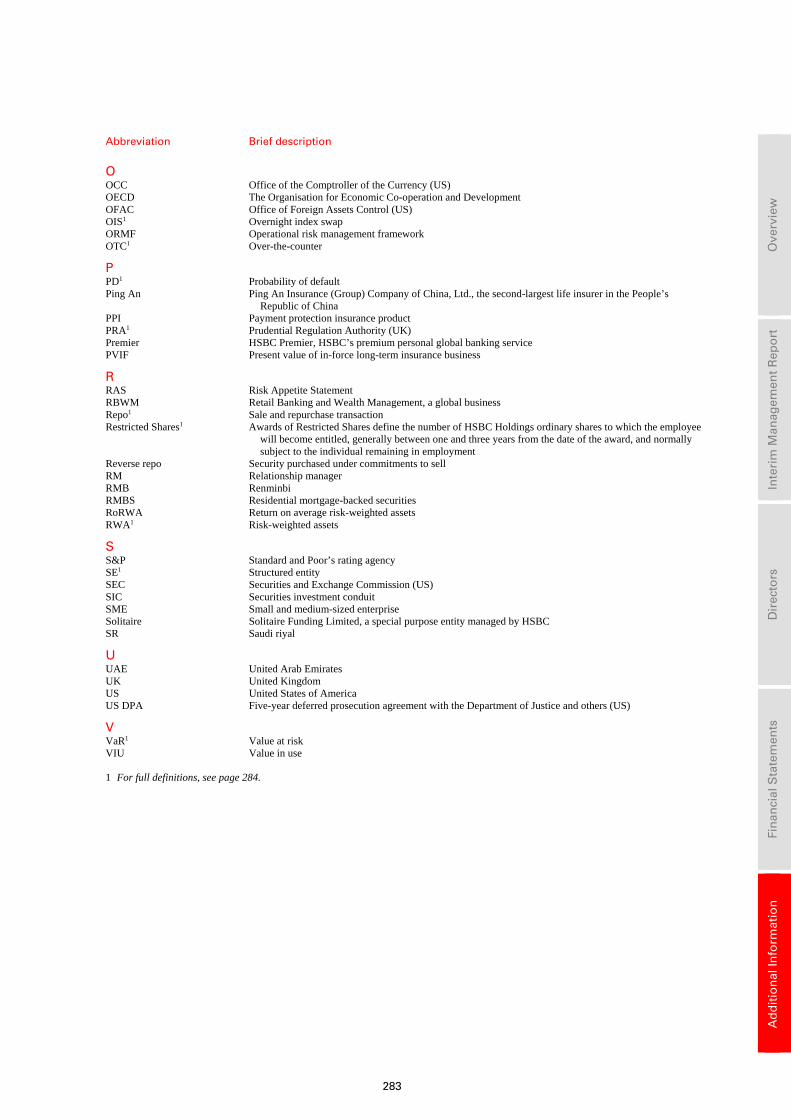
283
Ove
rvie
w
In
teri
m M
anag
emen
t R
epo
rt
D
irec
tors
Fin
anci
al S
tate
men
ts
A
dd
itio
nal
Info
rmat
ion
Abbreviation Brief description
O
OCC Office of the Comptroller of the Currency (US) OECD The Organisation for Economic Co-operation and Development OFAC Office of Foreign Assets Control (US) OIS1 Overnight index swap ORMF Operational risk management framework OTC1 Over-the-counter
P PD1 Probability of default Ping An Ping An Insurance (Group) Company of China, Ltd., the second-largest life insurer in the People’s
Republic of China PPI Payment protection insurance product PRA1 Prudential Regulation Authority (UK) Premier HSBC Premier, HSBC’s premium personal global banking service PVIF Present value of in-force long-term insurance business
R RAS Risk Appetite Statement RBWM Retail Banking and Wealth Management, a global business Repo1 Sale and repurchase transaction Restricted Shares1 Awards of Restricted Shares define the number of HSBC Holdings ordinary shares to which the employee
will become entitled, generally between one and three years from the date of the award, and normally subject to the individual remaining in employment
Reverse repo Security purchased under commitments to sell RM Relationship manager RMB Renminbi RMBS Residential mortgage-backed securities RoRWA Return on average risk-weighted assets RWA1 Risk-weighted assets
S
S&P Standard and Poor’s rating agency SE1 Structured entity SEC Securities and Exchange Commission (US) SIC Securities investment conduit SME Small and medium-sized enterprise Solitaire Solitaire Funding Limited, a special purpose entity managed by HSBC SR Saudi riyal
U
UAE United Arab Emirates UK United Kingdom US United States of America US DPA Five-year deferred prosecution agreement with the Department of Justice and others (US)
V
VaR1 Value at risk VIU Value in use
1 For full definitions, see page 284.
H S B C H O L D I N G S P L C
Additional Information (continued) Glossary
284
Glossary
Term Definition
A Adjustable-rate mortgages
(‘ARM’s) Mortgage loans in the US on which the interest rate is periodically changed based on a reference price.
These are included within ‘affordability mortgages’.
Affordability mortgages Mortgage loans where the customer’s monthly payments are set out at a low initial rate, either variable or fixed, before resetting to a higher rate once the introductory period is over.
Agency exposures Exposures to near or quasi-government agencies including public sector entities fully owned by government carrying out non-commercial activities, provincial and local government authorities, development banks and funds set up by government.
Alt-A A US description for loans regarded as lower risk than sub-prime, but with higher risk characteristics than lending under normal criteria.
Arrears Customers are said to be in arrears (or in a state of delinquency) when they are behind in fulfilling their obligations, with the result that an outstanding loan is unpaid or overdue. When a customer is in arrears, the total outstanding loans on which payments are overdue are described as delinquent.
Asset-backed securities (‘ABS’s)
Securities that represent an interest in an underlying pool of referenced assets. The referenced pool can comprise any assets which attract a set of associated cash flows but are commonly pools of residential or commercial mortgages.
B
Back-testing A statistical technique used to monitor and assess the accuracy of a model, and how that model would have performed had it been applied in the past.
Bail-inable debt Bail-in refers to imposition of losses at the point of non viability (but before insolvency) on bank liabilities (bail-inable debt) that are not exposed to losses while the institution remains a viable, going concern. Whether by way of write-down or conversion into equity, this has the effect of recapitalising the bank (although it does not provide any new funding).
Bank levy A levy that applies to UK banks, building societies and the UK operations of foreign banks from 1 January 2011. The amount payable is based on a percentage of the group’s consolidated liabilities and equity as at 31 December after deducting certain items the most material of which are those related to insured deposit balances, tier 1 capital, insurance liabilities, high quality liquid assets and items subject to a legally enforceable net settlement agreement.
Basel II The capital adequacy framework issued by the Basel Committee on Banking Supervision in June 2006 in the form of the ‘International Convergence of Capital Measurement and Capital Standards’, amended by subsequent changes to the capital requirements for market risk and re-securitisations, commonly known as Basel 2.5, which took effect 31 December 2011.
Basel III In December 2010, the Basel Committee issued ‘Basel III rules: A global regulatory framework for more resilient banks and banking systems’ and ‘International framework for liquidity risk measurement, standards and monitoring’. Together these documents present the Basel Committee’s reforms to strengthen global capital and liquidity rules with the goal of promoting a more resilient banking sector. In June 2011, the Basel Committee issued a revision to the former document setting out the finalised capital treatment for counterparty credit risk in bilateral trades.
Basis point (‘bps’) One hundredth of a per cent (0.01%), so 100 basis points is 1%. Used in quoting movements in interest rates or yields on securities.
C
Capital conservation buffer A capital buffer prescribed by regulators under Basel III and designed to ensure banks build up capital buffers outside periods of stress which can be drawn down as losses are incurred. Should a bank’s capital levels fall within the capital conservation buffer range, capital distributions will be constrained by the regulators.
Capital planning buffer A capital buffer, prescribed by the PRA under Basel II, and designed to ensure banks build up capital buffers outside periods of stress which can be drawn down as losses are incurred. Should a bank’s capital levels fall within the capital planning buffer range, a period of heightened regulatory interaction would be triggered.
Capital requirements directive (‘CRD’)
A capital adequacy legislative package issued by the European Commission and adopted by EU member states. The first CRD legislative package gave effect to the Basel II proposals in the EU and came into force on 20 July 2006. CRD II, which came into force on 31 December 2010, subsequently updated the requirements for capital instruments, large exposure, liquidity risk and securitisation. A further CRD III amendment, updated market risk capital and additional securitisation requirements, and came into force on 31 December 2011.
CRD IV package comprises a recast Capital Requirements Directive and a new Capital Requirements Regulation. The package implements the Basel III capital proposals together with transitional arrangements for some of its requirements. CRD IV came into force on 1 January 2014.
Central counterparty (‘CCP’) An intermediary between a buyer and a seller (generally a clearing house).
Collateralised debt obligation (‘CDO’)
A security issued by a third-party which references ABSs and/or certain other related assets purchased by the issuer. CDOs may feature exposure to sub-prime mortgage assets through the underlying assets.
285
Ove
rvie
w
In
teri
m M
anag
emen
t R
epo
rt
D
irec
tors
Fin
anci
al S
tate
men
ts
A
dd
itio
nal
Info
rmat
ion
Term Definition
Collectively assessed impairment
Impairment assessment on a collective basis for homogeneous groups of loans that are not considered individually significant and to cover losses which have been incurred but have not yet been identified on loans subject to individual assessment.
Commercial paper (‘CP’) An unsecured, short-term debt instrument issued by a corporation, typically for the financing of accounts receivable, inventories and meeting short-term liabilities. The debt is usually issued at a discount, reflecting prevailing market interest rates.
Commercial real estate Any real estate, comprising buildings or land, intended to generate a profit, either from capital gain or rental income.
Common equity tier 1 capital (‘CET1’)
The highest quality form of regulatory capital under Basel III that comprises common shares issued and related share premium, retained earnings and other reserves excluding the cash flow hedging reserve, less specified regulatory adjustments.
Common reporting (‘COREP’) Harmonised European reporting framework established in the Capital Requirements Directives, to be mandated by the European Banking Authority.
Compliance risk The risk that the Group fails to observe the letter and spirit of all relevant laws, codes, rules, regulations and standards of good market practice, and incurs fines and penalties and suffers damage to its businessas a consequence.
Conduits HSBC sponsors and manages multi-seller conduits and ‘SIC’s. The multi-seller conduits hold interests in diversified pools of third-party assets such as vehicle loans, trade receivables and credit card receivables funded through the issuance of short-dated commercial paper and supported by a liquidity facility. The SICs hold predominantly asset-backed securities referencing such items as commercial and residential mortgages, vehicle loans and credit card receivables funded through the issuance of both long-term and short-term debt.
Constant currency A non-GAAP financial measure that adjusts for the year-on-year effects of foreign currency translation differences by comparing reported results for the reported period with reported results for comparative period retranslated at exchange rates for the reported period. The foreign currency translation differences reflect the movements of the US dollar against most major currencies during the reported period.
Constant net asset value fund (‘CNAV’)
A fund that prices its assets on an amortised cost basis, subject to the amortised book value of the portfolio remaining within 50 basis points of its market value.
Consumer and Mortgage Lending (‘CML’)
In the US, the CML portfolio consists of our Consumer Lending and Mortgage Services businesses, which are in run-off.
The Consumer Lending business offered secured and unsecured loan products, such as first and second lien mortgage loans, open-ended home equity loans and personal non-credit card loans through branch locations and direct mail. The majority of the mortgage lending products were for refinancing and debt consolidation rather than home purchases. In the first quarter of 2009, we discontinued all originations by our Consumer Lending business.
Prior to the first quarter of 2007, when we ceased new purchase activity, the Mortgage Services business purchased non-conforming first and second lien real estate secured loans from unaffiliated third parties. The business also included the operations of Decision One Mortgage Company (‘Decision One’), which historically originated mortgage loans sourced by independent mortgage brokers and sold these to secondary market purchasers. Decision One ceased originations in September 2007.
Contractual maturities The date on which the final payment (principal or interest) of any financial instrument is due to be paid, at which point all the remaining outstanding principal and interest have been repaid.
Core tier 1 capital The highest quality form of regulatory capital, under Basel II, that comprises total shareholders’ equity and related non-controlling interests, less goodwill and intangible assets and certain other regulatory adjustments.
Countercyclical capital buffer (‘CCB’)
A capital buffer prescribed by regulators under Basel III which aims to ensure that capital requirements take account of the macro-financial environment in which banks operate. This will provide the banking sector with additional capital to protect it against potential future losses, when excess credit growth in the financial system as a whole is associated with an increase in system-wide risk.
Counterparty credit risk (‘CCR’)
Counterparty credit risk, in both the trading and non-trading books, is the risk that the counterparty to a transaction may default before completing the satisfactory settlement of the transaction.
Credit default swap (‘CDS’)
A derivative contract whereby a buyer pays a fee to a seller in return for receiving a payment in the event of a defined credit event (e.g. bankruptcy, payment default on a reference asset or assets, or downgrades by a rating agency) on an underlying obligation (which may or may not be held by the buyer).
Credit enhancements Facilities used to enhance the creditworthiness of financial obligations and cover losses due to asset default.
Credit risk Risk of financial loss if a customer or counterparty fails to meet an obligation under a contract. It arises mainly from direct lending, trade finance and leasing business, but also from products such as guarantees, derivatives and debt securities.
Credit valuation adjustment (‘CVA’)
An adjustment to the valuation of OTC derivative contracts to reflect the creditworthiness of OTC derivative counterparties.
H S B C H O L D I N G S P L C
Additional Information (continued) Glossary
286
Term Definition
Credit risk mitigation A technique to reduce the credit risk associated with an exposure by application of credit risk mitigants such as collateral, guarantee and credit protection.
Credit risk spread The premium over the benchmark or risk-free rate required by the market to accept a lower credit quality. The yield spread between securities with the same coupon rate and maturity structure but with different associated credit risks. The yield spread rises as the credit rating worsens.
Credit spread risk The risk that movements in credit spreads will affect the value of financial instruments.
Customer deposits Money deposited by account holders. Such funds are recorded as liabilities.
Customer remediation Activities carried out by HSBC to compensate customers for losses or damages associated with a failure to comply with regulations. Customer remediation is initiated by HSBC in response to customer complaints, and not specifically initiated by regulatory action.
Customer risk rating (‘CRR’) A scale of 23 grades measuring obligor PD.
D
Debit valuation adjustment (‘DVA’)
An adjustment made by an entity to the valuation of OTC derivative liabilities to reflect within fair value the entity’s own credit risk.
Debt restructuring A restructuring by which the terms and provisions of outstanding debt agreements are changed. This is often done in order to improve cash flow and the ability of the borrower to repay the debt. It can involve altering the repayment schedule as well as debt or interest charge reduction.
Debt securities Financial assets on the Group’s balance sheet representing certificates of indebtedness of credit institutions, public bodies or other undertakings, excluding those issued by central banks.
Debt securities in issue Transferable certificates of indebtedness of the Group to the bearer of the certificates. These are liabilities of the Group and include certificates of deposits.
Deed-in-lieu An arrangement in which a borrower surrenders the deed for a property to the lender without going through foreclosure proceedings and is subsequently released from any further obligations on the loan.
Defined benefit obligation The present value of expected future payments required to settle the obligations of a defined benefit plan resulting from employee service.
Delinquency See ‘Arrears’.
Deposits by banks All deposits received from domestic and foreign banks, excluding deposits or liabilities in the form of debt securities or for which transferable certificates have been issued.
E
Economic capital The internally calculated capital requirement which is deemed necessary by HSBC to support the risks to which it is exposed.
Economic profit The difference between the return on financial capital invested by shareholders and the cost of that capital. Economic profit may be expressed as a whole number or as a percentage.
Economic value of equity (‘EVE’) sensitivity
Considers all re-pricing mismatches in the current balance sheet and calculates the change in market value that would result from a set of defined interest rate shocks.
Encumbered assets Assets on our balance sheet which have been pledged as collateral against an existing liability.
Enhanced Variable Net Asset Value fund (‘ENAV’)
A fund that prices its assets on a fair value basis. Consequently, prices may change from one day to the next.
Equity risk The risk arising from positions, either long or short, in equities or equity-based instruments, which create exposure to a change in the market price of the equities or equity instruments.
Eurozone The 18 European Union countries using the euro as their common currency. The 18 countries are Austria, Belgium, Cyprus, Estonia, Finland, France, Germany, Greece, Ireland, Italy, Latvia, Luxembourg, Malta, Netherlands, Portugal, Slovakia, Slovenia and Spain.
Expected loss (‘EL’) A regulatory calculation of the amount expected to be lost on an exposure using a 12-month time horizon and downturn loss estimates. EL is calculated by multiplying the PD (a percentage) by the EAD (an amount) and LGD (a percentage).
Exposure A claim, contingent claim or position which carries a risk of financial loss.
Exposure at default (‘EAD’) The amount expected to be outstanding after any credit risk mitigation, if and when the counterparty defaults. EAD reflects drawn balances as well as allowance for undrawn amounts of commitments and contingent exposures.
F
Fair value adjustment An adjustment to the fair value of a financial instrument which is determined using a valuation technique (level 2 and level 3) to include additional factors that would be considered by a market participant that are not incorporated within the valuation model.
Fiduciary risk The risk to the Group of breaching its fiduciary duties where it acts in a fiduciary capacity as trustee, investment manager or as mandated by law or regulation.
Financial Conduct Authority (‘FCA’)
The Financial Conduct Authority regulates the conduct of financial firms and, for certain firms, prudential standards in the UK. It has a strategic objective to ensure that the relevant markets function well.
287
Ove
rvie
w
In
teri
m M
anag
emen
t R
epo
rt
D
irec
tors
Fin
anci
al S
tate
men
ts
A
dd
itio
nal
Info
rmat
ion
Term Definition
Financial Policy Committee (‘FPC’)
The Financial Policy Committee, at the Bank of England, is charged with a primary objective of identifying, monitoring and taking action to remove or reduce systemic risks with a view to protecting and enhancing the resilience of the UK financial system. The FPC has a secondary objective to support the economic policy of the UK Government.
Financial Reporting (‘FINREP’)
Harmonised European financial reporting framework, proposed by the European Union, which will be used to obtain a comprehensive view of a firm’s risk profile.
First lien A security interest granted over an item of property to secure the repayment of a debt that places its holder first in line to collect repayment from the sale of the underlying collateral in the event of a default on the debt.
Forbearance strategies Employed in order to improve the management of customer relationships, maximise collection opportunities and, if possible, avoid default, foreclosure or repossession. Such arrangements include extended payment terms, a reduction in interest or principal repayments, approved external debt management plans, debt consolidations, the deferral of foreclosures, other modifications and re-ages.
Funded exposure A situation where the notional amount of a contract is or has been exchanged.
Funding risk A form of liquidity risk arising when the liquidity needed to fund illiquid asset positions cannot be obtained at the expected terms and when required.
G
Gap risk The risk of financial loss arising from a significant change in market price with no accompanying trading opportunity.
Global systemically important bank (‘G-SIB’)
In parallel with the Basel III proposals, the Basel Committee issued in July 2011 a consultative document: ‘Global systemically important banks: assessment methodology and the additional loss absorbency requirement’, and in November 2011, its first rules on G-SIBs. The Financial Stability Board (‘FSB’) periodically issues the list of G-SIBs, which currently includes HSBC and 28 other major banks from around the world and is re-assessed through annual re-scoring of the individual banks and a triennial review of the methodology.
Government-sponsored enterprises (‘GSE’s)
A group of financial services enterprises created by the US Congress to reduce the cost of capital for certain borrowing sectors of the economy, and to make them more efficient and transparent. Examples in the residential mortgage borrowing segment are Freddie Mac and Fannie Mae. GSEs carry the implicit backing, but are not direct obligations, of the US government.
GPSP Awards Awards that define the number of HSBC Holdings ordinary shares to which the employee will become entitled, generally five years from the date of the award, and normally subject to individual remaining in employment. The shares to which the employee becomes entitled are subject to a retention requirement until cessation of employment.
Guarantee An undertaking by a party to pay a creditor should a debtor fail to do so.
H
Haircut A discount applied by management when determining the amount at which an asset can be realised. The discount takes into account the method of realisation including the extent to which an active market for the asset exists.
Historical rating transition matrices
The probability of a counterparty with a particular rating moving to a different rating over a defined time horizon.
Home equity lines of credit (‘HELoC’s)
A form of revolving credit facility provided to US customers, which is supported in the majority of cases by a second lien or lower ranking charge over residential property. Holdings of HELoCs are classified as sub-prime.
I
Impaired loans Loans where the Group does not expect to collect all the contractual cash flows or expects to collect them later than they are contractually due.
Impairment allowances Management’s best estimate of losses incurred in the loan portfolios at the balance sheet date.
Individually assessed impairment
Exposure to loss is assessed on all individually significant accounts and all other accounts that do not qualify for collective assessment.
Insurance risk A risk, other than a financial risk, transferred from the holder of a contract to the insurance provider. The principal insurance risk is that, over time, the combined cost of claims, administration and acquisition of the contract may exceed the aggregate amount of premiums received and investment income.
Internal Capital Adequacy Assessment Process
The Group’s own assessment of the levels of capital that it needs to hold through an examination of its risk profile from regulatory and economic capital viewpoints.
Internal Model Method One of three approaches defined by Basel II to determine exposure values for counterparty credit risk.
Internal ratings-based approach (‘IRB’)
A method of calculating credit risk capital requirements using internal, rather than supervisory, estimates of risk parameters.
Invested capital Equity capital invested in HSBC by its shareholders, adjusted for certain reserves and goodwill previously amortised or written off.
Investment grade Represents a risk profile similar to a rating of BBB- or better, as defined by an external rating agency.
H S B C H O L D I N G S P L C
Additional Information (continued) Glossary
288
Term Definition
IRB advanced approach A method of calculating credit risk capital requirements using internal PD, LGD and EAD models.
IRB foundation approach A method of calculating credit risk capital requirements using internal PD models but with supervisory estimates of LGD and conversion factors for the calculation of EAD.
ISDA Master agreement Standardised contract developed by ISDA used as an umbrella contract under which bilateral derivatives contracts are entered into.
K
Key management personnel Directors and Group Managing Directors of HSBC Holdings.
L
Legacy credit in GB&M A separately identifiable, discretely managed business comprising Solitaire Funding Limited, the securities investment conduits, the asset-backed securities trading portfolios and credit correlation portfolios, derivative transactions entered into directly with monoline insurers, and certain other structured credit transactions.
Legal proceedings Civil court, arbitration or tribunal proceedings brought against HSBC companies (whether by way of claim or counterclaim) or civil disputes that may, if not settled, result in court, arbitration or tribunal proceedings.
Legal risk The risk of financial loss, sanction and/or reputational damage resulting from contractual risk (the risk that the rights and/or obligations of a Group member within a contractual relationship are defective); dispute risk (the risk when involved in or managing potential or actual disputes); legislative risk (the risk that a Group member fails to adhere to laws of the jurisdiction in which it operates); and non contractual rights risk (the risk that a Group member’s assets are not properly owned or are infringed by others or the infringement by a Group member of another party’s rights).
Level 1 – quoted market price Financial instruments with quoted prices for identical instruments in active markets.
Level 2 – valuation technique using observable inputs
Financial instruments with quoted prices for similar instruments in active markets or quoted prices for identical or similar instruments in inactive markets and financial instruments valued using models where all significant inputs are observable.
Level 3 – valuation technique with significant unobservable inputs
Financial instruments valued using valuation techniques where one or more significant inputs are unobservable.
Leveraged finance Funding provided for entities with higher than average indebtedness, which typically arises from sub-investment grade acquisitions or event-driven financing.
Leverage ratio A measure, prescribed by regulators under Basel III, which is the ratio of tier 1 capital to total exposures. Total exposures include on-balance sheet items, off-balance sheet items and derivatives, and should generally follow the accounting measure of exposure. This supplementary measure to the risk-based capital requirements is intended to constrain the build-up of excess leverage in the banking sector.
Liquidity coverage ratio (‘LCR’)
The ratio of the stock of high quality liquid assets to expected net cash outflows over the following 30 days. High quality liquid assets should be unencumbered, liquid in markets during a time of stress and, ideally, be central bank eligible. The Basel III rules require this ratio to be at least 100% with effect from 2015. The LCR is still subject to an observation period and review to address any unintended consequences.
Liquidity enhancement Liquidity enhancement makes funds available if required for reasons other than asset default, e.g. to ensure timely repayment of maturing commercial paper.
Liquidity risk The risk that HSBC does not have sufficient financial resources to meet its obligations as they fall due, or will have to do so at an excessive cost. This risk arises from mismatches in the timing of cash flows.
Loan modification An account management action that results in a change to the original terms and conditions of a loan either temporarily or permanently without resetting its delinquency status, except in case of a ‘modification re-age’ where delinquency status is also reset to up-to-date. Account modifications may include revisions to one or more terms of the loan including, but not limited to, a change in interest rate, extension of the amortisation period, reduction in payment amount and partial forgiveness or deferment of principal.
Loan re-age An account management action that results in the resetting of the contractual delinquency status of an account to up-to-date upon fulfilment of certain requirements which indicate that payments are expected to be made in accordance with the contractual terms.
Loans past due Loans on which repayments are overdue.
Loan to value ratio (‘LTV’) A mathematical calculation that expresses the amount of the loan as a percentage of the value of security. A high LTV indicates that there is less cushion to protect the lender against house price falls or increases in the loan if repayments are not made and interest is added to the outstanding loan balance.
Loss given default (‘LGD’) The estimated ratio (percentage) of the loss on an exposure to the amount outstanding at default (EAD) upon default of a counterparty.
Loss severity The realised amount of losses incurred (including ancillary amounts owed) when a loan is foreclosed or disposed of through the arrangement with the borrower. The loss severity is represented as a percentage of the outstanding loan balance.
289
Ove
rvie
w
In
teri
m M
anag
emen
t R
epo
rt
D
irec
tors
Fin
anci
al S
tate
men
ts
A
dd
itio
nal
Info
rmat
ion
Term Definition
M Malus An arrangement that permits an organisation to prevent vesting of all or part of the amount of a deferred
remuneration award in relation to risk outcomes or performance.
Market risk The risk that movements in market risk factors, including foreign exchange rates and commodity prices, interest rates, credit spreads and equity prices will reduce income or portfolio values.
Medium-term notes (‘MTN’s)
Issued by corporates across a range of maturities. Under MTN Programmes notes are offered on a regular and continuous basis to investors.
Monoline insurers (‘monolines’)
Entities which specialise in providing credit protection to the holders of debt instruments in the event of default by the debt security counterparty. This protection is typically held in the form of derivatives such as CDSs referencing the underlying exposures held.
Mortgage-backed securities (‘MBS’s)
Securities that represent interests in groups of mortgages, which may be on residential or commercial properties. Investors in these securities have the right to cash received from future mortgage payments (interest and/or principal). When the MBS references mortgages with different risk profiles, the MBS is classified according to the highest risk class.
Mortgage-related assets Referenced to underlying mortgages.
Mortgage vintage The year a mortgage was originated.
N
Negative equity mortgages Equity is the value of the asset less the outstanding balance on the loan. Negative equity arises when the value of the property purchased is below the balance outstanding on the loan.
Net asset value per share Total shareholders’ equity, less non-cumulative preference shares and capital securities, divided by the number of ordinary shares in issue.
Net interest income The amount of interest received or receivable on assets net of interest paid or payable on liabilities.
Net interest income sensitivity Considers all pricing mismatches in the current balance sheet, with suitable assumptions for balance sheet growth in the future, and calculates the change in net interest income that would result from a set of defined interest rate shocks.
Net principal exposure The gross principal amount of a financial asset after taking account of credit protection purchased but excluding the effect of any counterparty credit valuation adjustment to that protection. It includes assets that benefit from monoline protection, except where this protection is purchased with a CDS.
Net stable funding ratio (‘NSFR’)
The ratio of available stable funding to required stable funding over a one year time horizon, assuming a stressed scenario. Available stable funding would include items such as equity capital, preferred stock with a maturity of over one year and liabilities with an assessed maturity of over one year. The Basel III rules require this ratio to be over 100% with effect from 2018. The NSFR is still subject to an observation period and review to address any unintended consequences.
Non-conforming mortgages US mortgages that do not meet normal lending criteria. Examples include mortgages where the expected level of documentation is not provided (such as with income self-certification), or where poor credit history increases the risk and results in pricing at a higher than normal lending rate.
Non-trading portfolios Portfolios that comprise positions that primarily arise from the interest rate management of our retail and commercial banking assets and liabilities, financial investments designated as available for sale and held to maturity, and exposures arising from our insurance operations.
Non-trading risk The market risk arising from non-trading portfolios.
O
Offset mortgages A flexible type of mortgage where a borrower’s savings balance(s) held at the same institution can be used to offset the mortgage balance outstanding. The borrower pays interest on the net balance which is calculated by subtracting the credit balance(s) from the debit balance. As part of the offset mortgage a total facility limit is agreed and the borrower may redraw up to a pre-agreed limit.
Overnight Index Swap (‘OIS’) discounting
A method of valuing collateralised interest rate derivatives which uses a discount curve that reflects the overnight interest rate typically earned or paid in respect of collateral received.
Operational risk The risk of loss resulting from inadequate or failed internal processes, people and systems or from external events, including legal risk.
Over-the-counter (‘OTC’) A bilateral transaction (e.g. derivatives) that is not exchange traded and that is valued using valuation models.
P
Pension risk The risk that contributions from Group companies and members fail to generate sufficient funds to meet the cost of accruing benefits for the future service of active members, and the risk that the performance of assets held in pension funds is insufficient to cover existing pension liabilities.
Performance shares Awards of HSBC Holdings ordinary shares under employee share plans that are subject to the achievement of corporate performance conditions.
Personal lending See ‘Retail loans’.
PRA standard rules The method prescribed by the PRA for calculating market risk capital requirements in the absence of VaR model approval.
H S B C H O L D I N G S P L C
Additional Information (continued) Glossary
290
Term Definition
Prime A US description for mortgages granted to the most creditworthy category of borrowers.
Private equity investments Equity securities in operating companies not quoted on a public exchange, often involving the investment of capital in private companies or the acquisition of a public company that results in its delisting.
Probability of default (‘PD’) The probability that an obligor will default within one year.
Prudential Regulation Authority (‘PRA’)
The Prudential Regulation Authority in the UK is responsible for prudential regulation and supervision of banks, building societies, credit unions, insurers and major investment firms.
R
Refi rate The refi (or refinancing) rate is set by the European Central Bank (‘ECB’) and is the price banks pay to borrow from the ECB.
Regulatory capital The capital which HSBC holds, determined in accordance with rules established by the PRA for the consolidated Group and by local regulators for individual Group companies.
Regulatory matters Investigations, reviews and other actions carried out by, or in response to the actions of, regulators or law enforcement agencies in connection with alleged wrongdoing by HSBC.
Renegotiated loans Loans for which the contractual terms have been changed because of significant concerns about the borrower’s ability to meet the contractual payments when due.
Repo (or sale and repurchase agreement)
A short-term funding agreement that allows a borrower to create a collateralised loan by selling a financial asset to a lender. As part of the agreement the borrower commits to repurchase the security at a date in the future repaying the proceeds of the loan. For the party on the other end of the transaction (buying the security and agreeing to sell in the future) it is reverse repurchase agreement or a reverse repo.
Reputational risk The risk that illegal, unethical or inappropriate behaviour by the Group itself, members of staff or clients or representatives of the Group will damage HSBC’s reputation, leading, potentially, to a loss of business, fines or penalties.
Residential mortgage A loan to purchase a residential property which is then used as collateral to guarantee repayment of the loan. The borrower gives the lender a lien against the property, and the lender can foreclose on the property if the borrower does not repay the loan per the agreed terms.
Restricted shares Awards that define the number of HSBC Holdings ordinary shares to which the employee will become entitled, generally between one and three years from the date of the award, and normally subject to the individual remaining in employment. The shares to which the employee becomes entitled may be subject to retention requirement.
Retail loans Money lent to individuals rather than institutions. This includes both secured and unsecured loans such as mortgages and credit card balances.
Return on equity Profit attributable to shareholders of the parent company divided by average ordinary shareholders’ equity.
Risk appetite The aggregate level and types of risk a firm is willing to assume within its risk capacity to achieve its strategic objectives and business plan.
Risk capacity The maximum level of risk the firm can assume before breaching constraints determined by regulatory capital and liquidity needs and its obligations, also from a conduct perspective, to depositors, policyholders, other customers and shareholders.
Risk-weighted assets (‘RWA’s)
Calculated by assigning a degree of risk expressed as a percentage (risk weight) to an exposure value in accordance with the applicable Standardised or IRB approach rules.
Run-off portfolios Legacy credit in GB&M, the US CML portfolio and other US run-off portfolios, including the treasury services related to the US CML businesses and commercial operations in run-off. Origination of new business in the run-off portfolios has been discontinued and balances are being managed down through attrition and sale.
S
Sale and repurchase agreement See repo above.
Second lien A security interest granted over an item of property to secure the repayment of a debt that is issued against the same collateral as a first lien but that is subordinate to it. In the case of default, repayment for this debt will only be received after the first lien has been repaid.
Securitisation A transaction or scheme whereby the credit risk associated with an exposure, or pool of exposures, is tranched and where payments to investors in the transaction or scheme are dependent upon the performance of the exposure or pool of exposures. A traditional securitisation involves the transfer of the exposures being securitised to a structured entity which issues securities. In a synthetic securitisation, the tranching is achieved by the use of credit derivatives and the exposures are not removed from the balance sheet of the originator.
Securitisation swap An interest rate or cross currency swap with notional linked to the size of the outstanding asset portfolio in a securitisation. Securitisation swaps are typically executed by securitisation vehicles to hedge interest rate risk arising from mismatches between the interest rate risk profile of the asset portfolio and that of the securities issued by the vehicle.
291
Ove
rvie
w
In
teri
m M
anag
emen
t R
epo
rt
D
irec
tors
Fin
anci
al S
tate
men
ts
A
dd
itio
nal
Info
rmat
ion
Term Definition
Short sale In relation to credit risk management, a ‘short sale’ is an arrangement in which a bank permits the borrower to sell the property for less than the amount outstanding under a loan agreement. The proceeds are used to reduce the outstanding loan balance and the borrower is subsequently released from any further obligations on the loan.
Single-issuer liquidity facility A liquidity or stand-by line provided to a corporate customer which is different from a similar line provided to a conduit funding vehicle.
Six filters An internal measure designed to improve capital deployment across the Group. Five of the filters examine the strategic relevance of each business in each country, in terms of connectivity and economic development, and the current returns, in terms of profitability, cost efficiency and liquidity. The sixth filter requires adherence to global risk standards.
Sovereign exposures Exposures to governments, ministries, departments of governments, embassies, consulates and exposures on account of cash balances and deposits with central banks.
Standardised approach In relation to credit risk, a method for calculating credit risk capital requirements using External Credit Assessment Institutions (‘ECAI’) ratings and supervisory risk weights. In relation to operational risk, a method of calculating the operational capital requirement by the application of a supervisory defined percentage charge to the gross income of eight specified business lines.
Stressed VaR A market risk measure based on potential market movements for a continuous one-year period of stress for a trading portfolio
Structured entities (‘SE’s)
An entity that has been designed so that voting or similar rights are not the dominant factor in deciding who controls the entity, such as when voting rights relate to administrative tasks only and the relevant activities are directed by means of contractual arrangements.
Structured finance/notes An instrument whose return is linked to the level of a specified index or the level of a specified asset. The return on a structured note can be linked to equities, interest rates, foreign exchange, commodities or credit. Structured notes may or may not offer full or partial capital protection in the event of a decline in the underlying index or asset.
Structured Investment Vehicles (‘SIV’s)
Structured entities which invest in diversified portfolios of interest-earning assets, generally funded through issues of commercial paper, medium-term notes and other senior debt to take advantage of the spread differentials between the assets in the SIV and the funding cost.
Student loan-related assets Securities with collateral relating to student loans.
Subordinated liabilities Liabilities which rank after the claims of other creditors of the issuer in the event of insolvency or liquidation.
Sub-prime A US description for customers with high credit risk, for example those who have limited credit histories, modest incomes, high debt-to-income ratios, high loan-to-value ratios (for real estate secured products) or have experienced credit problems caused by occasional delinquencies, prior charge-offs, bankruptcy or other credit-related problems.
Sustainability risk The risk that the environmental and social effects of providing financial services outweigh the economic benefits.
Sustainable cost savings Permanent cost reductions at a given level of business activity. Sustainable cost savings exclude cost avoidance and revenue and loan impairment charge benefits as these do not represent operational expense reductions. Cost savings resulting from business disposals are not classified as sustainable.
Systems risk The risk of failure or other deficiency in the automated platforms that support the Group’s daily execution and the systems infrastructure on which they reside, including data centres, networks and distributed computers.
T Tier 1 capital A component of regulatory capital, comprising core tier 1 and other tier 1 capital. Other tier 1 capital
includes qualifying capital instruments such as non-cumulative perpetual preference shares and hybrid capital securities.
Tier 2 capital A component of regulatory capital, comprising qualifying subordinated loan capital, related non-controlling interests, allowable collective impairment allowances and unrealised gains arising on the fair valuation of equity instruments held as available-for-sale. Tier 2 capital also includes reserves arising from the revaluation of properties.
Trading portfolios Positions arising from market-making and warehousing of customer-derived positions.
Trading risk Market risk arising from trading portfolios.
Troubled debt restructuring A US description for restructuring a debt whereby the creditor for economic or legal reasons related to a debtor’s financial difficulties grants a concession to the debtor that it would not otherwise consider.
H S B C H O L D I N G S P L C
Additional Information (continued) Glossary / Index
292
Term Definition
U Unencumbered assets Assets on our balance sheet which have not been pledged as collateral against an existing liability.
Unfunded exposures An exposure where the notional amount of a contract has not been exchanged.
US government agency and sponsored enterprises mortgage-related assets
Securities that are guaranteed by US government agencies such as Ginnie Mae, or by US government sponsored entities including Fannie Mae and Freddie Mac.
V Value-at-risk
(‘VaR’) A measure of the loss that could occur on risk positions as a result of adverse movements in market risk
factors (e.g. rates, prices, volatilities) over a specified time horizon and to a given level of confidence.
W Wholesale loans Money lent to sovereign borrowers, banks, non-bank financial institutions and corporate entities.
Write-down/Write-off When a financial asset is written down or written off, a customer balance is partially or fully removed, respectively, from the balance sheet. Loans (and related impairment allowance accounts) are normally written off, either partially or in full, when there is no realistic prospect of recovery. Where loans are secured, this is generally after receipt of any proceeds from the realisation of security. In circumstances where the net realisable value of any collateral has been determined and there is no reasonable expectation of further recovery, write-off may be earlier.
Wrong-way risk An adverse correlation between the counterparty’s PD and the mark-to-market value of the underlying transaction.
293
Ove
rvie
w
In
teri
m M
anag
emen
t R
epo
rt
D
irec
tors
Fin
anci
al S
tate
men
ts
A
dd
itio
nal
Info
rmat
ion
Index
A Abbreviations 281 Accounting
consolidation 215 future developments 215 policies 217 standards 214
Acquisitions 46, 62 Anti-money laundering investigations 264 Areas of special interest 107 Asia
assets 38 balance sheet data 74 by country 71, 72 constant currency/reported profit 20 cost efficiency ratios 36, 70 country business highlights 71 customer accounts 42, 74 economic background 70 financial overview 70 impairment allowances/charges 131, 132, 134 loans and advances 74 profit before tax 61, 70, 74 review of performance 72 risk-weighted assets 62 staff numbers 35, 70 underlying/reported profit 24
Asset-backed securities 143 Assets 2
by geographical region 62, 67, 74, 80, 86, 92 by global business 46, 67, 74, 80, 86, 92 charged as security 252 constant currency/reported reconciliation 40 held for sale 241 held in custody and under administration 95 liquid 150 maturity analysis 245 movement in 39 risk-weighted 3, 44, 46, 62 trading 222
Associates and joint ventures 36, 72, 254 underlying/reported reconciliation 23
Auditor’s review report 270
B Backtesting 159 Balance sheet
consolidated 38, 208 constant currency/reported reconciliation 40 data 38, 58, 67, 74, 80 insurance manufacturing subsidiaries 170 movement 39
Balance Sheet Management 42, 161 Bancassurance 169 Bank of Communications 254 Basis of preparation 214 Brazilian economic plans 268 Brazilian labour and fiscal claims 245 Business model 11
C Capital
buffers 187 commitments 257 generation 194 management 193 measurement and allocation 194 overview 176
ratios 3, 176 risks 193 structure 184 total regulatory 194
Cash flows 151 consolidated statement 209 notes 253
Cautionary statement regarding forward-looking statements 280
Client assets 55 Collateral 252 Combined customer lending and deposits 41 Commercial Banking 50
constant currency/reported profit 20 cost efficiency ratios 36 customer deposit markets 148 management view 50 underlying/reported profit 24
Commercial real estate 120 Commitments 111 Competitive advantages 10 Compliance risk 166 Compliance with IFRSs 214 Composition of Group (changes in) 216 Concentration of exposure 136 Constant currency 19 Consumer Credit Act (UK) 244 Contents – inside front cover Contingent liabilities contractual commitments and
guarantees 257 Copies of the Interim Report 278 Corporate governance 277 Cost items (significant) 27 Countercyclical buffer 188 Counterparty risk 181, 198 CRD IV 149, 176, 195 Credit default swap regulatory investigation and
litigation 267 Credit quality 120 Credit risk 109, 179
credit exposure 111 drivers 196 risk-weighted assets 178
Credit valuation adjustment 225 Cross-border liquidity and funding 154 Customer accounts 3, 42, 67, 74, 80, 86, 92 Customer lending and deposits (combined) 41
D Data management 107 Dealings in HSBC Holdings shares 276 Debit valuation adjustment 225 Deferred tax 220 Defined terms – inside front cover Derivatives 236
by product contract type 236 credit 237 exposure 111, 136 hedging instruments 238 interest rate 244 trading 237
Directors biographies 199 board changes 5 interests 271 responsibility statement 269
Disposals 22, 46, 62 Dividends 217, 276
H S B C H O L D I N G S P L C
Additional Information (continued) Index
294
E Earnings per share 218 Economic background
Asia 70 Europe 63 Latin America 89 Middle East and North Africa 77 North America 83
Equity 38, 40 Equity securities available for sale 161 Estimates and assumptions 215 Europe
assets 62, 67 balance sheet data 67 by country 64 constant currency/reported profit 20 cost efficiency ratios 36 country business highlights 64 customer accounts 42, 67 economic background 63 financial overview 63 impairment allowances/charges 131, 132, 134 loans and advances 67 profit before tax 61, 63, 64, 67 review of performance 65 risk-weighted assets 62 staff numbers 35, 63 underlying/reported profit 24
Eurozone banking reform 191 Events after the balance sheet date 268
F Fair values
adjustments 224 control framework 224 movements 62 of financial instruments at fair value 223 of financial instruments not at fair value 233 significant unobservable assumptions 228 valuation bases 226
Fee income (net) 29 constant currency/reported reconciliation 20
Final results 277 Financial assets
designated at fair value 235 offsetting 250
Financial crime compliance 107 Financial highlights 2 Financial instruments
at fair value 31 credit quality 120 not at fair value 233
Financial investments 43, 136, 239 Financial liabilities designated at fair value 242
offsetting 250 Footnotes 96, 172 Forbearance 126 Foreclosed properties in US 117 Foreign exchange rates 25, 38
investigations and litigation 267 Funding sources 153 Funds under management 95
G Gains less losses from financial investments 32 Geographical regions 12
risk-weighted assets 177 Global Banking and Markets 52
ABSs classified as AFS 143 constant currency/reported profit 20 cost efficiency ratios 36 customer deposit markets 148 fair value adjustments 224 management view 53
underlying/reported profit 24 Global businesses 13, 45
risk-weighted assets 177 Global functions 12 Global Private Banking 55
constant currency/reported profit 20 cost efficiency ratios 36 customer deposit markets 149 underlying/reported profit 24
Global Standards 14 Glossary 284 Going concern 217, 278 Gold and silver fix-related litigation 267 Goodwill impairment 259 Governance framework 14 Group Chairman’s Statement 4 Group Chief Executive’s Business Review 6 Group Managing Directors 204 Growth priorities 48, 51, 54, 56
H Highlights 2, 47, 50, 52, 55, 63, 70, 77, 83, 89 HSBC Finance 116,128 HSBC Holdings 12, 164
I Impairment
allowances and charges 133 by geographical region 131, 135 charges and other credit risk provisions 34 constant currency/reported profit 135 impaired loans 129
Income from financial instruments designated at fair value (net) 31
Income statement consolidated 25, 206
Information security 106 Insurance
asset and liability matching 169 balance sheet by type of contract 170 claims incurred and movement in liabilities to
policyholders (net) 34 net earned premiums 32 risk 169, 171
Interest-earning assets 28 Interest expense 29 Interest income (net) 28
constant currency/reported reconciliation 20 sensitivity 162 underlying/reported reconciliation 23
Interest rate repricing gap 164 Interim Management Statement 277 Interim Report 268 Internet crime 106 Investment criteria 13
L Latin America
assets 92 balance sheet data 92 by country 90 constant currency/reported profit 20 cost efficiency ratios 36 country business highlights 90 customer accounts 42, 92 economic background 89 financial overview 89 impairment allowances/charges 131, 132, 134 loans and advances 92 profit before tax 61, 89, 92 review of performance 91 risk-weighted assets 62
295
Ove
rvie
w
In
teri
m M
anag
emen
t R
epo
rt
D
irec
tors
Fin
anci
al S
tate
men
ts
A
dd
itio
nal
Info
rmat
ion
staff numbers 35, 89 underlying/reported profit 24
Legal proceedings 259 Leverage ratio 198 Liabilities 38
constant currency/reported reconciliation 40 financial liabilities designated at fair value 242 maturity analysis 245 movement in 39 offsetting 250 trading 242
Libor investigation 266 Liquidity and funding 148
assets of principal entities 150 contingent liquidity risk 152 management 149 regulation 149
Loans and advances ageing analysis 125 by country/region 138, 139 by credit quality 121 by industry sector 118, 137 excluding held for sale 110 exposure 111, 136 impaired 129 mortgage lending 113, 114, 116 past due but not impaired 124 personal lending 109, 113 renegotiated 126 to banks 139 to customers 3, 67, 74, 80, 86, 92, 140 wholesale lending 118
Loan impairment charges and other credit risk provisions 34 underlying/reported reconciliation 23
M Madoff 260 Margin 28 Market capitalisation 1, 3 Market risk 157, 182
measures applicable to parent 164 Middle East and North Africa
assets 80 balance sheet data 80 by country 78 constant currency/reported profit 20 cost efficiency ratios 36, 77 country business highlights 77 customer accounts 42, 80 economic background 77 financial overview 77 impairment allowances/charges 131, 132, 134 loans and advances 80 profit before tax 61, 77, 80 review of performance 79 risk-weighted assets 62 staff numbers 35, 77 underlying/reported profit 24
Models 107 Monitor 15 Mortgage lending 113, 114, 116 Mortgage-related investigations (US) 262 Mortgage sales 147
N Non-GAAP measures 19 Non-trading portfolios 139, 160 North America
assets 86 balance sheet data 86 by country 84 constant currency/reported profit 20 cost efficiency ratios 36, 83 country business highlights 84
customer accounts 42, 86 economic background 83 financial overview 83 impairment allowances/charges 131, 132, 134 loans and advances 86 profit before tax 61 review of performance 85 risk-weighted assets 62 staff numbers 35, 83 underlying/reported profit 24
Notifiable interests in share capital 275
O Off-balance sheet arrangements 245 Offices 1 Offsets 250 Operating expenses 35
underlying/reported reconciliation 23 Operating income (other) 33
underlying/reported reconciliation 23 Operating model 12 Operational risk 165 ‘Other’ segment 57 Outlook 5, 7
P Payment protection insurance 243 Pension scheme 164 Personal lending 108, 113 Pillar 1, 2 and 3 195, 196 Preferred securities 38 Presentation of information 214, 216 Profit before tax
attributable 218 by country 64, 71, 72, 78, 84, 90 by geographical region 20, 24, 61, 63, 67, 74, 77, 80, 83,
86, 89, 92 by global business 20, 24, 46, 58, 67, 74, 80, 86, 92 consolidated 2, 25 constant currency/reported reconciliation 20 data 2 underlying 24 underlying/reported reconciliation 23
PRA buffer 188 Provisions 243 PVIF 33
R Ratios
advances to core funding 149 capital (total) 3 common equity tier 1 3, 18 core tier 1 ratio 3 cost efficiency 2, 18, 36, 58, 63, 67, 70, 74, 80, 83, 89, 92 cost of risk 18 customer advances to customer accounts 3, 18 dividend payout 2 dividends per ordinary share 2 earnings per share 2 leverage 3, 198 LICs to total operating income 2 net assets per share 38 return on average risk-weighted assets 3, 18, 43, 47, 63,
70, 77, 83, 89 return on average total assets 3 return on equity 18 stressed coverage 150
Regulatory capital 177, 185 capital buffers 187 investigations 102 risks 101 source and application 183 update 190
H S B C H O L D I N G S P L C
Additional Information (continued) Index
296
Related parties 95 Representations and warranties 147 Repurchase agreements (repos) and reverse repos 29, 41, 111,
139, 153, 239 Reputational risk 168 Responsibility statement 269 Retail Banking and Wealth Management 47
constant currency/reported profit 20 cost efficiency ratios 36 customer deposit markets 148 management view 48 Principal RBWM 48 underlying/reported profit 24
Revenue items (significant) 27 underlying/reported reconciliation 23
Review of performance 47, 50, 53, 55, 65, 72, 79, 85, 91 Risks 16
appetite 15, 18 aversion 5 business 104 capital 193 compliance 166 contingent liquidity 152 counterparty credit risk 198 credit 109 credit spread 161 data management 107 dispute 104 execution 104 factors 16 foreign exchange 164 geopolitical 101 information security 106 insurance operations 169, 171 internet crime 106 liquidity and funding 148 managing risk 100 market 157 model 107 non-trading interest rate 161 operational 165 people 105 profile 99 regulatory 101 reputational 168 social media 106 stress test 105 top and emerging 17, 100 wrong way 225
Risk-weighted assets 3, 177, 178 by geographical region 62 by global business 46 integrity 189 targets 193 underlying/reported reconciliation 44
S Securities investment conduits 143, 152 Securities litigation 260 Securitisation 143
activity and litigation 263
Segmental analysis 257 Senior management 204 Sensitivity of net interest income 162 Share capital 38 Share capital – notifiable interests 275 Shareholder enquiries 278 Share information 38 Share option plans
Directors’ interests 272 discretionary 275 employee share plans 274
Significant items 27 Six filters 13 Spread 28 Staff numbers 35, 63, 70, 77, 83, 89 Statement of changes in equity (consolidated) 210 Statement of comprehensive income (consolidated) 207 Stock lending 153 Stock symbols 278 #Strategic direction 9
Commercial Banking 50 Global Banking and Markets 52 Global Private Banking 55 Retail Banking and Wealth Management 48
Strategic priorities 1, 10 Stress testing 105, 108, 189, 193 Structural banking reform 190 Structural foreign exchange exposures 161 Sustainability (long-term) 8 Systemically important banks 187
T Tax 37, 219
US tax and broker-dealer investigations 265 Telephone and online share-dealing service 278 Total shareholder return 3 Trading
assets 136, 222 derivatives 237 income (net) 20, 30 liabilities 242 portfolios 158
U UK regulatory update 190 Underlying performance 22
V Value at risk 158, 160
stressed 159 Value creation 8 Values 15
W Wholesale funding 149 Wholesale lending 118 Wholesale term debt maturity profile 154
Y Yield 28

This document comprises the Interim Report 2014 to shareholders and information contained herein has been filed on Form 6-K with the US Securities and Exchange Commission for HSBC Holdings plc and its subsidiary and associated undertakings. HSBC HOLDINGS PLC Incorporated in England with limited liability. Registered in England: number 617987 REGISTERED OFFICE AND GROUP HEAD OFFICE 8 Canada Square, London E14 5HQ, United Kingdom Web: www.hsbc.com Copyright HSBC Holdings plc 2014 All rights reserved No part of this publication may be reproduced, stored in a retrieval system, or transmitted, in any form or by any means, electronic, mechanical, photocopying, recording, or otherwise, without the prior written permission of HSBC Holdings plc. Published by Group Finance, HSBC Holdings plc, London Cover designed by Black Sun Plc, London; text pages designed by Group Finance, HSBC Holdings plc, London, and by Communications (Asia), The Hongkong and Shanghai Banking Corporation Limited, Hong Kong Printed by Park Communications Limited, London, on Revive 100 White Offset paper using vegetable oil-based inks. Made in the UK (cover board) and Austria (text pages), the paper comprises 100% de-inked post-consumer waste. Pulps used are totally chlorine-free.
The FSC® logo identifies products which contain wood from well-managed forests certified in accordance with the rules of the Forest Stewardship Council®.
Photography Cover by Matthew Mawson Group Chairman and Group Chief Executive by George Brooks Stock number 99349-8

HSBC Holdings plc8 Canada SquareLondon E14 5HQUnited KingdomTelephone: 44 020 7991 8888www.hsbc.com
The view from HSBC Building, 8 Century Avenue, Pudong, Shanghai
The view from HSBC Main Building, 1 Queen’s Road Central, Hong Kong SAR
The view from HSBC Group Head Office, 8 Canada Square, London


