Embed Size (px)
Citation preview
HSBC BANK MALAYSIA BERHAD (Company No. 198401015221 (127776-V))
(Incorporated in Malaysia)
FINANCIAL STATEMENTS – 31 DECEMBER 2020
Domiciled in Malaysia. Registered Office:
10th Floor, South Tower,
2, Leboh Ampang,
50100 Kuala Lumpur
HSBC BANK MALAYSIA BERHAD (Company No. 198401015221 (127776-V))
(Incorporated in Malaysia)
CONTENTS
1 Board of Directors 2 Corporate Governance Disclosures 6 Board Responsibility and Oversight
Board of Directors Board Committees
11 Management Reports 12 Internal Control Framework 14 Remuneration Policy 15 Rating by External Rating Agencies 16 Directors’ Report 27 Directors’ Statement 28 Statutory Declaration 29 Independent Auditors’ Report 33 Statements of Financial Position 34 Statements of Profit or Loss 35 Statements of Comprehensive Income 36 Statements of Changes in Equity 40 Statements of Cash Flows 46 Notes to the Financial Statements
HSBC BANK MALAYSIA BERHAD (Company No. 198401015221 (127776-V))
(Incorporated in Malaysia)
BOARD OF DIRECTORS
Tan Sri Dato’ Tan Boon Seng @ Krishnan
Independent Non-Executive Chairman
Stuart Paterson Milne
Non-Independent Executive Director/Chief Executive Officer
Mukhtar Malik Hussain
Non-Independent Executive Director
Lee Choo Hock
Independent Non-Executive Director
Tan Kar Leng @ Chen Kar Leng
Independent Non-Executive Director
Choo Yoo Kwan @ Choo Yee Kwan
Independent Non-Executive Director
Datin Che Teh Ija Binti Mohd Jalil
Independent Non-Executive Director
1

HSBC BANK MALAYSIA BERHAD (Company No. 198401015221 (127776-V))
(Incorporated in Malaysia)
CORPORATE GOVERNANCE DISCLOSURES
The corporate governance practices set out on pages 2 to 14 and the information referred to therein constitutes the Corporate Governance Report of HSBC Bank Malaysia Berhad (the Bank). As a banking institution licensed under the Financial Services Act 2013, the Bank complies with the corporate governance standards set out in the Bank Negara Malaysia (BNM) Policy Document on Corporate Governance (BNM Corporate Governance Policy).
Directors
The Directors serving as at the date of this report are set out below:
Tan Sri Dato’ Tan Boon Seng @ Krishnan, 69
Independent Non-Executive Chairman
Member of the Nominations and Remuneration Committee Appointed to the Board: April 2014 Independent Non-Executive Chairman since March 2017
Tan Sri Dato’ Krishnan Tan has been appointed as Independent Non-Executive Chairman of the Bank on 15 March 2017. He was previously appointed as Independent Non-Executive Director on 2 April 2014. He is a member of the Nominations and Remuneration Committee of the Bank. He resigned as a member of the Audit Committee and Risk Committee on 1 April 2020.
Tan Sri Dato’ Krishnan Tan qualified as a Certified Public Accountant in 1978 after graduating with a Bachelor of Economics (Honours) degree from University of Malaya in 1975, and holds a Master’s degree in Business Administration from Golden Gate University, San Francisco, USA.
He joined IJM Corporation Berhad as Financial Controller in 1983 and was appointed Group Managing Director in 1997 and served in this position until 2010. He held the position of Executive Deputy Chairman of IJM Corporation Berhad from 2011 to 2013 and Non-Executive Deputy Chairman thereafter till August 2019.
He is currently the Non-Executive Chairman of IJM Corporation Berhad and Director of IJM Plantations Berhad, Grupo Concesionario del Oeste S.A., Argentina, Malaysia Airlines Berhad, and Malaysia Aviation Group Berhad. He is also a member of the Board of Trustees of the Malaysian Community & Education Foundation and a member of the Olympic Council Trust Management Committee.
Tan Sri Krishnan does not have any shareholding in the Bank.
Stuart Paterson Milne, 61 Non-Independent Executive Director and Chief Executive Officer Appointed to the Board: May 2018
Mr Milne was appointed as the Non-Independent Executive Director and Chief Executive Officer (CEO) on 24 May 2018.
Mr Milne graduated from the University of Durham, United Kingdom with a Bachelor of Arts (Honours) in Oriental Studies (Modern Arabic Studies). He joined HSBC in 1981. Since then, he has worked in a variety of businesses in the United Arab Emirates, Hong Kong, the Philippines, France, United States, Japan and India.
Prior to his appointment in Malaysia, he was the CEO of HSBC Japan and HSBC India respectively.
Mr Milne is a Non-Independent Executive Director of HSBC Amanah Malaysia Berhad (HBMS).
Mr Milne does not have any shareholding in the Bank. His interest in the Bank’s related corporation is as disclosed in the Directors’ Report on page 17.
2

HSBC BANK MALAYSIA BERHAD (Company No. 198401015221 (127776-V))
(Incorporated in Malaysia)
CORPORATE GOVERNANCE DISCLOSURES (Cont’d)
Directors (Cont’d)
Mukhtar Malik Hussain, 61
Non-Independent Executive Director
Appointed to the Board: December 2009
Mr Mukhtar was appointed as the Non-Independent Executive Director on 15 December 2009. Mr Mukhtar graduated from the University of Wales with a Bachelor of Science in Economics. He first joined
the HSBC Group in 1982 as a graduate trainee in Midland Bank International. He was then appointed as
Assistant Director in Samuel Montagu in 1991. After more than 10 years of working in the HSBC Group’s
London offices, Mr Mukhtar held numerous posts in Dubai, including CEO of HSBC Financial Services
(Middle East) Limited from 1995 to 2003. He established the initiative to create the first foreign investment
bank in Saudi Arabia for HSBC.
In 2003, Mr Mukhtar assumed the position of CEO, Corporate and Investment Banking. He then headed back
to London as the Co-Head of Global Banking in 2006. He was the Global Head of Principal Investments in
London from 2006 to 2008. Between 2008 to 2009, he was the Deputy Chairman of HSBC Bank Middle East
Limited and Global CEO of HSBC Amanah Malaysia Berhad. He was also the CEO, Global Banking and
Markets for Middle East and North Africa before assuming his role as the CEO of the Bank from 2009 to
2018. Mr Mukhtar is currently HSBC Group General Manager and Head of Belt & Road Initiatives for HSBC
Asia Pacific.
Mr Mukhtar is a Non-Independent Executive Director of HSBC Amanah Malaysia Berhad, Director and
Chairman of HSBC Bank (Singapore) Limited.
Mr Mukhtar does not have any shareholding in the Bank. His interest in the Bank’s related corporation is as
disclosed in the Directors’ Report on page 17.
Lee Choo Hock, 68
Independent Non-Executive Director
Chairman of the Audit Committee and member of the Nominations and Remuneration Committee Appointed to the Board: December 2013 Mr Lee was appointed as Independent Non-Executive Director of the Bank on 5 December 2013. He is Chairman of the Audit Committee and a member of the Nominations and Remuneration Committee of the Bank.
He is a member of the Institute of Chartered Accountants in England and Wales as well as the Malaysian
Institute of Accountants. He began his career with Miller, Brener & Co., London, a professional accounting
firm in 1975 and joined Malayan Banking Berhad (Maybank) in 1982. Having worked with Maybank for 27
years, Mr Lee has built a successful career as a professional accountant. He served various management
positions during his tenure with Maybank until he retired in 2008 and his last position was as the Executive
Vice President, Head of Accounting Services and Treasury Back Office Operations. He has also served as
a Director of a number of subsidiaries of Maybank.
He is a Director of Kossan Rubber Industries Berhad, Yayasan Kossan and a Non-Independent Non-
Executive Director of HSBC Amanah Malaysia Berhad.
Mr Lee does not have any shareholding in the Bank.
3
HSBC BANK MALAYSIA BERHAD (Company No. 198401015221 (127776-V))
(Incorporated in Malaysia)
CORPORATE GOVERNANCE DISCLOSURES (Cont’d)
Directors (Cont’d)
Tan Kar Leng @ Chen Kar Leng, 77
Independent Non-Executive Director
Chairman of the Nominations and Remuneration Committee and member of the Risk Committee
Appointed to the Board: April 2014
Ms Chen was appointed as Independent Non-Executive Director of the Bank on 2 April 2014. She is
Chairman of the Nominations and Remuneration Committee and a member of the Risk Committee of the
Bank.
Ms Chen was a graduate from the University of Singapore (now known as the National University of Singapore) and she was called to the Malaysian Bar in January 1968 and Brunei Bar in May 1996. She became a partner of the law firm of SKRINE, Kuala Lumpur in January 1974 and was the senior partner and Head of its Corporate Division on her retirement as a partner in December 2009. After her retirement, she has been retained as a consultant of the firm. She is an Independent Director of Eastern & Oriental Berhad and a member of the Board of Trustees of The Tun Dr Lim Chong Eu Foundation. She is also a member of several committees of the Malaysian Bar Council. Ms Chen does not have any shareholding in the Bank.
Choo Yoo Kwan @ Choo Yee Kwan, 68 Independent Non-Executive Director Chairman of the Risk Committee and member of the Audit Committee and Nominations and Remuneration Committee Appointed to the Board: February 2016 Mr Choo was appointed as Independent Non-Executive Director of the Bank on 11 February 2016. He is Chairman of the Risk Committee and a member of the Audit Committee and Nominations and Remuneration Committee of the Bank. Mr Choo has honours degrees in economics and law from University of Malaya and University of London respectively, and is a Barrister-at-Law (of Lincoln’s Inn) following his call to the Bar of England and Wales in 1984. He retired in July 2014 after having served the banking and risk management industry for 38 years. His last position was as Country Chief Risk Officer for OCBC Bank (Malaysia) Berhad (OCBC), having first joined the OCBC Group in December 2007. Prior to joining OCBC, he was the Chief Risk Officer for Maybank Group and Group Chief Risk Officer for Alliance Bank Malaysia Berhad. During his 14 years’ career at Maybank Group, he had served as Division Head for Credit Control; International Banking; Corporate Remedial Management; and Group Risk Management. He also served on the Corporate Debt Restructuring Committee set up under Bank Negara Malaysia. Before starting his career with Maybank, he had worked for the National Westminster Bank plc of the United Kingdom in the areas of Global Specialised Industries; and Group Credit Control. Mr Choo had served on the Education Committee of Asian Institute of Chartered Bankers for 14 years, between 2000 and 2014; and was re-appointed to Education Committee in June 2016. He was appointed as a member of the University Malaya Medical Centre Ethics Committee for 2 years from 2014 to 2015. He is a Chartered Banker and currently serves as a Teaching Facilitator in the Asian Banking School. He is an Independent Director of Danajamin Nasional Berhad and a member of FAA Accreditation Council. Mr Choo does not have any shareholding in the Bank.
4
HSBC BANK MALAYSIA BERHAD (Company No. 198401015221 (127776-V))
(Incorporated in Malaysia)
CORPORATE GOVERNANCE DISCLOSURES (Cont’d)
Directors (Cont’d)
Datin Che Teh Ija Binti Mohd Jalil, 68 Independent Non- Executive Director Member of the Audit Committee and Risk Committee Appointed to the Board: August 2019
Datin Teh has been appointed as Independent Non-Executive Director of HSBC Bank Malaysia Berhad on 1 August 2019. She is a member of the Audit Committee and Risk Committee of the Bank. Datin Teh holds a Bachelor of Arts (Honours) from University of Malaya and Master of Business Administration from Southern New Hampshire University. She began her career in the civil service and built her competency in the area of economic policy-making and international trade and finance through her 24 years in government. She retired from the Securities Commission of Malaysia (SC) where she had served for 17 years since 2000 in various capacities including Executive Director and as Advisor of Special Projects in the Chairman’s Office. During her stint in the SC, she was involved in capital market policies development and regulation, human capital development and training and education. She also co-led in the establishment of the Securities Industry Dispute Resolution Centre, Private Pension Administrator and the Capital Markets Promotion Council.
Her other experience included trade and financial services negotiations as Lead Negotiator in the World
Trade Organization, Association of Southeast Asian Nations and Asia–Pacific Economic Cooperation as well
as representing the Ministry of Finance (“MoF”) in World Bank, International Monetary Fund, APEC Finance
Ministers meetings during her tenure with MoF from 1990 to 1999.
She is currently an Independent Non-Executive Director of UEM Sunrise Berhad and Finance Accreditation
Agency Berhad.
Datin Teh does not have any shareholding in the Bank.
5
HSBC BANK MALAYSIA BERHAD (Company No. 198401015221 (127776-V))
(Incorporated in Malaysia)
CORPORATE GOVERNANCE DISCLOSURES (Cont’d)
BOARD RESPONSIBILITY AND OVERSIGHT Board of Directors The objectives of the management structure within the Bank, headed by the Board of Directors and led by the Independent Non-Executive Chairman, are to deliver sustainable value to shareholders and promote a culture of openness and debate. The Board is responsible for overseeing the management of the Bank and reviewing the Bank’s strategic plans and key policies. Although the Board delegates the day-to-day management of the Bank’s business and implementation of strategy to the Executive Committee, certain matters, including annual operating plans, risk appetite and performance targets, procedures for monitoring and controlling operations, approval of credit or market risk limits, specified senior appointments and any substantial change in balance sheet management policy are reserved by the Board for approval. The Board meets regularly to review reports on performance against financial and other strategic objectives, key business challenges, risk, business developments, and investor and external relations. All Directors have full and timely access to all relevant information and are encouraged to have free and open contact with management at all levels. Directors may take independent professional advice, if necessary, at the Bank’s expense. At the date of this report, the Board consists of seven (7) members; comprising one (1) Independent Non-Executive Chairman, two (2) Non-Independent Executive Directors and four (4) Independent Non-Executive Directors. The names of the Directors serving at the date of this report and brief biographical particulars for each of them are set out on pages 2 to 5. Appointments to the Board are made on merit and candidates are considered against objective criteria, having due regard to the benefits of diversity on the Board. A rigorous selection process, overseen by the Nominations and Remuneration Committee and based on agreed requirements including BNM Corporate Governance Policy requirements are followed in relation to the appointment of Directors. All Directors, including those appointed by the Board to fill a casual vacancy, are subjected to annual re-election by shareholder at the Bank’s Annual General Meeting. Non-Executive Directors are appointed for an initial three-year term and, subject to re-election by shareholder at Annual General Meetings, are typically expected to serve two three-year terms. Any term beyond six (6) years is subject to rigorous review. Tenure of Independent Non-Executive Directors shall not exceed a cumulative term of nine years. The terms and conditions of appointment of Non-Executive Directors are set out in a letter of appointment, which include the expectations of them and the time estimated for them to meet their commitment to the Bank. The current anticipated minimum time of commitment, which is subject to periodic review and adjustment by the Board, is 30 days per year and with appointment in not more than five (5) public listed companies. Time devoted to the Bank could be considerably more, particularly if serving on Board committees. All Non-Executive Directors have confirmed that they can meet this requirement. Independent Non-Executive Directors are not HSBC employees and do not participate in the daily business management of the Bank. They bring an external perspective, constructively challenge and help develop proposals on strategy, scrutinise the performance of management in meeting agreed goals and objectives, and monitor the risk profile and reporting of performance of the Bank. The Board has determined that each Non-Executive Director is independent in character and judgement, and there are no relationships or circumstances likely to affect the judgement of the Independent Non-Executive Directors. The roles of the Independent Chairman and CEO are separate, with a clear division of responsibilities between
the running of the Board and executive responsibility for running the Bank’s business.
6
HSBC BANK MALAYSIA BERHAD (Company No. 198401015221 (127776-V))
(Incorporated in Malaysia)
CORPORATE GOVERNANCE DISCLOSURES (Cont’d)
BOARD RESPONSIBILITY AND OVERSIGHT (Cont’d) Board of Directors (Cont’d)
Board and Committee Meetings
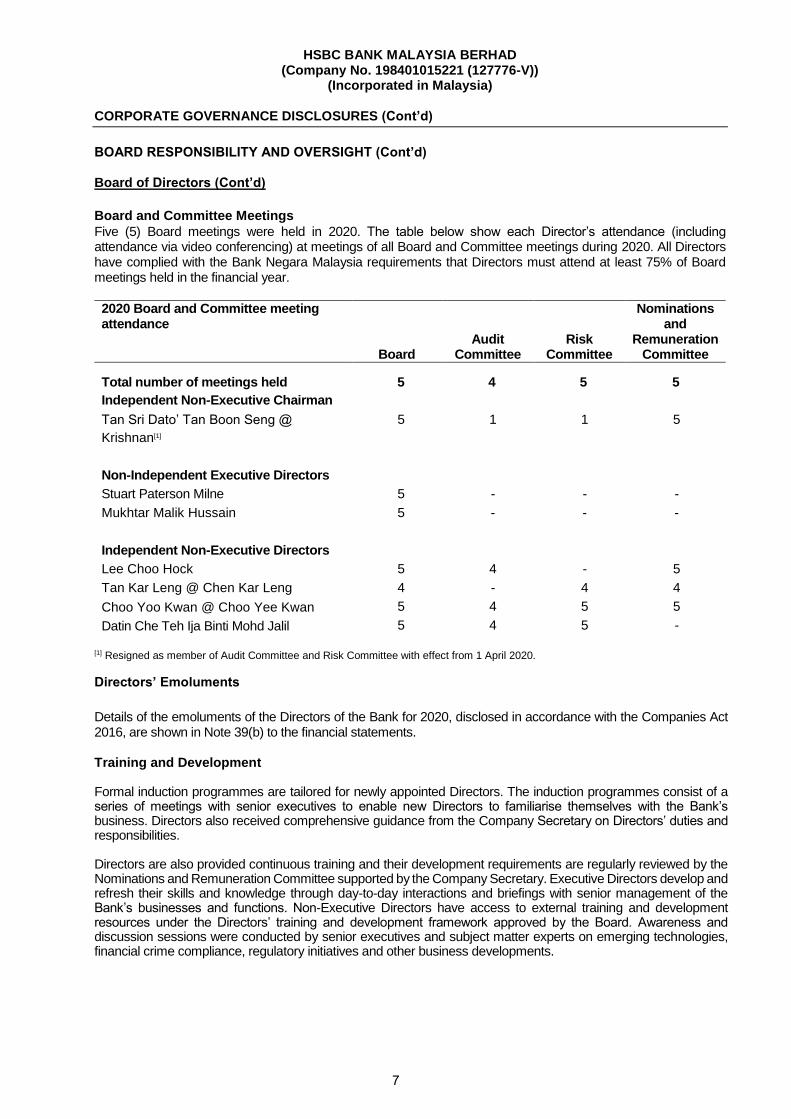
Five (5) Board meetings were held in 2020. The table below show each Director’s attendance (including attendance via video conferencing) at meetings of all Board and Committee meetings during 2020. All Directors have complied with the Bank Negara Malaysia requirements that Directors must attend at least 75% of Board meetings held in the financial year.
2020 Board and Committee meeting attendance
Board Audit
Committee Risk
Committee
Nominations and
Remuneration Committee
Total number of meetings held 5 4 5 5
Independent Non-Executive Chairman
Tan Sri Dato’ Tan Boon Seng @
Krishnan[1]
5 1 1 5
Non-Independent Executive Directors
Stuart Paterson Milne 5 - - -
Mukhtar Malik Hussain 5 - - -
Independent Non-Executive Directors
Lee Choo Hock 5 4 - 5
Tan Kar Leng @ Chen Kar Leng 4 - 4 4
Choo Yoo Kwan @ Choo Yee Kwan 5 4 5 5
Datin Che Teh Ija Binti Mohd Jalil 5 4 5 -
[1] Resigned as member of Audit Committee and Risk Committee with effect from 1 April 2020.
Directors’ Emoluments
Details of the emoluments of the Directors of the Bank for 2020, disclosed in accordance with the Companies Act 2016, are shown in Note 39(b) to the financial statements.
Training and Development Formal induction programmes are tailored for newly appointed Directors. The induction programmes consist of a series of meetings with senior executives to enable new Directors to familiarise themselves with the Bank’s business. Directors also received comprehensive guidance from the Company Secretary on Directors’ duties and responsibilities. Directors are also provided continuous training and their development requirements are regularly reviewed by the Nominations and Remuneration Committee supported by the Company Secretary. Executive Directors develop and refresh their skills and knowledge through day-to-day interactions and briefings with senior management of the Bank’s businesses and functions. Non-Executive Directors have access to external training and development resources under the Directors’ training and development framework approved by the Board. Awareness and discussion sessions were conducted by senior executives and subject matter experts on emerging technologies, financial crime compliance, regulatory initiatives and other business developments.
7
HSBC BANK MALAYSIA BERHAD (Company No. 198401015221 (127776-V))
(Incorporated in Malaysia)
CORPORATE GOVERNANCE DISCLOSURES (Cont’d)
BOARD RESPONSIBILITY AND OVERSIGHT (Cont’d) During the year, Directors have also attended talks, dialogue sessions and focus group sessions organised by
Financial Institutions Directors’ Education (FIDE) Forum, and have received refresher training and courses related
to Individual Liquidity Adequacy Assessment, Internal Liquidity Metric, Model Risk, Cybersecurity updates and
Clouds application. The Audit Committee and Risk Committee Chairmen have attended a one-day forum for the
HSBC Group’s Non-Executive Directors held in September 2020.
Board Committees The Board has established a number of committees, the membership of which comprises Independent Non-Executive Directors who have the skills, knowledge and experience relevant to the responsibilities of the committee. The Board and each Board committee have terms of reference to document their responsibilities and governance procedures. The details of the Board Charter comprising the Board committees’ terms of reference are available at http://www.about.hsbc.com.my/hsbc-in-malaysia/management-team. The key roles of the Board committees are described in the paragraph below. The Chairman of each Board committee reports to each subsequent Board meeting on the activities of the Board committee. Each Board committee will evaluate its terms of reference and its own effectiveness annually. As at the date of this report, the following are the principal Board committees: 1. Audit Committee The Audit Committee is accountable to the Board and has non-executive responsibility for oversight of and advice to the Board on financial reporting, including Pillar 3 Disclosures and internal controls over financial reporting, covering all material controls. The Audit Committee reviews the financial statements of the Bank before submission to the Board. It also monitors and reviews the effectiveness of the internal audit function and the Bank’s financial and accounting policies and practices. The Audit Committee advises the Board on the appointment of the external auditors and is responsible for oversight of the external auditors. The Audit Committee reviews and approves the internal audit’s annual plan and discusses on the internal audit resources. The Audit Committee meets regularly with the Bank’s senior financial and internal audit management and the external auditor to consider, inter alia, the Bank’s financial reporting, the nature and scope of audit reviews and the effectiveness of the systems of internal control relating to financial reporting. The current members of the Audit Committee, all being Independent Non-Executive Directors, are:
Lee Choo Hock (Chairman)
Choo Yoo Kwan @ Choo Yee Kwan
Datin Che Teh Ija bt Mohd Jalil
During 2020, the Audit Committee held 4 meetings. Attendance is set out in the table on page 7. 2. Risk Committee The Risk Committee is accountable to the Board and has non-executive responsibility for oversight of and advice to the Board on risk related matters and the principal risks impacting the Bank, risk governance and internal control systems (other than internal financial control systems). The Risk Committee meets regularly with the Bank’s senior financial, risk, internal audit and compliance management to consider, inter alia, risk reports and the effectiveness of compliance.
8
HSBC BANK MALAYSIA BERHAD (Company No. 198401015221 (127776-V))
(Incorporated in Malaysia)
CORPORATE GOVERNANCE DISCLOSURES (Cont’d)
BOARD RESPONSIBILITY AND OVERSIGHT (Cont’d)
Board Committees (Cont’d)
The Board and the Risk Committee oversee the maintenance and development of a strong risk management framework by continually monitoring the risk environment, top and emerging risks facing the Bank and mitigation actions planned and taken. The Risk Committee recommends the approval of the Bank’s risk appetite statement to the Board and monitors performance against the key performance/risk indicators included within the statement. The Risk Committee monitors the risk profiles for all of the risk categories within the Bank’s business. 2. Risk Committee (Cont’d) The current members of the Risk Committee, all being Independent Non-Executive Directors, are:
Choo Yoo Kwan @ Choo Yee Kwan (Chairman)
Tan Kar Leng @ Chen Kar Leng
Datin Che Teh Ija bt Mohd Jalil
During 2020, the Risk Committee held 5 meetings. Attendance is set out in the table on page 7.
3. Nominations and Remuneration Committee
The combined Nominations and Remuneration Committee is accountable to the Board and has non-
executive responsibility for: (i) leading the process for Board appointments and for identifying and
nominating, for the approval of the Board, candidates for appointment to the Board; (ii) reviewing the
candidates for appointment to the senior management team; and (iii) supporting the Board in overseeing
the operation of the Bank’s remuneration system and reviewing the remuneration of Directors on the Board.
The Nominations and Remuneration Committee considers plans for orderly succession to the Board and the appropriate balance of skills, knowledge and experience on the Board. The Nominations and
Remuneration Committee assists the Board in the evaluation of the Board’s own effectiveness and that of
its committees annually. The findings of the performance evaluation and the implementation of actions
arising from the performance evaluation are reported to the Board during 2020.
CEO’s performance evaluation is undertaken as part of the performance management process for all employees. The results will be considered by the Nominations and Remuneration Committees when reviewing the variable pay awards. The members of the Nominations and Remuneration Committee, being all Independent Non-Executive Directors, are:
Tan Kar Leng @ Chen Kar Leng (Chairman)
Choo Yoo Kwan @ Choo Yee Kwan
Lee Choo Hock
Tan Sri Dato’ Tan Boon Seng @ Krishnan During 2020, the Nominations and Remuneration Committee held 5 meetings. Attendance is set out in the table on page 7.
9
HSBC BANK MALAYSIA BERHAD (Company No. 198401015221 (127776-V))
(Incorporated in Malaysia)
CORPORATE GOVERNANCE DISCLOSURES (Cont’d)
BOARD RESPONSIBILITY AND OVERSIGHT (Cont’d) Board Committees (Cont’d) Delegations by the Board Connected Party Transactions Committee The Connected Party Transactions Committee is delegated with the authority to approve transactions with connected parties of the Bank. The current members of the Connected Party Transaction Committee are:
Lee Choo Hock
Tan Kar Leng @ Chen Kar Leng
Tan Sri Dato’ Tan Boon Seng @ Krishnan
Chief Risk Officer
Head of Wholesale Credit and Market Risk
Executive Committee The Executive Committee which consists of key senior management members, meets regularly and operates as a general management committee under the direct authority of the Board. The committee exercising all of the powers, authorities and discretions of the Board in so far as they concern the management and day-to-day running of the Bank, in accordance with such policies and directions as the Board may from time to time determine. The Bank’s CEO, Stuart Paterson Milne, chairs the Executive Committee. To strengthen the governance framework in anticipation of structural and regulatory changes that affect the Bank, the following sub-committees of the Executive Committee were established: (i) Asset and Liability Management Committee
The Asset and Liability Management Committee is responsible for the efficient management of the Bank’s balance sheet and the prudent management of risks pertaining to capital, liquidity and funding as well as interest rate risk, structural foreign exchange and structural/strategic equity risk.
(ii) Risk Management Meeting
The Risk Management Meeting is responsible for the oversight of the risk framework. Regular Risk Management Meetings (RMM), chaired by the Chief Risk Officer, are held to establish, maintain and periodically review the policy and guidelines for the management of risk within the Bank.
(iii) Financial Crime Risk Management Committee
The Financial Crime Risk Management Committee is a formal governance committee established to ensure effective enterprise-wide management of financial crime risk and to support the CEO (the Chair) in discharging the financial crime risk responsibilities.
(iv) IT Steering Committee The IT Steering Committee is responsible for the oversight of the implementation and development of the IT strategy. The Committee is accountable for reviewing, challenging and approving the financial planning and IT performance.
(v) People Committee The People Committee is established as a principle human resource forum to drive People Plan i.e. build capability, talent, succession and leaders. The Committees oversees the development and delivery of key people initiative or programmes, and resolve any critical people risks or issues.
10
HSBC BANK MALAYSIA BERHAD (Company No. 198401015221 (127776-V))
(Incorporated in Malaysia)
CORPORATE GOVERNANCE DISCLOSURES (Cont’d)
BOARD RESPONSIBILITY AND OVERSIGHT (Cont’d) Board Committees (Cont’d) Conflicts of Interest and Indemnification of Directors The Board has adopted a policy and procedures relating to Directors’ conflicts of interest. Where conflicts of interest arise, the Board has the power to authorise them. A review of those conflicts which have been authorised, and the terms of those authorisations, is undertaken by the Audit Committee annually. The Bank maintained on a group basis, a Directors’ and Officers’ Liability Insurance which provides adequate insurance cover for the Directors and Officers of the Group and the Bank. None of the Directors had, during the year, any material interest, directly or indirectly, in any contract of significance with the Bank. All Directors are regularly reminded of their obligations in respect of disclosure of conflicts or potential conflicts of interest in any transactions with the Bank. MANAGEMENT REPORTS The Board meetings are structured around a pre-set agenda and reports for discussion, notation and approvals are circulated in advance of the meeting dates. To enable Directors to keep abreast with the performance of the Bank and its subsidiaries (collectively known as the Group), key reports submitted to the Board during the financial year include:
Minutes of the Board Committees
Annual Operating Plan
CEO Updates
Capital Plan
Credit Transactions and Exposures to Connected Parties
Financial Crime Compliance, Anti-Money Laundering and Counter Terrorist Financing Reports
Internal Capital Adequacy Assessment Process
Quarterly and Annual Financial Statements
Quarterly Internal Audit Progress Reports
Risk Appetite Statement
Risk and Compliance Reports
Stress Testing Results
11
HSBC BANK MALAYSIA BERHAD (Company No. 198401015221 (127776-V))
(Incorporated in Malaysia)
CORPORATE GOVERNANCE DISCLOSURES (Cont’d)
INTERNAL CONTROL FRAMEWORK
The Board is responsible for maintaining and reviewing the effectiveness of risk management and internal control systems, and for determining the aggregate levels and types of risks the Group and the Bank are willing to take in achieving their strategic objectives. To meet this requirement and to discharge its obligations, procedures have been designed for safeguarding assets against unauthorised use or disposal; for maintaining proper accounting records; and for ensuring the reliability and usefulness of financial information used within the business or for publication. These procedures provide reasonable assurance against material mis-statement, errors, losses or fraud. They are designed to provide effective internal control within the Group and the Bank. The procedures have been in place throughout the year and up to 5 February 2021, the date of approval of the audited financial statements of the Group and the Bank for the financial year ended 31 December 2020.
The key risk management and internal control procedures include the following:
Group's Global Principles The Global Principles set an overarching standard for all other policies and procedures throughout the HSBC Group and are fundamental to the Group and the Bank’s risk management structure. It spells out, and connect, the Group and the Bank’s purpose, values, strategy and risk management principles, guiding on what is right and the manner to treat customers and colleagues fairly at all times.
Risk management framework (RMF) The RMF provides an effective and efficient approach to govern and oversee the organisation and monitor and mitigate risks to the delivery of the Group and the Bank’s strategy. It applies to all categories of risk, covering core governance, standards and principles that bring together all risk management practices into an integrated structure.
Delegation of authority within limits set by the Board
Subject to certain matters reserved for the Board, the Group and the Bank’s Chief Executive Officer, Chief Risk Officer and other authorised persons, have been delegated authority limits and powers within which to manage the day-to-day affairs of the Group, including the right to sub-delegate those limits and powers. Each relevant Executive Committee member has delegated authority within which to manage the day-to-day affairs of the business or function for which he or she is accountable. Delegation of authority from the Board requires those individuals to maintain a clear and appropriate apportionment of significant responsibilities and to oversee the establishment and maintenance of systems of control that are appropriate to their business or function. Authorities to enter into credit and market risk exposures are delegated with limits to line management of the Bank. However, credit proposals with specified higher-risk characteristics require the concurrence of the appropriate regional and global function. Credit and market risks are measured and reported at subsidiary company level and aggregated for risk concentration analysis on a Group-wide basis.
Risk identification and monitoring Systems and procedures are in place to identify, assess, control and monitor the material risk types facing the Group and the Bank as set out in the enterprise-wide risk framework. The Group and the Bank’s risk measurement and reporting systems are designed to help ensure that material risks are captured with all the attributes necessary to support well-founded decisions, that those attributes are accurately assessed and that information is delivered in a timely manner for those risks to be successfully managed and mitigated.
12
HSBC BANK MALAYSIA BERHAD (Company No. 198401015221 (127776-V))
(Incorporated in Malaysia)
CORPORATE GOVERNANCE DISCLOSURES (Cont’d)
INTERNAL CONTROL FRAMEWORK (Cont’d)
Changes in market conditions/practices
Processes are in place to identify new risks arising from changes in market conditions/practices or customer behaviours, which could expose the Group and the Bank to heightened risk of loss or reputational damage. The Group and the Bank employ a top and emerging risks framework, which contains an aggregate of all current and forward-looking risks and enables it to take action that either prevents these risk from materialising or to limit their impact.
Responsibility for risk management
All employees are responsible for identifying and managing risk within the scope of their role as part of the three lines of defence model, which is an activity-based model to delineate management accountabilities and responsibilities for risk management and the control environment. The second line of defence sets the policy and guidelines for managing specific risk areas, provides advice and guidance in relation to the risk, and challenges the first line of defence (the risk owners) on effective risk management.
The Board delegated authority to the Audit Committee (AC) and it reviewed the independence, autonomy and effectiveness of the firm's policies and procedures on whistleblowing, including the procedures for the protection of staff who raise concerns of detrimental treatment.
Strategic plans
Strategic plans are prepared for global businesses and global functions within the framework of the HSBC Group’s overall strategy. Annual operating plans, informed by detailed analysis of risk appetite describing the types and quantum of risk that the Bank is prepared to take in executing its strategy, are prepared and adopted, and sets out the key business initiatives and the likely financial effects of those initiatives.
Internal control over financial reporting As subsidiaries of HSBC, the Group and the Bank are required to comply with section 404 of the US Sarbanes- Oxley Act of 2002 and assess its effectiveness of internal control over financial reporting at 31 December 2020. In 2014, HSBC Group Audit Committee (GAC) endorsed the adoption of the Committee of Sponsoring Organisations of the Treadway Commission (COSO) 2013 framework for the monitoring of risk management and internal control systems to satisfy the requirements of section 404 of the Sarbanes-Oxley Act. The key risk management and internal control procedures over financial reporting include the following:
Entity level controls The primary mechanism through which comfort over risk management and internal control systems is achieved is through assessments of the effectiveness of entity level controls, and the reporting of risk and control issues on a regular basis through the various risk management and risk governance forums. Entity level controls are internal controls that have a pervasive influence over the entity as a whole. They include controls related to the control environment, such as the Group and the Bank's values and ethics, the promotion of effective risk management and the overarching governance exercised by the Board and its non-executive committees.
The design and operational effectiveness of entity level controls are assessed annually as part of the assessment of the effectiveness of internal controls over financial reporting. If issues are significant to the Bank, they are escalated to the Audit Committee for financial reporting issues and/or the Risk Committee for all other risk types.
13
HSBC BANK MALAYSIA BERHAD (Company No. 198401015221 (127776-V))
(Incorporated in Malaysia)
CORPORATE GOVERNANCE DISCLOSURES (Cont’d)
INTERNAL CONTROL FRAMEWORK (Cont’d)
Process level transactional controls
Key process level controls that mitigate the risk of financial misstatement are identified, recorded and monitored in accordance with the risk framework. This includes the identification and assessment of relevant control issues, against which action plans are tracked through to remediation. The Audit Committee and Risk Committee have continued to receive regular updates on the Group and the Bank’s ongoing activities for improving the effective oversight of 'end-to-end' business processes, which continues to identify opportunities for enhancing key controls, such as through the use of automation technologies.
Financial reporting
The Group and the Bank’s financial reporting process for preparing the financial statements is in
accordance with the Malaysian Financial Reporting Standards, International Financial Reporting
Standards, the requirements of the Companies Act 2016 in Malaysia and guidelines issued by BNM. The
financial reporting process is further supported by documented accounting policies and reporting formats
with detailed instructions and guidance on the reporting requirements issued by Global Finance to the
Group and the Bank in advance of each quarterly reporting period, as well as analytical review procedure.
The financial reports of the Group and the Bank are subjected to certification by the Chief Financial Officer
and Board’s approval.
Subsidiary Certifications
Half yearly confirmations are provided to the parent bank’s Audit Committee from the Audit Committee of
the Bank regarding whether the financial statements have been prepared in accordance with HSBC Group
policies, present fairly the state of affairs of the relevant principal subsidiary and are prepared on a going
concern basis.
During 2020, the Group and the Bank continued to focus on operational resilience and invest in the non-financial risk infrastructure. There was a particular focus on material and emerging risks with significant progress made enhancing the end-to-end risk and control assessment process. The annual review of the effectiveness of the Group and the Bank's system of risk management and internal control over financial reporting was conducted with reference to the COSO 2013 framework, and is reviewed regularly by the Board, the Risk Committee and the Audit Committee. The Risk Committee and the Audit Committee have received confirmation that executive management has taken or is taking the necessary actions to remedy any failings or weaknesses identified through the operation of the framework of controls. REMUNERATION POLICY
The remuneration policy for the HSBC Group aims to reward success, not failure, and to be properly aligned with the risk management framework and risk outcomes. In order to ensure alignment between remuneration and business strategy, individual remuneration is determined through assessment of performance, delivered against both annual and long-term objectives summarised in performance scorecards, as well as adherence to HSBC Values of being ‘open, connected and dependable’ and acting with ‘courageous integrity’. Altogether, performance is judged not only on what is achieved over the short and long term, but also on how it is achieved, as the latter contributes to the sustainability of the organisation. The financial and non-financial measures incorporated in the annual and long-term scorecards are carefully considered to ensure alignment with the long-term strategy of the HSBC Group. The Group and the Bank have fully adopted the remuneration policy of HSBC Holdings plc. Please refer to the HSBC remuneration practices and governance at http://www.hsbc.com/our-approach/remuneration for more details of the governance structure and the remuneration strategy of the HSBC Group.
In recognition to the local regulations, the materiality of definition needs to be taken into consideration in
ensuring a robust corporate governance framework has been duly applied for the Group and the Bank.
14
HSBC BANK MALAYSIA BERHAD (Company No. 198401015221 (127776-V))
(Incorporated in Malaysia)
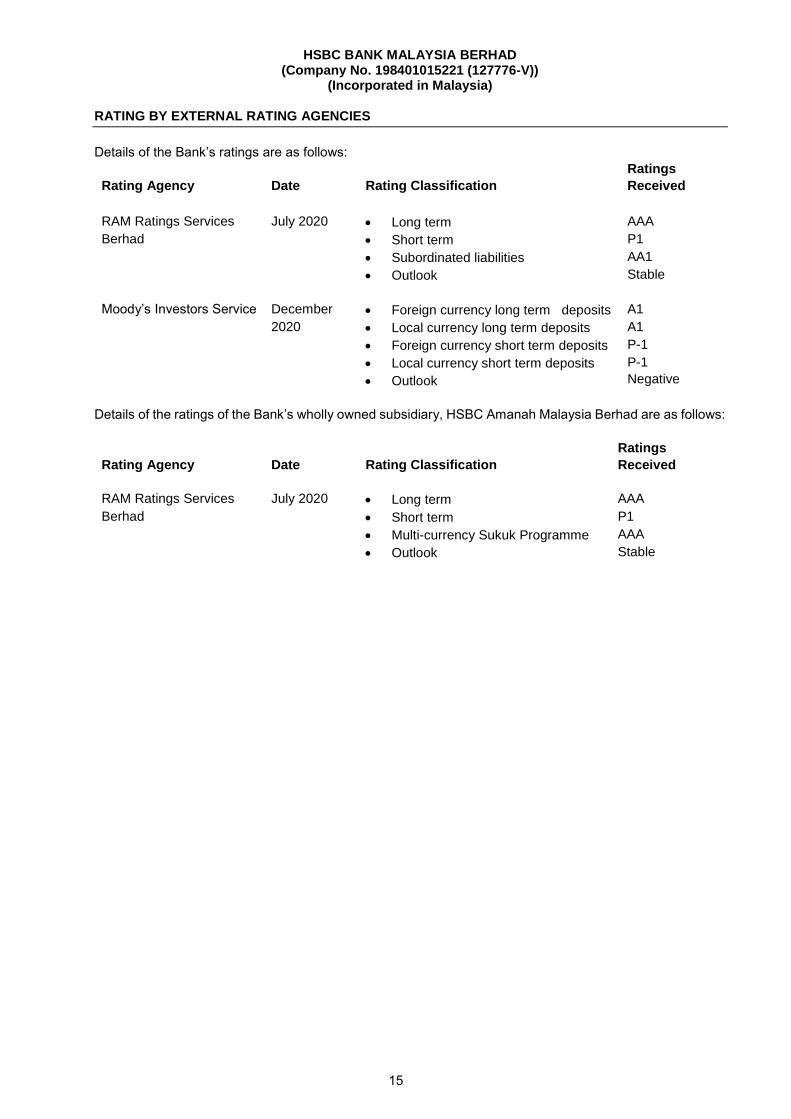
RATING BY EXTERNAL RATING AGENCIES
Details of the Bank’s ratings are as follows:
Rating Agency
Date
Rating Classification
Ratings
Received
RAM Ratings Services July 2020 Long term AAA
Berhad Short term P1
Subordinated liabilities AA1
Outlook Stable
Moody’s Investors Service December Foreign currency long term deposits A1
2020 Local currency long term deposits A1
Foreign currency short term deposits P-1
Local currency short term deposits
Outlook
P-1
Negative
Details of the ratings of the Bank’s wholly owned subsidiary, HSBC Amanah Malaysia Berhad are as follows:
Rating Agency
Date
Rating Classification
Ratings
Received
RAM Ratings Services July 2020 Long term AAA
Berhad Short term P1
Multi-currency Sukuk Programme AAA
Outlook
Stable
15
HSBC BANK MALAYSIA BERHAD (Company No. 198401015221 (127776-V))
(Incorporated in Malaysia)
DIRECTORS’ REPORT
The Directors hereby submit their report and the audited financial statements of HSBC Bank Malaysia Berhad
(the Bank) and its subsidiaries (the Group) for the financial year ended 31 December 2020.
DIRECTORS
The Directors in office during the financial year and during the period from the end of the financial year to
the date of the report are:
Tan Sri Dato’ Tan Boon Seng @ Krishnan
Stuart Paterson Milne
Mukhtar Malik Hussain
Lee Choo Hock
Tan Kar Leng @ Chen Kar Leng
Choo Yoo Kwan @ Choo Yee Kwan
Datin Che Teh Ija Binti Mohd Jalil
In accordance with Rule 21.6 of the Constitution, all Directors shall retire from the Board at the forthcoming
Annual General Meeting and, being eligible, offer themselves for re-election.
PRINCIPAL ACTIVITIES
The principal activities of the Group and the Bank are banking and related financial services, which also
include Islamic banking operations. There have been no significant changes in these activities during the
financial year.
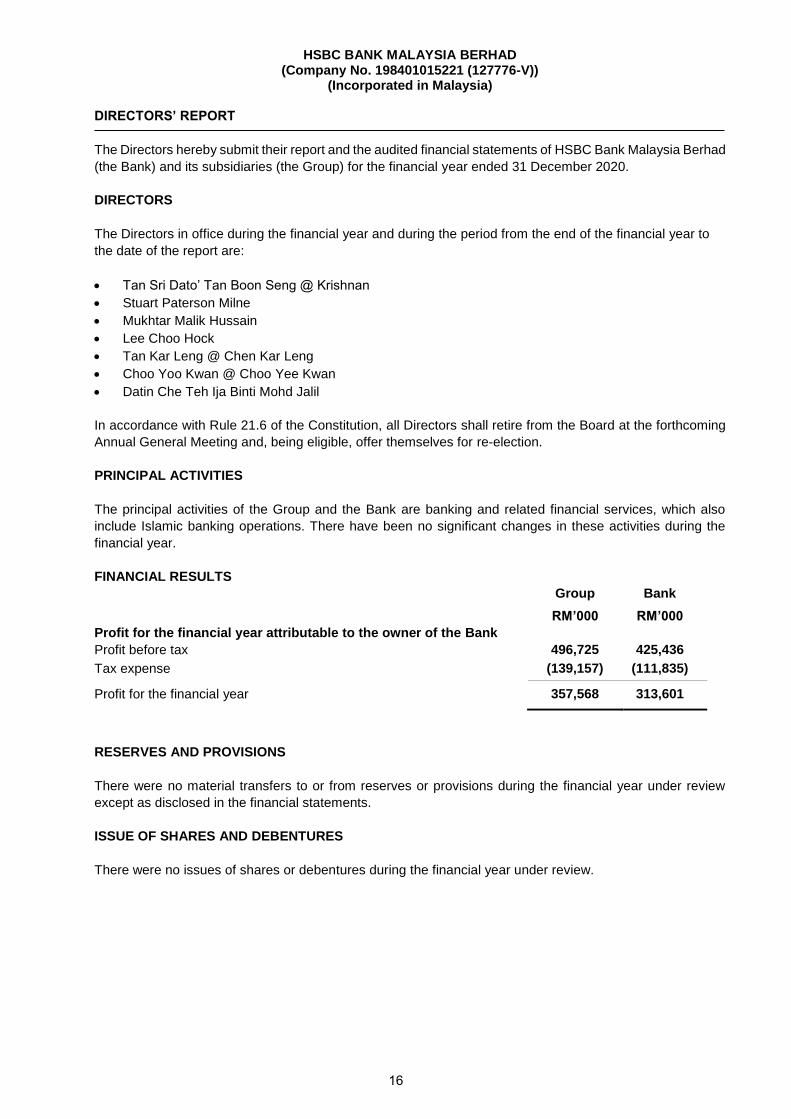
FINANCIAL RESULTS
Group Bank
Profit for the financial year attributable to the owner of the Bank
RM’000 RM’000
Profit before tax 496,725 425,436
Tax expense (139,157) (111,835)
Profit for the financial year 357,568 313,601
RESERVES AND PROVISIONS
There were no material transfers to or from reserves or provisions during the financial year under review
except as disclosed in the financial statements.
ISSUE OF SHARES AND DEBENTURES
There were no issues of shares or debentures during the financial year under review.
16
HSBC BANK MALAYSIA BERHAD (Company No. 198401015221 (127776-V))
(Incorporated in Malaysia)
DIRECTORS’ REPORT (Cont’d)
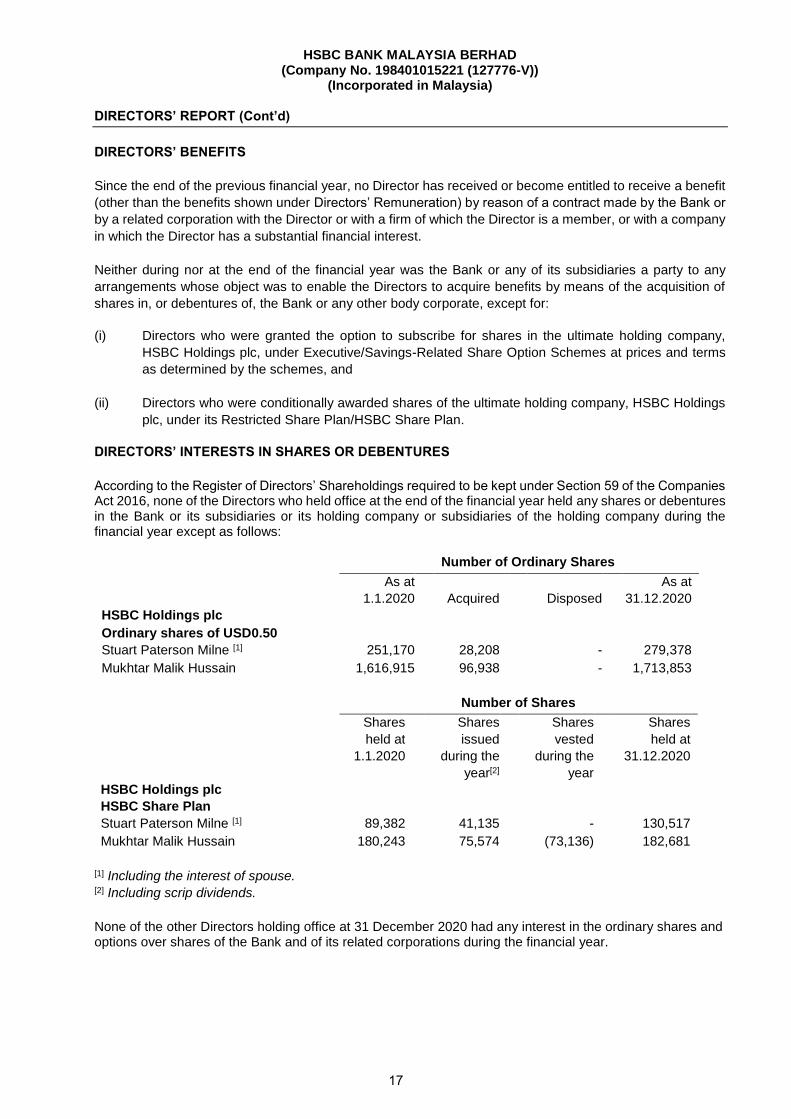
DIRECTORS’ BENEFITS
Since the end of the previous financial year, no Director has received or become entitled to receive a benefit
(other than the benefits shown under Directors’ Remuneration) by reason of a contract made by the Bank or
by a related corporation with the Director or with a firm of which the Director is a member, or with a company
in which the Director has a substantial financial interest.
Neither during nor at the end of the financial year was the Bank or any of its subsidiaries a party to any
arrangements whose object was to enable the Directors to acquire benefits by means of the acquisition of
shares in, or debentures of, the Bank or any other body corporate, except for:
(i) Directors who were granted the option to subscribe for shares in the ultimate holding company,
HSBC Holdings plc, under Executive/Savings-Related Share Option Schemes at prices and terms
as determined by the schemes, and
(ii) Directors who were conditionally awarded shares of the ultimate holding company, HSBC Holdings
plc, under its Restricted Share Plan/HSBC Share Plan.
DIRECTORS’ INTERESTS IN SHARES OR DEBENTURES
According to the Register of Directors’ Shareholdings required to be kept under Section 59 of the Companies Act 2016, none of the Directors who held office at the end of the financial year held any shares or debentures in the Bank or its subsidiaries or its holding company or subsidiaries of the holding company during the financial year except as follows:
Number of Shares
Shares
held at
1.1.2020
Shares
issued
during the
year[2]
Shares
vested
during the
year
Shares
held at
31.12.2020
HSBC Holdings plc
HSBC Share Plan
Stuart Paterson Milne [1] 89,382 41,135 - 130,517
Mukhtar Malik Hussain 180,243 75,574 (73,136) 182,681
[1] Including the interest of spouse. [2] Including scrip dividends.
None of the other Directors holding office at 31 December 2020 had any interest in the ordinary shares and options over shares of the Bank and of its related corporations during the financial year.
Number of Ordinary Shares
As at
1.1.2020
Acquired
Disposed
As at
31.12.2020
HSBC Holdings plc
Ordinary shares of USD0.50
Stuart Paterson Milne [1] 251,170 28,208 - 279,378
Mukhtar Malik Hussain 1,616,915 96,938 - 1,713,853
17
HSBC BANK MALAYSIA BERHAD (Company No. 198401015221 (127776-V))
(Incorporated in Malaysia)
DIRECTORS’ REPORT (Cont’d)
DIVIDENDS
Since the end of the previous financial year, the Bank paid a final dividend of 79.9 sen per ordinary share amounting to RM183.0 million for the financial year ended 31 December 2019. The dividend was paid on 1 June 2020. The Board of Directors via a resolution on 5 February 2021, has approved the payment of a final dividend of 82.2 sen per ordinary share, amounting to net dividend payment of RM188.2 million in respect of the financial year ended 31 December 2020. The dividend will be accounted for in the shareholder’s equity as an appropriation of retained earnings in the subsequent financial year. HOLDING COMPANIES
The Directors regard The Hongkong and Shanghai Banking Corporation Limited, a company incorporated in
Hong Kong and HSBC Holdings plc, a company incorporated in the United Kingdom, as the immediate and
ultimate holding companies of the Bank respectively.
OTHER STATUTORY INFORMATION
Before the financial statements of the Group and of the Bank were prepared, the Directors took reasonable
steps:
i) to ascertain that proper action had been taken in relation to the writing off of bad debts and the
making of provision for doubtful debts and satisfied themselves that all known bad debts had been
written off and that adequate provision had been made for doubtful debts; and
ii) to ensure that any current assets which were unlikely to be realised in the ordinary course of business
including the value of current assets as shown in the accounting records of the Group and of the
Bank had been written down to an amount which the current assets might be expected so to realise.
At the date of this report, the Directors are not aware of any circumstances:
i) which would render the amount written off for bad debts, or the amount of the provision for doubtful
debts inadequate to any substantial extent, or
ii) which would render the values attributed to current assets in the financial statements of the Group
and of the Bank misleading, or
iii) which have arisen which would render adherence to the existing method of valuation of assets or
liabilities of the Group and of the Bank misleading or inappropriate.
18

HSBC BANK MALAYSIA BERHAD (Company No. 198401015221 (127776-V))
(Incorporated in Malaysia)
DIRECTORS’ REPORT (Cont’d)
OTHER STATUTORY INFORMATION (Cont’d)
At the date of this report, there does not exist:
i) any charge on the assets of the Group and of the Bank which has arisen since the end of the
financial year which secures the liabilities of any other person, or
ii) any contingent liability in respect of the Group and of the Bank which has arisen since the end of
the financial year.
No contingent liability or other liability of any Bank in the Group has become enforceable, or is likely to
become enforceable within the period of twelve months after the end of the financial year which, in the opinion
of the Directors, will or may affect the ability of the Group and of the Bank to meet their obligations as and
when they fall due.
At the date of this report, the Directors are not aware of any circumstances not otherwise dealt with in this report or the financial statements of the Group and of the Bank which would render any amount stated in the respective financial statements misleading. In the opinion of the Directors: i) the results of the operations of the Group and of the Bank during the financial year were not
substantially affected by any item, transaction or event of a material and unusual nature; and
ii) there has not arisen in the interval between the end of the financial year and the date of this report any item, transaction or event of a material and unusual nature likely to affect substantially the results of the operations of the Group and of the Bank for the financial year in which this report is made.
SIGNIFICANT AND SUBSEQUENT EVENTS
There were no significant events and events subsequent to the date of the statement of financial position
that require disclosure or adjustment to the audited financial statements, except as set out in Note 47 to the
financial statements.
SUBSIDIARIES
Details of subsidiaries are set out in Note 17 to the financial statements.
DIRECTORS’ REMUNERATION
Details of Directors’ remuneration are set out in Note 39(b) to the financial statements.
AUDITORS’ REMUNERATION
Details of auditors’ remuneration are set out in Note 36 to the financial statements.
19
HSBC BANK MALAYSIA BERHAD (Company No. 198401015221 (127776-V))
(Incorporated in Malaysia)
DIRECTORS’ REPORT (Cont’d)
Performance Review, Strategy and Outlook
Performance Review
The Group recorded profit before tax (PBT) of RM496.7 million for the financial year ended 31 December
2020, a decrease of RM806.6 million or 61.9% compared to the prior year. The lower PBT was mainly
contributed by higher impairment allowance/provisions by RM 339.0 million, lower operating income by
RM243.1 million and higher operating expenses by RM224.5 million.
Impairment allowance/ provisions increased as the impact of COVID-19 outbreak has been considered in
deriving the Expected Credit Loss (ECL) for loans and advances and other financial assets. Operating income
were impacted by lower net interest income as a result of reductions in Bank Negara Malaysia (BNM)’s
Overnight Policy Rate (OPR) by 125 basis points to 1.75% between January 2020 to December 2020 and
lower non-interest income from the generally weak market sentiment impacting business and consumer
spending activities. Operating expenses was higher during the year mainly due to property revaluation loss
on the Group’s new head office building, coupled with higher related company expenses in respect of mainly
IT and digital services.
Despite lower PBT, total balance sheet size as at 31 December 2020 has grown by 1.6% or RM1.4 billion
to RM86.3 billion (31 December 2019: RM85.0 billion). The Group's capital and liquidity ratios have also
remained strong and well above regulatory requirements.
Business Strategy during the Year 2020 2020 has been a year marked with unprecedented challenges, disruptions and uncertainties caused by the COVID-19 outbreak. Global and domestic economies were severely impacted as a result of the pandemic, affecting households and businesses. For 2020, Malaysia’s GDP contracted by 5.6% compared to an expansion of 4.3% in year 2019. This was primarily due to weaker private sector expenditure and subdued consumer and business sentiments as a result of COVID-19 impact. Five economic sectors that were identified as most affected by COVID-19, were (i) retail and wholesale trading; (ii) accommodation; (iii) travel agencies/ tourism; (iv) airline/ aviation; and (v) food and beverage services/ restaurants. As at 31 December 2020, the gross outstanding loans, advances and financing extended by the Group to these sectors were approximately RM3.5 billion or 6.85% of our total gross loan, advances and financing. During the year, the Government has implemented various relief actions and economic stimulus packages to support household income, safeguard jobs and to spur the economy. BNM also rolled-out measures to assist individuals, SMEs and corporates affected by COVID-19. Pursuant to its circular on 25 March 2020, banking institutions, including HSBC Malaysia, has offered an automatic deferment of loan, advances and financing repayment for six months to all individual and small-medium enterprise (SME) in order to help them cope with the financial adversity. The automatic moratorium was given to Ringgit-denominated loans, advances and financing that were not in arrears exceeding 90 days as at 1 April 2020. For outstanding credit card balances, customers have the option to convert the outstanding balances into financing and advances of not more than three years. After converting into financing and advances, these customers can seek to opt-in for moratorium. Post expiry of the 6-month moratorium programme on 30 September 2020, banks have continued to offer targeted extension moratorium and repayment flexibilities to selected customers who are significantly impacted from reduction in income and loss of employment due to COVID-19 pandemic. The eligible customers can request to either defer monthly instalments for three months or reduce monthly instalments for further six months. As at 31 December 2020, the gross outstanding loans, advances and financing extended by the Group to these individuals under the targeted relief assistance programme were approximately RM1.6 billion or 3.15% of our total gross loan, advances and financing.
20
HSBC BANK MALAYSIA BERHAD (Company No. 198401015221 (127776-V))
(Incorporated in Malaysia)
DIRECTORS’ REPORT (Cont’d)
Performance Review, Strategy and Outlook (Cont’d)
Business Strategy during the Year 2020 (Cont’d)
In addition, BNM also reduced the Overnight Policy Rate (OPR) by a cumulative 125 basis points to 1.75% during the year, and the Statutory Reserve Requirement (SRR) ratio by 100 basis points to 2.0% with allowance for Government securities to be recognised for SRR compliance. Despite the extraordinarily challenging environment, the Group and the Bank have made remarkable achievements including the launch of more than thirty new digital innovations, embarking on sustainability initiatives, having received more than twenty industry awards, and assisted our customers diligently to help them cross the hurdles in this difficult time. Our Wealth and Personal Banking (WPB) business has supported our customers during the COVID-19 crisis through payment holidays, non-compounding of interest or profit during payment holidays, and restructuring of financing. During the various phases of Movement Control Order (MCO) imposed by the Malaysian Government for COVID-19 containment, new digital capabilities were introduced for customers to perform banking from the comfort and safety of their home. The prominent ones, which were also the first of their kind in the Malaysia banking industry, were, i) Remote Engagement Service (RES) which enables customers to engage with HSBC remotely via Zoom without walking into branch; ii) Digital account opening journey with 24/7 self-service machine for identification and verification process; iii) Voice-ID Biometrics solution for telebanking which enables authentication using voice capabilities in place of password or PIN code; and iv) 24/7 Unit Trust Browser (UTB) platform with powerful funds research functions and detailed information on open-ended unit trusts that are offered by HSBC. Commercial Banking (CMB) has continued to support customers’ liquidity and working capital needs. To its business banking customers which are mainly comprising small and medium enterprises (SME), CMB has taken proactive efforts by offering repayment flexibility with extension of trade loans / financing payment period without additional fee or penalty rate. Government-guaranteed borrowing facilities were also made available to those who need access to financing. Various new products and services were rolled out, which include the enhanced functionality for Mobile Collections (Omni Channel and DuitNow QR), Treasury API, and NextGen Virtual Accounts. Our Global Banking & Markets (GBM) has focused on supporting customers across structured product solutions, including debt capital market, advisory and structured trade, coupled with sustainability-linked financing and innovative cash management solutions. GBM launched Sustainable Supply Chain Financing First Strategy and acted as the sole structuring and bank financing for Malaysia’s first Sustainability-Linked Financing (SLF) for a leading energy solution provider, which reinforces the bank’s commitment to supporting a low carbon economy. We have also continued to deliver our expertise in debt capital to secure key deals which yielded other ancillary income and opportunities. We are also on track to launch a new system for Equity Derivatives, which will allow the Group and the Bank to re-introduce equity linked quanto structured products to our retail customers. Our offshore FX capability were also enhanced though our affiliates’ network and expanded product offerings. In line with our aspiration to “build a bank fit for the future”, GBM worked alongside CMB to integrate their business operation functions, and performed joint initiatives on digital penetration including electronic signature solution, credit & lending robotics and electronic audit confirmations to improve customer experience. CMB also signed its first Memorandum of Understanding (MoU) with Malaysia Digital Economy Corporation (MDEC) to focus on enhancing the adoption of technology among companies in Malaysia. Separately, the HSBC Security Services (HSS) once again asserted its market leadership position as leading custodian and fund administrator by securing its position as No.1 Sub Custodian in Malaysia (12th consecutive year). HSS has also continued to offer new products and services through collaboration with product partners, financial institutions group, and customer segments to increase its market share.
21
HSBC BANK MALAYSIA BERHAD (Company No. 198401015221 (127776-V))
(Incorporated in Malaysia)
DIRECTORS’ REPORT (Cont’d)
Performance Review, Strategy and Outlook (Cont’d)
Business Strategy during the Year 2020 (Cont’d)
HSBC Malaysia’s strong liquidity and capital position against a backdrop of the continuing impacts of COVID-19 was well recognised by external parties including RAM Ratings Services Berhad, which in 2020 reaffirmed the Bank and its subsidiary, HSBC Amanah Malaysia Berhad (HBMS)’s long term and short term ratings of AAA and P1 ratings respectively. The Group and the Bank also continued to maintain its market leader position in various segments, evident by the numerous awards won in 2020 including the prestigious awards such as ‘Best International Bank in Malaysia’ by both Asiamoney Awards and The FinanceAsia Country Awards. Other notable recognitions are disclosed on page 24 to 25 under Directors’ Report of this financial statement. On the sustainability front, the Group via HBMS, has launched Project Cocoon in April 2020, in conjunction with the 50th anniversary of the World Earth Day, with a pledge to deliver sustainable banking at local level, as well as supporting HSBC Group’s sustainability strategy at global level. This is also in line with Bank Negara’s Value Based Intermediation (VBI). VBI aims to encourage banks to generate positive and sustainable impact to the economy, community and environment through practices, conduct and offerings consistent with shareholder’s sustainable returns and long term interests. HBMS also recently marked another milestone in Malaysia by becoming an official member of the United Nations Global Compact (UNGC) via UNGC’s local chapter, the Global Compact Malaysia (GCMY). This follows in the footsteps of the HSBC Group that has been an active member of UNGC since it was launched in 2000. HBMS is currently the only international bank in Malaysia that is a member of GCMY. During the year, HBMS has acted as lead arranger for the ASEAN Green Sustainable and Responsible Investment (SRI) Sukuk for a company focused on renewable power generation. We were also the sole sustainability structuring bank for Malaysia’s first Sustainability-Linked Financing (SLF) for a leading energy solutions provider. For all its sustainability focus journey, HBMS was recently awarded the ‘Islamic ESG (Environmental, Social and Governance) Bank of the Year’ from The Asset Triple A Islamic Finance Awards 2020 and ‘Islamic Finance House of the Year’ from FinanceAsia. Furthermore, the Group and the Bank have exceptionally accomplished the three main pillars of its corporate social responsibilities in 2020 including developing Future Skills, Sustainable Network & Entrepreneurship and Sustainable Finance. To help the communities address the challenges of COVID-19, we have donated RM1 million to MERCY Malaysia in support of its COVID-19 Strategic Preparedness and Response Plan through The Association of Banks Malaysia (ABM). We have participated in a number of other initiatives to support rural communities impacted by the MCO. We have also launched a ‘We Can We Do’ initiative to cultivate the Can-Do spirit amongst Malaysians by encouraging and facilitating financial empowerment for individuals, entrepreneurs, and business owners. Internally, a ‘Matching Fund’ has been launched to provide a channel for employees to give back to the at-risk communities impacted by COVID-19. Our people are our most important asset. This year, more than ever, our priority has been the safety, health and well-being of our people. To ensure we maintained essential banking services and met the surge in customer demand for assistance during COVID-19, we quickly adapted our branches to maintain physical distancing measures and keep our people and customers safe. We also quickly scaled our remote working technologies allowing our people to work from home. New and enhanced well-being support programmes were given to our employees including medical guidance, education on mental health awareness, employee counselling, training on how to lead remote teams, and advice on managing stress and working remotely. We will continue to support our employees and customers in these challenging times.
22

HSBC BANK MALAYSIA BERHAD (Company No. 198401015221 (127776-V))
(Incorporated in Malaysia)
DIRECTORS’ REPORT (Cont’d)
Performance Review, Strategy and Outlook (Cont’d)
Outlook for 2021 The outlook on the global economy remains uncertain, with the pace and strength of recovery being subject to the ability in controlling the COVID-19 pandemic and the effective rollout of vaccination plans. The World Bank has forecasted Malaysia’s economy to grow by 6.7% in 2021. The domestic economy activities are expected to improve gradually, underpinned by recovery in domestic demand and turnaround in both public and private sector expenditure with the support from various economic stimulus packages and relief measures rolled out by the Government. The expected commencement of COVID-19 vaccination programme by 1Q2021 is also expected to further uplift the local sentiments. The events of 2020 have not dampened the inclination of most Malaysian businesses to invest to grow. More businesses expect to see expansion in digital platforms and channels as an important driver of growth to target consumers, improve the customer experience and promote collaboration. HSBC Malaysia will continue to focus on enhancing customer experience, accelerating digital transformation and investing in employees to help develop new skills, in line with HSBC Group’s vision to “build a bank fit for the future” which will be key to our success. These are in addition to our commitment of maintaining a robust risk management culture and framework. The Group and the Bank will also continue to capture cross-border opportunities in the ASEAN and Belt and Road Initiative (BRI) corridors through HSBC Group’s international network and capabilities. Sustainability-linked propositions will also be one of our key focus in 2021, leveraging on HSBC Amanah’s sustainability and VBI initiatives. 2021 will also mark a landmark year for HSBC Malaysia as we transit our head office from Leboh Ampang to the new, LEED Gold Standard, head office building in TRX. We strive to provide the best and conducive banking environment for our customers as well as a modern and sustainable working environment for our employees. We remain committed to supporting our customers through these trying times, and will continue delivering products and services that meet customers’ ever-changing banking needs.
23
HSBC BANK MALAYSIA BERHAD (Company No. 198401015221 (127776-V))
(Incorporated in Malaysia)
DIRECTORS’ REPORT (Cont’d)
Awards won during the financial year:
HSBC Bank Malaysia Berhad
1. Best International Bank, Malaysia – FinanceAsia Country Awards 2020
2. Best International Bank in Malaysia – Asiamoney Awards 2020 (2nd consecutive year)
3. Best Service Provider, Cash Management (Malaysia) – The Asset Triple A Treasury, Trade, Supply Chain and Risk Management Awards 2020
4. Client Solutions Awards, Best Payments & Collections Solution category for KPJ Healthcare Bhd
– The Asset Triple A Treasury, Trade, Supply Chain and Risk Management Awards 2020
5. Client Solutions Awards, Best Liquidity and Investments Solution category – The Asset Triple A
Treasury, Trade, Supply Chain and Risk Management Awards 2020
6. Best Renminbi Bank – The Asset Triple A Treasury, Trade, Supply Chain and Risk Management
Awards 2020 (3rd consecutive year)
7. Petrochemical Deal of the Year (Malaysia) – The Asset Infrastructure Awards 2020
8. Petrochemical Deal of the Year (Regional) – The Asset Infrastructure Awards 2020
9. Information Management (Banking) – Malaysia Technology Excellence Awards 2020
10. Online services (Banking) – Malaysia Technology Excellence Awards 2020
11. No 1 Sub-Custodian in Malaysia 2020 (Unweighted Category) – Global Investor / ISF Sub Custody
Survey 2020 (12th consecutive year)
12. Best Frictionless Customer Relationship Management – Global Retail Banking Innovation Awards
2020, The Digital Banker
13. Best Bank (Global) – The Asset Country Awards (3rd consecutive year)
14. Best Bond Adviser (Global) – The Asset Country Awards (14th consecutive year)
15. Best Corporate Bond, PETRONAS US$6 billion triple-tranche bond - The Asset Country Awards
16. Best Bank Capital Bond, United Overseas Bank (Malaysia) 750 million ringgit tier 2 subordinated
notes – The Asset Country Awards
17. Best Syndicated Loan, Yinson Boronia Production US$400 million syndicated bridge loan facility
– The Asset Country Awards
18. Best Foreign Currency Bond Deal of the Year 2020 – Alpha Southeast Asia
19. Best Domestic Cash Manager in Malaysia as voted by Corporates – Euromoney Cash Management
Survey 2020 – Market Leader (4th consecutive year)
20. COVID-19 Response Award 2020 for KPJ Healthcare Berhad – Treasury Management International
(TMI) Innovation and Excellence Awards and Treasury4Good Awards
24

HSBC BANK MALAYSIA BERHAD (Company No. 198401015221 (127776-V))
(Incorporated in Malaysia)
DIRECTORS’ REPORT (Cont’d)
Awards won during the financial year (Cont’d):
HSBC Amanah Malaysia Berhad
1. Islamic ESG Bank of the Year – The Asset Triple A Islamic Finance Awards 2020
2. Best Islamic Trade Finance Bank – The Asset Triple A Islamic Finance Awards 2020 (3rd consecutive
year)
3. Best Quasi-Sovereign Sukuk – The Asset Triple A Islamic Finance Awards 2020
4. Best New Sukuk – The Asset Triple A Islamic Finance Awards 2020
5. Best Structured Financing – The Asset Triple A Islamic Finance Awards 2020
6. Best Trade Finance Product – The Asset Triple A Islamic Finance Awards 2020
7. Islamic Finance House of the Year – FinanceAsia Achievement Awards 2020
8. Best Islamic Syndicated Financing Deal of the Year 2020 – Alpha Southeast Asia
25
HSBC BANK MALAYSIA BERHAD (Company No. 198401015221 (127776-V))
(Incorporated in Malaysia)
DIRECTORS’ REPORT (Cont’d)
AUDITORS
The auditors, PricewaterhouseCoopers PLT (LLP0014401-LCA & AF 1146), have expressed their
willingness to accept re-appointment as auditors. A resolution to re-appoint PricewaterhouseCoopers PLT
as auditor of the Group and the Bank will be proposed at the forthcoming Annual General Meeting.
This report was approved by the Board of Directors on 5 February 2021.
Signed on behalf of the Board of Directors in accordance with a resolution of the Directors:
…………………….……………….…..…. …………………….……………….…..….
STUART PATERSON MILNE LEE CHOO HOCK
Director Director
Kuala Lumpur, Malaysia
5 February 2021
26
HSBC BANK MALAYSIA BERHAD (Company No. 198401015221 (127776-V))
(Incorporated in Malaysia)
STATEMENT BY DIRECTORS PURSUANT TO SECTION 251(2) OF THE COMPANIES ACT 2016
We, Stuart Paterson Milne and Lee Choo Hock, two of the Directors of HSBC Bank Malaysia Berhad, do
hereby state that, in the opinion of the Directors, the accompanying financial statements set out on pages 33
to 185 are drawn up so as to give a true and fair view of the financial position of the Group and of the Bank
as at 31 December 2020 and financial performance of the Group and of the Bank for the financial year ended
31 December 2020 in accordance with the Malaysian Financial Reporting Standards, International Financial
Reporting Standards and the requirements of the Companies Act 2016 in Malaysia.
Signed on behalf of the Board of Directors in accordance with a resolution of the Directors dated 5 February
2021.
…………………….……………….…..…. …………………….……………….…..….
STUART PATERSON MILNE LEE CHOO HOCK
Director Director
Kuala Lumpur, Malaysia
5 February 2021
27

HSBC BANK MALAYSIA BERHAD (Company No. 198401015221 (127776-V))
(Incorporated in Malaysia)
STATUTORY DECLARATION PURSUANT TO SECTION 251(1) OF THE COMPANIES ACT 2016
I, Sun Wenyun, being the officer primarily responsible for the financial management of HSBC Bank Malaysia
Berhad, do solemnly and sincerely declare that, to the best of my knowledge and belief, the financial
statements set out on pages 33 to 185 are correct, and I make this solemn declaration conscientiously
believing the same to be true, and by virtue of the provisions of the Statutory Declarations Act 1960.
Subscribed and solemnly declared by the abovenamed.
at Kuala Lumpur, Malaysia on 5 February 2021.
....................................................................
SUN WENYUN
BEFORE ME:
…………………………………………….
Signature of Commissioner for Oaths
28
INDEPENDENT AUDITORS’ REPORT
TO THE MEMBERS OF HSBC BANK MALAYSIA BERHAD
(Incorporated in Malaysia)
(Company No. 198401015221 (127776-V)) REPORT ON THE AUDIT OF THE FINANCIAL STATEMENTS Our opinion
In our opinion, the financial statements of HSBC Bank Malaysia Berhad (“the Bank”) and its subsidiaries (“the Group”) give a true and fair view of the financial position of the Group and of the Bank as at 31 December 2020, and of their financial performance and their cash flows for the financial year then ended in accordance with Malaysian Financial Reporting Standards, International Financial Reporting Standards and the requirements of the Companies Act 2016 in Malaysia.
What we have audited
We have audited the financial statements of the Group and of the Bank, which comprise the statements of financial position as at 31 December 2020 of the Group and of the Bank, and the statements of profit or loss, the statements of comprehensive income, statements of changes in equity and statements of cash flows of the Group and of the Bank for the financial year then ended, and notes to the financial statements, including a summary of significant accounting policies, as set out on pages 33 to 185.
Basis for opinion
We conducted our audit in accordance with approved standards on auditing in Malaysia and International Standards on Auditing. Our responsibilities under those standards are further described in the “Auditors’ responsibilities for the audit of the financial statements” section of our report.
We believe that the audit evidence we have obtained is sufficient and appropriate to provide a basis for our opinion.
Independence and other ethical responsibilities
We are independent of the Group and of the Bank in accordance with the By-Laws (on Professional Ethics, Conduct and Practice) of the Malaysian Institute of Accountants (“By-Laws”) and the International Ethics Standards Board for Accountants’ International Code of Ethics for Professional Accountants (including International Independence Standards) (“IESBA Code”), and we have fulfilled our other ethical responsibilities in accordance with the By-Laws and the IESBA Code.
29
INDEPENDENT AUDITORS’ REPORT
TO THE MEMBERS OF HSBC BANK MALAYSIA BERHAD
(Incorporated in Malaysia)
(Company No. 198401015221 (127776-V)) REPORT ON THE AUDIT OF THE FINANCIAL STATEMENTS (CONT’D) Information other than the financial statements and auditors’ report thereon
The Directors of the Bank are responsible for the other information. The other information comprises the list of Board of Directors, Corporate Governance Disclosures, Rating by External Rating Agencies and Directors' Report, but does not include the financial statements of the Group and of the Bank and our auditors’ report thereon.
Our opinion on the financial statements of the Group and of the Bank does not cover the other information and we do not express any form of assurance conclusion thereon.
In connection with our audit of the financial statements of the Group and of the Bank, our responsibility is to read the other information and, in doing so, consider whether the other information is materially inconsistent with the financial statements of the Group and of the Bank or our knowledge obtained in the audit or otherwise appears to be materially misstated.
If, based on the work we have performed, we conclude that there is a material misstatement of this other information, we are required to report that fact. We have nothing to report in this regard.
Responsibilities of the Directors for the financial statements
The Directors of the Bank are responsible for the preparation of the financial statements of the Group and of the Bank that give a true and fair view in accordance with Malaysian Financial Reporting Standards, International Financial Reporting Standards and the requirements of the Companies Act 2016 in Malaysia. The Directors are also responsible for such internal control as the Directors determine is necessary to enable the preparation of financial statements of the Group and of the Bank that are free from material misstatement, whether due to fraud or error.
In preparing the financial statements of the Group and of the Bank, the Directors are responsible for assessing the Group’s and the Bank’s ability to continue as a going concern, disclosing, as applicable, matters related to going concern and using the going concern basis of accounting unless the Directors either intend to liquidate the Group or the Bank or to cease operations, or have no realistic alternative but to do so.
Auditors’ responsibilities for the audit of the financial statements
Our objectives are to obtain reasonable assurance about whether the financial statements of the Group and of the Bank as a whole are free from material misstatement, whether due to fraud or error, and to issue an auditors’ report that includes our opinion. Reasonable assurance is a high level of assurance, but is not a guarantee that an audit conducted in accordance with approved standards on auditing in Malaysia and International Standards on Auditing will always detect a material misstatement when it exists. Misstatements can arise from fraud or error and are considered material if, individually or in the aggregate, they could reasonably be expected to influence the economic decisions of users taken on the basis of these financial statements.
30
INDEPENDENT AUDITORS’ REPORT
TO THE MEMBERS OF HSBC BANK MALAYSIA BERHAD
(Incorporated in Malaysia)
(Company No. 198401015221 (127776-V)) REPORT ON THE AUDIT OF THE FINANCIAL STATEMENTS (CONT’D) Auditors’ responsibilities for the audit of the financial statements (continued)
As part of an audit in accordance with approved standards on auditing in Malaysia and International Standards on Auditing, we exercise professional judgement and maintain professional scepticism throughout the audit. We also:
(a) Identify and assess the risks of material misstatement of the financial statements of the Group and of the Bank, whether due to fraud or error, design and perform audit procedures responsive to those risks, and obtain audit evidence that is sufficient and appropriate to provide a basis for our opinion. The risk of not detecting a material misstatement resulting from fraud is higher than for one resulting from error, as fraud may involve collusion, forgery, intentional omissions, misrepresentations, or the override of internal control.
(b) Obtain an understanding of internal control relevant to the audit in order to design audit procedures that are appropriate in the circumstances, but not for the purpose of expressing an opinion on the effectiveness of the Group’s and of the Bank’s internal control.
(c) Evaluate the appropriateness of accounting policies used and the reasonableness of accounting estimates and related disclosures made by the Directors.
(d) Conclude on the appropriateness of the Directors’ use of the going concern basis of accounting and, based on the audit evidence obtained, whether a material uncertainty exists related to events or conditions that may cast significant doubt on the Group’s or on the Bank’s ability to continue as a going concern. If we conclude that a material uncertainty exists, we are required to draw attention in our auditors’ report to the related disclosures in the financial statements of the Group and of the Bank or, if such disclosures are inadequate, to modify our opinion. Our conclusions are based on the audit evidence obtained up to the date of our auditors’ report. However, future events or conditions may cause the Group or the Bank to cease to continue as a going concern.
(e) Evaluate the overall presentation, structure and content of the financial statements of the Group and of the Bank, including the disclosures, and whether the financial statements of the Group and of the Bank represent the underlying transactions and events in a manner that achieves fair presentation.
(f) Obtain sufficient appropriate audit evidence regarding the financial information of the entities or business activities within the Group to express an opinion on the financial statements of the Group. We are responsible for the direction, supervision and performance of the group audit. We remain solely responsible for our audit opinion.
We communicate with the Directors regarding, among other matters, the planned scope and timing of the audit and significant audit findings, including any significant deficiencies in internal control that we identify during our audit.
31
INDEPENDENT AUDITORS’ REPORT
TO THE MEMBERS OF HSBC BANK MALAYSIA BERHAD
(Incorporated in Malaysia)
(Company No. 198401015221 (127776-V)) OTHER MATTERS This report is made solely to the member of the Bank, as a body, in accordance with Section 266 of the Companies Act 2016 in Malaysia and for no other purpose. We do not assume responsibility to any other person for the content of this report.
PRICEWATERHOUSECOOPERS PLT WILLIAM MAH JIN CHIEK LLP0014401-LCA & AF 1146 03085/07/2021 J Chartered Accountants Chartered Accountant
Kuala Lumpur 18 February 2021
32
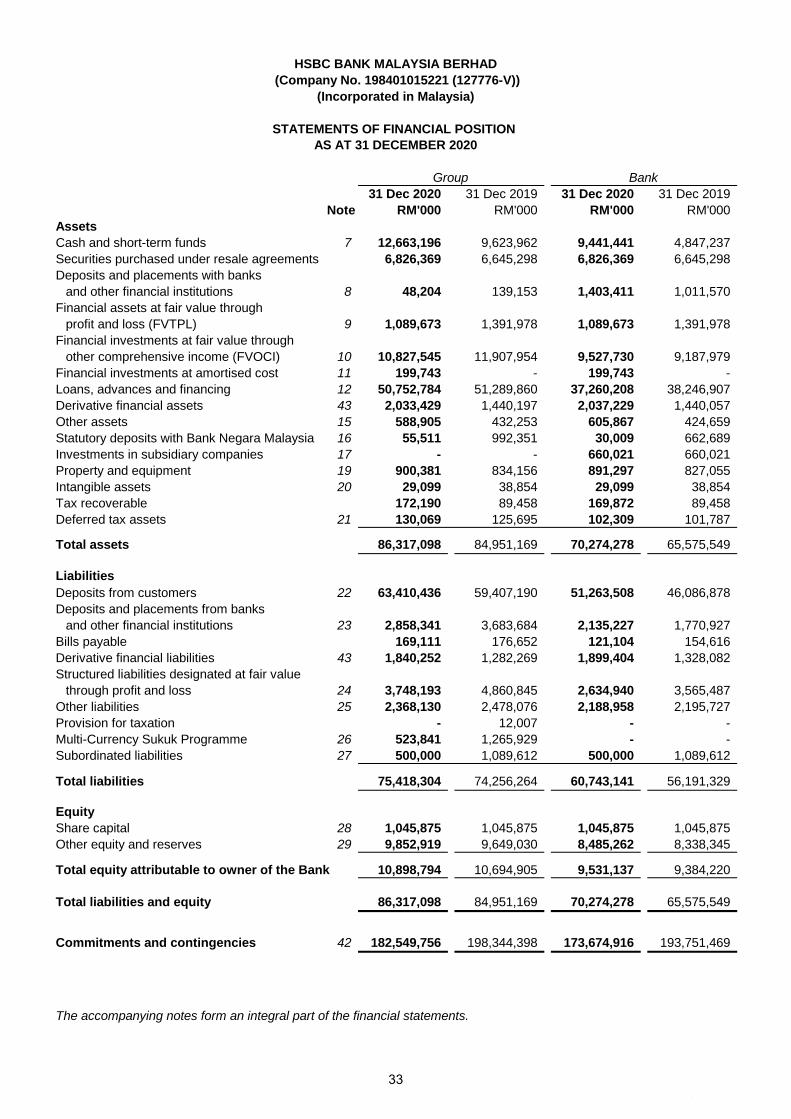
31 Dec 2020 31 Dec 2019 31 Dec 2020 31 Dec 2019
Note RM'000 RM'000 RM'000 RM'000
Assets
Cash and short-term funds 7 12,663,196 9,623,962 9,441,441 4,847,237
Securities purchased under resale agreements 6,826,369 6,645,298 6,826,369 6,645,298
Deposits and placements with banks
and other financial institutions 8 48,204 139,153 1,403,411 1,011,570
Financial assets at fair value through
profit and loss (FVTPL) 9 1,089,673 1,391,978 1,089,673 1,391,978
Financial investments at fair value through
other comprehensive income (FVOCI) 10 10,827,545 11,907,954 9,527,730 9,187,979
Financial investments at amortised cost 11 199,743 - 199,743 -
Loans, advances and financing 12 50,752,784 51,289,860 37,260,208 38,246,907
Derivative financial assets 43 2,033,429 1,440,197 2,037,229 1,440,057
Other assets 15 588,905 432,253 605,867 424,659
Statutory deposits with Bank Negara Malaysia 16 55,511 992,351 30,009 662,689
Investments in subsidiary companies 17 - - 660,021 660,021
Property and equipment 19 900,381 834,156 891,297 827,055
Intangible assets 20 29,099 38,854 29,099 38,854
Tax recoverable 172,190 89,458 169,872 89,458
Deferred tax assets 21 130,069 125,695 102,309 101,787
Total assets 86,317,098 84,951,169 70,274,278 65,575,549
Liabilities
Deposits from customers 22 63,410,436 59,407,190 51,263,508 46,086,878
Deposits and placements from banks
and other financial institutions 23 2,858,341 3,683,684 2,135,227 1,770,927
Bills payable 169,111 176,652 121,104 154,616
Derivative financial liabilities 43 1,840,252 1,282,269 1,899,404 1,328,082
Structured liabilities designated at fair value
through profit and loss 24 3,748,193 4,860,845 2,634,940 3,565,487
Other liabilities 25 2,368,130 2,478,076 2,188,958 2,195,727
Provision for taxation - 12,007 - -
Multi-Currency Sukuk Programme 26 523,841 1,265,929 - -
Subordinated liabilities 27 500,000 1,089,612 500,000 1,089,612
Total liabilities 75,418,304 74,256,264 60,743,141 56,191,329
Equity
Share capital 28 1,045,875 1,045,875 1,045,875 1,045,875
Other equity and reserves 29 9,852,919 9,649,030 8,485,262 8,338,345
Total equity attributable to owner of the Bank 10,898,794 10,694,905 9,531,137 9,384,220
Total liabilities and equity 86,317,098 84,951,169 70,274,278 65,575,549
Commitments and contingencies 42 182,549,756 198,344,398 173,674,916 193,751,469
The accompanying notes form an integral part of the financial statements.
Group Bank
HSBC BANK MALAYSIA BERHAD
(Company No. 198401015221 (127776-V))
(Incorporated in Malaysia)
STATEMENTS OF FINANCIAL POSITION
AS AT 31 DECEMBER 2020
#
33
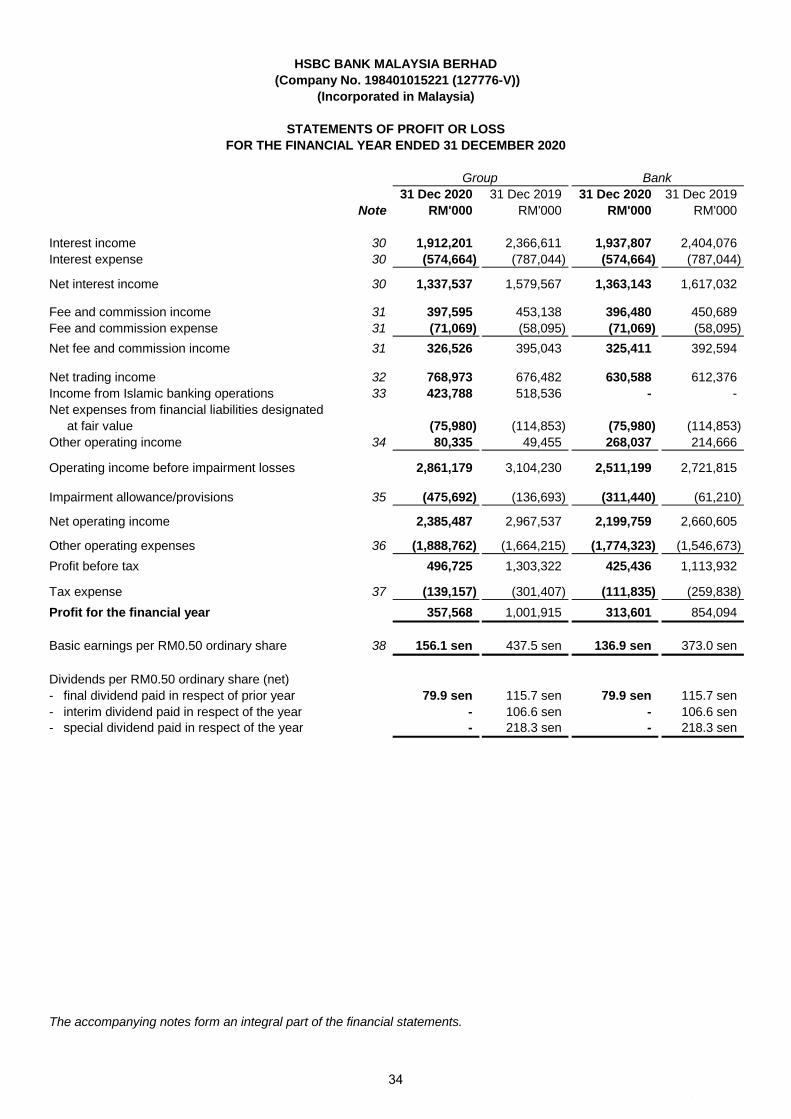
31 Dec 2020 31 Dec 2019 31 Dec 2020 31 Dec 2019
Note RM'000 RM'000 RM'000 RM'000
Interest income 30 1,912,201 2,366,611 1,937,807 2,404,076
Interest expense 30 (574,664) (787,044) (574,664) (787,044)
Net interest income 30 1,337,537 1,579,567 1,363,143 1,617,032
Fee and commission income 31 397,595 453,138 396,480 450,689
Fee and commission expense 31 (71,069) (58,095) (71,069) (58,095)
Net fee and commission income 31 326,526 395,043 325,411 392,594
Net trading income 32 768,973 676,482 630,588 612,376
Income from Islamic banking operations 33 423,788 518,536 - -
Net expenses from financial liabilities designated
at fair value (75,980) (114,853) (75,980) (114,853)
Other operating income 34 80,335 49,455 268,037 214,666
Operating income before impairment losses 2,861,179 3,104,230 2,511,199 2,721,815
Impairment allowance/provisions 35 (475,692) (136,693) (311,440) (61,210)
Net operating income 2,385,487 2,967,537 2,199,759 2,660,605
Other operating expenses 36 (1,888,762) (1,664,215) (1,774,323) (1,546,673)
Profit before tax 496,725 1,303,322 425,436 1,113,932
Tax expense 37 (139,157) (301,407) (111,835) (259,838)
Profit for the financial year 357,568 1,001,915 313,601 854,094
Basic earnings per RM0.50 ordinary share 38 156.1 sen 437.5 sen 136.9 sen 373.0 sen
Dividends per RM0.50 ordinary share (net)
- final dividend paid in respect of prior year 79.9 sen 115.7 sen 79.9 sen 115.7 sen
- interim dividend paid in respect of the year - 106.6 sen - 106.6 sen
- special dividend paid in respect of the year - 218.3 sen - 218.3 sen
Group Bank
HSBC BANK MALAYSIA BERHAD
(Company No. 198401015221 (127776-V))
(Incorporated in Malaysia)
STATEMENTS OF PROFIT OR LOSS
FOR THE FINANCIAL YEAR ENDED 31 DECEMBER 2020
The accompanying notes form an integral part of the financial statements.
#
34
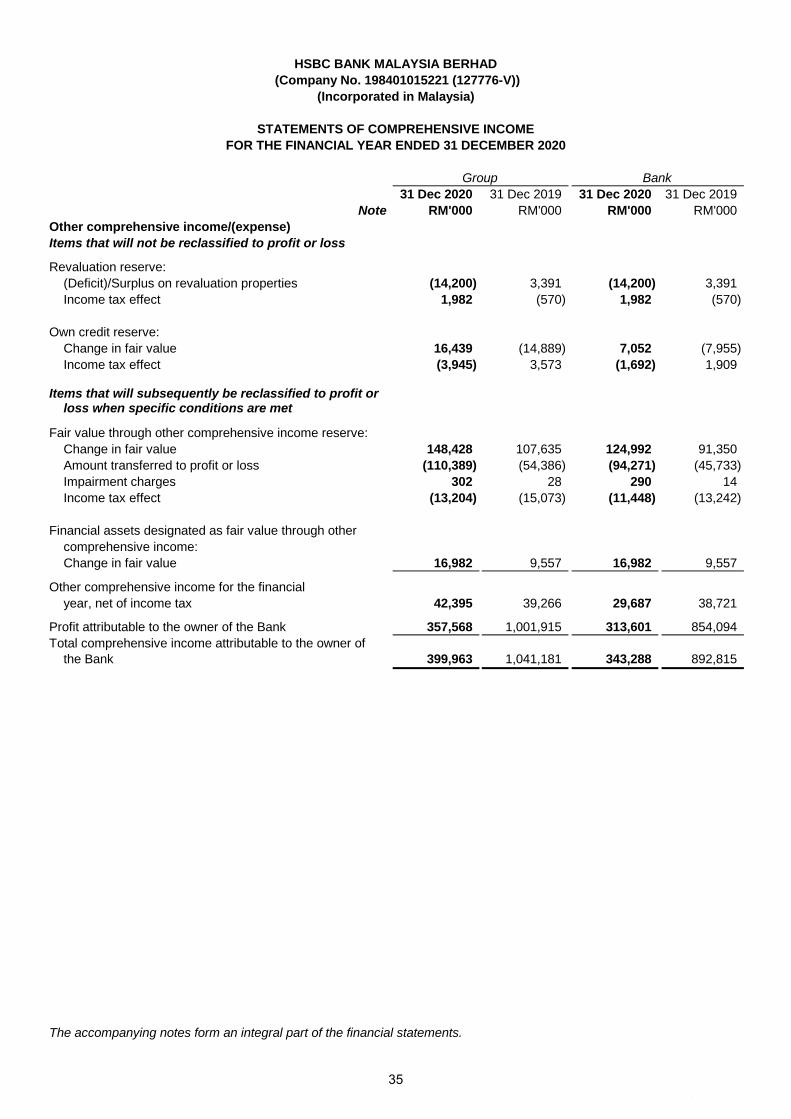
31 Dec 2020 31 Dec 2019 31 Dec 2020 31 Dec 2019
Note RM'000 RM'000 RM'000 RM'000
Other comprehensive income/(expense)
Items that will not be reclassified to profit or loss
Revaluation reserve:
(Deficit)/Surplus on revaluation properties (14,200) 3,391 (14,200) 3,391
Income tax effect 1,982 (570) 1,982 (570)
Own credit reserve:
Change in fair value 16,439 (14,889) 7,052 (7,955)
Income tax effect (3,945) 3,573 (1,692) 1,909
Items that will subsequently be reclassified to profit orloss when specific conditions are met
Fair value through other comprehensive income reserve:
Change in fair value 148,428 107,635 124,992 91,350
Amount transferred to profit or loss (110,389) (54,386) (94,271) (45,733)
Impairment charges 302 28 290 14
Income tax effect (13,204) (15,073) (11,448) (13,242)
Financial assets designated as fair value through other
comprehensive income:
Change in fair value 16,982 9,557 16,982 9,557
Other comprehensive income for the financial
year, net of income tax 42,395 39,266 29,687 38,721
Profit attributable to the owner of the Bank 357,568 1,001,915 313,601 854,094
Total comprehensive income attributable to the owner of
the Bank 399,963 1,041,181 343,288 892,815
HSBC BANK MALAYSIA BERHAD
(Company No. 198401015221 (127776-V))
(Incorporated in Malaysia)
STATEMENTS OF COMPREHENSIVE INCOME
FOR THE FINANCIAL YEAR ENDED 31 DECEMBER 2020
Group Bank
The accompanying notes form an integral part of the financial statements.
#
35

Distributable
Group (RM'000) Own Capital
Share Other equity Revaluation FVOCI credit contribution Regulatory Retained Total
capital instrument reserve reserve reserve reserve reserve profits equity
2020
Balance at 1 January 1,045,875 500,000 205,363 173,673 (18,179) 100,010 486,200 8,201,963 10,694,905
Profit for the financial year - - - - - - - 357,568 357,568
Other comprehensive income, net of income tax
Revaluation reserve:
Transfer to retained profits upon realisation of depreciation - - (2,394) - - - - 2,394 -
Deficit on revaluation of properties - - (14,200) - - - - - (14,200)
Deferred tax adjustment on revaluation reserve - - 1,982 - - - - - 1,982
FVOCI reserve/Own credit reserve
Net change in fair value - - - 125,713 12,494 - - - 138,207
Net amount transferred to profit or loss - - - (83,896) - - - - (83,896)
Impairment charges - - - 302 - - - - 302
Total other comprehensive income - - (14,612) 42,119 12,494 - - 2,394 42,395
Total comprehensive income for the financial year - - (14,612) 42,119 12,494 - - 359,962 399,963
Net change in regulatory reserves - - - - - - (188,100) 188,100 -
Transactions with the owner, recorded directly in equity
Share based payment transactions - - - - - 3,780 - 1,720 5,500
Dividends paid to owner - 2019 final - - - - - - - (183,000) (183,000)
Discretionary coupon on other equity instrument issued - - - - - - - (18,574) (18,574)
Balance at 31 December 1,045,875 500,000 190,751 215,792 (5,685) 103,790 298,100 8,550,171 10,898,794
The accompanying notes form an integral part of the financial statements.
HSBC BANK MALAYSIA BERHAD
(Company No. 198401015221 (127776-V))
(Incorporated in Malaysia)
STATEMENTS OF CHANGES IN EQUITY FOR THE FINANCIAL YEAR ENDED 31 DECEMBER 2020
Non-distributable
#
36
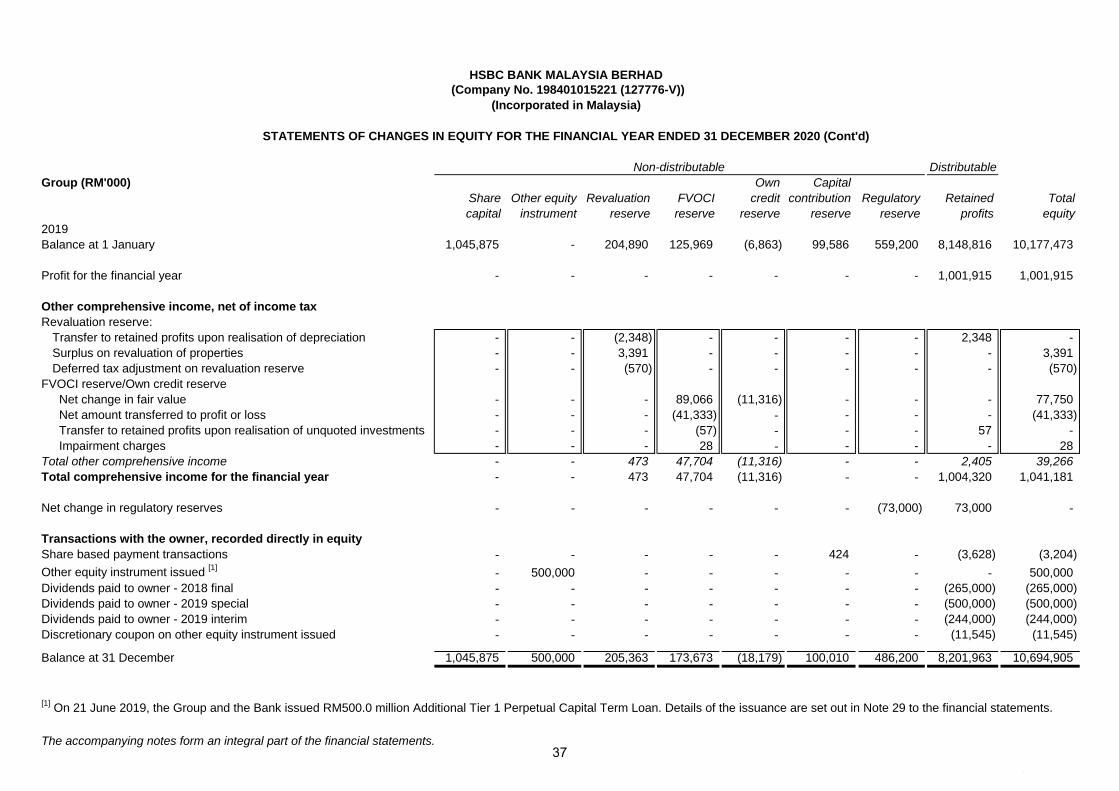
Distributable
Group (RM'000) Own Capital
Share Other equity Revaluation FVOCI credit contribution Regulatory Retained Total
capital instrument reserve reserve reserve reserve reserve profits equity
2019
Balance at 1 January 1,045,875 - 204,890 125,969 (6,863) 99,586 559,200 8,148,816 10,177,473
Profit for the financial year - - - - - - - 1,001,915 1,001,915
Other comprehensive income, net of income tax
Revaluation reserve:
Transfer to retained profits upon realisation of depreciation - - (2,348) - - - - 2,348 -
Surplus on revaluation of properties - - 3,391 - - - - - 3,391
Deferred tax adjustment on revaluation reserve - - (570) - - - - - (570)
FVOCI reserve/Own credit reserve
Net change in fair value - - - 89,066 (11,316) - - - 77,750
Net amount transferred to profit or loss - - - (41,333) - - - - (41,333)
Transfer to retained profits upon realisation of unquoted investments - - - (57) - - - 57 -
Impairment charges - - - 28 - - - - 28
Total other comprehensive income - - 473 47,704 (11,316) - - 2,405 39,266
Total comprehensive income for the financial year - - 473 47,704 (11,316) - - 1,004,320 1,041,181
Net change in regulatory reserves - - - - - - (73,000) 73,000 -
Transactions with the owner, recorded directly in equity
Share based payment transactions - - - - - 424 - (3,628) (3,204)
Other equity instrument issued [1]
- 500,000 - - - - - - 500,000
Dividends paid to owner - 2018 final - - - - - - - (265,000) (265,000)
Dividends paid to owner - 2019 special - - - - - - - (500,000) (500,000)
Dividends paid to owner - 2019 interim - - - - - - - (244,000) (244,000)
Discretionary coupon on other equity instrument issued - - - - - - - (11,545) (11,545)
Balance at 31 December 1,045,875 500,000 205,363 173,673 (18,179) 100,010 486,200 8,201,963 10,694,905
The accompanying notes form an integral part of the financial statements.
Non-distributable
STATEMENTS OF CHANGES IN EQUITY FOR THE FINANCIAL YEAR ENDED 31 DECEMBER 2020 (Cont'd)
HSBC BANK MALAYSIA BERHAD
(Company No. 198401015221 (127776-V))
(Incorporated in Malaysia)
[1] On 21 June 2019, the Group and the Bank issued RM500.0 million Additional Tier 1 Perpetual Capital Term Loan. Details of the issuance are set out in Note 29 to the financial statements.
#
37
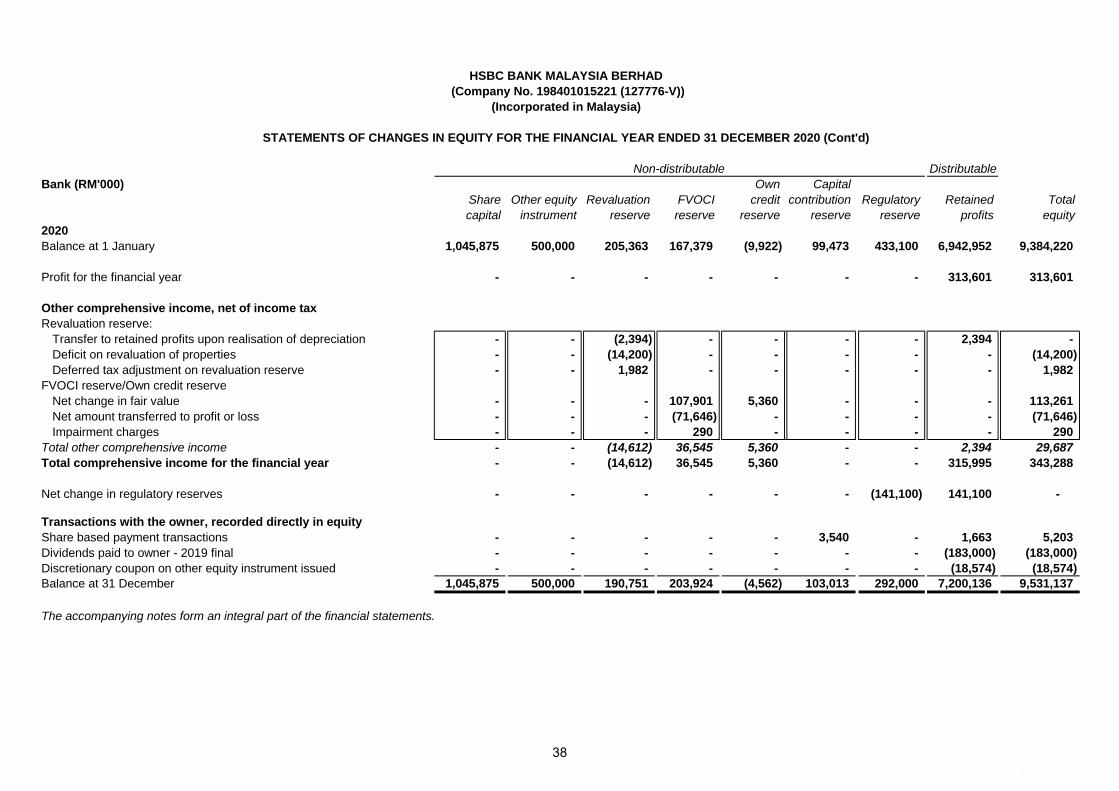
Distributable
Bank (RM'000) Own Capital
Share Other equity Revaluation FVOCI credit contribution Regulatory Retained Total
capital instrument reserve reserve reserve reserve reserve profits equity
2020
Balance at 1 January 1,045,875 500,000 205,363 167,379 (9,922) 99,473 433,100 6,942,952 9,384,220
Profit for the financial year - - - - - - - 313,601 313,601
Other comprehensive income, net of income tax
Revaluation reserve:
Transfer to retained profits upon realisation of depreciation - - (2,394) - - - - 2,394 -
Deficit on revaluation of properties - - (14,200) - - - - - (14,200)
Deferred tax adjustment on revaluation reserve - - 1,982 - - - - - 1,982
FVOCI reserve/Own credit reserve
Net change in fair value - - - 107,901 5,360 - - - 113,261
Net amount transferred to profit or loss - - - (71,646) - - - - (71,646)
Impairment charges - - - 290 - - - - 290
Total other comprehensive income - - (14,612) 36,545 5,360 - - 2,394 29,687
Total comprehensive income for the financial year - - (14,612) 36,545 5,360 - - 315,995 343,288
Net change in regulatory reserves - - - - - - (141,100) 141,100 -
Transactions with the owner, recorded directly in equity
Share based payment transactions - - - - - 3,540 - 1,663 5,203
Dividends paid to owner - 2019 final - - - - - - - (183,000) (183,000)
Discretionary coupon on other equity instrument issued - - - - - - - (18,574) (18,574)
Balance at 31 December 1,045,875 500,000 190,751 203,924 (4,562) 103,013 292,000 7,200,136 9,531,137
The accompanying notes form an integral part of the financial statements.
(Incorporated in Malaysia)
HSBC BANK MALAYSIA BERHAD
(Company No. 198401015221 (127776-V))
STATEMENTS OF CHANGES IN EQUITY FOR THE FINANCIAL YEAR ENDED 31 DECEMBER 2020 (Cont'd)
Non-distributable
#
38

Distributable
Bank (RM'000) Own Capital
Share Other equity Revaluation FVOCI credit contribution Regulatory Retained Total
capital instrument reserve reserve reserve reserve reserve profits equity
2019
Balance at 1 January 1,045,875 - 204,890 125,490 (3,876) 99,087 468,100 7,075,642 9,015,208
Profit for the financial year - - - - - - - 854,094 854,094
Other comprehensive income, net of income tax
Revaluation reserve:
Transfer to retained profits upon realisation of depreciation - - (2,348) - - - - 2,348 -
Surplus on revaluation of properties - - 3,391 - - - - - 3,391
Deferred tax adjustment on revaluation reserve - - (570) - - - - - (570)
FVOCI reserve/Own credit reserve
Net change in fair value - - - 76,689 (6,046) - - - 70,643
Net amount transferred to profit or loss - - - (34,757) - - - - (34,757)
Transfer to retained profits upon realisation of unquoted investments - - - (57) - - - 57 -
Impairment charges - - - 14 - - - - 14
Total other comprehensive income - - 473 41,889 (6,046) - - 2,405 38,721
Total comprehensive income for the financial year - - 473 41,889 (6,046) - - 856,499 892,815
Net change in regulatory reserves - - - - - - (35,000) 35,000 -
Transactions with the owner, recorded directly in equity
Share based payment transactions - - - - - 386 - (3,644) (3,258)
Other equity instrument issued [1]
500,000 - - - 500,000
Dividends paid to owner - 2018 final - - - - - - - (265,000) (265,000)
Dividends paid to owner - 2019 special - - - - - - - (500,000) (500,000)
Dividends paid to owner - 2019 interim - - - - - - - (244,000) (244,000)
Discretionary coupon on other equity instrument issued - - - - - - - (11,545) (11,545)
Balance at 31 December 1,045,875 500,000 205,363 167,379 (9,922) 99,473 433,100 6,942,952 9,384,220
The accompanying notes form an integral part of the financial statements.
[1] On 21 June 2019, the Group and the Bank issued RM500.0 million Additional Tier 1 Perpetual Capital Term Loan. Details of the issuance are set out in Note 29 to the financial statements.
HSBC BANK MALAYSIA BERHAD
(Company No. 198401015221 (127776-V))
(Incorporated in Malaysia)
STATEMENTS OF CHANGES IN EQUITY FOR THE FINANCIAL YEAR ENDED 31 DECEMBER 2020 (Cont'd)
Non-distributable
#
39
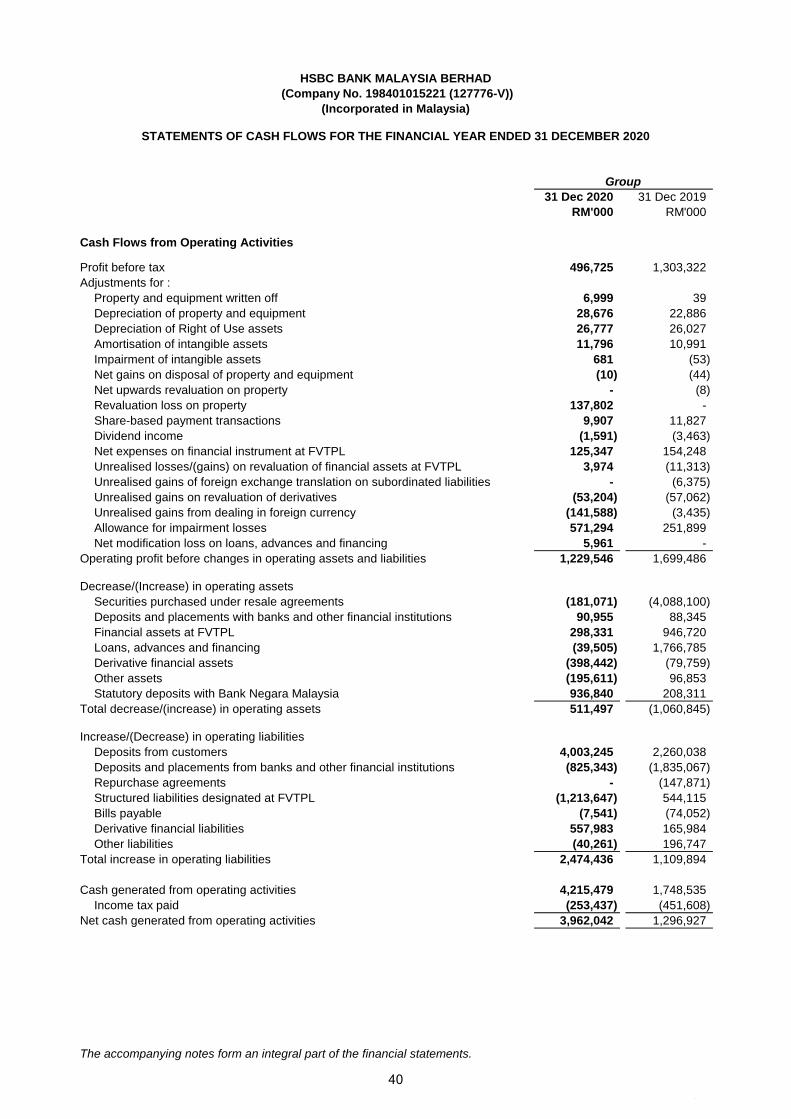
31 Dec 2020 31 Dec 2019
RM'000 RM'000
Cash Flows from Operating Activities
Profit before tax 496,725 1,303,322
Adjustments for :
Property and equipment written off 6,999 39
Depreciation of property and equipment 28,676 22,886
Depreciation of Right of Use assets 26,777 26,027
Amortisation of intangible assets 11,796 10,991
Impairment of intangible assets 681 (53)
Net gains on disposal of property and equipment (10) (44)
Net upwards revaluation on property - (8)
Revaluation loss on property 137,802 -
Share-based payment transactions 9,907 11,827
Dividend income (1,591) (3,463)
Net expenses on financial instrument at FVTPL 125,347 154,248
Unrealised losses/(gains) on revaluation of financial assets at FVTPL 3,974 (11,313)
Unrealised gains of foreign exchange translation on subordinated liabilities - (6,375)
Unrealised gains on revaluation of derivatives (53,204) (57,062)
Unrealised gains from dealing in foreign currency (141,588) (3,435)
Allowance for impairment losses 571,294 251,899
Net modification loss on loans, advances and financing 5,961 -
Operating profit before changes in operating assets and liabilities 1,229,546 1,699,486
Decrease/(Increase) in operating assets
Securities purchased under resale agreements (181,071) (4,088,100)
Deposits and placements with banks and other financial institutions 90,955 88,345
Financial assets at FVTPL 298,331 946,720
Loans, advances and financing (39,505) 1,766,785
Derivative financial assets (398,442) (79,759)
Other assets (195,611) 96,853
Statutory deposits with Bank Negara Malaysia 936,840 208,311
Total decrease/(increase) in operating assets 511,497 (1,060,845)
Increase/(Decrease) in operating liabilities
Deposits from customers 4,003,245 2,260,038
Deposits and placements from banks and other financial institutions (825,343) (1,835,067)
Repurchase agreements - (147,871)
Structured liabilities designated at FVTPL (1,213,647) 544,115
Bills payable (7,541) (74,052)
Derivative financial liabilities 557,983 165,984
Other liabilities (40,261) 196,747
Total increase in operating liabilities 2,474,436 1,109,894
Cash generated from operating activities 4,215,479 1,748,535
Income tax paid (253,437) (451,608)
Net cash generated from operating activities 3,962,042 1,296,927
The accompanying notes form an integral part of the financial statements.
Group
HSBC BANK MALAYSIA BERHAD
(Company No. 198401015221 (127776-V))
(Incorporated in Malaysia)
STATEMENTS OF CASH FLOWS FOR THE FINANCIAL YEAR ENDED 31 DECEMBER 2020
#
40
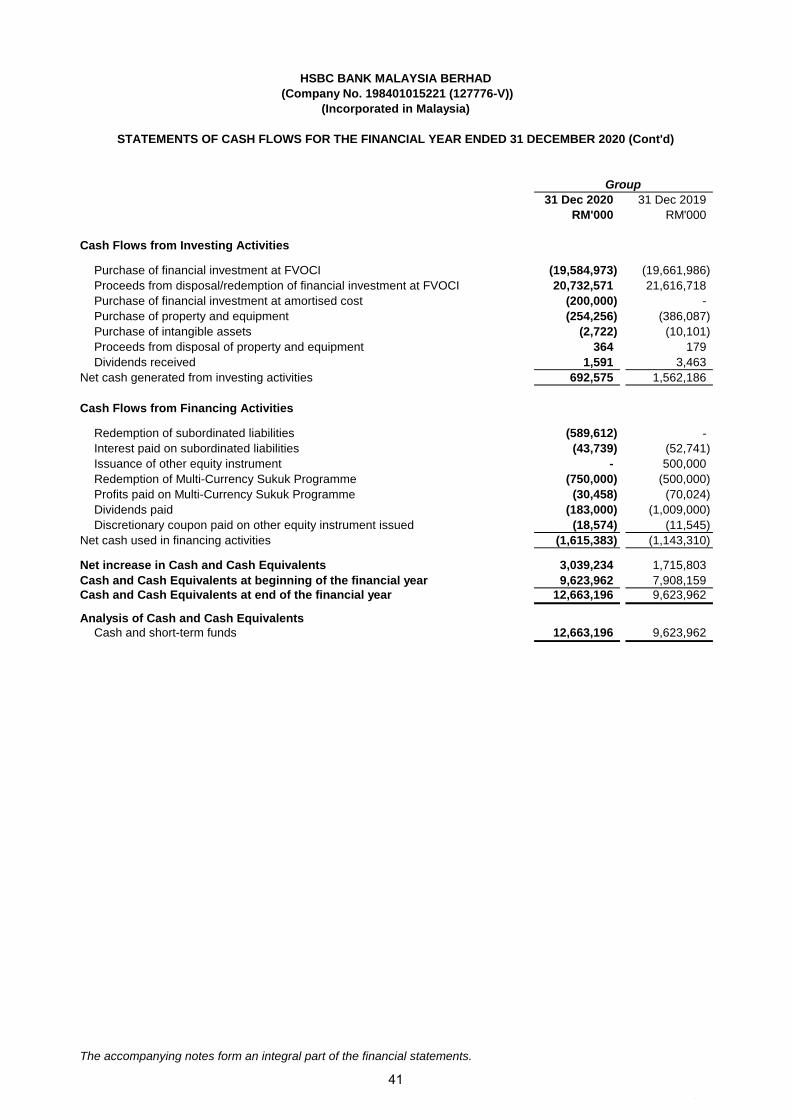
31 Dec 2020 31 Dec 2019
RM'000 RM'000
Cash Flows from Investing Activities
Purchase of financial investment at FVOCI (19,584,973) (19,661,986)
Proceeds from disposal/redemption of financial investment at FVOCI 20,732,571 21,616,718
Purchase of financial investment at amortised cost (200,000) -
Purchase of property and equipment (254,256) (386,087)
Purchase of intangible assets (2,722) (10,101)
Proceeds from disposal of property and equipment 364 179
Dividends received 1,591 3,463
Net cash generated from investing activities 692,575 1,562,186
Cash Flows from Financing Activities
Redemption of subordinated liabilities (589,612) -
Interest paid on subordinated liabilities (43,739) (52,741)
Issuance of other equity instrument - 500,000
Redemption of Multi-Currency Sukuk Programme (750,000) (500,000)
Profits paid on Multi-Currency Sukuk Programme (30,458) (70,024)
Dividends paid (183,000) (1,009,000)
Discretionary coupon paid on other equity instrument issued (18,574) (11,545)
Net cash used in financing activities (1,615,383) (1,143,310)
Net increase in Cash and Cash Equivalents 3,039,234 1,715,803
Cash and Cash Equivalents at beginning of the financial year 9,623,962 7,908,159
Cash and Cash Equivalents at end of the financial year 12,663,196 9,623,962
Analysis of Cash and Cash Equivalents
Cash and short-term funds 12,663,196 9,623,962
The accompanying notes form an integral part of the financial statements.
HSBC BANK MALAYSIA BERHAD
(Company No. 198401015221 (127776-V))
(Incorporated in Malaysia)
STATEMENTS OF CASH FLOWS FOR THE FINANCIAL YEAR ENDED 31 DECEMBER 2020 (Cont'd)
Group
#
41
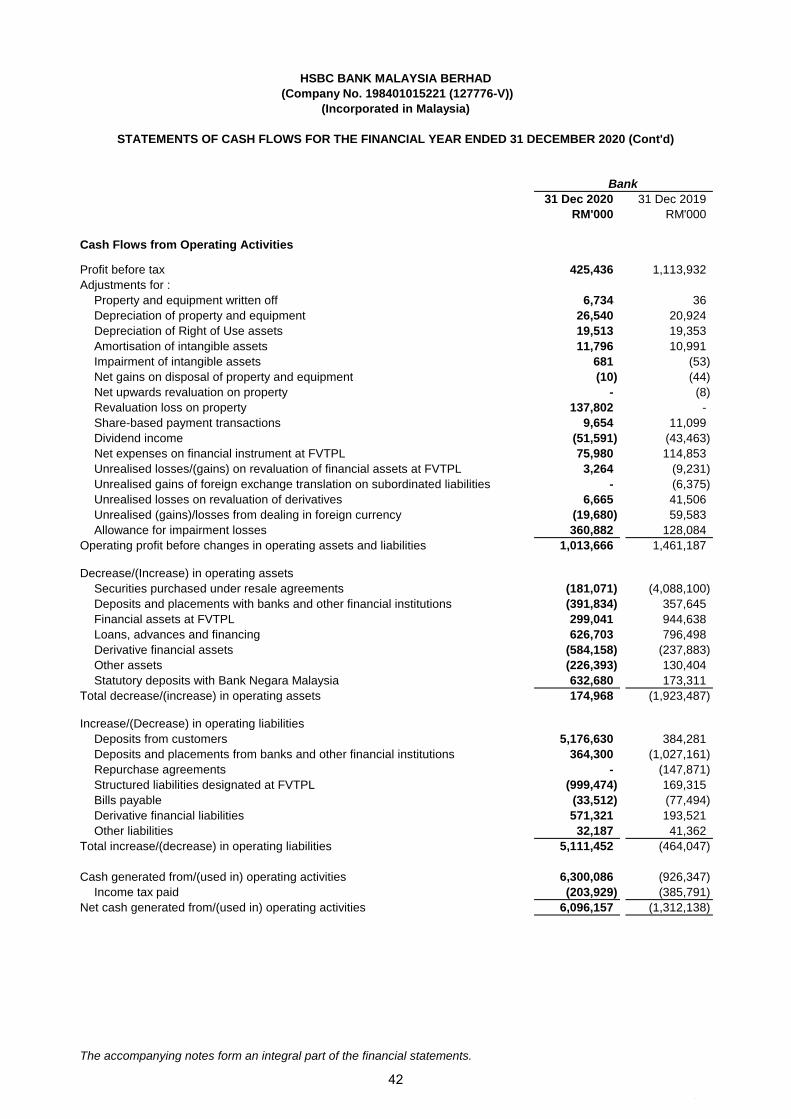
31 Dec 2020 31 Dec 2019
RM'000 RM'000
Cash Flows from Operating Activities
Profit before tax 425,436 1,113,932
Adjustments for :
Property and equipment written off 6,734 36
Depreciation of property and equipment 26,540 20,924
Depreciation of Right of Use assets 19,513 19,353
Amortisation of intangible assets 11,796 10,991
Impairment of intangible assets 681 (53)
Net gains on disposal of property and equipment (10) (44)
Net upwards revaluation on property - (8)
Revaluation loss on property 137,802 -
Share-based payment transactions 9,654 11,099
Dividend income (51,591) (43,463)
Net expenses on financial instrument at FVTPL 75,980 114,853
Unrealised losses/(gains) on revaluation of financial assets at FVTPL 3,264 (9,231)
Unrealised gains of foreign exchange translation on subordinated liabilities - (6,375)
Unrealised losses on revaluation of derivatives 6,665 41,506
Unrealised (gains)/losses from dealing in foreign currency (19,680) 59,583
Allowance for impairment losses 360,882 128,084
Operating profit before changes in operating assets and liabilities 1,013,666 1,461,187
Decrease/(Increase) in operating assets
Securities purchased under resale agreements (181,071) (4,088,100)
Deposits and placements with banks and other financial institutions (391,834) 357,645
Financial assets at FVTPL 299,041 944,638
Loans, advances and financing 626,703 796,498
Derivative financial assets (584,158) (237,883)
Other assets (226,393) 130,404
Statutory deposits with Bank Negara Malaysia 632,680 173,311
Total decrease/(increase) in operating assets 174,968 (1,923,487)
Increase/(Decrease) in operating liabilities
Deposits from customers 5,176,630 384,281
Deposits and placements from banks and other financial institutions 364,300 (1,027,161)
Repurchase agreements - (147,871)
Structured liabilities designated at FVTPL (999,474) 169,315
Bills payable (33,512) (77,494)
Derivative financial liabilities 571,321 193,521
Other liabilities 32,187 41,362
Total increase/(decrease) in operating liabilities 5,111,452 (464,047)
Cash generated from/(used in) operating activities 6,300,086 (926,347)
Income tax paid (203,929) (385,791)
Net cash generated from/(used in) operating activities 6,096,157 (1,312,138)
The accompanying notes form an integral part of the financial statements.
Bank
HSBC BANK MALAYSIA BERHAD
(Company No. 198401015221 (127776-V))
(Incorporated in Malaysia)
STATEMENTS OF CASH FLOWS FOR THE FINANCIAL YEAR ENDED 31 DECEMBER 2020 (Cont'd)
#
42
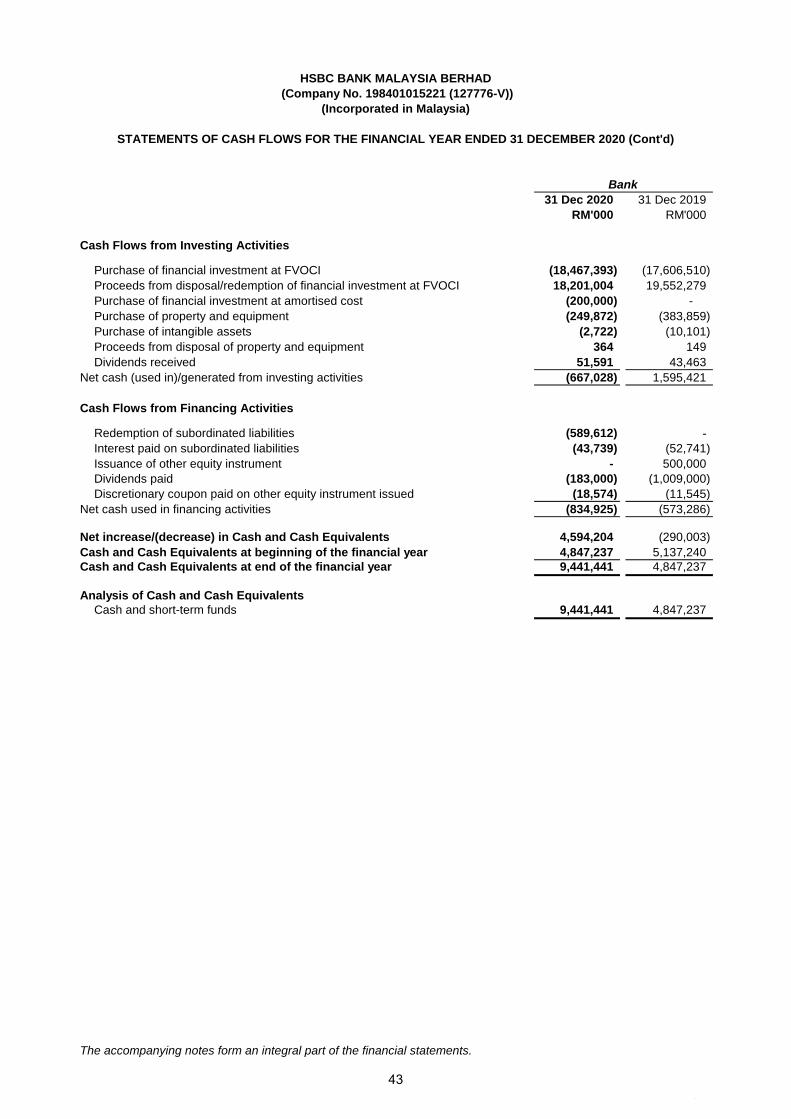
31 Dec 2020 31 Dec 2019
RM'000 RM'000
Cash Flows from Investing Activities
Purchase of financial investment at FVOCI (18,467,393) (17,606,510)
Proceeds from disposal/redemption of financial investment at FVOCI 18,201,004 19,552,279
Purchase of financial investment at amortised cost (200,000) -
Purchase of property and equipment (249,872) (383,859)
Purchase of intangible assets (2,722) (10,101)
Proceeds from disposal of property and equipment 364 149
Dividends received 51,591 43,463
Net cash (used in)/generated from investing activities (667,028) 1,595,421
Cash Flows from Financing Activities
Redemption of subordinated liabilities (589,612) -
Interest paid on subordinated liabilities (43,739) (52,741)
Issuance of other equity instrument - 500,000
Dividends paid (183,000) (1,009,000)
Discretionary coupon paid on other equity instrument issued (18,574) (11,545)
Net cash used in financing activities (834,925) (573,286)
Net increase/(decrease) in Cash and Cash Equivalents 4,594,204 (290,003)
Cash and Cash Equivalents at beginning of the financial year 4,847,237 5,137,240
Cash and Cash Equivalents at end of the financial year 9,441,441 4,847,237
Analysis of Cash and Cash Equivalents
Cash and short-term funds 9,441,441 4,847,237
The accompanying notes form an integral part of the financial statements.
HSBC BANK MALAYSIA BERHAD
(Company No. 198401015221 (127776-V))
(Incorporated in Malaysia)
STATEMENTS OF CASH FLOWS FOR THE FINANCIAL YEAR ENDED 31 DECEMBER 2020 (Cont'd)
Bank
#
43
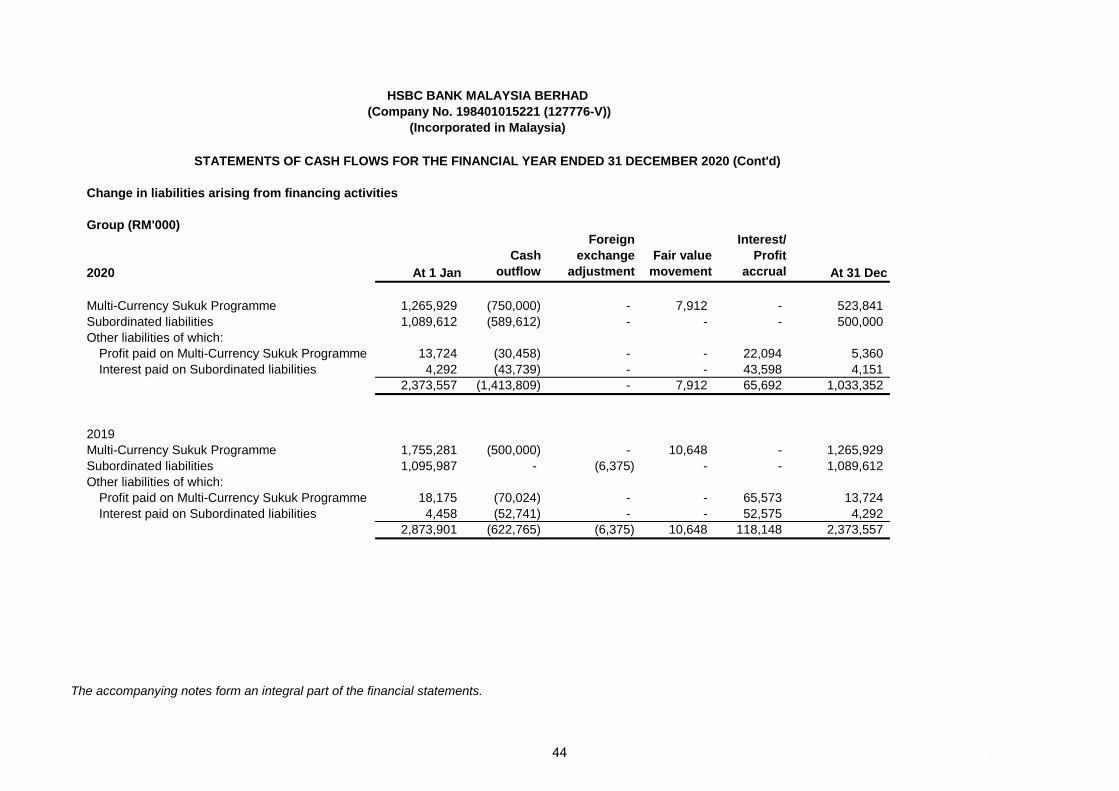
Change in liabilities arising from financing activities
Group (RM'000)
2020 At 1 Jan
Cash
outflow
Foreign
exchange
adjustment
Fair value
movement
Interest/
Profit
accrual At 31 Dec
Multi-Currency Sukuk Programme 1,265,929 (750,000) - 7,912 - 523,841
Subordinated liabilities 1,089,612 (589,612) - - - 500,000
Other liabilities of which:
Profit paid on Multi-Currency Sukuk Programme 13,724 (30,458) - - 22,094 5,360
Interest paid on Subordinated liabilities 4,292 (43,739) - - 43,598 4,151
2,373,557 (1,413,809) - 7,912 65,692 1,033,352
2019
Multi-Currency Sukuk Programme 1,755,281 (500,000) - 10,648 - 1,265,929
Subordinated liabilities 1,095,987 - (6,375) - - 1,089,612
Other liabilities of which:
Profit paid on Multi-Currency Sukuk Programme 18,175 (70,024) - - 65,573 13,724
Interest paid on Subordinated liabilities 4,458 (52,741) - - 52,575 4,292
2,873,901 (622,765) (6,375) 10,648 118,148 2,373,557
The accompanying notes form an integral part of the financial statements.
HSBC BANK MALAYSIA BERHAD
(Company No. 198401015221 (127776-V))
(Incorporated in Malaysia)
STATEMENTS OF CASH FLOWS FOR THE FINANCIAL YEAR ENDED 31 DECEMBER 2020 (Cont'd)
#44
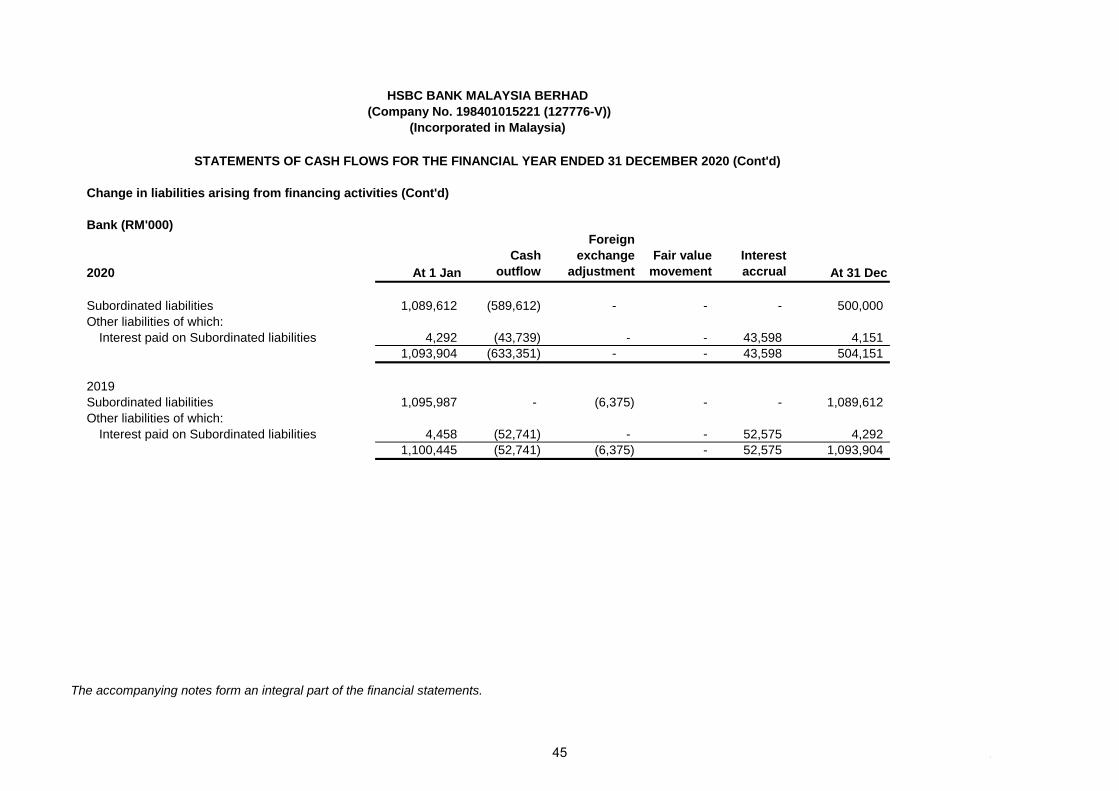
Change in liabilities arising from financing activities (Cont'd)
Bank (RM'000)
2020 At 1 Jan
Cash
outflow
Foreign
exchange
adjustment
Fair value
movement
Interest
accrual At 31 Dec
Subordinated liabilities 1,089,612 (589,612) - - - 500,000
Other liabilities of which:
Interest paid on Subordinated liabilities 4,292 (43,739) - - 43,598 4,151
1,093,904 (633,351) - - 43,598 504,151
2019
Subordinated liabilities 1,095,987 - (6,375) - - 1,089,612
Other liabilities of which:
Interest paid on Subordinated liabilities 4,458 (52,741) - - 52,575 4,292
1,100,445 (52,741) (6,375) - 52,575 1,093,904
The accompanying notes form an integral part of the financial statements.
STATEMENTS OF CASH FLOWS FOR THE FINANCIAL YEAR ENDED 31 DECEMBER 2020 (Cont'd)
HSBC BANK MALAYSIA BERHAD
(Company No. 198401015221 (127776-V))
(Incorporated in Malaysia)
#45
HSBC BANK MALAYSIA BERHAD (Company No. 198401015221 (127776-V))
(Incorporated in Malaysia) NOTES TO THE FINANCIAL STATEMENTS 1 General Information
HSBC Bank Malaysia Berhad (the Bank) is principally engaged in the provision of banking and other related financial services. The subsidiaries of the Bank are principally engaged in the businesses of Islamic Banking and nominee services. Islamic Banking operations refer generally to the acceptance of deposits and granting of financing under the principles of Shariah. The Bank and its subsidiaries are collectively known as "the Group". There were no significant changes in these activities during the financial year. The Bank is a public limited liability company, incorporated and domiciled in Malaysia. The registered office of the Bank is located at 10th Floor, South Tower, 2, Leboh Ampang, 50100 Kuala Lumpur. The immediate holding company and the ultimate holding company during the financial year are The Hongkong and Shanghai Banking Corporation Limited (HBAP) and HSBC Holdings plc, respectively. The financial statements were approved and authorised for issue by the Board of Directors on 5 February 2021.
2 Basis of Preparation
(a) Statement of compliance
The financial statements of the Group and the Bank have been prepared in accordance with the Malaysian Financial Reporting Standards (MFRS), International Financial Reporting Standards and the requirements of the Companies Act 2016 in Malaysia. The financial statements incorporate those activities relating to Islamic Banking which have been undertaken by the Bank’s Islamic subsidiary. (i) Standards and amendments to published standards that are effective The amendments to published standards that are effective and applicable to the Group and the Bank for the financial year beginning on 1 January 2020 are as follows:
The Conceptual Framework for Financial Reporting (Revised 2018)
Amendments to MFRS 101 and MFRS 108 “Definition of Material”
Amendments to MFRS 3 “Definition of a Business”
Amendments to MFRS 9, 139 & 7 “Interest Rate Benchmark Reform”
The amendments to published standards that are effective and applicable to the Group and the Bank for the financial year beginning on 1 June 2020 are as follows:
Amendments to MFRS 16 “COVID-19-Related Rent Concessions”
The Group and the Bank had early adopted the amendments to MFRS 139 and MFRS 7 of the Interest Rate Benchmark Reform from 1 January 2019. The amendments provide temporary relief from applying specific hedge accounting requirements to hedging relationships directly affected by inter-bank offered rate (IBOR) reform. The reliefs have the effect that IBOR reform should not generally cause hedge accounting to terminate. However, any hedge ineffectiveness continues to be recorded in the statement of comprehensive income. The reliefs will cease to apply when the uncertainty arising from interest rate benchmark reform is no longer present. These amendments had no impact on the amounts recognised in the prior or current period. The other amendments listed above did not give rise to any material financial impact to the Group and the Bank on the current period or any prior period and is not likely to affect future period.
46

HSBC Bank Malaysia Berhad 198401015221 (127776-V)
NOTES TO THE FINANCIAL STATEMENTS (Cont’d)
2 Basis of Preparation (Cont’d)
(a) Statement of compliance (Cont’d)
(ii) Standards and amendments to published standards that have been issued but not yet effective
A number of new standards and amendments to standards and interpretations have been issued that are applicable to the Group and the Bank but are not yet effective.
Effective for annual periods commencing on or after 1 January 2021
Interest Rate Benchmark Reform - Phase 2 (Amendments to MFRS 9, MFRS 139, MFRS 7, MFRS 4 and MFRS 16) The amendments address issues affecting financial statements when changes are made to contractual cash flows and hedging relationships as a result of the reform. Under these amendments, changes made to a financial instrument measured at other than fair value through profit or loss that are economically equivalent and required by interest rate benchmark reform, do not result in the derecognition or a change in the carrying amount of the financial instrument, but instead require the effective interest rate to be updated to reflect the change in the interest rate benchmark. In addition, hedge accounting will not be discontinued solely because of the replacement of the interest rate benchmark if the hedge meets other hedge accounting criteria.
Effective for annual periods commencing on or after 1 January 2022
Amendments to MFRS 116 “Proceeds before Intended Use” The amendments prohibit an entity from deducting from the cost of a property, plant and equipment the proceeds received from selling items produced by the property, plant and equipment before it is ready for its intended use. The sales proceeds should instead be recognised in profit or loss. The amendments also clarify that testing whether an asset is functioning properly refers to assessing the technical and physical performance of the property, plant and equipment. The amendments shall be applied retrospectively.
Amendments to MFRS 3 “Reference to the Conceptual Framework” The amendments replace the reference to Framework for Preparation and Presentation of Financial Statements with 2018 Conceptual Framework. The amendments did not change the current accounting for business combinations on acquisition date. The amendments provide an exception for the recognition of liabilities and contingent liabilities should be in accordance with the principles of MFRS 137 ‘Provisions, contingent liabilities and contingent assets’ and IC Interpretation 21 ‘Levies’ when falls within their scope. It also clarifies that contingent assets should not be recognised at the acquisition date. The amendments shall be applied prospectively.
Annual Improvements to MFRSs (2018 - 2020 cycle) effective for annual periods beginning on or after 1 January 2022 as follows: - Amendment to MFRS 1 First-time Adoption of MFRS: Subsidiary as First-time Adopter. - Amendment to Illustrative Example accompanying MFRS 16 Leases: Lease Incentives. - Amendment to MFRS 141 Agriculture: Taxation in Fair Value Measurements. - Amendment to MFRS 9 Financial Instruments: Fees in the ‘10 per cent’ Test for
Derecognition of Financial Liabilities.
47

HSBC Bank Malaysia Berhad 198401015221 (127776-V)
NOTES TO THE FINANCIAL STATEMENTS (Cont’d)
2 Basis of Preparation (Cont’d)
(a) Statement of compliance (Cont’d)
(ii) Standards and amendments to published standards that have been issued but not yet effective (Cont’d)
Effective for annual periods commencing on or after 1 January 2022 (Cont’d)
Amendments to MFRS 137 “Onerous Contracts – Cost of Fulfilling a Contract” The amendments clarify that direct costs of fulfilling a contract include both the incremental cost of fulfilling the contract as well as an allocation of other costs directly related to fulfilling contracts. The amendments also clarify that before recognising a separate provision for an onerous contract, impairment loss that has occurred on assets used in fulfilling the contract should be recognised. The amendments shall be applied retrospectively.
Effective for annual periods commencing on or after 1 January 2023
Amendments to MFRS 101 “Classification of liabilities as current or non-current” The amendments clarify that a liability is classified as non-current if an entity has a substantive right at the end of the reporting period to defer settlement for at least 12 months after the reporting period. A liability is classified as current if a condition is breached, at or before the reporting date, and a waiver is obtained after the reporting date. A loan is classified as non-current if a covenant is breached after the reporting date. The amendments shall be applied retrospectively.
None of the above is expected to have a significant effect on the financial statements of the Group and the Bank.
(iii) Going concern
The Board, having made appropriate enquiries, is satisfied that the Group and the Bank as a whole has adequate resources to continue operations for a period of at least 12 months from the date of this report, and it therefore continues to adopt the going concern basis in preparing the financial statement.
(b) Basis of measurement
The financial statements of the Group and the Bank have been prepared under the historical cost convention, except for the following assets and liabilities as disclosed in their respective accounting policy notes:
Structured liabilities
Financial investments
Property and equipment
Derivatives and hedge accounting
Financial liabilities designated at fair value through profit and loss
(c) Functional and presentation currency
These financial statements are presented in Ringgit Malaysia (RM), which is the Group and the Bank’s functional currency. All financial information presented in RM has been rounded to the nearest thousand, unless otherwise stated.
48
HSBC Bank Malaysia Berhad 198401015221 (127776-V)
NOTES TO THE FINANCIAL STATEMENTS (Cont’d)
2 Basis of Preparation (Cont’d)
(d) Use of estimates and judgements
The results of the Group and the Bank are sensitive to the accounting policies, assumptions and estimates that underlie the preparation of the financial statements. The significant accounting policies are described in Note 3. The preparation of the financial statements in conformity with MFRSs requires management to make estimates and assumptions about future conditions. The use of available information and the application of judgement are inherent in the formation of estimates; actual results in the future may differ from estimates upon which financial information is prepared. Management believes that the Group and the Bank’s critical accounting policies where judgement is necessarily applied are those which relate to impairment of loans, advances and financing and the valuation of financial instruments (refer Note 6). There are no other significant areas of estimation uncertainty and critical judgements in applying accounting policies that have significant effect on the amounts recognised in the financial statements other than those disclosed above.
Estimates and underlying assumptions are reviewed on an ongoing basis. Revisions to accounting estimates are recognised in the period in which the estimates are revised and in any future periods affected.
49
HSBC Bank Malaysia Berhad 198401015221 (127776-V)
NOTES TO THE FINANCIAL STATEMENTS (Cont’d) 3 Significant Accounting Policies
The accounting policies set out below have been applied consistently to the periods presented in these financial statements and have been applied consistently by the Group and the Bank.
(a) Basis of consolidation
The Group financial statements include the financial statements of the Bank and its subsidiaries made up to 31 December 2020.
(i) Subsidiaries
Subsidiaries are all entities, including structured entities, controlled by the Group. The financial statements of subsidiaries are included in the consolidated financial statements from the date that control commences until the date the control ceases.
The Group controls and consequently consolidates an entity when it is exposed, or has rights, to variable returns from its involvement with the entity and has the ability to affect those returns through its power to direct activities over the entity. Potential voting rights are considered when assessing control only when such rights are substantive. The Group and the Bank also consider having de facto power over an investee when, despite not having the majority of voting rights, it has the current ability to direct the activities of the investee that significantly affect the investee’s return. They are deconsolidated from the date that control ceases.
Investments in subsidiaries are measured in the Bank’s statement of financial position at cost less any impairment losses, unless the investment is held for sale or distribution. The cost of investments includes transaction cost.
(ii) Business combinations
Business combinations are accounted for using the acquisition method.
For new acquisitions, the Group measures the cost of goodwill at the acquisition date as:
the fair value of the consideration transferred; plus
the recognised amount of any non-controlling interests in the acquiree; plus
if the business combination is achieved in stages, the fair value of the existing equity interest in the acquiree; less
the net recognised amount (generally fair value) of the identifiable assets acquired and liabilities assumed.
When the excess is negative, a bargain purchase gain is recognised immediately in profit or loss.
For each business combination, the Group elects whether it measures the non-controlling interests in the acquirer either at fair value or at the proportionate share of the acquiree’s identifiable net assets at the acquisition date.
Transaction costs, other than that related to the issuance of debt or equity securities, that the Group incurs in connection with a business combination are expensed as incurred.
Any contingent consideration to be transferred by the Group is recognised at fair value at the acquisition date. Subsequent changes to the fair value of the contingent consideration that is deemed to be an asset or liability is recognised in accordance with MFRS 9 in profit or loss. Contingent consideration that is classified as equity is not remeasured, and its subsequent settlement is accounted for within equity. (iii) Acquisitions of non-controlling interests The Group treats all changes in its ownership interest in a subsidiary that do not result in a loss of control as equity transactions between the Group and its non-controlling interest holders. Any difference between the Group’s share of net assets before and after the change, and any consideration received or paid, is adjusted to or against the Group reserves.
50
HSBC Bank Malaysia Berhad 198401015221 (127776-V)
NOTES TO THE FINANCIAL STATEMENTS (Cont’d)
3 Significant Accounting Policies (Cont’d)
(a) Basis of consolidation (Cont’d)
(iv) Loss of control Upon the loss of control of a subsidiary, the Group derecognises the assets and liabilities of the former subsidiary, any non-controlling interests and the other components of equity related to the former subsidiary from the consolidated statement of financial position. Any surplus or deficit arising on the loss of control is recognised in profit or loss. If the Group retains any interest in the former subsidiary, then such interest is measured at fair value at the date that the control is lost. Subsequently, it is accounted for as an associate, joint venture or financial asset. In addition, any amounts previously recognised in other comprehensive income in respect of that entity are accounted for as if the Group had directly disposed of the related assets and liabilities. This may mean the amounts previously recognised in other comprehensive income are reclassified to profit or loss. (v) Joint arrangements Joint arrangements are arrangements of which the Group has joint control, established by contracts requiring unanimous consent for decision about the activities that significantly affect the arrangement’s returns. The Group adopted MFRS 11, Joint Arrangements. Joint arrangements are classified and accounted for as follows:
A joint arrangement is classified as “joint operation” when the Group or the Bank has the direct rights to the assets and obligations for the liabilities relating to an arrangement. The Group and the Bank account for each of its share of the assets, liabilities and transactions, including the share of those held or incurred jointly with the other investors, in relation to the joint operation.
A joint arrangement is classified as a “joint venture” when the Group has rights only to the net assets of the arrangements. The Group accounts for its interest in the joint venture using the equity method as described in MFRS 128.
(vi) Transactions eliminated on consolidation Intra-group balances and transactions, and any unrealised income and expenses arising from intra-group transactions, are eliminated in preparing the consolidated financial statements.
Unrealised gains arising from transactions with equity-accounted joint ventures are eliminated against the investment to the extent of the Group’s interest in the investees. Unrealised losses are eliminated in the same way as unrealised gains, but only to the extent that there is no evidence of impairment.
(b) Foreign currencies
Transactions in foreign currencies are translated to the functional currency at exchange rates at the dates of the transactions.
Monetary assets and liabilities denominated in foreign currencies at the reporting period are retranslated to the functional currency at the exchange rate at that date.
Non-monetary assets and liabilities denominated in foreign currencies are not retranslated at the end of the reporting date except for those that are measured at fair value are retranslated to the functional currency at the exchange rate at the date that the fair value was determined.
Foreign currency differences arising on retranslation are recognised in profit or loss, except for differences arising on the retranslation of FVOCI equity instruments or a financial instrument designated as a hedge of currency risk, which are recognised in other comprehensive income.
51
HSBC Bank Malaysia Berhad 198401015221 (127776-V)
NOTES TO THE FINANCIAL STATEMENTS (Cont’d)
3 Significant Accounting Policies (Cont’d)
(c) Interest income and expense/Islamic financing income and expense Interest income and expense/Islamic financing income and expense for all financial instruments of the Group and the Bank, except those classified as financial instruments designated at fair value through profit or loss (FVTPL) are recognised in “interest income” and “interest expense” and “Income from Islamic Banking Operation” in the statement of profit or loss using the effective interest/profit rate method. The effective interest/profit rate method is a way of calculating the amortised cost of a financial asset or a financial liability (or groups of financial assets or financial liabilities) and of allocating the interest income or expense/Islamic financing income or expense over the relevant period.
The effective interest/profit rate is the rate that exactly discounts estimated future cash payments or receipts through the expected life of the financial instrument or, where appropriate, a shorter period, to the net carrying amount of the financial asset or liability. When calculating the effective interest/profit rate, the Group and the Bank estimate cash flows considering all contractual terms of the financial instrument but not future credit losses.
The calculation of the effective interest/profit rate includes all amounts paid or received by the Group and the Bank that are an integral part of the effective interest/profit rate, including transaction costs and all other premiums or discounts.
Interest/profit on impaired financial assets of the Group and the Bank is recognised using the rate of interest/profit used to discount the future cash flows for the purpose of measuring the impairment loss.
Financing income and expense from Islamic Banking operations are recognised on an accrual basis in accordance with the principles of Shariah.
Interest/Financing income and expense of the Group and the Bank presented in the statement of profit and loss include:
interest/profit on financial assets and liabilities measured at amortised costs calculated on an effective interest/profit rate basis;
interest/profit on FVOCI investment securities calculated on an effective interest/profit rate basis;
the effective portion of fair value changes in qualifying hedging derivatives designated in cash flow hedges of variability in interest/profit cash flows, in the same period that the hedged cash flows affect interest/financing income/expense; and
the effective portion of fair value changes in qualifying hedging derivatives designated in fair value hedges of interest rate risk.
(d) Fees and commission, net trading income and other operating income
Fee income is earned from a diverse range of services the Group and the Bank provide to their customers. Fee income is accounted for as follows:
income earned on the execution of a significant act is recognised as revenue when the act is completed;
income earned from the provision of services is recognised as revenue as the services are provided; and
income which forms an integral part of the effective interest/profit rate of a financial instrument is recognised as an adjustment to the effective interest/profit rate and recorded in ‘interest/financing income’ Note 3(c).
Dividend income is recognised when the right to receive payment is established. This is the ex-dividend date for listed equity securities, and usually the date when shareholders approve the dividend for unlisted equity securities.
52
HSBC Bank Malaysia Berhad 198401015221 (127776-V)
NOTES TO THE FINANCIAL STATEMENTS (Cont’d)
3 Significant Accounting Policies (Cont’d)
(d) Fees and commission, net trading income and other operating income (Cont’d)
Net trading income comprises all gains and losses from changes in the fair value of financial assets and financial liabilities FVTPL, together with the related interest income and expense; and it also includes all gains and losses from changes in the fair value of derivatives that are managed in conjunction with financial assets and liabilities measured at fair value through profit or loss.
Net income/(expense) from financial instruments designated at fair value includes:
all gains and losses from changes in the fair value of financial assets and financial liabilities
designated at fair value through profit or loss, including liabilities under investment contracts;
all gains and losses from changes in the fair value of derivatives that are managed in conjunction
with financial assets and liabilities designated at fair value through profit or loss; and
interest/profit income, interest/profit expense and dividend income in respect of:
- financial assets and financial liabilities designated at fair value through profit or loss; and
- derivatives managed in conjunction with the above, except for interest/profit arising from debt securities issued by the Group and the Bank and derivatives managed in conjunction with those debt securities, which is recognised in ‘Interest income and expense/Islamic financing income and expense’ (Note 3(c)).
The fair value of financial instruments is generally measured on an individual basis. However, in cases
where the Group and the Bank manage a group of financial assets and liabilities according to its net
market or credit risk exposure, the fair value of the group of financial instruments is measured on a net
basis but the underlying financial assets and liabilities are presented separately in the financial
statements, unless they satisfy the offsetting criteria.
(e) Income tax
Income tax comprises current tax and deferred tax. Income tax is recognised in the profit or loss except to the extent that it relates to items recognised in other comprehensive income or directly in equity, in which case it is recognised in the same statement in which the related item appears. Current tax is the tax expected to be payable or receivable on the taxable income or loss for the financial year, calculated using tax rates enacted or substantively enacted at the end of the reporting period, and any adjustment to tax payable in respect of previous financial years. The Group and the Bank provide for potential current tax liabilities that may arise on the basis of the amounts expected to be paid to the tax authorities. Current tax assets and liabilities are offset when the Group and the Bank intend to settle on a net basis and the legal right to offset exists.
Deferred tax is recognised on temporary differences between the carrying amounts of assets and liabilities in the balance sheet and the amounts attributed to such assets and liabilities for tax purposes. Deferred tax liabilities are generally recognised for all taxable temporary differences and deferred tax assets are recognised to the extent that it is probable that future taxable profits will be available against which deductible temporary differences can be utilised.
Deferred tax is calculated using the tax rates expected to apply in the periods in which the assets will be realised or the liabilities settled, based on tax rates and laws enacted, or substantively enacted, by the balance sheet date. Deferred tax assets and liabilities are offset when they arise in the same tax reporting group and relate to income taxes levied by the same taxation authority, and when the Group and the Bank have a legal right to offset.
Deferred tax relating to fair value of FVOCI investments and cash flow hedging instruments which are charged or credited directly to other comprehensive income, is also charged or credited to other comprehensive income and is subsequently recognised in the profit or loss when the deferred fair value gain or loss is recognised in the profit or loss.
53
HSBC Bank Malaysia Berhad 198401015221 (127776-V)
NOTES TO THE FINANCIAL STATEMENTS (Cont’d)
3 Significant Accounting Policies (Cont’d)
(f) Cash and cash equivalents
For the purpose of the statements of cash flows, cash and cash equivalents include highly liquid investments that are readily convertible to known amounts of cash and which are subject to an insignificant risk of change in value. Cash and cash equivalents comprise cash at hand and bank balances, short term deposits and placements with banks maturing within one month.
(g) Financial instruments (i) Initial recognition and measurement
A financial asset or a financial liability is recognised in the statement of financial position when, and only when the Group or the Bank becomes a party to the contractual provisions of the instrument. A financial instrument is recognised initially, at its fair value plus, in the case of a financial instrument not at fair value through profit or loss, transactions costs that are directly attributable to the acquisition or issue of the financial instrument. (ii) Financial instruments categories and subsequent measurement The Group and the Bank categorise financial instruments as follows:
financial instruments measured at amortised cost (Note 3(h));
financial assets measured at fair value through other comprehensive income (FVOCI) (Note 3(i));
equity securities measured at fair value with fair value movements presented in OCI (Note 3(j)); or
financial instruments designated at fair value through profit or loss (FVTPL) (Note 3(k)). The Group and the Bank classify their financial liabilities, as measured at amortised cost or designated at fair value through profit or loss (See Notes 3(h) and 3(k)). (iii) Derecognition of financial assets and liabilities
Financial assets are derecognised when the rights to receive cash flows from the assets have expired; or where the Group and the Bank have transferred their contractual rights to receive the cash flows of the financial assets, and have transferred substantially all the risks and rewards of ownership; or where both control and substantially all the risks and rewards are not retained. Financial liabilities are derecognised when they are extinguished, i.e. when the obligation is discharged, cancelled, or expires. (iv) Offsetting financial assets/liabilities and income/expenses Financial assets and liabilities are offset and the net amount reported in the statement of financial position when there is currently a legally enforceable right to offset the recognised amounts and the Group and the Bank intend to settle on a net basis, or realise the asset and settle the liability simultaneously. The legally enforceable right must not be contingent on future events and must be enforceable in the normal course of business and in the event of default, insolvency or bankruptcy.
The ‘Gross amounts not offset in the statement of financial position’ for derivatives and securities purchased under resale agreements and similar arrangements include transactions where:
the counterparty has an offsetting exposure with the Group and the Bank and a master netting or similar arrangement is in place with a right of set off only in the event of default, insolvency or bankruptcy, or the offset criteria are otherwise not satisfied; and
cash and non-cash collaterals are received and pledged in respect of the transactions described above.
54

HSBC Bank Malaysia Berhad 198401015221 (127776-V)
NOTES TO THE FINANCIAL STATEMENTS (Cont’d)
3 Significant Accounting Policies (Cont’d)
(g) Financial instruments (Cont’d)
(iv) Offsetting financial assets/liabilities and income/expenses (Cont’d) Income and expenses are presented on a net basis only when permitted under the MFRSs, or for gains and losses arising from a group of similar transactions such as in the Group and the Bank’s trading activity.
(v) Valuation of financial instruments All financial instruments are recognised initially at fair value. Fair value is the price that would be received to sell an asset or paid to transfer a liability in an orderly transaction between market participants at the measurement date. The fair value of a financial instrument on initial recognition is generally its transaction price (that is, the fair value of the consideration given or received). However, if there is a difference between the transaction price and the fair value of financial instruments whose fair value is based on a quoted price in an active market or a valuation technique that uses only data from observable markets, the Group and the Bank recognise the difference as a trading gain or loss at inception (“day 1 gain or loss”). In all other cases, the entire day 1 gain or loss is deferred and recognised in the income statement over the life of the transaction when the inputs become observable, the transaction matures or is closed out, or when the Group and the Bank enter into an offsetting transaction.
The fair value of financial instruments is generally measured on an individual basis. However, in cases where the Group and the Bank manage a group of financial assets and liabilities according to its net market or credit risk exposure, the fair value of the group of financial instruments is measured on a net basis but the underlying financial assets and liabilities are presented separately in the financial statements, unless they satisfy the MFRSs offsetting criteria. Subsequent to initial recognition, the fair values of financial instruments measured at fair value are measured in accordance with the Group and the Bank’s valuation methodologies, which are described in Note 6(b)(ii). (vi) Derivative financial instruments and hedge accounting
Derivatives are financial instruments that derive their value from the price of underlying items such as equities, interest rates or other indices. Derivatives are recognised initially and are subsequently measured at fair value, with changes in fair value generally recorded in the income statement. Derivatives are classified as assets when their fair value is positive or as liabilities when their fair value is negative. This includes embedded derivatives in financial liabilities which are bifurcated from the host contract when they meet the definition of a derivative on a stand-alone basis. Where the derivatives are managed with debt securities issued by the Group and the Bank that are designated at fair value, the contractual interest is shown in ‘Interest expense’ together with the interest payable on the issued debt.
Hedge accounting
When derivatives are not part of fair value designated relationships, if held for risk management purposes, they are designated in hedge accounting relationships where the required criteria for documentation and hedge effectiveness are met. The Group and the Bank uses these derivatives or, where allowed, other non-derivative hedging instruments in fair value hedges, cash flow hedges or hedges of net investments in foreign operations as appropriate to accounting for the risk being hedged.
Fair value hedge
Fair value hedge accounting does not change the recording of gains and losses on derivatives and other hedging instruments, but results in recognising changes in the fair value of the hedged assets or liabilities attributable to the hedged risk that would not otherwise be recognised in the income statement. If a hedge relationship no longer meets the criteria for hedge accounting, hedge accounting is discontinued and the cumulative adjustment to the carrying amount of the hedged item is amortised to the income statement on a recalculated effective interest rate, unless the hedged item has been derecognised, in which case it is recognised in the income statement immediately.
55
HSBC Bank Malaysia Berhad 198401015221 (127776-V)
NOTES TO THE FINANCIAL STATEMENTS (Cont’d)
3 Significant Accounting Policies (Cont’d)
(g) Financial instruments (Cont’d)
(vi) Derivative financial instruments and hedge accounting (Cont’d) Hedge accounting (Cont’d)
Cash flow hedge
The effective portion of gains and losses on hedging instruments is recognised in other comprehensive income and the ineffective portion of the change in fair value of derivative hedging instruments that are part of a cash flow hedge relationship is recognised immediately in the income statement within ‘Net Trading Income’. The accumulated gains and losses recognised in other comprehensive income are reclassified to the income statement in the same periods in which the hedged item affects profit or loss. In hedges of forecast transactions that result in recognition of a non-financial asset or liability, previous gains and losses recognised in other comprehensive income are included in the initial measurement of the asset or liability. When a hedge relationship is discontinued, or partially discontinued, any cumulative gain or loss recognised in other comprehensive income remains in equity until the forecast transaction is recognised in the income statement. When a forecast transaction is no longer expected to occur, the cumulative gain or loss previously recognised in other comprehensive income is immediately reclassified to the income statement.
Hedging Instruments impacted by Inter-Bank Offered Rates (IBOR) Reform
Following the request received by the Financial Stability Board from the G20, a fundamental review and reform of the major interest rate benchmarks is under way across the world's largest financial markets. This reform was not contemplated when the standard was published, and consequently the MASB has published a set of temporary exceptions from applying specific hedge accounting requirements to provide clarification on how the standard should be applied in these circumstances. Under the temporary exceptions, IBORs are assumed to continue for the purposes of hedge accounting until such time as the uncertainty is resolved. The first set of amendments (Phase 1) to MFRS 9 and MFRS 139, which came into effect from 1 January 2020 (with early adoption allowed from 1 January 2019) primarily allowed the assumption that the interbank offered rates (IBORs) are to continue unaltered for the purposes of forecasting hedged cash flows until such time as the uncertainty of transitioning to nearly risk free rates (RFRs) is resolved. The second set of amendments (Phase 2), which will only be effective from 1 January 2021 allows for modification of hedge documentation to reflect the components of hedge relationships which have transitioned to RFRs on an economically equivalent basis as a direct result of the IBOR transition. The Group and the Bank has adopted Phase 1 since 1 January 2019 and will adopt Phase 2 from 1 January 2021. The Group and the Bank have fair value hedge accounting relationships that are exposed to MYR Kuala Lumpur Interbank Offered Rate (KLIBOR). Existing derivatives designated in these relationships referencing IBORs will transition to new Risk-Free Rates (RFRs) in different ways and at different times. External progress on the transition to RFRs is being monitored, with the objective of ensuring a smooth transition for the Group and the Bank’s hedge accounting relationships. The specific issues arising will vary with the details of each hedging relationship, but may arise due to the transition of existing products included in the designation, a change in expected volumes of products to be issued, a change in contractual terms of new products issued, or a combination of these factors. Some hedges may need to be de-designated and new relationships entered into, while others may survive the market-wide benchmarks reform. Hedged items within the hedge accounting relationships affected by the adoption of the temporary exceptions are presented in the Balance Sheet as financial investments at FVOCI. For details on the hedging derivatives, see note 43.
56
HSBC Bank Malaysia Berhad 198401015221 (127776-V)
NOTES TO THE FINANCIAL STATEMENTS (Cont’d)
3 Significant Accounting Policies (Cont’d)
(g) Financial instruments (Cont’d)
(vi) Derivative financial instruments and hedge accounting (Cont’d) Hedge accounting (Cont’d)
Hedging Instruments impacted by Inter-Bank Offered Rates (IBOR) Reform (Cont’d)
The notional contract amounts of interest rate derivatives designated in qualifying hedge accounting relationships indicate the nominal value of transactions outstanding at the balance sheet date; they do not represent amounts at risk. The Group and the Bank continue to monitor market-wide IBOR reform changes and plans to effect the transition of IBOR hedged items, hedged risks and hedging instruments to RFRs following methodologies which are not expected to result in discontinuation of designated hedge relationships.
(h) Financial instruments measured at amortised cost
Financial assets that are held to collect the contractual cash flows and that contain contractual terms that give rise on specified dates to cash flows that are solely payments of principal and interest, such as most loans, advances and financing to banks and customers and some debt securities, are measured at amortised cost. In addition, most financial liabilities are measured at amortised cost. The carrying value of these financial assets at initial recognition includes any directly attributable transactions costs. If the initial fair value is lower than the cash amount advanced, such as in the case of some leveraged finance and syndicated lending activities, the difference is deferred and recognised over the life of the loan through the recognition of interest income.
The Group and the Bank may commit to underwrite loans, advances and financing on fixed contractual terms for specified periods of time. When the loans, advances and financing arising from the lending commitment is expected to be held for trading, the commitment to lend is recorded as a derivative. When the Group and the Bank intend to hold the loans, advances and financing, the related commitment is included in the impairment calculations set out in Note 3(l). They are derecognised when either the borrower repays its obligations, or the loans, advances and financing are sold or written off, or substantially all the risks and rewards of ownership are transferred.
For financing under the Syndicated Investment Account for Financing/Investment Agency Account (SIAF/IAA) arrangements, the Group and Bank recognise the financing to the extent that the financing qualify for derecognition by the subsidiary of the Bank, HBMS. Refer to accounting policy Note 3(g)(iii) on derecognition of financial assets. (i) Sale and repurchase agreements When debt securities are sold subject to a commitment to repurchase them at a predetermined price (repos), they remain on the balance sheet and a liability is recorded in respect of the consideration received. Securities purchased under commitments to resell (reverse repos) are not recognised on the balance sheet and an asset is recorded in respect of the initial consideration paid. Non-trading repos and reverse repos are measured at amortised cost. The difference between the sale and repurchase price or between the purchase and resale price is treated as interest and recognised in net interest income over the life of the agreement. Contracts that are economically equivalent to reverse repurchase or repurchase agreements (such as sales or purchases of debt securities entered into together with total return swaps with the same counterparty) are accounted for similarly to, and presented together with, reverse repurchase or repurchase agreements.
57
HSBC Bank Malaysia Berhad 198401015221 (127776-V)
NOTES TO THE FINANCIAL STATEMENTS (Cont’d)
3 Significant Accounting Policies (Cont’d)
(h) Financial instruments measured at amortised cost (Cont’d)
(ii) Financial liabilities measured at amortised cost Financial liabilities that are not classified as fair value through profit or loss fall into this category and are measured at amortised cost. The financial liabilities measured at amortised cost are deposits from customers, deposits and placement from banks and other financial institutions, repurchase agreement, bills payable, other liabilities and subordinated liabilities. Financial liabilities are recognised when the Group and the Bank enter into the contractual provisions of the arrangements with counterparties, which are generally on trade date, and initially measured at fair value, which is normally the consideration received. Subsequent measurement of financial liabilities, other than those measured at fair value through profit or loss and financial guarantees, is at amortised cost, using the effective interest method to amortise the difference between proceeds received, net of directly attributable transaction costs incurred, and the redemption amount over the expected life of the instrument. Subordinated liabilities of the Group and the Bank are measured at amortised cost using the effective interest/profit rate method, except for the portions which are fair value hedged, which are adjusted for the fair value gains or losses attributable to the hedged risks. Interest expense/profits payable on subordinated liabilities of the Group and the Bank are recognised on an accrual basis.
(i) Financial assets measured at fair value through other comprehensive income (FVOCI)
Financial assets held for a business model that is achieved by both collecting contractual cash flows and selling and that contain contractual terms that give rise on specified dates to cash flows that are solely payments of principal and interest are measured at FVOCI. These comprise primarily debt securities. They are recognised on the trade date when the Group and the Bank enter into contractual arrangements to purchase and are normally derecognised when they are either sold or redeemed. They are subsequently remeasured at fair value and changes therein (except for those relating to impairment, interest income and foreign currency exchange gains and losses) are recognised in other comprehensive income until the assets are sold. Upon disposal, the cumulative gains or losses in other comprehensive income are recognised in the income statement as ‘Other Operating Income’. Financial assets measured at FVOCI are included in the impairment calculations set out below and impairment is recognised in profit or loss.
(j) Equity securities measured at fair value with fair value movements presented in Other
Comprehensive Income (OCI) The equity securities for which fair value movements are shown in OCI are business facilitation and other similar investments where the Group and the Bank hold the investments other than to generate a capital return. Gains or losses on the derecognition of these equity securities are not transferred to profit or loss. Dividend income is recognised in profit or loss.
(k) Financial instruments designated at fair value through profit or loss
Financial instruments, other than those held for trading, are classified in this category if they meet one or more of the criteria set out below and are so designated irrevocably at inception:
the use of the designation removes or significantly reduces an accounting mismatch;
when a group of financial assets and liabilities or a group of financial liabilities is managed and its performance is evaluated on a fair value basis, in accordance with a documented risk management or investment strategy;
where the financial liability contains one or more non-closely related embedded derivatives
58

HSBC Bank Malaysia Berhad 198401015221 (127776-V)
NOTES TO THE FINANCIAL STATEMENTS (Cont’d) 3 Significant Accounting Policies (Cont’d)
(k) Financial instruments designated at fair value through profit or loss (Cont’d)
Designated financial assets are recognised when the Group and the Bank enter into contracts with counterparties, which is generally on trade date, and are normally derecognised when the rights to the cash flows expire or are transferred. Designated financial liabilities are recognised when the Group and the Bank enter into contracts with counterparties, which is generally on settlement date, and are normally derecognised when extinguished. Subsequent changes in fair values are recognised in the income statement in ‘Net income/(expenses) from financial liabilities designated at fair value’ except for the effect of changes in the liabilities' credit risk which is presented in OCI, unless that treatment would create or enlarge an accounting mismatch in profit or loss. Under the above criterion, the main classes of financial instruments designated by the Group and the Bank are:
Debt instruments for funding purposes that are designated to reduce an accounting mismatch (including Multi-currency sukuk programme)
The interest/profit and/or foreign exchange exposure on certain fixed rate debt securities issued has been matched with the interest/profit and/or foreign exchange exposure on certain swaps as part of a documented risk management strategy.
Structured liabilities designated at fair value through profit or loss
Structured liabilities of the Group and the Bank which are designated at fair value are recognised in the balance sheet in ‘Structured Liabilities Designated at Fair Value’. Please refer to Note 24.
(l) Impairment of amortised cost and FVOCI financial assets
Expected credit losses (ECL) are recognised for placements and advances to banks, loans, advances and financing to customers, non-trading reverse repurchase agreements, other financial assets held at amortised cost, debt instruments measured at fair value through other comprehensive income, debt instruments measured at amortised cost and certain loan commitments and financial guarantee contracts. At initial recognition, allowance (or provision in the case of some loan commitments and financial guarantees) is required for ECL resulting from default events that are possible within the next 12 months (or less, where the remaining life is less than 12 months) (12-month ECL). In the event of a significant increase in credit risk, allowance (or provision) is required for ECL resulting from all possible default events over the expected life of the financial instrument (lifetime ECL). Financial assets where 12-month ECL is recognised are considered to be ‘stage 1’; financial assets which are considered to have experienced a significant increase in credit risk are in ‘stage 2’; and financial assets for which there is objective evidence of impairment so are considered to be in default or otherwise credit-impaired are in ‘stage 3’. (i) Credit-impaired (stage 3)
The Group and the Bank determine that a financial instrument is credit-impaired and in stage 3 by considering relevant objective evidence, primarily whether:
Quantitative criteria - contractual payments of either principal or interest/profit are past due for more than 90 days.
Qualitative criteria - there are other indications that the borrower is unlikely to pay such as when a concession has
been granted to the borrower for economic or legal reasons relating to the borrower’s financial condition; and
- the loan, advance and financing is otherwise considered to be in default.
59

HSBC Bank Malaysia Berhad 198401015221 (127776-V)
NOTES TO THE FINANCIAL STATEMENTS (Cont’d) 3 Significant Accounting Policies (Cont’d)
(l) Impairment of amortised cost and FVOCI financial assets (Cont’d)
(i) Credit-impaired (stage 3) (Cont’d) If such unlikeliness to pay is not identified at an earlier stage, it is deemed to occur when an exposure is 90 days past due. Therefore the definitions of credit-impaired and default are aligned as far as possible so that stage 3 represents all loans, advances and financing which are considered defaulted or otherwise credit-impaired. Interest/financing income is recognised by applying the effective interest/profit rate to the amortised cost amount, i.e. gross carrying amount less ECL allowance. (ii) Write-off Financial assets (and the related impairment allowances) are normally written off, either partially or in full, when there is no realistic prospect of recovery. Where loans, advances and financing are secured, this is generally after receipt of any proceeds from the realisation of security. In circumstances where the net realisable value of any collateral has been determined and there is no reasonable expectation of further recovery, write-off may be earlier. (iii) Renegotiation
Loans, advances and financing are identified as renegotiated and classified as credit-impaired when the contractual payment terms are modified due to significant credit distress of the borrower. Renegotiated loans, advances and financing remain classified as credit-impaired until there is sufficient evidence to demonstrate a significant reduction in the risk of non-payment of future cash flows and retain the designation of renegotiated until maturity or derecognition. A loans, advances and financing that is renegotiated is derecognised if the existing agreement is cancelled and a new agreement is made on substantially different terms or if the terms of an existing agreement are modified such that the renegotiated loans, advances and financing is a substantially different financial instrument. The renegotiated loans, advances and financing may be reclassified as unimpaired when restructured payment is received and observed for a minimum period of 12 months. Other than originated credit-impaired loans, advances and financing, all other modified loans, advances and financing could be transferred out of stage 3 if they no longer exhibit any evidence of being credit-impaired and, in the case of renegotiated loans, advances and financing, there is sufficient evidence to demonstrate a significant reduction in the risk of non-payment of future cash flows, over the minimum observation period, and there are no other indicators of impairment. These loans, advances and financing could be transferred to stage 1 or 2 based on the mechanism as described below by comparing the risk of a default occurring at the reporting date (based on the modified contractual terms) and the risk of a default occurring at initial recognition (based on the original, unmodified contractual terms). Any amount written off as a result of the modification of contractual terms would not be reversed. For details of the risk management process on renegotiated loans, please refer to ‘Renegotiated loans and forbearance’ in Note 4(b)(iii).
60
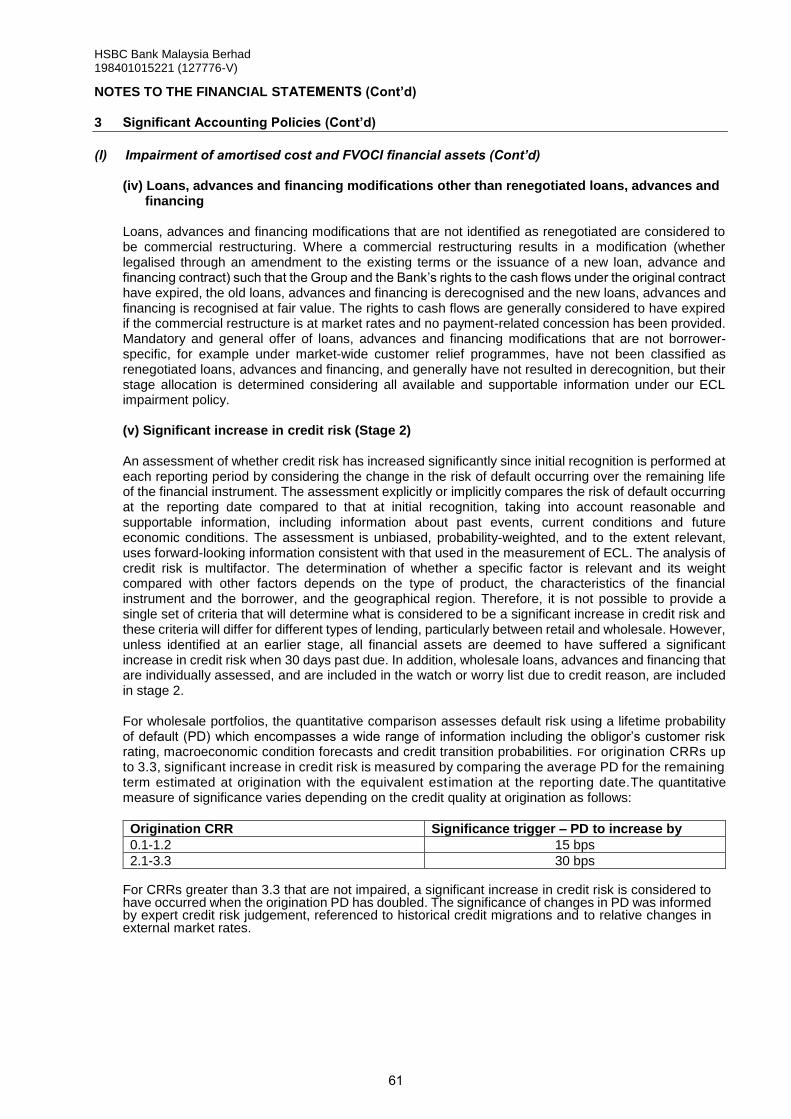
HSBC Bank Malaysia Berhad 198401015221 (127776-V)
NOTES TO THE FINANCIAL STATEMENTS (Cont’d) 3 Significant Accounting Policies (Cont’d)
(l) Impairment of amortised cost and FVOCI financial assets (Cont’d)
(iv) Loans, advances and financing modifications other than renegotiated loans, advances and
financing
Loans, advances and financing modifications that are not identified as renegotiated are considered to be commercial restructuring. Where a commercial restructuring results in a modification (whether legalised through an amendment to the existing terms or the issuance of a new loan, advance and financing contract) such that the Group and the Bank’s rights to the cash flows under the original contract have expired, the old loans, advances and financing is derecognised and the new loans, advances and financing is recognised at fair value. The rights to cash flows are generally considered to have expired if the commercial restructure is at market rates and no payment-related concession has been provided. Mandatory and general offer of loans, advances and financing modifications that are not borrower-specific, for example under market-wide customer relief programmes, have not been classified as renegotiated loans, advances and financing, and generally have not resulted in derecognition, but their stage allocation is determined considering all available and supportable information under our ECL impairment policy.
(v) Significant increase in credit risk (Stage 2) An assessment of whether credit risk has increased significantly since initial recognition is performed at each reporting period by considering the change in the risk of default occurring over the remaining life of the financial instrument. The assessment explicitly or implicitly compares the risk of default occurring at the reporting date compared to that at initial recognition, taking into account reasonable and supportable information, including information about past events, current conditions and future economic conditions. The assessment is unbiased, probability-weighted, and to the extent relevant, uses forward-looking information consistent with that used in the measurement of ECL. The analysis of credit risk is multifactor. The determination of whether a specific factor is relevant and its weight compared with other factors depends on the type of product, the characteristics of the financial instrument and the borrower, and the geographical region. Therefore, it is not possible to provide a single set of criteria that will determine what is considered to be a significant increase in credit risk and these criteria will differ for different types of lending, particularly between retail and wholesale. However, unless identified at an earlier stage, all financial assets are deemed to have suffered a significant increase in credit risk when 30 days past due. In addition, wholesale loans, advances and financing that are individually assessed, and are included in the watch or worry list due to credit reason, are included in stage 2. For wholesale portfolios, the quantitative comparison assesses default risk using a lifetime probability of default (PD) which encompasses a wide range of information including the obligor’s customer risk rating, macroeconomic condition forecasts and credit transition probabilities. For origination CRRs up to 3.3, significant increase in credit risk is measured by comparing the average PD for the remaining term estimated at origination with the equivalent estimation at the reporting date.The quantitative measure of significance varies depending on the credit quality at origination as follows:
Origination CRR Significance trigger – PD to increase by
0.1-1.2 15 bps
2.1-3.3 30 bps
For CRRs greater than 3.3 that are not impaired, a significant increase in credit risk is considered to have occurred when the origination PD has doubled. The significance of changes in PD was informed by expert credit risk judgement, referenced to historical credit migrations and to relative changes in external market rates.
61
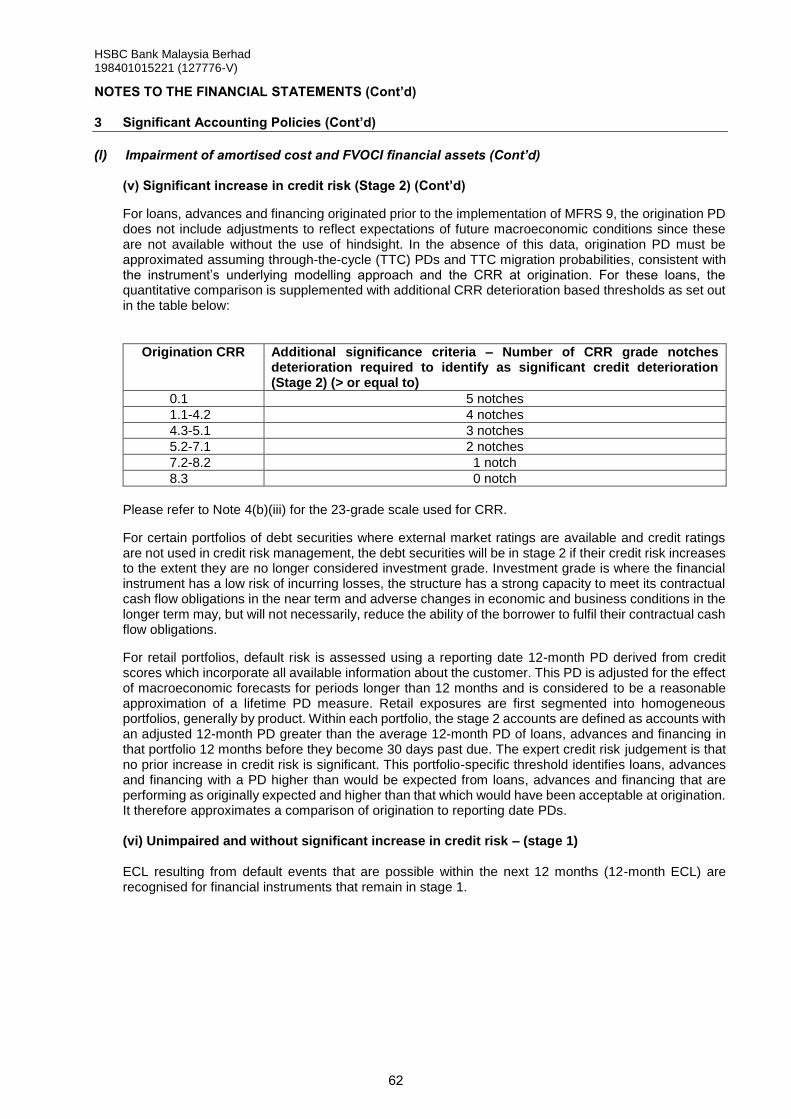
HSBC Bank Malaysia Berhad 198401015221 (127776-V)
NOTES TO THE FINANCIAL STATEMENTS (Cont’d) 3 Significant Accounting Policies (Cont’d)
(l) Impairment of amortised cost and FVOCI financial assets (Cont’d)
(v) Significant increase in credit risk (Stage 2) (Cont’d) For loans, advances and financing originated prior to the implementation of MFRS 9, the origination PD does not include adjustments to reflect expectations of future macroeconomic conditions since these are not available without the use of hindsight. In the absence of this data, origination PD must be approximated assuming through-the-cycle (TTC) PDs and TTC migration probabilities, consistent with the instrument’s underlying modelling approach and the CRR at origination. For these loans, the quantitative comparison is supplemented with additional CRR deterioration based thresholds as set out in the table below:
Origination CRR Additional significance criteria – Number of CRR grade notches deterioration required to identify as significant credit deterioration (Stage 2) (> or equal to)
0.1 5 notches
1.1-4.2 4 notches
4.3-5.1 3 notches
5.2-7.1 2 notches
7.2-8.2 1 notch
8.3 0 notch
Please refer to Note 4(b)(iii) for the 23-grade scale used for CRR. For certain portfolios of debt securities where external market ratings are available and credit ratings are not used in credit risk management, the debt securities will be in stage 2 if their credit risk increases to the extent they are no longer considered investment grade. Investment grade is where the financial instrument has a low risk of incurring losses, the structure has a strong capacity to meet its contractual cash flow obligations in the near term and adverse changes in economic and business conditions in the longer term may, but will not necessarily, reduce the ability of the borrower to fulfil their contractual cash flow obligations. For retail portfolios, default risk is assessed using a reporting date 12-month PD derived from credit scores which incorporate all available information about the customer. This PD is adjusted for the effect of macroeconomic forecasts for periods longer than 12 months and is considered to be a reasonable approximation of a lifetime PD measure. Retail exposures are first segmented into homogeneous portfolios, generally by product. Within each portfolio, the stage 2 accounts are defined as accounts with an adjusted 12-month PD greater than the average 12-month PD of loans, advances and financing in that portfolio 12 months before they become 30 days past due. The expert credit risk judgement is that no prior increase in credit risk is significant. This portfolio-specific threshold identifies loans, advances and financing with a PD higher than would be expected from loans, advances and financing that are performing as originally expected and higher than that which would have been acceptable at origination. It therefore approximates a comparison of origination to reporting date PDs. (vi) Unimpaired and without significant increase in credit risk – (stage 1) ECL resulting from default events that are possible within the next 12 months (12-month ECL) are recognised for financial instruments that remain in stage 1.
62
HSBC Bank Malaysia Berhad 198401015221 (127776-V)
NOTES TO THE FINANCIAL STATEMENTS (Cont’d) 3 Significant Accounting Policies (Cont’d)
(l) Impairment of amortised cost and FVOCI financial assets (Cont’d)
(vii) Movement between stages Financial assets can be transferred between the different categories depending on their relative increase in credit risk since initial recognition. Financial instruments are transferred out of stage 2 if their credit risk is no longer considered to be significantly increased since initial recognition based on the assessments described above. Except for renegotiated loans, advances and financing, financial instruments are transferred out of stage 3 when they no longer exhibit any evidence of credit impairment as described above. Renegotiated loans, advances and financing will continue to be in stage 3 until there is sufficient evidence to demonstrate a significant reduction in the risk of non-payment of future cash flows, observed over a minimum one-year period and there are no other indicators of impairment. For loans, advances and financing that are assessed for impairment on a portfolio basis, the evidence typically comprises a history of payment performance against the original or revised terms, as appropriate to the circumstances. For loans, advances and financing that are assessed for impairment on an individual basis, all available evidence is assessed on a case-by-case basis.
(viii) Measurement of ECL The assessment of credit risk, and the estimation of ECL, are unbiased and probability-weighted, and incorporate all available information which is relevant to the assessment including information about past events, current conditions and reasonable and supportable forecasts of future events and economic conditions at the reporting date. In addition, the estimation of ECL should take into account the time value of money. In general, the Group and the Bank calculate ECL using three main components, a probability of default, a loss given default (LGD) and the exposure at default (EAD). The 12-month ECL is calculated by multiplying the 12-month PD, LGD and EAD. Lifetime ECL is calculated using the lifetime PD instead. The 12-month and lifetime PDs represent the probability of default occurring over the next 12 months and the remaining maturity of the instrument respectively. The EAD represents the expected balance at default, taking into account the repayment of principal and interest from the balance sheet date to the default event together with any expected drawdowns of committed facilities. The LGD represents expected losses on the EAD given the event of default, taking into account, among other attributes, the mitigating effect of collateral value at the time it is expected to be realised and the time value of money. The ECL for wholesale stage 3 is determined on an individual basis using a discounted cash flow (DCF) methodology. The expected future cash flows are based on the credit risk officer’s estimates as at the reporting date, reflecting reasonable and supportable assumptions and projections of future recoveries and expected future receipts of interest/profit. Collateral is taken into account if it is likely that the recovery of the outstanding amount will include realisation of collateral based on the estimated fair value of collateral at the time of expected realisation, less costs for obtaining and selling the collateral. The cash flows are discounted at a reasonable approximation of the original effective interest rate. For significant cases, cash flows under four different scenarios are probability-weighted by reference to the economic scenarios applied more generally by the Group and the Bank and the judgement of the credit risk officer in relation to the likelihood of the workout strategy succeeding or receivership being required. For less significant cases, the effect of different economic scenarios and work-out strategies are approximated and applied as an adjustment to the most likely outcome.
63
HSBC Bank Malaysia Berhad 198401015221 (127776-V)
NOTES TO THE FINANCIAL STATEMENTS (Cont’d) 3 Significant Accounting Policies (Cont’d)
(l) Impairment of amortised cost and FVOCI financial assets (Cont’d)
(ix) Period over which ECL is measured Expected credit loss is measured from the initial recognition of the financial asset. The maximum period considered when measuring ECL (be it 12-month or lifetime ECL) is the maximum contractual period over which the Group and the Bank are exposed to credit risk. For wholesale overdrafts, credit risk management actions are taken no less frequently than on an annual basis and therefore this period is to the expected date of the next substantive credit review. The date of the substantive credit review also represents the initial recognition of the new facility. However, where the financial instrument includes both a drawn and undrawn commitment and the contractual ability to demand repayment and cancel the undrawn commitment does not serve to limit the Group and the Bank’s exposure to credit risk to the contractual notice period, the contractual period does not determine the maximum period considered. Instead, ECL is measured over the period the Group and the Bank remain exposed to credit risk that is not mitigated by credit risk management actions. This applies to retail overdrafts and credit cards, where the period is the average time taken for stage 2 exposures to default or close as performing accounts, determined on a portfolio basis and ranging from between two and six years. In addition, for these facilities it is not possible to identify the ECL on the loan, advance and financing commitment component separately from the financial asset component. As a result, the total ECL is recognised in the loss allowance for the financial asset unless the total ECL exceeds the gross carrying amount of the financial asset, in which case the ECL is recognised as a provision. (x) Forward-looking economic inputs The Group and the Bank apply multiple forward-looking global economic scenarios determined with reference to external forecast distributions representative of their view of forecast economic conditions. This approach is considered sufficient to calculate unbiased expected loss in most economic environments. Additional analysis may be necessary and may result in additional scenarios or adjustments, to reflect a range of possible economic outcomes sufficient for an unbiased estimate. The detailed methodology is disclosed in ‘Measurement uncertainty and sensitivity analysis of ECL estimates’ in Note 4(b)(v).
(m) Property and equipment
(i) Land and buildings
Land and buildings held for own use, comprising freehold land and buildings, and leasehold land and buildings including capital work-in-progress are carried at their revalued amount, being the fair value at the date of the revaluation less any subsequent accumulated depreciation and impairment losses. Revaluation are performed annually by independent professional qualified valuers, on a market basis, with sufficient regularity to ensure that the net carrying amount does not differ materially from the fair value. Increases in the carrying amounts arising on revaluation of land and buildings are recognised, net of tax, in other comprehensive income and accumulated in reserves in shareholders’ equity. To the extent that the increase reverses a decrease previously recognised in profit or loss, the increase is first recognised in profit or loss. Decreases that reverse previous increases of the same asset are first recognised in other comprehensive income to the extent of the remaining surplus attributable to the asset; all other decreases are charged to profit or loss. Each financial year, the difference between depreciation based on the revalued carrying amount of the asset charged to profit or loss and depreciation based on the asset’s original cost, net of tax, is reclassified from revaluation reserve to retained earnings. Any accumulated depreciation at the date of revaluation is eliminated against the gross carrying amount of the asset. The gains or losses on disposal of land and buildings are determined by comparing the proceeds from disposal with the carrying amount of the land and buildings and is recognised net within “other operating income” in profit or loss. When revalued assets are sold, the amounts included in the revaluation surplus reserve are transferred to retained earnings.
64
HSBC Bank Malaysia Berhad 198401015221 (127776-V)
NOTES TO THE FINANCIAL STATEMENTS (Cont’d)
3 Significant Accounting Policies (Cont’d)
(m) Property and equipment (Cont’d)
(i) Land and buildings (Cont’d) Freehold land and capital work-in-progress related to land and buildings are not depreciated. Depreciation of capital work-in-progress commences when the assets are ready for their intended use. Depreciation of all other land and buildings is calculated to write off the cost of the assets on a straight line basis over the estimated useful lives of the assets concerned as follows: Leasehold land Over the lease term Buildings on freehold land 50 years Buildings on leasehold land Over the lease term Improvements on freehold building 10 years Improvements on leasehold building The shorter of 10 years and the lease term Land and buildings are subject to an impairment review if there are events or changes in circumstances which indicate that the carrying amount may not be recoverable. The fair value is within level 2 of the fair value hierarchy. The fair value has been derived using the sales comparison approach.
(ii) Equipment Equipment, fixtures and fittings, and motor vehicles are stated at cost less accumulated depreciation and any accumulated impairment losses. The related capital work-in-progress is stated at cost and is not depreciated. Depreciation of capital work-in-progress commences when the assets are ready for their intended use. Depreciation of all other equipment is calculated on a straight-line basis to write off the assets over their useful lives as follows: Office equipment, fixtures and fittings 5 to 7 years Computer equipment 4 to 5 years Motor vehicles 5 years
During the year, the Group and the Bank revised the minimum equipment capitalisation estimate amount. Additions to equipment costing RM2,000 (2019: RM1,000) and below are expensed to profit or loss in the month of purchase. For those assets costing more than RM2,000 (2019: RM1,000), it will be capitalised and depreciated accordingly. The change in estimate is immaterial to the Group and the Bank. The gains or losses on disposal of an item of equipment is determined by comparing the proceeds from disposal with the carrying amount of the equipment and is recognised net within “other operating income” in the profit or loss. Equipment is subject to review for impairment if there are events or changes in circumstances which indicate that the carrying amount may not be recoverable.
(n) Leases
Leases are recognised as a ROU asset and a corresponding lease liability at the date at which the leased asset is made available for use. ROU asset is presented within “Other Assets” in the statement of financial position, and is depreciated, over the shorter of the ROU asset’s useful economic life and the lease term, on a straight-line basis. Lease liability is represented in the “Other Liabilities” in the statement of financial position. Lease payments are allocated between the liability and finance cost. The finance cost is charged to the statement of profit or loss as interest expense over the lease term so as to produce a constant period rate of interest on the remaining balance of the liability.
65
HSBC Bank Malaysia Berhad 198401015221 (127776-V)
NOTES TO THE FINANCIAL STATEMENTS (Cont’d) 3 Significant Accounting Policies (Cont’d)
(n) Leases (Cont’d)
In determining the lease term, all facts and circumstances that create an economic incentive to exercise an extension or termination option are considered. Where the discount rate implicit in the lease is unavailable, the incremental borrowing rate is used. This is the rate that the Group and the Bank would have to pay to borrow the funds necessary to obtain an asset of a similar value in a similar economic environment at similar terms and conditions. The Group and the Bank have elected not to recognise ROU assets and lease liabilities for short-term leases that have lease terms of 12 months or less and leases of low value leases. Lease payments relating to these leases are expensed to the statement of profit or loss on a straight-line basis over the lease term.
(o) Intangible assets
Intangible assets of the Group and the Bank represent computer software that have a finite useful life, and are stated at cost less accumulated amortisation and any accumulated impairment losses. Computer software includes both purchased and internally generated software. The cost of internally generated software comprises all directly attributable costs necessary to create, produce and prepare the software to be capable of operating in the manner intended by management. Costs incurred in the ongoing maintenance of software are expensed immediately as incurred. Amortisation of intangible assets is calculated to write off the cost of the intangible assets on a straight line basis over the estimated useful lives of 3 to 5 years. Intangible assets are subject to impairment review if there are events or changes in circumstances which indicate that the carrying amount may not be recoverable.
(p) Bills payable
Bills payable represents bills payable to various beneficiaries arising from the sale of bank drafts, demand drafts, cashier’s orders and certified cheques.
(q) Provisions, contingent liabilities and financial guarantees contracts
Provisions are recognised when it is probable that an outflow of economic benefits will be required to settle a present legal or constructive obligation that has arisen as a result of past events and for which a reliable estimate can be made.
Contingent liabilities, which include certain guarantees and letters of credit pledged as collateral security, and contingent liabilities related to legal proceedings or regulatory matters, are not recognised in the financial statements but are disclosed unless the probability of settlement is remote. Liabilities under financial guarantees contracts which are not classified as insurance contracts are recorded initially at their fair value, which is generally the fee received or present value of the fee receivable. Financial guarantees contracts are subsequently measured at the higher of the amount determined in accordance with the expected credit loss model under MFRS 9 ‘Financial instruments’ and the amount initially recognised less cumulative amount of income recognised in accordance with the principles of MFRS 15 ‘Revenue from Contracts with Customers’, where appropriate.
66

HSBC Bank Malaysia Berhad 198401015221 (127776-V)
NOTES TO THE FINANCIAL STATEMENTS (Cont’d) 3 Significant Accounting Policies (Cont’d)
(r) Employee benefits
(i) Short term employee benefits
Short term employee benefits obligations in respect of salaries, annual bonuses, paid annual leave and sick leave are measured at the amounts expected to be paid when the liabilities are settled and are expensed as the related service is provided.
A liability is recognised for the amount expected to be paid under short term cash bonus or profit-sharing
plans if the Group and the Bank have a present legal or constructive obligation to pay this amount as a result of past service provided by the employee and the obligation can be estimated reliably.
(ii) Defined contribution plan
As required by law, companies in Malaysia make contributions to the Employees Provident Fund (EPF). Such contributions are recognised as an expense in the statement of profit or loss.
(iii) Termination benefits Termination benefits where applicable are payable when employment is terminated by the Group or the Bank for mutual or voluntary separation. The Group and the Bank recognise termination benefits when the Group and the Bank recognise costs for a restructuring that is within the scope of MFRS 137 ‘Provisions, Contingent Liabilities and Contingent Assets’ and involves the payment of termination benefits. In the case of voluntary separation, the termination benefits are estimated based on the number of employees expected to apply and be accepted for the separation.
(s) Share based payments
The Bank’s ultimate holding company operates a number of equity-settled share based payment arrangements with the Bank’s employees as compensation for services provided by the employees. Equity-settled share based payment arrangements entitle employees to receive equity instruments of the ultimate holding company, HSBC Holdings plc.
The cost of share-based payment arrangements with employees is measured by reference to the fair value of equity instruments on the date they are granted, and recognised as an expense on a straight-line basis over the vesting period, with a corresponding credit to the equity. The credit to equity is treated as capital contribution as the ultimate holding company is compensating the Bank’s employees with no expense to the Bank. The vesting period is the period during which all the specified vesting conditions of a share-based payment arrangement are to be satisfied. The fair value of equity instruments that are made available immediately, with no vesting period attached to the award, are expensed immediately.
Fair value is determined by using market prices or appropriate valuation models, taking into account the terms and conditions upon which the equity instruments were granted. Vesting conditions include service conditions and performance conditions; any other features of a share-based payment arrangement are non-vesting conditions. Market performance conditions and non-vesting conditions are taken into account when estimating the fair value of equity instruments at the date of grant, so that an award is treated as vesting irrespective of whether the market performance condition or non-vesting condition is satisfied, provided all other vesting conditions are satisfied. Vesting conditions, other than market performance conditions, are not taken into account in the initial estimate of the fair value at the grant date. They are taken into account by adjusting the number of equity instruments included in the measurement of the transaction, so that the amount recognised for services received as consideration for the equity instruments granted shall be based on the number of equity instruments that eventually vest. On a cumulative basis, no expense is recognised for equity instruments that do not vest because of a failure to satisfy non-market performance or service conditions.
67
HSBC Bank Malaysia Berhad 198401015221 (127776-V)
NOTES TO THE FINANCIAL STATEMENTS (Cont’d)
3 Significant Accounting Policies (Cont’d)
(s) Share based payments (Cont’d)
Where an award has been modified, as a minimum, the expense of the original award continues to be recognised as if it had not been modified. Where the effect of a modification is to increase the fair value of an award or increase the number of equity instruments, the incremental fair value of the award or incremental fair value of the extra equity instruments is recognised in addition to the expense of the original grant, measured at the date of modification, over the modified vesting period. A cancellation that occurs during the vesting period is treated as an acceleration of vesting, and recognised immediately for the amount that would otherwise have been recognised for services over the remaining vesting period. Where the ultimate holding company recharges the Bank for the equity instruments granted, the recharge is recognised over the vesting period.
(t) Share capital and other equity instruments
Ordinary shares and other equity instruments with discretionary coupons are classified as equity according to the substance of the contractual arrangement of the particular instrument. Dividend distributions to holders of an equity instrument is recognised directly in equity.
(u) Earnings per share
The Group and the Bank present basic earnings per share (EPS) data for its ordinary shares. Basic EPS is calculated by dividing the profit or loss attributable to the ordinary shareholder of the Group and the Bank by the weighted average number of shares outstanding during the year.
68
HSBC Bank Malaysia Berhad 198401015221 (127776-V)
NOTES TO THE FINANCIAL STATEMENTS (Cont’d)
4 Risk
(a) Introduction and overview
(i) Risk appetite
The Group and the Bank recognise the importance of a strong risk culture, which refers to shared
attitudes, values and norms that shape behaviours related to risk awareness, risk taking and risk
management. All our people are responsible for the management of risk, with the ultimate
accountability residing with the Board.
We seek to build our business for the long term by balancing social, environmental and economic considerations in the decisions we make. Our strategic priorities are underpinned by our endeavour to operate in a sustainable way. This helps us to carry out our social responsibility and manage the risk profile of the business. We are committed to managing and mitigating climate related risks, both physical and transition, and will continue to incorporate this into how we manage and oversee risks internally and with our customers. The following principles guide our overarching risk appetite for risk and determine how our businesses
and risks are managed.
Financial position
Aim to maintain a strong capital position, defined by regulatory and internal capital ratios.
Carry out liquidity and funding management for each operating entity, on a stand-alone basis.
Operating model
Seek to generate returns in line with a conservative risk appetite and strong risk management
capability.
Aim to deliver sustainable earnings and consistent returns for shareholders.
Business practice
Zero tolerance for any of the employees to knowingly engage in any business, activity or
association where foreseeable reputational risk or damage has not been considered and/or
mitigated.
No appetite for deliberately or knowingly causing detriment to consumers, or incurring a breach
of the letter or spirit of regulatory requirements.
No appetite for inappropriate market conduct by a member of staff or by any group business.
Enterprise-wide application
The Group and the Bank’s risk appetite encapsulate considerations of financial and non-financial risks.
They are applied across HSBC Group entities.
Financial risk is defined as the risk of a financial loss as a result of business activities. These types of
risks are actively taken to maximise shareholder value and profits. Non-financial risk is defined as the
risk to achieving the Group and the Bank’s strategy or objectives as a result of inadequate or failed
internal processes, people and systems or from external events.
HSBC Group’s risk appetite is expressed in both quantitative and qualitative terms and applied at the
global business level and to material operating entities such as the Group and the Bank. It continues
to evolve and expand its scope as part of its regular review process.
69
HSBC Bank Malaysia Berhad 198401015221 (127776-V)
NOTES TO THE FINANCIAL STATEMENTS (Cont’d)
4 Risk (Cont’d)
(a) Introduction and overview (Cont’d)
(i) Risk appetite (Cont’d) Enterprise-wide application (Cont’d)
The Board reviews and approves the Group and the Bank’s risk appetite to make sure it remains fit for
purpose. The risk appetite is considered, developed and enhanced through:
an alignment with our strategy, purpose, values and customer needs;
trends highlighted in other group risk reports;
communication with risk stewards on the developing risk landscape;
strength of our capital, liquidity and balance sheet;
compliance with applicable laws and regulations;
effectiveness of the applicable control environment to mitigate risk, informed by risk ratings from
risk control assessments;
functionality, capacity and resilience of available systems to manage risk; and
the level of available staff with the required competencies to manage risks.
The Group and the Bank formally articulate risk appetite through the risk appetite statement (RAS),
which is approved by the Board on the recommendation of the Risk Committee (RC). Setting out risk
appetite helps to make sure that planned business activities provide an appropriate balance of return
for the risk taken, and that suitable level of risk is agreed for the Group and the Bank. In this way, risk
appetite informs financial planning process and helps senior management to allocate capital to
business activities, services and products.
The RAS consists of qualitative statements and quantitative metrics, covering financial and non-
financial risks. It is fundamental to the development of business line strategies, strategic and business
planning, and senior management balanced scorecards.
The performance against the RAS is reported to the Risk Management Meeting (RMM) on a monthly
basis so that any actual performance that falls outside the approved risk appetite is discussed and
appropriate mitigating actions are determined. This reporting allows risks to be promptly identified and
mitigated, and informs risk-adjusted remuneration to drive a strong risk culture. All RASs and business
activities are guided and underpinned by qualitative principles and or quantitative metrics.
(ii) Risk management
The Group and the Bank recognise that the primary role of risk management is to protect the business, customers, colleagues, shareholders and the communities that we serve, while ensuring we are able to support our strategy and provide sustainable growth. We are focused upon implementation of our business strategy, as part of which we are carrying out a major change programme, and it is critical that we ensure we use active risk management to manage the execution risks. Periodic risk assessments will also be performed, including strategies to ensure retention of key personnel for our continued safe operation. A comprehensive risk management framework is used across the organisation and across all risk types, underpinned by the Group and the Bank’s risk culture and values. This outlines the key principles, policies and practices that is employed in managing material risks, both financial and non-financial. The framework fosters continual monitoring, promotes risk awareness and encourages sound operational and strategic decision making. It also ensures a consistent approach to identifying, assessing, managing and reporting the risks we accept and incur in our activities.
70
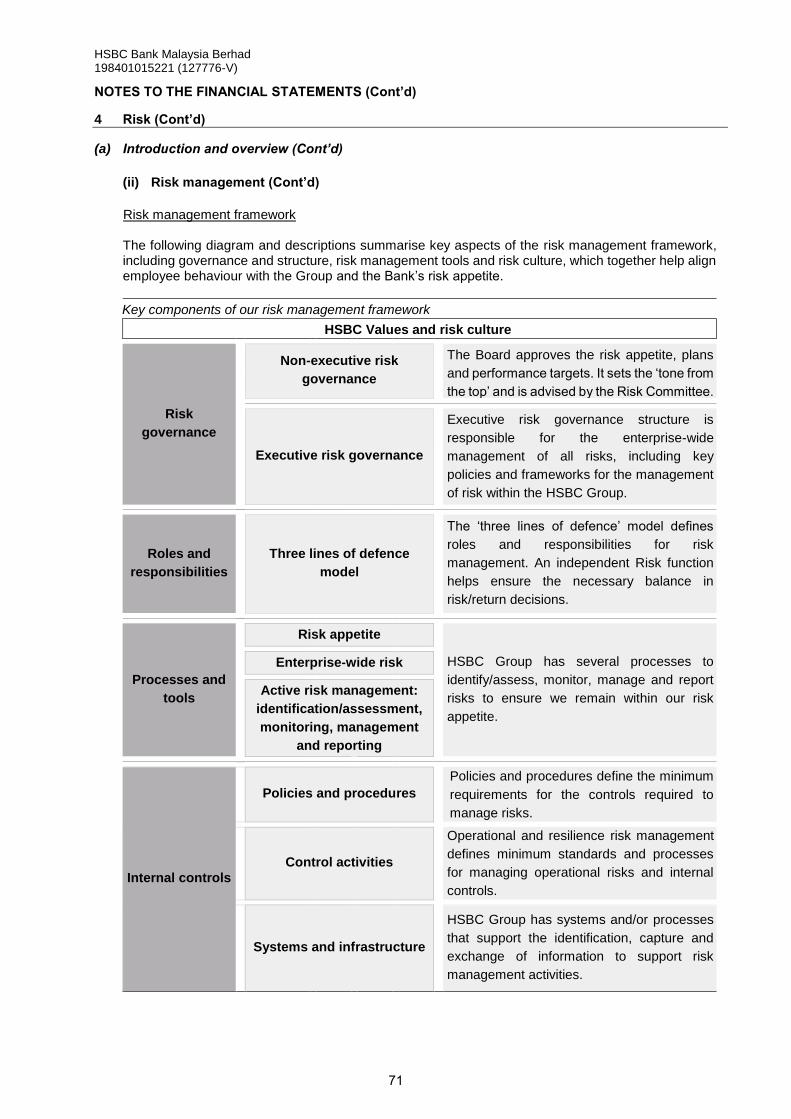
HSBC Bank Malaysia Berhad 198401015221 (127776-V)
NOTES TO THE FINANCIAL STATEMENTS (Cont’d)
4 Risk (Cont’d)
(a) Introduction and overview (Cont’d)
(ii) Risk management (Cont’d)
Risk management framework
The following diagram and descriptions summarise key aspects of the risk management framework, including governance and structure, risk management tools and risk culture, which together help align employee behaviour with the Group and the Bank’s risk appetite.
Key components of our risk management framework
HSBC Values and risk culture
Risk
governance
Non-executive risk
governance
The Board approves the risk appetite, plans
and performance targets. It sets the ‘tone from
the top’ and is advised by the Risk Committee.
Executive risk governance
Executive risk governance structure is
responsible for the enterprise-wide
management of all risks, including key
policies and frameworks for the management
of risk within the HSBC Group.
Roles and
responsibilities
Three lines of defence
model
The ‘three lines of defence’ model defines
roles and responsibilities for risk
management. An independent Risk function
helps ensure the necessary balance in
risk/return decisions.
Processes and
tools
Risk appetite
HSBC Group has several processes to
identify/assess, monitor, manage and report
risks to ensure we remain within our risk
appetite.
Enterprise-wide risk
management tools
Active risk management:
identification/assessment,
monitoring, management
and reporting
Internal controls
Policies and procedures
Policies and procedures define the minimum
requirements for the controls required to
manage risks.
Control activities
Operational and resilience risk management
defines minimum standards and processes
for managing operational risks and internal
controls.
Systems and infrastructure
HSBC Group has systems and/or processes
that support the identification, capture and
exchange of information to support risk
management activities.
71
HSBC Bank Malaysia Berhad 198401015221 (127776-V)
NOTES TO THE FINANCIAL STATEMENTS (Cont’d)
4 Risk (Cont’d)
(a) Introduction and overview (Cont’d)
(ii) Risk management (Cont’d)
Risk governance The Board has ultimate responsibility for the effective management of risk and approves our risk appetite. It is advised on risk-related matters by the Risk Committee. The Chief Risk Officer, supported by the RMM, holds executive accountability for the ongoing monitoring, assessment and management of the risk environment and the effectiveness of the risk management framework. The management of regulatory compliance risk, alongside financial crime risk resides with the Chief Compliance Officer. Oversight is maintained by the Chief Risk Officer in line with his enterprise risk oversight responsibilities through the RMM. The day-to-day responsibility for risk management is delegated to senior managers with individual accountability for decision making. All our people have a role to play in risk management. These roles are defined using the three lines of defence model, which takes into account our business and functional structures. A defined executive risk governance structure is used to help ensure there is appropriate oversight and accountability of risk, which facilitates reporting and escalation to the RMM. Responsibilities for risk management All our people are responsible for identifying and managing risk within the scope of their role as part of the three lines of defence model. Three lines of defence To create a robust control environment to manage risks, we use an activity-based three lines of defence model. This model delineates management accountabilities and responsibilities for risk management and the control environment. The model underpins our approach to risk management by clarifying responsibility, and encouraging collaboration, as well as enabling efficient coordination of risk and control activities. The three lines of defence are summarised below:
The first line of defence owns the risks and is responsible for identifying, recording, reporting and managing them in line with risk appetite, and ensuring that the right controls and assessments are in place to mitigate them.
The second line of defence challenges the first line of defence on effective risk management, and provides advice and guidance in relation to the risk.
The third line of defence is the Internal Audit function, which provides independent assurance that risk management approach and processes are designed and operating effectively
Risk function The Risk function, headed by the Chief Risk Officer, is responsible for the risk management framework. This responsibility includes establishing and monitoring of risk profiles, and forward-looking risk identification and management. The Risk function is made up of sub-functions covering all risks to our business and forms part of the second line of defence. It is independent from the global businesses, including sales and trading functions, to provide challenge, appropriate oversight and balance in risk/return decisions.
72
HSBC Bank Malaysia Berhad 198401015221 (127776-V)
NOTES TO THE FINANCIAL STATEMENTS (Cont’d)
4 Risk (Cont’d)
(a) Introduction and overview (Cont’d)
(ii) Risk management (Cont’d)
Responsibilities for risk management (Cont’d) Risk function (Cont’d) Responsibility for minimising both financial and non-financial risk lies with our people. They are required to manage the risks of the business and operational activities for which they are responsible. Adequate oversight of risks is maintained through various specialist Risk Stewards, as well as the collective accountability held by Chief Risk Officer. Non-financial risk includes some of the most material risks the Group and the Bank face, such as cyber-attacks, poor customer outcomes and the loss of data. Actively managing non-financial risk is crucial to serving our customers effectively and having a positive impact on society. During 2020, we continued to strengthen the control environment and our approach to the management of non-financial risk, as broadly set out in our risk management. The management of non-financial risk focuses on governance and risk appetite, and providing a single view of the non-financial risks that matter the most, and associated controls. It incorporates a risk management system designed to enable the active management of non-financial risk. Our ongoing focus is on simplifying our approach to non-financial risk management, while driving more effective oversight and better end-to-end identification and management of non-financial risks. This is overseen by the Operational and Resilience Risk function, headed by the HSBC Group Head of Operational and Resilience Risk. Stress testing The Group and the Bank operate a wide-ranging stress testing programme that supports risk management and capital planning. Stress testing provides management with key insights into the impact of severely adverse events, and provides confidence to regulators on financial stability. As well as undertaking regulatory-driven stress tests, we conduct our own internal stress tests, in order to understand the nature and level of all material risks, quantify the impact of such risks and develop plausible business as usual mitigating actions. The stress testing programme assesses capital and liquidity strength through a rigorous examination of resilience to external shocks from a range of stress scenarios. They include potential adverse macroeconomic, geopolitical and operational risk events, and other potential events that are specific to the Group and the Bank. Stress testing analysis helps management understand the nature and extent of vulnerabilities to which the Group and the Bank are exposed and informs decisions about preferred capital or liquidity levels.
Separately, reverse stress tests are conducted at the Group and the Bank and, where required, subsidiary entity level in order to understand which potential extreme conditions would make the business model non-viable. Reverse stress testing identifies potential stresses and vulnerabilities which the Group and the Bank or its subsidiary entity might face, and helps inform early warning triggers, management actions and contingency plans designed to mitigate risks.
Key developments in 2020
During the year, we have actively managed the risks resulting from the COVID-19 pandemic and its impacts on our customers and operations during 2020, as well as other key risks described in this section. In addition, we enhanced our risk management in the following areas:
In January 2020, we simplified our approach and articulation of risk management through the combination of our enterprise risk management framework and our operational risk management framework.
73
HSBC Bank Malaysia Berhad 198401015221 (127776-V)
NOTES TO THE FINANCIAL STATEMENTS (Cont’d)
4 Risk (Cont’d)
(a) Introduction and overview (Cont’d)
(ii) Risk management (Cont’d)
Responsibilities for risk management (Cont’d)
Key developments in 2020 (Cont’d)
The global model risk policy and associated standards were revised to improve how we manage model risk and meet enhanced external expectations.
We continued to focus on simplifying our approach to non-financial risk management. We are driving more effective oversight and better end-to-end identification and management of non-financial risks.
We continue to support the business and our customers throughout the pandemic, while continuing to manage financial crime risk. We continued to invest in both advanced analytics and artificial intelligence, which remain key components of our next generation of tools to fight financial crime. From 2021, we will combine our RMM and Financial Crime Risk Management Meetings to ensure a holistic view of all risks.
In line with the increasing threat landscape that the industry faces within non-financial risk, we formed a new Operational & Resilience Risk combined sub-function. The sub-function provides robust first line of defence oversight and risk steward oversight, supported by clear plans and evidenced by effective and timely independent challenge. The sub-function challenges the status quo ensuring that the first line of defence are focused firmly on priority tasks. By bringing the two teams together, we expect to benefit from improved stewardship, better risk management capabilities and better outcomes for our customers.
Top and emerging risks management
The Group and the Bank use a top and emerging risks process to provide a forward looking view of issues that have the potential to threaten the execution of strategy or operations over the medium to long term. The Group and the Bank proactively assess the internal and external risk environment, as well as review the themes identified across regions and global businesses, for any risks that may require global escalation, updating top and emerging risks as necessary. The Group and the Bank define a ‘top risk’ as a thematic issue that may form and crystallise within one year, and which has the potential to materially affect the Group and the Bank’s financial results, reputation or business model. It may arise across any combination of risk types, countries or global businesses. The impact may be well understood by senior management and some mitigating actions may already be in place. Stress tests of varying granularity may already have been carried out to assess the impact. An ‘emerging risk’ is defined as a thematic issue with large unknown components that may form and crystallise beyond a one-year time horizon. If it were to materialise, it could have a material effect on a combination of our long term strategy, profitability and reputation. Existing mitigation action plans are likely to be minimal, reflecting the uncertain nature of these risks at this stage. Some high-level analysis and/or stress testing may have been carried out to assess the potential impact. The Group and the Bank’s current key top and emerging risks are as follows:
COVID-19 Outbreak
Geopolitical risk
System resilience, cyber threat and unauthorised access to systems
Climate-related risk
Third Party Risk Management
People risk
74
HSBC Bank Malaysia Berhad 198401015221 (127776-V)
NOTES TO THE FINANCIAL STATEMENTS (Cont’d)
4 Risk (Cont’d)
(a) Introduction and overview (Cont’d)
(ii) Risk management (Cont’d)
Top and emerging risks management (Cont’d) Area of Special Interest - Risks related to COVID-19 The COVID-19 pandemic and its effects on the global economy have impacted our customers and our performance, and the future effects of the pandemic are uncertain. The outbreak necessitated governments to respond at unprecedented levels to protect public health, local economies and livelihoods. It has affected regions at different times and varying degrees as it has developed. The varying government measures in response have added challenges, given the rapid pace of change and significant operational demands. The speed at which countries and territories will be able to unwind their lockdown measures and return to pre-COVID-19 economic levels will vary based on the levels of infection, local political decisions and access and ability to roll out vaccines. There remains a risk of subsequent waves of infection. Government restrictions imposed around the world to limit the spread of COVID-19 resulted in a sharp contraction in global economic activity during 2020. At the same time, governments also took steps designed to soften the extent of the damage to investment, trade and labour markets. Economic activity is expected to gradually recover, but renewed lockdowns in several economies including Malaysia will curtail or delay this recovery.
There is a material risk of a renewed drop in economic activity. The economic fallout from COVID-19 risks increasing inequality across markets that have already suffered from social unrest. This will leave the burden on governments and central banks to maintain or increase fiscal and monetary stimulus. After financial markets suffered a sharp fall in the early phases of the spread of COVID-19, they rebounded but still remain volatile. Depending on the degree to which global economic growth suffers permanent losses, financial asset prices may suffer a further sharp fall. The Group and the Bank have implemented BNM-led measures to support our retail and small & medium enterprises (SMEs) through these challenging times. The rapid introduction and varying nature of the government support schemes, as well as rising customer expectations, have also led to risks, due to large scale implementation within a short period of time. Such risks include operational risks, reputational risk and fraud risk. These risks are likely to heighten further once the new schemes are rolled out as a result of unavailability of system readiness, insufficient testing at times and manual workarounds introduced during the challenging times. The COVID-19 outbreak has also led to a weakening in GDP, a key input used for calculating ECL, and there remains the risk of more adverse economic scenarios given its ongoing impact. The impact will vary by sectors of the economy. The impact of the outbreak on the long-term prospects of businesses in these sectors is uncertain and may lead to significant ECL charges on specific exposures. In addition, in times of crisis, fraudulent activity is often more prevalent, leading to potentially significant ECL charges.
The significant changes in economic and market drivers, customer behaviours and government actions caused by COVID-19 have also impacted the performance of financial models. These include retail and wholesale credit models, as well as capital models, traded risk models and models used in the asset/ liability management process. This has required more ongoing monitoring and more frequent testing across the Group and the Bank, particularly for credit models. It also has resulted in the use of compensating controls as underlays/overlays, on top of model outputs, to provide a more appropriate assessment. By their nature, such compensating controls require a significant degree of management judgement and assumptions to be applied, and there is a risk that future actual results/performance may differ from such judgements and assumptions.
75

HSBC Bank Malaysia Berhad 198401015221 (127776-V)
NOTES TO THE FINANCIAL STATEMENTS (Cont’d)
4 Risk (Cont’d)
(a) Introduction and overview (Cont’d)
(ii) Risk management (Cont’d)
Top and emerging risks management (Cont’d) Area of Special Interest - Risks related to COVID-19 (Cont’d) The performance and usage of models over the 12 months will continue to be impacted by the consequences of the COVID-19 outbreak. It is too early in the current situation to be certain of the magnitude of change required for models but the models may need to be recalibrated. Separately, the Group and the Bank have successfully implemented business continuity responses and managed to maintain majority of our service level agreements. The Group and the Bank have not experienced any major impacts to the supply chain from our third-party service providers due to COVID-19. The risk of damage or theft to our physical assets or criminal injury to our employees remains unchanged and no significant incidents have impacted our buildings or staff. There remain significant uncertainties in assessing the duration of the COVID-19 outbreak and its impact. The actions taken by our Government and BNM provide an indication of the potential severity of the downturn and post-recovery environment, which from a commercial, regulatory and risk perspective could be significantly different to past crises. A prolonged period of significantly reduced economic activity as a result of the impact of the outbreak would have a materially adverse effect on our financial condition, results of operations, prospects, liquidity, capital position and credit ratings in Malaysia. This would, in turn, have an impact on our ability to meet our financial targets. Nevertheless, we will continue to monitor the situation closely and will undertake any additional mitigating action where necessary. (iii) Material banking risks
All of the Group and the Bank’s activities involve analysis, evaluation, acceptance and management of some degree of risk or combination of risks. The Group and the Bank have exposure to the following material risks from financial instruments:
credit risk
liquidity and funding risk
market risks (includes foreign exchange, interest/profit rate and basis risk)
resilience risk
regulatory compliance risk
financial crime and fraud risk
model risk
This note presents information about the Group and the Bank’s exposure to each of the above risks as well as the objectives, policies and processes for measuring and managing those risks.
(b) Credit risk management
(i) Overview Credit risk is the risk of financial loss if a customer or counterparty fails to meet an obligation under a contract. Credit risk arises principally from direct lending, trade finance and leasing business, but also from other products, such as guarantees and credit derivatives.
76
HSBC Bank Malaysia Berhad 198401015221 (127776-V)
NOTES TO THE FINANCIAL STATEMENTS (Cont’d)
4 Risk (Cont’d)
(b) Credit risk management (Cont’d)
(ii) Credit risk management framework Key developments in 2020 There were no material changes to the policies and practices for the management of credit risk in 2020 except for those that are specially-mentioned in relation to COVID-19. We continued to apply the requirements of MFRS 9 ‘Financial Instruments’ within Credit Risk. Governance and structure The Group and the Bank have established credit risk management and related MFRS 9 processes. The Group and the Bank continue to actively assess the impact of economic developments in key markets on specific customers, customer segments or portfolios. As credit conditions change, the Group and the Bank take mitigating action, including the revision of risk appetites or limits and tenors, as appropriate. In addition, the Group and the Bank continue to evaluate the terms under which credit facilities are provided within the context of individual customer requirements, the quality of the relationship, regulatory requirements, market practices and the Group and the Bank’s market position. (iii) Credit risk sub-function
Credit approval authorities are delegated by the Board to the Chief Executive (CEO) together with the authority to sub-delegate them. The Credit Risk sub-function in Global Risk at HSBC Group is responsible for the key policies and processes for managing credit risk, which include formulating credit policies and risk rating frameworks, guiding the Group and the Bank’s appetite for credit risk exposures, undertaking independent reviews and objective assessment of credit risk, and monitoring performance and management of portfolios. The principal objectives of credit risk management are: - to maintain a strong culture of responsible lending, and robust risk policies and control frameworks; - to both partner and challenge businesses in defining, implementing and continually re-evaluating risk
appetite under actual and scenario conditions; and - to ensure there is independent, expert scrutiny of credit risks, their costs and their mitigation.
Key risk management processes MFRS 9 ‘Financial Instruments’ process The MFRS 9 process comprises three main areas: modelling and data; implementation; and governance.
Modelling and data
To address the MFRS 9 requirements the Group and the Bank have established modelling and data processes in various geographies which are subject to internal model risk governance including independent review of significant model developments.
Implementation
A centralised impairment engine performs the expected credit loss (ECL) calculation using data, which is subject to a number of validation checks and enhancements, from a variety of client, finance and risk systems. Where possible, these checks and processes are performed in a globally consistent and centralised manner.
77

HSBC Bank Malaysia Berhad 198401015221 (127776-V)
NOTES TO THE FINANCIAL STATEMENTS (Cont’d)
4 Risk (Cont’d)
(b) Credit risk management (Cont’d)
(iii) Credit risk sub-function (Cont’d)
Key risk management processes (Cont’d) MFRS 9 ‘Financial Instruments’ process (Cont’d)
Governance
Management review forums are established both in regions and sites in order to review and approve the impairment results. The management review forums have representatives from Credit Risk and Finance. The site and regional approvals are reported up to the global business impairment committee for final approval of the Group and the Bank’s ECL for the period. Required members of the forum at site level are the Chief Risk Officer, heads of Wholesale Credit, Market Risk, and Wealth and Personal Banking Risk, as well as the Chief Financial Officer and the Financial Controller.
Concentration of exposure Concentrations of credit risk arise when a number of counterparties or exposures have comparable economic characteristics, or such counterparties are engaged in similar activities or operate in the same geographical areas or industry sectors so that their collective ability to meet contractual obligations is uniformly affected by changes in economic, political or other conditions. We use a number of controls and measures to minimise undue concentration of exposure in our portfolios across industries, countries and global businesses. These include portfolio and counterparty limits, approval and review controls, and stress testing.
The Group and the Bank monitor concentration of credit risk by sector and geographical location. The analysis of concentration of credit risk from loans, advances and financing to customers is shown in Notes 12(v) and 12(vii). The analysis of concentration of credit risk from the Group and the Bank’s financial assets is shown in Note 4(b)(vi). Credit quality of financial instruments The Group and the Bank’s risk rating system facilitates the internal ratings-based approach under the adopted Basel framework to support the calculation of minimum credit regulatory capital requirement. The five credit quality classifications each encompass a range of granular internal credit rating grades assigned to wholesale and retail lending businesses, and the external ratings attributed by external agencies to debt securities. For debt securities and certain other financial instruments, external ratings have been aligned to the five quality classifications based upon the mapping of related customer risk rating (CRR) to external credit rating.
Wholesale lending
The CRR 10-grade scale summarises a more granular underlying 23-grade scale of obligor probability of default (PD). All corporate customers are rated using the 10- or 23-grade scale, depending on the degree of sophistication of the Basel approach adopted for the exposure. Each CRR band is associated with an external rating grade by reference to long-run default rates for that grade, represented by the average of issuer-weighted historical default rates. This mapping between internal and external ratings is indicative and may vary over time.
Retail lending
Retail lending credit quality is based on a 12-month point-in-time (PIT) probability-weighted probability of default (PD).
78
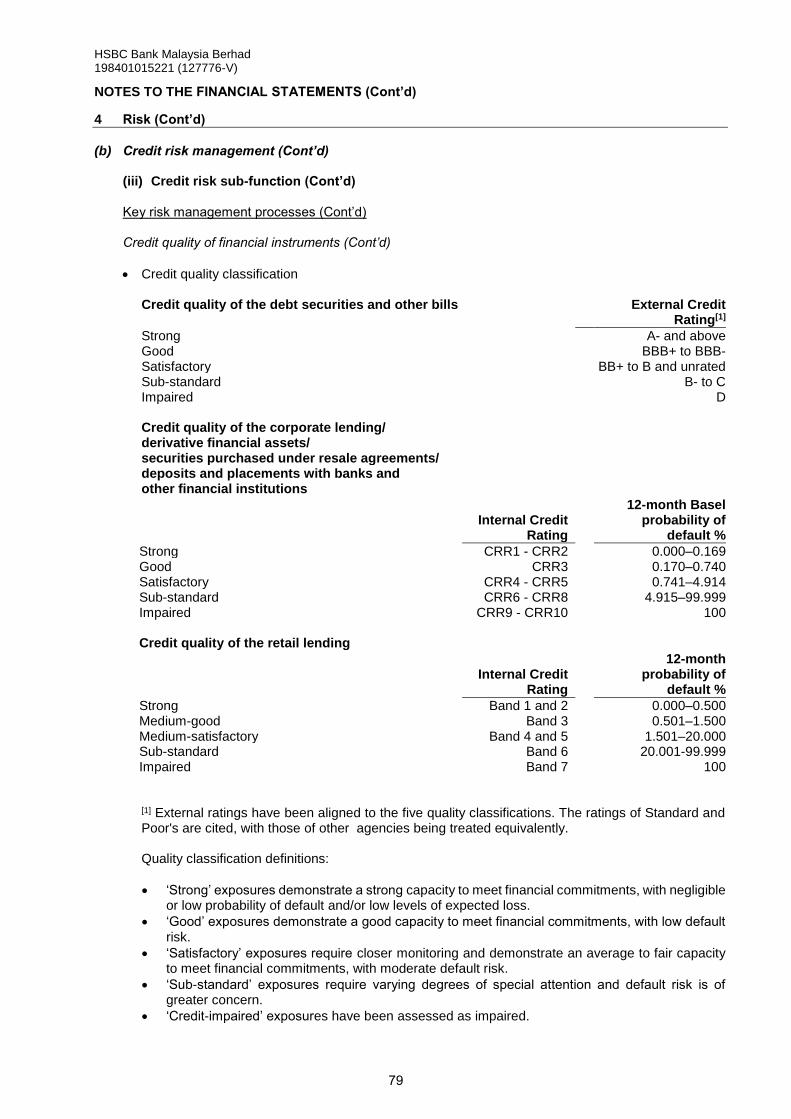
HSBC Bank Malaysia Berhad 198401015221 (127776-V)
NOTES TO THE FINANCIAL STATEMENTS (Cont’d)
4 Risk (Cont’d)
(b) Credit risk management (Cont’d)
(iii) Credit risk sub-function (Cont’d) Key risk management processes (Cont’d) Credit quality of financial instruments (Cont’d)
Credit quality classification
Credit quality of the debt securities and other bills External Credit Rating[1]
Strong A- and above Good BBB+ to BBB- Satisfactory BB+ to B and unrated Sub-standard B- to C Impaired D Credit quality of the corporate lending/ derivative financial assets/ securities purchased under resale agreements/ deposits and placements with banks and other financial institutions
Internal Credit
Rating
12-month Basel probability of
default %
Strong CRR1 - CRR2 0.000–0.169 Good CRR3 0.170–0.740 Satisfactory CRR4 - CRR5 0.741–4.914 Sub-standard CRR6 - CRR8 4.915–99.999 Impaired CRR9 - CRR10 100 Credit quality of the retail lending
Internal Credit Rating
12-month probability of
default %
Strong Band 1 and 2 0.000–0.500 Medium-good Band 3 0.501–1.500 Medium-satisfactory Band 4 and 5 1.501–20.000 Sub-standard Band 6 20.001-99.999 Impaired Band 7 100
[1] External ratings have been aligned to the five quality classifications. The ratings of Standard and Poor's are cited, with those of other agencies being treated equivalently. Quality classification definitions:
‘Strong’ exposures demonstrate a strong capacity to meet financial commitments, with negligible or low probability of default and/or low levels of expected loss.
‘Good’ exposures demonstrate a good capacity to meet financial commitments, with low default risk.
‘Satisfactory’ exposures require closer monitoring and demonstrate an average to fair capacity to meet financial commitments, with moderate default risk.
‘Sub-standard’ exposures require varying degrees of special attention and default risk is of greater concern.
‘Credit-impaired’ exposures have been assessed as impaired.
79
HSBC Bank Malaysia Berhad 198401015221 (127776-V)
NOTES TO THE FINANCIAL STATEMENTS (Cont’d)
4 Risk (Cont’d)
(b) Credit risk management (Cont’d)
(iii) Credit risk sub-function (Cont’d) Key risk management processes (Cont’d) Renegotiated loans and forbearance ‘Forbearance’ describes concessions made on the contractual terms of a loan in response to an obligor’s financial difficulties. A loan, advance and financing is classed as ‘renegotiated’ when we modify the contractual payment terms on concessionary terms because we have significant concerns about the borrowers’ ability to meet contractual payments when due. Non-payment-related concessions (e.g. covenant waivers), while potential indicators of impairment, do not trigger identification as renegotiated loans. Loans, advances and financing that have been identified as renegotiated retain this designation until maturity or derecognition. For details of the policy on derecognised renegotiated loans, see Note 3(l)(iii).
Credit quality of renegotiated loans
On execution of a renegotiation, the loan, advance and financing will also be classified as credit impaired if it is not already so classified. In wholesale lending, all facilities with a customer, including loans that have not been modified, are considered credit impaired following the identification of a renegotiated loan. Wholesale renegotiated loans, advances and financing are classified as credit-impaired until there is sufficient evidence to demonstrate a significant reduction in the risk of non-payment of future cash flows, observed over a minimum one-year period, and there are no other indicators of impairment. Personal renegotiated loans are deemed to remain credit impaired until repayment or derecognition.
Renegotiated loans and recognition of expected credit losses
For retail lending, unsecured renegotiated loans, advances and financing are generally segmented from other parts of the loan, advance and financing portfolio. Renegotiated expected credit loss assessments reflect the higher rates of losses typically encountered with renegotiated loans, advances and financing. For wholesale lending, renegotiated loans, advances and financing are typically assessed individually. Credit risk ratings are intrinsic to the impairment assessments. The individual impairment assessment takes into account the higher risk of the future non-payment inherent in renegotiated loans.
Impairment assessment For details of the impairment policies on loans, advances and financing and financial investments, see Note 3(l). Write-off of loans, advances and financing For details of the policy on the write-off of loans, advances and financing, see Note 3(l)(ii). Unsecured personal facilities, including credit cards, are generally written off at between 180 and 210 days past due except for unsecured restructured facilities which are usually written off at 90 days past due. The standard period runs until the end of the month in which the account becomes 180 days contractually delinquent. Write-off periods may be extended, generally to no more than 360 days past due. However, in exceptional circumstances, they may be extended further.
80
HSBC Bank Malaysia Berhad 198401015221 (127776-V)
NOTES TO THE FINANCIAL STATEMENTS (Cont’d)
4 Risk (Cont’d)
(b) Credit risk management (Cont’d)
(iii) Credit risk sub-function (Cont’d) Write-off of loans, advances and financing (Cont’d) For secured facilities, write-off should occur upon repossession of collateral, receipt of proceeds via settlement, or determination that recovery of the collateral will not be pursued. Any secured assets maintained on the balance sheet beyond 60 months of consecutive delinquency-driven default require additional monitoring and review to assess the prospect of recovery. In the event of bankruptcy or analogous proceedings, write-off may occur earlier than the maximum periods stated above. Collection procedures may continue after write-off.
(iv) Credit risk profile The financial assets recorded in each stage have the following characteristics: Stage 1: These financial assets are unimpaired and without significant increase in credit risk on which a 12-month allowance for ECL is recognised.
Stage 2: A significant increase in credit risk has been experienced on these financial assets since initial recognition for which a lifetime ECL is recognised.
Stage 3: There is objective evidence of impairment and the financial assets are therefore considered to be in default or otherwise credit impaired on which a lifetime ECL is recognised. Unless identified at an earlier stage, all financial assets are deemed to have suffered a significant increase in credit risk when they are 30 days past due (DPD) and are transferred from stage 1 to stage 2. (v) Credit deterioration of financial instruments Measurement uncertainty and sensitivity analysis of ECL estimates
The recognition and measurement of expected credit losses (ECL) involves the use of significant judgement and estimation. We form multiple economic scenarios based on economic forecasts, apply these assumptions to credit risk models to estimate future credit losses, and probability-weight the results to determine an unbiased ECL estimate. Methodology for developing forward looking economic scenarios The Group and the Bank use multiple economic scenarios to reflect assumptions about future economic scenarios based on consensus forecast distributions, supplemented by alternative or additional economic scenarios and/or management adjustments where, in management’s judgement, the consensus forecast distribution does not adequately capture the relevant risks.
81
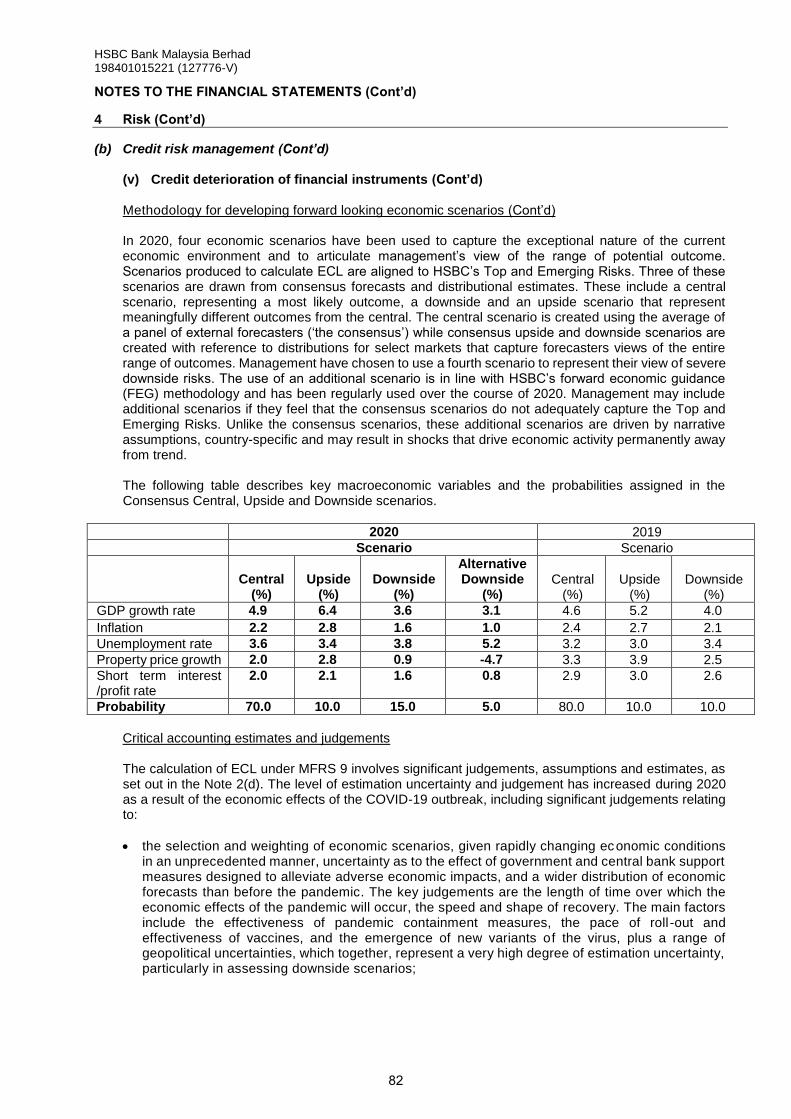
HSBC Bank Malaysia Berhad 198401015221 (127776-V)
NOTES TO THE FINANCIAL STATEMENTS (Cont’d)
4 Risk (Cont’d)
(b) Credit risk management (Cont’d)
(v) Credit deterioration of financial instruments (Cont’d) Methodology for developing forward looking economic scenarios (Cont’d) In 2020, four economic scenarios have been used to capture the exceptional nature of the current economic environment and to articulate management’s view of the range of potential outcome. Scenarios produced to calculate ECL are aligned to HSBC’s Top and Emerging Risks. Three of these scenarios are drawn from consensus forecasts and distributional estimates. These include a central scenario, representing a most likely outcome, a downside and an upside scenario that represent meaningfully different outcomes from the central. The central scenario is created using the average of a panel of external forecasters (‘the consensus’) while consensus upside and downside scenarios are created with reference to distributions for select markets that capture forecasters views of the entire range of outcomes. Management have chosen to use a fourth scenario to represent their view of severe downside risks. The use of an additional scenario is in line with HSBC’s forward economic guidance (FEG) methodology and has been regularly used over the course of 2020. Management may include additional scenarios if they feel that the consensus scenarios do not adequately capture the Top and Emerging Risks. Unlike the consensus scenarios, these additional scenarios are driven by narrative assumptions, country-specific and may result in shocks that drive economic activity permanently away from trend. The following table describes key macroeconomic variables and the probabilities assigned in the Consensus Central, Upside and Downside scenarios.
2020 2019
Scenario Scenario
Central
(%)
Upside
(%)
Downside
(%)
Alternative Downside
(%)
Central
(%)
Upside
(%)
Downside
(%)
GDP growth rate 4.9 6.4 3.6 3.1 4.6 5.2 4.0
Inflation 2.2 2.8 1.6 1.0 2.4 2.7 2.1
Unemployment rate 3.6 3.4 3.8 5.2 3.2 3.0 3.4
Property price growth 2.0 2.8 0.9 -4.7 3.3 3.9 2.5
Short term interest /profit rate
2.0 2.1 1.6 0.8 2.9 3.0 2.6
Probability 70.0 10.0 15.0 5.0 80.0 10.0 10.0
Critical accounting estimates and judgements The calculation of ECL under MFRS 9 involves significant judgements, assumptions and estimates, as set out in the Note 2(d). The level of estimation uncertainty and judgement has increased during 2020 as a result of the economic effects of the COVID-19 outbreak, including significant judgements relating to:
the selection and weighting of economic scenarios, given rapidly changing economic conditions in an unprecedented manner, uncertainty as to the effect of government and central bank support measures designed to alleviate adverse economic impacts, and a wider distribution of economic forecasts than before the pandemic. The key judgements are the length of time over which the economic effects of the pandemic will occur, the speed and shape of recovery. The main factors include the effectiveness of pandemic containment measures, the pace of roll -out and effectiveness of vaccines, and the emergence of new variants of the virus, plus a range of geopolitical uncertainties, which together, represent a very high degree of estimation uncertainty, particularly in assessing downside scenarios;
82
HSBC Bank Malaysia Berhad 198401015221 (127776-V)
NOTES TO THE FINANCIAL STATEMENTS (Cont’d)
4 Risk (Cont’d)
(b) Credit risk management (Cont’d)
(v) Credit deterioration of financial instruments (Cont’d) Critical accounting estimates and judgements (Cont’d)
estimating the economic effects of those scenarios on ECL, where there is no observable historical trend that can be reflected in the models that will accurately represent the effects of the economic changes of the severity and speed brought about by the COVID-19 outbreak. Modelled assumptions and linkages between economic factors and credit losses may underestimate or overestimate ECL in these conditions, and there is significant uncertainty in the estimation of parameters such as collateral values and loss severity; and
the identification of customers experiencing significant increases in credit risk and credit impairment, particularly where those customers have accepted payment deferrals and other reliefs designed to address short-term liquidity issues, or have extended those deferrals, given limitations in the available credit information on these customers. The use of segmentation techniques for indicators of significant increases in credit risk involves significant estimation uncertainty.
How economic scenarios are reflected in the wholesale calculation of ECL HSBC Group has developed a globally consistent methodology for the application of forward economic guidance into the calculation of ECL by incorporating forward economic guidance into the estimation of the term structure of probability of default (PD) and loss given default (LGD). For PDs, the correlation of forward economic guidance to default rates is considered for a particular industry in a country. For LGD calculations the correlation of forward economic guidance to collateral values and realisation rates is considered for a particular country and industry. PDs and LGDs are estimated for the entire term structure of each instrument. For impaired loans, advances and financing, LGD estimates take into account independent recovery valuations provided by external consultants where available, or internal forecasts corresponding to anticipated economic conditions and individual company conditions. In estimating the ECL on impaired loans that are individually considered not to be significant, HSBC Group incorporates forward economic guidance proportionate to the probability-weighted outcome and the Central scenario outcome for non-stage 3 populations. How economic scenarios are reflected in the retail calculation of ECL HSBC Group has developed and implemented a globally consistent methodology for incorporating forecasts of economic conditions into ECL estimates. The impact of economic scenarios on PD is modelled at a portfolio level. Historic relationships between observed default rates and macro-economic variables are integrated into MFRS 9 ECL estimates by leveraging economic response models. The impact of these scenarios on PD is modelled over a period equal to the remaining maturity of underlying asset or assets. The impact on LGD is modelled for mortgage portfolios by forecasting future loan-to-value (LTV) profiles for the remaining maturity of the asset by leveraging national level forecasts of the house price index and applying the corresponding LGD expectation. Management judgemental adjustments The methodologies for the application of forward economic guidance into the calculation of ECL for wholesale and retail loans, advances and financing and portfolios are set out above. These models are based largely on historical observations and correlations with default rates. During 2020, the projections of macroeconomic variables are outside the historical observations on which MFRS 9 models have been built and calibrated to operate. Moreover, the complexities of the relief programme and regulatory guidance on treatment of customer impacts (such as forbearance and deferment of payments) and the unpredictable pathways of the pandemic have never been modelled. Consequently, HSBC’s MFRS 9 models, in some cases, generate outputs that appear overly sensitive when compared with other economic and credit metrics. Management judgemental adjustments are required to ensure that an appropriate amount of ECL impairment is recognised.
83
HSBC Bank Malaysia Berhad 198401015221 (127776-V)
NOTES TO THE FINANCIAL STATEMENTS (Cont’d)
4 Risk (Cont’d)
(b) Credit risk management (Cont’d)
(v) Credit deterioration of financial instruments (Cont’d) Management judgemental adjustments (Cont’d) These data and model limitations have been addressed in the short term using in-model and post-model adjustments. This includes refining model input and outputs and using post-model adjustments based on management judgement and higher level quantitative analysis for impacts that are difficult to model. To ensure a consistent framework, we identified the model segments where results were overly conservative based on historical benchmarks and defined the worst economic inputs where the model output is considered reliable. For the wholesale portfolio, this analysis produced a ‘credit expert best estimate’ to act as a benchmark against the modelled outcomes, and inform management judgemental adjustments. In the short term, the focus is on refining model inputs and outputs in a consistent and explainable manner, using management judgemental adjustments. Wider-ranging model changes will take time to develop and need more real data on which models can be trained. Models will be recalibrated over time once the full impacts of COVID-19 are observed over time. Management judgemental adjustments made in respect of COVID-19 in estimating the reported ECL for the Group and the Bank as at 31 December 2020 are RM225,726,000 and RM131,773,000 respectively. Economic scenarios sensitivity analysis of ECL estimates Management considered the sensitivity of the ECL outcome against the economic forecasts as part of the ECL governance process by recalculating the ECL under each scenario described above for selected portfolios, applying a 100% weighting to each scenario in turn. The weighting is reflected in both the determination of significant increase in credit risk and the measurement of the resulting ECL. The ECL calculated for the Upside and Downside scenarios should not be taken to represent the upper and lower limits of possible ECL outcomes. The impact of defaults that might occur in the future under different economic scenarios is captured by recalculating ECL for loans, advances and financing in stages 1 and 2 at the balance sheet date. The population of stage 3 loans (in default) at the balance sheet date is unchanged in these sensitivity calculations. Stage 3 ECL would only be sensitive to changes in forecasts of future economic conditions if the loss given default (LGD) of a particular portfolio was sensitive to these changes. There is a particularly high degree of estimation uncertainty in numbers representing tail risk scenarios when assigned a 100% weighting. For wholesale credit risk exposures, the sensitivity analysis excludes ECL and financial instruments related to defaulted obligors because the measurement of ECL is relatively more sensitive to credit factors specific to the obligor than future economic scenarios. Therefore, it is impracticable to separate the effect of macro-economic factors in individual assessments.
For retail credit risk exposures, the sensitivity analysis includes ECL for loans, advances and financing to customers related to defaulted obligors. This is because the retail ECL for secured mortgage portfolios including loans in all stages is sensitive to macroeconomic variables. Wholesale and retail sensitivity The wholesale and retail sensitivity analysis is stated inclusive of post-model adjustments, as appropriate to each scenario. The results tables exclude small portfolios.
84
HSBC Bank Malaysia Berhad 198401015221 (127776-V)
NOTES TO THE FINANCIAL STATEMENTS (Cont’d)
4 Risk (Cont’d)
(b) Credit risk management (Cont’d)
(v) Credit deterioration of financial instruments (Cont’d) Wholesale analysis MFRS 9 ECL sensitivity to future economic conditions [1]
ECL coverage of financial instruments subject to significant measurement uncertainty as at 31 December[2]
Group Bank
2020 2019
2020 2019
Reported ECL (RM’000) 139,857 36,288 126,596 25,424
Gross carrying value/ nominal amount [3] (RM’000)
90,671,566 85,605,706 73,361,549 67,671,487
Reported ECL coverage (%) 0.15% 0.04 % 0.17% 0.04 %
Coverage ratios by scenario (%)
Consensus central scenario 0.13% 0.04 % 0.15% 0.04 %
Consensus upside scenario 0.11% 0.04 % 0.12% 0.03 %
Consensus downside scenario 0.21% 0.05 % 0.24% 0.04 %
Alternative downside scenario 0.41% N/A 0.45% N/A
[1]Excludes ECL and financial instruments relating to defaulted obligors because the measurement of ECL is relatively more sensitive to credit factors specific to the obligor then future economic scenario. [2]Includes off balance sheet financial instruments that are subject to significant measurement uncertainty. [3]Includes low credit risk financial instruments such as Debt instruments at FVOCI which have low ECL coverage ratios under all the above scenarios. Coverage ratios on loans, advances and financing to customers including loan commitments and financial guarantees are typically higher.
Retail analysis MFRS 9 ECL sensitivity to future economic conditions [1]
ECL coverage of financing and advances at 31 December[2]
Group Bank
2020 2019 2020 2019
Reported ECL (RM’000) 429,077 375,625 184,482 175,028
Drawn amount (RM’000) 21,006,931 23,391,973 15,277,010 17,052,335
Reported ECL coverage (%) 2.04% 1.61 % 1.21% 1.03 %
Coverage ratios by scenario (%)
Consensus central scenario 2.01% 1.60 % 1.19% 1.02 %
Consensus upside scenario 1.85% 1.46 % 1.09% 0.95 %
Consensus downside scenario 2.19% 1.81 % 1.30% 1.16 %
Alternative downside scenario 2.54% N/A 1.54% N/A
[1]ECL sensitivities excludes portfolios utilising less complex modelling approaches. [2]ECL sensitivity includes only on balance sheet financial instruments to which MFRS 9 impairment requirements are applied .
The changes in sensitivity from 31 December 2019 is reflective of changes in lending volumes, credit quality and movements in foreign exchange. Post-model adjustments In the context of MFRS 9, post-model adjustments are short-term increases or decreases to the expected credit loss at either a customer or portfolio level to account for model deficiencies, expert credit judgement applied following management review and challenge and for any late breaking events. Internal governance is in place to regularly monitor post-model adjustments and where possible to reduce the reliance on these through model recalibration or redevelopment as appropriate.
85
HSBC Bank Malaysia Berhad 198401015221 (127776-V)
NOTES TO THE FINANCIAL STATEMENTS (Cont’d)
4 Risk (Cont’d)
(b) Credit risk management (Cont’d)
(vi) Credit quality
Credit quality of financial instruments The Group and the Bank assess credit quality of all financial instruments that are subject to credit risk. The credit quality of financial instruments is a point in time assessment of the probability of default of financial instruments, whereas stages 1 and 2 are determined based on relative deterioration of credit quality since initial recognition. Accordingly, for non-credit impaired financial instruments, there is no direct relationship between the credit quality assessment and stages 1 and 2, though typically the lower credit quality bands exhibit a higher proportion in stage 2. The five credit quality classifications each encompass a range of granular internal credit rating grades assigned to wholesale and retail lending businesses and the external ratings attributed by external agencies to debt securities, as shown in the table on the following page.
86
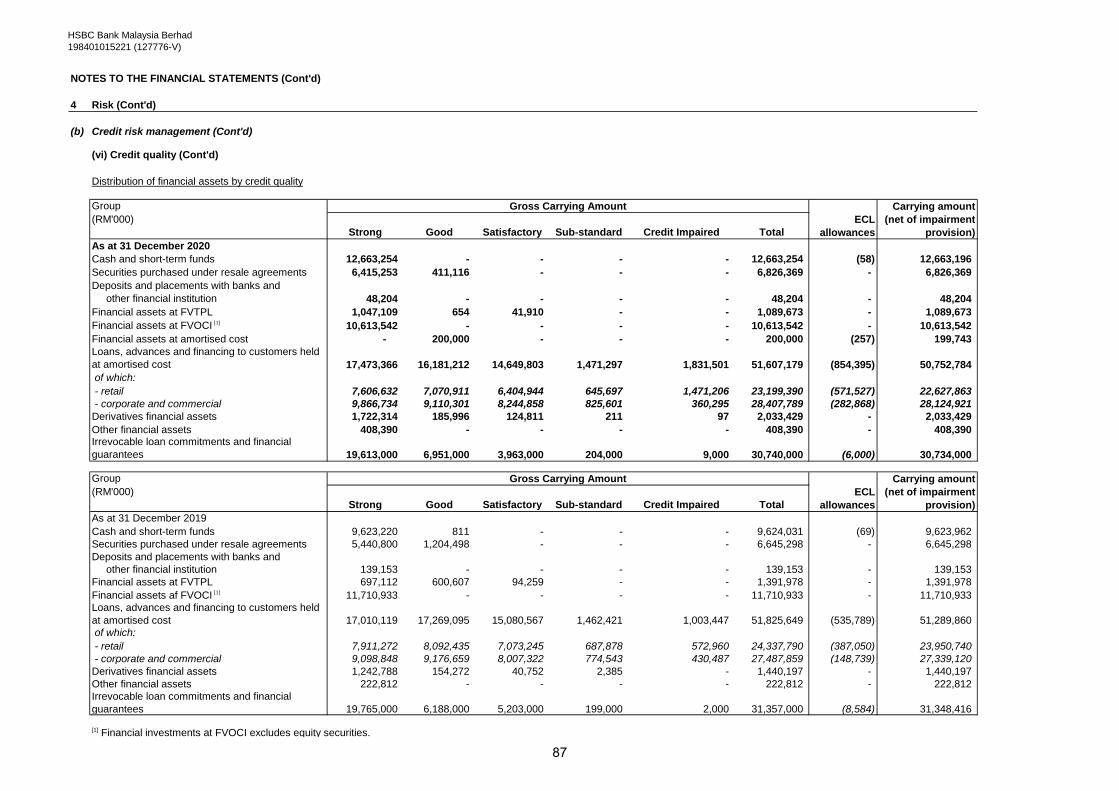
HSBC Bank Malaysia Berhad
198401015221 (127776-V)
NOTES TO THE FINANCIAL STATEMENTS (Cont'd)
4 Risk (Cont'd)
(b) Credit risk management (Cont'd)
(vi) Credit quality (Cont'd)
Distribution of financial assets by credit quality
Group
(RM'000)
Strong Good Satisfactory Sub-standard Credit Impaired Total
As at 31 December 2020
Cash and short-term funds 12,663,254 - - - - 12,663,254 (58) 12,663,196
Securities purchased under resale agreements 6,415,253 411,116 - - - 6,826,369 - 6,826,369
Deposits and placements with banks and
other financial institution 48,204 - - - - 48,204 - 48,204
Financial assets at FVTPL 1,047,109 654 41,910 - - 1,089,673 - 1,089,673
Financial assets at FVOCI [1] 10,613,542 - - - - 10,613,542 - 10,613,542
Financial assets at amortised cost - 200,000 - - - 200,000 (257) 199,743
Loans, advances and financing to customers held
at amortised cost 17,473,366 16,181,212 14,649,803 1,471,297 1,831,501 51,607,179 (854,395) 50,752,784
of which:
- retail 7,606,632 7,070,911 6,404,944 645,697 1,471,206 23,199,390 (571,527) 22,627,863
- corporate and commercial 9,866,734 9,110,301 8,244,858 825,601 360,295 28,407,789 (282,868) 28,124,921
Derivatives financial assets 1,722,314 185,996 124,811 211 97 2,033,429 - 2,033,429
Other financial assets 408,390 - - - - 408,390 - 408,390 Irrevocable loan commitments and financial
guarantees 19,613,000 6,951,000 3,963,000 204,000 9,000 30,740,000 (6,000) 30,734,000
Group
(RM'000)
Strong Good Satisfactory Sub-standard Credit Impaired Total
As at 31 December 2019
Cash and short-term funds 9,623,220 811 - - - 9,624,031 (69) 9,623,962
Securities purchased under resale agreements 5,440,800 1,204,498 - - - 6,645,298 - 6,645,298
Deposits and placements with banks and
other financial institution 139,153 - - - - 139,153 - 139,153
Financial assets at FVTPL 697,112 600,607 94,259 - - 1,391,978 - 1,391,978
Financial assets af FVOCI [1] 11,710,933 - - - - 11,710,933 - 11,710,933
Loans, advances and financing to customers held
at amortised cost 17,010,119 17,269,095 15,080,567 1,462,421 1,003,447 51,825,649 (535,789) 51,289,860
of which:
- retail 7,911,272 8,092,435 7,073,245 687,878 572,960 24,337,790 (387,050) 23,950,740
- corporate and commercial 9,098,848 9,176,659 8,007,322 774,543 430,487 27,487,859 (148,739) 27,339,120
Derivatives financial assets 1,242,788 154,272 40,752 2,385 - 1,440,197 - 1,440,197
Other financial assets 222,812 - - - - 222,812 - 222,812
Irrevocable loan commitments and financial
guarantees 19,765,000 6,188,000 5,203,000 199,000 2,000 31,357,000 (8,584) 31,348,416
[1] Financial investments at FVOCI excludes equity securities.
Gross Carrying Amount
ECL
allowances
Carrying amount
(net of impairment
provision)
Gross Carrying Amount
ECL
allowances
Carrying amount
(net of impairment
provision)
#
87

HSBC Bank Malaysia Berhad
198401015221 (127776-V)
NOTES TO THE FINANCIAL STATEMENTS (Cont'd)
4 Risk (Cont'd)
(b) Credit risk management (Cont'd)
(vi) Credit quality (Cont'd)
Distribution of financial assets by credit quality
Bank
(RM'000)
Strong Good Satisfactory Sub-standard Credit Impaired Total
As at 31 December 2020
Cash and short-term funds 9,441,488 - - - - 9,441,488 (47) 9,441,441
Securities purchased under resale agreements 6,415,253 411,116 - - - 6,826,369 - 6,826,369
Deposits and placements with banks and
other financial institution 1,403,411 - - - - 1,403,411 - 1,403,411
Financial assets at FVTPL 1,047,109 654 41,910 - - 1,089,673 - 1,089,673
Financial assets at FVOCI [1] 9,313,727 - - - - 9,313,727 - 9,313,727
Financial assets at amortised cost - 200,000 - - - 200,000 (257) 199,743
Loans, advances and financing to customers held
at amortised cost 13,864,525 11,508,813 10,259,028 909,116 1,224,806 37,766,288 (506,080) 37,260,208
of which:
- retail 5,977,951 4,962,241 4,423,373 391,982 924,859 16,680,406 (251,501) 16,428,905
- corporate and commercial 7,886,574 6,546,572 5,835,655 517,134 299,947 21,085,882 (254,579) 20,831,303
Derivatives financial assets 1,743,795 185,894 107,389 54 97 2,037,229 - 2,037,229
Other financial assets 457,296 - - - - 457,296 - 457,296 Irrevocable loan commitments and financial
guarantees 15,360,000 5,590,000 2,811,000 95,000 8,000 23,864,000 (4,000) 23,860,000
Bank
(RM'000)
Strong Good Satisfactory Sub-standard Credit Impaired Total
As at 31 December 2019
Cash and short-term funds 4,846,489 811 - - - 4,847,300 (63) 4,847,237
Securities purchased under resale agreements 5,440,800 1,204,498 - - - 6,645,298 - 6,645,298
Deposits and placements with banks and
other financial institution 1,011,570 - - - - 1,011,570 - 1,011,570
Financial assets at FVTPL 697,112 600,607 94,259 - - 1,391,978 - 1,391,978
Financial assets af FVOCI [1] 8,990,958 - - - - 8,990,958 - 8,990,958
Loans, advances and financing to customers held
at amortised cost 13,742,497 12,454,541 10,719,059 991,190 618,144 38,525,431 (278,524) 38,246,907
of which:
- retail 6,284,469 5,695,484 4,901,845 453,273 282,678 17,617,749 (181,279) 17,436,470
- corporate and commercial 7,458,028 6,759,057 5,817,214 537,917 335,466 20,907,682 (97,245) 20,810,437
Derivatives financial assets 1,289,343 112,486 35,843 2,385 - 1,440,057 - 1,440,057
Other financial assets 250,543 - - - - 250,543 - 250,543
Irrevocable loan commitments and financial
guarantees 15,574,000 5,127,000 3,359,000 107,000 - 24,167,000 (6,031) 24,160,969
[1] Financial investments at FVOCI excludes equity securities.
Gross Carrying Amount
ECL
allowances
Carrying amount
(net of impairment
provision)
Gross Carrying Amount
ECL
allowances
Carrying amount
(net of impairment
provision)
#
88
HSBC Bank Malaysia Berhad 198401015221 (127776-V)
NOTES TO THE FINANCIAL STATEMENTS (Cont’d)
4 Risk (Cont’d)
(b) Credit risk management (Cont’d) (vi) Credit quality (Cont’d) Credit impaired loans (Stage 3)
The Group and the Bank determine that a financial instrument is credit impaired and in stage 3 by considering relevant objective evidence, primarily whether:
contractual payments of either principal or interest are past due for more than 90 days;
there are other indications that the borrower is unlikely to pay, such as when a concession has been granted to the borrower for economic or legal reasons relating to the borrower’s financial condition; and
the loan is otherwise considered to be in default. If such unlikeliness to pay is not identified at an earlier stage, it is deemed to occur when an exposure is 90 days past due. Therefore, the definitions of credit impaired and default are aligned as far as possible so that stage 3 represents all loans that are considered de faulted or otherwise credit impaired.
Collateral and other credit enhancements Although collateral can be an important mitigant of credit risk, it is the Group and the Bank’s practice to lend on the basis of the customer’s ability to meet their obligations out of their cash flow resources rather than placing primary reliance on collateral and other credit risk enhancements. Depending on the customer’s standing and the type of product, facilities may be provided without any collateral or other credit enhancements. For other lending, a charge over collateral is obtained and considered in determining the credit decision and pricing. In the event of default, the bank may utilise the collateral as a source of repayment. In line with HSBC Global policy, lending/financing is made on the basis of the customer’s capacity to repay, as opposed to placing primary reliance on credit risk mitigation. Depending on the customer’s standing and the type of product, facilities may be provided unsecured. Mitigation of credit risk is nevertheless a key aspect of effective risk management and in the Group and Bank, takes many forms, the most common method of which is to take collateral. The principal collateral types employed by the Group and the Bank are as follows:
under the residential and real estate business; mortgages over residential and financed properties;
under certain Islamic specialised financing and leasing transactions (such as machinery financing) where physical assets form the principal source of facility repayment, physical collateral is typically taken;
in the commercial and industrial sectors, charges over business assets such as premises, stock and debtors;
facilities provided to small and medium enterprises are commonly granted against guarantees by their owners/directors;
guarantees from third parties can arise where facilities are extended without the benefit of any alternative form of security, e.g. where the Group and the Bank issue a bid or performance bond in favour of a non-customer at the request of another bank;
under the institutional sector, certain trading facilities are supported by charges over financial instruments such as cash, debt securities and equities; and
financial collateral in the form of marketable securities is used in much of the over-the-counter (OTC) derivatives activities and in the Group and the Bank’s securities financing business (securities lending and borrowing or repos and reverse repos).
The Group and the Bank do not disclose the fair value of collateral held as security or other credit enhancements on loans, advances and financing past due but not impaired as it is not practicable to do so. The financial effect of collateral (quantification of the extent to which collateral and other credit enhancements mitigate credit risk) held for impaired loans, advances and financing for the Group and the Bank as at 31 December 2020 are 59.9% (2019: 58.1%) and 64.3% (2019: 62.6%) respectively.
89
HSBC Bank Malaysia Berhad 198401015221 (127776-V)
NOTES TO THE FINANCIAL STATEMENTS (Cont’d)
4 Risk (Cont’d)
(b) Credit risk management (Cont’d) (vi) Credit quality (Cont’d) Collateral and other credit enhancements (Cont’d) The financial effect of collateral held for other remaining on-balance sheet financial assets is not significant. Collateral especially properties are made available for sale in an orderly fashion, with the proceeds used to reduce or repay the outstanding indebtedness. If excess funds arise after the debt/financing has been repaid, they are made available either to repay other secured lenders/financier with lower priority or are returned to the customer. The Group and the Bank do not generally occupy repossessed properties for its business use. Derivatives The Group and the Bank participate in transactions exposing us to counterparty credit risk. Counterparty credit risk is the risk of financial loss if the counterparty to a transaction defaults before satisfactorily settling it. It arises principally from over-the-counter (‘OTC’) derivatives and securities financing transactions and is calculated in both the trading and non-trading books. Transactions vary in value by reference to a market factor such as an interest rate, exchange rate or asset price. The counterparty risk from derivative transactions is taken into account when reporting the fair value of derivative positions. The adjustment to the fair value is known as the credit value adjustment (‘CVA’).
90

HSBC Bank Malaysia Berhad
198401015221 (127776-V)
NOTES TO THE FINANCIAL STATEMENTS (Cont'd)
4 Risk (Cont'd)
(b) Credit Risk Management (Cont'd)
(vi) Credit quality (Cont'd)
Offsetting financial assets and liabilities
[1] International Swaps and Derivatives Association
(i) (ii) (iii) = (i) + (ii) (iv)a (iv)b (v) = (iii) - (iv)
Description
Financial
instruments Cash collateral
RM'000 RM'000 RM'000 RM'000 RM'000 RM'000
2020
Group
Securities purchased under resale agreements 6,826,369 - 6,826,369 6,826,369 - -
Derivative financial assets 2,033,429 - 2,033,429 - 100,711 1,932,718
Derivative financial liabilities 1,840,252 - 1,840,252 - 615,800 1,224,452
Bank
Securities purchased under resale agreements 6,826,369 - 6,826,369 6,826,369 - -
Derivative financial assets 2,037,229 - 2,037,229 - 100,711 1,936,518
Derivative financial liabilities 1,899,404 - 1,899,404 - 615,800 1,283,604
2019
Group
Securities purchased under resale agreements 6,645,298 - 6,645,298 6,645,298 - -
Derivative financial assets 1,440,197 - 1,440,197 - 40,143 1,400,054
Derivative financial liabilities 1,282,269 - 1,282,269 - 439,106 843,163
Bank
Securities purchased under resale agreements 6,645,298 - 6,645,298 6,645,298 - -
Derivative financial assets 1,440,057 - 1,440,057 - 40,143 1,399,914
Derivative financial liabilities 1,328,082 - 1,328,082 - 439,106 888,976
The disclosures set out in the table below include financial assets and financial liabilities that are subject to an enforceable master netting agreement, irrespective of whether
they are offset in the statement of financial position. Financial assets and financial liabilities are offset and the net amount is reported in the statement of financial position when
there is a legally enforceable right to offset the recognised amounts and there is an intention to settle on a net basis, or realise the asset and liability simultaneously (the offset
criteria). During the financial year, no financial assets or financial liabilities were offset in the statement of financial position because the ISDA[1]
does not meet the criteria for
offsetting in the statement of financial position. The ISDA[1]
creates for the parties to the agreement, a right of set off of recognised amounts that is enforceable only following
an event of default, insolvency or bankruptcy of the Group and the Bank, or its counterparties. Financial instruments subject to offsetting, enforceable master netting
agreements and similar agreements are shown as follows:
Gross amounts
of recognised
assets
Gross amounts
offset in the
statement of
financial position
Net amount of
assets presented
in the statement of
financial position Net amount
Gross amounts not offset in the statement of financial position
#
91

HSBC Bank Malaysia Berhad 198401015221 (127776-V)
NOTES TO THE FINANCIAL STATEMENTS (Cont’d) 4 Risk (Cont’d)
(c) Liquidity and funding risk management
(i) Overview Liquidity risk is the risk that the Group and the Bank do not have sufficient financial resources to meet their obligations when they fall due. Liquidity risk arise from mismatches in the timing of cash flows. Funding risk is the risk that the Group and the Bank cannot raise funding or can only do so at excessive cost. The Group and the Bank maintain a diversified and stable funding base comprising core retail and corporate customer deposits and institutional balances. This is augmented by wholesale funding and portfolios of highly liquid assets. The objective of the Group and the Bank’s liquidity and funding management is to ensure that all foreseeable funding commitments and deposit withdrawals can be met when due and that wholesale market access is coordinated and cost effective.
Current accounts and savings deposits payable on demand or at short notice form a significant part of HSBC Group’s funding, and the Group and the Bank place considerable importance on maintaining their stability. For deposits, stability depends upon preserving depositor confidence in the Group and the Bank’s capital strength and liquidity, and on competitive and transparent pricing. In aggregate, the Group and the Bank are net liquidity providers to the interbank market, placing significantly more funds with other banks than it borrows. (ii) Governance and structure The management of liquidity and funding is primarily carried out through HSBC Group’s liquidity and funding risk framework (LFRF) and BNM’s Liquidity Coverage Ratio and Net Stable Funding Ratio Framework. Limits are proposed by Asset, Liability and Capital Management (ALCM) through the RMM and approved by the Board. These limits vary to take account of the depth and liquidity of the local market in which the Group and the Bank operate. The Group and the Bank maintain strong liquidity positions and manage the liquidity profile of the assets, liabilities and commitments to ensure that cash flows are appropriately balanced and all obligations are met when due. The Asset and Liability Committee (ALCO) is responsible for managing all ALCM issues including liquidity and funding risk management. Compliance with liquidity and funding requirements is monitored by ALCO through the following processes:
maintaining compliance with relevant regulatory requirements of the operating entity;
projecting cash flows under various stress scenarios and considering the level of liquid assets necessary in relation thereto;
monitoring liquidity and funding ratios against internal and regulatory requirements;
maintaining a diverse range of funding sources with adequate back-up facilities;
managing the concentration and profile of term funding;
managing contingent liquidity commitment exposures within predetermined limits;
maintaining debt financing plans;
monitoring of depositor concentration in order to avoid undue reliance on large individual depositors and ensuring a satisfactory overall funding mix; and
maintaining liquidity and funding contingency plans. These plans identify early indicators of stress conditions and describe actions to be taken in the event of difficulties arising from systemic or other crises, while minimising adverse long-term implications for the business.
92

HSBC Bank Malaysia Berhad 198401015221 (127776-V)
NOTES TO THE FINANCIAL STATEMENTS (Cont’d) 4 Risk (Cont’d)
(c) Liquidity and funding risk management (Cont’d)
(iii) Management of liquidity and funding risk
The HSBC Group’s LFRF uses the liquidity coverage ratio (LCR) and net stable funding ratio (NSFR)
regulatory framework as a foundation, but adds extra metrics, limits and overlays to address the risks
that we consider are not adequately reflected by the regulatory framework.
Funding and liquidity plans form part of the annual operating plan that is approved by the Board. The critical Board risk appetite measures are the liquidity coverage ratio (LCR) and net stable funding ratio (NSFR). An appropriate funding and liquidity profile is managed through a wider set of measures:
a minimum LCR requirement;
a minimum NSFR requirement or other appropriate metric;
a legal entity depositor concentration limit;
three-month and 12-month cumulative rolling term contractual maturity limits covering deposits from banks, deposits from non-bank financial institutions and securities issued;
a minimum LCR requirement by currency;
intra-day liquidity;
the application of liquidity funds transfer pricing; and
forward-looking funding assessments.
The management of liquidity risk was enhanced during 2020 in response to the COVID-19 outbreak to ensure the Group and the Bank anticipated, monitored and responded to the impact.
93
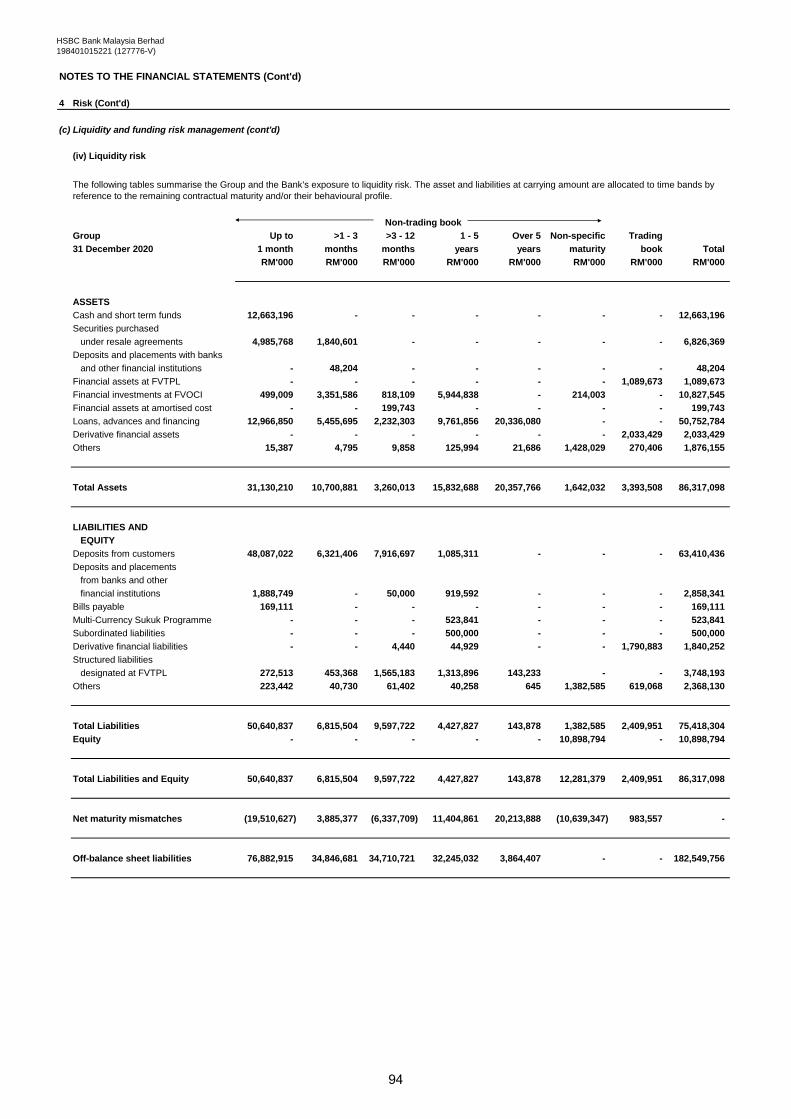
HSBC Bank Malaysia Berhad
198401015221 (127776-V)
NOTES TO THE FINANCIAL STATEMENTS (Cont'd)
4 Risk (Cont'd)
(c) Liquidity and funding risk management (cont'd)
(iv) Liquidity risk
Group Up to >1 - 3 >3 - 12 1 - 5 Over 5 Non-specific Trading
1 month months months years years maturity book Total
RM'000 RM'000 RM'000 RM'000 RM'000 RM'000 RM'000 RM'000
ASSETS
Cash and short term funds 12,663,196 - - - - - - 12,663,196
Securities purchased
under resale agreements 4,985,768 1,840,601 - - - - - 6,826,369
Deposits and placements with banks
and other financial institutions - 48,204 - - - - - 48,204
Financial assets at FVTPL - - - - - - 1,089,673 1,089,673
Financial investments at FVOCI 499,009 3,351,586 818,109 5,944,838 - 214,003 - 10,827,545
Financial assets at amortised cost - - 199,743 - - - - 199,743
Loans, advances and financing 12,966,850 5,455,695 2,232,303 9,761,856 20,336,080 - - 50,752,784
Derivative financial assets - - - - - - 2,033,429 2,033,429
Others 15,387 4,795 9,858 125,994 21,686 1,428,029 270,406 1,876,155
Total Assets 31,130,210 10,700,881 3,260,013 15,832,688 20,357,766 1,642,032 3,393,508 86,317,098
LIABILITIES AND
EQUITY
Deposits from customers 48,087,022 6,321,406 7,916,697 1,085,311 - - - 63,410,436
Deposits and placements
from banks and other
financial institutions 1,888,749 - 50,000 919,592 - - - 2,858,341
Bills payable 169,111 - - - - - - 169,111
Multi-Currency Sukuk Programme - - - 523,841 - - - 523,841
Subordinated liabilities - - - 500,000 - - - 500,000
Derivative financial liabilities - - 4,440 44,929 - - 1,790,883 1,840,252
Structured liabilities
designated at FVTPL 272,513 453,368 1,565,183 1,313,896 143,233 - - 3,748,193
Others 223,442 40,730 61,402 40,258 645 1,382,585 619,068 2,368,130
Total Liabilities 50,640,837 6,815,504 9,597,722 4,427,827 143,878 1,382,585 2,409,951 75,418,304
Equity - - - - - 10,898,794 - 10,898,794
Total Liabilities and Equity 50,640,837 6,815,504 9,597,722 4,427,827 143,878 12,281,379 2,409,951 86,317,098
Net maturity mismatches (19,510,627) 3,885,377 (6,337,709) 11,404,861 20,213,888 (10,639,347) 983,557 -
Off-balance sheet liabilities 76,882,915 34,846,681 34,710,721 32,245,032 3,864,407 - - 182,549,756
The following tables summarise the Group and the Bank's exposure to liquidity risk. The asset and liabilities at carrying amount are allocated to time bands by
reference to the remaining contractual maturity and/or their behavioural profile.
Non-trading book
31 December 2020
#
94
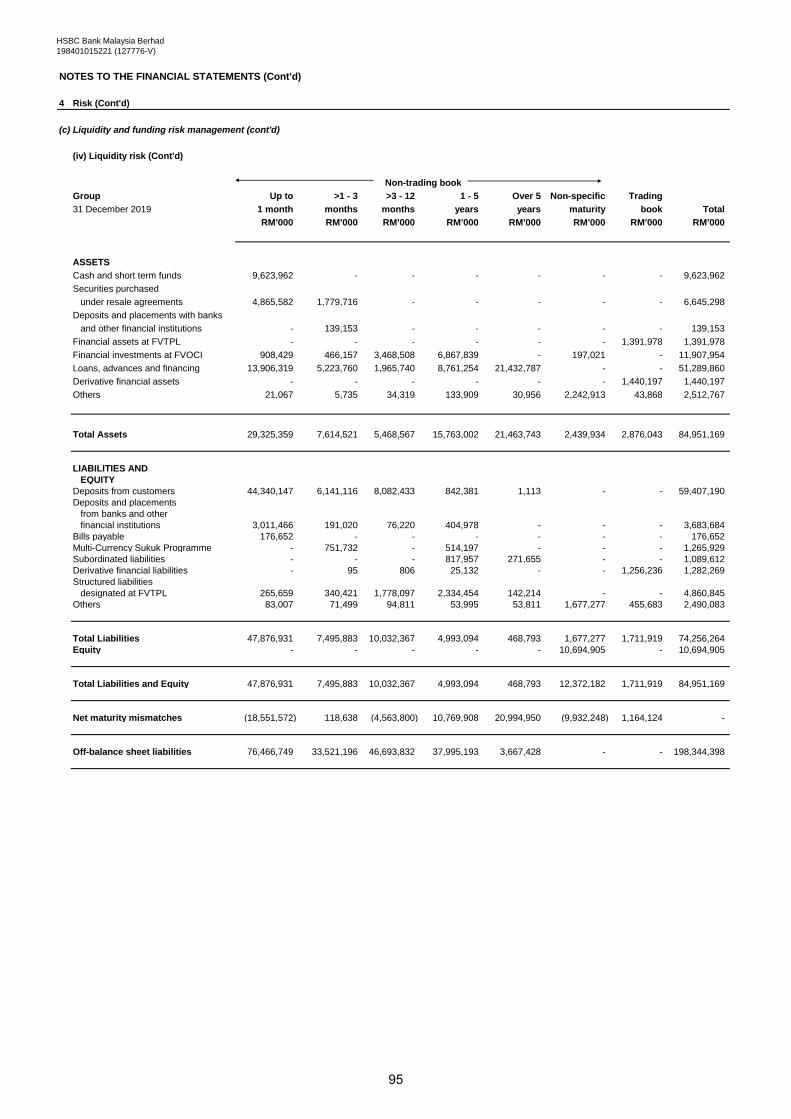
HSBC Bank Malaysia Berhad
198401015221 (127776-V)
NOTES TO THE FINANCIAL STATEMENTS (Cont'd)
4 Risk (Cont'd)
(c) Liquidity and funding risk management (cont'd)
(iv) Liquidity risk (Cont'd)
Group Up to >1 - 3 >3 - 12 1 - 5 Over 5 Non-specific Trading
31 December 2019 1 month months months years years maturity book Total
RM'000 RM'000 RM'000 RM'000 RM'000 RM'000 RM'000 RM'000
ASSETS
Cash and short term funds 9,623,962 - - - - - - 9,623,962
Securities purchased
under resale agreements 4,865,582 1,779,716 - - - - - 6,645,298
Deposits and placements with banks
and other financial institutions - 139,153 - - - - - 139,153
Financial assets at FVTPL - - - - - - 1,391,978 1,391,978
Financial investments at FVOCI 908,429 466,157 3,468,508 6,867,839 - 197,021 - 11,907,954
Loans, advances and financing 13,906,319 5,223,760 1,965,740 8,761,254 21,432,787 - - 51,289,860
Derivative financial assets - - - - - - 1,440,197 1,440,197
Others 21,067 5,735 34,319 133,909 30,956 2,242,913 43,868 2,512,767
Total Assets 29,325,359 7,614,521 5,468,567 15,763,002 21,463,743 2,439,934 2,876,043 84,951,169
LIABILITIES AND
EQUITY
Deposits from customers 44,340,147 6,141,116 8,082,433 842,381 1,113 - - 59,407,190
Deposits and placements
from banks and other
financial institutions 3,011,466 191,020 76,220 404,978 - - - 3,683,684
Bills payable 176,652 - - - - - - 176,652
Multi-Currency Sukuk Programme - 751,732 - 514,197 - - - 1,265,929
Subordinated liabilities - - - 817,957 271,655 - - 1,089,612
Derivative financial liabilities - 95 806 25,132 - - 1,256,236 1,282,269
Structured liabilities
designated at FVTPL 265,659 340,421 1,778,097 2,334,454 142,214 - - 4,860,845
Others 83,007 71,499 94,811 53,995 53,811 1,677,277 455,683 2,490,083
Total Liabilities 47,876,931 7,495,883 10,032,367 4,993,094 468,793 1,677,277 1,711,919 74,256,264
Equity - - - - - 10,694,905 - 10,694,905
Total Liabilities and Equity 47,876,931 7,495,883 10,032,367 4,993,094 468,793 12,372,182 1,711,919 84,951,169
Net maturity mismatches (18,551,572) 118,638 (4,563,800) 10,769,908 20,994,950 (9,932,248) 1,164,124 -
Off-balance sheet liabilities 76,466,749 33,521,196 46,693,832 37,995,193 3,667,428 - - 198,344,398
Non-trading book
#
95
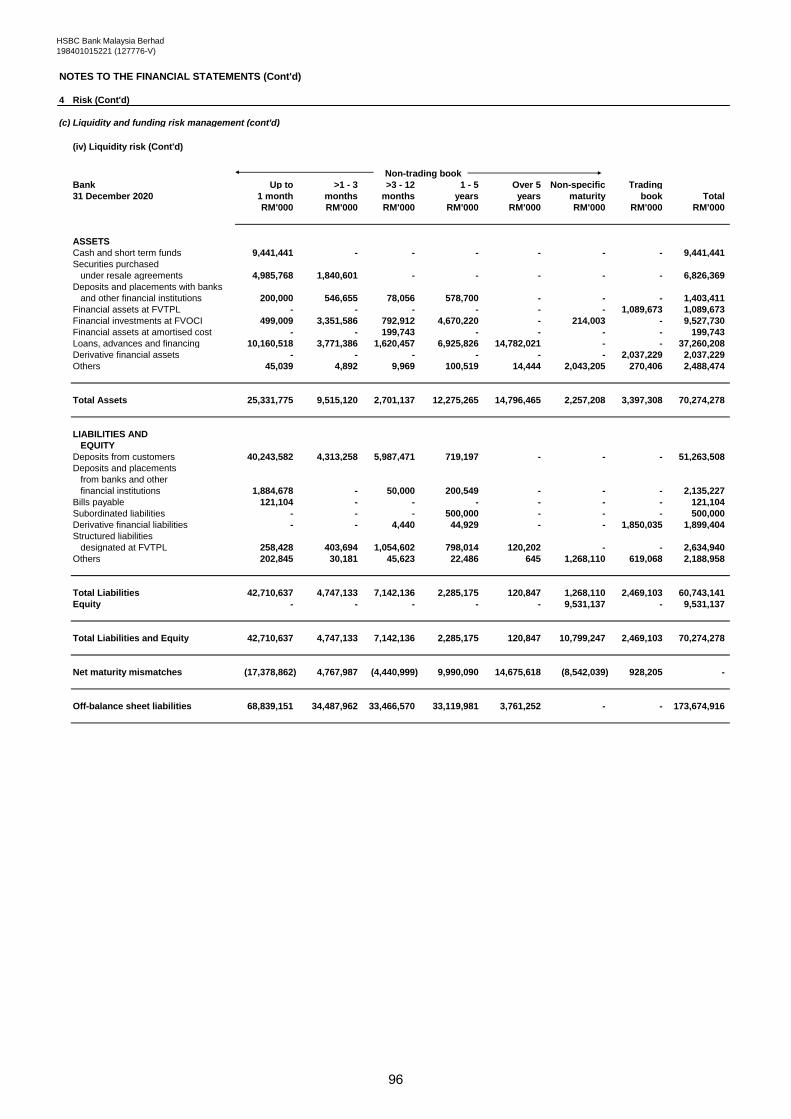
HSBC Bank Malaysia Berhad
198401015221 (127776-V)
NOTES TO THE FINANCIAL STATEMENTS (Cont'd)
4 Risk (Cont'd)
(c) Liquidity and funding risk management (cont'd)
(iv) Liquidity risk (Cont'd)
Bank Up to >1 - 3 >3 - 12 1 - 5 Over 5 Non-specific Trading
31 December 2020 1 month months months years years maturity book Total
RM'000 RM'000 RM'000 RM'000 RM'000 RM'000 RM'000 RM'000
ASSETS
Cash and short term funds 9,441,441 - - - - - - 9,441,441
Securities purchased
under resale agreements 4,985,768 1,840,601 - - - - - 6,826,369
Deposits and placements with banks
and other financial institutions 200,000 546,655 78,056 578,700 - - - 1,403,411
Financial assets at FVTPL - - - - - - 1,089,673 1,089,673
Financial investments at FVOCI 499,009 3,351,586 792,912 4,670,220 - 214,003 - 9,527,730
Financial assets at amortised cost - - 199,743 - - - - 199,743
Loans, advances and financing 10,160,518 3,771,386 1,620,457 6,925,826 14,782,021 - - 37,260,208
Derivative financial assets - - - - - - 2,037,229 2,037,229
Others 45,039 4,892 9,969 100,519 14,444 2,043,205 270,406 2,488,474
Total Assets 25,331,775 9,515,120 2,701,137 12,275,265 14,796,465 2,257,208 3,397,308 70,274,278
LIABILITIES AND
EQUITY
Deposits from customers 40,243,582 4,313,258 5,987,471 719,197 - - - 51,263,508
Deposits and placements
from banks and other
financial institutions 1,884,678 - 50,000 200,549 - - - 2,135,227
Bills payable 121,104 - - - - - - 121,104
Subordinated liabilities - - - 500,000 - - - 500,000
Derivative financial liabilities - - 4,440 44,929 - - 1,850,035 1,899,404
Structured liabilities
designated at FVTPL 258,428 403,694 1,054,602 798,014 120,202 - - 2,634,940
Others 202,845 30,181 45,623 22,486 645 1,268,110 619,068 2,188,958
Total Liabilities 42,710,637 4,747,133 7,142,136 2,285,175 120,847 1,268,110 2,469,103 60,743,141
Equity - - - - - 9,531,137 - 9,531,137
Total Liabilities and Equity 42,710,637 4,747,133 7,142,136 2,285,175 120,847 10,799,247 2,469,103 70,274,278
Net maturity mismatches (17,378,862) 4,767,987 (4,440,999) 9,990,090 14,675,618 (8,542,039) 928,205 -
Off-balance sheet liabilities 68,839,151 34,487,962 33,466,570 33,119,981 3,761,252 - - 173,674,916
Non-trading book
#
96

HSBC Bank Malaysia Berhad
198401015221 (127776-V)
NOTES TO THE FINANCIAL STATEMENTS (Cont'd)
4 Risk (Cont'd)
(c) Liquidity and funding risk management (cont'd)
(iv) Liquidity risk (Cont'd)
Bank Up to >1 - 3 >3 - 12 1 - 5 Over 5 Non-specific Trading
31 December 2019 1 month months months years years maturity book Total
RM'000 RM'000 RM'000 RM'000 RM'000 RM'000 RM'000 RM'000
ASSETS
Cash and short term funds 4,847,237 - - - - - - 4,847,237
Securities purchased
under resale agreements 4,865,582 1,779,716 - - - - - 6,645,298
Deposits and placements with banks
and other financial institutions - 110,076 311,881 317,958 271,655 - - 1,011,570
Financial assets at FVTPL - - - - - - 1,391,978 1,391,978
Financial investments at FVOCI 908,429 466,157 1,767,919 5,848,453 - 197,021 - 9,187,979
Loans, advances and financing 11,198,611 3,949,482 1,496,796 6,020,568 15,581,450 - - 38,246,907
Derivative financial assets - - - - - - 1,440,057 1,440,057
Others 77,116 5,664 22,008 107,834 22,823 2,525,210 43,868 2,804,523
Total Assets 21,896,975 6,311,095 3,598,604 12,294,813 15,875,928 2,722,231 2,875,903 65,575,549
LIABILITIES AND
EQUITY
Deposits from customers 35,849,295 3,898,391 5,810,880 527,572 740 - - 46,086,878
Deposits and placements
from banks and other
financial institutions 1,565,698 473 323 204,433 - - - 1,770,927
Bills payable 154,616 - - - - - - 154,616
Subordinated liabilities - - - 817,957 271,655 - - 1,089,612
Derivative financial liabilities - 95 806 25,132 - - 1,302,049 1,328,082
Structured liabilities
designated at FVTPL 247,230 216,635 1,337,053 1,652,113 112,456 - - 3,565,487
Others 60,899 41,221 71,432 40,219 53,810 1,472,559 455,587 2,195,727
Total Liabilities 37,877,738 4,156,815 7,220,494 3,267,426 438,661 1,472,559 1,757,636 56,191,329
Equity - - - - - 9,384,220 - 9,384,220
Total Liabilities and Equity 37,877,738 4,156,815 7,220,494 3,267,426 438,661 10,856,779 1,757,636 65,575,549
Net maturity mismatches (15,980,763) 2,154,280 (3,621,890) 9,027,387 15,437,267 (8,134,548) 1,118,267 -
Off-balance sheet liabilities 71,868,175 34,182,223 45,449,440 38,600,192 3,651,439 - - 193,751,469
Non-trading book
#
97
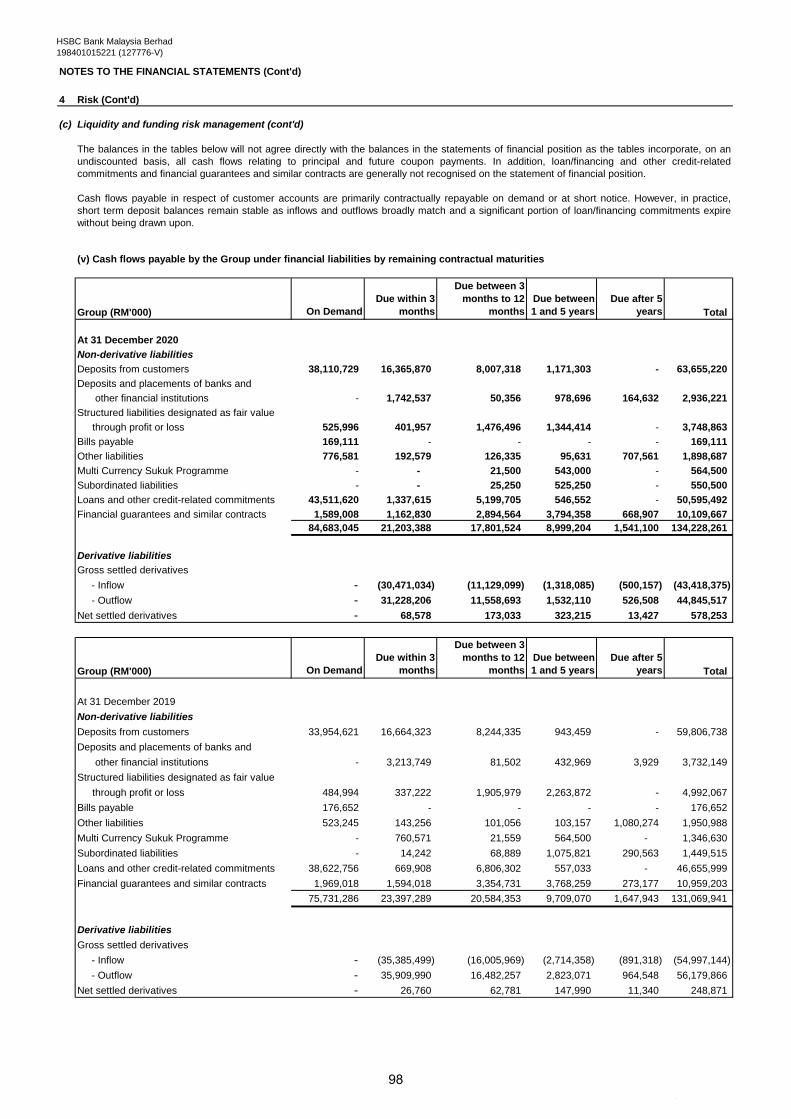
HSBC Bank Malaysia Berhad
198401015221 (127776-V)
NOTES TO THE FINANCIAL STATEMENTS (Cont'd)
4 Risk (Cont'd)
(c) Liquidity and funding risk management (cont'd)
Group (RM'000) On Demand
Due within 3
months
Due between 3
months to 12
months
Due between
1 and 5 years
Due after 5
years Total
At 31 December 2020
Non-derivative liabilities
Deposits from customers 38,110,729 16,365,870 8,007,318 1,171,303 - 63,655,220
Deposits and placements of banks and
other financial institutions - 1,742,537 50,356 978,696 164,632 2,936,221
Structured liabilities designated as fair value
through profit or loss 525,996 401,957 1,476,496 1,344,414 - 3,748,863
Bills payable 169,111 - - - - 169,111
Other liabilities 776,581 192,579 126,335 95,631 707,561 1,898,687
Multi Currency Sukuk Programme - - 21,500 543,000 - 564,500
Subordinated liabilities - - 25,250 525,250 - 550,500
Loans and other credit-related commitments 43,511,620 1,337,615 5,199,705 546,552 - 50,595,492
Financial guarantees and similar contracts 1,589,008 1,162,830 2,894,564 3,794,358 668,907 10,109,667
84,683,045 21,203,388 17,801,524 8,999,204 1,541,100 134,228,261
Derivative liabilities
Gross settled derivatives
- Inflow - (30,471,034) (11,129,099) (1,318,085) (500,157) (43,418,375)
- Outflow - 31,228,206 11,558,693 1,532,110 526,508 44,845,517
Net settled derivatives - 68,578 173,033 323,215 13,427 578,253
Group (RM'000) On Demand
Due within 3
months
Due between 3
months to 12
months
Due between
1 and 5 years
Due after 5
years Total
At 31 December 2019
Non-derivative liabilities
Deposits from customers 33,954,621 16,664,323 8,244,335 943,459 - 59,806,738
Deposits and placements of banks and
other financial institutions - 3,213,749 81,502 432,969 3,929 3,732,149
Structured liabilities designated as fair value
through profit or loss 484,994 337,222 1,905,979 2,263,872 - 4,992,067
Bills payable 176,652 - - - - 176,652
Other liabilities 523,245 143,256 101,056 103,157 1,080,274 1,950,988
Multi Currency Sukuk Programme - 760,571 21,559 564,500 - 1,346,630
Subordinated liabilities - 14,242 68,889 1,075,821 290,563 1,449,515
Loans and other credit-related commitments 38,622,756 669,908 6,806,302 557,033 - 46,655,999
Financial guarantees and similar contracts 1,969,018 1,594,018 3,354,731 3,768,259 273,177 10,959,203
75,731,286 23,397,289 20,584,353 9,709,070 1,647,943 131,069,941
Derivative liabilities
Gross settled derivatives
- Inflow - (35,385,499) (16,005,969) (2,714,358) (891,318) (54,997,144)
- Outflow - 35,909,990 16,482,257 2,823,071 964,548 56,179,866
Net settled derivatives - 26,760 62,781 147,990 11,340 248,871
(v) Cash flows payable by the Group under financial liabilities by remaining contractual maturities
The balances in the tables below will not agree directly with the balances in the statements of financial position as the tables incorporate, on an
undiscounted basis, all cash flows relating to principal and future coupon payments. In addition, loan/financing and other credit-related
commitments and financial guarantees and similar contracts are generally not recognised on the statement of financial position.
Cash flows payable in respect of customer accounts are primarily contractually repayable on demand or at short notice. However, in practice,
short term deposit balances remain stable as inflows and outflows broadly match and a significant portion of loan/financing commitments expire
without being drawn upon.
#
98
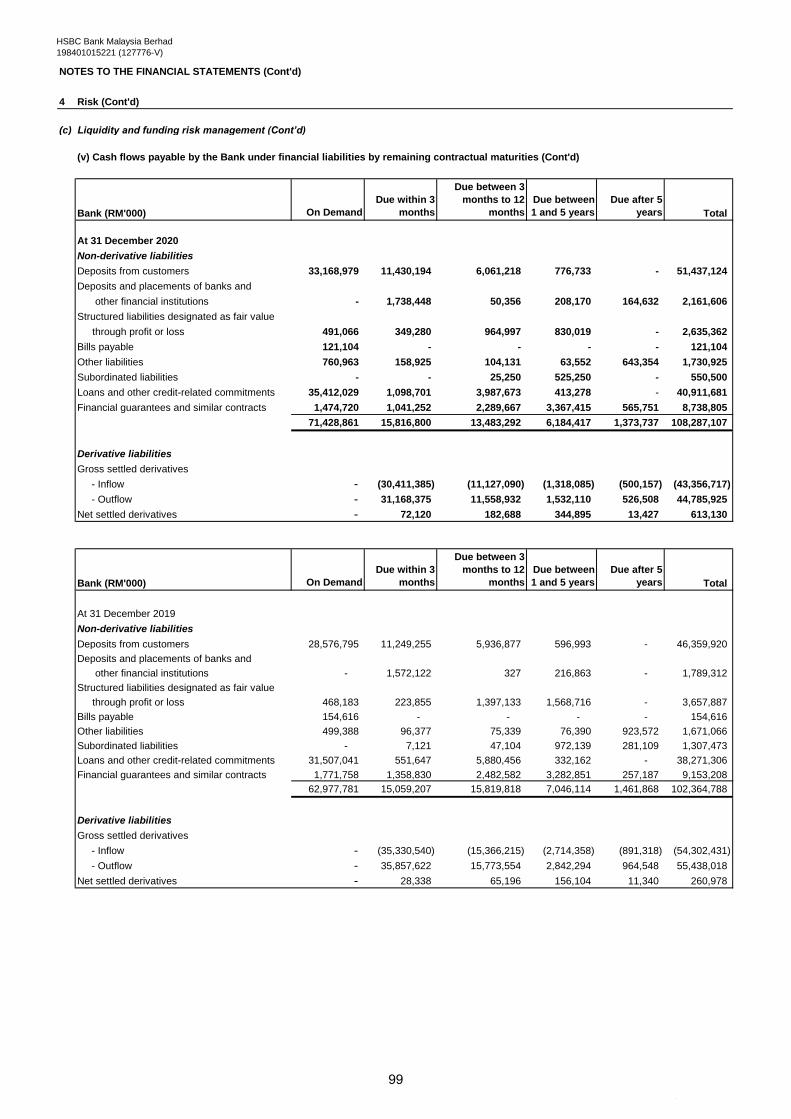
HSBC Bank Malaysia Berhad
198401015221 (127776-V)
NOTES TO THE FINANCIAL STATEMENTS (Cont'd)
4 Risk (Cont'd)
(c) Liquidity and funding risk management (Cont’d)
Bank (RM'000) On Demand
Due within 3
months
Due between 3
months to 12
months
Due between
1 and 5 years
Due after 5
years Total
At 31 December 2020
Non-derivative liabilities
Deposits from customers 33,168,979 11,430,194 6,061,218 776,733 - 51,437,124
Deposits and placements of banks and
other financial institutions - 1,738,448 50,356 208,170 164,632 2,161,606
Structured liabilities designated as fair value
through profit or loss 491,066 349,280 964,997 830,019 - 2,635,362
Bills payable 121,104 - - - - 121,104
Other liabilities 760,963 158,925 104,131 63,552 643,354 1,730,925
Subordinated liabilities - - 25,250 525,250 - 550,500
Loans and other credit-related commitments 35,412,029 1,098,701 3,987,673 413,278 - 40,911,681
Financial guarantees and similar contracts 1,474,720 1,041,252 2,289,667 3,367,415 565,751 8,738,805
71,428,861 15,816,800 13,483,292 6,184,417 1,373,737 108,287,107
Derivative liabilities
Gross settled derivatives
- Inflow - (30,411,385) (11,127,090) (1,318,085) (500,157) (43,356,717)
- Outflow - 31,168,375 11,558,932 1,532,110 526,508 44,785,925
Net settled derivatives - 72,120 182,688 344,895 13,427 613,130
Bank (RM'000) On Demand
Due within 3
months
Due between 3
months to 12
months
Due between
1 and 5 years
Due after 5
years Total
At 31 December 2019
Non-derivative liabilities
Deposits from customers 28,576,795 11,249,255 5,936,877 596,993 - 46,359,920
Deposits and placements of banks and
other financial institutions - 1,572,122 327 216,863 - 1,789,312
Structured liabilities designated as fair value
through profit or loss 468,183 223,855 1,397,133 1,568,716 - 3,657,887
Bills payable 154,616 - - - - 154,616
Other liabilities 499,388 96,377 75,339 76,390 923,572 1,671,066
Subordinated liabilities - 7,121 47,104 972,139 281,109 1,307,473
Loans and other credit-related commitments 31,507,041 551,647 5,880,456 332,162 - 38,271,306
Financial guarantees and similar contracts 1,771,758 1,358,830 2,482,582 3,282,851 257,187 9,153,208
62,977,781 15,059,207 15,819,818 7,046,114 1,461,868 102,364,788
Derivative liabilities
Gross settled derivatives
- Inflow - (35,330,540) (15,366,215) (2,714,358) (891,318) (54,302,431)
- Outflow - 35,857,622 15,773,554 2,842,294 964,548 55,438,018
Net settled derivatives - 28,338 65,196 156,104 11,340 260,978
(v) Cash flows payable by the Bank under financial liabilities by remaining contractual maturities (Cont'd)
#
99
HSBC Bank Malaysia Berhad 198401015221 (127776-V)
NOTES TO THE FINANCIAL STATEMENTS (Cont’d)
4 Risk (Cont’d)
(d) Market risk management
Market risk is the risk that movements in market risk factors, such as foreign exchange rates,
interest/profit rates, credit spreads, equity prices and commodity prices will reduce the Group and the
Bank’s income or the value of their portfolios. Exposure to market risk is separated into two portfolios:
trading portfolios and non-trading portfolios.
Where appropriate, the Group and Bank apply similar risk management policies and measurement
techniques to both trading and non-trading portfolios. The objective of the Group and the Bank’s market
risk management is to manage and control market risk exposures to optimise return on risk while
maintaining a market profile consistent with HSBC Group’s established risk appetite.
There were no material changes to the Group and the Bank’s policies and practices for the management
of market risk in 2020.
Market risk in HBMY and HBMS is managed and controlled through limit mandates approved by the
HBMY and HBMS Board of Directors. HBMY and HBMS have an independent market risk management
and control sub-function, which is responsible for measuring, monitoring and reporting market risk
exposures against limits on a daily basis.
The Product Control function enforces the controls around trading in permissible instruments and also
restricts trading in the more complex derivatives products to offices with appropriate levels of product
expertise and robust control systems.
(i) Sensitivity Analysis
Sensitivity analysis measures the impact of individual market factor movements on specific instruments
or portfolios including interest rates, foreign exchange rates and equity prices. Sensitivity measures are
used to monitor the market risk positions within each risk type.
Granular sensitivity limits are set primarily for trading desks with consideration of market liquidity,
customer demand and capital constraints, among other factors.
(ii) Value at risk (VAR)
VAR is a technique for estimating potential losses on risk positions as a result of movements in market
rates and prices over a specified time horizon and to a given level of confidence. The use of VAR is
integrated into market risk management and is calculated for all trading positions regardless of how the
Group and the Bank capitalise those exposures.
In addition, the Group and the Bank calculate VAR for non-trading portfolios in order to have a complete
picture of market risk. Where VAR is not calculated explicitly, alternative tools are used as summarised
in the Market Risk stress testing section below.
100
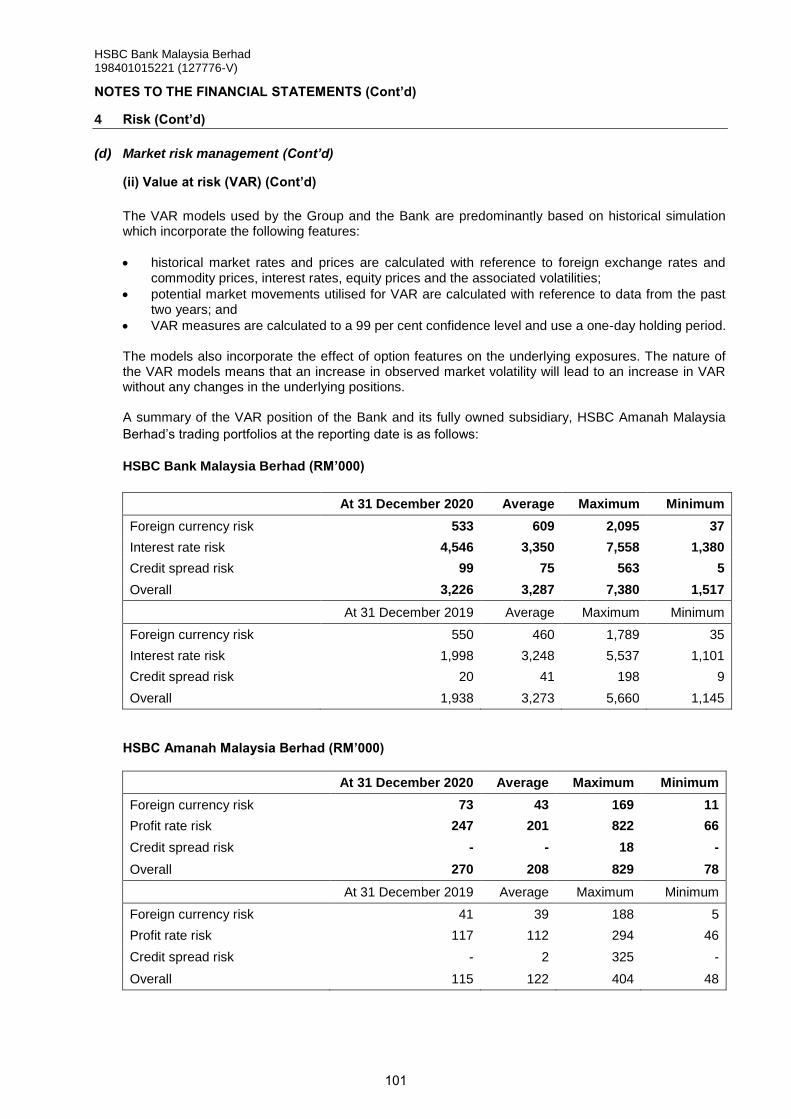
HSBC Bank Malaysia Berhad 198401015221 (127776-V)
NOTES TO THE FINANCIAL STATEMENTS (Cont’d)
4 Risk (Cont’d)
(d) Market risk management (Cont’d)
(ii) Value at risk (VAR) (Cont’d)
The VAR models used by the Group and the Bank are predominantly based on historical simulation which incorporate the following features:
historical market rates and prices are calculated with reference to foreign exchange rates and commodity prices, interest rates, equity prices and the associated volatilities;
potential market movements utilised for VAR are calculated with reference to data from the past two years; and
VAR measures are calculated to a 99 per cent confidence level and use a one-day holding period.
The models also incorporate the effect of option features on the underlying exposures. The nature of the VAR models means that an increase in observed market volatility will lead to an increase in VAR without any changes in the underlying positions. A summary of the VAR position of the Bank and its fully owned subsidiary, HSBC Amanah Malaysia
Berhad’s trading portfolios at the reporting date is as follows:
HSBC Bank Malaysia Berhad (RM’000)
At 31 December 2020 Average Maximum Minimum
Foreign currency risk 533 609 2,095 37
Interest rate risk 4,546 3,350 7,558 1,380
Credit spread risk 99 75 563 5
Overall 3,226 3,287 7,380 1,517
At 31 December 2019 Average Maximum Minimum
Foreign currency risk 550 460 1,789 35
Interest rate risk 1,998 3,248 5,537 1,101
Credit spread risk 20 41 198 9
Overall 1,938 3,273 5,660 1,145
HSBC Amanah Malaysia Berhad (RM’000) At 31 December 2020 Average Maximum Minimum
Foreign currency risk 73 43 169 11
Profit rate risk 247 201 822 66
Credit spread risk - - 18 -
Overall 270 208 829 78
At 31 December 2019 Average Maximum Minimum
Foreign currency risk 41 39 188 5
Profit rate risk 117 112 294 46
Credit spread risk - 2 325 -
Overall 115 122 404 48
101
HSBC Bank Malaysia Berhad 198401015221 (127776-V)
NOTES TO THE FINANCIAL STATEMENTS (Cont’d)
4 Risk (Cont’d)
(d) Market risk management (Cont’d)
(ii) Value at risk (VAR) (Cont’d)
Although a valuable guide to risk, VAR should always be viewed in the context of its limitations. For
example:
the use of historical data as a proxy for estimating future market movement may not encompass all
potential market events, particularly those that are extreme in nature;
the use of a one-day holding period for risk management purposes of trading and non-trading books assumes that this short period is sufficient to hedge or liquidate all positions;
the use of a 99 per cent confidence level, by definition, does not take into account losses that might
occur beyond this level of confidence;
VAR is calculated on the basis of exposures outstanding at the close of business and therefore
does not necessarily reflect intra-day exposures.
(iii) Interest Rate Risk in the Banking Book
Interest/ Profit Rate Risk in the Banking Book (‘IRRBB’) is the risk of an adverse impact to earnings or capital due to changes in market interest rates that affect the banking book positions. The risk arises either from timing mismatches in the repricing of non-traded assets and liabilities, an imperfect correlation between changes in the rates earned and paid on different instruments with otherwise similar repricing characteristics; as well as from option derivative positions or from optional elements embedded in the assets, liabilities and/or off-balance sheet items, where customer can alter the level and timing of their cash flows. In its management of the risk, the Group and the Bank aim to mitigate the impact of future interest rate movements which could reduce future net interest/ profit income or its net worth, while balancing the cost of hedging activities to the current revenue stream. Monitoring the sensitivity of the projected net interest / profit income and of the present value of expected net cash flows under varying interest/ profit rate scenarios is a key part of this.
In order to manage structural interest rate risk, non-traded assets and liabilities are transferred to
Balance Sheet Management (BSM) based on their repricing and maturity characteristics. For assets
and liabilities with no defined maturity or repricing characteristics, behaviouralisation is used to assess
the interest rate risk profile. BSM manages the banking book interest rate positions transferred to it
within the approved limits. ALCO is responsible for monitoring and reviewing their overall structural
interest rate risk position. Interest rate behaviouralisation policies have to be formulated in line with the
Group and the Bank’s behaviouralisation policies and approved annually by ALCO.
Sensitivity of net interest income A principal part of our management of non-traded interest rate risk is to monitor the sensitivity of expected net interest income (‘NII’) under varying interest rate scenarios (simulation modelling), where all other economic variables are held constant. NII sensitivity reflects the group’s sensitivity of earnings due to changes in market interest rates. Projected NII sensitivity figures represent the effect of pro forma movements in projected yield curves based on a constant balance sheet size and structure. The exception to this is where the size of the balances changes materially or repricing is deemed interest rate sensitive, for example, non-interest-bearing current account migration and fixed-rate loan early prepayment. These sensitivity calculations do not incorporate actions that would be taken by BSM or in the business that originate the risk to mitigate the effect of interest rate movements.
102
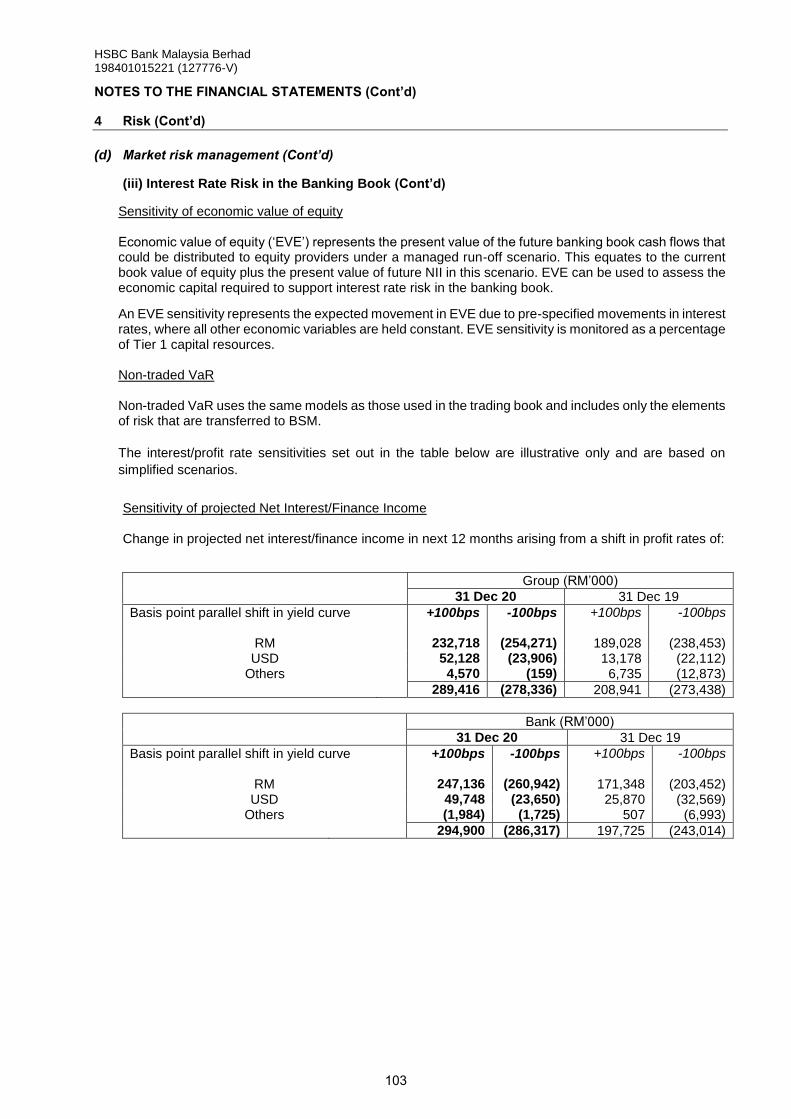
HSBC Bank Malaysia Berhad 198401015221 (127776-V)
NOTES TO THE FINANCIAL STATEMENTS (Cont’d)
4 Risk (Cont’d)
(d) Market risk management (Cont’d)
(iii) Interest Rate Risk in the Banking Book (Cont’d)
Sensitivity of economic value of equity Economic value of equity (‘EVE’) represents the present value of the future banking book cash flows that could be distributed to equity providers under a managed run-off scenario. This equates to the current book value of equity plus the present value of future NII in this scenario. EVE can be used to assess the economic capital required to support interest rate risk in the banking book.
An EVE sensitivity represents the expected movement in EVE due to pre-specified movements in interest rates, where all other economic variables are held constant. EVE sensitivity is monitored as a percentage of Tier 1 capital resources. Non-traded VaR Non-traded VaR uses the same models as those used in the trading book and includes only the elements of risk that are transferred to BSM.
The interest/profit rate sensitivities set out in the table below are illustrative only and are based on
simplified scenarios.
Sensitivity of projected Net Interest/Finance Income Change in projected net interest/finance income in next 12 months arising from a shift in profit rates of:
Group (RM’000)
31 Dec 20 31 Dec 19
Basis point parallel shift in yield curve +100bps -100bps +100bps -100bps
RM 232,718 (254,271) 189,028 (238,453) USD 52,128 (23,906) 13,178 (22,112)
Others 4,570 (159) 6,735 (12,873)
289,416 (278,336) 208,941 (273,438)
Bank (RM’000)
31 Dec 20 31 Dec 19
Basis point parallel shift in yield curve +100bps -100bps +100bps -100bps
RM 247,136 (260,942) 171,348 (203,452) USD 49,748 (23,650) 25,870 (32,569)
Others (1,984) (1,725) 507 (6,993)
294,900 (286,317) 197,725 (243,014)
103
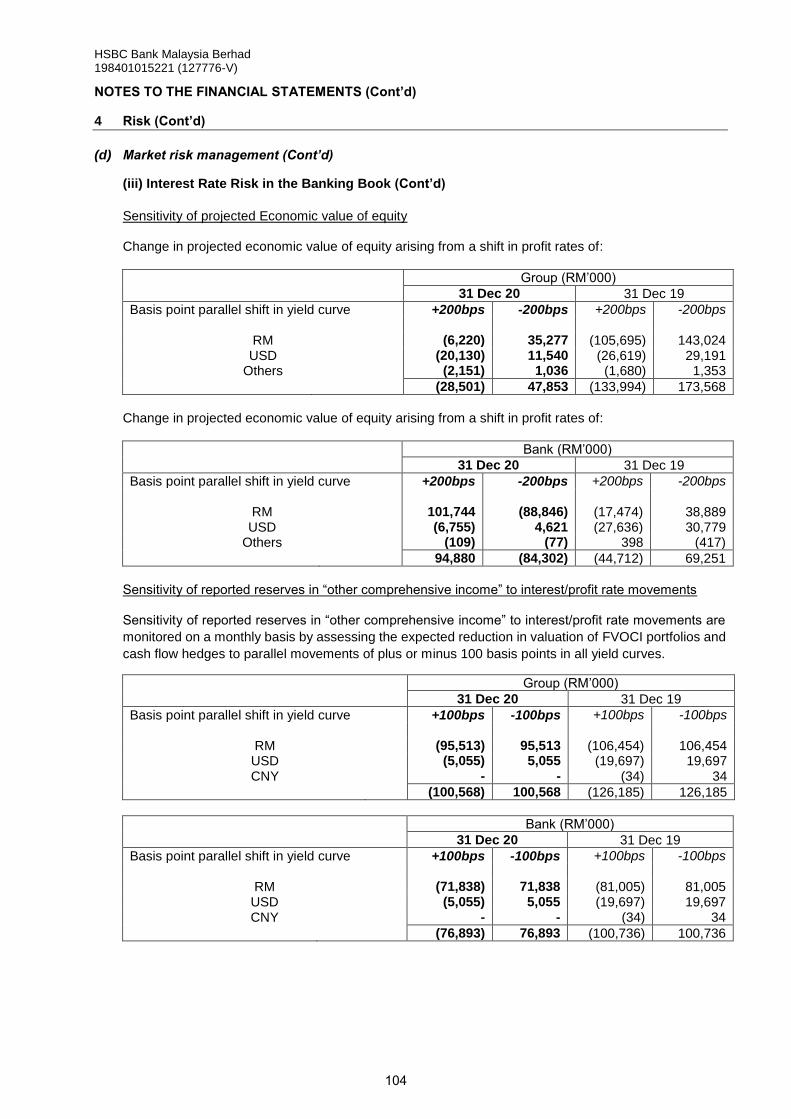
HSBC Bank Malaysia Berhad 198401015221 (127776-V)
NOTES TO THE FINANCIAL STATEMENTS (Cont’d)
4 Risk (Cont’d)
(d) Market risk management (Cont’d)
(iii) Interest Rate Risk in the Banking Book (Cont’d)
Sensitivity of projected Economic value of equity Change in projected economic value of equity arising from a shift in profit rates of:
Group (RM’000)
31 Dec 20 31 Dec 19
Basis point parallel shift in yield curve +200bps -200bps +200bps -200bps
RM (6,220) 35,277 (105,695) 143,024 USD (20,130) 11,540 (26,619) 29,191
Others (2,151) 1,036 (1,680) 1,353
(28,501) 47,853 (133,994) 173,568
Change in projected economic value of equity arising from a shift in profit rates of:
Bank (RM’000)
31 Dec 20 31 Dec 19
Basis point parallel shift in yield curve +200bps -200bps +200bps -200bps
RM 101,744 (88,846) (17,474) 38,889 USD (6,755) 4,621 (27,636) 30,779
Others (109) (77) 398 (417)
94,880 (84,302) (44,712) 69,251
Sensitivity of reported reserves in “other comprehensive income” to interest/profit rate movements Sensitivity of reported reserves in “other comprehensive income” to interest/profit rate movements are
monitored on a monthly basis by assessing the expected reduction in valuation of FVOCI portfolios and
cash flow hedges to parallel movements of plus or minus 100 basis points in all yield curves.
Group (RM’000)
31 Dec 20 31 Dec 19
Basis point parallel shift in yield curve +100bps -100bps +100bps -100bps
RM (95,513) 95,513 (106,454) 106,454
USD (5,055) 5,055 (19,697) 19,697 CNY - - (34) 34
(100,568) 100,568 (126,185) 126,185
Bank (RM’000)
31 Dec 20 31 Dec 19
Basis point parallel shift in yield curve +100bps -100bps +100bps -100bps
RM (71,838) 71,838 (81,005) 81,005 USD (5,055) 5,055 (19,697) 19,697 CNY - - (34) 34
(76,893) 76,893 (100,736) 100,736
104
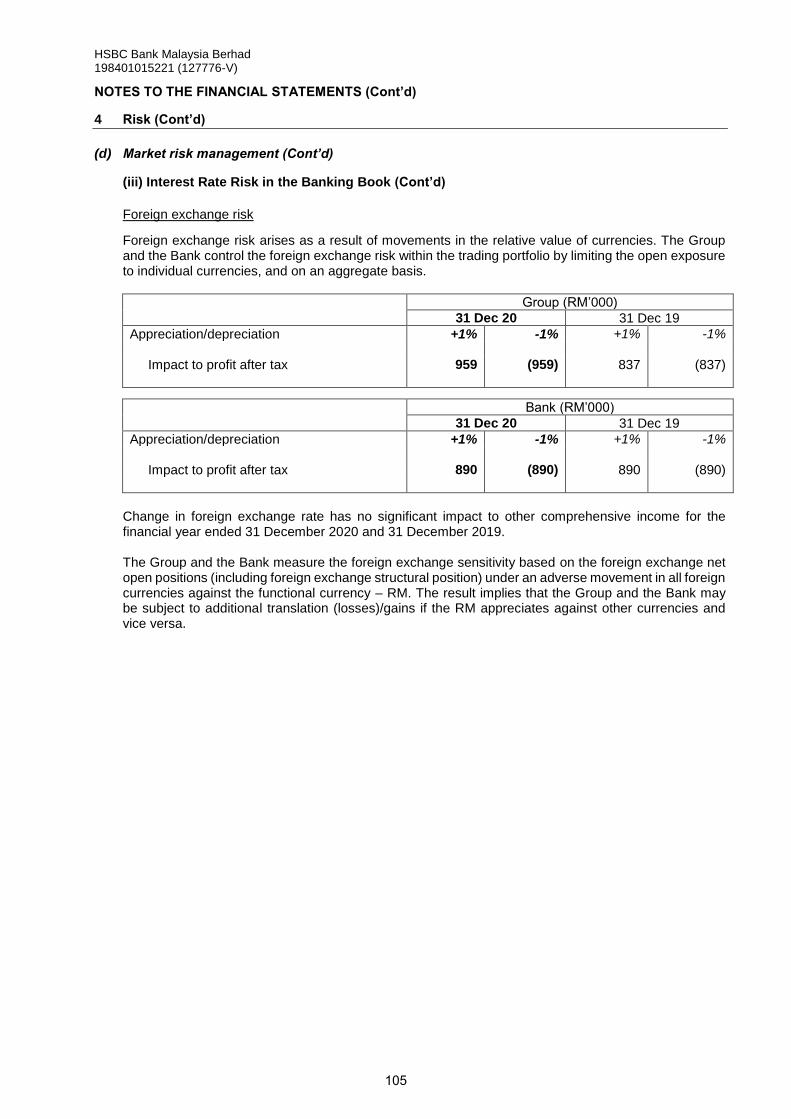
HSBC Bank Malaysia Berhad 198401015221 (127776-V)
NOTES TO THE FINANCIAL STATEMENTS (Cont’d)
4 Risk (Cont’d)
(d) Market risk management (Cont’d)
(iii) Interest Rate Risk in the Banking Book (Cont’d)
Foreign exchange risk
Foreign exchange risk arises as a result of movements in the relative value of currencies. The Group and the Bank control the foreign exchange risk within the trading portfolio by limiting the open exposure to individual currencies, and on an aggregate basis.
Group (RM’000)
31 Dec 20 31 Dec 19
Appreciation/depreciation +1% -1% +1% -1%
Impact to profit after tax 959 (959) 837 (837)
Bank (RM’000)
31 Dec 20 31 Dec 19
Appreciation/depreciation +1% -1% +1% -1%
Impact to profit after tax 890 (890) 890 (890)
Change in foreign exchange rate has no significant impact to other comprehensive income for the financial year ended 31 December 2020 and 31 December 2019. The Group and the Bank measure the foreign exchange sensitivity based on the foreign exchange net open positions (including foreign exchange structural position) under an adverse movement in all foreign currencies against the functional currency – RM. The result implies that the Group and the Bank may be subject to additional translation (losses)/gains if the RM appreciates against other currencies and vice versa.
105

HSBC Bank Malaysia Berhad
198401015221 (127776-V)
NOTES TO THE FINANCIAL STATEMENTS (Cont'd)
4 Risk (Cont'd)
(d) Market risk management (Cont'd)
(iv) Interest/Profit Rate Risk
Effective
Non- interest/
Group Up to >1 - 3 >3 - 12 1 - 5 Over 5 interest/profit Trading profit
1 month months months years years sensitive book Total rate
RM'000 RM'000 RM'000 RM'000 RM'000 RM'000 RM'000 RM'000 %
ASSETS
Cash and short term funds 12,249,497 - - - - 413,757 - 12,663,254 1.79
- impairment allowances - - - - - (58) - (58) -
Securities purchased
under resale agreements 4,985,768 1,840,601 - - - - - 6,826,369 2.22
Deposits and placements with
banks and other financial
institutions - 48,204 - - - - - 48,204 1.87
Financial assets at FVTPL - - - - - - 1,089,673 1,089,673 2.79
Financial investments at FVOCI 499,009 3,351,586 818,109 5,944,838 - 214,003 - 10,827,545 2.28
Financial assets at amortised cost - - 200,000 - - - - 200,000 2.86
- impairment allowances - - - - - (257) - (257) -
Loans, advances and financing
- performing 20,951,801 26,923,184 933,045 621,172 346,476 - - 49,775,678 4.05
- impaired - - - - - 1,831,501 - 1,831,501 -
- impairment allowances - - - - - (854,395) - (854,395) -
Derivative financial assets - - - - - - 2,033,429 2,033,429 -
Other assets - - - - - 137,984 270,406 408,390 -
Total Financial Assets 38,686,075 32,163,575 1,951,154 6,566,010 346,476 1,742,535 3,393,508 84,849,333
LIABILITIES AND EQUITY
Deposits from customers 36,625,811 6,321,406 7,916,697 1,085,311 - 11,461,211 - 63,410,436 1.41
Deposits and placements
from banks and other
financial institutions 1,884,689 - 50,000 919,592 - 4,060 - 2,858,341 0.98
Bills payable - - - - - 169,111 - 169,111 -
Multi-Currency Sukuk Programme - - - 523,841 - - - 523,841 3.16
Subordinated liabilities - - - 500,000 - - - 500,000 3.62
Derivative financial liabilities - - 4,440 44,929 - - 1,790,883 1,840,252 -
Structured liabilities designated at FVTPL 272,513 453,368 1,565,183 1,313,896 143,233 - - 3,748,193 1.99
Other liabilities
- provision for credit commitments - - - - - 8,274 - 8,274 -
- others - - - - - 963,901 619,068 1,582,969 -
Total Financial Liabilities 38,783,013 6,774,774 9,536,320 4,387,569 143,233 12,606,557 2,409,951 74,641,417
Total interest/profit
sensitivity gap (96,938) 25,388,801 (7,585,166) 2,178,441 203,243 (10,864,022) 983,557 10,207,916
The Group and the Bank are exposed to various risks associated with the effects of fluctuation in the prevailing level of market interest/profit rates on its financial
position and cash flows. The following tables summarise the Group and the Bank's exposure to interest/profit rate risk. The assets and liabilities at carrying
amount are allocated to time bands by reference to the earlier of the next contractual repricing dates and maturity dates.
Non-trading book
31 December 2020
#
106
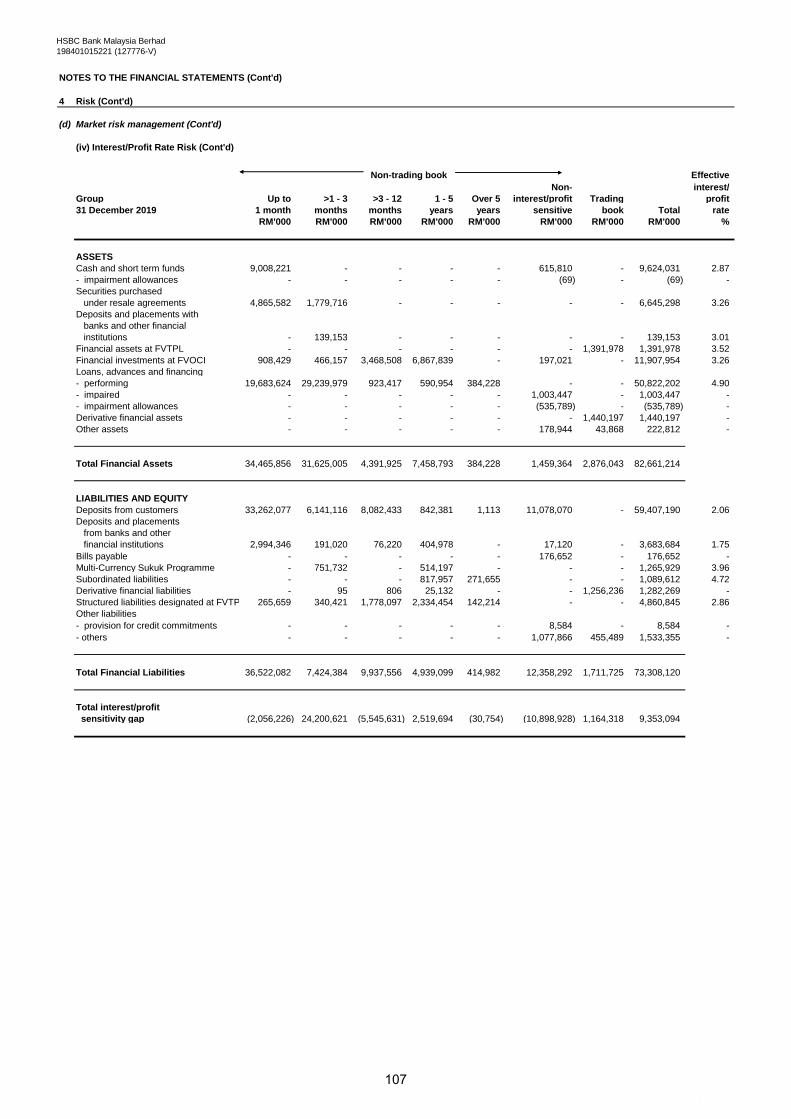
HSBC Bank Malaysia Berhad
198401015221 (127776-V)
NOTES TO THE FINANCIAL STATEMENTS (Cont'd)
4 Risk (Cont'd)
(d) Market risk management (Cont'd)
(iv) Interest/Profit Rate Risk (Cont'd)
Effective
Non- interest/
Group Up to >1 - 3 >3 - 12 1 - 5 Over 5 interest/profit Trading profit
1 month months months years years sensitive book Total rate
RM'000 RM'000 RM'000 RM'000 RM'000 RM'000 RM'000 RM'000 %
ASSETS
Cash and short term funds 9,008,221 - - - - 615,810 - 9,624,031 2.87
- impairment allowances - - - - - (69) - (69) -
Securities purchased
under resale agreements 4,865,582 1,779,716 - - - - - 6,645,298 3.26
Deposits and placements with
banks and other financial
institutions - 139,153 - - - - - 139,153 3.01
Financial assets at FVTPL - - - - - - 1,391,978 1,391,978 3.52
Financial investments at FVOCI 908,429 466,157 3,468,508 6,867,839 - 197,021 - 11,907,954 3.26
Loans, advances and financing
- performing 19,683,624 29,239,979 923,417 590,954 384,228 - - 50,822,202 4.90
- impaired - - - - - 1,003,447 - 1,003,447 -
- impairment allowances - - - - - (535,789) - (535,789) -
Derivative financial assets - - - - - - 1,440,197 1,440,197 -
Other assets - - - - - 178,944 43,868 222,812 -
Total Financial Assets 34,465,856 31,625,005 4,391,925 7,458,793 384,228 1,459,364 2,876,043 82,661,214
LIABILITIES AND EQUITY
Deposits from customers 33,262,077 6,141,116 8,082,433 842,381 1,113 11,078,070 - 59,407,190 2.06
Deposits and placements
from banks and other
financial institutions 2,994,346 191,020 76,220 404,978 - 17,120 - 3,683,684 1.75
Bills payable - - - - - 176,652 - 176,652 -
Multi-Currency Sukuk Programme - 751,732 - 514,197 - - - 1,265,929 3.96
Subordinated liabilities - - - 817,957 271,655 - - 1,089,612 4.72
Derivative financial liabilities - 95 806 25,132 - - 1,256,236 1,282,269 -
Structured liabilities designated at FVTPL 265,659 340,421 1,778,097 2,334,454 142,214 - - 4,860,845 2.86
Other liabilities
- provision for credit commitments - - - - - 8,584 - 8,584 -
- others - - - - - 1,077,866 455,489 1,533,355 -
Total Financial Liabilities 36,522,082 7,424,384 9,937,556 4,939,099 414,982 12,358,292 1,711,725 73,308,120
Total interest/profit
sensitivity gap (2,056,226) 24,200,621 (5,545,631) 2,519,694 (30,754) (10,898,928) 1,164,318 9,353,094
Non-trading book
31 December 2019
#
107
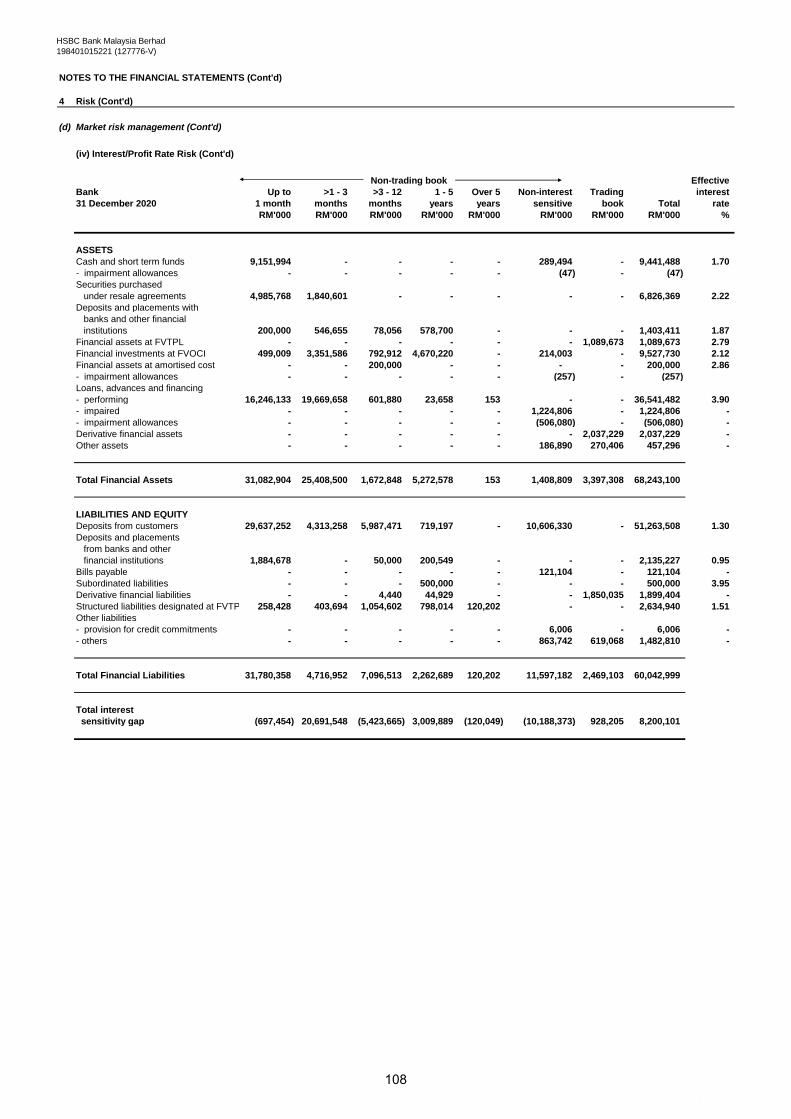
HSBC Bank Malaysia Berhad
198401015221 (127776-V)
NOTES TO THE FINANCIAL STATEMENTS (Cont'd)
4 Risk (Cont'd)
(d) Market risk management (Cont'd)
(iv) Interest/Profit Rate Risk (Cont'd)
Effective
Bank Up to >1 - 3 >3 - 12 1 - 5 Over 5 Non-interest Trading interest
31 December 2020 1 month months months years years sensitive book Total rate
RM'000 RM'000 RM'000 RM'000 RM'000 RM'000 RM'000 RM'000 %
ASSETS
Cash and short term funds 9,151,994 - - - - 289,494 - 9,441,488 1.70
- impairment allowances - - - - - (47) - (47)
Securities purchased
under resale agreements 4,985,768 1,840,601 - - - - - 6,826,369 2.22
Deposits and placements with
banks and other financial
institutions 200,000 546,655 78,056 578,700 - - - 1,403,411 1.87
Financial assets at FVTPL - - - - - - 1,089,673 1,089,673 2.79
Financial investments at FVOCI 499,009 3,351,586 792,912 4,670,220 - 214,003 - 9,527,730 2.12
Financial assets at amortised cost - - 200,000 - - - - 200,000 2.86
- impairment allowances - - - - - (257) - (257)
Loans, advances and financing
- performing 16,246,133 19,669,658 601,880 23,658 153 - - 36,541,482 3.90
- impaired - - - - - 1,224,806 - 1,224,806 -
- impairment allowances - - - - - (506,080) - (506,080) -
Derivative financial assets - - - - - - 2,037,229 2,037,229 -
Other assets - - - - - 186,890 270,406 457,296 -
Total Financial Assets 31,082,904 25,408,500 1,672,848 5,272,578 153 1,408,809 3,397,308 68,243,100
LIABILITIES AND EQUITY
Deposits from customers 29,637,252 4,313,258 5,987,471 719,197 - 10,606,330 - 51,263,508 1.30
Deposits and placements
from banks and other
financial institutions 1,884,678 - 50,000 200,549 - - - 2,135,227 0.95
Bills payable - - - - - 121,104 - 121,104 -
Subordinated liabilities - - - 500,000 - - - 500,000 3.95
Derivative financial liabilities - - 4,440 44,929 - - 1,850,035 1,899,404 -
Structured liabilities designated at FVTPL 258,428 403,694 1,054,602 798,014 120,202 - - 2,634,940 1.51
Other liabilities
- provision for credit commitments - - - - - 6,006 - 6,006 -
- others - - - - - 863,742 619,068 1,482,810 -
Total Financial Liabilities 31,780,358 4,716,952 7,096,513 2,262,689 120,202 11,597,182 2,469,103 60,042,999
Total interest
sensitivity gap (697,454) 20,691,548 (5,423,665) 3,009,889 (120,049) (10,188,373) 928,205 8,200,101
Non-trading book
#
108

HSBC Bank Malaysia Berhad
198401015221 (127776-V)
NOTES TO THE FINANCIAL STATEMENTS (Cont'd)
4 Risk (Cont'd)
(d) Market risk management (Cont'd)
(iv) Interest/Profit Rate Risk (Cont'd)
Effective
Bank Up to >1 - 3 >3 - 12 1 - 5 Over 5 Non-interest Trading interest
31 December 2019 1 month months months years years sensitive book Total rate
RM'000 RM'000 RM'000 RM'000 RM'000 RM'000 RM'000 RM'000 %
ASSETS
Cash and short term funds 4,375,759 - - - - 471,541 - 4,847,300 2.77
- impairment allowances - - - - - (63) - (63) -
Securities purchased
under resale agreements 4,865,582 1,779,716 - - - - - 6,645,298 3.26
Deposits and placements with
banks and other financial
institutions 25,000 110,076 286,881 317,958 271,655 - - 1,011,570 3.01
Financial assets at FVTPL - - - - - - 1,391,978 1,391,978 3.52
Financial investments at FVOCI 908,429 466,157 1,767,919 5,848,453 - 197,021 - 9,187,979 3.20
Loans, advances and financing
- performing 15,803,981 21,430,285 667,151 5,708 162 - - 37,907,287 4.75
- impaired - - - - - 618,144 - 618,144 -
- impairment allowances - - - - - (278,524) - (278,524) -
Derivative financial assets - - - - - - 1,440,057 1,440,057 -
Other assets - - - - - 206,675 43,868 250,543 -
Total Financial Assets 25,978,751 23,786,234 2,721,951 6,172,119 271,817 1,214,794 2,875,903 63,021,569
LIABILITIES
Deposits from customers 26,053,536 3,898,391 5,810,880 527,572 740 9,795,759 - 46,086,878 1.90
Deposits and placements
from banks and other
financial institutions 1,565,698 473 323 204,433 - - - 1,770,927 1.52
Bills payable - - - - - 154,616 - 154,616 -
Subordinated liabilities - - - 817,957 271,655 - - 1,089,612 4.79
Derivative financial liabilities - 95 806 25,132 - - 1,302,049 1,328,082 -
Structured liabilities designated at FVTPL 247,230 216,635 1,337,053 1,652,113 112,456 - - 3,565,487 2.64
Other liabilities
- provision for credit commitments - - - - - 6,032 - 6,032 -
- others - - - - - 955,011 455,587 1,410,598 -
Total Financial Liabilities 27,866,464 4,115,594 7,149,062 3,227,207 384,851 10,911,418 1,757,636 55,412,232
Total interest
sensitivity gap (1,887,713) 19,670,640 (4,427,111) 2,944,912 (113,034) (9,696,624) 1,118,267 7,609,337
Non-trading book
#
109
HSBC Bank Malaysia Berhad 198401015221 (127776-V)
NOTES TO THE FINANCIAL STATEMENTS (Cont’d)
4 Risk (Cont’d)
(d) Market risk management (Cont’d)
(v) Stress testing Stress testing is an important procedure that is integrated into our market risk management framework to evaluate the potential impact on portfolio values of more extreme, although plausible, events or movements in a set of financial variables. In such scenarios, losses can be much greater than those predicted by VaR modelling. Stress testing is implemented at the legal entity level with the scenarios tailored to capture the relevant potential events or market movements. The risk appetite around potential stress losses is set and monitored against a referral limit. Market risk reverse stress tests is part of the overall consideration of legal entity’s reverse stress tests which are undertaken based upon the premise that there is a fixed loss. The stress testing process identifies which scenarios lead to this loss. The rationale behind the reverse stress test is to understand scenarios which are beyond normal business settings that could have contagion and systemic implications. Stress testing and reverse stress testing provide senior management with insights regarding the ‘tail risk’ beyond VaR for which our risk appetite is limited. (vi) Back-testing The accuracy of VaR models are routinely validated by backtesting them with both actual and hypothetical profit and loss against the corresponding VaR numbers. Hypothetical profit and loss excludes non-modelled items such as fees, commissions and revenue of intra-day transactions. The actual number of profits or losses in excess of VaR over this period can be used to gauge how well the models are performing. A VaR model is deemed satisfactory if it experiences less than five profit or loss exceptions in a 250-day period.
110
HSBC Bank Malaysia Berhad 198401015221 (127776-V)
NOTES TO THE FINANCIAL STATEMENTS (Cont’d)
4 Risk (Cont’d)
(e) Resilience risk
(i) Overview
Resilience risk is the risk that we are unable to provide critical services to our customers, affiliates and counterparties, during sustained and significant operational disruption. Sustained and significant operational disruptions are events that could affect:
The stability of the wider financial system
The viability of the bank and our industry peers
The ability of our customers to access critical services
The underlying trust of our customers, shareholders and regulators as a result of a poorly managed operational events.
(ii) Resilience risk management
Key developments in 2020 In 2020 HSBC at the group level have:
Developed regional hubs accountable for core Operational & Resilience Risk delivery.
Implemented business and function aligned teams focused on emerging risks as well as material products and services.
Deployed risk management oversight of the most material change programmes across HSBC Group.
Implemented central services including governance, reporting and transformation.
Created a standalone assurance capability providing independent review and evaluation of end-to-end processes, risks and key controls.
Ensured we have in-place specialist risk teams providing expert oversight and guidance for highly technical areas of risk management.
HSBC Group prioritise these efforts on material risks and areas undergoing strategic growth, aligning our location strategy to this need. In Malaysia, we formed new Operational & Resilience Risk combined sub-function in 2020, for which the Target Operating Model will take effect from 1 January 2021. This will provide robust non-financial risk steward oversight of the Group and the Bank’s business, functions, legal entities and critical business services management of risk, supported by effective and timely independent challenge.
111

HSBC Bank Malaysia Berhad 198401015221 (127776-V)
NOTES TO THE FINANCIAL STATEMENTS (Cont’d)
4 Risk (Cont’d)
(e) Resilience risk (Cont’d)
(ii) Resilience risk management (Cont’d)
Governance and structure In HSBC Group, the Operational & Resilience Risk target operating model provides a globally consistent view across resilience risks, strengthening HSBC Group risk management oversight while operating effectively as part of a simplified non-financial risk structure. HSBC Group view resilience risk across seven risk types related to:
Third parties / supply-chain
Information, Technology and Cyber Security
Payments and manual processing
Physical security
Business Interruption / Contingency Risk
Buildings unavailability, and
Workplace safety
The Operational & Resilience Risk structure simplifies interactions with our key stakeholders by providing specialist skill and a single channel of contact. Resilience Risk actively challenges the business and delivers clear, consistent and credible responses, ensuring controls are being operated and risks are being managed. A principal senior management meeting for Operational & Resilience Risk governance is the Non-Financial Risk Management Board (NFRMB), chaired by the HSBC Group Chief Risk Officer, with an escalation path to the Group Risk Management Meeting (GRMM). In Malaysia, this is governed through the country Risk Management Meeting. Key risk management processes Operational Resilience is the Group and Bank’s ability to anticipate, prevent, adapt, respond to, recover and learn from internal or external disruption, protecting customers, the markets we operate in and their economic stability. Resilience is measured by assessing whether we are able to continue to provide our most important services, within an agreed tolerance, during a severe but a plausible level. We accept that we will not be able to prevent all disruption, but we prioritise investment to continuously improve our response and recovery capability for our most important business services. Continuity of business operations during COVID-19 pandemic As a result of COVID-19, business continuity responses have been successfully implemented and the majority of service level agreements continue to be maintained. The Group and Bank have not experienced any major impacts to the supply chain from our third-party service providers due to COVID-19. The risk of damage or theft to our physical assets or criminal injury to our employees remains unchanged and no significant incidents have impacted our buildings or staff.
112
HSBC Bank Malaysia Berhad 198401015221 (127776-V)
NOTES TO THE FINANCIAL STATEMENTS (Cont’d)
4 Risk (Cont’d)
(f) Regulatory Compliance Risk
(i) Overview Regulatory compliance risk is the risk of failure to observe the letter and spirit of all relevant laws, codes, rules, regulations and standards of good market practice, which as consequence incur fines and penalties and suffer damage to our business. Regulatory compliance risk arises from the risks associated with breaching the Group and the Bank’s duty to customers and other counterparties, inappropriate market conduct and breaching other regulatory licensing, permission and rules. (ii) Regulatory compliance risk management
Key developments in 2020 The key developments in the policies and practices for the management of regulatory compliance risk in 2020, included changes to our wider approach to the governance and structure of the Compliance function more generally and ongoing work to continue to ra ise standards related to the conduct of our business, in each case as described below. Governance and structure In May, a new operating model was introduced to transform the Compliance function. As a result, a new group capability has been formed, named Regulatory Conduct, which brings together the current group-level capabilities in regulatory compliance, regulatory affairs and the monitor liaison office team. The HSBC Group Head of Regulatory Conduct continues to report to the HSBC Group Chief Compliance Officer. The HSBC Group Regulatory Conduct capability works with the various newly appointed Regional Chief Compliance Officers and their teams to help them identify and manage regulatory compliance risks across the bank, to ensure good conduct outcomes and to provide enterprise-wide support on the regulatory agenda and similarly, in Malaysia, the Regulatory Conduct capability works with the Chief Compliance Officer. Key risk management processes The HSBC Group Regulatory Conduct capability is responsible for setting global policies, standards and risk appetite to guide the Group and the Bank’s regulatory compliance risk management, devising clear frameworks and supporting processes to protect against regulatory compliance risks. The capability also provides oversight, review and challenge to the Regional and country Chief Compliance Officers and their teams to help them identify, assess and mitigate regulatory compliance risks, where required. Policies and procedures are regularly reviewed. Global policies and procedures require the prompt identification and escalation of any actual or potential regulatory breach to Regulatory Compliance. Reportable events are escalated to the RMM and the Risk Committee, as appropriate. Conduct of business In 2020, good conduct through people’s behaviour and decision making continued to be promoted and encouraged in order to deliver fair outcomes for customers, and to maintain financial market integrity. During 2020: • We continued to champion a strong conduct and customer-focused culture. We have implemented
a number of measures throughout the COVID-19 pandemic to support our customers in financial difficulties, and have maintained service and supported colleagues in unprecedented conditions.
• We have also continued our focus on culture and behaviours, adapting our controls and risk
management processes to reflect significant levels of remote working throughout the year.
113
HSBC Bank Malaysia Berhad 198401015221 (127776-V)
NOTES TO THE FINANCIAL STATEMENTS (Cont’d)
4 Risk (Cont’d)
(f) Regulatory Compliance Risk (Cont’d)
(ii) Regulatory compliance risk management (Cont’d)
Conduct of business (Cont’d)
• We have continued to invest significant resources to improve our compliance systems and controls relating to our activities in global markets and to ensure market integrity. These include enhancements to pricing and disclosure, order management and trade execution; trade, voice and audio surveillance; front office supervision; and improvements to our enforcement and discipline framework for employee misconduct.
• We have also continued to emphasise and work to create an environment in which employees are encouraged and feel safe to speak up and have placed a particular focus on the importance of well-being during the current pandemic, through regular top down communications, virtual town halls, videos and podcasts.
• We continue to further embed conduct within our business line processes and work closely to consider and mitigate the conduct impacts of the Group’s strategic transformation programme and in key business change programmes such as the IBOR transition.
• We delivered our sixth annual global mandatory training course on conduct, and reinforced the importance of conduct by highlighting examples of good conduct.
• We are refreshing our approach to conduct arrangements across the Group and the Bank with a view to ensure that the arrangements remain appropriate for the nature of our business.
• The Board continues to maintain oversight of conduct matters through the Risk Committee.
(g) Financial crime and fraud risk
(i) Overview Financial crime and fraud risk is the risk that we knowingly or unknowingly help parties to commit or to further potentially illegal activity including money laundering, fraud, bribery and corruption, tax evasion, sanctions breaches, and terrorist and proliferation financing. Financial crime and fraud risk arises from day-to-day banking operations. (ii) Financial crime and fraud risk management Key developments in 2020 During 2020, we continue to strengthen our fight against financial crime and to enhance our financial crime risk management capability. The Group and Bank have faced challenges posed by COVID-19, and a number of measures were introduced during this period to support the business and our customers, these included:
• Supporting the most vulnerable customers and those in financial difficulty, including the raising of
fraud awareness during this period.
• Proactive engagement with the business to ensure financial crime risks were considered as part of COVID-19 related decisions.
• Supporting customers and the business through policy exceptions, including the allowance of email instructions (within controls) instead of face-to-face, and the introduction of virtual onboarding.
114
HSBC Bank Malaysia Berhad 198401015221 (127776-V)
NOTES TO THE FINANCIAL STATEMENTS (Cont’d)
4 Risk (Cont’d)
(g) Financial crime and fraud risk (Cont’d)
(ii) Financial crime and fraud risk management (Cont’d) Key developments in 2020 (Cont’d) As a result of the evolving geopolitical situation in 2020, we implemented measures to strengthen the Group and Bank’s financial crime risk management framework. The sanctions regulatory environment has remained volatile and uncertain during the course of 2020 due to the ongoing geopolitical tensions between the US and China and the increasing divergence in sanctions policies between the US and the EU on Iran and Russia. We comply with all applicable sanctions regulations in the jurisdictions in which we operate, and continue to monitor the geopolitical landscape for ongoing developments. We also continue to progress several key financial crime risk management initiatives, including:
• We continue to strengthen our anti-fraud capabilities, focusing on threats posed by new and existing technologies, and have delivered a comprehensive fraud training programme to our people.
• We continue to benefit from our continued investment in the use of artificial intelligence (AI) and advanced analytics techniques to manage financial crime and we also published our principles for the ethical use of Big Data and AI.
• We continue to work on strengthening our ability to combat money laundering and terrorist financing. In particular, we focused on the use of technology to enhance our risk management processes whilst minimising the impact to the customer. We also continue to develop our approach of intelligence led financial crime risk management, in part, through enhancements to our automated transaction monitoring systems.
Governance and structure Since establishing a global framework of Financial Crime Risk Management Committees in 2018, we have continued to strengthen and review the effectiveness of our governance framework to manage financial crime risk. Formal governance committee is held and chaired by the chief executive officer. They help to enable compliance with the letter and the spirit of all applicable financial crime compliance laws and regulations, as well as our own standards, values and policies relating to financial crime risks. At a HSBC Group level, the Financial Crime Risk Management Meeting, chaired by the HSBC Group Chief Compliance Officer, has served as the pinnacle of this governance structure, ultimately responsible for the management of financial crime risk. As a reflection of the growing maturity and effectiveness of our financial crime risk management, this meeting will be integrated with the HSBC Group Risk Management Meeting in January 2021. During the course of 2021, we will review the management of financial crime risk across the Group and Bank to identify other areas that could be simplified. During 2020, we re-designed and delivered an integrated operating model for our Compliance function, with the accompanying re-structure providing greater accountability to our regional Compliance teams. These teams, led by Regional Chief Compliance Officers, will support the Group Chief Compliance Officer in aligning the way in which we manage all compliance risks, including financial crime risk, to the needs and aims of the wider business, and in making our compliance risk management processes and procedures more efficient and effective. Key risk management processes We continue to deliver a programme to further enhance the policies and controls around identifying and managing the risks of bribery and corruption across our business. Recognising that the fight against financial crime is a constant challenge, we maintained our investment in operational controls and new technology to deter and detect criminal activity in the banking system. We continue to simplify our governance and policy frameworks, and our management information reporting process which demonstrates the effectiveness of our financial crime controls.
115
HSBC Bank Malaysia Berhad 198401015221 (127776-V)
NOTES TO THE FINANCIAL STATEMENTS (Cont’d)
4 Risk (Cont’d)
(g) Financial crime and fraud risk (Cont’d)
(ii) Financial crime and fraud risk management (Cont’d) Key risk management processes (Cont’d)
We remain committed to enhancing our risk assessment capabilities and aim to deliver more proactive risk management, including our ongoing investment in the next generation of capabilities to fight financial crime by applying advanced analytics and AI.
We are committed to working in partnership with the wider industry and the public sector in managing financial crime risk, protecting the integrity of the financial system, and helping to protect the communities we serve. We are a strong advocate of public-private partnerships and participate in a number of information-sharing initiatives around the world. We are a constructive partner to national governments and international standard setters, and support reforms being undertaken in key markets such as Singapore where we work closely with peer banks and with the Monetary Authority of Singapore. In Malaysia, Public-private partnership (PPP) initiative was formalised in November 2019 and HSBC Malaysia has been actively supporting the national agenda. Financial Services Professional Board (FSPB), through a Working Group led by HSBC Malaysia CCO with representatives from participating FIs, has produced a Guidance Document and issued in October 2020, setting out best practices to support the effective implementation of “adequate and proportionate procedures” to Bribery and Corruption (“B&C”) risks for financial institutions in response to requirement under Section 17A(5) of the Malaysian Anti-Corruption Commission Act (MACC) that came into force on 1 June 2020.
We have been an advocate for a more effective international framework for managing financial crime risk, whether through engaging directly with the Financial Action Task Force, or via our key role in industry groups such as the Wolfsberg Group and the Institute of International Finance.
(h) Model risk
(i) Overview
Model risk is the potential for adverse consequences from business decisions informed by models, which can be exacerbated by errors in methodology, design or the way they are used. Model risk arises in both financial and non-financial contexts whenever business decision making includes reliance on models. (ii) Key developments in 2020 In 2020, a number of initiatives were undertaken to further develop and embed the new Model Risk Management sub-function, including:
Refining the model risk policy to enable a more risk-based approach to model risk management.
Conducting a full review of model governance arrangements overseeing model risk across the HSBC Group, resulting in a range of enhancements to the underlying structure to improve effectiveness and increase business engagement.
Worked with the businesses and functions and developed new model risk controls in the Risk Control Library. These controls formed the basis for Model Risk Control Assessments that have been implemented for businesses and functions.
Updated the target operating model for Model Risk Management, referring to internal and industry best practice.
The Independent Model Validation team has begun a transformation program that will utilise advanced analytics and new workflow tools with the objective of providing a more risk based, efficient and effective management of model validation processes.
The consequences of COVID-19 on IFRS9 model performance and reliability has resulted in enhanced monitoring of those models and related model adjustments. Dramatic changes to model inputs such as GDP and unemployment rates have made the model results less reliable. As a result, greater reliance has been placed on management underlays/overlays based on business judgement to derive expected credit losses.
116

HSBC Bank Malaysia Berhad 198401015221 (127776-V)
NOTES TO THE FINANCIAL STATEMENTS (Cont’d)
4 Risk (Cont’d)
(h) Model risk (Cont’d)
(iii) Governance and structure We have placed greater focus on our model risk activities during 2020. To reflect this, HSBC Group has created the role of Chief Model Risk Officer, which is undertaken by the Head of Model Risk Management. We elevated Model Risk Management to a function in its own right within the Global Risk Structure, where it had previously been structured as a sub-function within Global Risk Strategy, the team now reports directly to the Chief Risk Officer. HSBC Group have also set up a Regional Model Risk Committee in Asia-Pacific to demonstrate effective oversight of our models. The Regional Model Risk Committee is supported by other forums such as Wholesale Model Oversight Forum (WMOF) and Retail Model Oversight Forum (RMOF). (iv) Key risk management processes We use a variety of modelling approaches, including regression, simulation, sampling, machine learning and judgemental scorecards for a range of business applications, in activities such as customer selection, product pricing, financial crime transaction monitoring, creditworthiness evaluation and financial reporting. Regular reviews are conducted for model risk management policies and procedures and the first line of defence is required to demonstrate a set of comprehensive and effective controls based on a library of model risk controls provided by Model Risk Management. Model Risk Management report on model risk to senior management on a regular basis through use of the risk map and regular key updates. The effectiveness of these processes is reviewed on a regular basis to ensure that appropriate understanding and ownership of model risk is embedded in the businesses and functions.
117
HSBC Bank Malaysia Berhad 198401015221 (127776-V)
NOTES TO THE FINANCIAL STATEMENTS (Cont’d) 5 Capital management
The Group and the Bank’s approach to capital management is driven by their strategic and
organisational requirements, taking into account the regulatory, economic and commercial environment
in which they operate.
It is the Group and the Bank’s objective to maintain a strong capital base to support the development of their business and to meet regulatory capital requirements at all times. The policy on capital management is underpinned by a capital management framework, which enables the Group and the Bank to manage their capital in a consistent manner. The Group and the Bank’s capital management process is articulated in their annual capital plan which is approved by the Board. The plan is drawn up with the objective of maintaining both an appropriate amount of capital and an optimal mix between the different components of capital.
In accordance with Capital Management Framework, capital generated by subsidiaries in excess of
planned requirements is returned to the parent companies, normally by way of dividends.
The Bank is primarily the provider of capital to its subsidiaries and these investments are substantially
funded by the Bank’s own capital issuance and profit retention. As part of its capital management
process, the Bank seeks to maintain a prudent balance between the composition of its capital and that
of its investment in subsidiaries.
The principal forms of capital are included in the following balances on the consolidated balance sheet:
share capital, other equity instruments, retained profits, other reserves and subordinated liabilities.
The Group and the Bank’s regulatory capital is analysed in two tiers:
Tier 1 capital is divided into Common Equity Tier 1 (CET1) Capital and Additional Tier 1 Capital. CET1 Capital includes ordinary share capital, retained earnings, and other regulatory adjustments relating to items that are included in equity but are treated differently for capital adequacy purposes. The Bank has also issued a perpetual capital term loan on 21 June 2019 which qualifies as Additional Tier 1 Capital. From 1 January 2020 to 31 December 2023, the Group and the Bank’s CET1 will also include a portion of the impairment allowances equal to 12-months and lifetime expected credit losses for non-credit impaired loans (commonly known as Stage 1 and 2 provisions). This is as allowed by BNM in its latest Capital Adequacy Framework (Capital Component) guideline issued on 9 December 2020 which allows banks to apply for a transitional arrangement where Stage 1 and 2 provisions for expected credit loss (ECL) are added back to CET1 Capital subject to capping and with an add-back factor that will gradually reduce over the transitional duration. The Group and the Bank has elected to adopt the transitional arrangement for four financial years beginning 1 January 2020.
Tier 2 capital, which includes qualifying subordinated liabilities and subordinated term financing, impairment allowances equal to 12-months and lifetime expected credit losses for non-credit impaired loans (commonly known as Stage 1 and 2 provisions), regulatory reserve, and the element of the fair value reserve relating to revaluation of property which are disclosed as regulatory adjustments.
(a) Externally imposed capital requirements
The Group and the Bank are required to comply with BNM’s Capital Adequacy Framework (Capital Components) Guideline for the purpose of computing regulatory capital adequacy ratios. Under the said Guideline, the Group and the Bank are required to maintain the minimum capital adequacy ratios for Common Equity Tier 1 (CET1), Tier 1 and Total Capital Ratios of 4.5%, 6.0% and 8.0% respectively.
118
HSBC Bank Malaysia Berhad 198401015221 (127776-V)
NOTES TO THE FINANCIAL STATEMENTS (Cont’d) 5 Capital management (Cont’d)
(b) Basel III
With effect from 1 January 2016, banking institutions in Malaysia are also required to maintain capital buffers above the minimum capital adequacy ratios. The capital buffer requirements comprise Capital Conservation Buffer (CCB) of 2.5%, and the Countercyclical Capital Buffer (CCyB) ranging between 0% to 2.5%. CCB is intended to build up capital buffers by individual banking institutions during normal times that can be drawn down during stress periods while CCyB is intended to protect the banking sector as a whole from the build-up of systemic risk during an economic upswing when aggregate credit growth tends to be excessive. On 24 March 2020, BNM in its circular on COVID-19 relief measures has allowed for banks to drawdown on the prudential buffer for CCB of 2.5%; to be gradually reinstated by 30 September 2021. Nevertheless, the Group and the Bank have continued to maintained this buffer as at 31 December 2020.
In line with the regulatory requirement, the Group and the Bank have also set further buffers to reflect risks
not included in the regulatory capital calculation, arising from internal assessment of risks and the results of
stress tests.
(c) Leverage ratio
Basel III introduces a simple non risk-based leverage ratio as a complementary measure to the risk-
based Capital Adequacy Framework. It aims to constrain the build-up of excess leverage in the banking
sector, introducing additional safeguards against model risk and measurement errors. The ratio is a
volume-based measure calculated as Basel III Tier 1 Capital divided by Total on- and off-balance sheet
exposures.
The Group and the Bank are required to comply with BNM Leverage Ratio Framework which came into
effect on 1 January 2018. This includes the implementation of the leverage ratio framework in Malaysia
with the minimum leverage ratio requirement of 3%.
119
HSBC Bank Malaysia Berhad 198401015221 (127776-V)
NOTES TO THE FINANCIAL STATEMENTS (Cont’d) 6 Use of estimates and judgements
The results of the Group and the Bank are sensitive to the accounting policies, assumptions and estimates that underlie the preparation of its consolidated financial statements. The significant accounting policies used in the preparation of the consolidated financial statements are described in Note 3. The accounting policies that are deemed critical to the Group and the Bank’s results and financial positions, in terms of the materiality of the items to which the policy is applied, and which involve a high degree of judgement including the use of assumptions and estimation, are discussed below.
(a) Impairment of loans, advances and financing
The Group and the Bank’s accounting policy for losses arising from the impairment of customer loans, advances and financing is described in Note 3(l). The calculation of the Group and the Bank’s ECL under MFRS 9 require a number of judgements, assumptions and estimates to be made. The most significant are set out below: Judgements:
Defining what is considered to be a significant increase in credit risk
Determining the lifetime and point of initial recognition of overdrafts and credit cards
Selecting and calibrating the PD, LGD and EAD models, which support the calculations, including making reasonable and supportable judgements about how models react to current and future economic conditions
Selecting model inputs and economic forecasts, including determining whether sufficient and appropriately weighted economic forecasts are incorporated to calculate unbiased expected loss
Estimates:
Note 4(b)(v) sets out the assumptions used in determining ECL and provide an indication of the sensitivity of the result to the application of different weightings being applied to different economic assumptions
(b) Fair value of financial instruments carried at fair value
The fair value of financial instruments is generally measured on the basis of the individual financial instrument. However, in cases where the Group and the Bank manage a group of financial assets and financial liabilities on the basis of its net exposure to either market risks or credit risk, the Group and the Bank measure the fair value of the group of financial instruments on a net basis, but present the underlying financial assets and liabilities separately in the financial statements, unless they satisfy the offsetting criteria as described in Note 3(g)(iv).
120
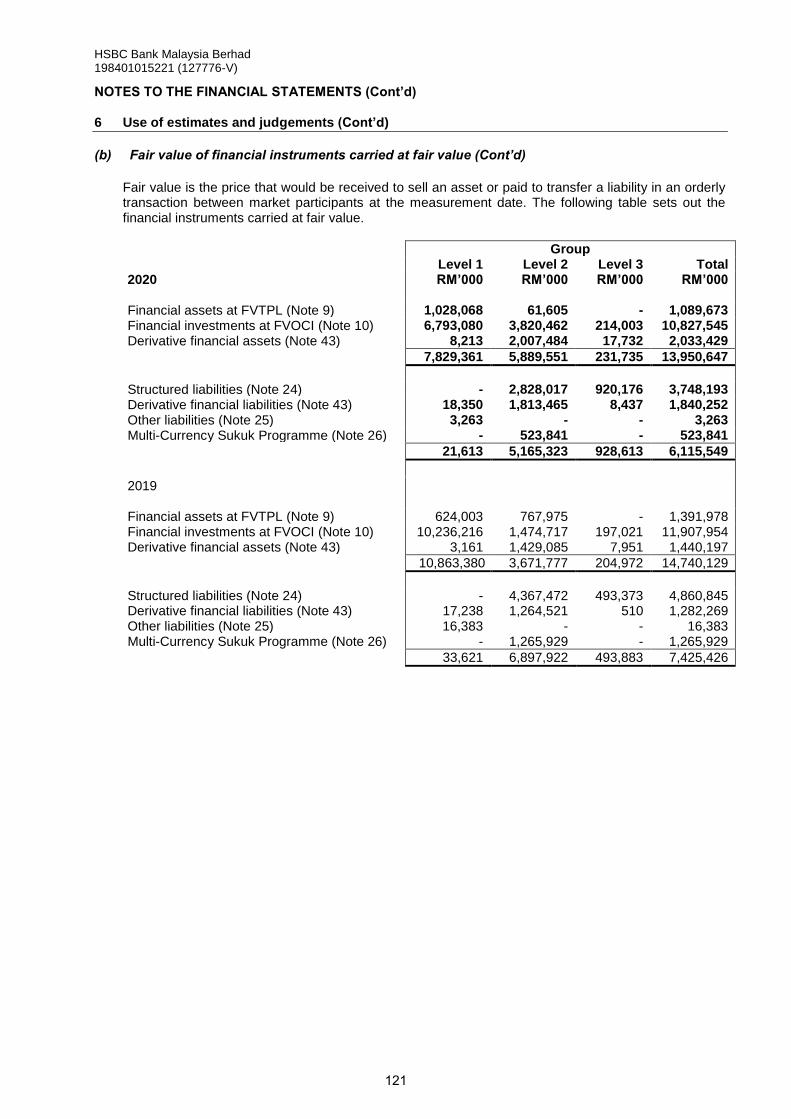
HSBC Bank Malaysia Berhad 198401015221 (127776-V)
NOTES TO THE FINANCIAL STATEMENTS (Cont’d) 6 Use of estimates and judgements (Cont’d)
(b) Fair value of financial instruments carried at fair value (Cont’d)
Fair value is the price that would be received to sell an asset or paid to transfer a liability in an orderly transaction between market participants at the measurement date. The following table sets out the financial instruments carried at fair value.
Group
Level 1 Level 2 Level 3 Total 2020 RM’000 RM’000 RM’000 RM’000 Financial assets at FVTPL (Note 9) 1,028,068 61,605 - 1,089,673 Financial investments at FVOCI (Note 10) 6,793,080 3,820,462 214,003 10,827,545 Derivative financial assets (Note 43) 8,213 2,007,484 17,732 2,033,429
7,829,361 5,889,551 231,735 13,950,647
Structured liabilities (Note 24) - 2,828,017 920,176 3,748,193 Derivative financial liabilities (Note 43) 18,350 1,813,465 8,437 1,840,252 Other liabilities (Note 25) 3,263 - - 3,263 Multi-Currency Sukuk Programme (Note 26) - 523,841 - 523,841
21,613 5,165,323 928,613 6,115,549
2019
Financial assets at FVTPL (Note 9) 624,003 767,975 - 1,391,978 Financial investments at FVOCI (Note 10) 10,236,216 1,474,717 197,021 11,907,954 Derivative financial assets (Note 43) 3,161 1,429,085 7,951 1,440,197
10,863,380 3,671,777 204,972 14,740,129
Structured liabilities (Note 24) - 4,367,472 493,373 4,860,845 Derivative financial liabilities (Note 43) 17,238 1,264,521 510 1,282,269 Other liabilities (Note 25) 16,383 - - 16,383 Multi-Currency Sukuk Programme (Note 26) - 1,265,929 - 1,265,929
33,621 6,897,922 493,883 7,425,426
121
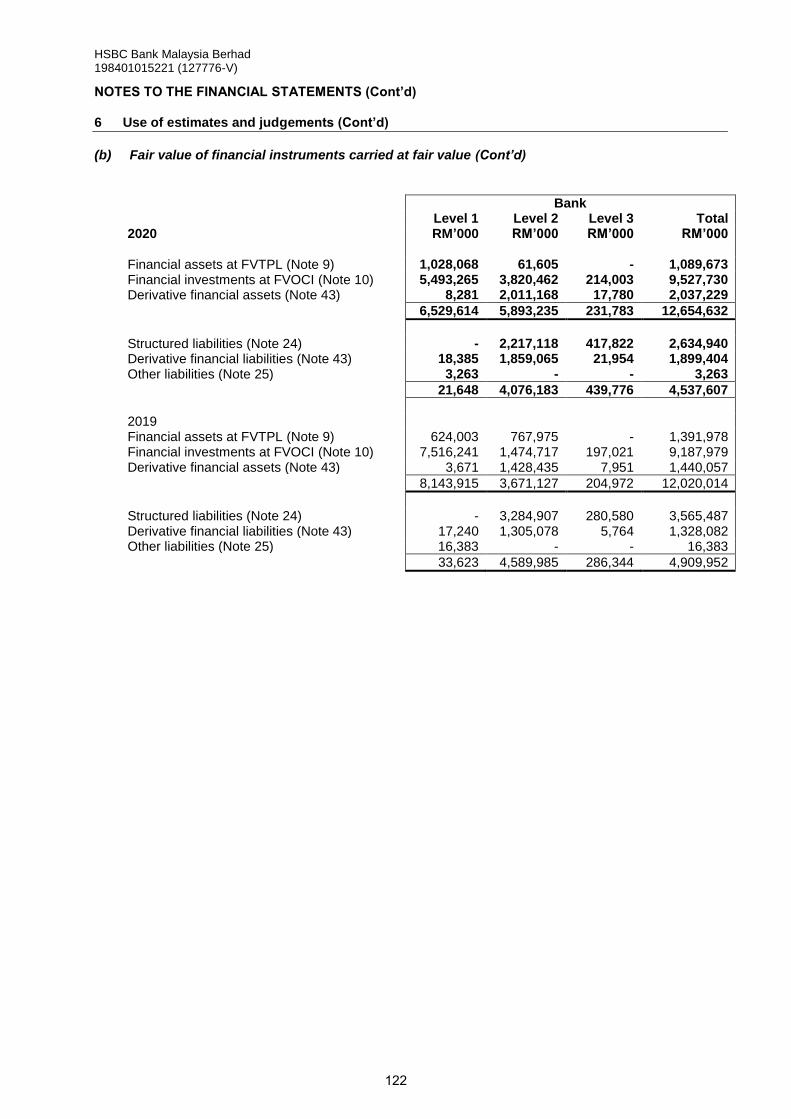
HSBC Bank Malaysia Berhad 198401015221 (127776-V)
NOTES TO THE FINANCIAL STATEMENTS (Cont’d)
6 Use of estimates and judgements (Cont’d)
(b) Fair value of financial instruments carried at fair value (Cont’d)
Bank
Level 1 Level 2 Level 3 Total 2020 RM’000 RM’000 RM’000 RM’000 Financial assets at FVTPL (Note 9) 1,028,068 61,605 - 1,089,673 Financial investments at FVOCI (Note 10) 5,493,265 3,820,462 214,003 9,527,730 Derivative financial assets (Note 43) 8,281 2,011,168 17,780 2,037,229
6,529,614 5,893,235 231,783 12,654,632
Structured liabilities (Note 24) - 2,217,118 417,822 2,634,940 Derivative financial liabilities (Note 43) 18,385 1,859,065 21,954 1,899,404 Other liabilities (Note 25) 3,263 - - 3,263
21,648 4,076,183 439,776 4,537,607
2019 Financial assets at FVTPL (Note 9) 624,003 767,975 - 1,391,978 Financial investments at FVOCI (Note 10) 7,516,241 1,474,717 197,021 9,187,979 Derivative financial assets (Note 43) 3,671 1,428,435 7,951 1,440,057
8,143,915 3,671,127 204,972 12,020,014
Structured liabilities (Note 24) - 3,284,907 280,580 3,565,487 Derivative financial liabilities (Note 43) 17,240 1,305,078 5,764 1,328,082 Other liabilities (Note 25) 16,383 - - 16,383
33,623 4,589,985 286,344 4,909,952
122
HSBC Bank Malaysia Berhad 198401015221 (127776-V)
NOTES TO THE FINANCIAL STATEMENTS (Cont’d)
6 Use of estimates and judgements (Cont’d)
(b) Fair value of financial instruments carried at fair value (Cont’d)
(i) Control framework
Fair values are subject to a control framework designed to ensure that they are either determined, or
validated, by a function independent of the risk-taker.
Where fair values are determined by reference to externally quoted prices or observable pricing inputs
to models, independent price determination or validation is utilised. For inactive markets, the Group and
the Bank source alternative market information, with greater weight given to information that is
considered to be more relevant and reliable. Examples of the factors considered are price observability,
instrument comparability, consistency of data sources, underlying data accuracy and timing of prices.
For fair values determined using valuation models, the control framework includes development or
validation by independent support functions of the model logic, inputs, model outputs and adjustments.
Valuation models are subject to a process of due diligence before becoming operational and are
calibrated against external market data on an ongoing basis.
Changes in fair value are generally subject to a profit and loss analysis process and are disaggregated
into high-level categories including portfolio changes, market movements and other fair value
adjustments.
(ii) Determination of fair value
Fair values are determined according to the following hierarchy:
Level 1 – Valuation technique using quoted market price
Financial instruments with quoted prices for identical instruments in active markets that the Group
and the Bank can access at the measurement date.
Level 2 – Valuation technique using observable inputs
Financial instruments with quoted prices for similar instruments in active markets or quoted prices
for identical or similar instruments in inactive markets and financial instruments valued using models
where all significant inputs are observable.
Level 3 – Valuation technique with significant unobservable inputs
Financial instruments valued using valuation techniques where one or more significant inputs are
unobservable.
The judgement as to whether a market is active may include, but is not restricted to, the consideration
of factors such as the magnitude and frequency of trading activity, the availability of prices and the
size of bid/offer spreads. The bid/offer spread represents the difference in prices at which a market
participant would be willing to buy compared with the price at which they would be willing to sell. In
inactive markets, obtaining assurance that the transaction price provides evidence of fair value or
determining the adjustments to transaction prices that are necessary to measure the fair value of the
instrument requires additional work during the valuation process.
123
HSBC Bank Malaysia Berhad 198401015221 (127776-V)
NOTES TO THE FINANCIAL STATEMENTS (Cont’d) 6 Use of estimates and judgements (Cont’d)
(b) Fair value of financial instruments carried at fair value (Cont’d)
(iii) Valuation techniques
Valuation techniques incorporate assumptions about factors that other market participants would use in their valuations. A range of valuation techniques is employed, dependent on the instrument type and available market data. More sophisticated valuation techniques are based upon discounted cash flow analysis, in which expected future cash flows are calculated and discounted to present value using a discounting curve. Prior to consideration of credit risk, the expected future cash flows may be known, as would be the case for the fixed leg of an interest/profit rate swap, or may be uncertain and require projection, as would be the case for the floating leg of an interest/profit rate swap. Projection utilises market forward curves, if available. In option models, the probability of different potential future outcomes must be considered. In addition, the values of some products are dependent on more than one market factor, and in these cases it will typically be necessary to consider how movements in one market factor may affect the other market factors. The model inputs necessary to perform such calculations include interest/profit rate yield curves, exchange rates, volatilities, correlations, prepayment and default rates. The majority of valuation techniques employ only observable market data. However, certain financial instruments are valued on the basis of valuation techniques that feature one or more significant market inputs that are unobservable, and for them the measurement of fair value is more judgemental. An instrument in its entirety is classified as valued using significant unobservable inputs if, in the opinion of management, a significant proportion of the instrument’s inception profit (day 1 gain or loss) or greater than 5% of the instrument’s carrying value is driven by unobservable inputs. ‘Unobservable’ in this context means that there is little or no current market data available from which to determine the price at which an arm’s length transaction would be likely to occur. It generally does not mean that there is no market data available at all upon which to base a determination of fair value (consensus pricing data may, for example, be used). All fair value adjustments are included within the levelling determination. Structured notes issued and certain other hybrid instrument liabilities are included within structured liabilities and are measured at fair value. The credit spread applied to these instruments is derived from the spreads at which the Group and the Bank issue structured notes. Gains and losses arising from changes in the credit spread of liabilities issued by the Group and the Bank reverse over the contractual life of the debt, provided that the debt is not repaid at a premium or a discount.
(iv) Fair value adjustments
Fair value adjustments are adopted when the Group and the Bank determine there are additional factors
considered by market participants that are not incorporated within the valuation model. Movements in
the level of fair value adjustments do not necessarily result in the recognition of profits or losses within
the income statement, such as when models are enhanced and therefore fair value adjustments may
no longer be required.
Bid-offer
MFRS 13 requires use of the price within the bid-offer spread that is most representative of fair value.
Valuation models will typically generate mid-market values. The bid-offer adjustment reflects the extent
to which bid-offer cost would be incurred if substantially all residual net portfolio market risks were closed
using available hedging instruments or by disposing of, or unwinding the position.
124
HSBC Bank Malaysia Berhad 198401015221 (127776-V)
NOTES TO THE FINANCIAL STATEMENTS (Cont’d)
6 Use of estimates and judgements (Cont’d)
(b) Fair value of financial instruments carried at fair value (Cont’d)
(iv) Fair value adjustments (Cont’d)
Uncertainty
Certain model inputs may be less readily determinable from market data, and/or the choice of model
itself may be more subjective. In these circumstances, an adjustment may be necessary to reflect the
likelihood that market participants would adopt more conservative values for uncertain parameters
and/or model assumptions, than those used in the Group and the Bank’s valuation model.
Credit valuation adjustment (CVA) and Debit valuation adjustment (DVA)
The CVA is an adjustment to the valuation of over-the-counter (OTC) derivative contracts to reflect the
possibility that the counterparty may default and the Group and the Bank may not receive the full market
value of the transactions.
The DVA is an adjustment to the valuation of OTC derivative contracts to reflect the possibility that the
Group and the Bank may default, and that the Group and the Bank may not pay the full market value of
the transactions.
The Group and the Bank calculate a separate CVA and DVA for each legal entity, and for each
counterparty to which the entity has exposure. With the exception of central clearing parties, all third-
party counterparties are included in the CVA and DVA calculations, and these adjustments are not
netted across entities.
The Group and the Bank calculate the CVA by applying the probability of default (PD) of the counterparty,
conditional on the non-default of the Group and the Bank, to the Group and the Bank’s expected positive
exposure to the counterparty and multiplying the result by the loss expected in the event of default.
Conversely, the Group and the Bank calculate the DVA by applying the PD of the Group and the Bank,
conditional on the non-default of the counterparty, to the expected positive exposure of the counterparty
to the Group and the Bank and multiplying the result by the loss expected in the event of default. Both
calculations are performed over the life of the potential exposure.
For most products the Group and the Bank use a simulation methodology, which incorporates a range
of potential exposures over the life of the portfolio, to calculate the expected positive exposure to a
counterparty. The simulation methodology includes credit mitigants, such as counterparty netting
agreements and collateral agreements with the counterparty.
The methodologies do not, in general, account for ‘wrong-way risk’ which arises when the underlying
value of the derivative prior to any CVA is positively correlated to the PD of the counterparty. When
there is significant wrong-way risk, a trade-specific approach is applied to reflect this risk in the valuation.
Funding fair value adjustment (FFVA)
The FFVA is calculated by applying future market funding spreads to the expected future funding exposure of any uncollateralised component of the OTC derivative portfolio. The expected future funding exposure is calculated by a simulation methodology, where available and is adjusted for events that may terminate the exposure, such as the default of the Group or the Bank or the counterparty. The FFVA and DVA are calculated independently. Model limitation Models used for portfolio valuation purposes may be based upon a simplifying set of assumptions that do not capture all material market characteristics. In these circumstances, model limitation adjustments are adopted.
125
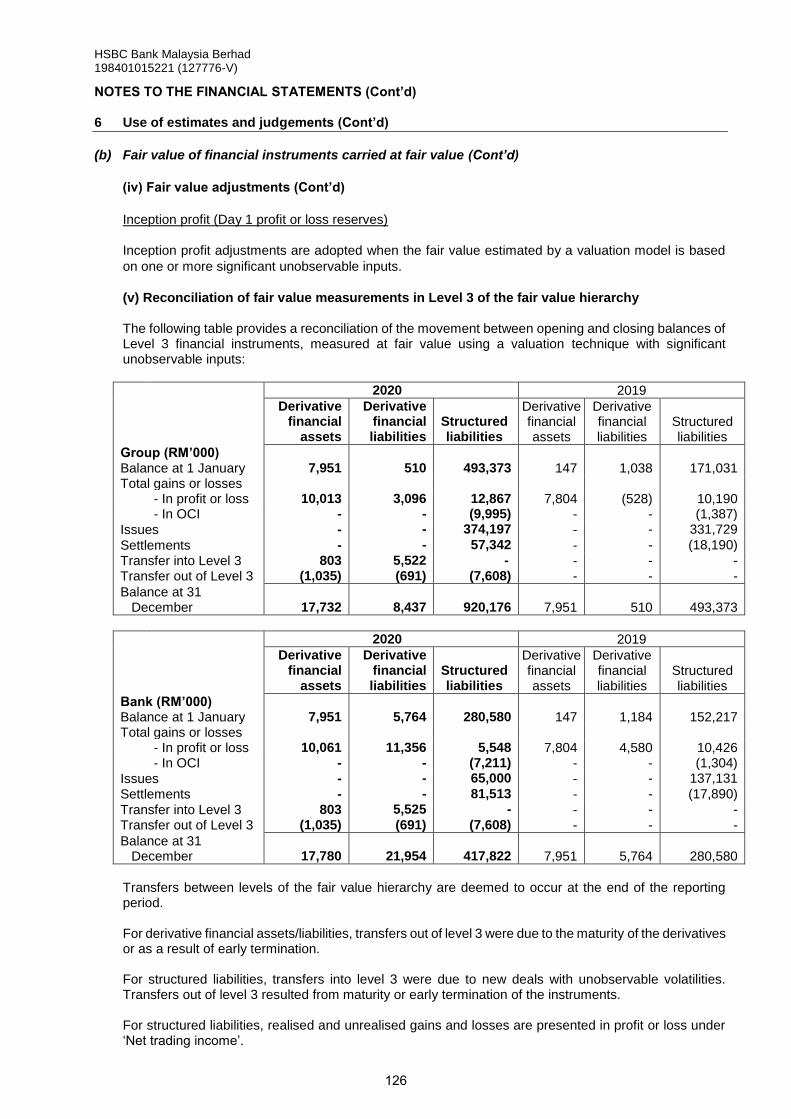
HSBC Bank Malaysia Berhad 198401015221 (127776-V)
NOTES TO THE FINANCIAL STATEMENTS (Cont’d)
6 Use of estimates and judgements (Cont’d)
(b) Fair value of financial instruments carried at fair value (Cont’d)
(iv) Fair value adjustments (Cont’d)
Inception profit (Day 1 profit or loss reserves)
Inception profit adjustments are adopted when the fair value estimated by a valuation model is based
on one or more significant unobservable inputs.
(v) Reconciliation of fair value measurements in Level 3 of the fair value hierarchy The following table provides a reconciliation of the movement between opening and closing balances of Level 3 financial instruments, measured at fair value using a valuation technique with significant unobservable inputs:
2020 2019
Derivative financial
assets
Derivative financial liabilities
Structured liabilities
Derivative financial assets
Derivative financial liabilities
Structured liabilities
Group (RM’000) Balance at 1 January 7,951 510 493,373 147 1,038 171,031 Total gains or losses
- In profit or loss 10,013 3,096 12,867 7,804 (528) 10,190 - In OCI - - (9,995) - - (1,387)
Issues - - 374,197 - - 331,729
Settlements - - 57,342 - - (18,190)
Transfer into Level 3 803 5,522 - - - - Transfer out of Level 3 (1,035) (691) (7,608) - - -
Balance at 31 December
17,732
8,437
920,176
7,951
510
493,373
2020 2019
Derivative financial
assets
Derivative financial liabilities
Structured liabilities
Derivative financial assets
Derivative financial liabilities
Structured liabilities
Bank (RM’000) Balance at 1 January 7,951 5,764 280,580 147 1,184 152,217 Total gains or losses
- In profit or loss 10,061 11,356 5,548 7,804 4,580 10,426 - In OCI - - (7,211) - - (1,304)
Issues - - 65,000 - - 137,131
Settlements - - 81,513 - - (17,890)
Transfer into Level 3 803 5,525 - - - -
Transfer out of Level 3 (1,035) (691) (7,608) - - -
Balance at 31 December
17,780
21,954
417,822
7,951
5,764
280,580
Transfers between levels of the fair value hierarchy are deemed to occur at the end of the reporting period. For derivative financial assets/liabilities, transfers out of level 3 were due to the maturity of the derivatives or as a result of early termination. For structured liabilities, transfers into level 3 were due to new deals with unobservable volatilities. Transfers out of level 3 resulted from maturity or early termination of the instruments. For structured liabilities, realised and unrealised gains and losses are presented in profit or loss under ‘Net trading income’.
126
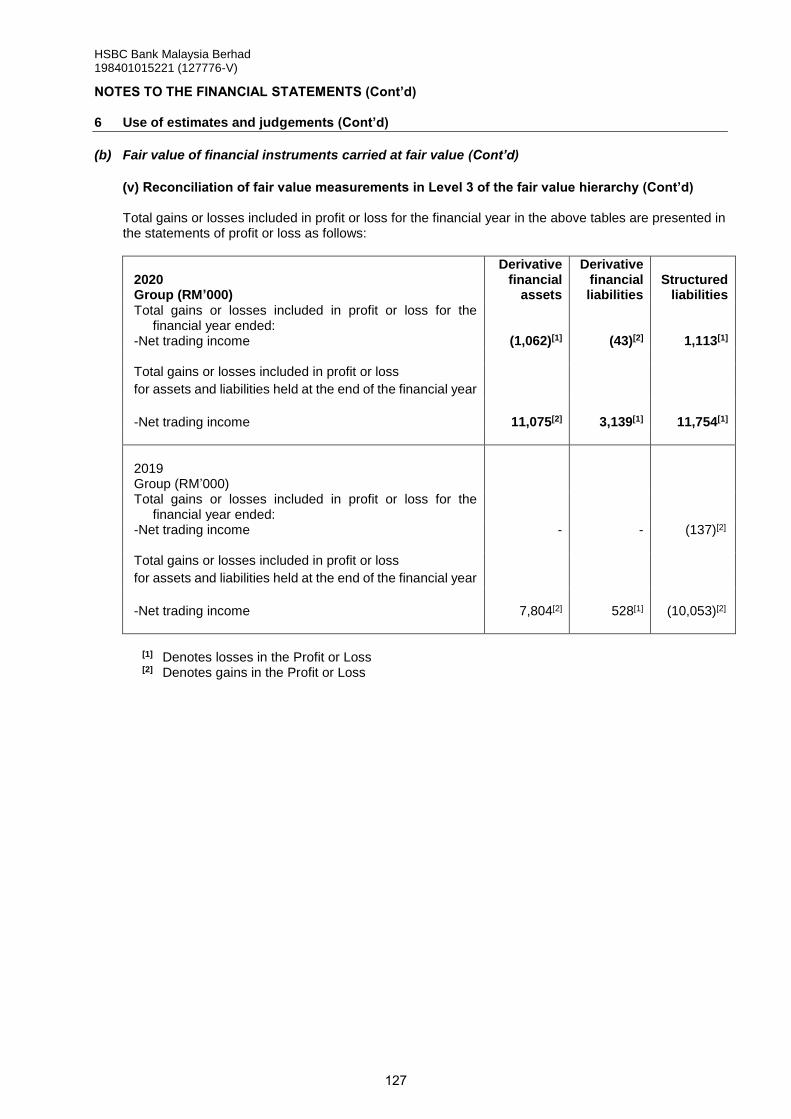
HSBC Bank Malaysia Berhad 198401015221 (127776-V)
NOTES TO THE FINANCIAL STATEMENTS (Cont’d)
6 Use of estimates and judgements (Cont’d)
(b) Fair value of financial instruments carried at fair value (Cont’d)
(v) Reconciliation of fair value measurements in Level 3 of the fair value hierarchy (Cont’d) Total gains or losses included in profit or loss for the financial year in the above tables are presented in the statements of profit or loss as follows:
2020 Group (RM’000)
Derivative financial
assets
Derivative financial liabilities
Structured
liabilities Total gains or losses included in profit or loss for the
financial year ended:
-Net trading income (1,062)[1] (43)[2] 1,113[1] Total gains or losses included in profit or loss
for assets and liabilities held at the end of the financial year
-Net trading income
11,075[2] 3,139[1]
11,754[1]
2019 Group (RM’000)
Total gains or losses included in profit or loss for the financial year ended:
-Net trading income - - (137)[2] Total gains or losses included in profit or loss
for assets and liabilities held at the end of the financial year
-Net trading income
7,804[2] 528[1]
(10,053)[2]
[1] Denotes losses in the Profit or Loss [2]
Denotes gains in the Profit or Loss
127
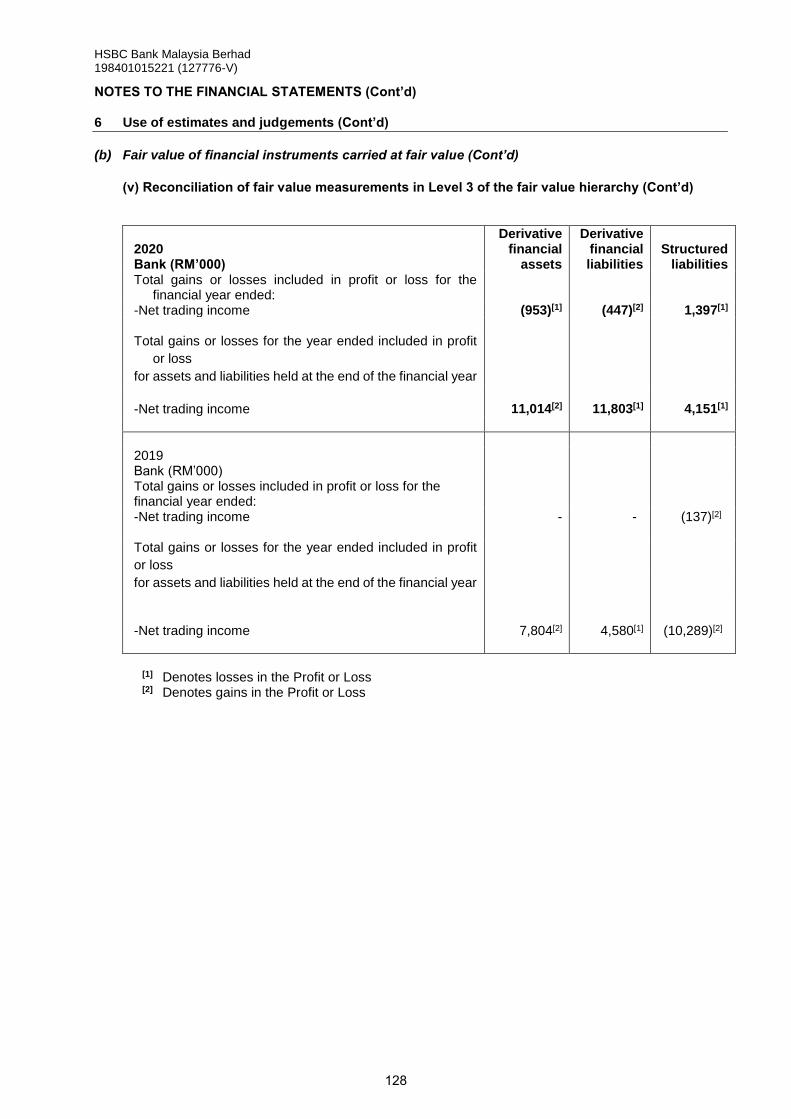
HSBC Bank Malaysia Berhad 198401015221 (127776-V)
NOTES TO THE FINANCIAL STATEMENTS (Cont’d)
6 Use of estimates and judgements (Cont’d)
(b) Fair value of financial instruments carried at fair value (Cont’d)
(v) Reconciliation of fair value measurements in Level 3 of the fair value hierarchy (Cont’d)
2020 Bank (RM’000)
Derivative financial
assets
Derivative financial liabilities
Structured
liabilities Total gains or losses included in profit or loss for the
financial year ended:
-Net trading income (953)[1] (447)[2] 1,397[1] Total gains or losses for the year ended included in profit
or loss
for assets and liabilities held at the end of the financial year
-Net trading income
11,014[2]
11,803[1]
4,151[1]
2019 Bank (RM’000)
Total gains or losses included in profit or loss for the financial year ended:
-Net trading income - - (137)[2] Total gains or losses for the year ended included in profit
or loss
for assets and liabilities held at the end of the financial year
-Net trading income
7,804[2] 4,580[1]
(10,289)[2]
[1] Denotes losses in the Profit or Loss [2]
Denotes gains in the Profit or Loss
128
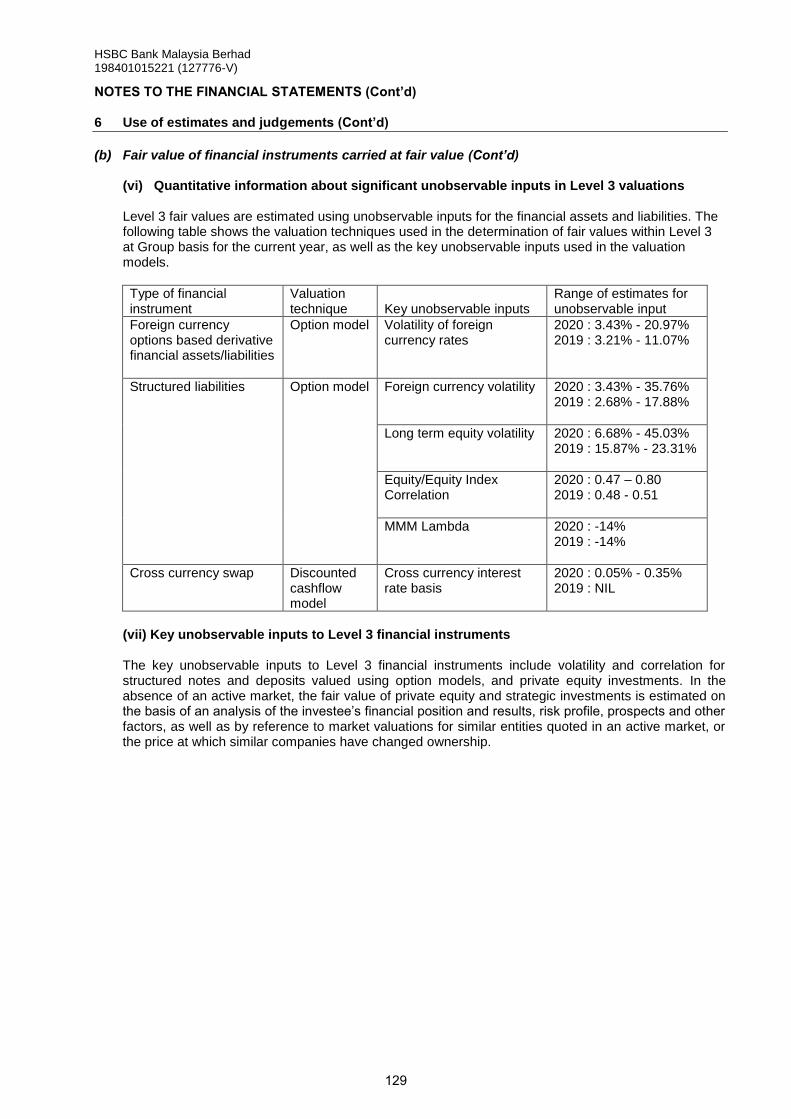
HSBC Bank Malaysia Berhad 198401015221 (127776-V)
NOTES TO THE FINANCIAL STATEMENTS (Cont’d)
6 Use of estimates and judgements (Cont’d)
(b) Fair value of financial instruments carried at fair value (Cont’d)
(vi) Quantitative information about significant unobservable inputs in Level 3 valuations
Level 3 fair values are estimated using unobservable inputs for the financial assets and liabilities. The following table shows the valuation techniques used in the determination of fair values within Level 3 at Group basis for the current year, as well as the key unobservable inputs used in the valuation models.
Type of financial instrument
Valuation technique Key unobservable inputs
Range of estimates for unobservable input
Foreign currency options based derivative financial assets/liabilities
Option model
Volatility of foreign currency rates
2020 : 3.43% - 20.97% 2019 : 3.21% - 11.07%
Structured liabilities
Option model Foreign currency volatility
2020 : 3.43% - 35.76% 2019 : 2.68% - 17.88%
Long term equity volatility
2020 : 6.68% - 45.03% 2019 : 15.87% - 23.31%
Equity/Equity Index Correlation
2020 : 0.47 – 0.80 2019 : 0.48 - 0.51
MMM Lambda 2020 : -14% 2019 : -14%
Cross currency swap Discounted cashflow model
Cross currency interest rate basis
2020 : 0.05% - 0.35% 2019 : NIL
(vii) Key unobservable inputs to Level 3 financial instruments
The key unobservable inputs to Level 3 financial instruments include volatility and correlation for structured notes and deposits valued using option models, and private equity investments. In the absence of an active market, the fair value of private equity and strategic investments is estimated on the basis of an analysis of the investee’s financial position and results, risk profile, prospects and other factors, as well as by reference to market valuations for similar entities quoted in an active market, or the price at which similar companies have changed ownership.
129

HSBC Bank Malaysia Berhad 198401015221 (127776-V)
NOTES TO THE FINANCIAL STATEMENTS (Cont’d) 6 Use of estimates and judgements (Cont’d)
(b) Fair value of financial instruments carried at fair value (Cont’d)
(viii) Sensitivity of fair values to reasonably possible alternative assumptions
As discussed above, the fair values of financial instruments are, in certain circumstances, measured
using valuation models that incorporate assumptions that are not supported by prices from observable
current market transactions in the same instrument and are not based on observable market data. The
following table shows the sensitivity of fair values to reasonably possible alternative assumptions:
2020 2019
Effect on profit or loss Effect on profit or loss
Favourable
changes Unfavourable
changes Favourable
changes Unfavourable
changes
Group (RM’000) Derivative financial assets 299 (299) 88 (88) Derivative financial liabilities 123 (123) 131 (131) Structured liabilities 205 (205) 131 (131)
627 (627) 350 (350)
Favourable and unfavourable changes are determined on the sensitivity analysis. The sensitivity
analysis aims to measure a range of fair values consistent with the application of a 95% confidence
interval. Methodologies take account of the nature of the valuation technique employed, as well as the
availability and reliability of observable proxy and historical data. When the available data is not
amenable to statistical analysis, the quantification of uncertainty is judgemental, but remains guided by
the 95% confidence interval.
When the fair value of a financial instrument is affected by more than one unobservable assumption, the above table reflects the most favourable or the most unfavourable change from varying the assumptions individually.
130
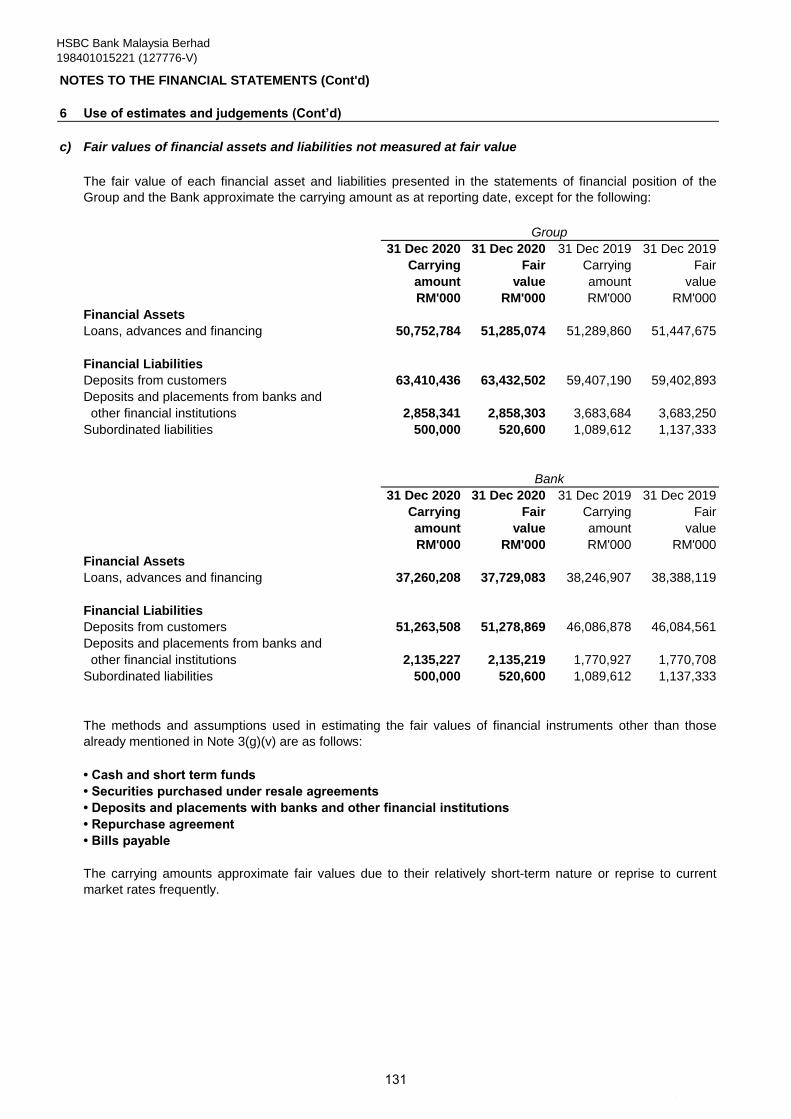
HSBC Bank Malaysia Berhad
198401015221 (127776-V)
NOTES TO THE FINANCIAL STATEMENTS (Cont'd)
6 Use of estimates and judgements (Cont’d)
c) Fair values of financial assets and liabilities not measured at fair value
31 Dec 2020 31 Dec 2020 31 Dec 2019 31 Dec 2019
Carrying Fair Carrying Fair
amount value amount value
RM'000 RM'000 RM'000 RM'000
Financial Assets
Loans, advances and financing 50,752,784 51,285,074 51,289,860 51,447,675
Financial Liabilities
Deposits from customers 63,410,436 63,432,502 59,407,190 59,402,893
Deposits and placements from banks and
other financial institutions 2,858,341 2,858,303 3,683,684 3,683,250
Subordinated liabilities 500,000 520,600 1,089,612 1,137,333
31 Dec 2020 31 Dec 2020 31 Dec 2019 31 Dec 2019
Carrying Fair Carrying Fair
amount value amount value
RM'000 RM'000 RM'000 RM'000
Financial Assets
Loans, advances and financing 37,260,208 37,729,083 38,246,907 38,388,119
Financial Liabilities
Deposits from customers 51,263,508 51,278,869 46,086,878 46,084,561
Deposits and placements from banks and
other financial institutions 2,135,227 2,135,219 1,770,927 1,770,708
Subordinated liabilities 500,000 520,600 1,089,612 1,137,333
• Cash and short term funds
• Securities purchased under resale agreements
• Deposits and placements with banks and other financial institutions
• Repurchase agreement
• Bills payable
The fair value of each financial asset and liabilities presented in the statements of financial position of the
Group and the Bank approximate the carrying amount as at reporting date, except for the following:
Group
Bank
The carrying amounts approximate fair values due to their relatively short-term nature or reprise to current
market rates frequently.
The methods and assumptions used in estimating the fair values of financial instruments other than those
already mentioned in Note 3(g)(v) are as follows:
#
131
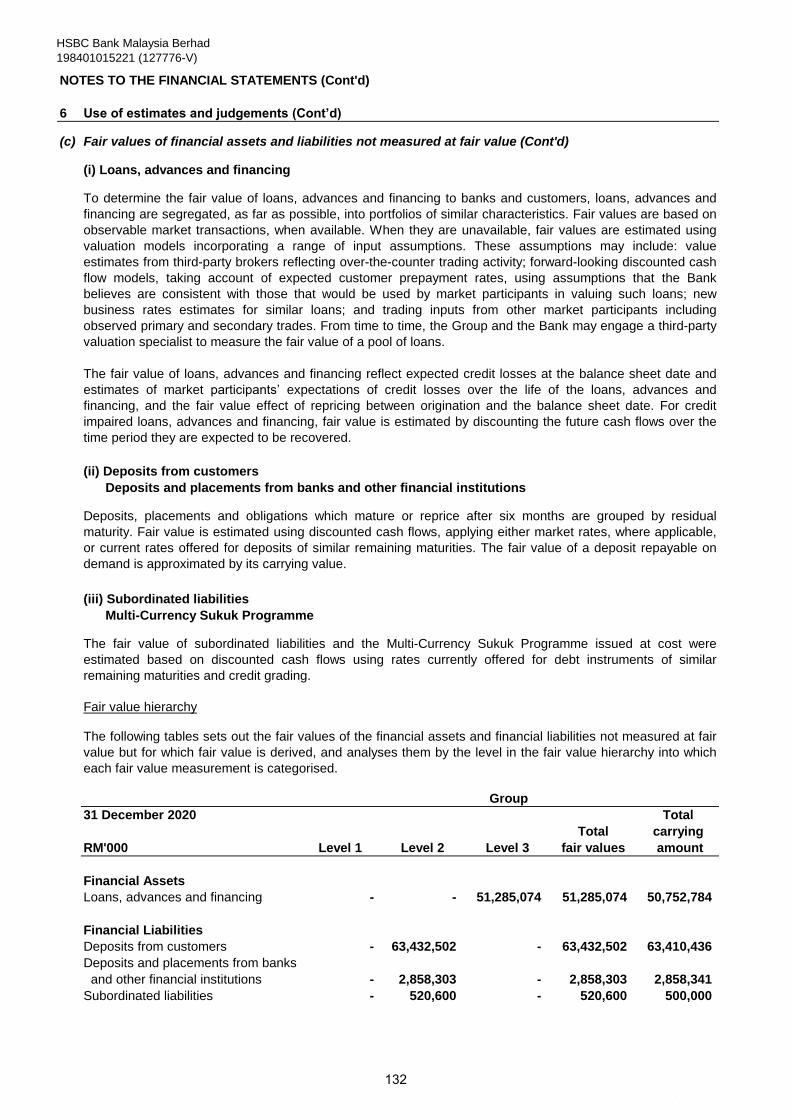
HSBC Bank Malaysia Berhad
198401015221 (127776-V)
NOTES TO THE FINANCIAL STATEMENTS (Cont'd)
6 Use of estimates and judgements (Cont’d)
(c) Fair values of financial assets and liabilities not measured at fair value (Cont'd)
(i) Loans, advances and financing
(ii) Deposits from customers
Deposits and placements from banks and other financial institutions
(iii) Subordinated liabilities
Multi-Currency Sukuk Programme
Fair value hierarchy
31 December 2020 Total
Total carrying
RM'000 Level 1 Level 2 Level 3 fair values amount
Financial Assets
Loans, advances and financing - - 51,285,074 51,285,074 50,752,784
Financial Liabilities
Deposits from customers - 63,432,502 - 63,432,502 63,410,436
Deposits and placements from banks
and other financial institutions - 2,858,303 - 2,858,303 2,858,341
Subordinated liabilities - 520,600 - 520,600 500,000
Group
To determine the fair value of loans, advances and financing to banks and customers, loans, advances and
financing are segregated, as far as possible, into portfolios of similar characteristics. Fair values are based on
observable market transactions, when available. When they are unavailable, fair values are estimated using
valuation models incorporating a range of input assumptions. These assumptions may include: value
estimates from third-party brokers reflecting over-the-counter trading activity; forward-looking discounted cash
flow models, taking account of expected customer prepayment rates, using assumptions that the Bank
believes are consistent with those that would be used by market participants in valuing such loans; new
business rates estimates for similar loans; and trading inputs from other market participants including
observed primary and secondary trades. From time to time, the Group and the Bank may engage a third-party
valuation specialist to measure the fair value of a pool of loans.
The fair value of loans, advances and financing reflect expected credit losses at the balance sheet date and
estimates of market participants’ expectations of credit losses over the life of the loans, advances and
financing, and the fair value effect of repricing between origination and the balance sheet date. For credit
impaired loans, advances and financing, fair value is estimated by discounting the future cash flows over the
time period they are expected to be recovered.
Deposits, placements and obligations which mature or reprice after six months are grouped by residual
maturity. Fair value is estimated using discounted cash flows, applying either market rates, where applicable,
or current rates offered for deposits of similar remaining maturities. The fair value of a deposit repayable on
demand is approximated by its carrying value.
The fair value of subordinated liabilities and the Multi-Currency Sukuk Programme issued at cost were
estimated based on discounted cash flows using rates currently offered for debt instruments of similar
remaining maturities and credit grading.
The following tables sets out the fair values of the financial assets and financial liabilities not measured at fair
value but for which fair value is derived, and analyses them by the level in the fair value hierarchy into which
each fair value measurement is categorised.
#
132

HSBC Bank Malaysia Berhad
198401015221 (127776-V)
NOTES TO THE FINANCIAL STATEMENTS (Cont'd)
6 Use of estimates and judgements (Cont’d)
(c) Fair values of financial assets and liabilities not measured at fair value (Cont'd)
Fair value hierarchy (Cont'd)
31 December 2019 Total
Total carrying
RM'000 Level 1 Level 2 Level 3 fair values amount
Financial Assets
Loans, advances and financing - - 51,447,675 51,447,675 51,289,860
Financial Liabilities
Deposits from customers - 59,402,893 - 59,402,893 59,407,190
Deposits and placements from banks
and other financial institutions - 3,683,250 - 3,683,250 3,683,684
Subordinated liabilities - 1,137,333 - 1,137,333 1,089,612
31 December 2020 Total
Total carrying
RM'000 Level 1 Level 2 Level 3 fair values amount
Financial Assets
Loans, advances and financing - - 37,729,083 37,729,083 37,260,208
Financial Liabilities
Deposits from customers - 51,278,869 - 51,278,869 51,263,508
Deposits and placements from banks
and other financial institutions - 2,135,219 - 2,135,219 2,135,227
Subordinated liabilities - 520,600 - 520,600 500,000
31 December 2019 Total
Total carrying
RM'000 Level 1 Level 2 Level 3 fair values amount
Financial Assets
Loans, advances and financing - - 38,388,119 38,388,119 38,246,907
Financial Liabilities
Deposits from customers - 46,084,561 - 46,084,561 46,086,878
Deposits and placements from banks
and other financial institutions - 1,770,708 - 1,770,708 1,770,927
Subordinated liabilities - 1,137,333 - 1,137,333 1,089,612
Group
Bank
Bank
#
133
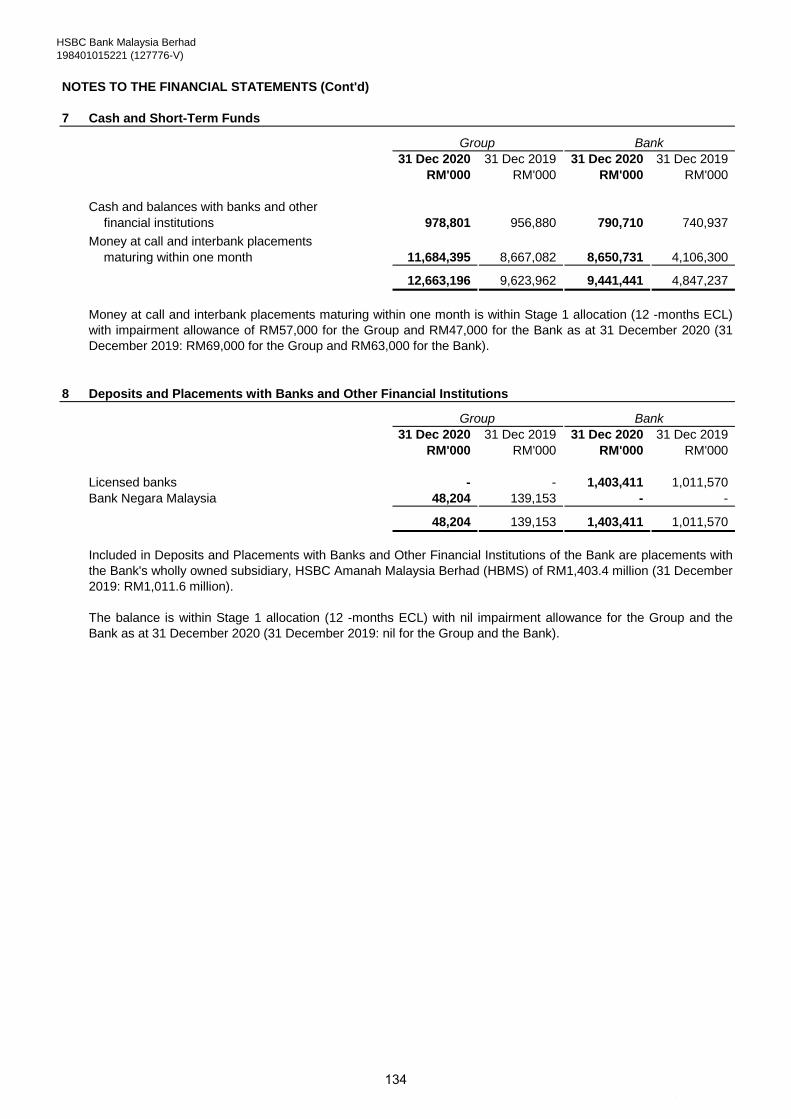
HSBC Bank Malaysia Berhad
198401015221 (127776-V)
NOTES TO THE FINANCIAL STATEMENTS (Cont'd)
7 Cash and Short-Term Funds
31 Dec 2020 31 Dec 2019 31 Dec 2020 31 Dec 2019
RM'000 RM'000 RM'000 RM'000
Cash and balances with banks and other
financial institutions 978,801 956,880 790,710 740,937
Money at call and interbank placements
maturing within one month 11,684,395 8,667,082 8,650,731 4,106,300
12,663,196 9,623,962 9,441,441 4,847,237
8 Deposits and Placements with Banks and Other Financial Institutions
31 Dec 2020 31 Dec 2019 31 Dec 2020 31 Dec 2019
RM'000 RM'000 RM'000 RM'000
Licensed banks - - 1,403,411 1,011,570
Bank Negara Malaysia 48,204 139,153 - -
48,204 139,153 1,403,411 1,011,570
Group Bank
Group Bank
Money at call and interbank placements maturing within one month is within Stage 1 allocation (12 -months ECL)
with impairment allowance of RM57,000 for the Group and RM47,000 for the Bank as at 31 December 2020 (31
December 2019: RM69,000 for the Group and RM63,000 for the Bank).
Included in Deposits and Placements with Banks and Other Financial Institutions of the Bank are placements with
the Bank's wholly owned subsidiary, HSBC Amanah Malaysia Berhad (HBMS) of RM1,403.4 million (31 December
2019: RM1,011.6 million).
The balance is within Stage 1 allocation (12 -months ECL) with nil impairment allowance for the Group and the
Bank as at 31 December 2020 (31 December 2019: nil for the Group and the Bank).
#
134

HSBC Bank Malaysia Berhad
198401015221 (127776-V)
NOTES TO THE FINANCIAL STATEMENTS (Cont'd)
9 Financial Assets at Fair Value through Profit and Loss (FVTPL)
31 Dec 2020 31 Dec 2019 31 Dec 2020 31 Dec 2019
RM'000 RM'000 RM'000 RM'000
Money market instruments:
Malaysian Government treasury bills - 48,736 - 48,736
Islamic treasury bills 32,751 19,668 32,751 19,668
Malaysian Government securities 803,632 397,683 803,632 397,683
Malaysian Government Islamic Sukuk 204,624 198,991 204,624 198,991
Cagamas bonds and notes 2,552 13,458 2,552 13,458
1,043,559 678,536 1,043,559 678,536
Unquoted:
Corporate bonds and Sukuk 46,114 113,388 46,114 113,388
Loans, advances and financing [1]
- 600,054 - 600,054
1,089,673 1,391,978 1,089,673 1,391,978
Rating
31 Dec 2020 31 Dec 2019 31 Dec 2020 31 Dec 2019
RM'000 RM'000 RM'000 RM'000
Money market instruments:
Malaysian Government treasury bills A+ to A- - 48,736 - 48,736
Islamic treasury bills A+ to A- 32,751 19,668 32,751 19,668
Malaysian Government securities A+ to A- 803,632 397,683 803,632 397,683
Malaysian Government Islamic Sukuk A+ to A- 204,624 198,991 204,624 198,991
Cagamas bonds and notes A+ to A- 2,552 13,458 2,552 13,458
Unquoted:
Corporate bonds and Sukuk - [2] 41,910 94,259 41,910 94,259
(including commercial paper) AA+ to AA- - 15,139 - 15,139
A+ to A- 3,550 3,437 3,550 3,437
BBB+ to BBB- 654 553 654 553 1,089,673 791,924 1,089,673 791,924
[1]
The recognition and derecognition treatments of the above are in accordance to Note 3(g).
[2] Rated separately by another rating agency.
This exposure is also an Syndicated Investment Account for Financing/Investment Agency Account (SIAF/IAA)
financing which is being disclosed as “Asset Under Management” in the financial statements of HBMS.
SIAF/IAA arrangement is with the Bank's wholly owned subsidiary, HBMS, and the contract is based on the
Wakalah principle where the Bank, solely or together with other financial institutions provide the funds, whilst
the assets are managed by HBMS (as the Wakeel or agent). However, in the arrangement, the profits of the
underlying assets are recognised by the Bank proportionately in relation to the funding it provides in the
syndication arrangement. At the same time, risks on the financing are also proportionately borne by the Bank.
Hence, the underlying assets and allowances for impairment arising thereon, if any, are proportionately
recognised and accounted for by the Bank.
Credit quality of financial assets at fair value through profit and loss based on the ratings of Standard & Poor's on
the counterparties:
Group Bank
Included in Financial Assets at FVTPL of the Bank as at 31 December 2019 is a financing exposure of
RM600,054,000 held for the purpose of sale in the near term. This exposure is classified as ‘other’ business
model and its cash flow does not represent solely for the collection of principal and interest (the ”SPPI” test).
Hence it is being classified as FVTPL. This has been sold during the current financial year.
All the financial assets at fair value through profit and loss as disclosed above are not pledged to any
counterparties.
Group Bank
#
135
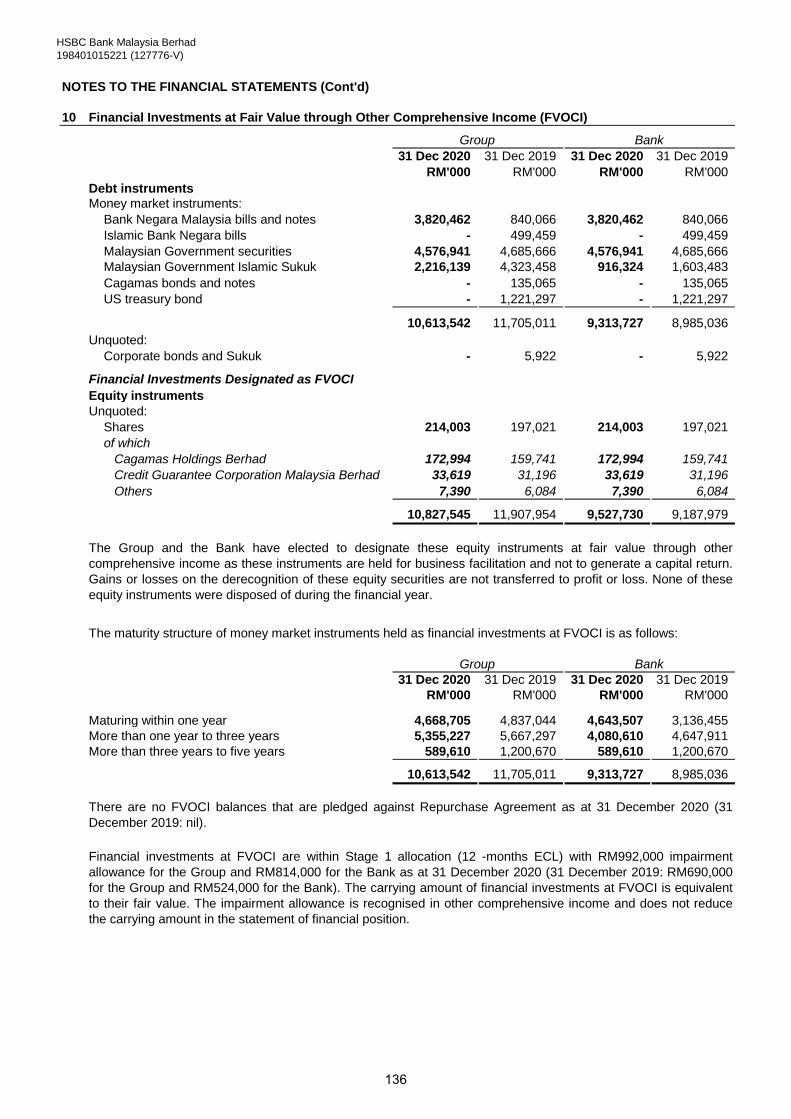
HSBC Bank Malaysia Berhad
198401015221 (127776-V)
NOTES TO THE FINANCIAL STATEMENTS (Cont'd)
10 Financial Investments at Fair Value through Other Comprehensive Income (FVOCI)
31 Dec 2020 31 Dec 2019 31 Dec 2020 31 Dec 2019
RM'000 RM'000 RM'000 RM'000
Debt instruments
Money market instruments:
Bank Negara Malaysia bills and notes 3,820,462 840,066 3,820,462 840,066
Islamic Bank Negara bills - 499,459 - 499,459
Malaysian Government securities 4,576,941 4,685,666 4,576,941 4,685,666
Malaysian Government Islamic Sukuk 2,216,139 4,323,458 916,324 1,603,483
Cagamas bonds and notes - 135,065 - 135,065
US treasury bond - 1,221,297 - 1,221,297
10,613,542 11,705,011 9,313,727 8,985,036
Unquoted:
Corporate bonds and Sukuk - 5,922 - 5,922
Financial Investments Designated as FVOCI
Equity instruments
Unquoted:
Shares 214,003 197,021 214,003 197,021
of which
Cagamas Holdings Berhad 172,994 159,741 172,994 159,741
Credit Guarantee Corporation Malaysia Berhad 33,619 31,196 33,619 31,196
Others 7,390 6,084 7,390 6,084
Gross Financial Investments at FVOCI 10,827,545 11,907,954 9,527,730 9,187,979
The maturity structure of money market instruments held as financial investments at FVOCI is as follows:
31 Dec 2020 31 Dec 2019 31 Dec 2020 31 Dec 2019
RM'000 RM'000 RM'000 RM'000
Maturing within one year 4,668,705 4,837,044 4,643,507 3,136,455
More than one year to three years 5,355,227 5,667,297 4,080,610 4,647,911
More than three years to five years 589,610 1,200,670 589,610 1,200,670
10,613,542 11,705,011 9,313,727 8,985,036
The Group and the Bank have elected to designate these equity instruments at fair value through other
comprehensive income as these instruments are held for business facilitation and not to generate a capital return.
Gains or losses on the derecognition of these equity securities are not transferred to profit or loss. None of these
equity instruments were disposed of during the financial year.
Bank
There are no FVOCI balances that are pledged against Repurchase Agreement as at 31 December 2020 (31
December 2019: nil).
Financial investments at FVOCI are within Stage 1 allocation (12 -months ECL) with RM992,000 impairment
allowance for the Group and RM814,000 for the Bank as at 31 December 2020 (31 December 2019: RM690,000
for the Group and RM524,000 for the Bank). The carrying amount of financial investments at FVOCI is equivalent
to their fair value. The impairment allowance is recognised in other comprehensive income and does not reduce
the carrying amount in the statement of financial position.
Group
Group Bank
#
136
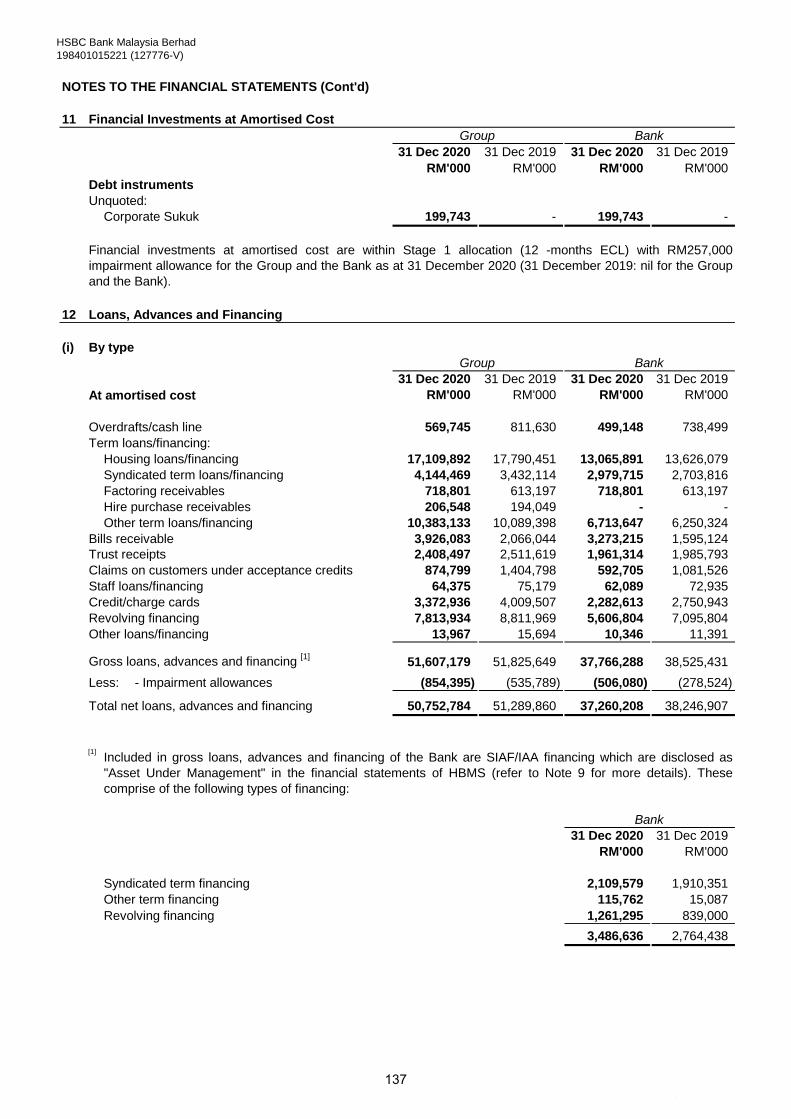
HSBC Bank Malaysia Berhad
198401015221 (127776-V)
NOTES TO THE FINANCIAL STATEMENTS (Cont'd)
11 Financial Investments at Amortised Cost
31 Dec 2020 31 Dec 2019 31 Dec 2020 31 Dec 2019
RM'000 RM'000 RM'000 RM'000
Debt instruments
Unquoted:
Corporate Sukuk 199,743 - 199,743 -
12 Loans, Advances and Financing
(i) By type
31 Dec 2020 31 Dec 2019 31 Dec 2020 31 Dec 2019
At amortised cost RM'000 RM'000 RM'000 RM'000
Overdrafts/cash line 569,745 811,630 499,148 738,499
Term loans/financing:
Housing loans/financing 17,109,892 17,790,451 13,065,891 13,626,079
Syndicated term loans/financing 4,144,469 3,432,114 2,979,715 2,703,816
Factoring receivables 718,801 613,197 718,801 613,197
Hire purchase receivables 206,548 194,049 - -
Other term loans/financing 10,383,133 10,089,398 6,713,647 6,250,324
Bills receivable 3,926,083 2,066,044 3,273,215 1,595,124
Trust receipts 2,408,497 2,511,619 1,961,314 1,985,793
Claims on customers under acceptance credits 874,799 1,404,798 592,705 1,081,526
Staff loans/financing 64,375 75,179 62,089 72,935
Credit/charge cards 3,372,936 4,009,507 2,282,613 2,750,943
Revolving financing 7,813,934 8,811,969 5,606,804 7,095,804
Other loans/financing 13,967 15,694 10,346 11,391
Gross loans, advances and financing [1]
51,607,179 51,825,649 37,766,288 38,525,431
Less: - Impairment allowances (854,395) (535,789) (506,080) (278,524)
Total net loans, advances and financing 50,752,784 51,289,860 37,260,208 38,246,907
[1]
31 Dec 2020 31 Dec 2019
RM'000 RM'000
Syndicated term financing 2,109,579 1,910,351
Other term financing 115,762 15,087
Revolving financing 1,261,295 839,000
3,486,636 2,764,438
Bank
Group Bank
Bank
Included in gross loans, advances and financing of the Bank are SIAF/IAA financing which are disclosed as
"Asset Under Management" in the financial statements of HBMS (refer to Note 9 for more details). These
comprise of the following types of financing:
Group
Financial investments at amortised cost are within Stage 1 allocation (12 -months ECL) with RM257,000
impairment allowance for the Group and the Bank as at 31 December 2020 (31 December 2019: nil for the Group
and the Bank).
#
137
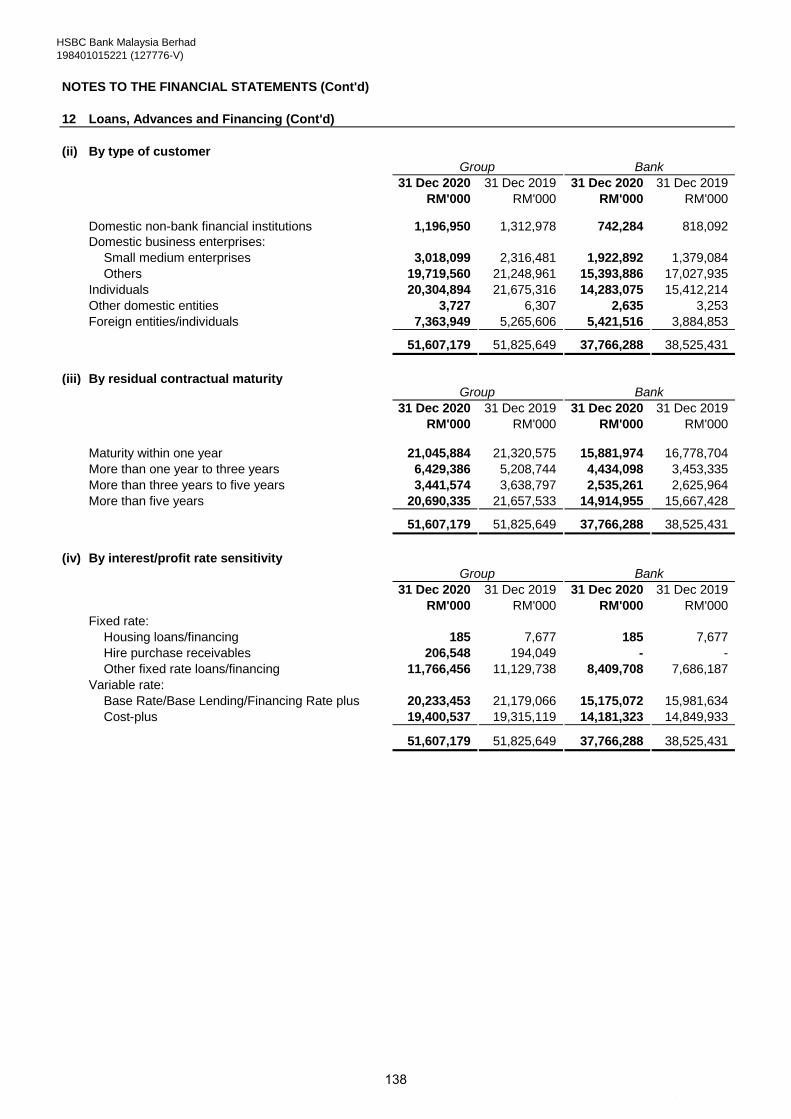
HSBC Bank Malaysia Berhad
198401015221 (127776-V)
NOTES TO THE FINANCIAL STATEMENTS (Cont'd)
12 Loans, Advances and Financing (Cont'd)
(ii) By type of customer
31 Dec 2020 31 Dec 2019 31 Dec 2020 31 Dec 2019
RM'000 RM'000 RM'000 RM'000
Domestic non-bank financial institutions 1,196,950 1,312,978 742,284 818,092
Domestic business enterprises:
Small medium enterprises 3,018,099 2,316,481 1,922,892 1,379,084
Others 19,719,560 21,248,961 15,393,886 17,027,935
Individuals 20,304,894 21,675,316 14,283,075 15,412,214
Other domestic entities 3,727 6,307 2,635 3,253
Foreign entities/individuals 7,363,949 5,265,606 5,421,516 3,884,853
51,607,179 51,825,649 37,766,288 38,525,431
(iii) By residual contractual maturity
31 Dec 2020 31 Dec 2019 31 Dec 2020 31 Dec 2019
RM'000 RM'000 RM'000 RM'000
Maturity within one year 21,045,884 21,320,575 15,881,974 16,778,704
More than one year to three years 6,429,386 5,208,744 4,434,098 3,453,335
More than three years to five years 3,441,574 3,638,797 2,535,261 2,625,964
More than five years 20,690,335 21,657,533 14,914,955 15,667,428
51,607,179 51,825,649 37,766,288 38,525,431
(iv) By interest/profit rate sensitivity
31 Dec 2020 31 Dec 2019 31 Dec 2020 31 Dec 2019
RM'000 RM'000 RM'000 RM'000
Fixed rate:
Housing loans/financing 185 7,677 185 7,677
Hire purchase receivables 206,548 194,049 - -
Other fixed rate loans/financing 11,766,456 11,129,738 8,409,708 7,686,187
Variable rate:
Base Rate/Base Lending/Financing Rate plus 20,233,453 21,179,066 15,175,072 15,981,634
Cost-plus 19,400,537 19,315,119 14,181,323 14,849,933
51,607,179 51,825,649 37,766,288 38,525,431
Group Bank
Group Bank
Group Bank
#
138
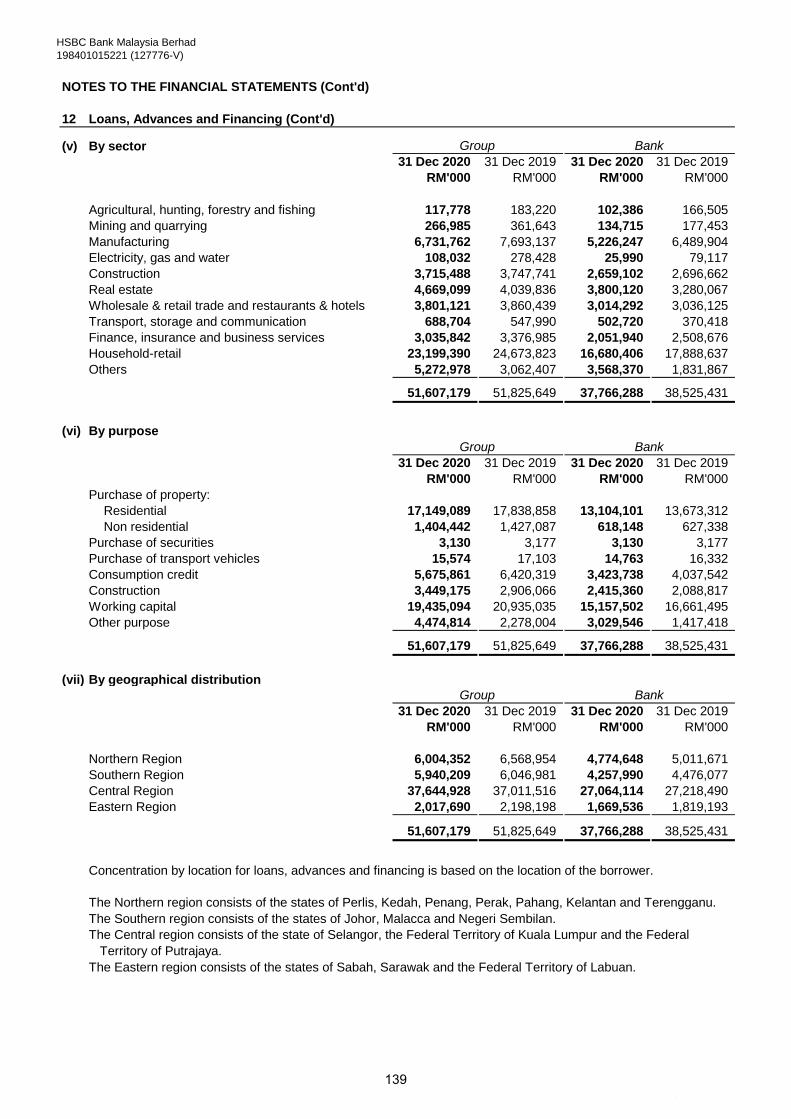
HSBC Bank Malaysia Berhad
198401015221 (127776-V)
NOTES TO THE FINANCIAL STATEMENTS (Cont'd)
12 Loans, Advances and Financing (Cont'd)
(v) By sector
31 Dec 2020 31 Dec 2019 31 Dec 2020 31 Dec 2019
RM'000 RM'000 RM'000 RM'000
Agricultural, hunting, forestry and fishing 117,778 183,220 102,386 166,505
Mining and quarrying 266,985 361,643 134,715 177,453
Manufacturing 6,731,762 7,693,137 5,226,247 6,489,904
Electricity, gas and water 108,032 278,428 25,990 79,117
Construction 3,715,488 3,747,741 2,659,102 2,696,662
Real estate 4,669,099 4,039,836 3,800,120 3,280,067
Wholesale & retail trade and restaurants & hotels 3,801,121 3,860,439 3,014,292 3,036,125
Transport, storage and communication 688,704 547,990 502,720 370,418
Finance, insurance and business services 3,035,842 3,376,985 2,051,940 2,508,676
Household-retail 23,199,390 24,673,823 16,680,406 17,888,637
Others 5,272,978 3,062,407 3,568,370 1,831,867
51,607,179 51,825,649 37,766,288 38,525,431
(vi) By purpose
31 Dec 2020 31 Dec 2019 31 Dec 2020 31 Dec 2019
RM'000 RM'000 RM'000 RM'000
Purchase of property:
Residential 17,149,089 17,838,858 13,104,101 13,673,312
Non residential 1,404,442 1,427,087 618,148 627,338
Purchase of securities 3,130 3,177 3,130 3,177
Purchase of transport vehicles 15,574 17,103 14,763 16,332
Consumption credit 5,675,861 6,420,319 3,423,738 4,037,542
Construction 3,449,175 2,906,066 2,415,360 2,088,817
Working capital 19,435,094 20,935,035 15,157,502 16,661,495
Other purpose 4,474,814 2,278,004 3,029,546 1,417,418
51,607,179 51,825,649 37,766,288 38,525,431
(vii) By geographical distribution
31 Dec 2020 31 Dec 2019 31 Dec 2020 31 Dec 2019
RM'000 RM'000 RM'000 RM'000
Northern Region 6,004,352 6,568,954 4,774,648 5,011,671
Southern Region 5,940,209 6,046,981 4,257,990 4,476,077
Central Region 37,644,928 37,011,516 27,064,114 27,218,490
Eastern Region 2,017,690 2,198,198 1,669,536 1,819,193
51,607,179 51,825,649 37,766,288 38,525,431
Concentration by location for loans, advances and financing is based on the location of the borrower.
The Northern region consists of the states of Perlis, Kedah, Penang, Perak, Pahang, Kelantan and Terengganu.
The Southern region consists of the states of Johor, Malacca and Negeri Sembilan.
The Central region consists of the state of Selangor, the Federal Territory of Kuala Lumpur and the Federal
Territory of Putrajaya.
The Eastern region consists of the states of Sabah, Sarawak and the Federal Territory of Labuan.
Group Bank
Group
Group
Bank
Bank
#
139
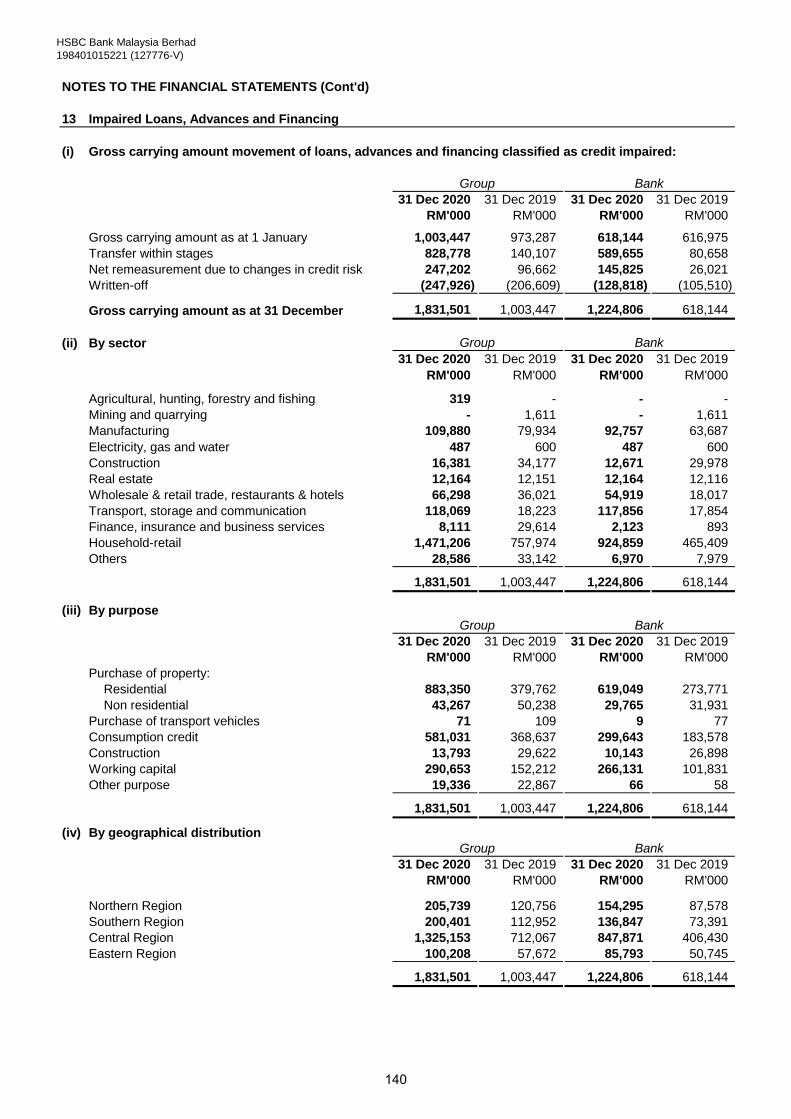
HSBC Bank Malaysia Berhad
198401015221 (127776-V)
NOTES TO THE FINANCIAL STATEMENTS (Cont'd)
13 Impaired Loans, Advances and Financing
(i) Gross carrying amount movement of loans, advances and financing classified as credit impaired:
31 Dec 2020 31 Dec 2019 31 Dec 2020 31 Dec 2019
RM'000 RM'000 RM'000 RM'000
Gross carrying amount as at 1 January 1,003,447 973,287 618,144 616,975
Transfer within stages 828,778 140,107 589,655 80,658
Net remeasurement due to changes in credit risk 247,202 96,662 145,825 26,021
Written-off (247,926) (206,609) (128,818) (105,510)
Gross carrying amount as at 31 December 1,831,501 1,003,447 1,224,806 618,144
(ii) By sector
31 Dec 2020 31 Dec 2019 31 Dec 2020 31 Dec 2019
RM'000 RM'000 RM'000 RM'000
Agricultural, hunting, forestry and fishing 319 - - -
Mining and quarrying - 1,611 - 1,611
Manufacturing 109,880 79,934 92,757 63,687
Electricity, gas and water 487 600 487 600
Construction 16,381 34,177 12,671 29,978
Real estate 12,164 12,151 12,164 12,116
Wholesale & retail trade, restaurants & hotels 66,298 36,021 54,919 18,017
Transport, storage and communication 118,069 18,223 117,856 17,854
Finance, insurance and business services 8,111 29,614 2,123 893
Household-retail 1,471,206 757,974 924,859 465,409
Others 28,586 33,142 6,970 7,979
1,831,501 1,003,447 1,224,806 618,144
(iii) By purpose
31 Dec 2020 31 Dec 2019 31 Dec 2020 31 Dec 2019
RM'000 RM'000 RM'000 RM'000
Purchase of property:
Residential 883,350 379,762 619,049 273,771
Non residential 43,267 50,238 29,765 31,931
Purchase of transport vehicles 71 109 9 77
Consumption credit 581,031 368,637 299,643 183,578
Construction 13,793 29,622 10,143 26,898
Working capital 290,653 152,212 266,131 101,831
Other purpose 19,336 22,867 66 58
1,831,501 1,003,447 1,224,806 618,144
(iv) By geographical distribution
31 Dec 2020 31 Dec 2019 31 Dec 2020 31 Dec 2019
RM'000 RM'000 RM'000 RM'000
Northern Region 205,739 120,756 154,295 87,578
Southern Region 200,401 112,952 136,847 73,391
Central Region 1,325,153 712,067 847,871 406,430
Eastern Region 100,208 57,672 85,793 50,745
1,831,501 1,003,447 1,224,806 618,144
Group Bank
Group Bank
Group Bank
Group Bank
#
140
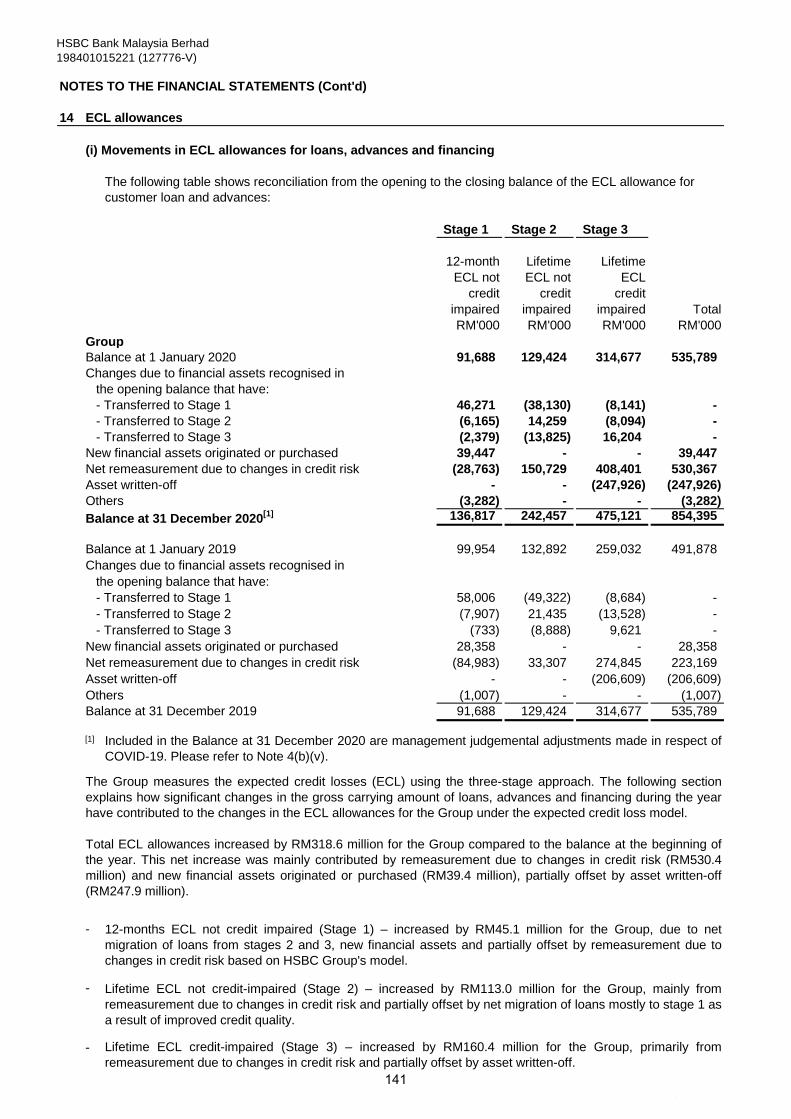
HSBC Bank Malaysia Berhad
198401015221 (127776-V)
NOTES TO THE FINANCIAL STATEMENTS (Cont'd)
14 ECL allowances
(i) Movements in ECL allowances for loans, advances and financing
Stage 1 Stage 2 Stage 3
12-month Lifetime Lifetime
ECL not ECL not ECL
credit credit credit
impaired impaired impaired Total
RM'000 RM'000 RM'000 RM'000
Group
Balance at 1 January 2020 91,688 129,424 314,677 535,789
Changes due to financial assets recognised in
the opening balance that have:
- Transferred to Stage 1 46,271 (38,130) (8,141) -
- Transferred to Stage 2 (6,165) 14,259 (8,094) -
- Transferred to Stage 3 (2,379) (13,825) 16,204 -
New financial assets originated or purchased 39,447 - - 39,447
Net remeasurement due to changes in credit risk (28,763) 150,729 408,401 530,367
Asset written-off - - (247,926) (247,926)
Others (3,282) - - (3,282)
Balance at 31 December 2020[1] 136,817 242,457 475,121 854,395
Balance at 1 January 2019 99,954 132,892 259,032 491,878
Changes due to financial assets recognised in
the opening balance that have:
- Transferred to Stage 1 58,006 (49,322) (8,684) -
- Transferred to Stage 2 (7,907) 21,435 (13,528) -
- Transferred to Stage 3 (733) (8,888) 9,621 -
New financial assets originated or purchased 28,358 - - 28,358
Net remeasurement due to changes in credit risk (84,983) 33,307 274,845 223,169
Asset written-off - - (206,609) (206,609)
Others (1,007) - - (1,007)
Balance at 31 December 2019 91,688 129,424 314,677 535,789
[1]
-
-
-
The following table shows reconciliation from the opening to the closing balance of the ECL allowance for
customer loan and advances:
The Group measures the expected credit losses (ECL) using the three-stage approach. The following section
explains how significant changes in the gross carrying amount of loans, advances and financing during the year
have contributed to the changes in the ECL allowances for the Group under the expected credit loss model.
Total ECL allowances increased by RM318.6 million for the Group compared to the balance at the beginning of
the year. This net increase was mainly contributed by remeasurement due to changes in credit risk (RM530.4
million) and new financial assets originated or purchased (RM39.4 million), partially offset by asset written-off
(RM247.9 million).
12-months ECL not credit impaired (Stage 1) – increased by RM45.1 million for the Group, due to net
migration of loans from stages 2 and 3, new financial assets and partially offset by remeasurement due to
changes in credit risk based on HSBC Group's model.
Lifetime ECL not credit-impaired (Stage 2) – increased by RM113.0 million for the Group, mainly from
remeasurement due to changes in credit risk and partially offset by net migration of loans mostly to stage 1 as
a result of improved credit quality.
Lifetime ECL credit-impaired (Stage 3) – increased by RM160.4 million for the Group, primarily from
remeasurement due to changes in credit risk and partially offset by asset written-off.
Included in the Balance at 31 December 2020 are management judgemental adjustments made in respect of
COVID-19. Please refer to Note 4(b)(v).
#
141

HSBC Bank Malaysia Berhad
198401015221 (127776-V)
NOTES TO THE FINANCIAL STATEMENTS (Cont'd)
14 ECL allowances (Cont'd)
(i) Movements in ECL allowances for loans, advances and financing (Cont'd)
Stage 1 Stage 2 Stage 3
12-month Lifetime Lifetime
ECL not ECL not ECL
credit credit credit
impaired impaired impaired Total
RM'000 RM'000 RM'000 RM'000
Bank
Balance at 1 January 2020 45,185 61,421 171,918 278,524
Changes due to financial assets recognised in
the opening balance that have:
- Transferred to Stage 1 23,323 (17,647) (5,676) -
- Transferred to Stage 2 (3,234) 8,590 (5,356) -
- Transferred to Stage 3 (978) (7,708) 8,686 -
New financial assets originated or purchased 11,463 - - 11,463
Net remeasurement due to changes in credit risk (24,598) 122,037 250,603 348,042
Asset written-off - - (128,818) (128,818)
Others (3,131) - - (3,131)
Balance at 31 December 2020[1] 48,030 166,693 291,357 506,080
Balance at 1 January 2019 55,966 68,428 132,951 257,345
Changes due to financial assets recognised in
the opening balance that have:
- Transferred to Stage 1 36,259 (31,147) (5,112) -
- Transferred to Stage 2 (3,612) 13,084 (9,472) -
- Transferred to Stage 3 (290) (5,057) 5,347 -
New financial assets originated or purchased 10,703 - - 10,703
Net remeasurement due to changes in credit risk (53,052) 16,113 153,714 116,775
Asset written-off - - (105,510) (105,510)
Others (789) - - (789)
Balance at 31 December 2019 45,185 61,421 171,918 278,524
[1]
-
-
-
Lifetime ECL not credit-impaired (Stage 2) – increased by RM105.3 million for the Bank, mainly from
remeasurement due to changes in credit risk and offset by migration of loans mostly to stage 1 due to credit
quality improvement.
Lifetime ECL credit-impaired (Stage 3) – increased by RM119.4 million, primarily contributed by
remeasurement due to changes in credit risk. This was partially offset by impaired loans written off.
12-months ECL not credit impaired (Stage 1) – increased by RM2.8 million for the Bank, contributed by net
migration of loans from stages 2 and 3 due to improved credit quality and new financial assets, partially offset
by remeasurement due to changes in credit risk.
The Bank measures the expected credit losses (ECL) using the three-stage approach. The following section
explains how significant changes in the gross carrying amount of loans, advances and financing during the year
have contributed to the changes in the ECL allowances for the Bank under the expected credit loss model.
The total ECL allowances increased by RM227.6 million for the Bank compared to the balance at the beginning
of the year. This net increase was mainly contributed by remeasurement due to changes in credit risk (RM348.0
million) and new financial assets originated or purchased (RM11.5 million), partially offset by asset written-off
(RM128.8 million).
Included in the Balance at 31 December 2020 are management judgemental adjustments made in respect of
COVID-19. Please refer to Note 4(b)(v).
#
142
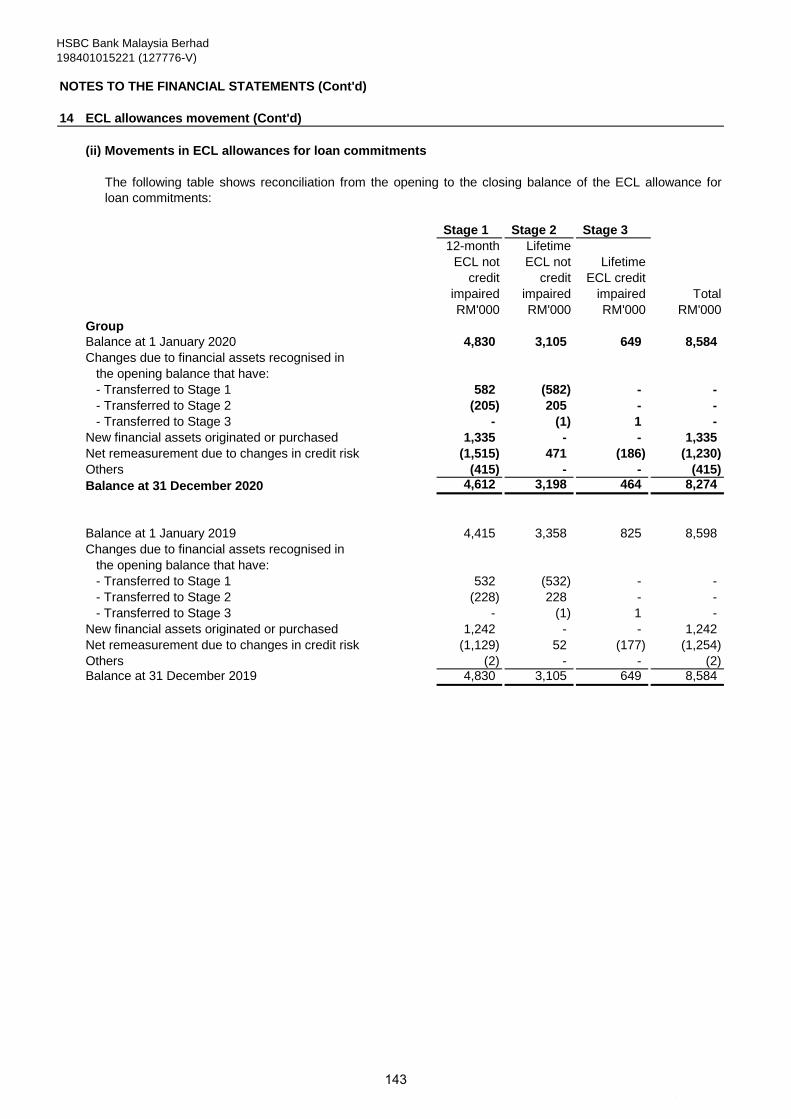
HSBC Bank Malaysia Berhad
198401015221 (127776-V)
NOTES TO THE FINANCIAL STATEMENTS (Cont'd)
14 ECL allowances movement (Cont'd)
(ii) Movements in ECL allowances for loan commitments
Stage 1 Stage 2 Stage 3
12-month Lifetime
ECL not ECL not Lifetime
credit credit ECL credit
impaired impaired impaired Total
RM'000 RM'000 RM'000 RM'000
Group
Balance at 1 January 2020 4,830 3,105 649 8,584
Changes due to financial assets recognised in
the opening balance that have:
- Transferred to Stage 1 582 (582) - -
- Transferred to Stage 2 (205) 205 - -
- Transferred to Stage 3 - (1) 1 -
New financial assets originated or purchased 1,335 - - 1,335
Net remeasurement due to changes in credit risk (1,515) 471 (186) (1,230)
Others (415) - - (415)
Balance at 31 December 2020 4,612 3,198 464 8,274
Balance at 1 January 2019 4,415 3,358 825 8,598
Changes due to financial assets recognised in
the opening balance that have:
- Transferred to Stage 1 532 (532) - -
- Transferred to Stage 2 (228) 228 - -
- Transferred to Stage 3 - (1) 1 -
New financial assets originated or purchased 1,242 - - 1,242
Net remeasurement due to changes in credit risk (1,129) 52 (177) (1,254)
Others (2) - - (2) Balance at 31 December 2019 4,830 3,105 649 8,584
The following table shows reconciliation from the opening to the closing balance of the ECL allowance for
loan commitments:
#
143
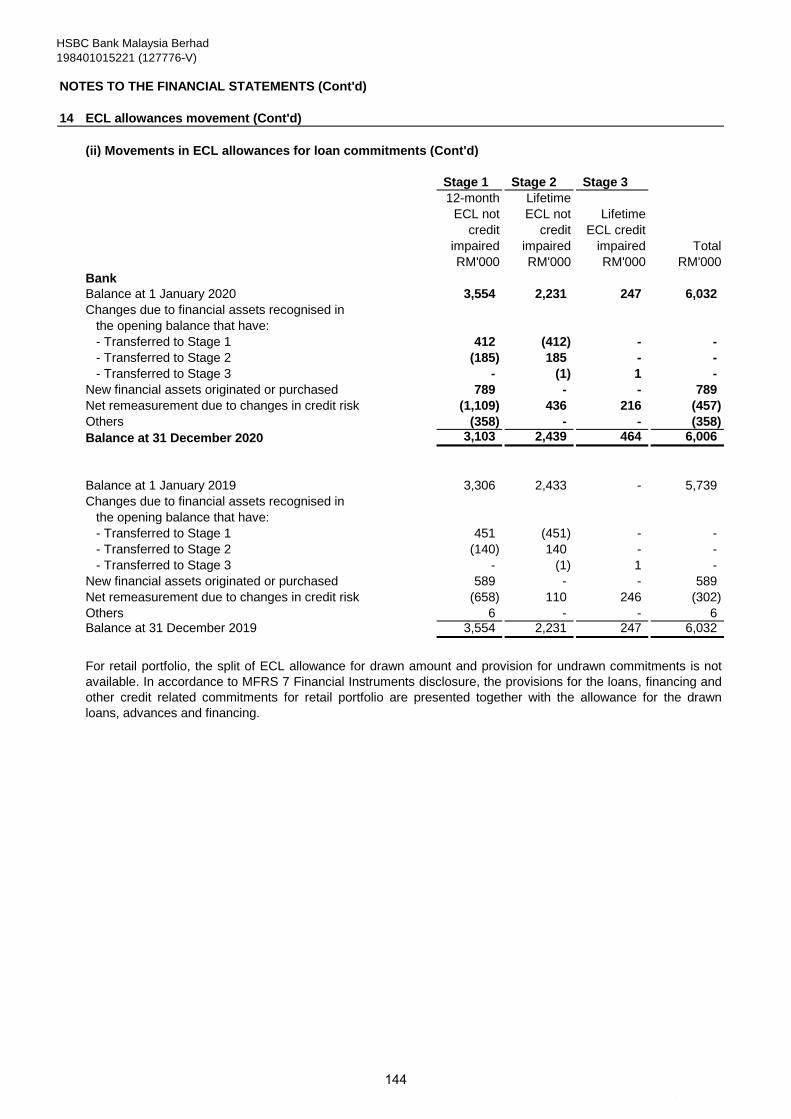
HSBC Bank Malaysia Berhad
198401015221 (127776-V)
NOTES TO THE FINANCIAL STATEMENTS (Cont'd)
14 ECL allowances movement (Cont'd)
(ii) Movements in ECL allowances for loan commitments (Cont'd)
Stage 1 Stage 2 Stage 3
12-month Lifetime
ECL not ECL not Lifetime
credit credit ECL credit
impaired impaired impaired Total
RM'000 RM'000 RM'000 RM'000
Bank
Balance at 1 January 2020 3,554 2,231 247 6,032
Changes due to financial assets recognised in
the opening balance that have:
- Transferred to Stage 1 412 (412) - -
- Transferred to Stage 2 (185) 185 - -
- Transferred to Stage 3 - (1) 1 -
New financial assets originated or purchased 789 - - 789
Net remeasurement due to changes in credit risk (1,109) 436 216 (457)
Others (358) - - (358)
Balance at 31 December 2020 3,103 2,439 464 6,006
Balance at 1 January 2019 3,306 2,433 - 5,739
Changes due to financial assets recognised in
the opening balance that have:
- Transferred to Stage 1 451 (451) - -
- Transferred to Stage 2 (140) 140 - -
- Transferred to Stage 3 - (1) 1 -
New financial assets originated or purchased 589 - - 589
Net remeasurement due to changes in credit risk (658) 110 246 (302)
Others 6 - - 6 Balance at 31 December 2019 3,554 2,231 247 6,032
For retail portfolio, the split of ECL allowance for drawn amount and provision for undrawn commitments is not
available. In accordance to MFRS 7 Financial Instruments disclosure, the provisions for the loans, financing and
other credit related commitments for retail portfolio are presented together with the allowance for the drawn
loans, advances and financing.
#
144
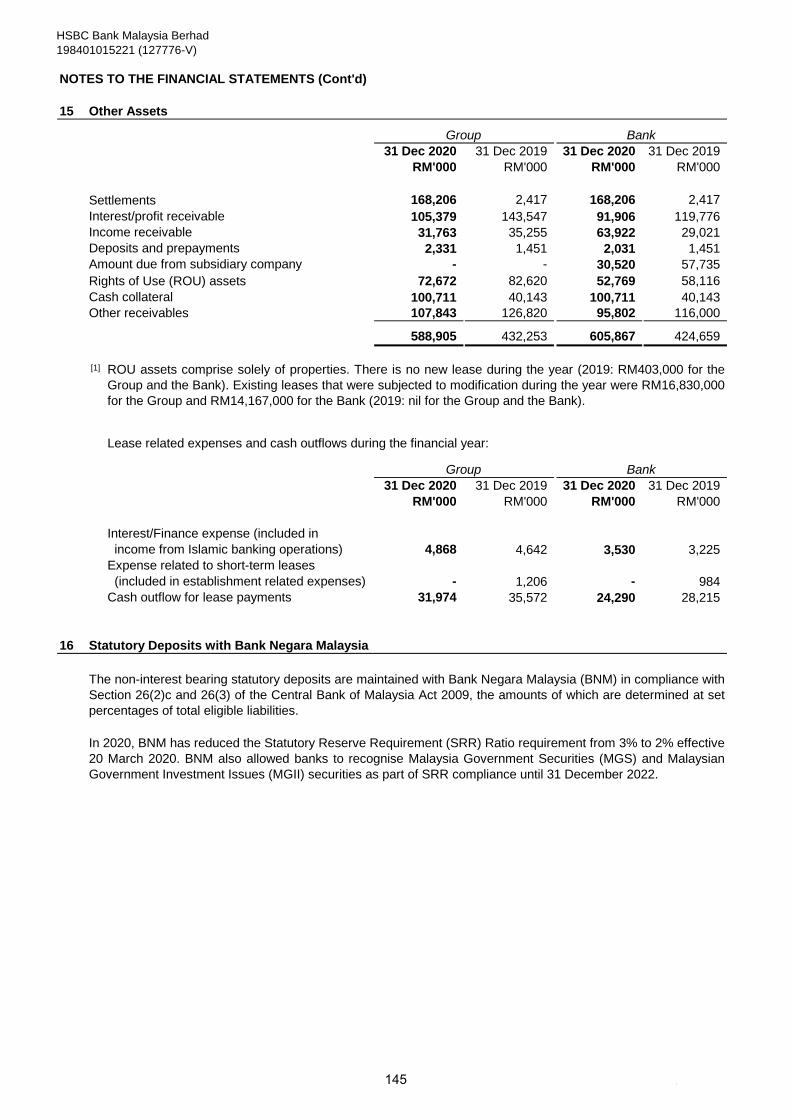
HSBC Bank Malaysia Berhad
198401015221 (127776-V)
NOTES TO THE FINANCIAL STATEMENTS (Cont'd)
15 Other Assets
31 Dec 2020 31 Dec 2019 31 Dec 2020 31 Dec 2019
RM'000 RM'000 RM'000 RM'000
Settlements 168,206 2,417 168,206 2,417
Interest/profit receivable 105,379 143,547 91,906 119,776
Income receivable 31,763 35,255 63,922 29,021
Deposits and prepayments 2,331 1,451 2,031 1,451
Amount due from subsidiary company - - 30,520 57,735
Rights of Use (ROU) assets 72,672 82,620 52,769 58,116
Cash collateral 100,711 40,143 100,711 40,143
Other receivables 107,843 126,820 95,802 116,000
588,905 432,253 605,867 424,659
[1]
Lease related expenses and cash outflows during the financial year:
31 Dec 2020 31 Dec 2019 31 Dec 2020 31 Dec 2019
RM'000 RM'000 RM'000 RM'000
Interest/Finance expense (included in
income from Islamic banking operations) 4,868 4,642 3,530 3,225
Expense related to short-term leases
(included in establishment related expenses) - 1,206 - 984
Cash outflow for lease payments 31,974 35,572 24,290 28,215
16 Statutory Deposits with Bank Negara Malaysia
Group Bank
The non-interest bearing statutory deposits are maintained with Bank Negara Malaysia (BNM) in compliance with
Section 26(2)c and 26(3) of the Central Bank of Malaysia Act 2009, the amounts of which are determined at set
percentages of total eligible liabilities.
Group Bank
ROU assets comprise solely of properties. There is no new lease during the year (2019: RM403,000 for the
Group and the Bank). Existing leases that were subjected to modification during the year were RM16,830,000
for the Group and RM14,167,000 for the Bank (2019: nil for the Group and the Bank).
In 2020, BNM has reduced the Statutory Reserve Requirement (SRR) Ratio requirement from 3% to 2% effective
20 March 2020. BNM also allowed banks to recognise Malaysia Government Securities (MGS) and Malaysian
Government Investment Issues (MGII) securities as part of SRR compliance until 31 December 2022.
#145
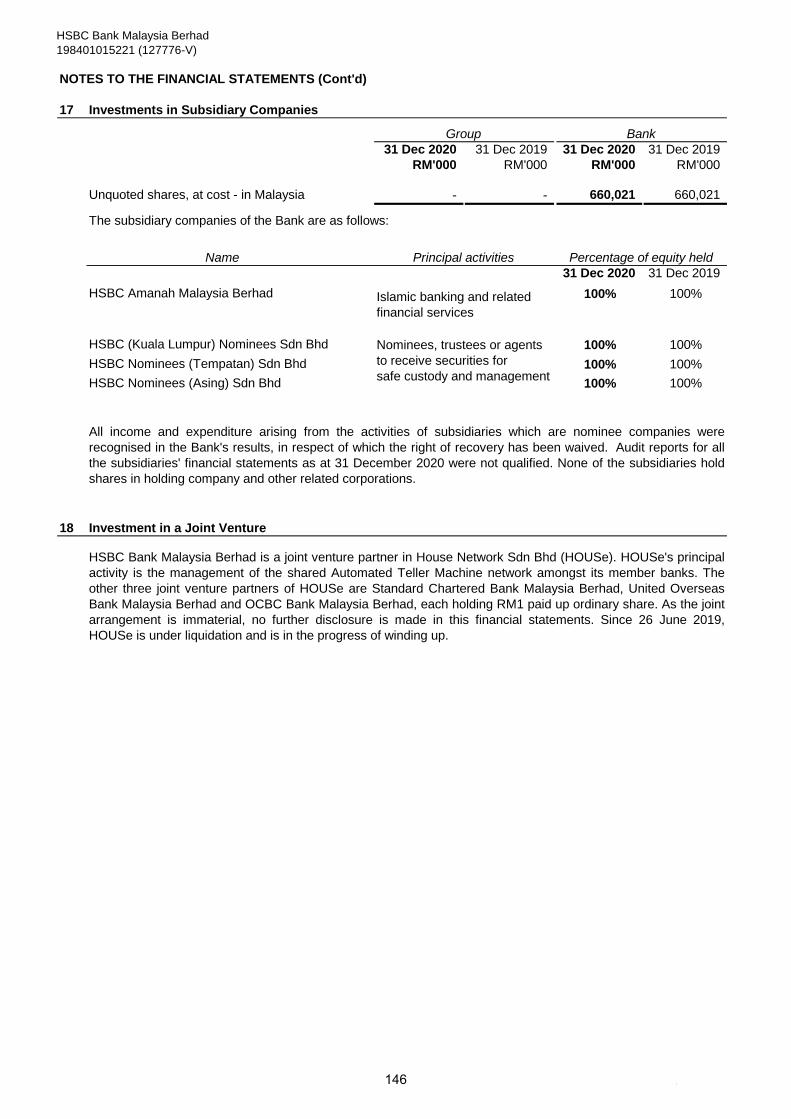
HSBC Bank Malaysia Berhad
198401015221 (127776-V)
NOTES TO THE FINANCIAL STATEMENTS (Cont'd)
17 Investments in Subsidiary Companies
31 Dec 2020 31 Dec 2019 31 Dec 2020 31 Dec 2019
RM'000 RM'000 RM'000 RM'000
Unquoted shares, at cost - in Malaysia - - 660,021 660,021
The subsidiary companies of the Bank are as follows:
31 Dec 2020 31 Dec 2019
HSBC Amanah Malaysia Berhad 100% 100%
HSBC (Kuala Lumpur) Nominees Sdn Bhd 100% 100%
HSBC Nominees (Tempatan) Sdn Bhd 100% 100%
HSBC Nominees (Asing) Sdn Bhd 100% 100%
18 Investment in a Joint Venture
Group Bank
All income and expenditure arising from the activities of subsidiaries which are nominee companies were
recognised in the Bank's results, in respect of which the right of recovery has been waived. Audit reports for all
the subsidiaries' financial statements as at 31 December 2020 were not qualified. None of the subsidiaries hold
shares in holding company and other related corporations.
Islamic banking and related
financial services
HSBC Bank Malaysia Berhad is a joint venture partner in House Network Sdn Bhd (HOUSe). HOUSe's principal
activity is the management of the shared Automated Teller Machine network amongst its member banks. The
other three joint venture partners of HOUSe are Standard Chartered Bank Malaysia Berhad, United Overseas
Bank Malaysia Berhad and OCBC Bank Malaysia Berhad, each holding RM1 paid up ordinary share. As the joint
arrangement is immaterial, no further disclosure is made in this financial statements. Since 26 June 2019,
HOUSe is under liquidation and is in the progress of winding up.
Name Principal activities Percentage of equity held
Nominees, trustees or agents
to receive securities for
safe custody and management
#146
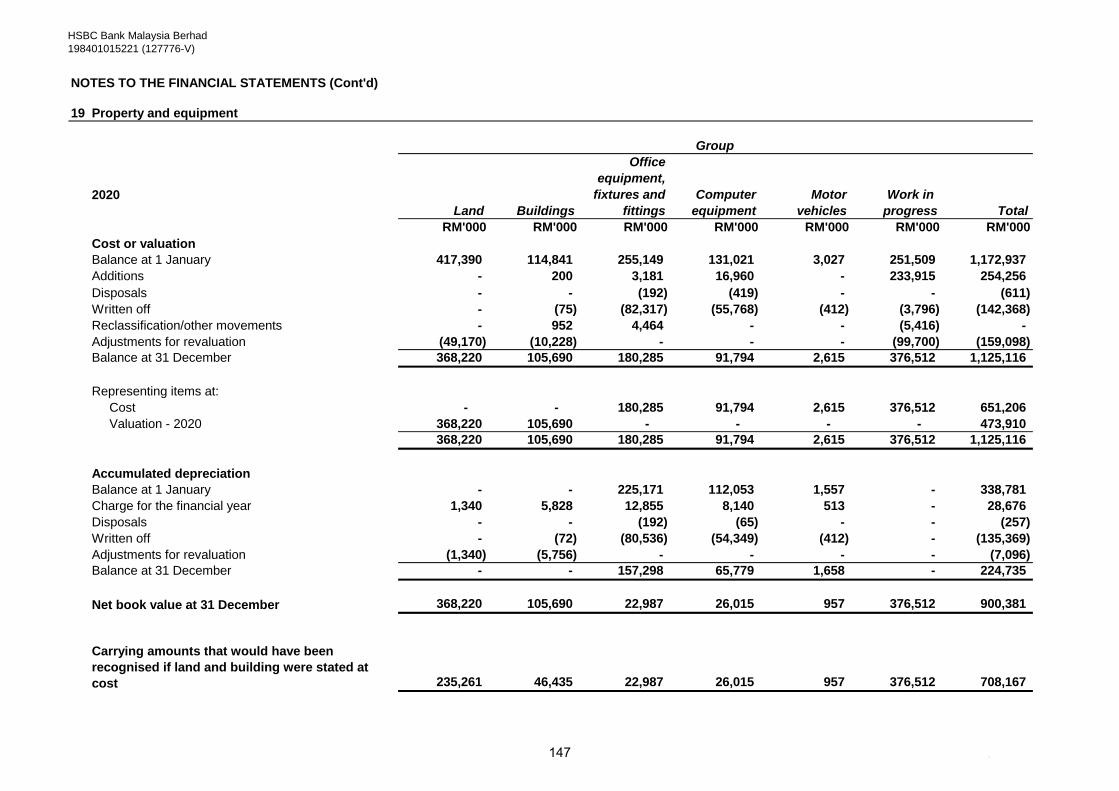
HSBC Bank Malaysia Berhad
198401015221 (127776-V)
NOTES TO THE FINANCIAL STATEMENTS (Cont'd)
19 Property and equipment
Office
equipment,
2020 fixtures and Computer Motor Work in
Land Buildings fittings equipment vehicles progress Total
RM'000 RM'000 RM'000 RM'000 RM'000 RM'000 RM'000
Cost or valuation
Balance at 1 January 417,390 114,841 255,149 131,021 3,027 251,509 1,172,937
Additions - 200 3,181 16,960 - 233,915 254,256
Disposals - - (192) (419) - - (611)
Written off - (75) (82,317) (55,768) (412) (3,796) (142,368)
Reclassification/other movements - 952 4,464 - - (5,416) -
Adjustments for revaluation (49,170) (10,228) - - - (99,700) (159,098)
Balance at 31 December 368,220 105,690 180,285 91,794 2,615 376,512 1,125,116
Representing items at:
Cost - - 180,285 91,794 2,615 376,512 651,206
Valuation - 2020 368,220 105,690 - - - - 473,910
368,220 105,690 180,285 91,794 2,615 376,512 1,125,116
Accumulated depreciation
Balance at 1 January - - 225,171 112,053 1,557 - 338,781
Charge for the financial year 1,340 5,828 12,855 8,140 513 - 28,676
Disposals - - (192) (65) - - (257)
Written off - (72) (80,536) (54,349) (412) - (135,369)
Adjustments for revaluation (1,340) (5,756) - - - - (7,096)
Balance at 31 December - - 157,298 65,779 1,658 - 224,735
Net book value at 31 December 368,220 105,690 22,987 26,015 957 376,512 900,381
Carrying amounts that would have been
recognised if land and building were stated at
cost 235,261 46,435 22,987 26,015 957 376,512 708,167
Group
#147
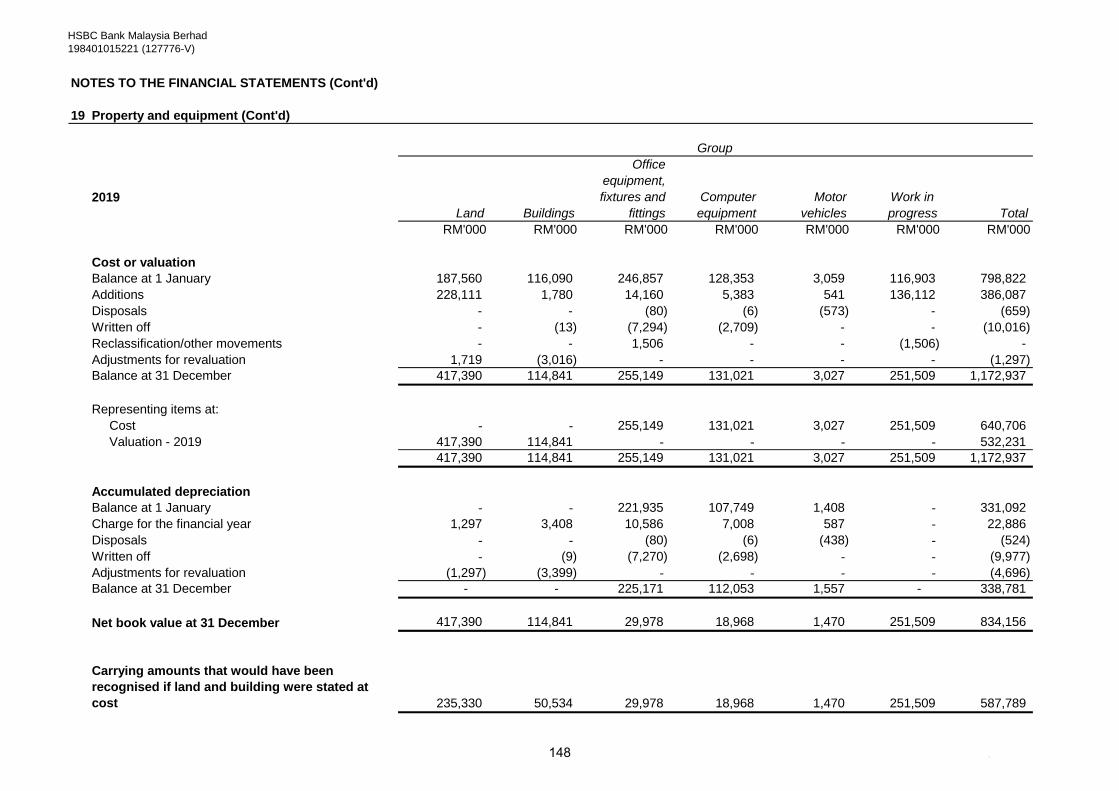
HSBC Bank Malaysia Berhad
198401015221 (127776-V)
NOTES TO THE FINANCIAL STATEMENTS (Cont'd)
19 Property and equipment (Cont'd)
Office
equipment,
2019 fixtures and Computer Motor Work in
Land Buildings fittings equipment vehicles progress Total
RM'000 RM'000 RM'000 RM'000 RM'000 RM'000 RM'000
Cost or valuation
Balance at 1 January 187,560 116,090 246,857 128,353 3,059 116,903 798,822
Additions 228,111 1,780 14,160 5,383 541 136,112 386,087
Disposals - - (80) (6) (573) - (659)
Written off - (13) (7,294) (2,709) - - (10,016)
Reclassification/other movements - - 1,506 - - (1,506) -
Adjustments for revaluation 1,719 (3,016) - - - - (1,297)
Balance at 31 December 417,390 114,841 255,149 131,021 3,027 251,509 1,172,937
Representing items at:
Cost - - 255,149 131,021 3,027 251,509 640,706
Valuation - 2019 417,390 114,841 - - - - 532,231
417,390 114,841 255,149 131,021 3,027 251,509 1,172,937
Accumulated depreciation
Balance at 1 January - - 221,935 107,749 1,408 - 331,092
Charge for the financial year 1,297 3,408 10,586 7,008 587 - 22,886
Disposals - - (80) (6) (438) - (524)
Written off - (9) (7,270) (2,698) - - (9,977)
Adjustments for revaluation (1,297) (3,399) - - - - (4,696)
Balance at 31 December - - 225,171 112,053 1,557 - 338,781
Net book value at 31 December 417,390 114,841 29,978 18,968 1,470 251,509 834,156
Carrying amounts that would have been
recognised if land and building were stated at
cost 235,330 50,534 29,978 18,968 1,470 251,509 587,789
Group
#148

HSBC Bank Malaysia Berhad
198401015221 (127776-V)
NOTES TO THE FINANCIAL STATEMENTS (Cont'd)
19 Property and equipment (Cont'd)
Office
equipment,
2020 fixtures and Computer Motor Work in
Land Buildings fittings equipment vehicles progress Total
RM'000 RM'000 RM'000 RM'000 RM'000 RM'000 RM'000
Cost or valuation
Balance at 1 January 417,390 114,841 217,252 110,803 2,726 251,509 1,114,521
Additions - 200 2,693 13,064 - 233,915 249,872
Disposals - - (192) (419) - - (611)
Written off - (75) (78,031) (44,145) (412) (3,796) (126,459)
Reclassification - 952 4,464 - - (5,416) -
Adjustments for revaluation (49,170) (10,228) - - - (99,700) (159,098)
Balance at 31 December 368,220 105,690 146,186 79,303 2,314 376,512 1,078,225
Representing items at:
Cost - - 146,186 79,303 2,314 376,512 604,315
Valuation - 2020 368,220 105,690 - - - - 473,910
368,220 105,690 146,186 79,303 2,314 376,512 1,078,225
Accumulated depreciation
Balance at 1 January - - 192,056 93,908 1,502 - 287,466
Charge for the financial year 1,340 5,828 11,451 7,468 453 - 26,540
Disposals - - (192) (65) - - (257)
Written off - (72) (76,403) (42,838) (412) - (119,725)
Adjustments for revaluation (1,340) (5,756) - - - - (7,096)
Balance at 31 December - - 126,912 58,473 1,543 - 186,928
Net book value at 31 December 368,220 105,690 19,274 20,830 771 376,512 891,297
Carrying amounts that would have been
recognised if land and building were stated at
cost 235,261 46,435 19,274 20,830 771 376,512 699,083
Bank
#149
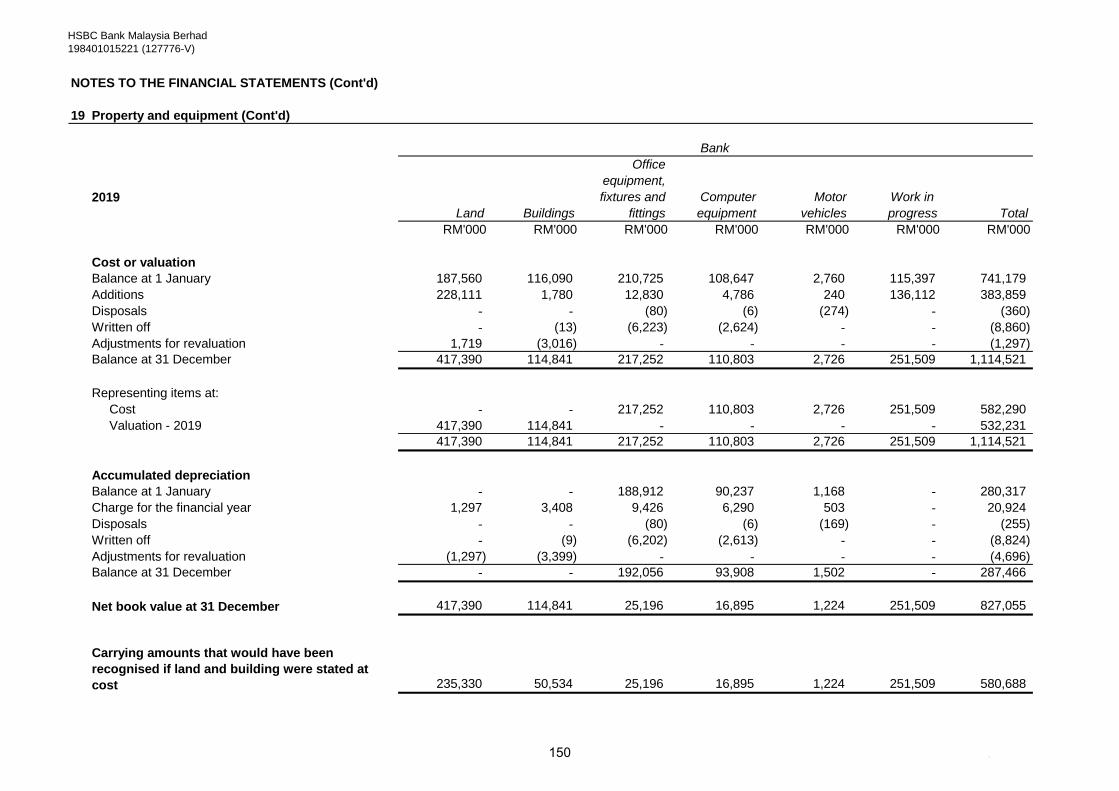
HSBC Bank Malaysia Berhad
198401015221 (127776-V)
NOTES TO THE FINANCIAL STATEMENTS (Cont'd)
19 Property and equipment (Cont'd)
Office
equipment,
2019 fixtures and Computer Motor Work in
Land Buildings fittings equipment vehicles progress Total
RM'000 RM'000 RM'000 RM'000 RM'000 RM'000 RM'000
Cost or valuation
Balance at 1 January 187,560 116,090 210,725 108,647 2,760 115,397 741,179
Additions 228,111 1,780 12,830 4,786 240 136,112 383,859
Disposals - - (80) (6) (274) - (360)
Written off - (13) (6,223) (2,624) - - (8,860)
Adjustments for revaluation 1,719 (3,016) - - - - (1,297)
Balance at 31 December 417,390 114,841 217,252 110,803 2,726 251,509 1,114,521
Representing items at:
Cost - - 217,252 110,803 2,726 251,509 582,290
Valuation - 2019 417,390 114,841 - - - - 532,231
417,390 114,841 217,252 110,803 2,726 251,509 1,114,521
Accumulated depreciation
Balance at 1 January - - 188,912 90,237 1,168 - 280,317
Charge for the financial year 1,297 3,408 9,426 6,290 503 - 20,924
Disposals - - (80) (6) (169) - (255)
Written off - (9) (6,202) (2,613) - - (8,824)
Adjustments for revaluation (1,297) (3,399) - - - - (4,696)
Balance at 31 December - - 192,056 93,908 1,502 - 287,466
Net book value at 31 December 417,390 114,841 25,196 16,895 1,224 251,509 827,055
Carrying amounts that would have been
recognised if land and building were stated at
cost 235,330 50,534 25,196 16,895 1,224 251,509 580,688
Bank
#150

HSBC Bank Malaysia Berhad
198401015221 (127776-V)
NOTES TO THE FINANCIAL STATEMENTS (Cont'd)
20 Intangible Assets
Computer software Group Bank
2020 RM'000 RM'000
Cost
Balance at 1 January 288,624 283,572
Additions 2,722 2,722
Written off (1,622) (949)
Balance at 31 December 289,724 285,345
Accumulated amortisation
Balance at 1 January 244,447 239,395
Charge for the financial year 11,796 11,796
Written off (1,622) (949)
At 31 December 254,621 250,242
Accumulated impairment loss
Balance at 1 January 5,323 5,323
Charge for the financial year 681 681
At 31 December 6,004 6,004
Net book value at 31 December 29,099 29,099
2019 RM'000 RM'000
Cost
Balance at 1 January 278,691 273,638
Additions 10,101 10,101
Written off (168) (167)
Balance at 31 December 288,624 283,572
Accumulated amortisation
Balance at 1 January 233,624 228,571
Charge for the financial year 10,991 10,991
Written off (168) (167)
At 31 December 244,447 239,395
Accumulated impairment loss
Balance at 1 January 5,376 5,376
Release for the financial year (53) (53)
Balance at 31 December 5,323 5,323
Net book value at 31 December 38,854 38,854
#
151
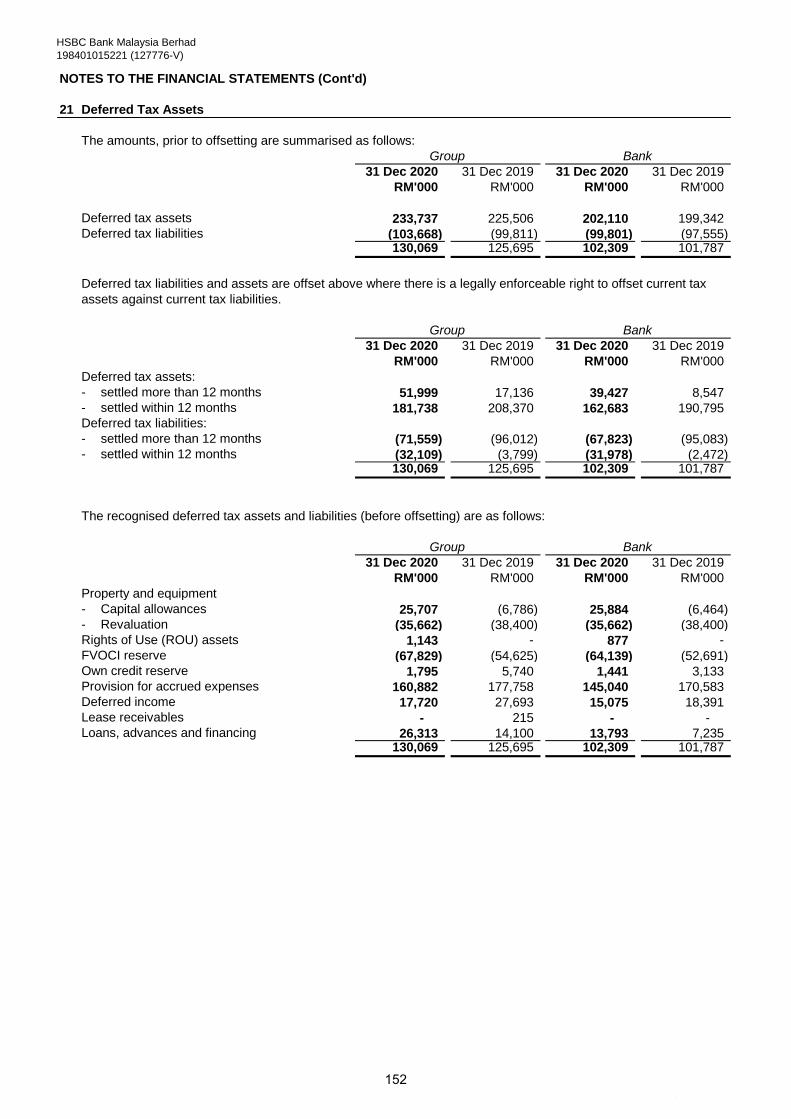
HSBC Bank Malaysia Berhad
198401015221 (127776-V)
NOTES TO THE FINANCIAL STATEMENTS (Cont'd)
21 Deferred Tax Assets
The amounts, prior to offsetting are summarised as follows:
31 Dec 2020 31 Dec 2019 31 Dec 2020 31 Dec 2019
RM'000 RM'000 RM'000 RM'000
Deferred tax assets 233,737 225,506 202,110 199,342
Deferred tax liabilities (103,668) (99,811) (99,801) (97,555) 130,069 125,695 102,309 101,787
31 Dec 2020 31 Dec 2019 31 Dec 2020 31 Dec 2019
RM'000 RM'000 RM'000 RM'000
Deferred tax assets:
- settled more than 12 months 51,999 17,136 39,427 8,547
- settled within 12 months 181,738 208,370 162,683 190,795
Deferred tax liabilities:
- settled more than 12 months (71,559) (96,012) (67,823) (95,083)
- settled within 12 months (32,109) (3,799) (31,978) (2,472) 130,069 125,695 102,309 101,787
The recognised deferred tax assets and liabilities (before offsetting) are as follows:
31 Dec 2020 31 Dec 2019 31 Dec 2020 31 Dec 2019
RM'000 RM'000 RM'000 RM'000
Property and equipment
- Capital allowances 25,707 (6,786) 25,884 (6,464)
- Revaluation (35,662) (38,400) (35,662) (38,400)
Rights of Use (ROU) assets 1,143 - 877 -
FVOCI reserve (67,829) (54,625) (64,139) (52,691)
Own credit reserve 1,795 5,740 1,441 3,133
Provision for accrued expenses 160,882 177,758 145,040 170,583
Deferred income 17,720 27,693 15,075 18,391
Lease receivables - 215 - -
Loans, advances and financing 26,313 14,100 13,793 7,235 130,069 125,695 102,309 101,787
Group Bank
Deferred tax liabilities and assets are offset above where there is a legally enforceable right to offset current tax
assets against current tax liabilities.
BankGroup
Group Bank
#
152
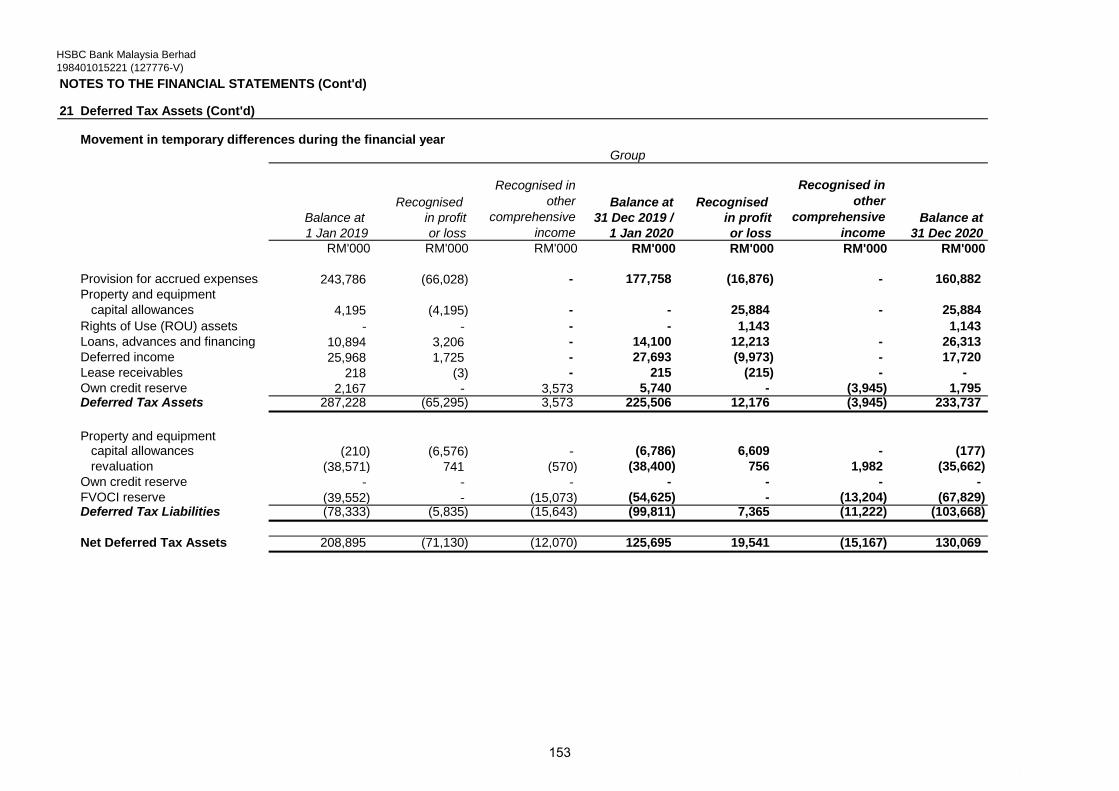
HSBC Bank Malaysia Berhad
198401015221 (127776-V)
NOTES TO THE FINANCIAL STATEMENTS (Cont'd)
21 Deferred Tax Assets (Cont'd)
Movement in temporary differences during the financial year
Recognised Balance at Recognised
Balance at in profit 31 Dec 2019 / in profit Balance at
1 Jan 2019 or loss 1 Jan 2020 or loss 31 Dec 2020
RM'000 RM'000 RM'000 RM'000 RM'000 RM'000 RM'000
Provision for accrued expenses 243,786 (66,028) - 177,758 (16,876) - 160,882
Property and equipment
capital allowances 4,195 (4,195) - - 25,884 - 25,884
Rights of Use (ROU) assets - - - - 1,143 1,143
Loans, advances and financing 10,894 3,206 - 14,100 12,213 - 26,313
Deferred income 25,968 1,725 - 27,693 (9,973) - 17,720
Lease receivables 218 (3) - 215 (215) - -
Own credit reserve 2,167 - 3,573 5,740 - (3,945) 1,795 Deferred Tax Assets 287,228 (65,295) 3,573 225,506 12,176 (3,945) 233,737
Property and equipment capital allowances (210) (6,576) - (6,786) 6,609 - (177)
revaluation (38,571) 741 (570) (38,400) 756 1,982 (35,662)
Own credit reserve - - - - - - -
FVOCI reserve (39,552) - (15,073) (54,625) - (13,204) (67,829) Deferred Tax Liabilities (78,333) (5,835) (15,643) (99,811) 7,365 (11,222) (103,668)
Net Deferred Tax Assets 208,895 (71,130) (12,070) 125,695 19,541 (15,167) 130,069
Group
Recognised in
other
comprehensive
income
Recognised in
other
comprehensive
income
#
153
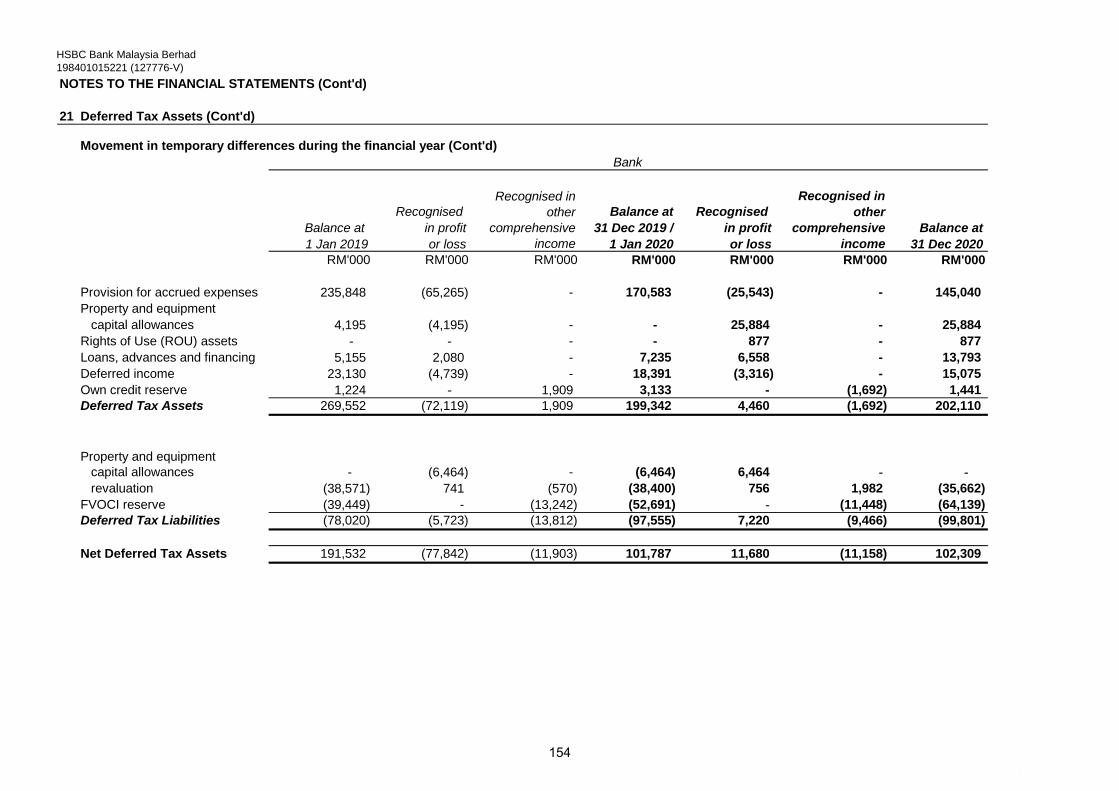
HSBC Bank Malaysia Berhad
198401015221 (127776-V)
NOTES TO THE FINANCIAL STATEMENTS (Cont'd)
21 Deferred Tax Assets (Cont'd)
Movement in temporary differences during the financial year (Cont'd)
Recognised Balance at Recognised
Balance at in profit 31 Dec 2019 / in profit Balance at
1 Jan 2019 or loss 1 Jan 2020 or loss 31 Dec 2020
RM'000 RM'000 RM'000 RM'000 RM'000 RM'000 RM'000
Provision for accrued expenses 235,848 (65,265) - 170,583 (25,543) - 145,040
Property and equipment
capital allowances 4,195 (4,195) - - 25,884 - 25,884
Rights of Use (ROU) assets - - - - 877 - 877
Loans, advances and financing 5,155 2,080 - 7,235 6,558 - 13,793
Deferred income 23,130 (4,739) - 18,391 (3,316) - 15,075
Own credit reserve 1,224 - 1,909 3,133 - (1,692) 1,441
Deferred Tax Assets 269,552 (72,119) 1,909 199,342 4,460 (1,692) 202,110
Property and equipment
capital allowances - (6,464) - (6,464) 6,464 - -
revaluation (38,571) 741 (570) (38,400) 756 1,982 (35,662)
FVOCI reserve (39,449) - (13,242) (52,691) - (11,448) (64,139)
Deferred Tax Liabilities (78,020) (5,723) (13,812) (97,555) 7,220 (9,466) (99,801)
Net Deferred Tax Assets 191,532 (77,842) (11,903) 101,787 11,680 (11,158) 102,309
Bank
Recognised in
other
comprehensive
income
Recognised in
other
comprehensive
income
#
154
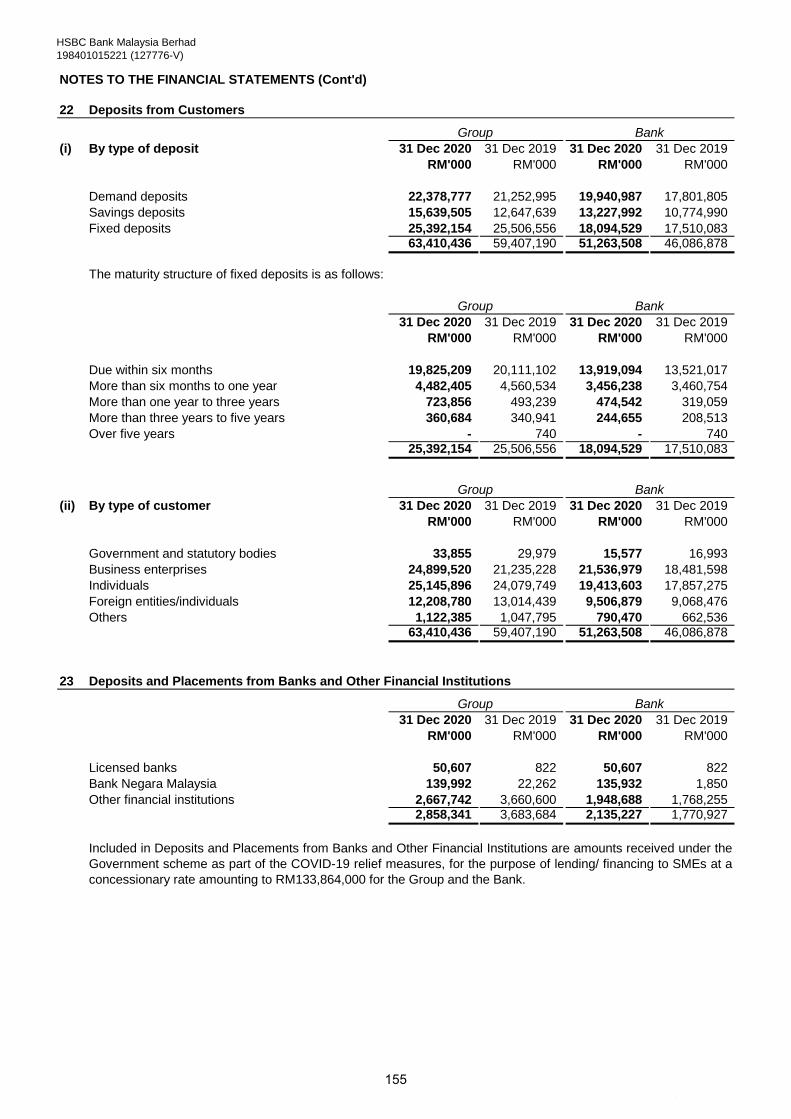
HSBC Bank Malaysia Berhad
198401015221 (127776-V)
NOTES TO THE FINANCIAL STATEMENTS (Cont'd)
22 Deposits from Customers
(i) By type of deposit 31 Dec 2020 31 Dec 2019 31 Dec 2020 31 Dec 2019
RM'000 RM'000 RM'000 RM'000
Demand deposits 22,378,777 21,252,995 19,940,987 17,801,805
Savings deposits 15,639,505 12,647,639 13,227,992 10,774,990
Fixed deposits 25,392,154 25,506,556 18,094,529 17,510,083 63,410,436 59,407,190 51,263,508 46,086,878
The maturity structure of fixed deposits is as follows:
31 Dec 2020 31 Dec 2019 31 Dec 2020 31 Dec 2019
RM'000 RM'000 RM'000 RM'000
Due within six months 19,825,209 20,111,102 13,919,094 13,521,017
More than six months to one year 4,482,405 4,560,534 3,456,238 3,460,754
More than one year to three years 723,856 493,239 474,542 319,059
More than three years to five years 360,684 340,941 244,655 208,513
Over five years - 740 - 740 25,392,154 25,506,556 18,094,529 17,510,083
(ii) By type of customer 31 Dec 2020 31 Dec 2019 31 Dec 2020 31 Dec 2019
RM'000 RM'000 RM'000 RM'000
Government and statutory bodies 33,855 29,979 15,577 16,993
Business enterprises 24,899,520 21,235,228 21,536,979 18,481,598
Individuals 25,145,896 24,079,749 19,413,603 17,857,275
Foreign entities/individuals 12,208,780 13,014,439 9,506,879 9,068,476
Others 1,122,385 1,047,795 790,470 662,536 63,410,436 59,407,190 51,263,508 46,086,878
23 Deposits and Placements from Banks and Other Financial Institutions
31 Dec 2020 31 Dec 2019 31 Dec 2020 31 Dec 2019
RM'000 RM'000 RM'000 RM'000
Licensed banks 50,607 822 50,607 822
Bank Negara Malaysia 139,992 22,262 135,932 1,850
Other financial institutions 2,667,742 3,660,600 1,948,688 1,768,255 2,858,341 3,683,684 2,135,227 1,770,927
Group Bank
Included in Deposits and Placements from Banks and Other Financial Institutions are amounts received under the
Government scheme as part of the COVID-19 relief measures, for the purpose of lending/ financing to SMEs at a
concessionary rate amounting to RM133,864,000 for the Group and the Bank.
Group Bank
Group Bank
Group Bank
#
155
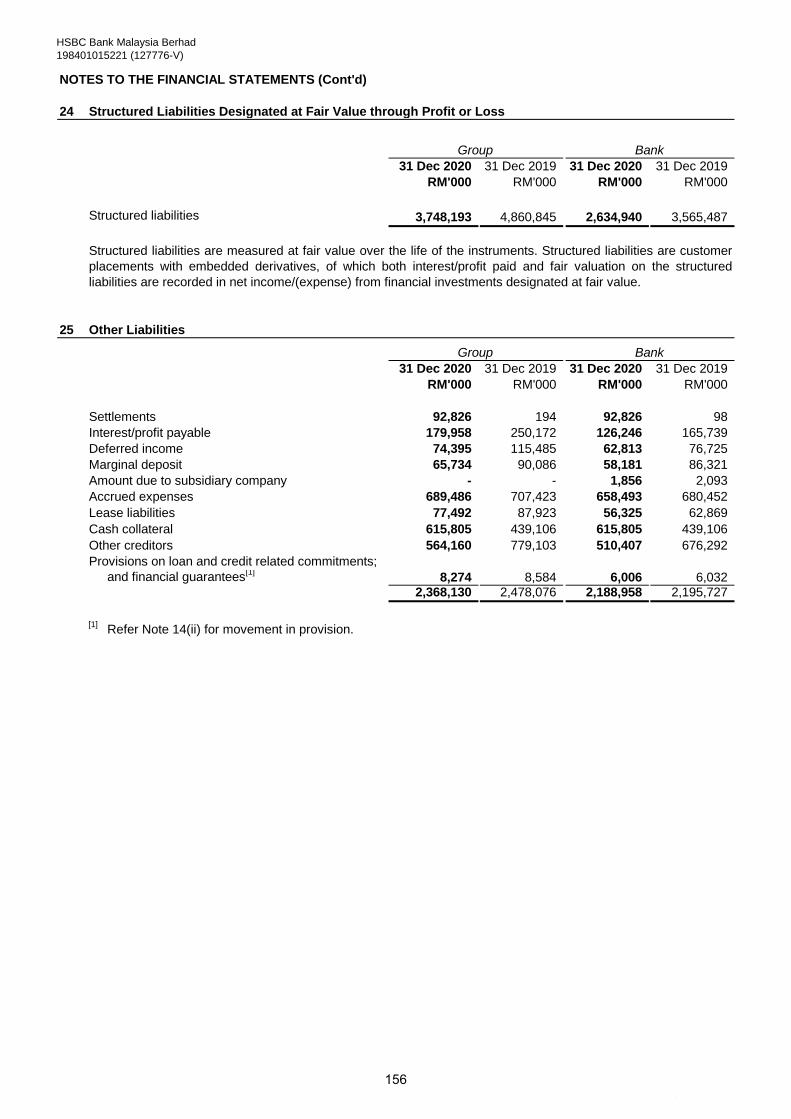
HSBC Bank Malaysia Berhad
198401015221 (127776-V)
NOTES TO THE FINANCIAL STATEMENTS (Cont'd)
24 Structured Liabilities Designated at Fair Value through Profit or Loss
31 Dec 2020 31 Dec 2019 31 Dec 2020 31 Dec 2019
RM'000 RM'000 RM'000 RM'000
Structured liabilities 3,748,193 4,860,845 2,634,940 3,565,487
25 Other Liabilities
31 Dec 2020 31 Dec 2019 31 Dec 2020 31 Dec 2019
RM'000 RM'000 RM'000 RM'000
Settlements 92,826 194 92,826 98
Interest/profit payable 179,958 250,172 126,246 165,739
Deferred income 74,395 115,485 62,813 76,725
Marginal deposit 65,734 90,086 58,181 86,321
Amount due to subsidiary company - - 1,856 2,093
Accrued expenses 689,486 707,423 658,493 680,452
Lease liabilities 77,492 87,923 56,325 62,869
Cash collateral 615,805 439,106 615,805 439,106
Other creditors 564,160 779,103 510,407 676,292
Provisions on loan and credit related commitments;
and financial guarantees[1]
8,274 8,584 6,006 6,032 2,368,130 2,478,076 2,188,958 2,195,727
[1]Refer Note 14(ii) for movement in provision.
Group Bank
Group Bank
Structured liabilities are measured at fair value over the life of the instruments. Structured liabilities are customer
placements with embedded derivatives, of which both interest/profit paid and fair valuation on the structured
liabilities are recorded in net income/(expense) from financial investments designated at fair value.
#
156

HSBC Bank Malaysia Berhad
198401015221 (127776-V)
NOTES TO THE FINANCIAL STATEMENTS (Cont'd)
26 Multi-Currency Sukuk Programme
31 Dec 2020 31 Dec 2019
RM'000 RM'000
Multi-Currency Sukuk Programme (MCSP) 523,841 1,265,929
Nominal Value Issue Maturity
Issuance under MCSP (RM'000) Date Date 31 Dec 2020 31 Dec 2019
At fair value
3rd series [1]
750,000 27 Mar 201527 Mar 2015 27 Mar 2020 - 751,732
4th series 500,000 2 Oct 2018 2 Oct 2023 523,841 514,197 Total 1,250,000 523,841 1,265,929
Movement in MCSP
3rd series 4th series
RM'000 RM'000
Balance at 1 January 751,732 514,197
Change in fair value other than from own credit risk 489 15,791
Change in fair value from own credit risk (2,221) (6,147)
Redemption of Multi-Currency Sukuk (750,000) - Balance at 31 December - 523,841
2nd series 3rd series 4th series
RM'000 RM'000 RM'000
Balance at 1 January 501,173 751,993 502,115
Change in fair value other than from own credit risk (917) (1,455) 8,446
Change in fair value from own credit risk (256) 1,194 3,636
Redemption of Multi-Currency Sukuk (500,000) - - Balance at 31 December - 751,732 514,197
31 Dec 2020 31 Dec 2019
RM'000 RM'000
The cumulative (gain)/ loss from change in fair value due to changes inown credit risk (8,368) 4,574
[1]Redeemed on 27 March 2020.
2020
2019
HSBC Amanah Malaysia Berhad, a subsidiary of the Bank, issued the following series of 5-year Sukuk under its
RM3 billion MCSP:
Group
Carrying Value (RM'000)
Group
#
157
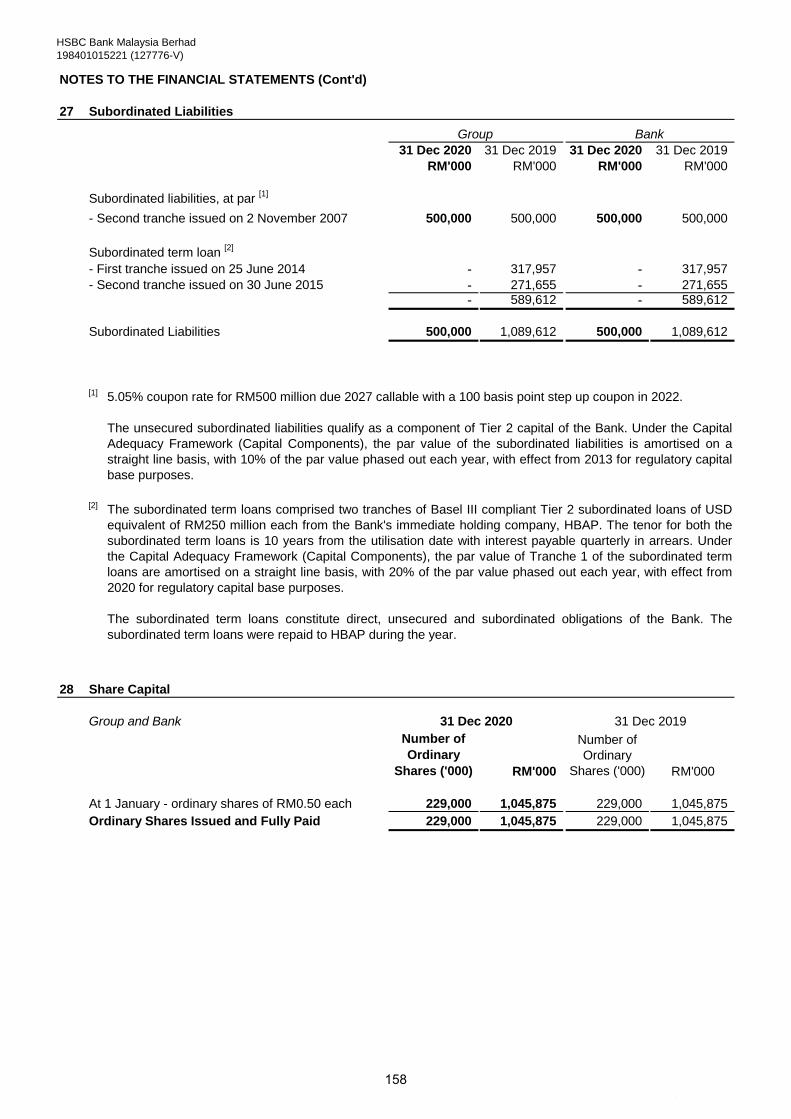
HSBC Bank Malaysia Berhad
198401015221 (127776-V)
NOTES TO THE FINANCIAL STATEMENTS (Cont'd)
27 Subordinated Liabilities
31 Dec 2020 31 Dec 2019 31 Dec 2020 31 Dec 2019
RM'000 RM'000 RM'000 RM'000
Subordinated liabilities, at par [1]
- Second tranche issued on 2 November 2007 500,000 500,000 500,000 500,000
Subordinated term loan [2]
- First tranche issued on 25 June 2014 - 317,957 - 317,957
- Second tranche issued on 30 June 2015 - 271,655 - 271,655 - 589,612 - 589,612
Subordinated Liabilities 500,000 1,089,612 500,000 1,089,612
[1]
[2]
28 Share Capital
Group and Bank
Number of
Ordinary
Shares ('000) RM'000
Number of
Ordinary
Shares ('000) RM'000
At 1 January - ordinary shares of RM0.50 each 229,000 1,045,875 229,000 1,045,875
Ordinary Shares Issued and Fully Paid 229,000 1,045,875 229,000 1,045,875
31 Dec 2020 31 Dec 2019
The subordinated term loans comprised two tranches of Basel III compliant Tier 2 subordinated loans of USD
equivalent of RM250 million each from the Bank's immediate holding company, HBAP. The tenor for both the
subordinated term loans is 10 years from the utilisation date with interest payable quarterly in arrears. Under
the Capital Adequacy Framework (Capital Components), the par value of Tranche 1 of the subordinated term
loans are amortised on a straight line basis, with 20% of the par value phased out each year, with effect from
2020 for regulatory capital base purposes.
The subordinated term loans constitute direct, unsecured and subordinated obligations of the Bank. The
subordinated term loans were repaid to HBAP during the year.
5.05% coupon rate for RM500 million due 2027 callable with a 100 basis point step up coupon in 2022.
The unsecured subordinated liabilities qualify as a component of Tier 2 capital of the Bank. Under the Capital
Adequacy Framework (Capital Components), the par value of the subordinated liabilities is amortised on a
straight line basis, with 10% of the par value phased out each year, with effect from 2013 for regulatory capital
base purposes.
Group Bank
#
158
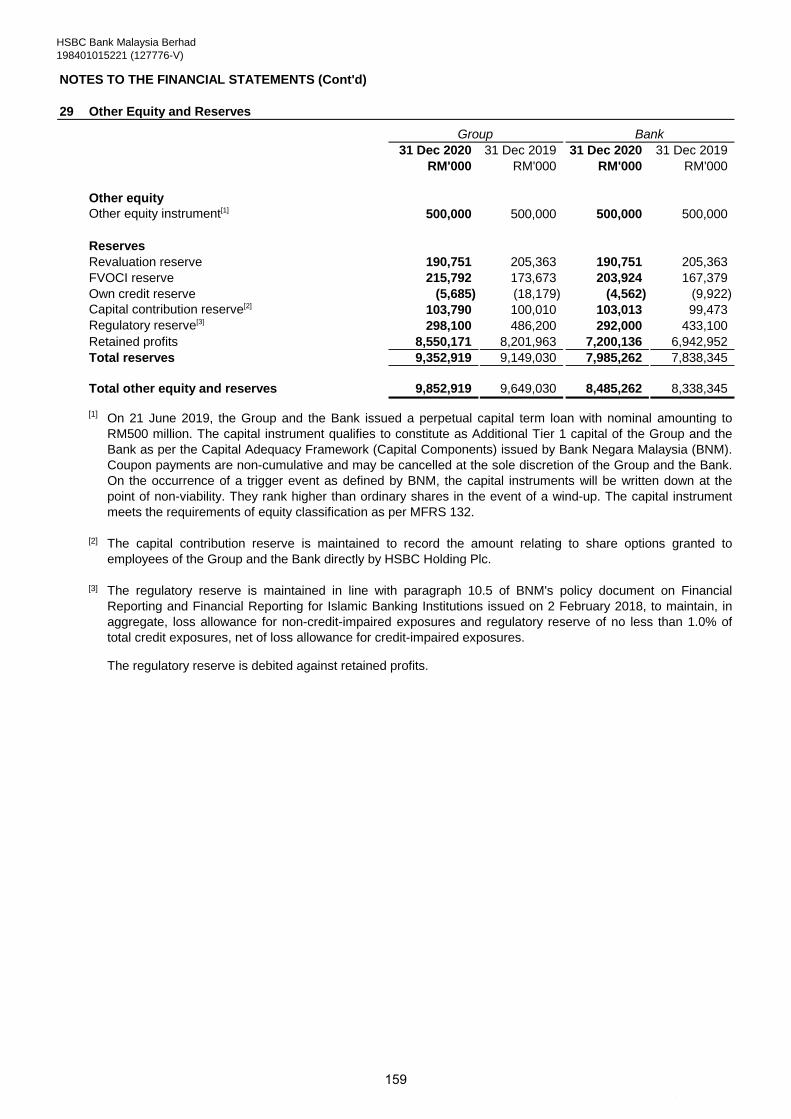
HSBC Bank Malaysia Berhad
198401015221 (127776-V)
NOTES TO THE FINANCIAL STATEMENTS (Cont'd)
29 Other Equity and Reserves
31 Dec 2020 31 Dec 2019 31 Dec 2020 31 Dec 2019
RM'000 RM'000 RM'000 RM'000
Other equity
Other equity instrument[1] 500,000 500,000 500,000 500,000
Reserves
Revaluation reserve 190,751 205,363 190,751 205,363
FVOCI reserve 215,792 173,673 203,924 167,379
Own credit reserve (5,685) (18,179) (4,562) (9,922)
Capital contribution reserve[2] 103,790 100,010 103,013 99,473
Regulatory reserve[3] 298,100 486,200 292,000 433,100
Retained profits 8,550,171 8,201,963 7,200,136 6,942,952
Total reserves 9,352,919 9,149,030 7,985,262 7,838,345
Total other equity and reserves 9,852,919 9,649,030 8,485,262 8,338,345
[1]
[2]
[3]
The regulatory reserve is debited against retained profits.
On 21 June 2019, the Group and the Bank issued a perpetual capital term loan with nominal amounting to
RM500 million. The capital instrument qualifies to constitute as Additional Tier 1 capital of the Group and the
Bank as per the Capital Adequacy Framework (Capital Components) issued by Bank Negara Malaysia (BNM).
Coupon payments are non-cumulative and may be cancelled at the sole discretion of the Group and the Bank.
On the occurrence of a trigger event as defined by BNM, the capital instruments will be written down at the
point of non-viability. They rank higher than ordinary shares in the event of a wind-up. The capital instrument
meets the requirements of equity classification as per MFRS 132.
The regulatory reserve is maintained in line with paragraph 10.5 of BNM's policy document on Financial
Reporting and Financial Reporting for Islamic Banking Institutions issued on 2 February 2018, to maintain, in
aggregate, loss allowance for non-credit-impaired exposures and regulatory reserve of no less than 1.0% of
total credit exposures, net of loss allowance for credit-impaired exposures.
The capital contribution reserve is maintained to record the amount relating to share options granted to
employees of the Group and the Bank directly by HSBC Holding Plc.
Group Bank
#
159

HSBC Bank Malaysia Berhad
198401015221 (127776-V)
NOTES TO THE FINANCIAL STATEMENTS (Cont'd)
30 Net Interest Income
31 Dec 2020 31 Dec 2019 31 Dec 2020 31 Dec 2019
RM'000 RM'000 RM'000 RM'000
Interest income
Loans and advances
- Interest income other than from impaired loans 1,436,003 1,762,355 1,436,003 1,762,355
- Interest income recognised from impaired loans 28,813 35,593 28,813 35,593
Money at call and deposit placements with financial
institutions 238,184 204,503 263,790 241,968
Financial investments at FVOCI 207,569 364,160 207,569 364,160
Financial investments at amortised cost 1,632 - 1,632 -
1,912,201 2,366,611 1,937,807 2,404,076
Interest expense
Deposits and placements of banks and other
financial institutions (16,747) (43,411) (16,747) (43,411)
Deposits from customers (510,045) (687,179) (510,045) (687,179)
Subordinated liabilities (43,598) (52,575) (43,598) (52,575)
Lease liabilities (3,530) (3,225) (3,530) (3,225)
Others (744) (654) (744) (654)
(574,664) (787,044) (574,664) (787,044)
Net interest income 1,337,537 1,579,567 1,363,143 1,617,032
31 Net Fee and Commission Income
31 Dec 2020 31 Dec 2019 31 Dec 2020 31 Dec 2019
RM'000 RM'000 RM'000 RM'000
Fee and commission income
Credit cards 93,152 130,661 93,152 130,661
Service charges 106,402 119,389 106,402 119,389
Credit facilities 56,212 59,966 56,212 59,966
Agency 113,112 110,090 113,112 110,090
Others 28,717 33,032 27,602 30,583
397,595 453,138 396,480 450,689
Fee and commission expense
Debit/credit cards (51,168) (33,436) (51,168) (33,436)
Interbank and clearing (798) (1,209) (798) (1,209)
Brokerage (2,557) (1,911) (2,557) (1,911)
Cash management (1,160) (1,159) (1,160) (1,159)
Others (15,386) (20,380) (15,386) (20,380)
(71,069) (58,095) (71,069) (58,095)
Net fee and commission income 326,526 395,043 325,411 392,594
Group Bank
Group Bank
#160
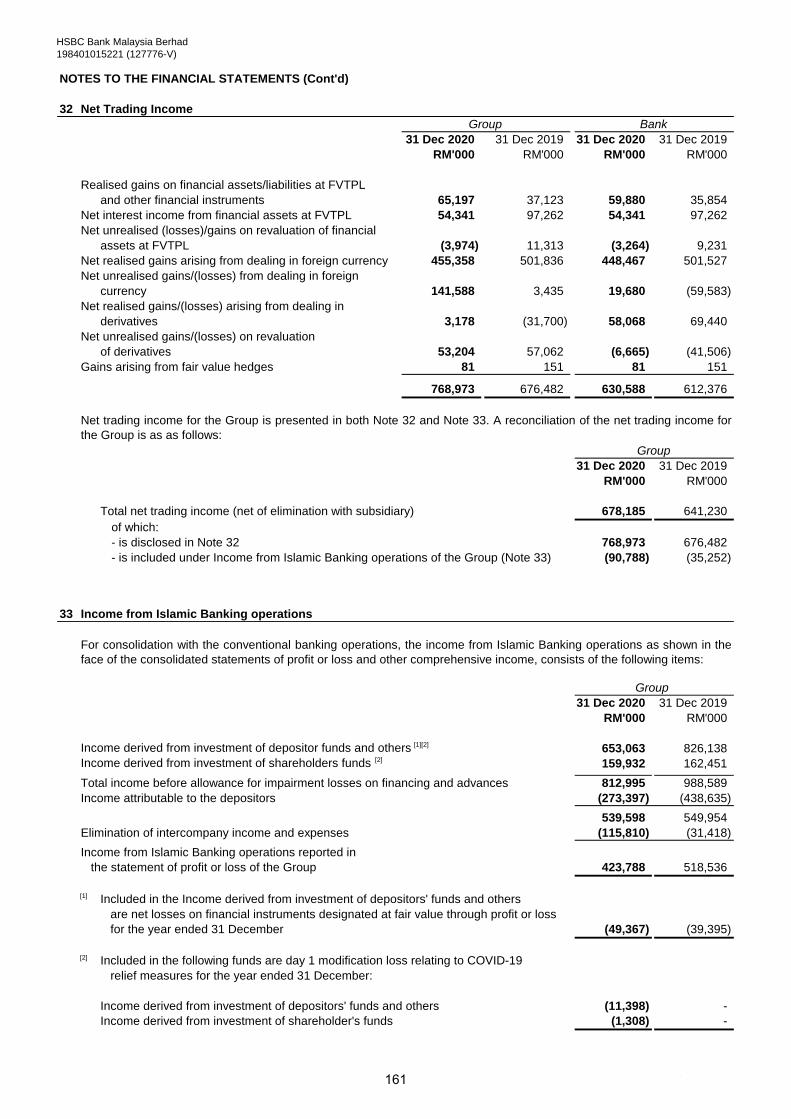
HSBC Bank Malaysia Berhad
198401015221 (127776-V)
NOTES TO THE FINANCIAL STATEMENTS (Cont'd)
32 Net Trading Income
31 Dec 2020 31 Dec 2019 31 Dec 2020 31 Dec 2019
RM'000 RM'000 RM'000 RM'000
Realised gains on financial assets/liabilities at FVTPL
and other financial instruments 65,197 37,123 59,880 35,854
Net interest income from financial assets at FVTPL 54,341 97,262 54,341 97,262
Net unrealised (losses)/gains on revaluation of financial
assets at FVTPL (3,974) 11,313 (3,264) 9,231
Net realised gains arising from dealing in foreign currency 455,358 501,836 448,467 501,527
Net unrealised gains/(losses) from dealing in foreign
currency 141,588 3,435 19,680 (59,583)
Net realised gains/(losses) arising from dealing in
derivatives 3,178 (31,700) 58,068 69,440
Net unrealised gains/(losses) on revaluation
of derivatives 53,204 57,062 (6,665) (41,506)
Gains arising from fair value hedges 81 151 81 151
768,973 676,482 630,588 612,376
31 Dec 2020 31 Dec 2019
RM'000 RM'000
Total net trading income (net of elimination with subsidiary) 678,185 641,230
of which:
- is disclosed in Note 32 768,973 676,482
- is included under Income from Islamic Banking operations of the Group (Note 33) (90,788) (35,252)
33 Income from Islamic Banking operations
31 Dec 2020 31 Dec 2019
RM'000 RM'000
Income derived from investment of depositor funds and others [1][2] 653,063 826,138
Income derived from investment of shareholders funds [2] 159,932 162,451
Total income before allowance for impairment losses on financing and advances 812,995 988,589
Income attributable to the depositors (273,397) (438,635)
539,598 549,954
Elimination of intercompany income and expenses (115,810) (31,418)
Income from Islamic Banking operations reported in
the statement of profit or loss of the Group 423,788 518,536
[1] Included in the Income derived from investment of depositors' funds and others
are net losses on financial instruments designated at fair value through profit or loss
for the year ended 31 December (49,367) (39,395)
[2] Included in the following funds are day 1 modification loss relating to COVID-19
relief measures for the year ended 31 December:
Income derived from investment of depositors' funds and others (11,398) -
Income derived from investment of shareholder's funds (1,308) -
Net trading income for the Group is presented in both Note 32 and Note 33. A reconciliation of the net trading income for
the Group is as as follows:
Group
Group Bank
For consolidation with the conventional banking operations, the income from Islamic Banking operations as shown in the
face of the consolidated statements of profit or loss and other comprehensive income, consists of the following items:
Group
#161
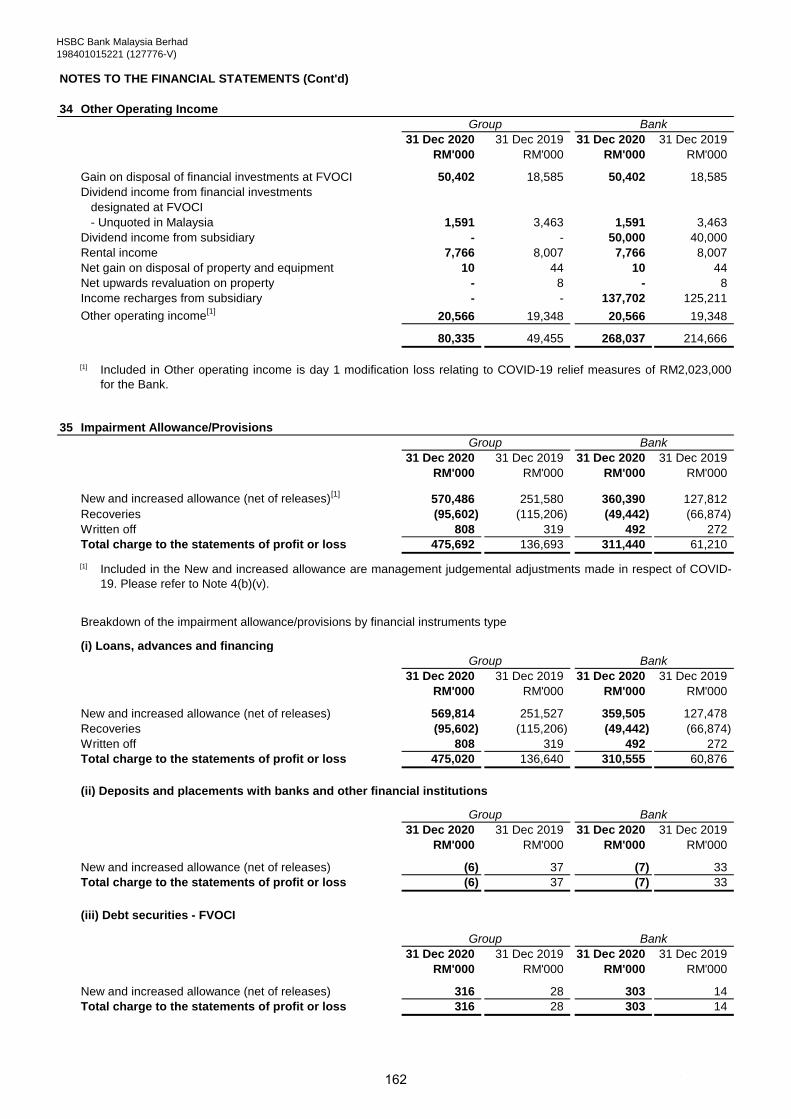
HSBC Bank Malaysia Berhad
198401015221 (127776-V)
NOTES TO THE FINANCIAL STATEMENTS (Cont'd)
34 Other Operating Income
31 Dec 2020 31 Dec 2019 31 Dec 2020 31 Dec 2019
RM'000 RM'000 RM'000 RM'000
Gain on disposal of financial investments at FVOCI 50,402 18,585 50,402 18,585
Dividend income from financial investments
designated at FVOCI
- Unquoted in Malaysia 1,591 3,463 1,591 3,463
Dividend income from subsidiary - - 50,000 40,000
Rental income 7,766 8,007 7,766 8,007
Net gain on disposal of property and equipment 10 44 10 44
Net upwards revaluation on property - 8 - 8
Income recharges from subsidiary - - 137,702 125,211
Other operating income[1]
20,566 19,348 20,566 19,348
80,335 49,455 268,037 214,666
[1]
35 Impairment Allowance/Provisions
31 Dec 2020 31 Dec 2019 31 Dec 2020 31 Dec 2019
RM'000 RM'000 RM'000 RM'000
New and increased allowance (net of releases)[1]
570,486 251,580 360,390 127,812
Recoveries (95,602) (115,206) (49,442) (66,874)
Written off 808 319 492 272
Total charge to the statements of profit or loss 475,692 136,693 311,440 61,210
[1]
Breakdown of the impairment allowance/provisions by financial instruments type
(i) Loans, advances and financing
31 Dec 2020 31 Dec 2019 31 Dec 2020 31 Dec 2019
RM'000 RM'000 RM'000 RM'000
New and increased allowance (net of releases) 569,814 251,527 359,505 127,478
Recoveries (95,602) (115,206) (49,442) (66,874)
Written off 808 319 492 272
Total charge to the statements of profit or loss 475,020 136,640 310,555 60,876
(ii) Deposits and placements with banks and other financial institutions
31 Dec 2020 31 Dec 2019 31 Dec 2020 31 Dec 2019
RM'000 RM'000 RM'000 RM'000
New and increased allowance (net of releases) (6) 37 (7) 33
Total charge to the statements of profit or loss (6) 37 (7) 33
(iii) Debt securities - FVOCI
31 Dec 2020 31 Dec 2019 31 Dec 2020 31 Dec 2019
RM'000 RM'000 RM'000 RM'000
New and increased allowance (net of releases) 316 28 303 14
Total charge to the statements of profit or loss 316 28 303 14
Included in the New and increased allowance are management judgemental adjustments made in respect of COVID-
19. Please refer to Note 4(b)(v).
Included in Other operating income is day 1 modification loss relating to COVID-19 relief measures of RM2,023,000
for the Bank.
Bank
Group Bank
Group Bank
Group Bank
Group Bank
Group
#162
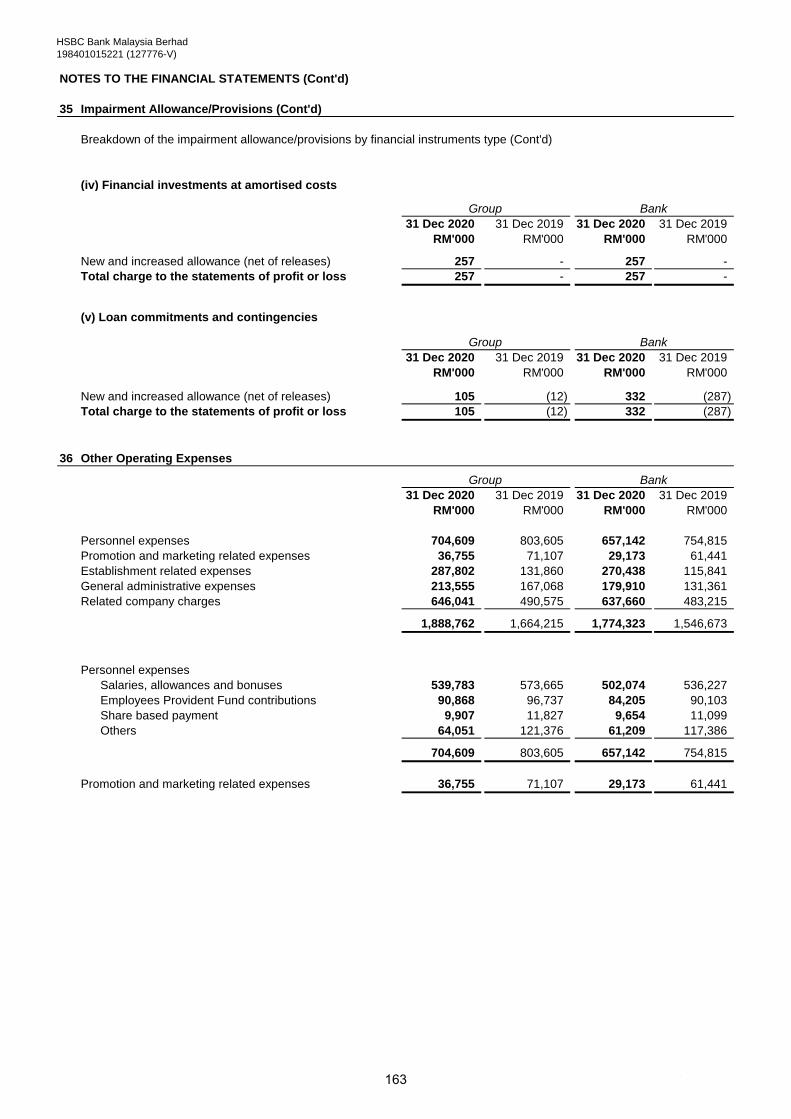
HSBC Bank Malaysia Berhad
198401015221 (127776-V)
NOTES TO THE FINANCIAL STATEMENTS (Cont'd)
35 Impairment Allowance/Provisions (Cont'd)
Breakdown of the impairment allowance/provisions by financial instruments type (Cont'd)
(iv) Financial investments at amortised costs
31 Dec 2020 31 Dec 2019 31 Dec 2020 31 Dec 2019
RM'000 RM'000 RM'000 RM'000
New and increased allowance (net of releases) 257 - 257 -
Total charge to the statements of profit or loss 257 - 257 -
(v) Loan commitments and contingencies
31 Dec 2020 31 Dec 2019 31 Dec 2020 31 Dec 2019
RM'000 RM'000 RM'000 RM'000
New and increased allowance (net of releases) 105 (12) 332 (287)
Total charge to the statements of profit or loss 105 (12) 332 (287)
36 Other Operating Expenses
31 Dec 2020 31 Dec 2019 31 Dec 2020 31 Dec 2019
RM'000 RM'000 RM'000 RM'000
Personnel expenses 704,609 803,605 657,142 754,815
Promotion and marketing related expenses 36,755 71,107 29,173 61,441
Establishment related expenses 287,802 131,860 270,438 115,841
General administrative expenses 213,555 167,068 179,910 131,361
Related company charges 646,041 490,575 637,660 483,215
1,888,762 1,664,215 1,774,323 1,546,673
Personnel expenses
Salaries, allowances and bonuses 539,783 573,665 502,074 536,227
Employees Provident Fund contributions 90,868 96,737 84,205 90,103
Share based payment 9,907 11,827 9,654 11,099
Others 64,051 121,376 61,209 117,386
704,609 803,605 657,142 754,815
Promotion and marketing related expenses 36,755 71,107 29,173 61,441
Group Bank
Group Bank
Group Bank
#163
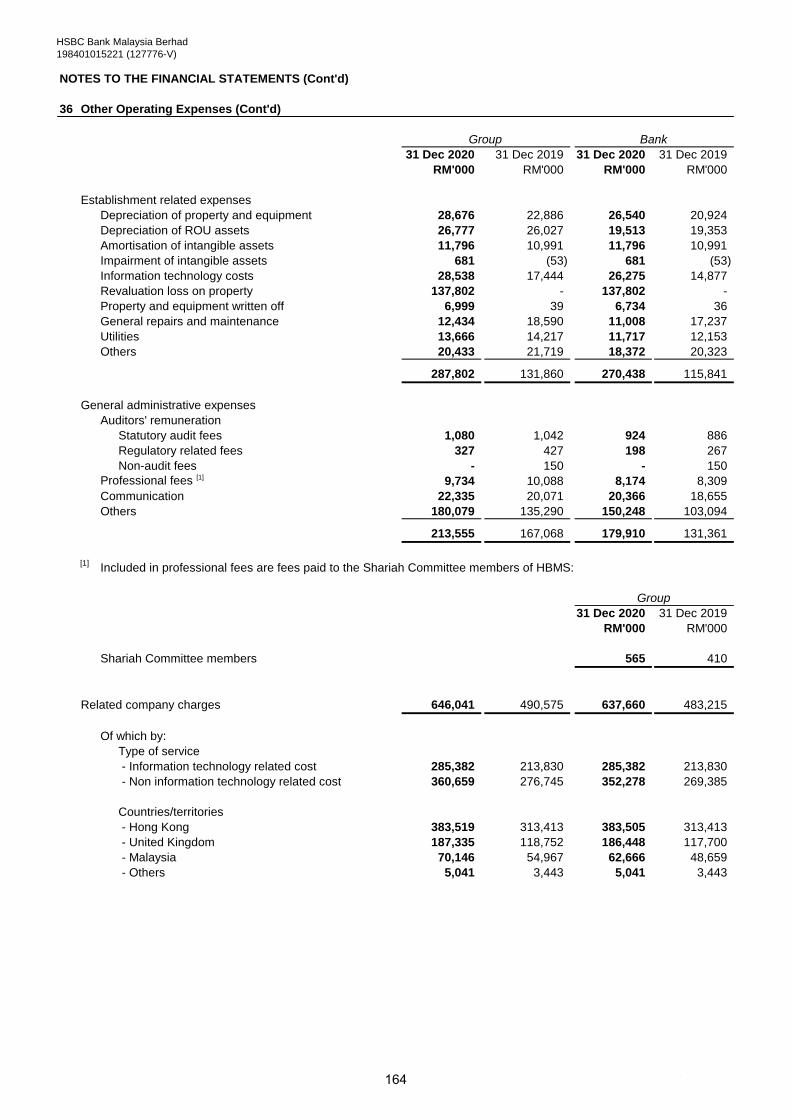
HSBC Bank Malaysia Berhad
198401015221 (127776-V)
NOTES TO THE FINANCIAL STATEMENTS (Cont'd)
36 Other Operating Expenses (Cont'd)
31 Dec 2020 31 Dec 2019 31 Dec 2020 31 Dec 2019
RM'000 RM'000 RM'000 RM'000
Establishment related expenses
Depreciation of property and equipment 28,676 22,886 26,540 20,924
Depreciation of ROU assets 26,777 26,027 19,513 19,353
Amortisation of intangible assets 11,796 10,991 11,796 10,991
Impairment of intangible assets 681 (53) 681 (53)
Information technology costs 28,538 17,444 26,275 14,877
Revaluation loss on property 137,802 - 137,802 -
Property and equipment written off 6,999 39 6,734 36
General repairs and maintenance 12,434 18,590 11,008 17,237
Utilities 13,666 14,217 11,717 12,153
Others 20,433 21,719 18,372 20,323
287,802 131,860 270,438 115,841
General administrative expenses
Auditors' remuneration
Statutory audit fees 1,080 1,042 924 886
Regulatory related fees 327 427 198 267
Non-audit fees - 150 - 150
Professional fees [1] 9,734 10,088 8,174 8,309
Communication 22,335 20,071 20,366 18,655
Others 180,079 135,290 150,248 103,094
213,555 167,068 179,910 131,361
[1]Included in professional fees are fees paid to the Shariah Committee members of HBMS:
31 Dec 2020 31 Dec 2019
RM'000 RM'000
Shariah Committee members 565 410
Related company charges 646,041 490,575 637,660 483,215
Of which by:
Type of service
- Information technology related cost 285,382 213,830 285,382 213,830
- Non information technology related cost 360,659 276,745 352,278 269,385
Countries/territories
- Hong Kong 383,519 313,413 383,505 313,413
- United Kingdom 187,335 118,752 186,448 117,700
- Malaysia 70,146 54,967 62,666 48,659
- Others 5,041 3,443 5,041 3,443
Group
Group Bank
#164
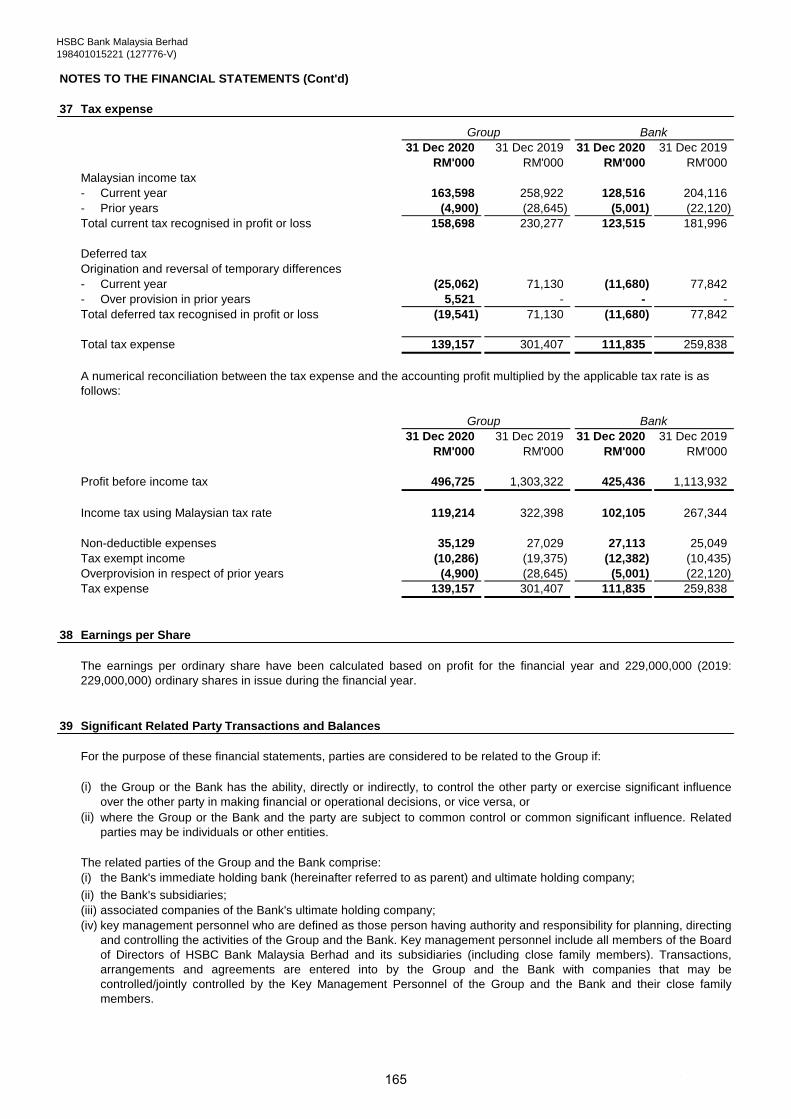
HSBC Bank Malaysia Berhad
198401015221 (127776-V)
NOTES TO THE FINANCIAL STATEMENTS (Cont'd)
37 Tax expense
31 Dec 2020 31 Dec 2019 31 Dec 2020 31 Dec 2019
RM'000 RM'000 RM'000 RM'000
Malaysian income tax
- Current year 163,598 258,922 128,516 204,116
- Prior years (4,900) (28,645) (5,001) (22,120)
Total current tax recognised in profit or loss 158,698 230,277 123,515 181,996
Deferred tax
Origination and reversal of temporary differences
- Current year (25,062) 71,130 (11,680) 77,842
- Over provision in prior years 5,521 - - -
Total deferred tax recognised in profit or loss (19,541) 71,130 (11,680) 77,842
Total tax expense 139,157 301,407 111,835 259,838
31 Dec 2020 31 Dec 2019 31 Dec 2020 31 Dec 2019
RM'000 RM'000 RM'000 RM'000
Profit before income tax 496,725 1,303,322 425,436 1,113,932
Income tax using Malaysian tax rate 119,214 322,398 102,105 267,344
Non-deductible expenses 35,129 27,029 27,113 25,049
Tax exempt income (10,286) (19,375) (12,382) (10,435)
Overprovision in respect of prior years (4,900) (28,645) (5,001) (22,120)
Tax expense 139,157 301,407 111,835 259,838
38 Earnings per Share
39 Significant Related Party Transactions and Balances
For the purpose of these financial statements, parties are considered to be related to the Group if:
(i)
(ii)
The related parties of the Group and the Bank comprise:
(i) the Bank's immediate holding bank (hereinafter referred to as parent) and ultimate holding company;
(ii) the Bank's subsidiaries;
(iii) associated companies of the Bank's ultimate holding company;
(iv)
the Group or the Bank has the ability, directly or indirectly, to control the other party or exercise significant influence
over the other party in making financial or operational decisions, or vice versa, or
where the Group or the Bank and the party are subject to common control or common significant influence. Related
parties may be individuals or other entities.
key management personnel who are defined as those person having authority and responsibility for planning, directing
and controlling the activities of the Group and the Bank. Key management personnel include all members of the Board
of Directors of HSBC Bank Malaysia Berhad and its subsidiaries (including close family members). Transactions,
arrangements and agreements are entered into by the Group and the Bank with companies that may be
controlled/jointly controlled by the Key Management Personnel of the Group and the Bank and their close family
members.
The earnings per ordinary share have been calculated based on profit for the financial year and 229,000,000 (2019:
229,000,000) ordinary shares in issue during the financial year.
Group Bank
A numerical reconciliation between the tax expense and the accounting profit multiplied by the applicable tax rate is as
follows:
Group Bank
#165

HSBC Bank Malaysia Berhad
198401015221 (127776-V)
NOTES TO THE FINANCIAL STATEMENTS (Cont'd)
39 Significant Related Party Transactions and Balances (Cont'd)
(a) The significant transactions and outstanding balances of the Group and the Bank with its related parties are as follows:
2020 2019
Other Key Other Key
related management related management
Parent companies personnel Parent companies personnel
RM'000 RM'000 RM'000 RM'000 RM'000 RM'000
Income
Interest/finance income on deposits and
placements with banks and other
financial institutions 488 121 - 848 169 -
Interest/finance income on loans,
advances and financing
from customers - - 219 - - 289
Fees and commission 7,152 15,101 - 7,702 26,002 -
Other income 6,989 13,927 - 5,225 9,529 -
Net trading income/(expenses) (49,533) 54,591 - 79,186 82,573 -
(34,904) 83,740 219 92,961 118,273 289
Expenditure
Interest/finance expense on deposits
and placements from banks and
other financial institutions 32,459 6,458 - 76,256 13,738 -
Interest/finance expense on deposits
from customers - - 197 - - 222
Fees and commission 3,577 13,428 - 4,767 9,517 -
Operating expenses 383,519 262,522 - 313,412 177,163 -
419,555 282,408 197 394,435 200,418 222
Amount due from
Deposits and placements with banks
and other financial institutions
(including cash and short-term funds) 55,493 422,252 - 151,375 210,070 -
Loans, advances and financing - - 7,111 - - 7,105
Derivative financial assets 361,048 352,926 - 240,264 313,907 -
Other assets 2,098 74,381 - 3,369 7,175 -
418,639 849,559 7,111 395,008 531,152 7,105
Amount due to
Deposit and placements from banks
and other financial institutions 952,777 899,718 - 591,998 913,148 -
Deposit from customers - - 26,216 - - 26,675
Derivative financial liabilities 182,855 180,526 - 127,110 143,072 -
Other liabilities 393,646 280,659 - 273,132 338,667 -
Subordinated liabilities - - - 589,612 - -
1,529,278 1,360,903 26,216 1,581,852 1,394,887 26,675
All transactions of the Group and Bank and its related parties are made in the ordinary course of business.
Group
#
166
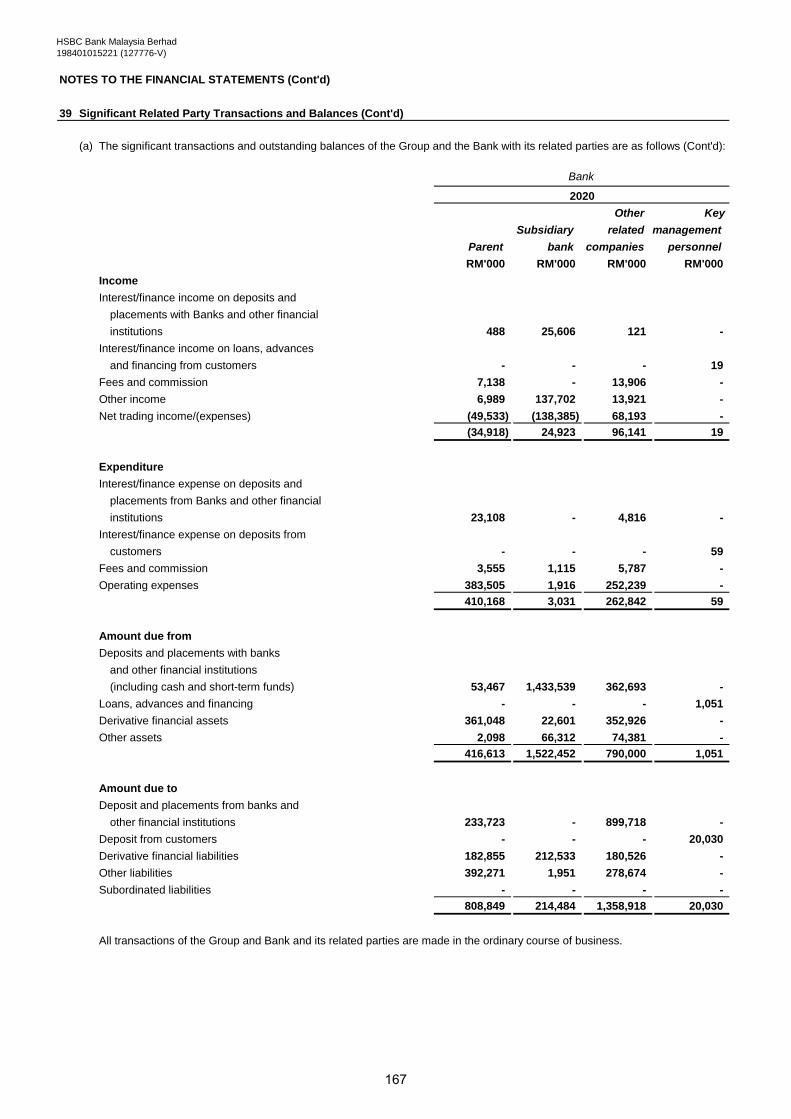
HSBC Bank Malaysia Berhad
198401015221 (127776-V)
NOTES TO THE FINANCIAL STATEMENTS (Cont'd)
39 Significant Related Party Transactions and Balances (Cont'd)
(a) The significant transactions and outstanding balances of the Group and the Bank with its related parties are as follows (Cont'd):
Other Key
Subsidiary related management
Parent bank companies personnel
RM'000 RM'000 RM'000 RM'000
Income
Interest/finance income on deposits and
placements with Banks and other financial
institutions 488 25,606 121 -
Interest/finance income on loans, advances
and financing from customers - - - 19
Fees and commission 7,138 - 13,906 -
Other income 6,989 137,702 13,921 -
Net trading income/(expenses) (49,533) (138,385) 68,193 -
(34,918) 24,923 96,141 19
Expenditure
Interest/finance expense on deposits and
placements from Banks and other financial
institutions 23,108 - 4,816 -
Interest/finance expense on deposits from
customers - - - 59
Fees and commission 3,555 1,115 5,787 -
Operating expenses 383,505 1,916 252,239 -
410,168 3,031 262,842 59
Amount due from
Deposits and placements with banks
and other financial institutions
(including cash and short-term funds) 53,467 1,433,539 362,693 -
Loans, advances and financing - - - 1,051
Derivative financial assets 361,048 22,601 352,926 -
Other assets 2,098 66,312 74,381 -
416,613 1,522,452 790,000 1,051
Amount due to
Deposit and placements from banks and
other financial institutions 233,723 - 899,718 -
Deposit from customers - - - 20,030
Derivative financial liabilities 182,855 212,533 180,526 -
Other liabilities 392,271 1,951 278,674 -
Subordinated liabilities - - - -
808,849 214,484 1,358,918 20,030
All transactions of the Group and Bank and its related parties are made in the ordinary course of business.
Bank
2020
#
167
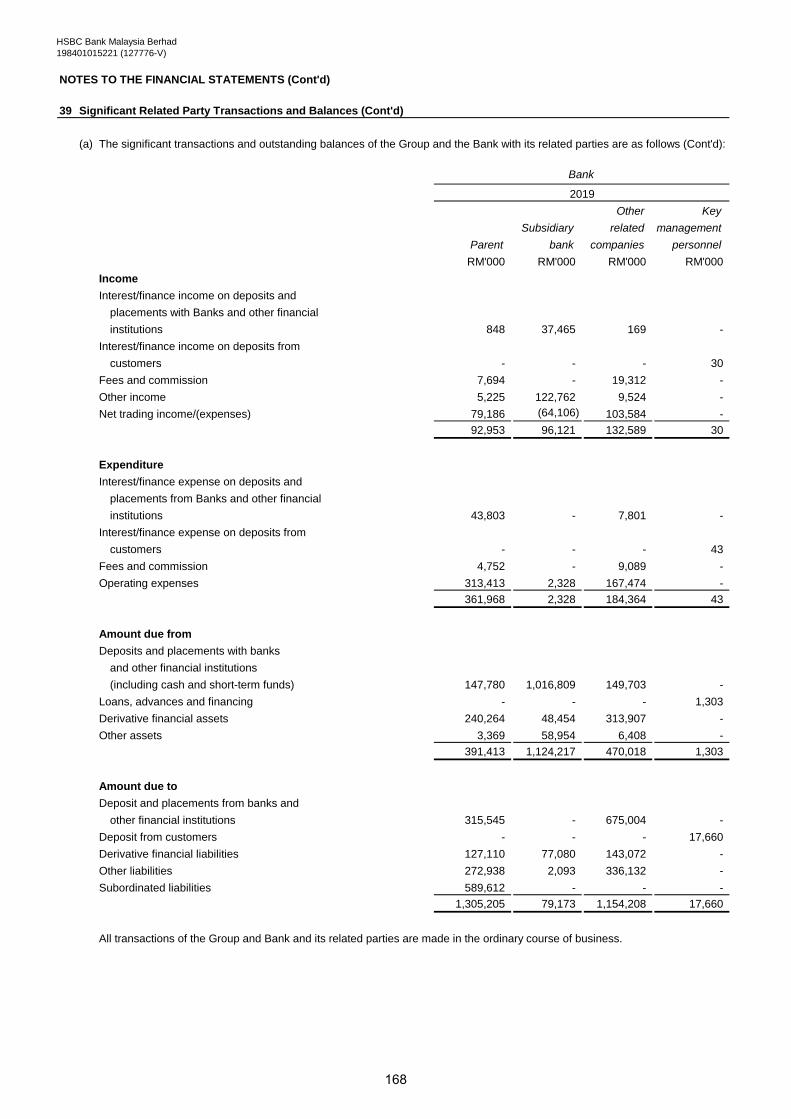
HSBC Bank Malaysia Berhad
198401015221 (127776-V)
NOTES TO THE FINANCIAL STATEMENTS (Cont'd)
39 Significant Related Party Transactions and Balances (Cont'd)
(a) The significant transactions and outstanding balances of the Group and the Bank with its related parties are as follows (Cont'd):
Other Key
Subsidiary related management
Parent bank companies personnel
RM'000 RM'000 RM'000 RM'000
Income
Interest/finance income on deposits and
placements with Banks and other financial
institutions 848 37,465 169 -
Interest/finance income on deposits from
customers - - - 30
Fees and commission 7,694 - 19,312 -
Other income 5,225 122,762 9,524 -
Net trading income/(expenses) 79,186 (64,106) 103,584 -
92,953 96,121 132,589 30
Expenditure
Interest/finance expense on deposits and
placements from Banks and other financial
institutions 43,803 - 7,801 -
Interest/finance expense on deposits from
customers - - - 43
Fees and commission 4,752 - 9,089 -
Operating expenses 313,413 2,328 167,474 -
361,968 2,328 184,364 43
Amount due from
Deposits and placements with banks
and other financial institutions
(including cash and short-term funds) 147,780 1,016,809 149,703 -
Loans, advances and financing - - - 1,303
Derivative financial assets 240,264 48,454 313,907 -
Other assets 3,369 58,954 6,408 -
391,413 1,124,217 470,018 1,303
Amount due to
Deposit and placements from banks and
other financial institutions 315,545 - 675,004 -
Deposit from customers - - - 17,660
Derivative financial liabilities 127,110 77,080 143,072 -
Other liabilities 272,938 2,093 336,132 -
Subordinated liabilities 589,612 - - -
1,305,205 79,173 1,154,208 17,660
All transactions of the Group and Bank and its related parties are made in the ordinary course of business.
Bank
2019
#
168
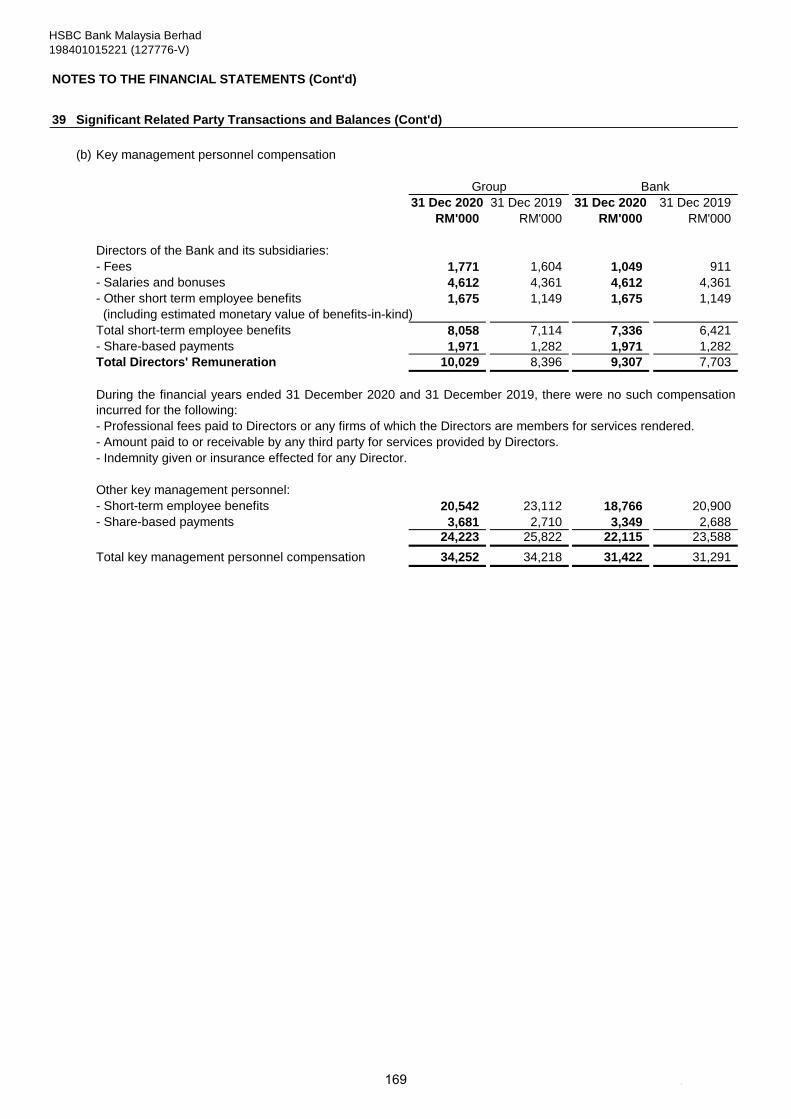
HSBC Bank Malaysia Berhad
198401015221 (127776-V)
NOTES TO THE FINANCIAL STATEMENTS (Cont'd)
39 Significant Related Party Transactions and Balances (Cont'd)
(b) Key management personnel compensation
31 Dec 2020 31 Dec 2019 31 Dec 2020 31 Dec 2019
RM'000 RM'000 RM'000 RM'000
Directors of the Bank and its subsidiaries:
- Fees 1,771 1,604 1,049 911
- Salaries and bonuses 4,612 4,361 4,612 4,361
- Other short term employee benefits 1,675 1,149 1,675 1,149
(including estimated monetary value of benefits-in-kind)
Total short-term employee benefits 8,058 7,114 7,336 6,421
- Share-based payments 1,971 1,282 1,971 1,282
Total Directors' Remuneration 10,029 8,396 9,307 7,703
- Professional fees paid to Directors or any firms of which the Directors are members for services rendered.
- Amount paid to or receivable by any third party for services provided by Directors.
- Indemnity given or insurance effected for any Director.
Other key management personnel:
- Short-term employee benefits 20,542 23,112 18,766 20,900
- Share-based payments 3,681 2,710 3,349 2,688
24,223 25,822 22,115 23,588
Total key management personnel compensation 34,252 34,218 31,422 31,291
Group Bank
During the financial years ended 31 December 2020 and 31 December 2019, there were no such compensation
incurred for the following:
#169
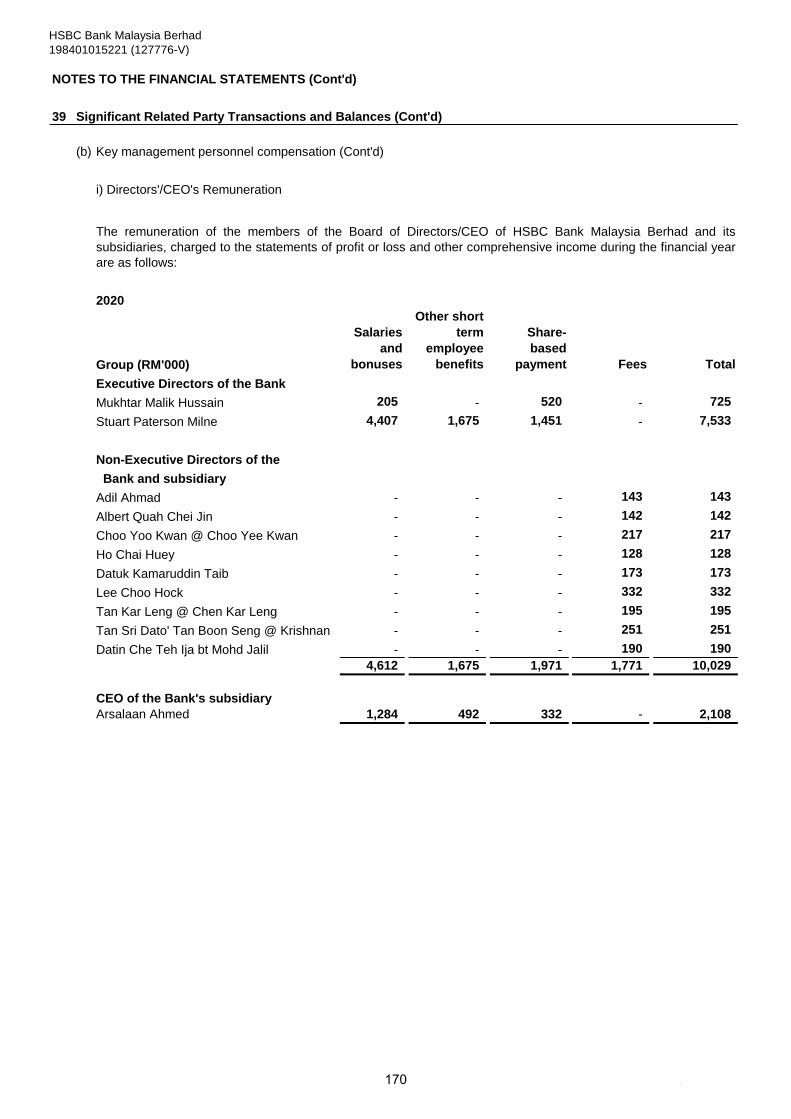
HSBC Bank Malaysia Berhad
198401015221 (127776-V)
NOTES TO THE FINANCIAL STATEMENTS (Cont'd)
39 Significant Related Party Transactions and Balances (Cont'd)
(b) Key management personnel compensation (Cont'd)
i) Directors'/CEO's Remuneration
2020
Group (RM'000)
Salaries
and
bonuses
Other short
term
employee
benefits
Share-
based
payment Fees Total
Executive Directors of the Bank
Mukhtar Malik Hussain 205 - 520 - 725
Stuart Paterson Milne 4,407 1,675 1,451 - 7,533
Non-Executive Directors of the
Bank and subsidiary
Adil Ahmad - - - 143 143
Albert Quah Chei Jin - - - 142 142
Choo Yoo Kwan @ Choo Yee Kwan - - - 217 217
Ho Chai Huey - - - 128 128
Datuk Kamaruddin Taib - - - 173 173
Lee Choo Hock - - - 332 332
Tan Kar Leng @ Chen Kar Leng - - - 195 195
Tan Sri Dato' Tan Boon Seng @ Krishnan - - - 251 251
Datin Che Teh Ija bt Mohd Jalil - - - 190 190
4,612 1,675 1,971 1,771 10,029
CEO of the Bank's subsidiary
Arsalaan Ahmed 1,284 492 332 - 2,108
The remuneration of the members of the Board of Directors/CEO of HSBC Bank Malaysia Berhad and its
subsidiaries, charged to the statements of profit or loss and other comprehensive income during the financial year
are as follows:
#170
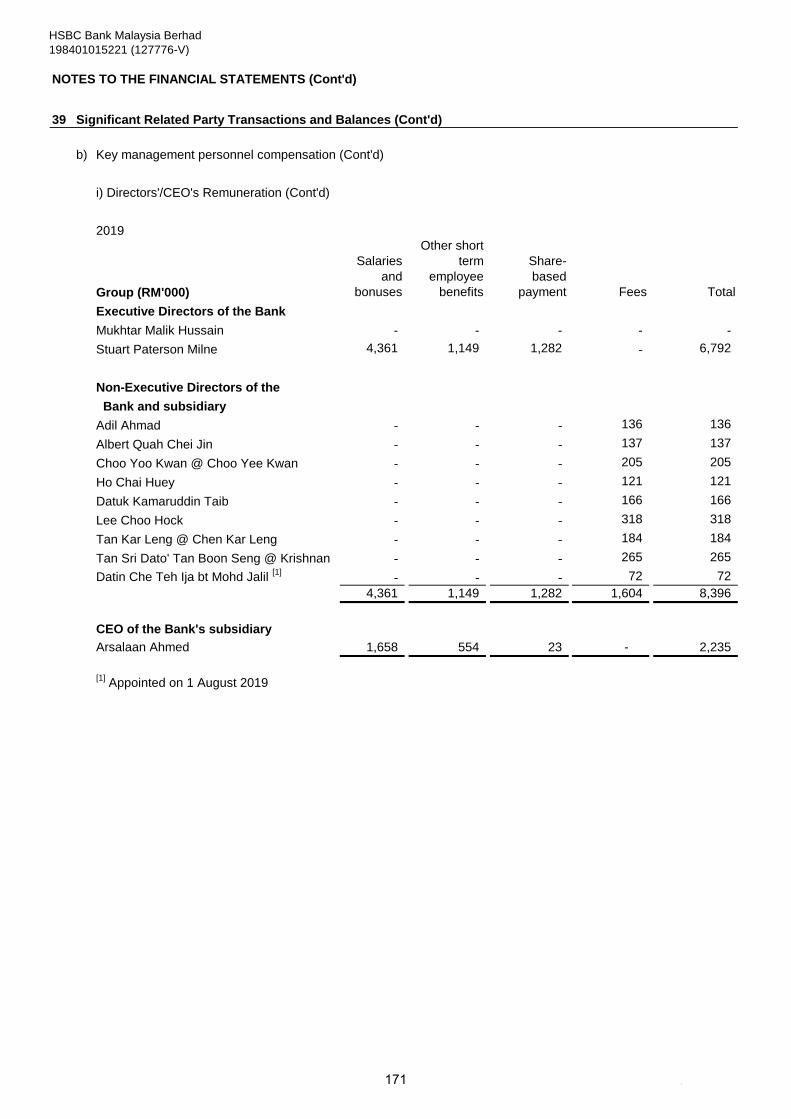
HSBC Bank Malaysia Berhad
198401015221 (127776-V)
NOTES TO THE FINANCIAL STATEMENTS (Cont'd)
39 Significant Related Party Transactions and Balances (Cont'd)
b) Key management personnel compensation (Cont'd)
i) Directors'/CEO's Remuneration (Cont'd)
2019
Group (RM'000)
Salaries
and
bonuses
Other short
term
employee
benefits
Share-
based
payment Fees Total
Executive Directors of the Bank
Mukhtar Malik Hussain - - - - -
Stuart Paterson Milne 4,361 1,149 1,282 - 6,792
Non-Executive Directors of the
Bank and subsidiary
Adil Ahmad - - - 136 136
Albert Quah Chei Jin - - - 137 137
Choo Yoo Kwan @ Choo Yee Kwan - - - 205 205
Ho Chai Huey - - - 121 121
Datuk Kamaruddin Taib - - - 166 166
Lee Choo Hock - - - 318 318
Tan Kar Leng @ Chen Kar Leng - - - 184 184
Tan Sri Dato' Tan Boon Seng @ Krishnan - - - 265 265
Datin Che Teh Ija bt Mohd Jalil [1]
- - - 72 72
4,361 1,149 1,282 1,604 8,396
CEO of the Bank's subsidiary
Arsalaan Ahmed 1,658 554 23 - 2,235
[1] Appointed on 1 August 2019
#171
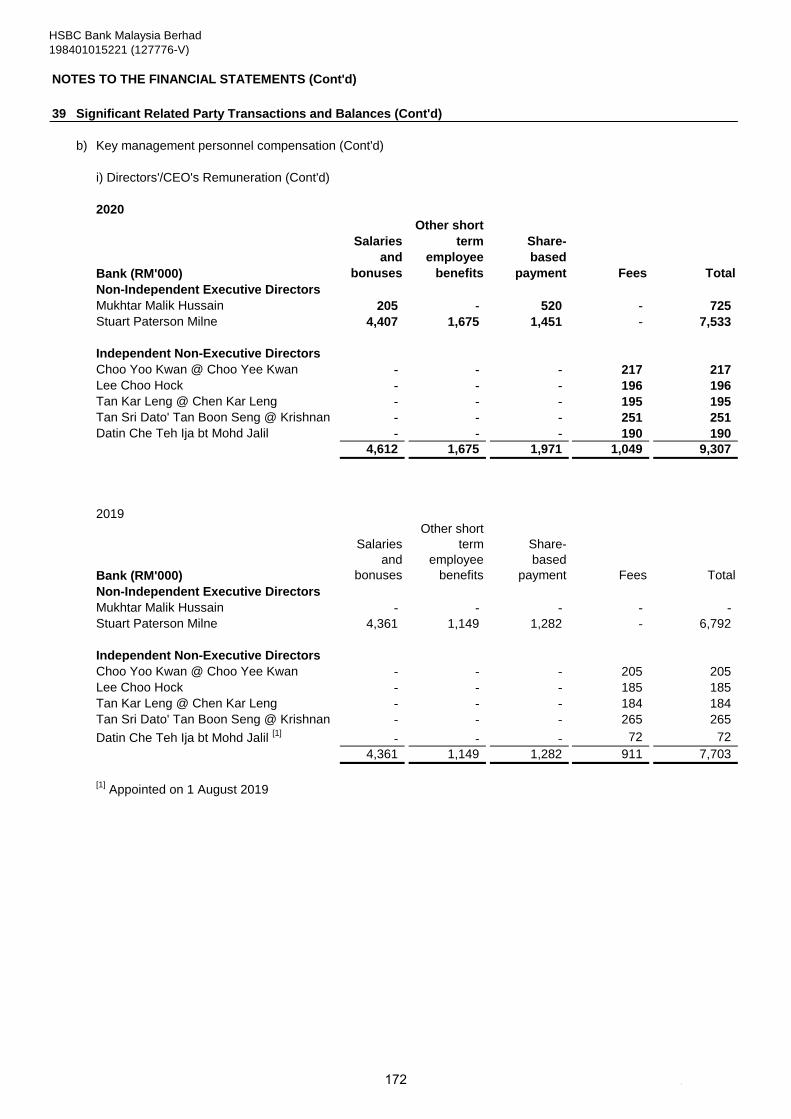
HSBC Bank Malaysia Berhad
198401015221 (127776-V)
NOTES TO THE FINANCIAL STATEMENTS (Cont'd)
39 Significant Related Party Transactions and Balances (Cont'd)
b) Key management personnel compensation (Cont'd)
i) Directors'/CEO's Remuneration (Cont'd)
2020
Bank (RM'000)
Salaries
and
bonuses
Other short
term
employee
benefits
Share-
based
payment Fees Total
Non-Independent Executive Directors
Mukhtar Malik Hussain 205 - 520 - 725
Stuart Paterson Milne 4,407 1,675 1,451 - 7,533
Independent Non-Executive Directors
Choo Yoo Kwan @ Choo Yee Kwan - - - 217 217
Lee Choo Hock - - - 196 196
Tan Kar Leng @ Chen Kar Leng - - - 195 195
Tan Sri Dato' Tan Boon Seng @ Krishnan - - - 251 251
Datin Che Teh Ija bt Mohd Jalil - - - 190 190
4,612 1,675 1,971 1,049 9,307
2019
Bank (RM'000)
Salaries
and
bonuses
Other short
term
employee
benefits
Share-
based
payment Fees Total
Non-Independent Executive Directors
Mukhtar Malik Hussain - - - - -
Stuart Paterson Milne 4,361 1,149 1,282 - 6,792
Independent Non-Executive Directors
Choo Yoo Kwan @ Choo Yee Kwan - - - 205 205
Lee Choo Hock - - - 185 185
Tan Kar Leng @ Chen Kar Leng - - - 184 184
Tan Sri Dato' Tan Boon Seng @ Krishnan - - - 265 265
Datin Che Teh Ija bt Mohd Jalil [1]
- - - 72 72
4,361 1,149 1,282 911 7,703
[1] Appointed on 1 August 2019
#172
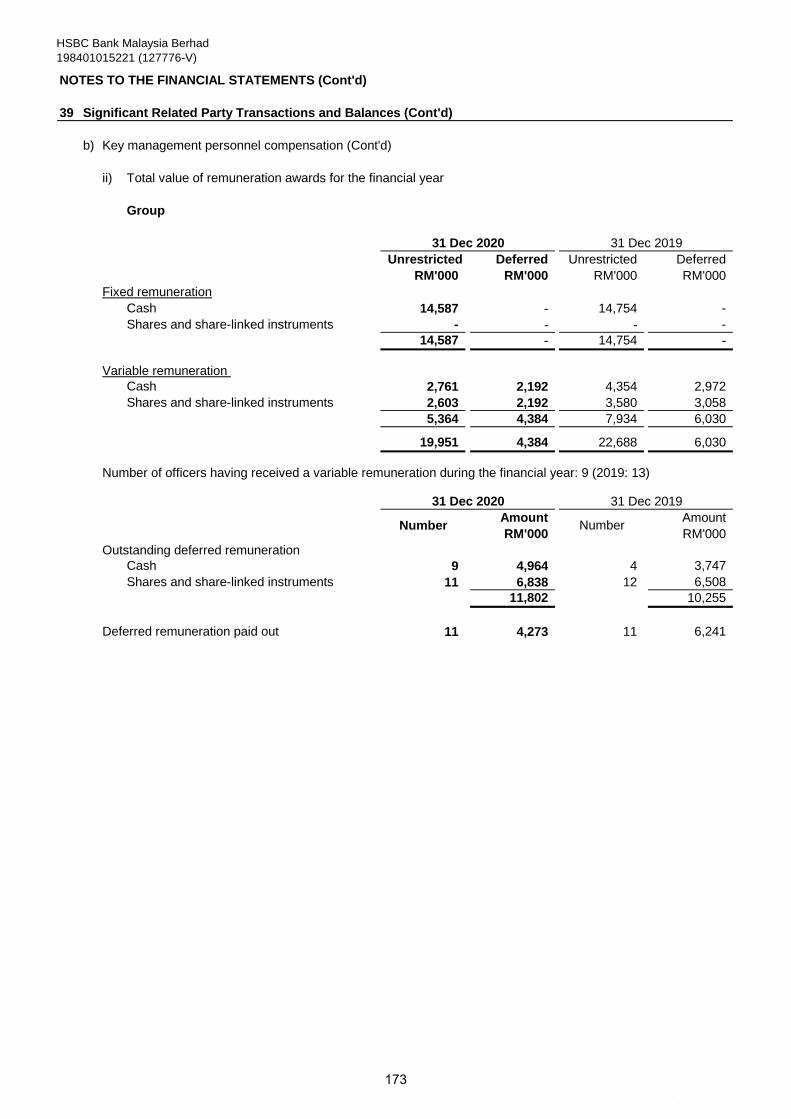
HSBC Bank Malaysia Berhad
198401015221 (127776-V)
NOTES TO THE FINANCIAL STATEMENTS (Cont'd)
39 Significant Related Party Transactions and Balances (Cont'd)
b) Key management personnel compensation (Cont'd)
ii) Total value of remuneration awards for the financial year
Group
Unrestricted Deferred Unrestricted Deferred
RM'000 RM'000 RM'000 RM'000
Fixed remuneration
Cash 14,587 - 14,754 -
Shares and share-linked instruments - - - -
14,587 - 14,754 -
Variable remuneration
Cash 2,761 2,192 4,354 2,972
Shares and share-linked instruments 2,603 2,192 3,580 3,058
5,364 4,384 7,934 6,030
19,951 4,384 22,688 6,030
Number of officers having received a variable remuneration during the financial year: 9 (2019: 13)
Amount Amount
RM'000 RM'000
Outstanding deferred remuneration
Cash 9 4,964 4 3,747
Shares and share-linked instruments 11 6,838 12 6,508
11,802 10,255
Deferred remuneration paid out 11 4,273 11 6,241
31 Dec 2020 31 Dec 2019
31 Dec 2020 31 Dec 2019
NumberNumber
#
173
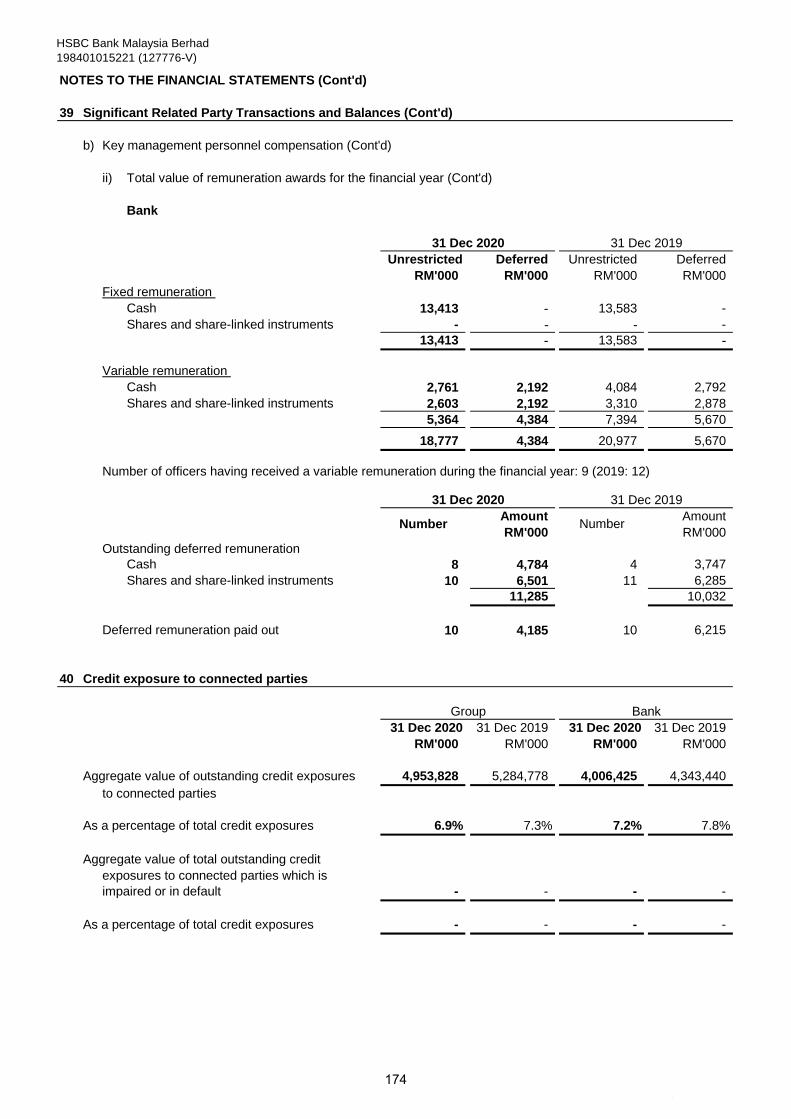
HSBC Bank Malaysia Berhad
198401015221 (127776-V)
NOTES TO THE FINANCIAL STATEMENTS (Cont'd)
39 Significant Related Party Transactions and Balances (Cont'd)
b) Key management personnel compensation (Cont'd)
ii) Total value of remuneration awards for the financial year (Cont'd)
Bank
Unrestricted Deferred Unrestricted Deferred
RM'000 RM'000 RM'000 RM'000
Fixed remuneration
Cash 13,413 - 13,583 -
Shares and share-linked instruments - - - -
13,413 - 13,583 -
Variable remuneration
Cash 2,761 2,192 4,084 2,792
Shares and share-linked instruments 2,603 2,192 3,310 2,878
5,364 4,384 7,394 5,670
18,777 4,384 20,977 5,670
Number of officers having received a variable remuneration during the financial year: 9 (2019: 12)
Amount Amount
RM'000 RM'000
Outstanding deferred remuneration
Cash 8 4,784 4 3,747
Shares and share-linked instruments 10 6,501 11 6,285
11,285 10,032
Deferred remuneration paid out 10 4,185 10 6,215
40 Credit exposure to connected parties
31 Dec 2020 31 Dec 2019 31 Dec 2020 31 Dec 2019
RM'000 RM'000 RM'000 RM'000
Aggregate value of outstanding credit exposures 4,953,828 5,284,778 4,006,425 4,343,440
to connected parties
As a percentage of total credit exposures 6.9% 7.3% 7.2% 7.8%
Aggregate value of total outstanding credit
exposures to connected parties which is
impaired or in default - - - -
As a percentage of total credit exposures - - - -
Group Bank
31 Dec 2020 31 Dec 2019
31 Dec 2020 31 Dec 2019
Number Number
#
174
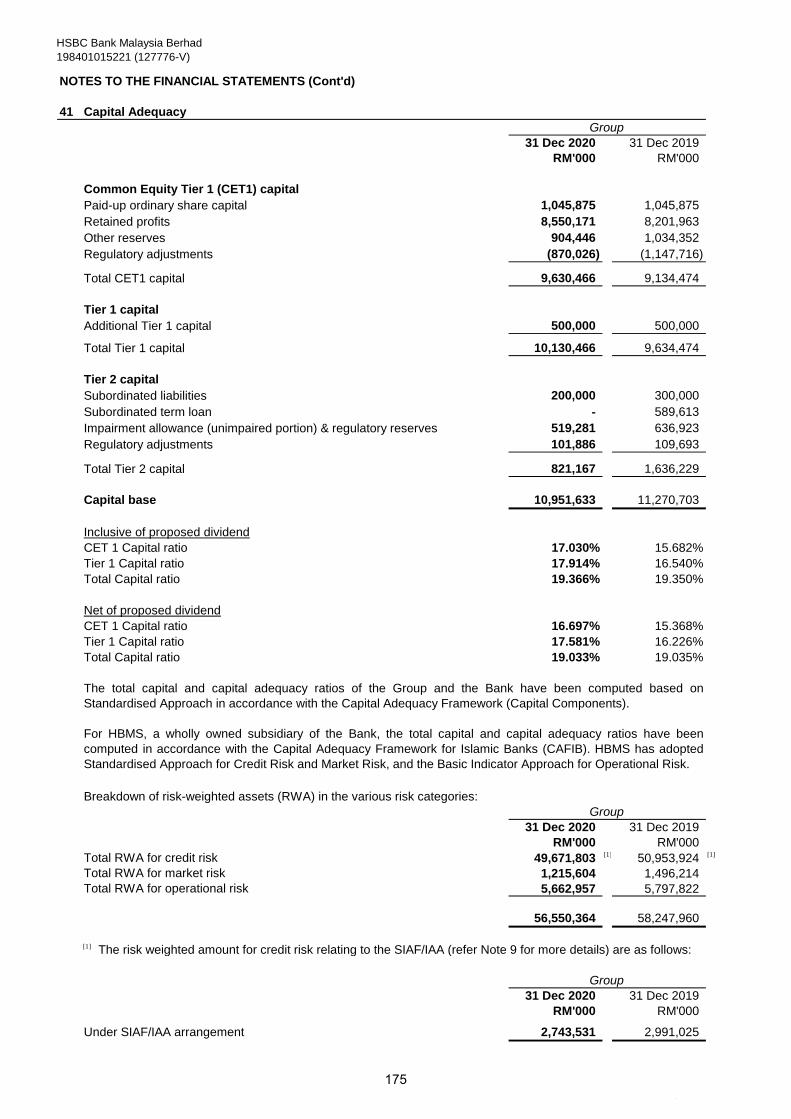
HSBC Bank Malaysia Berhad
198401015221 (127776-V)
NOTES TO THE FINANCIAL STATEMENTS (Cont'd)
41 Capital Adequacy
31 Dec 2020 31 Dec 2019
RM'000 RM'000
Common Equity Tier 1 (CET1) capital
Paid-up ordinary share capital 1,045,875 1,045,875
Retained profits 8,550,171 8,201,963
Other reserves 904,446 1,034,352
Regulatory adjustments (870,026) (1,147,716)
Total CET1 capital 9,630,466 9,134,474
Tier 1 capital
Additional Tier 1 capital 500,000 500,000
Total Tier 1 capital 10,130,466 9,634,474
Tier 2 capital
Subordinated liabilities 200,000 300,000
Subordinated term loan - 589,613
Impairment allowance (unimpaired portion) & regulatory reserves 519,281 636,923
Regulatory adjustments 101,886 109,693
Total Tier 2 capital 821,167 1,636,229
Capital base 10,951,633 11,270,703
Inclusive of proposed dividend
CET 1 Capital ratio 17.030% 15.682%
Tier 1 Capital ratio 17.914% 16.540%
Total Capital ratio 19.366% 19.350%
Net of proposed dividend
CET 1 Capital ratio 16.697% 15.368%
Tier 1 Capital ratio 17.581% 16.226%
Total Capital ratio 19.033% 19.035%
Breakdown of risk-weighted assets (RWA) in the various risk categories:
31 Dec 2020 31 Dec 2019
RM'000 RM'000
Total RWA for credit risk 49,671,803 [1] 50,953,924 [1]
Total RWA for market risk 1,215,604 1,496,214
Total RWA for operational risk 5,662,957 5,797,822
56,550,364 58,247,960
[1] The risk weighted amount for credit risk relating to the SIAF/IAA (refer Note 9 for more details) are as follows:
31 Dec 2020 31 Dec 2019
RM'000 RM'000
Under SIAF/IAA arrangement 2,743,531 2,991,025
Group
Group
Group
The total capital and capital adequacy ratios of the Group and the Bank have been computed based on
Standardised Approach in accordance with the Capital Adequacy Framework (Capital Components).
For HBMS, a wholly owned subsidiary of the Bank, the total capital and capital adequacy ratios have been
computed in accordance with the Capital Adequacy Framework for Islamic Banks (CAFIB). HBMS has adopted
Standardised Approach for Credit Risk and Market Risk, and the Basic Indicator Approach for Operational Risk.
#
175
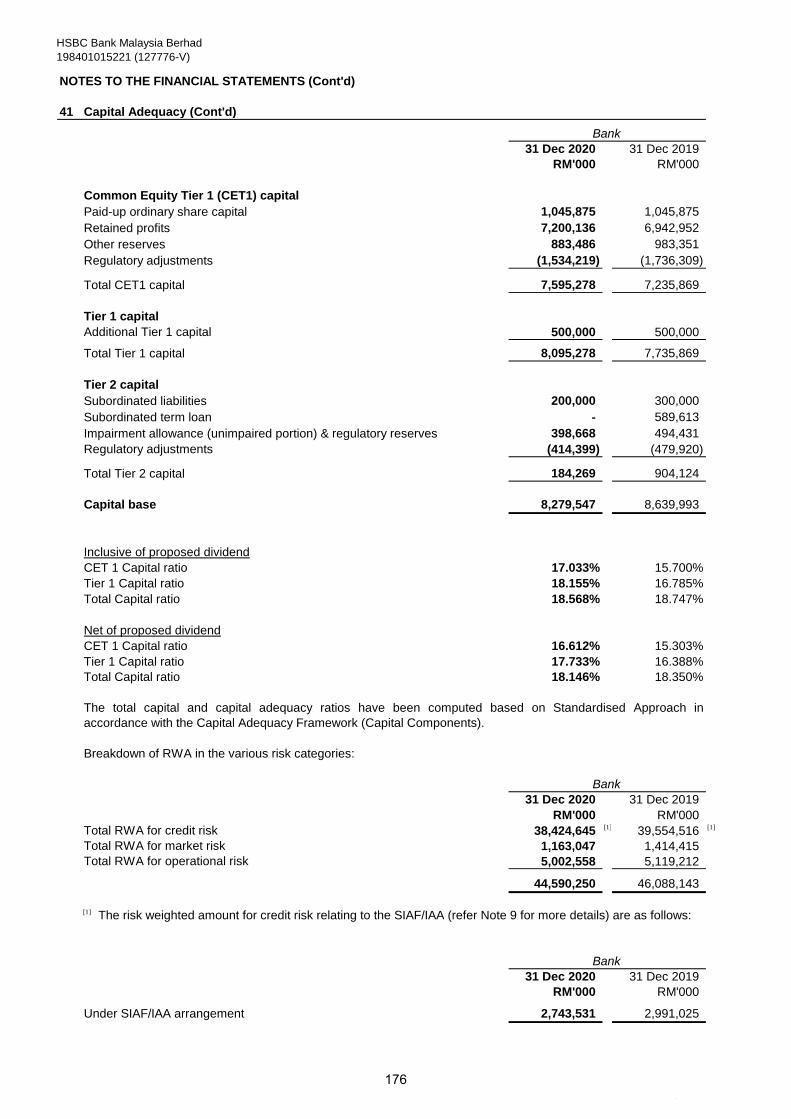
HSBC Bank Malaysia Berhad
198401015221 (127776-V)
NOTES TO THE FINANCIAL STATEMENTS (Cont'd)
41 Capital Adequacy (Cont'd)
31 Dec 2020 31 Dec 2019
RM'000 RM'000
Common Equity Tier 1 (CET1) capital
Paid-up ordinary share capital 1,045,875 1,045,875
Retained profits 7,200,136 6,942,952
Other reserves 883,486 983,351
Regulatory adjustments (1,534,219) (1,736,309)
Total CET1 capital 7,595,278 7,235,869
Tier 1 capital
Additional Tier 1 capital 500,000 500,000
Total Tier 1 capital 8,095,278 7,735,869
Tier 2 capital
Subordinated liabilities 200,000 300,000
Subordinated term loan - 589,613
Impairment allowance (unimpaired portion) & regulatory reserves 398,668 494,431
Regulatory adjustments (414,399) (479,920)
Total Tier 2 capital 184,269 904,124
Capital base 8,279,547 8,639,993
Inclusive of proposed dividend
CET 1 Capital ratio 17.033% 15.700%
Tier 1 Capital ratio 18.155% 16.785%
Total Capital ratio 18.568% 18.747%
Net of proposed dividend
CET 1 Capital ratio 16.612% 15.303%
Tier 1 Capital ratio 17.733% 16.388%
Total Capital ratio 18.146% 18.350%
Breakdown of RWA in the various risk categories:
31 Dec 2020 31 Dec 2019
RM'000 RM'000
Total RWA for credit risk 38,424,645 [1] 39,554,516 [1]
Total RWA for market risk 1,163,047 1,414,415
Total RWA for operational risk 5,002,558 5,119,212
44,590,250 46,088,143
[1] The risk weighted amount for credit risk relating to the SIAF/IAA (refer Note 9 for more details) are as follows:
31 Dec 2020 31 Dec 2019
RM'000 RM'000
Under SIAF/IAA arrangement 2,743,531 2,991,025
Bank
Bank
Bank
The total capital and capital adequacy ratios have been computed based on Standardised Approach in
accordance with the Capital Adequacy Framework (Capital Components).
#
176

HSBC Bank Malaysia Berhad
198401015221 (127776-V)
NOTES TO THE FINANCIAL STATEMENTS (Cont'd)
41 Capital Adequacy (Cont'd)
As presented in the financial statement:
31 Dec 2020
Inclusive of proposed dividend RM'000 % RM'000 %
CET1 Capital 9,630,466 17.030% 9,472,058 16.750%
Tier 1 Capital 10,130,466 17.914% 9,972,058 17.634%
Tier 2 Capital 821,167 - 922,784 -
Total Capital 10,951,633 19.366% 10,894,842 19.266%
31 Dec 2020
Inclusive of proposed dividend RM'000 % RM'000 %
CET1 Capital 7,595,278 17.033% 7,486,920 16.790%
Tier 1 Capital 8,095,278 18.155% 7,986,920 17.912%
Tier 2 Capital 184,269 - 265,909 -
Total Capital 8,279,547 18.568% 8,252,829 18.508%
Bank
Without Transitional ArrangementWith Transitional Arrangement
Pursuant to BNM’s Guidelines on Capital Adequacy Framework (Capital Component) issued on 9 December
2020 (the Guidelines), the Group and the Bank elected to apply the transitional arrangements as specified in
paragraph 39.
Under transitional arrangements, the expected credit loss (ECL) allowance measured at an amount equal to 12-
month and lifetime ECL to the extent they are related to non-credit-impaired exposures (hereinafter referred to as
Stage 1 and Stage 2 provisions), are allowed to be added back to CET-1, subject to a capping. The transitional
arrangement commenced beginning from financial year beginning 1 January 2020, with an add-back factor that
will gradually reduce over the four-year transitional duration.
As required by the Guideline, below is the disclosure on the capital ratios with comparison of:
(i) the Capital Ratios, computed in accordance with the transitional arrangement
(ii) the Capital Ratios, had the transitional arrangement not been applied.
Without Transitional ArrangementWith Transitional Arrangement
Group
#
177
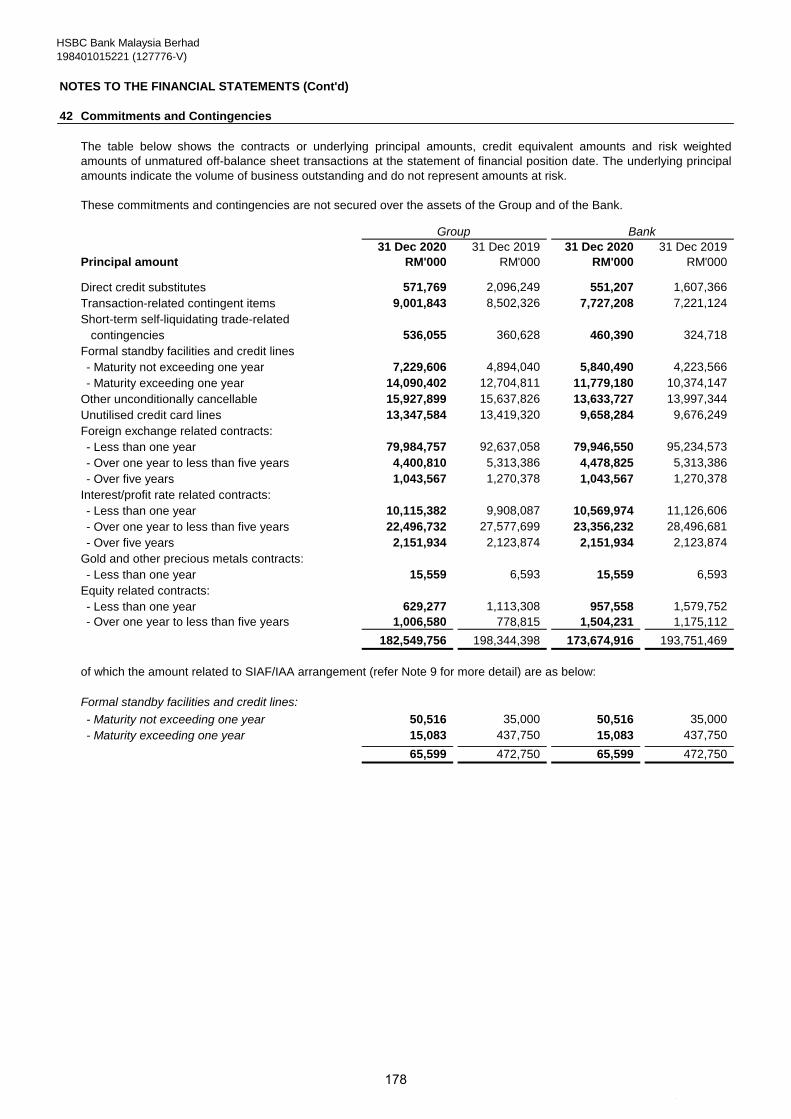
HSBC Bank Malaysia Berhad
198401015221 (127776-V)
NOTES TO THE FINANCIAL STATEMENTS (Cont'd)
42 Commitments and Contingencies
31 Dec 2020 31 Dec 2019 31 Dec 2020 31 Dec 2019
Principal amount RM'000 RM'000 RM'000 RM'000
Direct credit substitutes 571,769 2,096,249 551,207 1,607,366
Transaction-related contingent items 9,001,843 8,502,326 7,727,208 7,221,124
Short-term self-liquidating trade-related
contingencies 536,055 360,628 460,390 324,718
Formal standby facilities and credit lines
- Maturity not exceeding one year 7,229,606 4,894,040 5,840,490 4,223,566
- Maturity exceeding one year 14,090,402 12,704,811 11,779,180 10,374,147
Other unconditionally cancellable 15,927,899 15,637,826 13,633,727 13,997,344
Unutilised credit card lines 13,347,584 13,419,320 9,658,284 9,676,249
Foreign exchange related contracts:
- Less than one year 79,984,757 92,637,058 79,946,550 95,234,573
- Over one year to less than five years 4,400,810 5,313,386 4,478,825 5,313,386
- Over five years 1,043,567 1,270,378 1,043,567 1,270,378
Interest/profit rate related contracts:
- Less than one year 10,115,382 9,908,087 10,569,974 11,126,606
- Over one year to less than five years 22,496,732 27,577,699 23,356,232 28,496,681
- Over five years 2,151,934 2,123,874 2,151,934 2,123,874
Gold and other precious metals contracts:
- Less than one year 15,559 6,593 15,559 6,593
Equity related contracts:
- Less than one year 629,277 1,113,308 957,558 1,579,752
- Over one year to less than five years 1,006,580 778,815 1,504,231 1,175,112
182,549,756 198,344,398 173,674,916 193,751,469
of which the amount related to SIAF/IAA arrangement (refer Note 9 for more detail) are as below:
Formal standby facilities and credit lines:
- Maturity not exceeding one year 50,516 35,000 50,516 35,000
- Maturity exceeding one year 15,083 437,750 15,083 437,750
65,599 472,750 65,599 472,750
Group Bank
The table below shows the contracts or underlying principal amounts, credit equivalent amounts and risk weighted
amounts of unmatured off-balance sheet transactions at the statement of financial position date. The underlying principal
amounts indicate the volume of business outstanding and do not represent amounts at risk.
These commitments and contingencies are not secured over the assets of the Group and of the Bank.
#
178

HSBC Bank Malaysia Berhad
198401015221 (127776-V)
NOTES TO THE FINANCIAL STATEMENTS (Cont'd)
43 Derivative Financial Instruments
Details of derivative financial instruments outstanding are as follows:
Derivative financial instruments measured at their fair values together with their corresponding contract/notional amounts:
Group Up to 1 Year > 1 - 5 Years > 5 Years Total Up to 1 Year > 1 - 5 Years > 5 Years Total Up to 1 Year > 1 - 5 Years > 5 Years Total
At 31 Dec 2020 RM'000 RM'000 RM'000 RM'000 RM'000 RM'000 RM'000 RM'000 RM'000 RM'000 RM'000 RM'000
Trading derivatives:
Foreign exchange contracts
- Forwards 75,909,799 552,972 - 76,462,771 923,016 2,409 - 925,425 976,257 9,002 - 985,259
- Swaps 3,572,306 3,847,838 1,043,567 8,463,711 182,779 257,764 72,198 512,741 85,871 100,520 33,247 219,638
- Options 502,652 - - 502,652 1,459 - - 1,459 2,978 - - 2,978
Interest/profit rate related contracts
- Options 955,008 193,346 - 1,148,354 4,393 2,456 - 6,849 6,639 - - 6,639
- Swaps 8,760,374 21,183,386 2,151,934 32,095,694 41,096 415,524 99,597 556,217 37,936 386,468 91,102 515,506
Equity related contracts
- Options 629,277 1,006,580 - 1,635,857 14,041 16,688 - 30,729 22,564 38,264 - 60,828
Precious metal contracts
- Options 15,559 - - 15,559 9 - - 9 36 - - 36
Sub- total 90,344,975 26,784,122 3,195,501 120,324,598 1,166,793 694,841 171,795 2,033,429 1,132,281 534,254 124,349 1,790,884
Hedging Derivatives:
Fair Value Hedge
Interest/profit rate related contracts
- Swaps 400,000 1,120,000 - 1,520,000 - - - - 4,440 44,928 - 49,368
Sub- total 400,000 1,120,000 - 1,520,000 - - - - 4,440 44,928 - 49,368
Total 90,744,975 27,904,122 3,195,501 121,844,598 1,166,793 694,841 171,795 2,033,429 1,136,721 579,182 124,349 1,840,252
Contract / Notional Amount Positive Fair Value Negative Fair Value
#
179

HSBC Bank Malaysia Berhad
198401015221 (127776-V)
NOTES TO THE FINANCIAL STATEMENTS (Cont'd)
43 Derivative Financial Instruments (Cont'd)
Details of derivative financial instruments outstanding are as follows (Cont'd):
Derivative financial instruments measured at their fair values together with their corresponding contract/notional amounts (Cont'd):
Group Up to 1 Year > 1 - 5 Years > 5 Years Total Up to 1 Year > 1 - 5 Years > 5 Years Total Up to 1 Year > 1 - 5 Years > 5 Years Total
At 31 Dec 2019 RM'000 RM'000 RM'000 RM'000 RM'000 RM'000 RM'000 RM'000 RM'000 RM'000 RM'000 RM'000
Trading derivatives:
Foreign exchange contracts
- Forwards 87,634,546 749,151 - 88,383,697 663,508 4,505 - 668,013 732,752 14,184 - 746,936
- Swaps 4,396,472 4,564,235 1,270,378 10,231,085 153,659 233,307 102,544 489,510 100,570 138,570 29,875 269,015
- Options 606,040 - - 606,040 670 - - 670 1,997 - - 1,997
Interest/profit rate related contracts
- Options 647,149 884,883 - 1,532,032 5,143 5,263 - 10,406 284 4,937 - 5,221
- Swaps 9,010,938 25,172,816 2,123,874 36,307,628 18,657 166,956 38,144 223,757 26,650 153,817 40,147 220,614
Equity related contracts
- Options 1,113,308 778,815 - 1,892,123 25,194 22,627 - 47,821 - 124 12,299 12,423
Precious metal contracts
- Options 6,593 - - 6,593 20 - - 20 30 - - 30
Sub- total 103,415,046 32,149,900 3,394,252 138,959,198 866,851 432,658 140,688 1,440,197 862,283 311,632 82,321 1,256,236
Hedging Derivatives:
Fair Value Hedge
Interest/profit rate related contracts
- Swaps 250,000 1,520,000 - 1,770,000 - - - - 901 25,132 - 26,033
Sub- total 250,000 1,520,000 - 1,770,000 - - - - 901 25,132 - 26,033
Total 103,665,046 33,669,900 3,394,252 140,729,198 866,851 432,658 140,688 1,440,197 863,184 336,764 82,321 1,282,269
Contract / Notional Amount Positive Fair Value Negative Fair Value
#
180
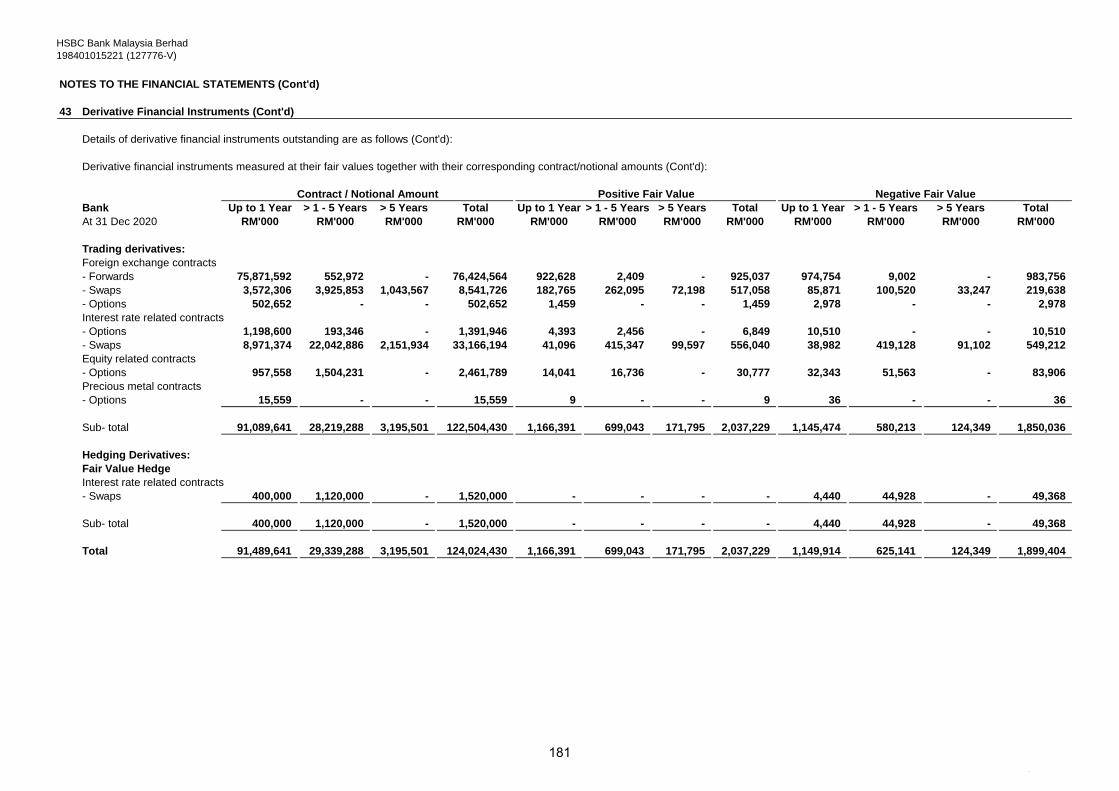
HSBC Bank Malaysia Berhad
198401015221 (127776-V)
NOTES TO THE FINANCIAL STATEMENTS (Cont'd)
43 Derivative Financial Instruments (Cont'd)
Details of derivative financial instruments outstanding are as follows (Cont'd):
Derivative financial instruments measured at their fair values together with their corresponding contract/notional amounts (Cont'd):
Bank Up to 1 Year > 1 - 5 Years > 5 Years Total Up to 1 Year > 1 - 5 Years > 5 Years Total Up to 1 Year > 1 - 5 Years > 5 Years Total
At 31 Dec 2020 RM'000 RM'000 RM'000 RM'000 RM'000 RM'000 RM'000 RM'000 RM'000 RM'000 RM'000 RM'000
Trading derivatives:
Foreign exchange contracts
- Forwards 75,871,592 552,972 - 76,424,564 922,628 2,409 - 925,037 974,754 9,002 - 983,756
- Swaps 3,572,306 3,925,853 1,043,567 8,541,726 182,765 262,095 72,198 517,058 85,871 100,520 33,247 219,638
- Options 502,652 - - 502,652 1,459 - - 1,459 2,978 - - 2,978
Interest rate related contracts
- Options 1,198,600 193,346 - 1,391,946 4,393 2,456 - 6,849 10,510 - - 10,510
- Swaps 8,971,374 22,042,886 2,151,934 33,166,194 41,096 415,347 99,597 556,040 38,982 419,128 91,102 549,212
Equity related contracts
- Options 957,558 1,504,231 - 2,461,789 14,041 16,736 - 30,777 32,343 51,563 - 83,906
Precious metal contracts
- Options 15,559 - - 15,559 9 - - 9 36 - - 36
Sub- total 91,089,641 28,219,288 3,195,501 122,504,430 1,166,391 699,043 171,795 2,037,229 1,145,474 580,213 124,349 1,850,036
Hedging Derivatives:
Fair Value Hedge
Interest rate related contracts
- Swaps 400,000 1,120,000 - 1,520,000 - - - - 4,440 44,928 - 49,368
Sub- total 400,000 1,120,000 - 1,520,000 - - - - 4,440 44,928 - 49,368
Total 91,489,641 29,339,288 3,195,501 124,024,430 1,166,391 699,043 171,795 2,037,229 1,149,914 625,141 124,349 1,899,404
Contract / Notional Amount Positive Fair Value Negative Fair Value
#
181
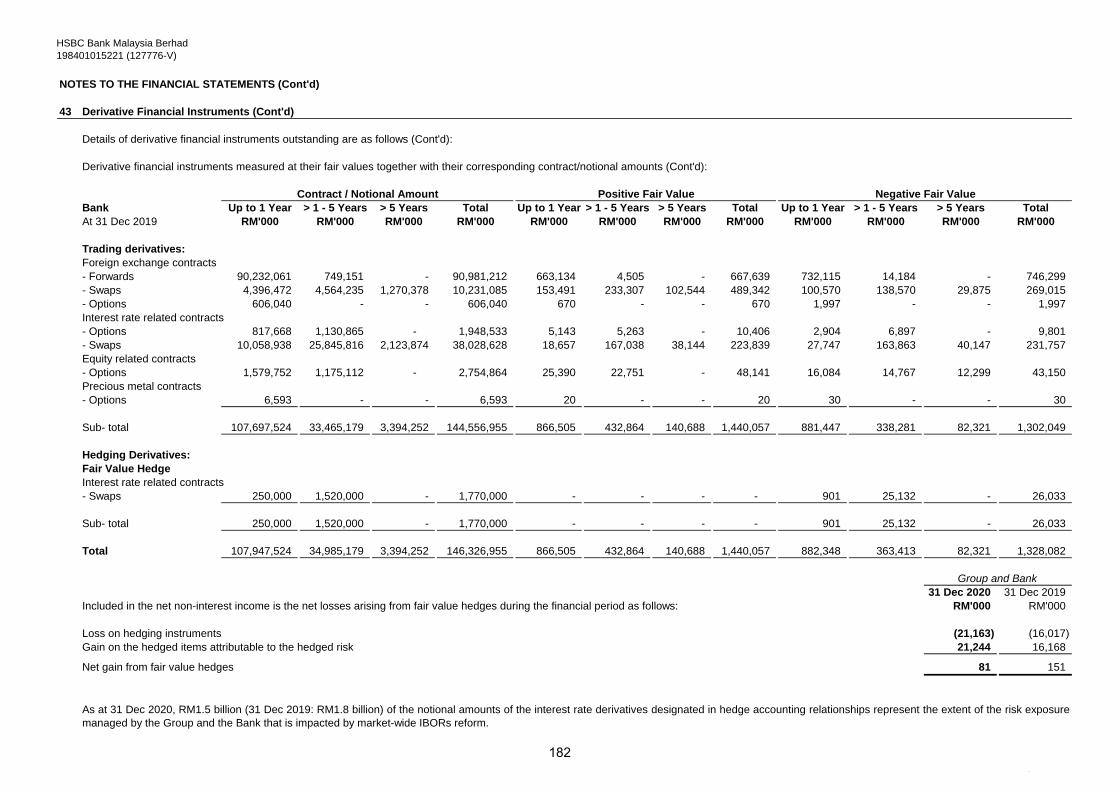
HSBC Bank Malaysia Berhad
198401015221 (127776-V)
NOTES TO THE FINANCIAL STATEMENTS (Cont'd)
43 Derivative Financial Instruments (Cont'd)
Details of derivative financial instruments outstanding are as follows (Cont'd):
Derivative financial instruments measured at their fair values together with their corresponding contract/notional amounts (Cont'd):
Bank Up to 1 Year > 1 - 5 Years > 5 Years Total Up to 1 Year > 1 - 5 Years > 5 Years Total Up to 1 Year > 1 - 5 Years > 5 Years Total
At 31 Dec 2019 RM'000 RM'000 RM'000 RM'000 RM'000 RM'000 RM'000 RM'000 RM'000 RM'000 RM'000 RM'000
Trading derivatives:
Foreign exchange contracts
- Forwards 90,232,061 749,151 - 90,981,212 663,134 4,505 - 667,639 732,115 14,184 - 746,299
- Swaps 4,396,472 4,564,235 1,270,378 10,231,085 153,491 233,307 102,544 489,342 100,570 138,570 29,875 269,015
- Options 606,040 - - 606,040 670 - - 670 1,997 - - 1,997
Interest rate related contracts
- Options 817,668 1,130,865 - 1,948,533 5,143 5,263 - 10,406 2,904 6,897 - 9,801
- Swaps 10,058,938 25,845,816 2,123,874 38,028,628 18,657 167,038 38,144 223,839 27,747 163,863 40,147 231,757
Equity related contracts
- Options 1,579,752 1,175,112 - 2,754,864 25,390 22,751 - 48,141 16,084 14,767 12,299 43,150
Precious metal contracts
- Options 6,593 - - 6,593 20 - - 20 30 - - 30
Sub- total 107,697,524 33,465,179 3,394,252 144,556,955 866,505 432,864 140,688 1,440,057 881,447 338,281 82,321 1,302,049
Hedging Derivatives:
Fair Value Hedge
Interest rate related contracts
- Swaps 250,000 1,520,000 - 1,770,000 - - - - 901 25,132 - 26,033
Sub- total 250,000 1,520,000 - 1,770,000 - - - - 901 25,132 - 26,033
Total 107,947,524 34,985,179 3,394,252 146,326,955 866,505 432,864 140,688 1,440,057 882,348 363,413 82,321 1,328,082
31 Dec 2020 31 Dec 2019
Included in the net non-interest income is the net losses arising from fair value hedges during the financial period as follows: RM'000 RM'000
Loss on hedging instruments (21,163) (16,017)
Gain on the hedged items attributable to the hedged risk 21,244 16,168
Net gain from fair value hedges 81 151
As at 31 Dec 2020, RM1.5 billion (31 Dec 2019: RM1.8 billion) of the notional amounts of the interest rate derivatives designated in hedge accounting relationships represent the extent of the risk exposure
managed by the Group and the Bank that is impacted by market-wide IBORs reform.
Group and Bank
Contract / Notional Amount Positive Fair Value Negative Fair Value
#
182

HSBC Bank Malaysia Berhad
198401015221 (127776-V)
NOTES TO THE FINANCIAL STATEMENTS (Cont'd)
44 Repurchase and Reverse Repurchase Transactions and Collateral Pledged/Accepted
31 Dec 2020 31 Dec 2019 31 Dec 2020 31 Dec 2019
RM'000 RM'000 RM'000 RM'000
Carrying amount of assets and collateral pledged
- Sold under repurchase agreements - - - -
- Collateral accepted on derivative contracts (ISDA[1]
) 100,711 40,143 100,711 40,143
Fair value of assets and collateral accepted
- Securities bought under reverse repurchase
agreement 6,911,292 6,768,271 6,911,292 6,768,271
- Securities sold under regulated short selling 3,263 16,383 3,263 16,383
- Collateral accepted on derivative contracts (ISDA[1]
) 615,800 439,106 615,800 439,106
[1]ISDA: International Swaps and Derivatives Association
45 Capital Commitments
31 Dec 2020 31 Dec 2019 31 Dec 2020 31 Dec 2019
RM'000 RM'000 RM'000 RM'000
Property and equipment- Authorised and contracted, but not provided for 113,326 205,825 113,326 205,825
Group Bank
In the normal course of business, the Group and the Bank sell assets to raise liabilities and accept assets for resale.
Assets sold and received are mainly via repurchase agreements and reverse repurchase agreements. Collateral is
accepted and pledged on derivative contracts, mainly in the form of cash.
Group Bank
#183
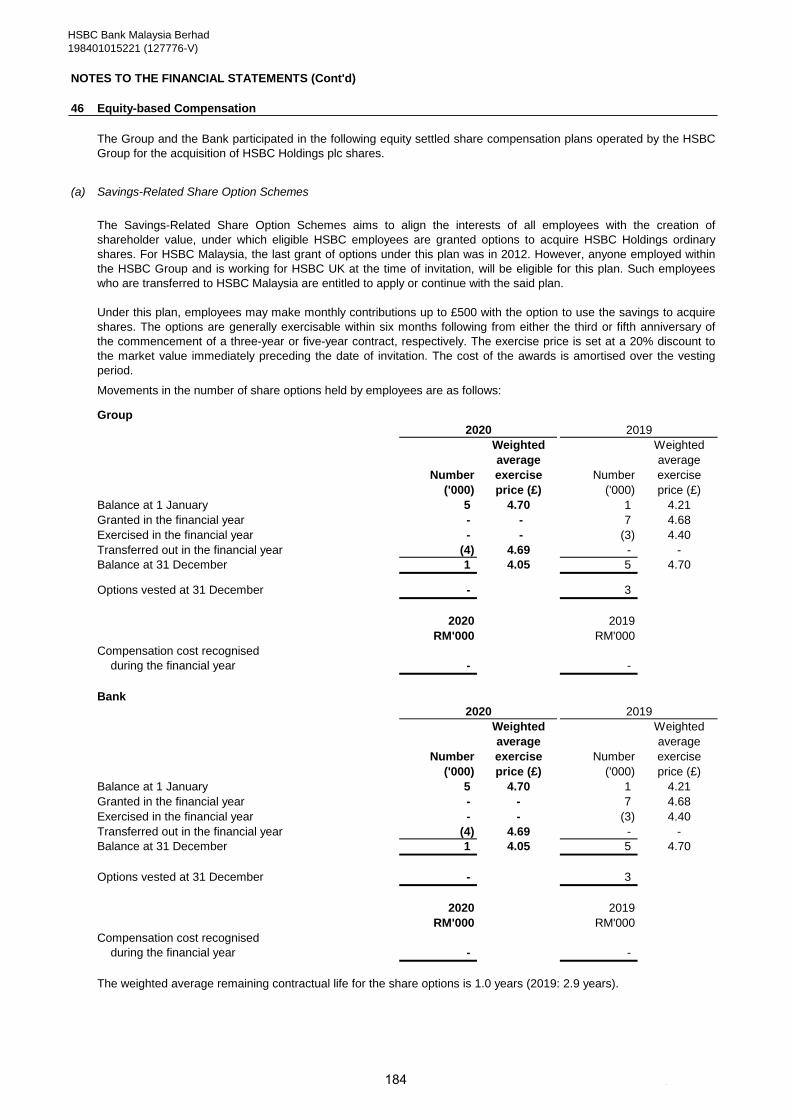
HSBC Bank Malaysia Berhad
198401015221 (127776-V)
NOTES TO THE FINANCIAL STATEMENTS (Cont'd)
46 Equity-based Compensation
(a) Savings-Related Share Option Schemes
Movements in the number of share options held by employees are as follows:
Group
Weighted Weighted
average average
Number exercise Number exercise
('000) price (£) ('000) price (£)
Balance at 1 January 5 4.70 1 4.21
Granted in the financial year - - 7 4.68
Exercised in the financial year - - (3) 4.40
Transferred out in the financial year (4) 4.69 - -
Balance at 31 December 1 4.05 5 4.70
Options vested at 31 December - 3
2020 2019
RM'000 RM'000
Compensation cost recognised
during the financial year - -
Bank
Weighted Weighted
average average
Number exercise Number exercise
('000) price (£) ('000) price (£)
Balance at 1 January 5 4.70 1 4.21
Granted in the financial year - - 7 4.68
Exercised in the financial year - - (3) 4.40
Transferred out in the financial year (4) 4.69 - -
Balance at 31 December 1 4.05 5 4.70
Options vested at 31 December - 3
2020 2019
RM'000 RM'000
Compensation cost recognised
during the financial year - -
The weighted average remaining contractual life for the share options is 1.0 years (2019: 2.9 years).
The Savings-Related Share Option Schemes aims to align the interests of all employees with the creation of
shareholder value, under which eligible HSBC employees are granted options to acquire HSBC Holdings ordinary
shares. For HSBC Malaysia, the last grant of options under this plan was in 2012. However, anyone employed within
the HSBC Group and is working for HSBC UK at the time of invitation, will be eligible for this plan. Such employees
who are transferred to HSBC Malaysia are entitled to apply or continue with the said plan.
Under this plan, employees may make monthly contributions up to £500 with the option to use the savings to acquire
shares. The options are generally exercisable within six months following from either the third or fifth anniversary of
the commencement of a three-year or five-year contract, respectively. The exercise price is set at a 20% discount to
the market value immediately preceding the date of invitation. The cost of the awards is amortised over the vesting
period.
2020 2019
The Group and the Bank participated in the following equity settled share compensation plans operated by the HSBC
Group for the acquisition of HSBC Holdings plc shares.
2020 2019
#184
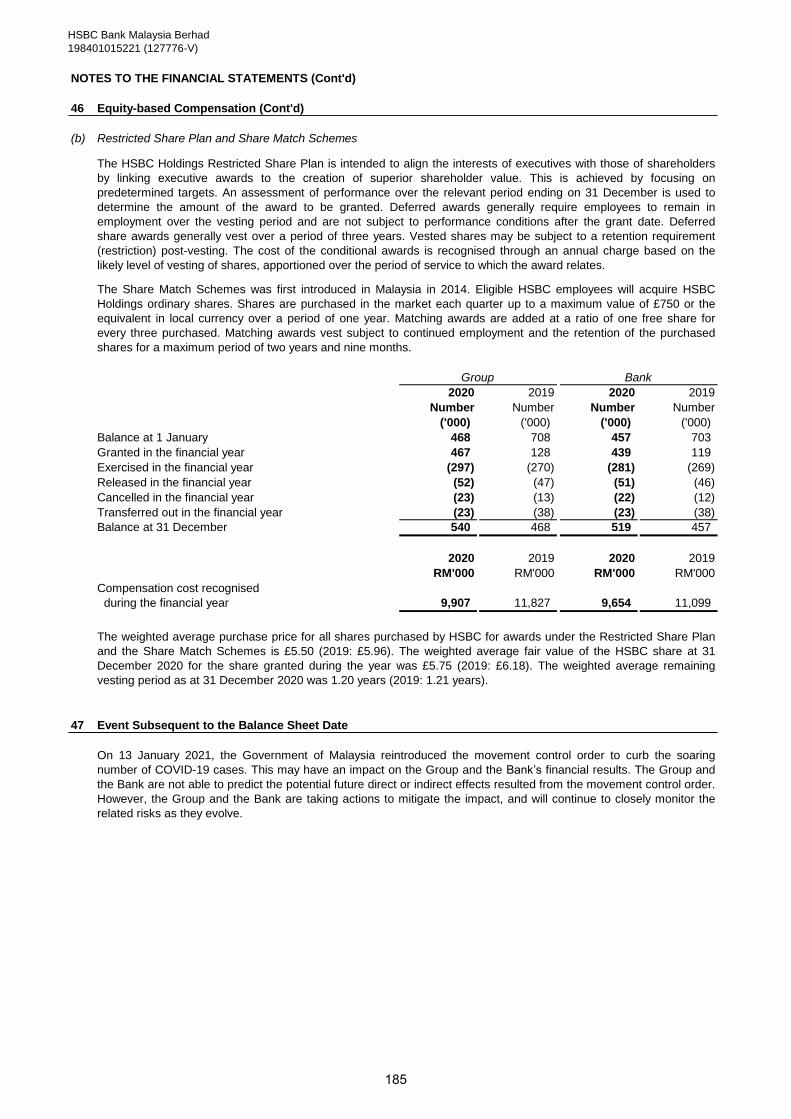
HSBC Bank Malaysia Berhad
198401015221 (127776-V)
NOTES TO THE FINANCIAL STATEMENTS (Cont'd)
46 Equity-based Compensation (Cont'd)
(b) Restricted Share Plan and Share Match Schemes
2020 2019 2020 2019
Number Number Number Number
('000) ('000) ('000) ('000)
Balance at 1 January 468 708 457 703
Granted in the financial year 467 128 439 119
Exercised in the financial year (297) (270) (281) (269)
Released in the financial year (52) (47) (51) (46)
Cancelled in the financial year (23) (13) (22) (12)
Transferred out in the financial year (23) (38) (23) (38)
Balance at 31 December 540 468 519 457
2020 2019 2020 2019
RM'000 RM'000 RM'000 RM'000
Compensation cost recognised
during the financial year 9,907 11,827 9,654 11,099
47 Event Subsequent to the Balance Sheet Date
On 13 January 2021, the Government of Malaysia reintroduced the movement control order to curb the soaring
number of COVID-19 cases. This may have an impact on the Group and the Bank’s financial results. The Group and
the Bank are not able to predict the potential future direct or indirect effects resulted from the movement control order.
However, the Group and the Bank are taking actions to mitigate the impact, and will continue to closely monitor the
related risks as they evolve.
The weighted average purchase price for all shares purchased by HSBC for awards under the Restricted Share Plan
and the Share Match Schemes is £5.50 (2019: £5.96). The weighted average fair value of the HSBC share at 31
December 2020 for the share granted during the year was £5.75 (2019: £6.18). The weighted average remaining
vesting period as at 31 December 2020 was 1.20 years (2019: 1.21 years).
The Share Match Schemes was first introduced in Malaysia in 2014. Eligible HSBC employees will acquire HSBC
Holdings ordinary shares. Shares are purchased in the market each quarter up to a maximum value of £750 or the
equivalent in local currency over a period of one year. Matching awards are added at a ratio of one free share for
every three purchased. Matching awards vest subject to continued employment and the retention of the purchased
shares for a maximum period of two years and nine months.
Group Bank
The HSBC Holdings Restricted Share Plan is intended to align the interests of executives with those of shareholders
by linking executive awards to the creation of superior shareholder value. This is achieved by focusing on
predetermined targets. An assessment of performance over the relevant period ending on 31 December is used to
determine the amount of the award to be granted. Deferred awards generally require employees to remain in
employment over the vesting period and are not subject to performance conditions after the grant date. Deferred
share awards generally vest over a period of three years. Vested shares may be subject to a retention requirement
(restriction) post-vesting. The cost of the conditional awards is recognised through an annual charge based on the
likely level of vesting of shares, apportioned over the period of service to which the award relates.
#185


