Embed Size (px)
Citation preview

Supporting the Employment of Mothers:
Policy Variation Across Fourteen Welfare States
Janet C. GornickDepartment of Political Science
Baruch CollegeCity University of New York
Marcia K. MeyersSchool of Social WorkColumbia University
Katherin E. RossSocial Science Program
Syracuse University
Luxembourg Income Study (LIS) Working Paper #139
July 1, 1996REVISED October 1996
We are grateful to Tim Smeeding and Lee Rainwater for their generous guidance and support inthe development of the new policy database. We would also like to thank Sheila Kamerman forher helpful comments on an earlier draft of this paper. In addition, we would like to express ourappreciation to the country representatives who so generously gave us their time and expertise;their names are listed in Appendix 6.

SUMMARY
Despite their broadly similar political and economic systems, the rates and patterns ofmothers' employment vary considerably across industrialized countries. This variation raisesquestions about the role played by government policies in enabling mothers to chooseemployment and, in turn, in shaping both gender equality and family economic well-being.
This paper compares fourteen OECD countries, as of the middle-to-late 1980s, withrespect to their provision of policies that support mothers' employment: parental leave, child care,and the scheduling of public education. Newly gathered data on eighteen policy indicators arepresented; these indicators were chosen to capture support for maternal employment, regardlessof national intent. The indicators are then standardized, weighted, and summed into indices. Bydifferentiating policies that affect maternal employment from family policies more generally, whilesimultaneously aggregating individual policies and policy features into policy "packages", theseindices reveal dramatic cross-national differences in policy provisions.
The empirical results reveal loose clusters of countries that correspond only partially toprevailing welfare state typologies. For mothers with preschool-aged children, only five of thefourteen countries provided reasonably complete and continuous benefits that supported theiroptions for combining paid work with family responsibilities. In the remaining countries,government provisions were much more limited or discontinuous. The pattern of cross-nationalpolicy variation changed notably when policies affecting mothers with older children wereexamined.
The links between these findings and three sets of outcomes are considered. The indicesprovide an improved measure of public support for maternal employment and are expected to helpexplain cross-national differences in the level and continuity of women's labor market attachment. Prior findings on women's labor supply provide initial support for this conclusion. These indicesare also useful for contrasting family benefits that are provided through direct cash transfers withthose that take the form of support for mothers' employment. Cross-national variation incombinations of transfers with employment supports is found to correspond to differences in childpoverty rates. Finally, these policy findings contribute to the body of scholarship that seeks tointegrate gender issues more explicitly into research on welfare state regimes. This study suggeststhat the country clusters identified in the dominant regime model fail to cohere with respect to thesubset of family policies that specifically help women to combine paid work with parenting.

1
INTRODUCTION
During the post-war period, rates of female employment, especially of maternal
employment, have increased markedly throughout the industrialized countries. Changes in
women's employment patterns have been influenced by a range of factors, including evolving
gender roles, demographic shifts and economic restructuring. Despite their broadly similar
political and economic systems, the rates and patterns of women's employment vary considerably
across industrialized countries. This variation raises questions about the role that government
policies play in influencing women's work decisions and, in turn, in shaping both gender equality
and family economic well-being.
Existing cross-national variation in both government policy and in patterns of maternal
employment provides a framework for assessing policy effects on employment outcomes. Both
incomplete theoretical specifications and data limitations, however, have constrained comparative
research on the role of policy in shaping maternal employment. Many analysts have failed to
clearly disaggregate family policies into policies that affect maternal employment and those with
largely unrelated effects . Policies that influence mothers' employment have been especially1
difficult to study cross-nationally because of the shortage of comparable data on institutional
features and expenditures.
This paper addresses these gaps by comparing fourteen industrialized countries with
respect to a subset of public "family policies" that facilitate the employment of mothers: parental
leave, child care, and the scheduling of public education. Data on eighteen measures of public2
policy effort are presented for fourteen countries. The data are then used to construct composite
indices of policy "packages" that support employment for mothers with children of different ages
and to compare countries' performances cross-nationally. Finally, levels of support for maternal
employment are contrasted with levels of income assistance for families with children. By
aggregating a range of policies that affect mothers' employment, while differentiating them from

2
family policies more generally, these comparisons reveal dramatic cross-national variation in both
support for the employment choices of mothers and in the ways that countries combine
employment support with income maintenance.
BACKGROUND
Defining Employment-Supporting Policies.
The policies examined in this study are a subset of family policies. Family policy is
typically defined broadly to include all government benefits that contribute to the health and well-
being of families with children through direct cash transfers (such as child allowances and
maternity benefits), tax expenditures (such as dependent tax credits), in-kind benefits (such as
housing) and direct services (such as public education and child care). Family policies can be
defined even more broadly to include other services, such as health care, that benefit all citizens
including families with children.
The diversity of family policy packages reflects cross-national differences in historical
origins, in contemporary policy goals, and in the use of alternative mechanisms aimed at achieving
the same goals. Public policies that support maternal employment may be adopted with the
explicit goal of increasing employment options; these policies may also be adopted in response to
largely unrelated social or economic needs, for example, in response to depopulation and/or
labour shortages. In different times and different places, for example, public child care has been
developed to enhance children's health and development, to achieve other social service goals, to
encourage childbearing and to facilitate mothers' employment (Ergas 1990; Kamerman 1991a,
1991b; Kamerman and Kahn 1991a, 1991b; OECD 1990b). Parental leave policies have been
adopted with the explicit goals of promoting infant health, securing employment opportunities for
women, providing income security for families, and reducing gender divisions in the allocation of
household work (Haas 1991; Kamerman 1980, 1991a; Stetson 1991).

3
Although all family policies are presumed to benefit both parents and children, the effects
of individual policies may affect family members differently. Children may benefit, for example,
from fewer hours of more educationally-enriching child care. Mothers may benefit from more
hours of less expensive custodial care. It is also important analytically to differentiate family
policies that benefit children by enabling mothers to work at home as full-time caregivers (e.g.,
family allowances) from those that enhance family income by supporting mothers' involvement in
paid work (e.g. paid maternity leaves).
The microeconomic theory of labour supply suggests one dimension along which family
policies can usefully be characterized: the extent to which policies support the option of
employment for women with dependent children. Policies may affect women's employment
decisions by encouraging unbroken labour force attachments around the time of childbirth, by
increasing the supply or reducing the cost of nonmaternal child care, or by providing de facto
child care via public school schedules that are compatible with parental employment.
Labour Supply Theory and Research.
The selection of variables for this study reflects microeconomic theory and empirical
research on the policy and non-policy factors that affect women's choices regarding the allocation
of their time between paid work and all other activities. Extending the basic consumption model,
labour supply is viewed as a consumption choice between two commodities -- market income and
time spent outside of paid work (i.e., non-market time). According to labour supply theory, a
woman faces a budget constraint determined by her market wage rate (i.e., the slope of the budget
constraint) and her other available income (i.e., her non-market or endowed income). Women
will choose the combination of market income and non-market time determined by the point of
tangency between the budget constraint and the highest possible indifference curve.3
The labour supply model suggests that the presence of children in the home will have an
impact on a woman's decision to work for pay and on her hours worked. Children are understood

4
to both raise the value that a woman places on her time outside of paid work (i.e., to steepen her
indifference curves) and to lower her effective market wages to the extent that substitute care
involves expenditures. The greater a woman's childrearing responsibilities, the less likely it is that
she will choose to enter paid work. For women who are employed, greater childrearing
responsibilities would reduce their hours in paid work. A substantial body of empirical research
supports these predictions with evidence of the negative effects of having young children on
maternal labour supply in industrialized countries (Connelly 1991; Gornick 1994; Knudsen and
Peters 1994; Leibowitz, Waite and Witsberger 1988; Mallier and Rosser 1986; Phipps 1993).
Labour supply theory also suggests ways that government policies may offset the
downward pressure that children exert on women's labour supply. Child care and parental leave
have received the greatest attention in empirical studies; recently, scholars have begun to examine
the relationship between public school schedules and maternal employment.
Child Care. The conventional labour supply model suggests at least two straightforward
approaches to the effects of child care on women's employment. The first approach depicts child
care as affecting women's preferences for non-market time versus time spent in paid work (Blau
and Ferber 1992). Theoretically, more satisfactory child care alternatives would decrease
mothers' preferences for time spent at home versus time spent in market work, all else equal. In
the second approach, features of child care affect women's budget constraints rather than their
relative preferences for home time (Connelly 1992; Michalopoulos, Robins and Garfinkel 1992;
Ribar 1992). The price of market child care may be viewed as a tax levied on mothers' hourly
wages. Higher-priced care would have the same effect as lower net wages -- a decrease in
employment and a decrease in hours of paid work among women.
The two theoretical approaches suggest that improvements in women's child care options
will be associated with increases in their labour supply. Single-country empirical studies suggest
that the relationships among the demand for child care, the price and availability of care, and
5
women's labour supply are complicated and multi-directional. On the whole, however, the
literature supports the theoretically-driven prediction that having more attractive child care
options increases maternal employment (Blau and Robins 1988; Connelly 1990, 1991, 1992;
Kimmel 1995; Leibowitz, Klerman and Waite 1992; Meyers 1993; Michalopoulos, Robins and
Garfinkel 1991; Ribar 1992; Stolzenberg and Waite 1984; U.S. General Accounting Office 1994).
In one of the few studies to address this question cross-nationally, Schmidt (1993) reported that
child care growth, from 1960 to 1980, was positively associated with increases in female
employment rates, across eighteen OECD countries.
Parental Leave. The relationship between maternal employment and parental leave
policies is understood differently than the relationship between maternal employment and child
care. Generous maternity leave provisions are generally believed to increase women's attachment
to paid work in the short term. In addition to offering basic income support to new mothers,
many maternity policies are explicitly designed to prevent women from exiting employment
following childbirth (Trzcinski 1991).
The relationship between elements of maternity leave and mothers' longer-term attachment
to paid work is more complicated. In contrast to child care, which enables mothers to spend more
time on the job, maternity leaves enable working mothers to spend more time at home -- even
though they usually remain officially "employed". Some scholars express concerns that policies
that enable long leave periods may limit certain career-enhancing opportunities that require a
degree of continuity on the job (e.g., opportunities for training and promotion). This constraint
may have a negative long-term effect on mothers' earnings, and in turn, on their labour supply.
On the other hand, to the extent that job guarantees and wage replacement lessen the probability
that mothers will exit paid work or change jobs following each childbirth, maternity provisions
would strengthen mothers' long-term labour market attachment,

6
The empirical literature on the effects of leave provisions on mothers' employment is
limited. O'Connell (1990) reports that the availability of employer-provided leave increases the
likelihood of an early return to work after the birth of a first child. Joesch (1995) concludes that
women's labour force attachment increases with the provision of paid leave. Klerman and
Leibowitz (1990), however, found only weak evidence of a relationship between United States'
state maternity leave statutes and employment. Using data from seventeen countries, Ruhm and
Teague (1995) conclude that the duration of paid parental leave is associated with increased
female employment rates. Others have reported, based on cross-national research, that elements
of child care and/or maternity leave policy affect not only women's labour force participation (and
employment) rates but their hours worked as well (Dex and Shaw 1986; Gornick 1994;
Gustafsson and Stafford 1995; Rosenfeld and Birkelund 1995).
Public School Schedules. School schedules can be a factor in mothers' employment
decisions because public school provides de facto child care for mothers of school-aged children.
Labour supply theory suggests that improvements in women's child care options will be associated
with increases in maternal labour supply. For mothers who rely on schools to provide child care
for their older children, "improvement" would include having children enrolled in public school for
more hours per day, for more weeks per year, and on schedules that are more consistent with
typical employment schedules.
The role of public schooling as child care has received increasing attention over the last
decade (e.g., Commission of the European Communities 1990; OECD 1990b). Some observers
(e.g., White 1983) have argued that child care problems may actually worsen during the early
school years. School vacations typically coincide with religious holidays and summer holidays,
and only imperfectly correspond to parents' breaks from paid work. If parents relinquish more
flexible child care arrangements when their children begin primary school, they may face even
greater problems coordinating childminding and paid work as their children age.

7
Although policy analysts are drawing attention to the role of school schedules in
employment decisions, empirical research on the topic is all but nonexistent. The Commission of
the European Communities (1990) reports that women with children aged five to nine have higher
activity rates in European countries that have continuous school days, compared with those with
school schedules characterized by attendance in shifts, short school days, or days broken by a
lunch break. In a study of four English-speaking countries, Gornick (1994) presents evidence of
sharp increases in mothers' employment rates that correspond to the age at which compulsory
education begins in each country.
Employment-Supporting Policies in Comparative Perspective.
There have been several efforts in recent years to compile information on family policies,
including child care and parental leave, in industrialized and developing countries. Comparative
studies take several forms. First, there are several compendia of quantitative and qualitative data
on program rules and/or expenditures . Compendia typically present information on large4
numbers of countries but with relatively little detail; none, unfortunately, contain data on child
care expenditures or on important parental leave details such as coverage and take-up rates.
Another important literature comprises volumes of country case studies that describe child care
and parental leave policies in great detail (Baker (1996); Cochran et al. (1993); Kahn and
Kamerman (1994); Kamerman and Kahn (1978 and 1994); Olmsted and Weikart (1989); Woodill
et al (1992)). While these case studies present rich historical, institutional, and programmatic
detail, it is difficult to use them to paint a comparative portrait because policy features are not
consistently measured. Finally, a number of scholars have compared the institutional detail of
family policies across several countries, focussing on either single policies or policy configurations
(Bradshaw et al 1993; Ergas 1990; Gauthier 1991; Gormley and Peters 1992; Gustafsson 1994;
Leira 1993; Scheiwe 1994; Wennemo 1994; Wilensky 1990). These studies provide important
insights about variation in the architecture of family policies, and about associated outcomes, such

8
as inequality and family poverty. Few have considered women's access to employment explicitly
as a policy goal.
In the last decade, feminist scholars have turned their attention to incorporating questions
of gender equality into welfare state theory and research. Recent works have focused on the
effects of family policies on a range of outcomes that are important to women, particularly
women's integration into the labour market and their economic independence vis-à-vis the family
(Lewis and Ostner 1991; O'Connor 1993; Orloff 1996; Sainsbury 1994; Siaroff 1994). This new
generation of scholarship has highlighted important subtleties in the impact of welfare state
policies on women's status as citizens, workers, and family members. The classic framing of
welfare state development in terms of the interaction between the state and the market is currently
giving way to more nuanced analyses that consider interdependencies among the state, market,
and family.
A focus on policies that disproportionately affect women is also evident in recent
challenges to welfare state regime theory. It is now commonplace for comparative scholars of the
welfare state to speak of clusters of countries, i.e., groups of countries with similar characteristics,
typically in relation to national-level public institutions. Esping-Andersen's (1990) empirically-
based model is the most well known. He posits the existence of three variants of the capitalist
welfare state -- the social democratic (primarily the Nordic countries), the conservative-
corporatist (dominated by the European continental countries) and the liberal (primarily the
English-speaking countries). Each regime type is characterized by a relatively similar set of social
policies and by corresponding socio-economic outcomes and employment patterns. Esping-
Andersen argues, specifically, that each welfare state model is associated with a distinct labour
market trajectory for women. Female employment levels would be expected to differ across
regime types, with high levels of female employment in the social democratic countries (in which
demand is driven by the large public sector and supply by extensive service provision); moderate
levels in the liberal countries (largely market-driven); and lower levels in the conservative-

9
corporatist countries (due to the historic marginalization of female workers and the existence of
policies that encourage mothers to remain in the home).
A small body of empirical work has challenged the Esping-Andersen cluster model by
focussing on intra-cluster variation in policies and outcomes with disproportionate importance for
women. Detailed comparisons of social policy across the Nordic countries, for example, reveal
significant variation in government support for maternal employment. This policy variation
corresponds to variation in female employment, with Norway diverging from the other social
democratic welfare states in having both lower levels of government support for the employment
of mothers and lower levels of maternal employment as well (Borchorst 1994; Leira 1992;
Sainsbury 1996). Gornick (1994) finds similar variation across four English-speaking countries,
with inter-country differences in maternal employment patterns corresponding closely to
differences in the generosity of public child care and leave provisions. Bussemaker and van
Kersbergen (1996) conclude that policy variation among the conservative regime countries leads
to divergent women's employment patterns between Belgium and Germany, on the one hand, and
Italy and the Netherlands, on the other.
RESEARCH ISSUES
The relationship between public policies and employment outcomes demands further
study; cross-national research designs are clearly promising because policy variations that cannot
be observed within a single country can be seen across countries. Comparative scholarship on the
effect of family policies on maternal employment has been limited both by the lack of comparable
data and by the use of policy variables that have been, paradoxically, operationalized either too
broadly (e.g., all spending on families) or too narrowly (e.g., child care variables alone).
A first important challenge for cross-national research is the disaggregation of family
policy. Although maternity leave, child care, and school policies are often subsumed under the
umbrella of family policy, they represent a specialized subset of all benefits provided to families

10
with children. To the extent that family policies, construed broadly, are directed toward goals
other than supporting maternal employment -- such as reducing family poverty or increasing
fertility -- this subset of policies may be weak even in countries with otherwise generous social
provisions for families.
A second important challenge is the aggregation of specific policy indicators into
measures of the larger packages of policies that affect maternal employment. Single policies are
poor indicators of overall government efforts to achieve complex policy goals. Some policies may
be near substitutes for one another; for example, direct spending on public child care and tax
expenditures that reduce the cost of private care may represent alternative strategies for the
achievement of a common goal. In other cases, the impact of policies is more nearly additive.
The generosity of maternity leave provisions, for example, depends both on the length of the leave
and on the average wage replacement rate during that period. Policies can interact in an even
more complex fashion. The overall generosity of maternity leave, for example, is mediated in
some countries by eligibility restrictions that narrow the pool of potential claimants. In the case of
family policies, interactions over time may also be important. For example, employed mothers
may face disruptive breakdowns in child care as their children age because public preschools
provide better coverage for young children than do intermittent school days for older children.
This study addresses these challenges by identifying, compiling and aggregating multiple
indicators of the subset of family policies that are expected to support maternal employment.
METHODS
Selection of Countries.
The fourteen countries in this study were selected to correspond to the core group of
micro-datasets included in the Luxembourg Income Study. The Luxembourg Income Study (LIS)
is a public access archive of micro-datasets gathered from a diverse set of industrialized countries
and made comparable. The datasets are based primarily on household surveys or tax records;

11
they contain demographic, employment, and detailed income data at the household and individual
level. The decision to link policy measures to micro-data available through LIS dictated both the5
countries to be included in this study and the year of initial observation. This paper presents
baseline policy data that corresponds to the second wave of the LIS micro-data, the period of
1984-1987.6
Selection of Policy Indicators.
Four criteria guided the final selection of the eighteen policy indicators included in this
study. First, the indicator measured an aspect of policy reasonably assumed to be under
government control. Maternal employment patterns are shaped by policy and non-policy factors,
and by both public and private sector policies. Non-policy factors include demographic
characteristics, wage and occupational structures, and prevailing norms about gender roles and
the care of children. Employment patterns are also influenced by the policies of private
employers, child care professionals, and other nongovernmental entities. This study concentrates
on indicators of public policies. Factors that influence labour market patterns but are only
indirectly under the control of governments, such as dominant beliefs about gender roles and
characteristics of private child care arrangements, are excluded.
Second, the indicator captured a policy feature that labour supply theory predicts will
affect a mother's decisions to enter or to remain in paid work. Public family policies typically
balance several competing goals. This analysis does not assume that support for maternal
employment was a primary or even explicit goal of the policies measured with each indicator.
Public child care may be provided, for example, for reasons related to child welfare or child
development. Regardless of the explicit or implicit policy goal, a larger supply of free or low cost
public child care is expected to increase the probability that mothers will enter employment.
Indicators included in this study are assumed to support mothers' decisions to enter or remain in
paid labour by (1) strengthening mothers' labour force attachments at the time of childbirth; (2)

12
increasing paternal involvement in child caregiving activities; (3) increasing the supply or reducing
the cost of non-parental child care; and/or (4) extending the time children are cared for in public
schools or by removing discontinuities in children's school schedules.
Third, the indicator was exogenous to individual employment decisions. Because
decisions about employment and child care arrangements may be simultaneous, specifying policy
measures that are exogenous to individual employment decisions is difficult. Measures included in
this study are limited to indicators of government policies that are logically independent or
precede the employment decisions of individual women. For example, the assumption here is that
enrollment in publicly-funded child care is a better measure of supply (because supply is set by
public policies and appropriations) than enrollment in all forms of non-parental care (which is a
function of both public policy and private family and market arrangements). The distinction is not
absolute. All family policies may reflect constituent demands for benefits that are consistent with
prevailing employment preferences and behaviours. For individual decision makers, however, the
availability of publicly-subsidized child care likely represents a fixed characteristic influencing
labour supply preferences and choices.
Fourth, reliable and reasonably comparable data were available for all of the fourteen
countries. There are two exceptions to this general rule. First, data on child care expenditures
were available in only six of the fourteen countries and, second, data on enrollments in publicly-
funded after-school child care were available in only six countries. Although data on these two
indicators were incomplete, they are included because they enhance cross-national comparisons
significantly. Other indicators that would be helpful for differentiating national performance, such
as the hours during which public child care is routinely available, were excluded because reliable
data were available for too few countries.
It is important to clarify that other public policies that potentially affect the labour supply
of women were excluded from this study. These policies, which extend beyond the traditional
boundaries of family policy, include: (1) income transfer rules, especially those that determine

13
benefit reductions associated with earnings; (2) public policies that encourage part-time work, for
example, through the adoption of worker protections (e.g., wage equity for part-time workers and
mandatory pro-rating of benefits) or through substantial demand for part-time workers in public
employment; (3) marginal tax rates and the tax treatment of spouses; and (4) the public provision
of health services and/or insurance for adults and their children.
These policies were excluded for a variety of reasons. First, income transfer rules,
especially rules on the withdrawal of means-tested benefits, are mostly likely to affect the labour
supply of lone mothers who are dependent on means-tested benefits. The labour market
behaviour of these mothers is very different from that of mothers whose primarily income sources
are family- and employment-based; this study emphasizes policies affecting the latter group, which
includes married mothers and lone mothers who do not substantially rely on income transfers.
Second, policies that increase part-time work clearly have mixed effects on women's employment
outcomes, in that they encourage employment but at limited hours and in a limited range of
occupations. This study is restricted to policies that facilitate both participation and hours and to
those that potentially widen (or at least do not constrain) occupational opportunities. Third,
marginal tax rates and the tax treatment of spouses are known to affect women's labour supply
but the effects of tax rules are largely differentiated according to women's marital status, not their
parenting status; the focus here is on policies that affect mothers' employment specifically.
Finally, policies that shape the availability of health services and/or insurance were excluded
largely due to data limitations; the labour supply effects of health benefits that are tightly linked to
employment, as in the United States, clearly demand further attention.
Data Sources and Operationalization of Indicators.
The eighteen indicators used in this study are described in Table 1. Data were collected
from published comparative reports and from country-specific sources. Sources of published data
for each country are presented in Appendix 5. In addition, policy experts in each country

14
reviewed preliminary findings and corrected data as necessary. The panel of experts for this study
is noted in Appendix 6.
The first six indicators measure policies that influence the generosity or availability of
benefits for new parents. The next eight indicators measure public efforts in the area of child care.
These eight include two measures of national child care expenditures (direct spending and tax
expenditures), two indicators of age-specific child care entitlements (through national legislation
or administrative policy) and four age-specific measures of public or publicly-subsidized child care
enrollments (as a proxy for the supply of low- or no-cost public care). Four final measures
capture public school policies that increase the supply of de facto child care through early school
enrollments and through school schedules that more closely correspond to the standard full-time,
full-year employment schedule.
Index Construction.
A set of indices were constructed from the eighteen indicators in order to capture policy
configurations that affect mothers with children of different ages. As necessary, country-specific
data were converted into common metrics: for example, expenditures were converted to 1987
United States dollars. Disparate indicators were rendered comparable by standardizing them as
percentages of maximum levels of policy effort (see Table 1). Supply of public child care, for
example, is standardized as the percentage of children in a given age range in public or publicly-
subsidized child care; maternity benefit duration is standardized as a percentage of fifty-two
weeks; school hours are standardized as a percentage of a typical forty-hour work week. In a few
instances, it was necessary to designate an absolute maximum based on empirically derived values.
For example, tax credits are standardized as a fraction of $2,600 in United States dollars, an
estimate of the minimum annual cost for full-time private child care in the United States in 1987.
In other cases, the presence of a policy, e.g., the availability of paternity benefits, was coded as

Table 1Measures Used in Indices, by Index
Policies that Support Employmentfor Mothers with
Measure Maximum Children Preschool- School-Effort Under Aged Aged
Three Children Children
Legislated Job Protection Yes =1 X
Paid Maternity Leave 52 Weeks X
Wage Replacement Rate 100% X
Coverage 100% X
Extended Leave na
Paternity Benefits Yes = 1 X
Child Care Expenditures na
Tax Relief for Child Care $2,600 X X X
Guaranteed Child Care Coverage (0-2) Ages 0-2 = X2
Guaranteed Child Care Coverage (3-5) Ages 3-5 = X2
Percent Children (0-2) in Publicly Funded 100% XChild Care
Percent (3-School-Age) Children in 100% XPublicly Funded Child Care
Percent (Age 5) Children in Preprimary 100% Xor School
Percent Children in Publicly Funded 100% XAfter-School Care
Age of Compulsory School Age 5 = 3 X
School Day 40 Hours X
School Year 260 Days X
Continuous School Day Yes = 1 X
Note: Two of the eighteen indicators in the database were not used in the indices. Extended leave wasomitted because the degree to which it is employment-enabling in the long run has not been established. In addition, child care expenditures were excluded due to data limitations.

15
one and its absence as zero. A more complete discussion of the index construction methodology
is provided in Appendix 1.
After individual indicators were converted into comparable units they were weighted and
summed into age-specific indices. Finally, numeric scores for each index were converted into
aggregate measures of maximum effort ranging from 0 to 100, with 100 representing 100 percent
of the maximum achievable score for this index. Table 1 presents the measures used in the
indices, by index; index formulas, values, and country rankings are reported in Table 5.
The first index, Policies that Support Employment for Mothers with Children under Six,
combines policies that support the employment option for mothers in the years between childbirth
and children's entry into public school: job protection at childbirth, the coverage and generosity of
maternity leaves, the availability of any paternity benefits, child care entitlements, the availability
of public child care, and tax relief for private child care. This index comprises two component
indices that are more finely defined by children's ages. The first of the two, Policies that Support
Employment for Women with Children under Three, combines eight indicators of public
provisions that protect women's employment and wages at the time of childbirth and that provide
alternatives to maternal care for infants and toddlers. The other component, Policies that Support
Employment for Mothers with Preschool-Aged Children, combines four indicators that reflect
government efforts to increase the supply of public child care for children from age three until
school enrollment.
A separate index, Policies that Support Employment for Mothers with School-Aged
Children, combines the length and continuity of the public school day, length of the school year,
and the availability of child care for older children (through public after school programs and tax
credits). Due to data limitations, only six countries are included in this final index.
Although the results for each index are presented in like units, index scores for individual
countries cannot be compared across indices. Values for individual items and for the indices as a
whole are very sensitive to the selection, coding, and standardization. Index scores can be
16
meaningfully compared only within individual indices. Comparisons of performances across
indices should be restricted to comparisons of countries' relative performances (i.e., their ranks).
Analysis.
The analyses in this paper are primary descriptive. Individual data elements measuring
parental leave, child care, and school schedules are first compared across the fourteen countries.
Age-specific indices are then analyzed to identify clusters of high- and low-performing countries
with respect to policy packages that support the decisions of mothers to enter or to remain in the
labour market. Country rankings are compared, within and across indices, to identify
discontinuities in policies supporting maternal employment for women with children of different
ages.
The final step in the analysis considers the role of employment-supporting policies in the
larger framework of national-level family policy. Countries' scores on the index of Policies that
Support Employment for Mothers with Children under Age Six are compared to their
performance on an aggregate measure of spending on family benefits: annual cash transfers per
child under age fifteen. Expenditure data are adapted from Kamerman and Kahn (1991b) and
include family and child allowances, public assistance benefits, and special family-related income
and housing allowance benefits . Expenditures on child care and parental leave benefits are not7
included.
FINDINGS
Policy Performance: Parental Leave, Child Care, School Schedules.
Parental Leave. As of the middle to late 1980's, all but three of the countries made near-
universal provisions for job protection and wage replacement in the months following the birth of
a child (see Table 2). The United States and Australia were the most prominent exceptions. The
United States had no national law providing job protection at the time of childbirth; in Australia,

Table 2Public Parental Leave Policies
Legislated Job Protection Paid Maternity Leave Wage Replacement Rate Coverage Extended Leave Paternity Benefits
Weeks % Wages % Employed Women Weeks
Country Data Notes Data Notes Data Notes Data Notes Data Notes Data Notes
Australia yes 12 (1/) 60% (5/) 10% (9/) 52 (12/) yes
Belgium yes 14 77% (6/) 100% 0 no
Canada yes 15 60% 100% 0 no
Denmark yes 18 90% 100% 10 yes
Finland yes 43 80% 100% 111 yes
France yes 16 84% 100% 140 yes
Germany yes 14 100% 100% 0 yes
Italy yes 20 (2/) 80% 100% 136 yes (15/)
Luxembourg yes 16 100% 100% 0 no
Netherlands yes 12 100% 100% 0 (13/) no
Norway yes 18 100% 100% 26 yes
Sweden yes 52 90% 100% 26 (14/) yes
United Kingdom yes 18 (3/) 46% (7/) 60% (10/) 22 no
United States no 6 (4/) 60% (8/) 25% (11/) 0 no
Note: Leave and wage replacement data refer only to those women covered under public or publicly mandated private maternity benefits.

17
federal law guaranteed up to twelve months of job protection but provided no wage replacement.
The United Kingdom also fell short relative to other countries, primarily because eligibility
restrictions (e.g., on minimum earnings and job tenure) were such that only approximately 60
percent of employed women had access to both job protection and wage replacement.
In the other countries, all or nearly all employed women were covered by national job
protection and wage replacement benefits. The length of protection and adequacy of wage
replacement varied substantially. On the high end, generous, universal systems in three Nordic
countries (Sweden, Finland and Norway) provided full or nearly full wage replacement for six
months to one year. In Finland, generous paid leave was supplemented with over two years of
extended, job-protected leave; in Sweden, parents had a right to unpaid leave until the child was
eighteen months old.
In about half of the countries, mothers' employment -- and paternal involvement in early
child care -- was facilitated by the extension of some form of paid or unpaid leave to fathers. In
general, countries with more extensive maternity benefits were more likely to provide benefits to
fathers. Some exceptions are notable. Australia, with very limited benefits for women, did extend
limited benefits to fathers as well. At the same time, a few countries with relatively generous
policies for mothers had made no provisions for fathers -- including Belgium, Luxembourg, and
the Netherlands.
Child Care. All fourteen countries made some public investments in child care. As with
parental leave policies, however, the form and intensity of support varied markedly (see Table 3).
Reasonably comparable data on direct child care expenditures were available for only six
countries. At the high end, Sweden spent $1,885 (in 1987 United States dollars) per year per
child under fifteen and Finland spent $1,212. At the low end, the United States and Canada each
invested less than $50 per child. Data were available for all countries on indirect tax expenditures
that are aimed at offsetting the cost of private household expenditures on child care. Tax relief

Table 3Child Care Policies: Public Support
Guaranteed Child Care Guaranteed Child Care
Tax Relief for Child Care Coverage (0-2) Coverage (3-5) Child Care Expenditures
1987 US Dollars Age (years) Age (years) 1987 US Dollars
Country Data Notes Data Notes Data Notes Data Notes
Australia $0 none none
Belgium $1,118 0-2 none
Canada $851 none none $43 (19/)
Denmark $0 0-2 (16/) 3-5 (16/)
Finland $198 0-2 (17/) 3-5 (17/) $1,212 (20/)
France $699 2 3-5 $630 (21/)
Germany $0 none none
Italy $0 none (18/) 3-5 (22/)
Luxembourg $599 none none
Netherlands $384 none none
Norway $342 none none $508
Sweden $0 >18 mo. 3-5 $1,885
United Kingdom $0 none none
United States $685 none none $44 (23/)
Note: Child Care Expenditures are separated from the table to stress the data's lower level of comparability (see notes for further explication).

Table 3Child Care Polices: Public Supply
% Children (0-2) in % Children (3-School-Age) % Children (Age 5) in % Children in Publicly Funded
Publicly Funded Child Care in Publicly Funded Child Care Preprimary or School After-School Care
Country Data Notes Data Notes Data Notes Data Notes
Australia 2% 26% 90% na
Belgium 20% 95% 99% na
Canada 5% (24/) 35% 98% na
Denmark 48% 85% 80% 29%
Finland 32% (25/) 59% (28/) 59% na
France 20% 95% 100% na
Germany 2% 78% 85% 4%
Italy 5% 88% 88% na
Luxembourg 2% 58% 99% 2%
Netherlands 2% 53% 99% na
Norway 12% 40% 50% na
Sweden 32% 79% (29/) 79% (29/) 34% (32/)
United Kingdom 2% 38% (30/) 100% <1%
United States 1% (26/) (27/) 14% (26/) (31/) 87% <1% (33/)
18
was available in eight countries. The generosity of these provisions varied from a high of $1,118
in Belgium to a low of $198 annually for one child in Finland (in 1987 United States dollars).
For the six countries with complete expenditure data, there is some evidence of a policy
tradeoff between direct and indirect expenditures. Those countries with the smallest direct
investments, the United States and Canada, were relatively generous in their provision of tax
assistance. Tax credits were low or nonexistent in Sweden and Finland, where direct investments
were high. The two middle-level countries, France and Norway, had moderate levels of spending
through both direct and indirect mechanisms.
An important indicator of government commitment to the provision of child care is the
adoption of national legislation that explicitly guarantees access to public or publicly-subsidized
care. By the late 1980s, only three of the fourteen countries -- Denmark, Finland, and Sweden --8
had adopted legislation that established child care as a right for all (or nearly all) children under
the age of six. France guaranteed child care to all children aged two to five; Belgium had
extended the promise of universal coverage to younger children (birth to age two) but not to older
preschool children. 9
In the provision of child care for infants, Denmark was the clear leader with 48 percent of
children under age three in publicly-supported care. Four additional countries (Belgium, Finland,
France and Sweden) also had relatively high rates of public provision, with 20 to 32 percent of
children under age three in care. Provision for children under age three fell substantially in the
remaining countries, with twelve percent of children in Norway and fewer than five percent of
children in the remaining countries enrolled in public or publicly-funded care.
Public child care provisions were more highly developed for preschool children. In four
countries (Belgium, Denmark, France and Italy), over 85 percent of children were in public day
care or preschools. At the other end of the spectrum, four countries (Australia, Canada, Norway
and the United Kingdom) enrolled only 25 to 40 percent of preschool children in publicly-
supported care. The United States again stands out as the exceptional case. Although use of all

19
forms of non-parental care is relatively high in the United States, the heavy reliance on private
arrangements and narrowly targeted means-testing for public benefits was evident in the
enrollment of fewer than 15 percent of preschoolers in publicly-supported care.
Levels of public child care arrangements for children begin to converge as children age
and school enrollment is considered. When child care and school enrollments are combined for
five year-old children, virtually all countries made public provisions for 80 to 100 percent of
children. Here, only Norway (50 percent) and Finland (59 percent) stand out.
Data on the supply of after-school child care for school-age children were available for
only six countries. In this group, Denmark and Sweden were once again the most generous, with
29 to 34 percent of children covered. After-school enrollments were much lower in the other four
countries for which data were available; estimates ranged from 5 percent to less than 1 percent in
Germany, Luxembourg, the United Kingdom and the United States.
Public School Schedules. The start of formal schooling marks an important transition for
families and an important shift in the structure of policies supporting mothers' entry into paid
labour. All of the industrialized countries provided universal access to government-sponsored
schools. Table 4 shows that the details of school scheduling varied.
Entry to school ranged from early enrollment at age five (in Luxembourg, the Netherlands
and the United Kingdom) to later enrollment by age six in most other countries. Finland,
Denmark and Sweden did not begin compulsory school until age seven. The number of school
days per year varied cross-nationally from 175 to 220; this represents a range of 45 additional
days or nine additional weeks of school.
Variation was also substantial in the average number of hours per week that children
attend school. Most countries appeared to tradeoff school attendance and the length of the

Table 4School Policies
Age of
Compulsory School School Hours School Year Continuous School Day
Age (years) Hours per Week (34/) Days per Year
Country Data Notes Data Notes Data Notes Data Notes
Australia 6 35 198 (39/) yes
Belgium 6 35 185 yes
Canada 6 35 180 yes
Denmark 7 21 (35/) 200 sometimes
Finland 7 25 190 yes
France 6 35 (36/) 175 no (42/)
Germany 6 25 213 (40/) no (43/)
Italy 6 27 (37/) 220 sometimes (44/)
Luxembourg 5 30 220 no (45/)
Netherlands 5 29 220 (41/) sometimes (46/)
Norway 6 30 190 yes
Sweden 7 30 (38/) 190 yes
United Kingdom 5 33 190 yes
United States 6 33 185 yes

20
school year. Countries with the longest weekly hours -- Australia, Belgium, Canada, France, the
United Kingdom and the United States all kept children in school from 32 to 35 hours each week
-- had short to moderate school years.
Low weekly school hours were particularly incompatible with employment schedules
when school schedules were also discontinuous. Children in two countries, Germany and
Luxembourg, were routinely sent home for lunch in the middle of the day. The typical school
week in Luxembourg was also disrupted by the scheduling of two half days during the week
(supplemented by a half-day Saturday session). In-school supervision for children during the
lunch period was inconsistent in Denmark, Italy and the Netherlands. France had one of the
longest school weeks (35 hours), but the schedule corresponded poorly to typical adult
employment hours because schools were routinely closed on Wednesday.
The Indices: Packaging Policies that Support Maternal Employment.
Individual policy indicators paint a complex portrait. It is difficult, however, to reach
general conclusions about the intensity of government support for maternal employment. Given
the extent to which different policies may substitute and interact, and the importance to employed
mothers of continuity in public supports, conclusions about policy achievement based on any
single indicator may be misleading. Composite indices provide more parsimonious measures of
relative country performance. By considering policies according to the ages of children affected,
these indices also provide a more complete and nuanced portrait of policy achievement.
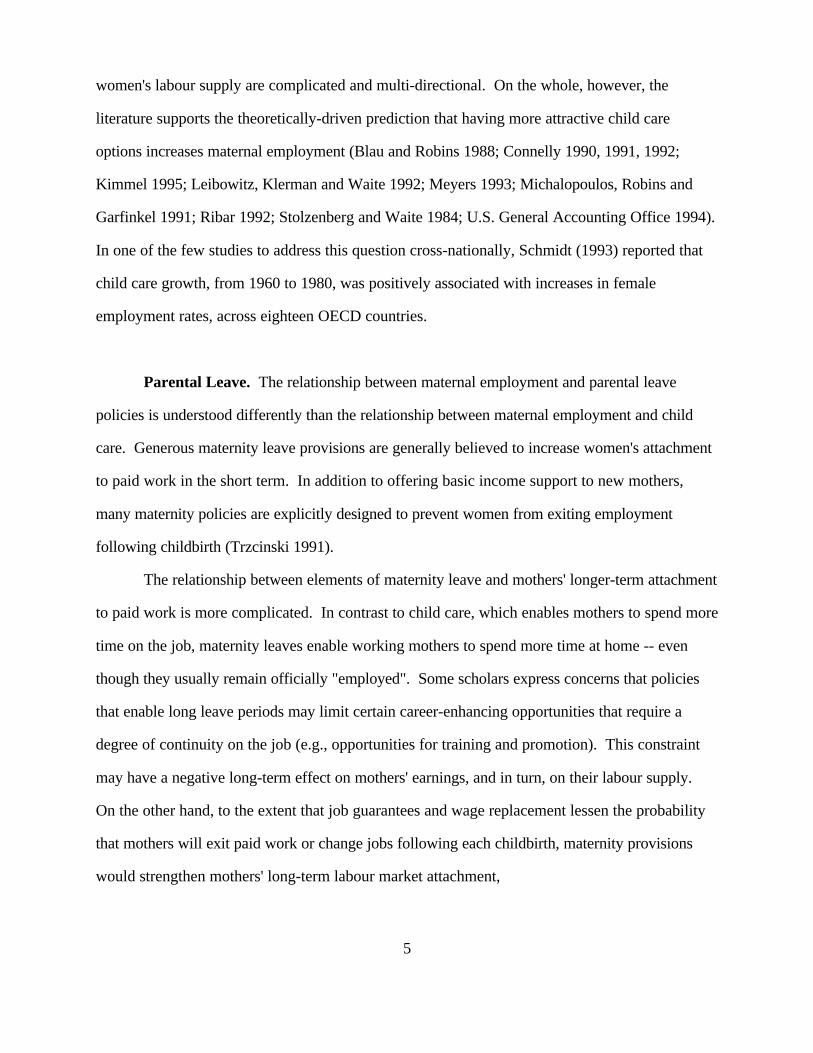
Policies Aimed at Children Under Age Six. Figure 1 uses the first index to compare the
intensity of government support for employment among mothers with children under the age of
six; index values are reported in Table 5. Three loose clusters are revealed. The six countries
with policies most supportive of maternal employment are France and three Nordic countries
(Finland, Denmark and Sweden), followed by Belgium and Italy. A middle tier of countries
Figure 1Policies that Support Employment for Mothers
Denmark
GermanyLuxembourg
Sweden
United Kingdom
United StatesAustralia
Belgium
Canada
Finland
France
Italy
NetherlandsNorway
0
10
20
30
40
50
60
70
80
90
100
Lev
el o
f E
ffor
t
With Children Under Six

Table 5Policies that Support Employment for Mothers: Index Values and Ranks
Policies for Mothers with Policies for Mothers with Policies for Mothers with Policies for Mothers with
Children Under Six Children Under Three Preschool-Aged Children School-Aged Children
Country Index Value Rank Index Value Rank Index Value Rank Index Value Rank
Australia 19.2 13 21.6 13 16.8 14
Belgium 55.6 5 60.0 4 51.3 6
Canada 32.4 9 34.7 10 30.1 9
Denmark 63.7 2 63.9 2 63.5 3 41.9 4
Finland 60.8 4 65.8 1 55.9 5
France 64.9 1 53.2 5 76.6 1
Germany 34.1 8 36.2 8 31.9 8 32.6 6
Italy 50.6 6 36.0 9 65.2 2
Luxembourg 35.2 7 36.3 7 34.1 7 41.4 5
Netherlands 32.0 10 34.0 11 30.1 10
Norway 31.2 11 41.4 6 20.9 12
Sweden 61.9 3 62.3 3 61.6 4 55.5 2
United Kingdom 21.6 12 22.0 12 21.3 11 54.6 3
United States 17.1 14 13.6 14 20.7 13 57.0 1
Note: Index scores were calculated using weighted combinations of the relevant indicators as follows:
Policies for Mothers with Children under Six
(Policies for Mothers with Children under Three + Policies for Mothers with Preschool-Aged Children )/2
Policies for Mothers with Children under Three
0.50[Legislated Job Protection + (Coverage )*( Paid Maternity Leave) + Wage Replacement Rate + Coverage +
0.50(Paternity Benefits )] + Tax Relief for Child Care + Guaranteed Child Care Coverage (0-2) + Percent Children
(0-2) in Publicly Funded Child Care
Policies for Mothers with Preschool-Aged Children
Tax Relief for Child Care + Guaranteed Child Care Coverage (3-5) + Percent Children (3 - School-Age) in
Publicly Funded Child Care + 0.33(Percent Children (Age 5) in Preprimary or School)
Policies for Mothers with School-Aged Children
Tax Relief for Child Care + Percent Children in Publicly Funded After School Care + 0.33(Age of Compulsory School)
+ School Day + School Year + Continuous School Day

21
includes a heterogeneous group of five countries -- Luxembourg, Germany, Canada, the
Netherlands and Norway. Three English-speaking countries -- Australia, the United Kingdom and
the United States -- were the least supportive of maternal employment. 10
Figure 2 compares the intensity of government support for mothers with infants to public
support for mothers with preschoolers. Several conclusions about continuity in employment-
supporting policies are suggested.
First, government support for maternal employment was fairly consistent for most (but not
all) countries across these age groups. The five countries that were the most generous in
provisions aimed at families with infants also provided generous benefits aimed at preschoolers as
well. The same is true at the other extreme: the three English-speaking countries with the
weakest provisions for infants remain clustered at the bottom in provisions for preschoolers.
Women in these three countries had less complete employment protections at childbirth, were less
likely to have wage protections during the following months, and had much more constrained
access to public child care.
Second, country ranks move within the loose clusters described above, suggesting subtle
differences in national policy emphases. France, for example, is among the high performers on
both indices, but is more supportive of employment for mothers of preschoolers. This shift
reflects the strong French commitment to nearly universal enrollment of children in l'ecoles
maternelle beginning at age three but somewhat limited parental leaves, the late addition of leave
benefits for fathers, and relatively modest rates of public child care provisions for infants. Finland
represents nearly the opposite case, shifting from the most generous in support of mothers with
infants to a position of poorer performance (relative to other countries) in provisions for
preschoolers. This reflects Finnish family policy, as of the middle to late 1980s, that emphasized
benefits for families with infants -- through both home care allowances and a child care
entitlement. Although there was a larger supply of public child care for preschoolers than for
infants, greater demand for care as children aged produced a larger gap between need and supply.

Figure 2Policies that Support Employment for Mothers
Australia
Australia
Belgium
Belgium
Canada
Canada
DenmarkDenmark
Finland
Finland
France
France
Germany
GermanyItaly
Italy
Luxembourg
Luxembourg
Netherlands
Netherlands
Norway
Norway
SwedenSweden
United Kingdom United KingdomUnited States
United States
0
10
20
30
40
50
60
70
80
90
100
Lev
el o
f E
ffor
t
With ChildrenUnder 3
With Preschool- Aged Children

22
Limited spaces in public child care for preschoolers were allocated on the basis of age and family
income.
Finally, more dramatic change in relative performance for two countries -- Norway and
Italy -- exemplifies serious discontinuities in policies. Norway declines markedly from providing
moderately generous benefits for infants to falling near the bottom in provisions for preschoolers.
During the late 1980s, Norway provided extensive and generous maternity leaves for employed
women, but those leave benefits were coupled with low levels of public child care provisions for
the under-threes, relatively modest investments in child care for preschoolers, and a late start on
compulsory education. Although mothers had generous support in the months after childbirth,
public support was limited once maternity leaves were exhausted. Italy's family policies
represented yet another combination: moderate support for mothers with infants and generous
provisions for those with preschool children. Italy provided generous maternity policies and
widespread preschool coverage for children over age three, with a significant gap in public child
care for infants and toddlers. During the period between the end of maternity benefits and the
beginning of public preschool at age three, Italian mothers faced significant barriers to
employment.
From the Preschool to the School Years: Policies for Families with Children Aged
Six to Twelve. Figure 3 depicts relative country performance on policies for mothers with
school-age children in the six countries for which complete data were obtained. Most salient here
is the dramatic shift in the composition of the more highly performing group: the three countries
with the most employment-supportive policies on this index are the United States, Sweden and
the United Kingdom. The United States and the United Kingdom score highly due to long weekly
school hours and continuous and regular school schedules; the United Kingdom also began
compulsory school at a young age (age five) and kept students in school for a relatively long
portion of the year. Sweden delayed compulsory schooling until age seven and had somewhat

Figure 3Policies that Support Employment for Mothers
Denmark
Germany
Luxembourg
SwedenUnited Kingdom
United States
0
10
20
30
40
50
60
70
80
90
100
Lev
el o
f E
ffor
t
With School-Aged Children

23
shorter school hours, but the potential disadvantage of these policies for employed mothers was
offset by extensive public after-school care.
The three lower-scoring countries for this age group -- Denmark, Germany and
Luxembourg -- had diverse policy packages. Average total weekly school hours in Denmark
were among the lowest in these fourteen countries and the age of compulsory schooling was
seven. The resultant downward pressures on maternal employment options were partially offset
by relatively high levels of after-school care. Luxembourg and Germany exemplify particularly
difficult policy combinations with respect to maternal employment. In these countries, the
combination of irregular school hours with low levels of public after-school care resulted in hours
of coverage that were substantially at odds with parental employment schedules, especially full-
time schedules.
Employment Support as a Component of the Family Policy Package.
The fourteen countries in this study varied dramatically in the generosity and continuity of
public support for maternal employment. These policies capture an important dimension of family
policy, but they represent only one component of the full package of benefits targeted on families
with children. Another crucial form of government support is cash transfers provided directly to
parents.
Figure 4 analyzes the relationship between family policy benefits provided through support
for maternal employment (the index of policies relevant to mothers with children under age six)
and through direct cash assistance (spending on child allowances and means-tested assistance).
Twelve countries for which complete data were available are compared.
About half of these countries made comparable commitments on both dimensions of
family policy. Denmark, France, and Sweden represent generous welfare states with policies that
provided extensive support for the employment of mothers and a generous system of direct
transfers to families. Germany and Norway represent the middle level on both dimensions:

Figure 4Policies that Support Employment for Mothers
By Family Transfers Per Child Under Age 15 (1984)(In 1980 U.S. Dollars, converted with OECD PPP series)
High Denmark(>$800) United Kingdom Netherlands France
Sweden
Medium($500-$799) Australia Germany
Norway
Low Finland($200-$499) United States Canada Italy
Low Medium High
Policies that Support Employment for Mothers with Children under Age Six
Notes: Comparable expenditure data for Belgium and Luxembourg not available.
Source for transfer data is Kamerman and Kahn 1991b.
Fam
ily T
rans
fers
Per
Chi
ld U
nder
Age
15

24
moderate and inconsistent support for maternal employment and medium levels of support
through direct family transfers. The United States was consistent in its lack of support for
families; direct income transfers were low and government support for mothers' employment was
extremely weak by international standards.
Another six countries represent mixed models of family support. Two extremes are
notable. The United Kingdom represents a “low employment-support/high cash transfers”
combination in which child care and parental leave policies were limited, but a combination of
universal and means-tested transfers provided relatively generous cash assistance to families.
Finland and Italy represent the contrasting “low cash transfers/high employment-support” package
of family benefits: a strong commitment to child care and maternity leaves but relatively low levels
of direct income assistance.
CONCLUSIONS
These indices reveal cross-national variation in public policies that support maternal
employment, both when considered alone and as part of a larger package of family support. This
policy variation is of substantive interest, because the adequacy of these policies affects both the
strength of women's labor force attachments and the economic well-being of families. The
patterns of cross-national variation are also of interest theoretically because they challenge
prevailing models of welfare regime types.
Labor market research indicates that women's employment rates and their patterns of
employment vary considerably across these same industrialized countries. OECD (1994) reports,
for example, widespread variation, with respect to women's ages, in labour force participation
rates in the late 1980s. In Finland, France and Sweden, women's participation patterns resembled
men's: their participation rates rose and fell smoothly with age, i.e., in an inverted U-shape. In
Germany and the Netherlands, in contrast, women's participation rates were highest among
women in their mid-twenties and they fell steadily from that point; this "left-peak" pattern

25
diverged markedly from the male pattern in these countries. In Australia and the United
Kingdom, women's rates rose, then fell (among women in their late-twenties), and then rose
again, in an "M-shaped" pattern that was once again unlike that of their male counterparts.
These data suggest that women's labour market behaviour varies across countries in
response to the addition of children into their lives. Other researchers, using multivariate designs,
also report that the magnitude of the negative effect of having young children on mothers' labour
supply varies across the industrialized countries (Gornick 1994; Knudsen and Peters 1994; Phipps
1993). The role that public policies play in shaping these labor supply responses remains largely
unmeasured. The policy indices presented in this paper provide an improved measure of the
policy variations that may underlie cross-national variation in mothers' employment patterns.11
For women with children below school-age, the most developed policy package combined
job protection and wage replacement at the time of childbirth, provisions for the care of infants
through extended leave and/or publicly subsidized child care, and support for the care of children
over age three in the form of public child care and/or early enrollment in public school. In the
middle-to-late 1980s, only five of the fourteen countries in this study had reasonably complete and
continuous provisions for this age group. In these countries -- Belgium, Denmark, Finland,
France and Sweden -- mothers would be able to enter and remain in full-time paid work with
minimal career disruptions and earnings losses due to child care responsibilities. Labour supply
theory and prior research would lead to a prediction of higher levels, and more continuous
patterns, of maternal employment in these countries; the OECD data suggest an employment
picture along these lines.
In the remaining countries, government provisions were far more limited and/or
discontinuous. In some countries, such as Germany and the Netherlands, moderately generous
maternity leave policies allowed women to leave the workplace at the time of childbirth without
severing their employment, but the lack of child care left them with few options for care after
leaves were exhausted. In these countries, women with children might be expected to

26
accommodate their family responsibilities by reducing their hours of employment or by exiting
employment altogether during the years between the end of maternity leaves and the beginning of
reliable child care through public centers or public schools. The "left-peak" pattern of women's
participation rates, reported by OECD, is consistent with a story of inadequate supports for
women who might otherwise choose to combine paid work and childrearing.
In a final group of countries, the English-speaking countries in this study, government
benefits were altogether limited. Without job protections and access to leaves, many women
workers faced stiff penalties for work absences due to childbirth; without publicly subsidized child
care, many had few viable alternatives to full-time maternal care of children. It is in these
countries that we would expect to observe the greatest disruptions in employment among mothers
with young children, i.e., where we expect to see employment patterns that are highly
differentiated by children's ages. The "M-shaped" pattern seen in some of these countries --
indicating a pattern of exit and re-entry -- suggests that women in these countries were
responding to inadequate supports by temporarily exiting the labor force.
The cross-national picture was very different with respect to policies for mothers with
school-aged children. There is evidence that countries with very strong commitments to policies
supporting maternal employment when children are young -- such as Sweden -- continue this
support through a combination of continuous school days and after-school child care. Much more
notable is the change in relative performance of the United States and the United Kingdom, which
emerge as strong performers with respect to school-aged children. Early school enrollments, long
school days and years are consistent with the historical commitment to free public education in
these countries. Provision of many hours of de facto child care may be an important byproduct of
these policies, and might enable mothers of older children to enter the labor market and/or to
extend their hours of paid work.
Policies that increase employment options directly enhance mothers' labor market
opportunities. These policies also have important and frequently overlooked implications for the

27
economic well-being of families. All of the industrialized countries in this study have social
insurance and social assistance programs designed to reduce the risk that families will fall into
poverty. In many, these programs have aimed to protect, augment, or replace the earnings of a
male breadwinner -- e.g., through unemployment insurance, child benefits, or lone parent
allowances. With the growing importance of women's earnings to household income -- in both
dual- and single-earner families -- policies affecting mothers' employment are an increasingly
important component of anti-poverty policy. Dramatic cross-national diversity in the economic
wellbeing of both families and children has been well-documented, and the role that income
transfers play in reducing poverty rates is well-understood (Rainwater and Smeeding 1995).
Much less appreciated is the effect of policies that support mothers' employment on reducing
poverty among families. The indices presented in this paper permit more complete analyses of
family benefit packages that combine both types of policies.
As shown in Figure 3, a few of the countries included in this study packaged generous
cash transfers to families with extensive supports for mothers' employment. Evidence of the
effectiveness of this package as a poverty-reduction strategy can be found in the low levels of
post-transfer child poverty, reported by Rainwater and Smeeding (1995) for the mid-to-late
1980s, in Denmark (3%), France (7%), and Sweden (3%) . The opposite extreme -- meager cash
transfers combined with few supports for continuous maternal employment -- likely contributed to
exceptionally high levels of poverty among children in the United States (22%) during this period.
More complex policy interactions may be observed in those countries that had "mixed" packages
of family supports. Several of these countries had child poverty rates in the middle of the range
seen in the industrialized countries -- including Australia (14%), Canada (14%), Italy (10%), and
the United Kingdom (10%) (Rainwater and Smeeding 1995) -- suggesting that the two policy
strategies may work in tandem to reduce family poverty.
This study also suggests a third direction for future empirical work -- the integration of
policies related to women's employment into research on welfare state regimes. As noted earlier,

28
Esping-Andersen's (1990) tripartite welfare state typology has dominated comparative analyses of
the welfare state in recent years. His work catalyzed a wave of feminist critiques of mainstream
welfare state research and it has provided a focal point for scholars seeking to integrate gender
into research on the determinants and effects of social policies. One of the most intriguing, yet
least developed, components of Esping-Andersen's work is the proposition that each welfare state
model is associated with a distinct labour market trajectory for women. While a few country
cases have been analyzed, neither Esping-Andersen nor his critics have used cross-national data
from a large sample of industrialized countries to systematically assess the extent to which each
welfare state model supports the employment of mothers.
The findings from this paper provide the outline of a new cross-national policy portrait.
The results reported here suggest that Esping-Anderson's clusters fail to cohere with respect to
policies that affect women's employment. As seen in Figure 1, the social democratic regime type
disaggregates as Norway diverges from the other social democratic countries (Denmark, Finland
and Sweden). The conservative countries reveal little commonality -- France and Germany
provide an especially sharp contrast -- and Canada pulls away from the other liberal countries
(Australia, the United Kingdom and the United States). These findings should motivate further12
empirical research aimed at reassessing the dominant welfare state typology by considering the
interplay between policy and women's employment patterns. Ideally, new research will focus on
both cross-cluster and intra-cluster variation in policy packages and in women's employment
outcomes.
In conclusion, this paper finds significant cross-national variation in government policies
that are understood to influence women's employment decisions by increasing viable alternatives
to full-time maternal childminding and thus reducing barriers to employment. The extent to which
women with children have institutional supports that enable them to choose the option of
employment, in turn, shapes both gender equality and the economic wellbeing of families with
children. Despite their importance, these policies -- and the economic, political and social

29
outcomes associated with them -- remain poorly understood. Existing cross-national variation in
the architecture and intensity of policies that support maternal employment provides a rich
opportunity and an important challenge for comparative scholarship and policy analysis.
30
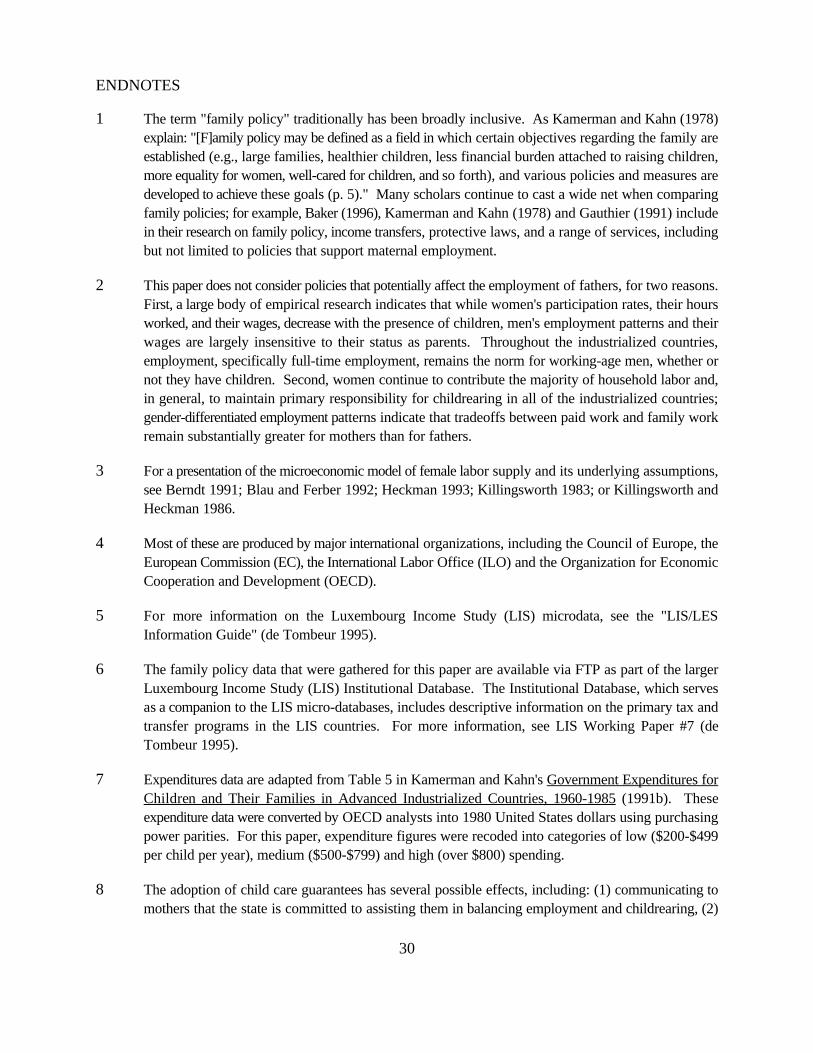
1 The term "family policy" traditionally has been broadly inclusive. As Kamerman and Kahn (1978)explain: "[F]amily policy may be defined as a field in which certain objectives regarding the family areestablished (e.g., large families, healthier children, less financial burden attached to raising children,more equality for women, well-cared for children, and so forth), and various policies and measures aredeveloped to achieve these goals (p. 5)." Many scholars continue to cast a wide net when comparingfamily policies; for example, Baker (1996), Kamerman and Kahn (1978) and Gauthier (1991) includein their research on family policy, income transfers, protective laws, and a range of services, includingbut not limited to policies that support maternal employment.
2 This paper does not consider policies that potentially affect the employment of fathers, for two reasons.First, a large body of empirical research indicates that while women's participation rates, their hoursworked, and their wages, decrease with the presence of children, men's employment patterns and theirwages are largely insensitive to their status as parents. Throughout the industrialized countries,employment, specifically full-time employment, remains the norm for working-age men, whether ornot they have children. Second, women continue to contribute the majority of household labor and,in general, to maintain primary responsibility for childrearing in all of the industrialized countries;gender-differentiated employment patterns indicate that tradeoffs between paid work and family workremain substantially greater for mothers than for fathers.
3 For a presentation of the microeconomic model of female labor supply and its underlying assumptions,see Berndt 1991; Blau and Ferber 1992; Heckman 1993; Killingsworth 1983; or Killingsworth andHeckman 1986.
4 Most of these are produced by major international organizations, including the Council of Europe, theEuropean Commission (EC), the International Labor Office (ILO) and the Organization for EconomicCooperation and Development (OECD).
5 For more information on the Luxembourg Income Study (LIS) microdata, see the "LIS/LESInformation Guide" (de Tombeur 1995).
6 The family policy data that were gathered for this paper are available via FTP as part of the largerLuxembourg Income Study (LIS) Institutional Database. The Institutional Database, which servesas a companion to the LIS micro-databases, includes descriptive information on the primary tax andtransfer programs in the LIS countries. For more information, see LIS Working Paper #7 (deTombeur 1995).
7 Expenditures data are adapted from Table 5 in Kamerman and Kahn's Government Expenditures forChildren and Their Families in Advanced Industrialized Countries, 1960-1985 (1991b). Theseexpenditure data were converted by OECD analysts into 1980 United States dollars using purchasingpower parities. For this paper, expenditure figures were recoded into categories of low ($200-$499per child per year), medium ($500-$799) and high (over $800) spending.
8 The adoption of child care guarantees has several possible effects, including: (1) communicating tomothers that the state is committed to assisting them in balancing employment and childrearing, (2)
ENDNOTES

31
increasing the total supply of child care, and (3) signaling to employers that mothers of young childrenwill be reliable employees, thereby reducing employers' reluctance to offer women opportunities fortraining and advancement.
9 Two other countries had developed policy in this area, but with such weak provisions that noentitlement to employment-supporting child care can be inferred. Italy had extended its guarantee ofchild care down to children under three, but with a service target so low (5 percent) and so poorlyfunded as to be meaningless. Germany had an entitlement for preschool children, but the programsto which it applied -- part-day, part-week preschool -- were poorly attuned to the working schedulesof employed parents.
10 An earlier study, by Wilensky (1990), included the construction of two indices -- for parental leaveand child care benefits -- for a sample of OECD countries during the period 1976-1982. Overall,Wilensky's index values on leave and child care are consistent with parallel indicators contained in thisstudy. Notably, this study scores Canada more highly (relatively) on child care provision and Norwaymuch lower; these discrepancies can be attributed to the inclusion here of tax relief as well as to policychanges over time. In both cases, the use here of continuous scoring and the inclusion of a largernumber of variables resulted in more variation across countries. For further information about therelationship between these two sets of indices, please contact the first author. Harold Wilenskygraciously provided information about his index construction methods and results.
11 See Gornick, Meyers and Ross (1996) for an analysis that links these indices with mothers' labormarket outcomes, specifically with employment patterns that are differentiated by the age of theyoungest child.
12 Gustafsson (1994) reaches the opposite conclusion -- that child care policy patterns can be predictedfrom Esping-Andersen's typology, but her analysis, based on three countries, is clearly preliminary.

32
REFERENCES
Allen, Mary J. and Wendy M. Yen. 1979. Introduction to Measurement Theory. Monterey, CA:Brooks/Cole Publishing.
Baker, Maureen. 1996. Canadian Family Policies: Cross-National Comparisons. Toronto:University of Toronto Press.
Behrman, Richard E. (Ed.) 1995. The Future of Children: Long-Term Outcomes of EarlyChildhood Programs. Vol 5(3). Los Altos, CA: The Center for the Future of Children.
Blank, Helen, Amy Wilkins and Margaret Crawley. 1987. State Child Care Fact Book 1987. Washington, DC: Children's Defense Fund.
Blau, David and Philip K. Robins. 1991. “Child Care Demand and Labor Supply of YoungMothers over Time,” Demography, 28: 333-351.
Blau, Francine D., and Marianne A. Ferber. 1992. The Economics of Women, Men, and Work. Englewood Cliffs: New Jersey: Prentice-Hall.
Bradshaw, J., J. Ditch, H. Holmes, and P. Whiteford. 1993. Support for Children: A Comparisonof Arrangements for Fifteen Countries. London: Department of Social Security.
Bussemaker, J. and K. van Kersbergen. 1996. “Gender Inequality and the Conservative WelfareState: A Four Nation Comparison.” Paper prepared for the 1996 Annual Meeting of theAmerican Political Science Association, San Francisco, August.
Cochran, Moncrieff (Ed). 1993. International Handbook of Child Care Policies and Programs. Westport, CT: Greenwood Press.
Cohen, Bronwen. 1993. "The United Kingdom." In Moncrieff Cochran (Ed.) InternationalHandbook of Child Care Policies and Programs, Cochran, Moncrieff. Connecticut: GreenwoodPress.
Commission of the European Communities. 1986. Comparative Tables of the Social SecuritySchemes in the Member States of the European Communities. 14th Edition. Brussels: Commission of the European communities.
Commission of the European Communities. 1990. Employment in Europe, 1990. Luxembourg:Office for Official Publications of the European Communities.

33
Committee on Ways and Means, United States House of Representatives. 1993. 1993 GreenBook: Background Material and Data on Major Programs Within the Jurisdiction of theCommittee on Ways and Means. Washington, DC: U.S. Government Printing Office.
de Tombeur, Caroline (Ed). 1995. LIS/LES Information Guide, revised edition, LuxembourgIncome Study, Working Paper No. 7.
Dex, Shirley, and Lois B. Shaw. 1986. British and American Women at Work: Do EqualOpportunity Policies Matter? London: Macmillan Press Ltd.
Esping-Anderson, Gosta. 1990. The Three Worlds of Welfare Capitalism. Princeton, NJ: Princeton University Press.
Ergas, Yasmine. 1990. "Child-Care Policies in Comparative Perspective," in OECD (Ed), Lone-Parent Families: The Economic Challenge. Paris: Organization for Economic Co-operation andDevelopment, pp. 173-99.
Estes, Richard J. 1984. The Social Progress of Nations. New York: Praeger.
Flora, Peter and Arnold J. Heidenheimer (Eds). 1981. The Development of Welfare States inEurope and America. New Brunswick, United States: Transaction Books.
Gauthier, Anne. 1991. "Family Policies in Comparative Perspective." Discussion Paper No. 5,Centre for European Studies, Nuffield College, Oxford.
Gormley, William T., Jr. and B. Guy Peters. 1992. "National Styles of Regulation: Child Care inThree Countries." Policy Sciences, 25: 381-399.
Gornick, Janet C. "Women, Employment, and Part-Time Work: A Comparative Study of theUnited States, the United Kingdom, Canada, and Australia" (Ph.D. Dissertation). Cambridge:MA: Harvard University, 1994.
Gornick, Janet C., Marcia C. Meyers, and Katherin E. Ross. 1996. "Public Policies and theEmployment of Mothers: A Cross-National Study." Luxembourg Income Study (LIS) WorkingPaper 140, Luxembourg: LIS. June.
Gustafsson, Siv S. 1994. "Childcare and Types of Welfare States" In Diane Sainsbury (Ed),Gendering Welfare States. Thousand Oaks, CA: Sage, pp. 45-61.
Gustafsson, Siv S. and Frank P. Stafford (1995) “Links Between Early Childhood Programs andMaternal Employment in Three Countries,” The Future of Children: Long-Term Outcomes ofEarly Childhood Programs 5(3): 161-174.

34
Haas, Linda. 1991. "Equal Parenthood and Social Policy: Lessons from a Study of ParentalLeave in Sweden." In J.S. Hyde and M.J. Essex, (Eds), Parental Leave and Child Care: Setting aResearch and Policy Agenda. Philadelphia, PA: Temple University Press.
Hantrais, Linda and Steen Mangen (Ed). 1994. “Family Policy and the Welfare of Women.” Cross-National Research Papers, Third Series, London: The Cross-National Research Group. March.
Hayes, Cheryl, Palmer, John, and Martha Zaslow (Editors). 1990. Who Cares for America'sChildren? Child Care Policy for the 1990s. Washington, D.C.: National Academy Press.
Hofferth, Sandra L., April Brayfield, Sharon Deich, and Pamela Holcomb. 1991. National ChildCare Survey, 1990, Urban Institute Report 91-5, Washington, DC: The Urban Institute Press.
International Labour Office. 1994. Conditions of Work Digest: Maternity and Work. Volume13. Geneva: International Labour Office.
Joesch, Jutta M. 1994. “Children and the Timing of Women’s Paid Work After Childbirth: AFurther Specification of the Relationship,” Journal of Marriage and the Family, 56: 429-440.
Joesch, Jutta M. 1995. “Paid Leave and the Timing of Women’s Employment SurroundingBirth,” Paper prepared for the Annual Meeting of the Population Association of America, SanFrancisco, April 1995.
Joshi, Heather and Hugh Davies. 1994. “Mothers’ Forgone Earnings and Child Care.,” In LindaHantrais and Steen Mangen (Ed). “Family Policy and the Welfare of Women.” Cross-NationalResearch Papers, Third Series, London: The Cross-National Research Group, pp. 9-25.
Kahn, Alfred J. and Sheila B. Kamerman. 1994. Social Policy and the Under-3s Six CountryCase Studies: A Resource for Policy Makers, Advocates and Scholars. Cross-national StudiesResearch Program, Columbia University, New York.
Kamerman, Sheila B. 1991a. "Parental Leave and Infant Care: United States and InternationalTrends and Issues, 1978-1988." In J.S. Hyde and M.J. Essex, (Eds), Parental Leave and ChildCare: Setting a Research and Policy Agenda. Philadelphia, PA: Temple University Press.
Kamerman, Sheila B. 1991b. "Child Care Policies and Programs: An International Overview."Journal of Social Issues, 42(2):. 179-196.
Kamerman, Sheila B. 1980. Maternity and Parental Benefits and Leaves. Impact on PolicySeries, Monograph No. 1. Columbia University: Center for the Social Sciences.

35
Kamerman, Sheila B. and Alfred J. Kahn. 1994. "A Welcome for Every Child: Care, Education,and Family Support for Infants and Toddlers in Europe." Arlington, VA: Zero to Three/NationalCenter for Clinical Infant Programs.
Kamerman, Sheila B. and Alfred J. Kahn. 1991a. Child Care, Parental Leave, and the Under 3s: Policy Innovation in Europe. New York: Auburn House.
Kamerman, Sheila B. and Alfred J. Kahn. 1991b. "Government Expenditures for Children andTheir Families in Advanced Industrialized Countries, 1960-85." UNICEF Innocenti OccasionalPapers, Economic Policy Series, Number 20, Florence, Italy.
Kamerman, Sheila B. and Alfred J. Kahn. 1978. Family Policy, Government and Families inFourteen Countries. New York: Columbia University Press.
Kamerman, Sheila B., Alfred J. Kahn, and Paul Kingston. 1983. Maternity Policies and WorkingWomen. New York: Columbia University Press.
Klerman, Jacob A. and Arleen Leibowitz. 1990. “Child Care and Women’s Return to WorkAfter Childbirth,” The American Economic Review, 80: 284-288.
Leibowitz, Arleen, Klerman, Jacob Alex, and Linda J. Waite. 1992. "Employment of NewMothers and Child Care Choice: Differences by Children's Age". The Journal of HumanResources. 27(1):112-33.
Leira, Arnlaug. 1993. "Combining Work and Family: Working Mothers in Scandinavia and in theEuropean Community." Paper prepared for the ISA Conference on Comparative Welfare Statesin Transition, Oxford.
Lewis, Jane, and Ilona Ostner. 1991. "Gender and the Evolution of European Social Policies." Paper prepared for Center for European Studies Workshop on "Emergent Supranational SocialPolicy: The EC's Social Dimension in Comparative Perspective", Nov. 15-17.
Mayer, Robert R. and Ernest Greenwood. 1980. The Design of Social Policy Research. Englewood Cliffs, NJ: Prentice-Hall.
Michalopoulos, Charles, Robins, Philip K., and Irwin Garfinkel. 1992. "A Structural Model ofLabor Supply and Child Care Demand." The Journal of Human Resources. 27(1):166-203.
Mitchell, Deborah. 1993. “Sole Parents, Work, and Welfare: Evidence from the LuxembourgIncome Study.” University of New South Wales Social Policy Research Centre Reports andProceedings No. 106.

36
Moss, Peter. 1990. "Childcare in the European Communities 1985-1990." EuropeanCommission Childcare Network, Women of Europe supplements, Report #31. Brussels: Commission of the European Communities.
O’Connell, Martin. 1990. “Maternity Leave Arrangements: 1961-85,” in Work and FamilyPatterns of American Women. Current Population Reports, Special Studies Series P-23, No. 165: 11-27.
O'Connor, Julia S. 1993. "Labour Market Participation in Liberal Welfare States Regimes --Issues of Quantity and Quality." Paper prepared for International Sociological AssociationConference on Comparative Research on Welfare States in Transition, University of Oxford, 9-12September.
Olmsted, Patricia P. and David P. Weikart (Eds). 1989. How Nations Serve Young Children: Profiles of Child Care and Education in 14 Countries. Ypslanti, MI: The High Scope Press.
Orloff, Ann Shola. 1993. "Gender and The Social Rights of Citizenship: The ComparativeAnalysis of Gender Relations and Welfare States". American Sociological Review, Vol. 58, June,303-328.
OECD. 1989. "Education in OECD Countries 1986-1987: A Compendium of StatisticalInformation". Paris: Organisation for Economic Co-Operation and Development.
OECD. 1990a. "Education in OECD Countries 1987-1988: A Compendium of StatisticalInformation". Paris: Organisation for Economic Co-Operation and Development.
OECD. 1990b. "Child Care in OECD Countries." Chapter 5 in Employment Outlook. Paris: Organisation for Economic Co-Operation and Development.
OECD. 1992. Employment Outlook. Paris: Organisation for Economic Co-Operation andDevelopment.
OECD. 1994. Women and Structural Change: New Perspectives. Paris: Organisation forEconomic Co-Operation and Development.
Presser, Harriet. 1980. "Child Care as a Constraint on Employment: Prevalence, Correlates, andBearing on the Work and Fertility Nexus." American Journal of Sociology, Vol. 85, No. 5,1203-13.
Ragin, Charles C. 1994. Constructing Social Research. Thousand Oaks, CA: Pine Forge Press.
Rainwater, Lee and Timothy Smeeding. 1995. "Doing Poorly: The Real Income of AmericanChildren in Comparative Perspective." Luxembourg Income Study (LIS) Working Paper #127. Luxembourg: The Luxembourg Income Study.

37
Ribar, David C. 1992. "Child Care and the Labor Supply of Married Women: Reduced FormEvidence." The Journal of Human Resources. 27(1):134-65.
Robins, Philip K. 1988. "Federal Support for Child Care: Current Policies and a Proposed NewSystem." Focus, 11(2): 1-9.
Ruhm, Christopher J. and Jacqueline L. Teague. 1995. “Parental Leave Policies in Europe andNorth America,” Paper prepared for ILR-Cornell Institute for Labor Market Policies Conference,Gender and Family Issues in the Workplace, Ithaca, April 1995.
Sainsbury, Diane. 1994. "Women's Rights and Men's Social Rights: Gendering Dimensions ofWelfare States." In Diane Sainsbury (Ed), Gendering Welfare States. Thousand Oaks, CA: Sage,pp. 150-169.
Sainsbury, D. 1996. “Gender Inequality and the Social Democratic Welfare State Regime.” Paper prepared for the 1996 Annual Meeting of the American Political Science Association, SanFrancisco, August.
Scheiwe, Kirsten. 1994. "Labour Market, Welfare State, and Family Institutions: The Links toMothers' Poverty Risks." Journal of European Social Policy, 4:201-24.
Siaroff, Alan. 1994. "Work, Welfare, and Gender Equality". In Diane Sainsbury (Ed),Gendering Welfare States. Thousand Oaks, CA: Sage, pp. 82-100.
Smeeding, Timothy, Sheldon Danziger, and Lee Rainwater. 1995. "The Western Welfare Statein the 1990s." Luxembourg Income Study (LIS) Working Paper #128. Luxembourg: TheLuxembourg Income Study.
Stetson, Dorothy McBride. 1991. "The Political History of Parental Leave Policy." In J.S. Hydeand M.J. Essex, (Eds), Parental Leave and Child Care: Setting a Research and Policy Agenda. Philadelphia, PA: Temple University Press.
United Nations. 1991. The Sex and Age Distribution of Population.
United States Department of Health and Human Services. 1987. Social Security ProgramsThroughout the World--1987. Social Security Administration Research Report #61. WashingtonDC: United States Government Printing Office.
United States General Accounting Office. 1994. Child Care Subsidies Increase Likelihood thatLow-Income Mothers Will Work, GAO/HEHS-94-87 (Washington, DC: GAO).
Wennemo, Irene. 1994. Sharing the Costs of Children: Studies on the Development of FamilySupport in the OECD Countries. Stockholm: Swedish Institute for Social Research DissertationSeries #25.

38
Wilensky, Harold L. 1990. "Common Problems, Divergent Policies: An 18-Nation Study ofFamily Policy." Public Affairs Reports, 3:31, Institute of Government Studies, University ofCalifornia at Berkeley.
Wilensky, Harold. 1975. The Welfare State and Equality: Structural and Ideological Roots ofPublic Expenditures. Berkeley, CA: University of California Press.
White, Julie. 1983. Women and Part-Time Work. Ontario: Canadian Advisory Council on theStatus of Women.
Woodill, Gary, et al. 1992. International Handbook of Early Childhood Education. New Yorkand London: Garland Publishing.

APPENDIX 1Index Construction
Index Components.
The first index, Policies that Support Employment for Mothers with Children under Six,
comprises two component indices. One, Policies that Support Employment for Mothers with
Children from Birth to Three, combines eight indicators measuring provisions that protect
women's employment and wages at the time of childbirth and that provide alternatives to maternal
care for infants and toddlers. Four indicators of the generosity and coverage of maternity leaves
are included and weighted by one-half to reflect the limited period of time that they are available
(typically the first 12 to 18 months after childbirth). The generosity of national child care
provisions is measured through the inclusion of indicators for a national child care entitlement, the
generosity of child care tax credits or deductions, and the supply of public child care for children
under three. A final indicator, whether any leave is available to fathers (coded as yes or no), is
included as a measure of both the generosity of parental leave and the availability of non-maternal
child care and weighted by half to reflect its indirect relationship to mothers' employment
decisions.
The other component of the first index, Policies that Support Employment for Mothers
with Preschool-Aged Children, combines four indicators that reflect government efforts to
increase the supply of public child care. Tax expenditures and the existence of a child care
entitlement for children between three and five are included, along with enrollments in public or
publicly-subsidized child care for this age group. To adjust for the impact of the age of school
enrollment on parents' need for child care, a fourth variable is included to measure the percentage
of five year old children enrolled in publicly-supported child care, preprimary, or primary school.
This measure was weighted by one-third to reflect the fact that five year old children make up
approximately one-third of the children in this age group. The final index measures Policies
that Support Employment for Mothers with School-Aged Children. The importance of the
correspondence of school schedules to regular employment hours dictated the inclusion of

measures for the age of compulsory schooling and the length and continuity of public school
schedules. The compulsory school-age variable is weighted by one third since variation in school
starting-age affects only a fraction of school-age children. Because employed parents also need
child care during the hours when school is not in session, the index also includes measures for tax
expenditures and enrollments in public after-school care. Due to severe limitations in data on
after-school enrollments, it was possible to include only six of the original countries in this index.
Methodological Considerations.
Measures of national policy intent, performance and/or achievement are generally
aggregated for comparative analyses using one of three approaches: (1) individual variables are
standardized and combined additively to form composite scales, with or without weighting; (2)
country values are ranked and the ranks are summed or averaged, across variables; or (3) values
are grouped to form qualitative typologies.
The first option involves standardization, for example, by calculating z-scores or
converting all values to proportions (e.g., Estes 1984). Standardization has a number of
advantages for data aggregation. Most obviously, by converting all data to a single metric (e.g.,
standard deviations from the mean), diverse measures of a single underlying phenomenon -- in our
case, employment-enabling public policy -- can be added together to produce a cumulative score
which captures both the magnitude and the distribution of individual components (Ragin 1994).
Because standardized scores are linear transformation of raw data, however, this approach
assumes that included data have meaningful intervals (Allen and Yen 1979). If the data do not
have meaningful intervals (e.g., they are simply ordinal) composite indices based on combining
scaled variables will be difficult to interpret.
Since policy data do not always lend themselves to the use of z-scores or other
standardization techniques, some cross-national researchers reduce all indicators to country ranks.
This allows consistent treatment of data that were originally measured using a combination of
continuous and categorical values. Items may be ranked separately, based on a theoretically

derived and imposed scale or based on the value of the data themselves (actual values or standard
deviations from the mean). A composite index can then be constructed by summing or averaging
ranks across individual indicators. If ranks on multiple items are combined into an aggregate
score, similar assumptions must be made about ordered values that measure intensity on the same
underlying continuum. Because ranking does not impose any form of standardization on
individual items, however, assumptions about the underlying distribution of values can be relaxed.
This method has the corresponding disadvantage of losing important information about the
dispersion of data and variance in the individual and aggregated values.
When assumptions about the continuous or ordinal structure of measures are not
warranted, scholars often rely on a third option -- the use of descriptive typologies. Typologies
can incorporate both ordered and unordered categorical data. Because they do not require
assumptions about either ordered values or normally distributed data, typologies can be useful for
developing complex, non-linear classification schemes (Mayer and Greenwood 1980). Although
descriptively rich, typologies lose considerable information about both the range and the
magnitude of values in the separate measures, and about relative performance using composite
measures.
Standardization Using Proportions.
We decided to standardize the indicators, or variables, presented in Part II, so that we
could add them in various combinations to construct composite indices. By standardize, we refer
to the process of adjusting all variables such that both their magnitudes and their distributions are
meaningfully comparable. Because standardization and aggregation involve decisions that can
have substantial implications for the interpretation of results, the following section summarizes in
some detail the core decision that we made with respect to standardization.
Two common techniques for standardizing variables with different original metrics are (1)
the use of z-scores or (2) the use of proportions relative to variable-specific maximums (e.g.,
Estes 1984). The common z-score approach makes strong assumptions, i.e., that untransformed

data have meaningful intervals and that they are normally distributed in the underlying population
(Allen and Yen 1979). If these assumptions are not met, standardization using z-scores may lead
to spurious conclusions driven by unusual distributions in the sample data.
Based on our assessment of the analytic questions and the data for this study, we chose to
construct additive scales using a set of indicators, each of which are standardized as proportions
of variable-specific maximum values. We chose to standardize using proportions of specified
maximum values, rather than using z-scores, because it allows a more intuitive interpretation of
values (as performance relative to an indicator of maximum effort) and makes fewer assumptions
about interval measures or the normality of the underlying distribution. The variables selected for
inclusion in the indices included continuous and ordered categorical data, but we were willing to
assume that the intervals for the ordered variables have a theoretically meaningful interpretation.
By comparing each country's performance against an absolute rather than relative measure of
maximum performance, we are able to characterize national policy efforts and achievements both
individually and comparatively. Furthermore, we leave open the possibility of adding additional
countries in future iterations of the indices.
Standardization of each measure against maximum performance required careful
specification of minimum and maximum values for each variable. Table 1 summarizes the basis
for standardizing each variable. In most instances, these values were obvious: e.g., child care
enrollments, wage replacement rates, and maternity benefit coverage could all be meaningfully
measured as percentages. Other variables required specification of maximum effort on more
theoretical grounds. For most, we were able to identify a logical value: e.g., weeks of maternity
leave as a percentage of a full year (52 weeks), school hours as a percentage of a full-time work
week (40 hours), or child care guarantees as ordered values from none (0) to partial (.5) or full
coverage (1.0) of the age group. A final set of variables required specification of a maximum
based on observed performance levels: e.g., tax relief is measured as a fraction of U.S. $2,600,
which is our calculation of the minimum annual cost for full-time private child care in the United
States in 1987.

To gauge the impact of methodological choices on our conclusions, we conducted
sensitivity analyses for all three indices to compare conclusions about comparative performance
when individual indicators were aggregated using three methods: 1) z-scores, 2) standardization
using proportions, and 3) unstandardized ranking. For nearly all combinations of variables,
conclusions about relative country performance were not sensitive to the aggregation method.

Appendix 2Policy Data: Years of Reference
Current Anticipated
Australia (AS) 1986 1990
Belgium (BE) 1985 1992
Canada (CN) 1987 1991
Denmark (DK) 1987 1992
Finland (FI) 1987 1991
France (FR) 1984 1989
Germany (GE) 1984 1989
Ireland (IR) 1987 1992
Italy (IT) 1986 1991
Luxembourg (LX) 1985 1991
Netherlands (NL) 1987 1991
Norway (NW) 1986 1991
Sweden (SW) 1987 1992
United Kingdom (UK) 1986 1991
United States (US) 1986 1991

Appendix 3Eighteen Measures of Policies that Support Employment for Mothers
Public Parental Leave Policies
Measure/Definition Metric/Notes
Legislated Job ProtectionLegislation that guarantees that women can (yes/no)retain their jobs at the time of child birth.
Paid Maternity LeaveWeeks during which women are entitled to (weeks)full or partial replacement of wages at the timeof childbirth.
Wage Replacement RateAverage rate at which wages are replaced (percent of wages)during the maternity leave period (above).
Where rate varies with time, we calculate aweighted average.
Excludes maternity grant, birth grant, andlump-sum.
CoveragePercentage of employed women eligible for (percent of employed women)paid maternity leave under public or publiclymandated private maternity benefits. Excludes maternity grant, birth grant, and
lump-sum.
Extended LeaveAdditional weeks of job-protected leave (paid (weeks)or unpaid) to which women are entitled afterthe exhaustion of any paid maternity leave.
Paternity BenefitsFathers entitled to any parental leave. (yes/no)

Appendix 3Eighteen Measures of Policies that Support Employment for Mothers
Public Support for Child Care
Measure/Definition Metric/Notes
Child Care ExpendituresNational and local government public (1987 U.S. Dollars)expenditures for substitute child care. Measure excludes tax expenditures (as below) Expenditures for public child care programsand family/child allowances. and subsidies to private child care providers
(national, local, and total) per child aged 0 toschool age.
Tax Relief for Child CareTax exemptions or tax credits on national (1987 U.S. Dollars)income taxes which are provided specificallyfor substitute care for children. Maximum benefit which is available to a
family with a full-time worker earning theaverage primary worker (APW) wage andwith one child under 6.
Guaranteed Child Care Coverage (0-2)Ages of children from birth to third birthday (ages covered)guaranteed access to child care throughnational legislation or executive policy. Countries are considered to have a guarantee
when legislation or policy sets targets whetheror not full coverage has been achieved.
Guaranteed Child Care Coverage (3-5)Ages of children from three to sixth birthday (ages covered)guaranteed access to child care throughnational legislation or executive policy. Countries are considered to have a guarantee
when legislation or policy sets targets whetheror not full coverage has been achieved.

Appendix 3Eighteen Measures of Policies that Support Employment for Mothers
Public Supply of Child Care
Measure/Definition Metric/Notes
Percent Children (0-2) in Publicly FundedChild CarePercent of children from birth to third birthday (percent of children aged 0-2)enrolled in public child care centers or publiclysubsidized private arrangements. Includes enrollments in all forms or regulated
care: child care centers, family child care,preschool and nursery schools. Excludes:nannies, playgroups, and baby-sittersregardless of funding source.
Percent Children (3-School-Age) inPublicly Funded Child CarePercent of children between the ages of 3 and (percent of children aged 3-school age)compulsory school age who are enrolled inpublic child care centers or publicly subsidized Includes enrollments in all forms or regulatedprivate arrangements. care: child care centers, family child care,
preschool and nursery schools. Excludesnannies, playgroups, and baby-sittersregardless of funding source.
In the three countries with compulsory schoolat age five, this measure includes enrollmentsfor 3 and 4 year old children only.
Percent Children (Age 5) in Preprimary orSchoolPercent of children age 5 enrolled in (percent of 5 year old children)preprimary or school programs
Percent Children in Publicly Funded After-School CarePercent of children under 12 who are enrolled (percent of children under 12)in publicly funded after-school care. Includeschildren who have access to care in extended-day school programs.

Appendix 3Eighteen Measures of Policies that Support Employment for Mothers
School Policies
Measure/Definition Metric/Notes
Age of Compulsory SchoolAge of compulsory education. (age in years)
School DayHours in typical public school schedule (hours per week)
Includes lunch period if supervision isprovided. Represents average school day,without adjusting for part-day Saturdayschedules. If school schedules vary withchildren’s ages, the schedule for the youngestchildren of compulsory school age is used.
School YearDays per year in the public school calendar. (days per year)
School days per week multiplied by weeks inthe school year (excluding scheduled holidayperiods).
Continuous School DayTypical public school schedule includes (yes/no)supervision of children during the lunch breakand is continuous from Monday throughFriday.
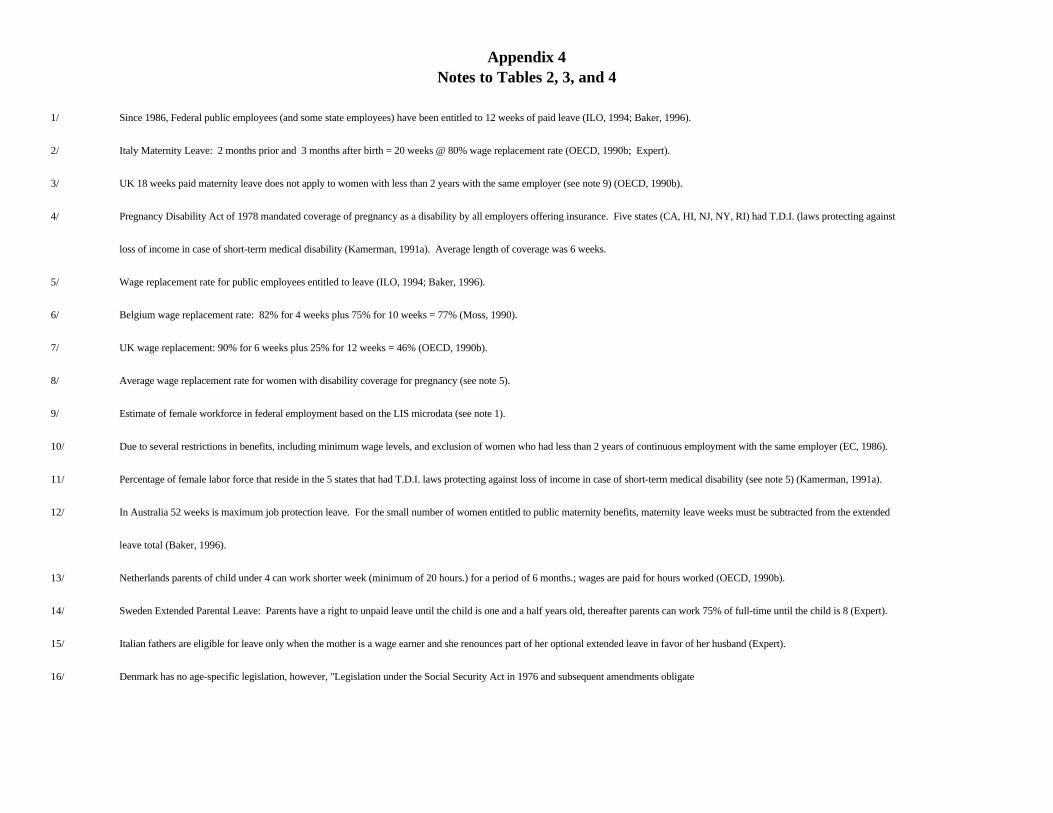
Appendix 4Notes to Tables 2, 3, and 4
1/ Since 1986, Federal public employees (and some state employees) have been entitled to 12 weeks of paid leave (ILO, 1994; Baker, 1996).
2/ Italy Maternity Leave: 2 months prior and 3 months after birth = 20 weeks @ 80% wage replacement rate (OECD, 1990b; Expert).
3/ UK 18 weeks paid maternity leave does not apply to women with less than 2 years with the same employer (see note 9) (OECD, 1990b).
4/ Pregnancy Disability Act of 1978 mandated coverage of pregnancy as a disability by all employers offering insurance. Five states (CA, HI, NJ, NY, RI) had T.D.I. (laws protecting against
loss of income in case of short-term medical disability (Kamerman, 1991a). Average length of coverage was 6 weeks.
5/ Wage replacement rate for public employees entitled to leave (ILO, 1994; Baker, 1996).
6/ Belgium wage replacement rate: 82% for 4 weeks plus 75% for 10 weeks = 77% (Moss, 1990).
7/ UK wage replacement: 90% for 6 weeks plus 25% for 12 weeks = 46% (OECD, 1990b).
8/ Average wage replacement rate for women with disability coverage for pregnancy (see note 5).
9/ Estimate of female workforce in federal employment based on the LIS microdata (see note 1).
10/ Due to several restrictions in benefits, including minimum wage levels, and exclusion of women who had less than 2 years of continuous employment with the same employer (EC, 1986).
11/ Percentage of female labor force that reside in the 5 states that had T.D.I. laws protecting against loss of income in case of short-term medical disability (see note 5) (Kamerman, 1991a).
12/ In Australia 52 weeks is maximum job protection leave. For the small number of women entitled to public maternity benefits, maternity leave weeks must be subtracted from the extended
leave total (Baker, 1996).
13/ Netherlands parents of child under 4 can work shorter week (minimum of 20 hours.) for a period of 6 months.; wages are paid for hours worked (OECD, 1990b).
14/ Sweden Extended Parental Leave: Parents have a right to unpaid leave until the child is one and a half years old, thereafter parents can work 75% of full-time until the child is 8 (Expert).
15/ Italian fathers are eligible for leave only when the mother is a wage earner and she renounces part of her optional extended leave in favor of her husband (Expert).
16/ Denmark has no age-specific legislation, however, "Legislation under the Social Security Act in 1976 and subsequent amendments obligate

Appendix 4Notes to Tables 2, 3, and 4
public authorities 'to make available the required number of day care facilities for children and young people." (Kahn and Kamerman, 1994)
17/ As of 1972, Finland municipalities were to provide public day care as needed for all children under 7 (Expert).
18/ While there is legislation guaranteeing child care for children under three the legislated target coverage rate and actual public provision was a low 5% of children in this age group.
With such a low target the public child care guarantee is essentially non-existent. Thus, we coded Italy guaranteed child care (0-3) as none (Moss, 1990; Expert).
19/ Two times the Federal portion of Canada Assistance Plan under which subsidies are given to the provinces for child care. Generally the federal portion equals 50% of total expenditures (Expert).
20/ Finland Child Care Expenditures: 2.069 billion FMK (national) + 2.428 billion FMK (local) = 5.070 billion FMK total (Expert).
21/ France Child Care Expenditures: 3.17 billion US$ national + 2.52 billion US$ in local public expenditure = $5.69 billion US$ (OECD, 1990b).
22/ National spending for kindergarten only in Italy : 2.907 Lira. Local expenditure varies and is unknown. We do not include this figure in the chart since it covers only a small portion of
children under 15 years old and the figure represents only a fraction of public spending on child care (Expert).
23/ US Child Care Expenditures = 1,097.5 mil (state and federal Title XX) + 1,053.4 mil (State and federal Head Start) + 30 mil (federal Job Training Partnership Act) + 0 Work Incentive Program
= $2,180.9 million (Robins, 1988; Blank, Wilkens and Crawley, 1987).
24/ Canada 0-2 enrollment: 10% of all children from 0-2 in day care and approximately 50% of all care subsidized (Woodill, et al., 1992).
25/ Finland (33,000 1-2 year olds in family day care plus 25,000 1-2 year olds in center or preschool plus 315 0-1 year olds in family day care plus 315 0-1 year olds in center or
preschool) divided by (122,000 1-2 year olds plus 63,000 0-1 year olds) = 32% enrolled in family day care or center or preschool (Kamerman and Kahn, 1991b).
26/ US 0-6 population = 15,944,000 (9,522,000 under 3; 6,422,000 aged 3-5); approximately 5% of children under 6 receive Head Start and other free care (5% times 15,944,000) = 797,200.
Of children enrolled in Head Start: 3% are under three and 97% are aged 3-5 (28% age 3; 62% age 4; 7% age 5). Estimated number of children under three who receive Head Start and other free care
(3% times 797,200) = 23,916; estimated percent of children under three (23,916 divided by 9,522,000) = 0.25%. Estimated number of children aged 3-5 who receive Head Start or other free care
(97% times 797,200) = 773,284; estimated percent of children aged 3-5 (773,284 divided by 6,422,000) = 12.04% (Hofferth, 1990 and Behrman, 1995).

Appendix 4Notes to Tables 2, 3, and 4
27/ US 0-2 enrollment: 0-2 population = 9,522,000 (38% 0-1 and 62% 1-2); 18.6% of 0-1 year olds and 28.8% of 1-2 year olds are in DC centers or FDC (18.6% times 38% plus 28.8% times 62%)
= 25%. An estimated 3.3% of parents using paid care received government subsidies (other than tax credits) (25% times 3.3%) = 0.8% children 0-2 in publicly subsidized child care. [These
figures are based on household survey data and may underestimate subsidies]. Total enrollment in publicly funded child care is the estimate of children under 3 receiving Head Start and other free care
(see note 25) plus the estimate of publicly subsidized care (0.25% plus 0.8%) = 1.05% (Hofferth, 1990).
28/ Finland (63,100 3-7 year olds in family day care plus 82,400 3-7 year olds in center or preschool) divided by (247,000 3-7 year olds) = 59% enrolled in family day care or
center or preschool (Kamerman and Kahn, 1991b).
29/ Enrollment in day care institutions and municipal "day care mothers" (Hantrais, 1994).
30/ Does not include 5 year old school enrollment (Moss, 1990).
31/ US 3-5 enrollment: 3-5 population = 6,422,000 (71% 3-4 and 29% 5); 47.8% of 3-4 year olds and 36.7% of 5 year olds are in DC center or FDC (47.8% times 71% plus 36.7% times 29%) = 45%
times 29%) = 45% in care (not kindergarten). An estimated 3.3% of parents using paid care received government subsidies (other than tax credits) (45% times 3.3%) = 1.5% in publicly subsidized
child care. [These figures are based on household survey data and may underestimate subsidies]. Total enrollment in publicly funded child care is the estimate of children aged 3-5 receiving
Head Start and other free care (see note 25) plus the estimate of publicly subsidized care (12.04% plus 1.5%) = 13.54% (Hofferth, 1990).
32/ US After School Day Care: 6-12 population = 10,675,000 (65.4% 6-9 and 34.6% 10-12); 16.8% of 6-9 year olds and 5.1% of 10-12 year olds are in DC or FDC (16.8% times 65.4% plus 34.6%
times 5.1%=12.8% in care. An estimated 3.3% of parents using paid care received government subsidies (other than tax credits) (12.8% times 3.3%) = 0.4%. [These figures are based on
household survey data and may underestimate subsidies] (Hofferth, 1990).
33/ Sweden after-school child care number for children age 7-12 (Expert).
34/ Hours of school day include lunch break if coverage is generally available.
35/ Denmark length of school day varies from day to day and by locale, and increases as children get older--range = 3 to 5.5 hours. Average day length = (3 plus 5.5) divided by 2 = 4.25;

Appendix 4Notes to Tables 2, 3, and 4
4.25 hours times 5 days = 21.25 hours per week (Moss, 1990).
36/ France has no school on Wednesday and classes are held on Saturday morning (OECD, 1990b).
37/ School day in Italy averages part day in 80% of classrooms and full day in 20% of classrooms (Moss, 1990; Expert).
38/ Sweden school day is 20 hours during the first year of compulsory school and 30 hours thereafter (Expert).
39/ Australia school year ranges from 194 to 201 days; 197.5 is the average of these two values (OECD, 1990b).
40/ Germany school year ranges from 200 to 226 days; 213 is the average of these two values (OECD, 1990b).
41/ Netherlands school year ranges from 200 to 240 days; 220 is the average of these two values (OECD, 1990b).
42/ Schools in France are not open on Wednesday, however there is some public child care available when the schools are closed (Expert).
43/ Most primary schools in Germany are only open from 8:30-13:00 (OECD, 1990b; Moss, 1990).
44/ In Italy many schools have no cafeteria and no lunch supervision. On two weekdays and on Saturday, many Italian schools are in session for only half a day (Expert).
45/ Pre-primary and primary schools in Luxembourg typically include a two-hour unsupervised lunch period. On two weekdays and on Saturday, schools are only open from 8:00-11:30 or 12:00
(Moss, 1990; Expert).
46/ School day in the Netherlands includes a lunch break although only an estimated two-thirds of schools provide lunch and only 30% of children participate (Moss, 1990).

Appendix 5List of Published Sources
Published Sources
Australia Baker, 1996; Cochran, 1993; ILO, 1994; OECD, 1990a.
Belgium EC, 1986; Hantrais, 1994; Kahn and Kamerman, 1994; Moss, 1990;OECD, 1989, 1990a, 1990b; Olmsted and Weikart, 1989.
Canada Cochran, 1993; Kamerman, 1991b; OECD, 1989, 1990a, 1990b; UN,1991; Woodill, et al., 1992.
Denmark EC, 1986; Kahn and Kamerman, 1994; Kamerman, 1991b; Moss, 1990;OECD, 1989, 1990a, 1990b.
Finland Cochran, 1993; Kahn and Kamerman, 1994; Kamerman, 1991b;Kamerman and Kahn, 1991a; OECD, 1989, 1990a, 1990b; UN, 1991;Woodill, et al., 1992.
France Cochran, 1993; EC, 1986; Hantrais, 1994; Kahn and Kamerman, 1994;Kamerman, 1991b; Moss, 1990; OECD, 1989, 1990a, 1990b.
Germany Cochran, 1993; EC, 1986; Kamerman, 1991b; Moss, 1990; OECD,1989, 1990a, 1990b.
Ireland EC, 1986; Moss, 1990; OECD, 1989, 1990a, 1990b.
Italy Cochran, 1993; EC, 1986; Kahn and Kamerman, 1994; Moss, 1990;OECD, 1989, 1990a, 1990b; UN, 1991.
Luxembourg EC, 1986; Hantrais, 1994; Moss, 1990; OECD, 1990a, 1990b.
Netherlands EC, 1986; Hantrais, 1994; Kamerman, 1991b; Moss, 1990; OECD,1990a, 1990b.
Norway Cochran, 1993; Kahn and Kamerman, 1994; Kamerman, 1991b; Leira,1993; OECD, 1989, 1990a, 1990b; UN, 1991.
Sweden Cochran, 1993; Hantrais, 1994; Kahn and Kamerman, 1994; Kamerman,1991b; Kamerman and Kahn, 1991a; OECD, 1990a, 1990b.
United Kingdom EC, 1986; Kahn and Kamerman, 1994; Kamerman, 1991b; Moss, 1990;OECD, 1989, 1990a, 1990b.
United States Blank, Wilkins and Crawley, 1987; Cochran, 1993; Committee on Waysand Means, 1993; Hofferth, 1991; Kamerman, 1991a, 1991b; Kamermanand Kahn, 1991a; OECD 1989, 1990a, 1990b; Robins, 1988.

Appendix 6List of Expert Sources
Monique Borsenberger LuxembourgKatja Forssen FinlandJohan Fritzell SwedenPeter Moss United Kingdom and EC CountriesMichel Neyens LuxembourgLisa M. Powell CanadaChiara Saraceno IrelandKatarina Spiess GermanyCristophe Starzec FranceBerenice Storms Belgium


