Embed Size (px)
Citation preview
Journal of Colloid and Interface Science 445 (2015) 76–83
Contents lists available at ScienceDirect
Journal of Colloid and Interface Science
www.elsevier .com/locate / jc is
Study on metal nanoparticles synthesis and orientation of geminisurfactant molecules used as stabilizer
http://dx.doi.org/10.1016/j.jcis.2014.12.0640021-9797/� 2014 Elsevier Inc. All rights reserved.
⇑ Corresponding authors. Fax: +91 1596 244183.E-mail addresses: [email protected], [email protected]
(S. Pande), [email protected], [email protected] (S.K. Saha).
Amit Kumar Tiwari a, Subhashis Gangopadhyay b, Chien-Hsiang Chang c, Surojit Pande a,⇑,Subit Kumar Saha a,⇑a Department of Chemistry, Birla Institute of Technology and Science, Pilani 333 031, Rajasthan, Indiab Department of Physics, Birla Institute of Technology and Science, Pilani 333 031, Rajasthan, Indiac Department of Chemical Engineering, National Cheng Kung University, 701 Tainan City, Taiwan
g r a p h i c a l a b s t r a c t
Ag Au Au-Ag
DMACA
a r t i c l e i n f o
Article history:Received 27 July 2014Accepted 18 December 2014Available online 31 December 2014
Keywords:Mono- and bimetallic nanoparticlesOrientationZeta-potentialFluorescence quenching
a b s t r a c t
In the present study, we report the synthesis of gold (Au), silver (Ag), and gold–silver alloy (Au–Ag) nano-particles (NPs) by seed-mediated method using gemini surfactant, containing diethyl ether spacer groupas a stabilizer. As-synthesized NPs are found very much stable and have been characterized using UV–visspectroscopy, X-ray photoelectron spectroscopy (XPS), transmission electron microscopy (TEM), energydispersive spectroscopy (EDS), and zeta potential techniques. The orientation of gemini surfactant mol-ecules surrounding the metal NPs has been investigated exploiting twisted intramolecular charge trans-fer (TICT) fluorescence properties of a probe 4-(N,N-dimethylamino) cinnamaldehyde (DMACA). Thequenching efficiencies of different NPs have been performed in the fluorescence of DMACA and are foundto be different. This effect can be related to the location of DMACA as well as the electro-negativity of themetals as the extent of orientation of the surfactant molecules around NPs controls the location of DMAC-A in a bilayer. To support the location of DMACA, fluorescence quenching studies with cetylpyridiniumchloride (CPC) as an external quencher have also been carried out.
� 2014 Elsevier Inc. All rights reserved.
1. Introduction
Gemini surfactants are one of the special classes of biscationicsurfactants, which can be considered as surfactant dimers, i.e.,the combination of two amphiphilic groups connected by a spacergroup within each surfactant molecules [1–5]. The spacer groupcan be rigid, flexible, hydrophilic or hydrophobic, which bindsthe two amphiphilic moieties at the headgroups. Moreover, gemini
surfactants have many attractive features, such as low criticalmicellar concentration (cmc), higher solubilization, and betterlubrication as compared to their conventional counterparts [6–8].In addition, ammonium based gemini surfactants have remarkablerole in aggregation and displaying rate acceleration involving inchemical reactions as compared to the conventional single chain-single headgroup surfactants [9–14]. It is already known that thespacer group of the gemini surfactant plays an important role forthe synthesis of Au and Ag nanoparticles (NPs) and significantlycontrols their size and shape [9,10,15]. Yao and co-workers [10]have reported the formation of well separated spherical Au-NPsof different size in aqueous medium using alkanediyl-a,x-bis
A.K. Tiwari et al. / Journal of Colloid and Interface Science 445 (2015) 76–83 77
(dimethyloctadecylammonium bromide), 18-s-18 (spacer,s = (CH2)n, where n = 3, 4, 5, 6, 8, 10, and 12) gemini surfactantsand sodium borohydride as a reducing agent. The larger and smal-ler size distributions have been related to the shorter (n = 3) andlonger spacer groups, respectively. On the other hand, seed-medi-ated synthesis of Ag-nanorod has been reported by Bhattacharyaand Biswas [9] using 16-s-16 (spacer, s = (CH2)n, where n = 2, 4, 5,and 12) gemini surfactants. Interestingly, they reported that thegemini surfactants with larger spacer groups (s = (CH2)5 and(CH2)12) are not able to promote the growth of Ag-nanorod in themicellar solution, whereas, with smaller spacer groups (s = (CH2)2
and (CH2)4) it can successfully grow the nanorod.Murphy and co-workers [11,16] have done a ground breaking
research work for Au and Ag NPs using cetyltrimethylammoniumbromide (CTAB) surfactant, which is a monomeric counterpart ofa cationic gemini surfactant, 16-s-16. Synthesis of Au NPs using agemini surfactant, 1,2-bis(dodecyldimethylammonio) ethanedichloride with UV-light irradiation have been reported by Esumiand co-workers [17]. Seed-mediated synthesis of Au-nanorod hasalso been performed by Liz-Marzán and co-workers where theyuse a long spacer gemini surfactant, (oligooxa)alkanediyl-a,x-bis(dimethyldodecylammonium bromide) (12-EOx-12, x = 4) [18].Liu and co-workers [19] have studied the synthesis of Ag-nanowireusing 1,3-bis(cetyldimethylammonium) propane dibromide (16-3-16) type gemini surfactant in aqueous medium with methenamineas a reducing agent at 100 �C for 24 h. Mono- (Au) and bimetallic(Au–Ag) NPs have been synthesized by Bakshi and co-workers[20] using trimethylene-1,3-bis(dodecyldimethylammonium bro-mide) (12-3-12) surfactant and sodium borohydride as a reducingagent. They have also showed the anisotropic growth of Au NPswith the increase of surfactant concentration from pre- to post-micellar regions. However, all the reports exhibited the synthesisof mono- and bimetallic NPs using different gemini surfactantsand their stability in the bilayer type of arrangement. A similarkind of bilayer formation has also been observed in CTAB. Bhat-tacharya and co-workers [9,15] found that shorter spacer groupsin a gemini surfactant form elongated worm like micelles, whereasfor longer spacer groups, a nearly spherical shape of micelles areformed, which finally determine the shape of the metal NPs.
Bimetallic NPs are more fascinating because of their superioroptical, catalytic, and electronic properties than their monometal-lic counterparts [21,22]. More precisely, the optical property ofbimetallic NPs comprised of Au and Ag are subject of considerableinterest, due to their intense absorption bands in the visible lightregion, often coined as surface plasmon absorbance. As a result,various research groups have extensively studied colloidal solu-tions of noble metals, especially Au and Ag. Moreover, metal NPsalso show excellent fluorescence quenching property in a widerrange of wavelengths, which enables to design the fluorescentand bioluminescent nanosensors for biosensing applications [23–27]. The hyper-efficient fluorescence quenching of non-conjugatedpendant polymer by Ag NPs has been reported [27]. Additionally,
NO
N
2Br−
C16H33 C16H33
aScheme 1. Chemical structures of (a) Gemini-Z (1,4-bis(hexadecyl-N,N-dimethycinnamaldehyde).
quenching efficiency also depends on the probe location, natureof the stabilizer and their orientation on the surface of the NPs.Hence, a detailed understanding of ‘surfactant orientation sur-rounding metal NPs’ using a fluorescence quencher are of highpractical importance.
In present work, we have made an effort to explain the differentextent of orientations of gemini surfactant molecules surroundingthe NPs, using steady-state fluorescence technique. Here, 1,4-bis(hexadecyl-N,N-dimethylammonium bromide) diethylethergemini surfactant (Gemini-Z) has been used which contains dieth-ylether spacer group and sixteen carbon atoms in the hydrophobictail (Scheme 1a). For steady-state fluorescence study, a twistedintramolecular charge transfer fluorescence probe, 4-(N,N-dimeth-ylamino) cinnamaldehyde (DMACA) has been used (Scheme 1b),which appears in dual fluorescence properties related to locallyexcited state (LE) as well as TICT state [28].
Within this paper, we report the synthesis of mono- (Au and Ag)and bimetallic (Au–Ag) NPs using Gemini-Z as stabilizer and theircharacterization using UV–vis, X-ray photoelectron spectroscopy(XPS), transmission electron microscopy (TEM), energy dispersivespectroscopy (EDS), and zeta potential measurement. Firstly, theas-synthesized NPs appear to be very much stable. Secondly, thefluorescence method also supports the fact of different extent oforientation of gemini surfactants on the surface of metal NPs.Finally, to explain the location of the probe, fluorescencequenching using an external quencher, cetylpyridinium chloride(CPC) has also been performed. Therefore, the unique observationsof this study are: (a) synthesis of mono- (Au and Ag) andbimetallic (Au–Ag) metal NPs using a new gemini surfactant and(b) finding the orientation of gemini surfactant surrounding theas-synthesized NPs.
2. Materials and methods
2.1. Materials
The detailed route for the synthesis of Gemini-Z has beenreported elsewhere [29,30]. In brief, synthesis of Gemini-Z was car-ried out reacting required amounts of 1,4-dibromodiethyl etherwith 2 M equivalent (plus a 10% excess) of N,N-dimethylhexadecyl-amine. The mixture was then refluxed in dry ethanol for 72 h. fol-lowed by the evaporation of ethanol in Rota-evaporator.Afterwards, the solid material obtained from the reaction wasrecovered by filtration and recrystallized several times from a mix-ture of ethyl-acetate/methanol (10:1 v/v). The structure of synthe-sized Gemini-Z was finally confirmed by FT-IR and 1H NMR data.Details procurement of the various commercial chemicals are asfollows: silver nitrate (AgNO3) and sodium borohydride (NaBH4)from Spectrochem, India; ascorbic acid from Sisco Research Lab,India; sodium hydroxide (NaOH) and tri-sodium citrate from S.D. fine chemicals, India; gold(III) chloride (HAuCl4), 4-(N,N-dimeth-ylamino)cinnamaldehyde (DMACA), and cetylpyridinium chloride
NO
H
blammoniumbromide)-2-ethylether) and (b) DMACA (4-(N,N-dimethylamino)

Fig. 1. UV–vis absorption spectra of Au, Ag, and Au–Ag alloy NPs stabilized byGemini-Z. 1.0 cm cuvette was used for the UV–vis measurement and an aqueoussolution of 1.0 mM metal-free Gemini-Z was used for background subtraction.
78 A.K. Tiwari et al. / Journal of Colloid and Interface Science 445 (2015) 76–83
(CPC) from Sigma Aldrich, India. Finally, all aqueous solutions wereprepared using Milli-Q water (Millipore).
2.2. Synthesis of Ag nanoseed
Ag-nanoseeds were prepared using a previously described pro-cedure [9]. Briefly, 0.1 mL of 5.0 mM AgNO3 and tri-sodium citratewere added to a beaker containing 24.73 mL of water with vigor-ous stirring. Then, 0.07 mL of 10 mM aqueous NaBH4 solutionwas added in the above mixture with continuous stirring. Now,the total volume of the solution 25.0 mL turns into yellowishwithin 2 min, which indicates the formation of Ag-nanoseeds [9].The as-synthesized Ag-nanoseeds were used for the synthesis ofAu, Ag and Au–Ag alloy NPs.
2.3. Synthesis of Au, Ag and Au–Ag alloy NPs
Au NPs were synthesized using the following procedure. At first,0.44 mL of 100 mM ascorbic acid was added to a solution contain-ing 8.85 mL of 1.0 mM Gemini-Z followed by the addition of0.27 mL of 10.0 mM HAuCl4 with vigorous stirring. Secondly,0.35 mL of Ag-nanoseed solution was mixed properly with thesolution. Finally, well-stirred 0.09 mL of 1.0 M NaOH was added(pH � 8–9) to the solution. As a result, the colour of the solutionchanged to red after �2 min, which clearly indicates the formationof Au NPs. To ensure the complete reduction, stirring process wascontinued for next 20 min.
Ag NPs were synthesized using the same procedure describedfor the Au NPs, except AgNO3 was used instead of HAuCl4. The paleyellow colour of the solution instead of red in earlier case indicatesthe formation of Ag NPs.
Au–Ag alloy NPs were synthesized using the same proceduredescribed for the Au-NPs, except in the first step both HAuCl4
(0.135 mL of 10.0 mM) and AgNO3 (0.135 mL of 10.0 mM) wereadded at-a-time. An orange colour of solution in final state con-firms the formation of Au–Ag alloy NPs.
2.4. Methods
The as-synthesized NPs (Au, Ag, and Au–Ag alloy) were centri-fuged at 5000 rpm for 10 min to remove the excess nanoseeds.Afterwards, the supernatant was discarded and the residue wassolubilized in Milli-Q water by bath sonication followed by anothercentrifuge. Following the same procedure, each of the NPs solutionwas centrifuged thrice before the final use for the purpose of UV–vis, zeta-potential, XPS, TEM, EDS, and fluorescence measurements.
UV–vis absorption spectra were recorded using a Shimadzu UV1800 spectrophotometer. The optical path length of the quartz cuv-ette was 1.0 cm. For metal NPs, 1.0 mM aqueous solution of metal-free Gemini-Z was used for background subtraction. Whereas,aqueous solutions of metal NPs stabilized by Gemini-Z was usedas reference for DMACA.
Zeta potential analysis was carried out using a Zetasizer, ZEN3600 (Malvern Instruments, UK), at a temperature of 298.2 K.
XPS compositional analysis was carried out using a commercialOmicron EA 125 spectrometer equipped with a seven-channeldetection system and Omicron X-ray source with Al Ka radiation(1486.7 eV). High resolution XPS spectra were collected using passenergy of 20 eV with a step size of 0.1 eV and a dwell time of 1 sper steps. For all measurements emission current of the X-raysource was fixed at 15 mA and the UHV chamber base pressurewas <3 � 10�10 mbar. XPS samples were prepared by dropping10.0 lL of the aqueous solution of each metal NPs onto smallpieces conducting carbon tape and dried under dry nitrogen line.To compensate any kind of charging effect, the binding energy ofC1s peak at 284.5 eV has been used as a reference.
TEM images were obtained using a JEOL-2100F microscope.Samples were prepared by placing 3–4 drops of the appropriateNPs solution on a 300-mesh, carbon-coated Cu grid (EM sciences)and allowing the liquid to evaporate in air. The particle size distri-bution was based on 100 randomly selected particles. Selected areaEDS analysis was also carried out using the same instrument.
Fluorescence measurements were performed using a HoribaJobin Yvon Fluoromax-4 scanning spectrofluorimeter with an exci-tation and emission slit width of 5 nm each. Fluorescence cuvettewith all four sides made of quartz glass and 1 cm path lengthwas used to record the fluorescence spectra. The excitation wave-length (kex) was set to 355 nm and the spectra were corrected forinstrumental sensitivity. The concentration of the used DMACAwas chosen to be 10.0 lM. The concentration of gemini surfactantused here in all experimental solutions was fixed at 1.0 mM whichis indeed very high and about �42 times of the cmc of the surfac-tant. It can be noted that beyond this concentration limit a severesolubility problem arises.
3. Results and discussion
3.1. UV–vis analysis of Au, Ag, and Au–Ag alloy NPs
Surface plasmon oscillations are coherent oscillations of theconduction (free) electrons (mainly within the surface), whichobtained from interaction of the small metal particles with anexternal electromagnetic field induced by the light wave. This sur-face plasmon oscillation is highly influenced by the size, shape, andthe surrounding environment of the small metal particles. Theoptical absorption spectra of Au and Ag NPs are interesting andhave been a subject of study for long time [26,27]. Fig. 1 representsthe absorption spectra for Au and Ag NPs using Gemini-Z as stabi-lizer, where a clear band at 529 nm for Au NPs and a sharp band at417 nm for Ag NPs have been observed. The surface plasmon bandsat 529 nm and 417 nm are attributable to the formation of Au andAg NP, respectively [31]. Recently, Bhattacharya and Biswas [9]reported both transverse and longitudinal bands for Ag-nanorodsynthesized by 16-s-16 gemini surfactants. However, we onlyobserved one clear band in the UV–vis spectra of both Au and AgNPs.
UV–vis absorption spectrum of the alloy (Au–Ag) NPs, is alsoshown in Fig. 1, which appears with an intermediate peak centredat 460 nm as compared to the Au and Ag NPs. This intermediateband position of bimetallic NPs confirms the formation of alloystructure rather than a core–shell type NPs [32]. The sharp peak
A.K. Tiwari et al. / Journal of Colloid and Interface Science 445 (2015) 76–83 79
obtained for alloy as compared to monometallic particles suggeststhe formation of spherical NPs [32]. The positions of the maximafor the Au, Ag, and Au–Ag alloy NPs are also in good agreementwith the synthesis of respective metal NPs by Gemini-Z as a stabi-lizer [9,20].
3.2. Zeta potential analysis of Au, Ag, and Au–Ag alloy NPs
The zeta potential values of the as-synthesized Au (0.27 mM),Ag (0.27 mM) and Au–Ag (0.135 mM of each metal) alloy NPs aremeasured to be +28.5 ± 1, +31.4 ± 1.2, and +35.7 ± 1 mV, respec-tively. The quite high positive zeta potential values for all threeNPs suggest that the surface of the NPs are largely covered by sur-factant molecules and the synthesized NPs are likely to be highlystable [33]. The surface charge densities of metal NPs can berelated to the packing densities of the gemini surfactants whichindicate that the surface coverage by the Gemini-Z is higher in caseof Au–Ag alloy NPs as compared to Au NPs. In addition, the surfacecoverage of Ag NPs, lies in between that of Au and Au–Ag alloy NPs.Finally, the positive zeta potential values reveal the orientation ofsurfactant molecules on the surface of NPs which clearly suggestthat the cationic polar headgroups of Gemini-Z are orientedtowards the bulk phase.
3.3. TEM analysis of Au, Ag, and Au–Ag alloy NPs
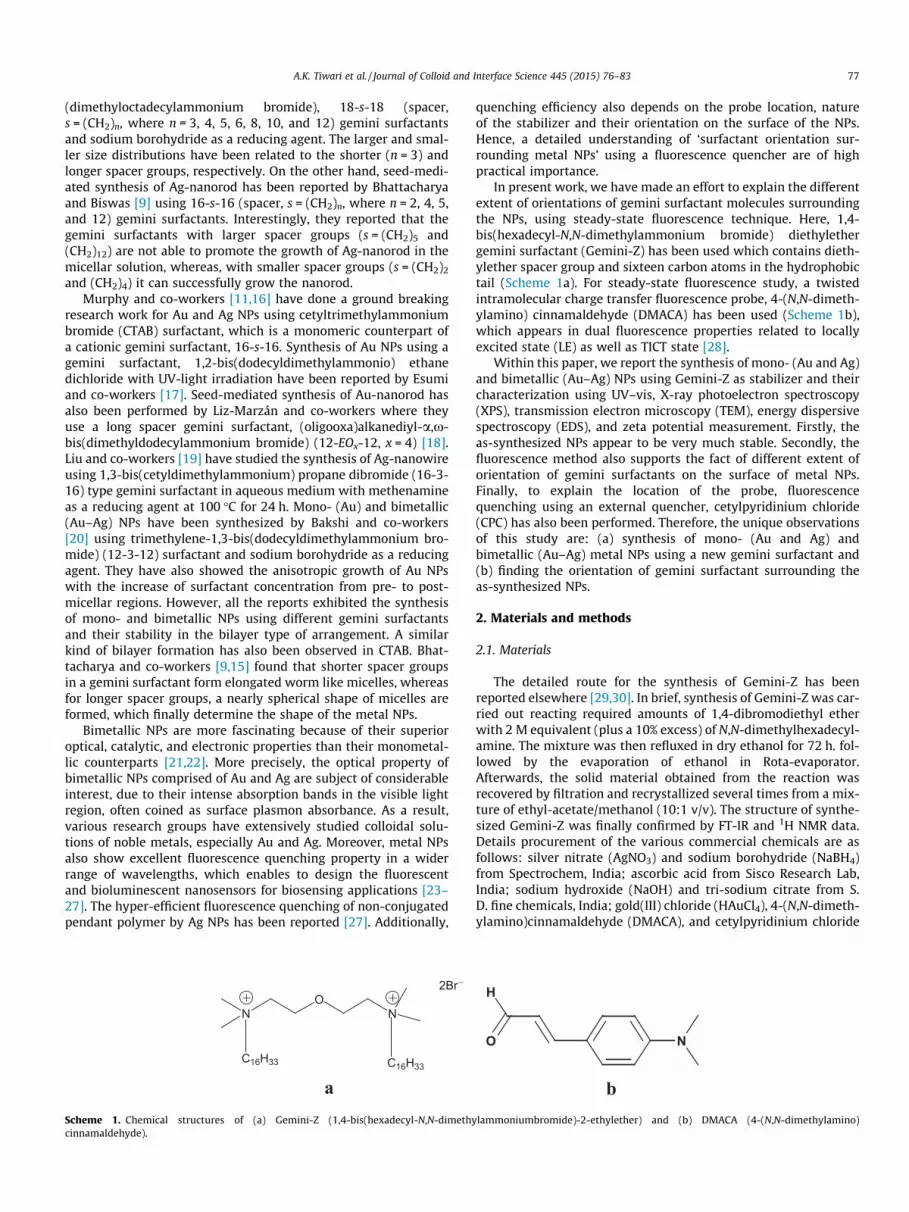
Fig. 2a and Fig. S1 (Supporting Information) represent the corre-sponding TEM, and selected area electron diffraction (SAED) micro-graphs, respectively, for Au NPs synthesized by seed mediatedmethod. Within this study, the Au NPs appear mostly in sphericalshape with an average diameter of �11 ± 2.15 nm. The HRTEMimage (Fig. S1a) of Au NP shows a fringe spacing of 0.22 nm, whichsymbolizes the presence of (111) lattice plane of Au crystal. Thisfinding also substantiates the growth of Au particle along the(111) direction, which is also confirmed from SAED analysis(Fig. S1b) of Au particles. From Fig. S1b, the presence of (200)and (220) can be related to the formation of Au particle usingGemini-Z as stabilizer. Similar to earlier results, Fig. 2b andFig. S2 (Supporting Information) exhibit the TEM analysis of AgNPs, where predominantly rod shaped nanoparticles are observed.The average length and breadth of Ag nanorods are found to be114.3 ± 19.14 nm and 50.1 ± 10.08 nm, respectively, with an aver-age aspect ratio is 2.3 ± 1.89. Inset of Fig. 2b shows the HRTEM
Fig. 2. TEM image of metal NPs: (a) Au and (b) Ag. Insets show
image of a single Ag nanorod. The HRTEM (Fig. S2a) of Ag NP showsa lattice fringe spacing of 0.23 nm, which can be attributed to the(111) crystal plane of Ag NPs. From SAED patterns (Fig. S2b) ofAg NP, presence of (220) lattice plane is also confirmed. However,for Ag NPs synthesis, even with centrifugation at 5000 rpm andwashing for 3 times, possibility of the mixture of particles cannotbe ruled out (Fig. 2b). EDS analysis of Au and Ag NPs clearly exhib-its the presence of Au and Ag metal only as shown in Fig. S3a and b.
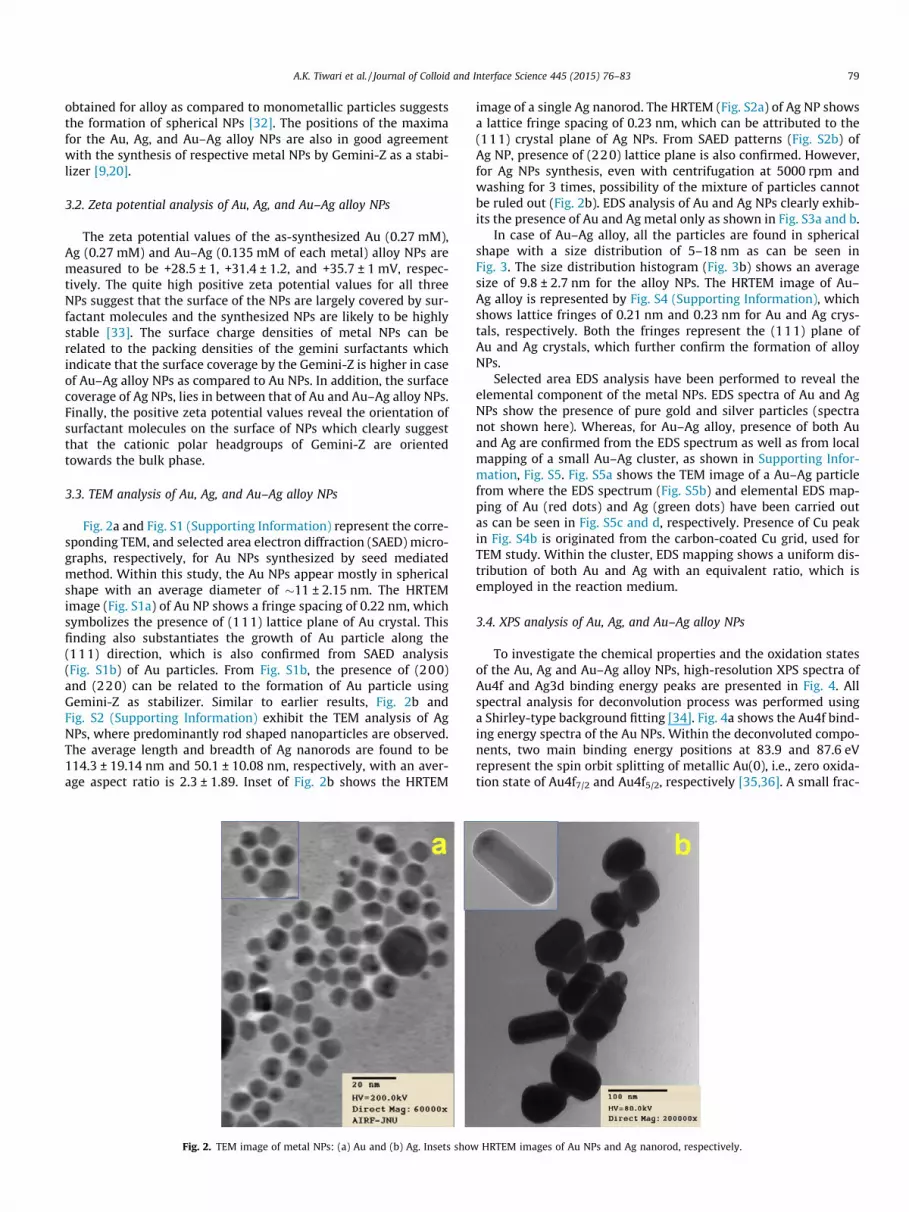
In case of Au–Ag alloy, all the particles are found in sphericalshape with a size distribution of 5–18 nm as can be seen inFig. 3. The size distribution histogram (Fig. 3b) shows an averagesize of 9.8 ± 2.7 nm for the alloy NPs. The HRTEM image of Au–Ag alloy is represented by Fig. S4 (Supporting Information), whichshows lattice fringes of 0.21 nm and 0.23 nm for Au and Ag crys-tals, respectively. Both the fringes represent the (111) plane ofAu and Ag crystals, which further confirm the formation of alloyNPs.
Selected area EDS analysis have been performed to reveal theelemental component of the metal NPs. EDS spectra of Au and AgNPs show the presence of pure gold and silver particles (spectranot shown here). Whereas, for Au–Ag alloy, presence of both Auand Ag are confirmed from the EDS spectrum as well as from localmapping of a small Au–Ag cluster, as shown in Supporting Infor-mation, Fig. S5. Fig. S5a shows the TEM image of a Au–Ag particlefrom where the EDS spectrum (Fig. S5b) and elemental EDS map-ping of Au (red dots) and Ag (green dots) have been carried outas can be seen in Fig. S5c and d, respectively. Presence of Cu peakin Fig. S4b is originated from the carbon-coated Cu grid, used forTEM study. Within the cluster, EDS mapping shows a uniform dis-tribution of both Au and Ag with an equivalent ratio, which isemployed in the reaction medium.
3.4. XPS analysis of Au, Ag, and Au–Ag alloy NPs
To investigate the chemical properties and the oxidation statesof the Au, Ag and Au–Ag alloy NPs, high-resolution XPS spectra ofAu4f and Ag3d binding energy peaks are presented in Fig. 4. Allspectral analysis for deconvolution process was performed usinga Shirley-type background fitting [34]. Fig. 4a shows the Au4f bind-ing energy spectra of the Au NPs. Within the deconvoluted compo-nents, two main binding energy positions at 83.9 and 87.6 eVrepresent the spin orbit splitting of metallic Au(0), i.e., zero oxida-tion state of Au4f7/2 and Au4f5/2, respectively [35,36]. A small frac-
HRTEM images of Au NPs and Ag nanorod, respectively.
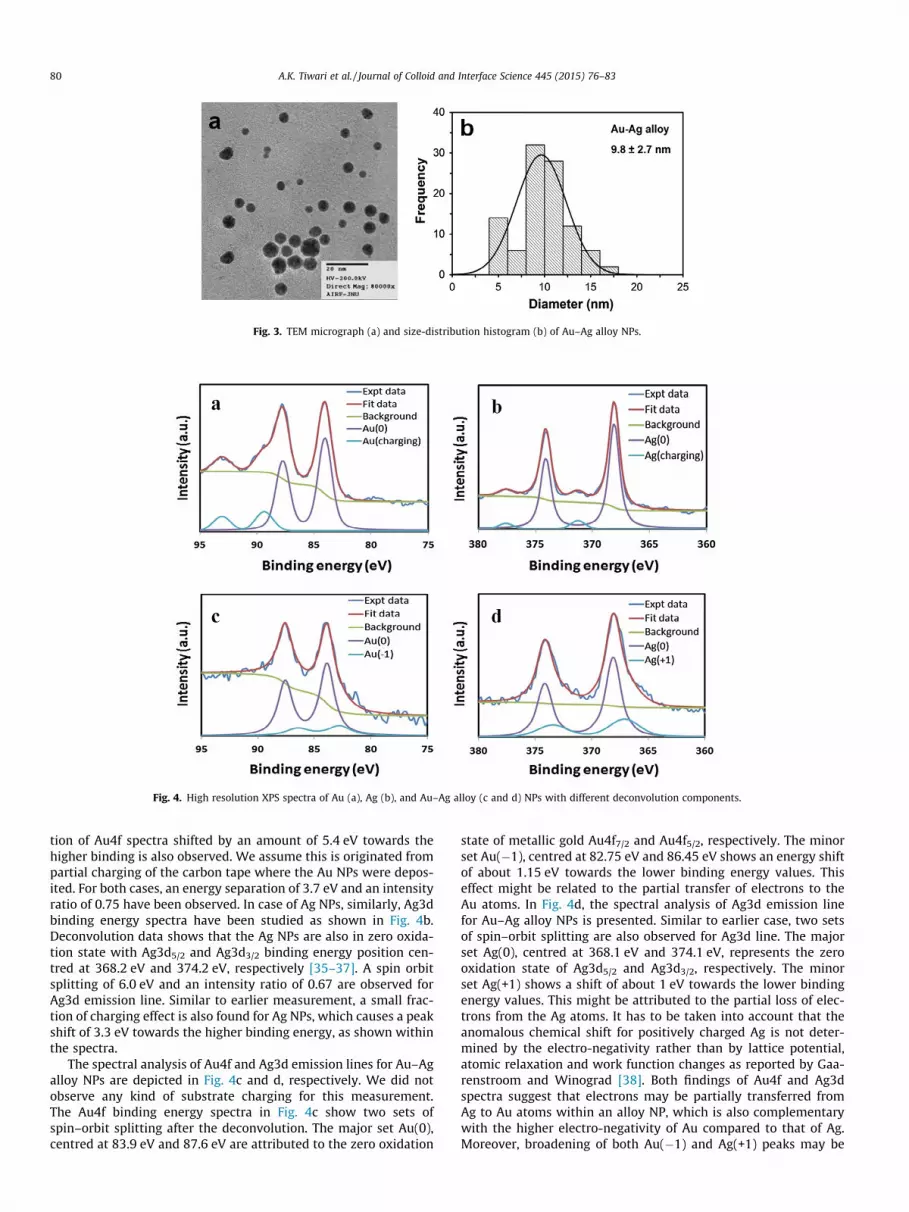
Fig. 3. TEM micrograph (a) and size-distribution histogram (b) of Au–Ag alloy NPs.
Fig. 4. High resolution XPS spectra of Au (a), Ag (b), and Au–Ag alloy (c and d) NPs with different deconvolution components.
80 A.K. Tiwari et al. / Journal of Colloid and Interface Science 445 (2015) 76–83
tion of Au4f spectra shifted by an amount of 5.4 eV towards thehigher binding is also observed. We assume this is originated frompartial charging of the carbon tape where the Au NPs were depos-ited. For both cases, an energy separation of 3.7 eV and an intensityratio of 0.75 have been observed. In case of Ag NPs, similarly, Ag3dbinding energy spectra have been studied as shown in Fig. 4b.Deconvolution data shows that the Ag NPs are also in zero oxida-tion state with Ag3d5/2 and Ag3d3/2 binding energy position cen-tred at 368.2 eV and 374.2 eV, respectively [35–37]. A spin orbitsplitting of 6.0 eV and an intensity ratio of 0.67 are observed forAg3d emission line. Similar to earlier measurement, a small frac-tion of charging effect is also found for Ag NPs, which causes a peakshift of 3.3 eV towards the higher binding energy, as shown withinthe spectra.
The spectral analysis of Au4f and Ag3d emission lines for Au–Agalloy NPs are depicted in Fig. 4c and d, respectively. We did notobserve any kind of substrate charging for this measurement.The Au4f binding energy spectra in Fig. 4c show two sets ofspin–orbit splitting after the deconvolution. The major set Au(0),centred at 83.9 eV and 87.6 eV are attributed to the zero oxidation
state of metallic gold Au4f7/2 and Au4f5/2, respectively. The minorset Au(�1), centred at 82.75 eV and 86.45 eV shows an energy shiftof about 1.15 eV towards the lower binding energy values. Thiseffect might be related to the partial transfer of electrons to theAu atoms. In Fig. 4d, the spectral analysis of Ag3d emission linefor Au–Ag alloy NPs is presented. Similar to earlier case, two setsof spin–orbit splitting are also observed for Ag3d line. The majorset Ag(0), centred at 368.1 eV and 374.1 eV, represents the zerooxidation state of Ag3d5/2 and Ag3d3/2, respectively. The minorset Ag(+1) shows a shift of about 1 eV towards the lower bindingenergy values. This might be attributed to the partial loss of elec-trons from the Ag atoms. It has to be taken into account that theanomalous chemical shift for positively charged Ag is not deter-mined by the electro-negativity rather than by lattice potential,atomic relaxation and work function changes as reported by Gaa-renstroom and Winograd [38]. Both findings of Au4f and Ag3dspectra suggest that electrons may be partially transferred fromAg to Au atoms within an alloy NP, which is also complementarywith the higher electro-negativity of Au compared to that of Ag.Moreover, broadening of both Au(�1) and Ag(+1) peaks may be

A.K. Tiwari et al. / Journal of Colloid and Interface Science 445 (2015) 76–83 81
related to the presence of a mixed or intermediate oxidation states.We also observe strong peaks correspond to C1s, N1s, and O1sbinding energies in survey scan, which reflects the presence ofGemini-Z surfactant (spectrum not shown here).
3.5. UV–vis absorption and steady-state fluorescence study of DMACAin presence of NPs
Fig. S6 (Supporting Information) shows the absorption spectraof DMACA in presence of water, Gemini-Z, Au, Ag, and Au–Ag alloyNPs, stabilized by Gemini-Z. The absorption peak maxima ofDMACA in all these cases are listed in Table 1. The absorption peakmaximum at �399 nm for DMACA in pure water is well corrobo-rated with the reported value [28]. In presence of pure Gemini-Z,the peak maximum (397 nm) is blue shifted by 2 nm indicatingthat the probe molecule is facing less polar environment in theaggregate of Gemini-Z than that in presence of pure water. Theshape of Gemini-Z micelles at this high concentration of surfactant(1 mM) is expected to be as extended wormlike and DMACA mol-ecules are present in a region, which is hydrophobic. The absorp-tion peak maxima of DMACA for Ag and Au–Ag alloy NPsstabilized by Gemini-Z remain unchanged as that in pure Gem-ini-Z (�397 nm). Whereas, for Au NPs stabilized by Gemini-Z, theabsorption maximum appears at �396 nm.
The fluorescence spectra of DMACA in presence of water, Gem-ini-Z, Au, Ag and Au–Ag alloy NPs stabilized by Gemini-Z have beenrecorded and are shown in Fig. 5. The observed fluorescence peakmaxima of DMACA in the studied systems are also listed in Table 1.The peak maxima at �498 nm of DMACA in pure water is in goodagreement with the reported literature value [28]. A significantblue shift with enhanced intensity for DMACA in Gemini-Z is alsoobserved. As the concentration of Gemini-Z (1 mM) is much higherthan the cmc of the Gemini-Z (0.024 mM) [39], the probe moleculesfeel less polar environment than that in pure water. Therefore, inthat less polar environment the excited TICT state of DMACA getsdestabilized and the energy gap between ground singlet state
Table 1UV–vis absorption peak maxima (kab
max), steady-state fluorescence peak maxima (kflmax)
and micropolarity of environment around the DMACA molecule in various systems.
Systems kabmax (nm) kfl
max (nm) eflmax (cm�1) ET(30) (kcal mol�1)
Water 399 498 20,080 58.90Gemini-Z 397 478 20,921 51.29Ag-NPs 397 478 20,921 51.29Au-Nps 396 474 21,097 49.62Au–Ag alloy NPs 397 495 20,202 57.89
Fig. 5. Fluorescence spectra of DMACA in presence of water, Gemini-Z, Au, Ag, andAu–Ag alloy NPs at kex = 355 nm.
(S0) and excited TICT state increases. As a result, the fluorescenceintensity increases with a blue shift in peak maximum. The fluores-cence of DMACA in presence of synthesized Ag NPs is quenchedwith peak maximum in a similar manner as that in Gemini-Z. How-ever, in case of Au NPs, the fluorescence is further quenched with aprominent blue shift (�4 nm) as compared to Gemini-Z. The fluo-rescence is substantially quenched in Au–Ag alloy NPs with peakmaximum close to that in pure water. The blue shift in fluores-cence peak for Au NPs as compared to other two nanoparticlesdepicts that DMACA facing little more hydrophobic environmentin presence of the former. A relatively larger shift in the fluores-cence peak compared to the absorption peak of DMACA for AuNPs in Gemini-Z infers that the fluorescence effect is more sensi-tive than the absorption process.
The difference in peak maxima of DMACA in presence of differ-ent metal NPs and pure Gemini-Z depict different location of probemolecules in various systems. To get further information about thelocation of the probe molecules, the micropolarity of the environ-ment around the probe molecules in various systems have beenestimated. The micropolarity is expressed in equivalent scale ofET(30), which is an empirical solvent polarity parameter comparingthe fluorescence behaviour of a probe molecule in micro-heteroge-neous systems to that in a mixture of homogeneous solvents ofvarying composition [40–44]. As referred by Sytnik and Kasha[45] this represents a static polarity. The fluorescence energy ofDMACA at peak maximum (efl
max) in different composition of diox-ane–water mixtures have been calculated and plotted againstET(30) (Fig. S7) based on the energy of transition for the solvatochro-mic intramolecular charge-transfer absorption of the betaine dye,2,6-diphenyl-4(2,4,6 triphenyl-1-pyridono)phenolate as developedby Reichardt et al. [46]. Using this plot and the efl
max values of DMACAin various studied systems, the micropolarity expressed in equiva-lent scale of ET(30) have been calculated and listed in Table 1. Onthe basis of obtained emission peak maxima and ET(30) values, wehave tried to explain the location of the probe in presence of differ-ent metal NPs.
The calculated ET(30) value for Gemini-Z is 51.29 kcal mol�1
which is also same for Ag NPs. This value is close to the ET(30) valueof ethanol (51.90 kcal mol�1) [47]. The ET(30) value close to that ofethanol in the micelles of Gemini-Z infers that the probe moleculesare residing in the Stern layer of micelles. DMACA with its donor–acceptor moieties has got quite a high dipole moment even in theground state (7.4 D in vacuum, expected to be much higher in polarsolvents) [48]. The dipole moment is increased at the excited statewhich depends on the twist of the donor group, N(CH3)2 [28].Because of the dipolar nature at ground as well as excited states,the DMACA molecule interacts with the ionic headgroups in thesurfactant aggregates. As a result, the molecule resides in the Sternlayer/surface and behaves like a surface probe. Nikoobakht and El-Sayed [49] reported the synthesis of metal nanorods, stabilized bythe bilayer morphology of surfactant. Based on their report, Bhat-tacharya and Biswas [9] also reported the stabilization of Ag-nano-rods by the bilayer formation of gemini surfactants. The surfaces ofthe as-synthesized metal NPs are hydrophilic in nature, so thepolar headgroups of gemini surfactants orient towards the surface.On the other hand, bulk phase is aqueous, so the headgroups alsoorient towards bulk to maintain the stability. Therefore, geminisurfactants can stabilize the NPs by the bilayer formation aroundthe metal NPs. Based on this, the possible orientations of surfactantmolecules around present Ag-nanorod is shown by Scheme 2a. Theobserved zeta potential value of +31.4 mV suggests high stability ofnanorods and is also in support of this kind of orientation of surfac-tant molecules. Since the emission peak maximum of DMACA andET(30) value for Ag-nanorod are same as that of Gemini-Z micelles,we can predict that the probe molecules are located in the Stern-layer of bilayer configuration around Ag-nanorods.
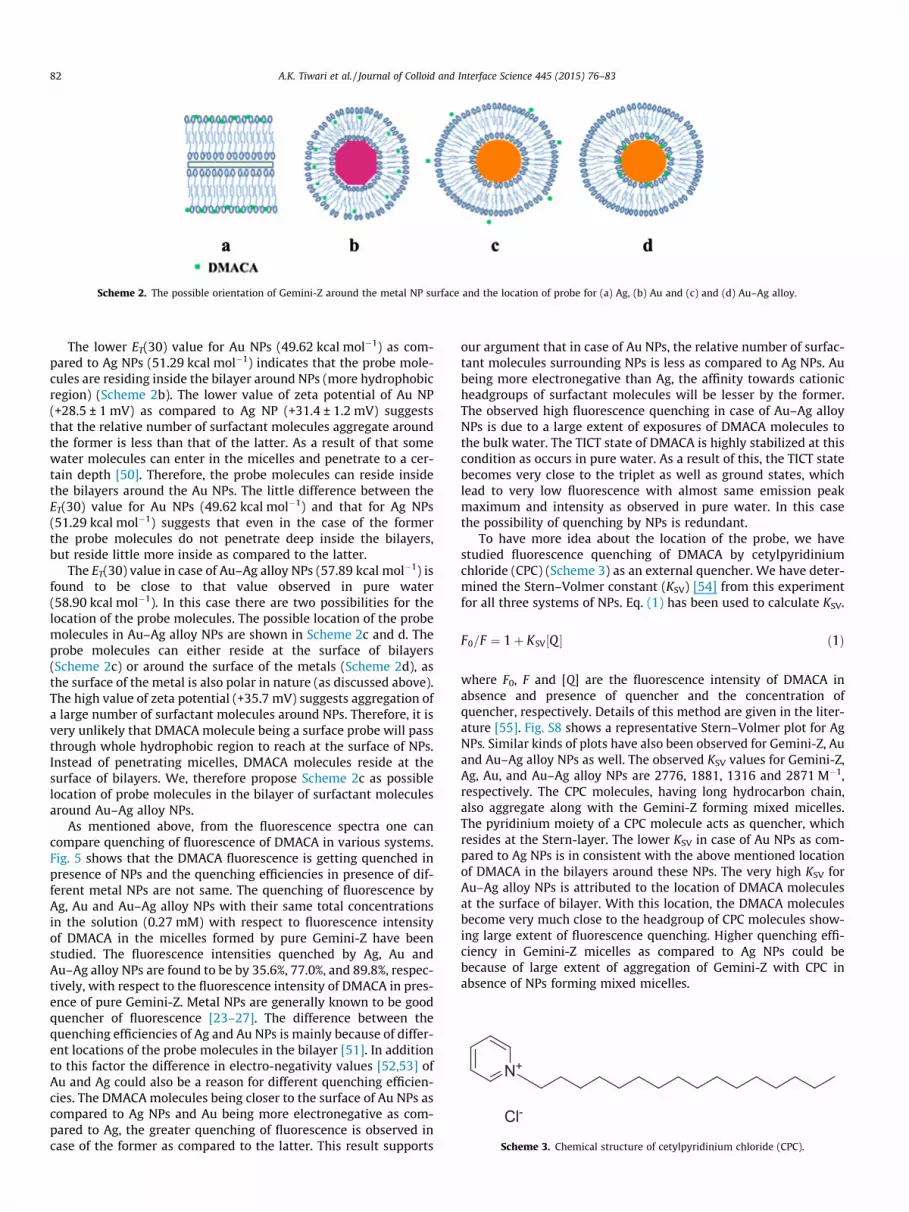
Scheme 2. The possible orientation of Gemini-Z around the metal NP surface and the location of probe for (a) Ag, (b) Au and (c) and (d) Au–Ag alloy.
N+
Cl-
Scheme 3. Chemical structure of cetylpyridinium chloride (CPC).
82 A.K. Tiwari et al. / Journal of Colloid and Interface Science 445 (2015) 76–83
The lower ET(30) value for Au NPs (49.62 kcal mol�1) as com-pared to Ag NPs (51.29 kcal mol�1) indicates that the probe mole-cules are residing inside the bilayer around NPs (more hydrophobicregion) (Scheme 2b). The lower value of zeta potential of Au NP(+28.5 ± 1 mV) as compared to Ag NP (+31.4 ± 1.2 mV) suggeststhat the relative number of surfactant molecules aggregate aroundthe former is less than that of the latter. As a result of that somewater molecules can enter in the micelles and penetrate to a cer-tain depth [50]. Therefore, the probe molecules can reside insidethe bilayers around the Au NPs. The little difference between theET(30) value for Au NPs (49.62 kcal mol�1) and that for Ag NPs(51.29 kcal mol�1) suggests that even in the case of the formerthe probe molecules do not penetrate deep inside the bilayers,but reside little more inside as compared to the latter.
The ET(30) value in case of Au–Ag alloy NPs (57.89 kcal mol�1) isfound to be close to that value observed in pure water(58.90 kcal mol�1). In this case there are two possibilities for thelocation of the probe molecules. The possible location of the probemolecules in Au–Ag alloy NPs are shown in Scheme 2c and d. Theprobe molecules can either reside at the surface of bilayers(Scheme 2c) or around the surface of the metals (Scheme 2d), asthe surface of the metal is also polar in nature (as discussed above).The high value of zeta potential (+35.7 mV) suggests aggregation ofa large number of surfactant molecules around NPs. Therefore, it isvery unlikely that DMACA molecule being a surface probe will passthrough whole hydrophobic region to reach at the surface of NPs.Instead of penetrating micelles, DMACA molecules reside at thesurface of bilayers. We, therefore propose Scheme 2c as possiblelocation of probe molecules in the bilayer of surfactant moleculesaround Au–Ag alloy NPs.
As mentioned above, from the fluorescence spectra one cancompare quenching of fluorescence of DMACA in various systems.Fig. 5 shows that the DMACA fluorescence is getting quenched inpresence of NPs and the quenching efficiencies in presence of dif-ferent metal NPs are not same. The quenching of fluorescence byAg, Au and Au–Ag alloy NPs with their same total concentrationsin the solution (0.27 mM) with respect to fluorescence intensityof DMACA in the micelles formed by pure Gemini-Z have beenstudied. The fluorescence intensities quenched by Ag, Au andAu–Ag alloy NPs are found to be by 35.6%, 77.0%, and 89.8%, respec-tively, with respect to the fluorescence intensity of DMACA in pres-ence of pure Gemini-Z. Metal NPs are generally known to be goodquencher of fluorescence [23–27]. The difference between thequenching efficiencies of Ag and Au NPs is mainly because of differ-ent locations of the probe molecules in the bilayer [51]. In additionto this factor the difference in electro-negativity values [52,53] ofAu and Ag could also be a reason for different quenching efficien-cies. The DMACA molecules being closer to the surface of Au NPs ascompared to Ag NPs and Au being more electronegative as com-pared to Ag, the greater quenching of fluorescence is observed incase of the former as compared to the latter. This result supports
our argument that in case of Au NPs, the relative number of surfac-tant molecules surrounding NPs is less as compared to Ag NPs. Aubeing more electronegative than Ag, the affinity towards cationicheadgroups of surfactant molecules will be lesser by the former.The observed high fluorescence quenching in case of Au–Ag alloyNPs is due to a large extent of exposures of DMACA molecules tothe bulk water. The TICT state of DMACA is highly stabilized at thiscondition as occurs in pure water. As a result of this, the TICT statebecomes very close to the triplet as well as ground states, whichlead to very low fluorescence with almost same emission peakmaximum and intensity as observed in pure water. In this casethe possibility of quenching by NPs is redundant.
To have more idea about the location of the probe, we havestudied fluorescence quenching of DMACA by cetylpyridiniumchloride (CPC) (Scheme 3) as an external quencher. We have deter-mined the Stern–Volmer constant (KSV) [54] from this experimentfor all three systems of NPs. Eq. (1) has been used to calculate KSV.
F0=F ¼ 1þ KSV½Q � ð1Þ
where F0, F and [Q] are the fluorescence intensity of DMACA inabsence and presence of quencher and the concentration ofquencher, respectively. Details of this method are given in the liter-ature [55]. Fig. S8 shows a representative Stern–Volmer plot for AgNPs. Similar kinds of plots have also been observed for Gemini-Z, Auand Au–Ag alloy NPs as well. The observed KSV values for Gemini-Z,Ag, Au, and Au–Ag alloy NPs are 2776, 1881, 1316 and 2871 M�1,respectively. The CPC molecules, having long hydrocarbon chain,also aggregate along with the Gemini-Z forming mixed micelles.The pyridinium moiety of a CPC molecule acts as quencher, whichresides at the Stern-layer. The lower KSV in case of Au NPs as com-pared to Ag NPs is in consistent with the above mentioned locationof DMACA in the bilayers around these NPs. The very high KSV forAu–Ag alloy NPs is attributed to the location of DMACA moleculesat the surface of bilayer. With this location, the DMACA moleculesbecome very much close to the headgroup of CPC molecules show-ing large extent of fluorescence quenching. Higher quenching effi-ciency in Gemini-Z micelles as compared to Ag NPs could bebecause of large extent of aggregation of Gemini-Z with CPC inabsence of NPs forming mixed micelles.

A.K. Tiwari et al. / Journal of Colloid and Interface Science 445 (2015) 76–83 83
4. Conclusions
In summary, Au, Ag, and Au–Ag alloy NPs have been synthe-sized by seed mediated method, using Gemini-Z as a stabilizer,where gemini surfactant molecules stabilize the NPs by surround-ing the metal surface in a bilayer form. Different shapes of NPs areobtained with a strong preference, depending on the materialstype. In case of Ag, mostly rod shaped NPs are observed whereasspheroidal particles are obtained for Au NPs. However, for Au–Agalloy all NPs are appeared in spherical shapes. From XPS study, ithas been confirmed that all the NPs are of zero oxidation statehowever a little charge transfer between Au and Ag atoms withinthe alloy NP may also occur. The DMACA fluorescence quenchingefficiencies in presence of different metal NPs is mainly deter-mined by the locations of the probe molecules in the bilayersaround NPs. This effect further depends on the extent of orienta-tion of surfactant molecules around NPs, which is probably con-trolled by the electro-negativity of the metal. The extent oforientation of surfactant molecules around NPs has been supportedby the observed zeta-potential values and locations of DMACAhave been evidenced by the method of fluorescence quenchingusing external quencher, CPC. Formation of different shapes ofNPs for different materials system at even similar concentrationof surfactant indicates that the shapes of NPs are also controlledto some extent by the nature of metal ions. Finally, we concludethat the synthesis of various NPs of different shapes have beenachieved using similar gemini surfactant (Gemini-Z) and the orien-tation of surfactant molecules surrounding metal NPs is alsoexplained.
Acknowledgments
SP acknowledges the BITS research initiation Grant and UGC-BSR research Start-up-Grant (No. F.20-1(21)/2012(BSR)). SP andSKS acknowledge the University Grants Commission (UGC) specialassistance program (F.540/14/DRS/2007 (SAP-I)), Department ofScience and Technology (DST) FIST program, Government of India.SKS acknowledges the Aditya Birla Groups for financial support.AKT acknowledges CSIR for financial support under senior researchfellowship. The instrumental support for XPS measurement fromProf. J. Falta of the University of Bremen, Germany is highlyacknowledged by SG.
Appendix A. Supplementary material
Supplementary data associated with this article can be found, inthe online version, at http://dx.doi.org/10.1016/j.jcis.2014.12.064.
References
[1] R. Zana, Adv. Colloid Interface Sci. 97 (2002) 205–253.[2] F.M. Menger, J.S. Keiper, Angew. Chem. Int. Ed. 39 (2000) 1907–1920.[3] M.J. Rosen, Surfactants and Interfacial Phenomenon, Wiley, New York, 2004.[4] A.K. Tiwari, Sonu, M. Sowmiya, S.K. Saha, J. Photochem. Photobiol. A: Chem.
223 (2011) 6–13.[5] A.K. Tiwari, J. Mol. Liq. 167 (2012) 18–27.[6] S. Ghosh, T. Chakraborty, J. Phys. Chem. B 111 (2007) 8080–8088.[7] M.S. Bakshi, K. Singh, J. Colloid Interface Sci. 287 (2005) 288–297.
[8] T. Lu, J. Huang, Z. Li, S. Jia, H. Fu, J. Phys. Chem. B 112 (2008) 2909–2914.[9] S. Bhattacharya, J. Biswas, Nanoscale 7 (2011) 2924–2930.
[10] Q. Liu, M. Guo, Z. Nie, J. Yuan, J. Tan, S. Yao, Langmuir 24 (2008) 1595–1599.[11] C.J. Murphy, N.R. Jana, Adv. Mater. 14 (2002) 80–82.[12] S. Bhattacharya, V.P. Kumar, Langmuir 21 (2005) 71–78.[13] S. Bhattacharya, V.P. Kumar, J. Org. Chem. 69 (2004) 559–562.[14] S. Bhattacharya, K. Snehalatha, Langmuir 11 (1996) 4653–4660.[15] S. Datta, J. Biswas, S. Bhattacharya, J. Colloid Interface Sci. 430 (2014) 85–92.[16] T.K. Sau, C.J. Murphy, J. Am. Chem. Soc. 126 (2004) 8648–8649.[17] K. Esumi, J. Hara, N. Aihara, K. Usui, K. Torigoe, J. Colloid Interface Sci. 208
(1998) 578–581.[18] A.G. Martínez, J.P. Juste, E.C. Argibay, G. Tardajos, L.M. Liz-Marzán, Angew.
Chem. Int. Ed. 48 (2009) 9484–9488.[19] J. Xu, J. Hu, C. Peng, H. Liu, Y. Hu, J. Colloid Interface Sci. 298 (2006) 689–693.[20] M.S. Bakshi, P. Sharma, T.S. Banipal, Mater. Lett. 61 (2007) 5004–5009.[21] S. Pande, S.K. Ghosh, S. Praharaj, S. Panigrahi, S. Basu, S. Jana, A. Pal, T. Tsukuda,
T. Pal, J. Phys. Chem. C 111 (2007) 10806–10813.[22] M.J. Hostetler, C.J. Zhong, B.K.H. Yen, J. Anderegg, S.M. Gross, N.D. Evans, M.
Porter, R.W. Murray, J. Am. Chem. Soc. 120 (1998) 9396–9397.[23] Q. Xu, J. Liu, Z. He, S. Yang, Chem. Commun. 46 (2010) 8800–8802.[24] E. Dulkeith, A.C. Morteani, T. Niedereichholz, T.A. Klar, J. Feldmann, S.A. Levi,
F.C.J.M. van Veggel, D.N. Reinhoudt, M. Möller, D.I. Gittins, Phys. Rev. Lett. 89(2002) 203002-1.
[25] T.L. Jennings, M.P. Singh, G.F. Strouse, J. Am. Chem. Soc. 128 (2006) 5462–5467.[26] T. Pons, I.L. Medintz, K.E. Sapsford, S. Higashiya, A.F. Grimes, D.S. English, H.
Mattoussi, Nano Lett. 7 (2007) 3157–3164.[27] D. Ghosh, N. Chattopadhyay, Chem. Phys. Lett. 532 (2012) 52–56.[28] P.R. Bangal, S. Panja, S. Chakravorti, J. Photochem. Photobiol. A: Chem. 139
(2001) 5–16.[29] M. Rosen, L. Liu, J. Am. Oil Chem. Soc. 76 (1996) 885–890.[30] S. De, V.K. Aswal, P.S. Goyal, S. Bhattacharya, J. Phys. Chem. B 102 (1998) 6152–
6160.[31] M. Treguer, C. de Cointet, H. Remita, J. Khatouri, M. Mostafavi, J. Amblard, J.
Belloni, R. de Keyzer, J. Phys. Chem. B 102 (1998) 4310–4321.[32] J.H. Sinfelt, Acc. Chem. Res. 20 (1987) 134–139.[33] F. Xu, Q. Zhang, Z. Gao, Colloids Surf. A 417 (2013) 201–210.[34] D.A. Shirley, Phys. Rev. B 5 (1972) 4709–4714.[35] (a) M.P. Seah, G.C. Smith, M.T. Anthony, Surf. Interface Anal. 15 (1998) 293–
308;(b) K. Duckers, H.P. Bonzel, Surf. Sci. 213 (1989) 25–48.
[36] (a) M.P. Seah, I.S. Gilmore, G. Beamson, Surf. Interface Anal. 26 (1998) 642–649;(b) G.B. Hoflund, J.F. Weaver, W.S. Epling, Surf. Sci. Spectra 3 (1994) 157–162.
[37] I. Srnova-Sloufova, B. Vlckova, Z. Bastl, L.T. Hasslett, Langmuir 20 (2004) 3407–3415.
[38] S.W. Gaarenstroom, N. Winograd, J. Chem. Phys. 67 (1977) 3500.[39] A.K. Tiwari, Sonu, S.K. Saha, J. Chem. Thermodyn. 70 (2014) 24–32.[40] R. Das, D. Guha, S. Mitra, S. Kar, S. Lahiri, S. Mukherjee, J. Phys. Chem. A 101
(1997) 4042–4047.[41] A. Mallick, B. Haldar, S. Maiti, N. Chattopadhyay, J. Colloids Interface Sci. 278
(2004) 215–223.[42] R.B. Macgregor, G. Weber, Nature 319 (1986) 70–73.[43] S.M. Dennison, J. Guharay, P.K. Sengupta, Spectrochim. Acta A 55 (1999) 1127–
1132.[44] M. Sowmiya, P. Purkayastha, A.K. Tiwari, S.S. Jaffer, S.K. Saha, J. Photochem.
Photobiol. A 205 (2009) 186–196.[45] A. Sytnik, M. Kasha, Proc. Natl. Acad. Sci. 91 (1994) 8627–8630.[46] C. Reichardt, W.J. Ratajazak, E.M. Kossower, O. Thomas, Molecular Interaction,
Wiley, New York, 1982.[47] S.K. Saha, P. Purkayastha, A.B. Das, S. Dhara, J. Photochem. Photobiol. A: Chem.
199 (2008) 179–187.[48] S. Ghosh, K.V.S. Girish, S. Ghosh, J. Chem. Sci. 125 (2013) 933–938.[49] B. Nikoobakht, M.A. El-Sayed, Langmuir 17 (2001) 6368–6374.[50] A. Mahata, D. Sarkar, D. Bose, D. Ghosh, P. Das, N. Chattopadhyay, J. Colloid
Interface Sci. 335 (2009) 234–241.[51] G. Schneider, G. Decher, N. Nerambourg, R. Praho, M.H.V. Werts, M.B. Desce,
Nano Lett. 6 (2006) 530–536.[52] Q. Zhou, X. Li, Q. Fan, X. Zhang, J. Zheng, Angew. Chem. Int. Ed. 45 (2006) 3970–
3973.[53] S. Pande, J. Chowdhury, T. Pal, J. Phys. Chem. C 115 (2011) 10497–10509.[54] J.R. Lakowicz, Principles of Fluorescence Spectroscopy, Springer, New York,
2006.[55] S.K. Saha, S.K. Dogra, J. Lumin. 75 (1997) 117–125.


