Embed Size (px)
Citation preview
Structural elucidation of synthetic calcium silicatesThomas Borrmann, James H. Johnston, Andrew J. McFarlane, andKenneth J. D. MacKenzieSchool of Chemical and Physical Sciences, Victoria University of Wellington, P.O. Box 600,Wellington 6140, New Zealand
Akihiko NukuiAdvanced Materials Laboratory, National Institute for Research in Inorganic Materials, Namiki 1-1,Tsukuba, Ibaraki 305-0044, Japan
�Received 29 June 2007; accepted 2 June 2008�
A series of synthetic calcium silicates has been produced comprising nano-sized plates. The startingcalcium silicate referred to as nano-structured calcium silicate, NCS, appears itself X-rayamorphous but contains impurities of calcite. These impurities decompose during the dry thermalconversion of the material into wollastonite. NCS can be enriched with calcium or silicon,respectively. The silicon enriched NCS can be hydrothermally transformed into a sheet materialrelated to Ca7Si16O38�OH�2. The X-ray pattern of this material was sufficient to allow the calculationof its unit cell with a comparatively high figure of merit. The calcium enriched NCS can form twovery distinctly different ceramic materials upon hydrothermal treatment, one a band material�formed below 200 °C� and the other a rose petal shaped material �formed above 210 °C�. TheX-ray diffraction patterns could not be resolved. The fit between the observed and calculatedpatterns was less than 50% as expressed in comparatively low figures of merit �unusually �20�,which is attributed to calcium carbonate impurities in the samples disrupting the long range order.The patterns of these calcium enriched samples could be best compared to those of tobermorite ortruscotite. © 2008 International Centre for Diffraction Data. �DOI: 10.1154/1.2957881�
Key words: nano-structured, calcium silicate, precursor, calcite impurities
I. INTRODUCTION
Calcium silicates are commonly used as fillers and sup-ports, and their structures have been elucidated using variousX-ray diffraction techniques �Iler, 1979�. Tobermorite, xono-thlite, and various CSH-phases dominate current concretetechnology �Hoshino et al., 2006; Gorce and Milestone,2007; Milestone, 1999�. Inorganic polymers �geopolymers�are materials at the cutting edge of ceramic developmentand, when combined with nano-structured calcium silicate�see below�, show promise as bioactive materials �MacKen-zie et al., 2007�. Ratinac et al. �2002�, Drits �2003�, andZotov �1990� have shown how X-ray diffraction �XRD�gives useful information about novel and known silicates.Layered silicates and wollastonite are used in plastics andform valuable components of high strength ceramics in me-dicinal applications �Han et al., 2001; Zilg et al., 1998; Longet al., 2006�. The X-ray diffraction patterns of these silicatescan be difficult to interpret because of small crystal sizes andthe impact of impurities �Rehak et al., 1998; Boikova andToropov, 1964�.
Presented here is a nano-structured calcium silicate�NCS� which, during dry heating, crystallises as wollastonitewhose thermal formation is followed using in situ XRD.NCS comprises randomly stacked nano-sized plates with adiameter of approximately 100 nm and a thickness of2 to 10 nm in comparison to classical calcium silicates thatare based on single or networked spherical structures. NCScan be the precursor for at least three other ceramic materi-als, the X-ray diffraction analyses of which are outlined be-low. As these ceramic materials produced did not displayknown diffraction patterns, McMaille 4.00 software �Le Bail,
2004� was employed to elucidate their structure, which led to204 Powder Diffraction 23 �3�, September 2008 0885-7156
insights about the importance of a calcite impurity found inthe NCS precursor material.
II. EXPERIMENTAL
Nano-structured calcium silicate was prepared accordingto literature from a concentrated silicate solution, calciumhydroxide, and hydrochloric acid �Johnston et al., 2005;Cairns et al., 2006; Borrmann et al., 2005�. Geothermal wa-ter or commercial sodium silicate can be used as the sourceof silicate monomers. The freshly precipitated NCS was rip-ened by stirring overnight during which time its nano-structure developed fully. After filtration, the resulting NCSfilter cake was split into three parts. One part was dry heatedto 800 °C for 2 h. The second part was enriched with10 mol % calcium via the addition of calcium hydroxide.The third part was enriched with 10 mol % silicon via theaddition of sodium silicate. The calcium and silicate enrichedsamples were hydrothermally treated at various temperaturesbetween 150 °C and 250 °C. The hydrothermal treatment ofsilicates was carried out in a 250 mL stainless steel vesselwith a glass or Teflon lining. In a typical experiment, thevessel was charged with 5 g of a dry reaction mixture or50 g of reaction slurry �assuming solids contents for theslurry of 10%� and 150 g of distilled water. After the hydro-thermal treatment, the samples were annealed at 800 °C for10 min in air. An overview of the treatments and analysescarried out on the samples is presented in Table I. Resultsfrom the X-ray powder diffraction analyses are discussed
here.204/2008/23�3�/204/9/$23.00 © 2008 JCPDS-ICDD
X-ray diffraction experiments were carried out on amodified Rigaku X-ray diffraction apparatus capable of mea-suring diffraction intensities using a position sensitive detec-tor in the range of 20 to 80°2�. CuK� radiation was used.The instrument allows the observation of the time evolutionof crystal structures at high temperatures. After a room tem-perature X-ray diffraction pattern was recorded, the silicatesample was heated up to 730 °C at a rate of 10° per minutefollowed by a slower heating rate of 5° per minute up to750 °C. Upon reaching this temperature, X-ray diffractionpatterns were recorded, with each measurement averaging1 min for data collection. After 2 h, the silicate sample wasallowed to cool to room temperature, and a final X-ray pat-tern was then recorded. Further X-ray diffraction powder dif-fraction patterns were measured on a Philips PW 3710 MPDcontrolled diffractometer; anode material Cu and �
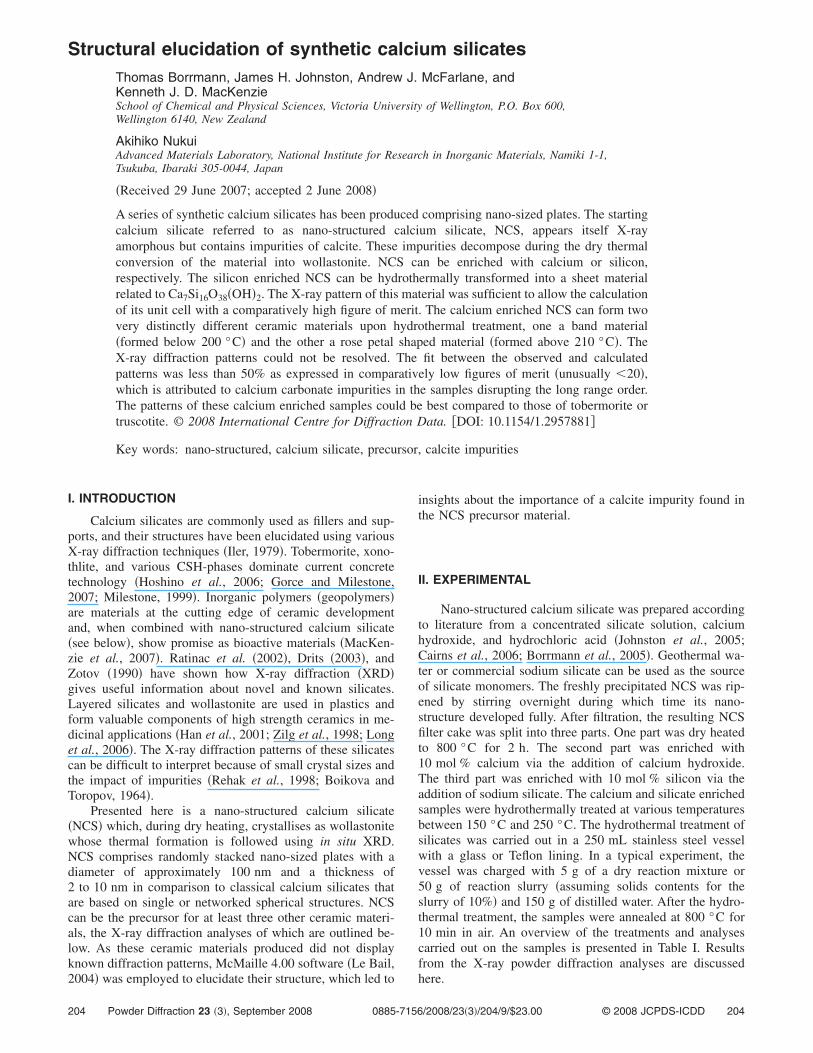
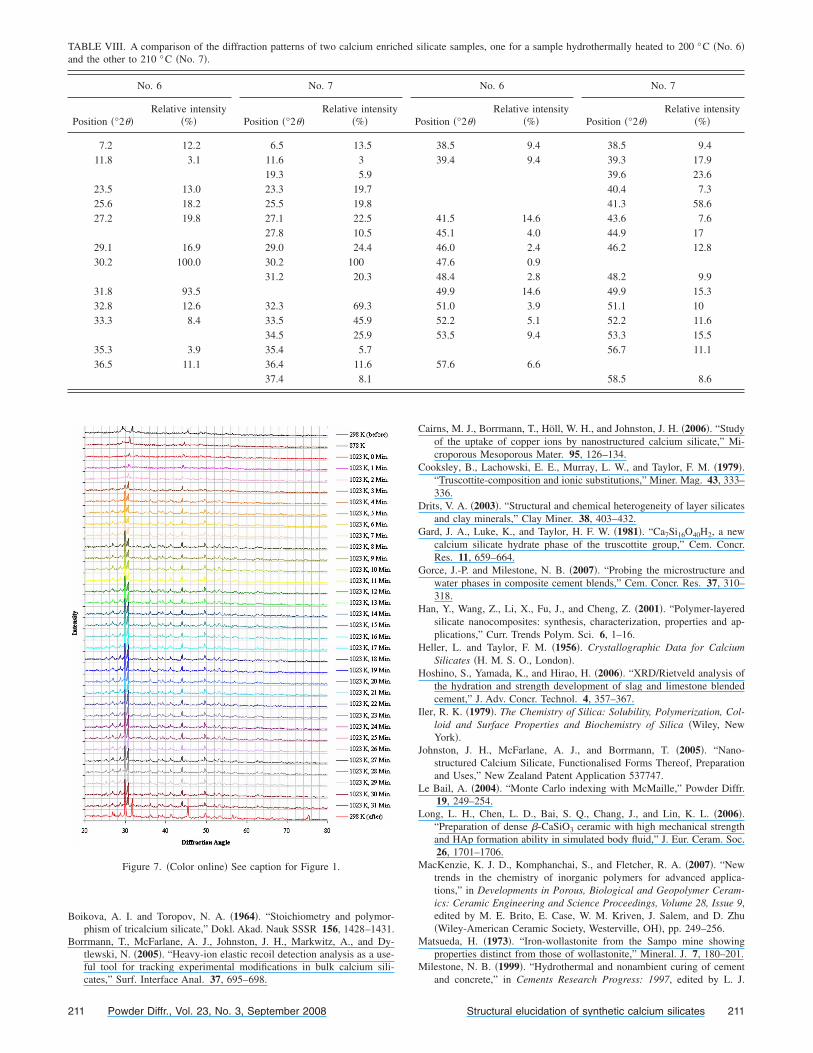
Figure 1. �Color online� Powder X-ray analysis results before, during, and
TABLE I. Procedural overview showing the sequenceas sample numbers.
Material Synthesis/Treatm
Sodium silicate Starting materialCalcium hydroxide Starting materialNano-structured calciumsilicate, No. 1
Mixing of startinripening �observeNMR, SEM�
Wollastonite, No. 2,CaSiO3+SiO2
Dry heating of N
Reinforced calcium silicate,no. 3, CaSi1.67O3.75 ·3H2O
Reinforcement ofsodium silicate
Micro-sheet calcium silicate,No. 4
Hydrothermal treNo. 3 at 150 °C
Material related toCa7Si16O38�OH�2
Annealing of No
Amorphous calcium silicate,No. 5, CaSiO3
Enrichment of Ncalcium
Band structure, No. 6 Hydrothermal treNo. 5 at 160 °C
Truscotite and/or tobermorite Annealing of NoDense ceramic, No. 7 Hydrothermal tre
No. 5 at �210 °Truscotite and/or tobermorite Annealing of No
after the heating of a silicate sample to 750 °C.
205 Powder Diffr., Vol. 23, No. 3, September 2008
=1.540 60 Å. Unit cells were calculated using McMaille ver-sion 4.00, the source code of which can be accessed at http://www.cristal.org/McMaille �Le Bail, 2004�.
High-resolution scanning electron micrographs were ob-tained using a Philips FEG-SEM and a JEOL, JSM 6500F,field emission scanning electron microscope with thesamples being platinum coated and, in some cases, addition-ally conducting polymer coated prior to measurements todiffuse sample charge.
III. RESULTS AND DISCUSSIONA. Nano-structured calcium silicate, No. 1
Nano-structured calcium silicate �NCS� is producedfrom sodium silicate and calcium hydroxide. In an unheatedsample of NCS �Figure 1, 298 K before�, a broad signalobserved at a diffraction angle of 29.4° is associated with a
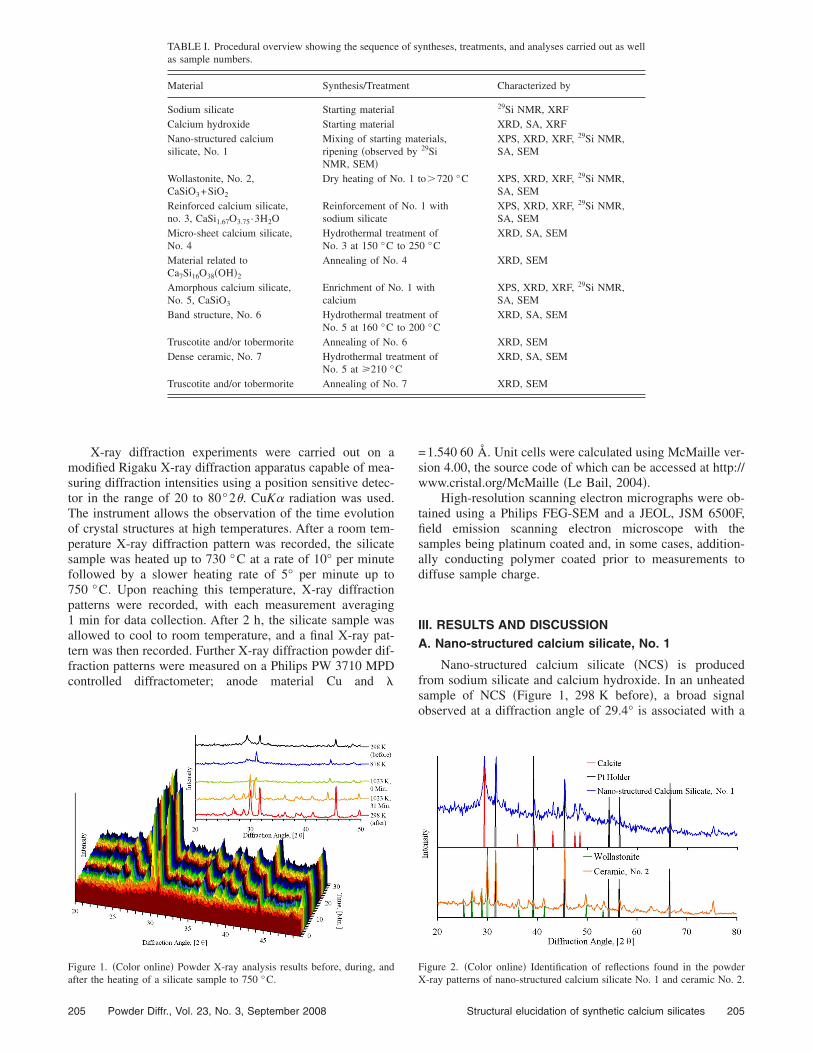
Figure 2. �Color online� Identification of reflections found in the powder
ntheses, treatments, and analyses carried out as well
Characterized by
29Si NMR, XRFXRD, SA, XRF
terials,29Si
XPS, XRD, XRF, 29Si NMR,SA, SEM
to�720 °C XPS, XRD, XRF, 29Si NMR,SA, SEM
1 with XPS, XRD, XRF, 29Si NMR,SA, SEM
t of0 °C
XRD, SA, SEM
XRD, SEM
ith XPS, XRD, XRF, 29Si NMR,SA, SEM
t of0 °C
XRD, SA, SEM
XRD, SEMt of XRD, SA, SEM
XRD, SEM
of sy
ent
g mad by
o. 1
No.
atmento 25. 4
o. 1 w
atmento 20. 6atmenC. 7
X-ray patterns of nano-structured calcium silicate No. 1 and ceramic No. 2.
205Structural elucidation of synthetic calcium silicates
calcite impurity, PDF 05-0586 �Swanson and Fuyat, 1953�,which is also present in the original calcium hydroxide usedas substrate. No patterns for calcium oxide or hydroxidewere found, which were predominant in the starting material.This carbonate decomposed upon heating the NCS to tem-peratures above 700 °C and was not observed in the finalheated sample �Figure 1, 298 K after�. These findings indi-cate that the NCS material itself is X-ray amorphous. How-ever, the reflections associated with calcium carbonate canmask the pattern of a polycrystalline material related to aC-S-H �I� phase as found in the making of Portland cement,for example PDF 42-0550 �Taylor, 1957�. A C-S-H �I� phasehas been investigated by Taylor �1957�, who described it aspoorly crystallised and tobermorite related with a calcium tosilicon ratio of 0.83.
B. Thermal treatment of nano-structured calciumsilicate, No. 1; formation of wollastonite, No. 2
All the peaks present in the powder X-ray diffractionpattern of NCS, recorded before, during, and after the heat-ing of a NCS sample to 750 °C, have been identified �Figure1�. Because of the low mass absorption coefficient and thin-ness of the material, the X-ray beam penetrated the samplethus diffracting from the platinum sample holder. The reflec-tions from the platinum shift or vanish during the heating ofthe sample because of thermal expansion and movement inthe coarsely crystalline metal during the experiment. Anoverview comparing the peaks found in the unheated sample,calcite reference, and platinum holder is presented in Figure2.
The relative intensities observed in the diffraction pat-terns are distorted because of the preferred orientation of theparticles and the multi-channel measurement technique used.These techniques and especially sample specific conditionsresult in the relative intensities differing from those found forsamples measured on other instruments; peaks with relative
TABLE II. Comparison of unit cells for calcium silicate No. 4 andCa7Si16O38�OH�2 �d�, PDF 35-0311 �Gard et al., 1981�.
a �Å� b �Å� c �Å� � �°� � �°� � �°� Volume �Å3�
No. 4 12.1 4.4 4.4 82.1 75.2 85.6 227d 12.3 9.7 9.7 120 108.6 78.1 945
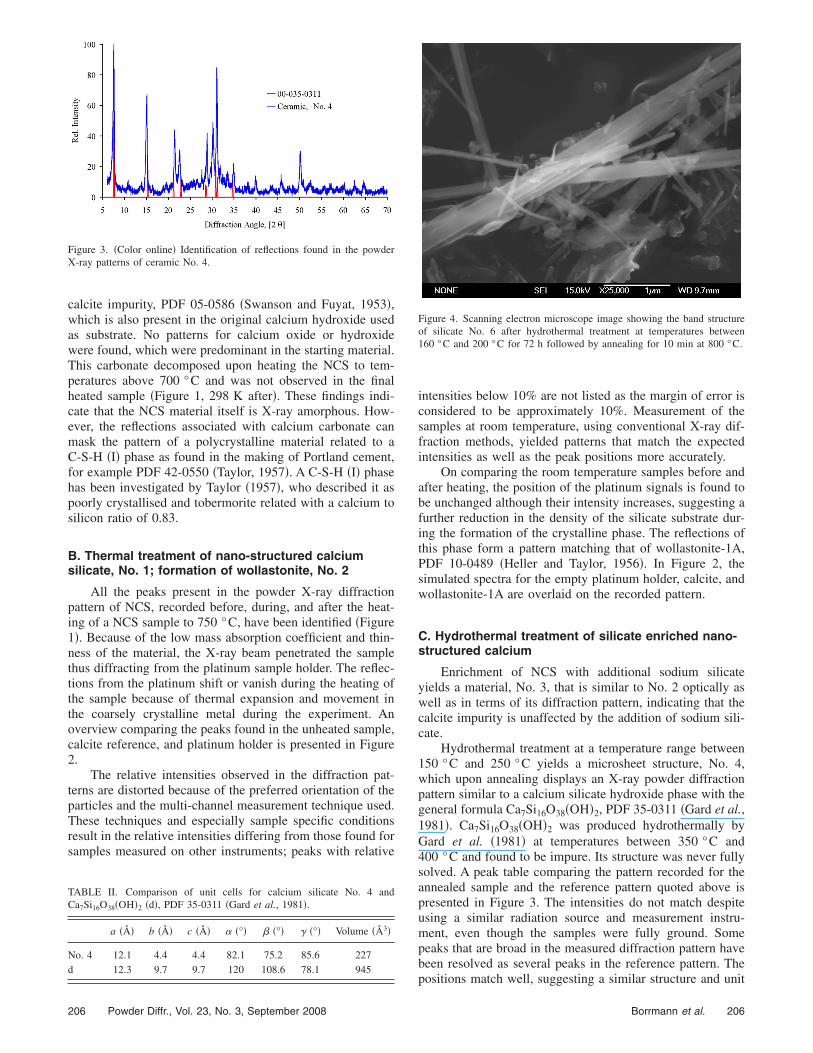
Figure 3. �Color online� Identification of reflections found in the powderX-ray patterns of ceramic No. 4.
206 Powder Diffr., Vol. 23, No. 3, September 2008
intensities below 10% are not listed as the margin of error isconsidered to be approximately 10%. Measurement of thesamples at room temperature, using conventional X-ray dif-fraction methods, yielded patterns that match the expectedintensities as well as the peak positions more accurately.
On comparing the room temperature samples before andafter heating, the position of the platinum signals is found tobe unchanged although their intensity increases, suggesting afurther reduction in the density of the silicate substrate dur-ing the formation of the crystalline phase. The reflections ofthis phase form a pattern matching that of wollastonite-1A,PDF 10-0489 �Heller and Taylor, 1956�. In Figure 2, thesimulated spectra for the empty platinum holder, calcite, andwollastonite-1A are overlaid on the recorded pattern.
C. Hydrothermal treatment of silicate enriched nano-structured calcium
Enrichment of NCS with additional sodium silicateyields a material, No. 3, that is similar to No. 2 optically aswell as in terms of its diffraction pattern, indicating that thecalcite impurity is unaffected by the addition of sodium sili-cate.
Hydrothermal treatment at a temperature range between150 °C and 250 °C yields a microsheet structure, No. 4,which upon annealing displays an X-ray powder diffractionpattern similar to a calcium silicate hydroxide phase with thegeneral formula Ca7Si16O38�OH�2, PDF 35-0311 �Gard et al.,1981�. Ca7Si16O38�OH�2 was produced hydrothermally byGard et al. �1981� at temperatures between 350 °C and400 °C and found to be impure. Its structure was never fullysolved. A peak table comparing the pattern recorded for theannealed sample and the reference pattern quoted above ispresented in Figure 3. The intensities do not match despiteusing a similar radiation source and measurement instru-ment, even though the samples were fully ground. Somepeaks that are broad in the measured diffraction pattern havebeen resolved as several peaks in the reference pattern. The
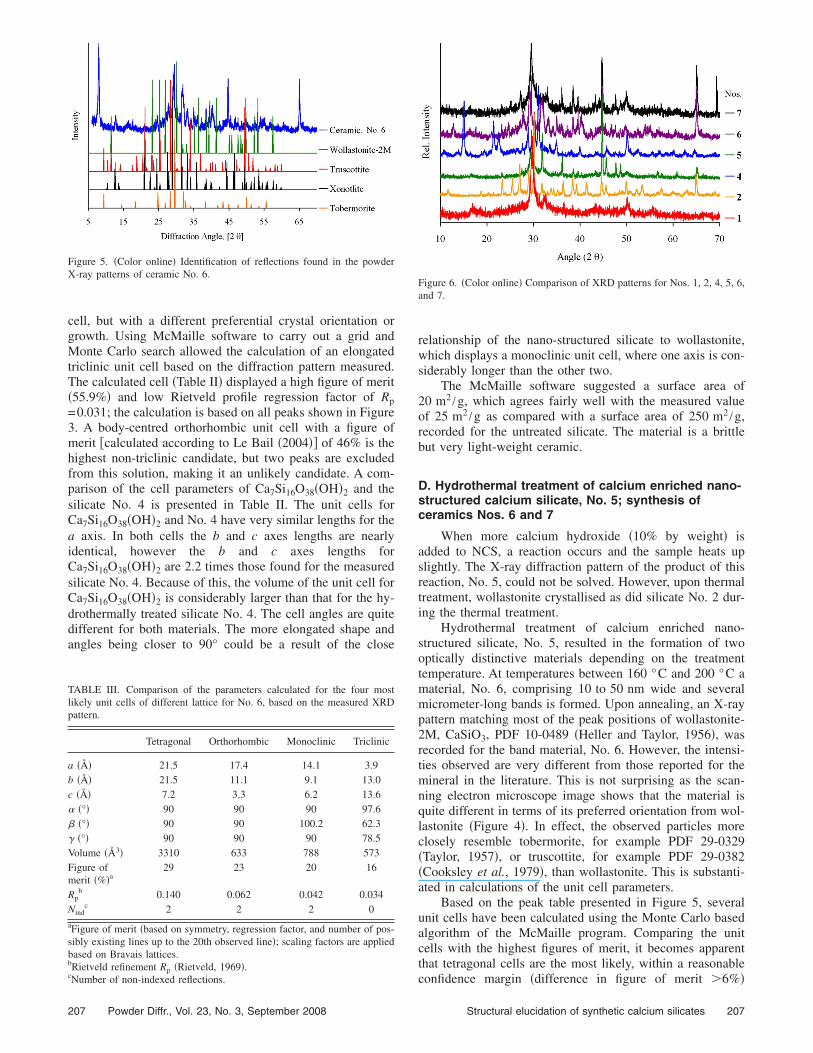
Figure 4. Scanning electron microscope image showing the band structureof silicate No. 6 after hydrothermal treatment at temperatures between160 °C and 200 °C for 72 h followed by annealing for 10 min at 800 °C.
positions match well, suggesting a similar structure and unit
206Borrmann et al.
cell, but with a different preferential crystal orientation orgrowth. Using McMaille software to carry out a grid andMonte Carlo search allowed the calculation of an elongatedtriclinic unit cell based on the diffraction pattern measured.The calculated cell �Table II� displayed a high figure of merit�55.9%� and low Rietveld profile regression factor of Rp=0.031; the calculation is based on all peaks shown in Figure3. A body-centred orthorhombic unit cell with a figure ofmerit �calculated according to Le Bail �2004�� of 46% is thehighest non-triclinic candidate, but two peaks are excludedfrom this solution, making it an unlikely candidate. A com-parison of the cell parameters of Ca7Si16O38�OH�2 and thesilicate No. 4 is presented in Table II. The unit cells forCa7Si16O38�OH�2 and No. 4 have very similar lengths for thea axis. In both cells the b and c axes lengths are nearlyidentical, however the b and c axes lengths forCa7Si16O38�OH�2 are 2.2 times those found for the measuredsilicate No. 4. Because of this, the volume of the unit cell forCa7Si16O38�OH�2 is considerably larger than that for the hy-drothermally treated silicate No. 4. The cell angles are quitedifferent for both materials. The more elongated shape andangles being closer to 90° could be a result of the close
TABLE III. Comparison of the parameters calculated for the four mostlikely unit cells of different lattice for No. 6, based on the measured XRDpattern.
Tetragonal Orthorhombic Monoclinic Triclinic
a �Å� 21.5 17.4 14.1 3.9b �Å� 21.5 11.1 9.1 13.0c �Å� 7.2 3.3 6.2 13.6� �°� 90 90 90 97.6� �°� 90 90 100.2 62.3� �°� 90 90 90 78.5Volume �Å3� 3310 633 788 573Figure ofmerit �%�a
29 23 20 16
Rpb 0.140 0.062 0.042 0.034
Nindc 2 2 2 0
aFigure of merit �based on symmetry, regression factor, and number of pos-sibly existing lines up to the 20th observed line�; scaling factors are appliedbased on Bravais lattices.bRietveld refinement Rp �Rietveld, 1969�.c
Figure 5. �Color online� Identification of reflections found in the powderX-ray patterns of ceramic No. 6.
Number of non-indexed reflections.
207 Powder Diffr., Vol. 23, No. 3, September 2008
relationship of the nano-structured silicate to wollastonite,which displays a monoclinic unit cell, where one axis is con-siderably longer than the other two.
The McMaille software suggested a surface area of20 m2 /g, which agrees fairly well with the measured valueof 25 m2 /g as compared with a surface area of 250 m2 /g,recorded for the untreated silicate. The material is a brittlebut very light-weight ceramic.
D. Hydrothermal treatment of calcium enriched nano-structured calcium silicate, No. 5; synthesis ofceramics Nos. 6 and 7
When more calcium hydroxide �10% by weight� isadded to NCS, a reaction occurs and the sample heats upslightly. The X-ray diffraction pattern of the product of thisreaction, No. 5, could not be solved. However, upon thermaltreatment, wollastonite crystallised as did silicate No. 2 dur-ing the thermal treatment.
Hydrothermal treatment of calcium enriched nano-structured silicate, No. 5, resulted in the formation of twooptically distinctive materials depending on the treatmenttemperature. At temperatures between 160 °C and 200 °C amaterial, No. 6, comprising 10 to 50 nm wide and severalmicrometer-long bands is formed. Upon annealing, an X-raypattern matching most of the peak positions of wollastonite-2M, CaSiO3, PDF 10-0489 �Heller and Taylor, 1956�, wasrecorded for the band material, No. 6. However, the intensi-ties observed are very different from those reported for themineral in the literature. This is not surprising as the scan-ning electron microscope image shows that the material isquite different in terms of its preferred orientation from wol-lastonite �Figure 4�. In effect, the observed particles moreclosely resemble tobermorite, for example PDF 29-0329�Taylor, 1957�, or truscottite, for example PDF 29-0382�Cooksley et al., 1979�, than wollastonite. This is substanti-ated in calculations of the unit cell parameters.
Based on the peak table presented in Figure 5, severalunit cells have been calculated using the Monte Carlo basedalgorithm of the McMaille program. Comparing the unitcells with the highest figures of merit, it becomes apparentthat tetragonal cells are the most likely, within a reasonable
Figure 6. �Color online� Comparison of XRD patterns for Nos. 1, 2, 4, 5, 6,and 7.
confidence margin �difference in figure of merit �6%�
207Structural elucidation of synthetic calcium silicates
�Table III�. Cells of this type are found for truscottite, forexample PDF 29-0382 �Cooksley et al., 1979�,Ca2Si4O9�OH�2. Under similar hydrothermal conditions, re-action mixtures reported in the literature produce orthorhom-bic tobermorite, for example PDF 29-0329 �Heller and Tay-
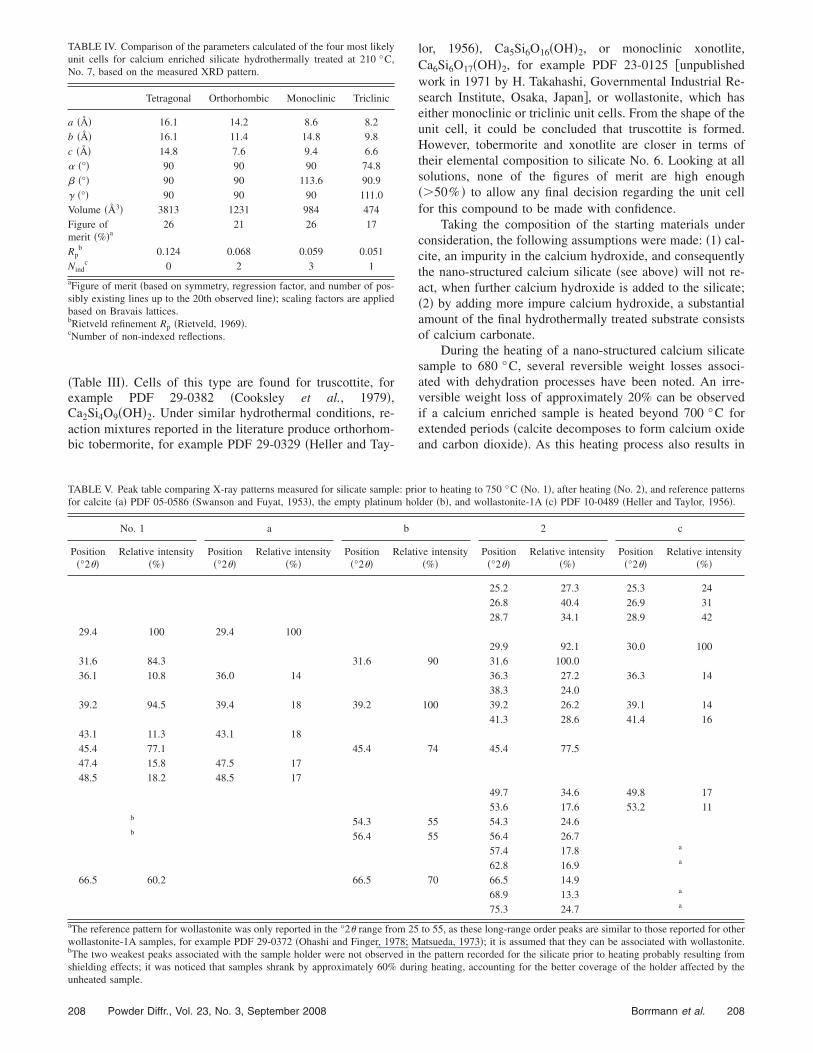
TABLE IV. Comparison of the parameters calculated of the four most likelyunit cells for calcium enriched silicate hydrothermally treated at 210 °C,No. 7, based on the measured XRD pattern.
Tetragonal Orthorhombic Monoclinic Triclinic
a �Å� 16.1 14.2 8.6 8.2b �Å� 16.1 11.4 14.8 9.8c �Å� 14.8 7.6 9.4 6.6� �°� 90 90 90 74.8� �°� 90 90 113.6 90.9� �°� 90 90 90 111.0Volume �Å3� 3813 1231 984 474Figure ofmerit �%�a
26 21 26 17
Rpb 0.124 0.068 0.059 0.051
Nindc 0 2 3 1
aFigure of merit �based on symmetry, regression factor, and number of pos-sibly existing lines up to the 20th observed line�; scaling factors are appliedbased on Bravais lattices.bRietveld refinement Rp �Rietveld, 1969�.cNumber of non-indexed reflections.
TABLE V. Peak table comparing X-ray patterns measured for silicate samplefor calcite �a� PDF 05-0586 �Swanson and Fuyat, 1953�, the empty platinum
No. 1 a
Position�°2��
Relative intensity�%�
Position�°2��
Relative intensity�%�
Position�°2��
R
29.4 100 29.4 100
31.6 84.3 31.636.1 10.8 36.0 14
39.2 94.5 39.4 18 39.2
43.1 11.3 43.1 1845.4 77.1 45.447.4 15.8 47.5 1748.5 18.2 48.5 17
b 54.3b 56.4
66.5 60.2 66.5
aThe reference pattern for wollastonite was only reported in the °2� range frowollastonite-1A samples, for example PDF 29-0372 �Ohashi and Finger, 197bThe two weakest peaks associated with the sample holder were not observeshielding effects; it was noticed that samples shrank by approximately 60%
unheated sample.208 Powder Diffr., Vol. 23, No. 3, September 2008
lor, 1956�, Ca5Si6O16�OH�2, or monoclinic xonotlite,Ca6Si6O17�OH�2, for example PDF 23-0125 �unpublishedwork in 1971 by H. Takahashi, Governmental Industrial Re-search Institute, Osaka, Japan�, or wollastonite, which haseither monoclinic or triclinic unit cells. From the shape of theunit cell, it could be concluded that truscottite is formed.However, tobermorite and xonotlite are closer in terms oftheir elemental composition to silicate No. 6. Looking at allsolutions, none of the figures of merit are high enough��50% � to allow any final decision regarding the unit cellfor this compound to be made with confidence.
Taking the composition of the starting materials underconsideration, the following assumptions were made: �1� cal-cite, an impurity in the calcium hydroxide, and consequentlythe nano-structured calcium silicate �see above� will not re-act, when further calcium hydroxide is added to the silicate;�2� by adding more impure calcium hydroxide, a substantialamount of the final hydrothermally treated substrate consistsof calcium carbonate.
During the heating of a nano-structured calcium silicatesample to 680 °C, several reversible weight losses associ-ated with dehydration processes have been noted. An irre-versible weight loss of approximately 20% can be observedif a calcium enriched sample is heated beyond 700 °C forextended periods �calcite decomposes to form calcium oxideand carbon dioxide�. As this heating process also results in
r to heating to 750 °C �No. 1�, after heating �No. 2�, and reference patternsder �b�, and wollastonite-1A �c� PDF 10-0489 �Heller and Taylor, 1956�.
2 c
ve intensity�%�
Position�°2��
Relative intensity�%�
Position�°2��
Relative intensity�%�
25.2 27.3 25.3 2426.8 40.4 26.9 3128.7 34.1 28.9 42
29.9 92.1 30.0 10090 31.6 100.0
36.3 27.2 36.3 1438.3 24.0
100 39.2 26.2 39.1 1441.3 28.6 41.4 16
74 45.4 77.5
49.7 34.6 49.8 1753.6 17.6 53.2 11
55 54.3 24.655 56.4 26.7
57.4 17.8 a
62.8 16.9 a
70 66.5 14.968.9 13.3 a
75.3 24.7 a
to 55, as these long-range order peaks are similar to those reported for otheratsueda, 1973�; it is assumed that they can be associated with wollastonite.
the pattern recorded for the silicate prior to heating probably resulting fromg heating, accounting for the better coverage of the holder affected by the
: priohol
b
elati
m 258; Md indurin
208Borrmann et al.
the irreversible formation of wollastonite No. 2 �see above�,thermal removal of calcite could not be used to obtain aclean diffraction pattern of the band material, No. 6. Instead,the reflections identified for the calcite have been removedfrom the diffraction pattern of No. 6. Calculation of the unitcell based on this reduced diffraction pattern yielded verysimilar unit cells for the tetragonal and orthorhombic solu-tions, with only minor differences ��1% �. When all the re-flections were indexed, the figures of merit were within 1%of the calculations for the full cell as quoted in Table III. Forthe monoclinic and triclinic solutions, lower figures of meritand significant changes in the unit cell were calculated. Thisprobably means that the band material either consists of to-bermorite or truscottite, or maybe a mixture of both. Further-more, as it contains a significant amount of calcite, it can beassumed that this impurity disrupts the formation of the crys-tal lattice and hence prevents the assessment and elucidationof the unit cell.
On a bulk scale, the band material forms a brittle butlightweight ceramic. The surface area of this ceramic de-creased as the temperature of the hydrothermal treatment wasraised. At 160 °C, a material with a surface area of 69 m2 /gis obtained, and at 200 °C a material with a surface area of29 m2 /g is synthesised. If a molar ratio other than 1 partcalcium to 1 part silicon is chosen, then the ceramic becomesvery fragile, losing particles if touched.
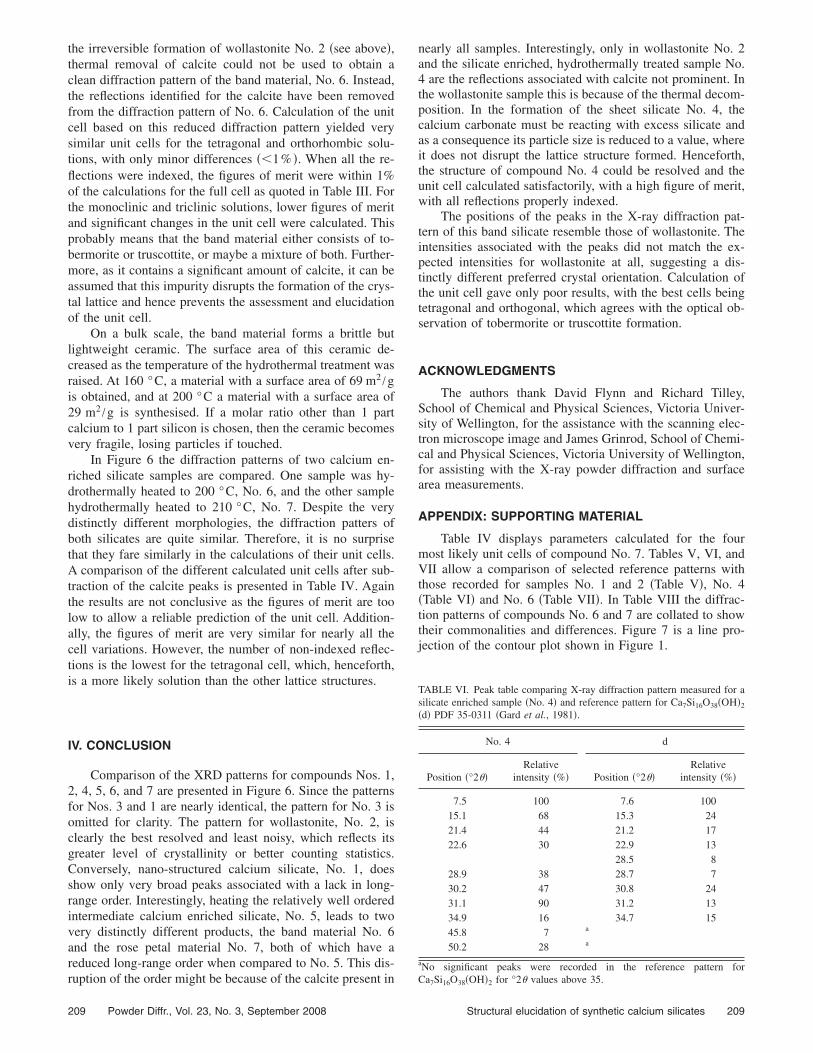
In Figure 6 the diffraction patterns of two calcium en-riched silicate samples are compared. One sample was hy-drothermally heated to 200 °C, No. 6, and the other samplehydrothermally heated to 210 °C, No. 7. Despite the verydistinctly different morphologies, the diffraction patters ofboth silicates are quite similar. Therefore, it is no surprisethat they fare similarly in the calculations of their unit cells.A comparison of the different calculated unit cells after sub-traction of the calcite peaks is presented in Table IV. Againthe results are not conclusive as the figures of merit are toolow to allow a reliable prediction of the unit cell. Addition-ally, the figures of merit are very similar for nearly all thecell variations. However, the number of non-indexed reflec-tions is the lowest for the tetragonal cell, which, henceforth,is a more likely solution than the other lattice structures.
IV. CONCLUSION
Comparison of the XRD patterns for compounds Nos. 1,2, 4, 5, 6, and 7 are presented in Figure 6. Since the patternsfor Nos. 3 and 1 are nearly identical, the pattern for No. 3 isomitted for clarity. The pattern for wollastonite, No. 2, isclearly the best resolved and least noisy, which reflects itsgreater level of crystallinity or better counting statistics.Conversely, nano-structured calcium silicate, No. 1, doesshow only very broad peaks associated with a lack in long-range order. Interestingly, heating the relatively well orderedintermediate calcium enriched silicate, No. 5, leads to twovery distinctly different products, the band material No. 6and the rose petal material No. 7, both of which have areduced long-range order when compared to No. 5. This dis-
ruption of the order might be because of the calcite present in209 Powder Diffr., Vol. 23, No. 3, September 2008
nearly all samples. Interestingly, only in wollastonite No. 2and the silicate enriched, hydrothermally treated sample No.4 are the reflections associated with calcite not prominent. Inthe wollastonite sample this is because of the thermal decom-position. In the formation of the sheet silicate No. 4, thecalcium carbonate must be reacting with excess silicate andas a consequence its particle size is reduced to a value, whereit does not disrupt the lattice structure formed. Henceforth,the structure of compound No. 4 could be resolved and theunit cell calculated satisfactorily, with a high figure of merit,with all reflections properly indexed.
The positions of the peaks in the X-ray diffraction pat-tern of this band silicate resemble those of wollastonite. Theintensities associated with the peaks did not match the ex-pected intensities for wollastonite at all, suggesting a dis-tinctly different preferred crystal orientation. Calculation ofthe unit cell gave only poor results, with the best cells beingtetragonal and orthogonal, which agrees with the optical ob-servation of tobermorite or truscottite formation.
ACKNOWLEDGMENTS
The authors thank David Flynn and Richard Tilley,School of Chemical and Physical Sciences, Victoria Univer-sity of Wellington, for the assistance with the scanning elec-tron microscope image and James Grinrod, School of Chemi-cal and Physical Sciences, Victoria University of Wellington,for assisting with the X-ray powder diffraction and surfacearea measurements.
APPENDIX: SUPPORTING MATERIAL
Table IV displays parameters calculated for the fourmost likely unit cells of compound No. 7. Tables V, VI, andVII allow a comparison of selected reference patterns withthose recorded for samples No. 1 and 2 �Table V�, No. 4�Table VI� and No. 6 �Table VII�. In Table VIII the diffrac-tion patterns of compounds No. 6 and 7 are collated to showtheir commonalities and differences. Figure 7 is a line pro-jection of the contour plot shown in Figure 1.
TABLE VI. Peak table comparing X-ray diffraction pattern measured for asilicate enriched sample �No. 4� and reference pattern for Ca7Si16O38�OH�2
�d� PDF 35-0311 �Gard et al., 1981�.
No. 4 d
Position �°2��Relative
intensity �%� Position �°2��Relative
intensity �%�
7.5 100 7.6 10015.1 68 15.3 2421.4 44 21.2 1722.6 30 22.9 13
28.5 828.9 38 28.7 730.2 47 30.8 2431.1 90 31.2 1334.9 16 34.7 1545.8 7 a
50.2 28 a
aNo significant peaks were recorded in the reference pattern for
Ca7Si16O38�OH�2 for °2� values above 35.209Structural elucidation of synthetic calcium silicates
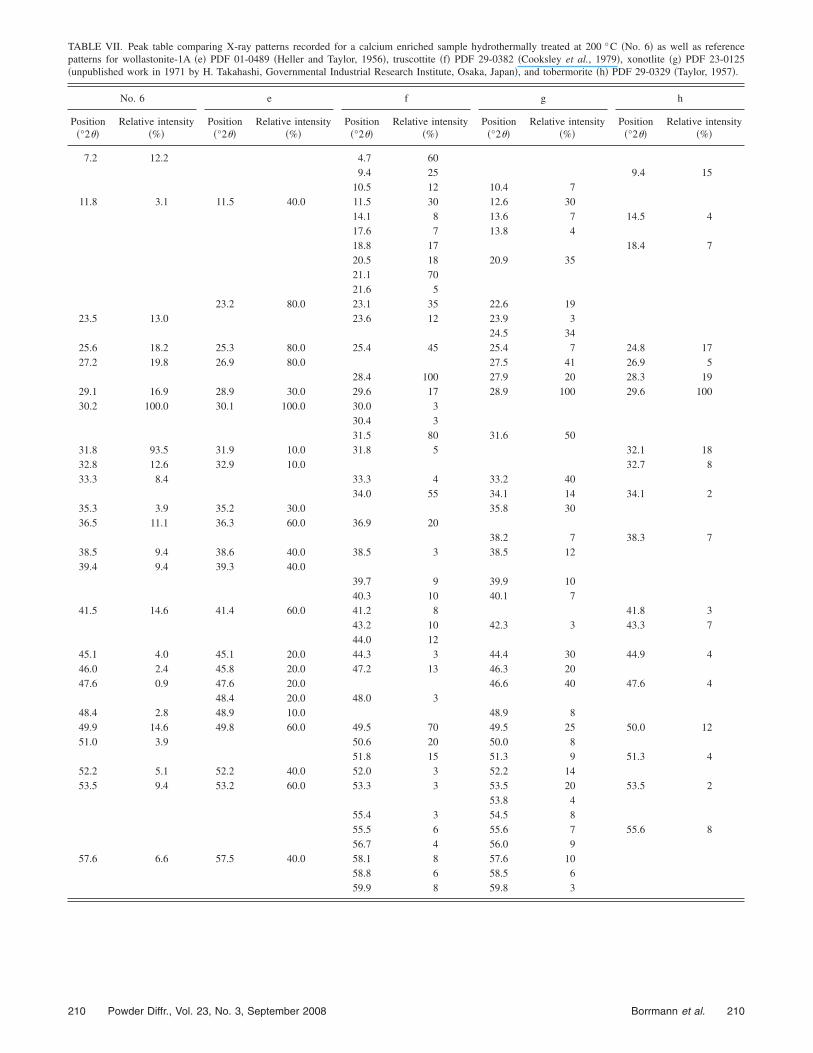
TABLE VII. Peak table comparing X-ray patterns recorded for a calcium enriched sample hydrothermally treated at 200 °C �No. 6� as well as referencepatterns for wollastonite-1A �e� PDF 01-0489 �Heller and Taylor, 1956�, truscottite �f� PDF 29-0382 �Cooksley et al., 1979�, xonotlite �g� PDF 23-0125�unpublished work in 1971 by H. Takahashi, Governmental Industrial Research Institute, Osaka, Japan�, and tobermorite �h� PDF 29-0329 �Taylor, 1957�.
No. 6 e f g h
Position�°2��
Relative intensity�%�
Position�°2��
Relative intensity�%�
Position�°2��
Relative intensity�%�
Position�°2��
Relative intensity�%�
Position�°2��
Relative intensity�%�
7.2 12.2 4.7 609.4 25 9.4 15
10.5 12 10.4 711.8 3.1 11.5 40.0 11.5 30 12.6 30
14.1 8 13.6 7 14.5 417.6 7 13.8 418.8 17 18.4 720.5 18 20.9 3521.1 7021.6 5
23.2 80.0 23.1 35 22.6 1923.5 13.0 23.6 12 23.9 3
24.5 3425.6 18.2 25.3 80.0 25.4 45 25.4 7 24.8 1727.2 19.8 26.9 80.0 27.5 41 26.9 5
28.4 100 27.9 20 28.3 1929.1 16.9 28.9 30.0 29.6 17 28.9 100 29.6 10030.2 100.0 30.1 100.0 30.0 3
30.4 331.5 80 31.6 50
31.8 93.5 31.9 10.0 31.8 5 32.1 1832.8 12.6 32.9 10.0 32.7 833.3 8.4 33.3 4 33.2 40
34.0 55 34.1 14 34.1 235.3 3.9 35.2 30.0 35.8 3036.5 11.1 36.3 60.0 36.9 20
38.2 7 38.3 738.5 9.4 38.6 40.0 38.5 3 38.5 1239.4 9.4 39.3 40.0
39.7 9 39.9 1040.3 10 40.1 7
41.5 14.6 41.4 60.0 41.2 8 41.8 343.2 10 42.3 3 43.3 744.0 12
45.1 4.0 45.1 20.0 44.3 3 44.4 30 44.9 446.0 2.4 45.8 20.0 47.2 13 46.3 2047.6 0.9 47.6 20.0 46.6 40 47.6 4
48.4 20.0 48.0 348.4 2.8 48.9 10.0 48.9 849.9 14.6 49.8 60.0 49.5 70 49.5 25 50.0 1251.0 3.9 50.6 20 50.0 8
51.8 15 51.3 9 51.3 452.2 5.1 52.2 40.0 52.0 3 52.2 1453.5 9.4 53.2 60.0 53.3 3 53.5 20 53.5 2
53.8 455.4 3 54.5 855.5 6 55.6 7 55.6 856.7 4 56.0 9
57.6 6.6 57.5 40.0 58.1 8 57.6 1058.8 6 58.5 659.9 8 59.8 3
210 210Powder Diffr., Vol. 23, No. 3, September 2008 Borrmann et al.
Boikova, A. I. and Toropov, N. A. �1964�. “Stoichiometry and polymor-phism of tricalcium silicate,” Dokl. Akad. Nauk SSSR 156, 1428–1431.
Borrmann, T., McFarlane, A. J., Johnston, J. H., Markwitz, A., and Dy-tlewski, N. �2005�. “Heavy-ion elastic recoil detection analysis as a use-ful tool for tracking experimental modifications in bulk calcium sili-
Figure 7. �Color online� See caption for Figure 1.
TABLE VIII. A comparison of the diffraction patterns of two calcium enricand the other to 210 °C �No. 7�.
No. 6 No. 7
Position �°2��Relative intensity
�%� Position �°2��Relative intensity
�%�
7.2 12.2 6.5 13.511.8 3.1 11.6 3
19.3 5.923.5 13.0 23.3 19.725.6 18.2 25.5 19.827.2 19.8 27.1 22.5
27.8 10.529.1 16.9 29.0 24.430.2 100.0 30.2 100
31.2 20.331.8 93.532.8 12.6 32.3 69.333.3 8.4 33.5 45.9
34.5 25.935.3 3.9 35.4 5.736.5 11.1 36.4 11.6
37.4 8.1
cates,” Surf. Interface Anal. 37, 695–698.
211 Powder Diffr., Vol. 23, No. 3, September 2008
Cairns, M. J., Borrmann, T., Höll, W. H., and Johnston, J. H. �2006�. “Studyof the uptake of copper ions by nanostructured calcium silicate,” Mi-croporous Mesoporous Mater. 95, 126–134.
Cooksley, B., Lachowski, E. E., Murray, L. W., and Taylor, F. M. �1979�.“Truscottite-composition and ionic substitutions,” Miner. Mag. 43, 333–336.
Drits, V. A. �2003�. “Structural and chemical heterogeneity of layer silicatesand clay minerals,” Clay Miner. 38, 403–432.
Gard, J. A., Luke, K., and Taylor, H. F. W. �1981�. “Ca7Si16O40H2, a newcalcium silicate hydrate phase of the truscottite group,” Cem. Concr.Res. 11, 659–664.
Gorce, J.-P. and Milestone, N. B. �2007�. “Probing the microstructure andwater phases in composite cement blends,” Cem. Concr. Res. 37, 310–318.
Han, Y., Wang, Z., Li, X., Fu, J., and Cheng, Z. �2001�. “Polymer-layeredsilicate nanocomposites: synthesis, characterization, properties and ap-plications,” Curr. Trends Polym. Sci. 6, 1–16.
Heller, L. and Taylor, F. M. �1956�. Crystallographic Data for CalciumSilicates �H. M. S. O., London�.
Hoshino, S., Yamada, K., and Hirao, H. �2006�. “XRD/Rietveld analysis ofthe hydration and strength development of slag and limestone blendedcement,” J. Adv. Concr. Technol. 4, 357–367.
Iler, R. K. �1979�. The Chemistry of Silica: Solubility, Polymerization, Col-loid and Surface Properties and Biochemistry of Silica �Wiley, NewYork�.
Johnston, J. H., McFarlane, A. J., and Borrmann, T. �2005�. “Nano-structured Calcium Silicate, Functionalised Forms Thereof, Preparationand Uses,” New Zealand Patent Application 537747.
Le Bail, A. �2004�. “Monte Carlo indexing with McMaille,” Powder Diffr.19, 249–254.
Long, L. H., Chen, L. D., Bai, S. Q., Chang, J., and Lin, K. L. �2006�.“Preparation of dense �-CaSiO3 ceramic with high mechanical strengthand HAp formation ability in simulated body fluid,” J. Eur. Ceram. Soc.26, 1701–1706.
MacKenzie, K. J. D., Komphanchai, S., and Fletcher, R. A. �2007�. “Newtrends in the chemistry of inorganic polymers for advanced applica-tions,” in Developments in Porous, Biological and Geopolymer Ceram-ics: Ceramic Engineering and Science Proceedings, Volume 28, Issue 9,edited by M. E. Brito, E. Case, W. M. Kriven, J. Salem, and D. Zhu�Wiley-American Ceramic Society, Westerville, OH�, pp. 249–256.
Matsueda, H. �1973�. “Iron-wollastonite from the Sampo mine showingproperties distinct from those of wollastonite,” Mineral. J. 7, 180–201.
Milestone, N. B. �1999�. “Hydrothermal and nonambient curing of cement
ilicate samples, one for a sample hydrothermally heated to 200 °C �No. 6�
No. 6 No. 7
osition �°2��Relative intensity
�%� Position �°2��Relative intensity
�%�
38.5 9.4 38.5 9.439.4 9.4 39.3 17.9
39.6 23.640.4 7.341.3 58.6
41.5 14.6 43.6 7.645.1 4.0 44.9 1746.0 2.4 46.2 12.847.6 0.948.4 2.8 48.2 9.949.9 14.6 49.9 15.351.0 3.9 51.1 1052.2 5.1 52.2 11.653.5 9.4 53.3 15.5
56.7 11.157.6 6.6
58.5 8.6
hed s
P
and concrete,” in Cements Research Progress: 1997, edited by L. J.
211Structural elucidation of synthetic calcium silicates

Struble �American Ceramic Society, Westerville, OH�, pp. 107–128.Ohashi, Y. and Finger, L. W. �1978�. “The role of octahedral cations in
pyroxenoid crystal chemistry. I. Bustamite, wollastonite, and thepectolite-schizolite-serandite series,” Am. Mineral. 63, 274–288.
Ratinac, K. R., Zhu, H. Y., Stadtmueller, L. M., and Ringer, S. P. �2002�.“Case studies in nanostructural analysis for understanding nanomateri-als,” Mater. Forum 26, 44–73.
Rehak, P., Kunath-Fandrei, G., Losso, P., Hildmann, B., Schneider, H., andJäger, C. �1998�. “Study of the Al coordination in mullites with varyingAl:Si ratio by 27Al NMR spectroscopy and X-ray diffraction,” Am. Min-eral. 83, 1266–1276.
Rietveld, H. M. �1969�. “Profile refinement method for nuclear and mag-
212 Powder Diffr., Vol. 23, No. 3, September 2008
netic structures,” J. Appl. Crystallogr. 2, 65–71.Swanson, H. E. and Fuyat, R. K. �1953�. Standard X-ray Diffraction Powder
Patterns (National Bureau of Standards Circular No. 539) �U.S. Gov-ernment Printing Office, Washington�, Vol. 2, p. 51.
Taylor, H. F. W. �1957�. “The dehydration of tobermorite,” Clays ClayMiner. 6, 101–109.
Zilg, C., Reichert, P., Dietsche, F., Engelhardt, T., and Muelhaupt, R. �1998�.“Polymer and rubber nanocomposites based upon layered silicates,”Kunststoffe Plast. Eur. 88, 1812–1820.
Zotov, N. �1990�. “Structure of natural silicate glasses. Interferences from
x-ray diffraction studies,” Rostocker Phys. Manuskripte 14, 5–15.212Borrmann et al.


