Embed Size (px)
Citation preview
61
Miocene Dam Formation, QatarGeoArabia, Vol. 12, No. 3, 2007Gulf PetroLink, Bahrain
Strontium (87Sr/86Sr) and calcium isotope ratios (44Ca/40Ca-44Ca/42Ca) of the Miocene Dam Formation in Qatar: tools for stratigraphic correlation and environment analysis
Harald G. Dill and Friedhelm Henjes-Kunst
ABSTRACT
The Dam Formation in Qatar is a series consisting of calcareous (calcite, dolomite) and evaporitic sediments (gypsum, celestite) that developed under subtidal through supratidal conditions passing towards younger and older series in an environment of deposition more akin to modern beach deposits. In the present study 87Sr/86Sr ratios, δ44/40Ca and δ44/42Ca data are discussed together with δ13C and δ18O values obtained during an environmental analysis carried out previously. Rather uniform isotope curves of the Sr, Ca and O isotopes for tidal deposits are replaced by more oscillating ones when these tidal-influenced regimes became substituted for by a more wave-dominated regime. Calcium isotope ratios still at its infancy and not fully understood seem to provide a new tool in carbonate petrography when it comes to an interpretation of the environment of deposition and calcification of dolomitic series. The Sr isotopes not only indicate an influx of more primitive Sr from the hinterland but also allow for a refinement of the stratigraphy, which yields a late Aquitanian to early Burdigalian age of sedimentation for the Dam Formation in Qatar.
INTRODUCTION
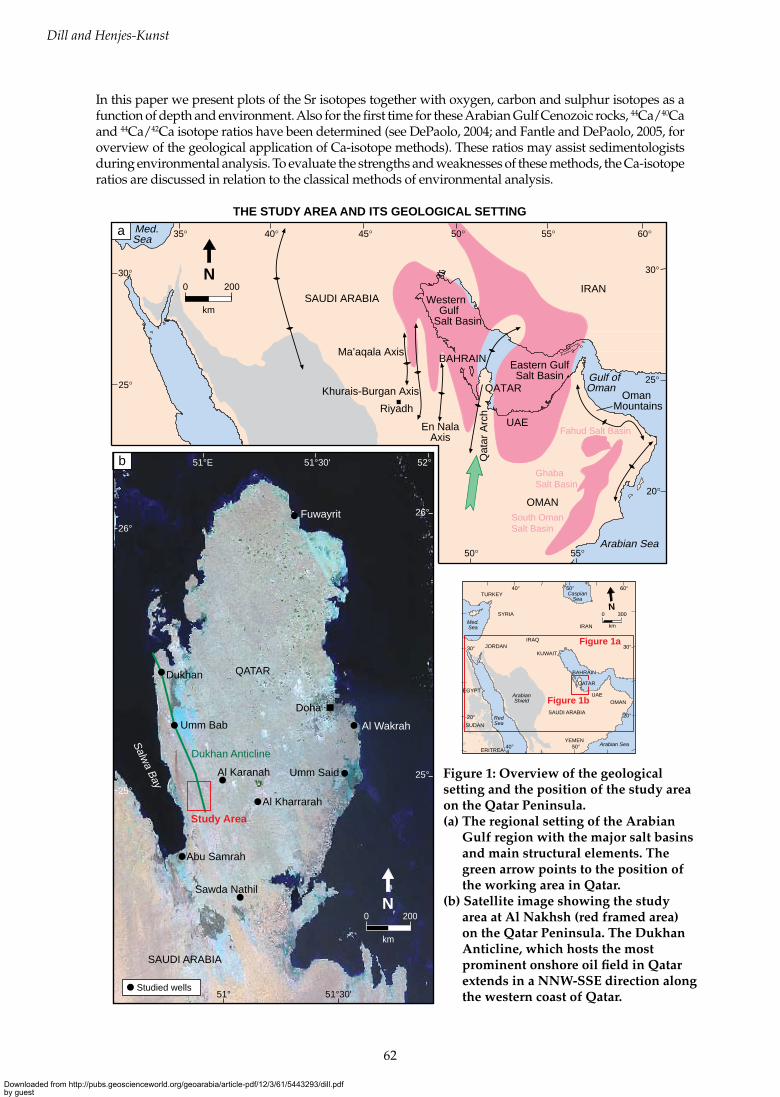
Holocene carbonate and evaporite sequences in the Arabian Gulf, located mainly along the coasts of the United Arab Emirates (UAE) and Kuwait, have been studied by sedimentologists and ecologists alike (e.g. Shinn, 1983; Sheppard et al., 1992; Saleh et al., 1999; Alsharhan and Kendall, 2002, and references cited therein). In contrast, the sabkhas of the Qatar Peninsula have not been as extensively investigated (Figure 1a). The Qatar Peninsula is the surface expression of the Qatar Arch, a deep structural trend that projects northwards from the Arabian Peninsula into the Arabian Gulf (Cavelier, 1970; Figure 1a). It is covered mainly by Quaternary sandy dunes, aeolianites and calcareous coastal sediments that rest upon Miocene and Eocene calcareous and evaporitic rocks. Despite the great number of outcrops, the investigation of Qatar’s geology is primarily limited to biostratigraphic studies of the calcareous Cenozoic sediments (El Beialy and Al-Hitmi, 1994; Al-Hinai et al., 1997; Al-Saad and Ibrahim, 2002).
In southwest Qatar, the prominent Dukhan Anticline hosts the NNW-trending onshore Dukhan giant oilfield (Sugden, 1962; Foster and Beaumont, 1991; Dill et al., 2003, 2005) (Figure 1b). It presents an excellent locality to study, not only Holocene sabkha sequences, but also the Neogene offshore and continental sediments. Accordingly a research project was conducted to study the sedimentary petrography, mineralogy and chemistry of these sediments. Supplementary palaeontological data were obtained by the study of body and ichnofossils (Dill et al., 2005).
Based upon the palaeontological and sedimentological data, a palaeoecological-palaeoenvironmental analysis of the evaporite-bearing series was successfully concluded (Dill et al., 2005); however the biostratigraphic age of the sediments was not possible. In places, the diversity of species of the macrofossil assemblages is low while the number of individuals is considerably high. This pattern implies a strong environmental stress, and in many beds fossils are absent due to the inhospitable conditions. To circumvent these palaeontological limitations, 87Sr/86Sr ratios of the marine sedimentary rocks were determined and compared with the sea-water ratios (De La Rocha and DePaolo, 2000). Trends of Sr-isotope ratios measured in marine series may be used to both constrain geochronological estimates and to refine the interpretation of palaeohydrological conditions in nearshore environments.
Downloaded from http://pubs.geoscienceworld.org/geoarabia/article-pdf/12/3/61/5443293/dill.pdfby gueston 11 February 2022
62
Dill and Henjes-Kunst
Fahud Salt Basin
Ghaba Salt Basin
South Oman Salt Basin
Med.Sea
IRAN
25°
35°
30°30°
40° 45° 50° 55°
15°
60°50° 55°35° 45°
45°
50° 55°
40°
15°
20° 20°
25°
THE STUDY AREA AND ITS GEOLOGICAL SETTING
Gulf of Aden
Gulf ofOman
Arabian Sea
QATAR
BAHRAIN
UAE
Qat
ar A
rch
SAUDI ARABIA
Riyadh
YEMEN
En NalaAxis
Khurais-Burgan Axis
Ma’aqala AxisEastern GulfSalt Basin
Oman Mountains
OMAN
Western Gulf
Salt Basin
N0 200
km
a
Umm Bab
Salwa Bay
Dukhan
Dukhan Anticline
Doha
Fuwayrit
Al Wakrah
Umm Said
Al Kharrarah
Al Karanah
Abu Samrah
Sawda Nathil
QATAR
SAUDI ARABIA
Studied wells
26°
25°
26°
25°
51° 51°30'
51°E 51°30' 52°
Study Area
b
ArabianShield
CaspianSea
Med.Sea
RedSea
Arabian Sea
SYRIA
Figure 1a
Figure 1b
TURKEY
SAUDI ARABIA
YEMEN
IRAQ
IRAN
ERITREA
SUDAN
JORDAN
BAHRAIN
KUWAIT
OMANUAE
0 300
km
N
N0 200
km
EGYPTQATAR
Figure 1: Overview of the geological setting and the position of the study area on the Qatar Peninsula. (a) The regional setting of the Arabian
Gulf region with the major salt basins and main structural elements. The green arrow points to the position of the working area in Qatar.
(b) Satellite image showing the study area at Al Nakhsh (red framed area) on the Qatar Peninsula. The Dukhan Anticline, which hosts the most prominent onshore oil field in Qatar extends in a NNW-SSE direction along the western coast of Qatar.
In this paper we present plots of the Sr isotopes together with oxygen, carbon and sulphur isotopes as a function of depth and environment. Also for the first time for these Arabian Gulf Cenozoic rocks, 44Ca/40Ca and 44Ca/42Ca isotope ratios have been determined (see DePaolo, 2004; and Fantle and DePaolo, 2005, for overview of the geological application of Ca-isotope methods). These ratios may assist sedimentologists during environmental analysis. To evaluate the strengths and weaknesses of these methods, the Ca-isotope ratios are discussed in relation to the classical methods of environmental analysis.
Downloaded from http://pubs.geoscienceworld.org/geoarabia/article-pdf/12/3/61/5443293/dill.pdfby gueston 11 February 2022
63
Miocene Dam Formation, Qatar
ANALYTICAL METHODS
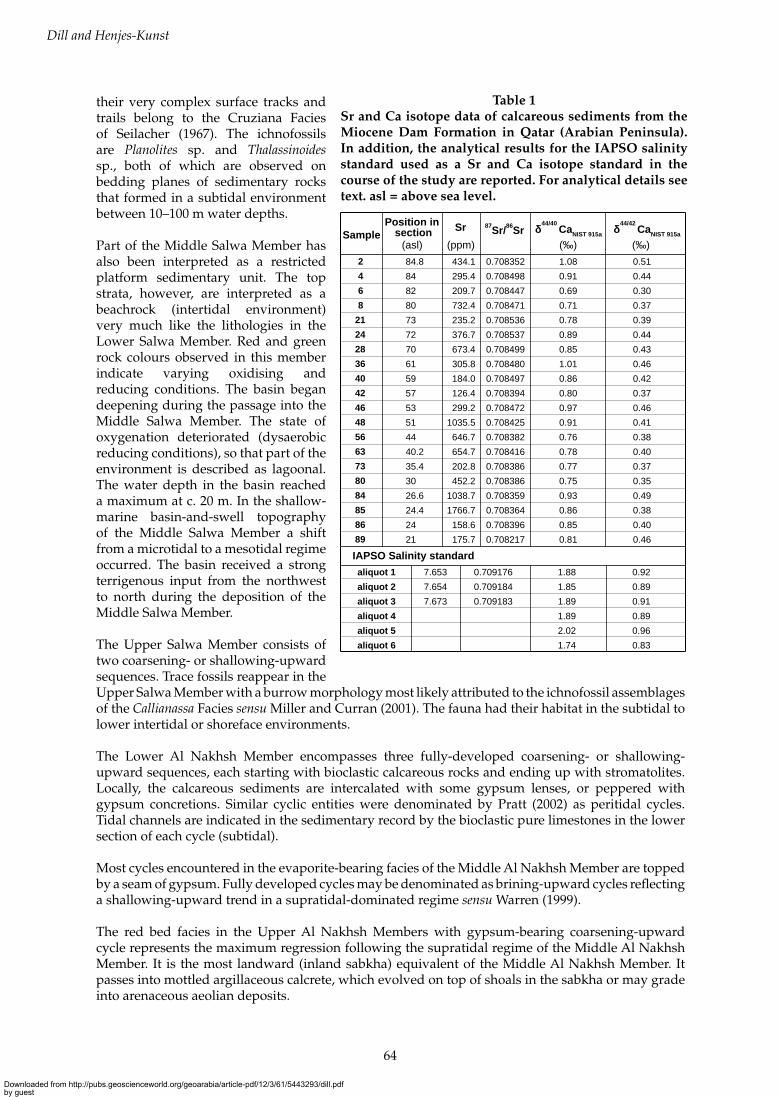
Twenty samples were investigated for their Sr and Ca isotope compositions and their Sr concentrations. Sr and Ca isotope analyses were performed at the Federal Institute for Geosciences and Natural Resources, Hannover (BGR). Approximately 50 mg of the sample powders were weighed into Teflon beakers and dissolved in 5 ml ~1.6 M distilled acetic acid at temperatures of 100–140°C on a hot plate for about 32 hours. This procedure was applied in order to dissolve the carbonates but avoid leaching of silicates in the residue. The leachate was separated and recovered from the sample solutions during several steps of centrifuging and washing with ultra-pure water. Different aliquots of the leachate were spiked for determination of Sr concentration using a single Sr spike on the one hand, and for Ca-isotope determination using a double spike enriched in 43Ca and 48Ca, on the other. The leachates were dried and then converted to chlorides. Sr and Ca fractions for mass spectrometrical isotope determination were obtained by standard cation-exchange techniques. An international seawater salinity standard (IAPSO) used as a Sr- and Ca-isotope reference material was treated in a similar manner.
Sr (approximately 200 ng) and Ca (approximately 4 µg) were loaded on Re filaments and run on a double-filament assembly using a Thermo Triton multicollector mass spectrometre in static (Sr) and dynamic (Ca) modes. During Ca-isotope measurement, 40K interference at 40Ca were monitored via 41K but was generally found to be negligible. All Ca samples were measured in replicate (n = 2, 3), the mean of which are reported here. Sr-isotopic ratios were normalised to 86Sr/88Sr = 0.1194. In the course of this study, repeated measurements of the NIST 987 Sr-isotope standard yielded a mean value for 87Sr/86Sr of 0.710248 ± 16 (2 SD). For IAPSO we obtained a Sr concentration of 7.66 ± 0.02 (2 SD) ppm and a 87Sr/86Sr = 0.709181 ± 8 (2 SD; n = 3). The latter value corresponds within error limit to a 87Sr/86Sr ratio of 0.709175 for modern sea water (e.g. Howarth and McArthur, 1997). Because of the young age of the investigated sediments and their very low Rb/Sr ratio as indicated by XRF analysis (Dill et al., 2005), no age correction of the 87Sr/86Sr ratio for decay of 87Rb was applied. Ca-isotope ratios were calculated from mass spectrometric raw data according to the procedure described by Heuser et al. (2002) and are reported in the common delta notation:
δ 44/40Ca = [(44Ca/40Ca)sample/(44Ca/40Ca)standard-1]*1000 and
δ 44/42Ca = [(44Ca/42Ca)sample/(44Ca/42Ca)standard-1]*1000 in per mil and as the difference to the respective values determined for the NIST SRM915a clinical carbonate standard at the BGR (δ44/40CaNIST 915a and δ44/42CaNIST 915a) (Coplen et al., 2002; Hippler et al., 2003). In the course of this study, we obtained δ44/40CaNIST 915a and δ44/42CaNIST 915a values of 1.88 ± 0.20‰ and 0.89 ± 0.09‰ (2 SD; n = 6), respectively for IAPSO, which agree within error to values determined for this material at other laboratories (e.g. Hippler et al., 2003; Schmitt et al., 2003a). Procedural blanks for Sr and Ca are less than 0.1% of the relevant sample concentration and are therefore negligible. Uncertainties are reported as 2 sigma standard deviation (2 SD) and are 25 ppm for 87Sr/86Sr. Although replicate Ca measurements of samples yielded in part uncertainties that are < 0.10‰ and < 0.05‰ for δ44/40Ca and δ44/42Ca, respectively, we assume that the uncertainties quoted above for repeated determinations of homogenous reference materials are more representative of the overall errors in Ca isotope determination. In all calculations, the IUGS-recommended constants (Steiger and Jäger, 1977) were used. The analytical results are presented in Table 1.
LITHOFACIES AND DEPOSITIONAL ENVIRONMENT OF THE MIOCENE DAM FORMATION IN QATAR
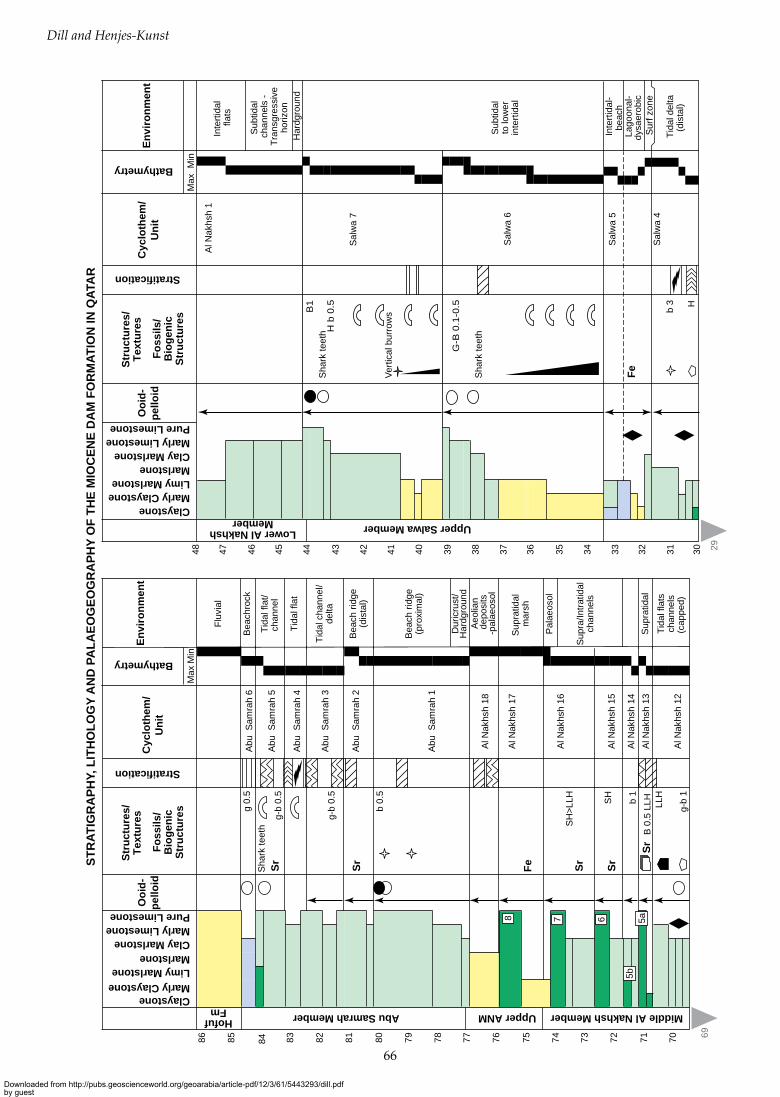
The Neogene Dam Formation was subdivided by Dill et al. (2005) into seven members named after type localities on the Qatar Peninsula (Figure 2). In the following paragraphs an overview of the environment of deposition is given based on Dill et al. (2005).
The Lower Salwa Member is a silicate-dolomite-calcite sequence. Fine-grained siliciclastics at the base indicate a deeper marine environment. Calcitic clay-rich marlstone, forming the top stratum indicate an intertidal to beach environment. Bright grey tints among the rock colours are unambiguous redox indicators for well-oxygenated conditions. Trace fossils are ubiquitous in the Lower Salwa Member;
Downloaded from http://pubs.geoscienceworld.org/geoarabia/article-pdf/12/3/61/5443293/dill.pdfby gueston 11 February 2022
64
Dill and Henjes-Kunst
their very complex surface tracks and trails belong to the Cruziana Facies of Seilacher (1967). The ichnofossils are Planolites sp. and Thalassinoides sp., both of which are observed on bedding planes of sedimentary rocks that formed in a subtidal environment between 10–100 m water depths.
Part of the Middle Salwa Member has also been interpreted as a restricted platform sedimentary unit. The top strata, however, are interpreted as a beachrock (intertidal environment) very much like the lithologies in the Lower Salwa Member. Red and green rock colours observed in this member indicate varying oxidising and reducing conditions. The basin began deepening during the passage into the Middle Salwa Member. The state of oxygenation deteriorated (dysaerobic reducing conditions), so that part of the environment is described as lagoonal. The water depth in the basin reached a maximum at c. 20 m. In the shallow-marine basin-and-swell topography of the Middle Salwa Member a shift from a microtidal to a mesotidal regime occurred. The basin received a strong terrigenous input from the northwest to north during the deposition of the Middle Salwa Member.
The Upper Salwa Member consists of two coarsening- or shallowing-upward sequences. Trace fossils reappear in the Upper Salwa Member with a burrow morphology most likely attributed to the ichnofossil assemblages of the Callianassa Facies sensu Miller and Curran (2001). The fauna had their habitat in the subtidal to lower intertidal or shoreface environments.
The Lower Al Nakhsh Member encompasses three fully-developed coarsening- or shallowing-upward sequences, each starting with bioclastic calcareous rocks and ending up with stromatolites. Locally, the calcareous sediments are intercalated with some gypsum lenses, or peppered with gypsum concretions. Similar cyclic entities were denominated by Pratt (2002) as peritidal cycles. Tidal channels are indicated in the sedimentary record by the bioclastic pure limestones in the lower section of each cycle (subtidal).
Most cycles encountered in the evaporite-bearing facies of the Middle Al Nakhsh Member are topped by a seam of gypsum. Fully developed cycles may be denominated as brining-upward cycles reflecting a shallowing-upward trend in a supratidal-dominated regime sensu Warren (1999).
The red bed facies in the Upper Al Nakhsh Members with gypsum-bearing coarsening-upward cycle represents the maximum regression following the supratidal regime of the Middle Al Nakhsh Member. It is the most landward (inland sabkha) equivalent of the Middle Al Nakhsh Member. It passes into mottled argillaceous calcrete, which evolved on top of shoals in the sabkha or may grade into arenaceous aeolian deposits.
Table 1 Sr and Ca isotope data of calcareous sediments from the Miocene Dam Formation in Qatar (Arabian Peninsula). In addition, the analytical results for the IAPSO salinity standard used as a Sr and Ca isotope standard in the course of the study are reported. For analytical details see text. asl = above sea level.
Position in sectionSample
Sr 87Sr/86Sr δ44/40 CaNIST 915a δ
44/42 CaNIST 915a
2468
21242836404246485663738084858689
84.8 434.1 0.708352 1.08 0.5184 295.4 0.708498 0.91 0.4482 209.7 0.708447 0.69 0.3080 732.4 0.708471 0.71 0.3773 235.2 0.708536 0.78 0.3972 376.7 0.708537 0.89 0.4470 673.4 0.708499 0.85 0.4361 305.8 0.708480 1.01 0.4659 184.0 0.708497 0.86 0.4257 126.4 0.708394 0.80 0.3753 299.2 0.708472 0.97 0.4651 1035.5 0.708425 0.91 0.4144 646.7 0.708382 0.76 0.3840.2 654.7 0.708416 0.78 0.4035.4 202.8 0.708386 0.77 0.3730 452.2 0.708386 0.75 0.3526.6 1038.7 0.708359 0.93 0.4924.4 1766.7 0.708364 0.86 0.3824 158.6 0.708396 0.85 0.4021 175.7 0.708217 0.81 0.46
7.653 0.709176 1.88 0.92 7.654 0.709184 1.85 0.89 7.673 0.709183 1.89 0.91 1.89 0.89 2.02 0.96 1.74 0.83
(asl) (ppm) (‰) (‰)
IAPSO Salinity standardaliquot 1aliquot 2aliquot 3aliquot 4aliquot 5aliquot 6
Downloaded from http://pubs.geoscienceworld.org/geoarabia/article-pdf/12/3/61/5443293/dill.pdfby gueston 11 February 2022
65
Miocene Dam Formation, Qatar
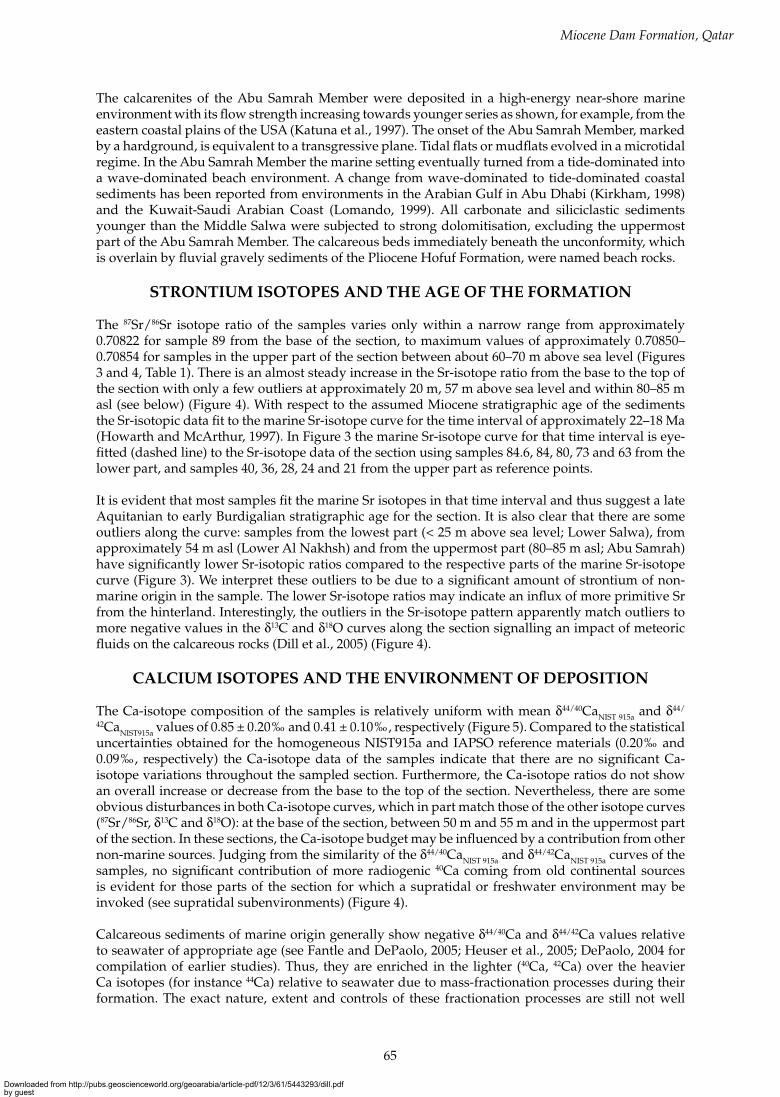
The calcarenites of the Abu Samrah Member were deposited in a high-energy near-shore marine environment with its flow strength increasing towards younger series as shown, for example, from the eastern coastal plains of the USA (Katuna et al., 1997). The onset of the Abu Samrah Member, marked by a hardground, is equivalent to a transgressive plane. Tidal flats or mudflats evolved in a microtidal regime. In the Abu Samrah Member the marine setting eventually turned from a tide-dominated into a wave-dominated beach environment. A change from wave-dominated to tide-dominated coastal sediments has been reported from environments in the Arabian Gulf in Abu Dhabi (Kirkham, 1998) and the Kuwait-Saudi Arabian Coast (Lomando, 1999). All carbonate and siliciclastic sediments younger than the Middle Salwa were subjected to strong dolomitisation, excluding the uppermost part of the Abu Samrah Member. The calcareous beds immediately beneath the unconformity, which is overlain by fluvial gravely sediments of the Pliocene Hofuf Formation, were named beach rocks.
STRONTIUM ISOTOPES AND THE AGE OF THE FORMATION
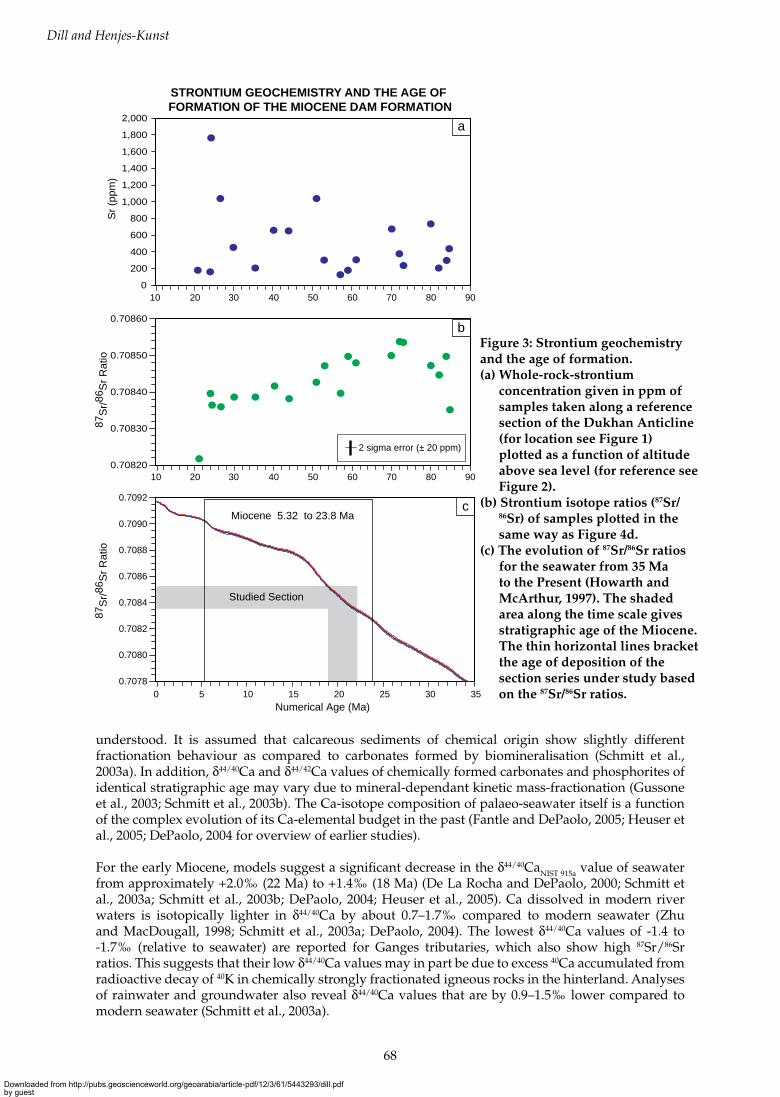
The 87Sr/86Sr isotope ratio of the samples varies only within a narrow range from approximately 0.70822 for sample 89 from the base of the section, to maximum values of approximately 0.70850–0.70854 for samples in the upper part of the section between about 60–70 m above sea level (Figures 3 and 4, Table 1). There is an almost steady increase in the Sr-isotope ratio from the base to the top of the section with only a few outliers at approximately 20 m, 57 m above sea level and within 80–85 m asl (see below) (Figure 4). With respect to the assumed Miocene stratigraphic age of the sediments the Sr-isotopic data fit to the marine Sr-isotope curve for the time interval of approximately 22–18 Ma (Howarth and McArthur, 1997). In Figure 3 the marine Sr-isotope curve for that time interval is eye-fitted (dashed line) to the Sr-isotope data of the section using samples 84.6, 84, 80, 73 and 63 from the lower part, and samples 40, 36, 28, 24 and 21 from the upper part as reference points.
It is evident that most samples fit the marine Sr isotopes in that time interval and thus suggest a late Aquitanian to early Burdigalian stratigraphic age for the section. It is also clear that there are some outliers along the curve: samples from the lowest part (< 25 m above sea level; Lower Salwa), from approximately 54 m asl (Lower Al Nakhsh) and from the uppermost part (80–85 m asl; Abu Samrah) have significantly lower Sr-isotopic ratios compared to the respective parts of the marine Sr-isotope curve (Figure 3). We interpret these outliers to be due to a significant amount of strontium of non-marine origin in the sample. The lower Sr-isotope ratios may indicate an influx of more primitive Sr from the hinterland. Interestingly, the outliers in the Sr-isotope pattern apparently match outliers to more negative values in the δ13C and δ18O curves along the section signalling an impact of meteoric fluids on the calcareous rocks (Dill et al., 2005) (Figure 4).
CALCIUM ISOTOPES AND THE ENVIRONMENT OF DEPOSITION
The Ca-isotope composition of the samples is relatively uniform with mean δ44/40CaNIST 915a and δ44/
42CaNIST915a values of 0.85 ± 0.20‰ and 0.41 ± 0.10‰, respectively (Figure 5). Compared to the statistical uncertainties obtained for the homogeneous NIST915a and IAPSO reference materials (0.20‰ and 0.09‰, respectively) the Ca-isotope data of the samples indicate that there are no significant Ca-isotope variations throughout the sampled section. Furthermore, the Ca-isotope ratios do not show an overall increase or decrease from the base to the top of the section. Nevertheless, there are some obvious disturbances in both Ca-isotope curves, which in part match those of the other isotope curves (87Sr/86Sr, δ13C and δ18O): at the base of the section, between 50 m and 55 m and in the uppermost part of the section. In these sections, the Ca-isotope budget may be influenced by a contribution from other non-marine sources. Judging from the similarity of the δ44/40CaNIST 915a and δ44/42CaNIST 915a curves of the samples, no significant contribution of more radiogenic 40Ca coming from old continental sources is evident for those parts of the section for which a supratidal or freshwater environment may be invoked (see supratidal subenvironments) (Figure 4).
Calcareous sediments of marine origin generally show negative δ44/40Ca and δ44/42Ca values relative to seawater of appropriate age (see Fantle and DePaolo, 2005; Heuser et al., 2005; DePaolo, 2004 for compilation of earlier studies). Thus, they are enriched in the lighter (40Ca, 42Ca) over the heavier Ca isotopes (for instance 44Ca) relative to seawater due to mass-fractionation processes during their formation. The exact nature, extent and controls of these fractionation processes are still not well
Downloaded from http://pubs.geoscienceworld.org/geoarabia/article-pdf/12/3/61/5443293/dill.pdfby gueston 11 February 2022
66
Dill and Henjes-Kunst
Pure LimestoneMarly LimestoneClay MarlstoneMarlstoneLimy MarlstoneMarly ClaystoneClaystone
Stru
ctur
es/
Text
ures
Foss
ils/
Bio
geni
cSt
ruct
ures
Stratification
Cyc
loth
em/
Uni
t
Bathymetry
Stratification
Bathymetry
Min
Max
59 58 57 56 55 54 53 52 51 50 49
Lower Al Nakhsh Member
Sr
Sup
ratid
al
Sub
tidal
Cha
nnel
Sub
tidal
Cha
nnel
Tida
l fla
ts
with
cha
nnel
s an
d le
vees
Tida
l fla
ts
with
cha
nnel
s an
d le
vees
Al N
akhs
h 2
Sup
ratid
al
Al N
akhs
h 3
Sup
ratid
al
LLH
LLH
SLH
b 0.
5
H 0
.5
b 0.
5LL
H
LLH
b1
SH
H 2
g-b
1-2
b 0.
5-1.
5
LLH
48 47 46 45
Sub
tidal
ch
anne
ls -
Tran
sgre
ssiv
eho
rizon
Inte
rtida
l fla
ts
Al N
akhs
h 1
Har
dgro
und
86 85 84
83 82 81 80 79 78 77 76 75 74 73 72 71 70 6929 30
70 69 68 67
66
65 64
63
62 61 60
HofufFm Abu Samrah Member Middle Al Nakhsh Member Middle Al Nakhsh MemberUpper ANM
Tida
l fla
tsch
anne
ls
Tida
l fla
tsch
anne
ls
Tida
l fla
tsch
anne
ls(c
appe
d)
Tida
l fla
tsch
anne
ls(c
appe
d)
Tida
l fla
ts c
hann
els
Sup
ratid
alA
l Nak
hsh
4
Tida
l fla
ts
Sup
ratid
al
Al N
akhs
h 5
Man
grov
e sw
amp
Sup
ratid
alA
l Nak
hsh
6
Al N
akhs
h 7
Sup
ra/In
tratid
alA
l Nak
hsh
8
Sup
ratid
alA
l Nak
hsh
9
Al N
akhs
h 10
Al N
akhs
h 11
Al N
akhs
h 12
Al N
akhs
h 13
Sup
ratid
al
Sup
ra/In
tratid
alch
anne
ls
Al N
akhs
h 14
Al N
akhs
h 15
Al N
akhs
h 16
Pal
aeos
ol
Sup
ratid
al
mar
shAl
Nak
hsh
17
Al N
akhs
h 18
Bea
ch ri
dge
(pro
xim
al)
Dur
icru
st/
Har
dgro
und
Aeo
lian
depo
sits
-pal
aeos
ol
Abu
Sam
rah
1
Abu
Sam
rah
2B
each
ridg
e(d
ista
l)
Abu
Sam
rah
3Ti
dal c
hann
el/
delta
Abu
Sam
rah
4Ti
dal f
lat
Abu
Sam
rah
5Ti
dal f
lat/
chan
nel
Bea
chro
ckA
bu S
amra
h 6
Fluv
ial
Fe FeSr Sr Sr Sr
Sr
SrSr Fe
b 0.
5
LLH
b 0.
3-0.
5
LLH
H 1
.5
root
s
g-b
0.5LL
H-S
HLL
H
b-H
<0.5
g-b
0.5
H 1
H 0
.1 -1
LLH
>S
Hb
1
LLH
g-b
1
LLH
B 0
.5 L
LH
b 1
SH
SH
>LLH
b 0.
5
g-b
0.5
g-b
0.5
g 0.
5S
hark
teet
h
Pure LimestoneMarly LimestoneClay MarlstoneMarlstoneLimy MarlstoneMarly ClaystoneClaystone
Ooi
d-pe
lloid
Ooi
d-pe
lloid
Stru
ctur
es/
Text
ures
Foss
ils/
Bio
geni
cSt
ruct
ures
Cyc
loth
em/
Uni
tEn
viro
nmen
t
Min
Max
33 32 31 30 29 28 27 26 25 24 23 22 21 20 19
Middle Salwa Member
18 17
Fe
Sal
wa
1a
Sal
wa
2
Sal
wa
3
Sal
wa
4
Sal
wa
5
b 1
b 1
b 3 H
Fe
Fe
Sal
wa
1b
Lower Salwa Member
Res
trict
ed
plat
form
ope
nm
arin
e w
ell
oxyg
enat
ed
Tida
l del
ta(d
ista
l)
Sur
f zon
e/B
rack
ish
Res
trict
edpl
atfo
rm/
Lago
onal
-dy
saer
obic
Res
trict
edpl
atfo
rm/
Lago
onal
-po
or
oxyg
enat
ion
Lago
onal
-dy
saer
obic
Inte
rtida
l-be
ach
Inte
rtida
l-be
ach
Inte
rtida
l-be
ach
Sur
f zon
e
Sha
rk te
eth
Sha
rk te
eth
Sha
rk te
eth
Verti
cal b
urro
ws
Sha
rk te
eth
Sha
rk te
eth
44 43 42 41 40 39 38 37 36 35 34
Upper Salwa Member Lower Al Nakhsh Member
Sub
tidal
to
low
er
inte
rtida
l S
alw
a 6
Sal
wa
7
G-B
0.1
-0.5B1
H b
0.5
Envi
ronm
ent
Thin
ly b
edde
d, m
arly
inte
rbed
s
Wav
e rip
ples
Goe
thite
Foss
ils
Trou
gh c
ross
bed
ding
Cel
estit
e
gG
astro
pod
bBi
valv
e (p
elec
ypod
)
Her
ringb
one
cros
s be
ddin
g
Hal
ite (s
olut
ion
cast
s)
GH
igh
dive
rsity
Plan
ar c
ross
bed
ding
Dol
omite
gLo
w d
iver
sity
1cm
Aver
age
diam
eter
Pelle
t (al
gal+
feca
l)
Cal
cite
Ooi
d
Sulp
hate
Silic
icla
stic
s
Gyp
sum
cry
stal
sC
oars
enin
g-up
war
d cy
cle
Tepe
e st
ruct
ures
Fini
ng-u
pwar
d cy
cle
Intra
clas
ts/ R
ip-u
p cl
asts
Mud
cra
cks
Seab
ed li
thifi
catio
n
Ichn
o fo
ssils
(bur
row
s)
Fe Sr
8 7 6
5b
4
4a
3b
3a 2b5a
2c
2a
1b 1a1c
STR
ATIG
RA
PHY,
LIT
HO
LOG
Y A
ND
PA
LAEO
GEO
GR
APH
Y O
F TH
E M
IOC
ENE
DA
M F
OR
MAT
ION
IN Q
ATA
R
Downloaded from http://pubs.geoscienceworld.org/geoarabia/article-pdf/12/3/61/5443293/dill.pdfby gueston 11 February 2022
67
Miocene Dam Formation, Qatar
Pure LimestoneMarly LimestoneClay MarlstoneMarlstoneLimy MarlstoneMarly ClaystoneClaystone
Stru
ctur
es/
Text
ures
Foss
ils/
Bio
geni
cSt
ruct
ures
Stratification
Cyc
loth
em/
Uni
t
Bathymetry
Stratification
Bathymetry
Min
Max
59 58 57 56 55 54 53 52 51 50 49
Lower Al Nakhsh Member
Sr
Sup
ratid
al
Sub
tidal
Cha
nnel
Sub
tidal
Cha
nnel
Tida
l fla
ts
with
cha
nnel
s an
d le
vees
Tida
l fla
ts
with
cha
nnel
s an
d le
vees
Al N
akhs
h 2
Sup
ratid
al
Al N
akhs
h 3
Sup
ratid
al
LLH
LLH
SLH
b 0.
5
H 0
.5
b 0.
5LL
H
LLH
b1
SH
H 2
g-b
1-2
b 0.
5-1.
5
LLH
48 47 46 45
Sub
tidal
ch
anne
ls -
Tran
sgre
ssiv
eho
rizon
Inte
rtida
l fla
ts
Al N
akhs
h 1
Har
dgro
und
86 85 84
83 82 81 80 79 78 77 76 75 74 73 72 71 70 6929 30
70 69 68 67
66
65 64
63
62 61 60
HofufFm Abu Samrah Member Middle Al Nakhsh Member Middle Al Nakhsh MemberUpper ANM
Tida
l fla
tsch
anne
ls
Tida
l fla
tsch
anne
ls
Tida
l fla
tsch
anne
ls(c
appe
d)
Tida
l fla
tsch
anne
ls(c
appe
d)
Tida
l fla
ts c
hann
els
Sup
ratid
alA
l Nak
hsh
4
Tida
l fla
ts
Sup
ratid
al
Al N
akhs
h 5
Man
grov
e sw
amp
Sup
ratid
alA
l Nak
hsh
6
Al N
akhs
h 7
Sup
ra/In
tratid
alA
l Nak
hsh
8
Sup
ratid
alA
l Nak
hsh
9
Al N
akhs
h 10
Al N
akhs
h 11
Al N
akhs
h 12
Al N
akhs
h 13
Sup
ratid
al
Sup
ra/In
tratid
alch
anne
ls
Al N
akhs
h 14
Al N
akhs
h 15
Al N
akhs
h 16
Pal
aeos
ol
Sup
ratid
al
mar
shAl
Nak
hsh
17
Al N
akhs
h 18
Bea
ch ri
dge
(pro
xim
al)
Dur
icru
st/
Har
dgro
und
Aeo
lian
depo
sits
-pal
aeos
ol
Abu
Sam
rah
1
Abu
Sam
rah
2B
each
ridg
e(d
ista
l)
Abu
Sam
rah
3Ti
dal c
hann
el/
delta
Abu
Sam
rah
4Ti
dal f
lat
Abu
Sam
rah
5Ti
dal f
lat/
chan
nel
Bea
chro
ckA
bu S
amra
h 6
Fluv
ial
Fe FeSr Sr Sr Sr
Sr
SrSr Fe
b 0.
5
LLH
b 0.
3-0.
5
LLH
H 1
.5
root
s
g-b
0.5LL
H-S
HLL
H
b-H
<0.5
g-b
0.5
H 1
H 0
.1 -1
LLH
>S
Hb
1
LLH
g-b
1
LLH
B 0
.5 L
LH
b 1
SH
SH
>LLH
b 0.
5
g-b
0.5
g-b
0.5
g 0.
5S
hark
teet
h
Pure LimestoneMarly LimestoneClay MarlstoneMarlstoneLimy MarlstoneMarly ClaystoneClaystone
Ooi
d-pe
lloid
Ooi
d-pe
lloid
Stru
ctur
es/
Text
ures
Foss
ils/
Bio
geni
cSt
ruct
ures
Cyc
loth
em/
Uni
tEn
viro
nmen
t
Min
Max
33 32 31 30 29 28 27 26 25 24 23 22 21 20 19
Middle Salwa Member
18 17
Fe
Sal
wa
1a
Sal
wa
2
Sal
wa
3
Sal
wa
4
Sal
wa
5
b 1
b 1
b 3 H
Fe
Fe
Sal
wa
1b
Lower Salwa Member
Res
trict
ed
plat
form
ope
nm
arin
e w
ell
oxyg
enat
ed
Tida
l del
ta(d
ista
l)
Sur
f zon
e/B
rack
ish
Res
trict
edpl
atfo
rm/
Lago
onal
-dy
saer
obic
Res
trict
edpl
atfo
rm/
Lago
onal
-po
or
oxyg
enat
ion
Lago
onal
-dy
saer
obic
Inte
rtida
l-be
ach
Inte
rtida
l-be
ach
Inte
rtida
l-be
ach
Sur
f zon
e
Sha
rk te
eth
Sha
rk te
eth
Sha
rk te
eth
Verti
cal b
urro
ws
Sha
rk te
eth
Sha
rk te
eth
44 43 42 41 40 39 38 37 36 35 34
Upper Salwa Member Lower Al Nakhsh Member
Sub
tidal
to
low
er
inte
rtida
l S
alw
a 6
Sal
wa
7
G-B
0.1
-0.5B1
H b
0.5
Envi
ronm
ent
Thin
ly b
edde
d, m
arly
inte
rbed
s
Wav
e rip
ples
Goe
thite
Foss
ils
Trou
gh c
ross
bed
ding
Cel
estit
e
gG
astro
pod
bBi
valv
e (p
elec
ypod
)
Her
ringb
one
cros
s be
ddin
g
Hal
ite (s
olut
ion
cast
s)
GH
igh
dive
rsity
Plan
ar c
ross
bed
ding
Dol
omite
gLo
w d
iver
sity
1cm
Aver
age
diam
eter
Pelle
t (al
gal+
feca
l)
Cal
cite
Ooi
d
Sulp
hate
Silic
icla
stic
s
Gyp
sum
cry
stal
sC
oars
enin
g-up
war
d cy
cle
Tepe
e st
ruct
ures
Fini
ng-u
pwar
d cy
cle
Intra
clas
ts/ R
ip-u
p cl
asts
Mud
cra
cks
Seab
ed li
thifi
catio
n
Ichn
o fo
ssils
(bur
row
s)
Fe Sr
8 7 6
5b
4
4a
3b
3a 2b5a
2c
2a
1b 1a1c
STR
ATIG
RA
PHY,
LIT
HO
LOG
Y A
ND
PA
LAEO
GEO
GR
APH
Y O
F TH
E M
IOC
ENE
DA
M F
OR
MAT
ION
IN Q
ATA
R
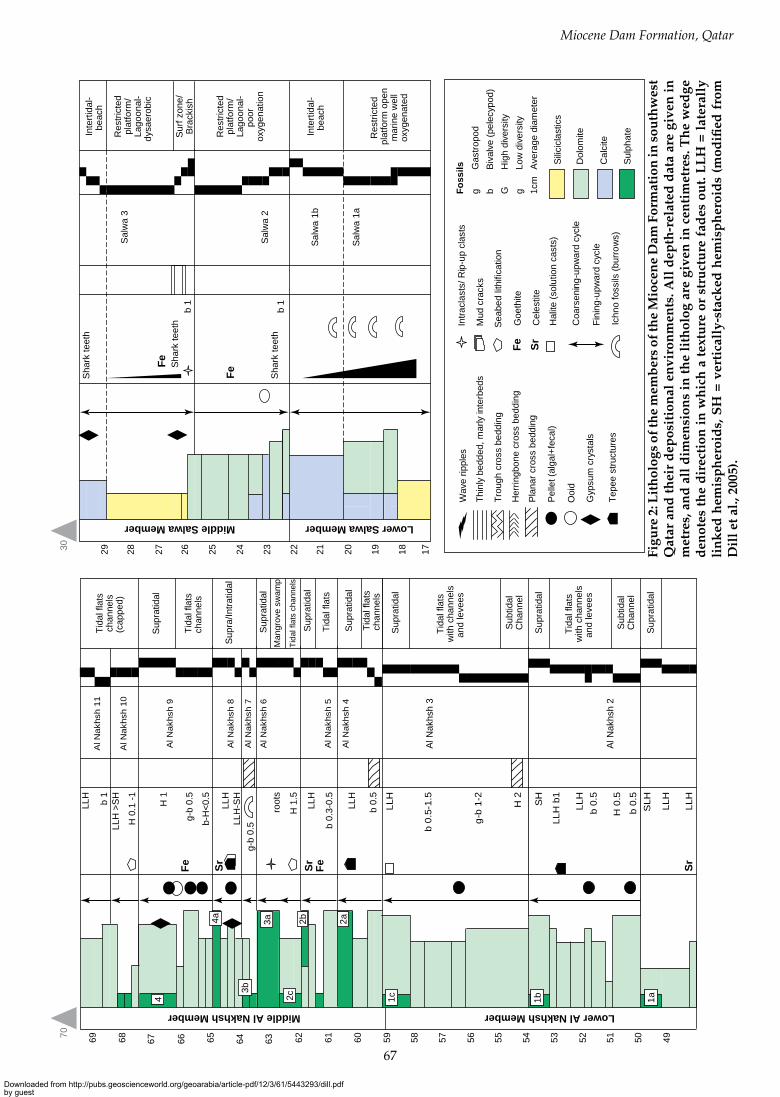
Figu
re 2
: Lit
hol
ogs
of th
e m
emb
ers
of th
e M
ioce
ne
Dam
For
mat
ion
in s
outh
wes
t Q
atar
an
d t
hei
r d
epos
itio
nal
en
viro
nm
ents
. All
dep
th-r
elat
ed d
ata
are
give
n i
n
met
res,
an
d a
ll d
imen
sion
s in
th
e li
thol
og a
re g
iven
in
cen
tim
etre
s. T
he
wed
ge
den
otes
th
e d
irec
tion
in
wh
ich
a t
extu
re o
r st
ruct
ure
fad
es o
ut.
LL
H =
lat
eral
ly
lin
ked
hem
isp
her
oid
s, S
H =
ver
tica
lly-
stac
ked
hem
isp
her
oid
s (m
odifi
ed f
rom
D
ill e
t al.,
200
5).
Downloaded from http://pubs.geoscienceworld.org/geoarabia/article-pdf/12/3/61/5443293/dill.pdfby gueston 11 February 2022
68
Dill and Henjes-Kunst
c
a
0.7078
0.7080
0.7082
0.7084
0.7086
0.7088
0.7090
0.7092
0 5 10 15 20 25 30 35Numerical Age (Ma)
Sr (
ppm
) 87
Sr/8
6 Sr R
atio
87
Sr/8
6 Sr R
atio
Miocene 5.32 to 23.8 Ma
Studied Section
0
200
400
600
800
1,000
1,200
1,400
1,600
1,800
2,000
0.70820
0.70830
0.70840
0.70850
0.70860
2 sigma error (± 20 ppm)
10 20 30 40 50 60 70 80 90
10 20 30 40 50 60 70 80 90
b
STRONTIUM GEOCHEMISTRY AND THE AGE OF FORMATION OF THE MIOCENE DAM FORMATION
Figure 3: Strontium geochemistry and the age of formation.(a) Whole-rock-strontium
concentration given in ppm of samples taken along a reference section of the Dukhan Anticline (for location see Figure 1) plotted as a function of altitude above sea level (for reference see Figure 2).
(b) Strontium isotope ratios (87Sr/86Sr) of samples plotted in the same way as Figure 4d.
(c) The evolution of 87Sr/86Sr ratios for the seawater from 35 Ma to the Present (Howarth and McArthur, 1997). The shaded area along the time scale gives stratigraphic age of the Miocene. The thin horizontal lines bracket the age of deposition of the section series under study based on the 87Sr/86Sr ratios.
understood. It is assumed that calcareous sediments of chemical origin show slightly different fractionation behaviour as compared to carbonates formed by biomineralisation (Schmitt et al., 2003a). In addition, δ44/40Ca and δ44/42Ca values of chemically formed carbonates and phosphorites of identical stratigraphic age may vary due to mineral-dependant kinetic mass-fractionation (Gussone et al., 2003; Schmitt et al., 2003b). The Ca-isotope composition of palaeo-seawater itself is a function of the complex evolution of its Ca-elemental budget in the past (Fantle and DePaolo, 2005; Heuser et al., 2005; DePaolo, 2004 for overview of earlier studies).
For the early Miocene, models suggest a significant decrease in the δ44/40CaNIST 915a value of seawater from approximately +2.0‰ (22 Ma) to +1.4‰ (18 Ma) (De La Rocha and DePaolo, 2000; Schmitt et al., 2003a; Schmitt et al., 2003b; DePaolo, 2004; Heuser et al., 2005). Ca dissolved in modern river waters is isotopically lighter in δ44/40Ca by about 0.7–1.7‰ compared to modern seawater (Zhu and MacDougall, 1998; Schmitt et al., 2003a; DePaolo, 2004). The lowest δ44/40Ca values of -1.4 to -1.7‰ (relative to seawater) are reported for Ganges tributaries, which also show high 87Sr/86Sr ratios. This suggests that their low δ44/40Ca values may in part be due to excess 40Ca accumulated from radioactive decay of 40K in chemically strongly fractionated igneous rocks in the hinterland. Analyses of rainwater and groundwater also reveal δ44/40Ca values that are by 0.9–1.5‰ lower compared to modern seawater (Schmitt et al., 2003a).
Downloaded from http://pubs.geoscienceworld.org/geoarabia/article-pdf/12/3/61/5443293/dill.pdfby gueston 11 February 2022
69
Miocene Dam Formation, Qatar
17
20
25
30
35
40
45
50
55
60
65
70
75
80
84
Low
er S
alw
aM
iddl
e Sa
lwa
Upp
er S
alw
a
Lo
wer
Al N
akhs
h
Mid
dle
Al N
akhs
h
Abu
Sam
rah
UAN
Supratidal intertidal
Supratidal-aeolian
duricrustsPu
re li
mes
tone
Mar
ly li
mes
tone
Cla
yey
mar
lsto
neM
arls
tone
Lim
y m
arls
tone
Mar
ly c
lays
tone
Cla
ysto
ne
Dep
th (m
)
Beachtidal flats/ Channelsduricrusts
Supratidalintertidal subtidal
(channels)
Subtidal to lower intertidal
Restricted platform,intertidal
beachtidal delta lagoonal
Restricted platform,
intertidal beach
c. 19
c. 21
MIDDLE MIOCENE - PLIOCENE
HOFUF FORMATION
Aqu
itani
an-B
urdi
galia
n
c. 21.6
c. 20
c. 18.9
SB-in
tra-
Dam
eros
iona
l sur
face
MFSNg 10
MFS Ng 20 ?
SB
Sulphate
Calcite Siliciclastics
Dolomite
Dill et al. (2005)
Dill et al. (2005)
Dill et al. (2005)
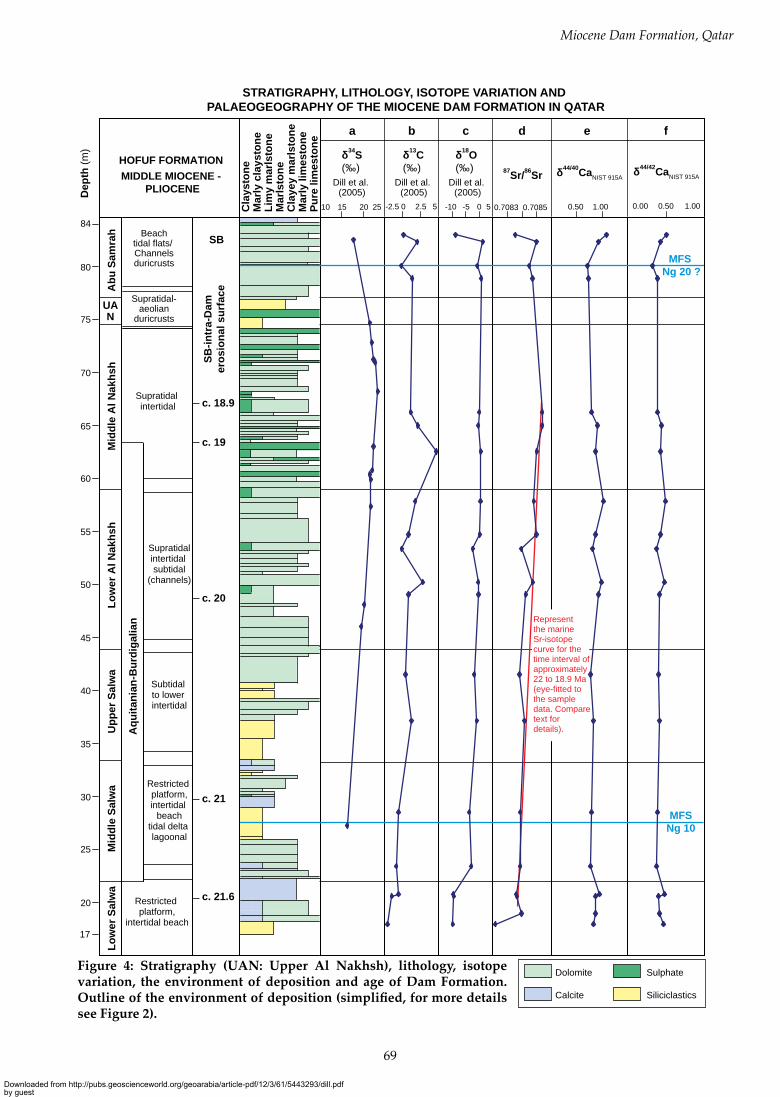
10 15 20 25 0 2.5-2.5 5 -10 -5 0 5 0.7083 0.7085 0.50 1.00 0.00 0.50 1.00
δ34S(‰)
a b c d e f
δ13C(‰) δ44/40CaNIST 915A
δ44/42CaNIST 915A
δ18O (‰) 87Sr/86Sr
Represent the marine Sr-isotope curve for the time interval of approximately 22 to 18.9 Ma (eye-fitted to the sample data. Compare text for details).
STRATIGRAPHY, LITHOLOGY, ISOTOPE VARIATION AND PALAEOGEOGRAPHY OF THE MIOCENE DAM FORMATION IN QATAR
Figure 4: Stratigraphy (UAN: Upper Al Nakhsh), lithology, isotope variation, the environment of deposition and age of Dam Formation. Outline of the environment of deposition (simplified, for more details see Figure 2).
Downloaded from http://pubs.geoscienceworld.org/geoarabia/article-pdf/12/3/61/5443293/dill.pdfby gueston 11 February 2022

70
Dill and Henjes-Kunst
a
b
0.2
0.5
1.0
0.5
1.0
1.5
10 20 30 40 50Altitude Above Sea level (metre)
60 70 80 90
2 sigma error (± 0.18 ‰)
2 sigma error (± 0.18 ‰)
δ44/40
Ca N
IST
915A
(‰)
δ44/42
Ca N
IST
915A
(‰)
CALCIUM ISOTOPE DATA
Figure 5: Calcium isotope data. (a) δ44/40Ca NIST 915a values of samples plotted as a function of altitude asl (for reference see Figure 2); and (b) δ44/42Ca NIST 915a values of samples plotted as a function of altitude asl (for reference see Figure 2).
Marine carbonates are isotopically lighter than seawater by about 1.3‰ (biogenic carbonates) to 1‰ (phosphorites) (De La Rocha and DePaolo, 2000; Schmitt et al., 2003b; DePaolo, 2004). Therefore, for early Miocene carbonates formed in a marine environment δ44/40CaNIST 915a values of approximately 1.0–0.1‰ are expected. The investigated samples for which Sr isotope data give evidence of a formation age of 22–18 Ma before present show δ44/40CaNIST 915a values of on average 0.85 ± 0.20‰. The Ca-isotope data are therefore in line with a formation of the sediments in a marine environment without significant contributions from other sources to their calcium budget.
EARLY MIOCENE SERIES ALONG THE NORTHEASTERN MARGIN OF THE ARABIAN PLATFORM
The section through the southern part of the Dukhan Anticline (Dill et al., 2005) takes the centre-stage for the correlation of early Miocene sedimentary sequences along the north-eastern margin of the Arabian Platform. It is correlated to reference sections in Dhofar, Oman (Roger et al., 1987); the western regions of the United Arab Emirates (Ditchfield et al., 1999; Whybrow et al., 1999); the Dammam region, Saudi-Arabia (Weijermars, 1999); and south-western Iran (Motiei, 1993) (Figure 6). Cavalier (1970) suspected a middle to late Miocene age for the Dam Formation in Qatar. A late Aquitanian to early Burdigalian age of sedimentation may be concluded from the Sr isotopes presented in this paper. Hence, early Miocene sedimentary sequences along a SE-NW section can be correlated and treated in more detail as to their lithology, environment of deposition and their sequence stratigraphic key elements (Figure 6).
In Dhofar, Oman, the Mughsayl Formation represents the early Miocene (Roger et al., 1987). The onset of turbiditic calcareous rocks was dated as early as late Stampian (early Oligocene) and lasted until the middle Burdigalian when conglomeratic limestones of the Adawnib Formation came to rest unconformably on top of the Mughsayl Formation. The slumped calcareous sediments of the Mughsayl Formation were laid down in a pelagic environment of deposition, whereas the hanging- wall rocks of the Adawnib Formation were apparently deposited in a marginal marine environment.
In the UAE, only the upper part of the Dam Formation is exposed and it consists of dolomitic claystones and hardgrounds. The strontium-isotope record published by Peebles (1999) for Abu Dhabi suggests a Burdigalian age. During the Neogene mainly clastic series formed. They were defined as the Shuwaihat Formation (lower part) and Baynunah Formation (upper part). Whybrow
Downloaded from http://pubs.geoscienceworld.org/geoarabia/article-pdf/12/3/61/5443293/dill.pdfby gueston 11 February 2022
71
Miocene Dam Formation, Qatar
Stratigraphic section not considered for correlation
30° 50°40°
30°E 50° 60°40°
30°
20°
40°N
30°
20°
40°
RED
SEA
CaspianSea
MediterraneanSea
ARABIANPLATE
LUTBLOCK
AFRICANPLATE
ALBORZ
Anatolia
TURKISHPLATE
LEVANTPLATE
Ow
enB
asin
NW Iran
Partides
SANANDAJ-SIRJAN ZONE
CENTRALIRAN BLOCKS
Makran
Dry landShallow marine(epicontinenatl)Deep marine (oceanic)Fault zone
Reference section
Northwest Southeast
Dolomite
Calcite
Sulphate
Siliciclastics
UAEQatar
Age
(Ma)
Age
(Ma)Saudi
ArabiaIran
50 m
19
20
21
1520
Ng 10
Ng 10
?
Motiei (1993)in Sharland et al. (2001)
Weijermars(1999)
Dill et al. (2005)
Whybrow et al. (1999);
Ditchfield (1999)
?
AQ
UIT
AN
IAN
-BU
RD
IGA
LIA
NSt
age
Asm
ari
Had
rouk
hD
am
Dam D
am
Mug
hsay
l
?
22 Ma
OmanRoger
et al. (1987)
1
1
1
23
4
5
23
4
5
4
2 3 4 5
ArabianPlate
Form
atio
n
Form
atio
n
Form
atio
n
Form
atio
n
Form
atio
n
Shu
wai
hat -
ba
ynna
h
Unconformity (SB) A
daw
nib
CORRELATION OF LOWER MIOCENE SEDIMENTARY SEQUENCES ALONG THE NORTHEAST BOUNDARY OF THE ARABIAN PLATFORM
N0 500
km
N0 500
km
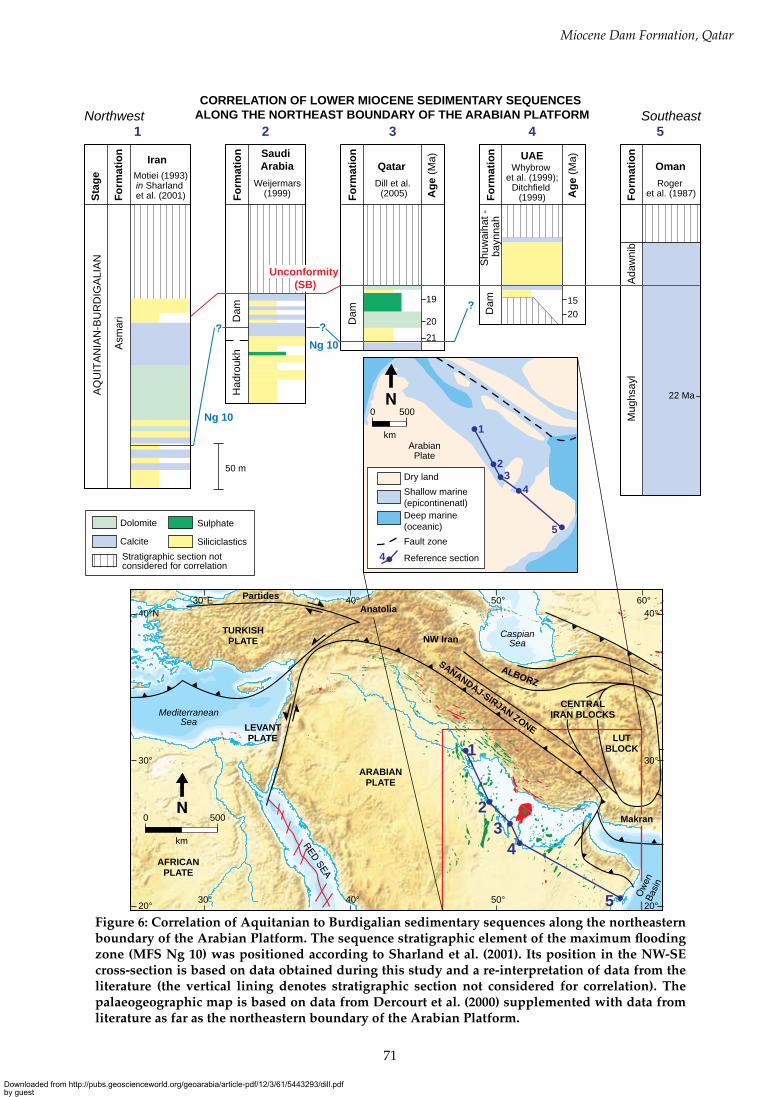
Figure 6: Correlation of Aquitanian to Burdigalian sedimentary sequences along the northeastern boundary of the Arabian Platform. The sequence stratigraphic element of the maximum flooding zone (MFS Ng 10) was positioned according to Sharland et al. (2001). Its position in the NW-SE cross-section is based on data obtained during this study and a re-interpretation of data from the literature (the vertical lining denotes stratigraphic section not considered for correlation). The palaeogeographic map is based on data from Dercourt et al. (2000) supplemented with data from literature as far as the northeastern boundary of the Arabian Platform.
Downloaded from http://pubs.geoscienceworld.org/geoarabia/article-pdf/12/3/61/5443293/dill.pdfby gueston 11 February 2022
72
Dill and Henjes-Kunst
a
b
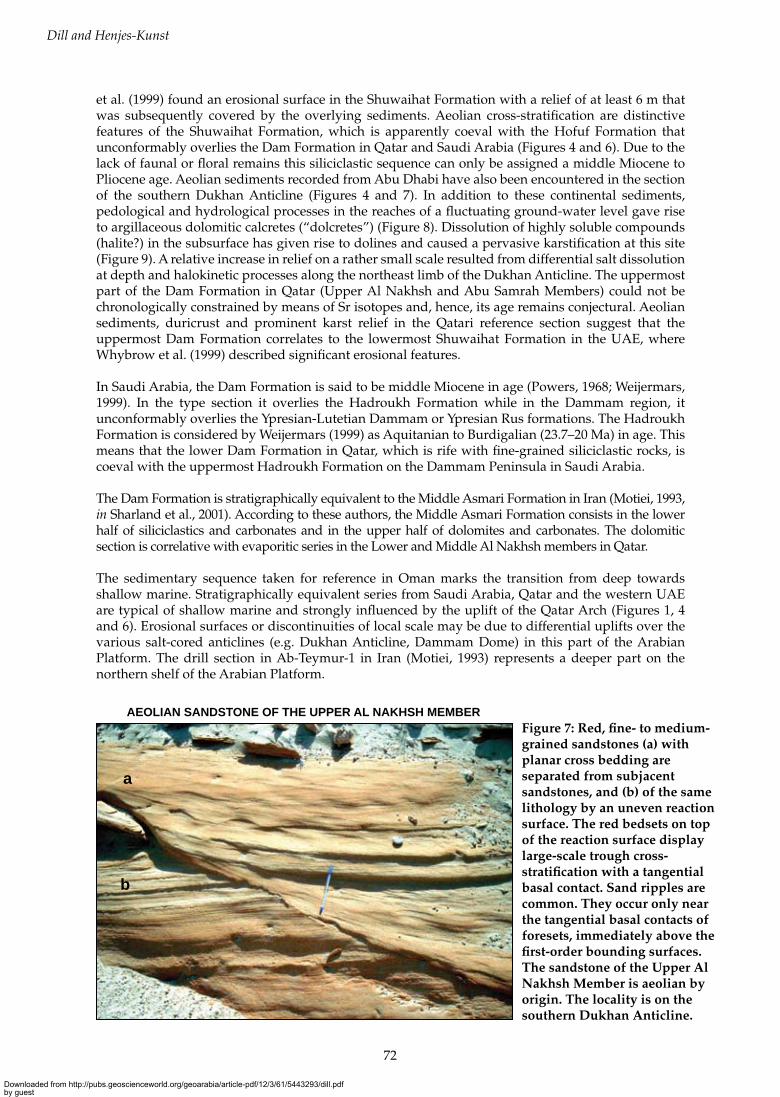
AEOLIAN SANDSTONE OF THE UPPER AL NAKHSH MEMBERFigure 7: Red, fine- to medium-grained sandstones (a) with planar cross bedding are separated from subjacent sandstones, and (b) of the same lithology by an uneven reaction surface. The red bedsets on top of the reaction surface display large-scale trough cross-stratification with a tangential basal contact. Sand ripples are common. They occur only near the tangential basal contacts of foresets, immediately above the first-order bounding surfaces. The sandstone of the Upper Al Nakhsh Member is aeolian by origin. The locality is on the southern Dukhan Anticline.
et al. (1999) found an erosional surface in the Shuwaihat Formation with a relief of at least 6 m that was subsequently covered by the overlying sediments. Aeolian cross-stratification are distinctive features of the Shuwaihat Formation, which is apparently coeval with the Hofuf Formation that unconformably overlies the Dam Formation in Qatar and Saudi Arabia (Figures 4 and 6). Due to the lack of faunal or floral remains this siliciclastic sequence can only be assigned a middle Miocene to Pliocene age. Aeolian sediments recorded from Abu Dhabi have also been encountered in the section of the southern Dukhan Anticline (Figures 4 and 7). In addition to these continental sediments, pedological and hydrological processes in the reaches of a fluctuating ground-water level gave rise to argillaceous dolomitic calcretes (“dolcretes”) (Figure 8). Dissolution of highly soluble compounds (halite?) in the subsurface has given rise to dolines and caused a pervasive karstification at this site (Figure 9). A relative increase in relief on a rather small scale resulted from differential salt dissolution at depth and halokinetic processes along the northeast limb of the Dukhan Anticline. The uppermost part of the Dam Formation in Qatar (Upper Al Nakhsh and Abu Samrah Members) could not be chronologically constrained by means of Sr isotopes and, hence, its age remains conjectural. Aeolian sediments, duricrust and prominent karst relief in the Qatari reference section suggest that the uppermost Dam Formation correlates to the lowermost Shuwaihat Formation in the UAE, where Whybrow et al. (1999) described significant erosional features.
In Saudi Arabia, the Dam Formation is said to be middle Miocene in age (Powers, 1968; Weijermars, 1999). In the type section it overlies the Hadroukh Formation while in the Dammam region, it unconformably overlies the Ypresian-Lutetian Dammam or Ypresian Rus formations. The Hadroukh Formation is considered by Weijermars (1999) as Aquitanian to Burdigalian (23.7–20 Ma) in age. This means that the lower Dam Formation in Qatar, which is rife with fine-grained siliciclastic rocks, is coeval with the uppermost Hadroukh Formation on the Dammam Peninsula in Saudi Arabia.
The Dam Formation is stratigraphically equivalent to the Middle Asmari Formation in Iran (Motiei, 1993, in Sharland et al., 2001). According to these authors, the Middle Asmari Formation consists in the lower half of siliciclastics and carbonates and in the upper half of dolomites and carbonates. The dolomitic section is correlative with evaporitic series in the Lower and Middle Al Nakhsh members in Qatar.
The sedimentary sequence taken for reference in Oman marks the transition from deep towards shallow marine. Stratigraphically equivalent series from Saudi Arabia, Qatar and the western UAE are typical of shallow marine and strongly influenced by the uplift of the Qatar Arch (Figures 1, 4 and 6). Erosional surfaces or discontinuities of local scale may be due to differential uplifts over the various salt-cored anticlines (e.g. Dukhan Anticline, Dammam Dome) in this part of the Arabian Platform. The drill section in Ab-Teymur-1 in Iran (Motiei, 1993) represents a deeper part on the northern shelf of the Arabian Platform.
Downloaded from http://pubs.geoscienceworld.org/geoarabia/article-pdf/12/3/61/5443293/dill.pdfby gueston 11 February 2022
73
Miocene Dam Formation, Qatar
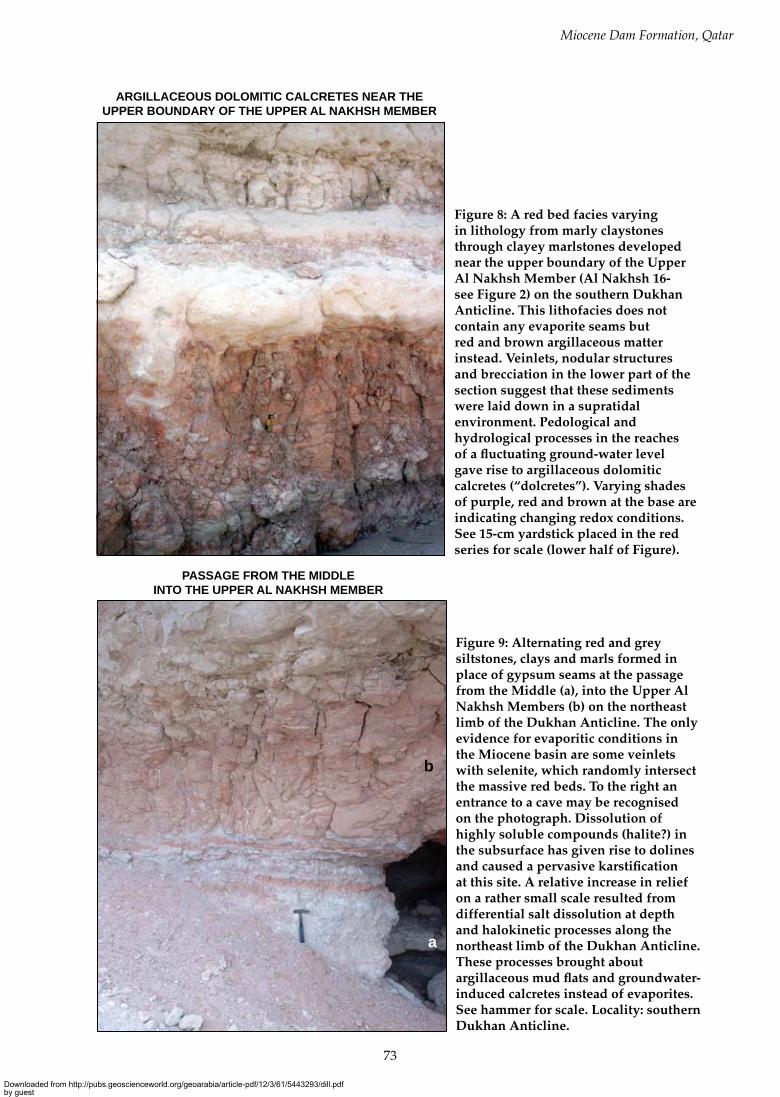
Figure 8: A red bed facies varying in lithology from marly claystones through clayey marlstones developed near the upper boundary of the Upper Al Nakhsh Member (Al Nakhsh 16-see Figure 2) on the southern Dukhan Anticline. This lithofacies does not contain any evaporite seams but red and brown argillaceous matter instead. Veinlets, nodular structures and brecciation in the lower part of the section suggest that these sediments were laid down in a supratidal environment. Pedological and hydrological processes in the reaches of a fluctuating ground-water level gave rise to argillaceous dolomitic calcretes (“dolcretes”). Varying shades of purple, red and brown at the base are indicating changing redox conditions. See 15-cm yardstick placed in the red series for scale (lower half of Figure).
ARGILLACEOUS DOLOMITIC CALCRETES NEAR THE UPPER BOUNDARY OF THE UPPER AL NAKHSH MEMBER
Figure 9: Alternating red and grey siltstones, clays and marls formed in place of gypsum seams at the passage from the Middle (a), into the Upper Al Nakhsh Members (b) on the northeast limb of the Dukhan Anticline. The only evidence for evaporitic conditions in the Miocene basin are some veinlets with selenite, which randomly intersect the massive red beds. To the right an entrance to a cave may be recognised on the photograph. Dissolution of highly soluble compounds (halite?) in the subsurface has given rise to dolines and caused a pervasive karstification at this site. A relative increase in relief on a rather small scale resulted from differential salt dissolution at depth and halokinetic processes along the northeast limb of the Dukhan Anticline. These processes brought about argillaceous mud flats and groundwater-induced calcretes instead of evaporites. See hammer for scale. Locality: southern Dukhan Anticline.
b
a
PASSAGE FROM THE MIDDLE INTO THE UPPER AL NAKHSH MEMBER
Downloaded from http://pubs.geoscienceworld.org/geoarabia/article-pdf/12/3/61/5443293/dill.pdfby gueston 11 February 2022
74
Dill and Henjes-Kunst
The most pronounced sequence boundary to be traced on a regional scale separates the shallow-marine carbonate sequences of early Miocene age (Dam Formation) from the siliciclastic series of the Hofuf Formation and lithological equivalent series found at outcrop in the UAE. The maximum flooding surface MFS Ng10 sensu Sharland et al. (2001) cannot be identified in all the studied reference sections. According to the present study, this MFS has to be drawn within the siliclastic-dominated Middle Asmari Formation in Iran, the marly Lower Dam Formation (Middle Salwa Member) in Qatar and in the calcareous Mughsayl Formation in Oman. If MFS Ng20 exists at all in the Dam Formation of Qatar, it has to be “squeezed” between the sequence boundary truncating the Dam Formation and the “intra-Dam erosional surfaces” (Figure 4). In both cases, the MFS Ng 10 and Ng 20 coincide with a “relative low” in the chemologs, illustrating the distribution of isotope ratios (Figure 4).
CONCLUSIONS
Calcareous and evaporitic sediments (gypsum, celestite) of the Dam Formation in Qatar reflect deposition under subtidal through supratidal conditions, which towards the base and the top of the series are replaced by an environment of deposition more akin to a modern beach. A rather uniform isotope curve of Sr, Ca and O isotopes for the tidal deposits is replaced by a more oscillating one when these tidal-influenced regimes became substituted for by a more wave-dominated regime. Small-scale disturbances of the isotope ratios in the Lower Al Nakhsh Member are correlative with the onset of the evaporite series in the section under study. The Sr isotopes do not only indicate an influx of more primitive Sr from the hinterland, but also allow for a refinement of the stratigraphy, which yields a late Aquitanian to early Burdigalian age of sedimentation for the Dam Formation in Qatar. Calcium isotope ratio studies, still in their infancy and not fully understood, seem to provide a new tool in carbonate petrography when interpreting the environment of deposition and calcification of dolomitic series. The isotope ratios need to be tested to determine if they can assist in positioning the planar architectural elements of sequence stratigraphy. The present study is promising in that way but not yet a proof, and needs further geochemical support.
ACKNOWLEDGMENT
The first author is grateful for the support provided by the Scientific and Applied Research Centre (SARC), which provided transportation in the field and to S. Nasir (Sultan Qaboos University, Muscat, Oman) and H. Al-Saad (University of Qatar). We acknowledge the laboratory support by S. Gerlach and P. Macaj (both BGR). We thank two anonymous reviewers for their important suggestions that have improved the manuscript. The final design and drafting by Nestor Niño Buhay is appreciated.
REFERENCES
Al-Hinai, K.G., A.E. Dabbagh, W.C. Gardner, M.A. Khan and S. Saner 1997. Shuttle imaging radar views of some geological features in the Arabian Peninsula. GeoArabia, v. 2, no. 2, p. 165-178.
Al-Saad, H. and M.I. Ibrahim 2002. Stratigraphy, micropalaeontology, and palaeoecology of the Miocene Dam Formation, Qatar. GeoArabia, v. 7, no. 1, p. 9-28.
Alsharhan, A.S. and C.G.St.C. Kendall 2002. Holocene carbonate/evaporites of Abu Dhabi, and their Jurassic ancient analogs. In, H.J. Barth and B.B. Boer (Eds.), Sabkha Ecosystems. Kluwer Academic Publishers, p. 187-202.
Cavelier, C. 1970. Geologic description of the Qatar Peninsula (Arabian Gulf). Government of Qatar Publication, Department of Petroleum Affairs, 39 p.
Coplen, T.B., J.A. Hopple, J.K. Böhlke, H.S. Peiser, S.E. Rieder, H.R. Krouse, K.J.R. Rosman, T. Ding Jr., R.D. Vocke, K.M. Révész, A. Lamberty, P. Taylor and P. De Bièvre 2002. Compilation of minimum and maximum isotope ratios of selected elements in naturally occurring terrestrial materials and reagents. United States Geological Survey, Water-Resources Investigations Report 01-4222, 98 p.
De La Rocha, C.L. and D.J. DePaolo 2000. Isotopic evidence for variations in the marine calcium cycle over the Cenozoic. Science, v. 289, p. 1176-1178.
DePaolo, D.J. 2004. Ca isotopic variations produced by biological, kinetic, radiogenic and nucleosynthetic processes. Reviews in Mineralogy and Geochemistry, v. 55, p. 255-28.
Dercourt, J., M. Geatani, B. Vrielinck, E. Barrier, B. Biju-Duval, M.F. Brunet, J.P. Cadet, S. Crasquin and M. Sandulescu 2000. Atlas Peri-Tethys: Palaeogeographical Maps. Commission de la Carte Géologique du Monde/Commission for the Geological Map of the World, Paris, 24 maps and explanatory notes, 269 p.
Downloaded from http://pubs.geoscienceworld.org/geoarabia/article-pdf/12/3/61/5443293/dill.pdfby gueston 11 February 2022
75
Miocene Dam Formation, Qatar
Dill, H.G., S. Nasir and H. Al-Saad 2003. Lithological and structural evolution of the northern sector of the Dukhan Anticline, Qatar, during the early Tertiary: with special reference to bounding surfaces of sequence stratigraphical relevance. GeoArabia, v. 8, no. 2, p. 201-226.
Dill, H.G., R. Botz, Z. Berner, D. Stüben, S. Nasir and H. Al-Saad 2005. Sedimentary facies, mineralogy, and geochemistry of the sulphate-bearing Miocene Dam Formation in Qatar. Sedimentary Geology, v. 174, p. 63-96.
Ditchfield, P.W. 1999. Diagenesis of the Baynunah, Shuwaihat, and Upper Dam Formation sediments exposed in the western region, Emirate of Abu Dhabi, United Arab Emirates. In, P. Whybrow and A. Hill (Eds.), Fossil, Vertebrates of Arabia. Yale University Press, p. 62-74.
El Beialy, S.Y. and H.H. Al-Hitmi 1994. Micropalaeontology and palynology of the Lower and Middle Cretaceous Thamama and Wasia groups, DK-C well, Dukhan oil field, western Qatar. Sciences Géologiques Bulletin, v. 47, p. 67-95.
Fantle, M.S. and D.J. DePaolo 2005. Variations in the marine Ca cycle over the past 20 million years. Earth and Planetary Science Letters, v. 237, p. 102-117.
Foster, N.H. and E.A. Beaumont 1991. Structural Traps V. American Association of Petroleum Geologists, Tulsa, 301 p.
Gussone, N., A. Eisenhauer, A. Heuser, M. Dietzel, B. Bock, F. Böhm, H.J. Spero, D.W. Lea, J. Bijma and T.F. Nägler 2003. Model for kinetic effects on calcium isotope fractionation (δ44Ca) in inorganic aragonite and cultured planktonic foraminifera. Geochimica et Cosmochimica Acta, v. 67, p. 1375-1382.
Heuser, A., A. Eisenhauer, F. Böhm, K. Wallmann, N. Gussone, P.N. Pearson, T.F. Nägler and W.-C. Dullo 2005. Calcium isotope (δ44/40Ca) variations of Neogene planktonic foraminifera. Palaeooceanography, v. 20, PA2013, doi: 10.1029/2004PA001048.
Heuser, A., A. Eisenhauer, N. Gussone, B. Bock, B.T. Hansen and T.F. Nägler 2002. Measurement of calcium isotopes (δ44Ca) using a multicollector TIMS technique. International Journal of Mass Spectrometry, v. 220, p. 385-397.
Hippler, D., A.-D. Schmitt, N. Gussone, A. Heuser, P. Stille, A. Eisenhauer and T.F. Nägler 2003. Calcium isotopic composition of various reference materials and seawater. Geostandards Newsletter, v. 27, no. 1, p. 13-19.
Howarth, R.J. and J.M. McArthur 1997. Statistics for strontium isotope stratigraphy with a look-up table version. Journal of Geology, v. 105, p. 441-456.
Katuna, M.P., J.G. Geisler and D.J. Colquhoun 1997. Stratigraphic correlation of Oligocene marginal marine and fluvial deposits across the middle and lower coastal plain, South Carolina. Sedimentary Geology, v. 108, p. 181-194.
Kirkham, A. 1998. A Quaternary proximal foreland ramp and its continental fringe, Arabian Gulf, U.A.E. Geological Society Special Publication v. 149, p. 15-41.
Lomando, A.J. 1999. Structural influences on facies trends of carbonate inner ramp systems, examples from Kuwait-Saudi Arabian Coast of the Arabian Gulf and Northern Yucatan, Mexico. GeoArabia, v. 4, no. 3, p. 339-360.
Miller, M.F. and H.A. Curran 2001. Behavioural plasticity of modern and Cainozoic burrowing thalassinidean shrimp. Palaeogeography, Palaeoclimatology, Palaeoecology, v. 166, p. 219-236.
Motiei, H. 1993. Stratigraphy of Zagros. Treatise on the Geology of Iran no. 1, Ministry of Mines and Metals, Geological Survey of Iran, Tehran.
Peebles, R.G. 1999. Stable isotope analysis and dating of the Miocene of the Emirates of Abu Dhabi. In, P. Whybrow and A. Hill (Eds.), Fossil, Vertebrates of Arabia. Yale University Press, p. 88-107.
Powers, R.W. 1968. Lexique Stratigraphique International. Asie. Saudi Arabia (excluding Arabian Shield), Congres Geologique International. Commission de Stratigraphie, v. 3,10b1. 3, 177 p.
Pratt, B.R. 2002. Tepees in peritidal carbonates: origin via earthquake-induced deformation, with example from the Middle Cambrian of western Canada. Sedimentary Geology, v. 153, p. 57-64.
Roger, J., J.-P. Platel, C. Cavelier and C. Bourdillon-De-Grissac 1987. Données nouvelles sur la stratigraphie et l´histoire géologique du Dhofar (Sultanat d´Oman). Bulletin de la Societe Géologique de France, v. 8, p. 265-277.
Saleh, A., F. Al-Ruwaih, A. Al-Reda and A. Gunatilaka 1999. A reconnaissance study of a clastic coastal sabkha in Northern Kuwait, Arabian Gulf. Journal of Arid Environments, v. 43, p. 1-19.
Schmitt, A.-D., F. Chabaux and P. Stille 2003a. The calcium riverine and hydrothermal isotopic fluxes and the oceanic calcium mass balance. Earth and Planetary Science Letters, v. 213, p. 503-518.
Schmitt, A.-D., P. Stille and T. Vennemann 2003b. Variations of the 44Ca/40Ca ratio in seawater during the past 24 million years: evidence from δ44Ca and δ18O values of Miocene phosphates. Geochimica et Cosmochimica Acta, v. 67/14, p. 2607-2614.
Seilacher, A. 1967. Bathymetry of trace fossils. Marine Geology 5, p. 413-428.Sharland, P.R., R. Archer, D.M. Casey, R.B. Davies, S.H. Hall, A.P. Heward, A.D. Horbury and M.D. Simmons
2001. Arabian Plate Sequence Stratigraphy. GeoArabia, Special Publication 2, 371 p.Sheppard, C., A. Price and C. Roberts 1992. Marine ecology of the Arabian Region. Patterns and processes in
extreme tropical environments. Academic press, London, 359 p. Shinn, E.A. 1983. Tidal flat environment. In, P.A. Scholle, D.G. Bebout and C.H. Moore (Eds.), Carbonate
Depositional Environments. American Association of Petroleum Geologists Memoir, v. 33, p. 171-210.Steiger, R.H. and E. Jäger 1977. Subcommission on geochronology: convention on the use of decay constants in
geo- and cosmochronology. Earth and Planetary Science Letters, v. 36, p. 359-362.
Downloaded from http://pubs.geoscienceworld.org/geoarabia/article-pdf/12/3/61/5443293/dill.pdfby gueston 11 February 2022
76
Dill and Henjes-Kunst
Sugden, W. 1962. Structural analysis, and geometrical prediction for change of form with depth, of some Arabian plains-type folds. American Association of Petroleum Geologists Bulletin, v. 48, p. 2213-2228.
Warren, J.K. 1999. Evaporites-their evolution and economics. Oxford, Blackwell, 438 p.Weijermars, R. 1999. Surface geology, lithostratigraphy and Tertiary growth of the Dammam Dome, Saudi Arabia:
a new field guide. GeoArabia, v. 4, no. 2, p. 199-226.Whybrow, P.J., P.F. Friend, P.W. Ditchfield and C.S. Bristow 1999. Local stratigraphy of the Neogene outcrops of
the coastal area: western region, Emirate of Abu Dhabi, United Arab Emirates. In, P. Whybrow and A. Hill (Eds.), Fossil, Vertebrates of Arabia. Yale University Press, p. 28-37.
Zhu, P. and J.D. MacDougall 1998. Calcium isotopes in the marine environment and the oceanic calcium cycle. Geochimica et Cosmochimica Acta, v. 62, p. 1691-1698.
ABOUT THE AUTHORS
Harald G. Dill is involved in international technical training with the German Federal Institute for Geosciences and Natural Resources (BGR) and is an Associate Professor at Hannover University. He studied Geology and Mineralogy at Würzburg, Aachen, and Erlangen universities and received a Diploma in Geology in 1975 and a Doctorate in Mineralogy in 1978. Harald conducted research at Bayreuth University before joining BGR in 1979. In 1982, he became Lecturer in Applied Geology at Mainz University where he was awarded his Doctor Rerum Naturalium Habilitatus in 1985. From 1986 to 1991, he was assigned to the Continental Deep Drilling Program of the Federal Republic of Germany. In 1991, Harald was appointed Associate Professor in Economic Geology at Hannover University. In the same year he rejoined BGR in the Department of Economic Geology and International Cooperation training geologists in sedimentology and the geology of non-metallic mineral deposits through international cooperation schemes. Harold lectures in Economic Geology and Sedimentology at Hannover University, elsewhere in Germany, and abroad. He has published over 200 papers and abstracts on the sedimentology and economic geology of metallic and non-metallic deposits in South America, Asia, and Central Europe. His interest lies in the capture of digital data in the field and the study of heavy minerals as well as mineral and energy deposits, mainly within sedimentary rocks.
Friedhelm Henjes-Kunst is a Research Scientist at the Department of Geochemistry and Mineralogy of the German Federal Institute for Geosciences and Natural Resources (BGR), specializing in isotope geochemistry and geochronology of igneous, metamorphic and sedimentary rocks. He studied mineralogy at the universities of Clausthal-Zellerfeld and Braunschweig and received a Diploma in 1976 and a Doctorate in 1980 both in Mineralogy. Afterwards, Friedhelm was involved in research projects at the universities of Münster, Karlsruhe and Freiburg covering petrology, geochemistry and isotope geochemistry of granitoids, rift-related volcanics and mantle-derived rocks. In 1990, he joined the BGR in the isotope geochemistry section. Since then, his major research interests were assigned to the Continental Deep Drilling Program of the Federal Republic of Germany and to the Polar Geoscience Program of the BGR. Friedhelm joined six expeditions to Antarctica and one to the Canadian High-Arctic. Since 2001 he has been involved in the investigation of ore deposits. His major interests are application of unconventional isotope methods to investigate formation and age of ore deposits.
Manuscript submitted September 2, 2006Revised December 15, 2006
Accepted December 28, 2006Press version proofread by authors April 29, 2007
Downloaded from http://pubs.geoscienceworld.org/geoarabia/article-pdf/12/3/61/5443293/dill.pdfby gueston 11 February 2022


