Embed Size (px)
Citation preview
PROOF COPY [CA8907] 031308PRC
PROO
F COPY [CA8907] 031308PRC
Photon asymmetry measurement in radiative muon capture on 40Ca
A. Pouladdej,* T. P. Gorringe,† M. D. Hasinoff, A. J. Larabee,‡ A. J. Noble,§ C. J. Virtue,� and D. H. Wright¶
University of British Columbia, Department of Physics and Astronomy, Vancouver, British Columbia, Canada V6T 1Z1
G. Azuelos**TRIUMF, Vancouver, British Columbia, Canada V6T 2A3
B. C. RobertsonQueen’s University, Department of Physics and Astronomy, Kingston, Ontario, Canada K7L 3N6
�Received 6 January 2003; revised manuscript received 4 June 2003�
A measurement of the photon asymmetry (��) in radiative muon capture RMC on 40Ca has been carried outof TRIUMF. Negative muons were stopped in a 40Ca target and the resulting RMC photons were thenconverted by a 5-cm thick NaI detector placed immediately in front of our main NaI detector, a cylindricalcrystal of diameter 46 cm and depth 51 cm. The data sample consisted of 5200 high-energy (57 MeV�E�
�95 MeV) RMC photon candidates. Our measured value for the energy-averaged photon asymmetry is ��
�1.00�0.23. The extracted values for the induced pseudoscalar coupling constant (gP) based on this photonasymmetry measurement are gP /gA�8.0, utilizing the impulse approximation IA model, and gP /gA�14.5 interms of the modified impulse approximation �MIA� model. The two extracted values, although both consistentwith the Goldberger-Treiman value of gP /gA�7, are considerably different, indicating a significant theoreticalmodel dependency.
DOI: 10.1103/PhysRevC.68.0246XX PACS number�s�: 23.40.Bw, 25.40.Lw, 23.20.Nx
I. INTRODUCTION
The interest in weak interactions goes back to the earlydays of radioactivity where the weak force manifested itselfthrough a common form of radioactivity, the � decay ofnuclei for which the elementary processes are
n→p�e�� �e ,
p→n�e�� �e .
The muon capture process (���p→n���), a strange-ness conserving semileptonic reaction, can be used as a pow-erful probe of nuclear structure, or, if the initial and finalnuclear states are well known, it can then provide new infor-mation on the weak interaction due to the much higher mo-mentum transfer �resulting from the larger muon mass�. Onefundamental parameter of interest investigated in such a
probe is the pseudoscalar coupling constant of the weak in-teractions gP . In the context of a nuclear capture process, theabove muon capture reaction is referred to as ordinary muoncapture �OMC�. In the case of a 40Ca target nucleus, one has
���40Ca→���40K�.
This paper is concerned with a suppressed version of theabove nuclear capture process known as radiative muon cap-ture �RMC�:
���40Ca→�����40K�.
The small branching ratio for RMC compared to OMC,1
makes the RMC process much less favorable and its obser-vation much more difficult. However, due to the increasedsensitivity of RMC to the induced pseudoscalar couplingconstant, its study is of great interest. In fact, OMC andRMC provide the two main sources of information for gPdetermination.
In nuclear muon capture experiments some possible ob-servables are the total capture rate, polarization, asymmetry,and energy distributions of the emitted nucleons. With RMCexperiments, different aspects associated with the emittedphotons are of interest and the most frequently measuredquantities in such experiments are the partial branching ratioand photon asymmetry �� . In the case of RMC for a polar-ized �� beam, the parity violation of the weak interaction ismanifested as an angular correlation between the direction ofemission of RMC photon and the direction of polarization of��. The observed angular distribution or ‘‘yield’’ for RMCphotons is given by
*Present address: Nortel Networks, Advanced Technology Divi-sion, Ottawa, Ontario Canada K2H 8E9.
†Present address: University of Kentucky, Department of Physics,Lexington, Kentucky 40506, USA.
‡ Present address: Greenville College, Department of Physics,Greenville Illinois 62246, USA.
§ Present address: Queen’s University, Department of Physics,Kingston, Ontario, Canada, K7L 3N6.
� Present address: Laurentian University, Department of Physicsand Astronomy, Sudbury, Ontario, Canada, P2E 2C6.
¶ Present address: Stanford Linear Accelerator Center, MenloPark, California 9405, USA.
**Also at Universite de Montreal, Montreal, Quebec, Canada,H3C 3J7. 1The ratio of RMC to OMC rate is (RMC /OMC)�2�10�5.
PHYSICAL REVIEW C 68, 0246XX �2003�
0556-2813/2003/68�2�/0246XX�15�/$20.00 ©2003 The American Physical Society68 0246XX-1
PROOF COPY [CA8907] 031308PRC
PROOF COPY [CA8907] 031308PRC
PROO
F COPY [CA8907] 031308PRC
Y ����N��1���P�� ���cos ��N��1�A�cos � ,�1�
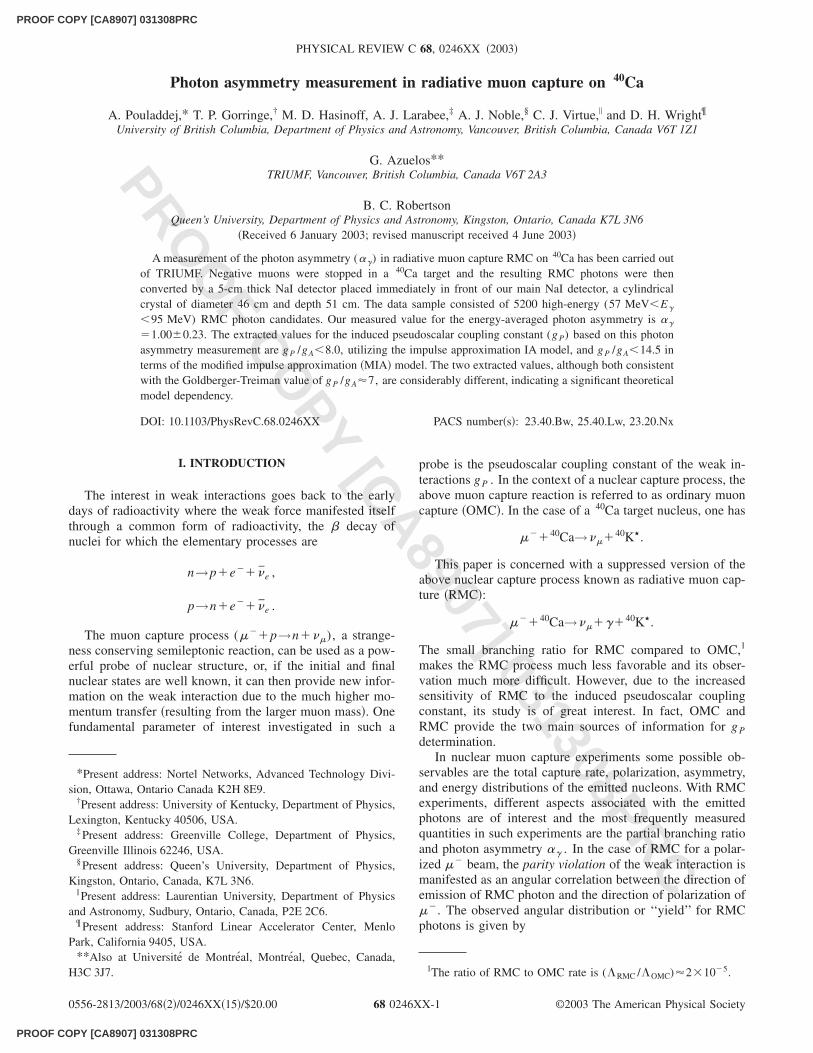
where Y �() is the angular yield, which is the rate of emis-sion of RMC photons for the given polar angle —this is theangle between the direction of emission of RMC photon andthe �� spin-quantization axis, N� is a normalization factor,A� is the magnitude of ‘‘observed’’ or ‘‘measured’’ photonasymmetry, �� is the ‘‘energy-averaged’’ or the ‘‘physical’’photon asymmetry, and �P�� is the average �� beam spin-polarization before capture, see Fig. 1. The V-A theory pre-dicts 100% right circularly polarized photons, so for a pureV-A theory ����1 exactly.
In order to better understand how the pseudoscalar cou-pling constant fits into the weak interaction picture, we canconsider the weak interaction Hamiltonian for the muoncaputre in terms of the four fermion coupling and the Gell-Mann-Cabbibo universality �1,2�:
Hw�G cos c
�2�n�V��A���p�V���1��5����H.c.,
�2�
where ‘‘G’’ is the Fermi coupling constant2 and ‘‘c’’ is theCabbibo mixing angle. The ��’s are the spinor functions forthe fermions ��n , p , � , and � . The phenomenologicalforms of the hadronic vector and axial vector terms are givenby
V��gV���� gM
2mN����q��� igS
m�� q� ,
A��gA���5�� igp
m�� q��5�� gT
2mN����q��5 .
The four-momentum transfer is given by q��n��p� ,where n� and p� are the neutron and proton four-momenta,mN and m� are the nucleon and muon masses, respectively.The parameters gV , gM , gS , gA , gP , and gT are the basic‘‘coupling constants’’ for the semileptonic interaction. Thecoupling constants gM , gS , gP , and gT are ‘‘induced’’ bythe strong interactions of the hadrons. The main componentof the pseudoscalar coupling gP is the one pion exchangediagram with a propagator 1/(m�
2 �q2), where m� is themass of the charged pion. In OMC, the four-momentumtransfer is fixed at q2��0.88m�
2 , while in the case of RMCa value of q2�m�
2 is achievable near the maximum photonenergy, thereby enhancing the amplitude of the one pion ex-change contribution by a factor of �3. Consequently, thepseudoscalar coupling, which is absent in the � decay andaffects OMC very little, strongly influences the high energypart of the photon energy spectrum and the absolute rate forRMC. The identification of this strong dependence of thetotal rate of the photon energy spectrum on gP was the initialmotivation for the experimental study of RMC. The very lowrate (Rk�57 MeV�2�10�5) for RMC favored rate measure-ments on heavy nuclei. For these nuclei the Coulomb attrac-tion concentrates the muon’s wave function over the nuclearvolume, effectively increasing the capture rate. However,with heavier nuclei, many theoretical difficulties arise. Toreduce such effects doubly magic nuclei such as 16O and40Ca with relatively simple nuclear structure have been fa-vored both theoretical considerations and experimental in-vestigations.
The partially conserved axial current �PCAC� formulationallows an estimation of gP for a ‘‘free’’ nucleon—gP is be-lieved to be a very robust prediction based on our under-standing of the manifestation of approximate chiral asymme-try. This leads of the well-known Goldberger-Treimanexpression �4�:
gP�q2��2m� mN
m�2 �q2
gA�0 �, �3�
which results in the value of gP(�0.88m�2 )�6.77gA(0)
�8.58 �5�. By comparing the experimentally determinedvalue of gP with the Goldberger-Treiman value, it is thenpossible, at least in principle, to draw conclusions about thepossible renormalization of gP within nuclear matter �6�.
II. THEORETICAL BASIS
It is generally accepted that QCD is the fundamentaltheory of strong interactions although it cannot be readilyapplied at low energies. In order to investigate interactions atthe quark-lepton level one must rely on a phenomenologicaldescription of the weak interactions. The Standard Model ofthe weak interactions, as seen in Eq. �2�, describes such in-teractions in terms of fundamental coupling constants thatneed to be determined experimentally. The vector and weakmagnetism coupling constants gV(q2) and gM(q2) are re-lated by the conserved vector current �CVC� theory to theelectromagnetic current �7� and have been measured by elec-2The value of G cos c�(1.41220�0.00043)�10�49 erg cm3 �3�.
FIG. 1. The schematics of RMC photon angular emission: p� ��
is the muon’s initial linear momentum as it enters the target, s�� is
the �� spin-quantization axis, and s� is the actual �� spin. It isemphasized that �� capture in the target occurs at rest, the direc-
tion as indicated by p� �� is that of �� as it enters the target.
A. POULADDEJ et al. PHYSICAL REVIEW C 68, 0246XX �2003�
0246XX-2
PROOF COPY [CA8907] 031308PRC
PROOF COPY [CA8907] 031308PRC
PROO
F COPY [CA8907] 031308PRC
tron scattering. The scalar and tensor coupling constantsgS(q2) and gT(q2) are predicted to be absent due to G-parityinvariance and this is consistent with experimental measure-ments �8,9�. The axial vector coupling constant gA(q2) canbe determined accurately from neutron � decay �3� and itsq2 dependence from neutrino scattering �10�, or pion electro-production �11,12�. This leaves the induced pseudoscalarcoupling constant gP(q2) which is by far the least wellknown of these coupling constants.
A. Muon capture on hydrogen and the ‘‘gP Puzzle’’
Recent developments in QCD in terms of chiral perturba-tion theory �ChPT� have provided an appropriate field theoryfor low-energy interactions. The heavy baryon chiral pertur-bation theory �HBChPT� �13,14�, which is a specific form ofChPT useful when nucleons are involved, has allowed theo-retical formulations to go beyond the PCAC approach. Cal-culations in the context of the HBChPT approach �15,16�have provided a rigorous justification for the Goldberger-Treiman estimate and Adler-Dothan correction �3� to yield amodified expression for gP as follows:
gP�q2��2m�g�NN�q2�F�
m�2 �q2
�1
3gA�0 �m�mNrA
2 , �4�
where g�NN is the pion-nucleon coupling constant, rA is thenucleon axial radius, and F� is the pion decay constant.Equation �4� leads to a predicted value of gP(�0.88m�
2 )�8.70�0.45�8.25 �5�. Comparing results from Eqs. �3� and�4� reveals that the correction term for gP is rather small.Furthermore, in the above O(q3) HBChPT formulation, theGoldberger-Treiman term appears as the first term of the chi-ral series expansion. The value of gP determined by Bardinet al. For OMC reaction on hydrogen �17� is in good agree-ment with the PCAC prediction. However, somewhat sur-prisingly, the TRIUMF results for RMC on hydrogen �18,19�yield a value for gP , which is �1.5 times larger than thePCAC prediction! Furthermore, the HBChPT calculation upto next-to-next-to-leading order �NNLO� �20� shows that thechiral series converges rapidly. This indicates that the dis-crepancy between experiment and theory for RMC on hydro-gen cannot be explained by higher order perturbation correc-tions within the context of HBChPT �21�.
B. Muon capture on heavy nuclei
The first theoretical attempt at evaluating the total capturerate for nuclei was carried out by Wheeler �22�. He assumedthat the capture rate was proportional to the overlap of themuon wave function at the nucleus and obtained the classicalprediction of c�Zeff
4 , where Zeff is an effective charge forthe nucleus. For light nuclei Zeff�Z .
Subsequent theoretical advancements since then havebeen based on two general approaches, the impulse approxi-mation �IA� and the elementary particle approach �EPA�. Ithas been pointed out that the EPA in its present form lacksserious justification and is insufficient for two step processessuch as RMC �23,24�. As a result, the majority of the calcu-
lations pertaining to RMC have employed the IA. There arebasically three different models for treating RMC within theframework of the standard IA. Closure models: These are thesimplest models and are based on nuclear sum rules and theyassume that all of the existing nuclear final states are attain-able. Phenomenological models: For these models a phe-nomenological nuclear response function is proposed, whichdivides the transition strength into a dipole and a quadrupolepart.3 One instance of such a model was developed by Chris-tillin �25�, who has criticized closure models purely on the-oretical grounds. He argued that the closure sums includestates of nuclear excitation, which are energetically forbid-den. As the RMC photon energy increases, the allowed partof the excitation energy decreases. This explains why all clo-sure models overestimate RMC rates. Microscopic models:The approach taken in the case of these models, developedby Gmitro et al. �26�, is to employ detailed wave functionsfor the initial and all the important final nuclear states andthen perform a detailed microscopic calculation summedover all partial transitions. This technique also suffers froman overestimation of RMC rates.
Table I shows �� values, which are energy-averaged pho-ton asymmetries with the energy cutoff of E��57 MeV, for40Ca evaluated based on several different models, using theGoldberger-Treiman value for gP . The last entry in the TableI is based on the MIA approach proposed by Gmitro et al.�27�, which is significantly different than the predictionsbased on other traditional models. The MIA model was de-veloped in order to account for the discrepancy between thephoton yield as predicted by the phenomenological model ofChristillin �25� and the earlier IA model of Gmitro et al.�26�. They applied meson exchange corrections �MEC� totheir IA technique by introducing constraints imposed by theelectromagnetic continuity equation at the pion vertex. TheseMEC corrections resulted in a reduction of the rate by almosta factor of 2 for 40Ca. However, it should be pointed out thatalthough the MIA is quite successful in predicting RMCrates, it predicts a lower sensitivity of �� to gP and this is asharp departure from the ‘‘model independence of �� versusgP’’ as predicted by the earlier theoretical work.
3In the phenomenological models, the dipole strength is fixedfrom related electroweak data and the quadrupole strength is fixedby OMC.
TABLE I. The energy-averaged �with the energy cutoff of E�
�57 MeV photon asymmetries for 40Ca as calculated by severaldifferent models, using the Goldberger-Treiman value for gP .
�� Reference
0.75 Rood and Tolhoek �28�
0.78 Rood, Yano, and Yano �29�
0.76 Sloboda and Fearing �30�
0.79 Christillin �Phenomenological Model� �25�
0.77 Gmitro et al. �IA� �26�
0.95 Gmitro et al. �MIA� �27�
PHOTON ASYMMETRY MEASUREMENT IN RADIATIVE . . . PHYSICAL REVIEW C 68, 0246XX �2003�
0246XX-3
PROOF COPY [CA8907] 031308PRC
PROOF COPY [CA8907] 031308PRC
PROO
F COPY [CA8907] 031308PRC
III. GENERAL EXPERIMENTAL ASPECTS
The experimental data presented in this paper were ob-tained by using the backward �� beam from the M20Achannel at TRIUMF. The data were collected at two differentaverage beam momenta of 76 MeV/c and 86 MeV/c. Theexperiment was designed in the manner of a muon spin ro-tation (�SR) experiment �31�. The �SR technique relies onthe fact that a muon decays preferentially along its helicitydirection—this was exploited in the following manner. Themuon beam entered the experimental area with its polariza-tion vector4 essentially longitudinal and it was then allowedto strike a target situated in a uniform transverse magneticfield. For those muons that were stopped within the target,the magnetic field caused their spins to precess in a horizon-tal plane at a uniform rate, see Fig. 1. By observing the RMCphotons in a stationary detector placed at a fixed angle to thedirection of the incident �� beam, the photon asymmetrymanifested itself as a periodic time component superimposedupon a normal exponential decay curve in the resulting timespectrum.
A. Experimental setup
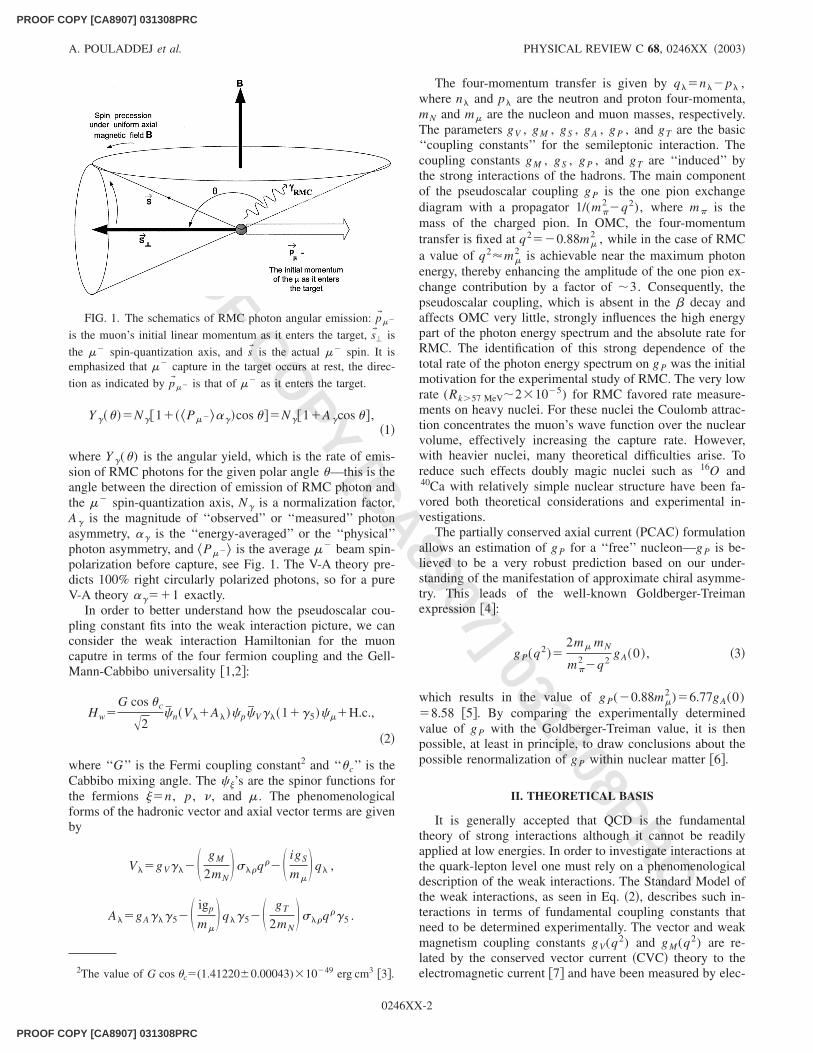
The key features of the geometrical setup of the experi-ment are shown in Fig. 2, where the main detection compo-nent was the photon telescope �TINA � BARS�. The wholesetup was completely covered with large blocks of concreteto provide an effective shielding against the unwanted back-ground radiations. The backgrounds encountered in this ex-periment can be categorized into three main classes: cosmicrays, beam or cyclotron-related, and target-associated. Neu-
trons and cosmic rays were a very major source of back-ground contamination in this experiment. Consequently,shielding against such unwanted events was a major designconsideration. Without any shielding, the RMC photons weredetectable with a signal-to-noise ratio of 0.5 to 1, while withthe added shielding we achieved a signal-to-noise ratio of 7to 1.
The target: It consisted of two geometrically identicalslabs of natural calcium �97% 40Ca) protected by a thin coat-ing of aluminum. The target was designed with two condi-tions in mind: first, to have as large a fraction of the incidentmuon’s stop in the target as possible; second, to have thecentroid of the stopping distribution as close as possible tothe back face of the target in direct view of TINA. This latterrequirement was necessary in order to reduce the bremsstrah-lung radiations arising from decay electrons within the tar-get, and thereby allowing a better determination of the ��
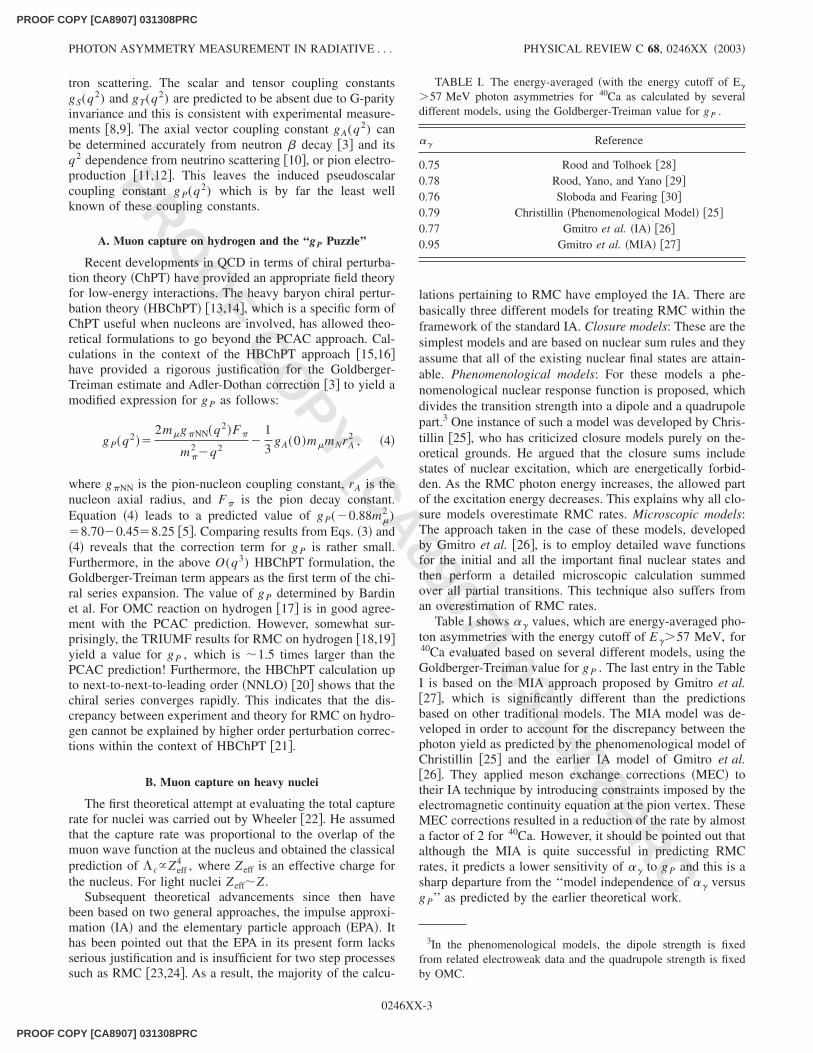
beam polarization before capture by reducing the MonteCarlo �MC� dependence of our result. The distance param-eter used in the above minimization was the ‘‘emergencedistance’’ ds , which was measured from the centroid of thestopping distribution to the back face of the target in a directline towards TINA. Figure 3 shows the relevant geometry.The results of our MC simulation indicated that with ourgiven set of experimental conditions of �P�� �76 and 86MeV/c, possible target inclination range 20°��60° , anda magnetic field of 0.041 T, the �� mean penetration depthvaried from 0.7 to 1.6 cm �i.e., well within the thickness ofone target slab�. It was, therefore, decided to employ a ‘‘thin-
4Due to the precession of a muon’s spin in the bending magnets,the beam’s polarization vector is not exactly longitudinal. The av-erage value of polarization for �� beam and �� beam in the M20Achannel have been measured �32�, and the average residual polar-ization for �� beam stopped in our 40Ca target has been determinedto be �P�� �0.111�0.010.
FIG. 2. Detailed design of the experiment including the shield-ing plan in the vicinity of M20A beamline to guard against back-ground radiation for RMC 40Ca experiment at TRIUMF.
FIG. 3. Target setup �not to scale�. C is the centriod of thestopping distribution, o is the geometrical center of the compoundtarget, x indicates the direction of the photon telescope, z is thedirection of the incident beam, and ds is the ‘‘emergence length,’’which is measured from the centroid of the stopping distribution tothe back face of the target in a direct line towards TINA. Theprimed axes ox�y�z� are a planar rotation—in the (x ,z) plane—ofthe x ,y ,z axes by the angle .
A. POULADDEJ et al. PHYSICAL REVIEW C 68, 0246XX �2003�
0246XX-4
PROOF COPY [CA8907] 031308PRC
PROOF COPY [CA8907] 031308PRC
PROO
F COPY [CA8907] 031308PRC
extended’’ target obtained by placing the slabs end to end,resulting in a compound target size of 20 cm�10 cm20 cm�10 cm�1.9 cm. An inclination angle of �30° was used,a choice that provided an acceptable level for both of theafore-mentioned requirements, see Table II. The Monte Carloresults for the % stops in the target values of 68% and 53%were in good agreement with the experimentally measuredvalues of (70�3)% and (53�3)%, respectively.
The precession magnet: The desired magnetic field wasobtained from a small C magnet, which provided a field ho-mogeneity of 3% across the target. Its square pole faces mea-sured 25.4 cm�25.4 cm and were separated by a uniformgap of 15.2 cm. These pole faces were completely coveredwith 0.32 cm thick sheets of lead, so that any muon thatmissed the target would stop in lead rather than iron, and thiswould then produce a much faster decay background timecomponent �for lead ����75 ns as compared to iron ���
�142 ns). The target, sandwiched between the two detectorsS2 and S3, was then placed between the magnet’s pole facessuch that its geometrical center coincided with that of thegap. It had its cross-sectional plane of 20 cm�10 cm verti-cal and was situated at 30° to the direction of the incidentbeam, see Fig. 3. The precession magnetic field had a nomi-nal value of 0.041 T, resulting in a precession frequency of5.5 MHz. Like an earlier TRIUMF experiment �32�, it wasdecided not to employ the stroboscopic �SR method �33� inwhich the muon precession frequency is tuned to be equal tothe cyclotron frequency.
Detection requirements: The detection task for this experi-ment consisted of the following: �i� identifying the arrivaltime and the ultimate fate of the incident muon, �ii� selectingthe relevant events �charged or neutral� arising from the ab-sorption or decay of the muon, and �iii� recording the timeand energy information for each event.
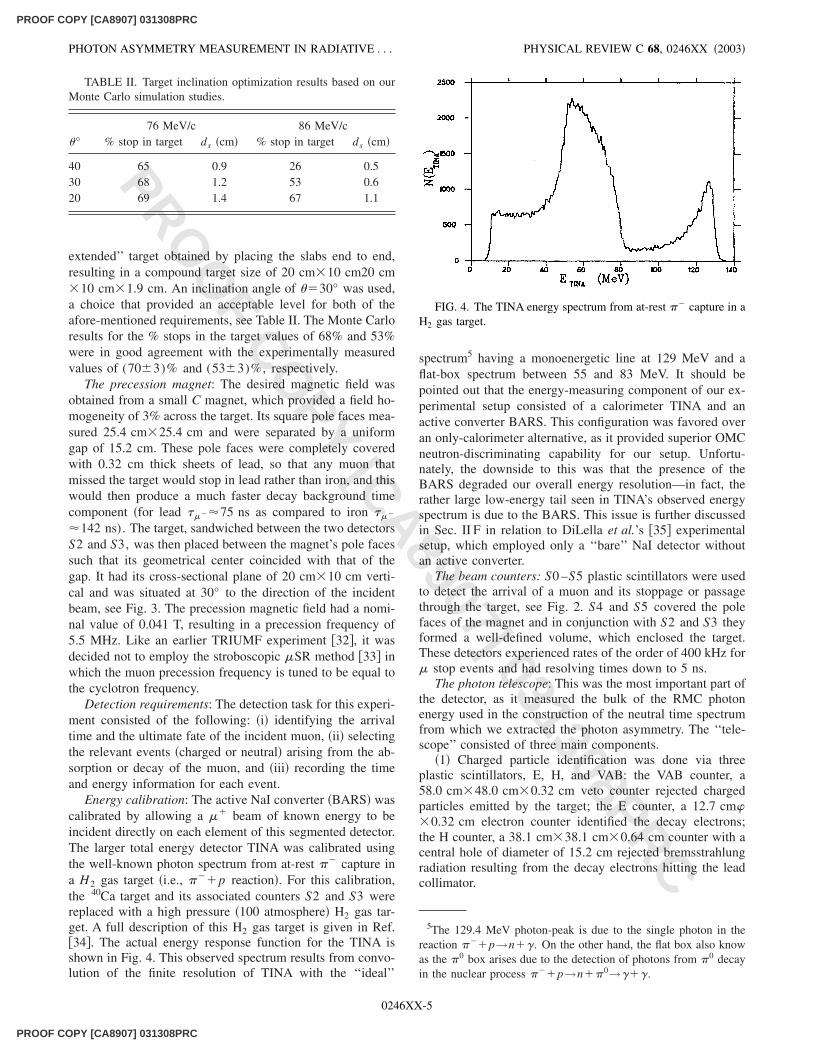
Energy calibration: The active NaI converter �BARS� wascalibrated by allowing a �� beam of known energy to beincident directly on each element of this segmented detector.The larger total energy detector TINA was calibrated usingthe well-known photon spectrum from at-rest �� capture ina H2 gas target �i.e., ���p reaction�. For this calibration,the 40Ca target and its associated counters S2 and S3 werereplaced with a high pressure �100 atmosphere� H2 gas tar-get. A full description of this H2 gas target is given in Ref.�34�. The actual energy response function for the TINA isshown in Fig. 4. This observed spectrum results from convo-lution of the finite resolution of TINA with the ‘‘ideal’’
spectrum5 having a monoenergetic line at 129 MeV and aflat-box spectrum between 55 and 83 MeV. It should bepointed out that the energy-measuring component of our ex-perimental setup consisted of a calorimeter TINA and anactive converter BARS. This configuration was favored overan only-calorimeter alternative, as it provided superior OMCneutron-discriminating capability for our setup. Unfortu-nately, the downside to this was that the presence of theBARS degraded our overall energy resolution—in fact, therather large low-energy tail seen in TINA’s observed energyspectrum is due to the BARS. This issue is further discussedin Sec. II F in relation to DiLella et al.’s �35� experimentalsetup, which employed only a ‘‘bare’’ NaI detector withoutan active converter.
The beam counters: S0 –S5 plastic scintillators were usedto detect the arrival of a muon and its stoppage or passagethrough the target, see Fig. 2. S4 and S5 covered the polefaces of the magnet and in conjunction with S2 and S3 theyformed a well-defined volume, which enclosed the target.These detectors experienced rates of the order of 400 kHz for� stop events and had resolving times down to 5 ns.
The photon telescope: This was the most important part ofthe detector, as it measured the bulk of the RMC photonenergy used in the construction of the neutral time spectrumfrom which we extracted the photon asymmetry. The ‘‘tele-scope’’ consisted of three main components.
�1� Charged particle identification was done via threeplastic scintillators, E, H, and VAB: the VAB counter, a58.0 cm�48.0 cm�0.32 cm veto counter rejected chargedparticles emitted by the target; the E counter, a 12.7 cm��0.32 cm electron counter identified the decay electrons;the H counter, a 38.1 cm�38.1 cm�0.64 cm counter with acentral hole of diameter of 15.2 cm rejected bremsstrahlungradiation resulting from the decay electrons hitting the leadcollimator.
5The 129.4 MeV photon-peak is due to the single photon in thereaction ���p→n�� . On the other hand, the flat box also knowas the �0 box arises due to the detection of photons from �0 decayin the nuclear process ���p→n��0→��� .
TABLE II. Target inclination optimization results based on ourMonte Carlo simulation studies.
76 MeV/c 86 MeV/c° % stop in target ds �cm� % stop in target ds �cm�
40 65 0.9 26 0.530 68 1.2 53 0.620 69 1.4 67 1.1
FIG. 4. The TINA energy spectrum from at-rest �� capture in aH2 gas target.
PHOTON ASYMMETRY MEASUREMENT IN RADIATIVE . . . PHYSICAL REVIEW C 68, 0246XX �2003�
0246XX-5
PROOF COPY [CA8907] 031308PRC
PROOF COPY [CA8907] 031308PRC
PROO
F COPY [CA8907] 031308PRC
�2� The photon energy measurement was performed viathe two NaI �TI� detectors, TINA and BARS. TINA was acylindrical crystal of diameter 46 cm and depth 51 cm en-closed in an aluminum container. It collected the electromag-netic showers that resulted from converted photons withinthe BARS. Because of its comparatively large geometricalvolume, it absorbed most of the energy associated with agiven neutral event. It had an energy resolution of 7.1% fullwidth at half maxium �FWHM� for 129 MeV photons. TheBARS detector consisted of seven geometrically identical,optically isolated blocks of NaI �TI�—each individual blockmeasured 5.08 cm�4.35 cm�35.56 cm. This served as our� converter, turning photons into electron-positron pairs. Ithad an energy resolution of 3.2% for 40 MeV pions. Thephoton telescope had an overall � energy resolution of�15% FWHM at 70 MeV. By requiring simultaneous en-ergy deposition �5 MeV in both the TINA and BARS, itwas possible to discriminate against a considerable part ofthe neutron background, arising from OMC in the target aswell as other background sources.
�3� Three 38.1 cm�38.1 cm�0.32 cm optically isolatedplastic scintillators �LST 1,2,3� were used to help identifyelectrons, resulting from photon conversion in the BARS.Due to the rather poor energy resolution and efficiency theactual measured LST energy was not used in the off-lineanalysis—rather an average energy loss was substituted.
The observed event rates in the NaI and other vetocounters were of the order of 500 Hz. The entire photontelescope was then placed in a 10-cm thick iron plate shield-ing box, which had a 30-cm diameter hole in its front face.
The cosmic-ray counters: To discriminate against cosmicrays, two additional sets of large plastic scintillators wereused to cover the whole of the photon telescope. The ‘‘inner’’counters were placed over and on both sides of TINA, whilethe ‘‘outer’’ counters were placed on the outside of theshielding box. These counters were used to identify cosmic-ray events that passed through or stopped in our apparatus.
This signals from the counters were processed by standardNIM modules and the relevant data were then passed viaCAMAC to a computer for recording on magnetic tapes.
B. Logic and event selection
Three event categories were deployed.�1� Neutral �NEU� events: a NEU event was intended for
classifying those processes that were recognized as beingelectrically neutral at their point of creation inside the target.Examples were RMC and bremsstrahlung photons and OMCneutrons.
�2� Charged �CHG� events: A CHG event referencedcharged decay electrons or positrons arising from muon de-cay in orbit. The CHG and NEU events were further com-bined logically to produce the more general ‘‘good event’’�GDV�.
�3� Pulser �PULSER� events: A PULSER event was ob-tained by using a beam pulser to sample events at random,following the arrival of a beam particle, thereby allowing thedetermination of the ‘‘pedestals’’ on our ADC’s �i.e., provid-ing information about the noise level on the counters as well
as the thresholds of the ADC’s�.In order to guard against muon stop events in the pole
faces of our precession magnet, an associated inhibit signalwas used. This inhibit signal was defined as an OR of thecomputer busy signal and a 300-ns-long signal of the form�(S0�S1)�(S4�S5)� . The coincidence (S0�S1�S2)signaled the arrival of a muon inside the target and�S0�S1�S2�(S3�S4�S5)� indicated that the muonhad, in fact, stopped within the target. The elementary eventswere then defined as follows:
NEU�TINA�BARS�NEUV,
CHG�BARS�S3�E�VA�VB�CHGV,
GDV��NEU�CHG��inhibit,
PULSER�S0�S1�S2�beam pulser�inhibit.
The charged and neutral ‘‘vetoes’’ were defined asCHGV�S0�S1�H�charged pulser,6 and NEUV�S0�S1�H�VA�VB.7
The CAMAC modules were read out for both GDV andPLS events. The decay of a captured muon within the targetwas observed within a 2-�s-long time window. If within the2-�s time window a second �or third, etc.� muon arrived,that particular event was discarded.
IV. EXPERIMENTAL ANALYSIS
The RMC asymmetry measurements were carried outwith a backward �� beam at two different average beammomenta of 76 and 86 MeV/c. The calibration data for TINAwere obtained with a 100 MeV/c �� beam, while the BARSwere calibrated in an 86 MeV/c backward �� beam.
A. The observable, ��
The energy-dependent RMC photon angular distributionis given by
W��k ,��1����k �cos ,
where K�E� is the photon energy, is the angle betweenthe emitted RMC photon and the direction of the spin-quantization axis of ��, and ��(k) is the energy-dependentphoton asymmetry coefficient, which was defined in terms ofthe RMC rate (RMC) as follows:
���k ���d�
RMC /dk���d�RMC /dk�
�d�RMC /dk���d�
RMC /dk�,
where �RMC�RMC(k ,�0) and �
RMC�RMC(k ,��). Due to the low rate associated with RMC, an energy-dependent measurement of the photon asymmetry was not
6Due to the very large number of charged events, a random pulserknown as the ‘‘charged pulser’’ was used to reduce �by a factor of�15) the rate at which charged events were recorded onto magnetictapes.
7It is noted that the veto counter VAB had two wave-shifter barsone on each side. VA and VB refer to the signals from these twowave-shifter bars.
A. POULADDEJ et al. PHYSICAL REVIEW C 68, 0246XX �2003�
0246XX-6
PROOF COPY [CA8907] 031308PRC
PROOF COPY [CA8907] 031308PRC
PROO
F COPY [CA8907] 031308PRC
experimentally feasible. Furthermore, below 57 MeV, the ex-perimental RMC energy spectrum was overpowered bybremsstrahlung photons, thus restricting the range overwhich the RMC could be accurately measured. Conse-quently, �� was defined over the experimentally accessibleregion of k�57 MeV as
���
�k�57 MeV
���k �RMC dk
�k�57 MeV
RMC dk
.
For 100% polarized �� before capture �experimentallynot realizable�, the angular distribution of the emitted RMCphotons in terms of �� is then given by
W����1���cos ,
which is tobe compared with Eq. �1�.
B. Choice of the fitting function
The most general function describing the observed neutraltime spectrum for this experiment has the form
N� t ���i
�Ni� t ���B� t �
��i
�N0ie�t/� i�1�A�icos��t���e��t� �B� t �
��i
�N0ie�t/� i�1�A�i� t �e�rit� �B� t �,
where the index ‘‘i’’ is to run over all the possible sourcesradiating the RMC photons. Ni(t): number of events per unittime at time t for source i; number of events per unit time attime t�0 for source i; � i : decay lifetime of �� in source imaterial �e.g., �333.0 ns in 40Ca); �: angular precessionfrequency dictated by the magnetic field; �: initial phaseangle which is �90° for �� in this experiment; B(t): time-dependent background term; A�i : magnitude of RMC pho-ton asymmetry for source i; A�i(t): time-dependent RMCphoton asymmetry function for source i; ri : relaxation pa-rameter for source i.
The exponential term e�t/� i arises because of the finitelifetime for the muon capture process. The periodicity inher-ent in the neutral time spectrum, which is associated with theprecession of �’s spin, is expressed by cos(�t��). Any pos-sible nonhomogeneity in the precession magnetic field willmanifest itself through a relaxation of the signal and this isaccounted for by the relaxation term e�rit.
The main source of the RMC photons was the calciumtarget. There were two other minor sources that also contrib-uted: the lead and the carbon components arising from ��
absorption in the lead sheaths and the scintillators or theirwrapping. From a two-component fit to the neutral timespectrum, it was determined that within the existing errorbounds for this experiment the above two minor sourcescould be omitted from the fits without affecting the estimated
value of the observed asymmetry for 40Ca.8 Furthermore, norelaxation effects were observed.9 Hence the value of theobserved asymmetry is independent of t�0. With these sim-plifications, the fitting function becomes a single time com-ponent equation, and takes the form of a standard � SRfitting function:
N� t ��NCa� t ��N0e�t/��1�A�cos��t�����B� t �
�N0e�t/��1�A�� t ���B� t �. �5�
The quantity of interest is the physical photon asymmetry(��). This was obtained by normalizing the observed photonasymmetry to the average residual �� beam polarization be-fore capture, using Eq. �1�. A !2 minimization was then car-ried out using the nonlinear functional-minimization pro-gram MINUIT �36�. The asymmetrical errors quoted for theestimated parameters are those provided by the MINOS sub-routine that provides 1� errors �i.e., 68% confidence limit�.
C. Brief discussion of cuts and energy reconstructionfor the RMC photons
The raw data were initially cleaned up with two cuts, onehardware and the other a software cut, before being subjectedto any systematic analysis. These cuts were as follows.
�1� The neutron removal condition consisted of requiring�25 MeV total energy deposition in the TINA and theBARS, i.e., BARS�TINA�25 MeV in conjunction with therequirement �(BARS�5 MeV)�(TINA�5 MeV)� . Thislatter condition was used since neutrons typically depositedenergy in both the TINA and BARS simultaneously. Thiswas a hardware cut applied by the data acquisition system; itwas quite successful in removing the prolific neutron back-ground. It discriminated against neutron background by afactor of �100.
�2� The low-energy neutral events were further removedby requiring �45 MeV total energy deposition in the TINAand the BARS. This was a software cut applied offline toproduce the final ‘‘skimmed’’ data sample used in our analy-sis.
The 2-�s �� decay time window was divided into twodistinct time regions, a foreground region, which was 985 nslong, and an early-time background region 1015 ns long.These two regions were separated by the ‘‘prompt peak,’’which had a full width �20 ns and signaled the arrival of a� in the target region. The following software cuts were thenapplied to our skimmed data sample to construct our cleanneutral time spectrum.
�1� The prompt cut: This cut was used to discard eventsthat were prompt-in-time with a �� arrival. This wasachieved by inspecting the S2 TDC and the S0�S1 pulseseparator TDC’s. This cut aimed at removing the ��-relatedbackground and its associated 43.37 ns cyclotron-relatedtime structure.
8Both of these minor sources had very low contributions:(N0Pb /N0Ca)�10�6, (N0C /N0Ca)�10�3.
9The relaxation term was found to be negligible rCa�10�5.
PHOTON ASYMMETRY MEASUREMENT IN RADIATIVE . . . PHYSICAL REVIEW C 68, 0246XX �2003�
0246XX-7
PROOF COPY [CA8907] 031308PRC
PROOF COPY [CA8907] 031308PRC
PROO
F COPY [CA8907] 031308PRC
�2� The cosmic-ray cut: It removed any events that werepreceded by the passage of a cosmic ray through the appa-ratus as far back as 8 �s prior to the prompt timing for theevent. This long veto was necessary in order to discriminateagainst any cosmic-ray �’s which stopped near TINA. Itrelied on the IN � OUT signal from the IN and OUTcosmic-ray counters to achieve this purpose.
�3� The 2nd �-stop cut: It rejected those events that oc-curred as a result of there being more than one �-stop at atime in the target.
�4� The bremsstrahlung cut: This cut guarded againstbremsstrahlung radiation arising from the interaction of thedecay electrons inside the target and/or within the C-magnetpole faces; this was achieved by using the S3, S4, and S5TDC’s and their respective ADC’s.
�5� The layered scintillator cut: It was the most successfulcut in removing background. This cut placed a low- and ahigh-energy requirements on the LST’s three elements. The‘‘low-energy’’ cut was employed to identify a ‘‘firing’’ in anyof the LST 1,2,3—it set the minimum energy deposition re-quired in the LST’s before an event was to be accepted. The‘‘high-energy’’ cut discriminated against high-energy cosmicrays passing through the LST’s.
For a more detailed discussion of these cuts, the reader isreferred to Refs. �37,38�.
The sum of the energies deposited in the BARS, TINA,LST and the nonactive elements between the BARS andTINA, the so-called ‘‘reconstructed energy’’ for the RMCphoton, was then computed. The energy deposited in the LSTand the nonactive elements between the BARS and TINAwas estimated using EGS �3� �39�. Our simulations indicatedan estimated value for this energy was �2.5 MeV for asingle electron and �5.0 MeV for two electrons10 passingbetween the BARS and TINA.
D. Parameter estimation for the RMC photonneutral time spectrum
The background term: After the application of the cuts tothe raw neutral data, the background was substantially re-duced and appeared almost completely independent of timein the early-time window. Any structure that might have re-mained due to the cyclotron-related background was over-shadowed by the Poisson uncertainty associated with the in-dividual data points. Consequently, a constant backgroundterm, B(t)�B�const, was chosen and its value was experi-mentally determined from a fit to the early-time region. Thischoice was later substantiated by scanning the neutral andthe charged time spectra over time ranges greater than 43 nsto look for a possible periodicity in the observed asymmetry.None was found.
The precession frequency and the initial phase: Becauseof the abundance of the decay e� data and its associatedlarge observed asymmetry, there is no depolarization of ��
within the target, the e� time spectrum was used for the
precession frequency and the initial phase determination. Theenergy loss within the target due to interaction of the e� withthe target material was also included. This was estimatedfrom Monte Carlo simulation �EGS �3�� to be �7 MeV.From a !2 minimization of the e� time spectrum with afunction of the form given by Eq. �5�, it was possible todetermine the precession frequency and the initial phase. Tocarry out these fits, the e� TDC spectrum was rebinned by afactor of 10. With our time calibration this meant a 10.11 nstime binning. Furthermore, the constancy of these fitted val-ues were investigated by performing time and energy scans.Our average decay time for �� from these fits was ���
�2.17�0.02 �s �38� which agreed reasonably well with thepresent world average for the �� lifetime of ����2.19703�0.0004 �s �3�. The estimated value of the initial phaseangle was ��88.8°�0.7° , which also agreed quite wellwith the nominally expected value of 90° . The measuredvalue of the precession frequency was ��5.50�0.01 MHz, which is to be compared with the expectedvalue of 5.50 MHz.
E. Extraction of the observed photon asymmetry, A�
The RMC asymmetry measurements were carried out atdifferent average beam momenta: 76 and 86 MeV/c. TableIII shows the total number of � stops for each of these twocases.
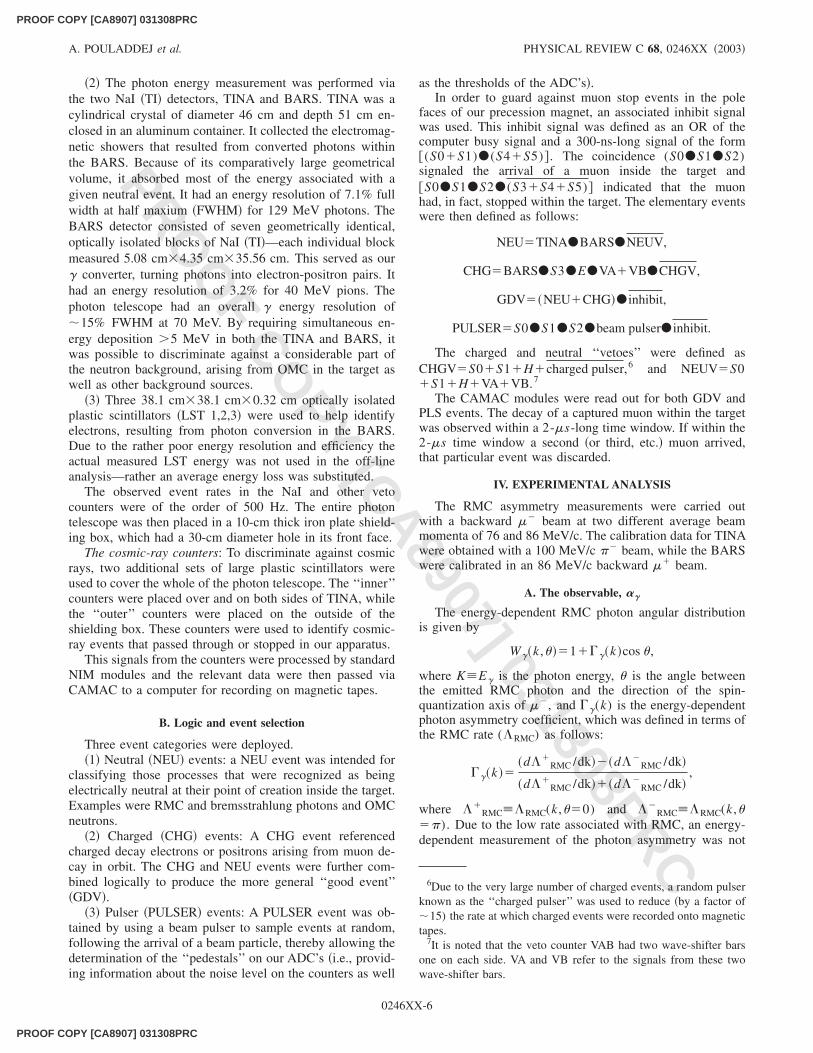
With the limited number of candidate events available, anindependent analysis for these two momenta was abandoned.Instead, all of the available data at both momenta weresummed up to produce one neutral time spectrum. The ob-served photon asymmetry was then estimated by a fit to thistime spectrum. Figure 5 shows the resulting time spectrum at
10These electrons were the result of photoconversion within theBARS.
TABLE III. ��-stop statistics for the RMC runs.
�p�� �86 MeV/c �p�� �76 MeV/c Total statistics
#� stops 7.37624�1010 4.70885�1010 12.08509�1010
FIG. 5. Final neutral time spectrum shown at the raw TDCbinning of 1.011 ns time bin. The plot shows both the backgroundand the foreground time regions, which are separated by the promptpeak.
A. POULADDEJ et al. PHYSICAL REVIEW C 68, 0246XX �2003�
0246XX-8
PROOF COPY [CA8907] 031308PRC
PROOF COPY [CA8907] 031308PRC
PROO
F COPY [CA8907] 031308PRC
1.01 ns/bin time binning after the application of all of thecuts.
For the neutral time spectrum, the integral signal �S� forthe incident average beam momentum �p�� was defined as
S �p�� ��0
960�"E�
N�E� ,t �dE�dt���960
0
B� t �dt
��0
960
N� t �dt���960
0
B� t �dt,
where "E� is the energy slice over which the observed pho-ton asymmetry is defined. Since RMC was prominent forphoton energies �57.0 MeV, the choice taken for the energyslice was "E��Emax�57.0. The value of Emax was thenchosen to maximize this signal. The results of these energyscans are presented in Table IV.
From Table IV it is seen that there is no gain in the RMCsignal for E��95.0 MeV. The integral observed photonasymmetry was then appropriately estimated as
A���E��57.0 MeV
A��E��dE���E��57.0 MeV
95.0
A��E��dE� .
With the limited statistics in hand, a fit to the data at thebest time binning of 1.011 ns/bin was impractical. In order toreduce the Poisson uncertainty associated with the individualdata points used in the fit, it was necessary to rebin the dataand fit at a coarser time binning. The resulting value of theobserved photon asymmetry extracted from the neutral timespectrum was then attenuated somewhat by the angular av-eraging brought about by this rebinning of the data. If Tp isthe precession period and Tb is the elementary bin time usedin the fit (�Tb� is the corresponding rebinning factor�, thisattenuation effect is expressible in terms of a reduction factorr [Tb] . This reduction factor relates the true value of photon
asymmetry A� to the estimated value of the attenuated ob-served photon asymmetry from a given fit, A�
([Tb]) , accordingto the following equation:
A��A�
([Tb])
r [Tb]. �6�
In this experiment, the precession frequency of 5.50 MHzcorresponded to Tp�181.8 ns, resulting in r [T10]�0.995 for
a 10-ns time bin and and r [T43]�0.911 for a 43-ns time bin.
In relation to our !2 minimization fit procedure, the fol-lowing two ‘‘constrained’’ fit-types were employed.
�1� A ‘‘semifree’’ �SF� fit is one in which all of the param-eters as per Eq. �5� except the background term are allowedto vary freely in the !2 minimization process.
�2� A ‘‘partially restricted’’ �PR� fit is one for which � , � ,and B are fixed at their experimentally determined value11
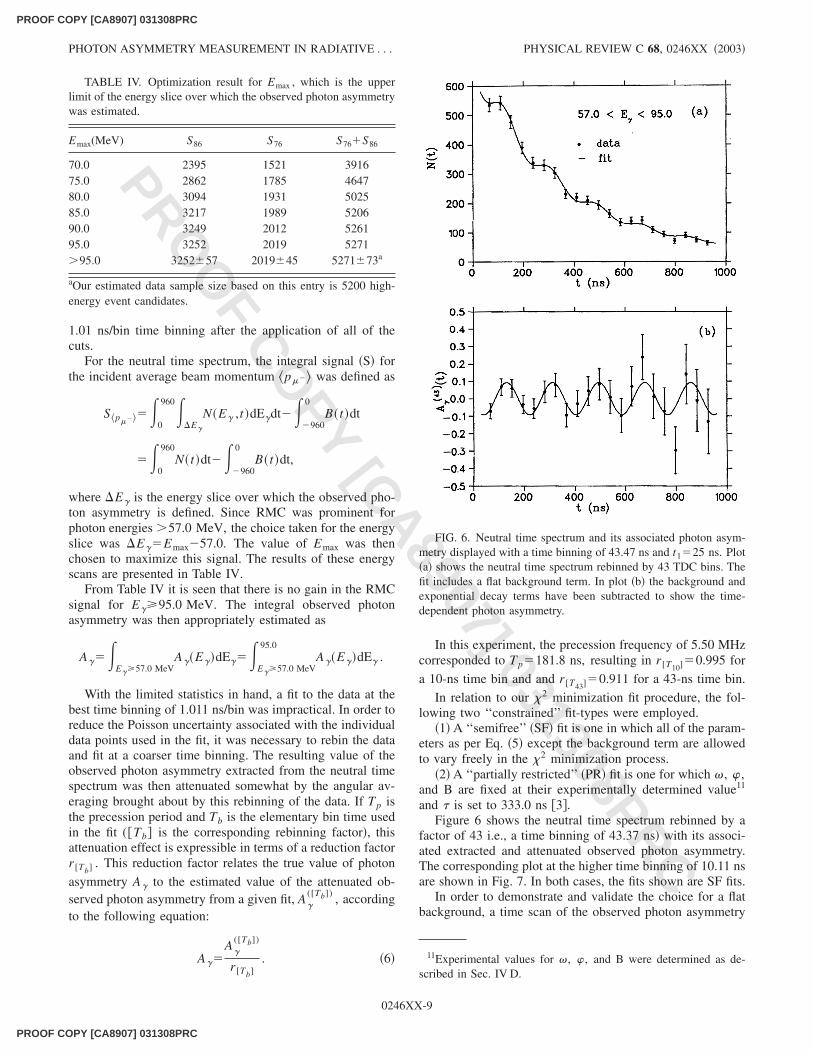
and � is set to 333.0 ns �3�.Figure 6 shows the neutral time spectrum rebinned by a
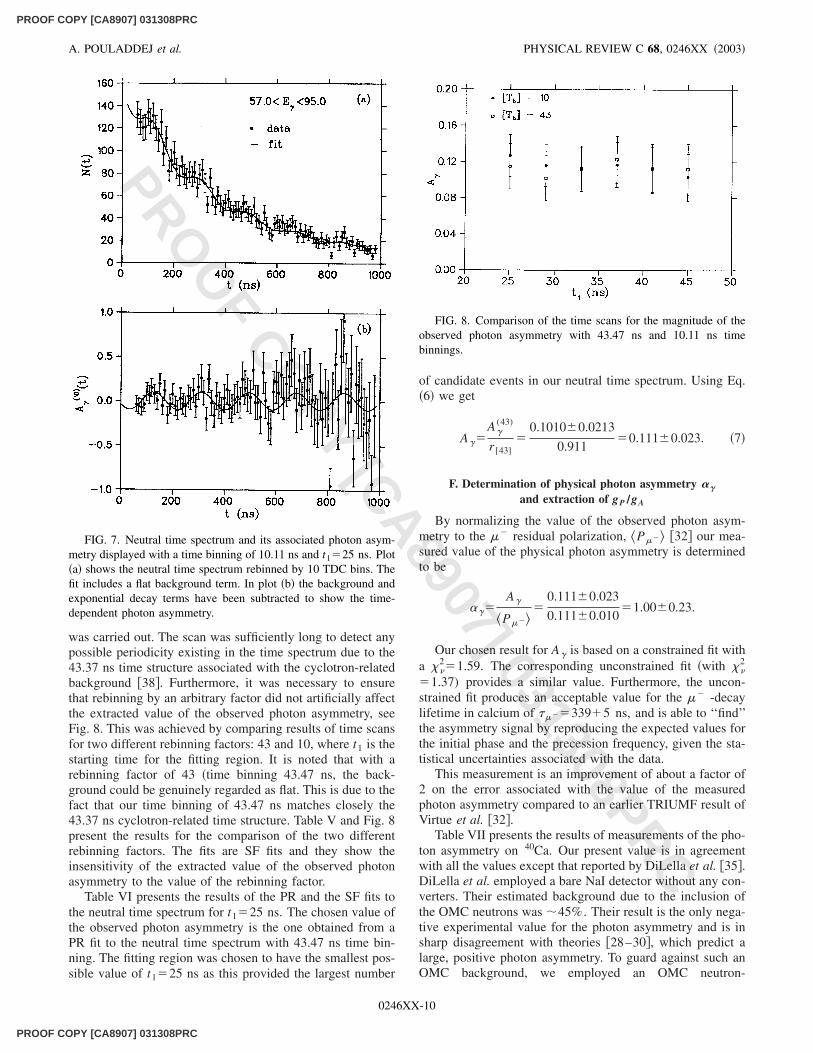
factor of 43 i.e., a time binning of 43.37 ns� with its associ-ated extracted and attenuated observed photon asymmetry.The corresponding plot at the higher time binning of 10.11 nsare shown in Fig. 7. In both cases, the fits shown are SF fits.
In order to demonstrate and validate the choice for a flatbackground, a time scan of the observed photon asymmetry
11Experimental values for � , � , and B were determined as de-scribed in Sec. IV D.
TABLE IV. Optimization result for Emax , which is the upperlimit of the energy slice over which the observed photon asymmetrywas estimated.
Emax(MeV) S86 S76 S76�S86
70.0 2395 1521 391675.0 2862 1785 464780.0 3094 1931 502585.0 3217 1989 520690.0 3249 2012 526195.0 3252 2019 5271�95.0 3252�57 2019�45 5271�73a
aOur estimated data sample size based on this entry is 5200 high-energy event candidates.
FIG. 6. Neutral time spectrum and its associated photon asym-metry displayed with a time binning of 43.47 ns and t1�25 ns. Plot�a� shows the neutral time spectrum rebinned by 43 TDC bins. Thefit includes a flat background term. In plot �b� the background andexponential decay terms have been subtracted to show the time-dependent photon asymmetry.
PHOTON ASYMMETRY MEASUREMENT IN RADIATIVE . . . PHYSICAL REVIEW C 68, 0246XX �2003�
0246XX-9
PROOF COPY [CA8907] 031308PRC
PROOF COPY [CA8907] 031308PRC
PROO
F COPY [CA8907] 031308PRC
was carried out. The scan was sufficiently long to detect anypossible periodicity existing in the time spectrum due to the43.37 ns time structure associated with the cyclotron-relatedbackground �38�. Furthermore, it was necessary to ensurethat rebinning by an arbitrary factor did not artificially affectthe extracted value of the observed photon asymmetry, seeFig. 8. This was achieved by comparing results of time scansfor two different rebinning factors: 43 and 10, where t1 is thestarting time for the fitting region. It is noted that with arebinning factor of 43 �time binning 43.47 ns, the back-ground could be genuinely regarded as flat. This is due to thefact that our time binning of 43.47 ns matches closely the43.37 ns cyclotron-related time structure. Table V and Fig. 8present the results for the comparison of the two differentrebinning factors. The fits are SF fits and they show theinsensitivity of the extracted value of the observed photonasymmetry to the value of the rebinning factor.
Table VI presents the results of the PR and the SF fits tothe neutral time spectrum for t1�25 ns. The chosen value ofthe observed photon asymmetry is the one obtained from aPR fit to the neutral time spectrum with 43.47 ns time bin-ning. The fitting region was chosen to have the smallest pos-sible value of t1�25 ns as this provided the largest number
of candidate events in our neutral time spectrum. Using Eq.�6� we get
A��A�
(43)
r [43]�
0.1010�0.0213
0.911�0.111�0.023. �7�
F. Determination of physical photon asymmetry ��
and extraction of gP ÕgA
By normalizing the value of the observed photon asym-metry to the �� residual polarization, �P�� �32� our mea-sured value of the physical photon asymmetry is determinedto be
���A�
�P�� �
0.111�0.023
0.111�0.010�1.00�0.23.
Our chosen result for A� is based on a constrained fit witha !�
2�1.59. The corresponding unconstrained fit �with !�2
�1.37) provides a similar value. Furthermore, the uncon-strained fit produces an acceptable value for the �� -decaylifetime in calcium of ����339�5 ns, and is able to ‘‘find’’the asymmetry signal by reproducing the expected values forthe initial phase and the precession frequency, given the sta-tistical uncertainties associated with the data.
This measurement is an improvement of about a factor of2 on the error associated with the value of the measuredphoton asymmetry compared to an earlier TRIUMF result ofVirtue et al. �32�.
Table VII presents the results of measurements of the pho-ton asymmetry on 40Ca. Our present value is in agreementwith all the values except that reported by DiLella et al. �35�.DiLella et al. employed a bare NaI detector without any con-verters. Their estimated background due to the inclusion ofthe OMC neutrons was �45%. Their result is the only nega-tive experimental value for the photon asymmetry and is insharp disagreement with theories �28–30�, which predict alarge, positive photon asymmetry. To guard against such anOMC background, we employed an OMC neutron-
FIG. 7. Neutral time spectrum and its associated photon asym-metry displayed with a time binning of 10.11 ns and t1�25 ns. Plot�a� shows the neutral time spectrum rebinned by 10 TDC bins. Thefit includes a flat background term. In plot �b� the background andexponential decay terms have been subtracted to show the time-dependent photon asymmetry.
FIG. 8. Comparison of the time scans for the magnitude of theobserved photon asymmetry with 43.47 ns and 10.11 ns timebinnings.
A. POULADDEJ et al. PHYSICAL REVIEW C 68, 0246XX �2003�
0246XX-10
PROOF COPY [CA8907] 031308PRC
PROOF COPY [CA8907] 031308PRC
PROO
F COPY [CA8907] 031308PRC
discriminating capability in our setup by placing an activeconverter in front of our main NaI detector.
The result of Hart et al. �40� was obtained by a con-strained fit (!�
2�1.0) to their time spectrum containing�1200 events. With �30% energy resolution, they chose63.5 MeV as their lower cutoff value for the RMC photonenergy spectrum. From their e� data, they obtained a valueof ����(366�8) ns, which is considerably larger than thepresently accepted value of ����333 ns �44�. Dobeli et al.�42� and Schaad �43� presented the results of the SIN/PSIgroup. They employed a pair spectrometer with the strobo-scopic method. In this method, the muon precession fre-quency was tuned to that of the cyclotron frequency. TheySchaad’s value was extracted from a constrained fit to a timespectrum containing some 27 000 events. The authors did notquote !�
2 for the final fit, but we estimate a value of !�2�5
from data, which implies that the quality of the fit is ratherpoor. Dobeli et al. �42� and Schaad �43� derived their model-dependent values of gP based on Gmitro et al.’s modifiedimpulse approximation �MIA� method �27�. The Schaad’svalue based on the photon asymmetry measurement is gP
�(5.1� 4.47.0 )gA . Their results for gP based on the rate mea-
surement technique will be discussed in the following sec-tion.
The result of Virtue et al. �32� was obtained from an un-constrained fit (!�
2�1.10) to a time spectrum containing2500 events. Their value for ����(352�4) ns is also largerthan expected. Their final fit was chosen for t1�67 ns to
avoid the problematic early-time region in their timespectrum.12 Due to their large value for the photon asymme-try, and its associated error, they could only quote an upperlimit for the pseudoscalar coupling constant. Their resultswere gP�5.2 gA for the traditional models and gP�9.5 gAfor the MIA model.
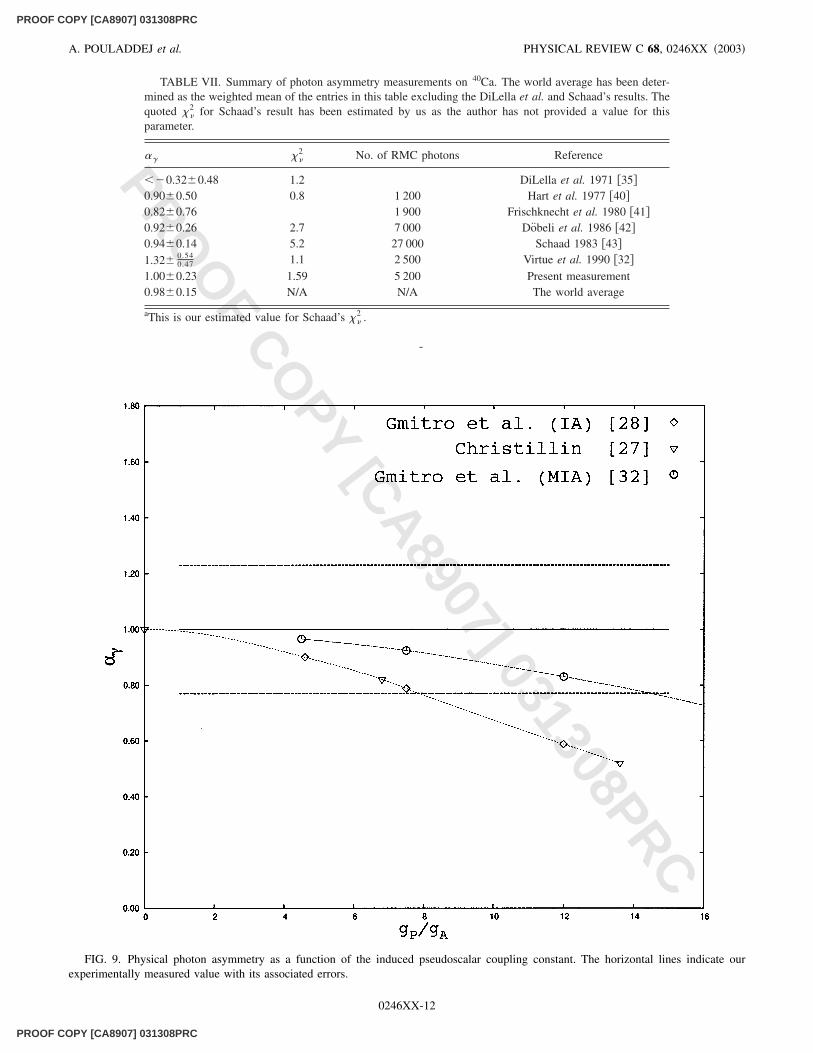
Figure 9 shows �� as a function of gP /gA for the Chris-tillin’s phenomenological model �25�, Gmitro et al.’s IAmodel �26�, and Gmitro et al.’s MIA model �27�. The MIAwas introduced to remove the discrepancy between the pho-ton yield as predicted by the phenomenological model ofChristillin and the earlier IA model of Gmitro et al. The twotraditional models seem to agree quite well, while the MIA issubstantially different at higher gP /gA values—where it pre-dicts a much smaller sensitivity of �� to gP , and therebyindicating a significant model dependence in the theory. Ifwe make a smooth fit to the theoretical data points of thetraditional models of Christillin �25� and Gmitro et al. �26�,we obtain the result gP /gA�8.0. However, for the MIAmodel we obtain gP /gA�14.5. Since the curves are ratherflat the MIA value is nearly twice as large as the value ob-tained from the more traditional models. Unfortunately giventhe statistical uncertainly associated with our measurementand the theoretical discrepancy that exists between the MIAand traditional models does not allow us to constrain gPeffectively, so we will not try to draw any conclusions aboutits possible quenching inside nuclear matter. The currentworld average for the energy-averaged photon asymmetry���0.98�0.15—obtained as a weighted mean of the resultsof Hart et al. �40�, Frischknecht et al. �41�, Dobeli et al.�42�, Virtue et al. �32�, and our current measurement—isequally ineffective in this respect. The corresponding gP /gAextracted values based on the current world average for pho-ton asymmetry measurement on 40Ca are gP /gA�6.8 for theIA model and gP /gA�12.0 for the MIA model. It should bepointed out that the extraction of our energy-averaged photonasymmetry is weighted by the energy-dependence of thephoton detection efficiency, while the theoretical results forIA and MIA are not. It has been assumed that this differenceis small.
12Their extracted value of A�(t1�67 ns) showed signs of system-atic problems implying some distortion in their time spectrum forthe early times, t1�67 ns. It is noted that Hart et al. �40� were alsoforced to discard early-time data in the first 100 ns following a ��
stop.
TABLE VI. Final PR and SF fits to the neutral time spectrum.The region of fit starts at t1�25 ns with 43.47 ns time binning.
Type of fit Parameter Fitted value
A�(43) 0.101�0.0213� 333.0 �ns�
PR � 5.50 �MHz�� 90 �degrees�!�
2 1.59A�
(43) 0.105 (�0.0225/�0.0224)� 339.0�5.1
SF � 5.57�0.08 (MHz)� 103�11 (degrees)!�
2 1.37
TABLE V. Table of the time scan for the observed photon asymmetry with 43.47 ns and 10.11 ns timebinning and SF fits.
t1 �ns�A��
A�(10)
r [10]
!�2
A��A�
(43)
r [43]
!�2
25.0 0.127 (�0.02330/�0.0233) 0.97 0.155 (�0.0247/�0.0246) 1.3729.0 0.116 (�0.0232/�0.0234) 0.96 0.102 (�0.0247/�0.0246) 1.4633.0 0.112 (�0.0239/�0.0236) 1.00 0.113 (�0.0248/�0.0252) 1.3937.0 0.117 (�0.0247/�0.0237) 0.96 0.123 (�0.0260/�0.0259) 0.7441.0 0.112 (�0.0251/�0.0247) 1.17 0.113 (�0.0265/�0.0263) 0.7445.0 0.103 (�0.0255/�0.0249) 0.90 0.112 (�0.0277/�0.0275) 0.59
PHOTON ASYMMETRY MEASUREMENT IN RADIATIVE . . . PHYSICAL REVIEW C 68, 0246XX �2003�
0246XX-11
PROOF COPY [CA8907] 031308PRC
PROOF COPY [CA8907] 031308PRC
PROO
F COPY [CA8907] 031308PRC
-
TABLE VII. Summary of photon asymmetry measurements on 40Ca. The world average has been deter-mined as the weighted mean of the entries in this table excluding the DiLella et al. and Schaad’s results. Thequoted !�
2 for Schaad’s result has been estimated by us as the author has not provided a value for thisparameter.
�� !�2 No. of RMC photons Reference
��0.32�0.48 1.2 DiLella et al. 1971 �35�
0.90�0.50 0.8 1 200 Hart et al. 1977 �40�
0.82�0.76 1 900 Frischknecht et al. 1980 �41�
0.92�0.26 2.7 7 000 Dobeli et al. 1986 �42�
0.94�0.14 5.2 27 000 Schaad 1983 �43�
1.32�0.540.47 1.1 2 500 Virtue et al. 1990 �32�
1.00�0.23 1.59 5 200 Present measurement0.98�0.15 N/A N/A The world average
aThis is our estimated value for Schaad’s !�2 .
FIG. 9. Physical photon asymmetry as a function of the induced pseudoscalar coupling constant. The horizontal lines indicate ourexperimentally measured value with its associated errors.
A. POULADDEJ et al. PHYSICAL REVIEW C 68, 0246XX �2003�
0246XX-12
PROOF COPY [CA8907] 031308PRC
PROOF COPY [CA8907] 031308PRC
PROO
F COPY [CA8907] 031308PRC
Finally, the question that one might now ask is, given thecurrent theoretical uncertainties of �� dependency ongP /gA , could the photon asymmetry measurement techniquewith a sufficiently large data sample draw a definitive con-clusion about gP suppression within nuclear matter? To an-swer this question it is necessary to compare the degree ofdiscrepancy in theory compared to our experimental uncer-tainty. From Fig. 10 it is seen that the IA model and MIAmodel predictions differ significantly, and, in fact, for theGoldberger-Trieman gP /gA value, the theoretical uncertaintyfor �� measured as the difference between the IA model andMIA model predictions is comparable to our experimentalerror. In the opinion of the authors, our ability to effectivelyconstrain gP and extract information about its renormaliza-tion within nuclear matter is currently limited by theory.What is now required are further theoretical investigations inorder to resolve the discrepancy between the predictions ofvarious nuclear models for RMC before any further im-proved experimental measurements are warranted.
V. DISCUSSION OF TRENDS IN gP ÕgA
In this section a summary of the gP /gA determinationbased on rate measurement techniques on medium to heavynuclei is presented. For a good recent overview of the differ-ent theoretical as well as experimental aspects related to thedetermination of the induced pseudoscalar coupling constantof the weak interaction the reader is referred to Gorringe andFearing �5�. It is noted that given the current status of RMC’stheoretical and experimental techniques, the error estimatefor gP as determined by the photon asymmetry measurementtechnique is considerably larger than its counterpart obtainedfrom the rate measurements on the same nucleus. The TRI-UMF and the SIN results are both reviewed here.
The Virtue et al.’s �37� model-dependent value for gPbased on the rate measurement for 40Ca utilizing the modelsof Christillin �25� and Gmitro et al. �27� is gP�(6.0� 2.8
2.9 )gA . Other TRIUMF rate measurements have been car-ried out for a number of different nuclei �45–47�. Their es-timated value for 40Ca �45� is gP�(4.6�1.8)gA . The SINgroup have also presented results based on both the photonasymmetry measurement and the partial branching ratio mea-surement. They derive their model-dependent extracted val-ues of gP based on Gmitro et al.’s MIA method �27�. Dobeliet al. �48� reported their results for RMC rate measurementson several nuclei in the range 12�Z�83—their value of gPfor 40Ca is gP�(6.3� 1.0
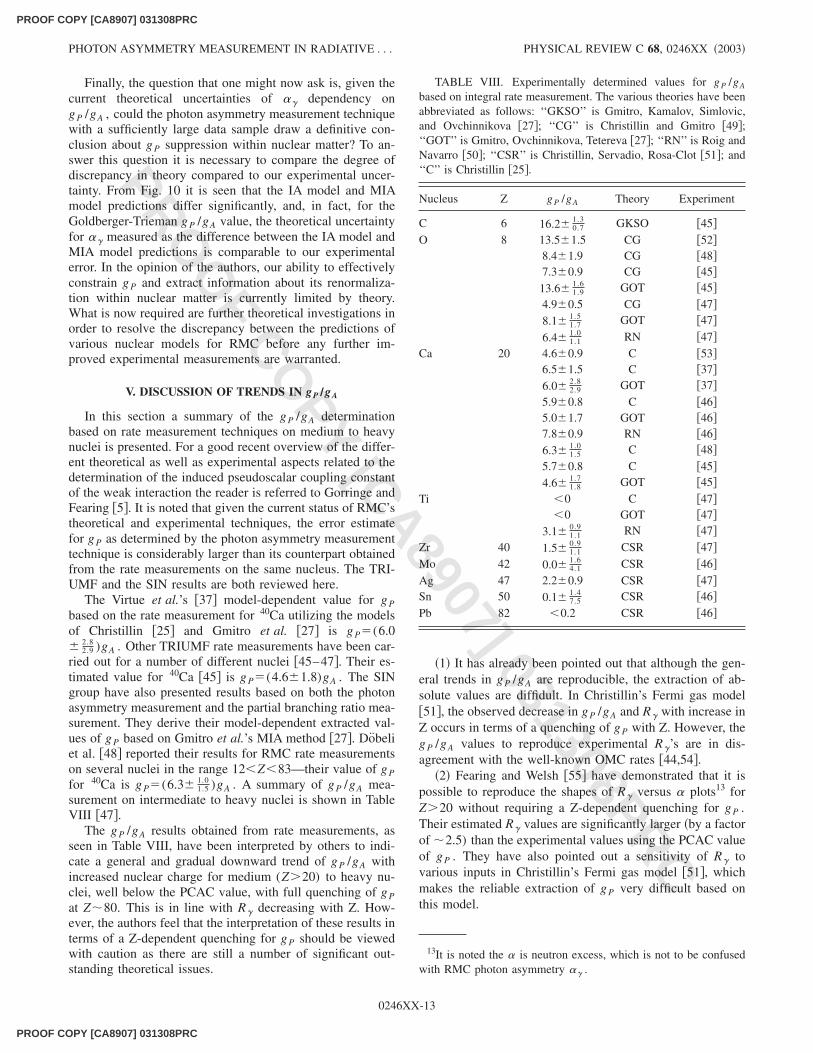
1.5 )gA . A summary of gP /gA mea-surement on intermediate to heavy nuclei is shown in TableVIII �47�.
The gP /gA results obtained from rate measurements, asseen in Table VIII, have been interpreted by others to indi-cate a general and gradual downward trend of gP /gA withincreased nuclear charge for medium (Z�20) to heavy nu-clei, well below the PCAC value, with full quenching of gPat Z�80. This is in line with R� decreasing with Z. How-ever, the authors feel that the interpretation of these results interms of a Z-dependent quenching for gP should be viewedwith caution as there are still a number of significant out-standing theoretical issues.
�1� It has already been pointed out that although the gen-eral trends in gP /gA are reproducible, the extraction of ab-solute values are diffidult. In Christillin’s Fermi gas model�51�, the observed decrease in gP /gA and R� with increase inZ occurs in terms of a quenching of gP with Z. However, thegP /gA values to reproduce experimental R�’s are in dis-agreement with the well-known OMC rates �44,54�.
�2� Fearing and Welsh �55� have demonstrated that it ispossible to reproduce the shapes of R� versus � plots13 forZ�20 without requiring a Z-dependent quenching for gP .Their estimated R� values are significantly larger �by a factorof �2.5) than the experimental values using the PCAC valueof gP . They have also pointed out a sensitivity of R� tovarious inputs in Christillin’s Fermi gas model �51�, whichmakes the reliable extraction of gP very difficult based onthis model.
13It is noted the � is neutron excess, which is not to be confusedwith RMC photon asymmetry �� .
TABLE VIII. Experimentally determined values for gP /gA
based on integral rate measurement. The various theories have beenabbreviated as follows: ‘‘GKSO’’ is Gmitro, Kamalov, Simlovic,and Ovchinnikova �27�; ‘‘CG’’ is Christillin and Gmitro �49�;‘‘GOT’’ is Gmitro, Ovchinnikova, Tetereva �27�; ‘‘RN’’ is Roig andNavarro �50�; ‘‘CSR’’ is Christillin, Servadio, Rosa-Clot �51�; and‘‘C’’ is Christillin �25�.
Nucleus Z gP /gA Theory Experiment
C 6 16.2�1.30.7 GKSO �45�
O 8 13.5�1.5 CG �52�
8.4�1.9 CG �48�
7.3�0.9 CG �45�
13.6�1.61.9 GOT �45�
4.9�0.5 CG �47�
8.1�1.51.7 GOT �47�
6.4�1.01.1 RN �47�
Ca 20 4.6�0.9 C �53�
6.5�1.5 C �37�
6.0�2.82.9 GOT �37�
5.9�0.8 C �46�
5.0�1.7 GOT �46�
7.8�0.9 RN �46�
6.3�1.01.5 C �48�
5.7�0.8 C �45�
4.6�1.71.8 GOT �45�
Ti �0 C �47�
�0 GOT �47�
3.1�0.91.1 RN �47�
Zr 40 1.5�0.91.1 CSR �47�
Mo 42 0.0�1.64.1 CSR �46�
Ag 47 2.2�0.9 CSR �47�
Sn 50 0.1�1.47.5 CSR �46�
Pb 82 �0.2 CSR �46�
PHOTON ASYMMETRY MEASUREMENT IN RADIATIVE . . . PHYSICAL REVIEW C 68, 0246XX �2003�
0246XX-13
PROOF COPY [CA8907] 031308PRC
PROOF COPY [CA8907] 031308PRC
PROO
F COPY [CA8907] 031308PRC
Hence the theoretical model-dependency is also a verymajor issue with regards to the rate measurement techniquefor extraction and interpretation of an absolute value for gP .
VI. CONCLUSIONS AND FUTURE PROSPECTS FOR THESTUDY OF THE INDUCED PSEUDOSCALAR
COUPLING CONSTANT
This paper has reported a TRIUMF measurement of theenergy-averaged photon asymmetry in radiative muon cap-ture on 40Ca. Our measured value for this energy-averagedasymmetry utilizing our data sample size of 5200 candidateevents is ���1.00�0.23. The extracted values for theinduced-pseudoscalar coupling constant gP based on thismeasurement are gP /gA�8.0 for the IA model, and gP /gA�14.5 in terms of the MIA model. The two extractedvalues—although both consistent with the Goldberger-Treiman value of gP /gA�7—are considerably different, in-dicating a significant theoretical model dependency.
Over the past three decades a very substantial effort hasbeen invested both theoretically and experimentally in theOMC- and RMC-related techniques to gain further insightinto the nature of nuclear matter by extracting and constrain-ing the pseudoscalar coupling constant of the weak interac-tions, gP . Although major advances have been made boththeoretically and experimentally, many outstanding issues re-main. One of the more surprising ones is that the value of gPas determined from the RMC hydrogen data �18,19� is �1.5times larger than the PCAC prediction, while the value of gPdeduced from the OMC hydrogen data �17� is in good agree-ment with the PCAC prediction. Furthermore, this discrep-
ancy cannot be explained by the higher order perturbationcorrections within the context of the HBChPT �21�. The situ-ation with regards to heavier nuclei is much more compli-cated due to additional nuclear interactions. The traditionalmodels of Christillin �25�, and Gmitro et al. �26� differ sig-nificantly from the more recent MIA �27� prediction, makingthe extraction and interpretation of gP in terms of the photonasymmetry measurements very difficult. The rate measure-ments on medium to heavy nuclei have indicated a generaland gradual decrease in the value of gP /gA with increasednuclear charge, well below the PCAC value. The interpreta-tion of this observation in terms of Z-dependent quenchingof gP has been put inot question—Fearing and Welsh �55�have demonstrated that it is possible to reproduce the shapesof R� versus � plots—where � is neutron excess—for Z�20 without requiring a Z-dependent quenching for gP .There is clearly a need for further theoretical investigationsto resolve these major outstanding issues.
ACKNOWLEDGMENTS
The authors would like to thank and acknowledge thecumulative efforts invested by a number of people over theyears in the RMC photon asymmetry measurement oncalcium-40 experiments at TRIUMF �E47 and E364�, nota-bly, K. A. Aniol, F. E. Entezami, R. A. Burnham, and H. W.Roser. We also gratefully acknowledge the excellent experi-mental and programming facilities provided by TRIUMF.The research result reported here was supported in part bythe Natural Sciences and Research Council of Canada�NSERC�.
�1� M. Gell-Mann, Phys. Rev. 125, 1067 �1962�.�2� N. Cabbibo, Phys. Rev. Lett. 10, 531 �1963�.�3� K. Hagiwara et al., Phys. Rev. D 66, � �2002�.�4� M.D. Goldberger and S.B. Treiman, Phys. Rev. 111, 354
�1958�; S.L. Adler and Y. Dothan, ibid. 151, 1267 �1966�.�5� T. Gorringe and H. W. Fearing, Triumf Report TRI-PP-02-08,
2002.�6� W. Weise, Nucl. Phys. A396, 373 �1983�.�7� M. Gell-Mann, Phys. Rev. 111, 362 �1958�.�8� M. Morita, Hyperfine Interact. 21, 143 �1985�.�9� B.R. Holstein, Phys. Rev. C 29, 623 �1984�.
�10� L.A. Ahrens et al., Phys. Lett. B 202, 284 �1988�.�11� V. Bernard et al., Phys. Rev. Lett. 69, 1877 �1992�.�12� S. Choi et al., Phys. Rev. Lett. 71, 3927 �1993�.�13� E. Jenkins and A.V. Manohar, Phys. Lett. B 255, 558 �1991�.�14� V. Bernard et al., Nucl. Phys. B388, 315 �1992�.�15� V. Bernard et al., Phys. Rev. D 50, 6899 �1994�.�16� H.W. Fearing et al., Phys. Rev. D 56, 1783 �1997�.�17� G. Bardin et al., Phys. Lett. B 104, 320 �1981�; Nucl. Phys.
A352, 365 �1981�.�18� G. Jonkmans et al., Phys. Rev. Lett. 77, 4512 �1996�.�19� D.H. Wright et al., Phys. Rev. C 57, 373 �1998�.�20� A. Ando and D.-P. Min, Phys. Lett. B 417, 177 �1998�.�21� S. Ando et al., Phys. Rev. C 65, 15 502 �2002�.
�22� J.A. Wheeler, Rev. Mod. Phys. 21, 133 �1949�.�23� L. Klieb, Ph.D. thesis, Groningen, 1982.�24� L. Klieb and H.P.C. Rood, Phys. Rev. C 29, 223 �1984�.�25� P. Christillin, Nucl. Phys. A362, 391 �1981�.�26� M. Gmitro, S.S. Kamalov, T.V. Moskalenko, and R.A. Er-
amzhyan, Czech. J. Phys., Sect. B 31, 499 �1981�.�27� M. Gmitro, A.A. Ovchinnikova, and T.V. Tetereva, Nucl. Phys.
A453, 685 �1986�; M. Gmitro, S.S. Kamalov, and A.A.Ovchinnikova, ibid. A468, 404 �1987�; M. Gmitro, S.S. Ka-malov, F. Simlovic, and A.A. Ovchinnikova, ibid. A507, 707�1990�.
�28� H.P.C. Rood and H.A. Tolhoek, Nucl. Phys. 70, 658 �1965�.�29� H.P.C. Rood, A.F. Yano, and F.B. Yano, Nucl. Phys. A228, 333
�1974�.�30� R.S. Sloboda and H.W. Fearing, Nucl. Phys. A340, 342
�1980�.�31� J. H. Brewer, K. M. Crowe, F. N. Gygax, and A. Schenck,
Muon Physics �Academic press, New York, 1977�, Vol. III.�32� C.J. Virtue et al., Nucl. Phys. A517, 509 �1990�.�33� A. Schenck, Nuclear and Particle Physics Intermediate Ener-
gies �Plenum Press, New York, 1976�, p. 159.�34� V.L. Highland, M. Salomon, M.D. Hasinoff, E. Mazzucato,
D.F. Measday, J.-M. Poutissou, and T. Suzuki, Nucl. Phys.A365, 333 �1981�.
A. POULADDEJ et al. PHYSICAL REVIEW C 68, 0246XX �2003�
0246XX-14
PROOF COPY [CA8907] 031308PRC
PROOF COPY [CA8907] 031308PRC
PROO
F COPY [CA8907] 031308PRC
�35� L. DiLella, I. Hammerman, and L.M. Rosenstein, Phys. Rev.Lett. 27, 830 �1971�.
�36� F. James and M. Ross, Comput. Phys. Commun. 10, 343�1975�.
�37� C. J. Virtue, Ph.D. thesis, University of British Columbia,1987.
�38� A. Pouladdej, M. Sc. thesis, University of British Columbia,1987.
�39� R. L. Ford and W. R. Nelson, The EGS Code System: Com-puter Programs for the Monte Carlo Simulation of Electro-magnetic Cascade Showers (Version 3) (� ,� ,1978).
�40� R.D. Hart, C.R. Cox, G.W. Dodson, M. Eckhause, J.R. Kane,M.S. Pandey, A.M. Rushton, R.T. Siegel, and R.E. Welsh,Phys. Rev. Lett. 39, 399 �1977�.
�41� A. Frischknecht, P. Spierenburg, and W. Stehling, Helv. Phys.Acta 53, 647 �1980�.
�42� M. Dobeli et al., Czech. J. Phys., Sect. B 36, 386 �1986�.�43� M. Schaad, Ph.D. thesis, University of Zurich, 1983.�44� T. Suzuki, D.F. Measday, and J.P. Roalsvig, Phys. Rev. C 35,
2212 �1987�.�45� D.S. Armstrong et al., Phys. Rev. C 43, 1425 �1991�.�46� D.S. Armstrong et al., Phys. Rev. C 46, 1094 �1992�.�47� P.C. Bergbusch et al., Phys. Rev. C 59, 2853 �1999�.�48� M. Dobeli et al., Phys. Rev. C 37, 1633 �1988�.�49� P. Christillin and M. Gmitro, Phys. Lett. 150B, 50 �1985�.�50� F. Roig and J. Navarro, Phys. Lett. B 236, 393 �1990�.�51� P. Christillin, S. Servadio, and M. Rosa-Clot, Nucl. Phys.
A345, 331 �1980�.�52� A. Frischknecht et al., Phys. Rev. C 38, 1996 �1988�.�53� A. Frischknecht et al., Phys. Rev. C 32, 1506 �1985�.�54� R. D. Hart, Ph.D. thesis, College of William and Mary, 1977.�55� H.W. Fearing and M.S. Welsh, Phys. Rev. C 46, 2077 �1992�.
PHOTON ASYMMETRY MEASUREMENT IN RADIATIVE . . . PHYSICAL REVIEW C 68, 0246XX �2003�
0246XX-15
PROOF COPY [CA8907] 031308PRC


