Embed Size (px)
Citation preview

Journal of Archaeological Science: Reports 6 (2016) 1–13
Contents lists available at ScienceDirect
Journal of Archaeological Science: Reports
j ourna l homepage: www.e lsev ie r .com/ locate / jas rep
Strontium isoscapes in The Netherlands. Spatial variations in 87Sr/86Sr asa proxy for palaeomobility
Lisette M. Kootker a,b,⁎, Rowin J. van Lanen c,d, Henk Kars b, Gareth R. Davies a
a Geology & Geochemistry Cluster, Vrije Universiteit Amsterdam, De Boelelaan 1085, 1081 HV Amsterdam, The Netherlandsb CLUE+, Vrije Universiteit Amsterdam, De Boelelaan 1085, 1081 HV Amsterdam, The Netherlandsc Cultural Heritage Agency, Smallepad 5, 3811 MG, Amersfoort, The Netherlandsd Faculty of Geosciences, Utrecht University, Heidelberglaan 2, 3584 CS Utrecht, The Netherlands
⁎ Corresponding author at: Geology & GeochemisAmsterdam, De Boelelaan 1085, 1081 HV Amsterdam, Th
E-mail address: [email protected] (L.M. Kootker).
http://dx.doi.org/10.1016/j.jasrep.2016.01.0152352-409X/© 2016 Elsevier Ltd. All rights reserved.
a b s t r a c t
a r t i c l e i n f oArticle history:Received 14 November 2015Received in revised form 11 January 2016Accepted 13 January 2016Available online xxxx
Strontium isotope analysis has been successfully applied to archaeological questions of residential mobility and an-imal husbandry for over three decades. To obtain a full understanding of variations in archaeological samples, spatialvariations in bioavailable strontium should be accurately mapped or inferred. This paper presents the first archaeo-logical bioavailable strontiummap of TheNetherlands. Themap is compiled solely from archaeological enamel sam-ples of rodents and selected mammals as they are considered to provide the best proxy of bioavailable Sr. Thediversity of the Dutch geological subsurface is directly reflected in the spatial distribution of 87Sr/86Sr ratios. Sixisoscapes are defined: A) Lower terrace of the river Meuse (0.7074–0.7091, n=2); B) Marine and river Rhine sed-iments (0.7088–0.7092; n=85); C) Holland peat area, Kempen and northern sand areas (0.7091–0.7095, n=14);D) Rur Graben (0.7095–0.7105, n=11); E) Push moraines (0.7095–0.7110, n= 7) and F) Northern and southernloess areas (0.7104–0.7113, n = 15). Although individual isoscapes may show some overlap, the mean of eachisoscape is statistically significant different, except for zones D and E. Five other geological environments yieldedno archaeological data,mainly due to poor preservation in acidic soils. Tofill this data gap, additional biosphere sam-ples will be collected and analysed. This approach, however, will require validation of the extent to which specificfloral are offset compared to the average archaeological bioavailable strontium. The base map presented herenow allows such a detailed assessment of potential offsets in the 87Sr/86Sr recorded by different proxies at theregional scale.
© 2016 Elsevier Ltd. All rights reserved.
Keywords:Strontium isotopeBioavailable strontiumIsoscapesMobilityArchaeologyThe Netherlands
1. Introduction
Archaeological migration models used to be based on the spatial dis-persal of cultural artefacts. This approach, however, has led to a lively de-bate about whether the archaeological cultural record represents theactual movement of people or the broader diffusion of cultural heritagein the form of ideas, materials and objects (Childe, 1925; Burmeister,2000; Hakenbeck, 2008). Over the last three decades, advances in severalbioarchaeological disciplines, such as DNA and isotope research, have of-fered new perspectives on this debate. Stable isotopes, such as carbon(C) and nitrogen (N), are used to address very diverse archaeologicalquestions. Originally introduced by Van der Merwe and Vogel (1977),both isotopes are now established as invaluable tools for the reconstruc-tion of palaeodiet, the determination of patterns of breastfeeding andweaning age, and the investigation of animal husbandry (e.g. Richardset al., 2002; Mays and Beavan, 2012; Hammond and O'Connor, 2013).
try Cluster, Vrije Universiteite Netherlands.
Moreover, the use of the radiogenic strontium isotope system(87Sr/86Sr) in bioarchaeological research has matured into an establishedtool for providing information about human and animal residentialmobility and husbandry practices in prehistory (see Bentley, 2006;Schwarcz et al., 2010; Slovak and Paytan, 2011 for review).
Strontium isotope ratios serve as a proxy of palaeomobility due tothe geographical variation in 87Sr produced by the β-decay of 87Rb asa result of the spatial variations in the initial amount of 87Rb in the geo-logical bedrock and the age of the lithology. Strontium isotope ratios(87Sr/86Sr) are released to the environment through the weathering ofrocks (Capo et al., 1998). Strontium isotope ratios in soil substrates,however, can deviate significantly from the biologically-available Srthat is taken up by vegetation and introduced into our food chain dueto inputs from the atmosphere, such as precipitation and sea-spray,and outputs through stream- and groundwater (Fig. 1; Price et al.,2002; Hedman et al., 2009). Ultimately, the bioavailable strontium isconveyed into the skeletal tissues of human and animals through theirdiet where it substitutes for calcium in the structure of hydroxyapatitein bone, dentine, enamel, keratin, ivory and shell. Tooth enamel isformed during childhood and barely undergoes any change aftermineralisation and during burial (Nelson et al., 1986; Budd et al.,

Fig. 1. Schematic diagram showing the basic principle of strontium isotope analysis of archaeological skeletal material. Key: - - - - 87Sr/86Sr dependent on differential weathering ordifferential uptake; ····· biomaterials susceptible to diagenetic alterations.Modified from Tütken et al. (2008).
2 L.M. Kootker et al. / Journal of Archaeological Science: Reports 6 (2016) 1–13
2000; Hoppe et al., 2003). Hence, the 87Sr/86Sr ratio in tooth enamel re-flects the strontium intake during childhood, and thus can serve as atracer of the geological area where the individual grew up, assumingthat his or her diet was dominated by locally grown foods (Hillson,1986; Price et al., 2002; Pye, 2004).
The main principle of this provenance technique is to compare theisotopic signatures from an individual to the local bioavailable stron-tium. Differences between the 87Sr/86Sr of an individual's dental enameland the local bioavailable strontium range indicate the individual didnot live in the region during their youth and has migrated from an iso-topically different geographical location (Fig. 1). In contrast, similaritiesbetween the local biosphere strontium signal and the individual's bio-genic signal indicate residential stability or residentialmobility betweentwo geographic locations with similar isotopic signatures.
A prerequisite for the interpretation of strontium isotope signaturesin archaeological organic materials is the accurate mapping of the spa-tial variations in bioavailable 87Sr/86Sr ratios within the study area, orthe development of accurate so-called isoscapes (Bowen, 2010). InEurope, 87Sr/86Sr reference maps have been published for the United
Kingdom (Evans et al., 2009, 2010), Denmark (Frei and Frei, 2011; Freiand Price, 2012), Sweden (Sjögren et al., 2009), France (Willmes et al.,2014), Greece (Nafplioti, 2011) and southwest Germany (Bentleyet al., 2004; Bentley and Knipper, 2005). To date, however, there is nobaseline information for bioavailable 87Sr/86Sr in The Netherlands. Theaim of this paper is to present a first archaeological 87Sr/86Sr spatial dis-tributionmap. This study approach allows us to evaluate the spatial var-iation in bioavailable 87Sr/86Sr in The Netherlands and to assessmigration in an archaeological context. Moreover, the data presentedhere contributes significantly to our understanding of the Europeanstrontium isoscapes, and ultimately allows a more accurate investiga-tion of ancient intra-European mobility.
2. Building Sr isotope reference datasets
A large variety ofmethods are used to investigate regional variabilityin 87Sr/86Sr ratios (Hodell et al., 2004; Evans et al., 2010; Viner et al.,2010; Maurer et al., 2012). Since the 87Sr/86Sr ratio is directly relatedto the initial amount of 87Rb in rocks and the age of the lithology, direct

3L.M. Kootker et al. / Journal of Archaeological Science: Reports 6 (2016) 1–13
strontium isotope measurements of regional biosphere material, suchas soil leachates, water and vegetation,may appear to be a fast and sim-ple way to create reference databases (Capo et al., 1998; Beard andJohnson, 2000; Faure and Mensing, 2005; Evans et al., 2010;Voerkelius et al., 2010). However, the release of 87Sr/86Sr from geologi-cal bedrock into soils through weathering is climate controlled. Chemi-cal weathering (Nprecipitation), for instance, acts as a catalyst in theremoval of the radiogenic strontium fraction from the environmentdue to the preferential breakdown of rubidium-rich minerals, resultingin relatively low radiogenic soils compared to the source rock (see Junget al., 2004 for references). A similar, but opposing, process occurs in acontrolled laboratory environment, where soil leachates are extracted;these leachates will be biased towards higher radiogenic strontiumvalues, as this fraction is preferentially released compared to the non-radiogenic fraction (e.g. Bagard et al., 2013). Moreover, variations insoil mineral contents due to pedological processes may result in largevariability in 87Sr/86Sr ratios between subsamples (Borg and Banner,1996; Price et al., 2002; Jung et al., 2004; Bentley, 2006; Evans et al.,2009). These factors, together with the input of strontium from non-geological sources, the use of modern fertilizers, negate the assumptionthat bedrock 87Sr/86Sr values are directly related to the 87Sr/86Sr valuesthat enter the environmental cycle (Capo et al., 1998; Price et al., 2002).
A second, perhaps more reliable approach is to use vegetation sam-ples to map the spatial variations in strontium isotope compositions.Strontium passes from the geological bedrock to soil in solution andcan be readily absorbed into vegetation and thus enter the food chain(Miller et al., 1993; Capo et al., 1998; Price et al., 2002; Bentley, 2006).The uptake of strontium by vegetation is, however, dependent amongother factors on climate, fungi, root-depth and taxon (Isermann, 1981;Dijkstra et al., 2003). Vegetation samples thereforemayprovide a biasedsignal, unless a vast quantity of different species of vegetation is collect-ed. Moreover, the 87Sr/86Sr ratio of plants may reflect modern soil con-ditions that are likely to be altered by various soilmodificationmethods,such as use of (synthesized) fertilizer and ploughing, rather than beingtypical of archaeological soil conditions (Evans et al., 2009; Viner et al.,2010; Maurer et al., 2012).
A third approach to defining regional isotopic isoscapes is to collectteeth of archaeological animal remains, preferably small rodents and/or mammals that forage in a restricted area and consumed a similardiet to humans. Similar to vegetation, animal skeletal tissue displays ho-mogeneity in 87Sr/86Sr ratios, averaging local variations (Price et al.,2002). Although the selection of species to for use as an isotopic proxydepends on local conditions, it is vital to avoid larger animals. Recentstable isotope and DNA studies have shown that long-distance acquisi-tion and exchange of medium and large domestic mammals has takenplace from early prehistory onwards (Schweissing and Grupe, 2003;Bentley and Knipper, 2005; Viner et al., 2010; Maurer et al., 2012;Oelze et al., 2012; Van der Jagt et al., 2012; Price, 2013; Colominaset al., 2015). The use of exclusively low-mobility rodents as a proxyfor bioavailable strontium values, may, however, provide 87Sr/86Sr ra-tios restricted to a too local geological area such that they do not repre-sent a ‘local’ human dietary average. Further potential restrictions forthe interpretation of human and animal provenance based on mappinglocal bioavailable strontium ratios come from the food they consumed.The increasing share of imported arable crops in human diet, for in-stance, from prehistory onwards will have an influence on the dietaryintake of strontium (Bakels and Jacomet, 2003; Livarda, 2011). Plantshave relatively high strontium concentrations compared to meat,which has undergone greater biopurification and hence contains lessstrontium (Burton, 2008). At least in Medieval Europe, grains such aswheat and barley dominated the daily diet (Singman, 1999); the possi-ble modification of the local 87Sr/86Sr ratio because of the ingestion ofhigh amounts of non-local strontium through imported vegetationtherefore needs to be taken into account.
A fourth approach uses a GIS-based model to that estimates the87Sr/86Sr of bioavailable strontium as a function of strontium inputs
from a variety of sources (Bataille and Bowen, 2012; Bataille et al.,2012). Although this method requires no samples, and therefore mayappear to be a cost-effective technique, their multi-source mapping ap-proach preferable requires validation through the ‘conventional’ analy-sis of biosphere or archaeological samples.
A fifth and final method to determine the local strontium range wasinitially proposed by Wright (2005). She used a statistical approach toidentify local individuals and to determine the local strontium range,based on the assumption that 87Sr/86Sr ratios of a local population re-cord a normal (Gaussian) distribution. By excluding statistical outliers,the local strontium range can be established.
In summary, the effect of sample selection on the definition of thelocal bioavailable strontium signatures should not be underestimated.In particular the paper byMaurer et al. (2012) stresses that the determi-nation of the bioavailable strontium values that entered the local ar-chaeological food chain is challenging, as it remains unclear whichenvironmental resources are most appropriate. Their study emphasizesthat careful selection of the bioavailable samples is of key importance toenable a reliable and accurate determination of local 87Sr/86Sr ratios.Socio-economic differences within ancient (Medieval) populations, forinstance, might have led to a diverse origin of the food resources be-tween the wealthy and the poor; the former might have had access tomore exotic food resources, resulting in the consumption food with dif-ferent isotopic ratios (Grumbkow et al., 2013. See also Price et al. (2006)for an example of a different archaeological time period). As a result,assumed ‘non-local 87Sr/86Sr ratios’ do not necessarily point towardsnon-local origins, but to differences in origin of diet. Therefore, themost conservative approach to determine the 87Sr/86Sr ratios that en-tered the local food chain is to combine the statistical assessment ofthe investigated population with archaeological and (modern)biosphere samples, although in the latter case an assessment is neededof potential anthropogenic influences from the use of fertilizers and re-gional pollution. In The Netherlands, however, an in-depth study to in-vestigate the possible offset between the various proxies used instrontium isotope studies has not yet been undertaken.
3. Regional setting
Located in northwest Europe, The Netherlands is bordered by theNorth Sea to the north and west, Belgium to the south and Germanyto the east. The majority of the landscape was formed by the estuaryof three major river systems: Rhine, Meuse and Scheldt. The countryconsists of lower flat-lying areas with Holocene deposits (Stouthamerand Berendsen, 2000, 2007; Vos, 2015) and relatively higher, stablePleistocene areas (Koomen and Excaltus, 2003; Vos et al., 2011; Vosand De Vries, 2013; Vos, 2015). Most of the sediments covering TheNetherlands have been deposited during the Quaternary period(2.6 MA–present) and consist of fluviatile, marine and glacigenicsediments, and local terrestrial deposits such as loess (aeolian) andpeat (De Mulder et al., 2003; Weerts et al., 2003; Van der Veer, 2006).The generally low-lying character of the country has led to the develop-ment of large-scale mires and bogs throughout the Holocene, especiallyafter ca. 7000–6000 BC (Petzelberger et al., 1999). From the Iron Age(800–12 BC) onwards, humans had a significant effect on the landscape(Lascaris and De Kraker, 2013). Rapid deforestation, agricultural activi-ties and later large-scale dike building extensively changed the land-scape. During the Roman and Medieval periods, large parts of TheNetherlands were still covered by peat; this situation remained un-changed until the start of the large-scale reclamation activities in the10th–12th century in the west (De Bont, 2008) and 16th century inthe eastern of the country (Borger, 1992; Gerding, 1995). Today, over70% of the total land surface in The Netherlands has been cultivated(Zwart et al., 2008; CBS, 2009). Less than 15% of the Dutch surface isdesignated as nature reserve, production woods or recreation park(CBS, 2009).
4 L.M. Kootker et al. / Journal of Archaeological Science: Reports 6 (2016) 1–13
4. Material
4.1. Sample selection
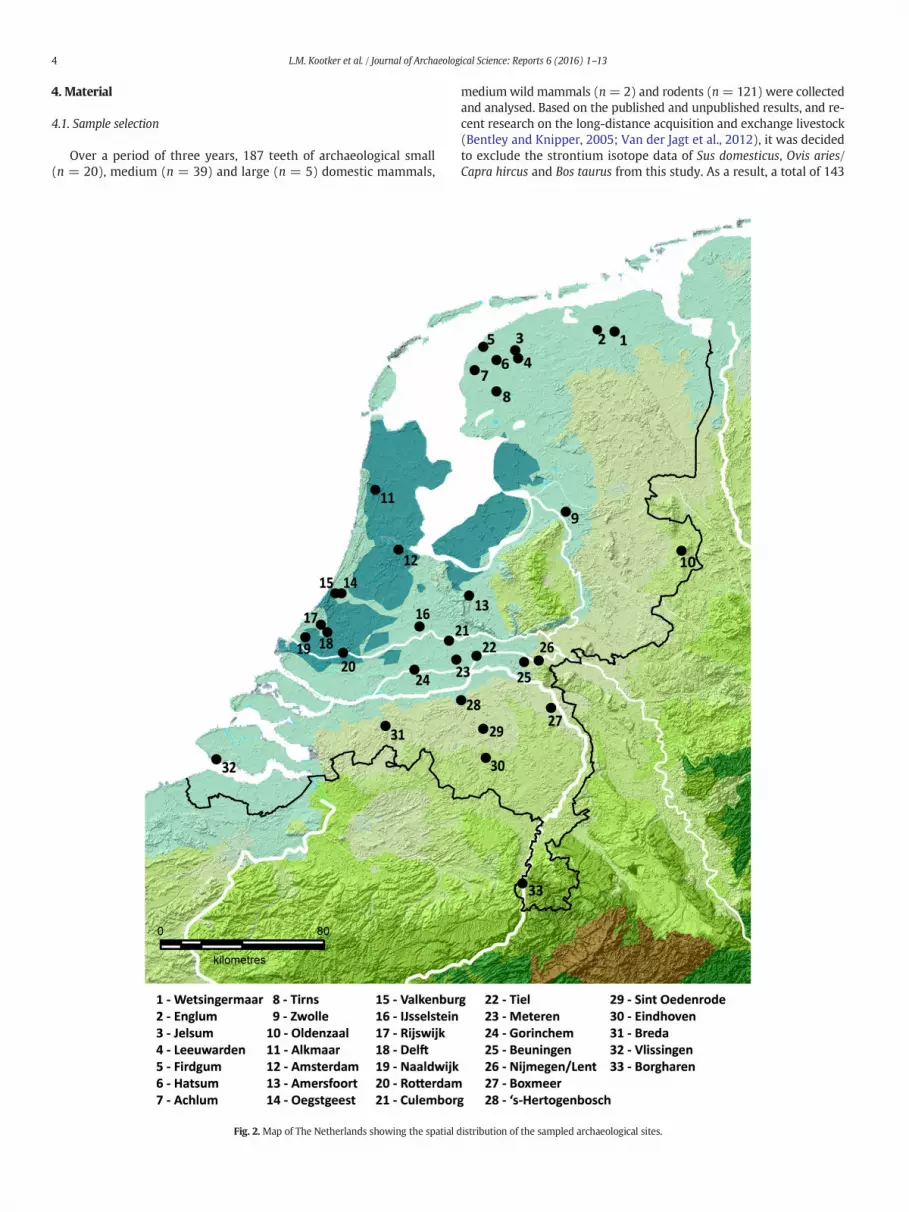
Over a period of three years, 187 teeth of archaeological small(n = 20), medium (n = 39) and large (n = 5) domestic mammals,
Fig. 2. Map of The Netherlands showing the spatial d
mediumwild mammals (n= 2) and rodents (n= 121) were collectedand analysed. Based on the published and unpublished results, and re-cent research on the long-distance acquisition and exchange livestock(Bentley and Knipper, 2005; Van der Jagt et al., 2012), it was decidedto exclude the strontium isotope data of Sus domesticus, Ovis aries/Capra hircus and Bos taurus from this study. As a result, a total of 143
istribution of the sampled archaeological sites.

5L.M. Kootker et al. / Journal of Archaeological Science: Reports 6 (2016) 1–13
incisors andmolars of archaeological rodents, small domestic mammalsand medium sized wild mammals from 38 sites throughout TheNetherlands are presented (Fig. 2). The vast majority of the rodentsamples are assigned to true mice and rats (Muroidea) and voles(Microtus sp.): species with restricted extents of movement of on aver-age less than 1.5 km2. If possible, the rodent and domestic mammal re-mains were collected from well-dated Medieval and post-Medievalcesspits. The urban context of the cesspits limits the possibility that in-trusive (modern) rodents were sampled. Cats (Felis catus) and foxes(Vulpes vulpes) are the main contributors of the small and mediummammal samples. In particular fox territories vary in size: the poorerthe habitat, the larger the territory. Recent research, however,established that the territory ofmodern foxes in Southern Limburg usu-ally do not exceed 0.65 km2 (Mulder, 2007). Given the stability of theirhabitat, it is assumed that their territories were similar in size in medi-eval times.
Teeth were sampled from locations that cover nearly all mainarchaeological landscape types of The Netherlands (see Section 4.3),but the coverage is not equally distributed due to for example varyingpreservation conditions (e.g., soil pH), restricted sample availability,differences in economic pressure across the country that lead todifferences in construction related excavations, and varying excavationpolicies between provinces/archaeological regions (see Kootker andDavies (2016). To enable a meaningful comparison between the87Sr/86Sr ratios of the main archaeological landscape types, it wasdecided to base the dataset presented in this study on one type ofproxy. Additional isotopic data are available on parts of the Dutchbiosphere (e.g., McManus et al., 2013) but it is beyond the scope ofthis article to conduct detailed comparisons between different localdata sets in order to increase the spatial coverage of the Sr isotope ratiosin The Netherlands.
4.2. Sampling protocol
The outer surface of the incisors of large rodents (all Rattus sp.,Oryctolagus cuniculus and Lepus europaeus) and molars (other mam-mals) was mechanically cleaned using a diamond-topped dental drill.Approximately 1–3 mg of enamel power was sampled and sealed inpre-cleaned 2 ml polyethylene Eppendorf® centrifuge tubes. The sizeof the incisors of the small rodent species, such as Muroidea andMicrotus sp., was often too small to collect pure enamel. The entire den-tal elements were therefore cleaned and bulk sampled (enamel anddentine). The presence of the dentine could possibly influence the87Sr/86Sr ratio of the enamel, altering the signal more towards diagenet-ic (“local” and/or modern) values. To limit effects of diagenetic alter-ation, dentine was physically removed from the incisors as much aspossible and samples were leached with 0.1 N acidic acid to removeany labile Sr on/in the dentine and enamel (see Grumbkow et al.,2013). All samples were transferred to the US Federal standard Class100 clean laboratory facility at the Vrije Universiteit Amsterdam for Srpurification.
4.3. Archaeological landscape map of The Netherlands
A geomorphological-dependent approach was used to produce87Sr/86Sr isoscapes. The main geomorphological landscape units werederived from the Archaeological Landscape Map of The Netherlands,which represents the most detailed geomorphological map of TheNetherlands to date (RCE, 2015). This dataset separates the overarchingmain landscape types from more detailed local landscape zones on a1:50,000 scale. The dataset is primarily based on the Geomorphologicalmap of The Netherlands (Koomen and Excaltus, 2003; Koomen andMaas, 2004), but each individual landscape unit is defined through acombination of geomorphological, archaeological, historical, geologicaland soil data. The map contains references to external datasets, suchas geomorphological and soil maps, the European Landscape Map
classifications (LANMAP2), and defines the natural boundary conditionsfor (current) anthropogenic use.
5. Analytical methods
5.1. Strontium isotope analysis
A detailed description of the column extraction and the sampleloading procedures is given in (Grumbkow et al., 2013). The strontiumisotope compositions were measured on a MAT-Finnigan 262multicollector mass spectrometer and on a ThermoFinnigan Triton atthe Vrije Universiteit Amsterdam. The ratios were determined using astatic routine and were corrected for mass-fractionation correction.Over the course of the research, measurements of NBS987 gave mean87Sr/86Sr values for the MAT262 and Triton of 0.710240 ± 0.000009(2SE, n = 41) and 0.710249 ± 0.000009 (2SE, n = 4) respectively. Theindividual measurements were normalized to 0.710240 using the valueof NBS987 measured in the same sample turret. The procedural blankscontained an average of b0.06 ng strontium (n = 27), a negligibleamount compared to the average amount of strontiumpresent in enamelsamples (50–500 ng/mg;Kohn et al., 1999).
5.2. Spatial analysis
Geographical Information System (GIS) was used to create spatialoverviews of sample locations and isoscapes in The Netherlands. Foreach sample location coordinates were extracted and converted to theAmersfoort/RD new — EPSG:28992 coordinate system and overlaid ona current relief map of The Netherlands. The main landscape type wasdetermined for each sample location using the Archaeological Land-scapeMapof TheNetherlands.Main landscape types that share a similarorigin and parent material type were grouped into one isoscape. Siteslocated near the boundary of two main landscape types were individu-ally analysed to determine the most dominant landscape type.
5.3. Statistical analysis
The distribution of 87Sr/86Sr datasets were analysed using SPSS 22.0(IBMSPSS Statistics forMacintosh, Armonk, IBMCorp.). Statistical outlierswere removed from the dataset using Extreme Value Analysis (EVA).Firstly, the distribution of the variables per isoscapewas checked to iden-tify values that deviate from a normal distribution. In addition, valueswere classified as (extreme outliers) if X b Q1 – 3 ∗ interquartile range(IQR) or X N Q3+ 3 ∗ IQR. Using both methods, identified statistical out-liers were removed, resulting in trimmed 87Sr/86Sr datasets. Following(Price et al., 2002), the local 87Sr/86Sr range per main landscape typewas obtained by calculating the mean 87Sr/86Sr ratios of the (trimmed)dataset ± two standard deviations (2σ).
6. Results
All strontium isotope results are shown in a relative probability dia-gram (Fig. 3). The figure shows a positive skewed distribution of thedata,with amedian of approximately 0.7091. Following themethodologydescribed in Section 5.2, each sample was assigned to a main landscapetype. Landscape types where no samples have been collected wereassigned to lithological and geogenetic similar landscape types (conformEvans et al., 2010, see Appendix A). This approach resulted in six differentlandscape groups (or isoscapes), identified by the letters A to F,representing 22 main landscape types (Appendix A). The unique originand/or parentmaterials source of five landscape types precluded the pos-sibility to infer the Sr isotope composition from other landscape typesand therefore these areas remain with no data coverage (isoscape X).The 87Sr/86Sr data per landscape group is listed in Appendix B.
The 87Sr/86Sr ratios of each isoscape are assessed by the Shapiro–Wilk's normality test. The data of isoscapes B and C are not normally

Fig. 3. A relative probability diagram of the obtained 87Sr/86Sr values (n=143). The curveand histogramare constructed allocating an arbitrary error to eachdata point set at 0.0001to account for intra-sample variation.
Fig. 4. Tukey's schematic boxplot showing 87Sr/86Sr variation per isoscape in TheNetherlands. Key: the boxes represent the interquartile range (IQR: Q3–Q1), the centralline indicates themedian. Thewhiskers represent Q1− 1.5 IQR andQ3+ 1.5 IQR. The cir-cle represents an extreme outlier (N3 IQR). A) Lower terrace of the riverMeuse; B)Marineand river Rhine sediments; C) Holland peat area, Kempen and northern sand area; D) RurGraben; E) Push moraines and F) Northern and southern loess areas.
6 L.M. Kootker et al. / Journal of Archaeological Science: Reports 6 (2016) 1–13
distributed (p b .01), but become so after removal of the most extremevalues (p N .01, Table 1. N = 6 in isoscape B, n = 2 in isoscape C). Thesample size of isoscape A (n=2) is too small to allow statistical assess-ment. Tukey's schematic boxplot in Fig. 4 displays the intra- and inter-isoscape variations in 87Sr/86Sr. Despite the apparent normal distribu-tion of 87Sr/86Sr data of isoscape D, one datum is flagged as an extremeoutlier as the value deviates more than three times the interquartilerange (IQR) from the median, and was therefore removed from datasetD.
An independent-sample t-test was run to determine if there weresignificant differences in mean 87Sr/86Sr ratios between the differentisoscapes. Levene's test for equality of variances showed no homogene-ity of variance in the data, except for isoscapes B–C, D–E, D–F and E–F(Table 2). Despite most isoscapes show an overlap in the range of87Sr/86Sr, the mean value of each isoscape is statistically different(p = b.05), except for isoscapes D (Rur Graben) and E (Push moraines,p = .214), indicating substantial differences in the spatial variation of87Sr/86Sr ratios in The Netherlands.
Based on the Archaeological LandscapeMap of The Netherlands, theselected sampling strategy, and the statistical considerations, the firstspatial distribution of bioavailable 87Sr/86Sr within The Netherlands ispresented in Fig. 5.
7. Discussion
Although The Netherlands is geologically homogeneous relative tothe entire variations of continental Europe, being predominantly madeup from Holocene (45%) and Pleistocene (50%) deposits, there is a sig-nificant spatial patterning in 87Sr/86Sr ratios that records the inter-and intra-lithological variations. Based on the data presented above,
Table 1Statistical assessment of 87Sr/86Sr data from archaeological animal remains, for the complete a
Statistics A B Trimmed B C
N 2 91 85 16Mean 87Sr/86Sr 0.70826 0.70901 0.70903 0.71088Standard deviation (1σ) 0.00043 0.00032 0.00010 0.00618Variance 1.87E−07 1.05E−07 9.28E−09 3.80E−0Minimum 0.70795 0.70617 0.70882 0.70910Maximum 0.70857 0.70941 0.70926 0.73405Range 0.00062 0.00324 0.00044 0.02495Median 0.70826 0.70904 0.70903 0.70932Shapiro–Wilk p value – 0.000 0.872 0.000
Key: A) Lower terrace of the river Meuse; B)Marine and river Rhine sediments; C) Holland peaand southern loess areas.
six isoscapes have been defined, each characterized by a distinct rangein 87Sr/86Sr ratios.
7.1. Isoscape A: Lower terrace of the river Meuse (0.7074–0.7091, n = 2)
Isoscape A is based on twomeasurements and is therefore only con-sidered as indicative of river Meuse sediments and the data cannot beused to infer minimum andmaximum values. The sediments depositedby the river Meuse system belong to the Beegden Formation, whichgenerally consists of course sands to heavy clays that locally can be cal-careous (DeMulder et al., 2003; Van der Veer, 2006). Although the top-soil near the sampling location appears to be predominantly non-calcareous (www.bodemdata.nl), the 87Sr/86Sr ratios indicate that onerodent's diet included unradiogenic Sr, possibly derived from acalcareous-rich region. The 87Sr/86Sr signature of Meusewater averagesaround 0.7094 (Petelet-Giraud et al., 2009). Obviously, more data areneeded to delineate this isoscape more accurately.
7.2. Isoscape B: Marine and river Rhine sediments (0.7088–0.7092; n = 85)
The range in 87Sr/86Sr ratios of the Holocene soil parent regions inisoscape B is consistent with the expected range of modern seawater(0.70917) and river Rhine water (0.7084–0.7091: Burke et al., 1982;Palmer and Edmond, 1989; Veizer, 1989; Buhl et al., 1991). Hence,87Sr/86Sr ratios between 0.7088 and 0.7092 are representative of over45% of the surface of The Netherlands.
7.3. Isoscape C: Holland peat area, Kempen and northern sand areas(0.7091–0.7095, n = 14)
A mix of sediments characterizes isoscape C. The Pleistocene north-ern sanddeposits belong to theBoxtel Formation and are of local aeolian
nd trimmed datasets per isoscape.
Trimmed C D Trimmed D E F
14 12 11 7 150.70930 0.70996 0.71004 0.71023 0.710840.00011 0.00035 0.00025 0.00039 0.00020
5 1.11E−08 1.27E−07 6.26E−08 1.51E−07 4.08E−080.70910 0.70912 0.70970 0.70985 0.710540.70945 0.71052 0.71052 0.71092 0.711170.00035 0.00140 0.00082 0.00107 0.000630.70931 0.70994 0.70998 0.71016 0.710810.622 0.363 0.469 0.359 0.193
t area, Kempen and northern sand area; D) Rur Graben; E) Push moraines and F) Northern

Table 2Results of the independent sample t-tests comparing mean 87Sr/86Sr ratios between the isoscapes. Isoscape A is excluded from statistical analyses, because of its small sample size.
Isoscape A B C D E F
A – – – – – –
B –0.8590.000280.000
0.0000.001010.000a
0.0000.001210.000a
0.0000.001820.000a
p value Levine's testmean differencet probability independent samples t-test
C –
0.0110.000770.000a
0.0020.000930.000a
0.0010.001540.000a
D –
0.2230.000200.214
0.6910.000810.000
E –
0.0590.000610.000
F –
Key: A) Lower terrace of the river Meuse; B)Marine and river Rhine sediments; C) Holland peat area, Kempen and northern sand area; D) Rur Graben; E) Push moraines and F) Northernand southern loess areas.
a Welch–Satterthwaite correction applied for nonhomogeneity of variance and/or unbalanced design of the datasets.
7L.M. Kootker et al. / Journal of Archaeological Science: Reports 6 (2016) 1–13
origin. In the Kempen region, located in southwest North-Brabant,soils are formed from local aeolian and fluviatile clay and loamysandy deposits that belong to the Stamproy Formation. At the begin-ning of the Holocene, sea level rose, resulting in the formation ofextensive intertidal areas. In the western and northern parts of TheNetherlands, peat developed at the margins of these areas(Nieuwkoop Formation), which are often overlain by marine andfluviatile/estuarine clays of Holocene age (De Mulder et al., 2003;Van der Veer, 2006).
The 87Sr/86Sr ratios of the bioavailable Sr in these districts rangefrom similar to the marine values up to 0.7095. The origin of the un-derlying lithology or the geographical setting of the sample locationsmay explain the relative low 87Sr/86Sr ratios, especially for the Pleis-tocene sand districts. The formation of the southern sand area(Stamproy Formation) is highly influenced by the fluviatile depositsof local rivers draining Pleistocene Meuse sediments from theKempish Massif in Belgium. The sample locations representing thenorthern sand district were collected close to the former Zuider Seacoastline. It can therefore be assumed that the influence of marinederived strontium, such as sea-spray (Fig. 1), might have beensubstantial, lowering 87Sr/86Sr ratios towards marine values. Morecomprehensive data coverage is expected to expand the observedrange in 87Sr/86Sr ratios towards higher values, or even to divideisoscape C into several separate zones.
7.4. Isoscape D: Rur Graben (0.7095–0.7105, n = 11)
The Rur Graben is located directly east of the Kempen sanddistrict that defines isoscape C, but is characterized by moreradiogenic 87Sr/86Sr signatures. The sedimentary sequence inthe Rur Valley Graben differs significantly from its neighbour.The Liempde Member, part of the Boxtel Formation, is alithostratographic unit exclusive to the Rur Valley Graben. ThisMember includes reworked aeolian loess and sandy loess deposits(De Mulder et al., 2003; Schokker et al., 2007). The topsoil of thisisoscape consists predominantly of aeolian sedimentation, withloess deposits occurring in the upper part of the sedimentarysequence (Schokker et al., 2007). Strontium isotope ratios rangefrom 0.7095 up to 0.7105.
7.5. Isoscape E: Push moraines (0.7095–0.7110, n = 7)
The relief formed by the push moraines stands out compared tothe general flat topography of The Netherlands. Formed by the
glaciers during theWeichselian, (the remains of) ice-pushed ridgesare found in the middle and eastern parts of The Netherlands.87Sr/86Sr ratios were determined on seven samples from Oldenzaal,situated in the eastern part of the country near the German border.In contrast to the push moraines in the centre of The Netherlands,the eastern push moraines consist of Tertiary marine clays andglacial deposits (boulder clay) derived from the Scandinavia(Berendsen, 1998; De Mulder et al., 2003; Jongmans et al., 2013).In particular boulder clay is expected to exhibit highly radiogenic87Sr/86Sr ratios due to derivation from Proterozic and Archaeanbasement rocks. In the central parts of The Netherlands, pre-Saalian fluviatile deposits, derived from the pre-Rhine–Meusesystem as well as the Eridanos river system, crop out in the ice-pushed ridges (Berendsen, 1998; Overeem and Kroonenberg,2002; De Mulder et al., 2003; Van der Veer, 2006). Van der Veer(2006) showed that reworked deposits from these “mixed” [fluviatileand glacial] sediments are characterized by elevated contributions ofalkali-feldspars. Alkali feldspars have high levels of rubidium andlow levels of strontium, resulting in elevated 87Sr/86Sr ratios. Thediversity of the sediments characterizing this isoscape resulted ina wide range of 87Sr/86Sr ratios, from 0.7095 to 0.7110.
7.6. Isoscape F: Northern and southern loess areas (0.7104–0.7113, n = 15)
The samples used to define the bioavailable strontium range in thesouthern part of the province of Limburg were collected in Borgharen,located within the valley of the river Meuse. Measured 87Sr/86Sr ratioswere more radiogenic than might be expected from river Meusesediments (Petelet-Giraud et al., 2009). Moreover, geological explora-tions showed that the soil is predominantly made up of gravel in amatric of alluvial loess, re-deposited by the river Meuse (Huismanet al., 2011). The samples from Borgharen were therefore assigned tothe northern and southern loess areas, rather than to the river Meusevalley.
The coverage of these silty aeolian (re-deposited) sediments ofSaalian and Weichselian age is restricted to the southern andsoutheastern parts of The Netherlands (De Mulder et al., 2003;Van der Veer, 2006). Bioavailable strontium in European loesssoils range from 0.7086 and 0.7111 (Price et al., 2003; Nehlichet al., 2009 and references therein). The local bioavailable stron-tium in the Dutch loess region is characterized by more radiogenicSr isotope ratios (0.7104 to 0.7113) due to the breakdown of alkalifeldspar.

Fig. 5. Bioavailable strontium isoscape map of The Netherlands.
8 L.M. Kootker et al. / Journal of Archaeological Science: Reports 6 (2016) 1–13
7.7. Isoscape X: no data coverage
The newly developed bioavailable strontium map of TheNetherlands lacks data coverage for approximately 15%. This includestwo major regions: the boulder clay areas in the northern parts of TheNetherlands and the Peelhorst, a district located east of the Rur Graben(isoscape D). In particular the former region is expected to exhibit high87Sr/86Sr values (N0.7113; see alsoMcManus et al., 2013), increasing therange of isotopic variations within The Netherlands. The latter region iscomprised of fluviatile and aeolian sands of the Beegden and Boxtel For-mations; sediments from both formations will be characterized byunradiogenic 87Sr/86Sr values, averaging around 0.7092. Additionalanalysis will hopefully enable the designation of this area to an existingor new isoscape. Due to the restricted availability of archaeological
fauna samples in these parts of The Netherlands, however, may requirea different sampling strategy.
8. Conclusion
Correct interpretation of strontium isotope data in respect of poten-tial past migration among archaeological human and animal popula-tions requires the establishment of regional maps of local bioavailablestrontium. The primary aim of this paper was to present a preliminaryarchaeological bioavailable 87Sr/86Sr ratio map of The Netherlands.This research has shown that the diversity in the Dutch geological sub-surface is directly reflected in the spatial distribution of the strontiumvalues: large isotopic differences are apparent between the measuredbioavailable strontium in Holocene and Pleistocene formations. As a

9L.M. Kootker et al. / Journal of Archaeological Science: Reports 6 (2016) 1–13
result, The Netherlands could be divided into six bioavailable strontiumisoscapes on the basis of the isotopic analysis of 143 archaeological ro-dents, and small and medium mammals. Ultimately, this map can beused to help improve our understanding of the intensity and extent ofmobility in Dutch and European archaeological context. It must betaken into account, however, that the isoscapes presented here onlygive guidance to the isotopic variations that can be expected in TheNetherlands. Variations in 87Sr/86Sr ratios in human populations dueto differences in diet or the origin of the food resources, may be largerthan the intra-isoscape variation. The best approach to studypalaeomobility in ancient populations is therefore to combine theisoscape map with appropriate (modern) biosphere samples and a sta-tistical assessment of the investigated population.
An idealistic archaeological approach was taken to avoid potentialproblems of human influence by cultivation (ploughing, fertilizers,irrigation and drainage changes); however, this approach did not yield100% coverage. Therefore, to improve its predictive power and to refinethe presented bioavailable strontium map to provide a morecomprehensive coverage, the analysis of archaeological sampleswill be continued for the foreseeable future. Due to the restrictedavailability of archaeological fauna samples in certain parts of TheNetherlands, however, additional biosphere samples will need tobe analysed. Validation of this approach will be needed, however,with studies to establish the extent to which specific floral are offsetcompared to the average archaeological bioavailable strontium. Thebase map presented here now allows a detailed assessment of poten-tial offsets in the 87Sr/86Sr recorded by different proxies at theregional scale. Consequently, to enable a meaningful comparison, aseparate biosphere strontium map will be constructed that coversall main landscape types in The Netherlands. Although such an ap-proach will require calibration for use in an archaeological context,it may prove to be directly appropriate for (modern) forensicpurposes.
LoDWRZYHKNRPMNSo
MM“DIJHLoWNInALiPFl
Acknowledgements
This research could not have been conducted without the initial fi-nancial support fromDr. Oliver Craig and Prof. Matthew Collins, Univer-sity of York, to fund LK's lab training at the Vrije Universiteit Amsterdam(LECHE, 7th Framework Programme, project no. 215362). The technicaland scientific staff at the Vrije Universiteit Amsterdam, in particularRichard Smeets andMartijn Klaver, provided invaluable help in the lab-oratory and with the analytical apparatus. The following people arethanked for collecting and/or providing samples: Bauke Hoekstra (Mu-seumTwentse Twelle), Cees Koot (BureauArcheologie enMonumentenNijmegen), Chiara Cavallo (University of Amsterdam), Dick Tiernego,Erica Rompelman (Aestimatica), Ernst Taayke (provincial archaeologi-cal depot of the Northern Netherlands), Evert Ulrich (ArcheologischeClub Oldenzaal), Frits Laarman (Cultural Heritage Agency), Hans deKievith (Archeologie Breda), Jørn Zeiler (ArchaeoBone), Joyce van Dijkand Kinie Esser (Archeoplan Eco), Maaike Sier (BOOR),Maaike Sonders,Martin Veen (provincial archaeological depot North Holland), MartineMelein (Vrije Universiteit Amsterdam), Nico van der Feest (Aeres-Mi-lieu), Norbert Eltingh (Aestimatica), Peter Bitter (municipality of Alk-maar), Rik Maliepaard (University of Amsterdam), Roel Lauwerier(Cultural Heritage Agency), Said Najaf Koshear and Steven Jongma(Archeologie Delft), Theo de Jong (Archeologisch Centrum Eindho-ven & municipality of Helmond), Tim Hoogendijk, Tiziano Goossens(Archol) and Wietske Prummel (University of Groningen). The au-thors thank the two anonymous reviewers whose constructive cri-tique contributed to improving an earlier draft.
The TRITON facility at the Vrije Universiteit Amsterdam is funded byThe Netherlands Organisation for Scientific Research (NWO) throughgrant no. 834.10.001. Funding for RJvL and GRD is provided by NWO(grant# 360.60.110) and the European Union's Seventh FrameworkProgramme (FP7/2007-2013)/ERC Synergy grant agreement no.319209 respectively.
Appendix A. Dataset used for extrapolation
Main landscape type with data coverage
Isoscapewer Meuse terraces
A unes, beaches and beach barriers B adden Sea clay area B hine–Meuse delta B eeland clay area B oung coastal accretion area B olland peat area C empen aeolian sand deposits C orthern aeolian sand deposits C ur Graben D ush moraines E euse valley F orthern loess area F uthern loess area Fain landscape type without data coverage
Isoscape used for extrapolation euse valley A roogmakerijen” (Polders) Bssel valley
B igher Rhine terraces B wer Rhine terraces B adden Sea peat area B orth Holland clay area B historical times severely flooded areas Beolian sand deposits and boulder clay
– mestone hills of Münster – eelhorst aeolian sand deposits – emisch aeolian sand deposits – rdennes foothills – A
Appendix B. Archaeological bioavailable 87Sr/86Sr data fromTheNetherlands per isoscape (A–F). Asterisks indicate statistical outliers. Latitude
10 L.M. Kootker et al. / Journal of Archaeological Science: Reports 6 (2016) 1–13
and longitude information conform toWGS84 geodetic datum
Identifier
A
B
Main landscape type
Site Taxon 87Sr/86Sr ±2SE Latitude LongitudeLower Meuse terraces
Boxmeer Muroidea 0.70795 0.00001 51.65 5.95 Rattus sp. 0.70857 0.00001 Average 0.70826 1σ 0.00043 N 2Dunes, beaches
Alkmaar Lepus europaeus 0.70896 0.00001 52.63 4.74 and beach barriers Lepus europaeus 0.70898 0.00001Lepus europaeus
0.70901 0.00001 Lepus europaeus 0.70905 0.00001 Rattus sp. 0.70915 0.00001 Lepus europaeus 0.70916 0.00001 Lepus europaeus 0.70920 0.00001 Muroidea 0.70934* 0.00001 Lepus europaeus 0.70936* 0.00001Naaldwijk
Microtus oeconomus 0.70894 0.00001 51.99 4.21 Microtus sp. 0.70897 0.00001 Microtus oeconomus 0.70898 0.00001Wadden Sea clay area
Achlum Muroidea 0.70904 0.00001 53.15 5.48 Muroidea 0.70906 0.00001 Microtus sp. 0.70906 0.00001 Microtus sp. 0.70907 0.00001 Microtus sp. 0.70911 0.00001 Microtus sp. 0.70913 0.00001Firdgum
Microtus sp. 0.70891 0.00001 53.25 5.56 Hatsum Muroidea 0.70910 0.00001 53.20 5.64Muroidea
0.70913 0.00001 Jelsum Muroidea 0.70901 0.00001 53.23 5.78Muroidea
0.70902 0.00001 Microtus sp. 0.70906 0.00001 Muroidea 0.70907 0.00001 Muroidea 0.70908 0.00001 Muroidea 0.70915 0.00001Leeuwarden
Muroidea 0.70926 0.00001 53.20 5.80 Muroidea 0.70932* 0.00001 Muroidea 0.70941* 0.00001Tirns
Muroidea 0.70904 0.00001 53.06 5.63 Englum Muroidea 0.70905 0.00001 53.31 6.40Muroidea
0.70905 0.00001 Muroidea 0.70907 0.00001Young coastal area
Wetsingermaar Muroidea 0.70914 0.00001 53.30 6.52 accretion Muroidea 0.70916 0.00001 Rhine–Meuse delta Beuningen Sorex coronatus 0.70617* 0.00001 51.86 5.77Muroidea
0.70885 0.00001 Sorex coronatus 0.70887 0.00001Culemborg
Muroidea 0.70902 0.00001 51.96 5.24 Microtus sp. 0.70906 0.00001 Muroidea 0.70909 0.00001Lent
Muroidea 0.70884 0.00001 51.86 5.86 Meteren Muroidea 0.70890 0.00001 51.88 5.29 Nijmegen-Lent Apodemus sylvaticus 0.70895 0.00001 51.86 5.86 Tiel Muroidea 0.70888 0.00001 51.89 5.43 IJsselstein Muroidea 0.70923 0.00001 52.02 0.50 Gorinchem Muroidea 0.70886 0.00001 51.84 4.98Muroidea
0.70891 0.00001 Muroidea 0.70894 0.00001Oegstgeest
Felis catus 0.70889 0.00001 52.18 4.47 Felis catus 0.70892 0.00001 Felis catus 0.70893 0.00001 Felis catus 0.70895 0.00001 Felis catus 0.70896 0.00001 Felis catus 0.70897 0.00001 Felis catus 0.70899 0.00001 Muroidea 0.70909 0.00001 Felis catus 0.70910 0.00001 Felis catus 0.70911 0.00001Rotterdam
Arvicola amphibius 0.70882 0.00001 51.92 4.49 Felis catus 0.70895 0.00001 Felis catus 0.70914 0.00001Valkenburg
Rattus sp. 0.70873* 0.00001 52.18 4.43 Muroidea 0.70891 0.00001 Rattus sp. 0.70898 0.00001
(
11L.M. Kootker et al. / Journal of Archaeological Science: Reports 6 (2016) 1–13
continued)
Identifier
C
D
E
Main landscape type
Site Taxon 87Sr/86Sr ±2SE Latitude LongitudeMuroidea
0.70907 0.00001 Muroidea 0.70908 0.00001Zeeland clay area
Vlissingen Oryctolagus cuniculus 0.70902 0.00001 51.45 3.57 Rattus sp. 0.70903 0.00001 Muroidea 0.70910 0.00001 Felis catus 0.70915 0.00001Delft
Muroidea 0.70889 0.00001 52.01 4.36 Arvicolinae 0.70891 0.00001 Arvicolinae 0.70893 0.00001 Muroidea 0.70899 0.00001 Muroidea 0.70905 0.00001 Muroidea 0.70906 0.00001 Muroidea 0.70906 0.00001 Rattus sp. 0.70911 0.00001 Rattus sp. 0.70920 0.00001 Rattus sp. 0.70920 0.00001Rijswijk
Muroidea 0.70897 0.00001 52.04 4.32 Muroidea 0.70899 0.00001 Muroidea 0.70900 0.00001 Muroidea 0.70900 0.00001 Muroidea 0.70900 0.00001 Muroidea 0.70901 0.00001 Muroidea 0.70903 0.00001 Muroidea 0.70909 0.00001 Muroidea 0.70914 0.00001 Average 0.70903 1σ 0.00010 N 85Holland peat area
Amsterdam Rattus rattus 0.70925 0.00001 52.37 4.90 Rattus rattus 0.70926 0.00001 Microtus sp. 0.70932 0.00001 Rattus rattus 0.70975* 0.00001Kempen aeolian sand
Breda Muroidea 0.70910 0.00001 51.59 4.78 deposits Muroidea 0.70917 0.00001Muroidea
0.70919 0.00001 Muroidea 0.70932 0.00001 Muroidea 0.70935 0.00001 Muroidea 0.70944 0.00001 Muroidea 0.70945 0.00001 Muroidea 0.73405* 0.00001Northern aeolian sand
Zwolle Felis catus 0.70929 0.00001 52.51 6.11 deposits Felis catus 0.70930 0.00001Felis catus
0.70939 0.00001 Amersfoort Rattus sp. 0.70944 0.00001 52.16 5.39Average
0.70930 1σ 0.00011 N 14Rur Graben
‘s-Hertogenbosch Soricida 0.70912* 0.00001 51.70 5.32 Muroidea 0.70989 0.00001 Microtus sp. 0.71024 0.00001 Microtus sp. 0.71039 0.00001 Microtus sp. 0.71052 0.00001Eindhoven
Muroidea 0.70984 0.00001 51.44 5.47 Muroidea 0.70986 0.00001 Muroidea 0.70991 0.00001 Muroidea 0.70998 0.00001 Muroidea 0.71003 0.00001Sint-Oedenrode
Microtus sp. 0.70970 0.00001 51.57 5.46 Lepus europaeus 0.71011 0.00001 Average 0.71004 1σ 0.00025 N 11Push moraines
Oldenzaal Felis catus 0.70985 0.00001 52.31 6.93 Felis catus 0.70991 0.00001 Felis catus 0.70995 0.00001 Felis catus 0.71016 0.00001 Oryctolagus cuniculus 0.71029 0.00001 Felis catus 0.71056 0.00001 Lepus europaeus 0.71092 0.00001Average
0.71023 1σ 0.00039(continued on next page)

(
12 L.M. Kootker et al. / Journal of Archaeological Science: Reports 6 (2016) 1–13
continued)
Identifier
F
Main landscape type
Site Taxon 87Sr/86Sr ±2SE Latitude LongitudeN
7Northern and southern
Borgharen Muroidea 0.71054 0.00001 50.88 5.69 loess areas Muroidea 0.71059 0.00001Muroidea
0.71062 0.00001 Muroidea 0.71067 0.00001 Muroidea 0.71068 0.00001 Muroidea 0.71074 0.00001 Muroidea 0.71074 0.00001 Muroidea 0.71081 0.00001 Muroidea 0.71093 0.00001 Muroidea 0.71101 0.00001 Muroidea 0.71102 0.00001 Vulpes vulpes 0.71102 0.00001 Muroidea 0.71102 0.00001 Vulpes vulpes 0.71107 0.00001 Muroidea 0.71117 0.00001 Average 0.71084 1σ 0.00020 N 15References
Bagard, M.-L., Schmitt, A.-D., Chabaux, F., Pokrovsky, O.S., Viers, J., Stille, P., Labolle, F.,Prokushkin, A.S., 2013. Biogeochemistry of stable Ca and radiogenic Sr isotopes in alarch-covered permafrost-dominated watershed of Central Siberia. Geochim.Cosmochim. Acta 114, 169–187.
Bakels, C., Jacomet, S., 2003. Access to luxury foods in Central Europe during the Romanperiod: the archaeobotanical evidence. World Archaeol. 34, 542–557. http://dx.doi.org/10.1080/0043824021000026503.
Bataille, C.P., Bowen, G.J., 2012. Mapping 87Sr/86Sr variations in bedrock and water forlarge scale provenance studies. Chem. Geol. 304–305, 39–52. http://dx.doi.org/10.1016/j.chemgeo.2012.01.028.
Bataille, C.P., Laffoon, J., Bowen, G.J., 2012. Mapping multiple source effects on the stron-tium isotopic signatures of ecosystems from the circum-Caribbean region. Ecosphere3. http://dx.doi.org/10.1890/es12-00155.1 (art118).
Beard, B.L., Johnson, C.M., 2000. Strontium isotope composition of skeletal material candetermine the birth place and geographic mobility of humans and animals.J. Forensic Sci. 45, 1049–1061.
Bentley, R.A., 2006. Strontium isotopes from the earth to the archaeological skeleton: a re-view. J. Archaeol. Method Theory 13, 135–187.
Bentley, R.A., Knipper, C., 2005. Geographical patterns in biologically available strontium,carbon and oxygen isotope signatures in prehistoric SW Germany. Archaeometry 47,629–644.
Bentley, R.A., Price, T.D., Stephan, E., 2004. Determining the ‘local’ 87Sr/86Sr range for ar-chaeological skeletons: a case study from Neolithic Europe. J. Archaeol. Sci. 31,365–375.
Berendsen, H.J.A., 1998. De vorming van het land. Inleiding in de geologie en degeomorfologie. 3rd ed. Van Gorkum & Comp. B.V., Assen.
Borg, L.E., Banner, J.L., 1996. Neodymium and strontium isotopic constraints on soilsources in Barbados, West Indies. Geochim. Cosmochim. Acta 60, 4193–4206.
Borger, G.J., 1992. Draining–digging–dredging; the creation of a new landscape in thepeat areas of the low countries. Geobotany 18, 131–171.
Bowen, G.J., 2010. Isoscapes: spatial pattern in isotopic biogeochemistry. Annu. Rev.Earth Planet. Sci. 38, 161–187. http://dx.doi.org/10.1146/annurev-earth-040809-152429.
Budd, P., Montgomery, J., Barreiro, B., Thomas, R.G., 2000. Differential diagenesis of stron-tium in archaeological human dental tissues. Appl. Geochem. 15, 687–694.
Buhl, D., Neuser, R.D., Richter, D.K., Riedel, D., Roberts, B., Strauss, H., Veizer, J., 1991.Nature and nurture: environmental isotope story of the River Rhine.Naturwissenschaften 78, 337–346. http://dx.doi.org/10.1007/bf01131605.
Burke, W.H., Denison, R.E., Hetherington, E.A., Koepnick, R.B., Nelson, H.F., Otto, J.B., 1982.Variation of seawater 87Sr/86Sr throughout Phanerozoic time. Geology 10, 516–519.http://dx.doi.org/10.1130/0091-7613(1982)10b516:vosstpN2.0.co;2.
Burmeister, S., 2000. Archaeology andmigration: approaches to an archaeological proof ofmigration. Curr. Anthropol. 41, 539–567. http://dx.doi.org/10.1086/317383.
Burton, J., 2008. Bone chemistry and trace element analysis. In: Katzenberg, A., Saunders,S.R. (Eds.), Biological Anthropology of the Human Skeleton, second ed. John Wiley &Sons Inc., pp. 443–460.
Capo, R.C., Stewart, B.W., Chadwick, O.A., 1998. Strontium isotopes as tracers of ecosystemprocesses: theory and methods. Geoderma 82, 197–225.
CBS, 2009. http://statline.cbs.nl/StatWeb/publication/?VW=T&DM=SLNL&PA=71284NED&D1=0,2&D2=0&D3=0-9&HD=091110-0913&HDR=G1,G2&STB=T.
Childe, V.G., 1925. The Dawn of European Civilization. Kegan Paul, Oxford.Colominas, L., Edwards, C.J., Beja-Pereira, A., Vigne, J.-D., Silva, R.M., Castanyer, P.,
Tremoleda, J., Saña Seguí, M., Pérez-Ripoll, M., Goyache, F., Howe, C.J., Barker, G.,Bower, M.A., 2015. Detecting the T1 cattle haplogroup in the IberianPeninsula fromNeolithic toMedieval times: new clues to continuous cattle migration
through time. J. Archaeol. Sci. 59, 110–117. http://dx.doi.org/10.1016/j.jas.2015.04.014.
De Bont, C.H.M., 2008. Vergeten land; ontginning, bewoning en waterbeheer in dewestnederlandse veengebieden (800–1350). Wageningen University, Wageningen(PhD thesis).
De Mulder, E.F.J., Geluk, M.C., Ritsema, I., Westerhoff, W.E., Wong, T.E., 2003. Deondergrond van Nederland. TNO, Utrecht.
Dijkstra, F.A., Van Breemen, N., Jongmans, A.G., Davies, G.R., Likens, G.E., 2003. Calciumweathering in forested soils and the effect of different tree species. Biogeochemistry62, 253–275. http://dx.doi.org/10.1023/A:1021132132199.
Evans, J.A., Montgomery, J., Wildman, G., 2009. Isotope domain mapping of 87Sr/86Sr bio-sphere variation on the Isle of Skye, Scotland. J. Geol. Soc. 166, 617–631.
Evans, J.A., Montgomery, J., Wildman, G., Boulton, N., 2010. Spatial variations in biosphere87Sr/86Sr in Britain. J. Geol. Soc. 167, 1–4.
Faure, G., Mensing, T., 2005. Isotopes: Principles and Applications. Wiley, Hoboken.Frei, K.M., Frei, R., 2011. The geographic distribution of strontium isotopes in Danish sur-
face waters: a base for provenance studies in archaeology, hydrology and agriculture.Appl. Geochem. 26, 326–340.
Frei, K.M., Price, T.D., 2012. Strontium isotopes and human mobility in prehistoric Denmark.Archaeol. Anthropol. Sci. 4, 103–114. http://dx.doi.org/10.1007/s12520-011-0087-7.
Gerding, M.A.W., 1995. Vier eeuwen turfwinning. De verveningen in Groningen,Friesland, Drenthe en Overijssel tussen 1550–1950A.A.G. Bijdragen 35.Landbouwuniversiteit Wageningen, Wageningen.
Grumbkow, P.v., Frommer, S., Kootker, L.M., Davies, G.R., Mazanec, J., Hummel, S., 2013. Kin-ship and mobility in 11th-century A.D. Gammertingen, Germany: an interdisciplinaryapproach. J. Archaeol. Sci. 40, 3768–3776. http://dx.doi.org/10.1016/j.jas.2013.05.001.
Hakenbeck, S., 2008. Migration in archaeology: are we nearly there yet? Archaeol. Rev.Cambridge 23 (2), 9–26.
Hammond, C., O'Connor, T., 2013. Pig diet in medieval York: carbon and nitrogen stableisotopes. Archaeol. Anthropol. Sci. 5, 123–127. http://dx.doi.org/10.1007/s12520-013-0123-x.
Hedman, K.M., Curry, B.B., Johnson, T.M., Fullagar, P.D., Emerson, T.E., 2009. Variation instrontium isotope ratios of archaeological fauna in the Midwestern United States: apreliminary study. J. Archaeol. Sci. 36, 64–73.
Hillson, S., 1986. Teeth. Cambridge University Press, Cambridge.Hodell, D.A., Quinn, R.L., Brenner, M., Kamenoc, G., 2004. Spatial variation of strontium
isotopes (87Sr/86Sr) in the Maya region: a tool for tracking ancient human migration.J. Archaeol. Sci. 31, 585–601.
Hoppe, K.A., Koch, P.L., Furutani, T.T., 2003. Assessing the preservation of biogenic stron-tium in fossil bones and tooth enamel. Int. J. Osteoarchaeol. 13, 20–28.
Huisman, D.J., Van Os, B.J.H., Jans, M.M.E., 2011. 6. Resultaten degradatieonderzoek. In:Lauwerier, R.C.G.M., Müller, A., D.E. S (Eds.), Merovingers in een villa. Romeinsevilla en Merovingisch grafveld Borgharen – Pasestraat. Onderzoek 2008–2009.Rijksdienst voor het Cultureel Erfgoed, Amersfoort, pp. 39–44.
Isermann, K., 1981. Uptake of stable strontium by plants and effects on plant growth. In:Skoryna, S.C. (Ed.), Handbook of Stable Strontium. Springer, US, pp. 65–86 http://dx.doi.org/10.1007/978–1-4684-3698-3_5.
Jongmans, A.G., Van den Berg, M.W., Sonneveld,M.P.W., Peek, G.J.W.C., Berg van Saparoea,R.M., 2013. Landschappen van Nederland: geologie, bodem en landgebruik.Wageningen Academic, Wageningen.
Jung, S.J.A., Davies, G.R., Ganssen, G.M., Kroon, D., 2004. Stepwise Holocene aridification inNE Africa deduced from dust-borne radiogenic isotope records. Earth Planet. Sci. Lett.221, 27–37. http://dx.doi.org/10.1016/S0012-821X(04)00095-0.
Kohn, M.J., Schoninger, M.J., Barker, W.W., 1999. Altered states: effects of diagenesis onfossil tooth chemistry. Geochim. Cosmochim. Acta 63, 2737–2747.
Koomen, A.J.M., Excaltus, R.P., 2003. De vervlakking van Nederland; naar eengaafheidkaart voor reliëf en bodem. Alterra-rapport 740. Alterra Research Institute,Wageningen.

13L.M. Kootker et al. / Journal of Archaeological Science: Reports 6 (2016) 1–13
Koomen, A.J.M., Maas, G.J., 2004. Geomorfologische Kaart Nederland (GKN);Achtergronddocument bij het landsdekkende digitale bestand. Alterra-rapport1039. Alterra Research Institute, Wageningen.
Kootker, L.M., Davies, R.D., 2016. Bones, teeth and invisible tracers: the current stateof human bioarchaeological isotope geochemistry research in The Netherlands.In: Kluiving, S.J., Kootker, L.M., Hermans, R.A.E. (Eds.), Interdisciplinarity Be-tween Humanities and Science, Festschrift Prof. Dr. H. Kars (submitted forpublication).
Lascaris, M.A., De Kraker, A.M.J., 2013. Dikes and other hydraulic engineering works fromthe Late Iron Age and Roman period on the coastal area between Dunkirk and theDanish Bight. In: Thoen, E., Borger, G., De Kraker, A.A.M.J., Soens, T., Tys, D., Vervoet,L., Weerts, H.J.T. (Eds.), Landscapes or Seascapes? The History of the Coastal Environ-ment in the North Sea Area Reconsidered. CORN Publication Series 13, pp. 177–198.
Livarda, A., 2011. Spicing up life in northwestern Europe: exotic food plant imports in theRoman and medieval world. Veg. Hist. Archaeobot. 20, 143–164. http://dx.doi.org/10.1007/s00334-010-0273-z.
Maurer, A.-F., Galer, S.J.G., Knipper, C., Beierlein, L., Nunn, E.V., Peters, D., Tütken, T., Alt,K.W., Schöne, B.R., 2012. Bioavailable 87Sr/86Sr in different environmental samples —effects of anthropogenic contamination and implications for isoscapes in past migra-tion studies. Sci. Total Environ. 433, 216–229.
Mays, S., Beavan, N., 2012. An investigation of diet in early Anglo-Saxon England usingcarbon and nitrogen stable isotope analysis of human bone collagen. J. Archaeol.Sci. 39, 867–874.
McManus, E., Montgomery, J., Evans, J., Lamb, A., Brettell, R., Jelsma, J., 2013. “To the landor to the sea”: diet and mobility in Early Medieval Frisia. J. Isl. Coast. Archaeol. 8,255–277. http://dx.doi.org/10.1080/15564894.2013.787565.
Miller, E.K., Blum, J.D., Friedland, A.J., 1993. Determination of soil exchangeable-cation lossand weathering rates using Sr isotopes. Nature 362, 438–441.
Mulder, J.L., 2007. Vossenbeheer voor hamsters, (hoe) heeft het gewerkt? Rapport BureauMulder-natuurlijk 2007-02, pp. 1–40
Nafplioti, A., 2011. Tracing populationmobility in the Aegean using isotope geochemistry:a first map of local biologically available 87Sr/86Sr signatures. J. Archaeol. Sci. 38,1560–1570.
Nehlich, O., Montgomery, J., Evans, J., Schade-Lindig, S., Pichler, S.L., Richards, M.P., Alt,K.W., 2009. Mobility or migration: a case study from the Neolithic settlement ofNieder-Mörlen (Hessen, Germany). J. Archaeol. Sci. 36, 1791–1799.
Nelson, B.K., Deniro, M.J., Schoeninger, M.J., De Paolo, D.J., Hare, P.E., 1986. Effects of dia-genesis on strontium, carbon, nitrogen and oxygen concentration and isotopic com-position of bone. Geochim. Cosmochim. Acta 50, 1941–1949.
Oelze, V.M., Nehlich, O., Richards, M.P., 2012. ‘There's no place like home’—no isotopic ev-idence for mobility at the early Bronze age cemetery of Singen, Germany.Archaeometry 54, 752–778. http://dx.doi.org/10.1111/j.1475-4754.2011.00644.x.
Overeem, I., Kroonenberg, S.B., 2002. De Amazone in de Noordzee. Nat. Tech. 70 (1),66–71.
Palmer, M.R., Edmond, J.M., 1989. The strontium isotope budget of the modern ocean.Earth Planet. Sci. Lett. 92, 11–26.
Petelet-Giraud, E., Klaver, G., Negrel, P., 2009. Natural versus anthropogenic sources in thesurface- and groundwater dissolved load of the Dommel river (Meuse basin): con-straints by boron and strontium isotopes and gadolinium anomaly. J. Hydrol. 369,336–349. http://dx.doi.org/10.1016/j.jhydrol.2009.02.029.
Petzelberger, B.E.M., Behre, K., Geyh, M.A., 1999. Beginn der Hochmoorentwicklung undAusbreitung der Hochmoore inNordwestdeutschland–ersteErgebnisseeinesneuenProjektes. Telma 29, 21–38.
Price, T.D., 2013. Human mobility at Uppåkra. A preliminary report on isotopicproveniencing. In: Hårdh, B., Larsson, L. (Eds.), Studies at Uppåkra, an Iron Age cityin Scania. Institute of Archaeology, Lund, Sweden, pp. 157–169.
Price, T.D., Burton, J.H., Bentley, R.A., 2002. The characterization of biologically available stron-tium isotope ratios for the study of prehistoric migration. Archaeometry 44, 117–135.
Price, T.D., Wahl, J., Knipper, C., Burger-Heinrich, E., Kurtz, G., Bentley, R.A., 2003. Dasbandkeramische Gräberfeld vom „Viesenhäuser Hof“ bei Stuttgart-Mühlhausen:Neue Untersuchungsergebnisse zum Migrationsverhalten im frühen Neolithikum.In: Funda, D.T. (Ed.), Fundberichte aus Baden-Württemberg. KommissionsverlagKonrad Theiss Verlag, Stuttgart, Germany, pp. 23–58.
Price, T.D., Wahl, J., Bentley, R.A., 2006. Isotopic evidence for mobility and group organiza-tion among Neolithic farmers at Talheim, Germany, 5000 BC. Eur. J. Archaeol. 9,259–284.
Pye, K., 2004. Isotope and trace element analysis of human teeth and bones for forensicpurposes. Geol. Soc. Lond., Spec. Publ. 232, 215–236.
RCE, 2015. Archeologische landschappenkaart (versie 1.0), Amersfoort.Richards, M.P., Mays, S., Fuller, B.T., 2002. Stable carbon and nitrogen isotope values of
bone and teeth reflect weaning age at the Medieval Wharram Percy site, Yorkshire,UK. Am. J. Phys. Anthropol. 119, 205–210. http://dx.doi.org/10.1002/ajpa.10124.
Schokker, J., Weerts, H.J.T., Westerhoff, W.E., Berendsen, H.J.A., Den Otter, C., 2007. Intro-duction of the Boxtel Formation and implications for the Quaternary lithostratigraphyof the Netherlands. Neth. J. Geosci. Geol. Mijnb. 86 (3), 197–210.
Schwarcz, H.P., White, C.D., Longstaffe, F.J., 2010. Stable and radiogenic isotopes in biolog-ical archaeology: some applications. In: West, J.B., G.J.B., Dawson, T.E., Tu, K.P. (Eds.),Understanding movement, pattern, and process on Earth through isotope mapping.Springer Science, Netherlands, pp. 335–356.
Schweissing, M.M., Grupe, G., 2003. Tracing migration events in man and cattle by stablestrontium isotope analysis of appositionally grown mineralized tissue. Int.J. Osteoarchaeol. 13, 96–103. http://dx.doi.org/10.1002/oa.652.
Singman, J.L., 1999. Daily Life in Medieval Europe. Greenwood Press, Westport,Connecticut.
Sjögren, K.-G., Price, T.D., Ahlström, T., 2009. Megaliths and mobility in south-westernSweden. Investigating relationships between a local society and its neighboursusing strontium isotopes. J. Anthropol. Archaeol. 28, 85–101.
Slovak, N.M., Paytan, A., 2011. Applications of Sr isotopes in archaeology. In: Baskaran, M.(Ed.), Handbook of Environmental Isotope Geochemistry. Spinger-Verlag, Heidelberg,pp. 743–768.
Stouthamer, E., Berendsen, H.J.A., 2000. Factors controlling the Holocene avulsion historyof the Rhine–Meuse delta (The Netherlands). J. Sediment. Res. 70 (5), 1051–1064.
Stouthamer, E., Berendsen, H.J.A., 2007. Avulsion, an autogenic or allogenic controlledprocess? Sediment. Geol. 198, 309–325.
Tütken, T., Knipper, C., Alt, K.W., 2008. Mobilität und migration im archäologischenkontext. Informationspotential von multi-element-isotopenanalysen (Sr, Pb, O). In:Bemmann, J., Schmauder, M. (Eds.), Kulturwandel in Mitteleuropa. Langobarden -Awaren - Slawen. Akten der Internationalen Tagung in Bonn vom 25. bis 28. Februar2008. Kolloquien zur Vor- und Frühgeschichte 11. Dr. Rudolf Habelt, Bonn, pp. 13–42.
Van der Jagt, I.M.M., Kootker, L.M., Van Kolfschoten, T., Kars, H., Davies, G.R., 2012. An in-sight into animal exchange in Early Medieval Oegstgeest: a combinedarchaeozoological and isotopic approach. In: Raemaekers, D.C.M., Esser, E.,Lauwerier, R.C.G.M., Zeiler, J.T. (Eds.), A Bouquet of Archaeological Studies. Essays inHonour of Wietske Prummel. Barkhuis, Eelde, pp. 137–149.
Van der Merwe, N.J., Vogel, J.C., 1977. Isotopic evidence for early maize cultivation in NewYork state. Am. Antiq. 42, 238–242.
Van der Veer, G., 2006. Geochemical soil survey of the Netherlands. Atlas of major andtrace elements in topsoil and parent material; assessment of natural and anthropo-genic enrichment factors. In: Borchert, J.G., Van Amersfoort, J.M.M., Berendsen,H.J.A., Druijven, P.C.J., Kouwenhoven, A.O., Scholten, H. (Eds.), Netherlands Geograph-ical Studies 347. Koninklijk Nederlands Aardrijkskundig Genootschap, Utrecht.
Veizer, J., 1989. Strontium isotopes in seawater through time. Annu. Rev. Earth Planet. Sci.17, 141–167.
Viner, S., Evans, J., Albarella, U., Parker Pearson, M., 2010. Cattle mobility in prehistoricBritain: strontium isotope analysis of cattle teeth from Durrington Walls (Wiltshire,Britain). J. Archaeol. Sci. 37, 2812–2820.
Voerkelius, S., Lorenz, G.D., Rummel, S., Quétel, C.R., Heiss, G., Baxter, M., Brach-Papa, C.,Deters-Itzelsberger, P., Hoelzl, S., Hoogewerff, J., Ponzevera, E., Van Bocxstaele, M.,Ueckermann, H., 2010. Strontium isotopic signatures of natural mineral waters, thereference to a simple geological map and its potential for authentication of food.Food Chem. 118, 933–940.
Vos, P., 2015. Origin of the Dutch Coastal Landscape. Long-Term Landscape Evolution ofthe Netherlands During the Holocene, Described and Visualized in National, Regionaland Local Palaeogeographical Map Series. Barkhuis Publishing, Eelde.
Vos, P., De Vries, S., 2013. 2e generatie palaeogeografische kaarten van Nederland (versie2.0). Deltares, Utrecht.
Vos, P.C., Bazelmans, J., Weerts, H.J.T., Van der Meulen, H.J.T., 2011. Atlas van Nederland inhet Holoceen. Bert Bakker, Amsterdam.
Weerts, H.J.T., Cleveringa, P., Ebbing, J.H.J., Lang, F.D.D., Westerhoff, W.E., 2003. Delithostratigrafische indeling van Nederland – Formaties uit het Tertiair en Kwartair,NITG 03-051-A. Nederlands Instituut voor Toegepaste Geowetenschappen TNO,Utrecht.
Willmes, M., McMorrow, L., Kinsley, L., Armstrong, R., Aubert, M., Eggins, S., Falguères, C.,Maureille, B., Moffat, I., Grün, R., 2014. The IRHUM (Isotopic Reconstruction of HumanMigration) database — bioavailable strontium isotope ratios for geochemicalfingerprinting in France. Earth Syst. Sci. Datas 6, 117–122. http://dx.doi.org/10.5194/essd-6-117-2014.
Wright, L.E., 2005. Identifying immigrants to Tikal, Guatemala: defining local variability instrontium isotope ratios of human tooth enamel. J. Archaeol. Sci. 32, 555–566.
www.bodemdata.nl, last accessed September 2015.Zwart, M.H., Hooijboer, A.E.J., Fraters, B., Kotte, M., Duin, R.N.M., Daatselaar, C.H.G., Bosma,
J.N., 2008. Agricultural practice and water quality in the Netherlands in the1992–2006 period. RIVM report 680716003/2008, p. 131.


