Embed Size (px)
Citation preview
Statistical Model Checking of Wireless MeshRouting Protocols
Peter Höfner1,3 and Annabelle McIver2,1
1 NICTA2 Department of Computing, Macquarie University
3 Computer Science and Engineering, University of New South Wales
Abstract. Several case studies indicate that model checking is limitedin the analysis of mesh networks: state space explosion restricts appli-cability to at most 10 node networks, and quantitative reasoning, oftensufficient for network evaluation, is not possible. Both deficiencies can beovercome to some extent by the use of statistical model checkers, such asSMC-Uppaal. In this paper we illustrate this by a quantitative analysisof two well-known routing protocols for wireless mesh networks, namelyAODV and DYMO. Moreover, we push the limits and show that thistechnology is capable of analysing networks of up to 100 nodes.
1 Introduction
Wireless Mesh Networks (WMNs) are self-organising ad-hoc networks that sup-port broadband communication without relying on a wired backhaul infrastruc-ture. They have gained popularity through their flexibility which allows themto be used in a diverse range of applications, from emergency response to trans-portation systems. Automatic route-discovery, maintenance and repair play afundamental role in reliability and performance of such networks where typicalscenarios include dynamic topologies. The engineering challenge is to design pro-tocols which facilitate good service in spite of these harsh operating conditions.
Traditional approaches to the analysis of WMN protocols are simulationand test-bed experiments. While these are important evaluation methods theyare typically used for testing implementations rather than design specifications.Moreover, the analysis is restricted to global properties such as overall through-put or message delay. Formal analysis of specifications is one way to systemati-cally screen protocols for flaws and to present counterexamples to diagnose them.It has been used in locating problems in automatic route-finding protocols [2, 9].
Unfortunately, current state-of-the art model checkers are unable to handleprotocols of the complexity needed for WMN routing in realistic settings. Inprevious work [8] we used the model checker Uppaal to analyse basic qualitativeproperties of the Ad hoc On-Demand Distance Vector (AODV) routing proto-col, one of four protocols currently standardised by the IETF MANET workinggroup. We were able to analyse systematically all network topologies of up tofive nodes. Although this provides a partial analysis, as does simulation, the
2 P. Höfner and A. McIver
network sizes are far from realistic and quantitative information such as proba-bilities were not included. In this paper we investigate whether statistical modelchecking can combine the systematic methodology of “classical” model checkingwith the ability to analyse quantitative properties and realistic scenarios.
Statistical Model Checking (SMC) [20, 19] combines ideas of model check-ing and simulation with the aim of supporting quantitative analysis as wellas addressing the size barrier that currently prevents useful analysis of largemodels. SMC trades certainty for approximation, using Monte Carlo style sam-pling, and hypothesis testing to interpret the results. We are interested in timedsystems and so we use SMC-Uppaal, the Statistical extension of Uppaal (re-lease 4.1.11) [4], which supports the composition of timed and/or probabilisticautomata. The sampling is carried out according to the probability distribu-tion defined by the probabilistic automata. Parameters setting thresholds on theprobability of false negatives (α) and on probabilistic uncertainty (ε) can be usedto specify the statistical confidence on the result. SMC-Uppaal computes thenumber of simulation runs needed by using the theoretical Chernoff-Hoeffdingbounds (O
(1ε2 ln
2α
)), which crucially is independent of the size of the model.
SMC-Uppaal generates an interval [p− ε, p+ ε] for estimating p, the probabilityof CTL-property ψ holding w.r.t. the underlying probability distribution.
In this paper we model two routing protocols for WMNs: AODV and DYMO(Dynamic MANET On-demand).1 One aim is to understand the role of thedifferent design choices via a number of performance and correctness measures.We analyse the performance, both over a complete set of topologies for smallnetworks as well as for medium-to-large network sizes. Since the complexity andsize of these protocols go far beyond what can be analysed with standard modelchecking, these case studies provide excellent test bases for demonstrating thepower and capacity of the new statistical tools. We illustrate here the rangeand depth of the analysis which is achievable with statistical analysis, which webelieve is currently not possible using traditional simulation alone.
In Sect. 2, we give an informal summary of routing, followed by a descrip-tion of our Uppaal models, concentrating particularly on timing aspects. Fourcategories of experiments are discussed in Sect. 3. The first presents a timing ana-lysis of AODV; the second and third provide a thorough comparison of AODVagainst DYMO both w.r.t. overall performance and quality of the routes dis-covered, where we find some surprising trends. Finally we demonstrate that thisanalysis is scalable, illustrated by redoing a selection of experiments for networksconsisting of up to 100 nodes. In Sect. 4, we review related work and, in Sect. 5,we reflect on the challenges ahead for SMC.
2 Routing Protocols and their Architecture
On demand routing protocols such as AODV and DYMO are designed to estab-lish routes only when needed, typically when a new data packet is injected by
1 Since March 2012, DYMO is sometimes referred to as AODVv2.
Statistical Model Checking of Wireless Mesh Routing Protocols 3
a user (application layer). Each node maintains its own routing table therebyenabling it to act as its own router. Routing tables can be updated whenevernew messages are handled, since incoming messages carry a wealth of informa-tion concerning network connectivity simply because they have just successfullytravelled from somewhere. Nodes mine that information in different ways, which,as our analysis shows, yields different behavioural profiles.
The collective information in the nodes’ routing tables is at best a partialrepresentation of network connectivity as it was sometime in the past; in themost general scenarios mobility continually modifies that representation. Nodesfollowing either AODV or DYMO store information about a route towards apossible destination d (if a route has been discovered) as follows. The totalnumber of hops in the route (hops), the identity of the very next hop in theroute (nhop), a “destination sequence number” (dsn) (a measure of the freshnessof the entry), and a “validity flag” (flag),2 which is unset whenever informationarrives indicating that one of the downstream links in the route is broken. Whilstcurrently our analysis only looks at static topologies we nevertheless find thatthese protocols do not always perform as we would expect.
2.1 Basic Architecture for Ad Hoc Routing
AODV and DYMO follow the same basic architecture. Each node maintains amessage queue to store incoming messages and a processor for handling messages.Whilst the queue is always enabled to receive messages, message handling cantake time and so communication between queue and handler occurs only whenthe handler has successfully processed a message. The workflow of the handleris as follows: first, the next (oldest) message is loaded from its message queue.Depending on the type of message (see below) the routing table is updated and,if necessary, a new message is created, and either broadcast or unicast.
The AODV Architecture. Each node maintains its own destination sequencenumber, routing table and keeps a record of the messages it has already re-ceived (or initiated). It also manages a queue to store data packets waiting tobe delivered. Messages are handled appropriately according to their type:
PKT Messages containing data packets play no part in route-finding. In thecase that a node has a valid route for the PKT’s destination, the packet isforwarded to nhop, the next hop on the route. In the case that the datapacket is injected by the application layer and no (valid) route is known,the packet is placed on the node’s packet queue, and a route discoveryprocess is initiated by broadcasting an appropriate RREQ message.
RREQ Route requests are messages, broadcast to every node within transmissionrange. They contain information about the originator of the route discov-ery process, the neighbour that most recently sent it, and the number ofnodes through which the request travelled. All of this information is avail-able for updating routing tables. The same request can be received via
2 AODV calls it ValidDestination Sequence Number flag ; DYMO Route.Broken.
4 P. Höfner and A. McIver
different routes and so nodes maintain a record of those that have alreadybeen handled so that duplicates can be discarded. For new requests, thefollowing actions are taken. (a) If the node is either the destination or hasa valid route to the destination stored in its routing table, a route reply(RREP) message is generated, which is unicast back to most recent sender.(b) If the node is neither the destination nor has any information aboutthe destination, it increments the hop count and broadcasts it on.
RREP Replies are “logically” matched up with the corresponding request thatgave rise to it so that a route for the requested destination can be es-tablished. The routing table is updated for that destination, by recordingnhop as the neighbour from which the RREP was received and similarlytaking hops and dsn from the RREP. Only if the routing table was changedduring the update, the hop count of the RREP is increased and then (inthe case that the node was not the original initiator) forwarded to theneighbour from which the corresponding request was received.
RERR Error messages are generated whenever link breaks are detected by somenodes. Often this occurs when a message (RREP or PKT) fails to be sent. Inthese cases an error message is sent to all neighbours. If an RERR message isreceived the routing tables are updated—in particular routes are markedas invalid, and the error message is forwarded to all neighbours.
This informal introduction to AODV should be sufficient to understand theexperiments described below. A detailed description can be found in [14].
The DYMO Architecture. DYMO [15] follows the same basic workflow asAODV. In this section we only highlight the major design differences.3
(a) DYMO’s mechanism for managing duplicate requests is no longer based ona queue of handled RREQ messages. Instead DYMO uses sequence numbersto judge whether information contained in a message should be forwarded.While this modification saves some memory, it has been shown that thechange can lead to loss of route requests [6].
(b) On the other hand AODV can lose route replies since RREP messages are onlyforwarded if the routing table of an intermediate node is updated (changed).4To avoid this, a node generating a route reply increments the sequence num-ber for the destination, thereby guaranting that the routing table of nodesreceiving the RREP message will be updated, and the RREP forwarded.
(c) DYMO establishes bidirectional routes between originator and destination.When an intermediate node initiates a route reply, it unicasts a messageback to the originator of the request (as AODV does), but at the same timeit forwards a route reply to the intended destination of the route request.
(d) DYMO uses the concept of path accumulation: whenever a control message(RREQ, RREP, RERR) travels via more than one node, information about allintermediate nodes is stored in the message. In this way, a node receiving amessage establishes routes to all other intermediate nodes. In AODV nodesonly establish routes to a the initiator and to the sender of a message.
3 Our model is based on DYMO’s internet draft version 22.4 http://www.ietf.org/mail-archive/web/manet/current/msg05702.html
Statistical Model Checking of Wireless Mesh Routing Protocols 5
addmsg(msg_global)
addmsg(msg_global)
addmsg(msg_global)
rreq[sip]?
create_msg(),delete_msg()
newpkt[ip][tip]?
rrep[sip][ip]?
sip:IP
sip:IP
tip:IPaddmsg(msg_global)
addmsg(createpkt(tip,ip))
sip:IP
sip:IPisconnected(sip,ip)
isconnected(sip,ip)
nextmsg()!=0 && idle[ip]
pkt[sip][ip]?
rerr[sip]?isconnected(sip,ip)
imsg[ip]!
isconnected(sip,ip)
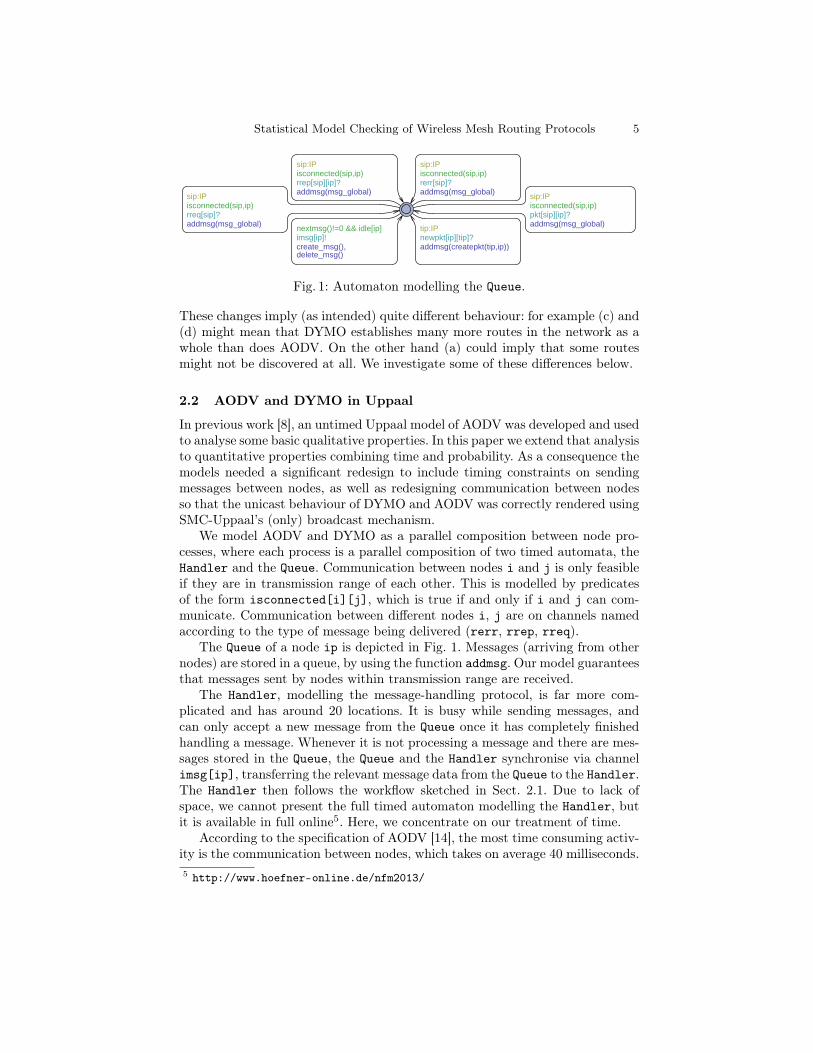
Fig. 1: Automaton modelling the Queue.
These changes imply (as intended) quite different behaviour: for example (c) and(d) might mean that DYMO establishes many more routes in the network as awhole than does AODV. On the other hand (a) could imply that some routesmight not be discovered at all. We investigate some of these differences below.
2.2 AODV and DYMO in Uppaal
In previous work [8], an untimed Uppaal model of AODV was developed and usedto analyse some basic qualitative properties. In this paper we extend that analysisto quantitative properties combining time and probability. As a consequence themodels needed a significant redesign to include timing constraints on sendingmessages between nodes, as well as redesigning communication between nodesso that the unicast behaviour of DYMO and AODV was correctly rendered usingSMC-Uppaal’s (only) broadcast mechanism.
We model AODV and DYMO as a parallel composition between node pro-cesses, where each process is a parallel composition of two timed automata, theHandler and the Queue. Communication between nodes i and j is only feasibleif they are in transmission range of each other. This is modelled by predicatesof the form isconnected[i][j], which is true if and only if i and j can com-municate. Communication between different nodes i, j are on channels namedaccording to the type of message being delivered (rerr, rrep, rreq).
The Queue of a node ip is depicted in Fig. 1. Messages (arriving from othernodes) are stored in a queue, by using the function addmsg. Our model guaranteesthat messages sent by nodes within transmission range are received.
The Handler, modelling the message-handling protocol, is far more com-plicated and has around 20 locations. It is busy while sending messages, andcan only accept a new message from the Queue once it has completely finishedhandling a message. Whenever it is not processing a message and there are mes-sages stored in the Queue, the Queue and the Handler synchronise via channelimsg[ip], transferring the relevant message data from the Queue to the Handler.The Handler then follows the workflow sketched in Sect. 2.1. Due to lack ofspace, we cannot present the full timed automaton modelling the Handler, butit is available in full online5. Here, we concentrate on our treatment of time.
According to the specification of AODV [14], the most time consuming activ-ity is the communication between nodes, which takes on average 40 milliseconds.5 http://www.hoefner-online.de/nfm2013/
6 P. Höfner and A. McIver
RREP[sip][ip]!
RERR[sip]!
isconnected[sip][ip]
!isconnected[sip][ip]
(a) untimed model
RREP[sip][ip]!
t:=0
t:=0
RERR[sip]!
isconnected[sip][ip]
!isconnected[sip][ip]
t<=45 &&isconnected[sip][ip]
t<=45
t>=35 && isconnected[sip][ip]
!isconnected[sip][ip]
t>=35
(b) timed model
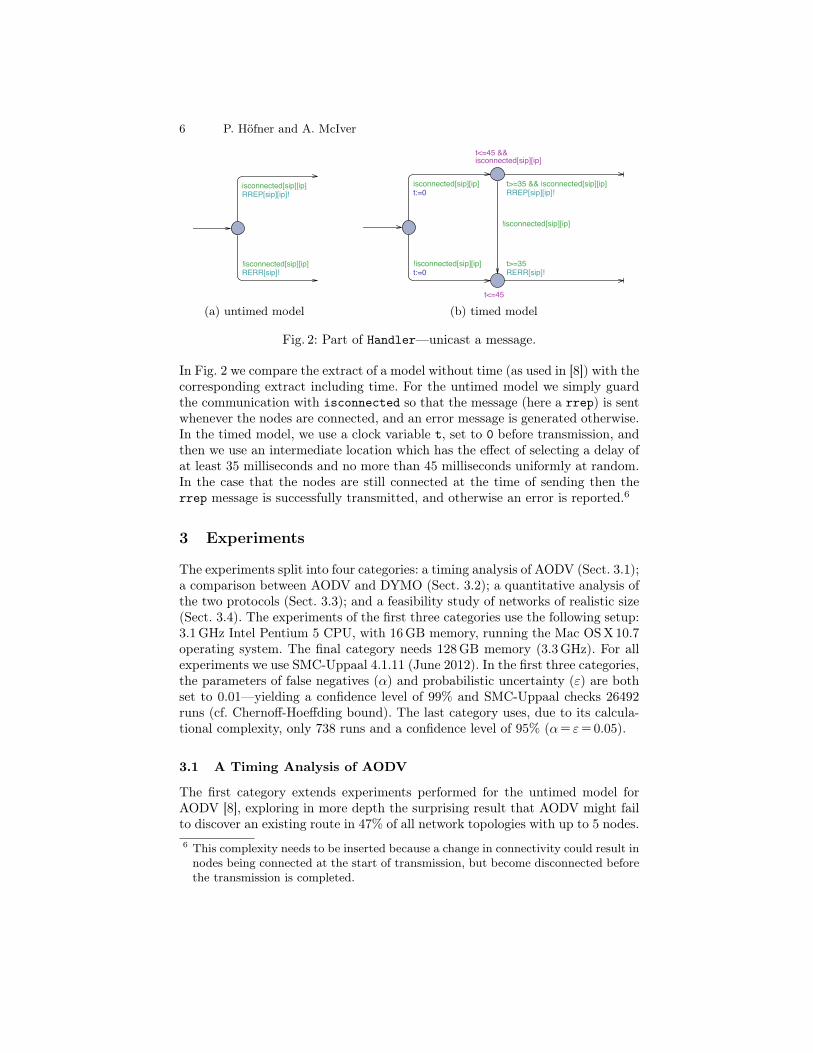
Fig. 2: Part of Handler—unicast a message.
In Fig. 2 we compare the extract of a model without time (as used in [8]) with thecorresponding extract including time. For the untimed model we simply guardthe communication with isconnected so that the message (here a rrep) is sentwhenever the nodes are connected, and an error message is generated otherwise.In the timed model, we use a clock variable t, set to 0 before transmission, andthen we use an intermediate location which has the effect of selecting a delay ofat least 35 milliseconds and no more than 45 milliseconds uniformly at random.In the case that the nodes are still connected at the time of sending then therrep message is successfully transmitted, and otherwise an error is reported.6
3 Experiments
The experiments split into four categories: a timing analysis of AODV (Sect. 3.1);a comparison between AODV and DYMO (Sect. 3.2); a quantitative analysis ofthe two protocols (Sect. 3.3); and a feasibility study of networks of realistic size(Sect. 3.4). The experiments of the first three categories use the following setup:3.1GHz Intel Pentium 5 CPU, with 16GB memory, running the Mac OSX 10.7operating system. The final category needs 128GB memory (3.3GHz). For allexperiments we use SMC-Uppaal 4.1.11 (June 2012). In the first three categories,the parameters of false negatives (α) and probabilistic uncertainty (ε) are bothset to 0.01—yielding a confidence level of 99% and SMC-Uppaal checks 26492runs (cf. Chernoff-Hoeffding bound). The last category uses, due to its calcula-tional complexity, only 738 runs and a confidence level of 95% (α= ε=0.05).
3.1 A Timing Analysis of AODV
The first category extends experiments performed for the untimed model forAODV [8], exploring in more depth the surprising result that AODV might failto discover an existing route in 47% of all network topologies with up to 5 nodes.6 This complexity needs to be inserted because a change in connectivity could result innodes being connected at the start of transmission, but become disconnected beforethe transmission is completed.
Statistical Model Checking of Wireless Mesh Routing Protocols 7
For the experiments we generate all topologies of up to 5 nodes, where foreach topology we consider three distinct nodes A, B and C; each with particularoriginator/destination roles as per scenario described below. Up to symmetrythis yields 444 topologies. For each scenario we analyse three properties; in totalthis requires approximately 4000 experiments for this category.
Initially, for each scenario no routes are known. Then, with a time gap of35–45 milliseconds, two of the distinct nodes receive a data packet and have tofind routes to the packets’ destinations. The scenarios assign roles as follows:(i) A is the only originator sending a packet first to B and afterwards to C;(ii) B and C are originators both sending to A;(iii) A is sending to B first and then B is also an originator sending to C;(iv) B is an originator sending to C followed by A sending to B.For each scenario we analyse two properties and their combination. The firstproperty examines the time taken for the protocol to complete, i.e., until allmessages have been handled, which encoded in Uppaal’s syntax as
Pr[<=10000](<> (tester.final && emptybuffers())) (1)
This query asks for the probability estimate (Pr) satisfying the CTL-path ex-pression <>(tester.final && emptybuffers()) within 10000 time units (mil-liseconds); we choose this bound as a conservative upper bound to ensure thatthe analyser explores paths to a depth where the protocol is guaranteed to haveterminated. tester refers to a process which injects the data packets to the orig-inators (tester.final means that all data packets have been injected), and thefunction emptybuffers() checks whether the nodes’ message queues are empty.
The second property examines the time for requested routes to be established.This differs from (1) since routes are usually found before all buffers are emptied.
Pr[<=10000](<> (OIP1.rt[DIP1].nhop!=0 && OIP2.rt[DIP2].nhop!=0)) (2)
Here, o.rt[d].nhop is the next hop in o’s routing table entry for destination d.As soon as this value is set (is different to 0), a route to d has been established.
The third property combines the first two and analyses the time which isneeded to finish the protocol and to establish the routes; this estimates theproportion of runs which end without ever finding a route.
Pr[<=10000](<> (tester.final && emptybuffers() &&OIP1.rt[DIP1].nhop!=0 && OIP2.rt[DIP2].nhop!=0))
(3)
For every scenario, SMC-Uppaal evaluates the property under considerationfor 26492 runs and returns a probability interval [p−0.01, p+0.01], where p isthe averaged probability over all runs. Probability theory implies that with alikelihood of 99% the “real” value is inside this interval.
Fig. 3 displays the results for all 5-node networks.7 The x-axis represents thetime (in milliseconds) for the property to be satisfied; the y-axis represents theaverage number of simulation runs per topology for the property to be satisfied.7 The graphs for network sizes 3 and 4 look similar and can be found athttp://www.hoefner-online.de/nfm2013/
8 P. Höfner and A. McIver
C
B
A
Four scenarios:(i) A searches for B, then A for C;(ii) B searches for A, then C for A;(iii) A searches for B, then B for C;(iv) B searches for C, then A for B
(a) example topology and scenarios
120 200 280 3600
150
300
450
600
AODVAB−AC (100%)AODVBA−CA (100%)AODVAB−BC (100%)AODVBC−AB (100%)
(b) running time of AODV
120 200 280 3600
150
300
450
600
AODVAB−AC (78.2%)AODVBA−CA (100%)AODVAB−BC (89.3%)AODVBC−AB (99%)
(c) route establishment
120 200 280 3600
100
200
300
400
500
600
700 AODVAB−AC (78.2%)AODVBA−CA (100%)AODVAB−BC (89.3%)AODVBC−AB (99%)
(d) combined properties
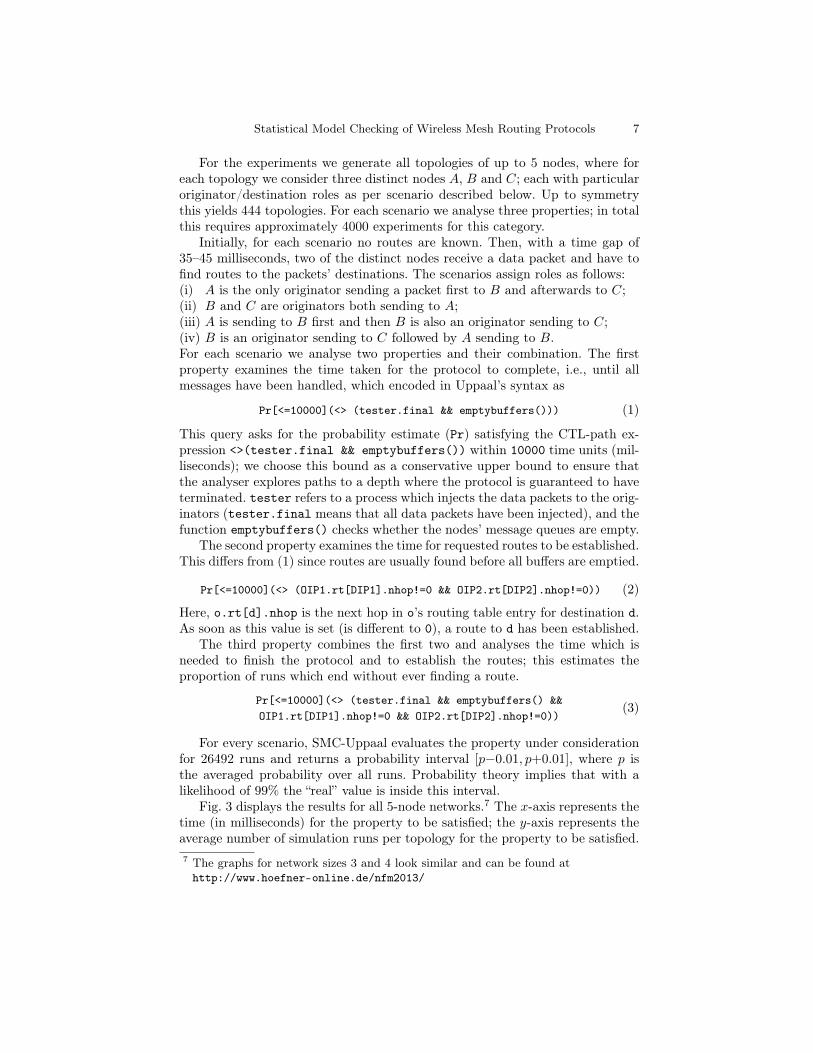
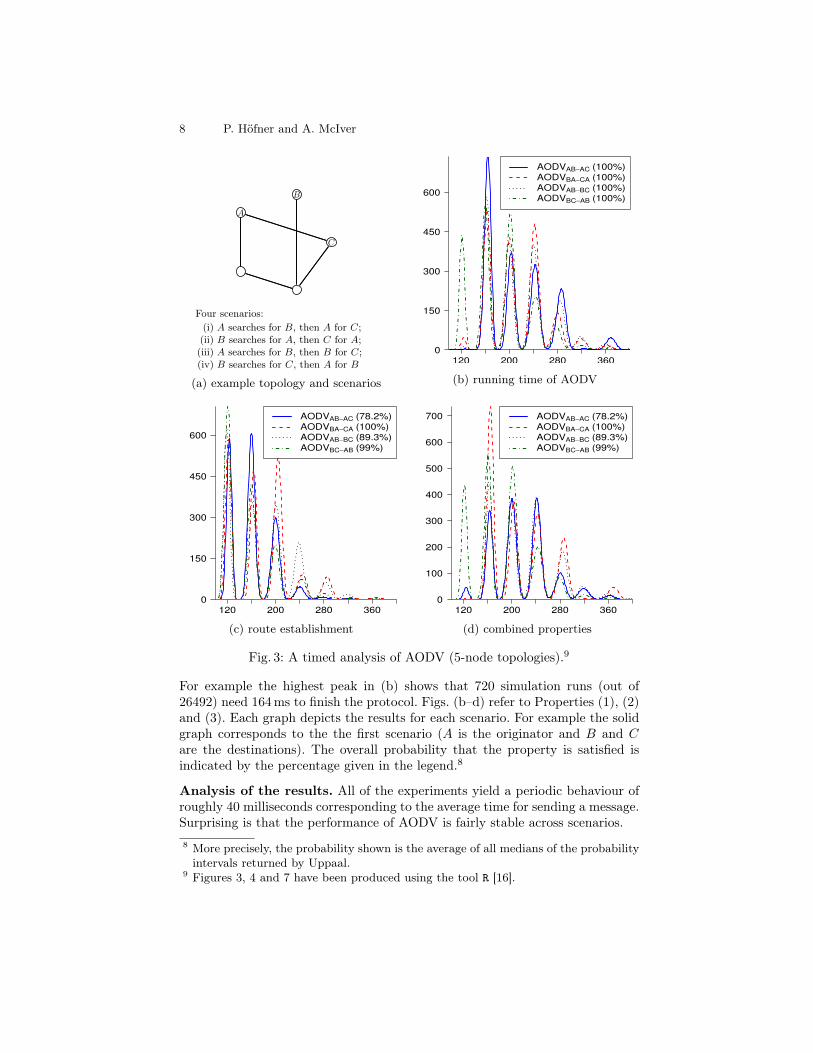
Fig. 3: A timed analysis of AODV (5-node topologies).9
For example the highest peak in (b) shows that 720 simulation runs (out of26492) need 164ms to finish the protocol. Figs. (b–d) refer to Properties (1), (2)and (3). Each graph depicts the results for each scenario. For example the solidgraph corresponds to the the first scenario (A is the originator and B and Care the destinations). The overall probability that the property is satisfied isindicated by the percentage given in the legend.8
Analysis of the results. All of the experiments yield a periodic behaviour ofroughly 40 milliseconds corresponding to the average time for sending a message.Surprising is that the performance of AODV is fairly stable across scenarios.8 More precisely, the probability shown is the average of all medians of the probabilityintervals returned by Uppaal.
9 Figures 3, 4 and 7 have been produced using the tool R [16].
Statistical Model Checking of Wireless Mesh Routing Protocols 9
Fig. 3(b) shows that AODV always terminates and presents the runningtimes for termination. Fig. 3(c) shows that in general route establishment occursmuch earlier; the results also show that AODV cannot always establish routes:in the case of 3-node topologies routes are not established in 11.7% of all cases;for networks with 4 nodes in 10.85% of all cases; and in case of 5 nodes inapproximately 10% of all cases.
Fig. 3(d) confirms that the quantitative analysis gives significantly more in-sight than an untimed analysis such as reported in [8]. There, we considered asimilar property and found that in 47.3% of all 5-node topologies there is thepossibility of route-discovery failure—a quantitative analysis was not possible.Our quantitative analysis shows that failure to find a route can now be estimatedat around 10%. There are two reasons for this dramatic difference. First, the in-clusion of time ruled out some scenarios where route failure was due to messagesovertaking each other. Second, and more significant, the new analysis determinesthe number of runs (not the number of topologies), where route discovery failsand indicates that discovery failures are rare: whereas in half of the topologiesroute failure is possible [8], in only ∼10% of all runs failure actually happens.
3.2 AODV versus DYMO
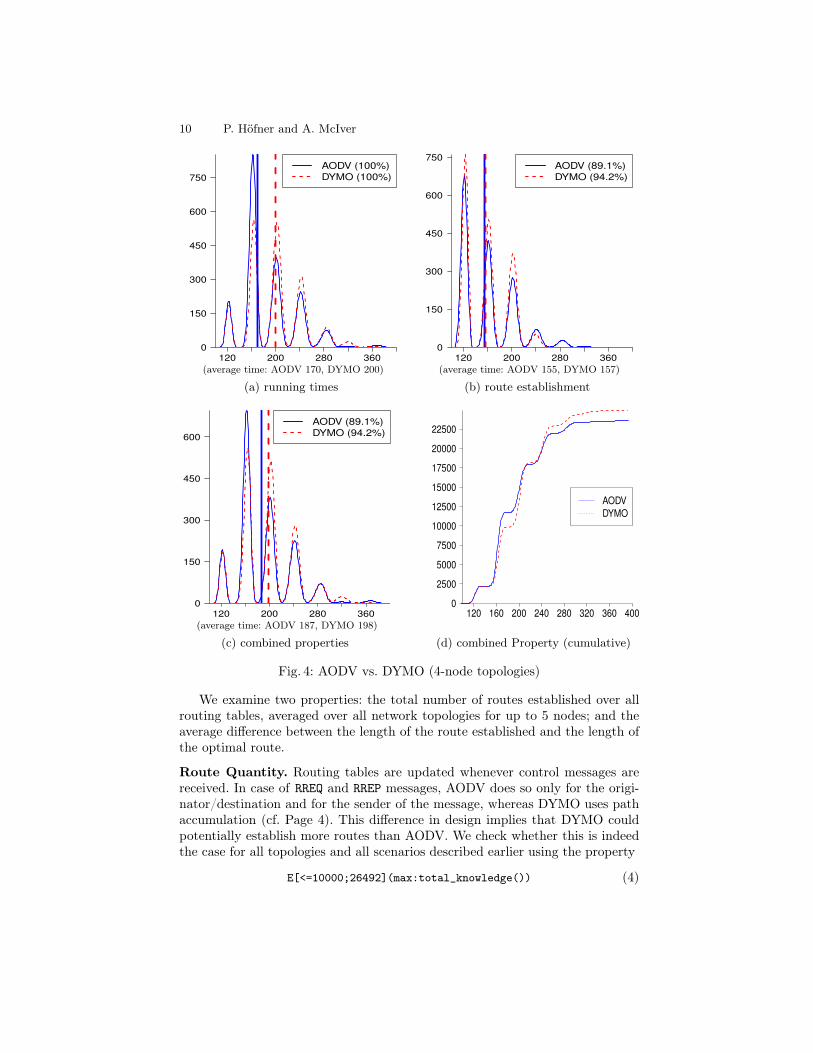
In Sect. 2 we have outlined the design differences between AODV and DYMO.Moreover, we have speculated on what those differences might imply w.r.t. over-all performance. We now run exactly the same experiments as described inSect. 3.1, this time for DYMO. The results averaged over all 4-node networksand all scenarios for both routing protocols are presented in Fig. 4; in thesediagrams we also indicate the average times by vertical bars.
To our surprise, the variation in performance between the two is marginal:DYMO appears to be more reliable in that it can establish more routes than doesAODV in some cases (Fig. 4(b,c)). DYMO takes on average longer to complete(Fig. 4(a)) but the average time to find routes is almost exactly the same as forAODV (Fig. 4(b)).
A first analysis of the circumstances behind the observed non-establishment ofroutes in DYMO is presented in [6], indicating that problems occur when mess-ages can overtake others. The reason why DYMO needs longer running times isthe additional RREP-message sent to the destination of a route request (cf. Page 4).
3.3 Quantitative Measurements
So far we have looked at running times and route discovery. In this section weillustrate how to the use Value-Estimation-Feature (E) of SMC-Uppaal to explorethe quality and quantity of the routes established by AODV and DYMO.
One side effect of broadcasting route requests is that intermediate nodes,which handle those requests, are able to establish routes to the originator. Whilstthis certainly represents an increase in “knowledge” across the network, there isno guarantee that the routes established are optimal. In [13] it is shown that non-optimal paths can impact overall performance of packet delivery dramatically.
10 P. Höfner and A. McIver
120 200 280 3600
150
300
450
600
750
AODV (100%)
DYMO (100%)
(average time: AODV 170, DYMO 200)
(a) running times
120 200 280 3600
150
300
450
600
750AODV (89.1%)
DYMO (94.2%)
(average time: AODV 155, DYMO 157)
(b) route establishment
120 200 280 3600
150
300
450
600
AODV (89.1%)
DYMO (94.2%)
(average time: AODV 187, DYMO 198)
(c) combined properties
120 160 200 240 280 320 360 4000
2500
5000
7500
10000
12500
15000
17500
20000
22500
AODV
DYMO
(d) combined Property (cumulative)
Fig. 4: AODV vs. DYMO (4-node topologies)
We examine two properties: the total number of routes established over allrouting tables, averaged over all network topologies for up to 5 nodes; and theaverage difference between the length of the route established and the length ofthe optimal route.
Route Quantity. Routing tables are updated whenever control messages arereceived. In case of RREQ and RREP messages, AODV does so only for the origi-nator/destination and for the sender of the message, whereas DYMO uses pathaccumulation (cf. Page 4). This difference in design implies that DYMO couldpotentially establish more routes than AODV. We check whether this is indeedthe case for all topologies and all scenarios described earlier using the property
E[<=10000;26492](max:total_knowledge()) (4)
Statistical Model Checking of Wireless Mesh Routing Protocols 11
Here, the function total_knowledge() counts the number of entries in all rout-ing tables along a run (path); max takes the largest of these values. Since valueestimation does not determine the number of runs, we set it to the same numberas determined previously (26492); the time bound is again set to 10000.
3 nodes 4 nodes 5 nodesAODV 5.28 8.83 13.99DYMO 5.25 7.87 11.94
max 6 12 20
Table 1: Average number of routes found
Table 1 presents the results,grouped by network size. Notethat the last row shows the max-imal number of possible rout-ing table entries: this is n ·(n−1)since each node can hold n−1entries in an n-node network.To our surprise, DYMO estab-
lishes fewer routes on average than does AODV. (Although it does establishmore of the requested routes Fig. 4.) A possible explanation is the following:when DYMO floods the network with the first RREQ, many nodes establish manyroutes (more than with AODV), due to path accumulation. When the secondRREQ is sent, the chance of an intermediate route reply is now greater (than forAODV)—an intermediate route reply means that the RREQ is not forwarded, thusadditional opportunities to create routes in receiving nodes are suppressed.10
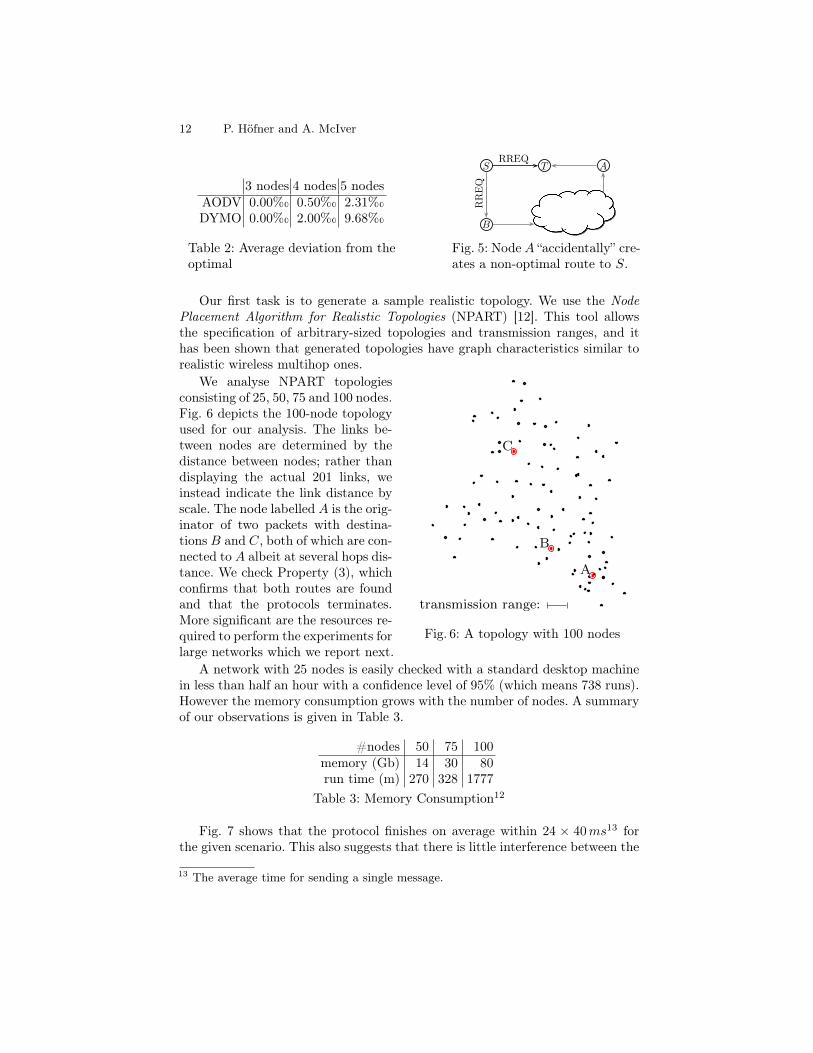
Route Quality. In almost all routing protocols based on RREQ-broadcast, non-optimal routes can be established [13]. This can happen when the destinationdoes not forward the RREQ message, as the example in Fig. 5 shows. The scenariodepicts node S searching for a route to node T . As soon as T receives the RREQmessage, it generates a route reply, and suppresses the RREQ. Node A receivesthe same RREQ via B and establishes a non-optimal path to S via B.
In our second experiment we check the extent of establishing non-optimalroutes. We use the query E[<=10000;26492](max:quality()), which is sim-ilar to (4), but instead uses a function quality that compares the length ofestablished routes with the length of the corresponding optimal routes.11
The results in Table 2 show that the average deviation from the optimallength (in %�) is small; which is to be expected in small networks. More inter-esting is that again DYMO performs less well than AODV. Again a potentialexplanation for this is the implication of path accumulation in DYMO. In theexample, node A establishes a (non-optimal) route to S, but because of pathaccumulation node A will also establish a non-optimal path to B (as well as allthe other nodes on this non-optimal path).
3.4 Networks of Realistic Size
In complex protocols used for routing, analysis by “classical” model checking islimited to around 8 nodes. WMNs usually consist of more than 50 nodes placingthem far beyond the capabilities of systematic logical analysis. In this sectionwe explore the scalability of SMC for such networks.10 An example is found at the website—it requires detailed knowledge of the protocols.11 The length of optimal routes can be calculated from the static network topology.
12 P. Höfner and A. McIver
3 nodes 4 nodes 5 nodesAODV 0.00%� 0.50%� 2.31%�DYMO 0.00%� 2.00%� 9.68%�
S
B
T ARREQ
RREQ
Table 2: Average deviation from theoptimal
Fig. 5: Node A “accidentally” cre-ates a non-optimal route to S.
Our first task is to generate a sample realistic topology. We use the NodePlacement Algorithm for Realistic Topologies (NPART) [12]. This tool allowsthe specification of arbitrary-sized topologies and transmission ranges, and ithas been shown that generated topologies have graph characteristics similar torealistic wireless multihop ones.
B
C
A
transmission range:
Fig. 6: A topology with 100 nodes
We analyse NPART topologiesconsisting of 25, 50, 75 and 100 nodes.Fig. 6 depicts the 100-node topologyused for our analysis. The links be-tween nodes are determined by thedistance between nodes; rather thandisplaying the actual 201 links, weinstead indicate the link distance byscale. The node labelled A is the orig-inator of two packets with destina-tions B and C, both of which are con-nected to A albeit at several hops dis-tance. We check Property (3), whichconfirms that both routes are foundand that the protocols terminates.More significant are the resources re-quired to perform the experiments forlarge networks which we report next.
A network with 25 nodes is easily checked with a standard desktop machinein less than half an hour with a confidence level of 95% (which means 738 runs).However the memory consumption grows with the number of nodes. A summaryof our observations is given in Table 3.
#nodes 50 75 100memory (Gb) 14 30 80run time (m) 270 328 1777
Table 3: Memory Consumption12
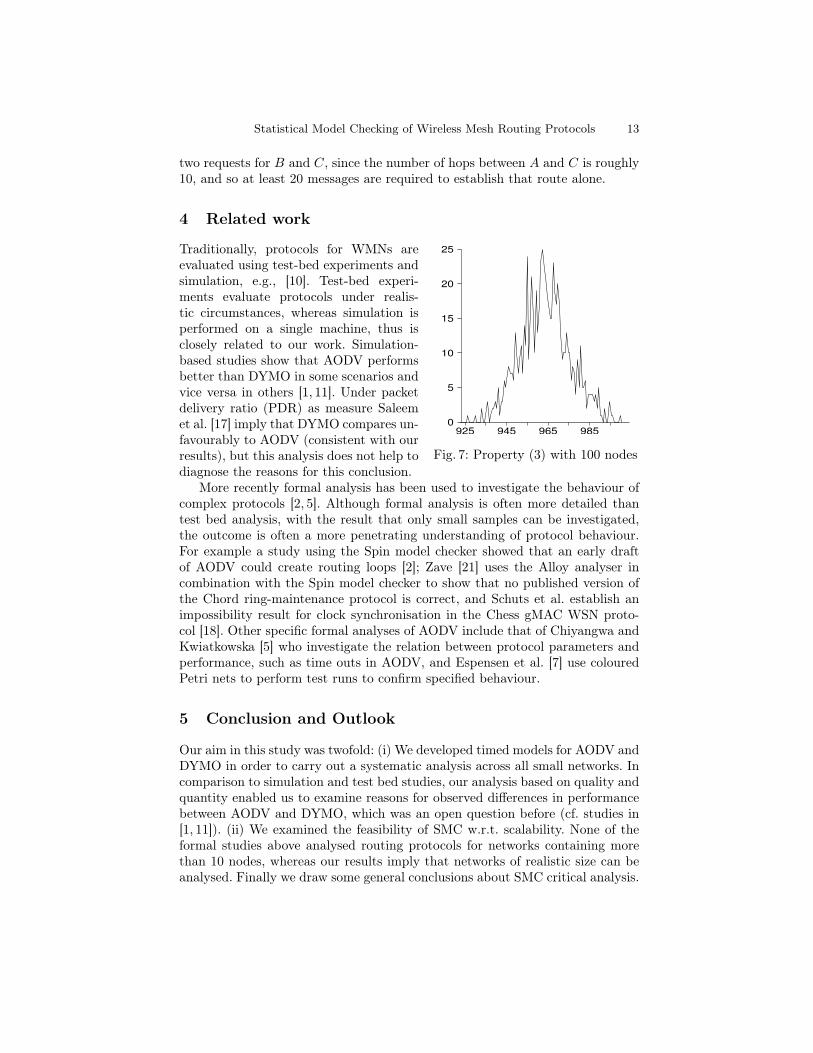
Fig. 7 shows that the protocol finishes on average within 24 × 40ms13 forthe given scenario. This also suggests that there is little interference between the
13 The average time for sending a single message.
Statistical Model Checking of Wireless Mesh Routing Protocols 13
two requests for B and C, since the number of hops between A and C is roughly10, and so at least 20 messages are required to establish that route alone.
4 Related work
925 945 965 985
0
5
10
15
20
25
Fig. 7: Property (3) with 100 nodes
Traditionally, protocols for WMNs areevaluated using test-bed experiments andsimulation, e.g., [10]. Test-bed experi-ments evaluate protocols under realis-tic circumstances, whereas simulation isperformed on a single machine, thus isclosely related to our work. Simulation-based studies show that AODV performsbetter than DYMO in some scenarios andvice versa in others [1, 11]. Under packetdelivery ratio (PDR) as measure Saleemet al. [17] imply that DYMO compares un-favourably to AODV (consistent with ourresults), but this analysis does not help todiagnose the reasons for this conclusion.
More recently formal analysis has been used to investigate the behaviour ofcomplex protocols [2, 5]. Although formal analysis is often more detailed thantest bed analysis, with the result that only small samples can be investigated,the outcome is often a more penetrating understanding of protocol behaviour.For example a study using the Spin model checker showed that an early draftof AODV could create routing loops [2]; Zave [21] uses the Alloy analyser incombination with the Spin model checker to show that no published version ofthe Chord ring-maintenance protocol is correct, and Schuts et al. establish animpossibility result for clock synchronisation in the Chess gMAC WSN proto-col [18]. Other specific formal analyses of AODV include that of Chiyangwa andKwiatkowska [5] who investigate the relation between protocol parameters andperformance, such as time outs in AODV, and Espensen et al. [7] use colouredPetri nets to perform test runs to confirm specified behaviour.
5 Conclusion and Outlook
Our aim in this study was twofold: (i) We developed timed models for AODV andDYMO in order to carry out a systematic analysis across all small networks. Incomparison to simulation and test bed studies, our analysis based on quality andquantity enabled us to examine reasons for observed differences in performancebetween AODV and DYMO, which was an open question before (cf. studies in[1, 11]). (ii) We examined the feasibility of SMC w.r.t. scalability. None of theformal studies above analysed routing protocols for networks containing morethan 10 nodes, whereas our results imply that networks of realistic size can beanalysed. Finally we draw some general conclusions about SMC critical analysis.
14 P. Höfner and A. McIver
5.1 Statistical Model Checking: Lessons Learned
Resourcing. One of the main bottlenecks in the analysis was time—to analysea 100 node network takes about 30 hours. One of the next steps is to determinewhether the most recent distributed release [3] is able to reduce that overhead.
Choosing the right scenario. For small networks it is possible to analyse alltopologies for given scenarios. This gives a good overall view of the performanceand behaviour in any situation. For large networks this is not feasible, and so theselection of topologies in combination with the right scenarios becomes some-thing of a “stab in the dark”.For our study we used the comparison of AODVand DYMO to observe that odd behaviour occur in the setting of two requests,thus we chose that scenario for our large networks. In general, a systematic ana-lysis of small networks can be used as a preliminary phase for selecting the mostinformative scenarios.
Interpreting the results. The results are frequently hard to interpret, partic-ularly when they indicate odd behaviour. Unfortunately SMC-Uppaal does notstore traces during analysis, thus it is not possible to recover counterexamples toexplain the observations. We tried to diagnose odd observations by formulatingmore probing queries beyond looking at overall performance. This suggests thatmore powerful statistical analysis such as “rare event simulation” in combinationwith multiple queries could be used to compile better evidence.
5.2 Future work
The models for AODV and DYMO are general enough to allow for the study ofmore complex scenarios, in particular mobility. In future work we will develop anumber of mobility models for understanding the behaviour of these and otherrouting protocols.
Acknowledgement. We are grateful to David Jansen and Frits Vaandragerfor helpful discussions, and to the NWO grant 040.11.302 for financial sup-port. NICTA is funded by the Australian Government as represented by theDepartment of Broadband, Communications and the Digital Economy and theAustralian Research Council through the ICT Centre of Excellence program.
References
1. Amin, M., Abrar, M., Khan, Z.U., Andusalam, Rizwan, S.: Comparison of OLSR& DYMO routing protocols on the basis of different performance metrics in mobilead-hoc networks. American Journal of Scientific Research (2011)
2. Bhargavan, K., Obradovic, D., Gunter, C.: Formal verification of standards fordistance vector routing protocols. J. ACM 49(4), 538–576 (2002)
3. Bulychev, P., David, A., Larsen, K., Legay, A., Mikučionis, M., Bøgsted Poulsen,D.: Checking and distributing statistical model checking. In: Goodloe, A., Person,S. (eds.) NASA Formal Methods (NFM’12). LNCS, vol. 7226, pp. 449–464. Springer(2012)
Statistical Model Checking of Wireless Mesh Routing Protocols 15
4. Bulychev, P., David, A., Larsen, K., Mikučionis, M., Bøgsted Poulson, D., Legay,A., Wang, Z.: UPPAAL-SMC: Statistical model checking for priced timed au-tomata. In: Wiklicky, H., Massink, M. (eds.) Quantitative Aspects of ProgrammingLanguages. EPTCS, vol. 85, pp. 1–16. Open Publishing Association (2012)
5. Chiyangwa, S., Kwiatkowska, M.: A timing analysis of AODV. In: Formal Methodsfor Open Object-based Distributed Systems (FMOODS’05). LNCS, vol. 3535, pp.306–322. Springer (2005)
6. Edenhofer, S., Höfner, P.: Towards a rigorous analysis of AODVv2 (DYMO). In:Rigorous Protocol Engineering (W-RiPE’12). IEEE Press (2012)
7. Espensen, K., Kjeldsen, M., Kristensen, L.: Modelling and initial validation of theDYMO routing protocol for mobile ad-hoc networks. In: van Hee, K.M., Valk, R.(eds.) Applications and Theory of Petri Nets (PETRI NETS’08). LNCS, vol. 5062,pp. 152–170. Springer (2008)
8. Fehnker, A., van Glabbeek, R.J., Höfner, P., McIver, A., Portmann, M., Tan, W.L.:Automated analysis of AODV using UPPAAL. In: Flanagan, C., König, B. (eds.)Tools and Algorithms for the Construction and Analysis of Systems (TACAS’12).LNCS, vol. 7214, pp. 173–187. Springer (2012)
9. van Glabbeek, R.J., Höfner, P., Tan, W.L., Portmann, M.: Sequence num-bers do not guarantee loop freedom—AODV can yield routing loops (2012),http://rvg.web.cse.unsw.edu.au/pub/AODVloop.pdf
10. Johnson, D., Lysko, A.: Comparison of MANET routing protocols using a scaledindoor wireless grid. Mob. Netw. Appl. 13(1-2), 82–96 (2008)
11. Kum, D.W., Park, J.S., Cho, Y.Z., Cheon, B.Y.: Performance evaluation of AODVand DYMO routing protocols in MANET. In: Consumer Communications andNetworking Conference (CCNC’10). pp. 1046–1047. IEEE Press (2010)
12. Milic, B., Malek, M.: NPART—node placement algorithm for realistic topologies inwireless multihop network simulation. In: Simulation Tools and Techniques (Simu-tools ’09). pp. 9:1–9:10. ICST (2009)
13. Miskovic, S., Knightly, E.: Routing primitives for wireless mesh networks: Design,analysis and experiments. In: Conference on Information communications (INFO-COM’10). pp. 2793–2801. IEEE Press (2010)
14. Perkins, C., Belding-Royer, E., Das, S.: Ad hoc on-demand distance vector (AODV)routing. RFC 3561 (Experimental) (2003), http://www.ietf.org/rfc/rfc3561
15. Perkins, C., Chakeres, I.: Dynamic MANET on-demand (AODVv2) routing. IETFInternet Draft (Work in Progress) (March 2012), http://tools.ietf.org/html/draft-ietf-manet-dymo-22
16. R Core Team: R: A Language and Environment for Statistical Computing (2012),http://www.R-project.org
17. Saleem, M., Khayam, S.A., Farooq, M.: On performance modeling of ad hoc routingprotocols. EURASIP J. Wirel. Commun. Netw. 2010, 31:1–31:13 (2010)
18. Schuts, M., Zhu, F., Heidarian, F., Vaandrager, F.: Modelling clock synchronizationin the Chess gMAC WSN protocol. In: Andova, S., McIver, A., D’Argenio, P.,Cuijpers, P., Markovski, J., Morgan, C., Núñez, M. (eds.) Quantitative FormalMethods: Theory and Applications (QFM’09). EPTCS, vol. 13, pp. 41–54 (2009)
19. Sen, K., Viswanathan, M., Agha, G.A.: Vesta: A statistical model-checker and ana-lyzer for probabilistic systems. In: Quantitative Evaluaiton of Systems (QEST’05).pp. 251–252. IEEE Press (2005)
20. Younes, H.: Verification and Planning for Stochastic Processes with AsynchronousEvents. Ph.D. thesis, Carnegie Mellon University (2004)
21. Zave, P.: Using lightweight modeling to understand CHORD. SIGCOMM Comput.Commun. Rev. 42(2), 49–57 (2012)


