Embed Size (px)
Citation preview

Macromol. Chern. Phys. 195, 1257-1271 (1994) 1257
Shear influence on the phase separation of oligomer blends
Edvani C. Muniz
Universidade Estadual de Maringa, Maringa-PR, Brazil
Suzana I? Nunes*
Universidade Estadual de Campinas, Institute of Chemistry, 13081 Campinas-SP, Brazil
B. A. Wolf*
Universitat Mainz, Institut fur Physikalische Chemie, D-55099 Mainz, Germany
(Received: June 6, 1993; revised manuscript of July 20, 1993)
SUMMARY Shear influences on the phase separation behaviour of four different blends of ethylene
glycol/propylene glycol oligomers, exhibiting upper critical solution temperatures, were investigated. Cloud point curves at rest (turbidity measurements) are reported for all systems, spinodal conditions (light scattering) and tie-lines (analysis of the coexisting phases) are given for some examples. Phase diagrams under shear were obtained from rheological data. They demonstrate that the demixing temperatures of systems where both glycols bear OH end-groups are lowered up to ca. 1 "C by shear rates of 1 OOO s - l ; the critical composition, generalized to the non-equilibrium conditions of flow, is markedly shifted. These observations are explained in terms of the generalized Gibbs energy (containing the mechanical energy the system stores during flow) as a consequence of the strongly interacting end-groups of the glycols. This interpretation is backed by the fact that the shear effects disappear when the glycols are methylated.
Introduction
When polymer blends are processed, they are subjected to considerable shear rates. Therefore, besides the investigation of polymer miscibility and phase behavior in equili- brium, it is important to know the effect of shearing forces. Many studies have been made describing shear demixing or shear dissolution in polymer blends and polymer solutions I-'*). This has been mainly discussed in terms of entropy elasticity, i. e. attributed to entanglement and disentanglement processes. Changes up to 30 K have been observed in the phase separation temperatures9) with a minimum shear rate of 10 s - ' . In low-molecular-weight liquids 1 3 ) , temperatures are shifted by ca. lo-' K even with shear rates larger than lo3 s-I. Nothing, however, is known on the behavior of oligomer mixtures. The present study was undertaken to fill the gap. In order to test the typical behavior and to see whether specific effects are observed in the case of strongly interacting end groups, oligomeric ethylene glycol/propylene glycol blends (bearing OH end groups) and the corresponding methylated system were studied. It will be shown that in the case of the glycols the shear influence is no purely entropic phenomenon and that enthalpic considerations have also to be taken into account.
@ 1994, Huthig & Wepf Verlag, Base1 CCC 1022-1 352/94/$08.00

1258 E. C. Muniz, S. P. Nunes, B. A. Wolf
Materials
Oligomeric ethylene glycol (EG) was kindly supplied by Atlas S.A., SHo Paulo, and character- ized by gel permeation chromatography (GPC). The subscripts in the following abbreviationsgive the number of monomeric units the oligomers contain. EG,, (M, = 558 g/m_ol, &f,,,/M,, = 1,09), EG,, (u,, = 798 g/mol, Mw/M,, = 1,lO) and EG,, (a,, = 1201 g/mol, Mw/M,, = 1,14). Dimethylated oligomeric ethylene glycol EG,,M (M,, = 865 g/rnol, &?,,,/a,, = 1,05) was kindly supplied by Hoechst, Burgkirchen, Germany. Oligorneric propylene glycol PG,, (M, = 1086 g/rnol, a,/%, = 1,17) was kindly supplied by Dow Quimica, SHo Paulo. Dimethylated oligomeric propylene glycol PGI8M was prepared in the laboratory (a,, = 1 134 g/mol, Mw /a,, = 1, lO) using the method described by Cooper et al.14).
Results and discussion
Phase diagram at non-shearing conditions
Cloud point and “dark point” curves
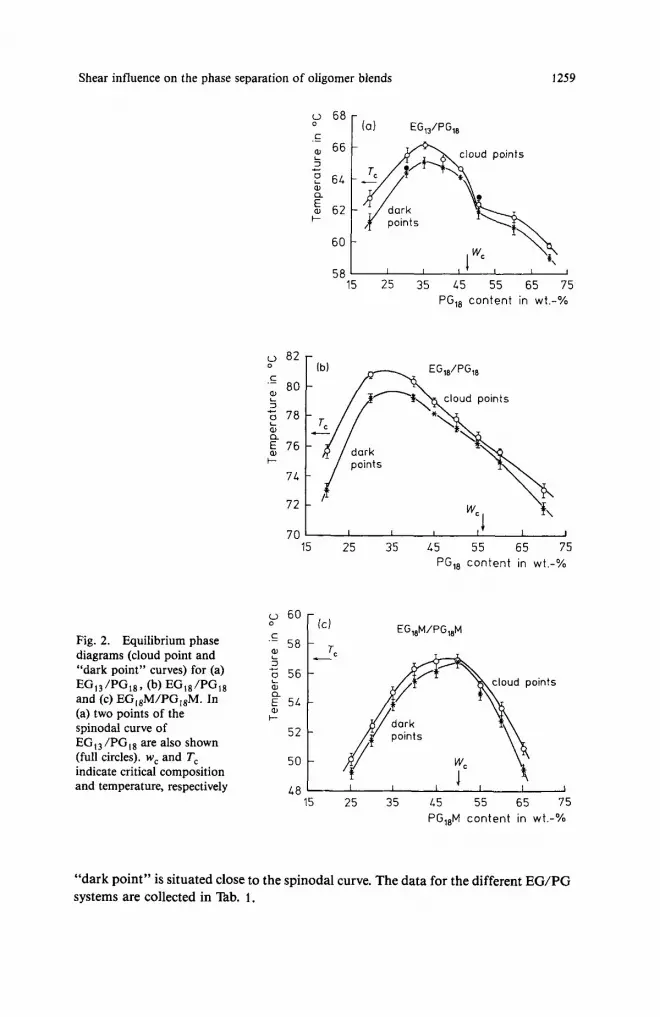
Cloud point temperatures ( cp) were obtained for different EG/PG compositions by a method analogous to that described by Schmidt and Wolf 15). The transmitted light from a 8 mW light-emitting diode across a 5 mm thick layer of the polymer blend was measured by a photodiode connected to a x-t register. The sample temperature was decreased at a rate of 0,2”C/min, controlled by a Mettler MF 15 equipment and a thermocouple (0,Ol “C precision). cp was obtained from the inflection point of the intensity of the transmitted light as a function of temperature. By extrapolation of the part of the curve corresponding to T > cp to the condition of minimal transmitted light, as shown in Fig. 1 , a “dark point” can be determined. This “dark point” does not necessarily coincide with the spinodal temperature since the turbidity may remain finite in the former case, whereas it becomes infinitely large in the latter. The phase diagrams for the EG,,/PG,,, EG,,/PG,, and EG,,M/PG,,M systems are shown in Fig. 2.
The critical composition of the systems at rest was estimated from the minima in plots of the difference between the cloud point and the “dark point” temperatures (Fig. 3) as a function of composition. This evaluation rests on the assumption that the cloud point coincides with the starting point of one branch of the binodal curve and the
n ” 59 60 61 62 63 6 1 65 66 67
Temperature in “C
Fig. 1. Determination of cloud point temperatures (Tcp) and “dark point” tem- peratures (Tdp)
Shear influence on the phase separation of oligomer blends 1259
Fig. 2. Equilibrium phase diagrams (cloud point and “dark point” curves) for (a)
and (c) EG,,M/PG,,M. In (a) two points of the spinodal curve of EG,,/PG,, are also shown (full circles). w, and T, indicate critical composition and temperature, respectively
EG,,/PGi,, (b) E G I , / P G ~ ~
L ._
Q
5 62- dark points
60 -
I I I I 5a 15 25 35 15 55 65 75
PG,, content in wt.-%
L 3 2 78 aJ
7 6 a, t-
7 1
72
70 I I I I , t I I
15 25 35 15 55 65 75 PGI8 content in wt.-%
y 60
’- 58 2 C
56 aJ
f 51 t-
52
50
1 8 15 25 35 15 55 65 75
PG,,M content in wt.-%
“dark point” is situated close to the spinodal curve. The data for the different EG/PG systems are collected in lhb. 1 .

1260 E. C. Muniz, S. P. Nunes, B. A. Wolf
10 30 50 70 90 PG content in wt.-%
Fig. 3. Differences between the cloud point and the “dark point” temperatures as a function of com- position for the indicated systems to determine their critical composition
’Rib. 1. (i. e. under shear) obtained from maxima in flow activation energy for different shear rates
Critical composition at rest (obtained from Fig. 3) and generalized critical composition
Blend ~~
Critical composition in wt.-Vo of PG at a shear rate of
0 64 258 648 1ms-’
EG 13 lPG 18 48 45 45 45 40
EG28 lPG I8 65 56 55 52 51 EG 18 /PG 18 55 50 50 48 45
EG 1 ,M/PG 1 EM 50 50 50 50 50
For strictly binary systems the critical point is found on the top of the phase diagram where the binodal and spinodal curves touch each other. It is the point at which the two coexisting phases become identical and the second and third derivative of the free Gibbs energy as a function of composition are zero. The EG/PG methylated systems have a symmetrical phase diagram with the critical point at its maximum, as shown in Fig. 2c. With the non-methylated EG/PG blends, however, one observes the pro- nouncedly asymmetric cloud point curves shown in Figs. 2a and 2 b. The critical points

Shear influence on the phase separation of oligomer blends 1261
do not coincide with the maxima of the curves. These characteristics have been explained theoretically 16) for polydisperse systems. Furthermore it is expected that end-group effects, leading to a particularly concentration-dependent interaction parameter g, play an important role for EG/PG blends.
Coexistence curves
Homogeneous blends of EG,, and PG,, with initial PG contents of 50 wt.-Vo and 35 wt.-Vo were cooled down to two-phase conditions and kept at a constant controlled temperature for approximately 3 days. This time is enough for the complete separation of two transparent phases. The final composition of each phase was determined by measuring its refractive index at 70°C and by means of a calibration curve. The resulting coexistence curves are shown in Fig. 4. They demonstrate that, because of the polydispersity of the components, though it is low, cloud point and coexistence curves do not coincide. For EG,,/PG,, a 50 wt.-Vo mixture is not far from the critical con- centration since the sol and gel branch of the coexistence curve almost tough each other for this initial composition. When the initial composition is 35 wt.-Vo PG, i. e. identical with that of the precipitation threshold, the concentrations of the first separable gel and sol phase differ from each other even at the highest temperature, where the segregation of a second phase just commences. This finding corroborates the position of the critical point on the cloud-point curve resulting from the turbidity measurements.
Fig. 4. Cloud point curve (- o -) for the system EG,,/PG,, and coexistence curves for 50 wt.-Vo (- - - -) and 35 wt.-Vo PG (- . - A - . -) starting composition
y 70
C
a, 3
.- L
60 a, Q
i + 50
LO
30 0 20 LO 60 80 100
PG content in wt.-%
Spinodal temperatures
The spinodal temperatures for EG,,/PG,, blends with 50 wt.-Vo and 30 wt.-Vo initial PG contents were evaluated by light scattering (cf. refs. 17, I , ) ) , using a method described in the literature 19*20) and a simple equipment constructed in the laboratory.

1262 E. C. Muniz, S. P. Nunes, B. A. Wolf
The system consists of a He-Ne laser as radiation source and a photodiode as detector attached to a goniometer and connected to a microcomputer by an A/D interface, which measures the light scattered by the sample at different angles. The 0,s mm thick sample (total volume = ca. 6 pL) is held in a small oven connected to a Mettler MF15 temperature controller. The sample is rapidly quenched down to different temperatures in the two-phase region of the phase diagram.
By this proceeding, phase separation is expected to occur via spinodal decomposi- tion. A light scattering ring pattern is observed and the photodiode gives the scattered light intensity as a function of q, the magnitude of the scattering vector, which is a function of the angle 0
q = (4n/L) sin(W2) (1)
where 1 is the light wavelength.
intensity, I , at each angle increases exponentially with time, t. The initial stages of phase separation follow the linear Cahnz') theory and the
I(q, t ) - expPR(q)tI (2)
R (q) is the growth rate of concentration fluctuations having a wave number q. According to the linear theory, the intercept of q = 0 for a plot of R ( q ) q 2 as a function of q2, as shown in Fig. 5 for a 1 : 1 blend (by weight) of EG and PG, gives the apparent diffusion coefficient Dapp, which characterizes the dynamics of phase separation.
Dapp is directly connected to 0, the self-diffusion coefficient for the translation of polymers, and to the thermodynamic conditions as formulated in Eq. (3). It is zero at the spinodal temperature and becomes negative (its module increases) as the penetra- tion into the instable range of the phase diagram proceeds.
Dapp - D[(X(T) - xsp)/xspl (3)
where x ( T ) is the Flory-Huggins interaction parameter at the quenching temperature T, and
Dapp - T. [T - rspl (4)
0
Fig. 5. Determination") of the apparent diffusion coefficient Dapp for different temperatures from plots of R (q)/q2 as a func- tion of q2

Shear influence on the phase separation of oligomer blends 1263
Fig. 6. Temperature dependence of the apparent diffusion coeffi- cient Dapp to obtain the spinodal temperature for the indicated compositions of the system EG I 3 /PG18 0
58 60 62 61 Temp. in O C
The spinodal temperature, cp, can be then obtained by extrapolation D,,,(T) to Dapp = 0, as shown in Fig. 6, assuming a linear variation of x with T i n the small interval of interest. For the 50 wt.-Vo EG,,/PG,, blend a value of 62,6"C was obtained for the spinodal temperature, and for 30 wt.-Vo PG, cp = 64,6"C. This is very close to the corresponding "dark points", which are 61,9 k 0,4 "C and 64,3 k
0,3 "C, respectively.
Rheological behavior
Viscosity measurements were performed in a Contraves Rheomat 115/Rheoscan 100 Rheometer with a wide-gap concentrical cell. The viscosity of EG/PG blends was measured at constant shear rates decreasing the temperature at a rate of 0,2 "C/min from 10 "C above the phase separation to 3 "C below. The temperature was measured by a thermocouple directly connected to the measuring cell, and each measurement was repeated 5 times for the same sample. Typical curves are presented in Fig. 7.
Fig. 7. Temperature depen- dence of the viscosity q at a shear rate of 64 s-' for two blends of EG,, and PG,, with 50 and 35 wt.-% of PG, respectively. The maximum and the discontinuity indi- cate phase separation
6 L 5.'
5 wt.-% PG
30 t 60 62 61 66 68 70
Temperature in O C

1264 E. C. Muniz, S. P. Nunes, B. A. Wolf
Flow activation energies
For the present systems, exhibiting miscibility gaps, the flow activation energy E, shows some peculiarities as one approaches the critical conditions. Critical phenomena have been described for a wide variety of systems in the l i t e r a t ~ r e ~ ~ - ~ ~ ) . Theories explain the critical point in the liquid-gas and liquid-liquid phase separation, and in magnetic-phase transitions, which resemble each other strikingly. In a homogeneous polymer blend, the concentration fluctuations become anomalously large and strongly correlated near the critical point. Naively one can interpret this situation as motion of very large clusters or networks that can be seen in the concentration and tempera- ture dependence of E, . The additional dissipation of energy near the phase separa- tion, as reported and discussed in the literature, results from that fact 26-28).
The activation energies shown in the Figs. 8 and 9 were obtained from the slope of the viscosity curves as a function of temperature following Arrhenius according to
E, /R = d Inr]/d(l/T) = - (T2/r])(dq/dT) (5)
- .- - 0
E 50 7 Y \ - lu"
LO
30
20
EG13/PG,, 6L s-' I
Fig. 8. Flow activation energies E, of the system EG,,/PGI8 as a function of composition for different temperatures and a constant shear rate of 64 s - '
15 25 35 L5 55 65 PG,, c o n t e n t in wt.-%
c r - g 5 0 - 7 Y \ - b" LO -
30 -
20 - 15 25 35 L5 55 65 75
PG,, c o n t e n t in wt.-%
EG13/PG18 66.8OC c r - EG13/PG18 g 5 0 - 7 Y \ - b" LO -
30 -
20 15 25 35 L5 55 65 75
PG,, c o n t e n t in wt.-%
Fig. 9. Flow activation energies E, of the system EGl,/PG18 as a function of composition for a constant temperature of 66,8 "C, which is 0,5 "C higher than the precipitation threshold, and two shear rates

Shear influence on the phase separation of oligomer blends 1265
E, increases as one approaches phase separation. At the critical composition, there is a maximum in the activation energy as reported in the literature2'), here it was used to determine the generalized critical composition for flowing systems shown in Tab. 1. A second maximum can be observed in Fig. 9 for EG,,/PG,, at lower EG concentra- tions. This should be caused by the abnormal concentration dependence of the interaction parameter g. Under such conditions, the spinodal curve may have two maxima as reported in the literature'6), and it is probably at this composition that the second maximum in the activation energy shows up. In both cases the reason for this
c ._
E 6 6
? I
6 L E aJ L
' 62
6 0
t 30 LO 5 0 60
PG,, content in wt.-%
!? 58 ._ a,
5 56
a 5 1
c Fig. 10. Central portions of the
points) and under shear (shear phase diagrams at rest (cloud
rates 64 and loo0 s - l ) for (a) 5i EGl,/PGl,, (b) EG,,/PGl, and c
0 a, L
(c) EG,,M/P~,,M. The critical 52 compositions at rest are indi-
50 cated on the abscissa
30 LO 50 60 PG,, content in wt.-%
EG18M/PG18M - (c)
2 30 LO 50 60
PGl8M content in wt.-%

1266 E. C. Muniz, S. P. Nunes, B. A. Wolf
extremum is the same: in the vicinity of the spinodal conditions, where the second derivative of the Gibbs energy as a function of composition becomes zero, concentra- tion fluctuations are particularly pronounced and the characteristic relaxation times of the system assume large values (critical slowing down) so that the activation energy rises.
A noteworthy feature of the present results is the influence of shear on the composi- tion of the maxima in the activation energy, which is principally different for the non- methylated and the methylated systems. In the former case (Fig. 9) the position of the higher maximum is markedly shifted, whereas it remains constant in the latter.
Phase diagrams under shear
If the composition of the solution is near critical, the entrance into the two-phase region is indicated by a pronounced viscosity maximum. For compositions far from critical, the maximum is less evident and the phase separation can be only detected by a discontinuity in the curve. From these data, the phase diagrams for different shear rates presented in Fig. 10 were obtained, the indicated errors correspond to the maximum uncertainty in fixing the discontinuities of the maxima in q ( T ) of Fig. 7.
Viscosity as a function of composition
As can be seen from Fig. 7, it is possible to perform reproducible measurements also under two-phase conditions. This stationary subdivision of the droplets of the coexisting phases in the shear field can be realized irrespective of a spinodal or binodal mechanism of phase separation. Fig. 11 shows how the viscosity varies with composi- tion at different temperature within the homogeneous and the heterogeneous regions of the system EG,,/PG,,, respectively. Similar curves are obtained for the other systems.
Fig. 1 1 . Concentration de- pendence of the viscosity of the system EG,,/PG,, at 1 OOO s-I. For T < 70°C these curves pass through the two-phase region; the dashed curve, indicating the boun- dary line between the homo- geneous and the heterogeneous mixture, was obtained by reading for each temperature the cloud point composition from Fig. 4
0 20 LO 60 80 100 PG content in wt.-%

Shear influence on the phase separation of oligomer blends 1267
Near the critical temperature only one maximum is observed. The maximum appears near the critical composition. At lower temperatures two maxima occur. Anomalous behaviours were described in a number of papers dealing with the concentration dependence of the melt viscosity of polymer mixture^^^,^^). In most cases they were attributed to the appearance of two phases. Lipatov et al. 30) reported examples for which viscosity maxima coincide with minima in the Flory-Huggins interaction para- meter.
The present viscosity maxima can be rationalized in terms of the phase diagram; to this end the viscosities corresponding to the conditions of the cloud-point curves of the stagnant solutions (Fig. 2) are also indicated in Fig. 11. The viscosity maxima are always observed close to the corresponding dark points, i. e. close to the border line between the metastable and the instable region of the phase diagram. This suggests that they may be connected to the spinodal conditions. De Gennes22) has shown that the correlation function of the concentration fluctuations diverges near the spinodal in a way similar to that at the critical point. The correlation length [ varies with x - xsp , the deviation of the interaction parameter from its value at the spinodal condition, according to
r - (xsp - x)-"2
At the spinodal the correlation length becomes infinitely large. Within the metastable region of the phase diagram spherical domains of one phase are dispersed in the matrix of the other. The viscosity is similar to that of the pure components. Measurements of viscosity as a function of composition, when the component viscosities are not very different from each other, could then provide an opportunity for the estimation of the spinodal temperatures. Theoretical relations for an increase of viscosity due to density fluctuation near the spinodal are described in the l i t e r a t ~ r e ~ ' - ~ ~ ) . However, viscosity peaks should not always be related to spinodal conditions. For instance, for solutions of aniline and cyclohexane a peak appears more than 21 "C above the critical tempera- t ~ r e ~ ~ ) .
Shear influence on phase separation
Generalized critical points (i. e. under shear) were estimated from the position of the higher maximum in the flow activation energy as a function of concentration. They are listed in Tmb. 1. For the methylated system these values do not change with increasing shear rates, in contrast to the non-methylated EG/PG blends where a shift towards lower PG contents is observed.
Rangel-Nafaile and Co-workers6) predicted for high-molecular-weight polymer systems, for which the phase diagrams near the critical point can be fitted by a parabola, that the critical composition, pc, should not change under shear. The approximation is however not valid for the EG/PG systems. Beysens and co- workers13) observed that pc also does not change under shear for low-mole- cular-weight mixtures such as nitrobenzene/hexane, although a small change in critical temperature was detected. In order to explain the shear influence on phase separation in such low-molecular-weight systems, they assume that spherical concentration

1268 E. C. Muniz, S. P. Nunes, B. A. Wolf
m : 28 ._
fluctuations are shifted as the system flows. Therefore, shear destroys the correlations in the flow direction, making the fluctuations anisotropic.
A shift of the maxima of demixing curves under shear has also been predicted 3). In this approach the shear influences on the phase separation of high-molecular-weight systems are explained by considering that the Gibbs energy of mixing under shear is the sum of its value at rest plus the energy stored during flow. Pronounced effects can be expected when: i) the stored energy is large, which is for instance the case with long chains; or ii) the G = f(p) curve is very shallow, which is true near the critical conditions, where the second derivative of G = f(p) is almost zero in a broad concen- tration range.
The entropically stored energy can be directly obtained from measurements of the elasticity or by a simpler indirect method using the flow curves (log q vs. logy plots) of non-newtonian systems4). A characteristic chain relaxation time can be estimated from the shear rate at which the system becomes non-Newtonian.
The phase separation of EG/PG is clearly influenced by shear, in contrast to the methylated systems, as is shown in Fig. 10. The effect is most pronounced for the EG,,/PG,, system near the critical composition. The molecular weight here is low and the stored energy cannot be a consequence of chain disentanglement. The system is Newtonian at least up to shear rates of 1 OOO s-l as shown by the flow curves in Fig. 12.
(1:l) EG,,/PG,, 81.2OC blend (weight ratio) of EG,, and
-
According to this information the characteristic viscometric relaxation time remains well below the order of a ms. In non-methylated EG/PG systems, chain association occurs via hydrogen bonds. Even when disturbed under stress, association will consequently be rapidly recuperated. For these systems the stored energy can be imagined as resulting from the ordering of associated molecules. Under shear they tend to be aligned, while forming rather random aggregates of higher entropy at rest. Despite the low values of the stored energy it can become effective if G(q) is shallow and this is actually the case near the critical composition.
Some other phenomena can, however, also effect the measured phase separation tem- perature under shear, as pointed out by Hindawi and co-workers 9): deformation and break-up of droplets of the dispersed phase, or viscous heating. The first two effects can be excluded since the actual measurements start from the one-phase condition. The

Shear influence on the phase separation of oligomer blends 1269
influence of shear on phase separation can also not be assigned to viscous heating since for very similar methylated systems, submitted to the same conditions, one does not observe changes in the phase diagram by shear.
Hydrogen bonds seem to play a special role for the different behaviour of methylated and non-methylated glycols; it may, therefore, be worthwhile to consider intermolec- ular interactions responsible; it appears feasible to assume that orientation can favor or disfavor the contact between groups of the molecule taking part in these interactions. The molecular alignment in the flow direction may also cause anisotropy in the interaction parameter; in other words, g may become different in the two directions (parallel or perpendicular to the flow).
Independent from the above considerations, the over-all Flory-Huggins interaction parameter (equilibrium conditions) can be evaluated from values of critical composi- tion 35).
AG/(RT) = (v, / r l ) InP, + (v2/r2) Inv2 + gv1v2 (7)
q, is the volume fraction of component i , and r , , the numbers of monomeric units, are for the present calculations taken to be the ratios of the molecular weight of component i and the weight of one ethylene glycol mer; g includes both, enthalpic and entropic (non-combinatorial) contributions. If one considers, in a rough approximation, that g depends on composition in a linear manner
g = go + g , v , (8)
the parameters go and g, can be easily obtained for the critical temperature for which
(9) i32AG/av: = a3AG/ag: = 0
as
where pic is the critical composition of component i. As shown in Tab. 2, g,, the critical interaction parameter does not vary with the
shear rate. On the other hand, the values of generalized critical temperature and composition change under shear. For a EG/PG system at a fixed composition, g itself
Tab. 2. Generalized critical interaction parameter, g, , for various shear rates
Shear rate in s - '
g, of the blend
EG I /PG EG 18 /PG 18 EG,, /PG 18 EG 1 8M/PG 18M
64 0,106 0,086 0,068 0,083 258 0.106 0,086 0,068 0,083 648 0,106 0,086 0,068 0,083
1 0 0,104 0,084 0,067 0,083

1270 E. C. Muniz, S. P. Nunes, B. A. Wolf
must consequently also change with shear rate. Molecular orientations that favor or disfavor the contacts between interactive groups in the molecules could be a plausible explanation. A reduction of the phase separation temperature that is beyond experi- mental error (+0,4 “C) and remarkably large in view of the low-molecular-weight nature of the components is measured at shear rates higher than ca. 750 g-’ near the critical composition, as shown in Fig. 13.
Fig. 13. Variation of the phase separation temperature of EG,, /PG,, blends contai- ning 45, 50 and 55 wt.-To PG
-1 I I I I J with shear rate
Shear rate f in s-’
0 200 400 600 800 1000
It can be anticipated that, unlike the situation with polymers, there exists a non- negligible enthalpy contribution td the stored energy in case of the OH-terminated oligomers. Such enthalpic effect should be expected in any system with strong specific interactions. The results shown here can be taken as an example for the necessity to consider both, enthalpy and entropy contributions in the theories dealing with shear influence on phase separation.
The authors thank CNPq, FAPESP and “DAAD/Stifterverband” for financial support.
’) A. Silberberg, W. Kuhn, Nature 170, 450 (1952) 2, J. W. Breitenbach, B. A. Wolf, Makromol. Chem. 117, 163 (1968) 3, B. A. Wolf, Macromolecules 17, 615 (1984) 4, H. Kramer-Lucas, H. Schenck, B. A. Wolf, Mukromol. Chem. 189, 1627 (1988) ’) R. Horst, B. A. Wolf, Macromolecules 25, 5291 (1992) 6, C. Rangel-Nafaile, A. B. Metzner, K. F. Wissbrun, Macromolecules 17, 1187 (1984) ’) E. Vrahopoulou-Gilbert, A. J. McHugh, Macromolecules 17, 2657 (1986) 8, J. D. Katsaros, M. F. Malone, H. H. Winter, Polym. Bull. (Berlin) 16, 83 (1986) 9, I. A. Hindawi, J. S. Higgins, R. A. Weiss, Polymer 33, 2522 (1992)
io) J. Lyngaae-Jargensen, K. Sandergaard, Polym. Eng. Sci. 27, 344 (1987) ’ I ) S. Frenkel, Pure Appl. Chem. 38, 117 (1974) 12) G. Elyashevich, Adv. Polym. Sci. 43, 205 (1982) 13) D. Beysens, M. Gbadamassi, B. Moncef-Bouanz, Phys. Rev. A 28, 2491 (1983) 14) D. R. Cooper, C. Booth, Polymer 18, 164 (1977)

Shear influence on the phase separation of oligomer blends 1271
Is) J. R. Schmidt, B. A. Wolf, Colloid Polym. Sci. 257, 1188 (1979) 16) R. Koningsveld, L. A. Kleintjens, H. M. Schoffeleers, Pure Appl. Chem. 39, 1 (1974) 17) Th. G. Scholte, Eur. Polym. J. 6, 1036 (1970) ”) M. Gordon, K. Kajiwara, PIaste Kautsch. 4, 245 (1972) ”) T. Inoue, T. Ougizawa, J. Macromol. Sci.-Chem. A26, 147 (1989) 20) T. Hashimoto, in “Current Topics in Polymer Science’: R. M. Ottenbrite, Ed., Hanser,
21) J. W. Cahn, J. Chem. Phys. 42, 93 (1965) ”) P.-G. de Gennes, “Scaling Concepts in Polymer Physics’: Cornell University Press, Ithaca
23) L. Leibler, Encycl. Polym. Sci. Eng. 11 , 30 (1988) 24) H. E. Stanley, Encycl. Polym. Sci. Eng. 4, 323 (1988) 2 5 ) B. A. Wolf, M. C. Sezen, Macromolecules 10, 1010 (1977) 26) W. Ostwald, Ko“oid-2. 12, 213 (1913) 27) M. J. Fixman, J. Chem. Phys. 36, 310 (1962)
2y) C. Vinogradov, A. Y. Malkin, V. N. Kuleznev, V. F. Larionov, Kolloid 2. Z. Polym. 28, 809
30) Y. S. Lipatov, A. E. Nesterov, V. F. Shumsky, T. D. Ignatova, A. N. Gorbatenko, Eur. Polym.
3 1 ) L. I. Manevich, V. S. Mitlin, A. Haginyan, Khim. Fiz. 3, 283 (1984), cited in L. A. Utracki,
32) P.-G. de Gennes, J. Chem. Phys. 72, 4756 (1980) 33) L. Leibler, Macromolecules 13, 1602 (1980) 34) J. Brunet, K. E. Gubbins, 7ians. Faraday Soc. 65, 1255 (1969) 35) A. Friday, D. R. Cooper, C. Booth, Polymer 18, 171 (1977)
Miinchen, Wien 1987, p. 199
1979
J. K. Rigler, B. A. Wolf, J. W. Breitenbach, Angew. Makromol. Chem. 57, 15 (1977)
(1 966)
J. 18, 981 (1982)
‘%lymer Alloys and Blends’: Hanser Publisher, Munchen, Wien 1989


