Embed Size (px)
Citation preview

UC San DiegoUC San Diego Previously Published Works
TitleShear Behavior of Exterior Non-Isolated Shear Keys in Bridge Abutments
Permalinkhttps://escholarship.org/uc/item/4q12z7k7
JournalACI STRUCTURAL JOURNAL, 117(2)
ISSN0889-3241
AuthorsKottari, AlexandraShing, P BensonBromenschenkel, Ron
Publication Date2020-03-01
DOI10.14359/51721317 Peer reviewed
eScholarship.org Powered by the California Digital LibraryUniversity of California
225ACI Structural Journal/March 2020
ACI STRUCTURAL JOURNAL TECHNICAL PAPER
Exterior shear keys are used in bridge abutments to provide lateral restraints to the bridge superstructure under normal service loads and moderate earthquake forces. They also serve as a structural fuse to protect the abutment piles from damage in the event of a major earthquake. These shear keys are conventionally constructed monolithic with the stem walls in bridge abutments and are referred to as non-isolated shear keys. Past experimental data have shown that the failure of these shear keys under lateral seismic forces tends to be governed by diagonal shear cracks in the stem walls. This type of failure can be sudden, resulting in non-ductile behavior and costly post-earthquake repairs. This paper presents a design method that prevents the diagonal shear failure of the stem wall and allows for a more predictable failure mechanism governed by the horizontal sliding of the shear key. Analytical formulas are presented for design. The design method has been validated by the tests of three shear key-stem wall assemblies.
Keywords: bridge abutment; concrete cracks; diagonal cracks; monolithic; non-isolated; shear keys; shear sliding.
INTRODUCTIONExterior shear keys are used in bridge abutments to restrain
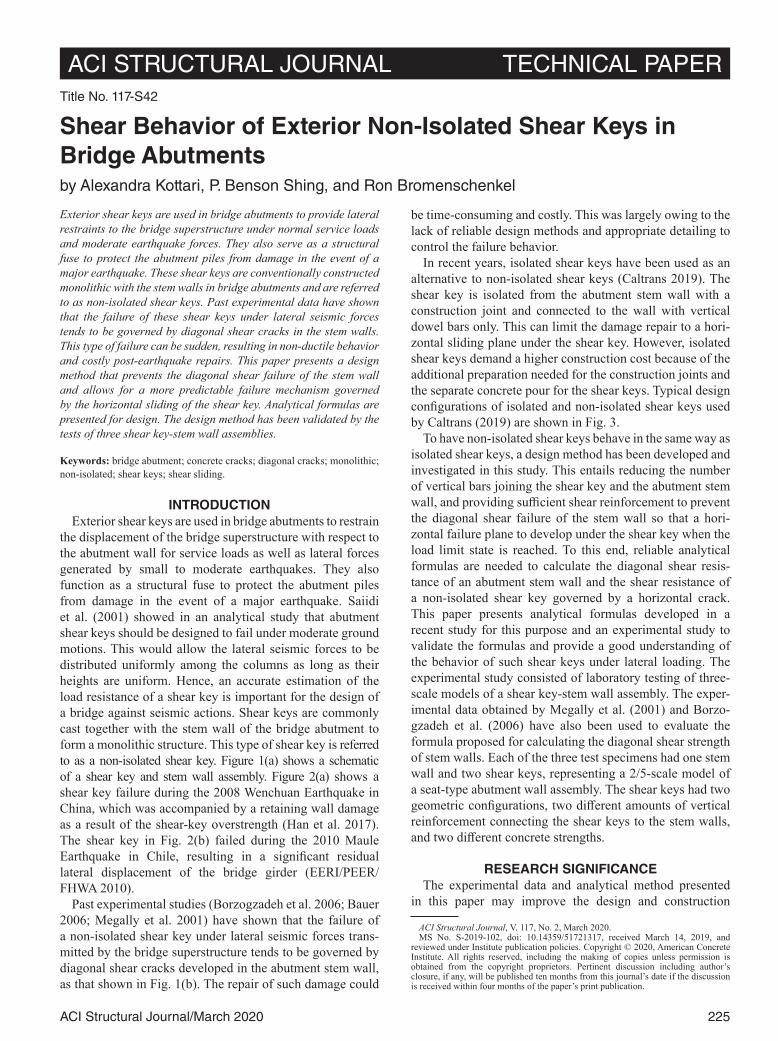
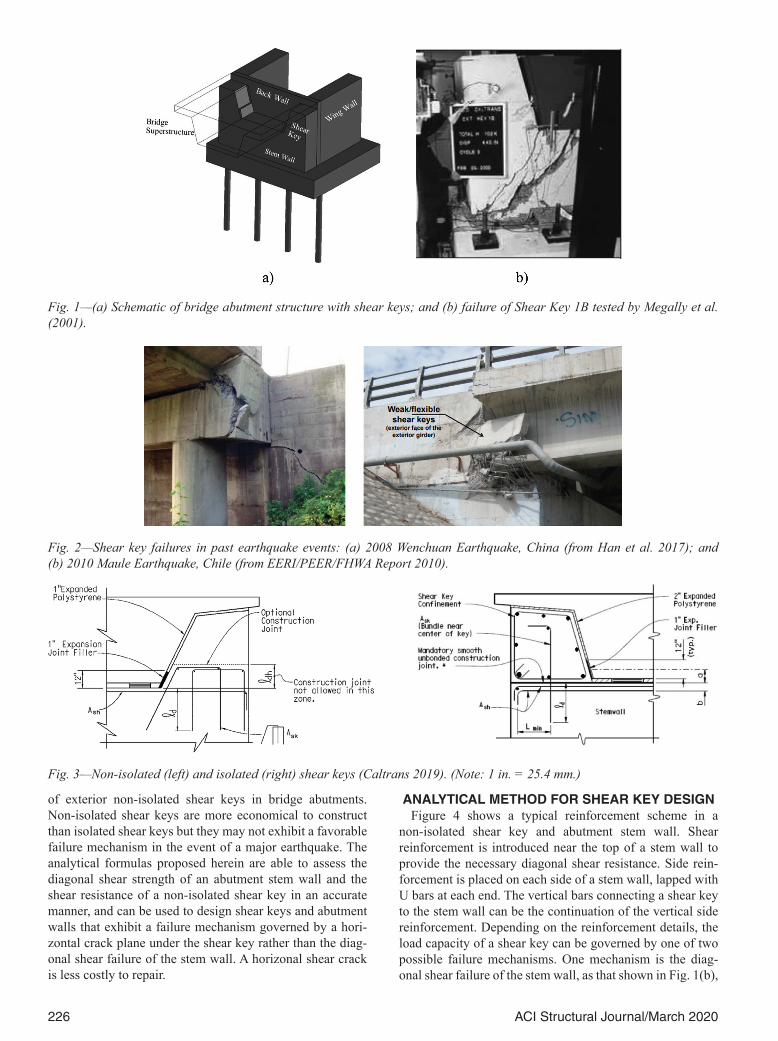
the displacement of the bridge superstructure with respect to the abutment wall for service loads as well as lateral forces generated by small to moderate earthquakes. They also function as a structural fuse to protect the abutment piles from damage in the event of a major earthquake. Saiidi et al. (2001) showed in an analytical study that abutment shear keys should be designed to fail under moderate ground motions. This would allow the lateral seismic forces to be distributed uniformly among the columns as long as their heights are uniform. Hence, an accurate estimation of the load resistance of a shear key is important for the design of a bridge against seismic actions. Shear keys are commonly cast together with the stem wall of the bridge abutment to form a monolithic structure. This type of shear key is referred to as a non-isolated shear key. Figure 1(a) shows a schematic of a shear key and stem wall assembly. Figure 2(a) shows a shear key failure during the 2008 Wenchuan Earthquake in China, which was accompanied by a retaining wall damage as a result of the shear-key overstrength (Han et al. 2017). The shear key in Fig. 2(b) failed during the 2010 Maule Earthquake in Chile, resulting in a significant residual lateral displacement of the bridge girder (EERI/PEER/FHWA 2010).
Past experimental studies (Borzogzadeh et al. 2006; Bauer 2006; Megally et al. 2001) have shown that the failure of a non-isolated shear key under lateral seismic forces trans-mitted by the bridge superstructure tends to be governed by diagonal shear cracks developed in the abutment stem wall, as that shown in Fig. 1(b). The repair of such damage could
be time-consuming and costly. This was largely owing to the lack of reliable design methods and appropriate detailing to control the failure behavior.
In recent years, isolated shear keys have been used as an alternative to non-isolated shear keys (Caltrans 2019). The shear key is isolated from the abutment stem wall with a construction joint and connected to the wall with vertical dowel bars only. This can limit the damage repair to a hori-zontal sliding plane under the shear key. However, isolated shear keys demand a higher construction cost because of the additional preparation needed for the construction joints and the separate concrete pour for the shear keys. Typical design configurations of isolated and non-isolated shear keys used by Caltrans (2019) are shown in Fig. 3.
To have non-isolated shear keys behave in the same way as isolated shear keys, a design method has been developed and investigated in this study. This entails reducing the number of vertical bars joining the shear key and the abutment stem wall, and providing sufficient shear reinforcement to prevent the diagonal shear failure of the stem wall so that a hori-zontal failure plane to develop under the shear key when the load limit state is reached. To this end, reliable analytical formulas are needed to calculate the diagonal shear resis-tance of an abutment stem wall and the shear resistance of a non-isolated shear key governed by a horizontal crack. This paper presents analytical formulas developed in a recent study for this purpose and an experimental study to validate the formulas and provide a good understanding of the behavior of such shear keys under lateral loading. The experimental study consisted of laboratory testing of three-scale models of a shear key-stem wall assembly. The exper-imental data obtained by Megally et al. (2001) and Borzo-gzadeh et al. (2006) have also been used to evaluate the formula proposed for calculating the diagonal shear strength of stem walls. Each of the three test specimens had one stem wall and two shear keys, representing a 2/5-scale model of a seat-type abutment wall assembly. The shear keys had two geometric configurations, two different amounts of vertical reinforcement connecting the shear keys to the stem walls, and two different concrete strengths.
RESEARCH SIGNIFICANCEThe experimental data and analytical method presented
in this paper may improve the design and construction
Title No. 117-S42
Shear Behavior of Exterior Non-Isolated Shear Keys in Bridge Abutmentsby Alexandra Kottari, P. Benson Shing, and Ron Bromenschenkel
ACI Structural Journal, V. 117, No. 2, March 2020.MS No. S-2019-102, doi: 10.14359/51721317, received March 14, 2019, and
reviewed under Institute publication policies. Copyright © 2020, American Concrete Institute. All rights reserved, including the making of copies unless permission is obtained from the copyright proprietors. Pertinent discussion including author’s closure, if any, will be published ten months from this journal’s date if the discussion is received within four months of the paper’s print publication.
226 ACI Structural Journal/March 2020
of exterior non-isolated shear keys in bridge abutments. Non-isolated shear keys are more economical to construct than isolated shear keys but they may not exhibit a favorable failure mechanism in the event of a major earthquake. The analytical formulas proposed herein are able to assess the diagonal shear strength of an abutment stem wall and the shear resistance of a non-isolated shear key in an accurate manner, and can be used to design shear keys and abutment walls that exhibit a failure mechanism governed by a hori-zontal crack plane under the shear key rather than the diag-onal shear failure of the stem wall. A horizonal shear crack is less costly to repair.
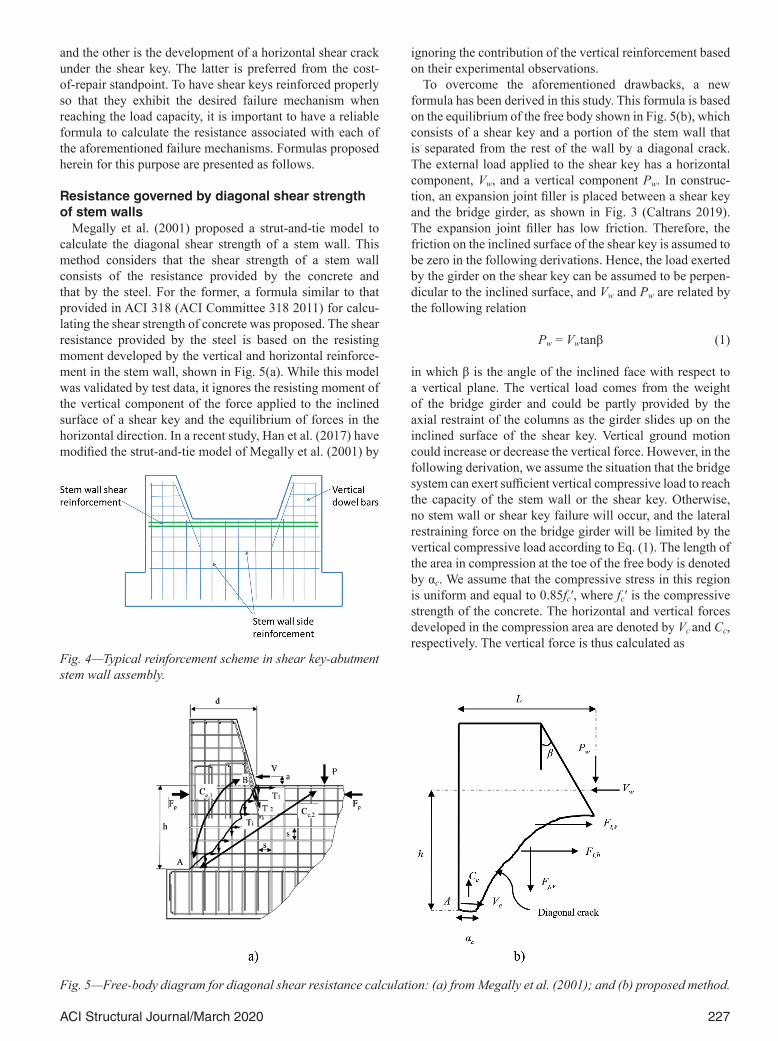
ANALYTICAL METHOD FOR SHEAR KEY DESIGNFigure 4 shows a typical reinforcement scheme in a
non-isolated shear key and abutment stem wall. Shear reinforcement is introduced near the top of a stem wall to provide the necessary diagonal shear resistance. Side rein-forcement is placed on each side of a stem wall, lapped with U bars at each end. The vertical bars connecting a shear key to the stem wall can be the continuation of the vertical side reinforcement. Depending on the reinforcement details, the load capacity of a shear key can be governed by one of two possible failure mechanisms. One mechanism is the diag-onal shear failure of the stem wall, as that shown in Fig. 1(b),
Fig. 2—Shear key failures in past earthquake events: (a) 2008 Wenchuan Earthquake, China (from Han et al. 2017); and (b) 2010 Maule Earthquake, Chile (from EERI/PEER/FHWA Report 2010).
Fig. 3—Non-isolated (left) and isolated (right) shear keys (Caltrans 2019). (Note: 1 in. = 25.4 mm.)
Fig. 1—(a) Schematic of bridge abutment structure with shear keys; and (b) failure of Shear Key 1B tested by Megally et al. (2001).
227ACI Structural Journal/March 2020
and the other is the development of a horizontal shear crack under the shear key. The latter is preferred from the cost-of-repair standpoint. To have shear keys reinforced properly so that they exhibit the desired failure mechanism when reaching the load capacity, it is important to have a reliable formula to calculate the resistance associated with each of the aforementioned failure mechanisms. Formulas proposed herein for this purpose are presented as follows.
Resistance governed by diagonal shear strength of stem walls
Megally et al. (2001) proposed a strut-and-tie model to calculate the diagonal shear strength of a stem wall. This method considers that the shear strength of a stem wall consists of the resistance provided by the concrete and that by the steel. For the former, a formula similar to that provided in ACI 318 (ACI Committee 318 2011) for calcu-lating the shear strength of concrete was proposed. The shear resistance provided by the steel is based on the resisting moment developed by the vertical and horizontal reinforce-ment in the stem wall, shown in Fig. 5(a). While this model was validated by test data, it ignores the resisting moment of the vertical component of the force applied to the inclined surface of a shear key and the equilibrium of forces in the horizontal direction. In a recent study, Han et al. (2017) have modified the strut-and-tie model of Megally et al. (2001) by
ignoring the contribution of the vertical reinforcement based on their experimental observations.
To overcome the aforementioned drawbacks, a new formula has been derived in this study. This formula is based on the equilibrium of the free body shown in Fig. 5(b), which consists of a shear key and a portion of the stem wall that is separated from the rest of the wall by a diagonal crack. The external load applied to the shear key has a horizontal component, Vw, and a vertical component Pw. In construc-tion, an expansion joint filler is placed between a shear key and the bridge girder, as shown in Fig. 3 (Caltrans 2019). The expansion joint filler has low friction. Therefore, the friction on the inclined surface of the shear key is assumed to be zero in the following derivations. Hence, the load exerted by the girder on the shear key can be assumed to be perpen-dicular to the inclined surface, and Vw and Pw are related by the following relation
Pw = Vwtanβ (1)
in which β is the angle of the inclined face with respect to a vertical plane. The vertical load comes from the weight of the bridge girder and could be partly provided by the axial restraint of the columns as the girder slides up on the inclined surface of the shear key. Vertical ground motion could increase or decrease the vertical force. However, in the following derivation, we assume the situation that the bridge system can exert sufficient vertical compressive load to reach the capacity of the stem wall or the shear key. Otherwise, no stem wall or shear key failure will occur, and the lateral restraining force on the bridge girder will be limited by the vertical compressive load according to Eq. (1). The length of the area in compression at the toe of the free body is denoted by αc. We assume that the compressive stress in this region is uniform and equal to 0.85fc′, where fc′ is the compressive strength of the concrete. The horizontal and vertical forces developed in the compression area are denoted by Vc and Cc, respectively. The vertical force is thus calculated as
Fig. 4—Typical reinforcement scheme in shear key-abutment stem wall assembly.
Fig. 5—Free-body diagram for diagonal shear resistance calculation: (a) from Megally et al. (2001); and (b) proposed method.
228 ACI Structural Journal/March 2020
Cc = 0.85fc′dαc (2)
in which d is the width of the shear key. Vertical bars located in the compression zone are considered to have reached their yield strength in compression.
Based on the moment equilibrium of the free body shown in Fig. 5(b) about Point A and Eq. (1), one can calculate the horizontal resistance of the shear key, Vw, as follows
VF l F l C
w
i h i hi
hor bars
j v j vj
vert
c c
=⋅∑ + ⋅∑ − ⋅ ⋅
= =, ,
# .
, ,
# .
1 1
bars
α 00 51
.
tan
,s ,s
# .
+ ⋅∑
− ⋅=
F l
h L
t tt
hor shear bars
β
(3)
in which Fi,h and Fj,v are the forces developed in a horizontal side reinforcing bar i and vertical side reinforcing bar j near the two faces of the stem wall, and Ft,s is the force developed in a horizontal bar t near the top of the stem wall, which serves as shear reinforcement; li,h is the vertical distance of horizontal bar i, lj,v is the horizontal distance of vertical bar j, and lt,s is the vertical distance of horizontal bar t, all with respect to Point A. Based on observations from the exper-imental studies of Borzogzadeh et al. (2006), we consider that the horizontal shear reinforcement of the stem wall has reached the ultimate tensile strength, fsu, while the vertical and horizontal side reinforcement has reached the yield strength, fy. It should be noted that the horizontal side rein-forcing bars near the level of Point A may not have a suffi-cient development length to develop the full tensile strength of the bars, while the upper ones may develop strain hard-ening. However, for simplicity, we assume that all the hori-zontal side reinforcement reaches the yield strength when the maximum lateral strength of the shear key has been reached. Because the value of αc is normally very small, the term with Cc in the aforementioned equation can be ignored. Based on the test data acquired in this study, as it will be discussed later, it is suggested that the value of tanβ in Eq. (3) be not less than 0.15, regardless of the actual angle of inclination of the loaded face of the shear key.
Based on the test results of Megally et al. (2001) and Borzogzadeh et al. (2006), one can assume that the diagonal
crack plane has an angle of 52 degrees with respect to the horizontal. Point A, the center of rotation of the free body, is at the intersection of the diagonal crack plane with the vertical edge of the stem wall. In the aforementioned tests, Point A was practically at the base of the stem wall.
We have validated this method with the experimental data of Megally et al. (2001) and Borzogzadeh et al. (2006), as shown in a later section of this paper.
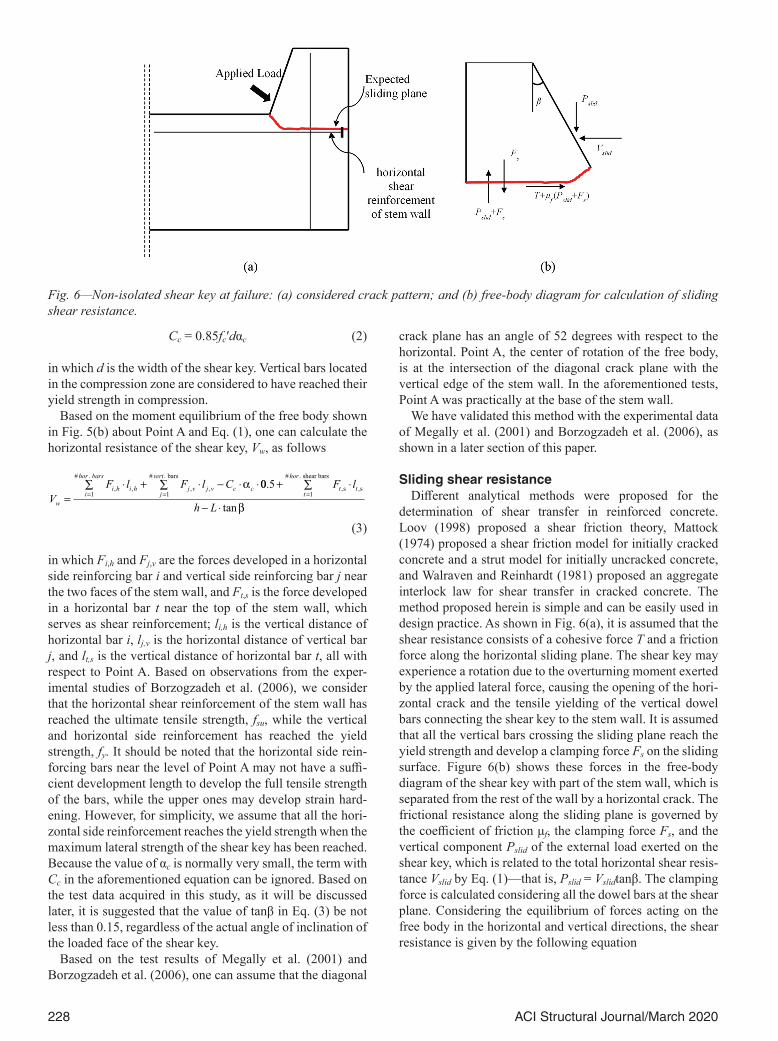
Sliding shear resistanceDifferent analytical methods were proposed for the
determination of shear transfer in reinforced concrete. Loov (1998) proposed a shear friction theory, Mattock (1974) proposed a shear friction model for initially cracked concrete and a strut model for initially uncracked concrete, and Walraven and Reinhardt (1981) proposed an aggregate interlock law for shear transfer in cracked concrete. The method proposed herein is simple and can be easily used in design practice. As shown in Fig. 6(a), it is assumed that the shear resistance consists of a cohesive force T and a friction force along the horizontal sliding plane. The shear key may experience a rotation due to the overturning moment exerted by the applied lateral force, causing the opening of the hori-zontal crack and the tensile yielding of the vertical dowel bars connecting the shear key to the stem wall. It is assumed that all the vertical bars crossing the sliding plane reach the yield strength and develop a clamping force Fs on the sliding surface. Figure 6(b) shows these forces in the free-body diagram of the shear key with part of the stem wall, which is separated from the rest of the wall by a horizontal crack. The frictional resistance along the sliding plane is governed by the coefficient of friction μf, the clamping force Fs, and the vertical component Pslid of the external load exerted on the shear key, which is related to the total horizontal shear resis-tance Vslid by Eq. (1)—that is, Pslid = Vslidtanβ. The clamping force is calculated considering all the dowel bars at the shear plane. Considering the equilibrium of forces acting on the free body in the horizontal and vertical directions, the shear resistance is given by the following equation
Fig. 6—Non-isolated shear key at failure: (a) considered crack pattern; and (b) free-body diagram for calculation of sliding shear resistance.
229ACI Structural Journal/March 2020
VT F
slidf s
f
=+ ⋅
− ⋅( )µ
µ β1 tan (4)
The friction coefficient μf is assumed to be 1.40 per ACI 318 for concrete placed monolithically. Similar to that in Eq. (3), the value of tanβ should not be less than 0.15, regardless of the actual angle of inclination. For the cohe-sive force of concrete, T, the following formula proposed by Bažant and Pfeiffer (1986) based on data from a large number of Mode-II fracture tests can be used
T = c d l
c =f
X
⋅ ⋅⋅ ′
⋅ +0.15 c
0 0099 0 3659. .
(5)
in which c is the cohesive strength of concrete in ksi; and d and l are the dimensions of the contact surface in inches, with l being measured in the direction of loading. Param-eter X is calculated from the following equation proposed by Bažant and Pfeiffer (1986)
X = lda
1.50 ⋅ (6)
in which da is the maximum aggregate size in inches. The horizontal crack opening and the rotation of the shear key occur before the shear strength has been reached, as shown by the tests described as follows. Therefore, the contact area that provides the cohesive force is much less than the base area of the shear key right above the stem wall. Hence, the value of l is recommended to be 1/4 the base length of the shear key in the direction of load application.
EXPERIMENTAL STUDYThree shear key-stem wall assemblies were constructed
and tested to investigate if shear keys and abutment stem walls could be so reinforced to prohibit diagonal shear cracks in the stem wall and achieve a failure mechanism dominated by a horizontal crack plane under the shear key. The test data were used to calibrate and evaluate the analytical formulas
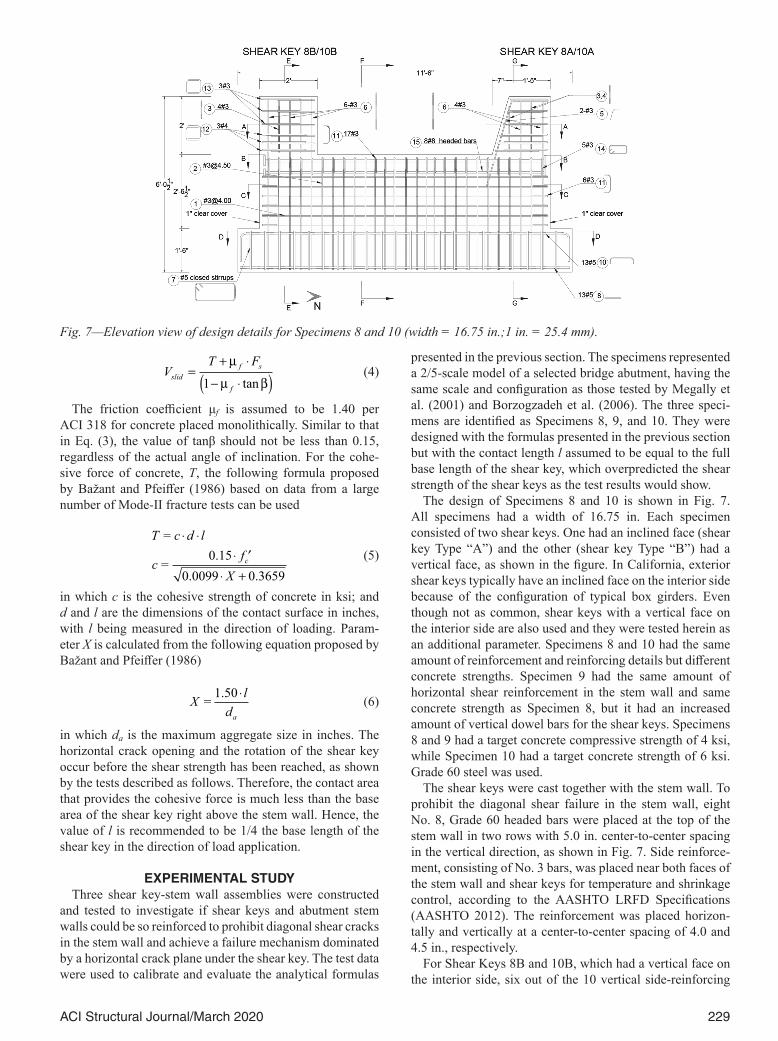
presented in the previous section. The specimens represented a 2/5-scale model of a selected bridge abutment, having the same scale and configuration as those tested by Megally et al. (2001) and Borzogzadeh et al. (2006). The three speci-mens are identified as Specimens 8, 9, and 10. They were designed with the formulas presented in the previous section but with the contact length l assumed to be equal to the full base length of the shear key, which overpredicted the shear strength of the shear keys as the test results would show.
The design of Specimens 8 and 10 is shown in Fig. 7. All specimens had a width of 16.75 in. Each specimen consisted of two shear keys. One had an inclined face (shear key Type “A”) and the other (shear key Type “B”) had a vertical face, as shown in the figure. In California, exterior shear keys typically have an inclined face on the interior side because of the configuration of typical box girders. Even though not as common, shear keys with a vertical face on the interior side are also used and they were tested herein as an additional parameter. Specimens 8 and 10 had the same amount of reinforcement and reinforcing details but different concrete strengths. Specimen 9 had the same amount of horizontal shear reinforcement in the stem wall and same concrete strength as Specimen 8, but it had an increased amount of vertical dowel bars for the shear keys. Specimens 8 and 9 had a target concrete compressive strength of 4 ksi, while Specimen 10 had a target concrete strength of 6 ksi. Grade 60 steel was used.
The shear keys were cast together with the stem wall. To prohibit the diagonal shear failure in the stem wall, eight No. 8, Grade 60 headed bars were placed at the top of the stem wall in two rows with 5.0 in. center-to-center spacing in the vertical direction, as shown in Fig. 7. Side reinforce-ment, consisting of No. 3 bars, was placed near both faces of the stem wall and shear keys for temperature and shrinkage control, according to the AASHTO LRFD Specifications (AASHTO 2012). The reinforcement was placed horizon-tally and vertically at a center-to-center spacing of 4.0 and 4.5 in., respectively.
For Shear Keys 8B and 10B, which had a vertical face on the interior side, six out of the 10 vertical side-reinforcing
Fig. 7—Elevation view of design details for Specimens 8 and 10 (width = 16.75 in.;1 in. = 25.4 mm).
230 ACI Structural Journal/March 2020
bars in the shear keys were used as dowels, continuing from the shear keys into the stem walls, while the rest was discon-tinued at the shear key-stem wall interface. For Shear Keys 8A and 10A, which had an inclined face on the interior side, four out of the eight vertical side reinforcing bars in the shear keys were used as dowels. Two additional No. 3 dowel bars were placed near and parallel to the inclined face of the shear keys.
Specimen 9 had the same design as Specimens 8 and 10, except that all the vertical side reinforcement continued into the stem wall. This resulted in a higher shear capacity. However, their shear resistance was still governed by a horizontal crack under the shear keys according to the calculations.
The strengths of the reinforcing bars from tension tests are summarized in Table 1. The compressive strength of the concrete on the day of the tests for Specimens 8, 9, and 10 reached 4.71, 5.10, and 6.74 ksi, respectively.
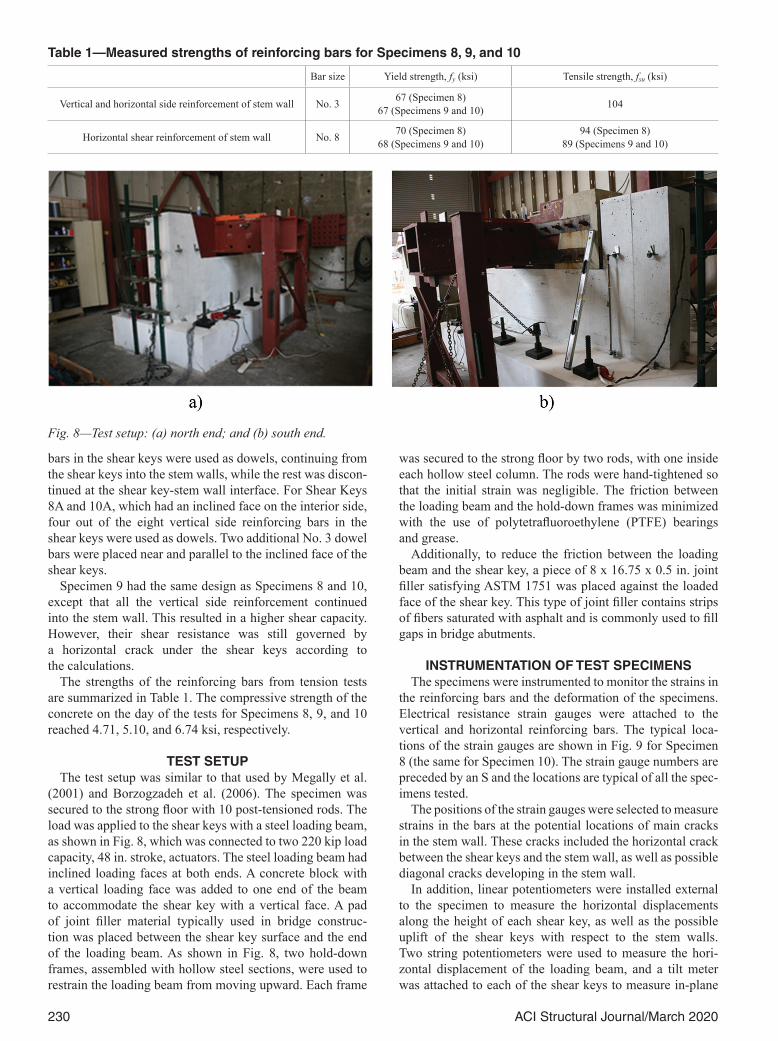
TEST SETUPThe test setup was similar to that used by Megally et al.
(2001) and Borzogzadeh et al. (2006). The specimen was secured to the strong floor with 10 post-tensioned rods. The load was applied to the shear keys with a steel loading beam, as shown in Fig. 8, which was connected to two 220 kip load capacity, 48 in. stroke, actuators. The steel loading beam had inclined loading faces at both ends. A concrete block with a vertical loading face was added to one end of the beam to accommodate the shear key with a vertical face. A pad of joint filler material typically used in bridge construc-tion was placed between the shear key surface and the end of the loading beam. As shown in Fig. 8, two hold-down frames, assembled with hollow steel sections, were used to restrain the loading beam from moving upward. Each frame
was secured to the strong floor by two rods, with one inside each hollow steel column. The rods were hand-tightened so that the initial strain was negligible. The friction between the loading beam and the hold-down frames was minimized with the use of polytetrafluoroethylene (PTFE) bearings and grease.
Additionally, to reduce the friction between the loading beam and the shear key, a piece of 8 x 16.75 x 0.5 in. joint filler satisfying ASTM 1751 was placed against the loaded face of the shear key. This type of joint filler contains strips of fibers saturated with asphalt and is commonly used to fill gaps in bridge abutments.
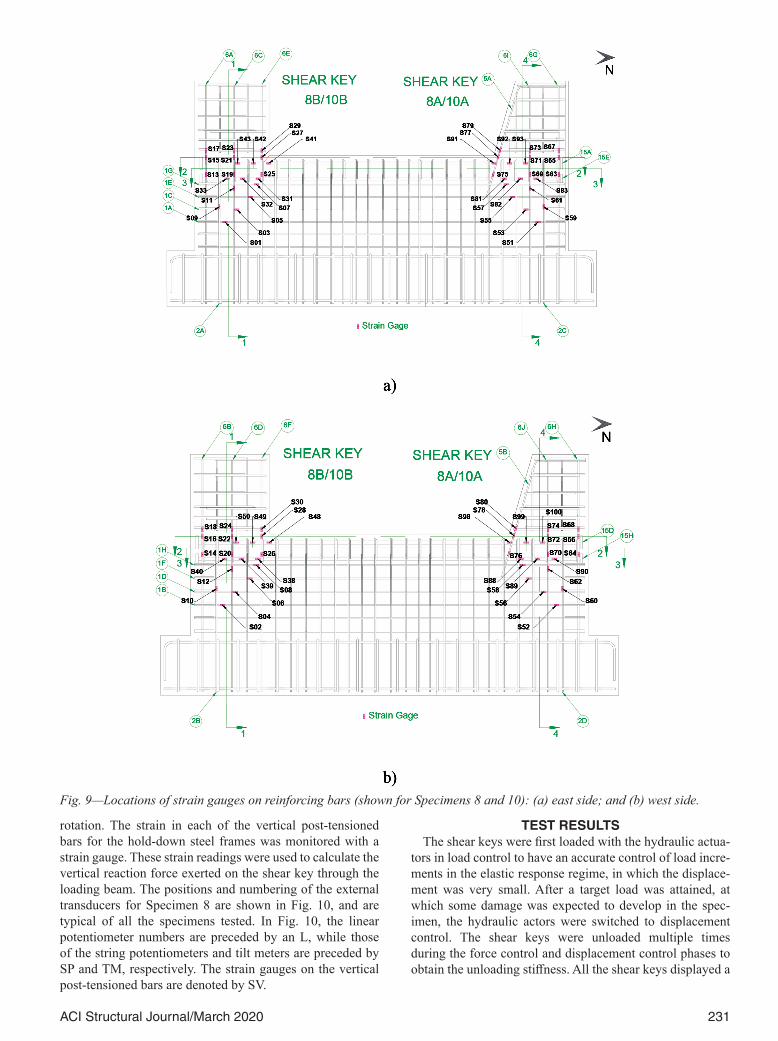
INSTRUMENTATION OF TEST SPECIMENSThe specimens were instrumented to monitor the strains in
the reinforcing bars and the deformation of the specimens. Electrical resistance strain gauges were attached to the vertical and horizontal reinforcing bars. The typical loca-tions of the strain gauges are shown in Fig. 9 for Specimen 8 (the same for Specimen 10). The strain gauge numbers are preceded by an S and the locations are typical of all the spec-imens tested.
The positions of the strain gauges were selected to measure strains in the bars at the potential locations of main cracks in the stem wall. These cracks included the horizontal crack between the shear keys and the stem wall, as well as possible diagonal cracks developing in the stem wall.
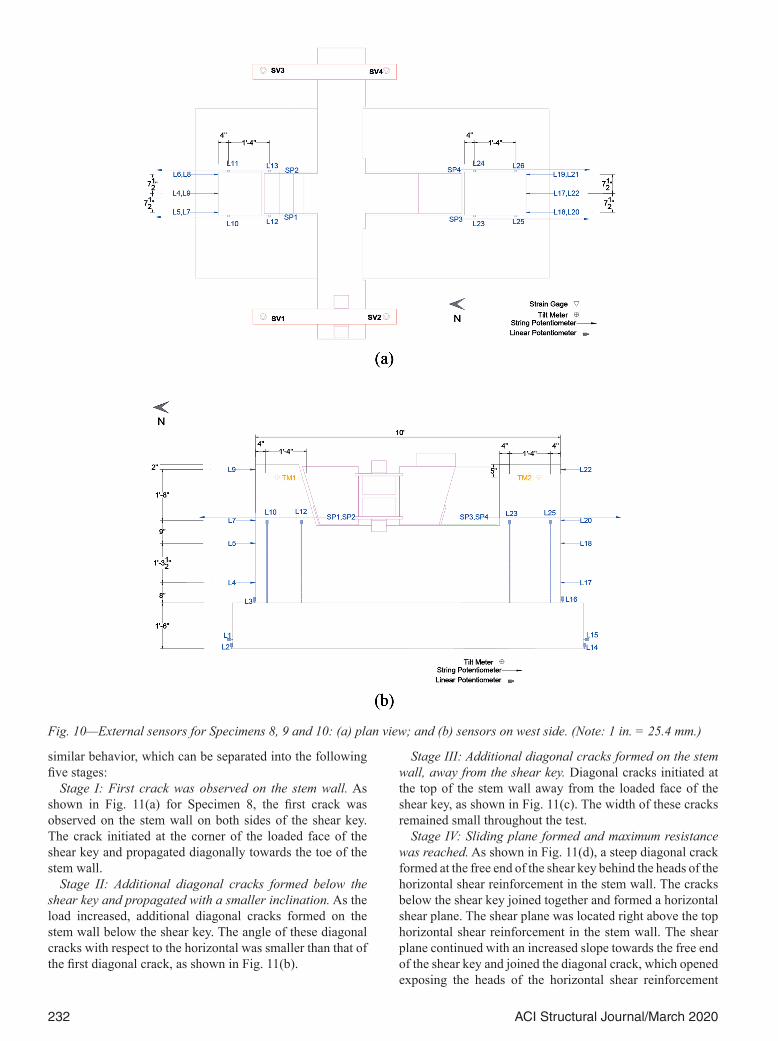
In addition, linear potentiometers were installed external to the specimen to measure the horizontal displacements along the height of each shear key, as well as the possible uplift of the shear keys with respect to the stem walls. Two string potentiometers were used to measure the hori-zontal displacement of the loading beam, and a tilt meter was attached to each of the shear keys to measure in-plane
Table 1—Measured strengths of reinforcing bars for Specimens 8, 9, and 10
Bar size Yield strength, fy (ksi) Tensile strength, fsu (ksi)
Vertical and horizontal side reinforcement of stem wall No. 3 67 (Specimen 8)67 (Specimens 9 and 10) 104
Horizontal shear reinforcement of stem wall No. 8 70 (Specimen 8)68 (Specimens 9 and 10)
94 (Specimen 8)89 (Specimens 9 and 10)
Fig. 8—Test setup: (a) north end; and (b) south end.
231ACI Structural Journal/March 2020
rotation. The strain in each of the vertical post-tensioned bars for the hold-down steel frames was monitored with a strain gauge. These strain readings were used to calculate the vertical reaction force exerted on the shear key through the loading beam. The positions and numbering of the external transducers for Specimen 8 are shown in Fig. 10, and are typical of all the specimens tested. In Fig. 10, the linear potentiometer numbers are preceded by an L, while those of the string potentiometers and tilt meters are preceded by SP and TM, respectively. The strain gauges on the vertical post-tensioned bars are denoted by SV.
TEST RESULTSThe shear keys were first loaded with the hydraulic actua-
tors in load control to have an accurate control of load incre-ments in the elastic response regime, in which the displace-ment was very small. After a target load was attained, at which some damage was expected to develop in the spec-imen, the hydraulic actors were switched to displacement control. The shear keys were unloaded multiple times during the force control and displacement control phases to obtain the unloading stiffness. All the shear keys displayed a
Fig. 9—Locations of strain gauges on reinforcing bars (shown for Specimens 8 and 10): (a) east side; and (b) west side.
232 ACI Structural Journal/March 2020
similar behavior, which can be separated into the following five stages:
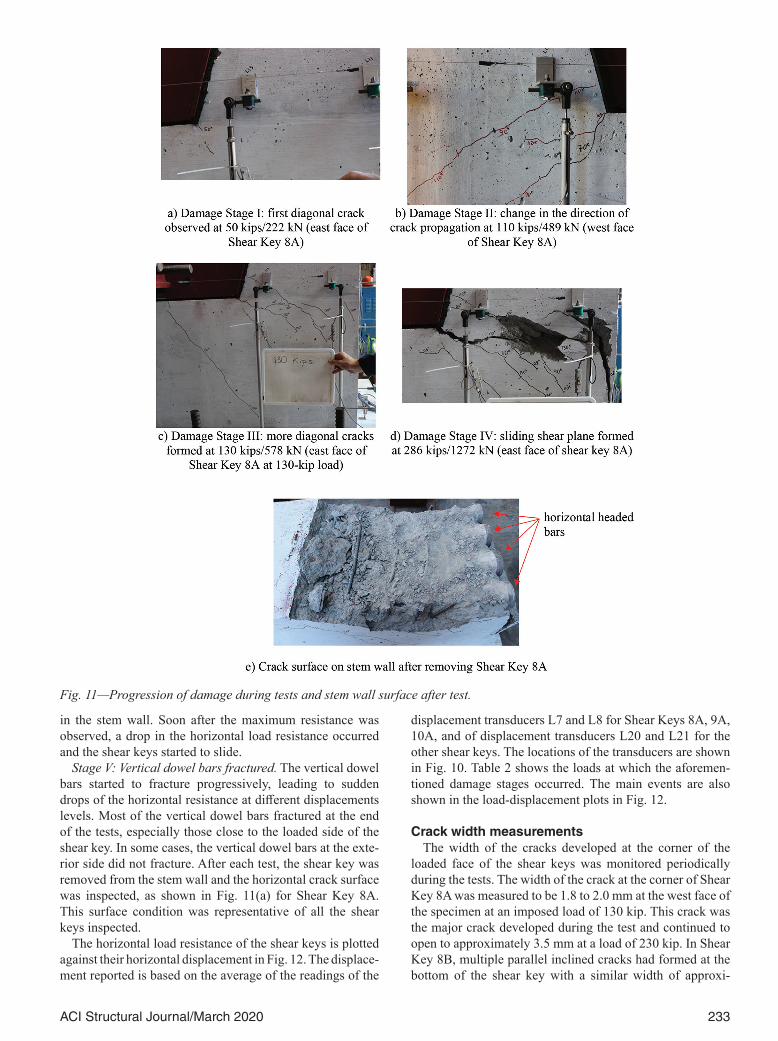
Stage I: First crack was observed on the stem wall. As shown in Fig. 11(a) for Specimen 8, the first crack was observed on the stem wall on both sides of the shear key. The crack initiated at the corner of the loaded face of the shear key and propagated diagonally towards the toe of the stem wall.
Stage II: Additional diagonal cracks formed below the shear key and propagated with a smaller inclination. As the load increased, additional diagonal cracks formed on the stem wall below the shear key. The angle of these diagonal cracks with respect to the horizontal was smaller than that of the first diagonal crack, as shown in Fig. 11(b).
Stage III: Additional diagonal cracks formed on the stem wall, away from the shear key. Diagonal cracks initiated at the top of the stem wall away from the loaded face of the shear key, as shown in Fig. 11(c). The width of these cracks remained small throughout the test.
Stage IV: Sliding plane formed and maximum resistance was reached. As shown in Fig. 11(d), a steep diagonal crack formed at the free end of the shear key behind the heads of the horizontal shear reinforcement in the stem wall. The cracks below the shear key joined together and formed a horizontal shear plane. The shear plane was located right above the top horizontal shear reinforcement in the stem wall. The shear plane continued with an increased slope towards the free end of the shear key and joined the diagonal crack, which opened exposing the heads of the horizontal shear reinforcement
Fig. 10—External sensors for Specimens 8, 9 and 10: (a) plan view; and (b) sensors on west side. (Note: 1 in. = 25.4 mm.)
233ACI Structural Journal/March 2020
in the stem wall. Soon after the maximum resistance was observed, a drop in the horizontal load resistance occurred and the shear keys started to slide.
Stage V: Vertical dowel bars fractured. The vertical dowel bars started to fracture progressively, leading to sudden drops of the horizontal resistance at different displacements levels. Most of the vertical dowel bars fractured at the end of the tests, especially those close to the loaded side of the shear key. In some cases, the vertical dowel bars at the exte-rior side did not fracture. After each test, the shear key was removed from the stem wall and the horizontal crack surface was inspected, as shown in Fig. 11(a) for Shear Key 8A. This surface condition was representative of all the shear keys inspected.
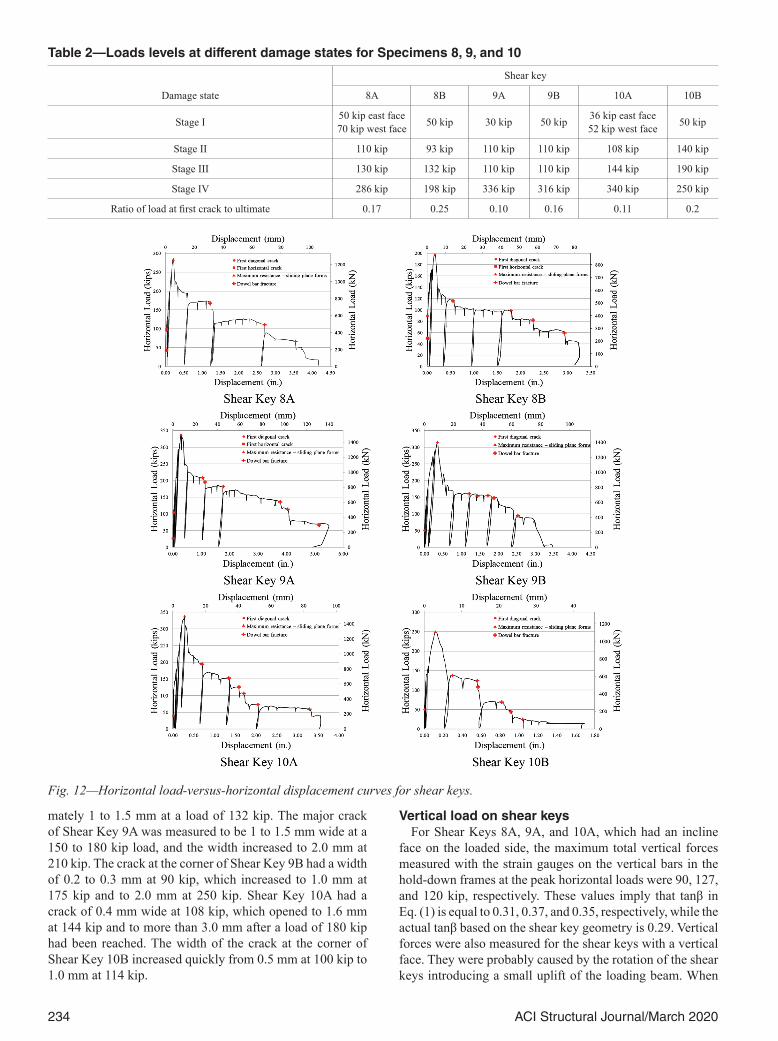
The horizontal load resistance of the shear keys is plotted against their horizontal displacement in Fig. 12. The displace-ment reported is based on the average of the readings of the
displacement transducers L7 and L8 for Shear Keys 8A, 9A, 10A, and of displacement transducers L20 and L21 for the other shear keys. The locations of the transducers are shown in Fig. 10. Table 2 shows the loads at which the aforemen-tioned damage stages occurred. The main events are also shown in the load-displacement plots in Fig. 12.
Crack width measurementsThe width of the cracks developed at the corner of the
loaded face of the shear keys was monitored periodically during the tests. The width of the crack at the corner of Shear Key 8A was measured to be 1.8 to 2.0 mm at the west face of the specimen at an imposed load of 130 kip. This crack was the major crack developed during the test and continued to open to approximately 3.5 mm at a load of 230 kip. In Shear Key 8B, multiple parallel inclined cracks had formed at the bottom of the shear key with a similar width of approxi-
Fig. 11—Progression of damage during tests and stem wall surface after test.
234 ACI Structural Journal/March 2020
mately 1 to 1.5 mm at a load of 132 kip. The major crack of Shear Key 9A was measured to be 1 to 1.5 mm wide at a 150 to 180 kip load, and the width increased to 2.0 mm at 210 kip. The crack at the corner of Shear Key 9B had a width of 0.2 to 0.3 mm at 90 kip, which increased to 1.0 mm at 175 kip and to 2.0 mm at 250 kip. Shear Key 10A had a crack of 0.4 mm wide at 108 kip, which opened to 1.6 mm at 144 kip and to more than 3.0 mm after a load of 180 kip had been reached. The width of the crack at the corner of Shear Key 10B increased quickly from 0.5 mm at 100 kip to 1.0 mm at 114 kip.
Vertical load on shear keysFor Shear Keys 8A, 9A, and 10A, which had an incline
face on the loaded side, the maximum total vertical forces measured with the strain gauges on the vertical bars in the hold-down frames at the peak horizontal loads were 90, 127, and 120 kip, respectively. These values imply that tanβ in Eq. (1) is equal to 0.31, 0.37, and 0.35, respectively, while the actual tanβ based on the shear key geometry is 0.29. Vertical forces were also measured for the shear keys with a vertical face. They were probably caused by the rotation of the shear keys introducing a small uplift of the loading beam. When
Fig. 12—Horizontal load-versus-horizontal displacement curves for shear keys.
Table 2—Loads levels at different damage states for Specimens 8, 9, and 10
Damage state
Shear key
8A 8B 9A 9B 10A 10B
Stage I 50 kip east face70 kip west face 50 kip 30 kip 50 kip 36 kip east face
52 kip west face 50 kip
Stage II 110 kip 93 kip 110 kip 110 kip 108 kip 140 kip
Stage III 130 kip 132 kip 110 kip 110 kip 144 kip 190 kip
Stage IV 286 kip 198 kip 336 kip 316 kip 340 kip 250 kip
Ratio of load at first crack to ultimate 0.17 0.25 0.10 0.16 0.11 0.2
235ACI Structural Journal/March 2020
dividing the peak vertical forces by the measured peak hori-zontal loads, we have tanβ values of 0.10, 0.15, and 0.18 for Shear Keys 8B, 9B, and 9B, respectively, while the actual value should be zero. Hence, when using Eq. (1), it is appro-priate to assume a minimum tanβ value of 0.15 when the actual β value is very small or close to zero because the rota-tion of the shear key is inevitable when a horizontal crack plane develops.
Strains in horizontal shear reinforcement of stem wall and vertical dowel bars
Strains in the horizontal shear reinforcement of the stem wall were measured (S93, S95, S97, S99, S86, S89, S84, S81). All the strain-gauge readings were within the elastic regime for Shear Keys 8A, 8B, and 10B. For Shear Keys 9A and 9B, which had a higher amount of vertical dowel reinforcement than the others, the stain-gauge readings show that one of the horizontal bars in the bottom row and all the horizontal bars in the top row reached the yield strain. For Shear Key 10A, the strain-gauge readings show that only one of the horizontal bars exceeded the yield strain, while the rest remained in the elastic regime.
The readings of the strain gauges close to the sliding planes (S65-S66, S71-S72, S77-S78) show that appreciable tensile forces developed in the vertical (as well as inclined) dowel bars from the beginning of the tests. The strain gauges that were closer to the loaded end of the shear key reached the yield strain earlier in the test, while the strain gauges at the free end of the shear key reached it last. This can be attributed to the in-plane rotation of the shear key, as discussed next.
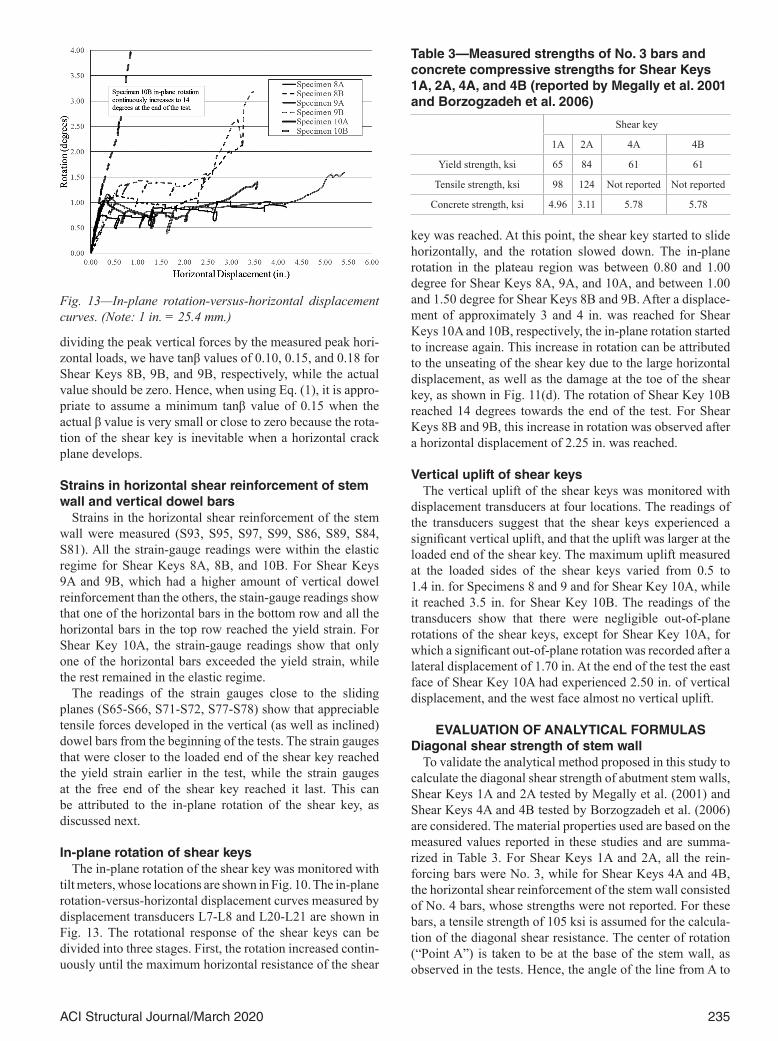
In-plane rotation of shear keysThe in-plane rotation of the shear key was monitored with
tilt meters, whose locations are shown in Fig. 10. The in-plane rotation-versus-horizontal displacement curves measured by displacement transducers L7-L8 and L20-L21 are shown in Fig. 13. The rotational response of the shear keys can be divided into three stages. First, the rotation increased contin-uously until the maximum horizontal resistance of the shear
key was reached. At this point, the shear key started to slide horizontally, and the rotation slowed down. The in-plane rotation in the plateau region was between 0.80 and 1.00 degree for Shear Keys 8A, 9A, and 10A, and between 1.00 and 1.50 degree for Shear Keys 8B and 9B. After a displace-ment of approximately 3 and 4 in. was reached for Shear Keys 10A and 10B, respectively, the in-plane rotation started to increase again. This increase in rotation can be attributed to the unseating of the shear key due to the large horizontal displacement, as well as the damage at the toe of the shear key, as shown in Fig. 11(d). The rotation of Shear Key 10B reached 14 degrees towards the end of the test. For Shear Keys 8B and 9B, this increase in rotation was observed after a horizontal displacement of 2.25 in. was reached.
Vertical uplift of shear keysThe vertical uplift of the shear keys was monitored with
displacement transducers at four locations. The readings of the transducers suggest that the shear keys experienced a significant vertical uplift, and that the uplift was larger at the loaded end of the shear key. The maximum uplift measured at the loaded sides of the shear keys varied from 0.5 to 1.4 in. for Specimens 8 and 9 and for Shear Key 10A, while it reached 3.5 in. for Shear Key 10B. The readings of the transducers show that there were negligible out-of-plane rotations of the shear keys, except for Shear Key 10A, for which a significant out-of-plane rotation was recorded after a lateral displacement of 1.70 in. At the end of the test the east face of Shear Key 10A had experienced 2.50 in. of vertical displacement, and the west face almost no vertical uplift.
EVALUATION OF ANALYTICAL FORMULASDiagonal shear strength of stem wall
To validate the analytical method proposed in this study to calculate the diagonal shear strength of abutment stem walls, Shear Keys 1A and 2A tested by Megally et al. (2001) and Shear Keys 4A and 4B tested by Borzogzadeh et al. (2006) are considered. The material properties used are based on the measured values reported in these studies and are summa-rized in Table 3. For Shear Keys 1A and 2A, all the rein-forcing bars were No. 3, while for Shear Keys 4A and 4B, the horizontal shear reinforcement of the stem wall consisted of No. 4 bars, whose strengths were not reported. For these bars, a tensile strength of 105 ksi is assumed for the calcula-tion of the diagonal shear resistance. The center of rotation (“Point A”) is taken to be at the base of the stem wall, as observed in the tests. Hence, the angle of the line from A to
Fig. 13—In-plane rotation-versus-horizontal displacement curves. (Note: 1 in. = 25.4 mm.)
Table 3—Measured strengths of No. 3 bars and concrete compressive strengths for Shear Keys 1A, 2A, 4A, and 4B (reported by Megally et al. 2001 and Borzogzadeh et al. 2006)
Shear key
1A 2A 4A 4B
Yield strength, ksi 65 84 61 61
Tensile strength, ksi 98 124 Not reported Not reported
Concrete strength, ksi 4.96 3.11 5.78 5.78
236 ACI Structural Journal/March 2020
the corner of the loaded face of the shear key with respect to the horizontal is 52 degrees.
The measured and calculated load resistance values are shown in Table 4. The method can predict the diagonal shear resistance of the stem wall’s well. The difference between the measured and the calculated strengths is below 10% for all the cases.
Sliding shear resistance of non-isolated shear keysThe test data of Specimens 8, 9, and 10 presented previ-
ously are used to evaluate the analytical method presented to calculate the shear strength of a non-isolated shear key governed by a horizonal crack. For this purpose, the shear strength of each shear key is calculated with Eq. (4). The cohesive resistance T is calculated with Eq. (5) and (6). The strengths of the steel reinforcement and concrete obtained from material tests are used. The steel strengths are shown in Table 1. For the contact area, d is 16.75 in. and l is 6 in., which is 1/4 of the base length of the shear keys. The cohe-sive force T, the total clamping force, Fs, and the calculated and measured horizontal shear strengths Vslid are shown in Table 5. For calculating the shear strengths of the shear keys with a vertical face on the loaded side (Shear Keys 8B, 9B, 10B) with Eq. (3), tanβ is assumed to be 0.15 based on the test data discussed previously. For comparison, the shear strengths of the stem walls calculated with the proposed method are also shown in the table. The calculated shear strengths of the stem walls are higher than the calculated shear strengths of the shear keys, by more than two times for most of the cases.
It can be observed that the proposed method predicts the strength of the shear keys reasonably well. For most of the cases, the difference between the calculated and measured shear strengths is less than 10% of the measured values. However, for Shear Key 9B, the method underpredicts the shear strength by 19%. It should be mentioned that the differ-
ence in the shear strengths of 9A and 9B obtained from the test is a lot smaller than that for the corresponding shear keys in Specimens 8 and 10. The horizontal resistances measured from Shear Keys 8B and 10B were 70% and 75% of the horizontal resistances of Shear Keys 8A and 10A, respec-tively, while the horizontal resistance of Shear Key 9B was measured to be 95% of that of Shear Key 9A.
The shear strengths are also calculated with the formula in the SDC (Caltrans 2019) for comparison. The results are shown in Table 5 as well. This formula does not distinguish the different geometries of the shear keys (that is, whether the loaded face is vertical or inclined) or the concrete strength. Therefore, the two shear keys in each specimen have the same calculated shear strength, and Specimens 8 and 10 end up having the same shear strength. It can be seen that for Shear Key 10B, the difference between the measured and the calculated shear strengths is 8%, for Shear Keys 8B, 9B, and 10B, the difference is between 10 and 16%, for Shear Keys 8A and 9A, it is 21 to 22%, and for Shear Key 10B, it is 34%.
SUMMARY AND CONCLUSIONSThis paper has demonstrated that exterior shear keys and
abutment stem walls cast monolithically can be designed to exhibit a desired failure mechanism that is governed by the horizontal sliding of the shear key, rather than the diagonal cracking of the stem wall. The former failure mode is easier to repair and can thus reduce the post-earthquake repair costs. Three shear key-stem wall specimens each with two non-isolated shear keys were tested. The specimens had two different amounts of dowel bars connecting the shear keys to the stem walls, two different concrete strengths, and two different shear key geometries, but had the same amount of horizontal shear reinforcement in the stem walls. The tests have shown that the concrete strength, the amount of vertical dowel bars, and the inclination of the loaded face of the shear key can influence the shear resistance of a shear key significantly. The failure mechanisms of the shear keys were similar and were governed by shear sliding. Diagonal shear cracks formed on the stem walls but remained small throughout the tests. Initially, the shear keys experienced an in-plane rotation without sliding. This led to the develop-ment of significant tensile forces in the dowel bars. Before sliding occurred, a number of parallel diagonal cracks formed right below the shear keys. Some of the diagonal cracks eventually propagated horizontally forming a sliding plane. When the maximum horizontal load was reached, the
Table 4—Diagonal shear strengths of stem walls from tests and proposed formula for shear key tests 1A, 2A, 4A, and 4B
Shear key Test, kip Formula, kip Difference
1A 222 207 –7%
2A 158 160 +1%
4A 329 333 +1%
4B 299 297 –0.5%
Table 5—Horizontal shear resistances of non-isolated shear keys for Specimens 8, 9, and 10
Shear key
Calculated cohesive force T, kip
Total yield force of vertical bars, Fs, kip
Calculated horizontal shear strength, kip
Measured horizontal shear strength, kip
Calculated shear resistance of stem
wall, kip
Calculated shear resistance of shear key from SDC
(Caltrans 2019)
8A 91.40 44.22 260 286 705 223
8B 91.40 44.22 194 198 564 223
9A 98.97 73.92 342 336 705 264
9B 98.97 73.92 256 316 564 264
10A 130.79 44.22 326 340 695 223
10B 130.79 44.22 244 250 564 223
237ACI Structural Journal/March 2020
shear key started to slide. At that point, the in-plane rota-tion of the shear key leveled off. The shear key continued to slide and the dowel bars fractured sequentially, leading to sudden drops of the horizontal load. As a shear key rotated, the exterior side of the shear key experienced large shear and compressive forces. This led to the development of a steep diagonal crack in the stem wall behind the heads of the horizontal shear reinforcement. When the sliding plane formed and the corner of the stem wall at the exterior side of the shear key broke off, the shear key stopped to rotate and started to slide on that plane.
Analytical formulas for calculating the sliding shear resistance of shear keys and the diagonal shear strength of stem walls are presented for use in design. The analytical formulas have been validated by the tests presented in this paper as well as data from prior tests. The formula for the sliding shear strength accounts for the cohesive as well as frictional forces in concrete, the angle of the loaded face of the shear key, and the clamping force of the dowel bars. It has been shown that the proposed formula provides a better correlation of the test results than that provided in the Caltrans SDC.
AUTHOR BIOSAlexandra Kottari is an Engineer at Simpson Gumpertz and Heger Inc. She received her BS from the National Technical University of Athens, Athens, Greece, and her MSc and PhD from University of California San Diego, San Diego, CA. Her research interests include finite element analysis and testing of reinforced concrete structures.
ACI member P. Benson Shing is a Professor of structural engineering at the University of California San Diego. He received his BS, MS, and PhD from the University of California, Berkeley, Berkeley, CA. His research interests include seismic design and the behavior and performance of concrete and masonry structures, including large-scale testing and analytical modeling.
Ron Bromenschenkel is a Senior Bridge Engineer at the California Department of Transportation. He received his BS in industrial engineering from St. Cloud State University, St. Cloud, MN, and his BS in civil engi-neering from the University of Minnesota, Minneapolis, MN. His research interests include incorporation of new findings in seismic performance of bridge components and systems into California bridge design standards.
ACKNOWLEDGMENTSThis study was supported by the California Department of Transportation
(Caltrans) under Contract No. 65A0424. The authors would like to thank J. Restrepo for his valuable input in this project, and the technical staff of the Powell Structural Engineering Laboratories at the University of California, San Diego for their effort and support in the experimental work, with special acknowledgments to C. Latham, P. Greco, D. McKay, and N. Aldrich. The authors are most grateful for the technical input and continuous support provided by M. Mahan and C. Sikorsky of Caltrans throughout this project. Their unfailing support ensured the successful completion of this project.
REFERENCESAASHTO, 2012, LRFD Bridge Design Specifications, American Associ-
ation of State Highway and Transportation Officials, Washington, DC.ACI Committee 318, 2011, “Building Code Requirements for Structural
Concrete (ACI 318-11) and Commentary,” American Concrete Institute, Farmington Hills, MI, 503 pp.
Bauer, L. H., 2006, “The Effects of Shear Key Properties on the Response of Overpass Bridges to Earthquakes,” master’s thesis, University of Cali-fornia at San Diego, La Jolla, CA.
BaŽant, Z. P., and Pfeiffer, P. A., 1986, “Shear Fracture Tests of Concrete,” Materiaux et Constructions, V. 19, No. 110, pp. 111-121.
Borzogzadeh, A.; Megally, S. H.; Restrepo, J.; and Ashford, S., 2006, “Seismic Response of Sacrificial Exterior Shear Keys in Bridge Abut-ments,” Journal of Bridge Engineering, ASCE, V. 11, No. 5, pp. 555-565. doi: 10.1061/(ASCE)1084-0702(2006)11:5(555)
Caltrans, 2019, Caltrans Seismic Design Criteria, v2.0, California Department of Transportation, Sacramento, CA.
EERI/PEER/FHWA Bridge Team Report, 2010, “Performance of Highway and Railway Structures during the February 27, 2010 Maule Chile Earthquake,” https://peer.berkeley.edu/sites/default/files/bppr4.pdf.
Han, Q.; Zhou, Y.; Zhong, Z.; and Du, Z., 2017, “Seismic Capacity Eval-uation of Exterior Shear Keys of Highway Bridges,” Journal of Bridge Engineering, ASCE, V. 22, No. 2, p. 04016119 doi: 10.1061/(ASCE)BE.1943-5592.0000978
Loov, R. E., 1998, “Review of A23.3-94 Simplified Method of Shear Design and Comparison with Results Using Shear Friction,” Canadian Journal of Civil Engineering, V. 25, No. 3, pp. 437-450. doi: 10.1139/l97-101
Mattock, A. H., 1974, “Shear Transfer in Concrete Having Reinforce-ment at an Angle to the Shear Plane,” Concrete (London), V. 1, pp. 17-42.
Megally, S. H.; Silva, P. F.; and Seible, F., 2001, “Seismic Response of Sacrificial Shear Keys in Bridge Abutments,” SSRP – 2001/23, California Department of Transportation, Sacramento, CA.
Saiidi, M. S.; Moore, R. T.; and Itani, A., 2001, “Seismic Performance of Reinforced Concrete Bridges with Unconventional Configurations,” ACI Structural Journal, V. 98, No. 5, Sept.-Oct., pp. 717-726.
Walraven, J. C., and H. W. Reinhardt, 1981, “Theory and Experiments on the Mechanical Behaviour of Cracks in Plain and Reinforced Concrete Subjected to Shear Loading,” Heron 26, 1(a), pp. 5-68.

Researchers, Maximize Your ACI Membership
ACI membership gives researchers and educators unique opportunities to expand their careers and further their education. ACI events such as ACI’s biannual conventions give participants the chance to participate in the development of industry codes and standards, learn about the latest in concrete technology, network with other concrete professionals, and fulfill potential continuing education requirements. ACI membership also allows professionals access to a vast abstract library, online educational presentations, webinars, and ACI education documents at either no or minimal cost. ACI and its subsidiaries are always accepting the submission of papers for potential publication and distribution. More information about ACI’s conventions, technical presentations and documents, and calls for papers can be found at www.concrete.org.
For more information visit Concrete.org
Technical Presentations and Documents: Access to a vast abstract library, online presentations, webinars, and educational documents are often free for members
Attend Conventions: Provides opportunity to develop codes and standards, learn about the latest technology, and network
Call for Papers: ACI is accepting the submission of papers for conventions, committees, chapters, and subsidiaries
ACI Convention Schedule
City Location Dates
Chicago/Rosemont, IL, USA
Hyatt Regency O’Hare
March 29- April 2, 2020
Raleigh, NC, USA
Raleigh Convention Center & Raleigh Marriott
October 25-29, 2020
Baltimore, MD, USA
Hilton & Marriott Baltimore
March 28-April 1, 2021
Atlanta, GA, USA
Hilton Atlanta Downtown
October 17-21, 2021
Orlando, FL, USA
Caribe Royal Orlando
March 27-31, 2022


