Embed Size (px)
Citation preview
IJRESS Volume 5, Issue 3 (March, 2015) (ISSN 2249-7382) International Journal of Research in Economics and Social Sciences (IMPACT FACTOR – 4.992)
International Journal of Research in Economics & Social Sciences Email id: [email protected], http://www.euroasiapub.org
129
SEASONALITY OF EXCHANGE RATES IN GHANA
BARNES EVANS JOHN VINCENT KONADU TAWIAH
MA Economics Chartered Accountant, Ghana
University of Mysore, India M.Com, University of Mysore, India
Abstract The seasonality of Ghanaian economic activities such as agriculture, consumption, money supply among
others which affect exchange rate gives the impression that, the Cedi – US Dollar rate also follows a
particular pattern within the year.
Using quarterly interbank Exchange rate data from 2000 to 2014, sourced from Bank of Ghana,
this study has established the quarterly behaviour of the Cedi against the US Dollar. To achieve this,
both statistical analysis and econometric model including trend, F – Test, K – Test and regression were
computed with the aid of X-12 Census ARIMA program provided by the US Census Bureau.
Whiles the trend analysis suggest seasonal depreciation of the Cedi with peak in the fourth
quarter, the regression results indicates statistically insignificant average mean difference between the
quarters. However, the moving seasonality test showed a cyclical pattern of seasonal frequencies
evolving from year to year. The general conclusion we established from the study is that depreciation of
the Ghana cedi to the dollar follows a moving seasonality with a pattern constantly repeated year to
year
Keywords: Cedi, US Dollar, quarters, seasonality, depreciation
1.0 INTRODUCTION In a fast globalization era like this, a country cannot survive without any trade with other
countries; hence the exchange of currency is inevitable. Every country been small or big has to exchange
its currency to other country currency in order to trade internationally.
Foreign exchange is the currency or many claims such as bank balances and bank drafts
expressed in equivalent value in foreign money.
Since the adoption of inter- bank exchange rate (also called as floating rate system), the debate
of exchange rate in Ghana continues unabated. This is due to the instability of the Ghana Cedi against
major currencies like US-Dollar, Euro UK Pounds.
Ghana as many other nations was using fixed or pegged exchange rate system under the Bretton
Wood agreement till 1986. Between 1987 and 1992, the country opted for the auction system also
known as the managed flexible system. The start of constitutional government in the country saw the
adoption of freely floating exchange rate system in 1992. The floating system caused almost 1500%
depreciation of the Cedi over 10years periods. That is the Cedi felt several hundred folds from 520 Cedi
in 1992 to 8000 Cedi in 2002 against the US Dollar.
Free-floating system allows a country currency rate to be freely determined by demand and
supply against another currency, whereas in the fixed rate system, the country currency is pegged at
IJRESS Volume 5, Issue 3 (March, 2015) (ISSN 2249-7382) International Journal of Research in Economics and Social Sciences (IMPACT FACTOR – 4.992)
International Journal of Research in Economics & Social Sciences Email id: [email protected], http://www.euroasiapub.org
130
specific price for specified time against an amount of gold. In between these two extreme systems is the
managed float where both the invisible hand of demand and supply as well as major government force
operates in the same market. Thus free market is allowed to some extent while government intervene
where necessary to achieve a desire economic objective. Almost all countries in the world have gone for
free-float or managed float since the breakdown of the Bretton Wood fixed exchange rate. It is often
said that most countries go for managed float because no country will sit down for its currency to
fluctuate beyond expectation without any government intervention. This is the same case with Ghana
while on the face value, exchange rate practice is free float; the government sometimes intervene the
market to achieve some economic objectives like inflation and interest reduction.
There will not be any issue on currency exchange if the whole world uses one common currency
or monetary units. But single global monetary unit can only be an opinion but not a reality; hence there
exist foreign exchange,
In addition to the enhancement of international trade, exchange rate also makes it possible for
foreign direct investment and transaction. Again, international movement of people have become easier
through exchange rate system.
Ghana as a developing and import led country is much affected by exchange rates. The import
led feature of Ghana economy means that any fluctuation in exchange rate does not only affect the
country’s currency on the international market but almost the macro economic variables such as
inflation and interest rates. Further, Ghana economy, especially the purchasing behavior usually follow
specific pattern. For instance, rice and clothing purchases are much during the last month than any
other time and these are largely imported goods. Also doing the off farming season such as July-August
most people including farmers turn on imported rice because local food becomes expensive.
Moreover other economic factors which affect the exchange rate such as money supply also
experience some seasonality. To add up, the importation of oil as well as the export of cocoa which are
the major international commodity of the country also follows a certain pattern.
On these bases, people believe that the fluctuations of the Ghana Cedi against US – Dollar follow
particular trend within the year yet little research has been done to empirically validate these
assumption. In line with this, the study attempts to proof or otherwise the quarterly seasonality of the
Ghana Cedi against the US Dollar.
2.0 LITERATURE REVIEW
The study on seasonality of exchange rate across the world has not attracted much attention by
both empirical and theoretical researchers perhaps due to the mix trend of most currency rates.
While An and Kim (2011) found no seasonality between Japan Yen – US Dollar rate, Cellini and
Cuccia (2011) failed to identify any clear cut monthly time series of Euro- Dollar exchange rate. Similarly,
Roberto et.al (2013) found a significant weekday effects as well as some monthly effects but at
conditional mean dynamics on Euro-Dollar exchange rate. Contrary, in a related research Jimenez et.al
(2009) study on seasonality of exchange rate, observed that, no seasonality and integration of order
between Euro-Dollar exchange rates.
In an exploratory analysis on assumption of non-seasonality of exchange rate, Tiziana et.al
(2011) found that, there is significant seasonal component in monthly time series. But the seasonality is
IJRESS Volume 5, Issue 3 (March, 2015) (ISSN 2249-7382) International Journal of Research in Economics and Social Sciences (IMPACT FACTOR – 4.992)
International Journal of Research in Economics & Social Sciences Email id: [email protected], http://www.euroasiapub.org
131
less in recent data due to the global financial integration. Their argument was that, as people demand
more capital across the globe and capital easily flow, there is continuous need for foreign exchange
regardless of the time it may be during the year. The study made an extensive use of F-Test to evaluate
both stable seasonality and moving seasonality between the Euros and US Dollar through X – 12 –
ARIMA computation program.
A bank of Ghana working paper (2004) on Cedi – Dollar rates by Zakari and Afriye deduced the
following behavior of the Cedi against the US Dollar. While there is no clear cut seasonal pattern in the
first three (3) quarters of the year, the end of year economic activities pressures causes the exchange
rate to outbound the trend path in the last quarter. The last quarter force on the exchange rate can be
attributed to the Christmas buying behavior of Ghanaians. The strong fundamental economics in 1999
cause the exchange rate to move below this trend line which was the only exception to the seasonality
behavior of the Cedi – Dollar exchange rates.
Owusu and Mumumi (2004) argue that, both economic fundamental and speculation are the
influencing factors of exchange rate in Ghana. Their analysis indicates high inflation depreciates the Cedi
while high domestic Treasury bill rate appreciate the Cedi in the short run. This means, if the country has
seasonal inflation rate and Treasury bill rate then the exchange rate will also be seasonal.
An early study by Bawumia and Abradu (2003) also reveals the seasonal pattern of exchange
rate in Ghana. The study shows a steady depreciation in the first three (3) quarters against a peak
depreciation in the last quarter of the year. The study also indicates that unlike inflation, the exchange
rate responds to changes in the money supply immediately. Money supply is seasonal in nature with a
noticeable year end hump. Thus the seasonal behaviour of the exchange rate in Ghana can be explained
by money supply especially in the fourth quarter.
3.0 SEASONAL ECONOMIC ACTIVITIES IN GHANA Economic activities of the three main sectors of the Ghanaian economy fluctuate in diverse
magnitude during the course of the year. Activities of these sectors are influenced by seasonal patterns
that are caused by economic behavior or recurrent exogenous factors such as weather pattern, holidays,
religious events and festive seasons.
Of the three sectors, the service sector which encompasses information, communication, real
estate, professional, and administration and support services has been found to show no evidence of
seasonality as majority of the sector activities are carried out throughout the year with little or no
variations. However the tourism industry which comes under the umbrella of this sector exhibit some
form of seasonal pattern with increasing patronage during the festive occasions.
Industrial and commercial activities exhibit some seasonal pattern. During the peak seasons,
such as festive, holidays and religious seasons which usually occur during the 3rd and 4th quarters, the
sector experience a booming demand and supply mostly for household consumables, clothing and
recreational commodities. During these times, traders increase their import to restock their stores to
meet demand whiles producers import more raw materials for production.
Economic activities in the Agriculture sector – livestock, forestry and logging and fishing sub
sectors usually record a slow growth during the first and second quarters of the year. Agriculture in
Ghana continues to be rain fed which is dictated by the pattern of the rainy and dry season in country.
Cocoa which is one of the main export commodity of Ghana is usually harvested in September which is

IJRESS Volume 5, Issue 3 (March, 2015) (ISSN 2249-7382) International Journal of Research in Economics and Social Sciences (IMPACT FACTOR – 4.992)
International Journal of Research in Economics & Social Sciences Email id: [email protected], http://www.euroasiapub.org
132
the main season and may-august; the midseason. Since the cocoa revenue constitute a major source of
revenue to farmers, the time of harvest leads to increase in demand for industrial output and imports. A
noticeable characteristic of the Ghanaian economy is that any factors that increase demand for goods
and services also invariably leads to increase in import.
Each period within the year is dominated by the activities of a particular sector. The industrial
(manufacturing) sector is known to exert much pressure during the first three months of the year
through the importation of inventory. Due to the dominance of Multi-NationalCompanies (MNC) in the
country, most of the company’s inventories are imported from outside. Similarly, capital in both cash
and machinery also flows into the country for start of new investments. These opposing movements of
international transaction also exhibit an opposing force on the exchange rate. Whiles the inventory
imports are very high during January, the high capital inflow in the following subsequent months offset
the inventory pressure, thereby strengthen the Cedis at the end of the quarter. These capital inflows
also include government borrowings and grants.
The second quarter which begins the farming season of the country does not see much of
international business except for the expiration of company returns in the April. Both the accounting
year and fiscal year of the country ends in December with auditing and subsequent Annual General
Meeting at the end of the first quarter. As usual, MNC repatriate their returns after AGM hence the Cedi
is expected to depreciate due to the demand for US-Dollars for transfers. But this phenomenon is
significantly to influence the Cedi as most companies retain much of profit for reinvestment.The farming
season used to be locally dependent in both inputs and methods. The revolution of crop production
through the massive application of chemicals has brought some international influence on the farming
season. Recent trend shows that, there is much preference for imported agricultural chemicals by
farmers which also exert some pressure on the Ghana Cedi – US Dollar rate. These pressures are not a
problem, because only few farmers have access to the imported chemicals.
The farming season continues through the third quarter with harvesting of the crops. The labour
intensive as well as the subsistence nature of the agricultural sector make the season less influential
period on exchange rate. Traditional, the first month of the quarter is known to be learn economic
period with hardship as farmers wait for their produces
The final quarter is known to be the lighting season of the country’s economy in terms of
business activities. This is usual due to the Christian dominance of the country coupled with the cocoa
production season. The festive seasons mainly Christmas brings in lots of household purchases which
are imported goods. The Cocoa beans which is the major export of the country also brings in some
Dollars. Interestingly, the high demand for imported goods during the season out-weights the Dollars
from cocoa exports. Cocoa farmers also exert more pressure on the imported goods when the cocoa
money lands in their pockets. These cause high depreciation of the Cedi at the end of the year.
4.0 METHODOLOGY The study seeks to establish whether or not a unique seasonal pattern exists on exchange rate in
Ghana. A quarterly data on interbank exchange rate for a period spinning from 2000 to 2014 have been
IJRESS Volume 5, Issue 3 (March, 2015) (ISSN 2249-7382) International Journal of Research in Economics and Social Sciences (IMPACT FACTOR – 4.992)
International Journal of Research in Economics & Social Sciences Email id: [email protected], http://www.euroasiapub.org
133
used for the analysis. All data are sourced from Bank of Ghana (BOG) time series data base. Each
monthly data is the daily is daily average of interbank exchange rate as provided by the BOG
4.1 Test of seasonality
The D8 F-test is employed to test for the presence of stable and moving seasonality based on
one way analysis of variance (ONE-WAY ANOVA).
The Kruskall-Wallis statistic, (K-statistics), which evaluates the equality of median values across
Different quarters (a value of this statistic falling into the rejection region means that median Values are
not constant across quarters) is also employed to lend consistent conclusion to the results.All of the
mentioned tests are computed by the X-12 census-ARIMA program, which is the program provided by
the US Census Bureau for evaluating (and disentangling) the seasonal components of time series.
The following hypothesis is tested:
H0: Q1=Q2=Q3=Q4(seasonality is not present in the data)
AgainstH1: QP ≠Qq
Where (Q1, Q2, Q3, Q4- quarterly means)
The decomposed variance is given as
(𝑥 𝑛𝑗𝑖=1
𝑘𝑗=1 ij-𝑥 )
2= 𝑛𝑗𝑘𝑗=𝑖 (𝑥 𝑗 − 𝑥 ) 2 + 𝑛𝑗(𝑘
𝑗=1 𝑥 𝑖𝑗-𝑥 j) 2
The total variance will be broken down into two; variance of the average due to seasonality and
variance due to residual
F = 𝑛𝑗𝑘
𝑗=𝑖 𝑥 𝑗−𝑥𝐺 2/ K−1
𝑛𝑗 (𝑘𝑗 =1 𝑥 𝑖𝑗 −𝑥 j) 2/n−k
4.2 Model specification
The paper further uses regression model based on seasonal dummies to test if there is a
significant difference among exchange rate in each quarter of the year. The regression model estimates
the impact of each quarter of the years on interbank exchange rate.
Yt = β0 +β1Q1+β2Q2+β3Q3+ut
Where
Yt is interbank bank exchange rate at time t, β0, is the intercept (measures the mean exchange
rate for the fourth quarter. Q1, Q3, Q4 are seasonal dummies for the first, third and fourth quarter
respectfully. The second quarter is omitted as a reference category
And Ut is the classical stochastic error term.
5.0 ANALYSIS AND DISCUSSION
5.1 Trend analysis
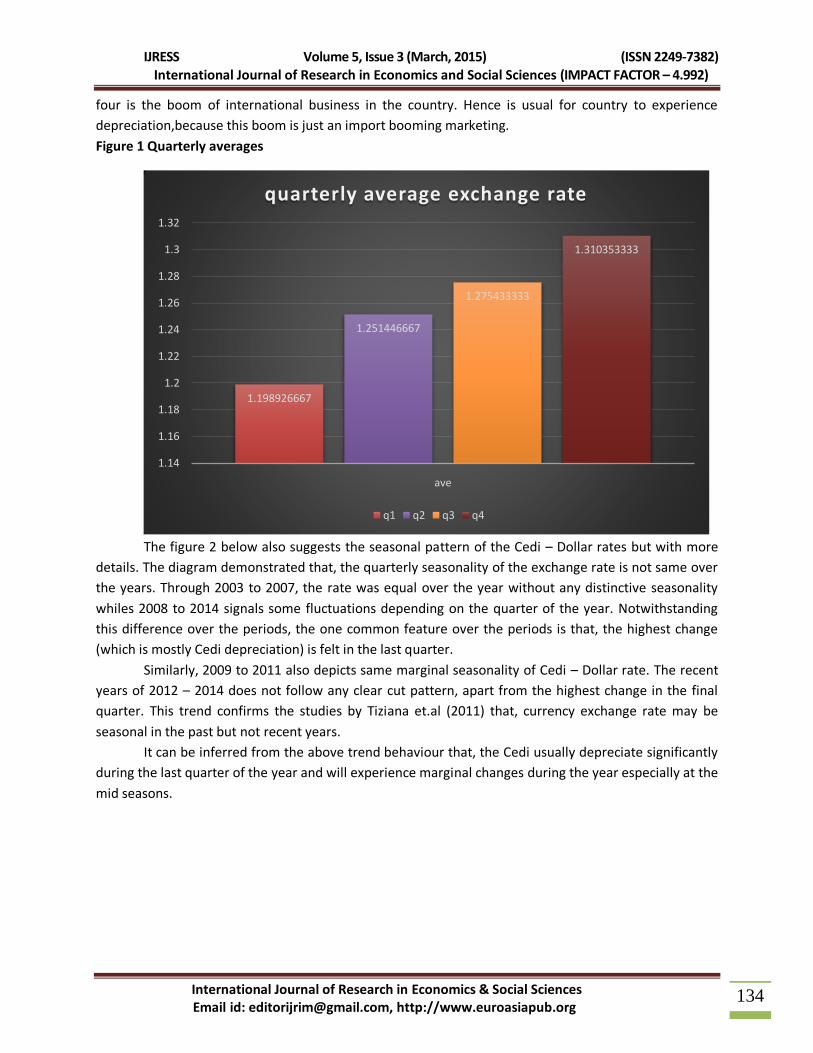
As it can be seen from figure 1, the Cedi depreciates as the quarters goes by. That is the
depreciation increases throughout the year with the highest in the last quarter. But this depreciation is
not equal among all the quarter. Whiles the change from the first quarter to second is about 5%; that of
second tothird quarter is 1.6% with last quarter percentage change to be 3%. This implies that, the Cedi-
Dollar change vary much between the first two quarters but marginal from the third quarter. This
margin change can be attributed to the fact that there is no much international activities during these
period in the country. As it has be discussed under the economic pattern of the country, the quarter
IJRESS Volume 5, Issue 3 (March, 2015) (ISSN 2249-7382) International Journal of Research in Economics and Social Sciences (IMPACT FACTOR – 4.992)
International Journal of Research in Economics & Social Sciences Email id: [email protected], http://www.euroasiapub.org
134
four is the boom of international business in the country. Hence is usual for country to experience
depreciation,because this boom is just an import booming marketing.
Figure 1 Quarterly averages
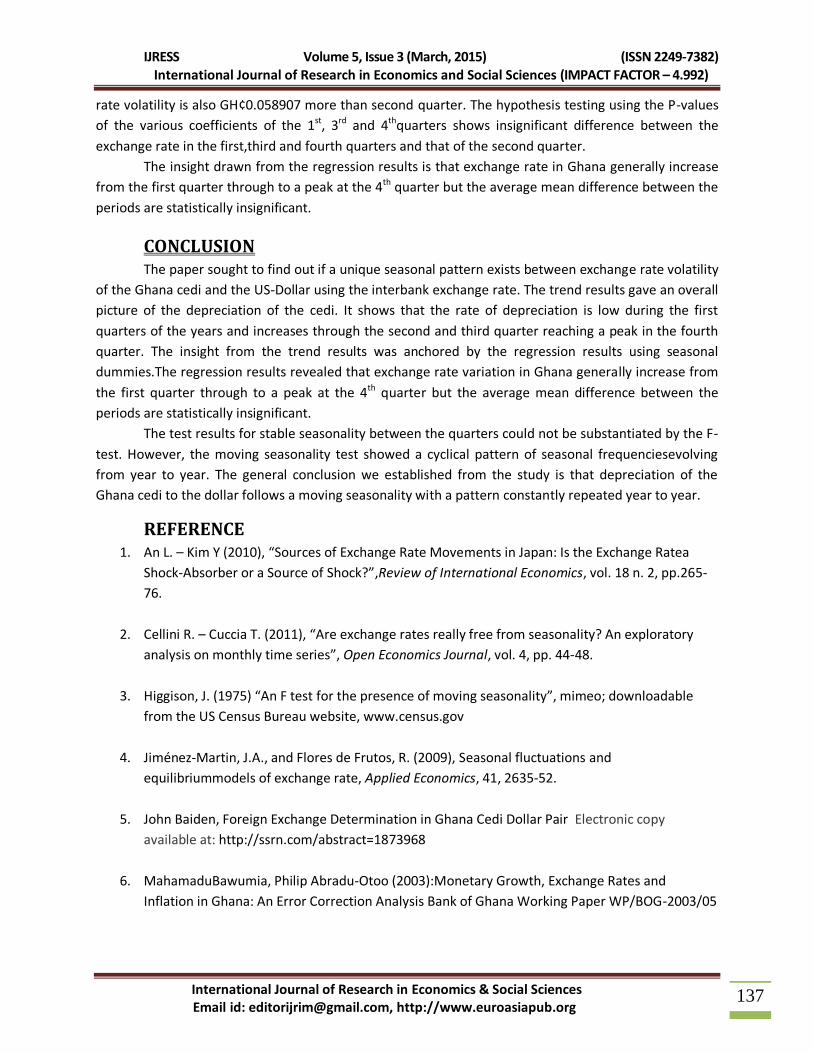
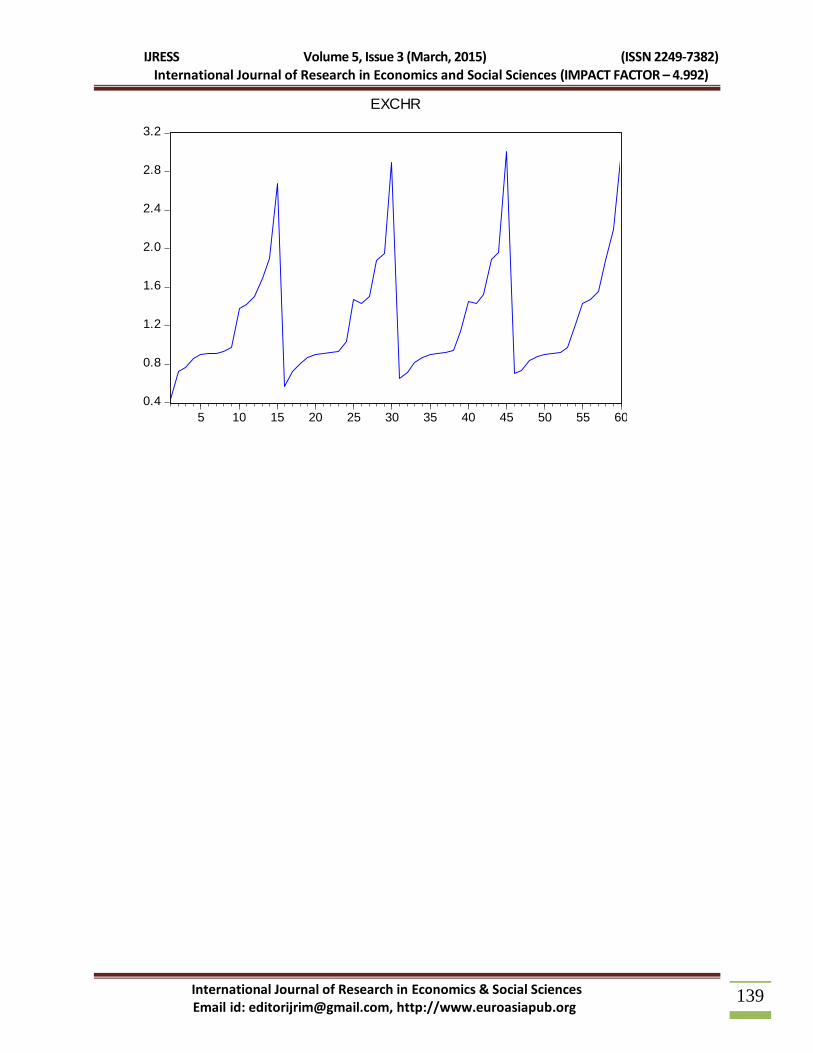
The figure 2 below also suggests the seasonal pattern of the Cedi – Dollar rates but with more
details. The diagram demonstrated that, the quarterly seasonality of the exchange rate is not same over
the years. Through 2003 to 2007, the rate was equal over the year without any distinctive seasonality
whiles 2008 to 2014 signals some fluctuations depending on the quarter of the year. Notwithstanding
this difference over the periods, the one common feature over the periods is that, the highest change
(which is mostly Cedi depreciation) is felt in the last quarter.
Similarly, 2009 to 2011 also depicts same marginal seasonality of Cedi – Dollar rate. The recent
years of 2012 – 2014 does not follow any clear cut pattern, apart from the highest change in the final
quarter. This trend confirms the studies by Tiziana et.al (2011) that, currency exchange rate may be
seasonal in the past but not recent years.
It can be inferred from the above trend behaviour that, the Cedi usually depreciate significantly
during the last quarter of the year and will experience marginal changes during the year especially at the
mid seasons.
1.198926667
1.251446667
1.275433333
1.310353333
1.14
1.16
1.18
1.2
1.22
1.24
1.26
1.28
1.3
1.32
ave
quarterly average exchange rate
q1 q2 q3 q4

IJRESS Volume 5, Issue 3 (March, 2015) (ISSN 2249-7382) International Journal of Research in Economics and Social Sciences (IMPACT FACTOR – 4.992)
International Journal of Research in Economics & Social Sciences Email id: [email protected], http://www.euroasiapub.org
135
Figure 2 Quarterly Trend of Cedi-Dollar rates
5.2 D8 F- Test of stable and moving seasonality
Table 1.0
D8 F-test Stable seasonality
Sum of squares Df
Mean square
f-value
Between quarters 25.7128 3 8.57093 5.946
Residual 80.7211 56
1.44145
total 106.4339 59
0
0.5
1
1.5
2
2.5
3
3.5
1998 2000 2002 2004 2006 2008 2010 2012 2014 2016
Quarterly trend of exchange rate(cedi -US dollar
q1 q2 q3 q4

IJRESS Volume 5, Issue 3 (March, 2015) (ISSN 2249-7382) International Journal of Research in Economics and Social Sciences (IMPACT FACTOR – 4.992)
International Journal of Research in Economics & Social Sciences Email id: [email protected], http://www.euroasiapub.org
136
F-test of moving seasonality
Between Years
31.2862 14
2.234728 3.063*
Error 30.6403 42
0.729531
Kruskal –Wallis stastistics
Degrees of freedom
Probability level
20.0142* 3 0.017%
*evidence of seasonality presence at 1% significant level
The D8 F-test (FS)was used to test the hypothesis of equal means of the quarterly exchange rate.
If the F- test supports the Null hypothesis of no seasonality then the time series are considered to be
non-seasonal. A consistent conclusion is also given by the Kruskal-Wallis non parametric test.The test
results gave no evidence of stable seasonality of exchange rate between the Ghana cedi and the US
dollar. The K- statistic was however unable to support the results of no stable seasonality as it was found
to be significant at 1% level.
The F-test for moving seasonality across the years showed an evidence of seasonality at 1%
level. This is consistent with the K-statistic.it shows that intra year variation in the exchange rate series is
repeated constantly or evolves from year to year.
5.3 Regression Results
Dependent variable: EXCHR
The intercept value of GH¢1.251447 measures the average exchange rate for the second quarter
which was chosen as a reference category. The coefficient of the first quarter shows that the first
quarter’s average exchange rate isGH¢ 0.052520 less than the second quarter.
D3, the slope coefficient for the third quarter shows that the mean exchange rate in third
quarter is GH¢0.052520 higher than the mean value in the second quarter. The fourth quarter exchange
Variable C
oefficient
St
d. Error
t-
Statistic
P
rob.
C 1
.251447
0.
159326
7.
854630
0
.0000
D1 -
0.052520
0.
225321
-
0.233090
0
.8165
D3 0
.023987
0.
225321
0.
106456
0
.9156
D4 0
.058907
0.
225321
0.
261434
0
.7947
IJRESS Volume 5, Issue 3 (March, 2015) (ISSN 2249-7382) International Journal of Research in Economics and Social Sciences (IMPACT FACTOR – 4.992)
International Journal of Research in Economics & Social Sciences Email id: [email protected], http://www.euroasiapub.org
137
rate volatility is also GH¢0.058907 more than second quarter. The hypothesis testing using the P-values
of the various coefficients of the 1st, 3rd and 4thquarters shows insignificant difference between the
exchange rate in the first,third and fourth quarters and that of the second quarter.
The insight drawn from the regression results is that exchange rate in Ghana generally increase
from the first quarter through to a peak at the 4th quarter but the average mean difference between the
periods are statistically insignificant.
CONCLUSION The paper sought to find out if a unique seasonal pattern exists between exchange rate volatility
of the Ghana cedi and the US-Dollar using the interbank exchange rate. The trend results gave an overall
picture of the depreciation of the cedi. It shows that the rate of depreciation is low during the first
quarters of the years and increases through the second and third quarter reaching a peak in the fourth
quarter. The insight from the trend results was anchored by the regression results using seasonal
dummies.The regression results revealed that exchange rate variation in Ghana generally increase from
the first quarter through to a peak at the 4th quarter but the average mean difference between the
periods are statistically insignificant.
The test results for stable seasonality between the quarters could not be substantiated by the F-
test. However, the moving seasonality test showed a cyclical pattern of seasonal frequenciesevolving
from year to year. The general conclusion we established from the study is that depreciation of the
Ghana cedi to the dollar follows a moving seasonality with a pattern constantly repeated year to year.
REFERENCE 1. An L. – Kim Y (2010), “Sources of Exchange Rate Movements in Japan: Is the Exchange Ratea
Shock-Absorber or a Source of Shock?”,Review of International Economics, vol. 18 n. 2, pp.265-
76.
2. Cellini R. – Cuccia T. (2011), “Are exchange rates really free from seasonality? An exploratory
analysis on monthly time series”, Open Economics Journal, vol. 4, pp. 44-48.
3. Higgison, J. (1975) “An F test for the presence of moving seasonality”, mimeo; downloadable
from the US Census Bureau website, www.census.gov
4. Jiménez-Martin, J.A., and Flores de Frutos, R. (2009), Seasonal fluctuations and
equilibriummodels of exchange rate, Applied Economics, 41, 2635-52.
5. John Baiden, Foreign Exchange Determination in Ghana Cedi Dollar Pair Electronic copy
available at: http://ssrn.com/abstract=1873968
6. MahamaduBawumia, Philip Abradu-Otoo (2003):Monetary Growth, Exchange Rates and
Inflation in Ghana: An Error Correction Analysis Bank of Ghana Working Paper WP/BOG-2003/05

IJRESS Volume 5, Issue 3 (March, 2015) (ISSN 2249-7382) International Journal of Research in Economics and Social Sciences (IMPACT FACTOR – 4.992)
International Journal of Research in Economics & Social Sciences Email id: [email protected], http://www.euroasiapub.org
138
7. Roberto Cellini and TizianaCuccia(2011)Are exchange rates really free from seasonality? An
exploratory analysis on monthly time series Munich Personal RePEc Archive
8. Roberto Cellini and TizianaCuccia (2013): Seasonal Processes in the Euro - US Dollar Daily
Exchange Rate University of Catania, Department of Economics and Business Electronic copy
available at: http://ssrn.com/abstract=2097704
9. ZakariMumuni Emmanuel Owusu-Afriyie (2004): Determinants of the Cedi/Dollar Rate of
Exchange in Ghana: A Monetary Approach; Bank of Ghana working paper WP/BOG-2004/06
Appendix
Category Statistics
Std.
Err.
Vari
able
Coun
t
Mea
n
Std.
Dev.
of
Mean
Q1 15
1.19
8927
0.57
2598
0.14
7844
Q2 15
1.25
1447
0.61
5024
0.15
8799
Q3 15
1.27
5433
0.63
0766
0.16
2863
Q4 15
1.31
0353
0.64
7377
0.16
7152
All 60
1.25
9040
0.60
2562
0.07
7790
IJRESS Volume 5, Issue 3 (March, 2015) (ISSN 2249-7382) International Journal of Research in Economics and Social Sciences (IMPACT FACTOR – 4.992)
International Journal of Research in Economics & Social Sciences Email id: [email protected], http://www.euroasiapub.org
139
0.4
0.8
1.2
1.6
2.0
2.4
2.8
3.2
5 10 15 20 25 30 35 40 45 50 55 60
EXCHR


