Embed Size (px)
Citation preview
1
Carry Trades, Interest Differentials, and International Monetary Reform
Ronald McKinnon1 Stanford University
Abstract (before August 2011)
The international dollar standard is malfunctioning. Near zero U.S. short-term interest rates launch massive hot money outflows by carry traders into Emerging Markets (EM) in Asia and Latin America. Each EM central bank buys dollars to prevent its currency from appreciating but loses monetary control. Despite EM currency appreciation, average inflation in EMs is now much higher than in the old industrial economies—and world commodity prices are bid up sharply. This inflation on the dollar’s periphery only registers in the U.S. CPI with a long lag. But the more immediate effect of the Fed’s zero interest rate is to upset the process of bank intermediation within the American economy. Bank credit continues to be weak while employment languishes.
Addendum (as of April 18, 2012)
The (second) avalanche of hot money outflows into emerging markets (EM) began when the Fed reduced the interest rate on Federal Funds to virtually zero in December 2008—and other industrial countries followed suit. But the outbreak of a banking crisis in Europe with counter party risk in the summer of 2011 led to a global tightening of bank credit on which “carry traders” depend for financing hot money flows and long positions in primary commodities. So they had to sell off their foreign exchange (mainly EM) assets and long positions in commodities to get back into dollars or yen. The result is that EM currencies and commodity prices—with the exception of the price of oil— fell and remained weak through December 2011, while the dollar strengthened and the Japanese government intervened several time in the last half of 2011 to prevent the yen from appreciating.
This cycle illustrates the main point of the paper: wide interest rate differentials across currencies make the world monetary system much more fragile whatever the exchange rate regime. “Reform” efforts should focus much more on international monetary harmonization that limits interest differentials while accepting the need for exchange rate buffers, such as capital controls, to limit hot money flows. Once the European banking crisis recedes (if ever), the large interest differential—near zero interest rates in the United States and much higher natural interest rates in the high growth EMs—will, in 2012, set off another cycle of hot money flows from the center to the periphery with rising commodity prices.
1 This paper is an adaption of Chapter 5 in the author’s forthcoming book The Unloved World Dollar Standard: From 1945 to the Rise of China , Oxford University Press, 2012
2
Introduction
In reforming the international monetary system, exchange rates usually get primary attention front and center—such as in numerous meetings of the Group of 20. Nobody wants a replay of the destructive beggar-thy-neighbor exchange rate depreciations of the 1930s.
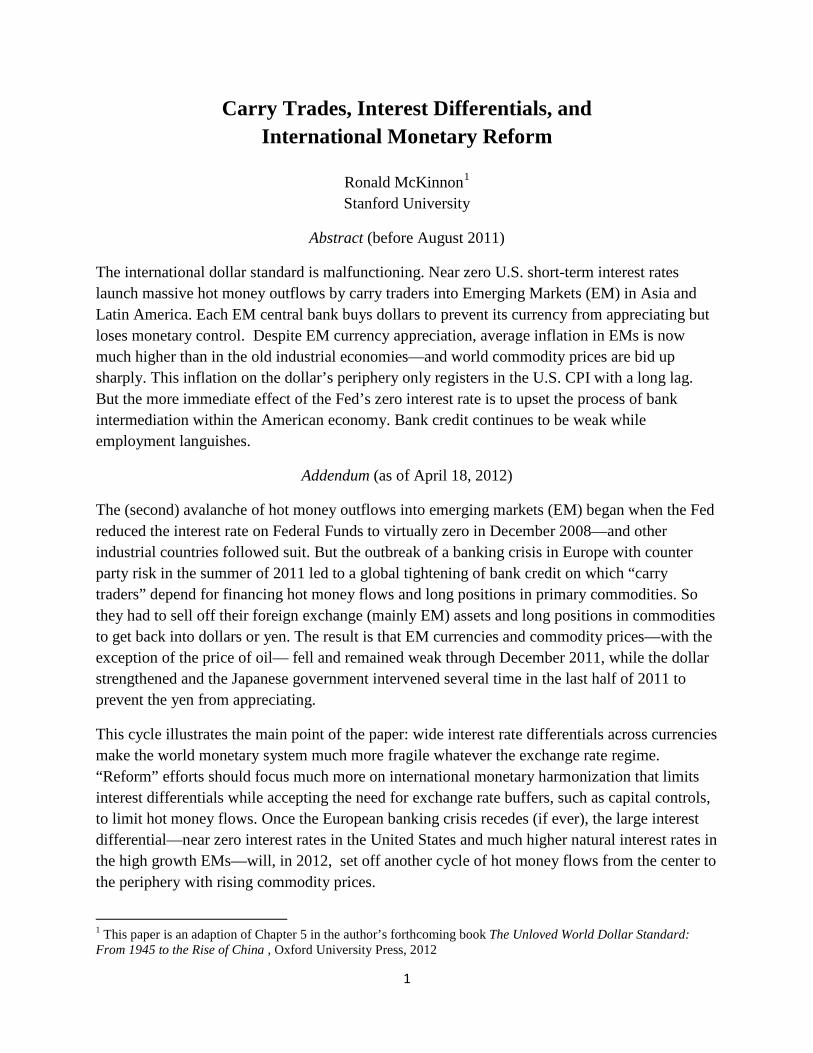
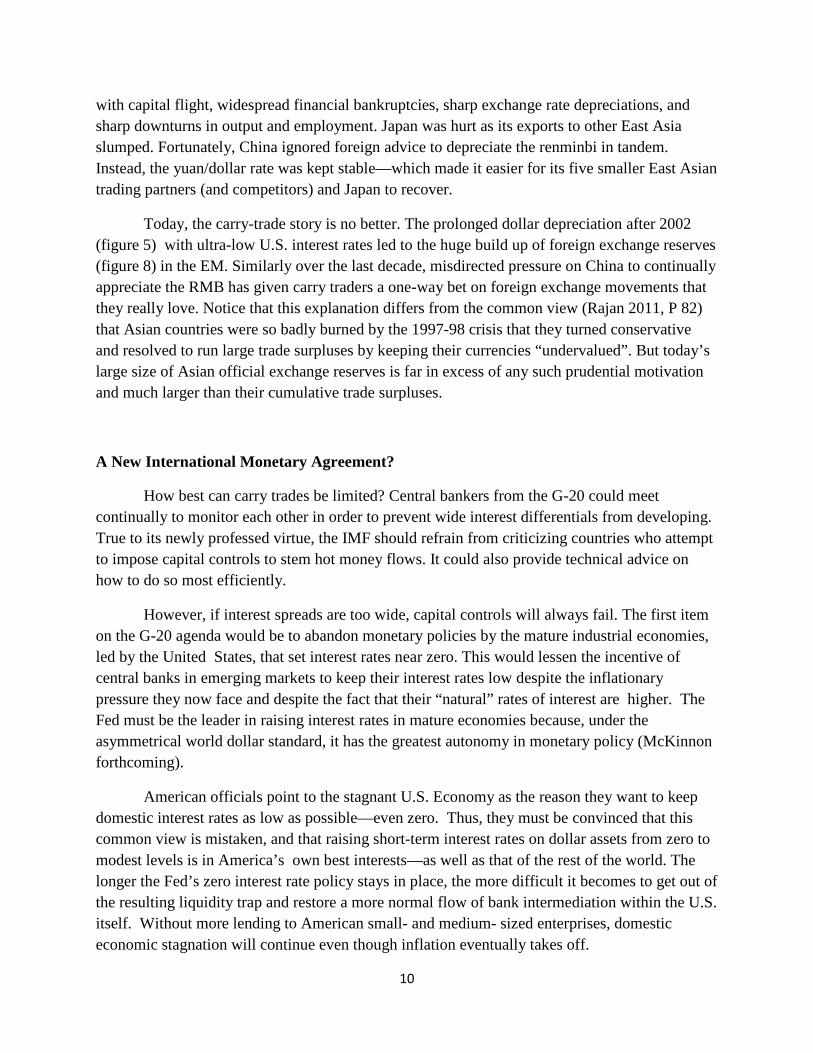
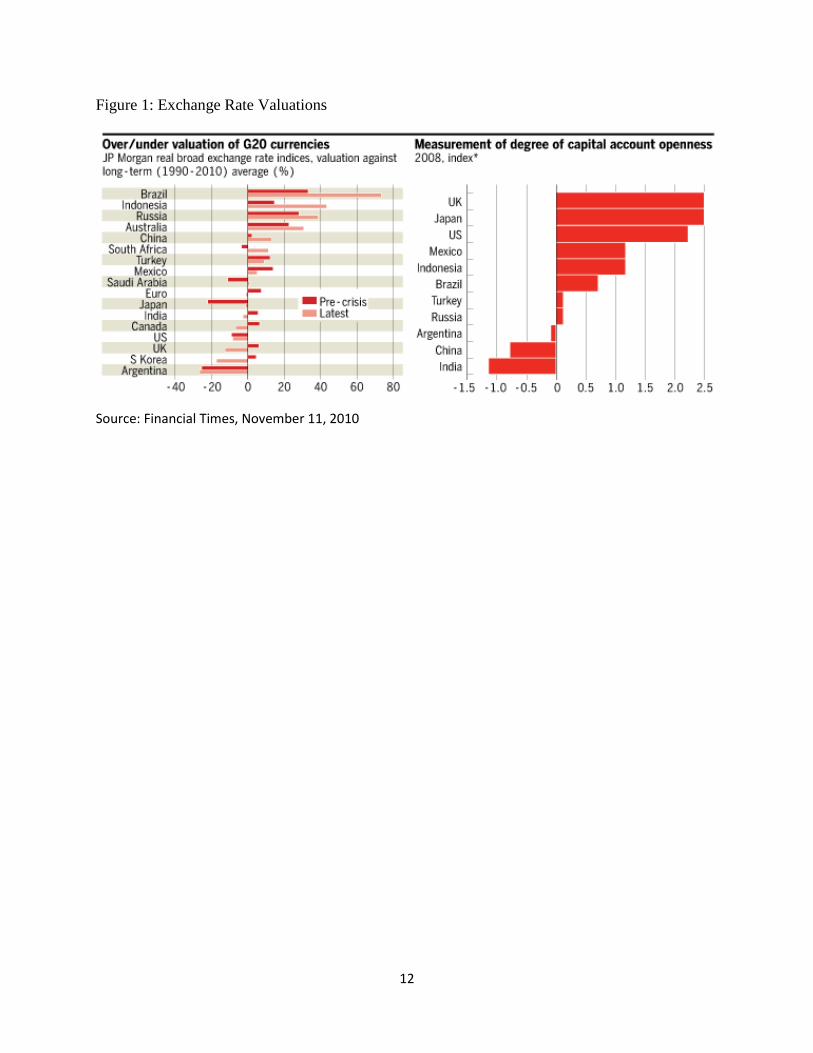
But at the G-20 meeting in November 2010, President Obama attacked China for not appreciating. In the dollar-based world of East Asia, China’s monetary policy has been oriented toward keeping the yuan/dollar rate fairly stable since 1994, when it unified its exchange rate system and went to current-account convertibility under the IMF’s article VIII. This policy of exchange rate stability served China well as a nominal anchor for its domestic price level, and to balance exchange relationships with its smaller neighbors (McKinnon and Schnabl, 2011). In addition, the left hand panel of the Figure 1 shows no clear evidence that China’s exchange rate is undervalued vis-à-vis Europe or the United States relative to their “real” multilateral exchange rates averaged over the past 20 years.
Not finding any agreement on exchange rate practices, the G-20 meetings shifted to trade imbalances. Last November, the United States suggested that countries with trade surpluses cap them at, say, 4 percent of GDP. But trade surpluses simply reflect net saving surpluses: the difference between national saving and investment. And in market economies, governments don’t directly control either. Nor, contrary to popular opinion and the proponents of “China bashing” to appreciate the RMB, can exchange appreciation be used as an instrument to reduce any creditor country’s saving (trade) surplus (Qiao 2007, McKinnon and Schnabl 2010).
Moreover, the U.S. weakened its position by not following through: it did not pledge to eliminate its saving deficiency, i.e., to reduce its fiscal deficit and to raise the woefully deficient saving of American households. But, eventually, for global imbalances to be corrected, surplus countries must consume more while the saving-deficient United States consumes much less. However, in view of the dramatic November impasse of the G-20 and continuing stalemate in 2011 on exchange rate and U.S. fiscal issues, better to let sleeping dogs lie.
Interest Differentials, Carry trades, and Worldwide Inflation
With exchange rates and trade balances off the table for now, what remains for constructive international monetary reform? Almost all emerging markets (EM) at the G-20 meeting in November 2010, and even more now in 2012, complain about ultra-low interest rates at the “center” inducing hot money flows to the “periphery”. With today’s two-speed world recovery, the slowly growing mature industrial countries—the United States, Europe, and Japan—have cut short-term interest rates very low.
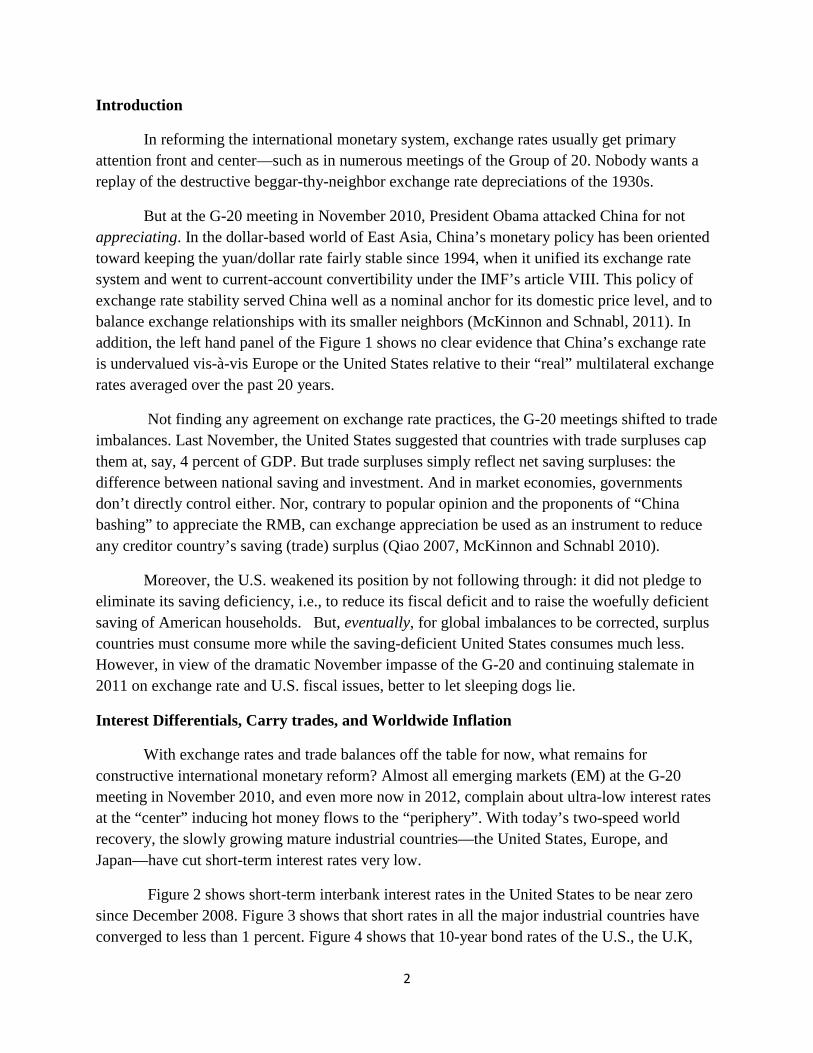
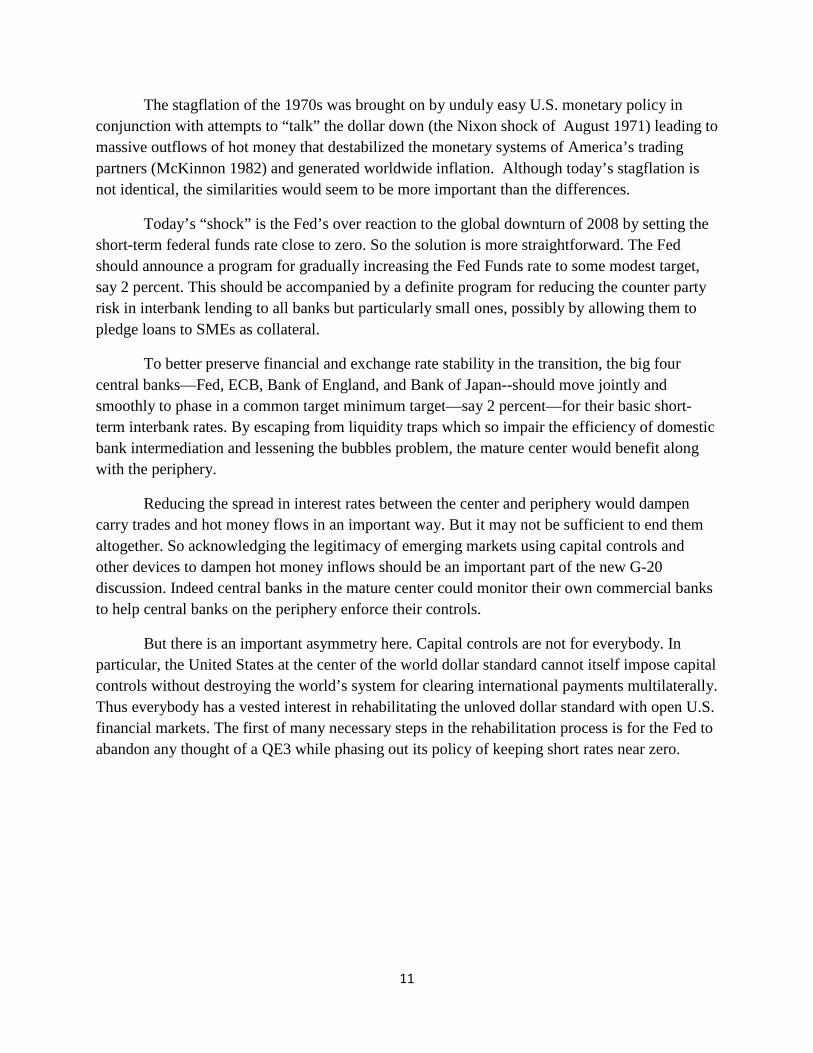
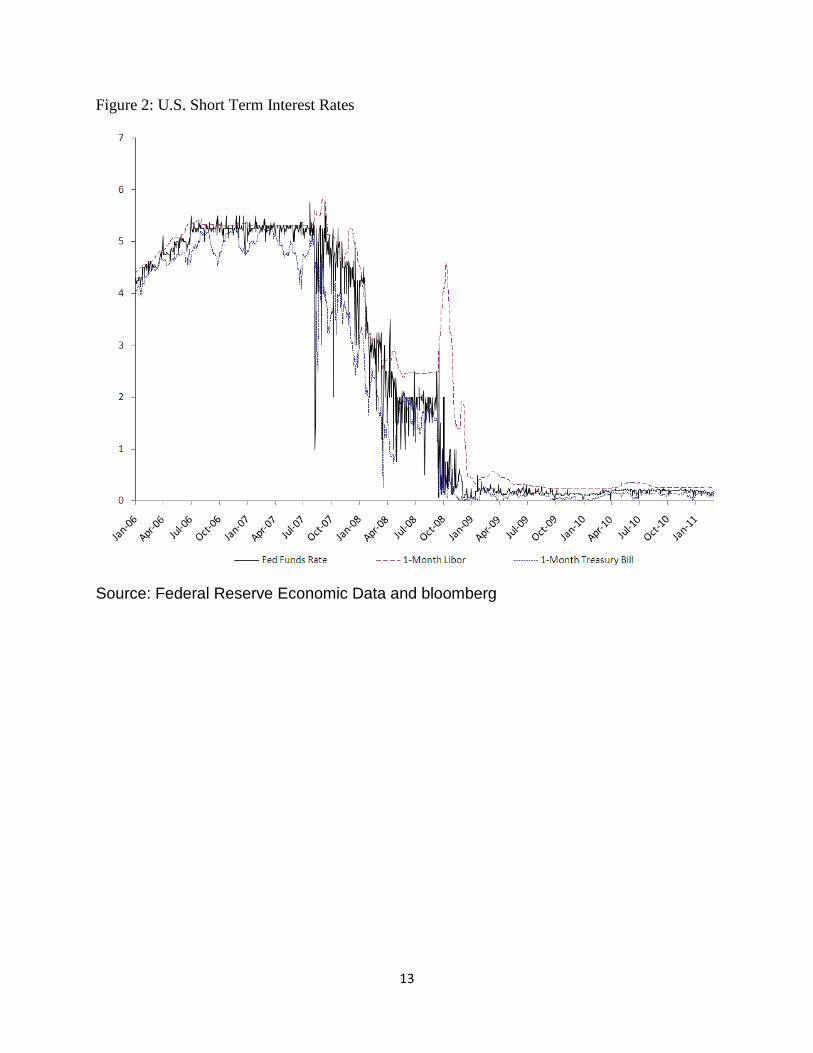
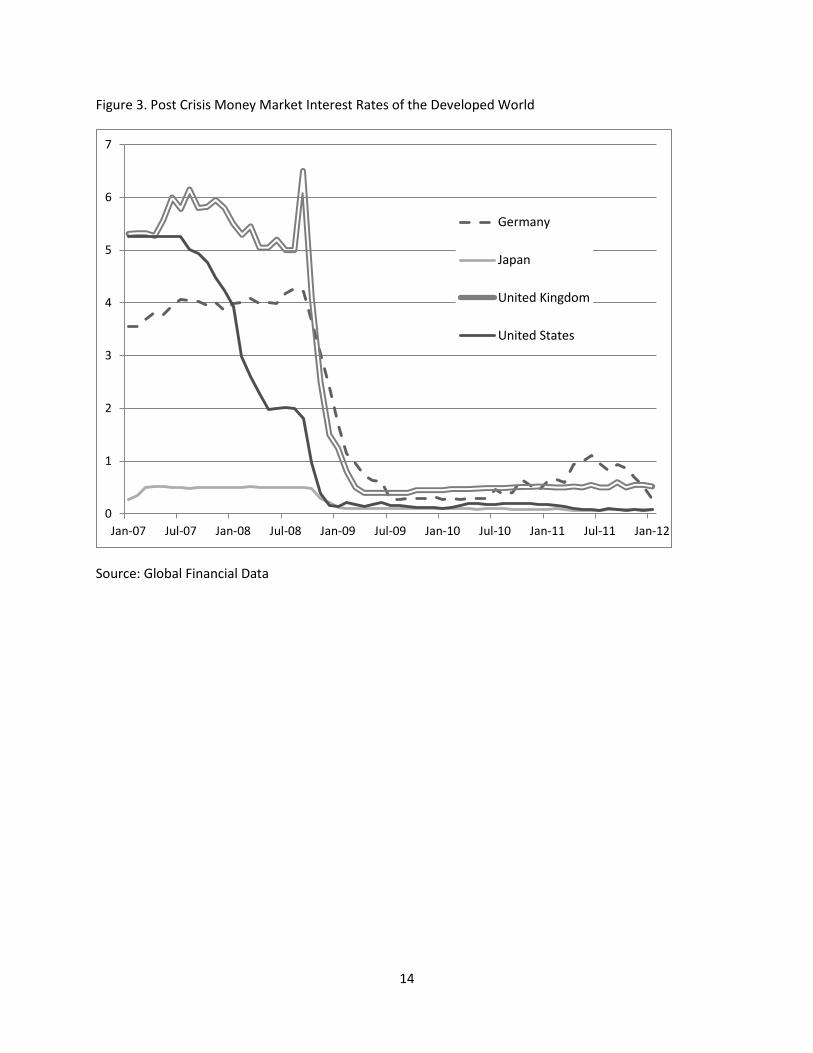
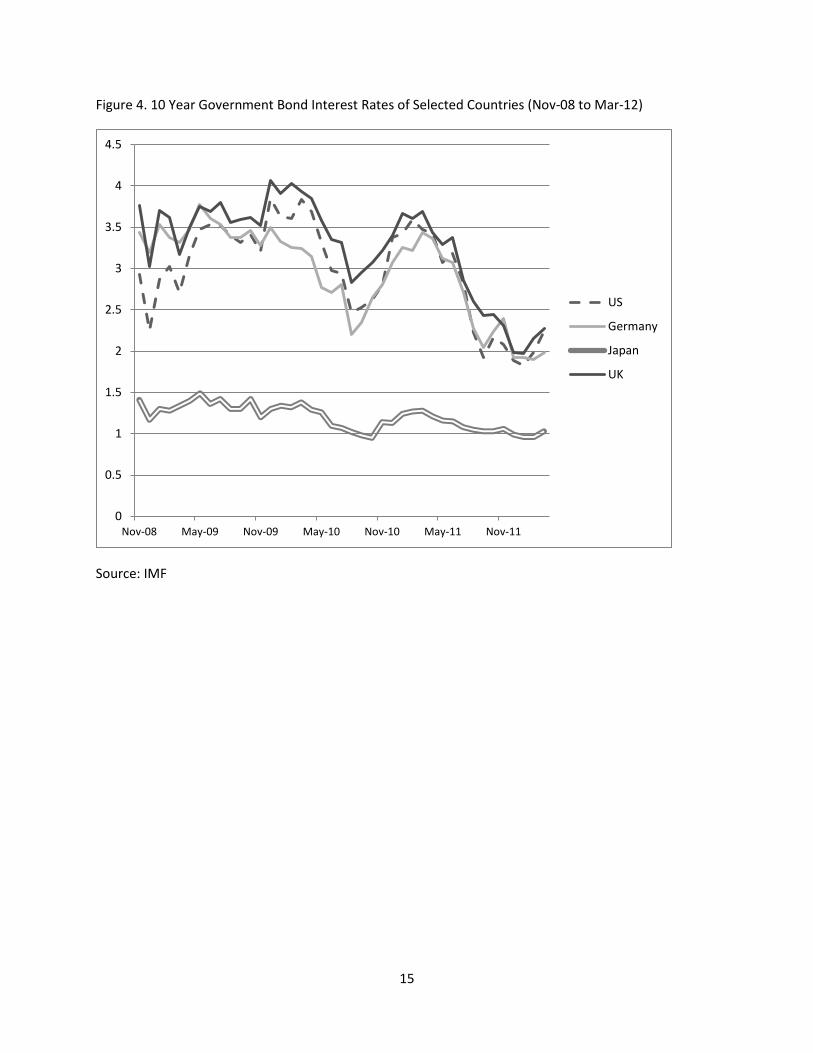
Figure 2 shows short-term interbank interest rates in the United States to be near zero since December 2008. Figure 3 shows that short rates in all the major industrial countries have converged to less than 1 percent. Figure 4 shows that 10-year bond rates of the U.S., the U.K,
3
and Germany, have a fallen in 2012 to just 2 percent; whereas Japan, which has been in a low interest liquidity trap since the mid 1990s, shows a 10-year bond rate of just 1 percent. Because Fed Chairman Ben Bernanke has “forecast” that U.S. short rates will remain near zero at least until 2014, the presumption is that U.S. long rates will continue to fall. (Remember, that long rates today are just the sum of expected short rates into the future plus a liquidity premium.) In addition, the U.S. Federal Reserve’s operation twist, i.e. replacing long term bonds with short term, exacerbated the disparity in interest rates between the U.S. financial markets and those of the emerging markets on the periphery. In 2010-2012, the resulting “carry trade” to exploit these wide interest differentials has again induced a flood of hot money into emerging markets—which have higher growth and naturally higher interest rates.
Brazillian President Dilma Rousseff delivered the latest salvo in a global debate over currencies pitting the emerging economies against rich ones, telling President Barack Obama that an expansive U.S. monetary policy meant to drive growth at home is harming Brazil and other developing countries.
The U.S. decision to leave benchmark lending rates near zero created an overload of speculative money that floods into economies like Brazil, leading to overvalued local currencies and uncompetitive factories, “thus impairing growth ….in emerging countries,” Ms Rousseff said on the first day of a two-day visit to the U.S. …She delivered a similar complaint about lose euro-zone monetary policy to Germany’s Angela Merkel during a visit there. Wall Street Journal, April 9, 2012
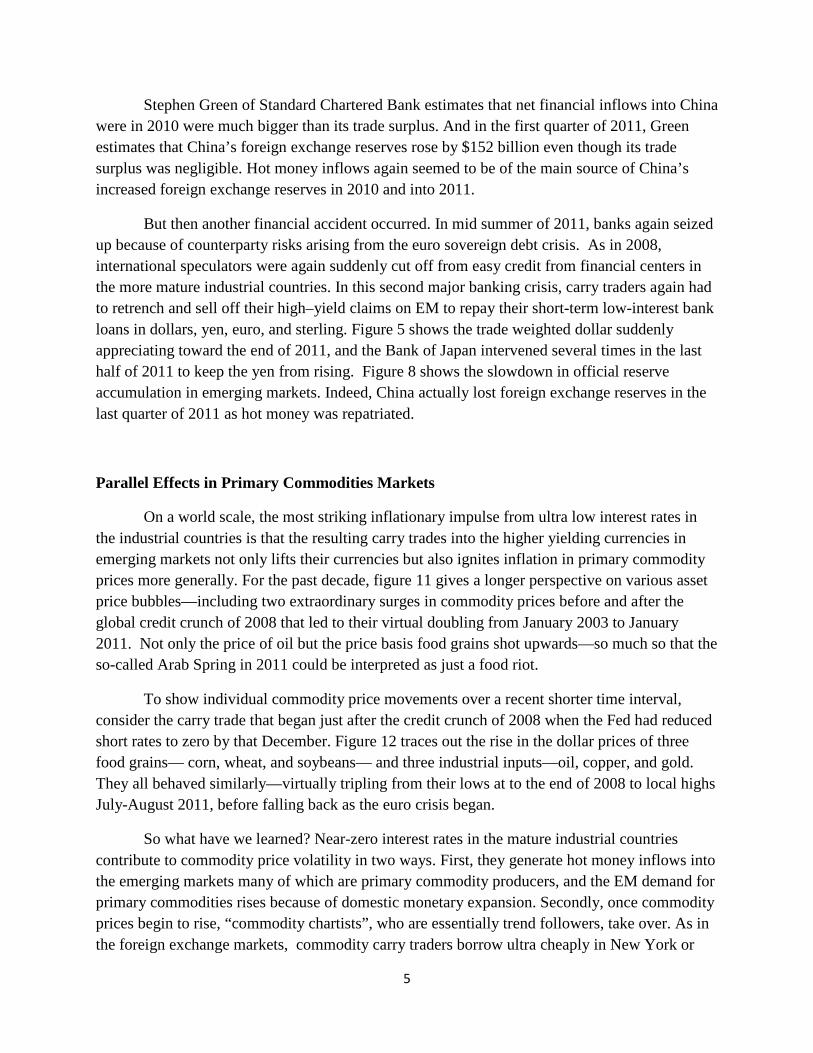
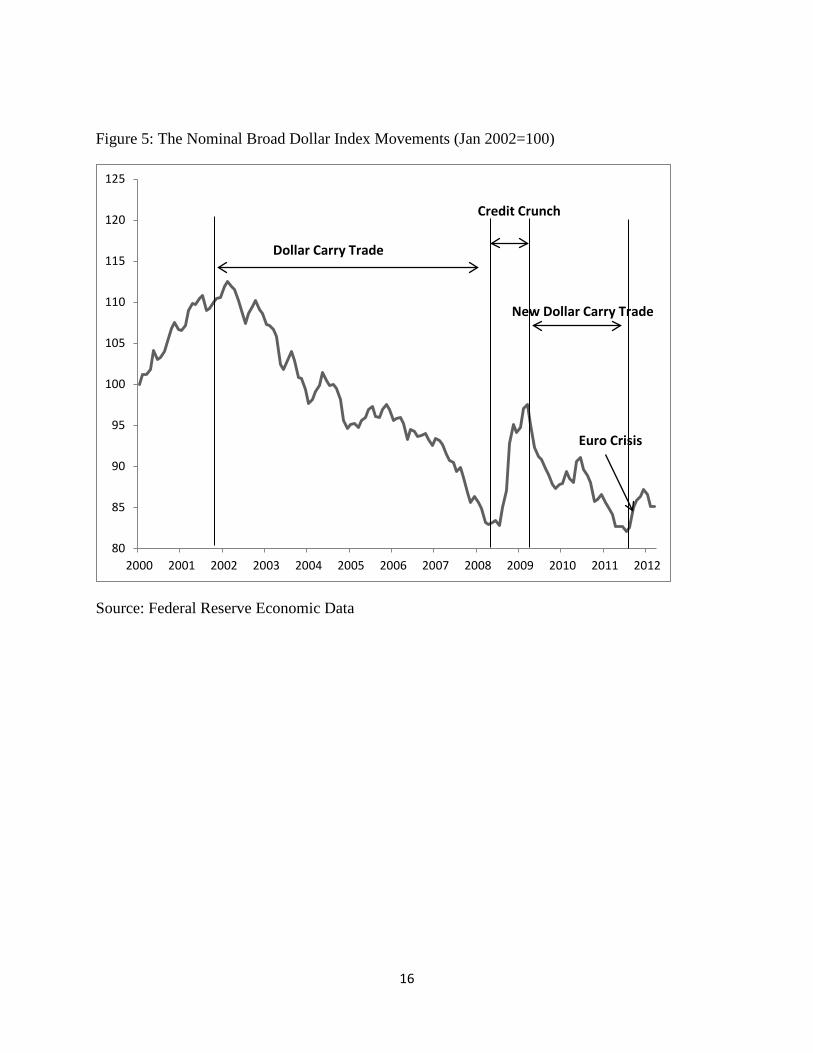
But this carry trade problem has been going on for more than a decade. Although interrupted by the credit crunch in the last half of 2008 into 2009 when the crisis demand for dollars shot upward, the dollar’s trade-weighted nominal exchange rate has been depreciating since 2002 through 2011 (Figure 5). The main pressure comes from the Fed keeping interest rates, on average, below those prevailing in most industrial countries, and much below “natural” rates of interest in emerging markets. The federal funds rate had been reduced to just 1 percent in 2003-04—an over-reaction to the collapse in 2001-02 of the dot com stock market bubble. And the Fed was unduly slow to increase the rate in the face of real estate and commodity price bubbles before the 2008 banking crisis (Taylor 2009).
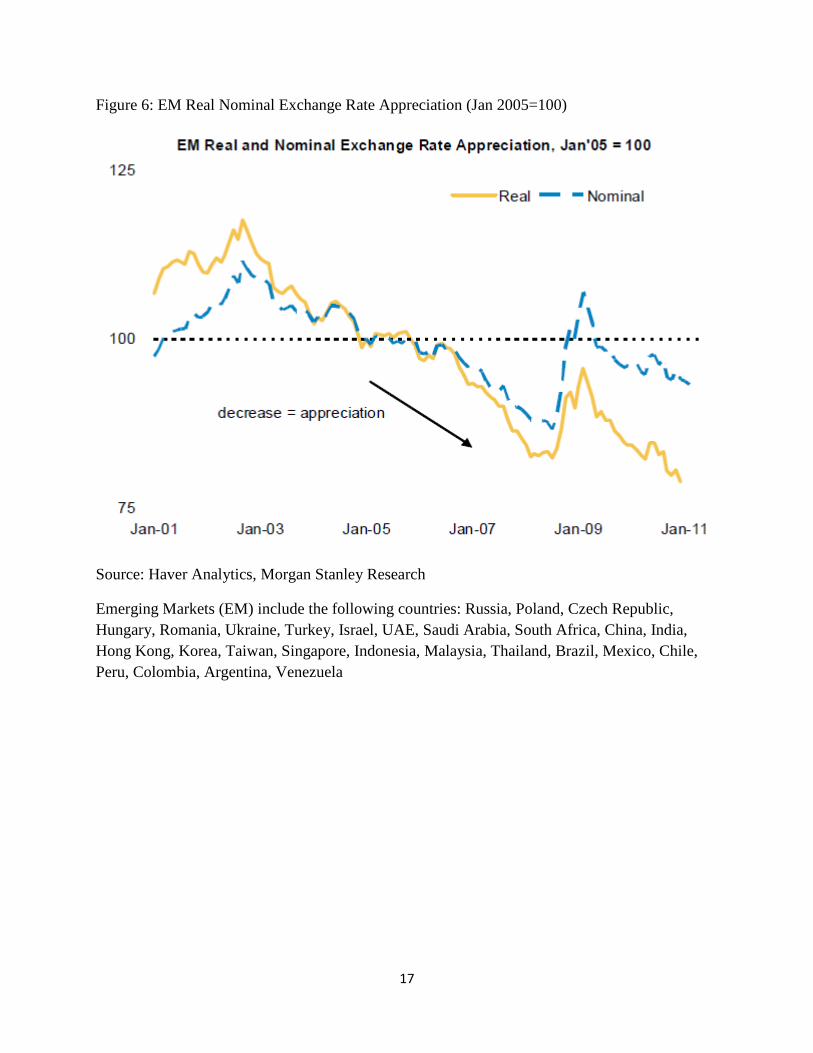
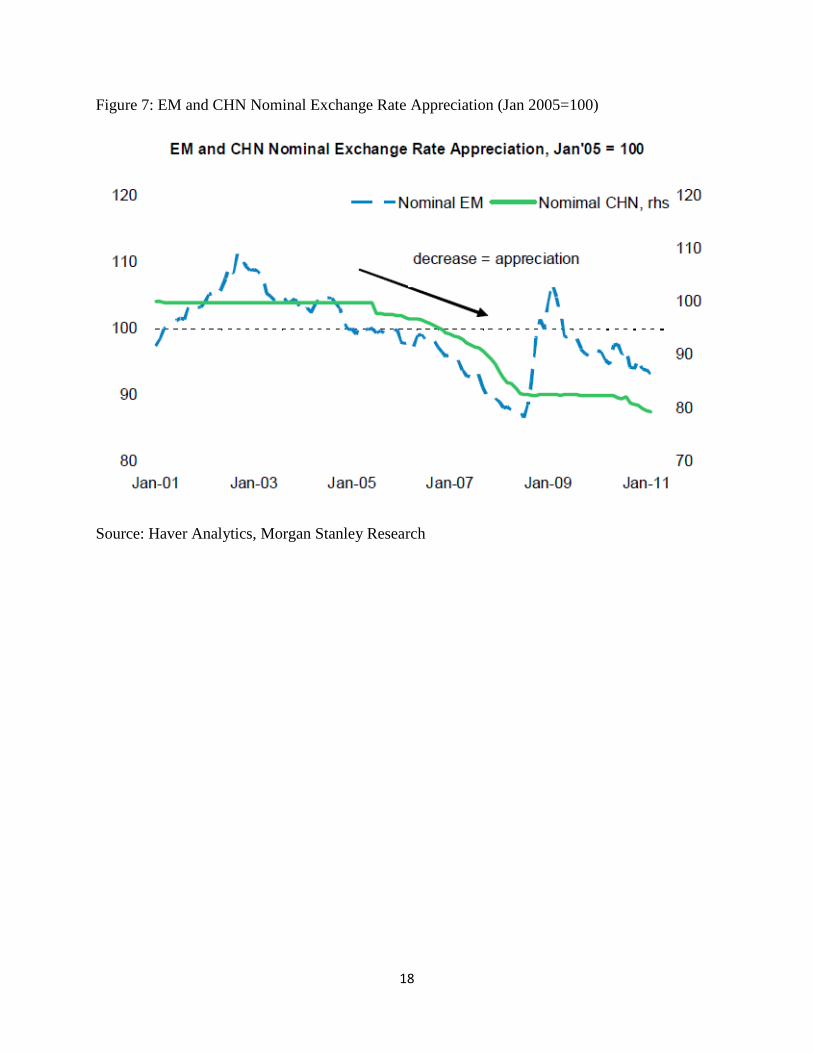
For emerging markets only, Figure 6 is the mirror image of Figure 5, and shows their ongoing nominal appreciation since 2002, as the counterpart of the dollar’s slow depreciation. Figure 7 shows that China’s modest appreciation from 2002 to early 2011 cumulated to be about the same as other emerging markets—but the upward course of the RMB has been smoother and more predictable.
So the combination of very low American interest rates and a declining dollar has provoked large outflows of financial capital (“hot” money) into EM for almost a decade. When EM exchange rates are not tied down by official parities, their endogenous ongoing appreciation
4
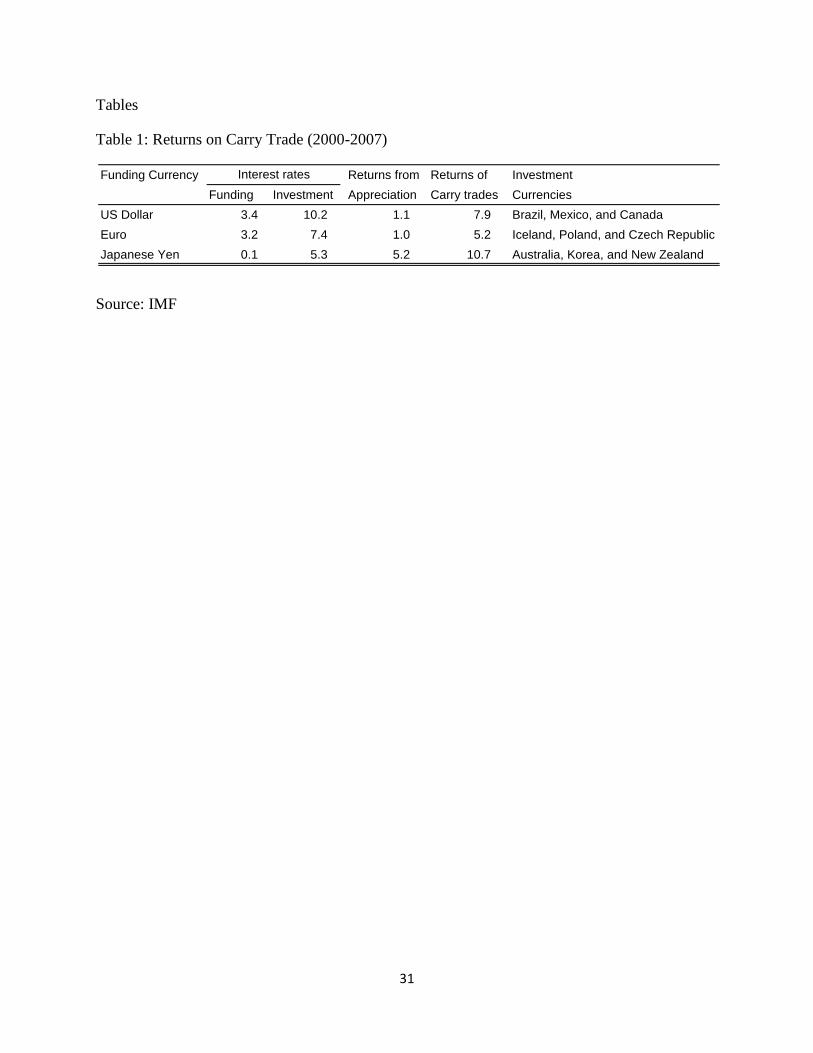
induces even more hot money inflows. Trend-following (chartist) speculators see a double benefit: the higher EM’s interest rates combined with their currencies appreciating against the dollar or yen. For 2000-2007 before the global credit crunch in 2008, table 1 provides illustrative returns to borrowing in dollars, euros, or yen to invest in surrounding EMs. The annual returns to dollar based carry traders investing in Brazil, Mexico, and Canada were about 7.9 percent.
For emerging markets, therefore, exchange rate flexibility is no protection from foreign interest rate disturbances—as when the Fed reduces its short rates to zero. In the short run, exchange rate flexibility may actually enhance the returns that carry traders see as the target EM currency appreciates against the dollar. So the standard textbook theorem that a floating exchange rate gives monetary independence to the nation’s central bank is violated in the presence of carry trades that force it to keep intervening to prevent unlimited appreciation.
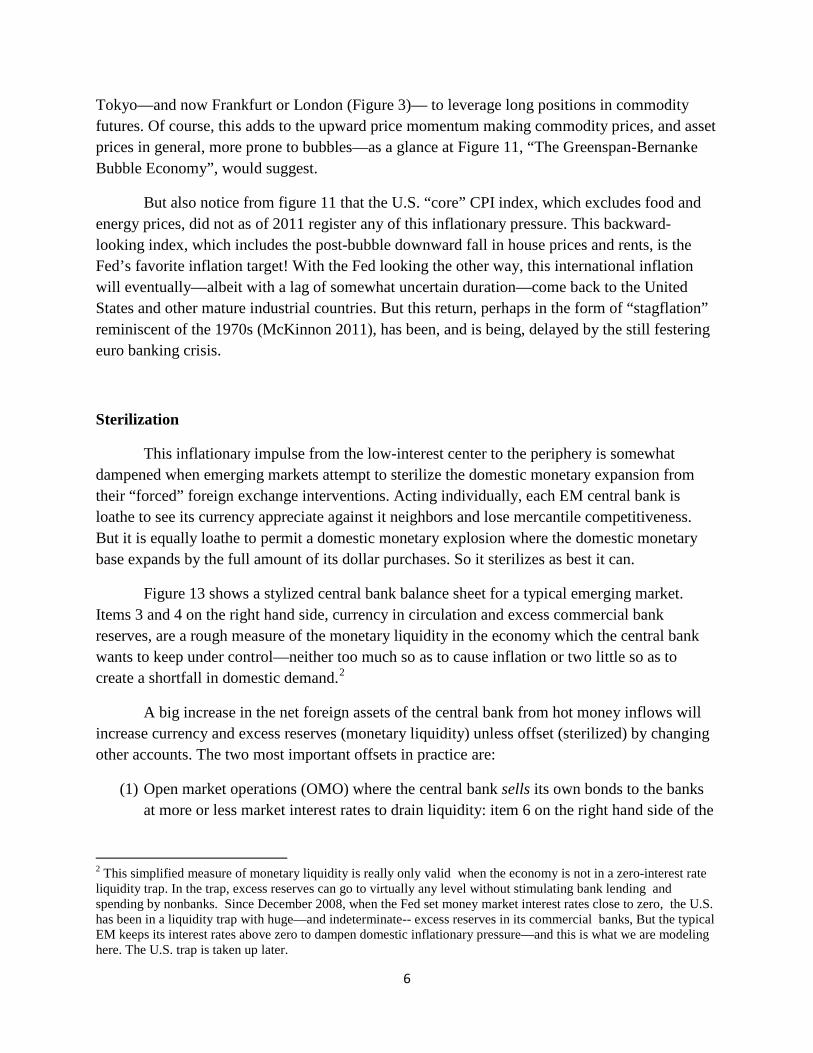
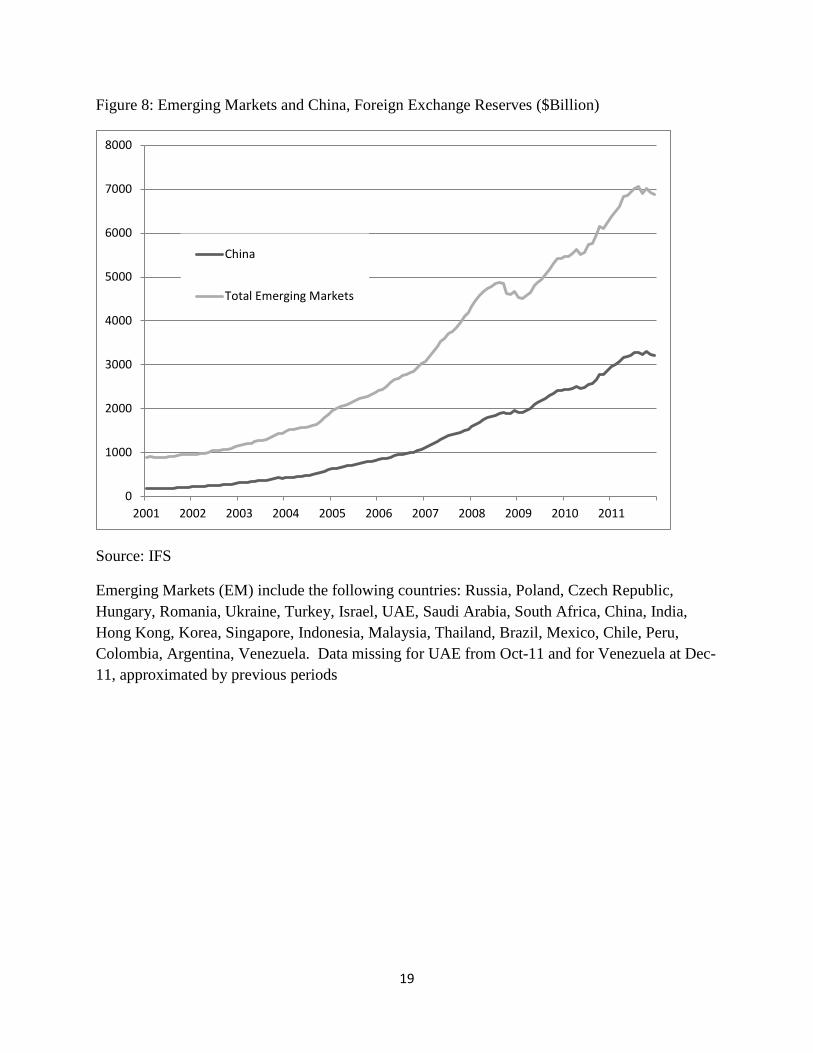
To slow the appreciations of EM currencies, EM central banks typically intervene to buy dollars with domestic base money. And these interventions have been truly massive. Figure 8 shows that from the first quarter of 2001 to the first quarter of 2011, the dollar value of EM foreign exchange reserves rose seven fold—from $1 trillion to $7 trillion! Figure 8 also shows that China accounted for about half of this huge buildup—but the collectivity of other EMs was equally important.
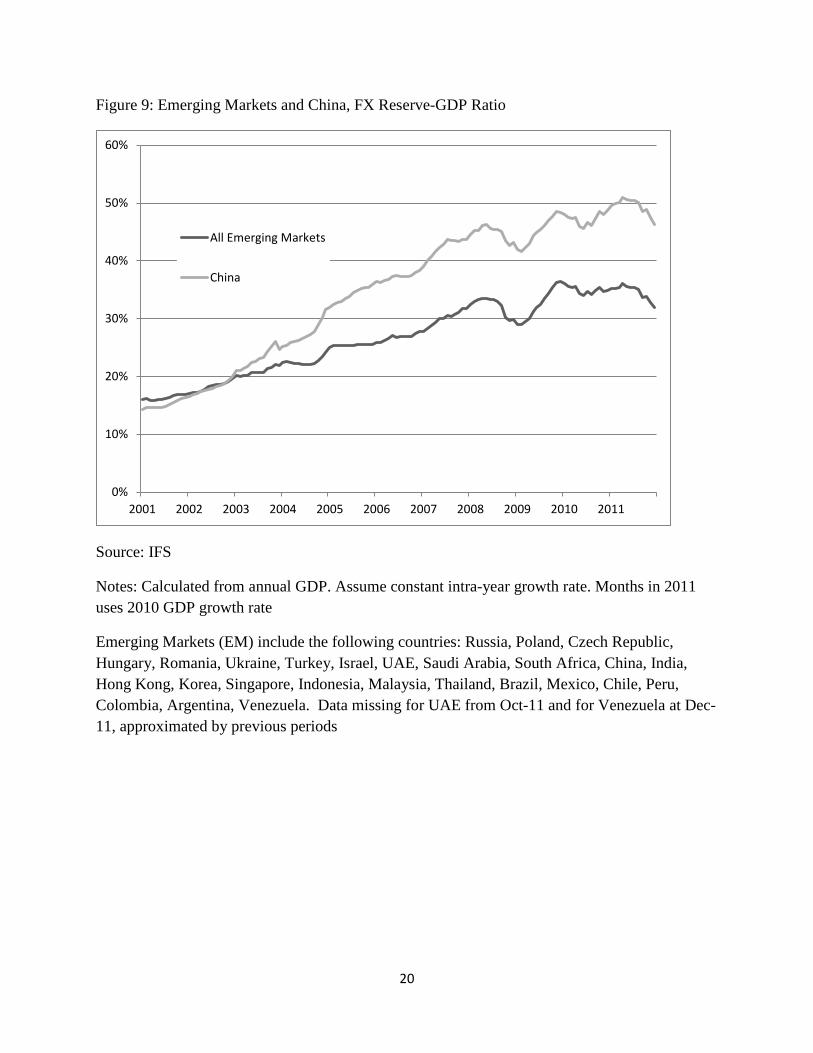
Figure 9 shows that this EM buildup of foreign exchange reserves increased much faster than the growth of their nominal GDPs. For the EM group, reserves rose from about 15 percent of GDP at the beginning of 2001 to 34 percent of GDP at the beginning of 2011. For China alone over this same 10-year period, Figure 9 shows that the ratio of FX reserves to GDP increased particularly strongly from about 13 to 50 percent. Some EM, notably China and Brazil, have re-imposed exchange controls on capital inflows—but with limited success.
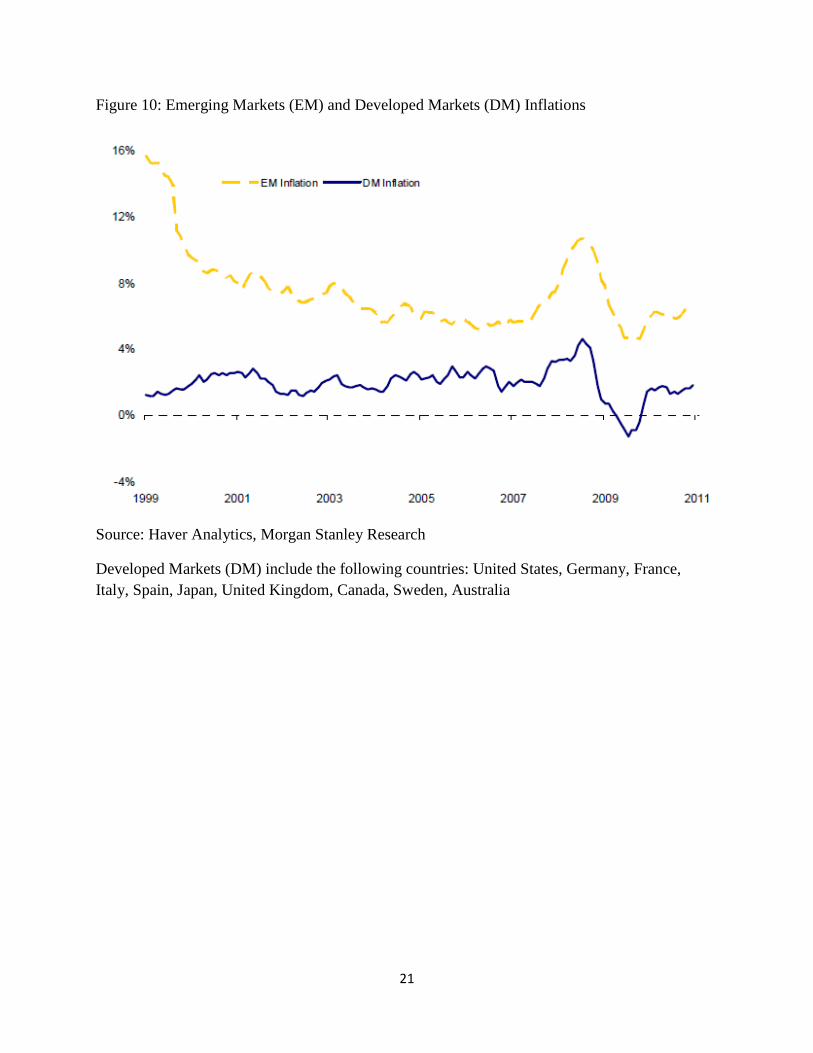
This sharp buildup of EM foreign exchange reserves has been too big to fully offset by domestic monetary sterilization operations. The resulting loss of monetary control in the EM led (and leads) to inflation generally higher than that in the developed market economies (DM)—as shown in Figure 10. This greater inflation in EMs occurred despite the fact that, since 2002, EM currencies on average appreciated against the DM currencies—as shown in Figure 6.
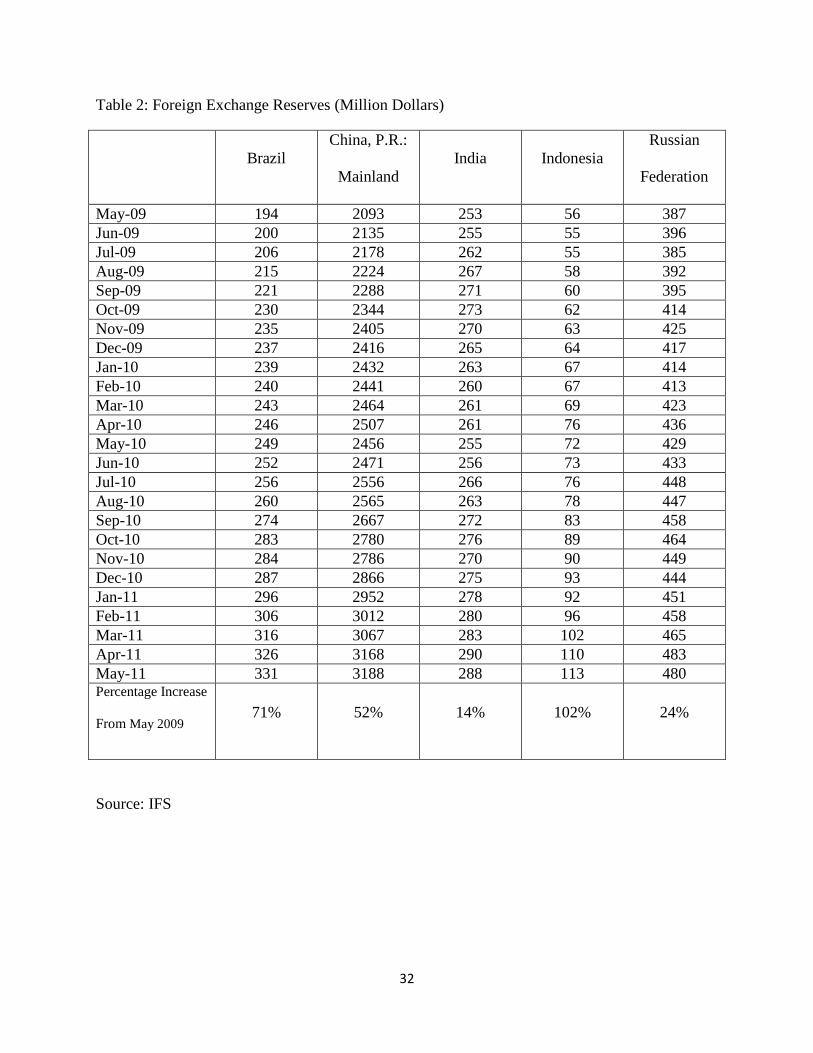
In response to the sharp U.S. economic downturn when the bubbles broke in 2008, the Fed again overreacted by pushing the Federal Funds rate down to zero. It has stayed near-zero since December 2008 onward. From May 2009 into 2011, Table 2 shows the continued rapid buildup of foreign exchange reserves in the largest EMs—China, Russia, Indonesia, India, and Brazil—all of whom had nominal CPIs growing more than 5 percent per year. This is substantially higher than CPI or PPI inflation in Europe, or Japan, or in the United States itself. China’s ongoing trade surplus (without any normal offsetting capital outflow) also contributes to its build up of foreign exchange reserves—but is no longer dominant.
5
Stephen Green of Standard Chartered Bank estimates that net financial inflows into China were in 2010 were much bigger than its trade surplus. And in the first quarter of 2011, Green estimates that China’s foreign exchange reserves rose by $152 billion even though its trade surplus was negligible. Hot money inflows again seemed to be of the main source of China’s increased foreign exchange reserves in 2010 and into 2011.
But then another financial accident occurred. In mid summer of 2011, banks again seized up because of counterparty risks arising from the euro sovereign debt crisis. As in 2008, international speculators were again suddenly cut off from easy credit from financial centers in the more mature industrial countries. In this second major banking crisis, carry traders again had to retrench and sell off their high–yield claims on EM to repay their short-term low-interest bank loans in dollars, yen, euro, and sterling. Figure 5 shows the trade weighted dollar suddenly appreciating toward the end of 2011, and the Bank of Japan intervened several times in the last half of 2011 to keep the yen from rising. Figure 8 shows the slowdown in official reserve accumulation in emerging markets. Indeed, China actually lost foreign exchange reserves in the last quarter of 2011 as hot money was repatriated.
Parallel Effects in Primary Commodities Markets
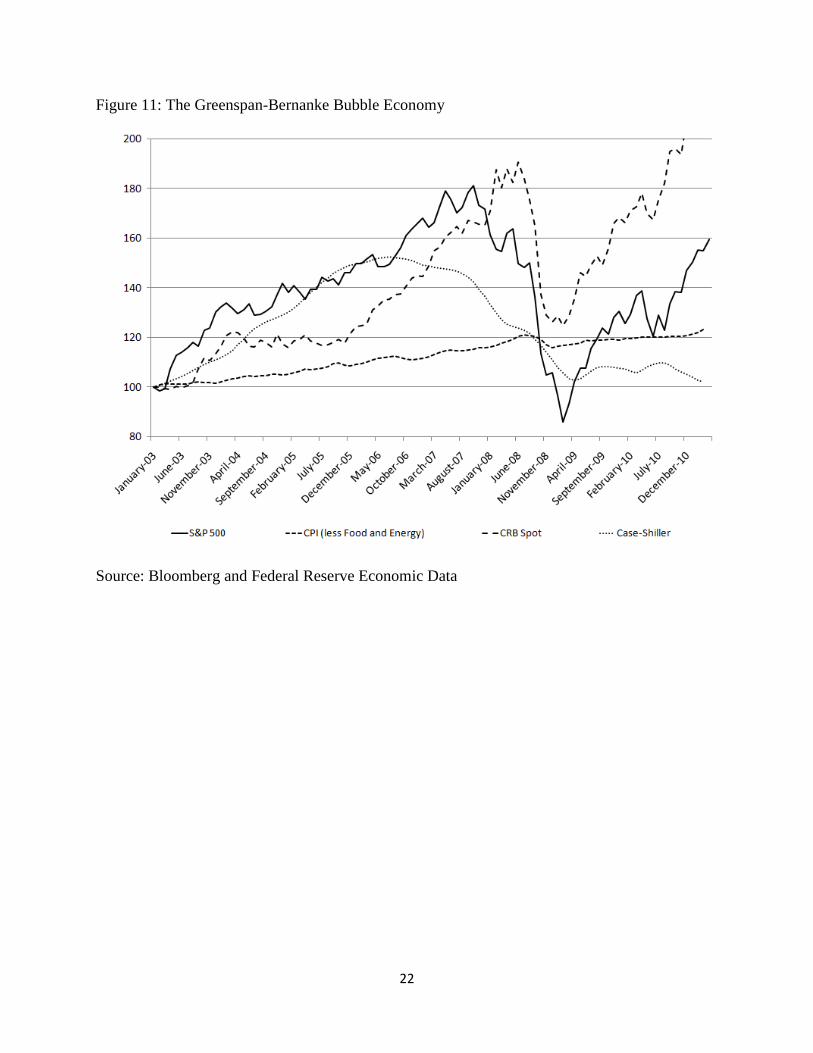
On a world scale, the most striking inflationary impulse from ultra low interest rates in the industrial countries is that the resulting carry trades into the higher yielding currencies in emerging markets not only lifts their currencies but also ignites inflation in primary commodity prices more generally. For the past decade, figure 11 gives a longer perspective on various asset price bubbles—including two extraordinary surges in commodity prices before and after the global credit crunch of 2008 that led to their virtual doubling from January 2003 to January 2011. Not only the price of oil but the price basis food grains shot upwards—so much so that the so-called Arab Spring in 2011 could be interpreted as just a food riot.
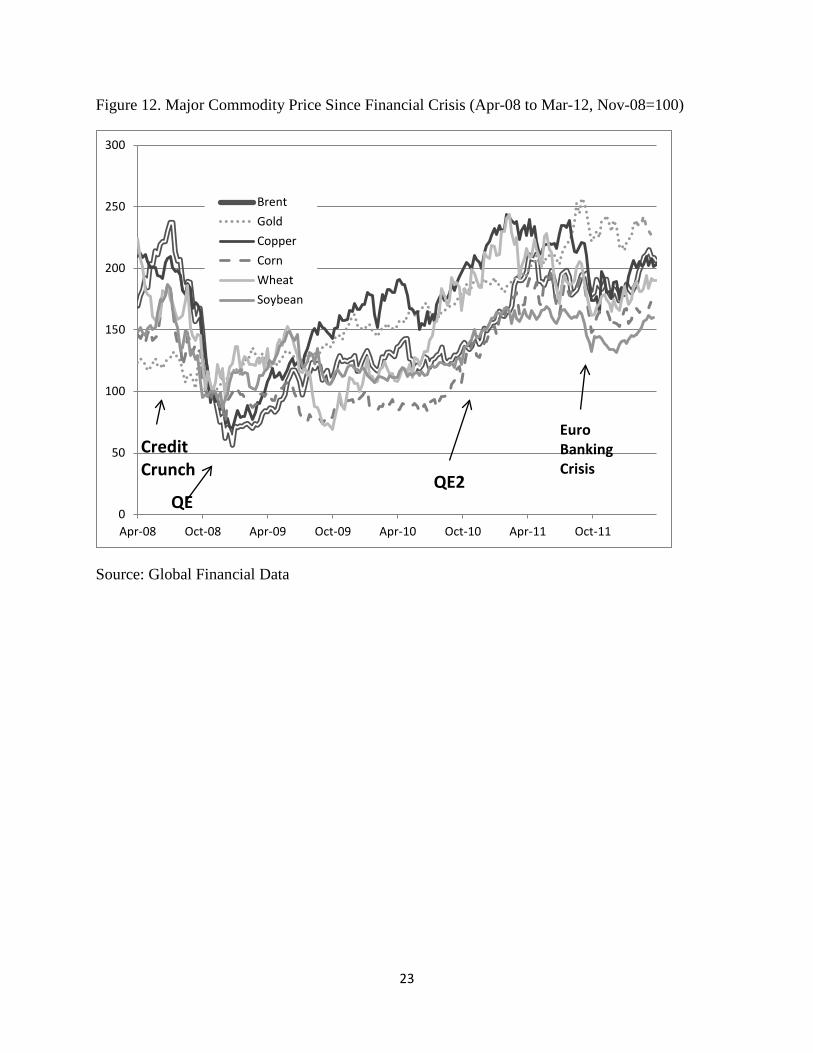
To show individual commodity price movements over a recent shorter time interval, consider the carry trade that began just after the credit crunch of 2008 when the Fed had reduced short rates to zero by that December. Figure 12 traces out the rise in the dollar prices of three food grains— corn, wheat, and soybeans— and three industrial inputs—oil, copper, and gold. They all behaved similarly—virtually tripling from their lows at to the end of 2008 to local highs July-August 2011, before falling back as the euro crisis began.
So what have we learned? Near-zero interest rates in the mature industrial countries contribute to commodity price volatility in two ways. First, they generate hot money inflows into the emerging markets many of which are primary commodity producers, and the EM demand for primary commodities rises because of domestic monetary expansion. Secondly, once commodity prices begin to rise, “commodity chartists”, who are essentially trend followers, take over. As in the foreign exchange markets, commodity carry traders borrow ultra cheaply in New York or
6
Tokyo—and now Frankfurt or London (Figure 3)— to leverage long positions in commodity futures. Of course, this adds to the upward price momentum making commodity prices, and asset prices in general, more prone to bubbles—as a glance at Figure 11, “The Greenspan-Bernanke Bubble Economy”, would suggest.
But also notice from figure 11 that the U.S. “core” CPI index, which excludes food and energy prices, did not as of 2011 register any of this inflationary pressure. This backward-looking index, which includes the post-bubble downward fall in house prices and rents, is the Fed’s favorite inflation target! With the Fed looking the other way, this international inflation will eventually—albeit with a lag of somewhat uncertain duration—come back to the United States and other mature industrial countries. But this return, perhaps in the form of “stagflation” reminiscent of the 1970s (McKinnon 2011), has been, and is being, delayed by the still festering euro banking crisis.
Sterilization
This inflationary impulse from the low-interest center to the periphery is somewhat dampened when emerging markets attempt to sterilize the domestic monetary expansion from their “forced” foreign exchange interventions. Acting individually, each EM central bank is loathe to see its currency appreciate against it neighbors and lose mercantile competitiveness. But it is equally loathe to permit a domestic monetary explosion where the domestic monetary base expands by the full amount of its dollar purchases. So it sterilizes as best it can.
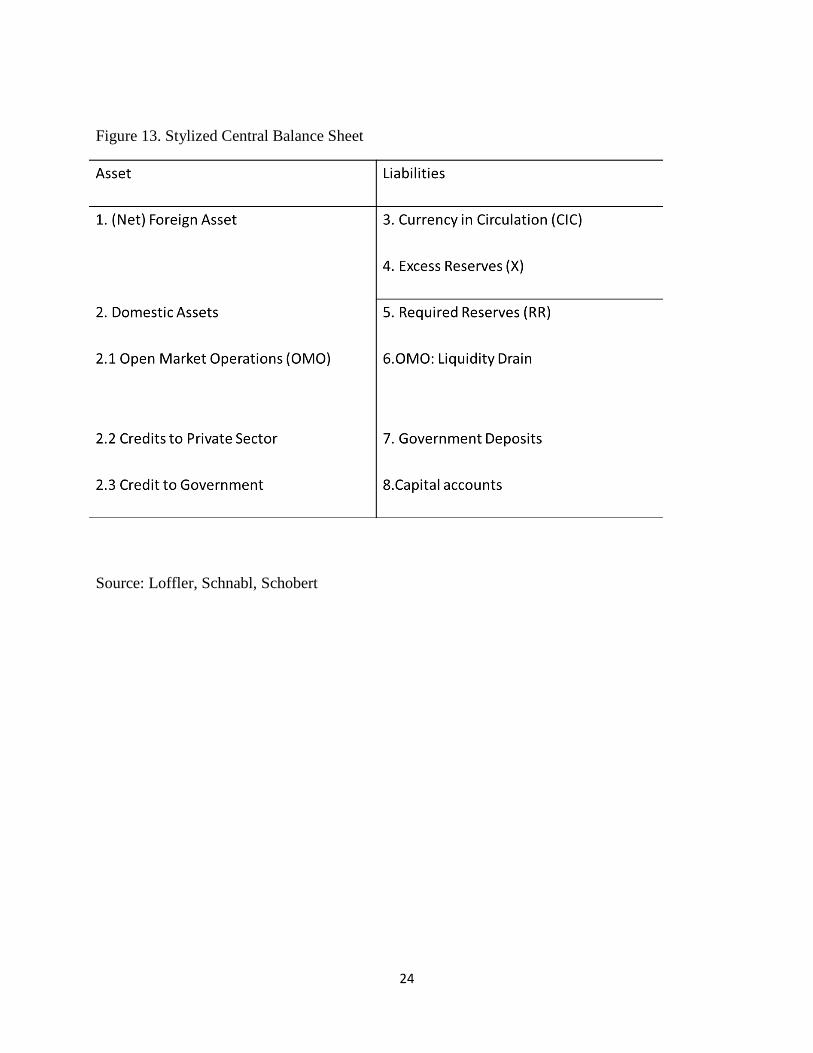
Figure 13 shows a stylized central bank balance sheet for a typical emerging market. Items 3 and 4 on the right hand side, currency in circulation and excess commercial bank reserves, are a rough measure of the monetary liquidity in the economy which the central bank wants to keep under control—neither too much so as to cause inflation or two little so as to create a shortfall in domestic demand.2
A big increase in the net foreign assets of the central bank from hot money inflows will increase currency and excess reserves (monetary liquidity) unless offset (sterilized) by changing other accounts. The two most important offsets in practice are:
(1) Open market operations (OMO) where the central bank sells its own bonds to the banks at more or less market interest rates to drain liquidity: item 6 on the right hand side of the
2 This simplified measure of monetary liquidity is really only valid when the economy is not in a zero-interest rate liquidity trap. In the trap, excess reserves can go to virtually any level without stimulating bank lending and spending by nonbanks. Since December 2008, when the Fed set money market interest rates close to zero, the U.S. has been in a liquidity trap with huge—and indeterminate-- excess reserves in its commercial banks, But the typical EM keeps its interest rates above zero to dampen domestic inflationary pressure—and this is what we are modeling here. The U.S. trap is taken up later.
7
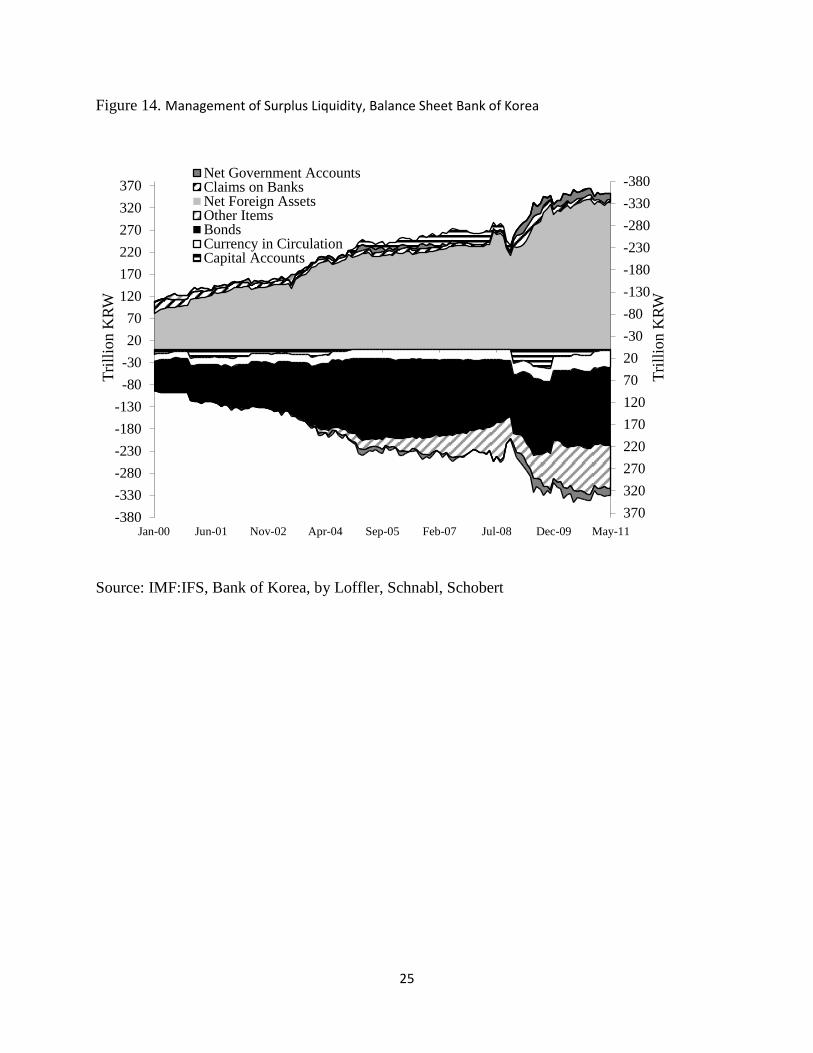
balance sheet shown in Figure 13. For more than a decade, the Bank of Korea (BOK) has used mainly these bond sales to sterilize, as shown by the dark area in Figure 14.
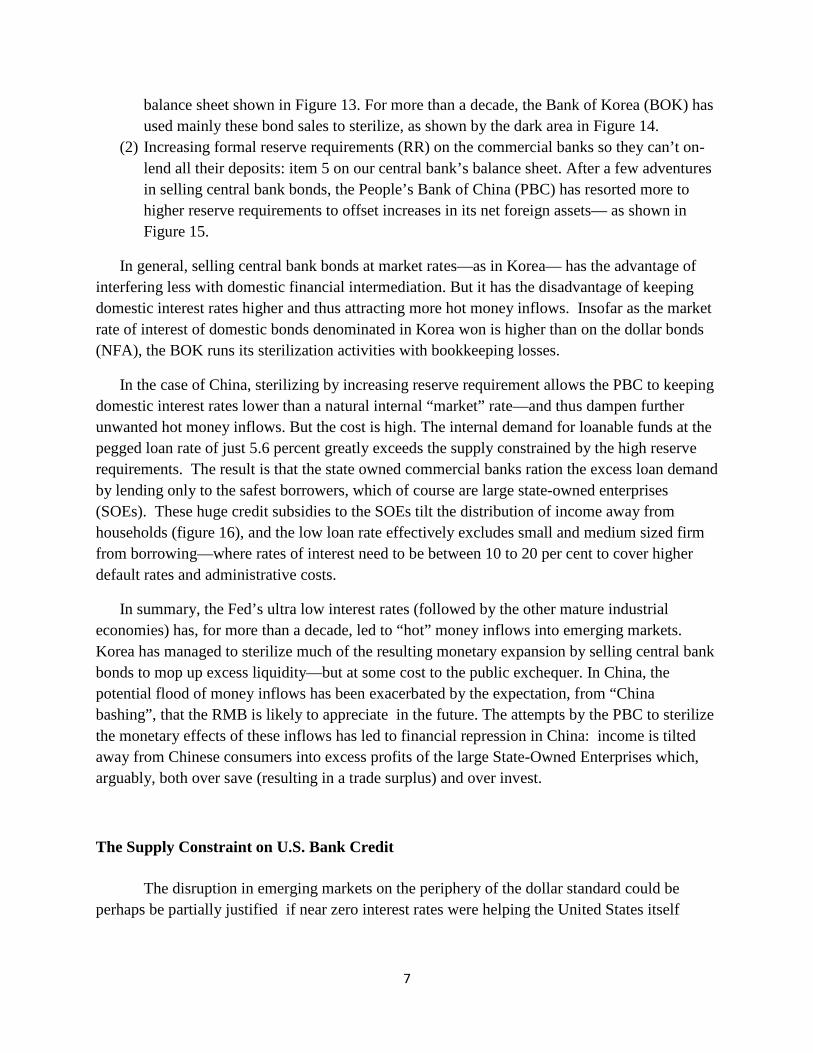
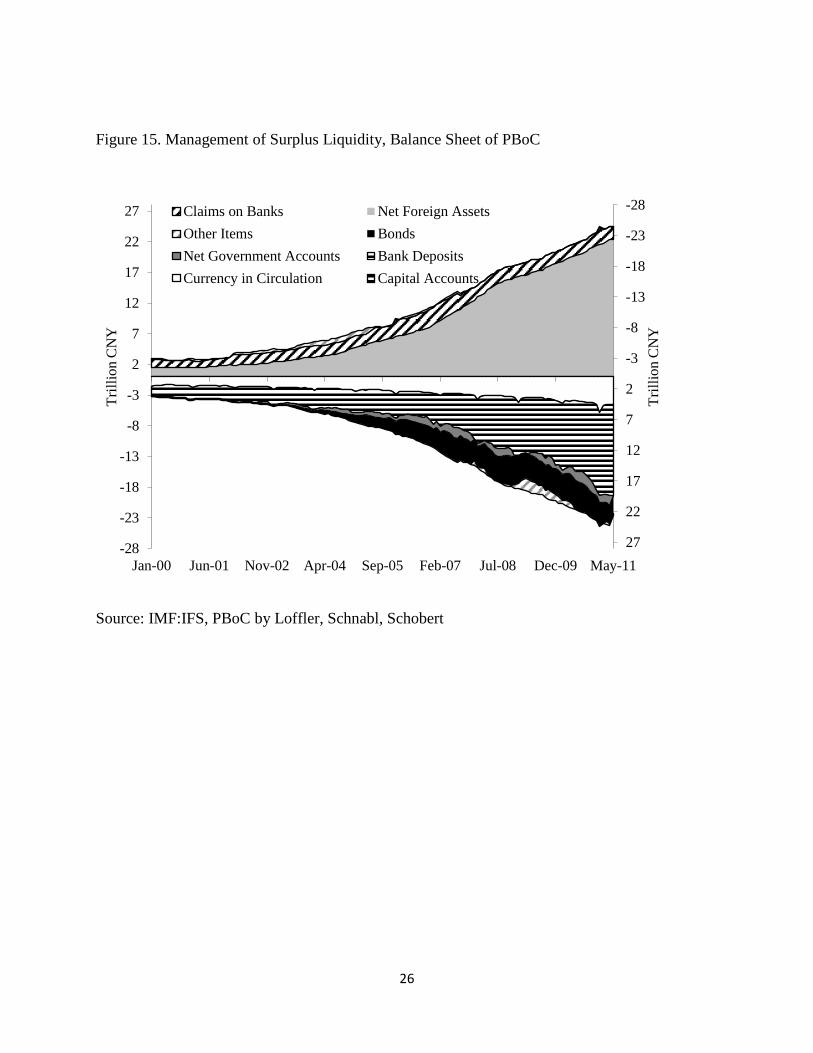
(2) Increasing formal reserve requirements (RR) on the commercial banks so they can’t on- lend all their deposits: item 5 on our central bank’s balance sheet. After a few adventures in selling central bank bonds, the People’s Bank of China (PBC) has resorted more to higher reserve requirements to offset increases in its net foreign assets— as shown in Figure 15.
In general, selling central bank bonds at market rates—as in Korea— has the advantage of interfering less with domestic financial intermediation. But it has the disadvantage of keeping domestic interest rates higher and thus attracting more hot money inflows. Insofar as the market rate of interest of domestic bonds denominated in Korea won is higher than on the dollar bonds (NFA), the BOK runs its sterilization activities with bookkeeping losses.
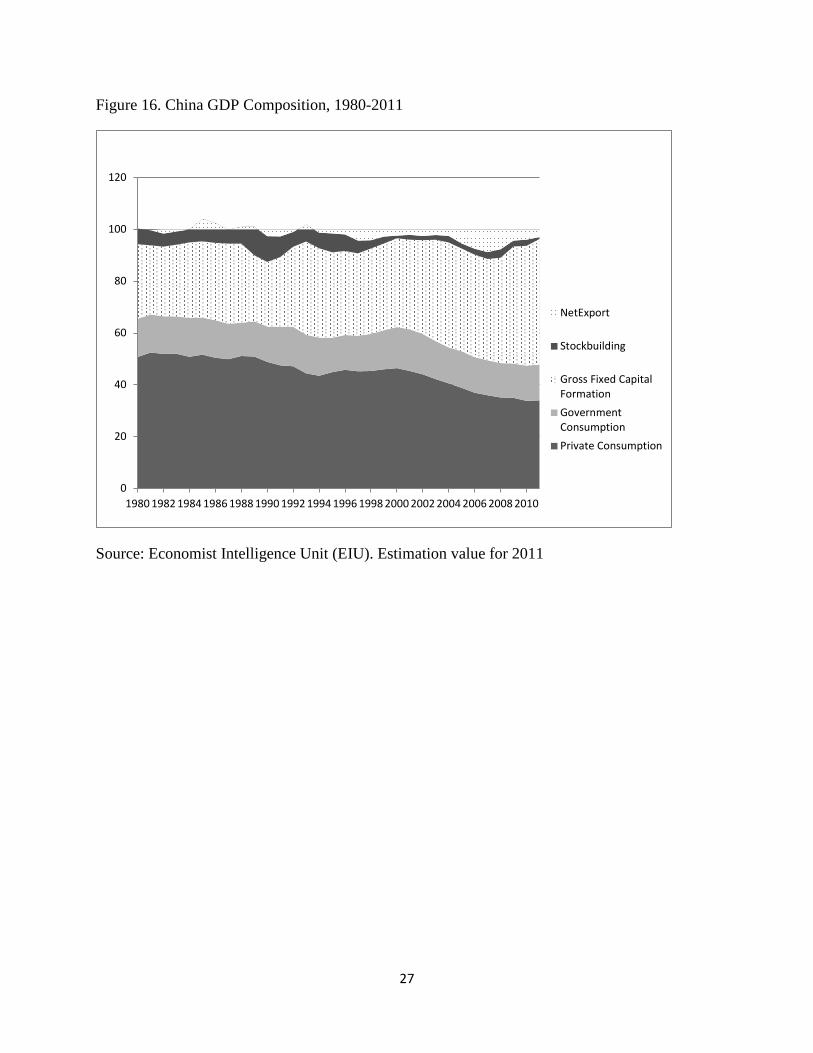
In the case of China, sterilizing by increasing reserve requirement allows the PBC to keeping domestic interest rates lower than a natural internal “market” rate—and thus dampen further unwanted hot money inflows. But the cost is high. The internal demand for loanable funds at the pegged loan rate of just 5.6 percent greatly exceeds the supply constrained by the high reserve requirements. The result is that the state owned commercial banks ration the excess loan demand by lending only to the safest borrowers, which of course are large state-owned enterprises (SOEs). These huge credit subsidies to the SOEs tilt the distribution of income away from households (figure 16), and the low loan rate effectively excludes small and medium sized firm from borrowing—where rates of interest need to be between 10 to 20 per cent to cover higher default rates and administrative costs.
In summary, the Fed’s ultra low interest rates (followed by the other mature industrial economies) has, for more than a decade, led to “hot” money inflows into emerging markets. Korea has managed to sterilize much of the resulting monetary expansion by selling central bank bonds to mop up excess liquidity—but at some cost to the public exchequer. In China, the potential flood of money inflows has been exacerbated by the expectation, from “China bashing”, that the RMB is likely to appreciate in the future. The attempts by the PBC to sterilize the monetary effects of these inflows has led to financial repression in China: income is tilted away from Chinese consumers into excess profits of the large State-Owned Enterprises which, arguably, both over save (resulting in a trade surplus) and over invest.
The Supply Constraint on U.S. Bank Credit
The disruption in emerging markets on the periphery of the dollar standard could be perhaps be partially justified if near zero interest rates were helping the United States itself

8
recover from the subprime mortgage crisis and economic downturn of 2008-09. But the evidence suggests otherwise.
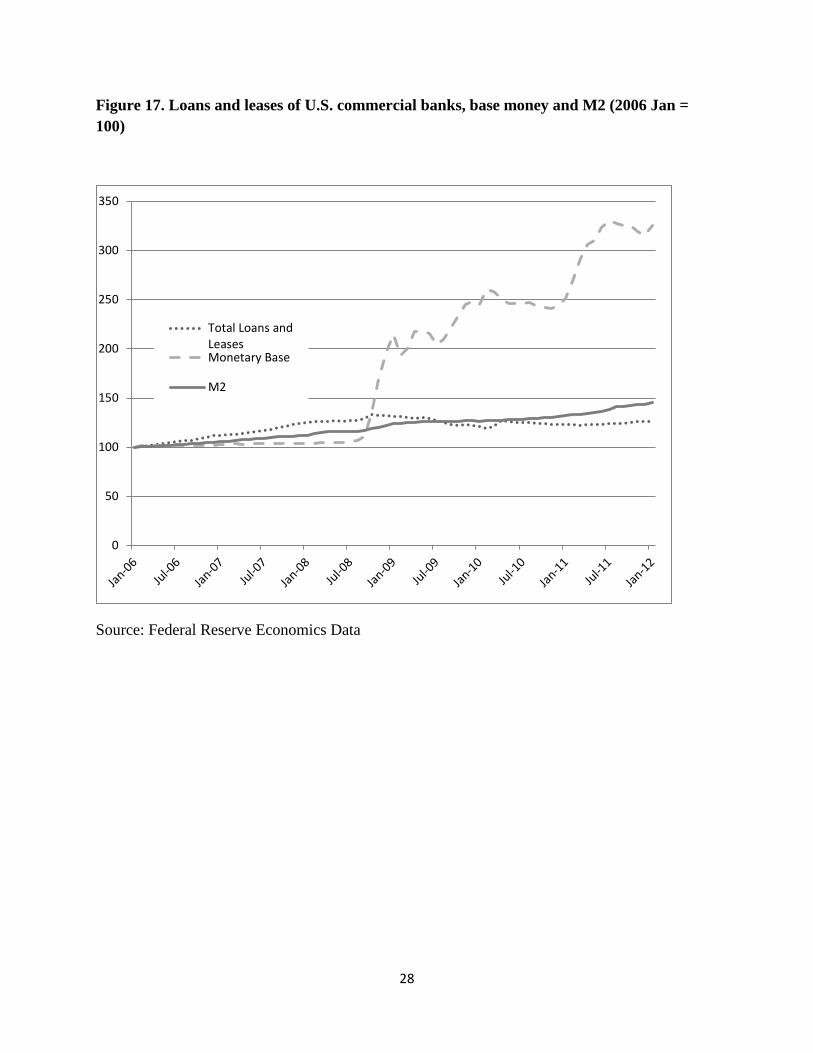
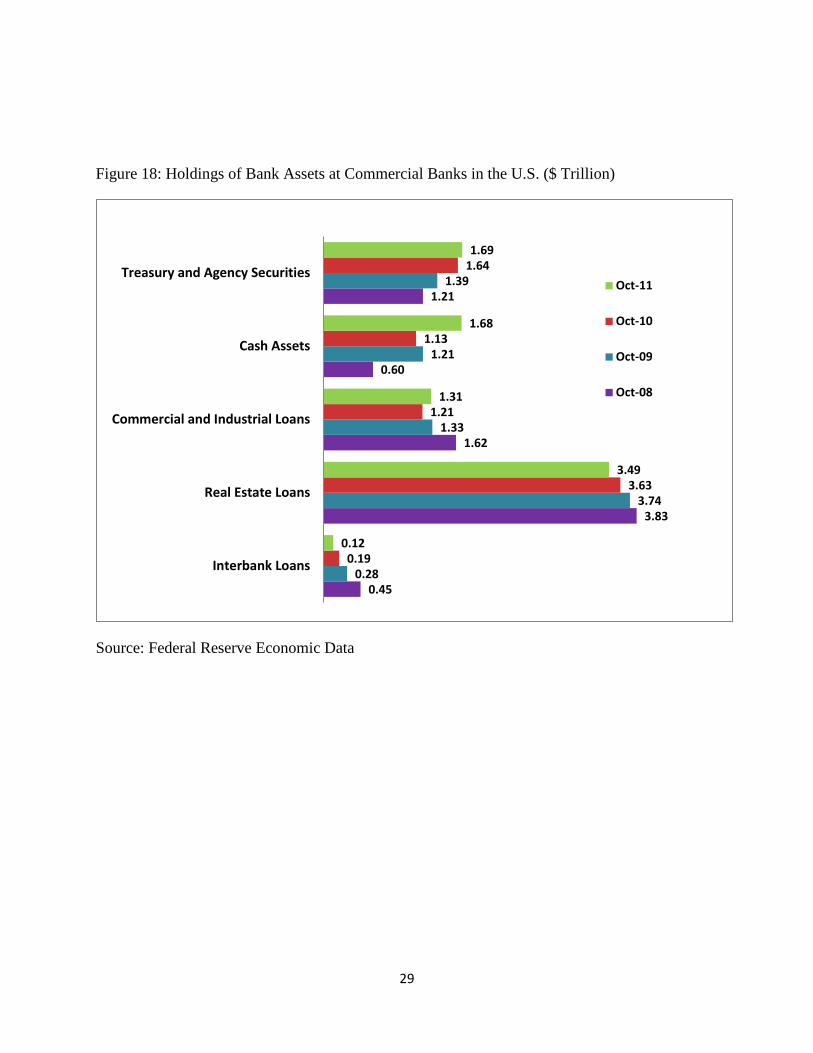
How do near-zero interest rates in U.S. interbank markets constrict the U.S. economy? Since July 2008, the stock of base money in the U.S. banking system has more than tripled (figure 17). As part of its rescue mission in the crisis and to drive interest rates down and flood markets with liquidity, the Fed has bought many nontraditional assets (mortgage-backed securities) as well as Treasuries. However, these drastic actions have not stimulated new bank lending—as also shown in Figure 17. Much of this huge increase in base money is now lodged as excess reserves (cash assets) in large American commercial banks: a liquidity trap. In addition, Figure 18 shows that banks have invested heavily in Treasury and Agency securities.
Despite the Fed’s strenuous efforts, the supply of ordinary bank credit to firms and households fell for almost two years after the crisis. Figure 18 shows outstanding “Commercial and Industrial Loans” falling from $1.62 trillion in October 2008 to just $1.21 trillion in October 2010. Since then the recovery in bank lending remains very weak and loans outstanding in 2012 are still less than they were in 2008. Although large corporate enterprises have recovered from the credit crunch of 2008 through their renewed access to bond and equity financing, bank credit is the principal source of finance for working capital for small and medium-sized enterprises (SMEs) enabling them to purchase labor and other supplies. In cyclical upswings, SMEs have traditionally been the main engines for increasing employment. But not in the very weak upswing of 2010-12, where employment gains have been meager.
Why should zero interest rates be causing a credit constraint? After all, conventional thinking has it that the lower the interest rate the better credit can expand. But this is only true when interest rates—particularly interbank interest rates—are comfortably above zero. Banks with good retail lending opportunities typically lend by opening credit lines to nonbank customers. But these credit lines are open-ended in the sense that the commercial borrower can choose when—and by how much—he will actually draw on his credit line (subject to some maximum limit of course). This creates uncertainty for the bank in not knowing what its future cash positions will be. An illiquid bank could be in trouble if its customers simultaneously decided to draw down their credit lines.
However, if the “retail” bank has easy access to the “wholesale” interbank market, its liquidity is much improved. To cover unexpected liquidity shortfalls, it can borrow from banks with excess reserves with little or no credit checks. But if the prevailing interbank lending rate is close to zero (as it is now), then large banks with surplus reserves become loathe to part with them for a derisory yield. Then smaller banks, which collectively are the biggest lenders to SMEs, cannot easily bid for funds at an interest rate significantly above the prevailing interbank rate without inadvertently signaling that they might be in trouble, i.e., distress borrowers. And indeed counterparty risk in smaller banks remains substantial as about 100 have failed in 2011. .
9
(Remember that the huge Fed and TARP bailouts of 2008-09 were limited to large banks deemed too big to fail.)
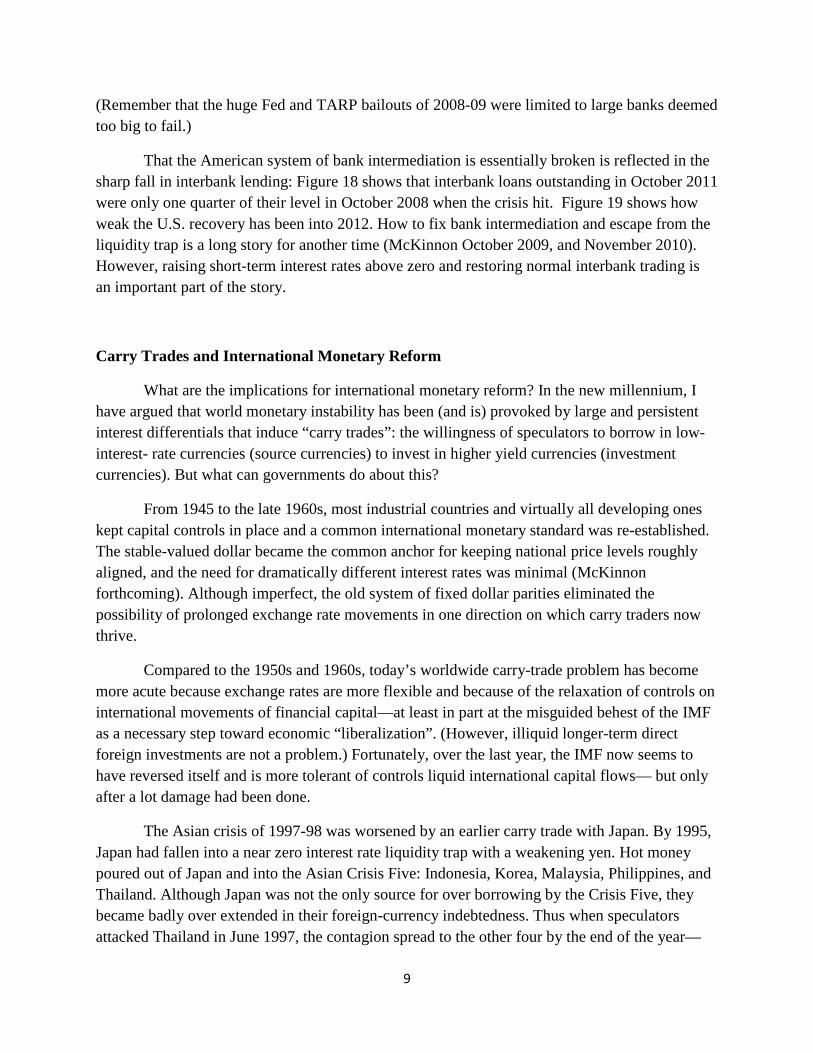
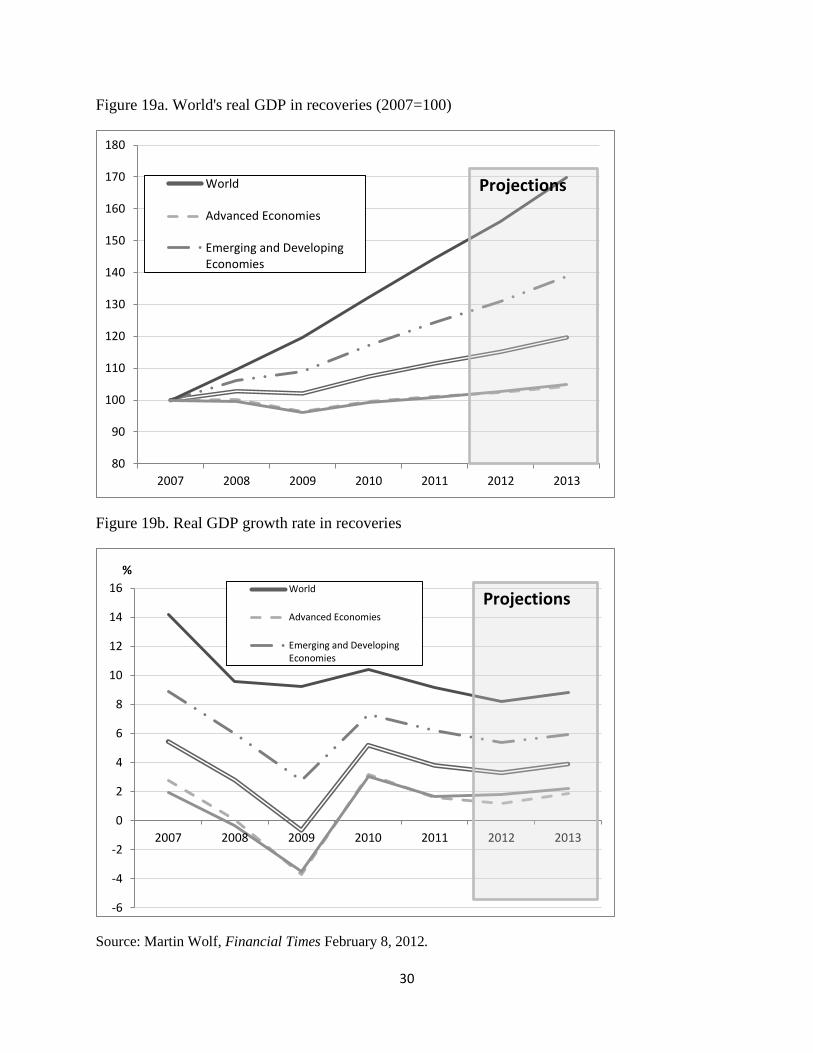
That the American system of bank intermediation is essentially broken is reflected in the sharp fall in interbank lending: Figure 18 shows that interbank loans outstanding in October 2011 were only one quarter of their level in October 2008 when the crisis hit. Figure 19 shows how weak the U.S. recovery has been into 2012. How to fix bank intermediation and escape from the liquidity trap is a long story for another time (McKinnon October 2009, and November 2010). However, raising short-term interest rates above zero and restoring normal interbank trading is an important part of the story.
Carry Trades and International Monetary Reform
What are the implications for international monetary reform? In the new millennium, I have argued that world monetary instability has been (and is) provoked by large and persistent interest differentials that induce “carry trades”: the willingness of speculators to borrow in low- interest- rate currencies (source currencies) to invest in higher yield currencies (investment currencies). But what can governments do about this?
From 1945 to the late 1960s, most industrial countries and virtually all developing ones kept capital controls in place and a common international monetary standard was re-established. The stable-valued dollar became the common anchor for keeping national price levels roughly aligned, and the need for dramatically different interest rates was minimal (McKinnon forthcoming). Although imperfect, the old system of fixed dollar parities eliminated the possibility of prolonged exchange rate movements in one direction on which carry traders now thrive.
Compared to the 1950s and 1960s, today’s worldwide carry-trade problem has become more acute because exchange rates are more flexible and because of the relaxation of controls on international movements of financial capital—at least in part at the misguided behest of the IMF as a necessary step toward economic “liberalization”. (However, illiquid longer-term direct foreign investments are not a problem.) Fortunately, over the last year, the IMF now seems to have reversed itself and is more tolerant of controls liquid international capital flows— but only after a lot damage had been done.
The Asian crisis of 1997-98 was worsened by an earlier carry trade with Japan. By 1995, Japan had fallen into a near zero interest rate liquidity trap with a weakening yen. Hot money poured out of Japan and into the Asian Crisis Five: Indonesia, Korea, Malaysia, Philippines, and Thailand. Although Japan was not the only source for over borrowing by the Crisis Five, they became badly over extended in their foreign-currency indebtedness. Thus when speculators attacked Thailand in June 1997, the contagion spread to the other four by the end of the year—
10
with capital flight, widespread financial bankruptcies, sharp exchange rate depreciations, and sharp downturns in output and employment. Japan was hurt as its exports to other East Asia slumped. Fortunately, China ignored foreign advice to depreciate the renminbi in tandem. Instead, the yuan/dollar rate was kept stable—which made it easier for its five smaller East Asian trading partners (and competitors) and Japan to recover.
Today, the carry-trade story is no better. The prolonged dollar depreciation after 2002 (figure 5) with ultra-low U.S. interest rates led to the huge build up of foreign exchange reserves (figure 8) in the EM. Similarly over the last decade, misdirected pressure on China to continually appreciate the RMB has given carry traders a one-way bet on foreign exchange movements that they really love. Notice that this explanation differs from the common view (Rajan 2011, P 82) that Asian countries were so badly burned by the 1997-98 crisis that they turned conservative and resolved to run large trade surpluses by keeping their currencies “undervalued”. But today’s large size of Asian official exchange reserves is far in excess of any such prudential motivation and much larger than their cumulative trade surpluses.
A New International Monetary Agreement?
How best can carry trades be limited? Central bankers from the G-20 could meet continually to monitor each other in order to prevent wide interest differentials from developing. True to its newly professed virtue, the IMF should refrain from criticizing countries who attempt to impose capital controls to stem hot money flows. It could also provide technical advice on how to do so most efficiently.
However, if interest spreads are too wide, capital controls will always fail. The first item on the G-20 agenda would be to abandon monetary policies by the mature industrial economies, led by the United States, that set interest rates near zero. This would lessen the incentive of central banks in emerging markets to keep their interest rates low despite the inflationary pressure they now face and despite the fact that their “natural” rates of interest are higher. The Fed must be the leader in raising interest rates in mature economies because, under the asymmetrical world dollar standard, it has the greatest autonomy in monetary policy (McKinnon forthcoming).
American officials point to the stagnant U.S. Economy as the reason they want to keep domestic interest rates as low as possible—even zero. Thus, they must be convinced that this common view is mistaken, and that raising short-term interest rates on dollar assets from zero to modest levels is in America’s own best interests—as well as that of the rest of the world. The longer the Fed’s zero interest rate policy stays in place, the more difficult it becomes to get out of the resulting liquidity trap and restore a more normal flow of bank intermediation within the U.S. itself. Without more lending to American small- and medium- sized enterprises, domestic economic stagnation will continue even though inflation eventually takes off.
11
The stagflation of the 1970s was brought on by unduly easy U.S. monetary policy in conjunction with attempts to “talk” the dollar down (the Nixon shock of August 1971) leading to massive outflows of hot money that destabilized the monetary systems of America’s trading partners (McKinnon 1982) and generated worldwide inflation. Although today’s stagflation is not identical, the similarities would seem to be more important than the differences.
Today’s “shock” is the Fed’s over reaction to the global downturn of 2008 by setting the short-term federal funds rate close to zero. So the solution is more straightforward. The Fed should announce a program for gradually increasing the Fed Funds rate to some modest target, say 2 percent. This should be accompanied by a definite program for reducing the counter party risk in interbank lending to all banks but particularly small ones, possibly by allowing them to pledge loans to SMEs as collateral.
To better preserve financial and exchange rate stability in the transition, the big four central banks—Fed, ECB, Bank of England, and Bank of Japan--should move jointly and smoothly to phase in a common target minimum target—say 2 percent—for their basic short-term interbank rates. By escaping from liquidity traps which so impair the efficiency of domestic bank intermediation and lessening the bubbles problem, the mature center would benefit along with the periphery.
Reducing the spread in interest rates between the center and periphery would dampen carry trades and hot money flows in an important way. But it may not be sufficient to end them altogether. So acknowledging the legitimacy of emerging markets using capital controls and other devices to dampen hot money inflows should be an important part of the new G-20 discussion. Indeed central banks in the mature center could monitor their own commercial banks to help central banks on the periphery enforce their controls.
But there is an important asymmetry here. Capital controls are not for everybody. In particular, the United States at the center of the world dollar standard cannot itself impose capital controls without destroying the world’s system for clearing international payments multilaterally. Thus everybody has a vested interest in rehabilitating the unloved dollar standard with open U.S. financial markets. The first of many necessary steps in the rehabilitation process is for the Fed to abandon any thought of a QE3 while phasing out its policy of keeping short rates near zero.
12
Figure 1: Exchange Rate Valuations
Source: Financial Times, November 11, 2010
13
Figure 2: U.S. Short Term Interest Rates
Source: Federal Reserve Economic Data and bloomberg
14
Figure 3. Post Crisis Money Market Interest Rates of the Developed World
Source: Global Financial Data
0
1
2
3
4
5
6
7
Jan-07 Jul-07 Jan-08 Jul-08 Jan-09 Jul-09 Jan-10 Jul-10 Jan-11 Jul-11 Jan-12
Germany
Japan
United Kingdom
United States
15
Figure 4. 10 Year Government Bond Interest Rates of Selected Countries (Nov-08 to Mar-12)
Source: IMF
0
0.5
1
1.5
2
2.5
3
3.5
4
4.5
Nov-08 May-09 Nov-09 May-10 Nov-10 May-11 Nov-11
US
Germany
Japan
UK
16
Figure 5: The Nominal Broad Dollar Index Movements (Jan 2002=100)
Source: Federal Reserve Economic Data
80
85
90
95
100
105
110
115
120
125
2000 2001 2002 2003 2004 2005 2006 2007 2008 2009 2010 2011 2012
Dollar Carry Trade
Credit Crunch
New Dollar Carry Trade
Euro Crisis
17
Figure 6: EM Real Nominal Exchange Rate Appreciation (Jan 2005=100)
Source: Haver Analytics, Morgan Stanley Research
Emerging Markets (EM) include the following countries: Russia, Poland, Czech Republic, Hungary, Romania, Ukraine, Turkey, Israel, UAE, Saudi Arabia, South Africa, China, India, Hong Kong, Korea, Taiwan, Singapore, Indonesia, Malaysia, Thailand, Brazil, Mexico, Chile, Peru, Colombia, Argentina, Venezuela
18
Figure 7: EM and CHN Nominal Exchange Rate Appreciation (Jan 2005=100)
Source: Haver Analytics, Morgan Stanley Research
19
Figure 8: Emerging Markets and China, Foreign Exchange Reserves ($Billion)
Source: IFS
Emerging Markets (EM) include the following countries: Russia, Poland, Czech Republic, Hungary, Romania, Ukraine, Turkey, Israel, UAE, Saudi Arabia, South Africa, China, India, Hong Kong, Korea, Singapore, Indonesia, Malaysia, Thailand, Brazil, Mexico, Chile, Peru, Colombia, Argentina, Venezuela. Data missing for UAE from Oct-11 and for Venezuela at Dec-11, approximated by previous periods
0
1000
2000
3000
4000
5000
6000
7000
8000
2001 2002 2003 2004 2005 2006 2007 2008 2009 2010 2011
China
Total Emerging Markets
20
Figure 9: Emerging Markets and China, FX Reserve-GDP Ratio
Source: IFS
Notes: Calculated from annual GDP. Assume constant intra-year growth rate. Months in 2011 uses 2010 GDP growth rate
Emerging Markets (EM) include the following countries: Russia, Poland, Czech Republic, Hungary, Romania, Ukraine, Turkey, Israel, UAE, Saudi Arabia, South Africa, China, India, Hong Kong, Korea, Singapore, Indonesia, Malaysia, Thailand, Brazil, Mexico, Chile, Peru, Colombia, Argentina, Venezuela. Data missing for UAE from Oct-11 and for Venezuela at Dec-11, approximated by previous periods
0%
10%
20%
30%
40%
50%
60%
2001 2002 2003 2004 2005 2006 2007 2008 2009 2010 2011
All Emerging Markets
China
21
Figure 10: Emerging Markets (EM) and Developed Markets (DM) Inflations
Source: Haver Analytics, Morgan Stanley Research
Developed Markets (DM) include the following countries: United States, Germany, France, Italy, Spain, Japan, United Kingdom, Canada, Sweden, Australia
22
Figure 11: The Greenspan-Bernanke Bubble Economy
Source: Bloomberg and Federal Reserve Economic Data
23
Figure 12. Major Commodity Price Since Financial Crisis (Apr-08 to Mar-12, Nov-08=100)
Source: Global Financial Data
0
50
100
150
200
250
300
Apr-08 Oct-08 Apr-09 Oct-09 Apr-10 Oct-10 Apr-11 Oct-11
BrentGoldCopperCornWheatSoybean
QE
Credit Crunch
QE2
Euro Banking Crisis
24
Figure 13. Stylized Central Balance Sheet
Source: Loffler, Schnabl, Schobert
25
Figure 14. Management of Surplus Liquidity, Balance Sheet Bank of Korea
Source: IMF:IFS, Bank of Korea, by Loffler, Schnabl, Schobert
-380-330-280-230-180-130-80-302070120170220270320370-380
-330-280-230-180-130-80-302070
120170220270320370
Jan-00 Jun-01 Nov-02 Apr-04 Sep-05 Feb-07 Jul-08 Dec-09 May-11
Trill
ion
KRW
Trill
ion
KRW
Net Government AccountsClaims on BanksNet Foreign AssetsOther ItemsBondsCurrency in CirculationCapital Accounts
26
Figure 15. Management of Surplus Liquidity, Balance Sheet of PBoC
Source: IMF:IFS, PBoC by Loffler, Schnabl, Schobert
-28
-23
-18
-13
-8
-3
2
7
12
17
22
27-28
-23
-18
-13
-8
-3
2
7
12
17
22
27
Jan-00 Jun-01 Nov-02 Apr-04 Sep-05 Feb-07 Jul-08 Dec-09 May-11
Trill
ion
CN
Y
Trill
ion
CN
Y
Claims on Banks Net Foreign AssetsOther Items BondsNet Government Accounts Bank DepositsCurrency in Circulation Capital Accounts
27
Figure 16. China GDP Composition, 1980-2011
Source: Economist Intelligence Unit (EIU). Estimation value for 2011
0
20
40
60
80
100
120
1980 1982 1984 1986 1988 1990 1992 1994 1996 1998 2000 2002 2004 2006 2008 2010
NetExport
Stockbuilding
Gross Fixed CapitalFormationGovernmentConsumptionPrivate Consumption
28
Figure 17. Loans and leases of U.S. commercial banks, base money and M2 (2006 Jan = 100)
Source: Federal Reserve Economics Data
0
50
100
150
200
250
300
350
Total Loans andLeasesMonetary Base
M2
29
Figure 18: Holdings of Bank Assets at Commercial Banks in the U.S. ($ Trillion)
Source: Federal Reserve Economic Data
0.45
3.83
1.62
0.60
1.21
0.28
3.74
1.33
1.21
1.39
0.19
3.63
1.21
1.13
1.64
0.12
3.49
1.31
1.68
1.69
Interbank Loans
Real Estate Loans
Commercial and Industrial Loans
Cash Assets
Treasury and Agency SecuritiesOct-11
Oct-10
Oct-09
Oct-08
30
Figure 19a. World's real GDP in recoveries (2007=100)
Figure 19b. Real GDP growth rate in recoveries
Source: Martin Wolf, Financial Times February 8, 2012.
80
90
100
110
120
130
140
150
160
170
180
2007 2008 2009 2010 2011 2012 2013
World
Advanced Economies
Emerging and DevelopingEconomies
Projections
-6
-4
-2
0
2
4
6
8
10
12
14
16
2007 2008 2009 2010 2011 2012 2013
% World
Advanced Economies
Emerging and DevelopingEconomies
Projections
31
Tables
Table 1: Returns on Carry Trade (2000-2007)
Source: IMF
Funding Currency Returns from Returns of InvestmentFunding Investment Appreciation Carry trades Currencies
US Dollar 3.4 10.2 1.1 7.9 Brazil, Mexico, and CanadaEuro 3.2 7.4 1.0 5.2 Iceland, Poland, and Czech RepublicJapanese Yen 0.1 5.3 5.2 10.7 Australia, Korea, and New Zealand
Interest rates
32
Table 2: Foreign Exchange Reserves (Million Dollars)
Brazil
China, P.R.:
Mainland India Indonesia
Russian
Federation
May-09 194 2093 253 56 387 Jun-09 200 2135 255 55 396 Jul-09 206 2178 262 55 385 Aug-09 215 2224 267 58 392 Sep-09 221 2288 271 60 395 Oct-09 230 2344 273 62 414 Nov-09 235 2405 270 63 425 Dec-09 237 2416 265 64 417 Jan-10 239 2432 263 67 414 Feb-10 240 2441 260 67 413 Mar-10 243 2464 261 69 423 Apr-10 246 2507 261 76 436 May-10 249 2456 255 72 429 Jun-10 252 2471 256 73 433 Jul-10 256 2556 266 76 448 Aug-10 260 2565 263 78 447 Sep-10 274 2667 272 83 458 Oct-10 283 2780 276 89 464 Nov-10 284 2786 270 90 449 Dec-10 287 2866 275 93 444 Jan-11 296 2952 278 92 451 Feb-11 306 3012 280 96 458 Mar-11 316 3067 283 102 465 Apr-11 326 3168 290 110 483 May-11 331 3188 288 113 480 Percentage Increase
From May 2009 71% 52% 14% 102% 24%
Source: IFS
33
References
Green, Stephen, “China, In, Out, Shake It About”, Global Research, Standard Chartered, May 5, 2011
Loeffler, Axel, Schnabl, Gunther and Schobert, Franziska, “Limits of Monetary Policy Autonomy by East Asian
Debtor Central Banks” (February 28, 2012),. CESifo Working Paper Series No. 3742. Available at SSRN:
http://ssrn.com/abstract=2012274
McKinnon, Ronald , “Currency Substitution and Instability in the World Dollar Standard, American Economic
Review June 1982, pp 320-333.
__________“The Rules of the Game: International Money in Historical Perspective”, Journal of Economic
Literature, March 1993, pp 1-44.
__________ “Zero Interest Rates and the Fall in U.S. Bank Lending”, The Journal of Economic Asymmetries
October 2009
__________” Beggar –Thy-Neighbor Interest Rate Policies”, Stanford Center for International Development
November, 2010
__________ “The Return of Stagflation” The Wall Street Journal , May 24, 2011.
__________The Unloved World Dollar Standard: From 1945 to the Rise of China , Oxford University Press,
forthcoming
_McKinnon, Ronald and Gunther Schnabl, “The Case for stabilizing China’s Exchange Rate:
Setting the Stage for Fiscal Expansion”, China & World Economy, vol. 17, Jan-Feb 2009.
____________________ “China and Its Dollar Exchange Rate: A Worldwide Stabilizing Influence?
CESifo Working Papers # 3449, May 2011.
Qiao, Hong (Helen) ‘Exchange Rate Changes and Trade Balances under the Dollar Standard”, Journal of Policy
Modeling, 29. 2007. P 765-82.
Rajan, Raghuram G., Fault Lines: How Hidden Fractures Still Threaten the World Economy, Princeton University
Press, 2010
Taylor, John, Getting Off Track :How Government Actions and Interventions, Caused, Prolonged, and Worsened the
Financial Crisis, Hoover Institution Press, Stanford University, 2009.
Wolf, Martin Financial Times, February 8, 2012

34


