Embed Size (px)
Citation preview
GAS CHROMATOGRAPHY
Innovation with Integrity
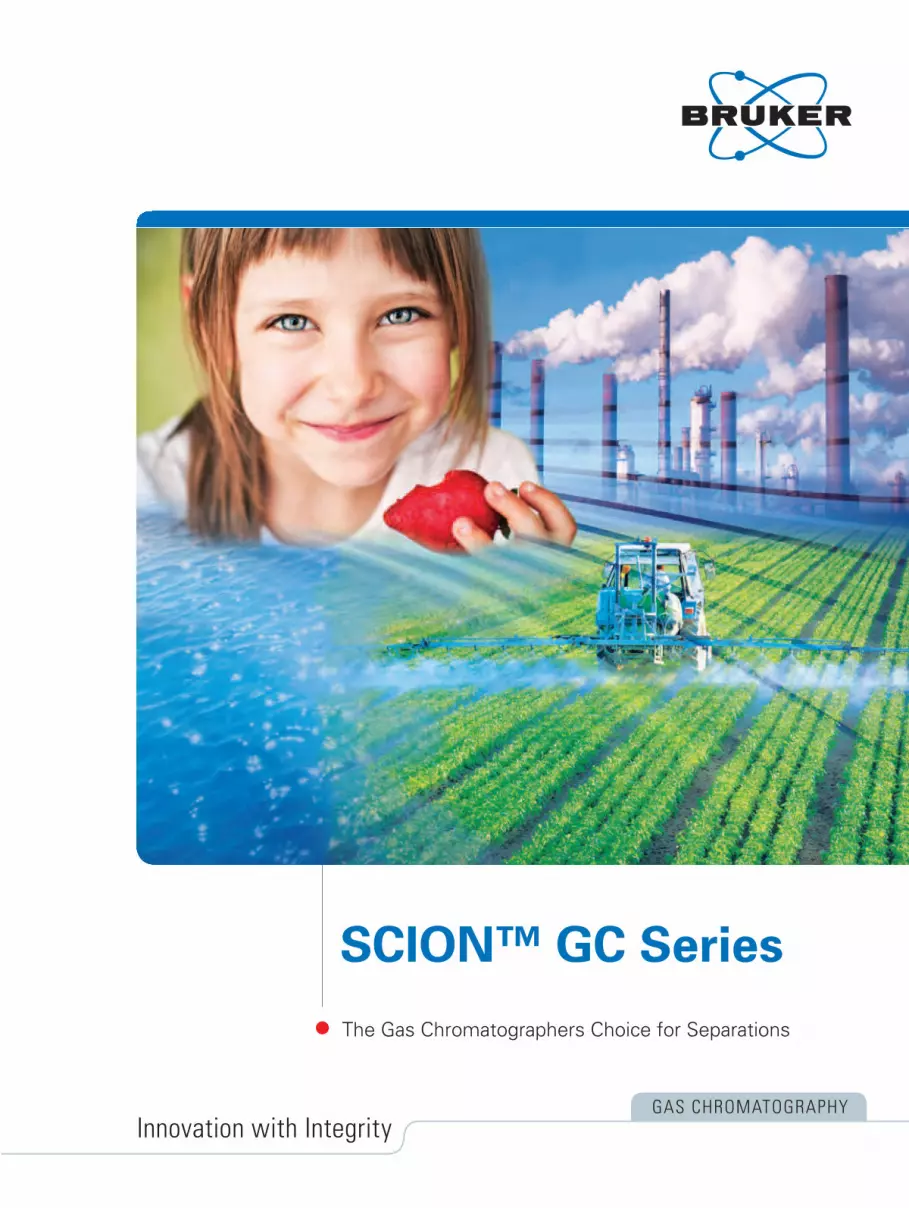
The Gas Chromatographers Choice for Separations
SCION™ GC Series

Innovation in Gas Chromatography
Bruker’s long tradition of innovation and product reliability have combined to create the
next generation of Bruker Gas Chromatographs. By understanding and then designing
to exceed the most critical performance and reliability needs of GC users, Bruker is
delivering systems that are especially for, and all about, the ultimate success of the GC
user. The new SCION 436-GC and SCION 456-GC have have been designed to meet
the most important user specified requirements – reliable performance, ease of use
and simple maintenance.
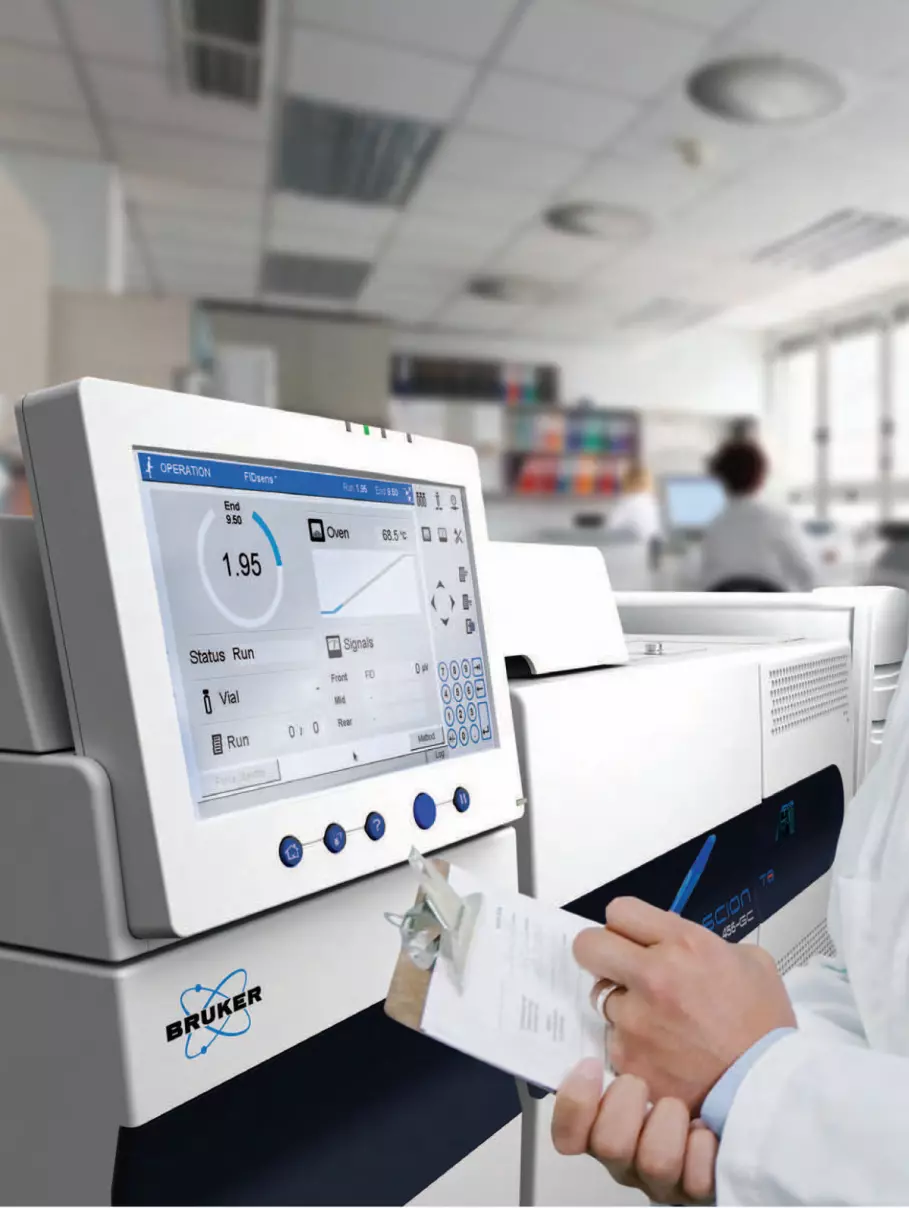
Local User Interface
This large, high resolution display makes
all GC functions accessible via touch
screen control and “instant access”
buttons. Easy to navigate and adapt it
comes available in 13 languages for ease
of local training and support.
Fast, Flexible Detection
Bruker’s comprehensive range of detec-
tors deliver industry leading sensitivity,
ease of operation and outstanding
reliability. And, now all Bruker detectors
feature fast sampling data rate (600Hz)
for rapid separations and greater analysis
throughput.
Multi-language capability
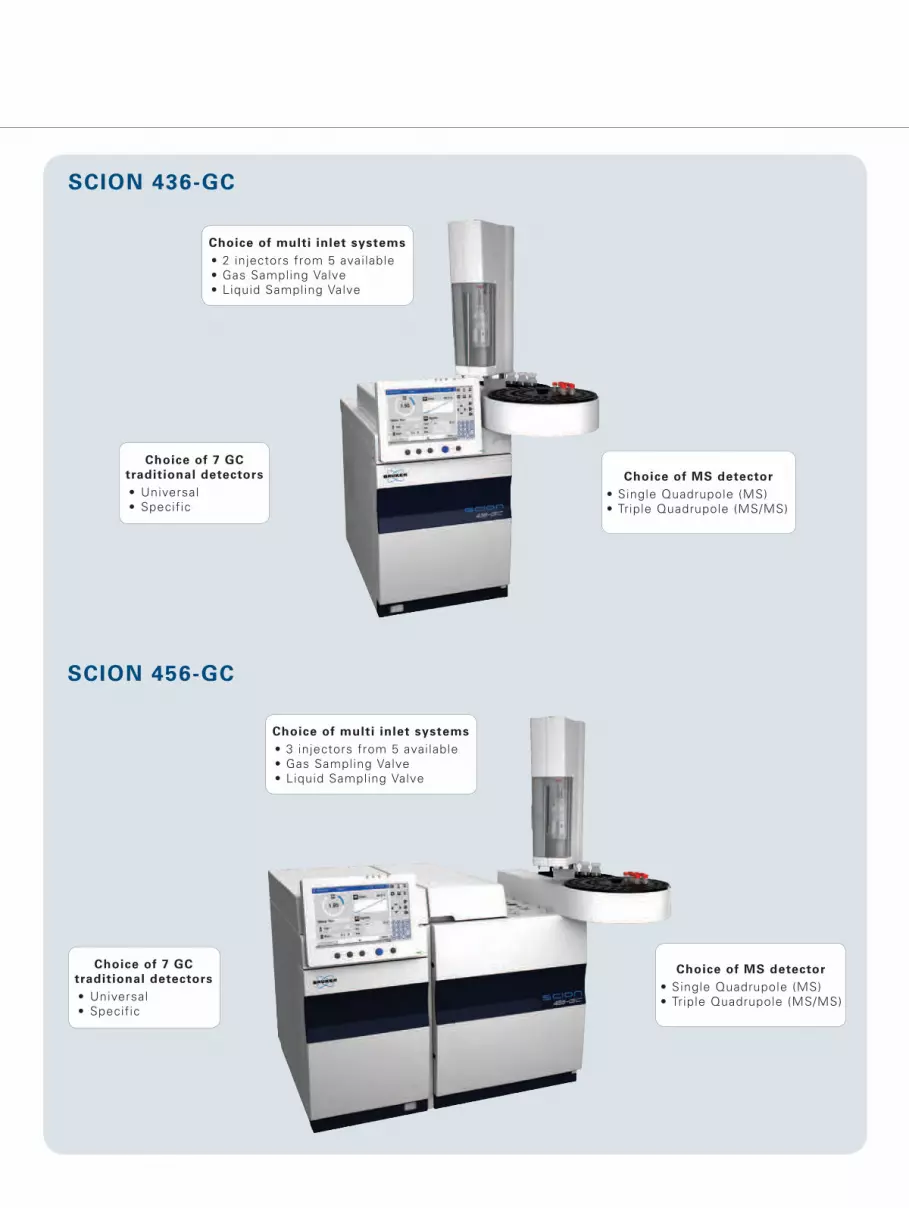
Choice of 7 GC
traditional detectors
• Universal
• Specific
Choice of multi inlet systems
• 2 injectors from 5 available
• Gas Sampling Valve
• Liquid Sampling Valve
Choice of MS detector
• Single Quadrupole (MS)
• Triple Quadrupole (MS/MS)
SCION 436-GC
SCION 456-GC
Choice of multi inlet systems
• 3 injectors from 5 available
• Gas Sampling Valve
• Liquid Sampling Valve
Choice of 7 GC
traditional detectors
• Universal
• Specific
Choice of MS detector
• Single Quadrupole (MS)
• Triple Quadrupole (MS/MS)
Turnkey Analyzer Solutions
Bruker configures and tests GC hardware
and software according to widely used
industry standard methods (e.g. ASTM,
UOP, EN, ISO, GPA), to save its clients
time and to ensure confidence in results.
Standard analyzers are configured to
meet the performance specifications
outlined in the method itself. Included in
these analyzer packages:
• All hardware
• Software (including special applica-
tion “plug-ins” when appropriate)
• Pre-installed methods
• Test chromatograms
• Installation/validation data
• User documentation customized to
the specific method
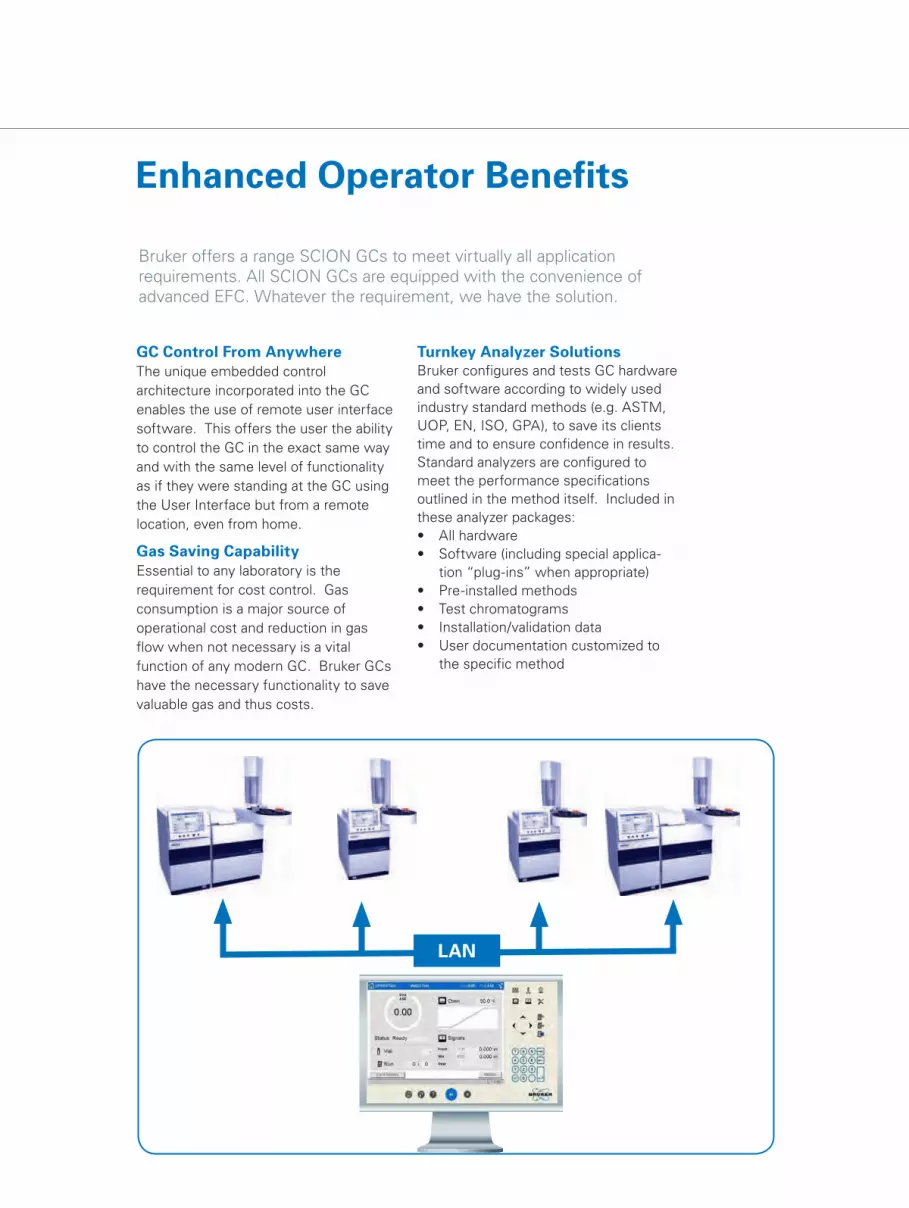
Bruker offers a range SCION GCs to meet virtually all application
requirements. All SCION GCs are equipped with the convenience of
advanced EFC. Whatever the requirement, we have the solution.
Enhanced Operator Benefits
GC Control From Anywhere
The unique embedded control
architecture incorporated into the GC
enables the use of remote user interface
software. This offers the user the ability
to control the GC in the exact same way
and with the same level of functionality
as if they were standing at the GC using
the User Interface but from a remote
location, even from home.
Gas Saving Capability
Essential to any laboratory is the
requirement for cost control. Gas
consumption is a major source of
operational cost and reduction in gas
flow when not necessary is a vital
function of any modern GC. Bruker GCs
have the necessary functionality to save
valuable gas and thus costs.
LAN
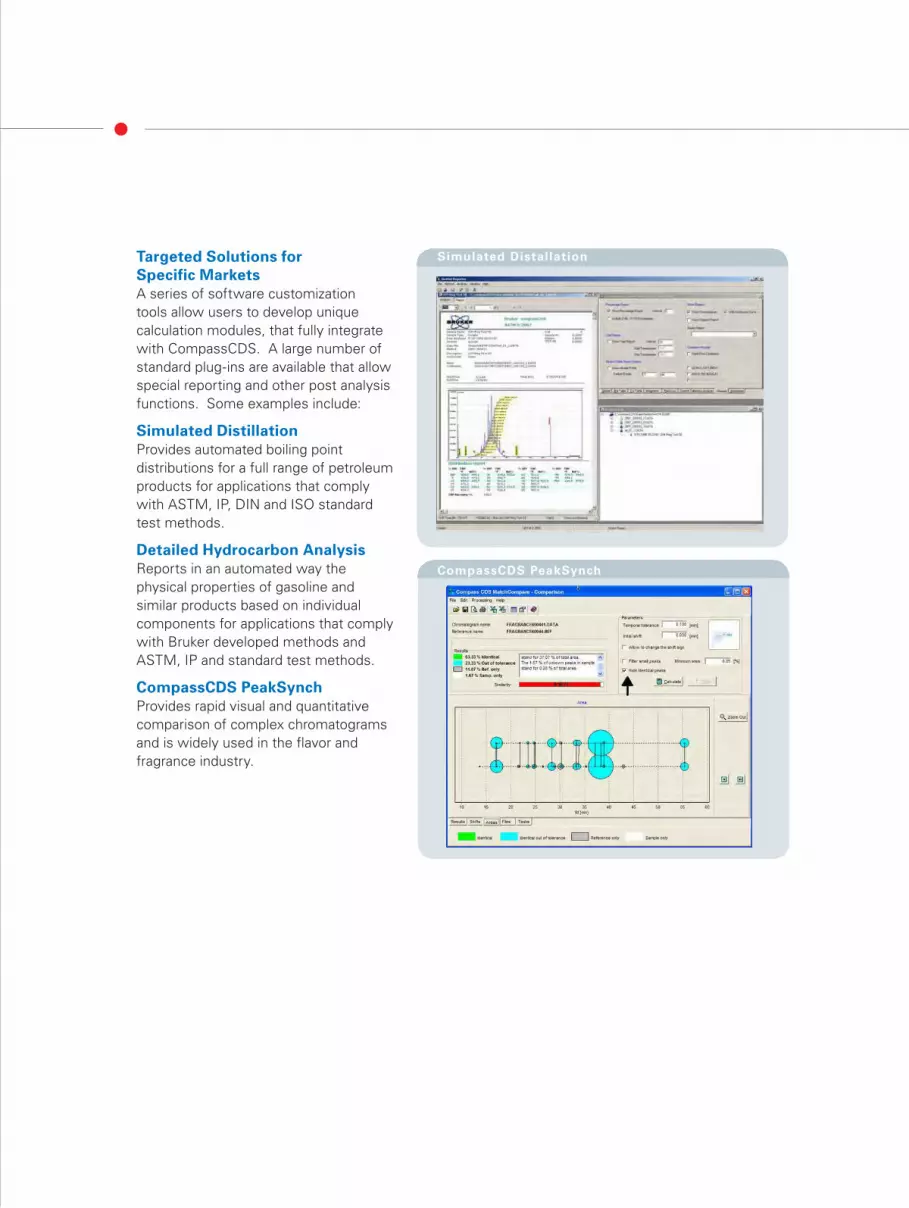
Targeted Solutions for
Specific Markets
A series of software customization
tools allow users to develop unique
calculation modules, that fully integrate
with CompassCDS. A large number of
standard plug-ins are available that allow
special reporting and other post analysis
functions. Some examples include:
Simulated Distillation
Provides automated boiling point
distributions for a full range of petroleum
products for applications that comply
with ASTM, IP, DIN and ISO standard
test methods.
Detailed Hydrocarbon Analysis
Reports in an automated way the
physical properties of gasoline and
similar products based on individual
components for applications that comply
with Bruker developed methods and
ASTM, IP and standard test methods.
CompassCDS PeakSynch
Provides rapid visual and quantitative
comparison of complex chromatograms
and is widely used in the flavor and
fragrance industry.
Simulated Distallation
CompassCDS PeakSynch
436 GC
Small dedicated high trough putt
system
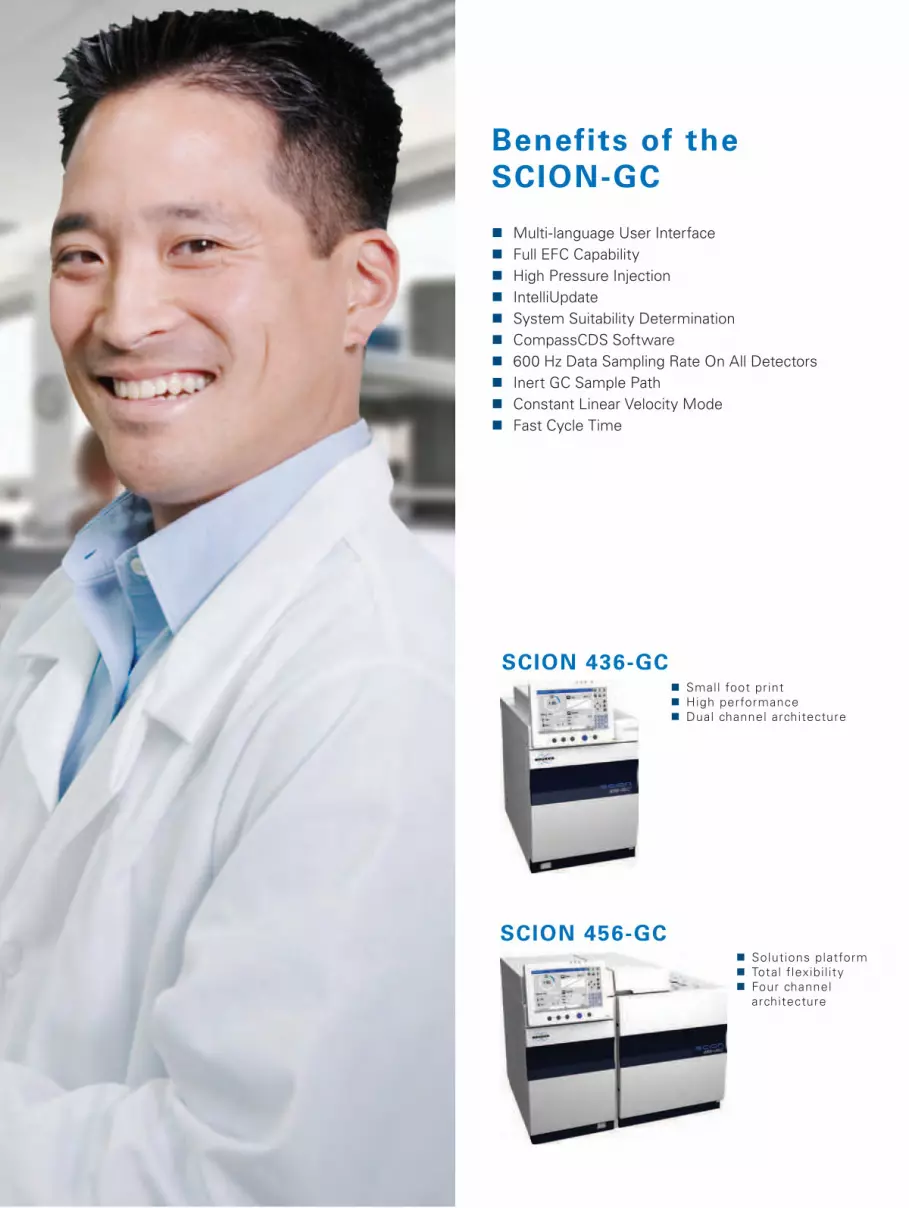
n Multi-language User Interface
n Full EFC Capability
n High Pressure Injection
n IntelliUpdate
n System Suitability Determination
n CompassCDS Software
n 600 Hz Data Sampling Rate On All Detectors
n Inert GC Sample Path
n Constant Linear Velocity Mode
n Fast Cycle Time
nSmall foot print
nHigh performance
nDual channel architecture
Benefits of the
SCION-GC
SCION 436-GC
SCION 456-GCnSolutions platform
nTotal flexibil ity
nFour channel
architecture
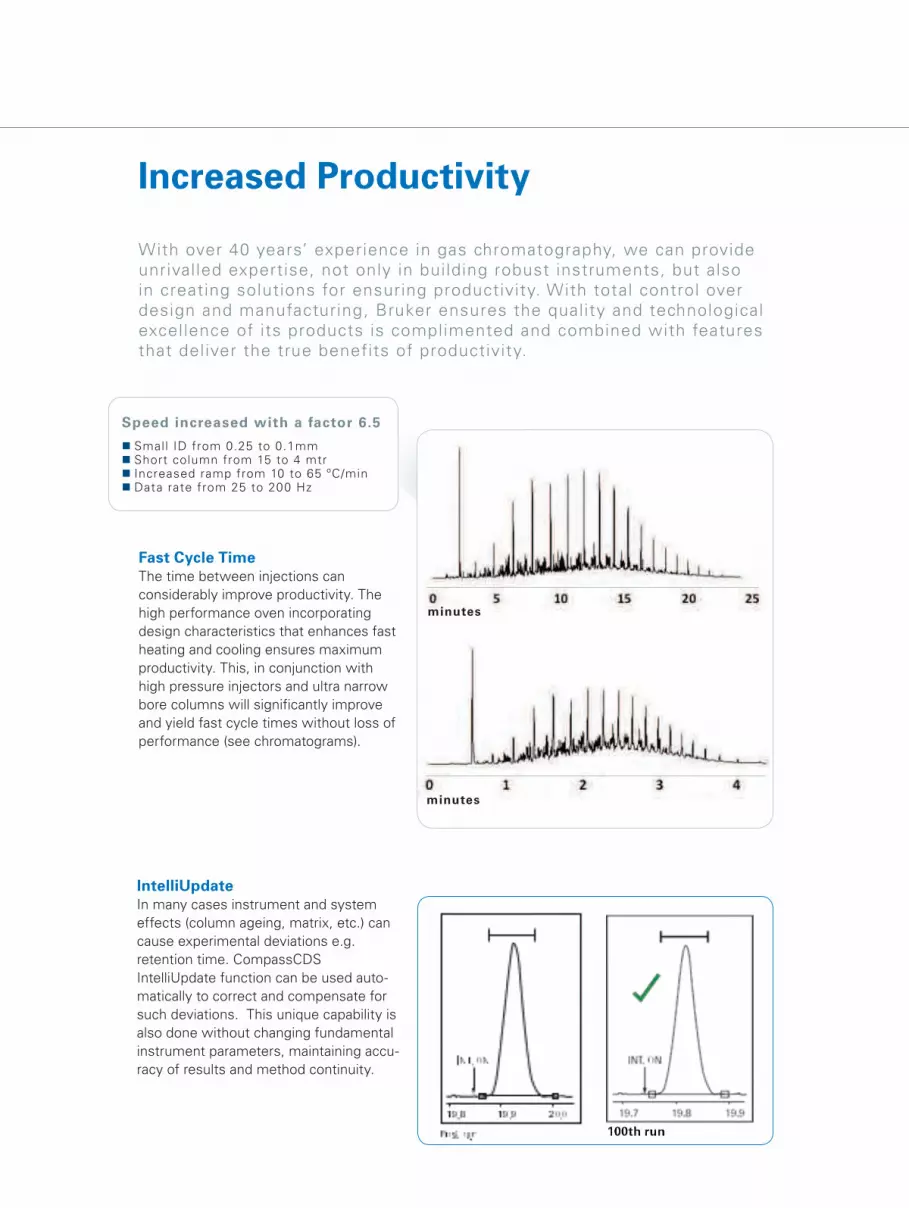
Increased Productivity
With over 40 years’ experience in gas chromatography, we can provide
unrivalled expertise, not only in building robust instruments, but also
in creating solutions for ensuring productivity. With total control over
design and manufacturing, Bruker ensures the quality and technological
excellence of its products is complimented and combined with features
that deliver the true benefits of productivity.
Fast Cycle Time
The time between injections can
considerably improve productivity. The
high performance oven incorporating
design characteristics that enhances fast
heating and cooling ensures maximum
productivity. This, in conjunction with
high pressure injectors and ultra narrow
bore columns will significantly improve
and yield fast cycle times without loss of
performance (see chromatograms).
IntelliUpdate
In many cases instrument and system
effects (column ageing, matrix, etc.) can
cause experimental deviations e.g.
retention time. CompassCDS
IntelliUpdate function can be used auto-
matically to correct and compensate for
such deviations. This unique capability is
also done without changing fundamental
instrument parameters, maintaining accu-
racy of results and method continuity.
minutes
minutes
Speed increased with a factor 6.5
n Small ID from 0.25 to 0.1mmn Short column from 15 to 4 mtrn Increased ramp from 10 to 65 ºC/minn Data rate from 25 to 200 Hz
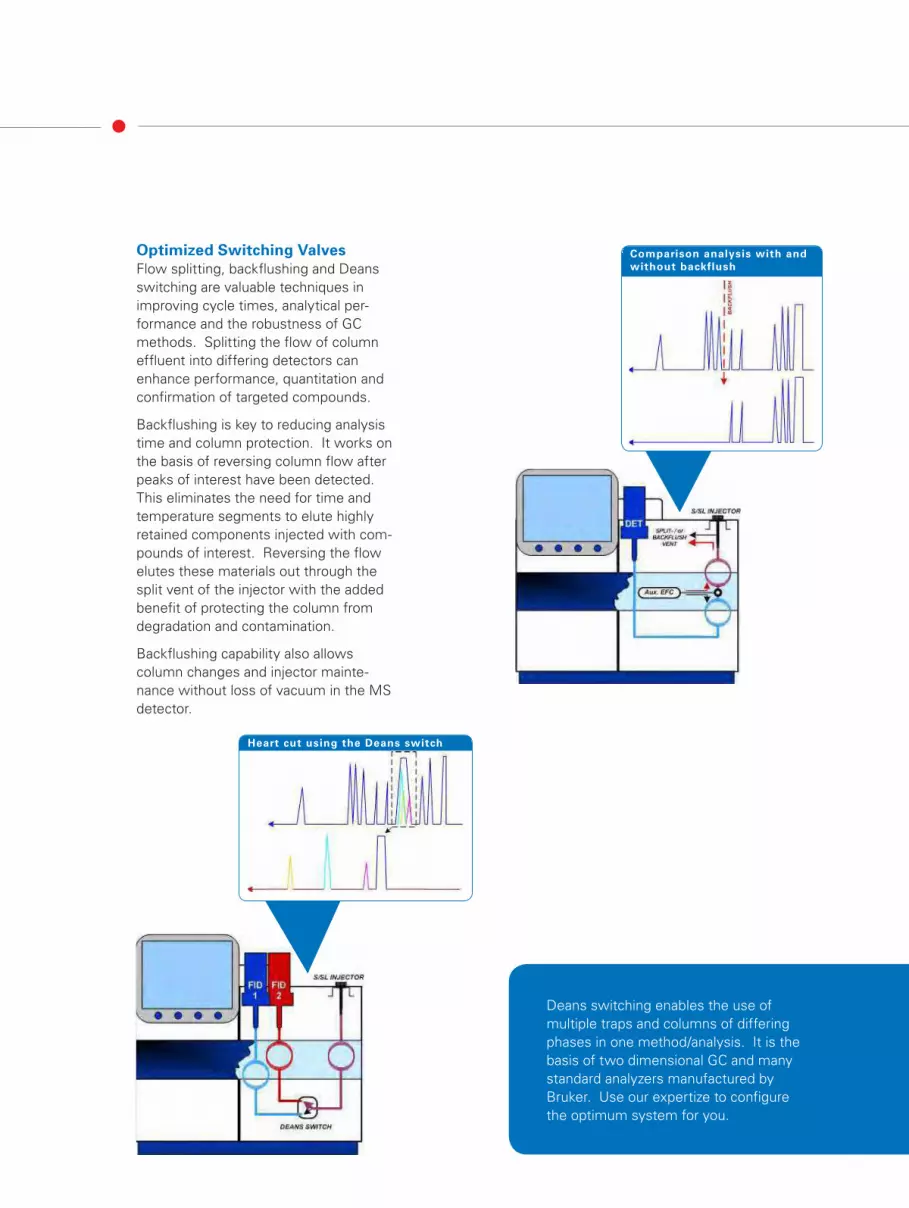
Optimized Switching Valves
Flow splitting, backflushing and Deans
switching are valuable techniques in
improving cycle times, analytical per-
formance and the robustness of GC
methods. Splitting the flow of column
effluent into differing detectors can
enhance performance, quantitation and
confirmation of targeted compounds.
Backflushing is key to reducing analysis
time and column protection. It works on
the basis of reversing column flow after
peaks of interest have been detected.
This eliminates the need for time and
temperature segments to elute highly
retained components injected with com-
pounds of interest. Reversing the flow
elutes these materials out through the
split vent of the injector with the added
benefit of protecting the column from
degradation and contamination.
Backflushing capability also allows
column changes and injector mainte-
nance without loss of vacuum in the MS
detector.
Comparison analysis with and
without backflush
Heart cut using the Deans switch
Deans switching enables the use of
multiple traps and columns of differing
phases in one method/analysis. It is the
basis of two dimensional GC and many
standard analyzers manufactured by
Bruker. Use our expertize to configure
the optimum system for you.
CompassCDS software

Capability and Automation
Bruker offers an injector and detector range to meet virtually all application and
market requirements. All are equipped with the convenience of advanced EFC.
Whatever the requirement, be it Split/splitless, Cold-on-Column, Packed, Flash or Pro-
grammable Temperature Vapourizing injector with a universal or specific detector we
have the solution.
P
etro leum
E
nviro men
t
A
cade mic
Beverage
Food
T
oxico log
y
Forensics
Universal Specific
FID TCD PHHID MS ECD NPD (TSD) PFPD
✓ ✓ ✓ ✓
✓ ✓ ✓ ✓ ✓
✓ ✓ ✓ ✓ ✓ ✓
✓ ✓ ✓
✓ ✓ ✓ ✓ ✓ ✓ ✓
Bruker offers a range of differing injector
designs for all applications, column dimensi-
ons and can be fully automated.
Trace
Analysis
Separation
& Speed
Sample
Capacity
Wide Range
of Analytes
Preferred Column Type 1st Choice 2nd Choice
✓ Capillary, 0.53 mm ID Large Volume (LV) Split/Splitless
✓ Capillary, 0.1 to 0.53 mm ID Split/Splitless Large Volume (LV) SS Mode
✓ ✓ Capillary, 0.53 mm ID Large Volume (LV)
✓ Capillary, retention gap Cold On-Column Large Volume PTV Mode
✓ Capillary, 0.53 mm ID Packed Large Volume (LV) PTV Mode
✓ Capillary, 0.53 mm ID Cold On-Column Large Volume (LV) On-Column Mode
Injector Selection Guide - Sample/Analysis Characteristics or Requirements
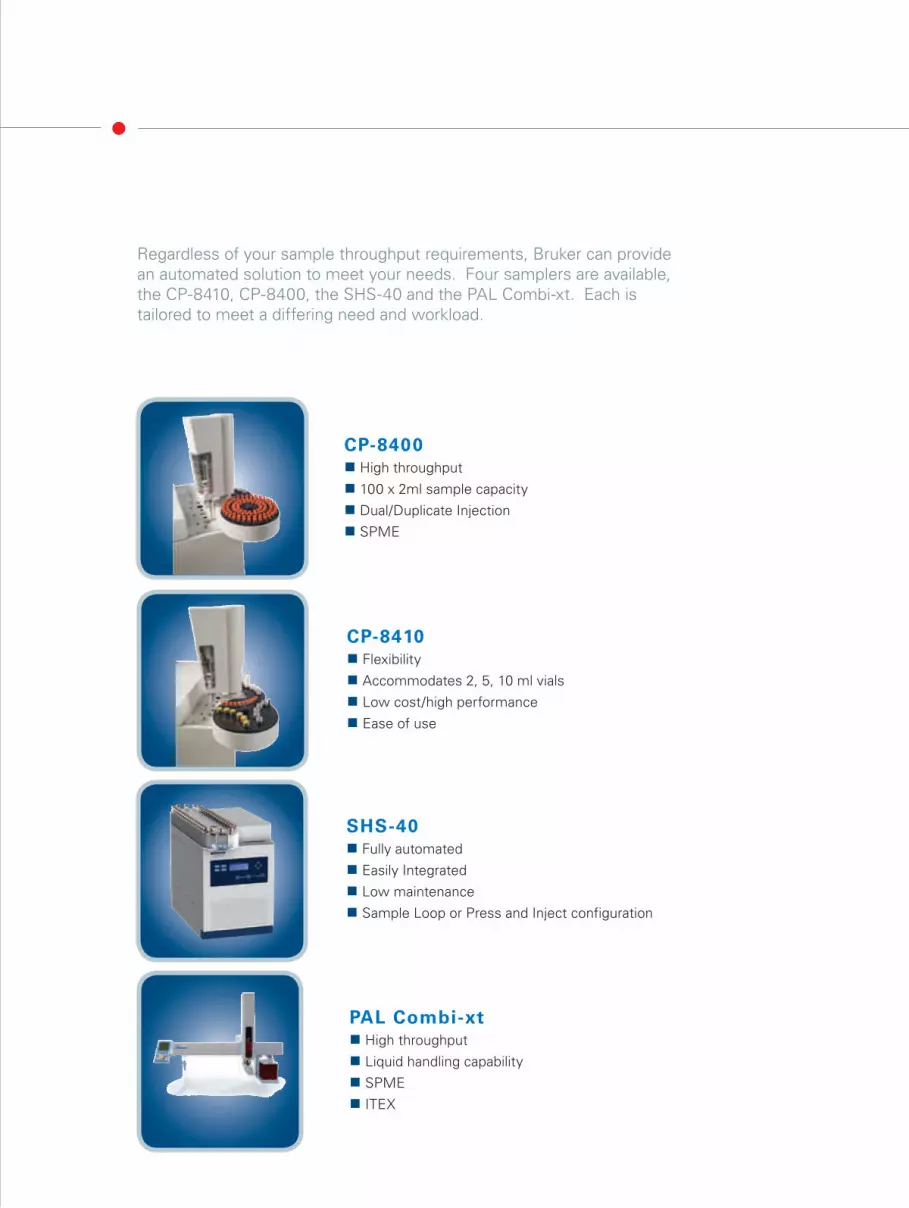
Regardless of your sample throughput requirements, Bruker can provide
an automated solution to meet your needs. Four samplers are available,
the CP-8410, CP-8400, the SHS-40 and the PAL Combi-xt. Each is
tailored to meet a differing need and workload.
CP-8400 n High throughput
n 100 x 2ml sample capacity
n Dual/Duplicate Injection
n SPME
CP-8410 n Flexibility
n Accommodates 2, 5, 10 ml vials
n Low cost/high performance
n Ease of use
SHS-40 n Fully automated
n Easily Integrated
n Low maintenance
n Sample Loop or Press and Inject configuration
PAL Combi-xt n High throughput
n Liquid handling capability
n SPME
n ITEX
www.bruker.com/scion
Bru
ke
r D
alt
on
ics is c
on
tin
ually im
pro
vin
g its
pro
du
cts
an
d r
ese
rve
s t
he r
igh
t to
ch
an
ge s
pe
cif
icati
on
s w
ith
ou
t n
oti
ce
.
© B
DA
L 0
4-2
012
. #
28
17
54 S
up
er
Cle
an™
is a
re
gis
tere
d t
rad
em
ark
of
SG
T M
idd
elb
urg
B.V
.
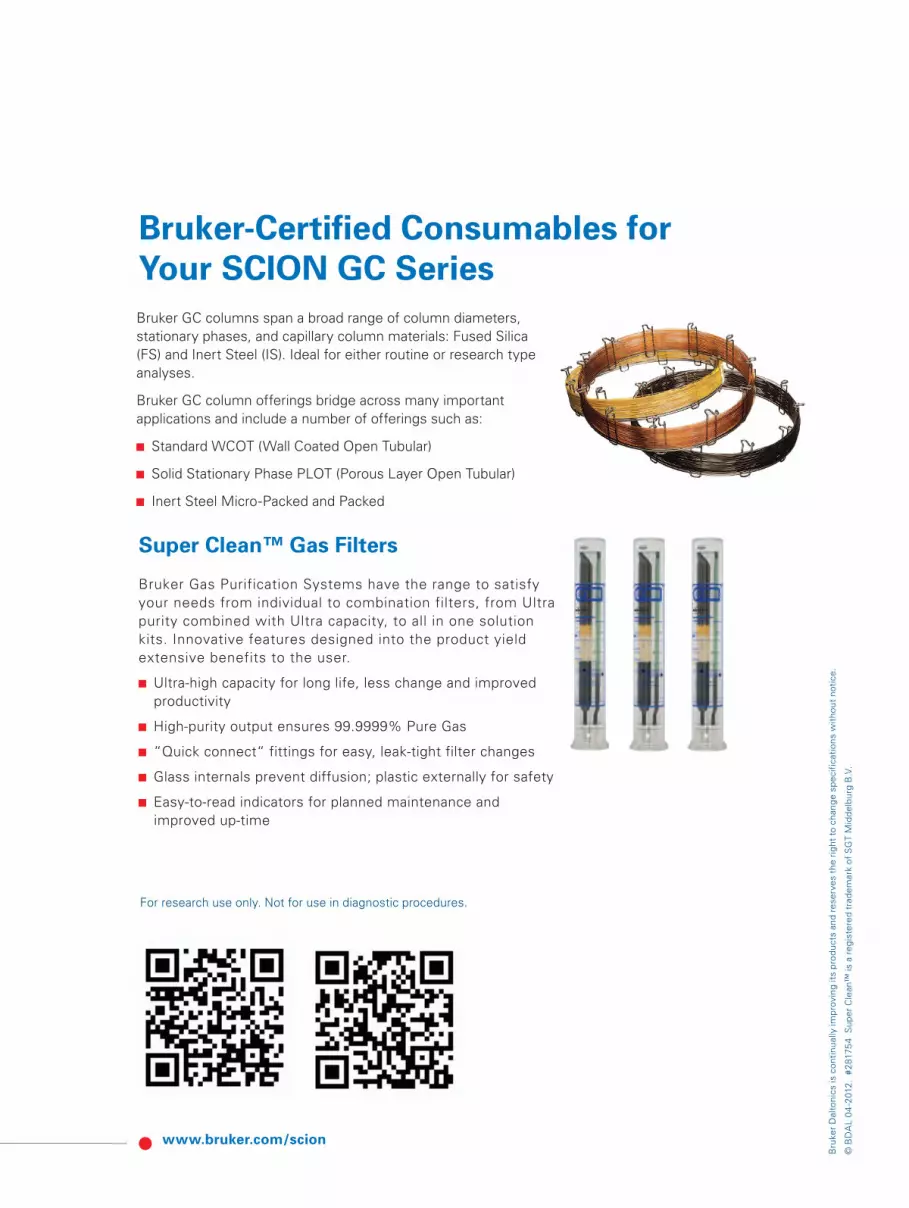
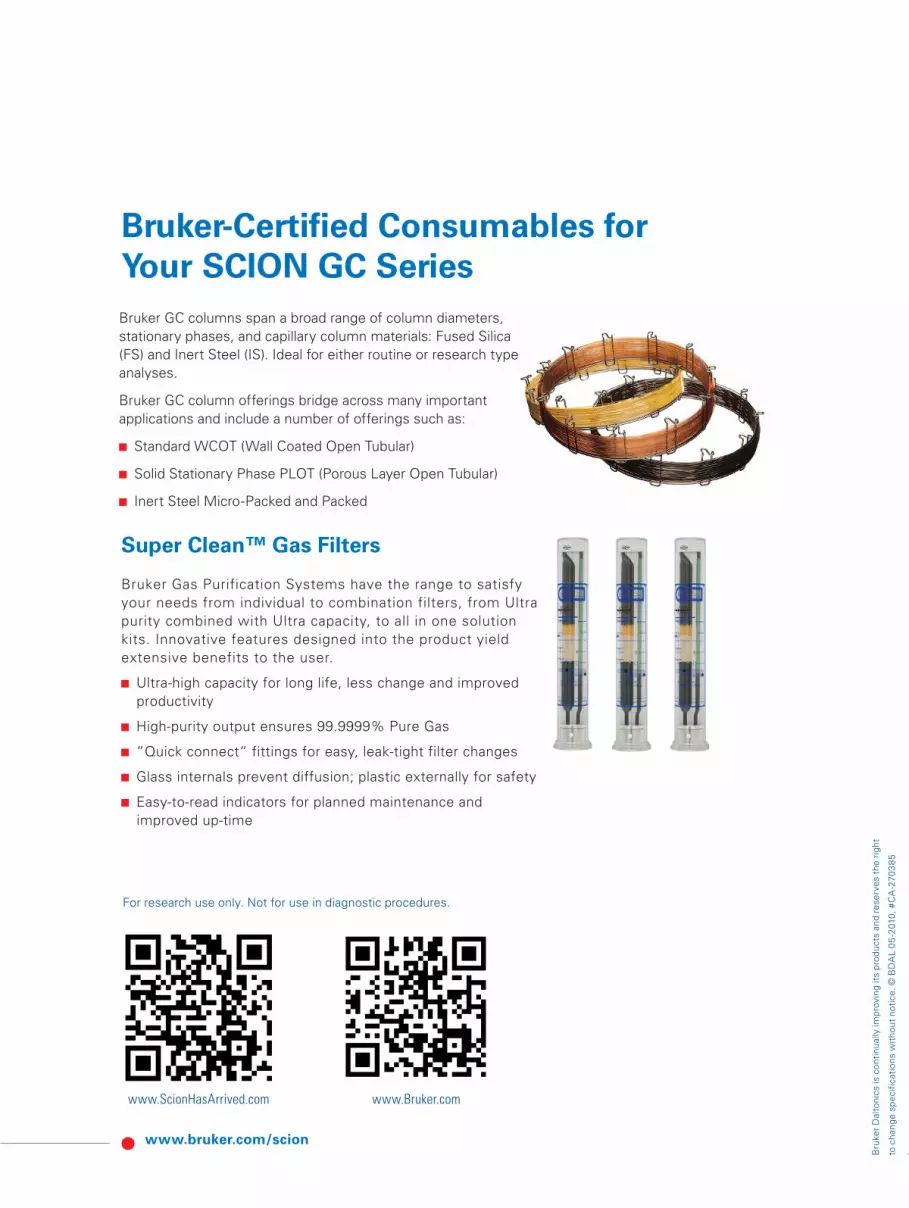
Bruker-Certified Consumables for
Your SCION GC Series
Bruker GC columns span a broad range of column diameters,
stationary phases, and capillary column materials: Fused Silica
(FS) and Inert Steel (IS). Ideal for either routine or research type
analyses.
Bruker GC column offerings bridge across many important
applications and include a number of offerings such as:
Standard WCOT (Wall Coated Open Tubular)
Solid Stationary Phase PLOT (Porous Layer Open Tubular)
Inert Steel Micro-Packed and Packed
For research use only. Not for use in diagnostic procedures.
Super Clean™ Gas Filters
Bruker Gas Purification Systems have the range to satisfy
your needs from individual to combination filters, from Ultra
purity combined with Ultra capacity, to all in one solution
kits. Innovative features designed into the product yield
extensive benefits to the user.
Ultra-high capacity for long life, less change and improved
productivity
High-purity output ensures 99.9999% Pure Gas
“Quick connect“ fittings for easy, leak-tight filter changes
Glass internals prevent diffusion; plastic externally for safety
Easy-to-read indicators for planned maintenance and
improved up-time
For research use only. Not for use in diagnostic procedures.
Bruker Daltonics is continually improving its products and
reserves the right to change specifications without notice.
© Bruker Daltonics 04-2012, #CA-701221
www.bruker.com/chemicalanalysis
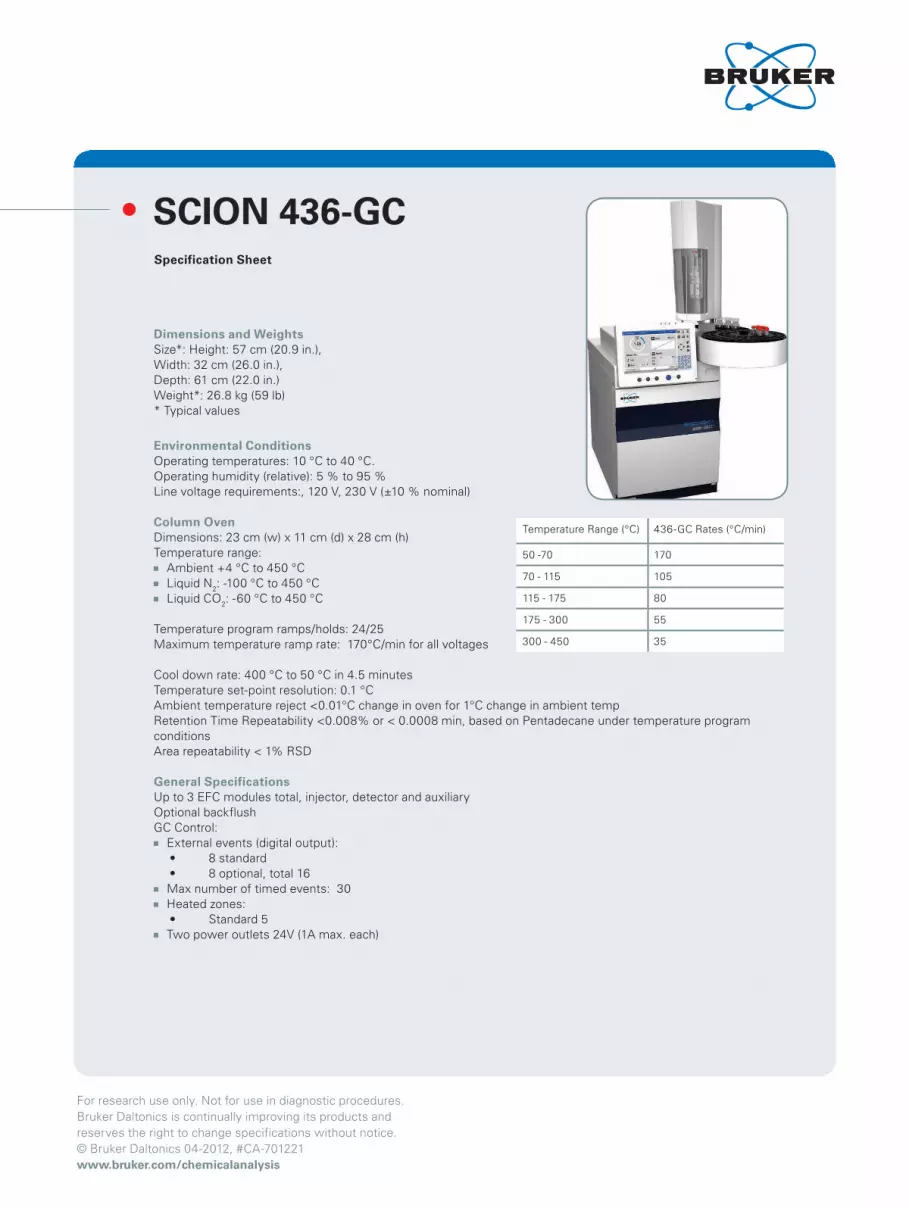
Dimensions and Weights
Size*: Height: 57 cm (20.9 in.),
Width: 32 cm (26.0 in.),
Depth: 61 cm (22.0 in.)
Weight*: 26.8 kg (59 lb)
* Typical values
Environmental Conditions
Operating temperatures: 10 °C to 40 °C.
Operating humidity (relative): 5 % to 95 %
Line voltage requirements:, 120 V, 230 V (±10 % nominal)
Column Oven
Dimensions: 23 cm (w) x 11 cm (d) x 28 cm (h)
Temperature range:
Ambient +4 °C to 450 °C
Liquid N2: -100 °C to 450 °C
Liquid CO2: -60 °C to 450 °C
Temperature program ramps/holds: 24/25
Maximum temperature ramp rate: 170°C/min for all voltages
Cool down rate: 400 °C to 50 °C in 4.5 minutes
Temperature set-point resolution: 0.1 °C
Ambient temperature reject <0.01°C change in oven for 1°C change in ambient temp
Retention Time Repeatability <0.008% or < 0.0008 min, based on Pentadecane under temperature program
conditions
Area repeatability < 1% RSD
General Specifications
Up to 3 EFC modules total, injector, detector and auxiliary
Optional backflush
GC Control:
External events (digital output):
• 8 standard
• 8 optional, total 16
Max number of timed events: 30
Heated zones:
• Standard 5
Two power outlets 24V (1A max. each)
Specification Sheet
SCION 436-GC
Temperature Range (°C) 436-GC Rates (°C/min)
50 -70 170
70 - 115 105
115 - 175 80
175 - 300 55
300 - 450 35
For research use only. Not for use in diagnostic procedures.
Bruker Daltonics is continually improving its products and
reserves the right to change specifications without notice.
© Bruker Daltonics 04-2012, #CA-701221
www.bruker.com/chemicalanalysis
Methods:
Maximum stored internal methods: 50 (max. 30 alphanumeric characters)
Logging:
Run log file (stored with the chromatogram when using CompassCDS)
Error log file
Local Display:
TFT full color screen
WVGA resolution (800 x 480)
Size 23 cm (9")
Local Control:
Touch screen
Hard keys
Languages:
English, German, French, Spanish, Italian, Portuguese, Cyrillic, Kanji, Chinese (standard and traditional),
Thai, Korean and Dutch.
Local automation:
Method lines: 25
Modes:
• Infinite looping
• Dual and duplicate injection
Communication
Ethernet: Protocol: TCP/IP
Data rate: 100 Mbps
Control: GC control and method parameters
Analog output (optional):
Number of channels: 1
Time programmable steps: 30
Output software selectable (set individual):
• 0-1 V (default)
• 0-10 V
Synchronization signals with other devices and data systems:
Ready in and out
Start in and out
Data Handling and System Control:
CompassCDS Chromatography Data System
Certifications
CSA:
• C22.2 61010-1
• UL 61010-1
IEC: 61010-1
EMC:
• 47 CFR part 15
• ANSI C63.4
• EN 61326
For research use only. Not for use in diagnostic procedures.
Bruker Daltonics is continually improving its products and
reserves the right to change specifications without notice.
© Bruker Daltonics 04-2012, #CA-701221
www.bruker.com/chemicalanalysis
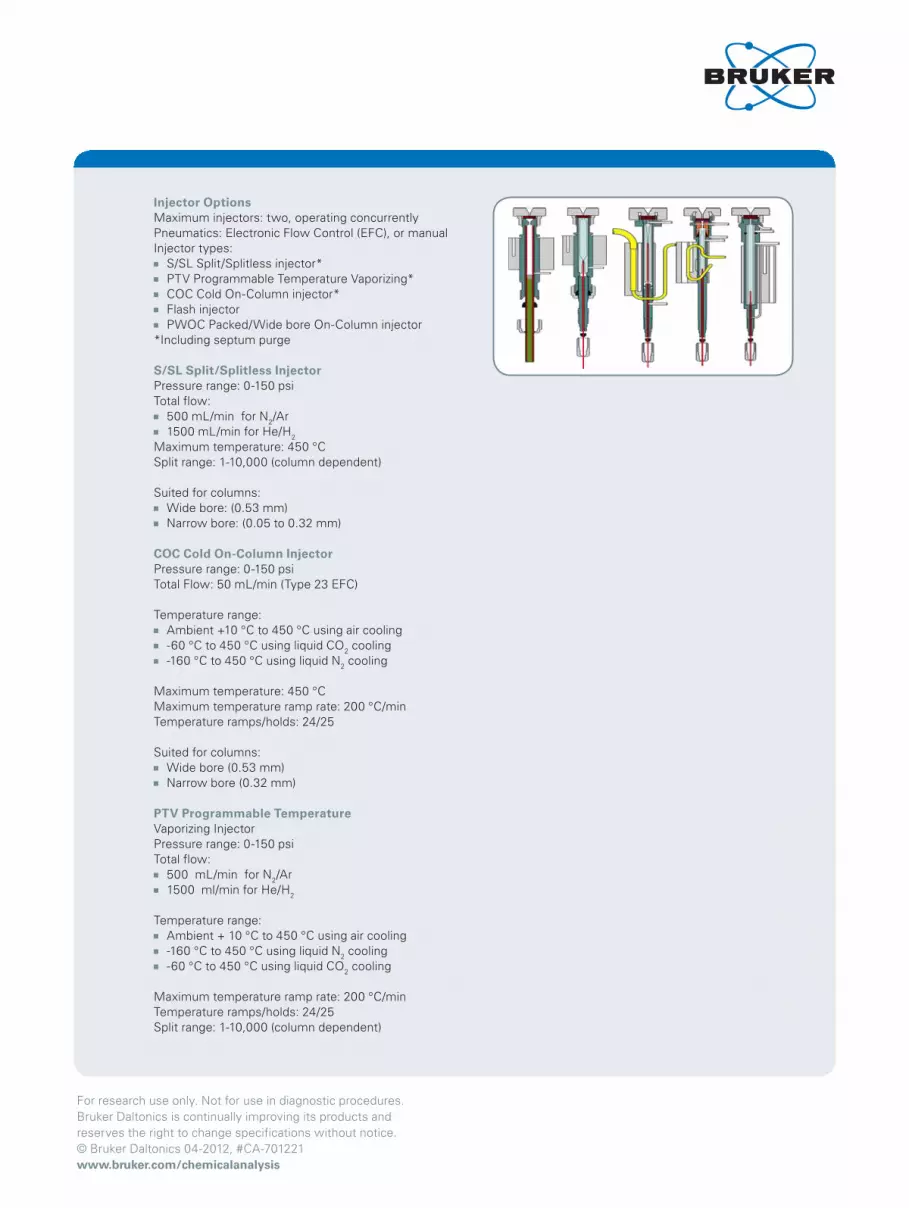
Injector Options
Maximum injectors: two, operating concurrently
Pneumatics: Electronic Flow Control (EFC), or manual
Injector types:
S/SL Split/Splitless injector*
PTV Programmable Temperature Vaporizing*
COC Cold On-Column injector*
Flash injector
PWOC Packed/Wide bore On-Column injector
*Including septum purge
S/SL Split/Splitless Injector
Pressure range: 0-150 psi
Total flow:
500 mL/min for N2/Ar
1500 mL/min for He/H2
Maximum temperature: 450 °C
Split range: 1-10,000 (column dependent)
Suited for columns:
Wide bore: (0.53 mm)
Narrow bore: (0.05 to 0.32 mm)
COC Cold On-Column Injector
Pressure range: 0-150 psi
Total Flow: 50 mL/min (Type 23 EFC)
Temperature range:
Ambient +10 °C to 450 °C using air cooling
-60 °C to 450 °C using liquid CO2 cooling
-160 °C to 450 °C using liquid N2 cooling
Maximum temperature: 450 °C
Maximum temperature ramp rate: 200 °C/min
Temperature ramps/holds: 24/25
Suited for columns:
Wide bore (0.53 mm)
Narrow bore (0.32 mm)
PTV Programmable Temperature
Vaporizing Injector
Pressure range: 0-150 psi
Total flow:
500 mL/min for N2/Ar
1500 ml/min for He/H2
Temperature range:
Ambient + 10 °C to 450 °C using air cooling
-160 °C to 450 °C using liquid N2 cooling
-60 °C to 450 °C using liquid CO2 cooling
Maximum temperature ramp rate: 200 °C/min
Temperature ramps/holds: 24/25
Split range: 1-10,000 (column dependent)
For research use only. Not for use in diagnostic procedures.
Bruker Daltonics is continually improving its products and
reserves the right to change specifications without notice.
© Bruker Daltonics 04-2012, #CA-701221
www.bruker.com/chemicalanalysis
Operational capabilities:
Large volume injection
Temperature ramped splitless
Cold on-column
Split and splitless
ChromatoProbe solid sample introduction optional
Suited for columns:
Wide bore (0.53 mm)
Narrow bore (0.05 to 0.32 mm)
Maximum injection volume: 250 μL (LVI mode)
Flash Injector
Pressure range: 0-150 psi
Total flow:
50 mL/min (Type 23 EFC)
Maximum temperature: 450 °C
Suited for columns:
Wide bore (0.53 mm)
Packed (1/8” to 1/4”)
PWOC Packed/Wide-bore On-Column Injector
Pressure range: 0-150 psi
Total flow:
50 mL/min (Type 23 EFC)
Maximum temperature: 450 °C
Suited for columns:
Wide bore (0.53 mm)
Packed (1/8” to 1/4”)
Electronic Flow Control: Injectors (EFC)
Module types: 2 injector-specific modules
Pressure: 0.1 % Full Scale
Resolution pressure set points is 0.001psi
Flow sensor accuracy 2% of measured or 0.2% of full scale
Flow sensor repeatability 0.5%
For research use only. Not for use in diagnostic procedures.
Bruker Daltonics is continually improving its products and
reserves the right to change specifications without notice.
© Bruker Daltonics 04-2012, #CA-701221
www.bruker.com/chemicalanalysis
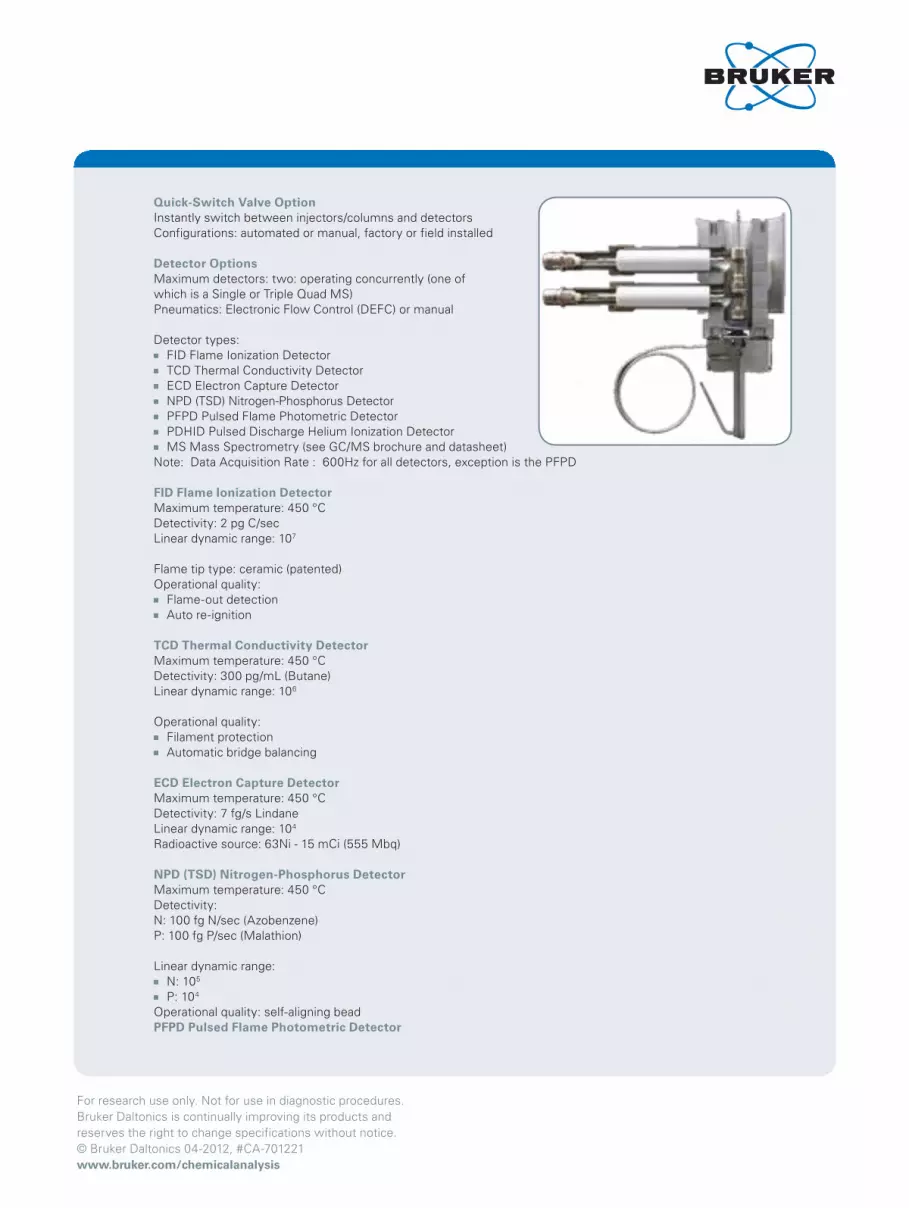
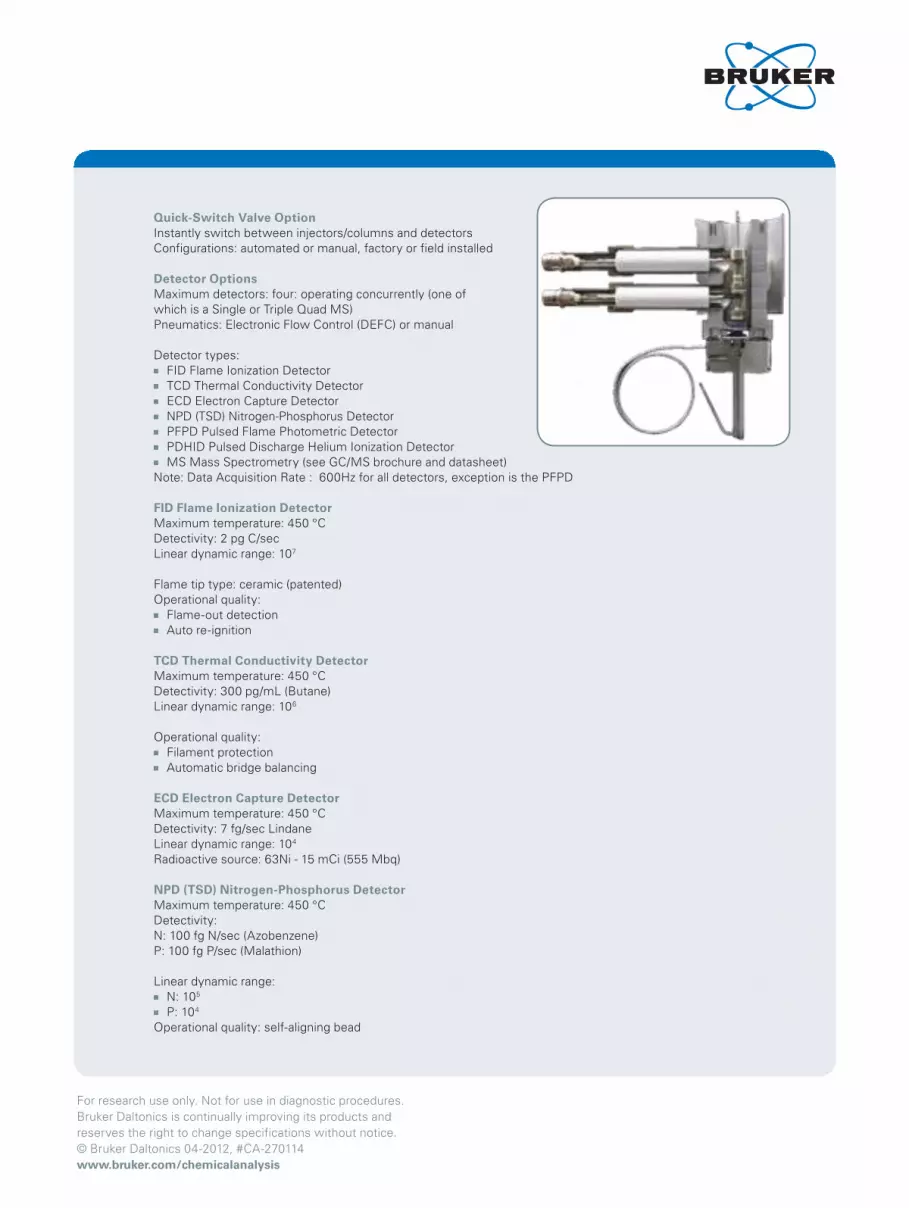
Quick-Switch Valve Option
Instantly switch between injectors/columns and detectors
Configurations: automated or manual, factory or field installed
Detector Options
Maximum detectors: two: operating concurrently (one of
which is a Single or Triple Quad MS)
Pneumatics: Electronic Flow Control (DEFC) or manual
Detector types:
FID Flame Ionization Detector
TCD Thermal Conductivity Detector
ECD Electron Capture Detector
NPD (TSD) Nitrogen-Phosphorus Detector
PFPD Pulsed Flame Photometric Detector
PDHID Pulsed Discharge Helium Ionization Detector
MS Mass Spectrometry (see GC/MS brochure and datasheet)
Note: Data Acquisition Rate : 600Hz for all detectors, exception is the PFPD
FID Flame Ionization Detector
Maximum temperature: 450 °C
Detectivity: 2 pg C/sec
Linear dynamic range: 107
Flame tip type: ceramic (patented)
Operational quality:
Flame-out detection
Auto re-ignition
TCD Thermal Conductivity Detector
Maximum temperature: 450 °C
Detectivity: 300 pg/mL (Butane)
Linear dynamic range: 106
Operational quality:
Filament protection
Automatic bridge balancing
ECD Electron Capture Detector
Maximum temperature: 450 °C
Detectivity: 7 fg/s Lindane
Linear dynamic range: 104
Radioactive source: 63Ni - 15 mCi (555 Mbq)
NPD (TSD) Nitrogen-Phosphorus Detector
Maximum temperature: 450 °C
Detectivity:
N: 100 fg N/sec (Azobenzene)
P: 100 fg P/sec (Malathion)
Linear dynamic range:
N: 105
P: 104
Operational quality: self-aligning bead
PFPD Pulsed Flame Photometric Detector
For research use only. Not for use in diagnostic procedures.
Bruker Daltonics is continually improving its products and
reserves the right to change specifications without notice.
© Bruker Daltonics 04-2012, #CA-701221
www.bruker.com/chemicalanalysis
Photomultiplier tube:
S/P
S/P/N
Maximum temperature: 450 °C
Detectivity:
S: 1 pg S/sec (S/P tube)
P: 100 fg P/sec (S/P tube)
N: 20 pg N/sec (S/P/N tube)
Linear dynamic range:
S: 103
P: 104
N: 102
Up to 23 elements can be detected
PDHID Pulsed Discharge Helium Ionization Detector
Detectivity: 50 ppb (Methane)
Linear dynamic range: 104 (Methane)
Operational quality:
Gold plated connections
Welded column connections
Detectors (DEFC)
Module types: 6 detector-specific modules
Accuracy: ± 7 % set point flow
Resolution: 0.1 or 1 mL/min
Automation Options
CP-8410 Auto Injector
Sample capacity:
10 x 2 mL vials
6 x 5 mL vials
5 x 10 mL vials
Large solvent wash vial: 2 x 120 mL*
Dual and duplicate mode
Internal standard addition
Modes of operation:
Liquid
Ambient headspace*
SPME (Solid Phase MicroExtraction)*
Sample heating and cooling*
Pre-programmed modes of injection Syringes:
1 μL, 2 μL, 5 μL, 10 μL, 100 μL, 250 μL
for liquid injection
SPME
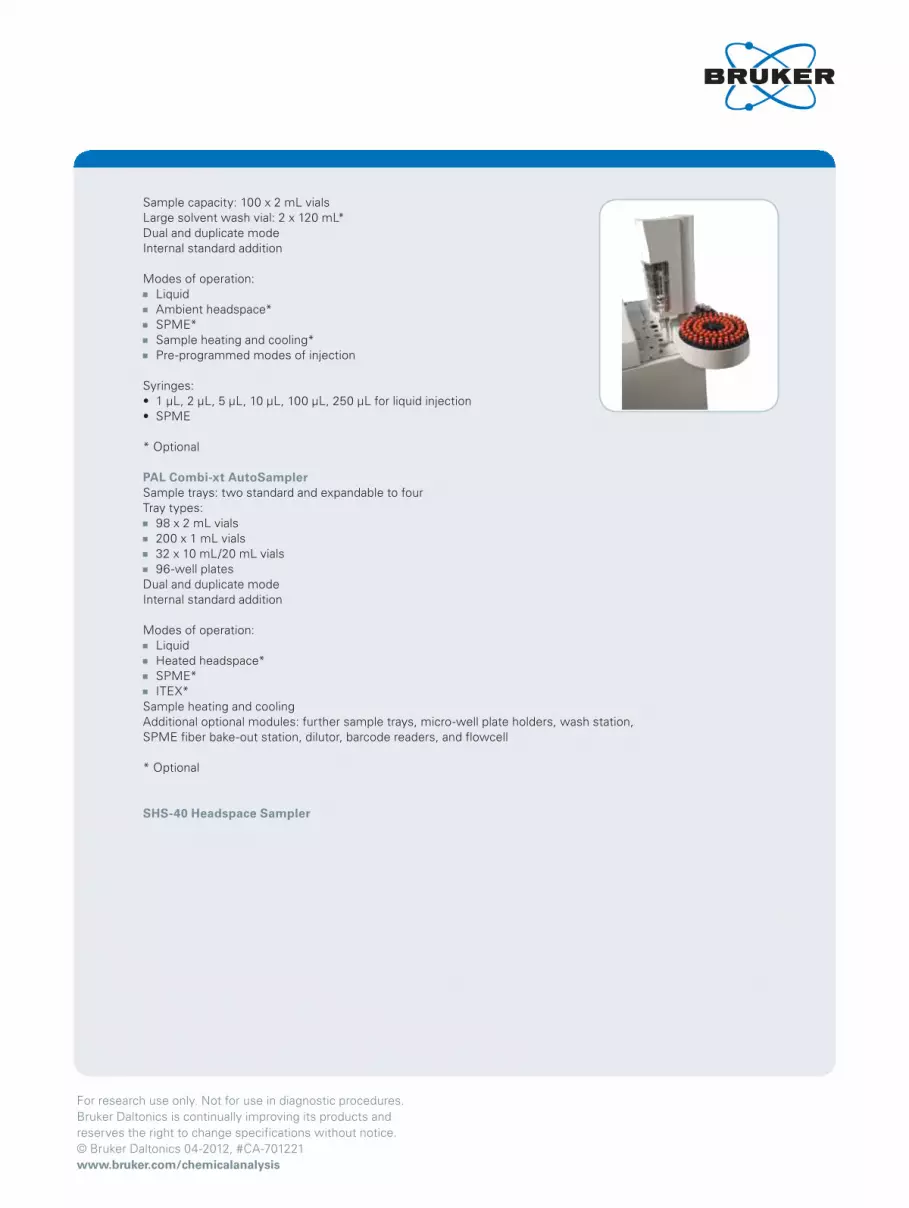
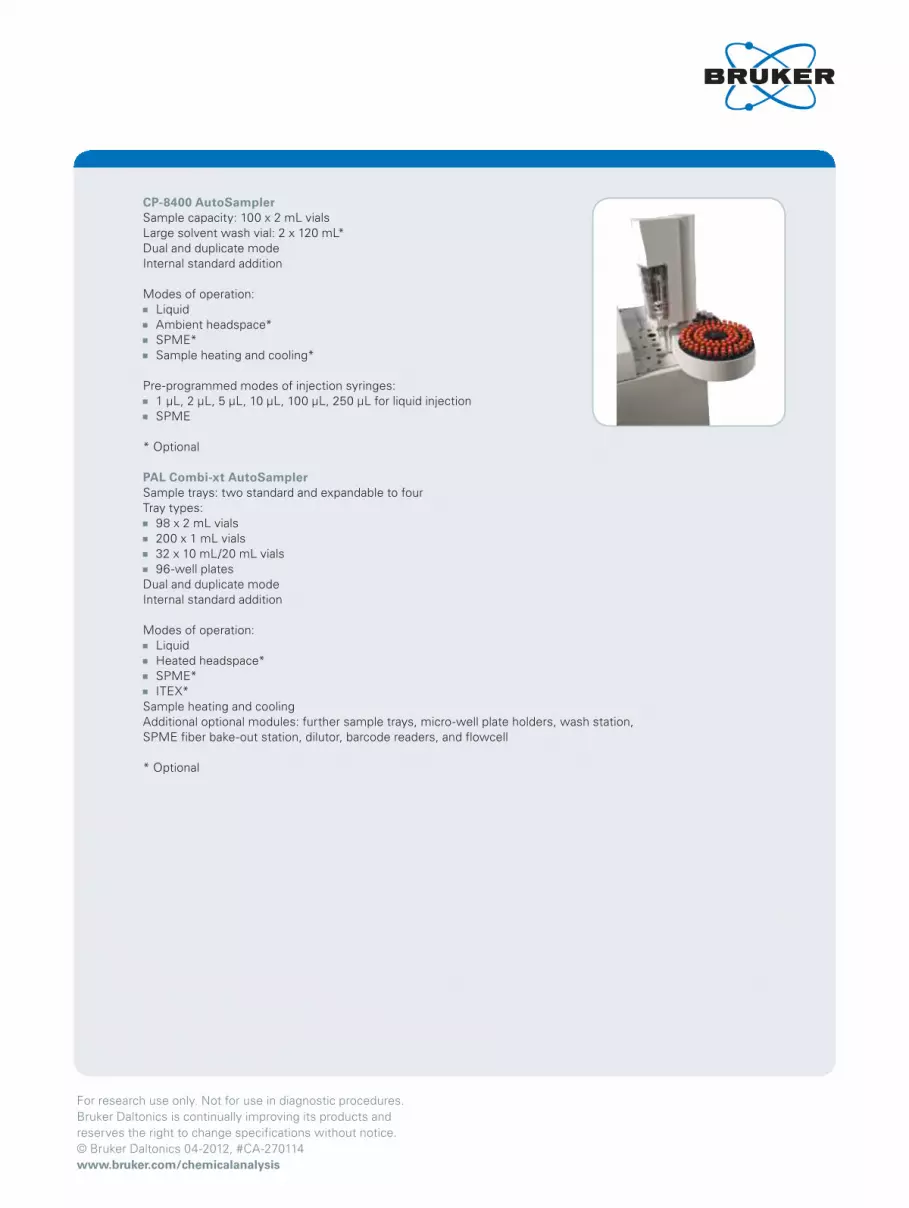
CP-8400 AutoSampler
For research use only. Not for use in diagnostic procedures.
Bruker Daltonics is continually improving its products and
reserves the right to change specifications without notice.
© Bruker Daltonics 04-2012, #CA-701221
www.bruker.com/chemicalanalysis
Sample capacity: 100 x 2 mL vials
Large solvent wash vial: 2 x 120 mL*
Dual and duplicate mode
Internal standard addition
Modes of operation:
Liquid
Ambient headspace*
SPME*
Sample heating and cooling*
Pre-programmed modes of injection
Syringes:
• 1μL,2μL,5μL,10μL,100μL,250μLforliquidinjection
• SPME
* Optional
PAL Combi-xt AutoSampler
Sample trays: two standard and expandable to four
Tray types:
98 x 2 mL vials
200 x 1 mL vials
32 x 10 mL/20 mL vials
96-well plates
Dual and duplicate mode
Internal standard addition
Modes of operation:
Liquid
Heated headspace*
SPME*
ITEX*
Sample heating and cooling
Additional optional modules: further sample trays, micro-well plate holders, wash station,
SPME fiber bake-out station, dilutor, barcode readers, and flowcell
* Optional
SHS-40 Headspace Sampler

For research use only. Not for use in diagnostic procedures.
Bruker Daltonics is continually improving its products and
reserves the right to change specifications without notice.
© Bruker Daltonics 04-2012, #CA-701221
www.bruker.com/chemicalanalysis
Sample Capacity: 40 x 20ml (10ml vials with adaptors).
Fully integrated
Sample path inert
Automated vial queuing system
Automated Gas Sampling Valve- Electric actuated 6-way injection valve (VICI) with 1 ml sample loop. This
entire module may be separately heated up to 350°C.
Heated incubation oven for 12 samples (40°C - 200°C, in 1°C-steps
Integrated Shaker
Automatic sample detection/recognition
Compatible with Crimp and Screw Top Vials
Carrier gas controlled direct from the GC
AUX gas pre-set internally.
Up to 9 different parameter sets can be stored.
Adaptable to different injectors
Multiple Headspace Extraction mode via single puncture
Flexible transfer line
Option: Sample Transfer Line Kit (direct connection to carrier gas, insertion of transfer line via injector no
longer required)
Control: Stand alone or remotely via Compass CDS software
Voltage: 110V or 230V
Dimensions: Width: 29cm (12in) Height: 46cm (18in) Depth: 62cm (25in)
Weight: 21kg (47lb)
System Features
Sample Capacity Up to 40 vials; 20mL
or 10 mL w/adaptor
Crimp or Screw Top Vials
Injection Modes Fixed Sample Volume
Press and Inject
Injection Valve 6 Way Electric Actuated
1 mL Sample Loop
Heat up to 350°C
Incubator Up to 12 Samples
40-200°C in 1°C increments
Integrated Shaker
Instrument Control Remote with Compass CDS
Stand alone
Sample Recognition
and Detection
Automated
Carrier Gas Control Direct from GC
Optional Accessories Additional Sampling Valve
Reactant Gas
Catalytic Converter
Press and Inject Configuration
ThSHS-40
Fixed Sample Volume Configuration
SHS-40

For research use only. Not for use in diagnostic procedures.
Bruker Daltonics is continually improving its products and
reserves the right to change specifications without notice.
© Bruker Daltonics 04-2012, #CA-270114
www.bruker.com/chemicalanalysis
Dimensions and Weights
Size*: Height: 57 cm (22.5 in.)
Width: 66 cm (26.0 in.)
Depth: 56 cm (22.0 in.)
Weight*: 43 kg (95 lb)
* Typical values
Environmental Conditions
Operating temperatures: 10 °C to 40 °C.
Operating humidity (relative): 5 % to 95 %
Line voltage requirements:, 120 V, 230 V (±10 % nominal)
Column Oven
Dimensions: 28 cm (w) x 20 cm (d) x 28 cm (h)
Temperature range:
Ambient +4 °C to 450 °C
Liquid N2: -100 °C to 450 °C
Liquid CO2: -60 °C to 450 °C
Temperature program ramps/holds: 24/25
Maximum temperature ramp rate: 150°C/min for all voltages
and 180 °C/min with oven insert accessory
Cool down rate: 400 °C to 50 °C in 4.5 minutes
Temperature set-point resolution: 0.1 °C
Ambient temperature reject <0.01°C change in oven for 1°C change in ambient temp
Retention time Repeatability <0.008% or < 0.0008 min, based on Pentadecane under temperature program
conditions
Area repeatability < 1% RSD
General Specifications
Up to 9 EFC modules total, injector, detector and auxiliary
Optional backflush
GC Control:
External events (digital output):
• 8 standard
• 8 optional, total 16
Max number of timed events: 16
Heated zones:
• Standard 5
• 4 optional, 9 total
Two power outlets 24V (1A max. each)
Methods:
Maximum stored internal methods: 50 (max. 30 alphanumeric characters)
Specification Sheet
SCION 456-GC
Temperature Range (°C) 456-GC Rates (°C/min)
50 -70 150
70 - 115 95
115 - 175 70
175 - 300 45
300 - 450 30

For research use only. Not for use in diagnostic procedures.
Bruker Daltonics is continually improving its products and
reserves the right to change specifications without notice.
© Bruker Daltonics 04-2012, #CA-270114
www.bruker.com/chemicalanalysis
Logging:
Run log file (stored with the chromatogram when using CompassCDS)
Error log file
Local Display:
TFT full color screen
WVGA resolution (800 x 480)
Size 23 cm (9")
Local Control:
Touch screen
Hard keys
Languages:
English, German, French, Spanish, Italian, Portuguese, Cyrillic, Kanji, Chinese (standard and traditional),
Thai, Korean and Dutch.
Local automation:
Method lines: 25
Modes:
• Infinite looping
• Dual and duplicate injection
Communication
Ethernet: Protocol: TCP/IP
Data rate: 100 Mbps
Control: GC control and method parameters
Analog output (optional):
Number of channels: 3
Time programmable steps: 30
Output software selectable (set individual):
• 0-1 V (default)
• 0-10 V
Synchronization signals with other devices and data systems:
Ready in and out
Start in and out
Data Handling and System Control:
CompassCDS Chromatography Data System
Certifications
CSA:
• C22.2 61010-1
• UL 61010-1
IEC: 61010-1
EMC:
• 47 CFR part 15
• ANSI C63.4
• EN 61326

For research use only. Not for use in diagnostic procedures.
Bruker Daltonics is continually improving its products and
reserves the right to change specifications without notice.
© Bruker Daltonics 04-2012, #CA-270114
www.bruker.com/chemicalanalysis
Injector Options
Maximum injectors: three, operating concurrently
Pneumatics: Electronic Flow Control (EFC), or manual
Injector types:
S/SL Split/Splitless injector*
PTV Programmable Temperature Vaporizing*
COC Cold On-Column injector*
Flash injector
PWOC Packed/Wide bore On-Column injector
*Including septum purge
S/SL Split/Splitless Injector
Pressure range: 0-150 psi
Total flow:
500 mL/min for N2/Ar
1500 mL/min for He/H2
Maximum temperature: 450 °C
Split range: 1-10,000 (column dependent)
Suited for columns:
Wide bore: (0.53 mm)
Narrow bore: (0.05 to 0.32 mm)
COC Cold On-Column Injector
Pressure range: 0-150 psi
Total Flow: 50 mL/min (Type 23 EFC)
Temperature range:
Ambient +10 °C to 450 °C using air cooling
-60 °C to 450 °C using liquid CO2 cooling
-160 °C to 450 °C using liquid N2 cooling
Maximum temperature: 450 °C
Maximum temperature ramp rate: 200 °C/min
Temperature ramps/holds: 24/25
Suited for columns:
Wide bore (0.53 mm)
Narrow bore (0.32 mm)
PTV Programmable Temperature
Vaporizing Injector
Pressure range: 0-150 psi
Total flow:
500 mL/min for N2/Ar
1500 ml/min for He/H2
Temperature range:
Ambient + 10 °C to 450 °C using air cooling
-160 °C to 450 °C using liquid N2 cooling
-60 °C to 450 °C using liquid CO2 cooling
Maximum temperature ramp rate: 200 °C/min
Temperature ramps/holds: 24/25
Split range: 1-10,000 (column dependent)
For research use only. Not for use in diagnostic procedures.
Bruker Daltonics is continually improving its products and
reserves the right to change specifications without notice.
© Bruker Daltonics 04-2012, #CA-270114
www.bruker.com/chemicalanalysis
Operational capabilities:
Large volume injection
Temperature ramped splitless
Cold on-column
Split and splitless
ChromatoProbe solid sample introduction optional
Suited for columns:
Wide bore (0.53 mm)
Narrow bore (0.05 to 0.32 mm)
Maximum injection volume: 250 μL (LVI mode)
Flash Injector
Pressure range: 0-150 psi
Total flow:
50 mL/min (Type 23 EFC)
Maximum temperature: 450 °C
Suited for columns:
Wide bore (0.53 mm)
Packed (1/8” to 1/4”)
PWOC Packed/Wide-bore On-Column Injector
Pressure range: 0-150 psi
Total flow:
50 mL/min (Type 23 EFC)
Maximum temperature: 450 °C
Suited for columns:
Wide bore (0.53 mm)
Packed (1/8” to 1/4”)
Electronic Flow Control: Injectors (EFC)
Module types: 4 injector-specific modules
Pressure: 0.1 % Full Scale
Resolution pressure set points is 0.001psi
Flow sensor accuracy 2% of measured or 0.2% of full scale
Flow sensor repeatability 0.5%
Sample Preconcentration Trap (SPT)
Trace level analysis of volatiles in gases
Fully integrated
Temperature range:
-60 °C to 450 °C using liquid CO2 cooling
-185 °C to 450 °C using liquid N2 cooling
Temperature rate:
Ballistic for instant release of adsorbed volatiles
Available traps:
Two lengths
A wide range of standard packings and custom packings
For research use only. Not for use in diagnostic procedures.
Bruker Daltonics is continually improving its products and
reserves the right to change specifications without notice.
© Bruker Daltonics 04-2012, #CA-270114
www.bruker.com/chemicalanalysis
Quick-Switch Valve Option
Instantly switch between injectors/columns and detectors
Configurations: automated or manual, factory or field installed
Detector Options
Maximum detectors: four: operating concurrently (one of
which is a Single or Triple Quad MS)
Pneumatics: Electronic Flow Control (DEFC) or manual
Detector types:
FID Flame Ionization Detector
TCD Thermal Conductivity Detector
ECD Electron Capture Detector
NPD (TSD) Nitrogen-Phosphorus Detector
PFPD Pulsed Flame Photometric Detector
PDHID Pulsed Discharge Helium Ionization Detector
MS Mass Spectrometry (see GC/MS brochure and datasheet)
Note: Data Acquisition Rate : 600Hz for all detectors, exception is the PFPD
FID Flame Ionization Detector
Maximum temperature: 450 °C
Detectivity: 2 pg C/sec
Linear dynamic range: 107
Flame tip type: ceramic (patented)
Operational quality:
Flame-out detection
Auto re-ignition
TCD Thermal Conductivity Detector
Maximum temperature: 450 °C
Detectivity: 300 pg/mL (Butane)
Linear dynamic range: 106
Operational quality:
Filament protection
Automatic bridge balancing
ECD Electron Capture Detector
Maximum temperature: 450 °C
Detectivity: 7 fg/sec Lindane
Linear dynamic range: 104
Radioactive source: 63Ni - 15 mCi (555 Mbq)
NPD (TSD) Nitrogen-Phosphorus Detector
Maximum temperature: 450 °C
Detectivity:
N: 100 fg N/sec (Azobenzene)
P: 100 fg P/sec (Malathion)
Linear dynamic range:
N: 105
P: 104
Operational quality: self-aligning bead
For research use only. Not for use in diagnostic procedures.
Bruker Daltonics is continually improving its products and
reserves the right to change specifications without notice.
© Bruker Daltonics 04-2012, #CA-270114
www.bruker.com/chemicalanalysis
PFPD Pulsed Flame Photometric Detector
Photomultiplier tube:
S/P
S/P/N
Maximum temperature: 450 °C
Detectivity:
S: 1 pg S/sec (S/P tube)
P: 100 fg P/sec (S/P tube)
N: 20 pg N/sec (S/P/N tube)
Linear dynamic range:
S: 103
P: 104
N: 102
Up to 23 elements can be detected
PDHID Pulsed Discharge Helium Ionization Detector
Detectivity: 50 ppb (Methane)
Linear dynamic range: 104 (Methane)
Operational quality:
Gold plated connections
Welded column connections
Detectors (DEFC)
Module types: 6 detector-specific modules
Accuracy: ± 7 % set point flow
Resolution: 0.1 or 1 mL/min
Automation Options
CP-8410 Auto Injector
Sample capacity:
10 x 2 mL vials
6 x 5 mL vials
5 x 10 mL vials
Large solvent wash vial: 2 x 120 mL*
Dual and duplicate mode
Internal standard addition
Modes of operation:
Liquid
Ambient headspace*
SPME (Solid Phase MicroExtraction)*
Sample heating and cooling*
Pre-programmed modes of injection Syringes:
1 μL, 2 μL, 5 μL, 10 μL, 100 μL, 250 μL for liquid injection
SPME
For research use only. Not for use in diagnostic procedures.
Bruker Daltonics is continually improving its products and
reserves the right to change specifications without notice.
© Bruker Daltonics 04-2012, #CA-270114
www.bruker.com/chemicalanalysis
CP-8400 AutoSampler
Sample capacity: 100 x 2 mL vials
Large solvent wash vial: 2 x 120 mL*
Dual and duplicate mode
Internal standard addition
Modes of operation:
Liquid
Ambient headspace*
SPME*
Sample heating and cooling*
Pre-programmed modes of injection syringes:
1 μL, 2 μL, 5 μL, 10 μL, 100 μL, 250 μL for liquid injection
SPME
* Optional
PAL Combi-xt AutoSampler
Sample trays: two standard and expandable to four
Tray types:
98 x 2 mL vials
200 x 1 mL vials
32 x 10 mL/20 mL vials
96-well plates
Dual and duplicate mode
Internal standard addition
Modes of operation:
Liquid
Heated headspace*
SPME*
ITEX*
Sample heating and cooling
Additional optional modules: further sample trays, micro-well plate holders, wash station,
SPME fiber bake-out station, dilutor, barcode readers, and flowcell
* Optional

For research use only. Not for use in diagnostic procedures.
Bruker Daltonics is continually improving its products and
reserves the right to change specifications without notice.
© Bruker Daltonics 04-2012, #CA-270114
www.bruker.com/chemicalanalysis
SHS-40 Headspace Sampler
Sample Capacity: 40 x 20ml (10ml vials with adaptors).
Fully integrated
Sample path inert
Automated vial queuing system
Automated Gas Sampling Valve- Electric actuated 6-way injection valve (VICI) with 1 ml sample loop. This
entire module may be separately heated up to 350°C.
Heated incubation oven for 12 samples (40°C - 200°C, in 1°C-steps
Integrated Shaker
Automatic sample detection/recognition
Compatible with Crimp and Screw Top Vials
Carrier gas controlled direct from the GC
AUX gas pre-set internally.
Up to 9 different parameter sets can be stored.
Adaptable to different injectors
Multiple Headspace Extraction mode via single puncture
Flexible transfer line
Option: Sample Transfer Line Kit (direct connection to carrier gas, insertion of transfer line via injector no
longer required)
Control: Stand alone or remotely via Compass CDS software
Voltage: 110V or 230V
Dimensions: Width: 29cm (12in) Height: 46cm (18in) Depth: 62cm (25in)
Weight: 21kg (47lb)
System Features
Sample Capacity Up to 40 vials; 20mL
or 10 mL w/adaptor
Crimp or Screw Top Vials
Injection Modes Fixed Sample Volume
Press and Inject
Injection Valve 6 Way Electric Actuated
1 mL Sample Loop
Heat up to 350°C
Incubator Up to 12 Samples
40-200°C in 1°C increments
Integrated Shaker
Instrument Control Remote with Compass CDS
Stand alone
Sample Recognition
and Detection
Automated
Carrier Gas Control Direct from GC
Optional Accessories Additional Sampling Valve
Reactant Gas
Catalytic Converter
Press and Inject Configuration
ThSHS-40
Fixed Sample Volume Configuration
SHS-40

Optimized GC Analysis Solutions
Innovation with IntegrityGas Chromatography
Refinery
Gas Analyzer
A range of refinery gas analysis
(RGA) solutions. Bruker offers RGA
solutions to meet the broadest
range of stream sample types and
throughput requirements.
A powerful, easy to use GC solution.
Bruker’s 456-GC and
CompassCDS chromatography
software is a very powerful
combination designed to achieve
the best possible results. In
addition, these systems do not
require a high degree of operator skills.
A highly flexible solution for analysis.
The Bruker RGA solutions can optional
be configured to analyze high
pressurized gas and liquefied petroleum
gas (LPG) through the use of a fully
integrated Micro-Gasifier, giving the
flexibility to accommodate a wide range
of stream types.
Operational procedures are fully
documented. Bruker RGA analyzers
not only incorporate proven GC
hardware and software but also arrive
pre-loaded with analysis methods, and
include documentation specific to the
application required.
A comprehensive, single vendor
solution. Bruker provides complete
solutions. The hardware, software,
application optimization,
documentation, installation and
performance verification are all
provided by Bruker, offering an all
inclusive, convenient analysis solution.
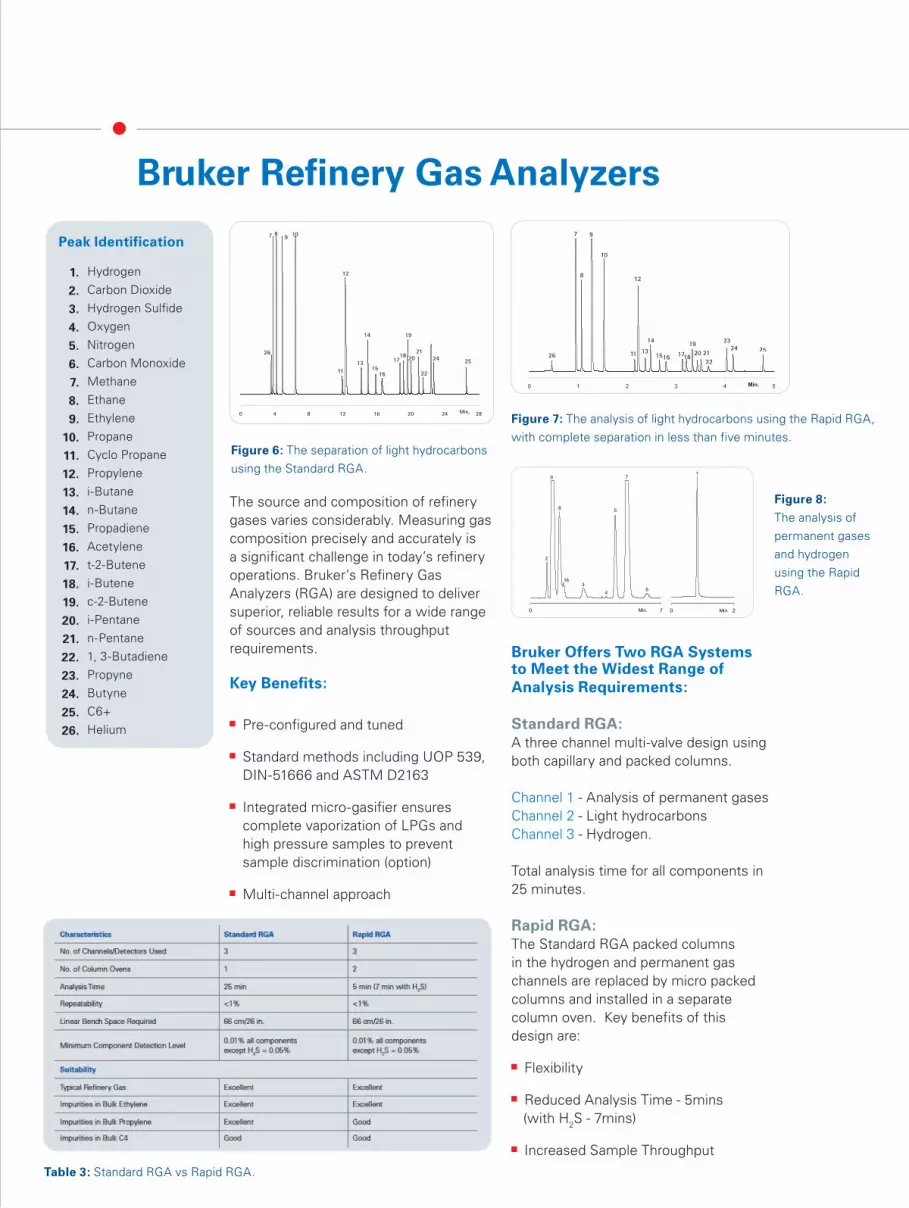
The source and composition of refinery gases varies considerably. Measuring gas
composition precisely and accurately is a significant challenge in today’s refinery
operations. Bruker’s refinery gas analyzers are designed to deliver superior, reliable
results for a wide range of sources and analysis throughput requirements.
Bruker Refinery Gas Analyzers
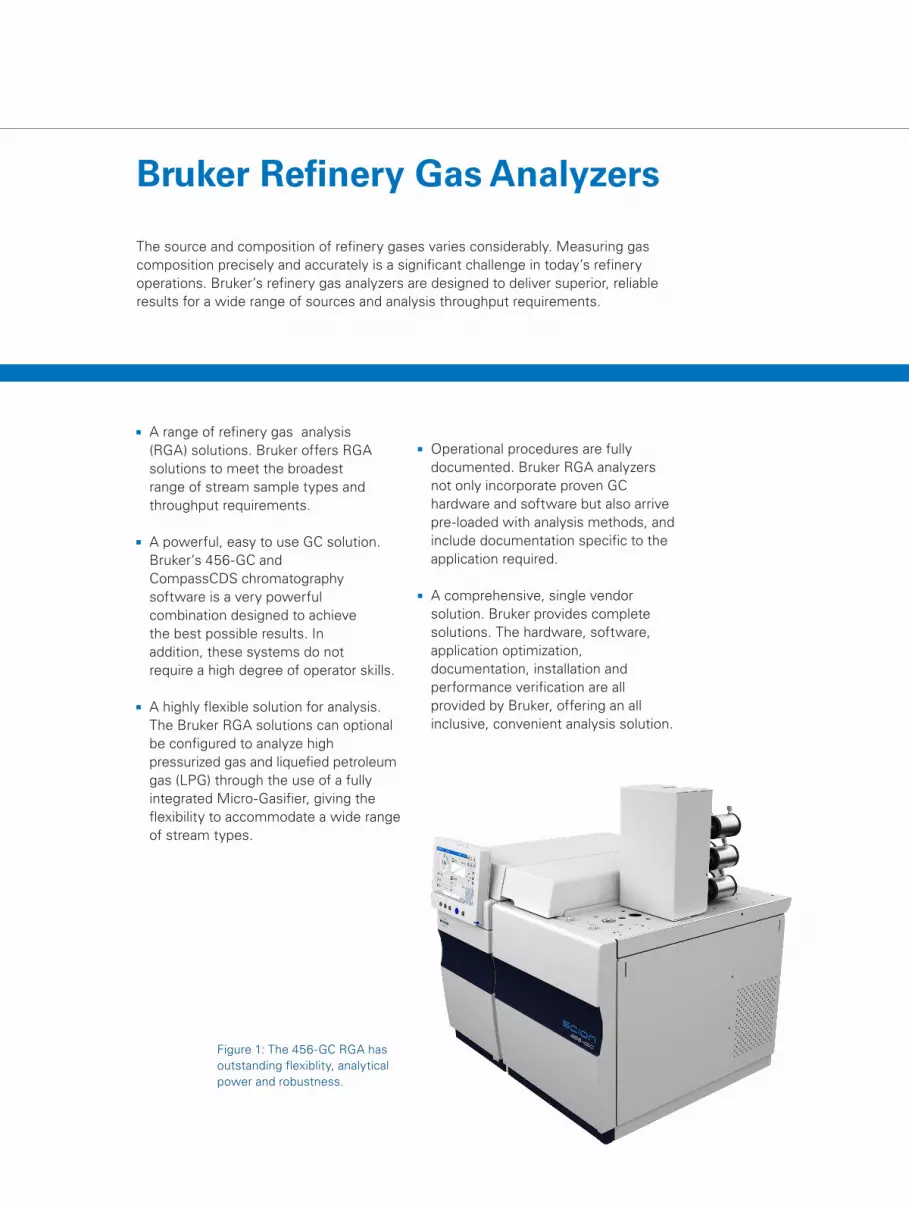
Figure 1: The 456-GC RGA has
outstanding flexiblity, analytical
power and robustness.
Key Benefits
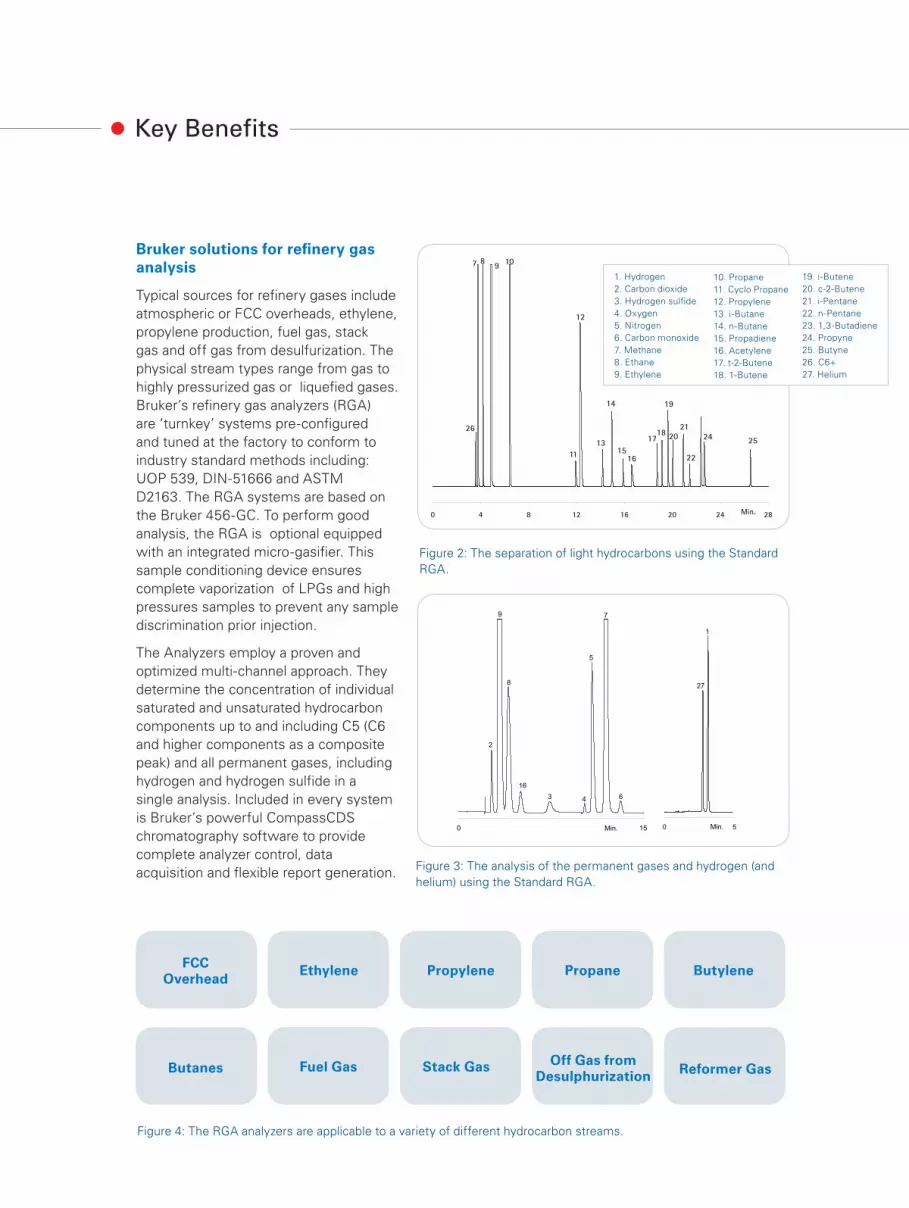
Bruker solutions for refinery gas analysis
Typical sources for refinery gases include
atmospheric or FCC overheads, ethylene,
propylene production, fuel gas, stack
gas and off gas from desulfurization. The
physical stream types range from gas to
highly pressurized gas or liquefied gases.
Bruker’s refinery gas analyzers (RGA)
are ‘turnkey’ systems pre-configured
and tuned at the factory to conform to
industry standard methods including:
UOP 539, DIN-51666 and ASTM
D2163. The RGA systems are based on
the Bruker 456-GC. To perform good
analysis, the RGA is optional equipped
with an integrated micro-gasifier. This
sample conditioning device ensures
complete vaporization of LPGs and high
pressures samples to prevent any sample
discrimination prior injection.
The Analyzers employ a proven and
optimized multi-channel approach. They
determine the concentration of individual
saturated and unsaturated hydrocarbon
components up to and including C5 (C6
and higher components as a composite
peak) and all permanent gases, including
hydrogen and hydrogen sulfide in a
single analysis. Included in every system
is Bruker’s powerful CompassCDS
chromatography software to provide
complete analyzer control, data
acquisition and flexible report generation.
0 4 8 12 16 20 24 28Min.
2425
22
21
20
19
1817
16
15
14
13
12
11
109
87
26
Figure 2: The separation of light hydrocarbons using the Standard
RGA.
Figure 3: The analysis of the permanent gases and hydrogen (and
helium) using the Standard RGA.
Figure 4: The RGA analyzers are applicable to a variety of different hydrocarbon streams.
FCCOverhead
Butanes
Ethylene
Fuel Gas
Propylene
Stack Gas
Propane
Off Gas fromDesulphurization
Butylene
Reformer Gas
1. Hydrogen
2. Carbon dioxide
3. Hydrogen sulfide
4. Oxygen
5. Nitrogen
6. Carbon monoxide
7. Methane
8. Ethane
9. Ethylene
10. Propane
11. Cyclo Propane
12. Propylene
13. i-Butane
14. n-Butane
15. Propadiene
16. Acetylene
17. t-2-Butene
18. 1-Butene
19. i-Butene
20. c-2-Butene
21. i-Pentane
22. n-Pentane
23. 1,3-Butadiene
24. Propyne
25. Butyne
26. C6+
27. Helium
510 0 5
2
9
8
16
3 4
5
7
6
27
1
Min. Min.
Bruker Refinery Gas Analyzers
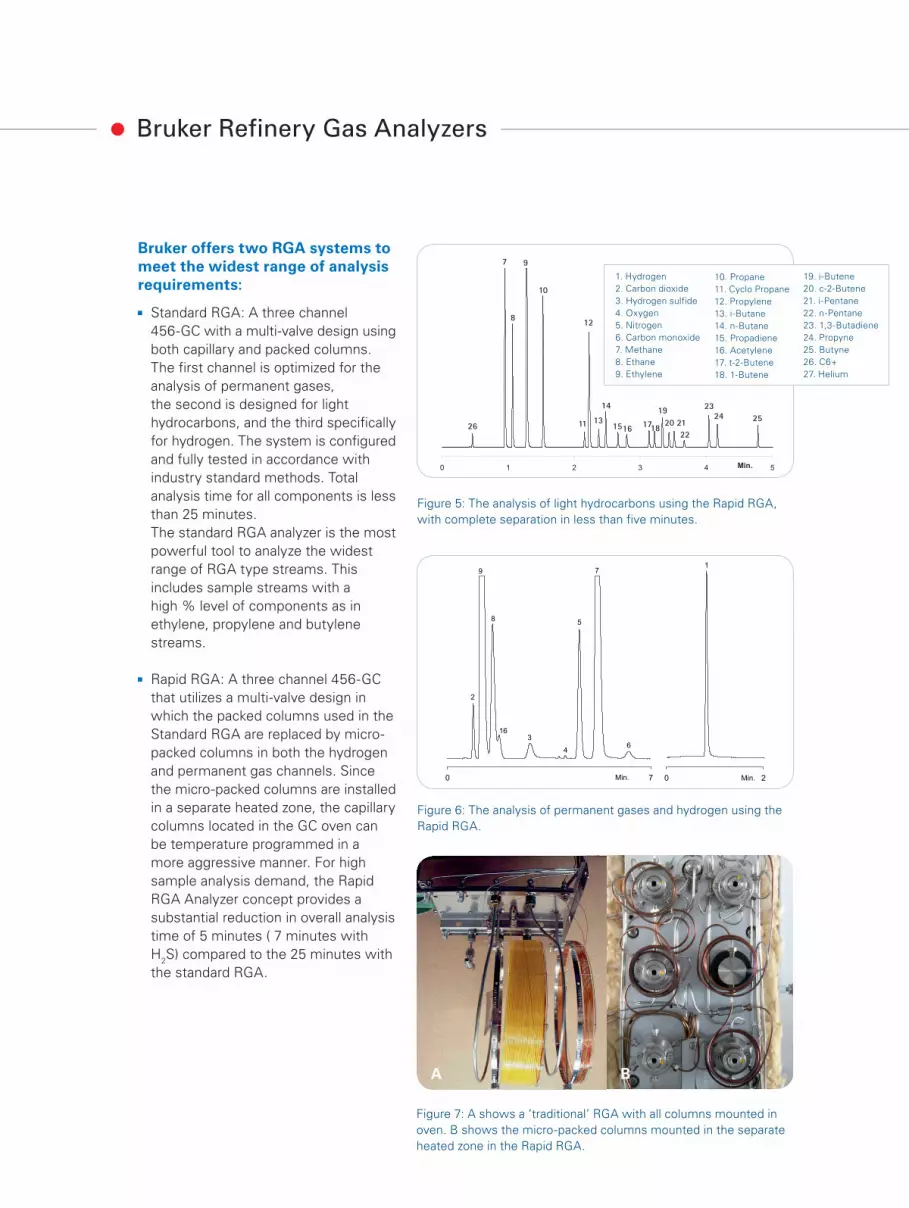
Bruker offers two RGA systems to meet the widest range of analysis requirements:
Standard RGA: A three channel
456-GC with a multi-valve design using
both capillary and packed columns.
The first channel is optimized for the
analysis of permanent gases,
the second is designed for light
hydrocarbons, and the third specifically
for hydrogen. The system is configured
and fully tested in accordance with
industry standard methods. Total
analysis time for all components is less
than 25 minutes.
The standard RGA analyzer is the most
powerful tool to analyze the widest
range of RGA type streams. This
includes sample streams with a
high % level of components as in
ethylene, propylene and butylene
streams.
Rapid RGA: A three channel 456-GC
that utilizes a multi-valve design in
which the packed columns used in the
Standard RGA are replaced by micro-
packed columns in both the hydrogen
and permanent gas channels. Since
the micro-packed columns are installed
in a separate heated zone, the capillary
columns located in the GC oven can
be temperature programmed in a
more aggressive manner. For high
sample analysis demand, the Rapid
RGA Analyzer concept provides a
substantial reduction in overall analysis
time of 5 minutes ( 7 minutes with
H2S) compared to the 25 minutes with
the standard RGA.
Figure 5: The analysis of light hydrocarbons using the Rapid RGA,
with complete separation in less than five minutes.
Figure 6: The analysis of permanent gases and hydrogen using the
Rapid RGA.
0 1 2 3 4 5Min.
21
22
23
24 2517
18
19
13
14
1516
10
11
12
7
8
9
2620 21
Figure 7: A shows a ‘traditional’ RGA with all columns mounted in
oven. B shows the micro-packed columns mounted in the separate
heated zone in the Rapid RGA.
A B
70 20Min. Min.
2
9
8
16
3
4
5
7
6
1
1. Hydrogen
2. Carbon dioxide
3. Hydrogen sulfide
4. Oxygen
5. Nitrogen
6. Carbon monoxide
7. Methane
8. Ethane
9. Ethylene
10. Propane
11. Cyclo Propane
12. Propylene
13. i-Butane
14. n-Butane
15. Propadiene
16. Acetylene
17. t-2-Butene
18. 1-Butene
19. i-Butene
20. c-2-Butene
21. i-Pentane
22. n-Pentane
23. 1,3-Butadiene
24. Propyne
25. Butyne
26. C6+
27. Helium
Bruker Refinery Gas Analyzers
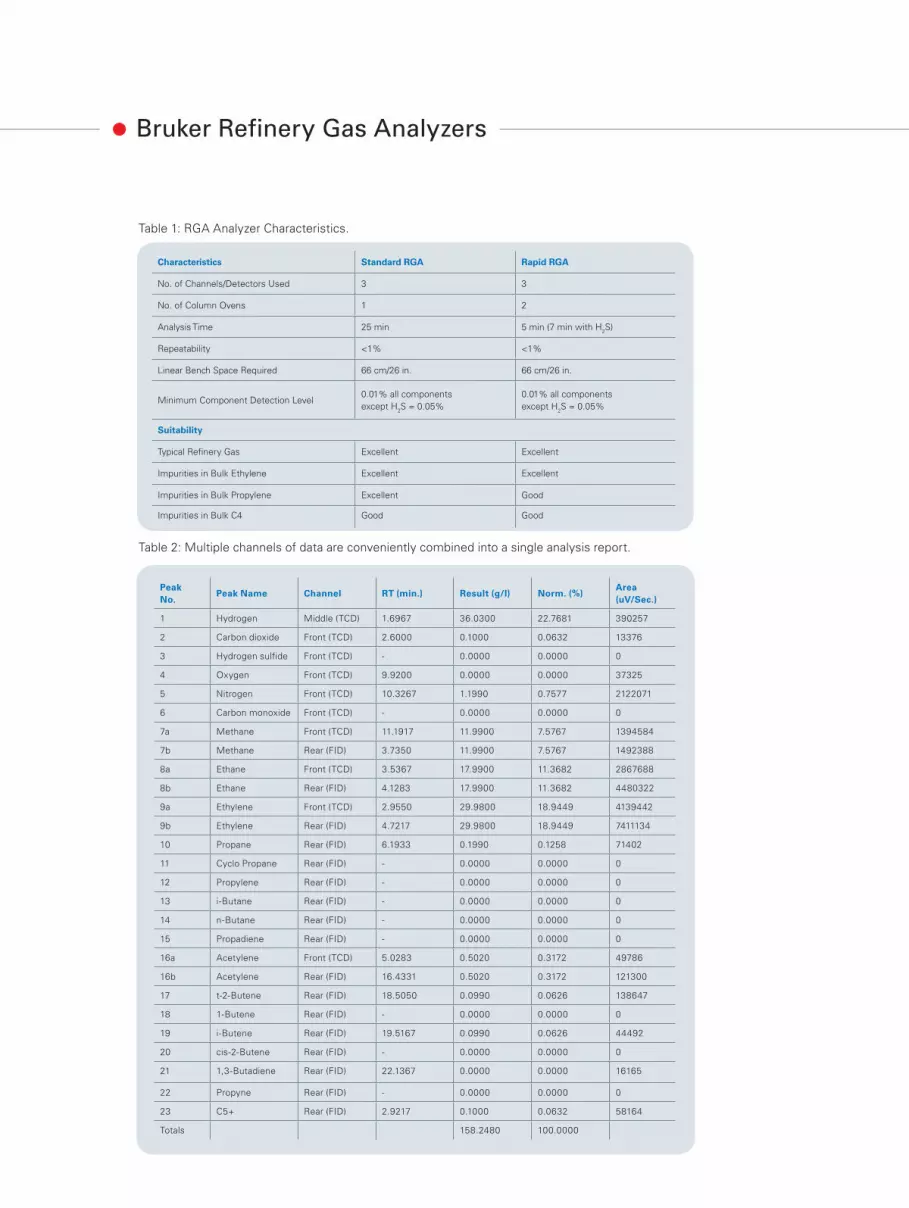
Peak
No.Peak Name Channel RT (min.) Result (g/l) Norm. (%)
Area
(uV/Sec.)
1 Hydrogen Middle (TCD) 1.6967 36.0300 22.7681 390257
2 Carbon dioxide Front (TCD) 2.6000 0.1000 0.0632 13376
3 Hydrogen sulfide Front (TCD) - 0.0000 0.0000 0
4 Oxygen Front (TCD) 9.9200 0.0000 0.0000 37325
5 Nitrogen Front (TCD) 10.3267 1.1990 0.7577 2122071
6 Carbon monoxide Front (TCD) - 0.0000 0.0000 0
7a Methane Front (TCD) 11.1917 11.9900 7.5767 1394584
7b Methane Rear (FID) 3.7350 11.9900 7.5767 1492388
8a Ethane Front (TCD) 3.5367 17.9900 11.3682 2867688
8b Ethane Rear (FID) 4.1283 17.9900 11.3682 4480322
9a Ethylene Front (TCD) 2.9550 29.9800 18.9449 4139442
9b Ethylene Rear (FID) 4.7217 29.9800 18.9449 7411134
10 Propane Rear (FID) 6.1933 0.1990 0.1258 71402
11 Cyclo Propane Rear (FID) - 0.0000 0.0000 0
12 Propylene Rear (FID) - 0.0000 0.0000 0
13 i-Butane Rear (FID) - 0.0000 0.0000 0
14 n-Butane Rear (FID) - 0.0000 0.0000 0
15 Propadiene Rear (FID) - 0.0000 0.0000 0
16a Acetylene Front (TCD) 5.0283 0.5020 0.3172 49786
16b Acetylene Rear (FID) 16.4331 0.5020 0.3172 121300
17 t-2-Butene Rear (FID) 18.5050 0.0990 0.0626 138647
18 1-Butene Rear (FID) - 0.0000 0.0000 0
19 i-Butene Rear (FID) 19.5167 0.0990 0.0626 44492
20 cis-2-Butene Rear (FID) - 0.0000 0.0000 0
21 1,3-Butadiene Rear (FID) 22.1367 0.0000 0.0000 16165
22 Propyne Rear (FID) - 0.0000 0.0000 0
23 C5+ Rear (FID) 2.9217 0.1000 0.0632 58164
Totals 158.2480 100.0000
Table 2: Multiple channels of data are conveniently combined into a single analysis report.
Characteristics Standard RGA Rapid RGA
No. of Channels/Detectors Used 3 3
No. of Column Ovens 1 2
Analysis Time 25 min 5 min (7 min with H2S)
Repeatability <1% <1%
Linear Bench Space Required 66 cm/26 in. 66 cm/26 in.
Minimum Component Detection Level0.01% all components
except H2S = 0.05%
0.01% all components
except H2S = 0.05%
Suitability
Typical Refinery Gas Excellent Excellent
Impurities in Bulk Ethylene Excellent Excellent
Impurities in Bulk Propylene Excellent Good
Impurities in Bulk C4 Good Good
Table 1: RGA Analyzer Characteristics.
Bru
ke
r D
alt
on
ics is c
on
tin
ually im
pro
vin
g its
pro
du
cts
an
d r
ese
rve
s t
he r
igh
t
to c
han
ge s
pe
cif
icati
on
s w
ith
ou
t n
oti
ce
. ©
BD
AL 0
5-2
010
, #
CA
-27
03
85
www.bruker.com/scion
Bruker-Certified Consumables for Your SCION GC Series
Bruker GC columns span a broad range of column diameters,
stationary phases, and capillary column materials: Fused Silica
(FS) and Inert Steel (IS). Ideal for either routine or research type
analyses.
Bruker GC column offerings bridge across many important
applications and include a number of offerings such as:
Standard WCOT (Wall Coated Open Tubular)
Solid Stationary Phase PLOT (Porous Layer Open Tubular)
Inert Steel Micro-Packed and Packed
For research use only. Not for use in diagnostic procedures.
Super Clean™ Gas Filters
Bruker Gas Purification Systems have the range to satisfy
your needs from individual to combination filters, from Ultra
purity combined with Ultra capacity, to all in one solution
kits. Innovative features designed into the product yield
extensive benefits to the user.
Ultra-high capacity for long life, less change and improved
productivity
High-purity output ensures 99.9999% Pure Gas
“Quick connect“ fittings for easy, leak-tight filter changes
Glass internals prevent diffusion; plastic externally for safety
Easy-to-read indicators for planned maintenance and
improved up-time
www.ScionHasArrived.com www.Bruker.com

Analyzer Solutions
Innovation with IntegritySolutions
Petrochemical Gas Chromatographs
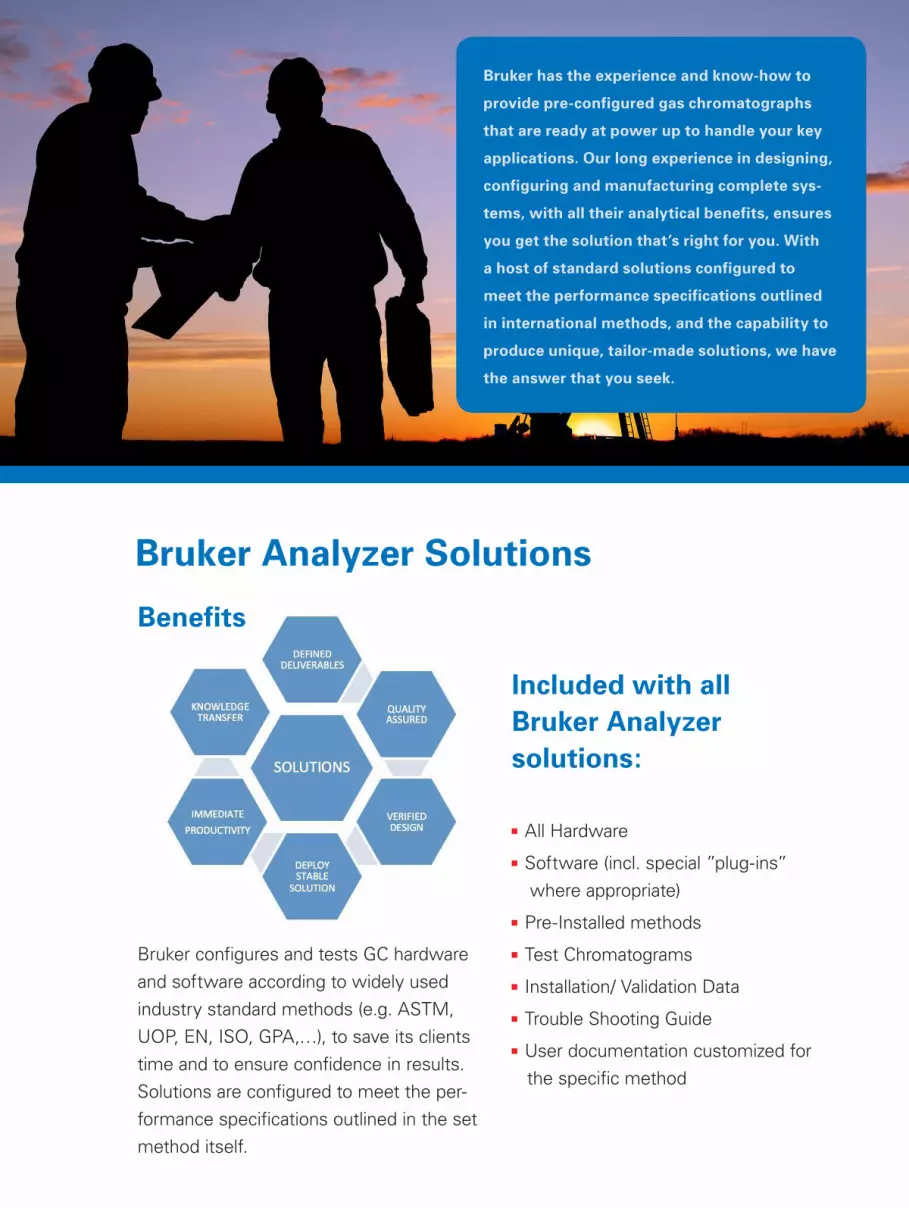
Bruker Analyzer Solutions
Benefits
Bruker configures and tests GC hardware
and software according to widely used
industry standard methods (e.g. ASTM,
UOP, EN, ISO, GPA,…), to save its clients
time and to ensure confidence in results.
Solutions are configured to meet the per-
formance specifications outlined in the set
method itself.
Bruker has the experience and know-how to
provide pre-configured gas chromatographs
that are ready at power up to handle your key
applications. Our long experience in designing,
configuring and manufacturing complete sys-
tems, with all their analytical benefits, ensures
you get the solution that’s right for you. With
a host of standard solutions configured to
meet the performance specifications outlined
in international methods, and the capability to
produce unique, tailor-made solutions, we have
the answer that you seek.
Included with all
Bruker Analyzer
solutions:
All Hardware
Software (incl. special ”plug-ins”
where appropriate)
Pre-Installed methods
Test Chromatograms
Installation/ Validation Data
Trouble Shooting Guide
User documentation customized for
the specific method
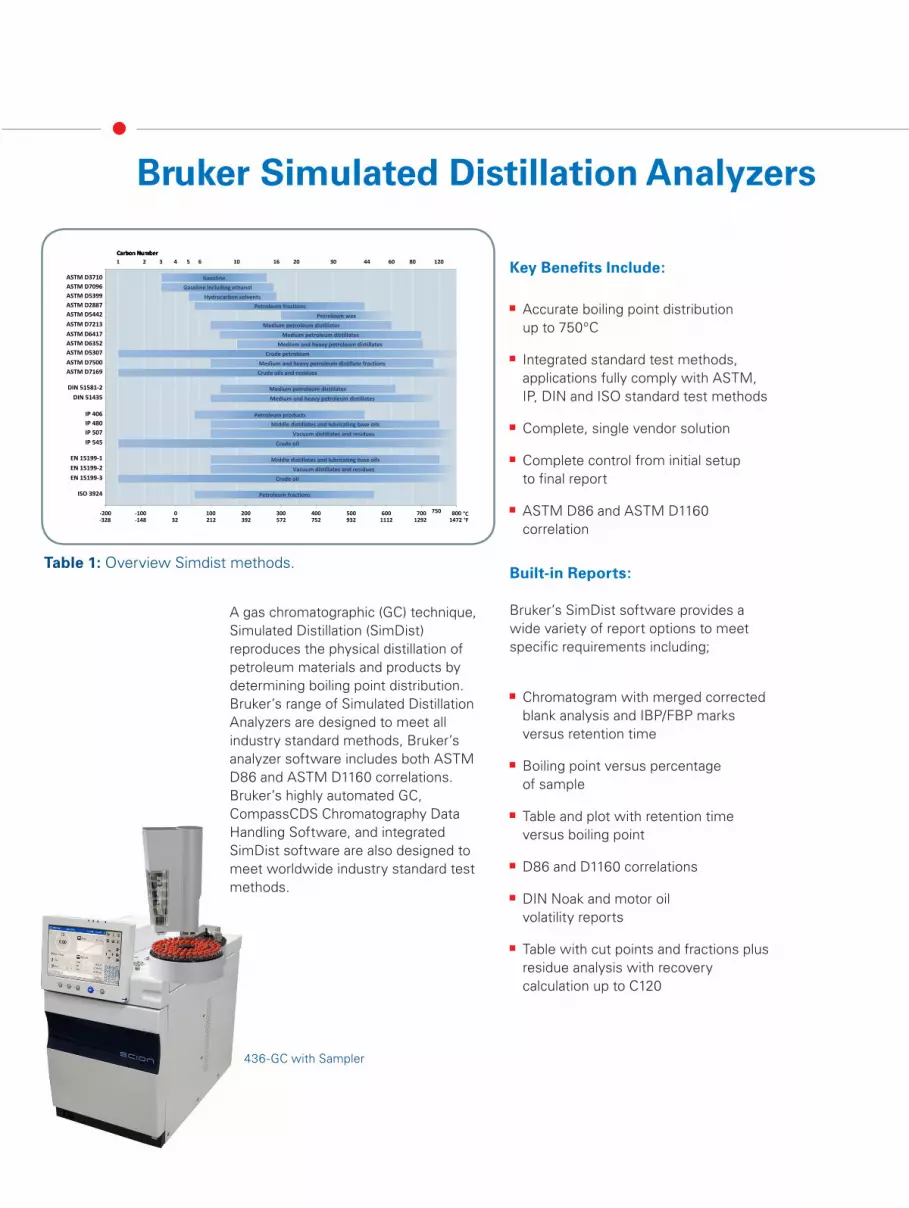
Bruker Simulated Distillation Analyzers
Key Benefits Include:
Accurate boiling point distribution
up to 750°C
Integrated standard test methods,
applications fully comply with ASTM,
IP, DIN and ISO standard test methods
Complete, single vendor solution
Complete control from initial setup
to final report
ASTM D86 and ASTM D1160
correlation
Built-in Reports:
Bruker’s SimDist software provides a
wide variety of report options to meet
specific requirements including;
Chromatogram with merged corrected
blank analysis and IBP/FBP marks
versus retention time
Boiling point versus percentage
of sample
Table and plot with retention time
versus boiling point
D86 and D1160 correlations
DIN Noak and motor oil
volatility reports
Table with cut points and fractions plus
residue analysis with recovery
calculation up to C120
1 2 3 4 5 6 10 16 20 30 44 60 80
750
120
0
ヲン000000
‐200 ‐100 0 100 200 300 400 500 600 700 800
‐328 ‐148 32 212 392 572 752 932 1112 1292 1472 °F
Carbon NumberCarbon Number
°C
Carbon NumberCarbon Number
Medium and heavy petroleum distillate fractions
Petroleum waxPetroleum fractions
Medium petroleum distillates
Medium petroleum distillates
Middle distillates and lubricating base oilsVacuum distillates and residues
Crude oil
Middle distillates and lubricating base oils
Gasoline
Gasoline including ethanolHydrocarbon solvents
Medium and heavy petroleum distillatesCrude petroleum
Medium and heavy petroleum distillates
Vacuum distillates and residuesCrude oil
Petroleum fractions
Petroleum products
Medium petroleum distillates
Crude oils and residues
ASTM D3710ASTM D7096ASTM D5399ASTM D2887ASTM D5442ASTM D7213ASTM D6417ASTM D6352ASTM D5307ASTM D7500ASTM D7169
DIN 51581‐2DIN 51435
IP 406IP 480IP 507IP 545
EN 15199‐1EN 15199‐2EN 15199‐3
ISO 3924
Table 1: Overview Simdist methods.
A gas chromatographic (GC) technique,
Simulated Distillation (SimDist)
reproduces the physical distillation of
petroleum materials and products by
determining boiling point distribution.
Bruker’s range of Simulated Distillation
Analyzers are designed to meet all
industry standard methods, Bruker’s
analyzer software includes both ASTM
D86 and ASTM D1160 correlations.
Bruker’s highly automated GC,
CompassCDS Chromatography Data
Handling Software, and integrated
SimDist software are also designed to
meet worldwide industry standard test
methods.
436-GC with Sampler
Characterization of Engine Fuels by
Hydrocarbon Group Type
Bruker’s PIONA+™ Analyzer is a highly
flexible GC analysis platform to obtain
comprehensive characterization and
quantitative information, including
hydrocarbon group types, oxygenates
and carbon number distribution for spark
ignition engine fuels.
Key Analyzer Capabilities:
Unparalleled operational flexibility
Compliant with established standards
A complete and fully integrated
solution
A powerful analyzer, easy to use,
generating outstanding analysis results
day after day
The PIONA+ Analyzer performs a
complete analysis (as described in
ASTM D6839 and similar methods)
and provides unprecedented analytical
flexibility and simplified operation
through the use of a novel approach
to column/trap heating and exchange
(Figure 1).
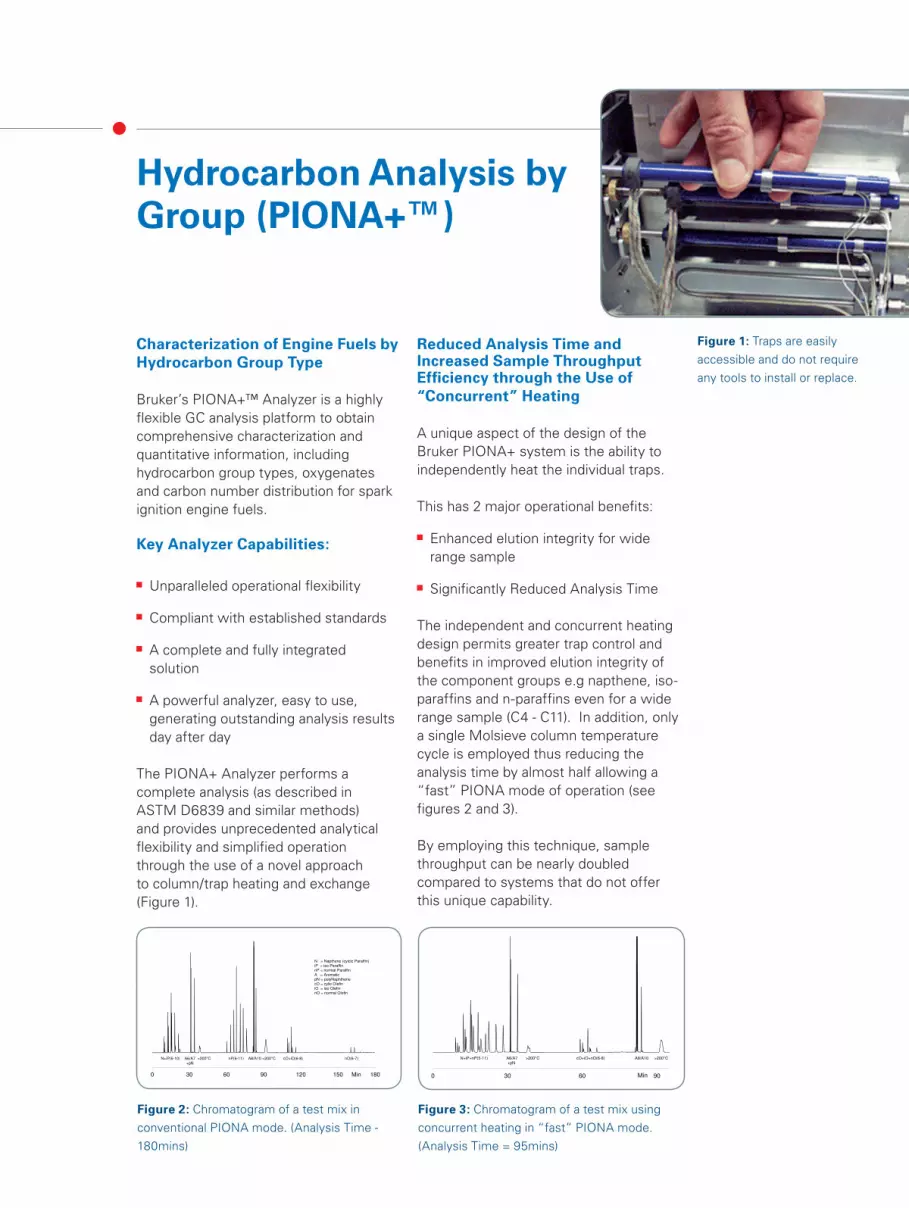
0 30 60 90 120 150 180Min
N+iP(6-10) A6/A7 >200C nP(6-11) A8/A10 >200C cO+iO(6-8) nO(6-7)+pN
N = Napthene (cylcic Paraffin)iP = iso ParaffinnP = normal ParaffinA = AromaticpN = polyNaphthenecO = cylic OlefiniO = iso OlefinnO = normal Olefin
0 30 60 90Min
N+iP+nP(5-11) A6/A7 >200C cO+iO+nO(6-8) A8/A10 >200C +pN
Figure 1: Traps are easily
accessible and do not require
any tools to install or replace.
Figure 2: Chromatogram of a test mix in
conventional PIONA mode. (Analysis Time -
180mins)
Figure 3: Chromatogram of a test mix using
concurrent heating in “fast” PIONA mode.
(Analysis Time = 95mins)
Hydrocarbon Analysis by Group (PIONA+™)
Reduced Analysis Time and Increased Sample Throughput Efficiency through the Use of
“Concurrent” Heating
A unique aspect of the design of the
Bruker PIONA+ system is the ability to
independently heat the individual traps.
This has 2 major operational benefits:
Enhanced elution integrity for wide
range sample
Significantly Reduced Analysis Time
The independent and concurrent heating
design permits greater trap control and
benefits in improved elution integrity of
the component groups e.g napthene, iso-
paraffins and n-paraffins even for a wide
range sample (C4 - C11). In addition, only
a single Molsieve column temperature
cycle is employed thus reducing the
analysis time by almost half allowing a
“fast” PIONA mode of operation (see
figures 2 and 3).
By employing this technique, sample
throughput can be nearly doubled
compared to systems that do not offer
this unique capability.
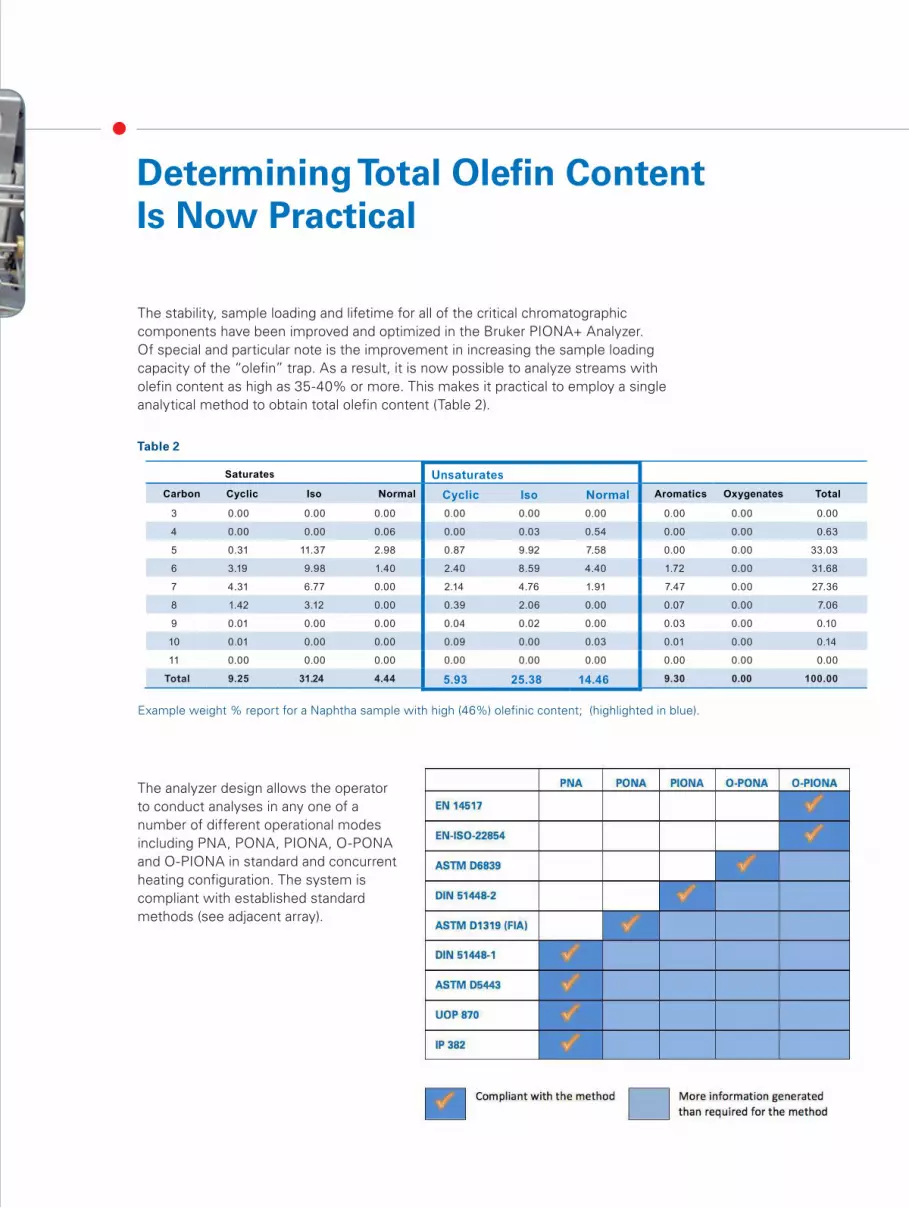
Determining Total Olefin Content Is Now Practical
The stability, sample loading and lifetime for all of the critical chromatographic
components have been improved and optimized in the Bruker PIONA+ Analyzer.
Of special and particular note is the improvement in increasing the sample loading
capacity of the “olefin” trap. As a result, it is now possible to analyze streams with
olefin content as high as 35-40% or more. This makes it practical to employ a single
analytical method to obtain total olefin content (Table 2).
The analyzer design allows the operator
to conduct analyses in any one of a
number of different operational modes
including PNA, PONA, PIONA, O-PONA
and O-PIONA in standard and concurrent
heating configuration. The system is
compliant with established standard
methods (see adjacent array).
Example weight % report for a Naphtha sample with high (46%) olefinic content; (highlighted in blue).
Table 2
Saturates Unsaturates Carbon Cyclic Iso Normal Cyclic Iso Normal Aromatics Oxygenates Total
3 0.00 0.00 0.00 0.00 0.00 0.00 0.00 0.00 0.00
4 0.00 0.00 0.06 0.00 0.03 0.54 0.00 0.00 0.63
5 0.31 11.37 2.98 0.87 9.92 7.58 0.00 0.00 33.03
6 3.19 9.98 1.40 2.40 8.59 4.40 1.72 0.00 31.68
7 4.31 6.77 0.00 2.14 4.76 1.91 7.47 0.00 27.36
8 1.42 3.12 0.00 0.39 2.06 0.00 0.07 0.00 7.06
9 0.01 0.00 0.00 0.04 0.02 0.00 0.03 0.00 0.10
10 0.01 0.00 0.00 0.09 0.00 0.03 0.01 0.00 0.14
11 0.00 0.00 0.00 0.00 0.00 0.00 0.00 0.00 0.00
Total 9.25 31.24 4.44 5.93 25.38 14.46 9.30 0.00 100.00
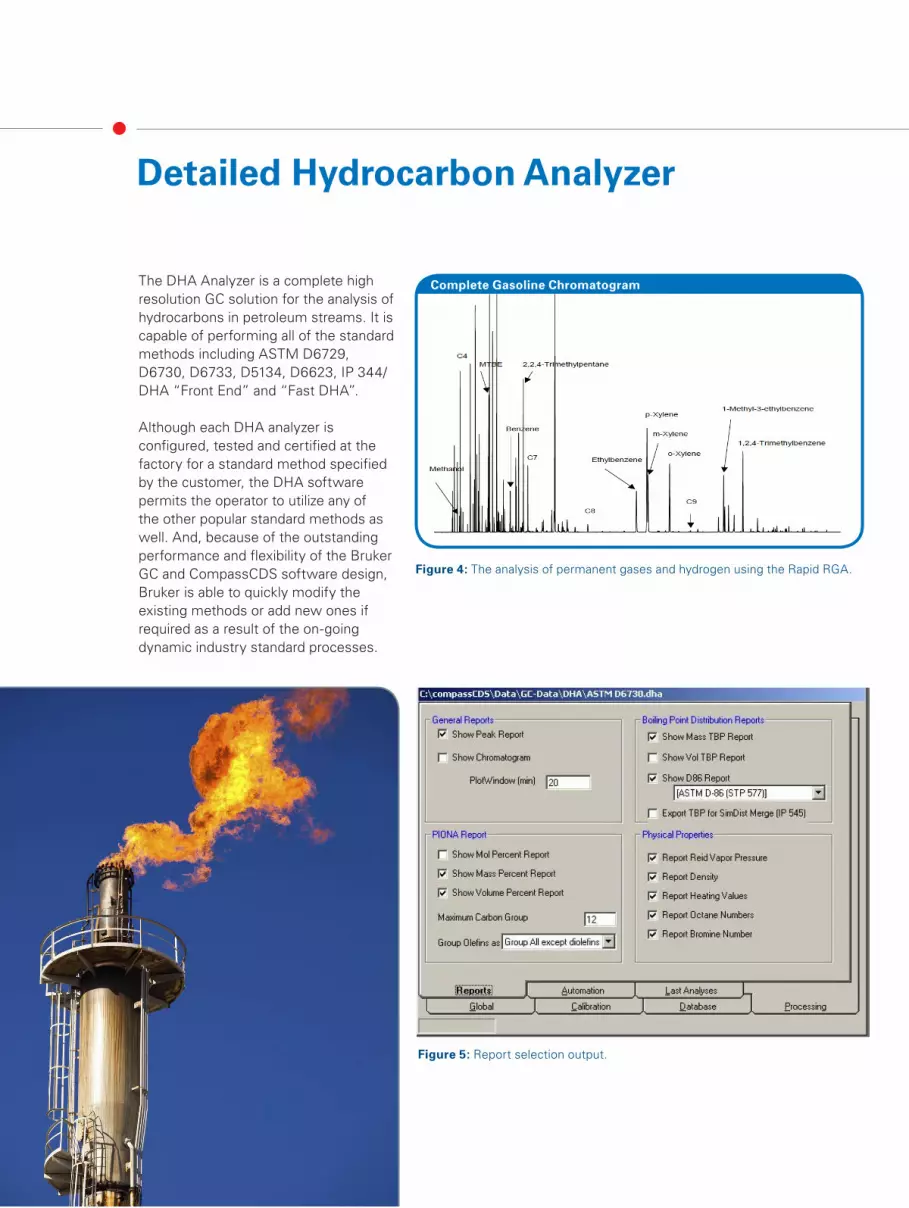
Detailed Hydrocarbon Analyzer
The DHA Analyzer is a complete high
resolution GC solution for the analysis of
hydrocarbons in petroleum streams. It is
capable of performing all of the standard
methods including ASTM D6729,
D6730, D6733, D5134, D6623, IP 344/
DHA “Front End” and “Fast DHA”.
Although each DHA analyzer is
configured, tested and certified at the
factory for a standard method specified
by the customer, the DHA software
permits the operator to utilize any of
the other popular standard methods as
well. And, because of the outstanding
performance and flexibility of the Bruker
GC and CompassCDS software design,
Bruker is able to quickly modify the
existing methods or add new ones if
required as a result of the on-going
dynamic industry standard processes.
Figure 5: Report selection output.
Figure 4: The analysis of permanent gases and hydrogen using the Rapid RGA.
Complete Gasoline Chromatogram
Bruker Refinery Gas Analyzers
Figure 8:
The analysis of
permanent gases
and hydrogen
using the Rapid
RGA.
The source and composition of refinery
gases varies considerably. Measuring gas
composition precisely and accurately is
a significant challenge in today’s refinery
operations. Bruker’s Refinery Gas
Analyzers (RGA) are designed to deliver
superior, reliable results for a wide range
of sources and analysis throughput
requirements.
Key Benefits:
Pre-configured and tuned
Standard methods including UOP 539,
DIN-51666 and ASTM D2163
Integrated micro-gasifier ensures
complete vaporization of LPGs and
high pressure samples to prevent
sample discrimination (option)
Multi-channel approach
Bruker Offers Two RGA Systems to Meet the Widest Range of
Analysis Requirements:
Standard RGA:
A three channel multi-valve design using
both capillary and packed columns.
Channel 1 - Analysis of permanent gases
Channel 2 - Light hydrocarbons
Channel 3 - Hydrogen.
Total analysis time for all components in
25 minutes.
Rapid RGA:
The Standard RGA packed columns
in the hydrogen and permanent gas
channels are replaced by micro packed
columns and installed in a separate
column oven. Key benefits of this
design are:
Flexibility
Reduced Analysis Time - 5mins
(with H2S - 7mins)
Increased Sample Throughput
Figure 6: The separation of light hydrocarbons
using the Standard RGA.
Table 3: Standard RGA vs Rapid RGA.
Figure 7: The analysis of light hydrocarbons using the Rapid RGA,
with complete separation in less than five minutes.
0 4 8 12 16 20 24 28Min.
2425
22
21
20
19
1817
16
15
14
13
12
11
109
87
26
0 1 2 3 4 5Min.
21
22
23
24 2517
18
19
13
14
1516
10
11
12
7
8
9
2620 21
70 20Min. Min.
2
9
8
163
4
5
7
6
1
Hydrogen
Carbon Dioxide
Hydrogen Sulfide
Oxygen
Nitrogen
Carbon Monoxide
Methane
Ethane
Ethylene
Propane
Cyclo Propane
Propylene
i-Butane
n-Butane
Propadiene
Acetylene
t-2-Butene
i-Butene
c-2-Butene
i-Pentane
n-Pentane
1, 3-Butadiene
Propyne
Butyne
C6+
Helium
Peak Identification
1.
2.
3.
4.
5.
6.
7.
8.
9.
10.
11.
12.
13.
14.
15.
16.
17.
18.
19.
20.
21.
22.
23.
24.
25.
26.

The determination of sub to high ppm
levels of ethers, alcohols, aldehydes
and ketones in different hydrocarbon
matrices is a recurring challenge in the
petroleum refining and petrochemical
industry. The Bruker Low Level
Oxygenates Analyzer is an easy to use
solution to meet this challenge and is
according ASTM D7423.
The Low Level Oxygenates Analyzer
is designed and optimized to quantify
ppm and sub ppm levels of ethers (e.g.
DME, MTBE, ETBE, DIPE), alcohols (e.g.
methanol, ethanol, propanol), ketones
(e.g. acetone, MEK) and aldehydes in
various hydrocarbon matrices. In general,
all oxygenated components with a boiling
point of up to 100°C can be analyzed and
the sample can be a gas, LPG or liquid
under ambient conditions with a final
boiling point up to 250°C.
Low Level Oxygenates Analyzer
Figure 9: Typical chromatogram showing a wide range analysis of a liquid sample stream.
The system is comprised of a Bruker GC
configured with gas and liquid sampling
valves, two high performance capillary
analysis columns, digitally controlled
pneumatics including a ‘fluidic’ switch
and Flame Ionization Detector (FID).
An optional ‘pressure station’ can be
added to eliminate the possibility of
losing sample due to evaporation when
analyzing LPG. The GC is controlled via
the CompassCDS Chromatography Data
Handling Software, which acquires data,
processes it and generates analyses
reports.
1.
2.
3.
4.
5.
6.
7.
8.
9.
10.
11.
12.
13.
14.
15.
16.
17.
18.
19.
Diethylether
Acetaldehyde
Ethyl tert. Butyl ether
Methyl tert. Butyl ether
Diisopropylether
Propanal
tert amyl methyl ether
Propylether
Isobutyraldehyde
Butyraldehyde
Methanol
Acetone
Isovaleraldehyde
Valeraldehyde
2-Butanone
Ethanol
1-Propanol
tert Butyl alcohol
& Isobutanol
1-Butanol
Peak Identification
-5000
0
5000
10000
15000
20000
25000
30000
35000
40000
45000
50000
55000
60000
65000
70000
75000
0 3 6 9 12 15 18 21 24 27
1
5
2
34
6
8
7
109
12
1314
15
11
16
17
18
19
Min
Bruker 4815 GC Oxygenates Analyzer
The Bruker 4815 GC Analyzer provides
a highly cost effective solution for the
analysis of oxygenates in gasoline,
according to the widely used industry
standard method ASTM D4815. The
combination of Bruker’s reliable GC
hardware, powerful software and
industry leading pre- and post-sales
support teams make this analyzer
package the most comprehensive
solution available today.
Oxygenated compounds can be present
in various hydrocarbon matrices either
because they were purposely added (e.g.
into gasoline), because they are naturally
present, or formed during catalytic
processes such as polymer production.
In gasoline, oxygenated compounds are
added as ‘anti-knock’ agents to increase
the octane number and decrease
emissions by replacing organo-lead
compounds.
The type and concentration of
oxygenated compounds must be
measured in reformulated gasolines
as part of ongoing product quality
assessment, and to confirm the
oxygenated components have been
added in the correct amounts according
to regulatory requirements (e.g. California
Air Resources Board).
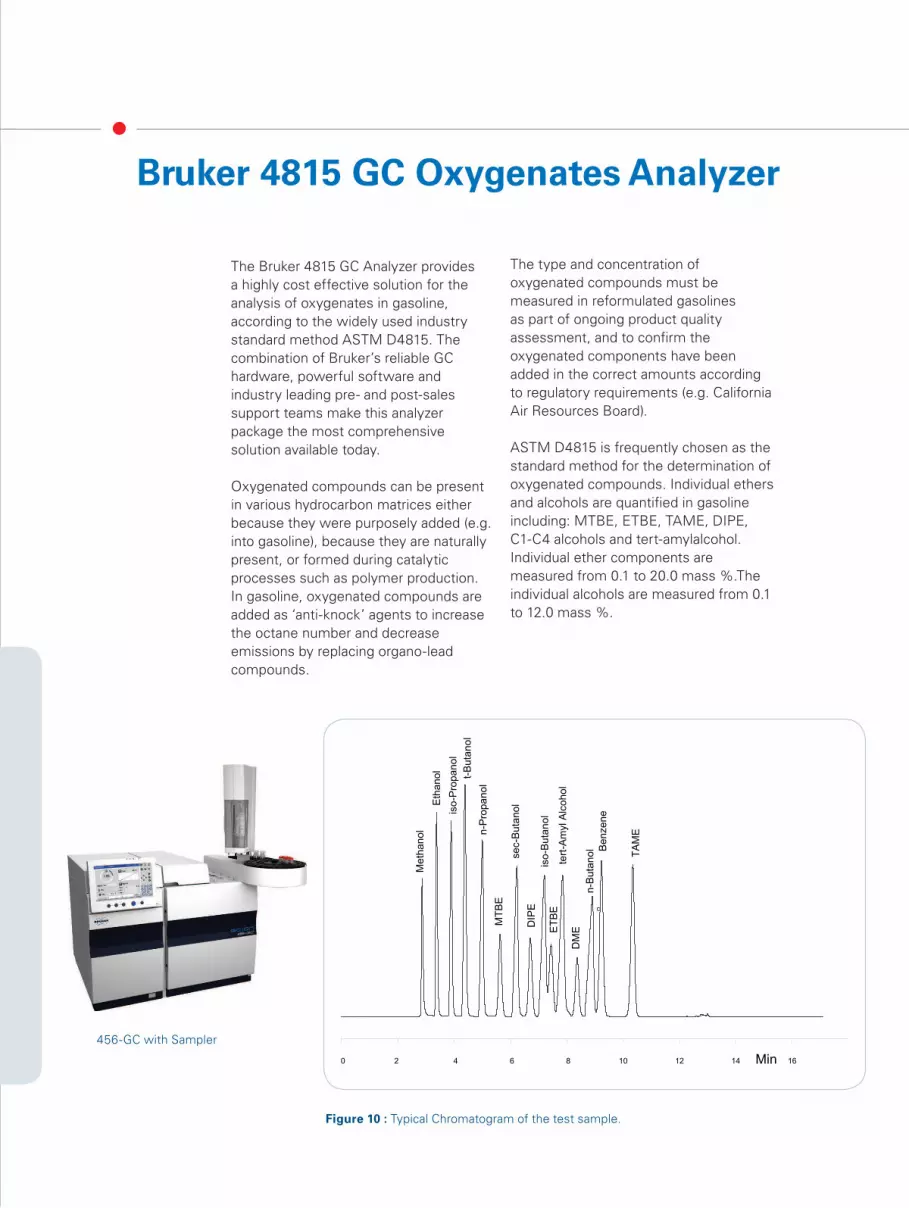
ASTM D4815 is frequently chosen as the
standard method for the determination of
oxygenated compounds. Individual ethers
and alcohols are quantified in gasoline
including: MTBE, ETBE, TAME, DIPE,
C1-C4 alcohols and tert-amylalcohol.
Individual ether components are
measured from 0.1 to 20.0 mass %.The
individual alcohols are measured from 0.1
to 12.0 mass %.
Figure 10 : Typical Chromatogram of the test sample.
0 2 4 6 8 10 12 14 16
Me
tha
no
l
Eth
an
ol
iso
-Pro
pa
no
l
t-B
uta
no
l
n-P
rop
an
ol
MT
BE
se
c-B
uta
no
l
DIP
E
iso
-Bu
tan
ol
ET
BE
tert
-Am
ylA
lco
ho
l
DM
E
n-B
uta
no
l Be
nze
ne
TA
ME
Min
c
456-GC with Sampler

Trace Impurity Analyzers
Figure 11: Sulfur components in propane, BR-1 column.
Figure 12: Sulfur components in propane, BR-Q PLOT.
Figure 13: LPG sample.
Sulfur Components in LPGs
Low level analysis of sulfur containing
components such as H2S, COS and
mercaptanes is extremely challenging
and a configured GC offers the solution.
Firstly, the system employs a micro-
gasifier enabling the direct coupling
of an LPG stream. Secondly, an inert
steel sample path ensures a trouble free
analysis of sulfur containing components
at low concentrations. Finally, a two
channel PFPD/ two column approach
permits the analysis of all components
of interest in one run whatever the LPG
matrix. Two differing columns ensures
quenching of PFPD signal by the matrix
is overcome and full sulfur component
analysis is achieved. Figures 11 and
12 show chromatograms obtained in a
propane matrix and illustrates the novel
benefits of the 2 channel approach.
Permanent Gases in LPGs
Impurities such as CO, CO2, H
2, O
2 and
N2 need to be determined at low levels
in LPGs. Complete separation of these
components is done using a two channel
single detector (PDHID) system. The
GC employs a permanent gas channel
for analyzing H2, O
2, N
2, CH
4 and CO
and a specific second channel for the
analysis of CO2. A gasifier is used as a
sample introduction device thus giving
the capability of handling LPG samples
C2 through C4.
Detection limits are at the ppb level
(Figure 13), depending on the component
of interest.

Figure 17: Light hydrocarbons on GC-2. Figure 18: Oxygenates on GC-2. Figure 19: Sulfur components on GC-2.
Figure 14: CO, CH4 and CO
2 on GC-1. Figure 15: H
2 on GC-1. Figure 16: O
2 and N
2 on GC-1.
Total Characterization of Ethylene ImpuritiesFor a total characterization of impurities
in ethylene and also propylene six GC
channels are required. By coupling two
Bruker GCs with three channels each,
a comprehensive solution is available
for analyzing these components. The
channels used in this analyzer are
analytical tools principally developed for
the determination of different gases in
various hydrocarbon types of gaseous
matrices.
GC-1
H2 Channel (TCD)
O2/N
2 Channel (TCD)
CO, CO2 Channel (Methanizer/FID)
GC-2
Light Hydrocarbon Channel (FID)
Oxygenates Channel (FID)
Sulfur Channel (PFPD)
The results (see figures 14 to 19)
demonstrate how this 6 channel
system is perfectly suited for the total
characterization of ethylene and its
impurities.
A Family of optimized GC Solutions
Innovation with IntegrityGas Chromatography
Natural
Gas Analyzer
Key Benefits include:
A complete range of natural gas
analysis (NGA) solutions. Bruker
offers many different NGA gas
chromatography analyzers to meet the
broadest range of stream sample types
and throughput needs, whether the
analysis is conducted in a laboratory,
at-line or in the field.
Easy to operate, powerful GC solutions.
Bruker’s GC with CompassCDS
Chromatography Software, form a
powerful combination and do not
require a high degree of skill to be used
successfully.
Flexibility to analyze natural gas,
liquified petroleum gas or natural gas
liquids (NGL). Bruker’s GC based NGA
analyzers can be configured to measure
the composition of LPG or NGL
streams through the use of specialized
sample conditioners, ensuring sample
integrity is constistently maintained.
Operational procedures are fully
documented. All Bruker NGA analyzers
not only incorporate proven GC
hardware and software, but arrive with
the pre-loaded analysis method(s)
and documentation specific to the
application.
Comprehensive single-vendor
solution. Bruker is proud to provide
complete solutions. The hardware,
software, application optimization,
documentation, installation and
performance verification are all
delivered by Bruker.
Figure 1: The Bruker GC based
Natural Gas Analyzer.
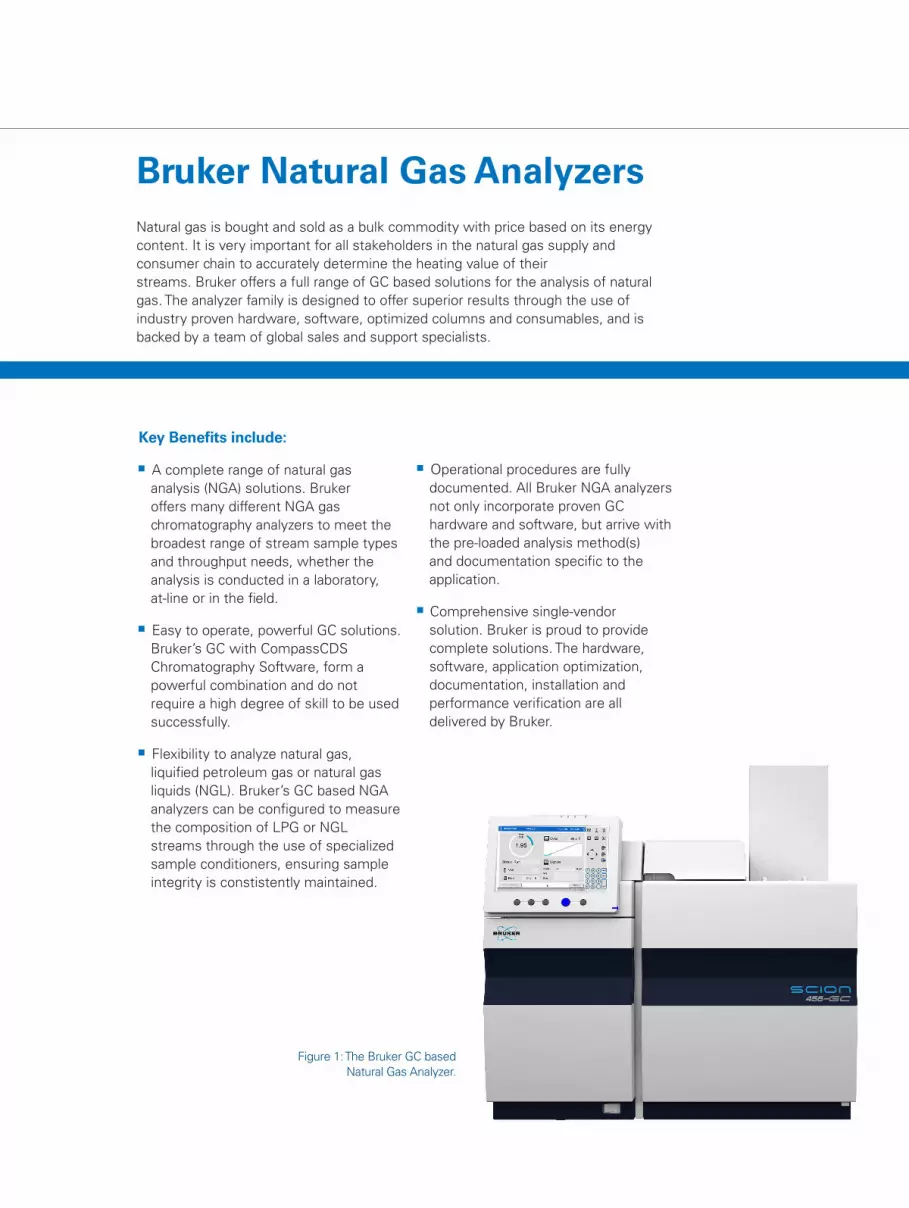
Natural gas is bought and sold as a bulk commodity with price based on its energy
content. It is very important for all stakeholders in the natural gas supply and
consumer chain to accurately determine the heating value of their
streams. Bruker offers a full range of GC based solutions for the analysis of natural
gas. The analyzer family is designed to offer superior results through the use of
industry proven hardware, software, optimized columns and consumables, and is
backed by a team of global sales and support specialists.
Bruker Natural Gas Analyzers
Solutions for Natural Gas Analysis
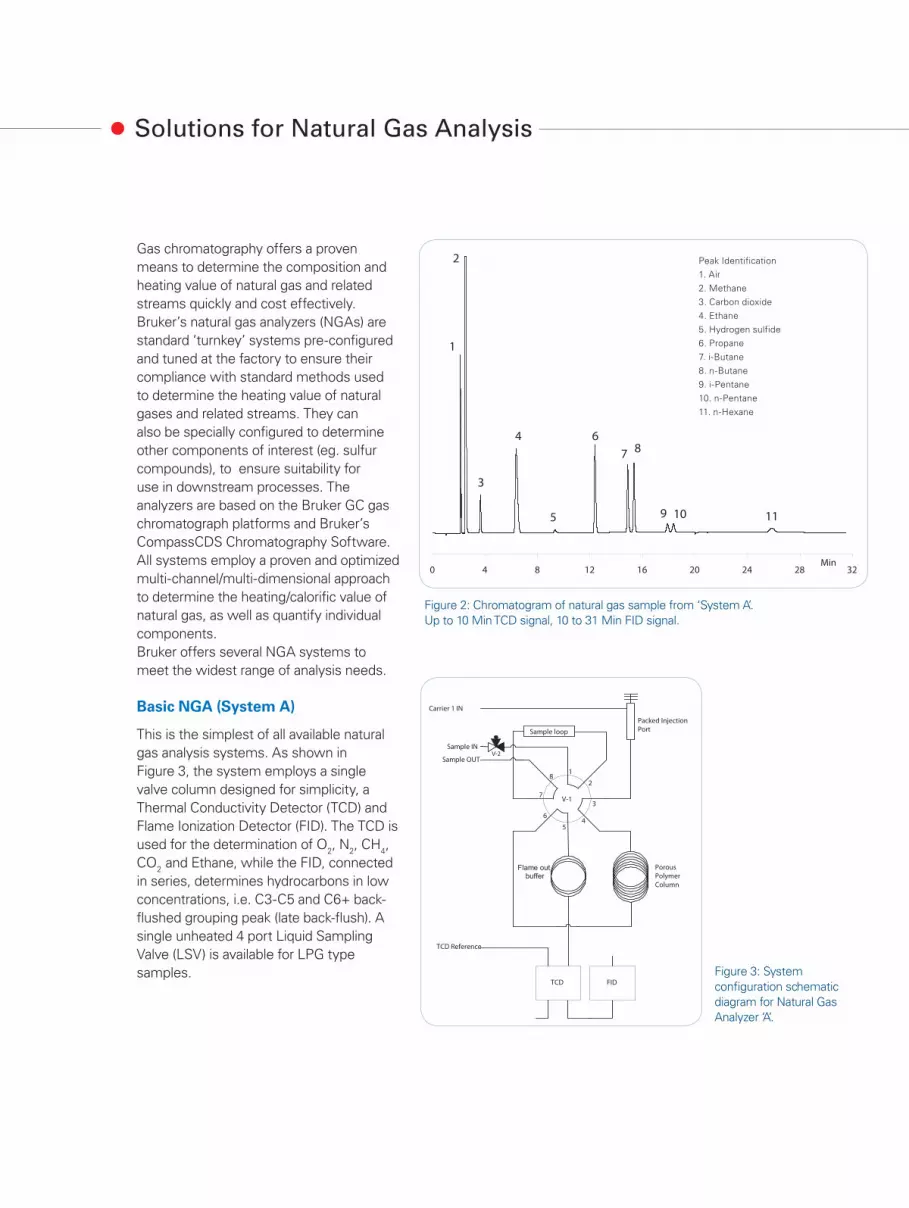
Gas chromatography offers a proven
means to determine the composition and
heating value of natural gas and related
streams quickly and cost effectively.
Bruker’s natural gas analyzers (NGAs) are
standard ‘turnkey’ systems pre-configured
and tuned at the factory to ensure their
compliance with standard methods used
to determine the heating value of natural
gases and related streams. They can
also be specially configured to determine
other components of interest (eg. sulfur
compounds), to ensure suitability for
use in downstream processes. The
analyzers are based on the Bruker GC gas
chromatograph platforms and Bruker’s
CompassCDS Chromatography Software.
All systems employ a proven and optimized
multi-channel/multi-dimensional approach
to determine the heating/calorific value of
natural gas, as well as quantify individual
components.
Bruker offers several NGA systems to
meet the widest range of analysis needs.
Basic NGA (System A)
This is the simplest of all available natural
gas analysis systems. As shown in
Figure 3, the system employs a single
valve column designed for simplicity, a
Thermal Conductivity Detector (TCD) and
Flame Ionization Detector (FID). The TCD is
used for the determination of O2, N
2, CH
4,
CO2
and Ethane, while the FID, connected
in series, determines hydrocarbons in low
concentrations, i.e. C3-C5 and C6+ back-
flushed grouping peak (late back-flush). A
single unheated 4 port Liquid Sampling
Valve (LSV) is available for LPG type
samples.
Figure 2: Chromatogram of natural gas sample from ‘System A’.
Up to 10 Min TCD signal, 10 to 31 Min FID signal.
Figure 3: System
configuration schematic
diagram for Natural Gas
Analyzer ‘A’.
0 4 8 12 16 20 24 28 32Min
4
109
7
6
5
3
1
2
8
11
8
7
Sample IN
Sample OUT
6
54
3
2
1
Sample loop
Packed Injection
Port
V-1
Flame out
buffer
Porous
Polymer
Column
Carrier 1 IN
TCD Reference
TCD FID
V-2
Peak Identification
1. Air
2. Methane
3. Carbon dioxide
4. Ethane
5. Hydrogen sulfide
6. Propane
7. i-Butane
8. n-Butane
9. i-Pentane
10. n-Pentane
11. n-Hexane
Flame-outBuffer
Non-PolarColumn
Non-PolarPre-Column
MolsieveColumn
TCDReference
TCD
Vent
Carrier 2 IN
Sample IN
Sample OUT
Sample loop
Carrier 1 IN
Sample loop
12
3
4
5
678
9
10
11
12
V - 2
12
3
4
56
7
8
9
10
V - 1
V-3
FID
NV-1
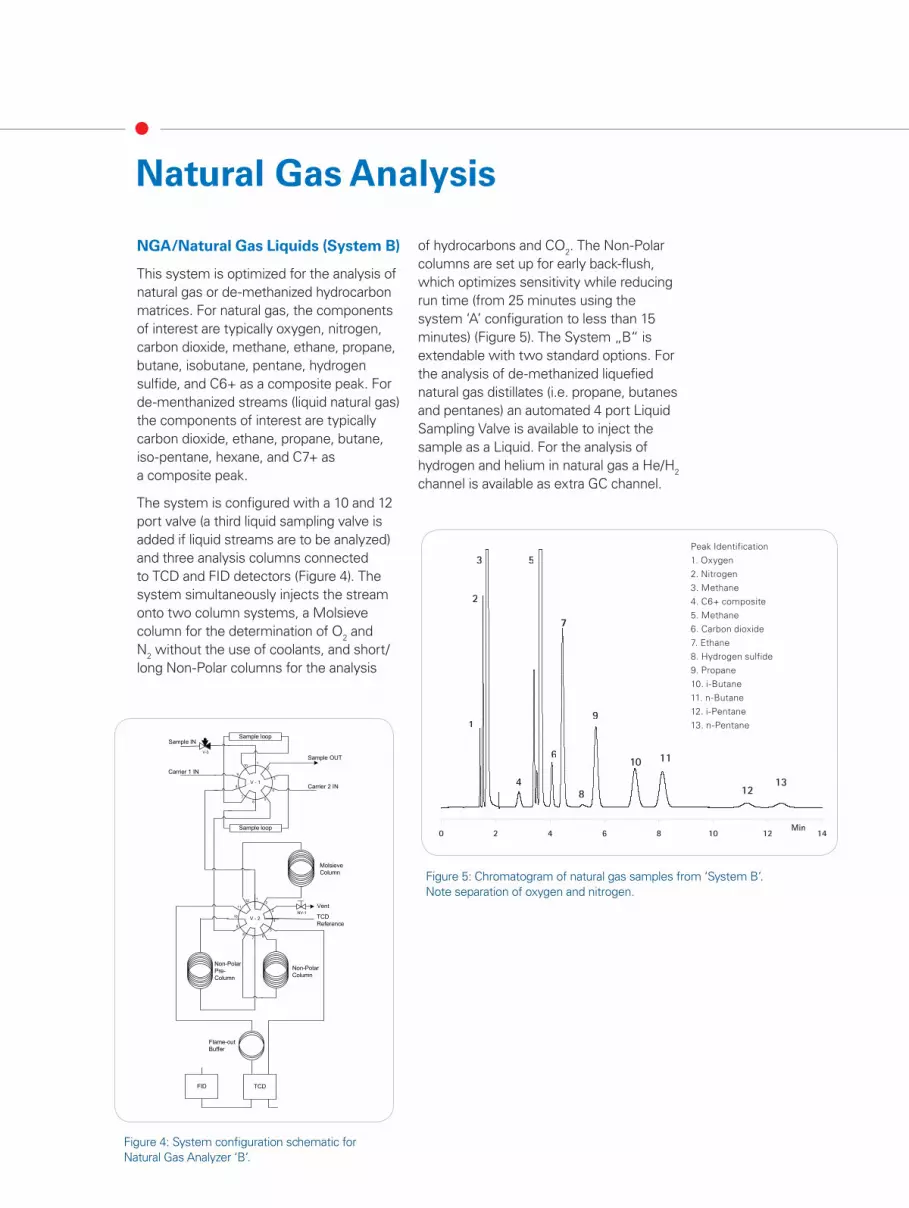
Figure 4: System configuration schematic for
Natural Gas Analyzer ‘B’.
NGA/Natural Gas Liquids (System B)
This system is optimized for the analysis of
natural gas or de-methanized hydrocarbon
matrices. For natural gas, the components
of interest are typically oxygen, nitrogen,
carbon dioxide, methane, ethane, propane,
butane, isobutane, pentane, hydrogen
sulfide, and C6+ as a composite peak. For
de-menthanized streams (liquid natural gas)
the components of interest are typically
carbon dioxide, ethane, propane, butane,
iso-pentane, hexane, and C7+ as
a composite peak.
The system is configured with a 10 and 12
port valve (a third liquid sampling valve is
added if liquid streams are to be analyzed)
and three analysis columns connected
to TCD and FID detectors (Figure 4). The
system simultaneously injects the stream
onto two column systems, a Molsieve
column for the determination of O2 and
N2 without the use of coolants, and short/
long Non-Polar columns for the analysis
of hydrocarbons and CO2. The Non-Polar
columns are set up for early back-flush,
which optimizes sensitivity while reducing
run time (from 25 minutes using the
system ‘A’ configuration to less than 15
minutes) (Figure 5). The System „B“ is
extendable with two standard options. For
the analysis of de-methanized liquefied
natural gas distillates (i.e. propane, butanes
and pentanes) an automated 4 port Liquid
Sampling Valve is available to inject the
sample as a Liquid. For the analysis of
hydrogen and helium in natural gas a He/H2
channel is available as extra GC channel.
0 2 4 6 8 10 12 14Min
1
4
2
3
9
8
7
6
5
13
1110
12
Figure 5: Chromatogram of natural gas samples from ‘System B’.
Note separation of oxygen and nitrogen.
Peak Identification
1. Oxygen
2. Nitrogen
3. Methane
4. C6+ composite
5. Methane
6. Carbon dioxide
7. Ethane
8. Hydrogen sulfide
9. Propane
10. i-Butane
11. n-Butane
12. i-Pentane
13. n-Pentane
Natural Gas Analysis

“Rich” Natural Gas Analysis
Figure 7: System schematic for Natural Gas Analyzer ‘C‘
Figure 6: Chromatogram showing natural gas sample from ‘System C’ FID
channel. Note individual separation of C6+ components
Figure 8: Chromatogram showing natural gas sample from
‘system C’ TCD channel.
NGA/Natural Gas Liquids -
Extended Analysis (System C)
This system is specifically designed to
analyze ‘rich’ natural gas or natural gas
liquid streams by separating all
hydrocarbon components up to C16. As
with System B, it separates and quantifies
oxygen and nitrogen, as well as measuring
hydrogen sulfide down to ~100 ppm.
The system is configured with a 14 port
valve and 6 port valve. The 14 port valve
enables the system to introduce the
sample stream simultaneously to three
independent columns with automated
detector switching which provides high
sensitivity detection of all components
of interest. The valves are installed in the
multi-valve oven for flexible operation of
the conventional column oven. Two of the
sample paths flow onto Molsieve and
porous polymer columns to separate
oxygen, nitrogen and carbon dioxide,
ethane, methane, ethane and H2S, and the
other via a ‘splitter’ onto a high
performance non-polar capillary column to
separate the hydrogen components
up through C16. The 6 port valve is used to
direct the separated components fraction
Carrier 2 IN
Gas sample IN
Gas sample OUT
Sample loop
Sam
ple
loop
Sam
ple
loop
FID
TCD Reference
TCD
Non-polarCapillaryColumn
MolsieveColumn
Delaycolumn
PorousPolymerColumn
Vent
Carrier 1 IN
Carrier 3 IN
CapillaryInjectionPort
Split vent
V-3
12
3
4
5
678
9
10
11
12
1413
V - 1
1
2
3
4
5
6
V - 2
0 1 2 3 4 5 6 7 8Min.
1
2
3
4
5
6
7
8
9
10
11
12
13
14
15
16 1718
19
20
21
Peak identification
1. Propane
2. iso-Butane
3. n-Butane
4. neo-Pentane
5. iso-Pentane
6. n-Pentane
7. Cyclopentane
8. n-Hexane
9. Methylcyclopentane
10. Benzene
11. Cyclohexane
12. 2,2,4-Trimethylpentane
13. n-Heptane
14. Toluene
15. n-Octane
16. Ethylbenzene
17. m- + p-Xylene
18. o-Xylene
19. n-Nonane
20. 1,2,4-Trimethylbenzene
21. n-Decane
Peak identification
1. O2/Ar
2. N2
3. O2/Ar/N
2
4. Methane
5. CO2
6. Ethane
7. H2S
to the TCD detector while components
remaining on the Molsieve column are
flushed to vent. If natural gas liquids are to
be analyzed, a third valve (liquid sampling)
is added to the configuration described
above. For natural gas containing hydrogen
and helium a He/H2 channel is configured
additionally.
0 2 4 6 8Min
3 4
6
2
1
5
7
Peak identification
1. O2/Ar
2. N2
3. O2/Ar/N2
4. Methane
5. CO2
6. Ethane
7. H2S
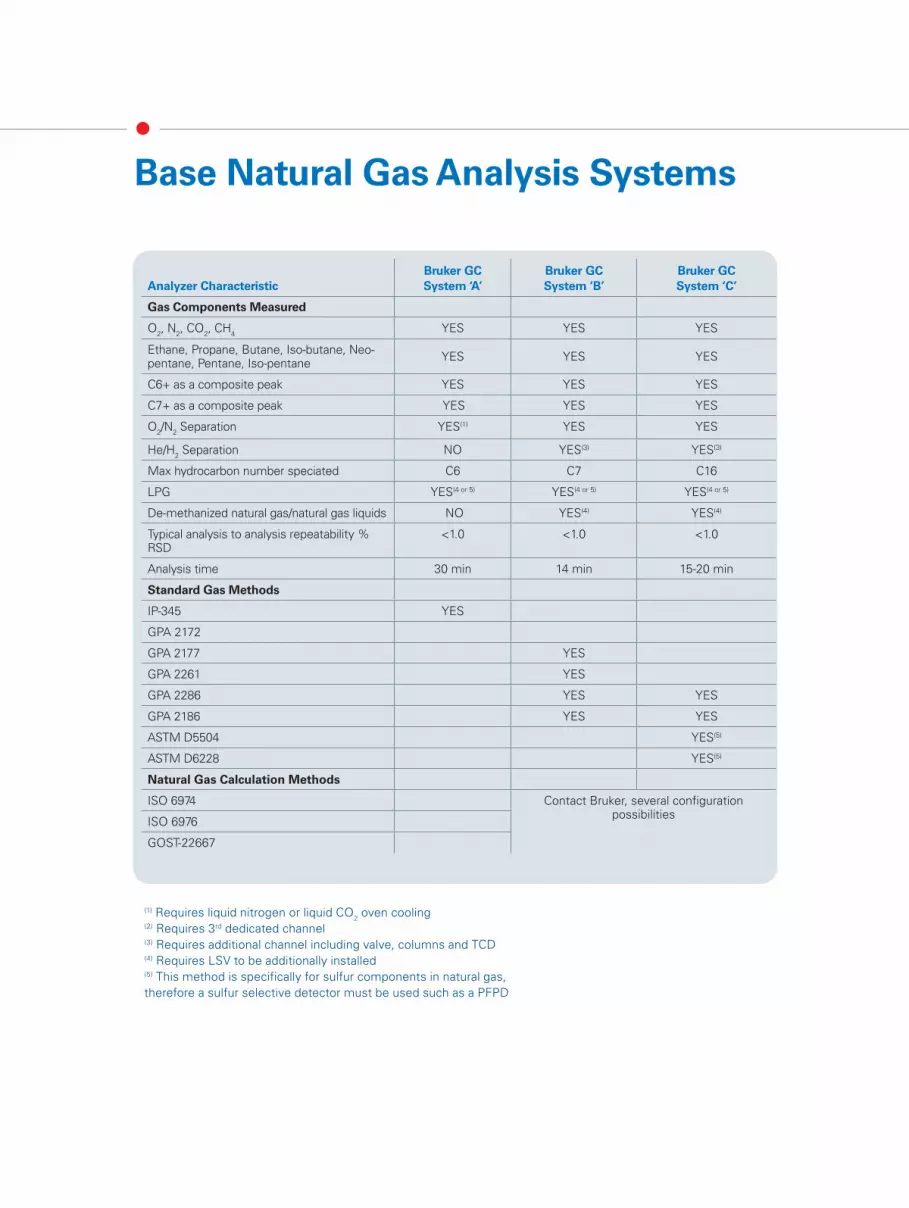
Analyzer Characteristic
Bruker GC
System ‘A’
Bruker GC
System ‘B’
Bruker GC
System ‘C’
Gas Components Measured
O2, N
2, CO
2, CH
4YES YES YES
Ethane, Propane, Butane, Iso-butane, Neo-pentane, Pentane, Iso-pentane
YES YES YES
C6+ as a composite peak YES YES YES
C7+ as a composite peak YES YES YES
O2/N
2 Separation YES(1) YES YES
He/H2 Separation NO YES(3) YES(3)
Max hydrocarbon number speciated C6 C7 C16
LPG YES(4 or 5) YES(4 or 5) YES(4 or 5)
De-methanized natural gas/natural gas liquids NO YES(4) YES(4)
Typical analysis to analysis repeatability % RSD
<1.0 <1.0 <1.0
Analysis time 30 min 14 min 15-20 min
Standard Gas Methods
IP-345 YES
GPA 2172
GPA 2177 YES
GPA 2261 YES
GPA 2286 YES YES
GPA 2186 YES YES
ASTM D5504 YES(5)
ASTM D6228 YES(5)
Natural Gas Calculation Methods
ISO 6974 Contact Bruker, several configuration possibilities
ISO 6976
GOST-22667
Base Natural Gas Analysis Systems
(1) Requires liquid nitrogen or liquid CO2 oven cooling
(2) Requires 3rd dedicated channel(3) Requires additional channel including valve, columns and TCD(4) Requires LSV to be additionally installed(5) This method is specifically for sulfur components in natural gas,
therefore a sulfur selective detector must be used such as a PFPD

Sulfur components in Natural Gas
Figure 9: Natural Gas Report - ‘System C’
generated using Bruker’s CompassCDS
Chromatography Data Software
There are several methods specifically
used for the analysis of sulfur
components in natural gas, e.g. ASTM
D5504 and ASTM D6228. Bruker’s
natural gas analyzers can be modified
to measure sulfur components through
the addition of an extra, fully inert
channel, dedicated for the determination
of lowlevel sulfur components only.
This sulfur channel will be equipped
with the Pulsed Flame Photometric
Detector (PFPD), a sulfur specific
detector. The systems can also be
configured and tested exclusively for the
analysis of sulfur components as per
standard methods, or enterprise specific
requirements.
0 4 8 12 16 20 24 Min
H S COS
CH SH
CH CH SH
TBM
THT
2
3
23
Figure 10: Detection of trace level sulfur components using the 450-GC, specially
treated with Inert Steel surface deactivation and Pulsed Flame Photometric
Detector (PFPD).
CompassCDS

Bru
ke
r D
alt
on
ics is c
on
tin
ually im
pro
vin
g its
pro
du
cts
an
d r
ese
rve
s t
he r
igh
t
to c
han
ge s
pe
cif
icati
on
s w
ith
ou
t n
oti
ce
. ©
BD
AL 0
8-2
010
, #
CA
-27
03
75
www.bruker.com/scion
Bruker-Certified Consumables for
Your SCION GC Series
Bruker GC columns span a broad range of column diameters,
stationary phases, and capillary column materials: Fused Silica
(FS) and Inert Steel (IS). Ideal for either routine or research type
analyses.
Bruker GC column offerings bridge across many important
applications and include a number of offerings such as:
Standard WCOT (Wall Coated Open Tubular)
Solid Stationary Phase PLOT (Porous Layer Open Tubular)
Inert Steel Micro-Packed and Packed
For research use only. Not for use in diagnostic procedures.
Super Clean™ Gas Filters
Bruker Gas Purification Systems have the range to satisfy
your needs from individual to combination filters, from Ultra
purity combined with Ultra capacity, to all in one solution
kits. Innovative features designed into the product yield
extensive benefits to the user.
Ultra-high capacity for long life, less change and improved
productivity
High-purity output ensures 99.9999% Pure Gas
“Quick connect“ fittings for easy, leak-tight filter changes
Glass internals prevent diffusion; plastic externally for safety
Easy-to-read indicators for planned maintenance and
improved up-time
www.ScionHasArrived.com www.Bruker.com
Optimized Solutions for Detailed
Hydrocarbon Analysis
Innovation with IntegrityGas Chromatography
DHA Analyzer Family
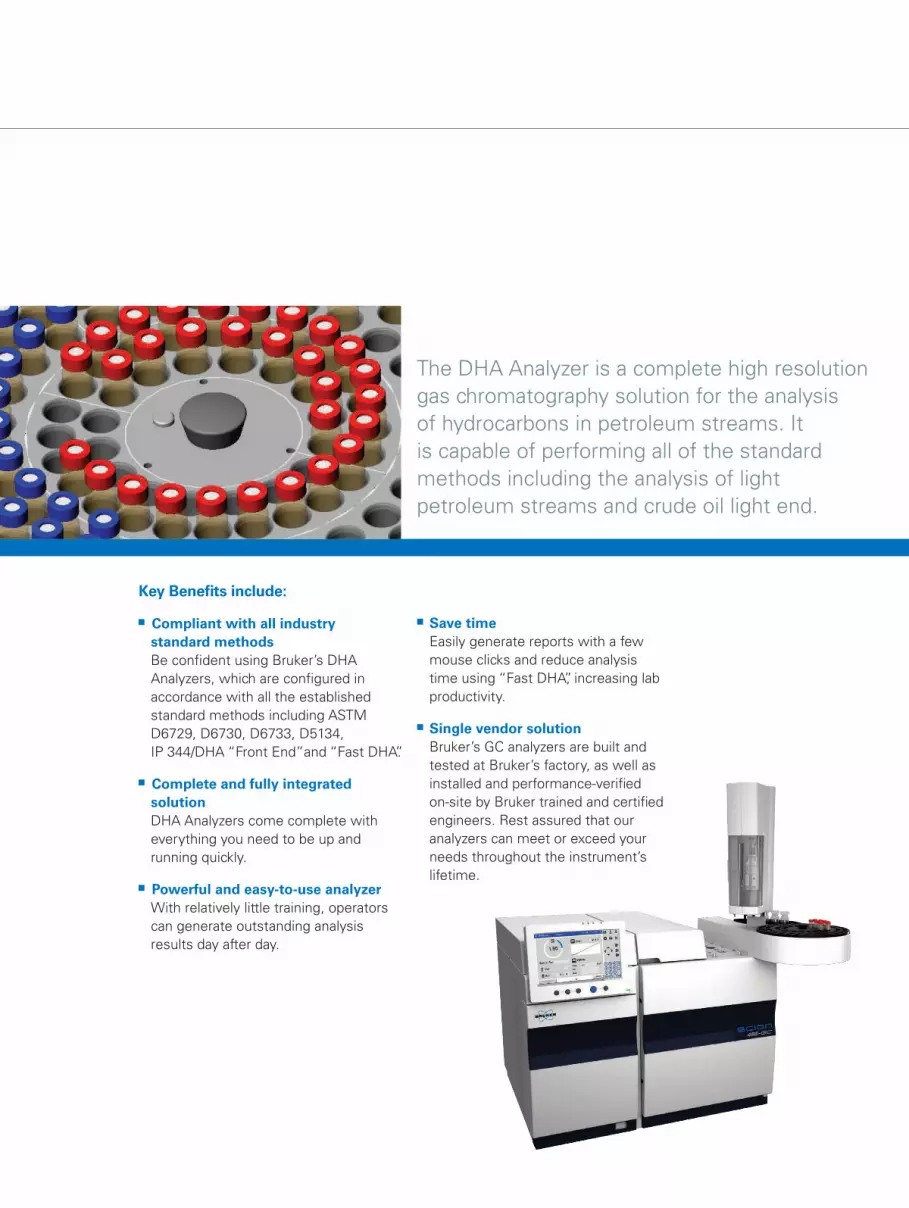
The DHA Analyzer is a complete high resolution
gas chromatography solution for the analysis
of hydrocarbons in petroleum streams. It
is capable of performing all of the standard
methods including the analysis of light
petroleum streams and crude oil light end.
Key Benefits include:
Compliant with all industry
standard methods
Be confident using Bruker’s DHA
Analyzers, which are configured in
accordance with all the established
standard methods including ASTM
D6729, D6730, D6733, D5134,
IP 344/DHA “Front End”and “Fast DHA”.
Complete and fully integrated
solution
DHA Analyzers come complete with
everything you need to be up and
running quickly.
Powerful and easy-to-use analyzer
With relatively little training, operators
can generate outstanding analysis
results day after day.
Save time
Easily generate reports with a few
mouse clicks and reduce analysis
time using “Fast DHA”, increasing lab
productivity.
Single vendor solution
Bruker’s GC analyzers are built and
tested at Bruker’s factory, as well as
installed and performance-verified
on-site by Bruker trained and certified
engineers. Rest assured that our
analyzers can meet or exceed your
needs throughout the instrument’s
lifetime.
DHA Analyzer Family
Detailed hydrocarbon analysis is often the
preferred technique to fully characterize
petroleum streams. The technique is
based on the identification of individual
components using high performance, high
resolution capillary gas chromatography.
Software Ensures Accurate
Identification
To successfully apply gas chromatography
to detailed hydrocarbon analysis (DHA) the
analyzer must be able to correctly identify a
large number of components (many eluting
very closely to one another) in a complex
chromatogram. The identification is based
on a comparison of their individual retention
index values to those in a pre-established
database. Therefore, it is extremely
important that the analyzer functions in a
highly repeatable manner.
Due to the high number of possible
components in hydrocarbon streams,
even though analyzed on a high resolution
column, it cannot prevent coelution
of some hydrocarbons. However, the
presence of certain hydrocarbons depends
on the type of sample stream. For example
the presence of naphthenes is more
common in Naphtha than in Reformate
where aromatics are more dominant. The
DHA analyzer allows presetting a sample
type within the DHA method. By setting a
component identification preference for a
coelution, the most likely main component
is assigned and sample characterization
is improved. The software also allows
defining additional sample presets in case
new sample types become available.
Figure 2: Detailed hydrocarbon
analysis of a reformate sample
showing aromatics identification
according ASTM D6730
Table 1: For some sample streams a single component assignment is possible due to
the assumed absence of one of the coeluting components.
KRI or LRI* Component Hydrocarbon Type
Component Present in:
Reformate Naphtha Alkylate
721.41,1,3-Trimethyl cyclopentane Naphthenic C8 - + -
2,2-Dimethylhexane iso paraffin C8 ++ + -
751.1Toluene Aromatic C7 +++ + -
2,3,3-Trimethylpentane Iso paraffin C8 - + ++
877.9o-Xylene Aromatic C8 +++ + -
1,1,2-Trimethylcyclohexane Naphthenic C8 - + -
* KRI = Kovats REtention Index. LRI = Linear Retention Index.
Standard Methods
Selecting Individual Peaks and
Updating the Database
The DHA software includes a Peak
Select and Database Update function to
make identification of unknown peaks as
straightforward as possible. The system
automatically provides the operator with
detailed comparative retention index
information for each “unknown” peak
including a highlighted “best fit” indicator,
making it easy for the operator to determine
the ID.
Integrated Standard Test Methods
Bruker’s DHA analyzers are compliant with
the following methods:
ASTM D6729 ASTM D5134
ASTM D6730 “Fast” DHA
ASTM D6733 IP 344 “Front end“
Although each DHA analyzer is configured,
tested and certified at the factory for
a standard method specified by the
customer, the DHA software permits
the operator to utilize any of the other
popular standard methods as well. And,
because of the outstanding performance
and flexibility of the Bruker GC and
CompassCDS software design, Bruker
is able to quickly modify the existing
methods or add new ones if required as a
result of the on-going “dynamic” industry
standard processes.
Powerful Reporting is Built-in
Bruker’s DHA software includes several
report options to accommodate the
standard methods and/or to meet the
customer’s special needs. These include:
Carbon number distribution
PIONA report; (weight and volume
percentage by hydrocarbon group)
Physical properties calculations;
specific gravity and molecular weight
True distillation profile
RON/MON specification
Figure 3: Assigning custom peak matching criteria
is easy.
Figure 4: DHA provides an easy-to-use graphical
means to select peaks and update the database
Figure 5: Choosing a preferred standard method is easy with the DHA software
Figure 6: Choosing report options is simple
Reduce Sample Analysis Time With “Fast DHA”
DHA Analyzer Includes These Key
Components
Bruker GC high performance gas
chromatograph equipped with:
- Split/splitless capillary injection port
- High performance capillary column
(dependent on specified method
on order)
- Flame ionization detector (FID)
- Full electronic flow control (EFC) of
all gases
State of the art backflush capabilities for
the IP 344 “Front End“ method
CP-8400 or CP-8410 automatic liquid
sampler
CompassCDS for system control,
data acquisition and report generation
CompassCDS based DHA application
software
Computer/monitor
Pre-loaded standard methods
Factory test
Reference chromatogram
Reference standard for use in conducting
on-site performance verification
Figure 7: These chromatograms illustrate the decreased analysis time using the “Fast DHA” method. Chromatogram of a naphtha sample
run on a 40 m X 0.10 mm X 0.2 µm film BR-DHA using the “Fast DHA” method (left). Chromatogram of the same sample, but run on a 100
m X 0.25 mm ID X 0.5 µm film BR-DHA column using standard method D6729 (right). Note reduced analysis time from ~80 minutes to ~20
minutes; almost four-fold.
Figure 8: Physical properties and detailed hydrocarbon report
Sample Name
Sample Preset
Data File
Method
Description
Instrument
VialReformate
Reformate
DHA\D6730 DHAX\6730_reformate.DATA
Reformate
Demo
ASTM D6730.dha
Bruker compassCDS
ASTM D6730
Database D6730_v4.mdb
D6730
DHA Method
Sample Wt
ISTD Wt 1,0000
# Vol%Mass%AreaGrpNameIndexTime
15 19,967 566,2 2-methylpentane iP 2,425 2,9984,787E-003
16 20,133 568,4 t-4-methyl-2-pentene iO 0,014 0,0172,903E-005
17 21,105 580,8 3-methylpentane iP 1,883 2,2893,717E-003
18 21,588 587,0 2-methyl-1-pentene iO 0,023 0,0274,616E-005
19 21,680 588,1 1-hexene nO 0,007 0,0091,463E-005
20 22,615 600,0 hexane nP 2,528 3,0974,991E-003
21 22,862 602,3 t-3-hexene iO 0,018 0,0213,595E-005
22 23,087 604,3 t-2-hexene iO 0,025 0,0305,038E-005
23 23,292 606,1 2-methyl-2-pentene iO 0,045 0,0539,137E-005
24 23,538 608,3 c-3-methyl-2-pentene iO 0,025 0,0315,101E-005
25 23,908 611,7 c-2-hexene iO 0,013 0,0162,701E-005
26 24,475 616,8 3,3-dimethyl-1-Pentene iO 0,034 0,0398,013E-005
27 24,788 619,6 2,2-dimethylpentane iP 0,319 0,3806,316E-004
28 24,968 621,2 methylcyclopentane cP 0,522 0,5631,058E-003
29 25,407 625,1 2,4-dimethylpentane iP 0,342 0,4116,777E-004
30 25,867 629,3 2,2,3-trimethylbutane iP 0,048 0,0569,457E-005
31 27,080 640,2 4,4-dimethyl-1-pentene iO 0,007 0,0081,411E-005
32 27,312 642,3 1-methylcyclopentene cO 0,023 0,0244,850E-005
33 27,480 643,8 Benzene Ar 6,002 5,5291,309E-002
34 27,947 648,0 3,3-dimethylpentane iP 0,321 0,3756,359E-004
35 28,365 651,8 cyclohexane cP 0,032 0,0336,417E-005
36 28,673 654,5 t-2-methyl-3-hexene iO 0,012 0,0142,401E-005
37 29,293 660,1 4-methyl-t/-c2-hexene iO 0,024 0,0274,785E-005
38 29,448 661,5 2-methylhexane iP 2,122 2,5294,203E-003
39 29,617 663,0 2,3-dimethylpentane iP 0,796 0,9221,576E-003
40 29,938 665,9 1,1-dimethylcyclopentane cP 0,024 0,0264,852E-005
41 30,483 670,8 3-methylhexane iP 2,640 3,0995,230E-003
42 30,952 675,0 3,4-dimethyl-c-pentene-2 iO 0,012 0,0142,415E-005
43 31,263 677,8 c-1,3-dimethylcyclopentane cP 0,043 0,0468,679E-005
44 31,622 681,0 t-1,3-dimethylcyclopentane cP 0,043 0,0468,650E-005
45 31,780 682,5 3-ethylpentane iP 0,272 0,3145,386E-004
46 31,972 684,2 t-1,2-dimethylcyclopentane cP 0,065 0,0701,315E-004
47 32,177 686,0 1-heptene nO 0,008 0,0091,544E-005
48 32,295 687,1 2-ethyl-pentene-1 iO 0,014 0,0172,878E-005
49 33,008 693,5 c-3-methyl-3-hexene iO 0,016 0,0193,249E-005
50 33,493 697,9 t-3-heptene nO 0,026 0,0305,168E-005
51 33,725 700,0 heptane nP 2,183 2,5804,324E-003
52 34,057 701,5 3-methyl-c-hexene-2 iO 0,068 0,0771,384E-004
53 34,215 702,3 3-methyl-t-hexene-3 iO 0,025 0,0295,122E-005
54 34,473 703,5 t-Heptene-2 iO 0,019 0,0223,933E-005
55 34,710 704,6 3-ethyl-2-pentene iO 0,012 0,0142,443E-005
56 35,162 706,8 c-Heptene-2 iO 0,036 0,0417,226E-005
57 35,763 709,6 2,3-dimethyl-2-pentene iO 0,029 0,0345,939E-005
Created by DHA Reporter - Compass CDS 3.9.5
Date Printed 20-7-2012 13:45:22 Page 3 of 5
Sample Name
Sample Preset
Data File
Method
Description
Instrument
VialReformate
Reformate
DHA\D6730 DHAX\6730_reformate.DATA
Reformate
Demo
ASTM D6730.dha
Bruker compassCDS
ASTM D6730
Database D6730_v4.mdb
D6730
DHA Method
Sample Wt
ISTD Wt 1,0000
Physical Properties Report
Reid Vapor Pressure psi at 100 °F 2.4
Liquid Density g/ml (15 °C) 0.8133
Research Octane Number 106.9
Motor Octane Number 97.0
Gross Heating Value KJ / Kg 44160.5
Nett Heating Value KJ / Kg 41793.0
Bromine Number 3.2
Paraffins
Cyclo
Paraffins
Iso
Paraffins
Normal
Olefins Aromatics Unknowns Total
C4 0,00 0,02 0,18 0,00 0,00 0,00 0,20
C5 0,32 2,12 1,29 0,08 0,00 0,00 3,81
C6 0,55 5,31 2,53 0,21 6,00 0,00 14,61
C7 0,21 6,86 2,18 0,38 20,99 0,00 30,62
C8 0,23 1,98 0,74 0,63 24,54 0,00 28,12
C9 0,00 0,47 0,18 0,00 10,78 0,00 11,43
C10 0,00 0,00 0,01 0,00 10,40 0,00 10,42
C11 0,00 0,03 0,00 0,00 0,20 0,00 0,23
C12 0,00 0,00 0,00 0,00 0,46 0,02 0,48
Heavy 0,00 0,00 0,00 0,00 0,00 0,10 0,10
Total 1,31 16,79 7,12 1,29 73,37 0,12 100,0
PIONA Report in Mass%
PIONA Report in Volume%
Paraffins
Cyclo
Paraffins
Iso
Paraffins
Normal
Olefins Aromatics Unknowns Total
C4 0,00 0,02 0,25 0,00 0,00 0,00 0.28
C5 0,34 2,76 1,67 0,10 0,00 0,00 4.86
C6 0,60 6,53 3,10 0,25 5,53 0,00 15.99
C7 0,22 8,09 2,58 0,44 19,53 0,00 30.85
C8 0,25 2,27 0,85 0,70 22,85 0,00 26.91
C9 0,00 0,53 0,20 0,00 10,02 0,00 10.76
C10 0,00 0,00 0,02 0,00 9,63 0,00 9.64
C11 0,00 0,03 0,00 0,00 0,17 0,00 0.20
C12 0,00 0,00 0,00 0,00 0,39 0,02 0.41
Heavy 0,00 0,00 0,00 0,00 0,00 0,11 0.11
Total 1,41 20,22 8,66 1,48 68,11 0,13 100,0
Created by DHA Reporter - Compass CDS 3.9.5
Date Printed 20-7-2012 13:45:22 Page 1 of 5
Bru
ke
r D
alt
on
ics is c
on
tin
ually im
pro
vin
g its
pro
du
cts
an
d r
ese
rve
s t
he r
igh
t
to c
han
ge s
pe
cif
icati
on
s w
ith
ou
t n
oti
ce
. ©
BD
AL 0
5-2
010
, #
CA
-27
03
64
www.bruker.com/scion
Bruker-Certified Consumables for
Your SCION GC Series
Bruker GC columns span a broad range of column diameters,
stationary phases, and capillary column materials: Fused Silica
(FS) and Inert Steel (IS). Ideal for either routine or research type
analyses.
Bruker GC column offerings bridge across many important
applications and include a number of offerings such as:
Standard WCOT (Wall Coated Open Tubular)
Solid Stationary Phase PLOT (Porous Layer Open Tubular)
Inert Steel Micro-Packed and Packed
For research use only. Not for use in diagnostic procedures.
Super Clean™ Gas Filters
Bruker Gas Purification Systems have the range to satisfy
your needs from individual to combination filters, from Ultra
purity combined with Ultra capacity, to all in one solution
kits. Innovative features designed into the product yield
extensive benefits to the user.
Ultra-high capacity for long life, less change and improved
productivity
High-purity output ensures 99.9999% Pure Gas
“Quick connect“ fittings for easy, leak-tight filter changes
Glass internals prevent diffusion; plastic externally for safety
Easy-to-read indicators for planned maintenance and
improved up-time
www.ScionHasArrived.com www.Bruker.com

think forward MALDI-TOF
Microorganism Identification and Classification
MALDI Biotyper
Bruker Daltonics
Identify Microorganisms in Minutes
Searching for the culprit?
Fast and reliable species-specific identi-
fication of microorganisms, like bacteria,
yeasts, or fungi, is mandatory in clinical
routine monitoring, food processing quality
control or environmental and taxonomical
research. Benefit from ultra-fast analysis
time and a simple consistent analysis
workflow with high differentiation power.
The molecular fingerprint
Discover bacteria’s identity by its own
unique molecular composition. In a
MALDI-TOF mass spectrometer, proteins
and peptides are arranged in a spectrum
with increasing mass – revealing a
characteristic peak pattern, even for
reliable differentiation of species:
The individual fingerprint.
Sample amount is not critical
The sample material can be a single
colony from overnight culture or a centri-
fuged portion of a liquid culture. Biological
material is prepared as smear or extract
respectively, representing millions of cells
roughly, although a minimum of 105 cells
can be measured accurately on a standard
MALDI sample target plate.
Ready-to-Go database
MALDI Biotyper integrates a ready-
to-use reference library comprising
thousands of individual species and is
growing continuously.
The system is open and can be easily
expanded by specific requests of the
user including data for ID of bacteria,
yeasts and fungi.
Performance on the bench: the microflexTM
In One Simple Step
Ease of operation:
Real-Time analysis
Single bacterial colonies or other
biological material can be directly
applied to a MALDI sample target
and introduced to a FLEX series
MALDI-TOF mass spectrometer.
Spectra acquisition is completed after
a few minutes and data evaluation is
directly linked to the measurement.
This simple and exclusive workflow
is adequate for most microorganisms,
avoiding the need to perform gram-
staining, oxidase- or any other tests.
Sophisticated instrumentation
With robust and reliable Bruker
Daltonics FLEX series instrumentation,
fast measurements with high
reproducibility are possible. The high
sensitivity of the instruments allows
identification of minimal sample
amounts. When employing the renow-
ned Bruker AnchorChipTM technology,
scientists need even less biological
material.
The molecular fingerprint is used
for pattern matching. Sophisticated
recalibration and statistical algorithms
allow robust and accurate identification.
Matching scores supported by color
codes are used for ranking of results.
Ps. mendocina DSM50017 |
Ps. oleovorans B396 |
Ps. fluoreszens B340 |
Ps. veronii DSM11331 |
Ps. putida DSM291 |
Ps. putida B401 |
The Workflow: Only Little Interaction Required
It takes only minutes to
receive results on the screen.
You are only five mouse clicks
away from your results.
Ps. mendocina DSM50017 |
Ps. oleovorans B396 |
Ps. fluoreszens B340 |
Ps. veronii DSM11331 |
Ps. putida DSM291 |
Ps. putida B401 |
1. Open MALDI Biotyper control wizard
5. Receive results
4. Initiate measurement
2. Define your project
3. Allocate your samples
Full Bioinformatics Capabilities
Sub-Typing
In depth analysis of acquired data sets is
possible by applying different bioinforma-
tic tools like weighted pattern matching
algorithms, correlation and principal
component analysis.
Principal component analysis
Principal component analysis, for
example, is an excellent tool for fine
analysis of closely related isolates,
species or subspecies.
Dendrogram generation
Dendrograms are created literally within
seconds from all main spectra selected in
one step.
Creation of own reference files
Add your own references or create a
complete new reference database by
yourself straightforwardly with a few
additional mouse clicks.
Clostridia dendrogram created with
MALDI Biotyper; finest differences
between species can readily be
evaluated. Data were generated in
cooperation with Prof. Krüger and
Dr. Grosse-Herrenthey, Institute of
Bacteriology and Mycology,
University of Leipzig, Germany.
Typical MALDI Biotyper 2.0 result window after off-line proces-
sing of an unknown sample. Left: Peak matching window shows
the measured spectrum compared to the reference spectrum.
Right window shows the hits in the database.
Identification by peak-matching
Multivariate analysis of pseudomonas species
3D scatter plot of the first three principle component scores for
six individual species of the genus Pseudomonas, Pseudomonas
veronii, P. fluorescens, P. mendocina, P. oleovorans, P. putida
species B401, P. putida species DSM291
Dendrogram generation
Technical Specifications
Bruker Daltonik GmbH
Bremen · Germany
Phone +49 (421) 2205-0
Fax +49 (421) 2205-103
Bruker Daltonics Inc.
Billerica, MA · USA
Phone +1 (978) 663-3660
Fax +1 (978) 667-5993
www.bdal.com
Fields of application
Clinical routine monitoring, environmental and taxonomical research,
food processing quality control
Features identification, taxonomical classification, or dereplication of
microorganisms
Sample preparation / handling
Very simple and rapid preparation.
Very sensitive, amounts of roughly 105 cells are required
No initial assessment, each sample handled in the same way:
No gram staining, oxidase- or any other tests and conditions choice
Samples
Bacteria (gram+ / gram-), yeasts, fungi
Instrumentation
Fast measurements with high reproducibility on a microflexTM, autoflexTM
or ultraflexTM MALDI-TOF mass spectrometer
Software
MALDI Biotyper, COMPASSTM for FLEX series incl. flexAnalysisTM
Speed of analysis
Minutes from colony to result for a single sample,
approx. 1.5 hours from colony to result for 96 samples
For research use only. Not for use in diagnostic purposes.
Bru
ke
r D
alt
on
ics is c
on
tin
ually im
pro
vin
g its
pro
du
cts
an
d r
ese
rve
s t
he r
igh
t
to c
han
ge s
pe
cif
icati
on
s w
ith
ou
t n
oti
ce
. ©
BD
AL 0
8-2
00
8, L
S-3
0/3
“There was an urgent need
for a next generation techni-
que for the fast, convenient
and cost-effective identifica-
tion of microbial species.
Bruker Daltonics MALDI
Biotyper is well suited for
this purpose as it fulfills
these requirements and as it
has proven to be very robust
and reproducible.”
Prof. Dr. Erko Stackebrandt,
Managing Director of DSMZ

ICP-MS
A new era in ICP-MS
aurora M90
Innovation with Integrity

Your Partner in ICP-MS Solutions
Bruker continues to find new and novel ways
to meet your changing needs. As a leader in
elemental analysis you can be assured that
when you buy a Bruker ICP-MS, you’re buying
more than just an instrument. You’re buying a
relationship with one of the most respected and
experienced instrument companies in the world.

ICP-MS: It’s never been Easier
Bruker innovation, making ICP-MS easier
If you’ve ever wished that ICP-MS could
be simpler, wish no more. The aurora
M90 makes light work of it. No matter
what your requirements, with a Bruker
ICP-MS, you can tackle any application
with ease.
Key benefits of aurora M90 include:
Bruker’s patented high-efficiency 90
degree ion optics and double off-axis
quadrupole delivers exceptionally low
background noise and unmatched
sensitivity – at more than 1 million
counts per second for 1µg/L.
Tunable from normal to high sensitivity,
the aurora M90 is perfect for both
routine and research-grade appli-
cations – Flexibility at your fingertips.
The aurora M90 delivers industry
leading detection limit performance.
Collision/reaction interface (CRI)
technology makes setup of complex
cell systems a thing of the past.
Simply turn on the gas flow to remove
interferences. It’s that simple.
Featuring the only all-digital ICP-MS
detector, covering more than nine
decades of dynamic range in pulse
counting mode, the aurora M90
delivers fast and accurate multi-
element analysis from ultra-trace to
major levels in a single measurement.
Let Bruker Quantum work for you
If your goal is to spend less time
creating methods and optimising
conditions, and more time running
samples, Bruker Quantum software
delivers. Enjoy accurate results in less
time with an intuitive yet flexible user
interface that takes the hard work out
of ICP-MS.
With auto-tuning of all instrument
parameters, you can spend less time
on instrument setup and more time on
sample analysis. Saving you valuable
time and money.
Fully automated, aerosol dilution
extends the high dissolved solids
tolerance of your ICP-MS allowing you
to directly analyze challenging samples
without additional sample preparation.

Patented 90 degree ion mirror and low
noise double off-axis quadrupole
provide industry leading sensitivity
and background for lowest detection
limits.
New and improved Collision Reaction
Interface (CRI II) provides even simpler
and more effective removal of trouble–
some interferences for interference-
free analysis of your samples.
Robust, high-efficiency plasma system
and patented Interlaced Coils break
down your toughest sample matrices,
reduce matrix effects, and minimize ion
energy spread for maximum sensitivity
and stability.
All-digital extended range detector –
means fewer dilutions, and longer
detector lifetime for greater productivity
and lower running costs.
Innovation you can trust
Low noise quadrupole
with curved fringe rods*
for ultimate efficiency and
low background. * US
Patent 6,762,407 B2
Interlaced plasma coils provide
exceptional plasma stability.
* US Patent 5,194,731
The ion mirror* reflects
the ion beam through 90
degrees, focusing the
analyte ions into the qua-
drupole with the highest
possible efficiency.
By keeping photons
and neutrals away from
the mass analyzer, the
ion mirror greatly reduces
background signal.
*US Patent 6,614,021 B2
The aurora M90 CRI II*
provides faster, more
flexible, interference-free
analysis.
*US Patent 7,329,863 B2
Our 90 Degree Reflecting Ion Optics Revolutionizes ICP-MS Performance
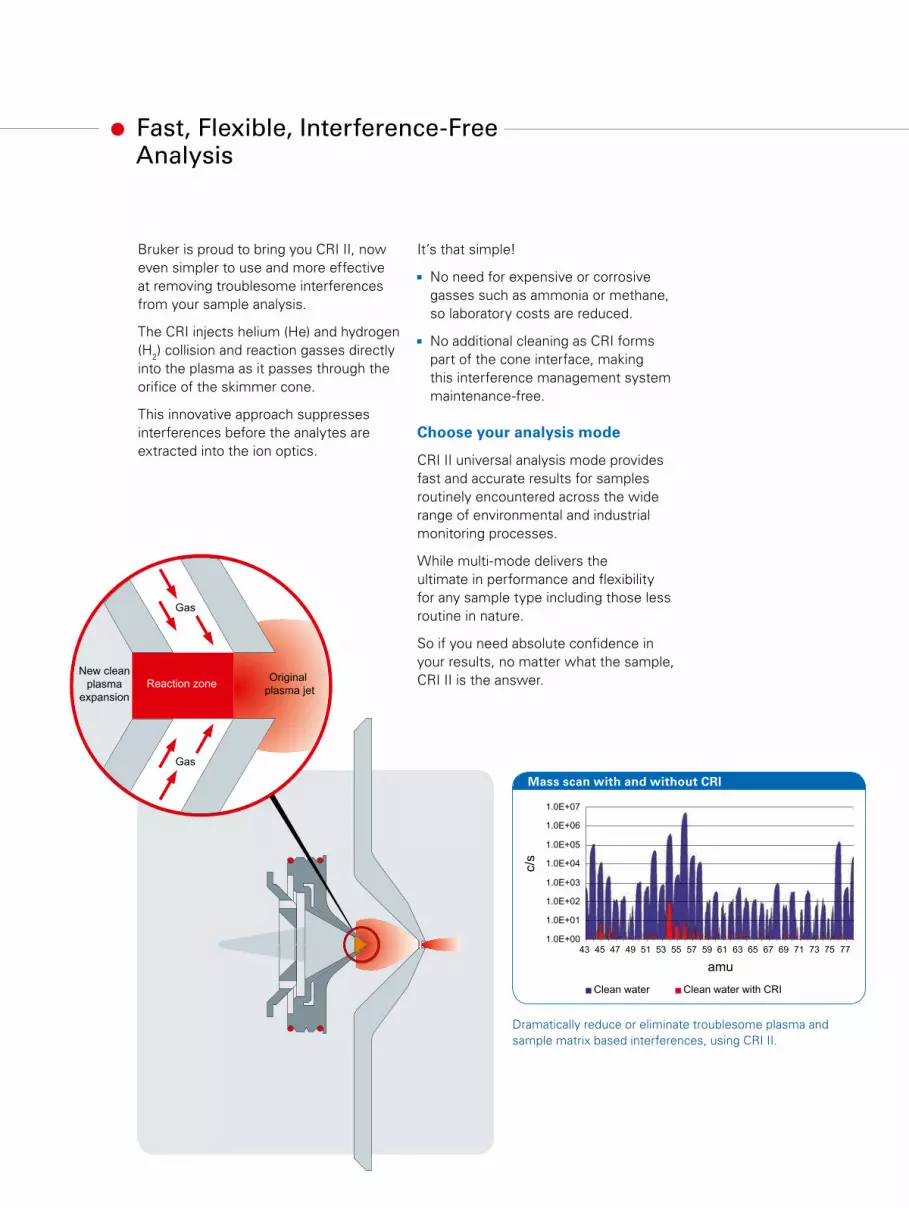
Fast, Flexible, Interference-Free Analysis
It’s that simple!
No need for expensive or corrosive
gasses such as ammonia or methane,
so laboratory costs are reduced.
No additional cleaning as CRI forms
part of the cone interface, making
this interference management system
maintenance-free.
Choose your analysis mode
CRI II universal analysis mode provides
fast and accurate results for samples
routinely encountered across the wide
range of environmental and industrial
monitoring processes.
While multi-mode delivers the
ultimate in performance and flexibility
for any sample type including those less
routine in nature.
So if you need absolute confidence in
your results, no matter what the sample,
CRI II is the answer.
Bruker is proud to bring you CRI II, now
even simpler to use and more effective
at removing troublesome interferences
from your sample analysis.
The CRI injects helium (He) and hydrogen
(H2) collision and reaction gasses directly
into the plasma as it passes through the
orifice of the skimmer cone.
This innovative approach suppresses
interferences before the analytes are
extracted into the ion optics.
Dramatically reduce or eliminate troublesome plasma and
sample matrix based interferences, using CRI II.
Mass scan with and without CRI
1.0E+00
1.0E+01
1.0E+02
1.0E+03
1.0E+04
1.0E+05
1.0E+06
1.0E+07
43 45 47 49 51 53 55 57 59 61 63 65 67 69 71 73 75 77
Clean water Clean water with CRI
amu
c/s
Original
plasma jet
New clean
plasma
expansion
Reaction zone
Gas
Gas

The solution to your application needs
A range of autosampler and produc-
tivity-enhancing accessories provide
you with fast, unattended operation of
your ICP-MS.
The nitrox 500 accessory allows online
addition of nitrogen or oxygen gas
to the plasma. Add nitrogen to lower
your detection limits on key elements
like As and Se. Add oxygen for routine
analysis of organic solvents.
Fully-integrated speciation options for
the analyst wanting to know more
about their samples.
The aurora M90 is compatible with
a wide range of laser ablation
systems providing you with solution-
free analysis.
With a vast range of options to choose
from, Bruker has the solution to your
application. Choose from
CRI II for fast, accurate interference-
free analysis of your samples.
High sensitivity interface. Ideal for
research applications on non-interfered
isotopes, pushing your detection
capability to levels never seen before.
Make simple work of your most chal-
lenging samples. Upgrade to the inert
vacuum pump system for low
maintenance, high performance
ICP-MS operation.
Clean room package is suited to
applications in the semiconductor
industry and provides an inert and
contamination-free environment for
ultra-trace analysis.
Application-specific sample introduc-
tion systems for routine analysis
of geochemical and petrochemical
samples.
Clean room package helps
semiconductor labs attain
clean room conditions for
ultra-trace analysis.
All PFA sample introduction
kits allow direct analysis of
samples containing free HF
acid.
Fully-integrated HPLC
interface makes light
work of speciation
applications.
Boost the performance
of your aurora M90 by
adding the nitrox 500.
Choose from a
range of accesso-
ries to meet your
sample handling
requirements.
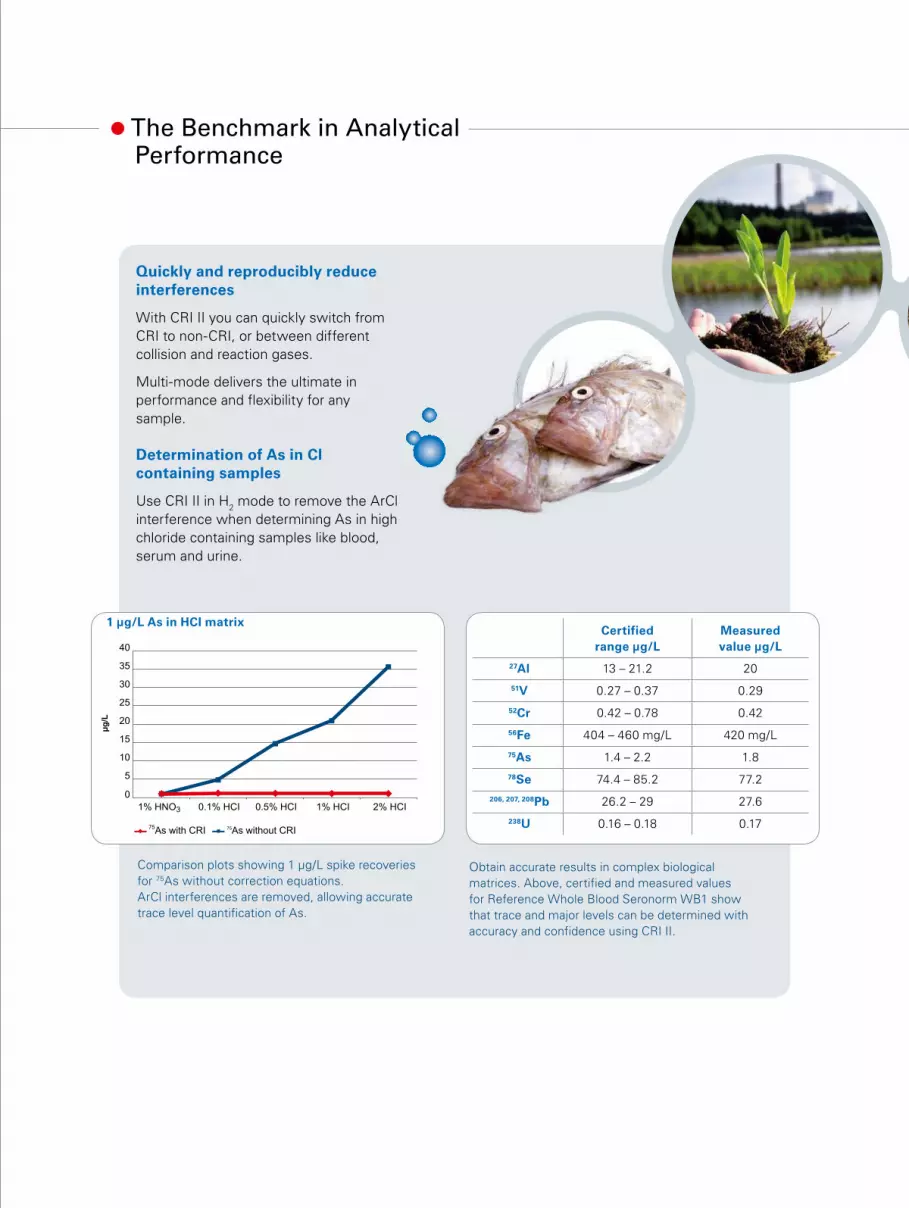
Comparison plots showing 1 µg/L spike recoveries
for 75As without correction equations.
ArCl interferences are removed, allowing accurate
trace level quantification of As.
Quickly and reproducibly reduceinterferences
With CRI II you can quickly switch from
CRI to non-CRI, or between different
collision and reaction gases.
Multi-mode delivers the ultimate in
performance and flexibility for any
sample.
Determination of As in Cl containing samples
Use CRI II in H2 mode to remove the ArCl
interference when determining As in high
chloride containing samples like blood,
serum and urine.
The Benchmark in Analytical Performance
1 µg/L As in HCI matrix
0
5
10
15
20
25
30
35
40
75As with CRI 75As without CRI
µg
/L
1% HNO3 0.1% HCI 0.5% HCI 1% HCI 2% HCI
Obtain accurate results in complex biological
matrices. Above, certified and measured values
for Reference Whole Blood Seronorm WB1 show
that trace and major levels can be determined with
accuracy and confidence using CRI II.
Certified
range µg/L
Measured
value µg/L
27Al 13 – 21.2 20
51V 0.27 – 0.37 0.29
52Cr 0.42 – 0.78 0.42
56Fe 404 – 460 mg/L 420 mg/L
75As 1.4 – 2.2 1.8
78Se 74.4 – 85.2 77.2
206, 207, 208Pb 26.2 – 29 27.6
238U 0.16 – 0.18 0.17
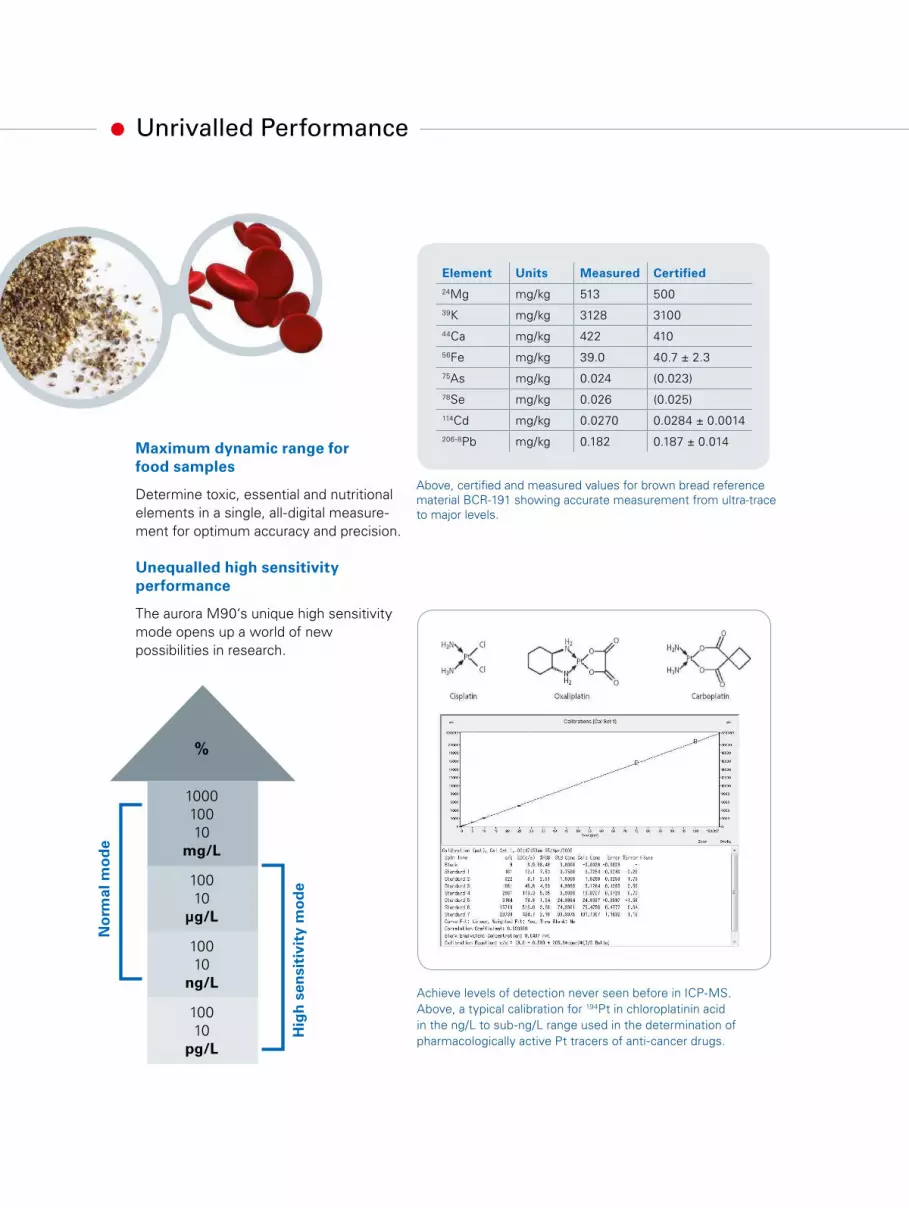
Maximum dynamic range for food samples
Determine toxic, essential and nutritional
elements in a single, all-digital measure-
ment for optimum accuracy and precision.
Unequalled high sensitivity performance
The aurora M90‘s unique high sensitivity
mode opens up a world of new
possibilities in research.
Unrivalled Performance
Achieve levels of detection never seen before in ICP-MS.
Above, a typical calibration for 194Pt in chloroplatinin acid
in the ng/L to sub-ng/L range used in the determination of
pharmacologically active Pt tracers of anti-cancer drugs.
Element Units Measured Certified
24Mg mg/kg 513 500
39K mg/kg 3128 3100
44Ca mg/kg 422 410
56Fe mg/kg 39.0 40.7 ± 2.3
75As mg/kg 0.024 (0.023)
78Se mg/kg 0.026 (0.025)
114Cd mg/kg 0.0270 0.0284 ± 0.0014
206-8Pb mg/kg 0.182 0.187 ± 0.014
Above, certified and measured values for brown bread reference
material BCR-191 showing accurate measurement from ultra-trace
to major levels.
%
1000
100
10
mg/L
Hig
h s
en
sit
ivit
y m
od
e
No
rma
l m
od
e
100
10
µg/L
100
10
ng/L
100
10
pg/L
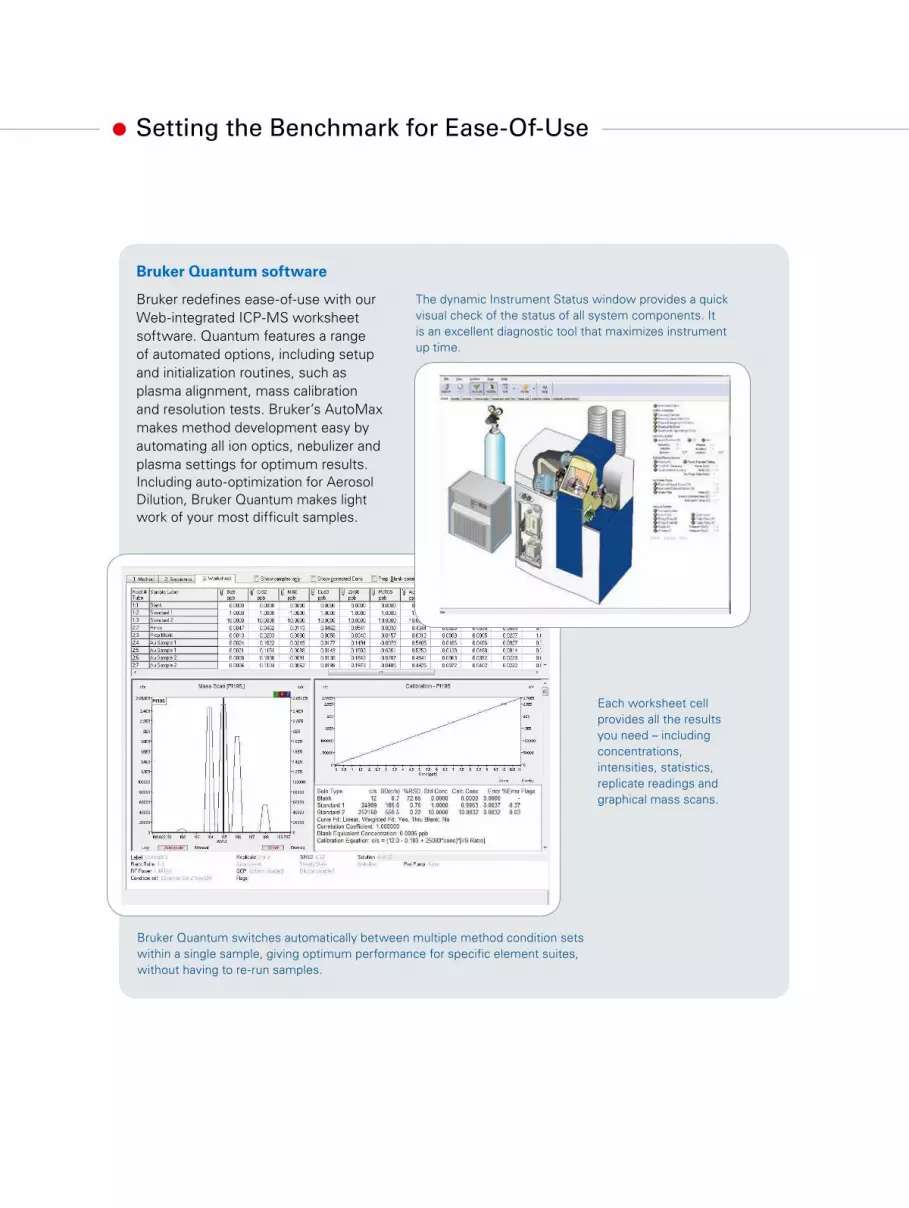
Setting the Benchmark for Ease-Of-Use
Bruker Quantum software
Bruker redefines ease-of-use with our
Web-integrated ICP-MS worksheet
software. Quantum features a range
of automated options, including setup
and initialization routines, such as
plasma alignment, mass calibration
and resolution tests. Bruker’s AutoMax
makes method development easy by
automating all ion optics, nebulizer and
plasma settings for optimum results.
Including auto-optimization for Aerosol
Dilution, Bruker Quantum makes light
work of your most difficult samples.
The dynamic Instrument Status window provides a quick
visual check of the status of all system components. It
is an excellent diagnostic tool that maximizes instrument
up time.
Each worksheet cell
provides all the results
you need – including
concentrations,
intensities, statistics,
replicate readings and
graphical mass scans.
Bruker Quantum switches automatically between multiple method condition sets
within a single sample, giving optimum performance for specific element suites,
without having to re-run samples.
Chemical Analysis Solutions
Bru
ke
r D
alt
on
ics is c
on
tin
ually im
pro
vin
g its
pro
du
cts
an
d r
ese
rve
s t
he r
igh
t
to c
han
ge s
pe
cif
icati
on
s w
ith
ou
t n
oti
ce
. ©
BD
AL 0
3-2
011, #
CA
-27
010
2
Laboratory gas chromatography systems
The 400 Series consists of two gas chromatographs and an
associated range of analyzers and solutions designed for leading
applications. These systems allow chemists and engineers to employ
standard methods and/or high quality trace sample analysis, in the
petrochemical, agrochemical and environmental industries.
The 450-GC is a highly affordable and powerful analytical instrument
that offers robust operation in an easy-to-use package. The system
gives users a broad choice of injectors, detectors, switching and
sampling valves up to three channels. The high resolution color touch
screen is intuitive and supports local languages. The Bruker 430-GC
offers the same outstanding performance as the 450-GC but in a
compact, single channel package that occupies about half the bench
space of conventional multi-channel GC.
Triple quadrupole mass spectrometer
The Bruker 320-MS GC/MS stands at the forefront of configurable
triple-quadrupole mass spectrometer systems. It offers: femtogram
sensitivity, 10 – 2000 Da mass range, and a wide array of
chromatographic and ionization configurations to uniquely
match your needs - all in less than 72 cm. (28 in.) of linear
bench space! In minutes, the 320-MS can be changed
from EI to CI modes of operation. Easily,
the 320-MS is the most sensitive,
robust, and flexible triple-quadrupole
MS system currently available.
For research use only.
Not for use in diagnostic procedures.
Bruker Daltonik GmbH
Bremen · Germany
Phone +49 (0)421-2205-0
Fax +49 (0)421-2205-103
Bruker Daltonics Inc.
Billerica, MA · USA
Phone +1 (978) 663-3660
Fax +1 (978) 667-5993
www.bruker.com/chemicalanalysis

Innovation with IntegrityUHR-TOF MS
Maximum Impact – Definitive Answers
impact

Redefining Accurate Mass LC-MS/MS
Until now, mass spectrometry technologies have
forced scientists to choose between performance
characteristics for a given application. Often, a
system is designed for qualitative work, sacrificing
quantitation performance in the process.
There is no need to make compromises in mass
spectrometry anymore. The maXis impact™
sets a new technology standard where industry
leading performance values are all simultaneously
available in a single acquisition at full sensitivity.
Powered by a series of patented technology
innovations, the maXis impact simply provides the
very best results without compromise in a cost
effective, benchtop format.
maXis impact: Qualitative and Quantitative results from a single LC/MS analysis
Sub-ppm mass accuracy and 40,000 full sensitivity resolution
Extreme sensitivity across the entire mass
range from very small molecules to intact proteins
High speed MS/MS capability with full U-HPLC compatibility
Simultaneous analysis of major and trace sample components
Isotopic fidelity for definitive molecular formulae determination
Robust and easy to operate system
And all in an economical and compact design!

Refining capabilities across the analytical world
With it’s unique capabilities, the maXis
impact liberates your work from restriction
and compromise. Whether the need is for
small or large molecule analysis, quantita-
tion or molecular identification, the maXis
impact is more than capable of providing the
results needed to make decisions first time,
every time.
Let the maXis impact achieve your goals in:
Forensics, toxicology & doping control
Food & environmental testing
Synthetic chemistry support
Drug metabolite and impurity identification
and quantitation
Metabolomics
Intact protein analysis & characterization
of biophamaceuticals
Biomarker discovery & validation
The only no-compromise full sensitivity and full resolution UHR-TOF on the market
A game changing step forwards in TOF
technology featuring nine new patents.
The maXis impact is powered by a
number of outstanding technology
innovations including:
Unique Full Sensitivity Resolution
(FSR) technology in all modes
Proven Bruker UHR-TOF
technology in bench-top format
New broadband transmission CID cell
providing ground-breaking sensitivity
Fast 4 G sample/sec digitizer enabling
data acquisition at up to 50 Hz
Long life FLASH Detector
Flexible choice of API sources
including new CaptiveSprayTM and
solid sample (DIP) and GC inlets
Unparalleled Performance Now in a Bench-top Package
Flight Tube
with in-flight focussing for
full sensitivity resolution
Long Life
Flash Detector
High Transmission
CID Cell
Quadrupole
Patented Dual
Ion Funnel
ESI Source
Dual Stage
Reflector
Qualitative and quantitative results from a single auto MS/MS run
One-Shot Certainty for Qual/Quant Analysis
MS of Buspiron acquired at 1Hz up to 50 Hz spectra to disk.
Resolution and spectral accuracy maintained even at maximum speed
1. TIC from complex sample (60 pesticides spiked into ginger extract (QuEChERS)).
2. High resolution extracted ion chromatogram (hrXIC) of m/z 223.0745 with 5mDa
discrimination width (Acetamiprid).
3. Magnified LC peak. High speed acquisition rate in MS and MS/MS mode (MS: 100ms,
MS/MS: 20ms spectra time). 100 data points across this LC peak allows precise quantitation.
4. High resolution survey MS with m/z 223.0745 selected as precursor.
5. High spectral accuracy means isotopic fidelity for identification certainty.
6. High sensitivity MS/MS spectrum even at very low MW (56.0498 m/z) for confirmation
by fragment information.
4 5 6 7 8 Time [min]0
1
2
3
4
5
6x10Intens.
4 5 6 7 8 Time [min]0
1
2
3
4
4x10
Intens.
1
2
4
4.95 5.00 5.05 5.10 5.15 5.20 5.25 5.30 Time [min]0
1
2
3
4
4x10
Intens.
81.0694
100.0754109.1008
123.1161
135.1160
153.1271
167.1056185.1172
196.1697
253.1801
223.0750
8. +MS, 4.99-5.16min #2324-2422
0
20
40
60
80
100
Intens.
[%]
25 50 75 100 125 150 175 200 225 250 m/z
56.0498
126.0110
167.1066
223.0745
8. +MS2(223.0750), 20.0eV, 4.99-5.16min #2325-2425
0
20
40
60
80
100
Intens.
[%]
25 50 75 100 125 150 175 200 225 250 m/z
5
Ultra fast acquisition speed up to 50 Hz
TIC
hrXIC
hrXIC
100 data points
MS and MS/MS
MS
MS/MS
Isotopes
6
maXis impact captures the full picture of
your sample in one analysis alleviating
the need for multiple runs. More than
4 orders of fundamental dynamic range
achieved without artificial compensators
allows simultaneous measurement of
major and trace sample components in a
single analysis - even if coeluent.386.2551
1+
387.25791+
386.0 386.5 387.0 387.5 388.0 388.5 m/z
386.25521+
387.25781+
386.25481+
387.25781+
386.25521+
387.25761+
386.25491+
387.25781+
386.25481+
387.25821+
386.25501+
387.25841+
386.25531+
387.25841+
386.25481+
387.25741+
386.25481+
387.25751+
386.25521+
387.25691+
386.25511+
387.25791+
386.0 386.5 387.0 387.5 388.0 388.5 m/z
386.25511+
387.25791+
386.0 386.5 387.0 387.5 388.0 388.5 m/z
386.25521+
387.25781+
386.25521+
387.25781+
386.25481+
387.25781+
386.25481+
387.25781+
386.25521+
387.25761+
386.25521+
387.25761+
386.25491+
387.25781+
386.25491+
387.25781+
386.25481+
387.25821+
386.25481+
387.25821+
386.25501+
387.25841+
386.25501+
387.25841+
386.25531+
387.25841+
386.25531+
387.25841+
386.25481+
387.25741+
386.25481+
387.25741+
386.25481+
387.25751+
386.25481+
387.25751+
386.25521+
387.25691+
386.25521+
387.25691+
50Hz45Hz
40Hz35Hz
30Hz25Hz
20Hz15Hz
10Hz5Hz
1Hz
Mass accuracy beter than 1ppm
Resoluion 25k-30kMass accuracy better than 1ppm
Resolution 25k-30k
Buspirone MS/MS linearity
y = 41323x + 55197
R2 = 0.9994
0.0E+00
5.0E+06
1.0E+07
1.5E+07
2.0E+07
0 50 100 150 200 250 300 350 400 450 500
conc [ppb]
Are
a
LOD = 0.05 ppb (100 fg absolute on column)
LOD = 0.05 ppb (100 fg
absolute on column)
0.05 to 500 ppb
matrix background
5 mDa selectivity
zoomed hrXIC3
4

Triple quad sensitivity and quantitation with high-res, accurate mass
Fluoxastrobin (m/z 459) has been quantified over 4 orders of magnitude in
concentration from 1ng down to 50fg. The linearity is R=0.9996 with an ultra low
LOD coupled with accurate mass certainty.
2 mDa high resolution XIC from 200 pesticides. Each color represents the hrXIC
of one pesticide. Sample at a concentration of 50 ppb each separated with
U- HPLC maXis impact.
Multi-target screening at 2mDa hrXIC selectivity
The maXis impact encapsulates the
capabilities of low fg range sensitivity
with more than four orders of magnitude
dynamic range and quantitative capacity
along with the performance of an
exceptional high resolution accurate
mass instrument. The simultaneous
combination of attributes is ideal for
many discovery, development, screening
and drug metabolism applications which
often require both the identification and
quantitation of sample components
that vary widely in both structure and
concentration.
Excellent for use in the analysis of both
known and unknown compounds, the
maXis impact represents a new level of
achievement in the challenge to provide
one step qualitative and quantitative data
in a single rapid analysis.
Mix200_50ppb_GB3_05_997.d
0.0
0.5
1.0
1.5
2.0
2.5
5x10
Intens.
0 2 4 6 8 10 12 Time [min]
Amitrole, [M+H]+, m/z 85
Avermecin,
[M+NH4]+, m/z 890Oxamyl,
Fragment m/z 72 Spinosad A,
[M+H]+, m/z 732
EIC width 2 mDa
Ideally suited for broad band multi-target screening
Resolve and identify multiple compounds
from extremely complex mixtures
across a wide mass range even at low
analyte concentrations. With these
key performance attributes, the maXis
impact is an ideal fit for rapid, high target
number screening tasks such as food
testing or forensic analysis.
For the laboratory challenged with rapid
response to novel analytes, retrospective
in-silico screening of complete datasets
using TargetAnalysisTM software makes
maXis impact the most agile screening
tool available.
4 orders of magnitude
Precisely Targeted Small Molecule Analysis
2
9.00 9.25 9.50 9.75 10.00 10.25 10.50 10.75 11.00 Time [min]
0
50
100
150
Intens.
50 fg
Very low LOD

Compound identification and structure confirmationImpacting Metabolomics results
A key bottleneck in metabolomics
research is structural confirmation and
elucidation of metabolites. Diterpene
glycosides (DTGs) are abundant plant
defence compounds with largely
unknown modes of action. Outstanding
MS and MS/MS data for Nicotiana
attenuata (tobacco) DTGs acquired
on a maXis impact enabled the rapid
identification of the entire compound
family. To achieve this, the fragmentation
results are visualized and interpreted
using Bruker´s novel FragmentExplorerTM.
The FragmentExplorer has been
especially designed for faster inter-
pretation of MS/MS data.
It provides an interactive link between
SmartFormula 3DTM results, mass
spectra and molecular structures.
Small Molecule ID & Structure Elucidation
271.24221+
395.11811+
537.30571+
683.36351+
949.42781+
+MS2(949.4275)
0.00
0.25
0.50
0.75
1.00
200 300 400 500 600 700 800 900 m/z
O
O
HO
OH
O
O
O
O
OH
O
O
HO
OH
O
HO
HO
OH
O
O
OO
HO
271.2420
359.0973
395.1184
417.2999
479.1031
497.1137
519.2952
537.3058
607.1505
625.1611
643.1716
661.1822
683.3637
949.4275
C 20 H 31 , -0.2 mDa,
C 2
0 H
33 O
1 , -
0.1
5 m
Da,
C 1
5 H
19 O
10 , 0
.25 m
Da,
C 1
5 H
21 O
11 , 0
.061 m
Da,
C 1
5 H
23 O
12 , 0
.32 m
Da,
C 2
6 H
39 O
3 , 0
.13 m
Da,
C 1
5 H
25 O
13 , 0
.35 m
Da,
C 2
6 H
41 O
4 , 0
.1 m
Da,
C 1
8 H
23 O
15 , 0
.37 m
Da,
C 1
8 H
25 O
16 , 0
.41 m
Da,
C 2
9 H
43 O
8 , 0
.31 m
Da,
C 2
9 H
45 O
9 , 0
.16 m
Da,
C 2
4 H
31 O
18 , 0
.48 m
Da,
C 2
4 H
33 O
19 , 0
.45 m
Da,
C 2
4 H
35 O
20 , 0
.33 m
Da,
C 2
4 H
37 O
21 , 0
.25 m
Da,
C 2
4 H
39 O
22 , 0
.38 m
Da,
C 35 H 55 O 13 , 0.27 mDa,
C 4
4 H
69 O
22 , 0
.81 m
Da,
0.0
0.2
0.4
0.6
0.8
1.0
1.2
5x10
Intens.
300 400 500 600 700 800 900 m/z
SmartFormula3DTM co-developed with Pfizer,
utilizes maXis impact high isotopic fidelity
in MS and MS/MS in a unique relational
algorythm to assign molecular formulae of
unknown analytes without prior knowledge or
assumptions.
FragmentExplorer with embedded ChemDraw expertly assists
fragment assignments.
SmartFormula3D
Fragment Explorer
Identification over a dynamic range of 4 decades of concentration from complex samples
Biomarker Discovery and Validation
In-depth qualitative analysis of complex proteomics samples
LC auto MS/MS survey. The human cell line HT29 is an established model
system to study colon cancer progression. A 1 µg digest of HT29 cells was
separated on a RSLCnano system (3 h gradient, 25 cm column) and measured
on a maXis impact with a captive spray source.
Get full performance first time, every time
The CaptiveSpray is a revolutionary
LC-MS source that combines the
sensitivity of nanospray with the ease
of use and robustness of electrospray.
CaptiveSpray utilizes patented techno-
logy to capture and sweep sample ions
into the MS independent of LC flow rate.
1.1 pmol
110 fmol
11 fmol
1.1 fmol
CaptiveSpray LC-MS source
4 decades of concentration
Plot of all peptides from a digest of
200ng E.coli
Real-life MS mass accuracy
ID more than 1500 proteins with FDR <1%
Sigma UPS-2 standard sample
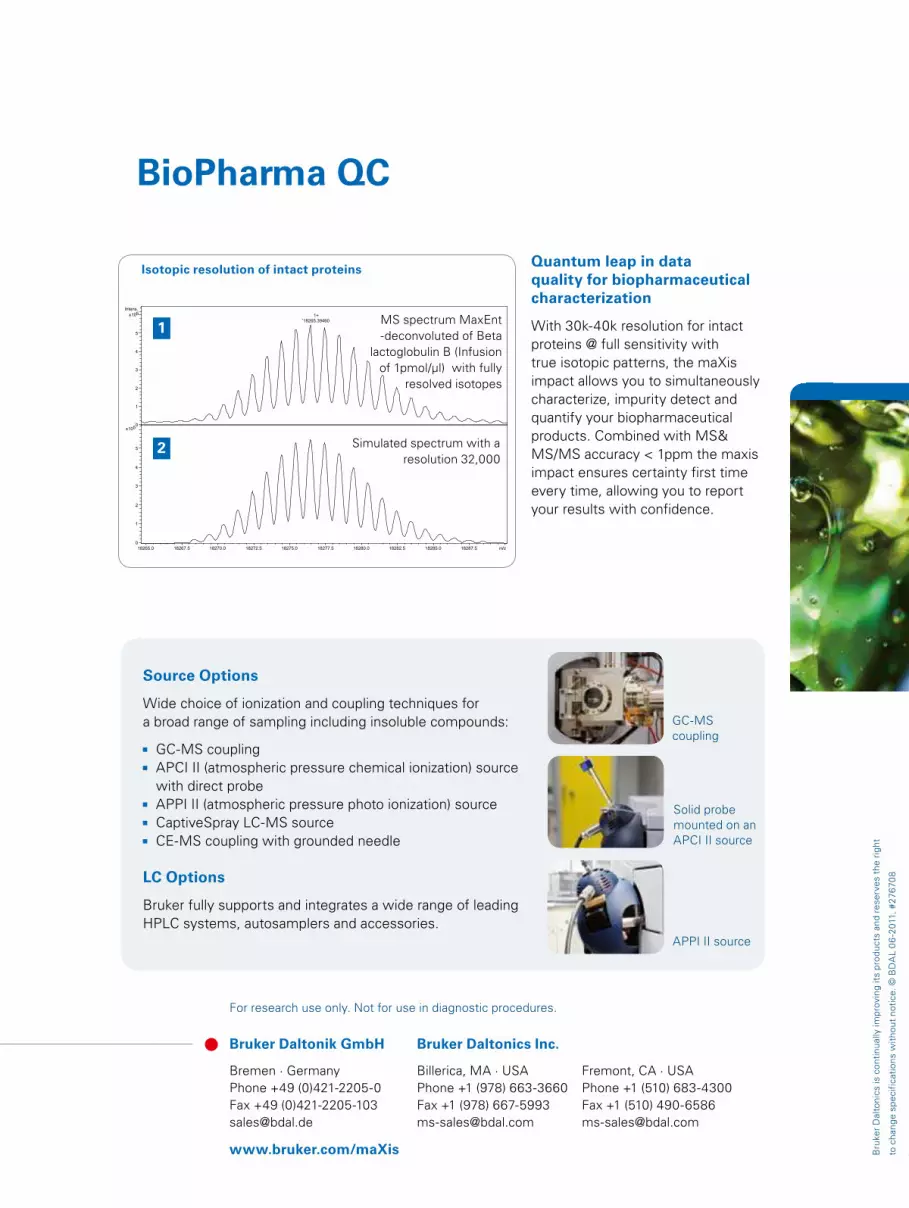
BioPharma QC
Bru
ke
r D
alt
on
ics is c
on
tin
ually im
pro
vin
g its
pro
du
cts
an
d r
ese
rve
s t
he r
igh
t
to c
han
ge s
pe
cif
icati
on
s w
ith
ou
t n
oti
ce
. ©
BD
AL 0
6-2
011, #
27
67
08
Bruker Daltonik GmbH
Bremen · Germany
Phone +49 (0)421-2205-0
Fax +49 (0)421-2205-103
Bruker Daltonics Inc.
Billerica, MA · USA Fremont, CA · USA
Phone +1 (978) 663-3660 Phone +1 (510) 683-4300
Fax +1 (978) 667-5993 Fax +1 (510) 490-6586
[email protected] [email protected]
www.bruker.com/maXis
Source Options
Wide choice of ionization and coupling techniques for
a broad range of sampling including insoluble compounds:
GC-MS coupling
APCI II (atmospheric pressure chemical ionization) source
with direct probe
APPI II (atmospheric pressure photo ionization) source
CaptiveSpray LC-MS source
CE-MS coupling with grounded needle
LC Options
Bruker fully supports and integrates a wide range of leading
HPLC systems, autosamplers and accessories.
GC-MS
coupling
Solid probe
mounted on an
APCI II source
APPI II source
Quantum leap in data quality for biopharmaceutical characterization
With 30k-40k resolution for intact
proteins @ full sensitivity with
true isotopic patterns, the maXis
impact allows you to simultaneously
characterize, impurity detect and
quantify your biopharmaceutical
products. Combined with MS&
MS/MS accuracy < 1ppm the maxis
impact ensures certainty first time
every time, allowing you to report
your results with confidence.
Isotopic resolution of intact proteins
'18265.39460
1++MS, 4.2-7.5min, Deconvoluted (MaxEnt)
C817H1311N206O248S9, M+nH ,18265.390
1
2
3
4
5
5x10
Intens.
0
1
2
3
4
5
5x10
18265.0 18267.5 18270.0 18272.5 18275.0 18277.5 18280.0 18282.5 18285.0 18287.5 m/z
32,000 Resoluion
Beta lactoglobulin B,
(1pmol/µl infusion)1
2 Simulated spectrum with a
resolution 32,000
MS spectrum MaxEnt
-deconvoluted of Beta
lactoglobulin B (Infusion
of 1pmol/µl) with fully
resolved isotopes
For research use only. Not for use in diagnostic procedures.

LC-MSInnovation with Integrity
A complete multi-residue solution for pesticide
screening using high resolution full scan
accurate mass data
PesticideScreener™
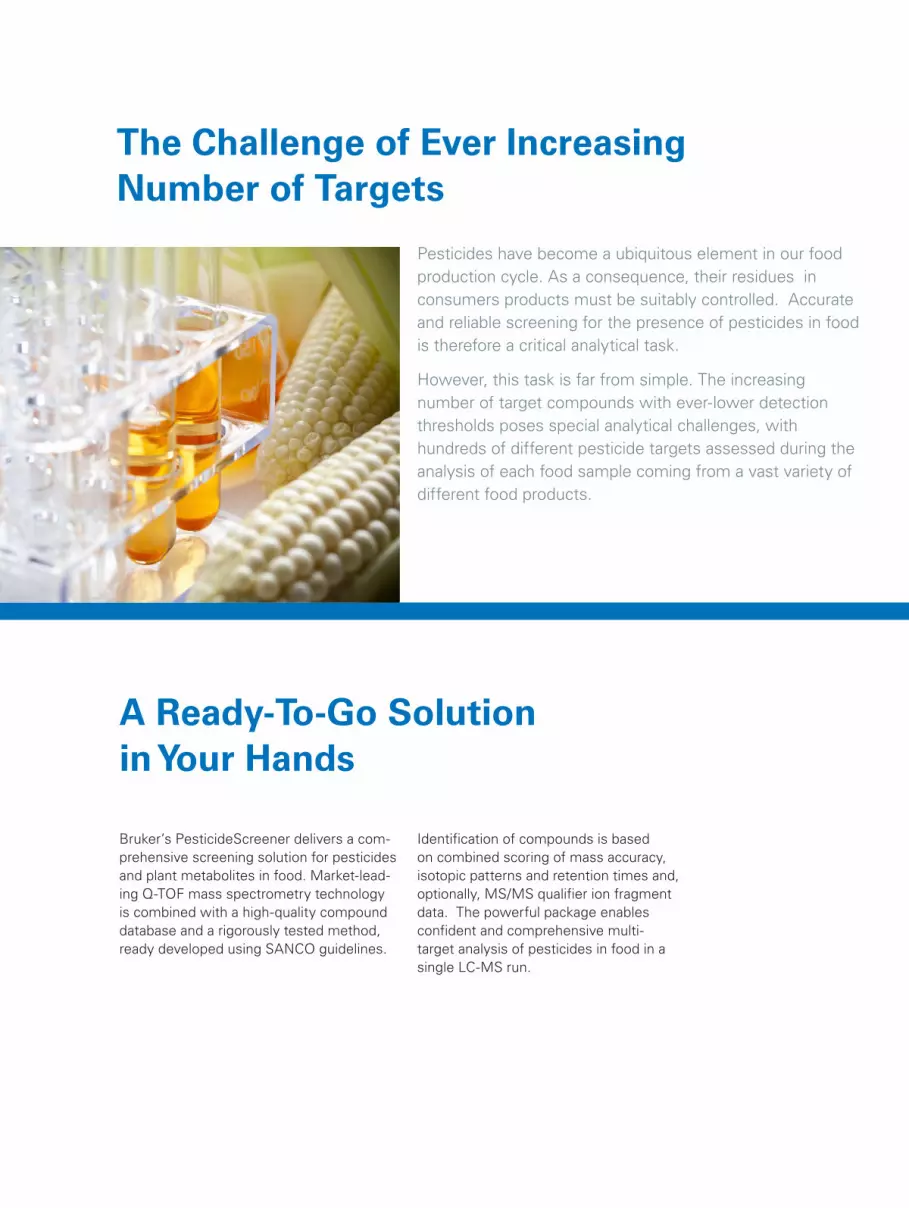
Pesticides have become a ubiquitous element in our food
production cycle. As a consequence, their residues in
consumers products must be suitably controlled. Accurate
and reliable screening for the presence of pesticides in food
is therefore a critical analytical task.
However, this task is far from simple. The increasing
number of target compounds with ever-lower detection
thresholds poses special analytical challenges, with
hundreds of different pesticide targets assessed during the
analysis of each food sample coming from a vast variety of
different food products.
The Challenge of Ever Increasing
Number of Targets
A Ready-To-Go Solution
in Your Hands
Bruker’s PesticideScreener delivers a com-
prehensive screening solution for pesticides
and plant metabolites in food. Market-lead-
ing Q-TOF mass spectrometry technology
is combined with a high-quality compound
database and a rigorously tested method,
ready developed using SANCO guidelines.
Identification of compounds is based
on combined scoring of mass accuracy,
isotopic patterns and retention times and,
optionally, MS/MS qualifier ion fragment
data. The powerful package enables
confident and comprehensive multi-
target analysis of pesticides in food in a
single LC-MS run.
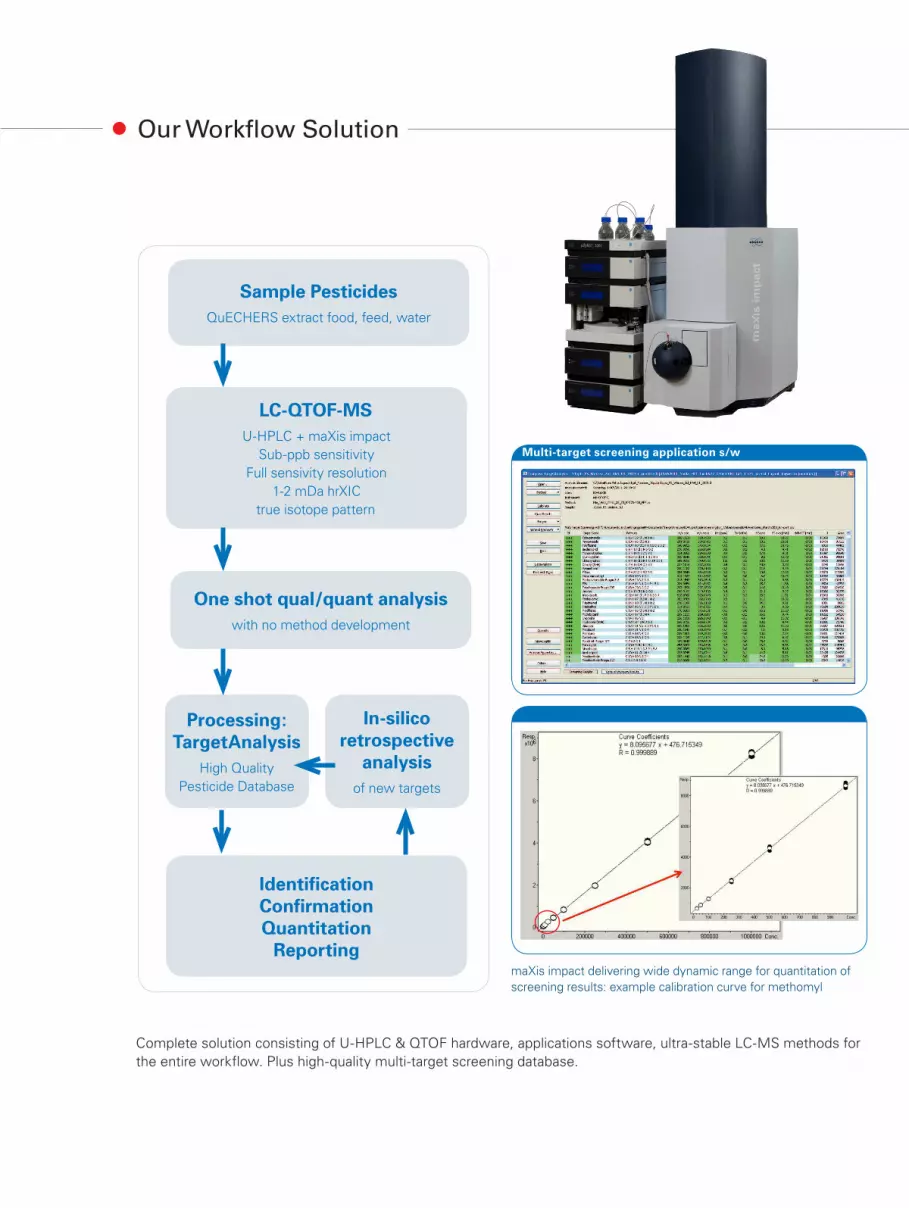
Our Workflow Solution
Sample Pesticides
QuECHERS extract food, feed, water
LC-QTOF-MS
U-HPLC + maXis impact
Sub-ppb sensitivity
Full sensivity resolution
1-2 mDa hrXIC
true isotope pattern
One shot qual/quant analysis
with no method development
Processing:
TargetAnalysis
High Quality
Pesticide Database
In-silico
retrospective
analysis
of new targets
Identification
Confirmation
Quantitation
Reporting
Multi-target screening application s/w
maXis impact delivering wide dynamic range for quantitation of
screening results: example calibration curve for methomyl
Complete solution consisting of U-HPLC & QTOF hardware, applications software, ultra-stable LC-MS methods for
the entire workflow. Plus high-quality multi-target screening database.

Automation & High-Quality
Database
Ready-to-go, no method development required
2
3
• At the heart of Bruker’s Pesticide
Screener is a high-quality data-
base of more than 700 target
pesticides.
• Far more than a “list of
compounds”
• Retention times for the matched
UHPLC method
• Adduct information
• Isomer information
• Fragment ions on MS data level
• Isotopic confirmation
• Qualifier ions for confirmation in
broad band MS/MS mode
• For definitive analyte detection
• Data are screened and scored
against the database information
for at-a-glance confidence
• Use qualifier ions (and their
intensity ratios) from broad band
MS/MS for enhanced confirma-
tion (++++)
• Enables fast and reliable identi-
fication of target compounds at
ppb levels, with very low false
positive rates even in complex
matrices
• Get quantitative results via
integrated link to quantitation
software
• Perform in-silico retrospective
analysis of new targets at a click
of a mouse
Processing is completely automated with TargetAnalysis
Level of confidence
Results Overview
Detailed report on bbCID qualifier ions
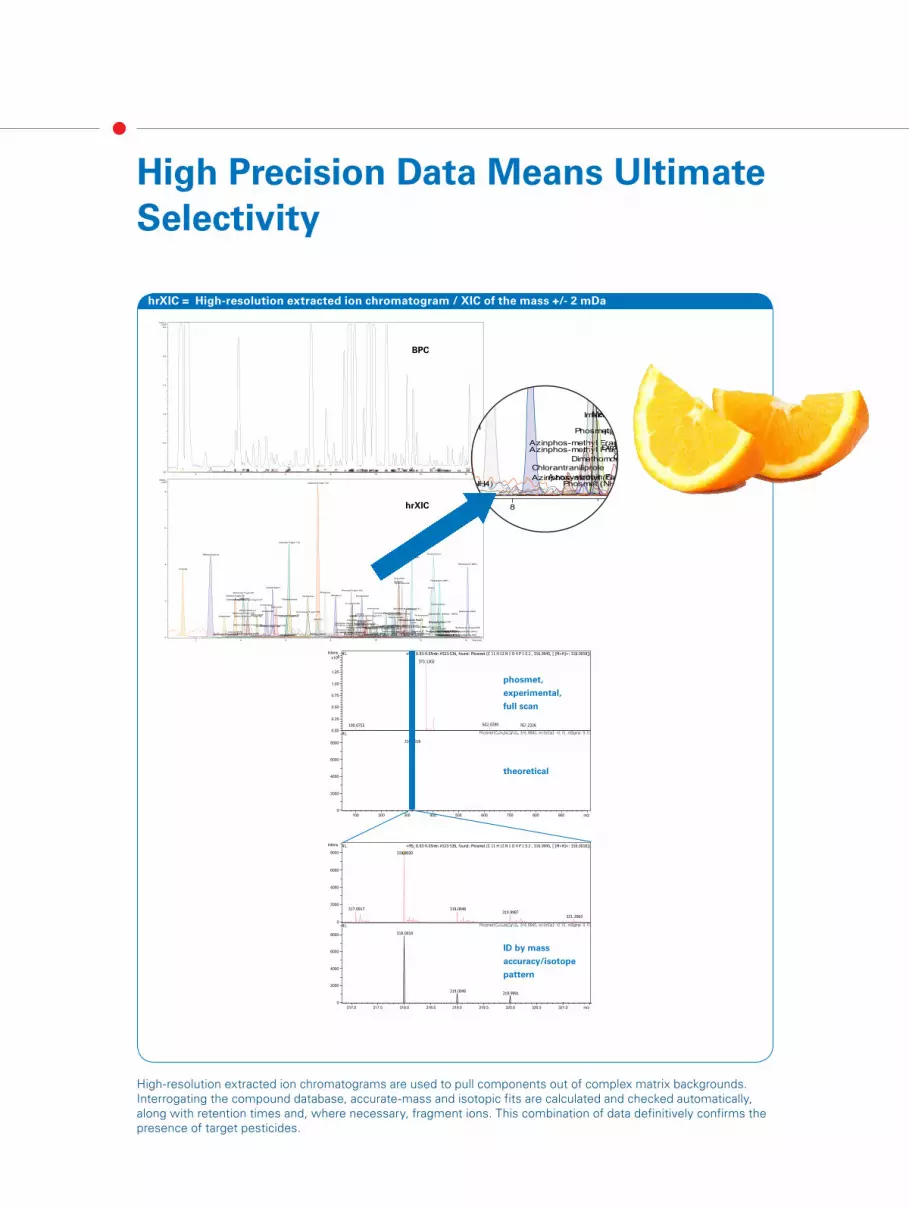
High Precision Data Means Ultimate
Selectivity
2
hrXIC = High-resolution extracted ion chromatogram / XIC of the mass +/- 2 mDa
High-resolution extracted ion chromatograms are used to pull components out of complex matrix backgrounds.
Interrogating the compound database, accurate-mass and isotopic fits are calculated and checked automatically,
along with retention times and, where necessary, fragment ions. This combination of data definitively confirms the
presence of target pesticides.
Triadimenol I Fragm 70
Triadimenol II Fragm 70
Oxamyl Fragm 72
Butocarboxim Fragm 75
Amitrole
Methomyl Fragm 88
Aldicarb Fragm 89
Oxamyl Fragm 90
Monocrotophos Fragm 98
Methomyl Fragm 106
Aldicarb Fragm 116
Monocrotophos Fragm 127
Azinphos-methyl Fragm 132
Tolyfluanid Fragm 137
Methamidophos
Carbaryl Fragm 145
Phosmet Fragm 160
Azinphos-methyl Fragm 160Carbendazim Fragm 160
Methomyl
Carbofuran Fragm 165
Chlorpropham Fragm 172
Omethoate Fragm 183Butocarboxim
Carbendazim
Monocrotophos Fragm 193Dimethoate Fragm 199 Ethion Fragm 199
Pyrimethanil
Thiabendazole
Carbaryl
Kresoxim-methyl Fragm 206
Aldicarb (NH4)
Pendimethalin Fragm 212
Omethoate
ChlorprophamOxamyl Carbaryl (NH4)
Carbofuran
Acetamiprid
Monocrotophos
Cyprodinil
Dimethoate
Propargite Fragm 231
Oxamyl (NH4) Tolyfluanid Fragm 238
Pirimicarb
Monocrotophos (NH4)
Linuron
Fludioxonil
Thiacloprid
Imidacloprid
Fludioxonil (NH4)
Metalaxyl
Pendimethalin
Penconazole
Myclobutanil
Triadimenol II
Imazalil
Tebufenozide Fragm 297
Fenhexamid
Diazinon
Quinoxyphen
Tebuconazole
Prochloraz Fragm 308
Triazophos
Kresoxim-methyl
Methoxyfenozide Fragm 313
Phosmet
Azinphos-methyl (Guthion)
Triadimenol II (Na)Chlorpyriphos-methyl
Pyriproxyfen
EPN
Kresoxim-methyl (NH4)Phosmet (NH4)
Boscalid
Tolyfluanid
Chlorpyriphos
Propargite
Tebufenozide Etofenprox Fragm 359Tolyfluanid (NH4)
Propargite (NH4)
Methoxyfenozide
Profenophos
Azoxystrobin Fragm 372
Prochloraz
Ethion
Pyraclostrobin
Dimethomorph Peak 2
Dimethomorph Peak 1
Etofenprox (NH4)
Azoxystrobin
Difenoconazole Peak 1Difenoconazole Peak 2
Trif loxystrobin
Cypermethrin II
Cypermethrin II (NH4)Cypermethrin III (NH4)
Cypermethrin II (Na)Cypermethrin III (Na)
Bifenthrin (NH4)
Cyhalothrin. lambda- (NH4)
Cyhalothrin. lambda- (Na)Chlorantraniliprole
Indoxacarb
Spinosad A (Spinosyn A) Fragm 544Indoxacarb (Na)
Spinosad D (Fragm 558)Spinosyn B or K (last of 3-4 peaks)
Spinosad A (Spinosyn A)
Spinosad D AvermectinB1a (Abamectin) (NH4)
AvermectinB1a (Abamectin) (Na)
2 4 6 8 10 12 14 Time [min]
0
2
4
6
8
4x10
Intens.
60615 24
1 9 267 1410
2815 38 73
2
34
42392111 30 563 25
2216 19 94
4929 32 6727 994 576 33311812
7720 1028 70
3513 48 51
2317 52361007458 6246 6564
76 9875 8059 68544140 63 89
96
906943 50 71 97 10366 11472101
55 9345 81 95785347
11544 8485
88
106107109108110 11310410537 8682 87 917983 92 111112
2 4 6 8 10 12 14 Time [min]
0.0
0.5
1.0
1.5
2.0
2.5
6x10
Intens.
BPC
100.0755
373.1302
622.0290 767.2326
41. +MS, 8.83-9.05min #523-536, found: Phosmet (C 11 H 12 N 1 O 4 P 1 S 2 , 316.9945, [ [M+H]+: 318.0018])
318.0018
41. Phosmet(C于于H于亞N于O₄P于S亞, 316.9945, err[mDa]: -0.15, mSigma: 9.1)0.00
0.25
0.50
0.75
1.00
1.25
6x10
Intens.
0
2000
4000
6000
8000
100 200 300 400 500 600 700 800 900 m/z
317.0917
318.0020
319.0046319.9987
321.2063
41. +MS, 8.83-9.05min #523-536, found: Phosmet (C 11 H 12 N 1 O 4 P 1 S 2 , 316.9945, [ [M+H]+: 318.0018])
318.0018
319.0046319.9991
41. Phosmet(C于于H于亞N于O₄P于S亞, 316.9945, err[mDa]: -0.15, mSigma: 9.1)0
2000
4000
6000
8000
Intens.
0
2000
4000
6000
8000
317.0 317.5 318.0 318.5 319.0 319.5 320.0 320.5 321.0 m/z
phosmet,
experimental,
full scan
theoretical
ID by mass
accuracy/isotope
pattern
hrXIC
Azinphos-methyl Fragm 1Azinphos-methyl Fragm 1
ragm 165
Chlo
Carbaryl
arbaryl (NH4)
Linuro
Flud
Fludiox
ImazalilMethoxyfe
Phosmet
Azinphos-methyl (GuthioPhosmet (NH4)
BosMeth
Azoxystrobin Fragm
Dimetho
Dimethomorph
Chlorantraniliprole
8
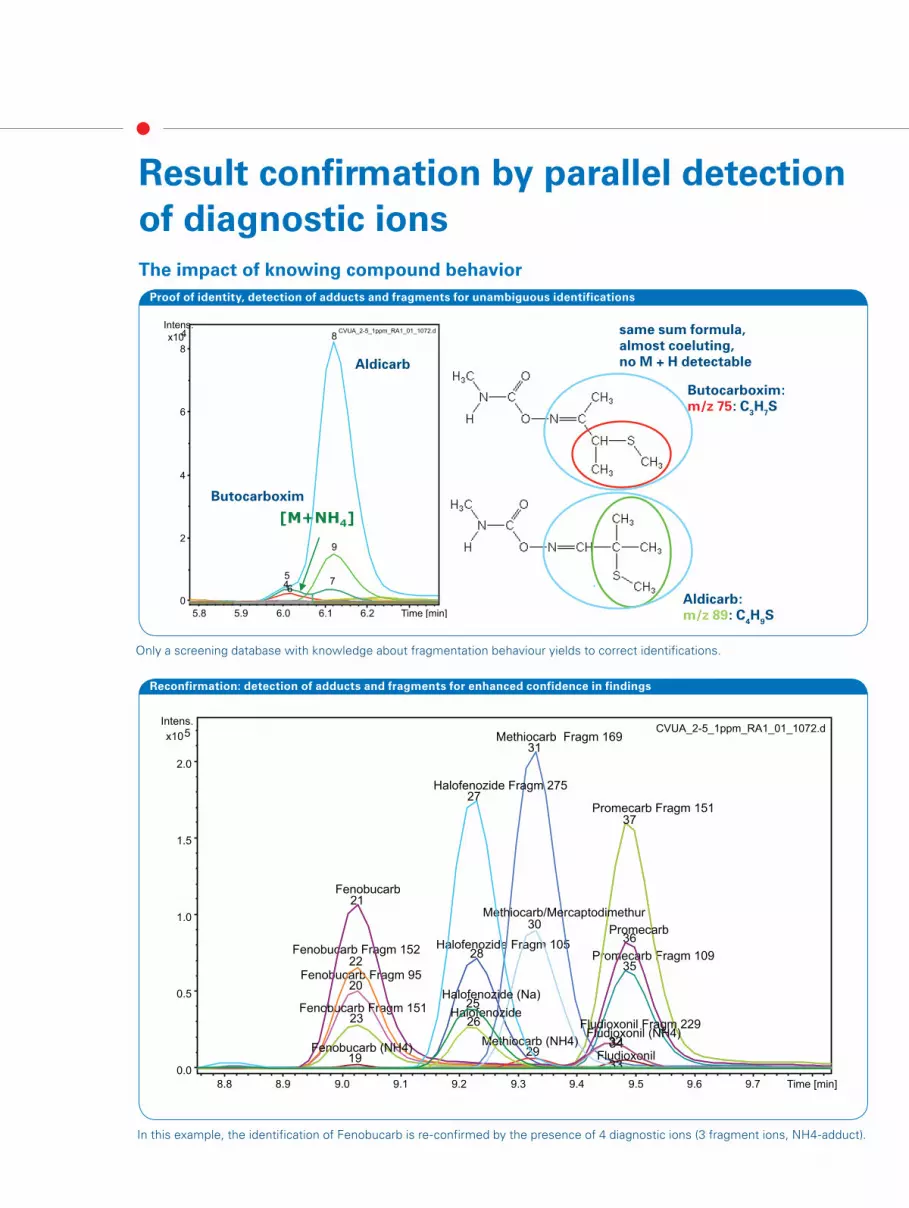
Result confirmation by parallel detection
of diagnostic ions
Proof of identity, detection of adducts and fragments for unambiguous identifications
[M+NH4]
9
8
5 7
CVUA_2-5_1ppm_RA1_01_1072.d
2
4
6
8
4 x10
Intens.
5.8 5.9 6.0 6.1 6.2 Time [min]
4 6
0
Reconfirmation: detection of adducts and fragments for enhanced confidence in findings
Fenobucarb Fragm 95 20
Halofenozide Fragm 105 28 Promecarb Fragm 109
36
Fenobucarb Fragm 151 23
Promecarb Fragm 151 37
Fenobucarb Fragm 152 22
Methiocarb Fragm 169 31
Fenobucarb 21
Promecarb
35
Fenobucarb (NH4) 19
Methiocarb/Mercaptodimethur 30
Fludioxonil Fragm 229
34 Methiocarb (NH4) 29 Fludioxonil
33
Fludioxonil (NH4) 32
Halofenozide Fragm 275 27
Halofenozide 26
Halofenozide (Na) 25
CVUA_2-5_1ppm_RA1_01_1072.d
0.0
0.5
1.0
1.5
2.0
5 x10
Intens.
8.8 8.9 9.0 9.1 9.2 9.3 9.4 9.5 9.6 9.7 Time [min]
same sum formula, almost coeluting, no M + H detectable
Aldicarb: m/z 89: C
4H
9S
Butocarboxim: m/z 75: C
3H
7S
The impact of knowing compound behavior
Only a screening database with knowledge about fragmentation behaviour yields to correct identifications.
In this example, the identification of Fenobucarb is re-confirmed by the presence of 4 diagnostic ions (3 fragment ions, NH4-adduct).
Butocarboxim
Aldicarb

+MS, found: Azoxystrobin (C 22 H 17 N 3 O 5 , 403.1168, [ [M+H]+: 404.1241])
azoxystrobin,
experimental,
full scan
345.0970
359.1130
373.1285
389.1236
403.1393
44.
0.00
0.25
0.50
0.75
1.00
1.25
5x10
Intens.
bbCID
345.0975 358.1051
373.1285
389.1237
395.1112
403.1395
372.0984 (0.5), %I 1.03344.1016 (-1.4), %I 0.23
44. +bbCID MS, 25.0eV 372.0979 (0.5), 344.1030 (-1.4), : points : 30.0
0.5
1.0
1.5
5x10
Azoxystrobin
44
10ppb_bbCID_Orange_2ul_RB4_01_2853.d
0.0
0.2
0.4
0.6
0.8
1.0
1.2
6x10
Intens.
8.0 8.5 9.0 9.5 10.0 10.5 11.0 11.5 Time [min]
XIC@ m/z403
BPC
Azoxystrobin
44
9.0
!
Why Use bbCID Fragment Ions?
Example of interference in Orange, spiked 10 ppb
Reference: SANCO/12495/2011:
Method validation and quality
control procedures for pesticide
residues analysis in food and
feed: Where an ion chromatogram
shows evidence of significant
chromatographic interference,
it must not be relied upon to
quantify or identify residues.
• In this spectrum, an interference
peak m/z 403 is masking
azoxystrobin m/z 404
• But, the CID method generates
fragments in parallel
• Each individual fragment is
identified by accurate mass,
isotope pattern and intensity ratio
• So, azoxystrobin is still
definitively identified
• The database contains qualifier
ions for species which may require
extra information
• m/z 344.1016 and m/z 372.0984 are
qualifier ions. Brackets represent
relative intensity range.
What is bbCID? Alternative acquisition of full scan data with/without fragmentation.
Highlest level of confidence:
• ID by mass accuracty, isotopic pattern and adduct information
•Confirmation by diagnostic ions and bbCID
•Very low false positive rates
Bru
ke
r D
alt
on
ics is c
on
tin
ually im
pro
vin
g its
pro
du
cts
an
d r
ese
rve
s t
he r
igh
t
to c
han
ge s
pe
cif
icati
on
s w
ith
ou
t n
oti
ce
. ©
BD
AL 0
9-2
012
, #
70
316
2
For research use only. Not for use in diagnostic procedures.
Bruker Daltonik GmbH
Bremen · Germany
Phone +49 (0)421-2205-0
Fax +49 (0)421-2205-103
Bruker Daltonics Inc.
Billerica, MA · USA Fremont, CA · USA
Phone +1 (978) 663-3660 Phone +1 (510) 683-4300
Fax +1 (978) 667-5993 Fax +1 (510) 490-6586
[email protected] [email protected]
www.bruker.com
maXis impact: Highest Performance
Benchtop Q-TOF
One, no compromise mode:
• Resolution and speed simultaneously
for coupling to high-res LC
• Full Sensitivity Resolution (FSR)
• One shot method
• Excellent sensitivity, high dynamic
range
• True Isotope Pattern (TIP): For ultimate
confidence in the molecular formula
• Extracted ion chromatograms (hrXIC)
+/- 1 mDa
Resolution
(FWHM)
Maximum Speed
(spectra/second)
MS and MS/MS
Accuracy/ppm True Isotope Pattern
confidence
maXis impact 40,000 50 0.8 PesticideScreener Solution:
• Ultimate robustness of LC methods
• System-to-system reproducibility <0.1 min RT
• Ultimate confidence in results
• Ready-to-go with methods and high quality database
Dedicated to the MostChallenging Applications
solariX, the next-generation line of
hybrid Qq-FTMS systems, is the culmination of
key technology enhancements that provide unique
capabilities in mass spectral
performance and versatility.
Superior Sensitivity
Unmatched Mass Accuracy and Broadband
Resolution
Widest range of structural tools, including
Electron Transfer Dissociation (ETD)
Expansive Mass Range
Selective Ion Enrichment and Enhanced
Dynamic Range
Application Directed and Optimized Solution
Packages
Common applications for solariX
The analytical power and performance of FTMS
is well suited to address some of today’s most
challenging and complex samples. Drawing
on years of applications experience, we have
combined our unique FTMS instrumentation and
comprehensive software tools to provide turn-
key solutions for the following areas:
High End Proteomics Studies
(Top-down and Bottom-up workflows)
Molecular Imaging of Tissue - Distribution of
Drugs, Metabolites, and Biomarkers
Petroleum Product Analysis
Complex Environmental sample analysis
Metabolomics Research
The technological advances
encompassed by solariX provide:

Performance Beyond Compare
At the core of the solariX is dramatically
improved sensitivity and dynamic range.
This allows researchers to identify and
analyze a much wider range of molecules
than ever before, and to delve deeper
into complex mixtures and analyze lower
abundance species.
More power for greater
complexity
The broadband, ultra high resolving
power (increased 8-fold) and superb
mass accuracy of solariX is more
powerful than previously possible with
any other mass spectrometer. This
extraordinary increase in the number of
available m/z channels is essential for
addressing complex problems such as
petroleomics and environmental samples
which require resolving powers of greater
than 400,000 for effective analysis.
Faster and more advanced LC-MS
and LC-MS/MS operation
The new data acquisition functionality
enables smarter modes of data
dependent operation. Here, spectral
acquisition parameters such as data set
size or starting mass may be adjusted
on-the-fly in a mass dependent mode
of operation. Smaller data sets can
be selected for MS/MS acquisitions
making the overall data acquisition rate
faster, while maintaining the high fidelity
measurements for the MS precursor
acquisitions. Moreover, super stable mass
accuracy is maintained throughout the
LC-MS analysis using Bruker’s proprietary
Ion Charge Control (ICC™) mode.
Base Peak Chromatogram for LC-MS and LC-MS/MS of
protein mixture
200 400 600 800 1000 12000.0
0.5
1.0
1.5
m/z
Intens.
x109
Crude Oil, APPI positve
Effective analysis of complex problems
Broad band spectrum of a crude oil measured by APPI in
positive ion mode. Insets illustrate the extreme
high resolving power (> 550,000) of the solariX-CM.
0
1
2
3
4
5
303.215303.195
303.19366
303.19815
303.20630
303.20967
303.21078
303.21414
m/z
Intens.
x108
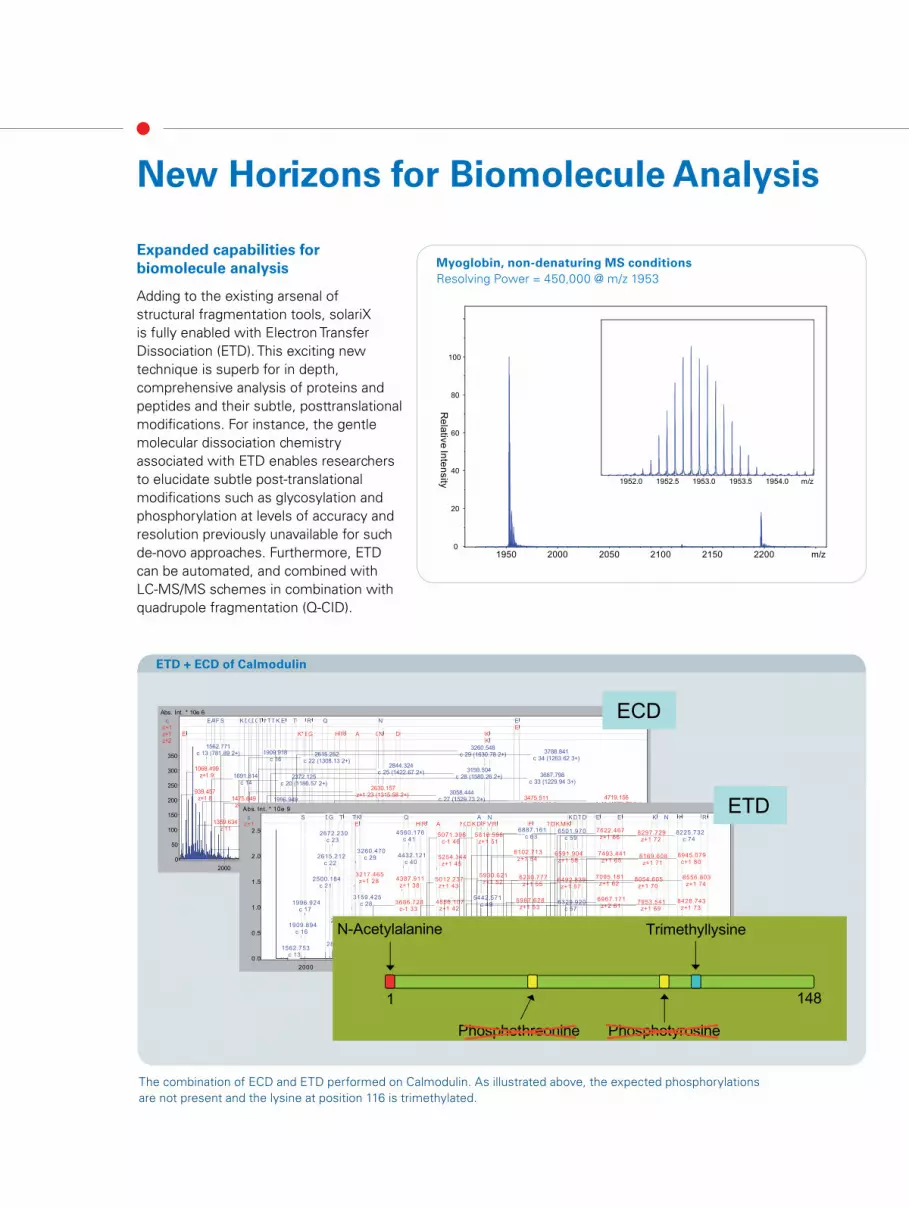
New Horizons for Biomolecule Analysis
The combination of ECD and ETD performed on Calmodulin. As illustrated above, the expected phosphorylations
are not present and the lysine at position 116 is trimethylated.
ETD + ECD of Calmodulin
m/z2000 4000 6000 8000 10000
0
50
100
150
200
250
300
350
Abs. Int. * 10e 6
c EAF S KDGDGT I TTK E T R Q N Ec+1 Ez+1 E K* EG H R A GN D Kz+2 K
939.457z+1 8
1068.499z+1 9
1359.634z 11
1475.649z+2 12
1562.771c 13 (781.89 2+)
1691.814c 14
1701.767z+1 14
1762.853c 15
1909.918c 16
1996.949c 17
2372.125c 20 (1186.57 2+)
2500.228c 21 (1250.62 2+)
2615.252c 22 (1308.13 2+)
2672.274c 23 (1336.64 2+)
2630.157z+1 23 (1315.58 2+)
2787.308c 24 (1394.16 2+)
2844.324c 25 (1422.67 2+)
2945.372c 26 (1473.19 2+)
3003.329z+1 26 (1502.17 2+)
3058.444c 27 (1529.73 2+)
3159.504c 28 (1580.26 2+)
3260.548c 29 (1630.78 2+)
3388.647c 30 (1694.83 2+)
3475.511z+1 30 (1738.26 2+)
3687.798c 33 (1229.94 3+)
3686.790c-1 33 (1843.90 2+)
3804.671z+1 33 (1902.84 2+)
3788.841c 34 (1263.62 3+)
4719.156z+1 41 (1573.72 3+)
m/z2000 4000 6000 8000 10000
0.0
0.5
1.0
1.5
2.0
2.5
Abs. Int. * 10e 9
c S DG T TK Q A N KDTD E E K N I Rz+1 E H R A NGDKD F V R E TDKMK
1562.753c 13
1909.894c 16
1996.924c 17
2500.184c 21
2615.212c 22
2672.230c 23
2844.266c 25
2945.307c 26
3159.425c 28
3217.465z+1 28
3260.470c 29
3346.420z+1 29
3388.592c 30
3686.728c-1 33
4387.911z+1 38
4432.121c 40
4560.176c 41
4718.084z 41
4719.034z+1 41
4856.107z+1 42
5012.237z+1 43
5254.344z+1 45
5071.396c-1 46
5325.373z+1 46
5483.448z+1 48
5442.571c 49
5816.598z+1 51
5930.621z+1 52
5931.625z+2 52
5915.754c 53
5987.628z+1 53
6102.713z+1 54
6230.777z+1 55
6258.887c 56
6345.795z+1 56
6329.920c 57
6492.839z+1 57
6591.904z+1 58
6501.970c 59
6748.061z+1 59
6616.002c 60
6967.171z+2 61
7095.181z+1 62
6887.161c 63
7493.441z+1 65
7622.467z+1 66
7375.339c 67
7839.478z+2 68
7953.541z+1 69
8054.605z+1 70
8169.608z+1 71
8297.729z+1 72
8298.717z+2 72
8070.620c+1 73
8428.743z+1 73
8225.732c 74
8556.803z+1 74
8728.009c 78
8945.079c+1 80
N-Acetylalanine Trimethyllysine
Phosphothreonine Phosphotyrosine
1 148
ECD
ETD
Expanded capabilities for
biomolecule analysis
Adding to the existing arsenal of
structural fragmentation tools, solariX
is fully enabled with Electron Transfer
Dissociation (ETD). This exciting new
technique is superb for in depth,
comprehensive analysis of proteins and
peptides and their subtle, posttranslational
modifications. For instance, the gentle
molecular dissociation chemistry
associated with ETD enables researchers
to elucidate subtle post-translational
modifications such as glycosylation and
phosphorylation at levels of accuracy and
resolution previously unavailable for such
de-novo approaches. Furthermore, ETD
can be automated, and combined with
LC-MS/MS schemes in combination with
quadrupole fragmentation (Q-CID).
Myoglobin, non-denaturing MS conditions
Resolving Power = 450,000 @ m/z 1953
0
20
40
60
80
100
Re
lativ
e In
ten
sity
1950 2000 2050 2100 2150 2200 m/z
1952.0 1952.5 1953.0 1953.5 1954.0 m/z

Definitive molecular identification
With the solariX, high sensitivity, superior
quality, exact mass measurements are
only a mouse click away. Leveraging
sub-ppm levels of mass accuracy for both
intact precursor (MS) and product ions
(MS/MS) combined with accurate isotope
patterns, SmartFormula3D™ provides
definitive elemental composition and
molecular formula information. This level
of confidence is readily achieved without
internal standards or recalibration and the
high resolution data inherently mitigates
the complications resulting from other
chemical interferences.
325.180 325.190 325.200 325.210 m/z
325.1939913C1C21H28S
+•
0.0 ppm
325.19845
C22H29S+
0.0 ppm
325.19510
C25H25+
-0.1 ppm
325.19064+•
0.1 ppm325.18253
C24H23N+•
0.1 ppm
325.1780513C1C23H22N
+
0.1 ppm
325.20178
C19H33S2+
0.1 ppm
325.21617
C22H29O2+
0.1 ppm
2413C1C24H
High resolution spectrum of crude oil by APPI demonstrating
broadband resolving power of 950,000 with average mass
measurement error below 100 ppb.
Molecular formulae determination of components in crude oil
CASI™: For rapid, enhanced
selectivity and dynamic range
The unique Qq-FTMS geometry of
the solariX can enrich lower abundant
or trace species for detection and
structural interrogation via MS and MS/
MS, respectively. This mode, known as
Continuous Accumulation of Selected
Ions (CASI), is essential for tissue
imaging, analyzing low-copy PTMs, and
to extend the general dynamic range
of almost any measurement. This can
improve signal intensities by as much as
an order of magnitude.
“Q”
CASI Figure
Solution packages optimized for a
variety of applications
The solariX product line features a series
of tailored solutions around specific
applications. Each solution comprises
the appropriate hardware, ion source
options, and application level software for
a turn-key analytical platform. Whether
your primary application is complex
mixtures (e.g. petroleomics) or high
resolution tissue imaging, a solariX
package is designed to meet your needs.
For laboratories having unique or multiple
analysis needs, Bruker will work with you
to prepare an appropriate, customized
configuration.
Schematic of CASI workflow where target ions
are selected and enriched in the collision cell.
The solariX FTMS is as intuitive and
easy to use as a benchtop instrument.
Bruker’s Compass™ software enables
the researcher to harness the analytical
power and versatility with ease so that
the focus is on the application and not on
the instrumentation.
Weekly cryogen “fills” become
annual…
Bruker’s patented refrigerated magnet
technology means nitrogen-free compact
superconducting magnets with very low
helium losses to minimize instrument
maintenance and service. Patented active
shielding technology minimizes the
stray magnetic field levels for compact
installations and maximum laboratory
safety. These magnets are available for
the full range of magnetic field strengths
(7T, 9.4T, 12T, and 15T).
High-End Performance for any Analytical Laboratory
“ ” “q”
m/z = 313.1485
Full mass range MS CASI - 20 m/z window
CASI boosts
sensitivity, enabling
the detection of drug
and metabolites at
lower concentrations
Molecular imaging of olanzapine in kidneyDosage – 5 mg/kg, 6h post dosage analysis.
Unique Features of solariX
Ultimate versatility in structural
analysis
The solariX leverages the complementary
nature of traditional quadrupole based
Collisional Induced Dissociation (CID), and
now Electron Transfer Dissociation (ETD).
Additionally, precursors of complex
mixtures may be isolated and fragmented
using high front-end resolution, in-cell
isolation followed by Electron Capture
Dissociation (ECD) or Sustained Off-
Resonance Irradiation (SORI)-CID.
Whether your application is natural
product, peptide/protein, carbohydrate,
orpetroleum product analysis, solariX has
an array of fragmentation tools to address
practically any compound class.
Ion source flexibility
While FTMS is ideally suited to liquid
introduction, Bruker Daltonics offers the
unique dual ESI/MALDI source. This is
based on patented Ion Funnel technology
for maximum sensitivity which allows
effortless switching between ESI and
MALDI – all at the touch of a button! The
intermediate pressure MALDI source
offers exquisite sensitivity, and preserves
molecular ion fidelity throughout the
complete FTMS detection process. The
efficiency of the dual ESI/MALDI source
combined with the new ion optics of the
solariX provides a marriage of ultra-high
resolution with high-end “MALDI-TOF
sensitivity”.
Along with our array of atmospheric
pressure ionization sources (ESI,
nano-ESI, APCI, and APPI), Bruker
now offers GC-APCI capability.
Flexible Front-end Solutions
Compass
The powerful Compass software enables the operation of a range of
industry standard HPLC and u-HPLC platforms with the solariX.
This includes comprehensive system control and seamless integration
of mass spectral and UV data.
solariXcontrol™ - the instrument control software for solariX
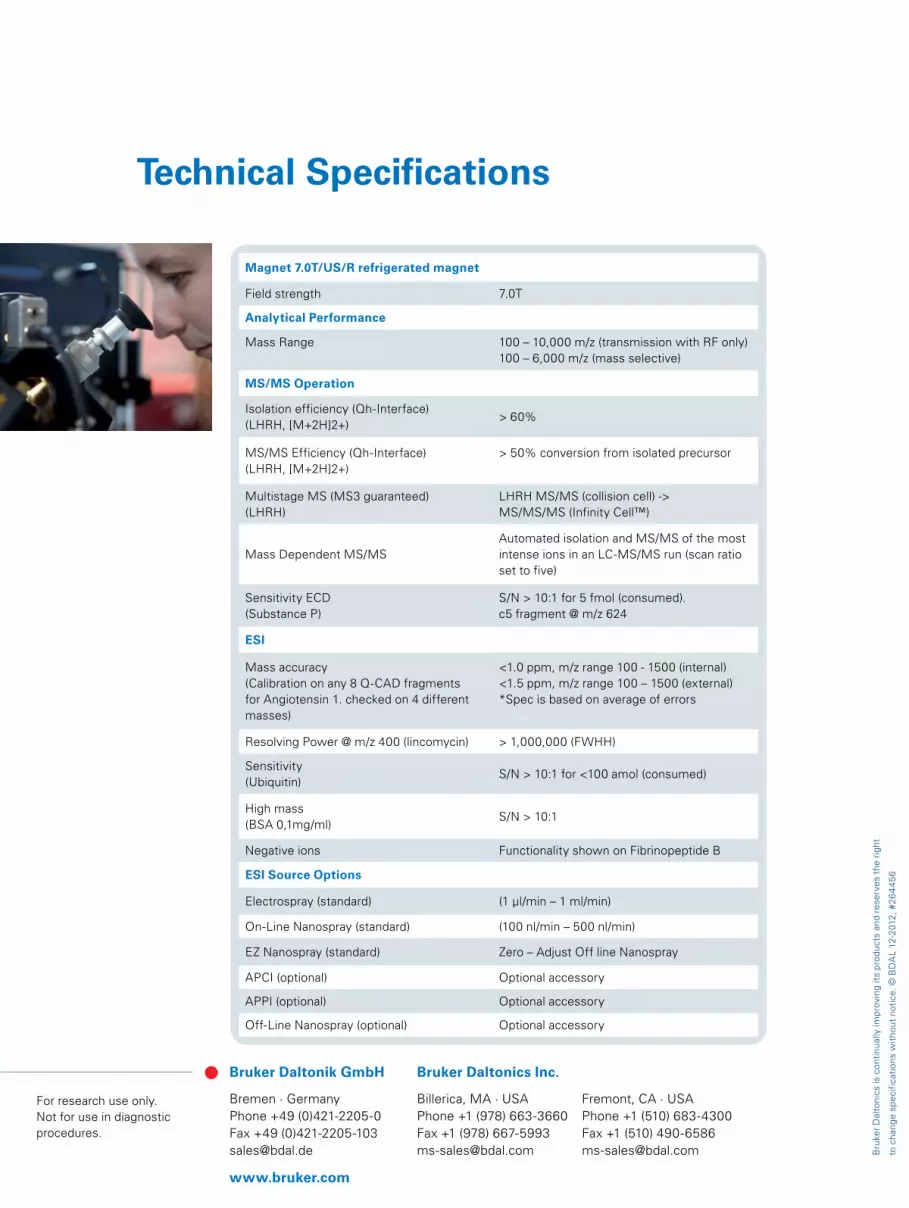
Technical Specifications
Bru
ke
r D
alt
on
ics is c
on
tin
ually im
pro
vin
g its
pro
du
cts
an
d r
ese
rve
s t
he r
igh
t
to c
han
ge s
pe
cif
icati
on
s w
ith
ou
t n
oti
ce
. ©
BD
AL 1
2-2
012
, #
26
44
56
Magnet 7.0T/US/R refrigerated magnet
Field strength 7.0T
Analytical Performance
Mass Range 100 – 10,000 m/z (transmission with RF only)
100 – 6,000 m/z (mass selective)
MS/MS Operation
Isolation efficiency (Qh-Interface)
(LHRH, [M+2H]2+)> 60%
MS/MS Efficiency (Qh-Interface)
(LHRH, [M+2H]2+)
> 50% conversion from isolated precursor
Multistage MS (MS3 guaranteed)
(LHRH)
LHRH MS/MS (collision cell) ->
MS/MS/MS (Infinity Cell™)
Mass Dependent MS/MS
Automated isolation and MS/MS of the most
intense ions in an LC-MS/MS run (scan ratio
set to five)
Sensitivity ECD
(Substance P)
S/N > 10:1 for 5 fmol (consumed).
c5 fragment @ m/z 624
ESI
Mass accuracy
(Calibration on any 8 Q-CAD fragments
for Angiotensin 1. checked on 4 different
masses)
<1.0 ppm, m/z range 100 - 1500 (internal)
<1.5 ppm, m/z range 100 – 1500 (external)
*Spec is based on average of errors
Resolving Power @ m/z 400 (lincomycin) > 1,000,000 (FWHH)
Sensitivity
(Ubiquitin)S/N > 10:1 for <100 amol (consumed)
High mass
(BSA 0,1mg/ml)S/N > 10:1
Negative ions Functionality shown on Fibrinopeptide B
ESI Source Options
Electrospray (standard) (1 µl/min – 1 ml/min)
On-Line Nanospray (standard) (100 nl/min – 500 nl/min)
EZ Nanospray (standard) Zero – Adjust Off line Nanospray
APCI (optional) Optional accessory
APPI (optional) Optional accessory
Off-Line Nanospray (optional) Optional accessory
For research use only.
Not for use in diagnostic
procedures.
Bruker Daltonik GmbH
Bremen · Germany
Phone +49 (0)421-2205-0
Fax +49 (0)421-2205-103
Bruker Daltonics Inc.
Billerica, MA · USA Fremont, CA · USA
Phone +1 (978) 663-3660 Phone +1 (510) 683-4300
Fax +1 (978) 667-5993 Fax +1 (510) 490-6586
[email protected] [email protected]
www.bruker.com
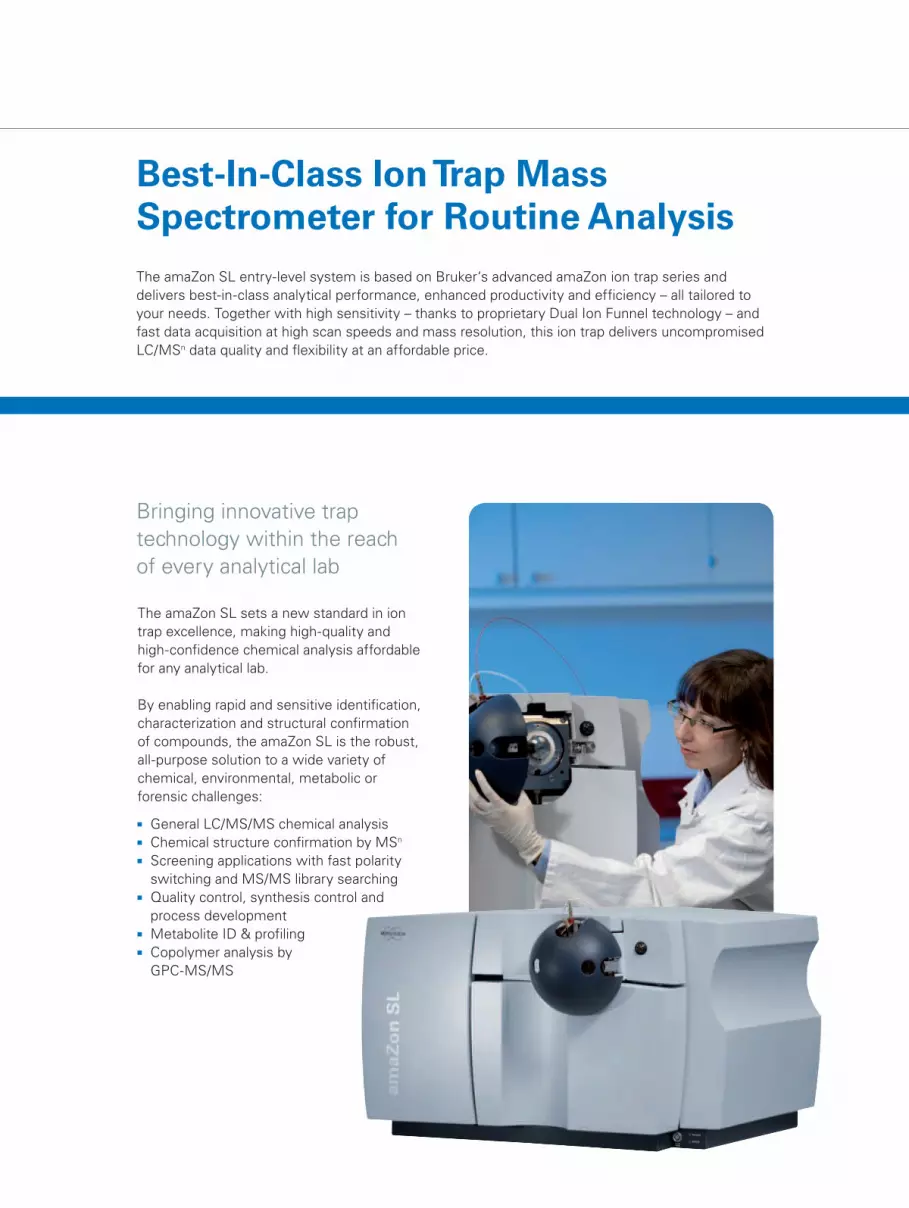
Best-In-Class Ion Trap Mass Spectrometer for Routine Analysis
The amaZon SL entry-level system is based on Bruker‘s advanced amaZon ion trap series and
delivers best-in-class analytical performance, enhanced productivity and efficiency – all tailored to
your needs. Together with high sensitivity – thanks to proprietary Dual Ion Funnel technology – and
fast data acquisition at high scan speeds and mass resolution, this ion trap delivers uncompromised
LC/MSn data quality and flexibility at an affordable price.
Bringing innovative trap
technology within the reach
of every analytical lab
The amaZon SL sets a new standard in ion
trap excellence, making high-quality and
high-confidence chemical analysis affordable
for any analytical lab.
By enabling rapid and sensitive identification,
characterization and structural confirmation
of compounds, the amaZon SL is the robust,
all-purpose solution to a wide variety of
chemical, environmental, metabolic or
forensic challenges:
General LC/MS/MS chemical analysis
Chemical structure confirmation by MSn
Screening applications with fast polarity
switching and MS/MS library searching
Quality control, synthesis control and
process development
Metabolite ID & profiling
Copolymer analysis by
GPC-MS/MS
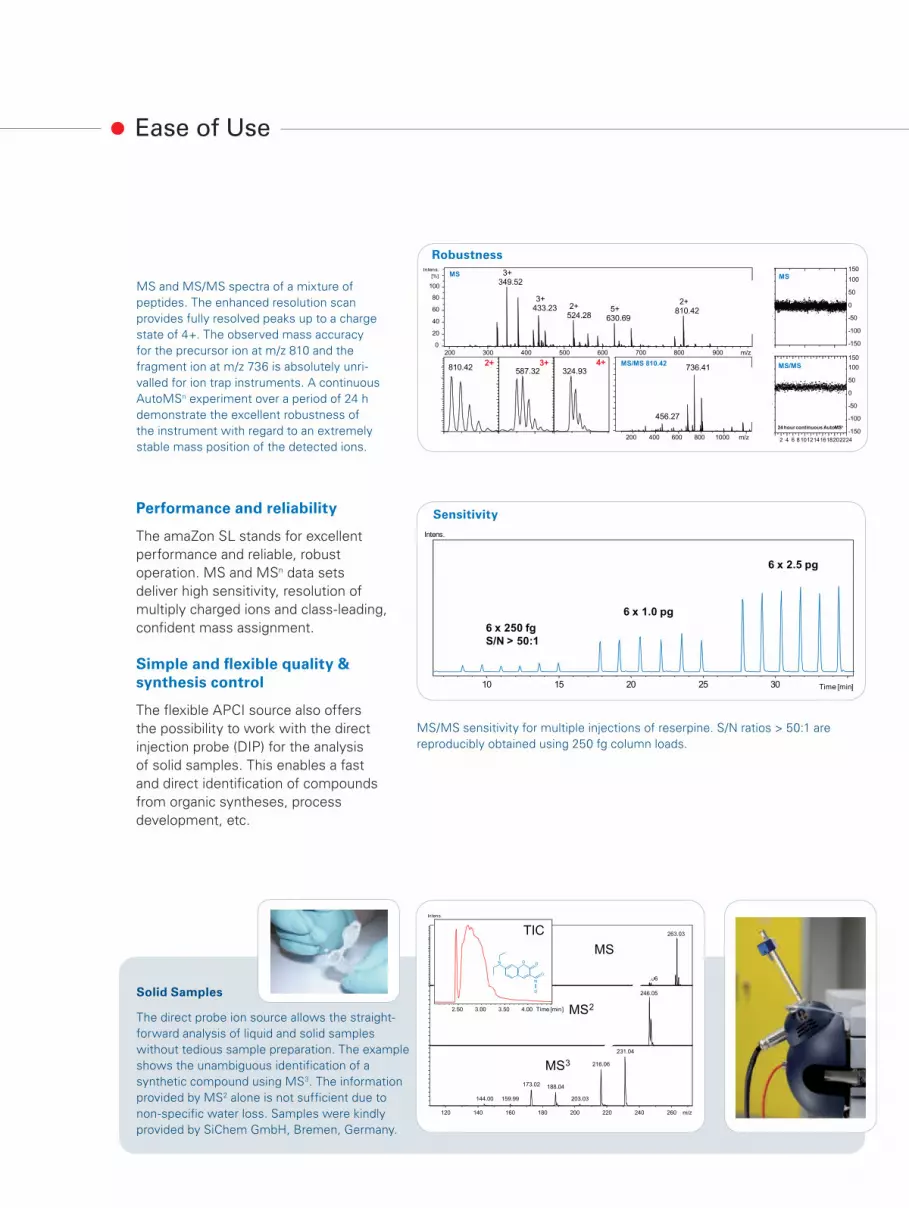
Ease of Use
Performance and reliability
The amaZon SL stands for excellent
performance and reliable, robust
operation. MS and MSn data sets
deliver high sensitivity, resolution of
multiply charged ions and class-leading,
confident mass assignment.
Simple and flexible quality &
synthesis control
The flexible APCI source also offers
the possibility to work with the direct
injection probe (DIP) for the analysis
of solid samples. This enables a fast
and direct identification of compounds
from organic syntheses, process
development, etc.
MS/MS sensitivity for multiple injections of reserpine. S/N ratios > 50:1 are
reproducibly obtained using 250 fg column loads.
Sensitivity
6 x 250 fg
S/N > 50:1
6 x 1.0 pg
6 x 2.5 pg
10 15 20 25 30 Time [min]
Intens.
MS and MS/MS spectra of a mixture of
peptides. The enhanced resolution scan
provides fully resolved peaks up to a charge
state of 4+. The observed mass accuracy
for the precursor ion at m/z 810 and the
fragment ion at m/z 736 is absolutely unri-
valled for ion trap instruments. A continuous
AutoMSn experiment over a period of 24 h
demonstrate the excellent robustness of
the instrument with regard to an extremely
stable mass position of the detected ions.
Robustness
MS/MS 810.42 MS/MS3+2+
MS MS
4+
349.523+
433.233+
524.282+
630.695+ 810.42
2+
0
20
40
60
80
100
Intens.
[%]
200 300 400 500 600 700 800 900 m/z
456.27
736.41
200 400 600 800 1000 m/z
587.32 324.93810.42
-150
-100
-50
0
50
100
150
ma
ss
po
sitio
n /
mD
a
2 4 6 81012141618202224
-150
-100
-50
0
50
100
150
ma
ss
po
ssitio
n/m
Da
24 hour continuous AutoMSn
Solid Samples
The direct probe ion source allows the straight-
forward analysis of liquid and solid samples
without tedious sample preparation. The example
shows the unambiguous identification of a
synthetic compound using MS3. The information
provided by MS2 alone is not sufficient due to
non-specific water loss. Samples were kindly
provided by SiChem GmbH, Bremen, Germany.
246.06
263.03
246.05
144.00 159.99
173.02 188.04
203.03
216.06
231.04
Intens.
120 140 160 180 200 220 240 260 m/z
MS
MS2
MS3
2.50 3.00 3.50 4.00 Time [min]
TIC
OO
O
N
O
N
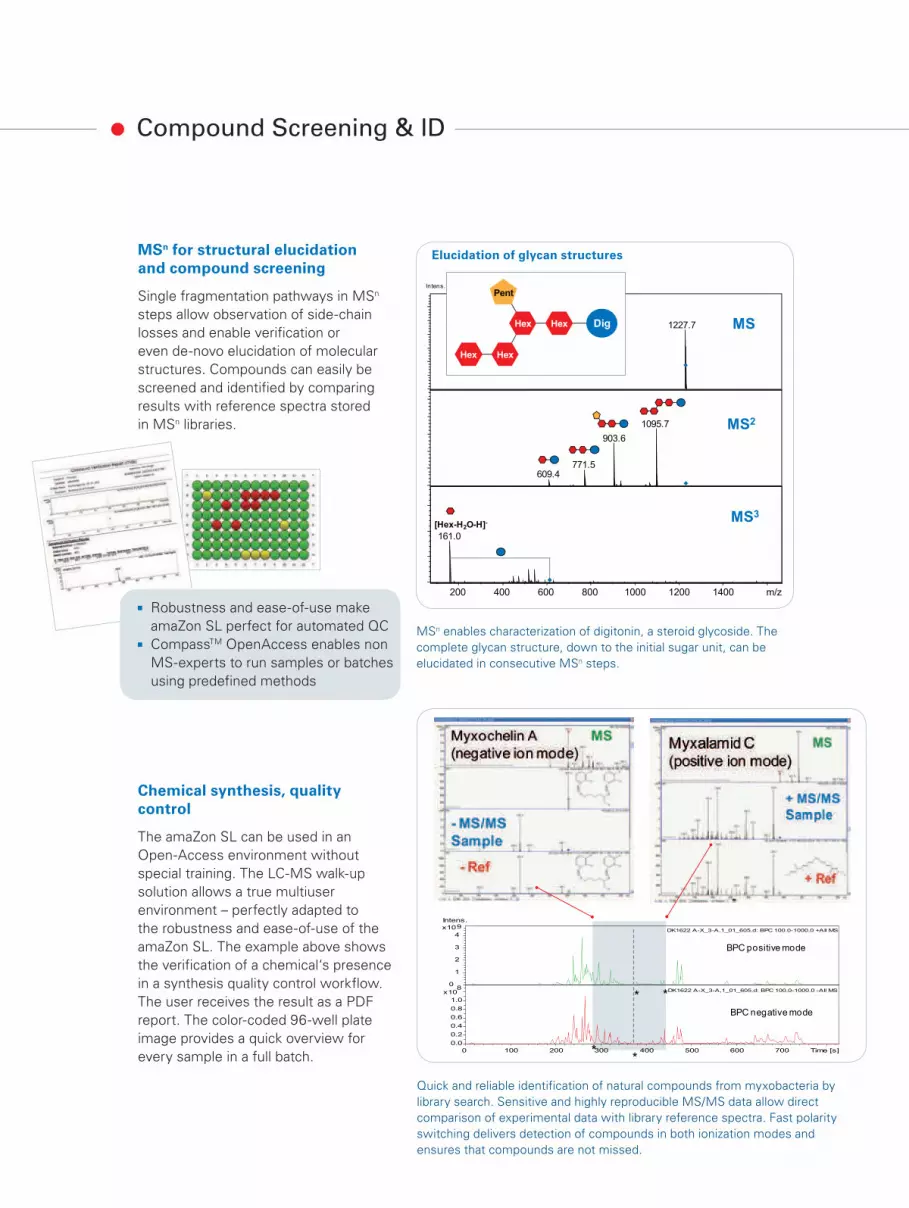
Compound Screening & ID
MSn enables characterization of digitonin, a steroid glycoside. The
complete glycan structure, down to the initial sugar unit, can be
elucidated in consecutive MSn steps.
Elucidation of glycan structures
[Hex-H2O-H]-
MS2
MS3
1227.7
1095.7
903.6
771.5609.4
161.0
MS
Intens.
200 400 600 800 1000 1200 1400 m/z
Pent
DigHex
Hex Hex
Hex
DK1622 A-X_3-A,1_01_605.d: BPC 100.0-1000.0 +All MS
DK1622 A-X_3-A,1_01_605.d: BPC 100.0-1000.0 -All MS
0
1
2
3
4
9x10
Intens.
0.0
0.2
0.4
0.6
0.8
1.0
8x10
0 100 200 300 400 500 600 700 Time [s]
BPC negative mode
BPC positive mode
**
**
Quick and reliable identification of natural compounds from myxobacteria by
library search. Sensitive and highly reproducible MS/MS data allow direct
comparison of experimental data with library reference spectra. Fast polarity
switching delivers detection of compounds in both ionization modes and
ensures that compounds are not missed.
MSn for structural elucidation
and compound screening
Single fragmentation pathways in MSn
steps allow observation of side-chain
losses and enable verification or
even de-novo elucidation of molecular
structures. Compounds can easily be
screened and identified by comparing
results with reference spectra stored
in MSn libraries.
Robustness and ease-of-use make
amaZon SL perfect for automated QC
CompassTM OpenAccess enables non
MS-experts to run samples or batches
using predefined methods
Chemical synthesis, quality
control
The amaZon SL can be used in an
Open-Access environment without
special training. The LC-MS walk-up
solution allows a true multiuser
environment – perfectly adapted to
the robustness and ease-of-use of the
amaZon SL. The example above shows
the verification of a chemical‘s presence
in a synthesis quality control workflow.
The user receives the result as a PDF
report. The color-coded 96-well plate
image provides a quick overview for
every sample in a full batch.
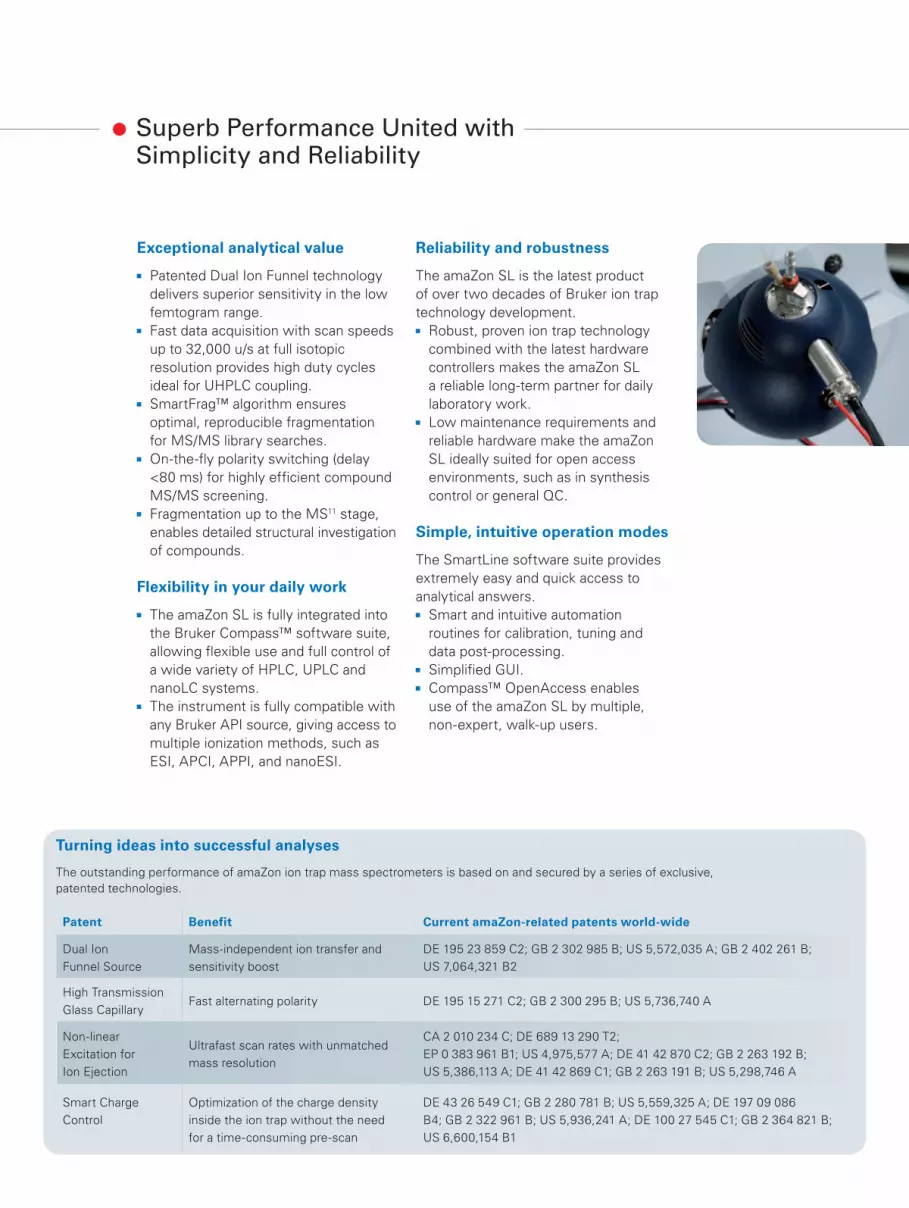
Superb Performance United with Simplicity and Reliability
Turning ideas into successful analyses
Patent Benefit Current amaZon-related patents world-wide
Dual Ion
Funnel Source
Mass-independent ion transfer and
sensitivity boost
DE 195 23 859 C2; GB 2 302 985 B; US 5,572,035 A; GB 2 402 261 B;
US 7,064,321 B2
High Transmission
Glass CapillaryFast alternating polarity DE 195 15 271 C2; GB 2 300 295 B; US 5,736,740 A
Non-linear
Excitation for
Ion Ejection
Ultrafast scan rates with unmatched
mass resolution
CA 2 010 234 C; DE 689 13 290 T2;
EP 0 383 961 B1; US 4,975,577 A; DE 41 42 870 C2; GB 2 263 192 B;
US 5,386,113 A; DE 41 42 869 C1; GB 2 263 191 B; US 5,298,746 A
Smart Charge
Control
Optimization of the charge density
inside the ion trap without the need
for a time-consuming pre-scan
DE 43 26 549 C1; GB 2 280 781 B; US 5,559,325 A; DE 197 09 086
B4; GB 2 322 961 B; US 5,936,241 A; DE 100 27 545 C1; GB 2 364 821 B;
US 6,600,154 B1
The outstanding performance of amaZon ion trap mass spectrometers is based on and secured by a series of exclusive,
patented technologies.
Exceptional analytical value
Patented Dual Ion Funnel technology
delivers superior sensitivity in the low
femtogram range.
Fast data acquisition with scan speeds
up to 32,000 u/s at full isotopic
resolution provides high duty cycles
ideal for UHPLC coupling.
SmartFrag™ algorithm ensures
optimal, reproducible fragmentation
for MS/MS library searches.
On-the-fly polarity switching (delay
<80 ms) for highly efficient compound
MS/MS screening.
Fragmentation up to the MS11 stage,
enables detailed structural investigation
of compounds.
Flexibility in your daily work
The amaZon SL is fully integrated into
the Bruker Compass™ software suite,
allowing flexible use and full control of
a wide variety of HPLC, UPLC and
nanoLC systems.
The instrument is fully compatible with
any Bruker API source, giving access to
multiple ionization methods, such as
ESI, APCI, APPI, and nanoESI.
Reliability and robustness
The amaZon SL is the latest product
of over two decades of Bruker ion trap
technology development.
Robust, proven ion trap technology
combined with the latest hardware
controllers makes the amaZon SL
a reliable long-term partner for daily
laboratory work.
Low maintenance requirements and
reliable hardware make the amaZon
SL ideally suited for open access
environments, such as in synthesis
control or general QC.
Simple, intuitive operation modes
The SmartLine software suite provides
extremely easy and quick access to
analytical answers.
Smart and intuitive automation
routines for calibration, tuning and
data post-processing.
Simplified GUI.
Compass™ OpenAccess enables
use of the amaZon SL by multiple,
non-expert, walk-up users.
Technical Specifications
Bruker Daltonik GmbH
Bremen · Germany
Phone +49 (0)421-2205-0
Fax +49 (0)421-2205-103
Bruker Daltonics Inc.
Billerica, MA · USA
Phone +1 (978) 663-3660
Fax +1 (978) 667-5993
www.bdal.com
Bru
ke
r D
alt
on
ics is c
on
tin
ually im
pro
vin
g its
pro
du
cts
an
d r
ese
rve
s t
he r
igh
t
to c
han
ge s
pe
cif
icati
on
s w
ith
ou
t n
oti
ce
. ©
BD
AL 0
3-2
010
, #
26
92
73
Superior high-capacity trap
using the latest Dual Ion Funnel
technology
Quadrupole ion trap based on
innovative technical design for the
highest ion storage capacities
Patented SmartICC™ for optimum ion
accumulation control without prescan
Mass-independent ion transmission
using Dual Ion Funnel technology
Standard-setting combination of mass
resolution, scan speed and m/z range
in MS and MSn
Fast polarity switching for acquisition
of positive- and negative-ion spectra
under LC conditions
Reproducible spectra for high-confi-
dence MS/MS library searches using
SmartFrag™
Scan speed and resolution (MS and MSn)
Scan Mode Res m/z u/sec
UltraScan™ 2+ ions 2,200 32,000
Enhanced
Resolution4+ ions 2,200 8,100
Extended
Mass Range 4,000 27,000
Scan modes
Full scan MS, MS/MS and MSn for the
most sensitive and reliable analysis of
unknown compounds
Neutral loss scan
Multiple reaction monitoring
(MRM) using MS/MS and MS3
Manual MSn up to n = 11 in all
scan modes
AutoMSn tree experiments with up
to 5 fragment ions per stage
Data-dependent experiments
All forms of common data-dependent
experiments – including preferred mass
lists for automated feedback experiments
from MetaboliteTools – are supported.
Source options
Choice of API sources
Advion Triversa NanoMate
Online/Offline NanoElectrospray
Smart CE-MS coupling with
grounded needle
Software options
MetaboliteToolsTM software for
metabolite identification
ACD Labs MS Manager for structural
interpretation and classification
Compass OA/QC: Web-based,
guided operation of LC/MS systems
for walk-up users
Compass Security Pack™ for
regulated environments
Support of HPLC and sample inlet systems from the following vendors:
Bruker EASY-nLC (I &II), Dionex, Advion TriVersa NanoMate, Agilent, VWR/Hitachi,
Waters (incl. UPLC), Autosamplers from CTC
For research use only. Not for use in diagnostic procedures.
Innovation with Integrity
Triple Quadrupole Mass Spectrometer
EVOQTM
MASS SPECTROMETRY

The EVOQ triple quadrupole for liquid chromatography (LC-TQ) was
designed for a singular purpose – to reliably quantify thousands
of real samples in the fastest sample-to-report time possible.
It delivers exceptional sensitivity, precision, accuracy, linearity,
and a wide dynamic range for your multiple reaction monitoring
(MRM) assays. Innovations in software and atmospheric pressure
ionization (API) technology make it a game changer for routine
high-sensitivity, quantitative analysis.
Key Benefits
Easily obtain ultra-high sensitivity for small molecules
and biomolecules as a result of the innovative interlaced-
quadrupole (IQ) dual ion funnel.
Confidently run matrix-rich samples on the robust oriice-
plate based API interface.
Efficiently analyze thermally labile molecules at high low
rates with the novel vacuum insulated probe (VIP) heated-
electrospray probe.
Save time using exception-based data-review software,
which makes it easier to highlight chromatograms that do
not meet preset method criteria.
A GAME CHANGER CREATES
SUCH A DISRUPTIVE ADVANTAGE, IT
TRANSFORMS THE ACCEPTED RULES
Key Applications
Food testing requires fast results because of
the perishable nature of food. The EVOQ LC-TQ
delivers the fastest sample-to-report time using
PACERTM software.
Environmental analysis can be made cost-
effective by using on-line extraction (OLE) using the
space-saving AdvanceTM UHPLC with OLE.
Toxicology testing covers a wide range of
compounds in dificult matrices, which can be easily
ionized by VIP heated-ESI technology.
Pharmacokinetics in early drug discovery
requires high-sensitivity and exceptional robustness
to analyze hundreds of rat plasma samples on a
daily basis; a task easily achieved by the oriice/IQ
dual ion funnel design.

PRECISON, ACCURACY, SPEED,
LINEARITY, DYNAMIC RANGE
Highly efficient VIP heated electrospray and APCI probes standard
Superior MRM sensitivity lens-free mass analyzer
Flat-tuning, tune-free, IQ dual ion funnel
Available in high performance QubeTM or ultra performance EliteTM models
UHPLC, HPLC, or OLE models with built-in column oven and degasser
eVol digital syringe standard infusion or loop injection experiments
CTC Autosampler (industry workhorse) with reduced carryover capability
High-capacity, cooled-tray sample storage standard
1
2
3
67
5
48
The Advance UHPLC, HPLC, and OLE LC modules
By engineering the lowest possible system delay-volume, the Advance LC pump technology
delivers superior ballistic gradient reproducibility at analytical low rates. This design-for-purpose
detail minimizes gradient delay and ensures highly precise retention times. The beneit
is shorter run-to-run cycle times with the reproducibility required for quantitative LC-MS/MS
analyses.
The OLE module extends the LC-TQ performance by enabling method-driven, on-line cleanup
or sample pre-concentration. The addition of a third pump in the same module and under full
software control reduces bench space requirement and simpliies setup, while giving you the
lexibility of rapid method development.
Your assay demands both because real samples
have more matrix than analyte. The EVOQ API
interface was engineered to deliver sensitivity
with uncompromised robustness; requirements
that set the standards for accuracy, precision, and
reproducibility.
Duty cycle impacts sensitivity, accuracy, and
precision, and is deined as the time spent by the
mass analyzer measuring the target analyte. In
MRM, the duty cycle can be close to 100% for a
single component. Even with a co-eluting internal
standard, the duty cycle of a TQ-MS is much higher
than any other MS analyzer technique that requires
scanning of the mass range. This is the main reason
a TQ-MS remains unbeatable for high sensitivity,
absolute quantitative analysis.
Sensitivity & Robustness
Accuracy & PrecisionAccuracy is the measure of the closeness of the
experimental value to the actual amount of the target
analyte in matrix. It is a measure of systematic bias.
Precision is how well the experimental values agree with
each other and is a measure of random error.
Together, these parameters measure the total
error of the assay, which in turn determines the limit of
quantitation (LOQ). Since the MRM technique spends
nearly all the time measuring the target analyte, the
result is an unbeatable LOQ in matrix; something you
will routinely achieve on the EVOQ LC-TQ.
1
2
3
4
5
6
7
8
Bruker Liquid Chromatography Solutions
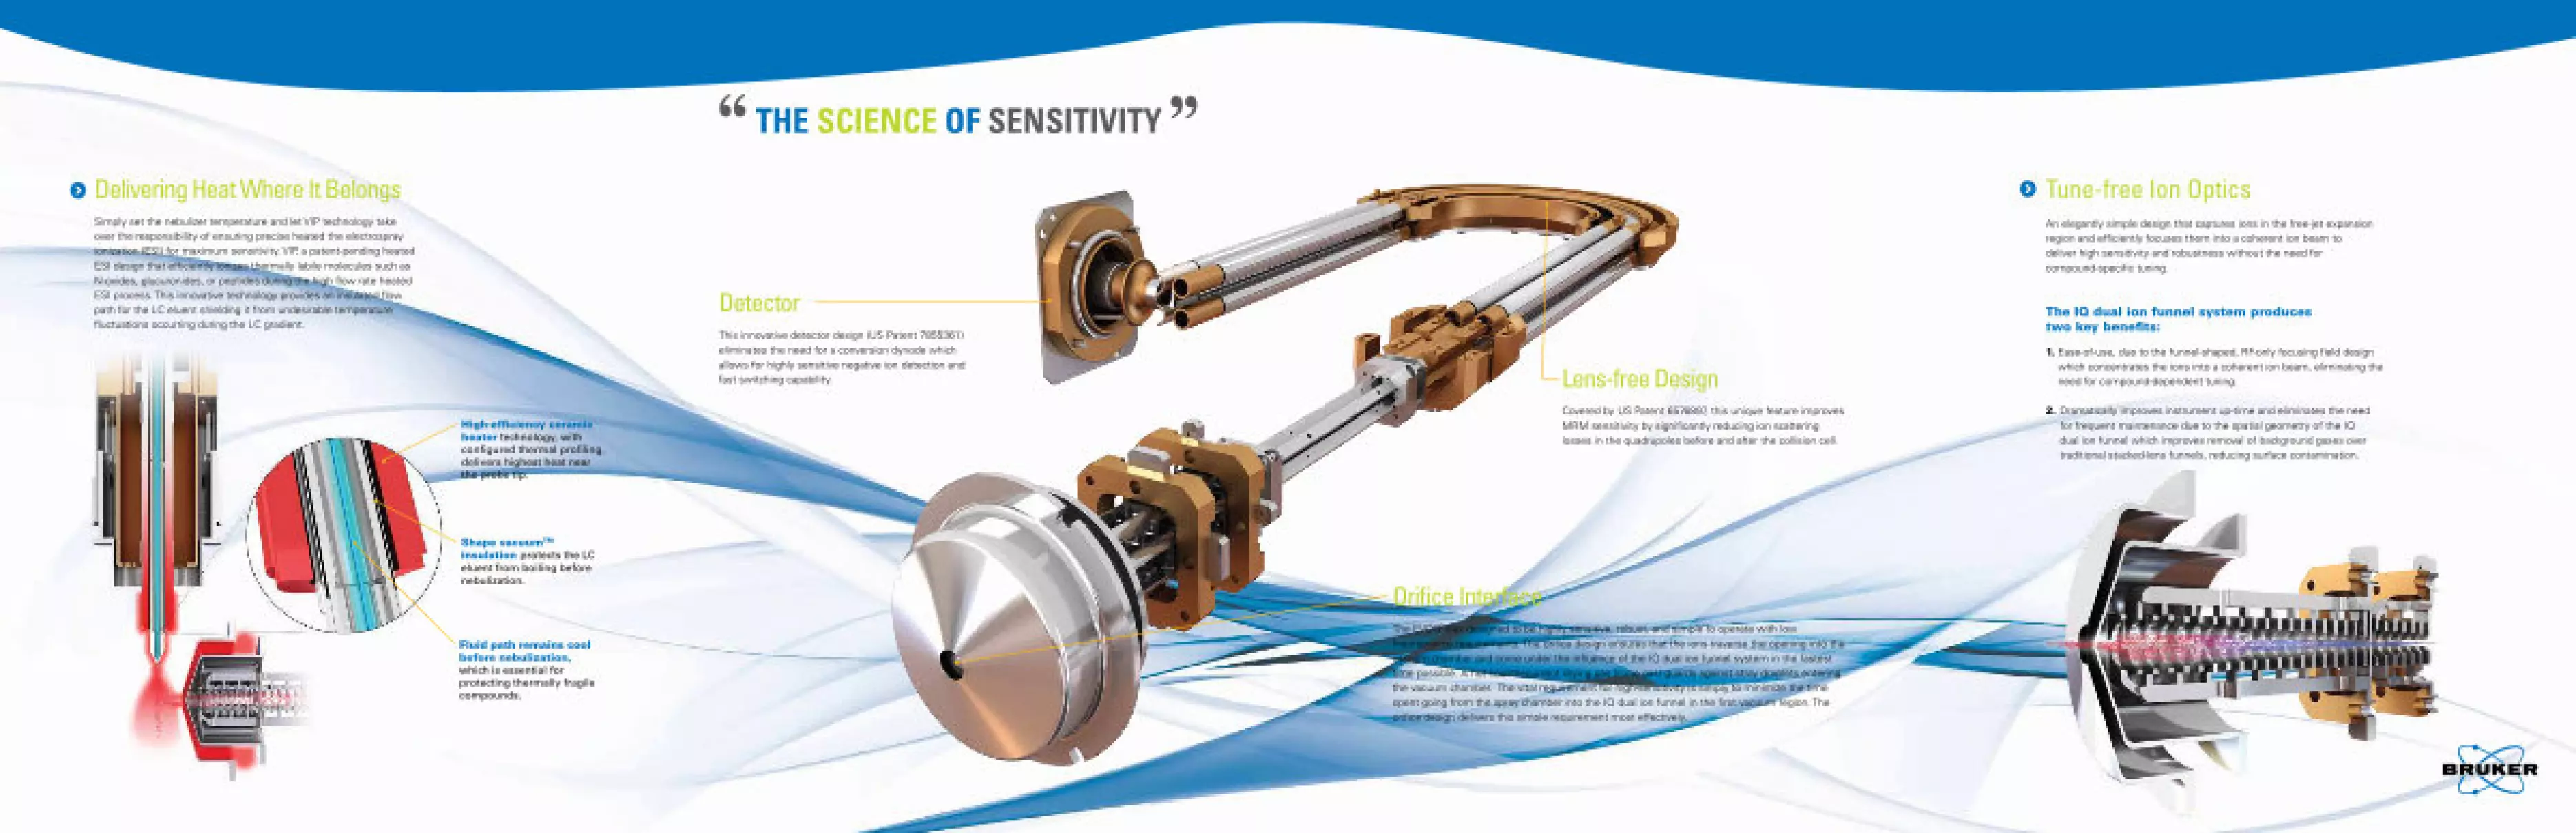
High-efficiency ceramic
heater technology, with
configured thermal profiling,
delivers highest heat near
the probe tip.
Shape vacuumTM
insulation protects the LC
eluent from boiling before
nebulization.
Fluid path remains cool
before nebulization,
which is essential for
protecting thermally fragile
compounds.
Delivering Heat Where It BelongsSimply set the nebulizer temperature and let VIP technology take
over the responsibility of ensuring precise heated the electrospray
ionization (ESI) for maximum sensitivity. VIP, a patent-pending heated
ESI design that eficiently ionizes thermally labile molecules such as
N-oxides, glucuronides, or peptides during the high low rate heated
ESI process. This innovative technology provides an insulated low
path for the LC eluent shielding it from undesirable temperature
luctuations occurring during the LC gradient.
Tune-free Ion Optics
An elegantly simple design that captures ions in the free-jet expansion
region and eficiently focuses them into a coherent ion beam to
deliver high sensitivity and robustness without the need for
compound-speciic tuning.
The IQ dual ion funnel system produces
two key benefits:
1. Ease-of-use, due to the funnel-shaped, RF-only focusing ield design
which concentrates the ions into a coherent ion beam, eliminating the
need for compound-dependent tuning.
2. Dramatically improves instrument up-time and eliminates the need
for frequent maintenance due to the spatial geometry of the IQ
dual ion funnel which improves removal of background gases over
traditional stacked-lens funnels, reducing surface contamination.
Orifice InterfaceThe EVOQ was designed to be highly sensitive, robust, and simple to operate with low
maintenance requirements. The oriice design ensures that the ions traverse the opening into the
vacuum chamber and come under the inluence of the IQ dual ion funnel system in the fastest
time possible. A hot counter-current drying gas (cone gas) guards against stray droplets entering
the vacuum chamber. The vital requirement for high-sensitivity is simply to minimize the time
spent going from the spray chamber into the IQ dual ion funnel in the irst vacuum region. The
oriice design delivers this simple requirement most effectively.
Lens-free DesignCovered by US Patent 6576897, this unique feature improves
MRM sensitivity by signiicantly reducing ion scattering
losses in the quadrupoles before and after the collision cell.
DetectorThis innovative detector design (US Patent 7855361)
eliminates the need for a conversion dynode which
allows for highly sensitive negative ion detection and
fast switching capability.
THE SCIENCE OF SENSITIVITY
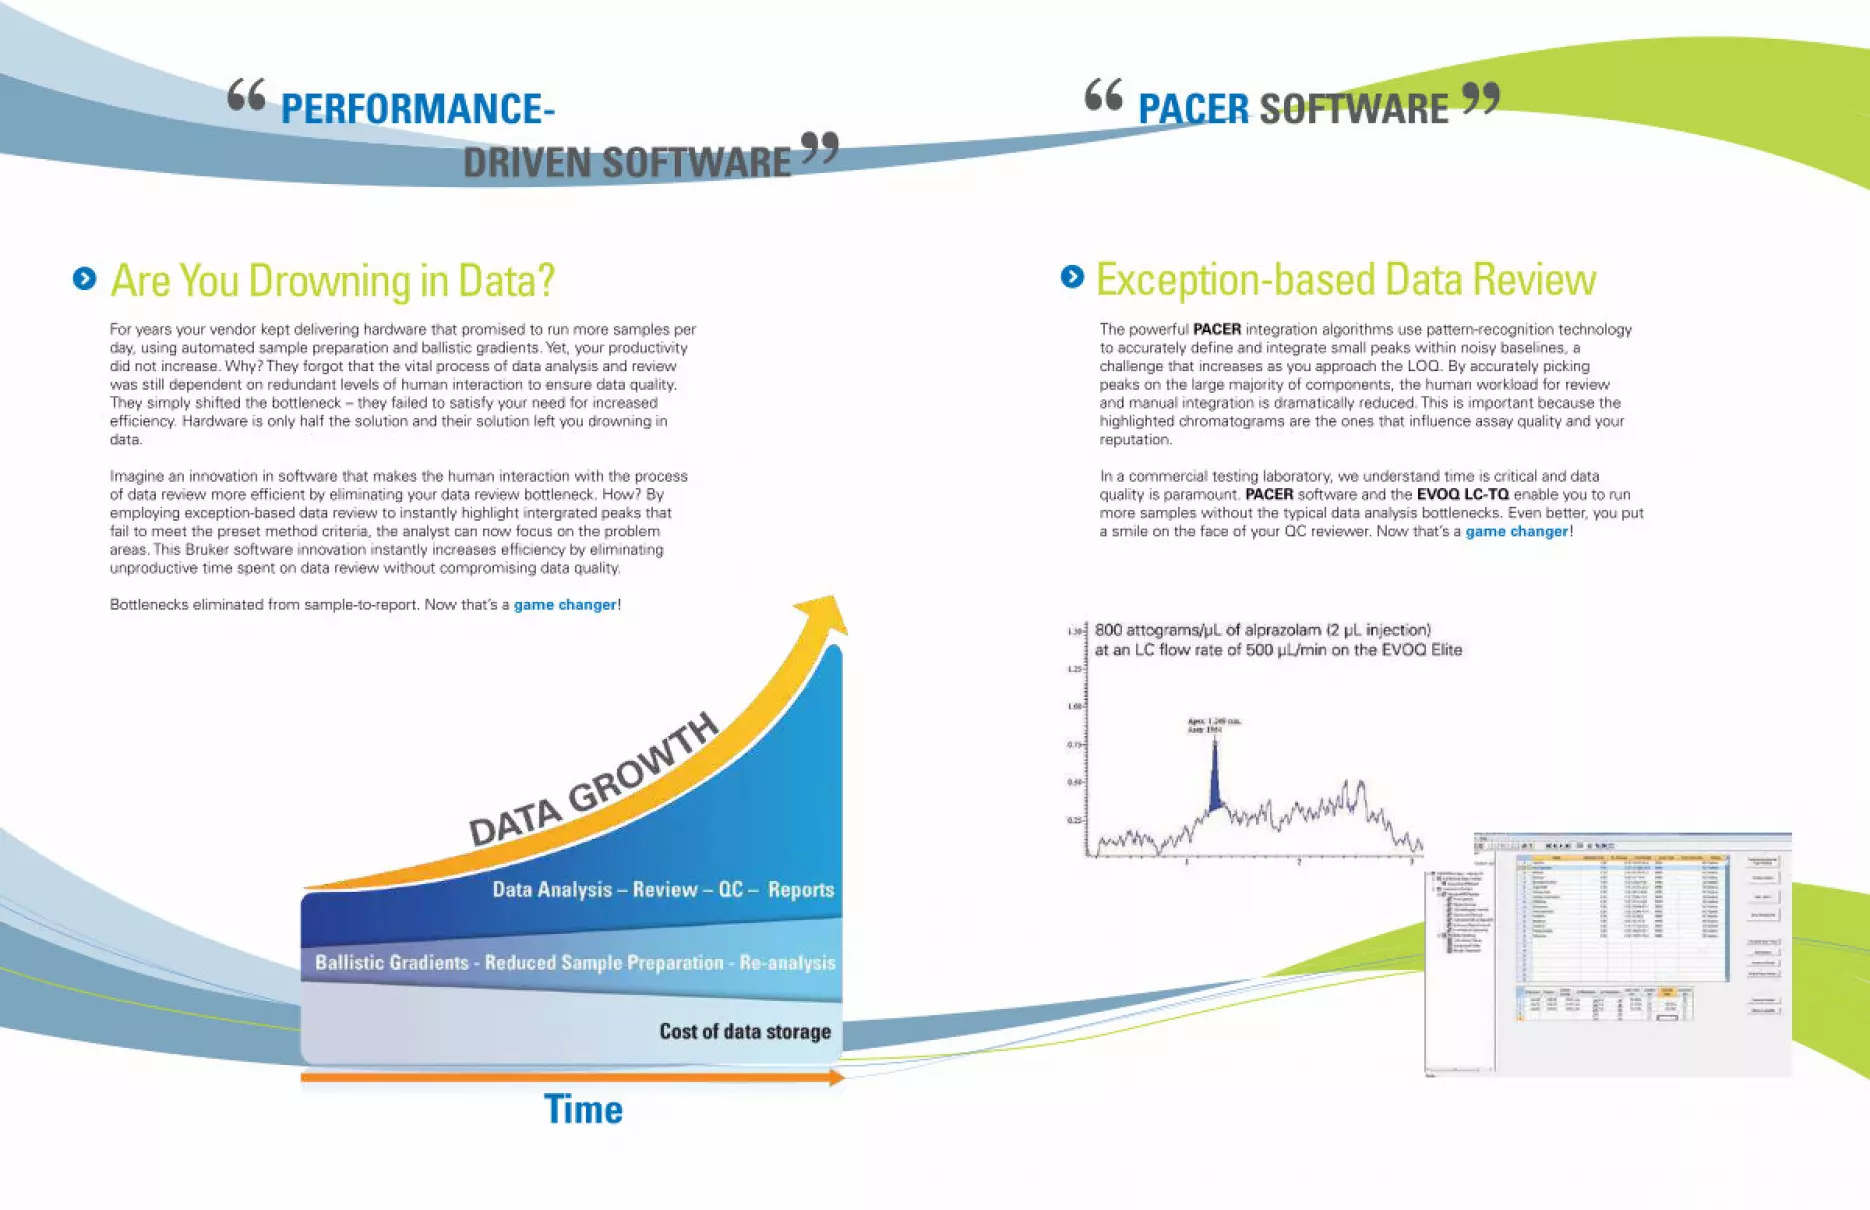
PERFORMANCE-
DRIVEN SOFTWARE
Time
PACER SOFTWARE
For years your vendor kept delivering hardware that promised to run more samples per
day, using automated sample preparation and ballistic gradients. Yet, your productivity
did not increase. Why? They forgot that the vital process of data analysis and review
was still dependent on redundant levels of human interaction to ensure data quality.
They simply shifted the bottleneck – they failed to satisfy your need for increased
eficiency. Hardware is only half the solution and their solution left you drowning in
data.
Imagine an innovation in software that makes the human interaction with the process
of data review more eficient by eliminating your data review bottleneck. How? By
employing exception-based data review to instantly highlight intergrated peaks that
fail to meet the preset method criteria, the analyst can now focus on the problem
areas. This Bruker software innovation instantly increases eficiency by eliminating
unproductive time spent on data review without compromising data quality.
Bottlenecks eliminated from sample-to-report. Now that’s a game changer!
The powerful PACER integration algorithms use pattern-recognition technology
to accurately deine and integrate small peaks within noisy baselines, a
challenge that increases as you approach the LOQ. By accurately picking
peaks on the large majority of components, the human workload for review
and manual integration is dramatically reduced. This is important because the
highlighted chromatograms are the ones that inluence assay quality and your
reputation.
In a commercial testing laboratory, we understand time is critical and data
quality is paramount. PACER software and the EVOQ LC-TQ enable you to run
more samples without the typical data analysis bottlenecks. Even better, you put
a smile on the face of your QC reviewer. Now that’s a game changer!
Are You Drowning in Data? Exception-based Data Review
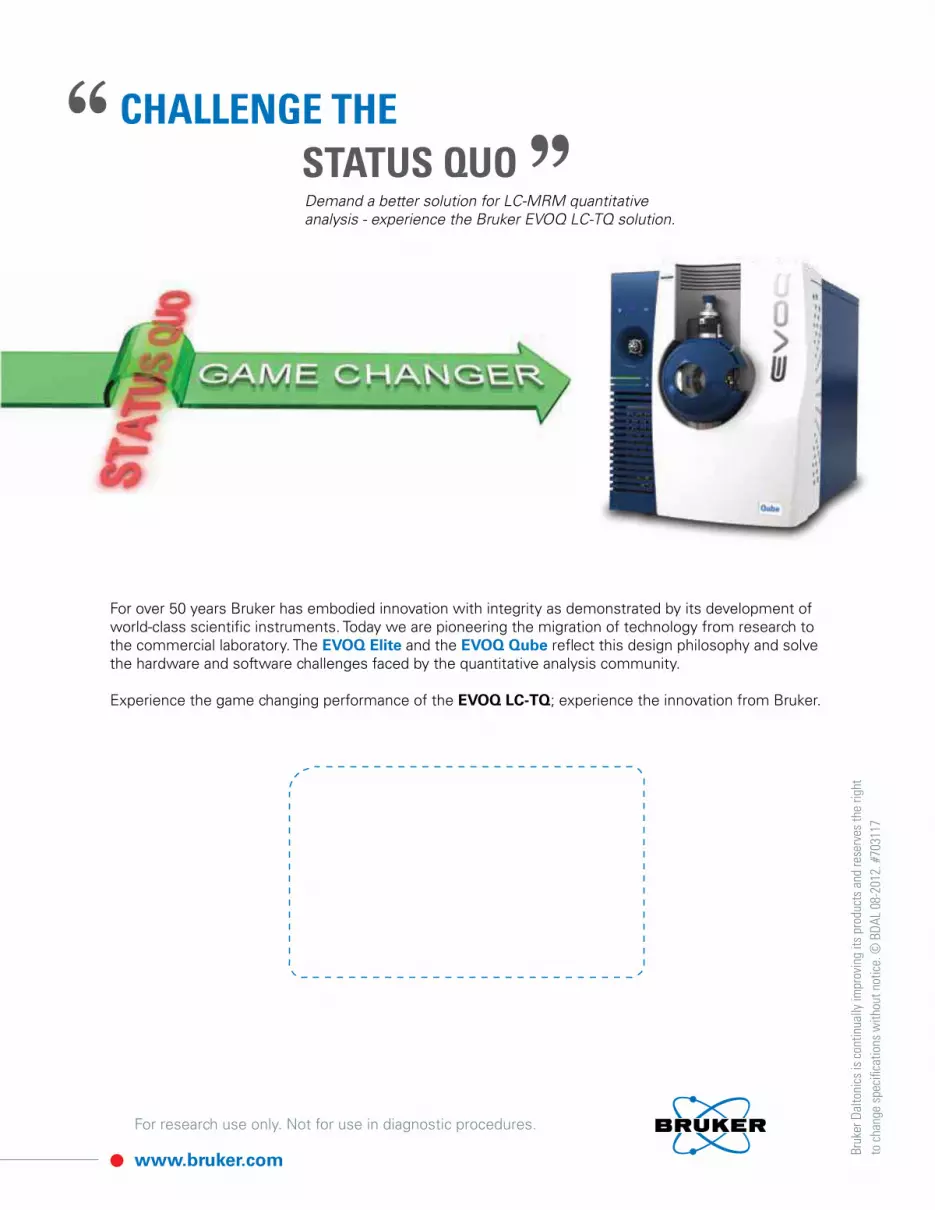
CHALLENGE THE
STATUS QUO
Bru
ker
Dal
toni
cs is
con
tinu
ally
impr
ovin
g it
s pr
oduc
ts a
nd r
eser
ves
the
righ
t
to c
hang
e sp
ecifi
cati
ons
wit
hout
not
ice.
© B
DA
L 08
-201
2. #
7031
17
For over 50 years Bruker has embodied innovation with integrity as demonstrated by its development of
world-class scientiic instruments. Today we are pioneering the migration of technology from research to
the commercial laboratory. The EVOQ Elite and the EVOQ Qube relect this design philosophy and solve
the hardware and software challenges faced by the quantitative analysis community.
Experience the game changing performance of the EVOQ LC-TQ; experience the innovation from Bruker.
Demand a better solution for LC-MRM quantitative
analysis - experience the Bruker EVOQ LC-TQ solution.
For research use only. Not for use in diagnostic procedures.
www.bruker.com


