Embed Size (px)
Citation preview
RESEARCH ARTICLE
Scent Lure Effect on Camera-Trap BasedLeopard Density EstimatesAlexander Richard Braczkowski1*, Guy Andrew Balme2,3, Amy Dickman1,4,Julien Fattebert2,5, Paul Johnson1, Tristan Dickerson2, David Whyte Macdonald1,Luke Hunter2
1 Wildlife Conservation Research Unit, Department of Zoology, University of Oxford, The Recanati-KaplanCentre, Tubney House, Tubney, Oxfordshire, United Kingdom, 2 Panthera, 8 West 40th Street,18th Floor,New York, New York, United States of America, 3 Department of Biological Sciences, University of CapeTown, Rondebosch, South Africa, 4 Ruaha Carnivore Project, Iringa, Tanzania, 5 School of Life Sciences,University of Kwazulu-Natal, Westville Campus, Durban, South Africa
AbstractDensity estimates for large carnivores derived from camera surveys often have wide confi-
dence intervals due to low detection rates. Such estimates are of limited value to authorities,
which require precise population estimates to inform conservation strategies. Using lures
can potentially increase detection, improving the precision of estimates. However, by alter-
ing the spatio-temporal patterning of individuals across the camera array, lures may violate
closure, a fundamental assumption of capture-recapture. Here, we test the effect of scent
lures on the precision and veracity of density estimates derived from camera-trap surveys
of a protected African leopard population. We undertook two surveys (a ‘control’ and ‘treat-
ment’ survey) on Phinda Game Reserve, South Africa. Survey design remained consistent
except a scent lure was applied at camera-trap stations during the treatment survey. Lures
did not affect the maximummovement distances (p = 0.96) or temporal activity of female
(p = 0.12) or male leopards (p = 0.79), and the assumption of geographic closure was met
for both surveys (p >0.05). The numbers of photographic captures were also similar for con-
trol and treatment surveys (p = 0.90). Accordingly, density estimates were comparable
between surveys (although estimates derived using non-spatial methods (7.28–9.28 leop-
ards/100km2) were considerably higher than estimates from spatially-explicit methods
(3.40–3.65 leopards/100km2). The precision of estimates from the control and treatment
surveys, were also comparable and this applied to both non-spatial and spatial methods of
estimation. Our findings suggest that at least in the context of leopard research in productive
habitats, the use of lures is not warranted.
IntroductionCamera-traps are widely used as a research tool to study cryptic species [1]. In particular,closed capture-recapture (CR) models are often used on camera-trapping data to estimate the
PLOSONE | DOI:10.1371/journal.pone.0151033 April 6, 2016 1 / 14
a11111
OPEN ACCESS
Citation: Braczkowski AR, Balme GA, Dickman A,Fattebert J, Johnson P, Dickerson T, et al. (2016)Scent Lure Effect on Camera-Trap Based LeopardDensity Estimates. PLoS ONE 11(4): e0151033.doi:10.1371/journal.pone.0151033
Editor: Raphaël Arlettaz, University of Bern,SWITZERLAND
Received: February 19, 2015
Accepted: February 23, 2016
Published: April 6, 2016
Copyright: © 2016 Braczkowski et al. This is anopen access article distributed under the terms of theCreative Commons Attribution License, which permitsunrestricted use, distribution, and reproduction in anymedium, provided the original author and source arecredited.
Data Availability Statement: All relevant data arewithin the paper and its Supporting Information files.
Funding: Panthera New York provided vehicles,camera-traps and funding for fieldwork. Albert andDidy Hartog and the Timbo-Stichting Foundation alsoprovided funding for fieldwork. The funders had norole in study design, data collection and analysis,decision to publish, or preparation of the manuscript.
Competing Interests: The authors have declaredthat no competing interests exist.
population abundance and density of large carnivores [2]. This method has recently beenstrengthened by incorporating data on spatial information of captured individuals into the CRframework, removing the edge effect typically associated with traditional non-spatial estima-tors [3], [4]. Importantly, the effective survey area is no longer defined by the inclusion of anad hoc buffer extending beyond the camera-trap grid [5], but by a homogenous distribution ofpotential home-range centres, from which density is estimated [3], [6]. Previous non-spatialestimators did not allow for demographic processes like immigration or emigration in their sta-tistical framework in order to interpret N in a meaningful way, and also assumed geographicand demographic closure [1]. Contrastingly new spatial methods relax geographic closure andallow for temporary movement of individuals around the state space [7].
Despite these recent advances, biologists continue to seek ways to improve camera-trap sur-veys; most notably, their precision given the low detection rates often associated with them [8].Precise population estimates are required to inform appropriate conservation actions and tomonitor the outcomes of management decisions [9]. Increasing the number of recaptures canreduce error but this may also violate the fundamental principles of CR; as sampling periodsmust be short enough to prevent any demographic processes to occur [10], [11]. Similarly,increasing sampling effort by increasing the number of camera-traps deployed is not alwayslogistically feasible [12]. Increasing the precision of camera-trap studies can be improved byaugmenting camera-trap data with ancillary biological information e.g. from faecal DNA [13],[14], but even this may be practically challenging and an inability to age scats or classify thoseof juveniles may overinflate density estimates. This was shown by Jenecka et al [15] working onsnow leopards in the Gobi desert of Mongolia.
An alternative option increasingly used in camera-trap studies is to entice animals to cam-era-traps by placing an attractant nearby [16]. This may be a scent lure such as a perfume/cologne [17], [18] or a food attractant that is inaccessible to the animal [8]. Baiting is anotherstrategy and entails the use of a food reward such as a carcass or meat [19], [20], [21]. However,the use of attractants can be laborious and expensive, and they are only likely warranted if theyincrease capture rates significantly [16]. Attractants may also influence the movement of indi-viduals on and off the camera-trap array, potentially violating the assumption of geographicclosure [8], but this is relaxed in SCR and individuals may move temporarily around the cam-era-trap grid [7]. They may also have variable effects on animals depending on their age, sex orresident status. Despite this, attractants have been used in camera-trap studies on species rang-ing from rodents to large carnivores [19], [20]. The use of lures could also be useful if the totalnumber of animal detections at a sampling site may be used and no sub-division of capturesinto individual temporal occasions occurs [22].
Attaining a better understanding of the effects of attractants in camera-trap surveys is neces-sary to determine whether they are an appropriate means of improving the precision of popula-tion density estimates.
In this paper we examine how the use of a scent lure affects the behaviour of African leop-ards Panthera pardus during a camera-trap survey, and the precision of the resultant densityestimates. We use leopards as a model species as, like many large carnivores, they are of conser-vation concern as they are sensitive to anthropogenic mortality and have suffered significantrange loss in recent decades [23]. Leopards are also important revenue generators for trophyhunting [24] and photo-tourism [25] industries. Therefore, accurate and precise estimates ofleopard population density are required to inform conservation and management practices[26], but leopard numbers are difficult to monitor. In this paper we assess (i) whether the useof lures violates the assumptions of geographic closure by examining the spatio-temporal pat-terning (as defined by the distances animals move between camera-traps, and the timing ofphotographic captures) of leopard captures in a control (i.e. non-lure) and treatment survey
Lure Effect on Leopard Density Estimates
PLOS ONE | DOI:10.1371/journal.pone.0151033 April 6, 2016 2 / 14
(scent lure), (ii) whether the use of lures significantly increases the number of leopard capturesand recaptures, and finally (iii) how precision and density estimates varied between a tradi-tional non-spatial CR density estimation method and two recent spatially-explicit CRapproaches.
Methods
Ethics statementWe obtained permission to perform leopard research on Phinda Game Reserve from the pro-vincial conservation authority, Ezemvelo Kwazulu-Natal Wildlife (permit number HO/4004/07), and by & Beyond, the management authority on Phinda Game Reserve. Ethical clearancefor this research was provided by the University of Kwazulu-Natal Ethics Committee (approval051/12/Animal).
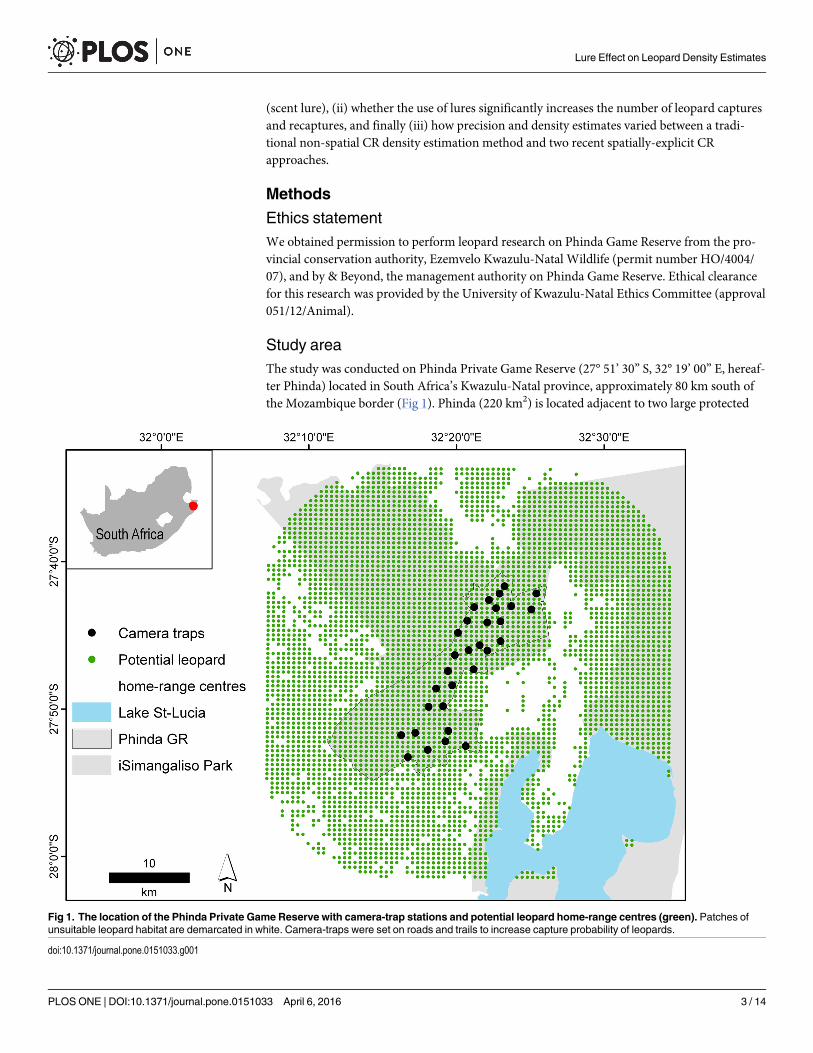
Study areaThe study was conducted on Phinda Private Game Reserve (27° 51’ 30” S, 32° 19’ 00” E, hereaf-ter Phinda) located in South Africa’s Kwazulu-Natal province, approximately 80 km south ofthe Mozambique border (Fig 1). Phinda (220 km2) is located adjacent to two large protected
Fig 1. The location of the Phinda Private Game Reserve with camera-trap stations and potential leopard home-range centres (green). Patches ofunsuitable leopard habitat are demarcated in white. Camera-traps were set on roads and trails to increase capture probability of leopards.
doi:10.1371/journal.pone.0151033.g001
Lure Effect on Leopard Density Estimates
PLOS ONE | DOI:10.1371/journal.pone.0151033 April 6, 2016 3 / 14
reserves, the Mkhuze Game Reserve and the St Lucia Wetland Park. The landscape is domi-nated by savanna interspersed with broad-leafed woodland, grassland and relict patches ofLicuati Sand Forest, a threatened and fragmented tropical dry forest with high levels of plantand animal endemism. Further details on the study area and its faunal assemblage may befound in [27]. Importantly, Phinda also borders a number of private game reserves, cattleranches and local communities. However, leopard hunting on the ranches surrounding Phindahas largely stopped allowing for a population recovery of leopards [9]. We therefore feel experi-menting with lures during camera-trap surveys is warranted as leopards who have home-ranges beyond Phinda’s border are unlikely to encounter intentionally placed scent trails.
Camera-trappingWe implemented two camera-trap surveys—a ‘control survey’ where no scent lures weredeployed, which ran from 14 August–22 September 2012, and a ‘treatment survey’ where scentlures were deployed, which ran from 06 October–14 November 2012. Both surveys lasted 40days and the camera-trap array remained consistent (Fig 1). We used Panthera1 IV digitalcamera-traps, set out in a paired format across 30 stations, totalling 60 camera-traps (1200camera-trap nights). At least one camera-trap site was present per mean female leopard home-range (30 km2) [28] to ensure no animal had a zero probability of capture (mean camera spac-ing = 1.68 km) [5]. Camera-traps were mounted to wooden posts, 40 cm from the ground andwere monitored every four days to replace memory cards and batteries, and to administerlures.
Leopards regularly use roads during territorial patrols and are often attracted to decompos-ing carcasses upon which they scavenge [29], [30]. Our lure therefore comprised a scent trail ofdecomposed entrails from the three main leopard prey species in Phinda, nyala Tragelaphusangasii, impala Aepyceros melampus, and warthog Phacochoerus africanus [27] that was depos-ited on the roads along which our camera-traps were placed. The majority of entrails werefrom nyala that had died during game translocation operations, which Phinda facilitatedbetween June-November 2012. The other species were used if found opportunistically. Thescent trail was laid on roads for a distance of 500 metres on either side of camera-traps andrefreshed every four days. This protocol is similar to that employed by trophy hunters wishingto attract a leopard to a bait near a shooting hide [31]. However, as we provided no reward forleopards, we considered our scent trail a lure rather than bait. We created separate capture his-tories for leopards photographed in the control and treatment surveys, in order to compare clo-sure estimates, distances moved by individuals, the times of their captures and densityestimates. The identity of leopards was determined by the unique spot patterns on their pelage[32], and their sex was estimated using distinctive morphological features [33]. We used aFischer’s exact test [34] to examine differences in capture rates among sex classes in the controland treatment surveys.
Population closureLeopards are long-lived (up to 19 years in the wild) [26]; hence, our survey period of 40 daysseems sufficiently short to assume demographic closure [9]. We assessed geographic closureusing the closure test of Otis et al [35] which assumes heterogeneity in recapture probability.We also used the closure test of Stanley and Burnham [36] which assumes a variation in timeof recapture probability. Both tests were run in the statistical programme CloseTest version 3(available online from: http://www.fort.usgs.gov/products/software/clostest/).
Lure Effect on Leopard Density Estimates
PLOS ONE | DOI:10.1371/journal.pone.0151033 April 6, 2016 4 / 14
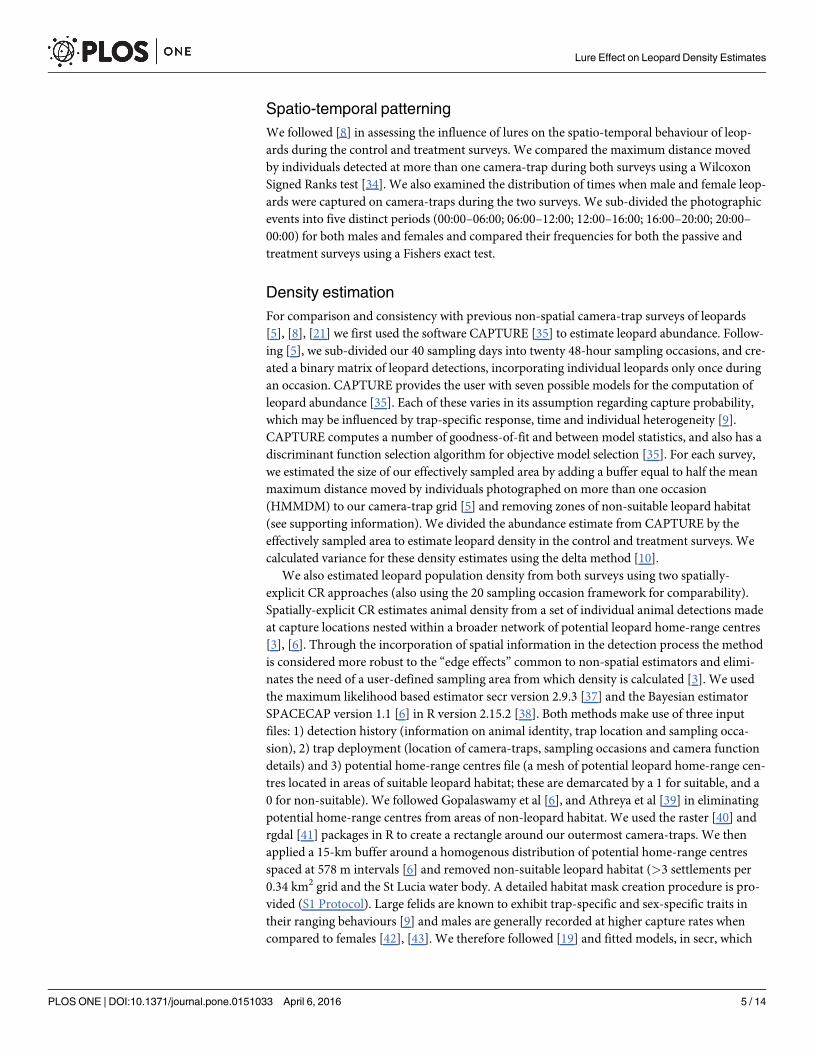
Spatio-temporal patterningWe followed [8] in assessing the influence of lures on the spatio-temporal behaviour of leop-ards during the control and treatment surveys. We compared the maximum distance movedby individuals detected at more than one camera-trap during both surveys using a WilcoxonSigned Ranks test [34]. We also examined the distribution of times when male and female leop-ards were captured on camera-traps during the two surveys. We sub-divided the photographicevents into five distinct periods (00:00–06:00; 06:00–12:00; 12:00–16:00; 16:00–20:00; 20:00–00:00) for both males and females and compared their frequencies for both the passive andtreatment surveys using a Fishers exact test.
Density estimationFor comparison and consistency with previous non-spatial camera-trap surveys of leopards[5], [8], [21] we first used the software CAPTURE [35] to estimate leopard abundance. Follow-ing [5], we sub-divided our 40 sampling days into twenty 48-hour sampling occasions, and cre-ated a binary matrix of leopard detections, incorporating individual leopards only once duringan occasion. CAPTURE provides the user with seven possible models for the computation ofleopard abundance [35]. Each of these varies in its assumption regarding capture probability,which may be influenced by trap-specific response, time and individual heterogeneity [9].CAPTURE computes a number of goodness-of-fit and between model statistics, and also has adiscriminant function selection algorithm for objective model selection [35]. For each survey,we estimated the size of our effectively sampled area by adding a buffer equal to half the meanmaximum distance moved by individuals photographed on more than one occasion(HMMDM) to our camera-trap grid [5] and removing zones of non-suitable leopard habitat(see supporting information). We divided the abundance estimate from CAPTURE by theeffectively sampled area to estimate leopard density in the control and treatment surveys. Wecalculated variance for these density estimates using the delta method [10].
We also estimated leopard population density from both surveys using two spatially-explicit CR approaches (also using the 20 sampling occasion framework for comparability).Spatially-explicit CR estimates animal density from a set of individual animal detections madeat capture locations nested within a broader network of potential leopard home-range centres[3], [6]. Through the incorporation of spatial information in the detection process the methodis considered more robust to the “edge effects” common to non-spatial estimators and elimi-nates the need of a user-defined sampling area from which density is calculated [3]. We usedthe maximum likelihood based estimator secr version 2.9.3 [37] and the Bayesian estimatorSPACECAP version 1.1 [6] in R version 2.15.2 [38]. Both methods make use of three inputfiles: 1) detection history (information on animal identity, trap location and sampling occa-sion), 2) trap deployment (location of camera-traps, sampling occasions and camera functiondetails) and 3) potential home-range centres file (a mesh of potential leopard home-range cen-tres located in areas of suitable leopard habitat; these are demarcated by a 1 for suitable, and a0 for non-suitable). We followed Gopalaswamy et al [6], and Athreya et al [39] in eliminatingpotential home-range centres from areas of non-leopard habitat. We used the raster [40] andrgdal [41] packages in R to create a rectangle around our outermost camera-traps. We thenapplied a 15-km buffer around a homogenous distribution of potential home-range centresspaced at 578 m intervals [6] and removed non-suitable leopard habitat (>3 settlements per0.34 km2 grid and the St Lucia water body. A detailed habitat mask creation procedure is pro-vided (S1 Protocol). Large felids are known to exhibit trap-specific and sex-specific traits intheir ranging behaviours [9] and males are generally recorded at higher capture rates whencompared to females [42], [43]. We therefore followed [19] and fitted models, in secr, which
Lure Effect on Leopard Density Estimates
PLOS ONE | DOI:10.1371/journal.pone.0151033 April 6, 2016 5 / 14
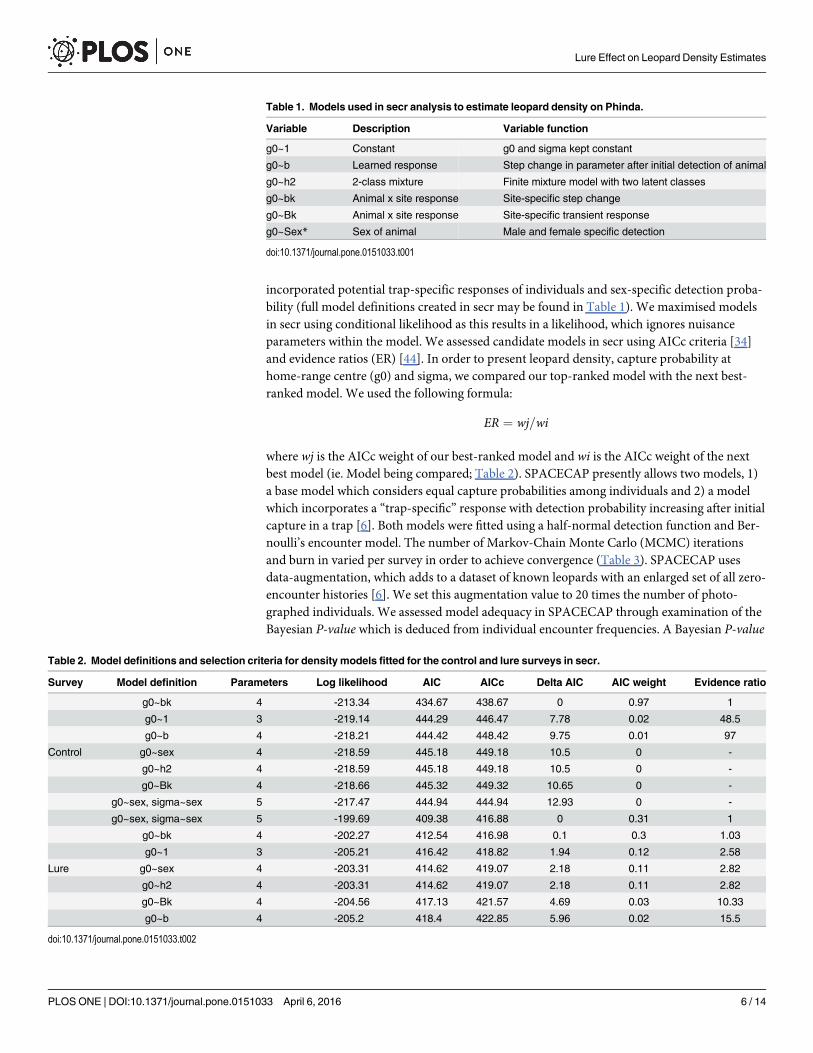
incorporated potential trap-specific responses of individuals and sex-specific detection proba-bility (full model definitions created in secr may be found in Table 1). We maximised modelsin secr using conditional likelihood as this results in a likelihood, which ignores nuisanceparameters within the model. We assessed candidate models in secr using AICc criteria [34]and evidence ratios (ER) [44]. In order to present leopard density, capture probability athome-range centre (g0) and sigma, we compared our top-ranked model with the next best-ranked model. We used the following formula:
ER ¼ wj=wi
where wj is the AICc weight of our best-ranked model and wi is the AICc weight of the nextbest model (ie. Model being compared; Table 2). SPACECAP presently allows two models, 1)a base model which considers equal capture probabilities among individuals and 2) a modelwhich incorporates a “trap-specific” response with detection probability increasing after initialcapture in a trap [6]. Both models were fitted using a half-normal detection function and Ber-noulli’s encounter model. The number of Markov-Chain Monte Carlo (MCMC) iterationsand burn in varied per survey in order to achieve convergence (Table 3). SPACECAP usesdata-augmentation, which adds to a dataset of known leopards with an enlarged set of all zero-encounter histories [6]. We set this augmentation value to 20 times the number of photo-graphed individuals. We assessed model adequacy in SPACECAP through examination of theBayesian P-value which is deduced from individual encounter frequencies. A Bayesian P-value
Table 1. Models used in secr analysis to estimate leopard density on Phinda.
Variable Description Variable function
g0~1 Constant g0 and sigma kept constant
g0~b Learned response Step change in parameter after initial detection of animal
g0~h2 2-class mixture Finite mixture model with two latent classes
g0~bk Animal x site response Site-specific step change
g0~Bk Animal x site response Site-specific transient response
g0~Sex* Sex of animal Male and female specific detection
doi:10.1371/journal.pone.0151033.t001
Table 2. Model definitions and selection criteria for density models fitted for the control and lure surveys in secr.
Survey Model definition Parameters Log likelihood AIC AICc Delta AIC AIC weight Evidence ratio
g0~bk 4 -213.34 434.67 438.67 0 0.97 1
g0~1 3 -219.14 444.29 446.47 7.78 0.02 48.5
g0~b 4 -218.21 444.42 448.42 9.75 0.01 97
Control g0~sex 4 -218.59 445.18 449.18 10.5 0 -
g0~h2 4 -218.59 445.18 449.18 10.5 0 -
g0~Bk 4 -218.66 445.32 449.32 10.65 0 -
g0~sex, sigma~sex 5 -217.47 444.94 444.94 12.93 0 -
g0~sex, sigma~sex 5 -199.69 409.38 416.88 0 0.31 1
g0~bk 4 -202.27 412.54 416.98 0.1 0.3 1.03
g0~1 3 -205.21 416.42 418.82 1.94 0.12 2.58
Lure g0~sex 4 -203.31 414.62 419.07 2.18 0.11 2.82
g0~h2 4 -203.31 414.62 419.07 2.18 0.11 2.82
g0~Bk 4 -204.56 417.13 421.57 4.69 0.03 10.33
g0~b 4 -205.2 418.4 422.85 5.96 0.02 15.5
doi:10.1371/journal.pone.0151033.t002
Lure Effect on Leopard Density Estimates
PLOS ONE | DOI:10.1371/journal.pone.0151033 April 6, 2016 6 / 14
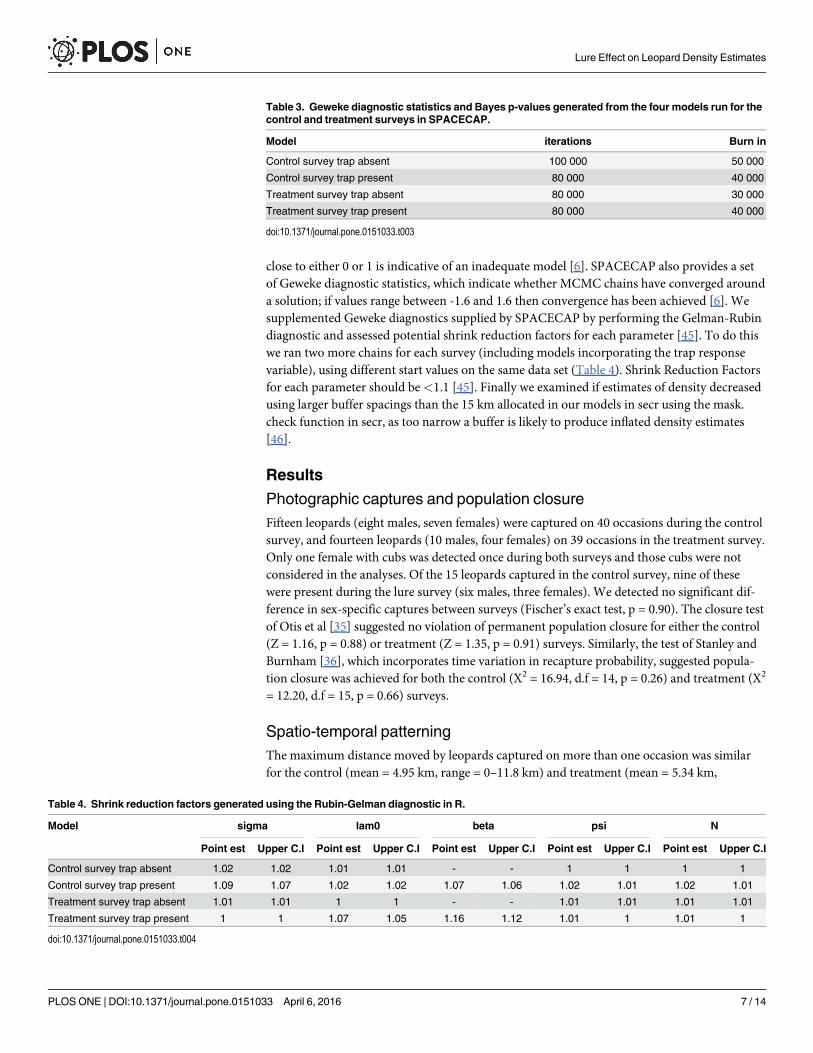
close to either 0 or 1 is indicative of an inadequate model [6]. SPACECAP also provides a setof Geweke diagnostic statistics, which indicate whether MCMC chains have converged arounda solution; if values range between -1.6 and 1.6 then convergence has been achieved [6]. Wesupplemented Geweke diagnostics supplied by SPACECAP by performing the Gelman-Rubindiagnostic and assessed potential shrink reduction factors for each parameter [45]. To do thiswe ran two more chains for each survey (including models incorporating the trap responsevariable), using different start values on the same data set (Table 4). Shrink Reduction Factorsfor each parameter should be<1.1 [45]. Finally we examined if estimates of density decreasedusing larger buffer spacings than the 15 km allocated in our models in secr using the mask.check function in secr, as too narrow a buffer is likely to produce inflated density estimates[46].
Results
Photographic captures and population closureFifteen leopards (eight males, seven females) were captured on 40 occasions during the controlsurvey, and fourteen leopards (10 males, four females) on 39 occasions in the treatment survey.Only one female with cubs was detected once during both surveys and those cubs were notconsidered in the analyses. Of the 15 leopards captured in the control survey, nine of thesewere present during the lure survey (six males, three females). We detected no significant dif-ference in sex-specific captures between surveys (Fischer’s exact test, p = 0.90). The closure testof Otis et al [35] suggested no violation of permanent population closure for either the control(Z = 1.16, p = 0.88) or treatment (Z = 1.35, p = 0.91) surveys. Similarly, the test of Stanley andBurnham [36], which incorporates time variation in recapture probability, suggested popula-tion closure was achieved for both the control (X2 = 16.94, d.f = 14, p = 0.26) and treatment (X2
= 12.20, d.f = 15, p = 0.66) surveys.
Spatio-temporal patterningThe maximum distance moved by leopards captured on more than one occasion was similarfor the control (mean = 4.95 km, range = 0–11.8 km) and treatment (mean = 5.34 km,
Table 3. Geweke diagnostic statistics and Bayes p-values generated from the four models run for thecontrol and treatment surveys in SPACECAP.
Model iterations Burn in
Control survey trap absent 100 000 50 000
Control survey trap present 80 000 40 000
Treatment survey trap absent 80 000 30 000
Treatment survey trap present 80 000 40 000
doi:10.1371/journal.pone.0151033.t003
Table 4. Shrink reduction factors generated using the Rubin-Gelman diagnostic in R.
Model sigma lam0 beta psi N
Point est Upper C.I Point est Upper C.I Point est Upper C.I Point est Upper C.I Point est Upper C.I
Control survey trap absent 1.02 1.02 1.01 1.01 - - 1 1 1 1
Control survey trap present 1.09 1.07 1.02 1.02 1.07 1.06 1.02 1.01 1.02 1.01
Treatment survey trap absent 1.01 1.01 1 1 - - 1.01 1.01 1.01 1.01
Treatment survey trap present 1 1 1.07 1.05 1.16 1.12 1.01 1 1.01 1
doi:10.1371/journal.pone.0151033.t004
Lure Effect on Leopard Density Estimates
PLOS ONE | DOI:10.1371/journal.pone.0151033 April 6, 2016 7 / 14
range = 0–10.4 km) surveys. Similarly, we found no difference in the maximum distancemoved by specific individuals captured in both surveys (W = 31, p = 0.96). We found no differ-ence in time-specific captures between the passive and treatment survey for males (Fisher’sExact test, p = 0.79) and females (Fisher’s Exact test, p = 0.12).
Photographic captures and density estimatesThe heterogeneity model M(h) fit our data best for both the control and treatment surveys inCAPTURE. Using the jackknife estimator, CAPTURE estimated population abundance (SE) at17±4.3 leopards for the control survey, yielding a density (SE) of 7.28±2 leopards/100 km2
when a buffer based on HMMDM (2.48 km) was applied to our survey area. Population abun-dance (SE) estimated by CAPTURE for the treatment survey was 23±6.6 leopards, resulting ina density (SE) of 9.28±2.9 leopards/100 km2 with a HMMDM buffer of 2.67 km.
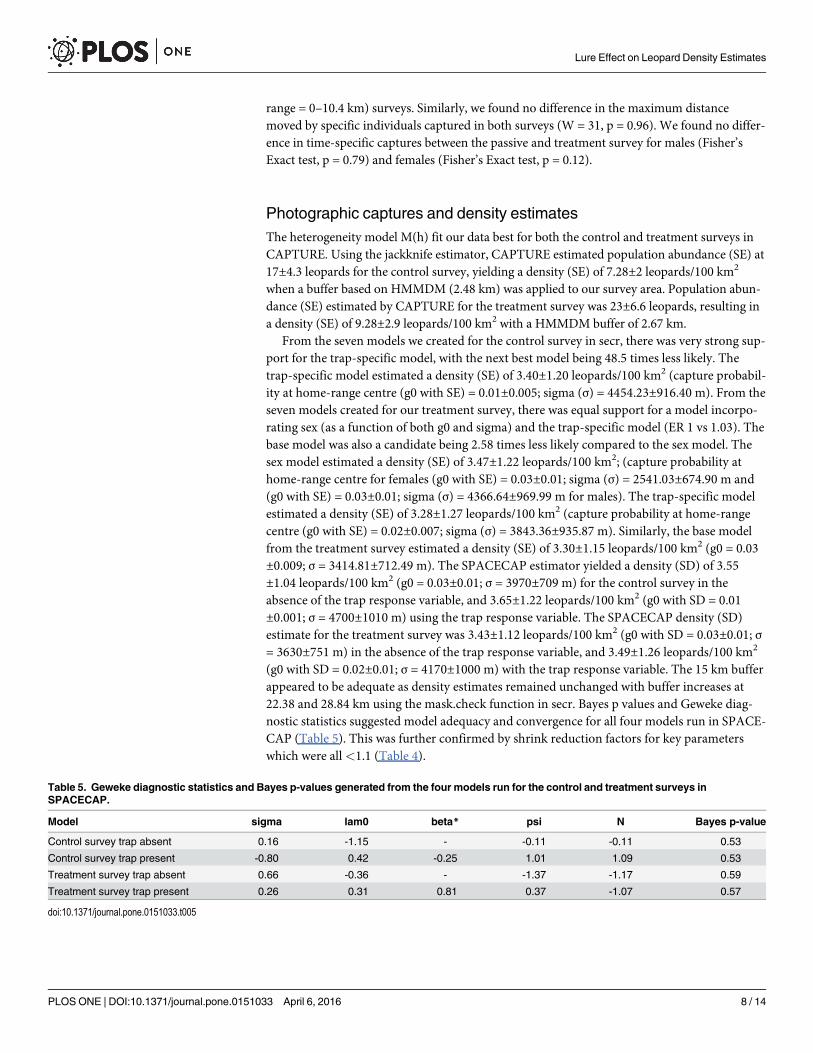
From the seven models we created for the control survey in secr, there was very strong sup-port for the trap-specific model, with the next best model being 48.5 times less likely. Thetrap-specific model estimated a density (SE) of 3.40±1.20 leopards/100 km2 (capture probabil-ity at home-range centre (g0 with SE) = 0.01±0.005; sigma (σ) = 4454.23±916.40 m). From theseven models created for our treatment survey, there was equal support for a model incorpo-rating sex (as a function of both g0 and sigma) and the trap-specific model (ER 1 vs 1.03). Thebase model was also a candidate being 2.58 times less likely compared to the sex model. Thesex model estimated a density (SE) of 3.47±1.22 leopards/100 km2; (capture probability athome-range centre for females (g0 with SE) = 0.03±0.01; sigma (σ) = 2541.03±674.90 m and(g0 with SE) = 0.03±0.01; sigma (σ) = 4366.64±969.99 m for males). The trap-specific modelestimated a density (SE) of 3.28±1.27 leopards/100 km2 (capture probability at home-rangecentre (g0 with SE) = 0.02±0.007; sigma (σ) = 3843.36±935.87 m). Similarly, the base modelfrom the treatment survey estimated a density (SE) of 3.30±1.15 leopards/100 km2 (g0 = 0.03±0.009; σ = 3414.81±712.49 m). The SPACECAP estimator yielded a density (SD) of 3.55±1.04 leopards/100 km2 (g0 = 0.03±0.01; σ = 3970±709 m) for the control survey in theabsence of the trap response variable, and 3.65±1.22 leopards/100 km2 (g0 with SD = 0.01±0.001; σ = 4700±1010 m) using the trap response variable. The SPACECAP density (SD)estimate for the treatment survey was 3.43±1.12 leopards/100 km2 (g0 with SD = 0.03±0.01; σ= 3630±751 m) in the absence of the trap response variable, and 3.49±1.26 leopards/100 km2
(g0 with SD = 0.02±0.01; σ = 4170±1000 m) with the trap response variable. The 15 km bufferappeared to be adequate as density estimates remained unchanged with buffer increases at22.38 and 28.84 km using the mask.check function in secr. Bayes p values and Geweke diag-nostic statistics suggested model adequacy and convergence for all four models run in SPACE-CAP (Table 5). This was further confirmed by shrink reduction factors for key parameterswhich were all<1.1 (Table 4).
Table 5. Geweke diagnostic statistics and Bayes p-values generated from the four models run for the control and treatment surveys inSPACECAP.
Model sigma lam0 beta* psi N Bayes p-value
Control survey trap absent 0.16 -1.15 - -0.11 -0.11 0.53
Control survey trap present -0.80 0.42 -0.25 1.01 1.09 0.53
Treatment survey trap absent 0.66 -0.36 - -1.37 -1.17 0.59
Treatment survey trap present 0.26 0.31 0.81 0.37 -1.07 0.57
doi:10.1371/journal.pone.0151033.t005
Lure Effect on Leopard Density Estimates
PLOS ONE | DOI:10.1371/journal.pone.0151033 April 6, 2016 8 / 14
DiscussionAn important foundation for estimating population abundance and subsequent estimates ofdensity using capture-recapture sampling is geographic closure [9]. Lures and other attractantsmay compromise geographic closure by prompting temporary immigration or emigration ofanimals into or out of a survey area. Although our results from the two closure tests suggestthat there was no breach of geographic closure during the lure survey, this does not rule out amovement of individuals either inside or outside the camera-trap grid. We had no GPS collaredleopards at the time of both surveys to confirm this. We however cannot discount the possibil-ity that our closure tests suffered from a Type II statistical error. Gerber et al [8] suggested thatthe Pradel model [47] was more suitable for evaluating population closure (as it is highly flexi-ble in modelling recapture variation and less susceptible to statistical errors when there is atrap-specific effect), but our sample sizes were inadequate to run this analysis. Importantlyhowever, assumptions of geographic closure in SCR are more relaxed and are robust to tempo-rary movements of individuals on the borders of the camera-trap grid [7].
The use of lures also did not appear to have a significant effect on the distances moved byleopards or the timing of leopard captures. Gerber et al [8] also found that the presence of alure did not influence the distances moved by Malagasy civet Fossa fossana or the temporal dis-tribution of their captures.
Importantly our model selection process revealed substantial evidence for the “site-spe-cific learned response”model bk, with individuals becoming “trap happy” in the control sur-vey. This result may seem surprising as the camera trap sites were not baited nor lured in thecontrol survey. We would have rather expected trap shyness. The “site-specific learnedresponse” also did not become more strongly positive when scent lures were used in the treat-ment. Instead there was an equal support for a model incorporating sex, the site specificbehavioural model and the base model. The fact that we observed a behavioural effect whenthere was no lure, there is a possibility that there was some other unmodelled effect (possiblysite-site detector differences). Additionally although the use of lures did not appear to affectthe behaviour of leopards (behaviour being defined as the distances they moved betweencamera-traps and when they were caught on camera-traps), they also did not improve cap-ture or recapture rates, and hence the precision of our density estimates. This may be due tothe limited range over which our lures were effective. Felids do not possess a particularlyacute sense of smell [48]; hence, leopards were only likely to detect scent trails in close prox-imity. It is also possible that leopards may be more predisposed to scavenging, and thus torespond to lures, in more arid areas where prey abundance is lower. Phinda is a productivesystem and earlier research demonstrated that the leopard population was not constrained byprey availability [49].
Studies on leopards elsewhere and carnivores more broadly suggest that capture rates maybe increased by using baits (i.e. where the target species is rewarded) rather than lures. Grant[21] placed stillborn cattle foetuses near camera-traps in Mangwe, Zimbabwe, and showed atwenty-fold increase in the number of leopard captures when compared to a failed non-baitedsurvey. Similarly, a study in the Bubye valley conservancy [19] found that the presence ofbaits near camera-traps increased leopard captures four-fold. Although at the outset theseresults appear promising, the precision estimates of Du Preez et al. [19] only increased mar-ginally with the presence of baits (2–4%) and at an additional cost of 314 man-hours per sur-vey [50]. Leopards can remain sedentary, feeding on a single carcass for up to a week if it islarge enough [29]. Such a change in an individual’s daily routine may be significant in thecontext of a 40-day camera-trap survey, especially if non-spatial methods are used. Specifi-cally in reducing the number of detections of an individual leopard on different camera-traps,
Lure Effect on Leopard Density Estimates
PLOS ONE | DOI:10.1371/journal.pone.0151033 April 6, 2016 9 / 14
which could underestimate the movement parameter sigma. However SCR models enable theuser to adjust the encounter probability, sigma and density when a trap-specific response isadded to the model. Even when using non-spatial HMMDM [19] suggested no significantchanges in the ranging behaviours of leopards in their study, although they did not explicitlytest for closure violations. The detection distance of baits may also be larger than lures,artificially drawing individuals into the sampling area and potentially biasing populationestimates.
The density estimates from the two spatially-explicit capture-recapture approaches (maxi-mum likelihood and Bayesian) were comparable, but were significantly lower than estimatesderived using traditional, non-spatial methods. This concurs with previous research whichshows that non-spatial CR analyses typically overestimate population density by underestimat-ing the distances moved by animals [51], [52], [53]. Furthermore, spatially-explicit CR modelsare generally more robust to changes in the camera-trap array, the sizes of sampled areas andthe movement patterns of individuals [54]. This was reflected in our study by a 22% increase indensity estimates between the control and treatment surveys using the non-spatial estimator,compared to a nominal change using spatial estimators. It was highly unlikely that leoparddensity varied much over our study given its duration and the short interval between surveys.This was reflected by the similar density estimates obtained from our candidate models in secrand SPACECAP over the combined survey period.
The application of scent trails was laborious and difficult to justify for our study given thelack of improvement in the precision of density estimates. However, capture probabilities athome-range centre among our surveys were similar to other recent studies employing spa-tially-explicit CR methods to estimate leopard density (eg. in the Limpopo province of SouthAfrica [46], p = 0.03; and a post conflict landscape of Cambodia [55], p = <0.01–0.04), andwere sufficiently high to produce reliable population estimates even in the absence of attrac-tants. This may not be the case in lower density populations, or for species, which are lessroutine in their movement patterns and thus more difficult to camera trap. In such cases theuse of an attractant may be warranted. For felids, this may require the deployment of baitsrather than lures; however, we strongly recommend that this only be done after the effects ofbaiting on population and spatial parameters have been assessed, preferably using a similarapproach as this study (i.e. with a control and treatment period). Lures may be adequate forspecies with superior olfactory senses such as hyaenids [16] or viverrids [8], where they arelikely preferable to baits. The use of lures could potentially also be warranted if a certainvariety is found to be particularly successful. Thorn et al [16] and Braczkowski et al [18] fol-lowed this approach in the Limpopo and Cape respectively, and attempted to examine lurepreference.
An alternative way to increase the capture rates of animals during surveys (and conse-quently measures of precision) is by lengthening the duration of surveys. This is indeed recom-mended by Tobler et al [2], who suggest that higher captures be preferred over short surveyperiods. Borchers et al [56] also developed a continuous time SCR model and showed thatusing count (rather than binary) data improved parameter estimates. Both of these approachescould help to increase the precision of density estimates.
Our results suggest that although using lures do not lead to the violation of CR modelassumptions in a savanna environment, they also do not improve the precision of density esti-mates, so may be of limited use for leopard researchers. Insights such as these are important inassisting biologists and conservation managers in determining which approaches should beapplied or avoided for the most cost- and time-efficient method to enumerate leopards andpotentially other large carnivores.
Lure Effect on Leopard Density Estimates
PLOS ONE | DOI:10.1371/journal.pone.0151033 April 6, 2016 10 / 14
Supporting InformationS1 Dataset. SPACECAP control survey captures.(CSV)
S2 Dataset. SPACECAP lure survey captures.(CSV)
S3 Dataset. SPACECAP trap layout.(CSV)
S4 Dataset. SPACECAP habitat suitability mask.(CSV)
S5 Dataset. secr control survey captures.(TXT)
S6 Dataset. secr lure survey captures.(TXT)
S7 Dataset. secr survey trap layout.(TXT)
S1 Protocol. Suitable leopard habitat mask creation procedure implemented in the R statis-tical environment.(DOCX)
S1 Results. SPACECAP control survey trap absent output.(TXT)
S2 Results. SPACECAP control survey trap present output.(TXT)
S3 Results. SPACECAP lure survey trap absent output.(TXT)
S4 Results. SPACECAP lure survey trap present output.(TXT)
AcknowledgmentsWe would like to thank Albert and Didy Hartog, the Timbo-Stichting Foundation andPanthera for funding the study and the provision of materials to perform this research.&Beyond is thanked for access to research sites. DWM thanks the Robertson Foundation andthe Recanati-Kaplan Foundation for support. The authors have no conflicts of interest todeclare.
Author ContributionsConceived and designed the experiments: AB GB JF PJ AD. Performed the experiments: ABTD. Analyzed the data: AB JF. Contributed reagents/materials/analysis tools: GB LH. Wrotethe paper: AB GB AD JF PJ DM LH.
References1. O'Connell AF, Nichols JD, Karanth KU. (2010) Camera traps in animal ecology: methods and analyses.
Springer Science & Business Media.
Lure Effect on Leopard Density Estimates
PLOS ONE | DOI:10.1371/journal.pone.0151033 April 6, 2016 11 / 14
2. Tobler MW, Carrillo-Percastegui SE, Zúñiga Hartley A, Powell GV. (2013) High jaguar densities andlarge population sizes in the core habitat of the southwestern Amazon. Biological Conservation 159:375–381.
3. Efford MG, Dawson DK, Robbins CS. (2004) DENSITY: software for analysing capture-recapture datafrom passive detector arrays. Animal Biodiversity Conservation 27: 217–228.
4. Royle JA, Karanth KU, Gopalaswamy AM, Kumar NS. (2009) Bayesian inference in camera trappingstudies for a class of spatial capture-recapture models. Ecology 90: 3233–3244. PMID: 19967878
5. Balme GA, Hunter LTB, Slotow R. (2009a) Evaluating methods for counting cryptic carnivores. Journalof Wildlife Management 73: 433–441.
6. Gopalaswamy AM, Royle JA, Hines JE, Singh P, Jathanna D, Kumar N, et al. (2012) Program SPACE-CAP: software for estimating animal density using spatially explicit capture–recapture models. Methodsin Ecololgy and Evolution 3: 1067–1072.
7. Chandler RB, Royle JA, King DI. (2011) Inference about density and temporary emigration in unmarkedpopulations. Ecology 92: 1429–1435. PMID: 21870617
8. Gerber BD, Karpanty SM, Kelly MJ. (2012) Evaluating the potential biases in carnivore capture–recap-ture studies associated with the use of lure and varying density estimation techniques using photo-graphic-sampling data of the Malagasy civet. Population Ecology 54: 43–54.
9. Balme GA, Slotow R, Hunter LTB. (2009b) Impact of conservation interventions on the dynamics andpersistence of a persecuted leopard (Panthera pardus) population. Biological Conservation 142:2681–2690
10. Karanth KU, Nichols JD. (1998) Estimation of tiger densities in India using photographic captures andrecaptures. Ecology 79: 2852–2862.
11. Williams BK, Nichols JD, Conroy MJ. (2002) Analysis and management of animal populations. Aca-demic Press, San Diego, California, USA.
12. Marnewick K, Funston PJ, Karanth KU. (2008) Evaluating camera trapping as a method for estimatingcheetah abundance in ranching areas. South African Journal of Wildlife Research 38: 59–65.
13. Gopalaswamy AM, Royle JA, Delampady M, Nichols JD, Karanth KU, Macdonald DW. (2012) Densityestimation in tiger populations: combining information for strong inference. Ecology 93: 1741–1751.PMID: 22919919
14. Sollmann R, Tôrres NM, Furtado MM, de Almeida Jácomo AT, Palomares F, Roques S, et al. (2013)Combining camera-trapping and noninvasive genetic data in a spatial capture–recapture frameworkimproves density estimates for the jaguar. Biological Conservation 167: 242–247.
15. Janečka JE, Munkhtsog B, Jackson RM, Naranbaatar G, Mallon DP, MurphyWJ. (2011) Comparisonof noninvasive genetic and camera-trapping techniques for surveying snow leopards. Journal of Mam-malogy 92: 771–783.
16. Thorn M, Scott DM, Green M, Bateman PW, Cameron EZ. (2009) Estimating brown hyaena occupancyusing baited camera traps. South African Journal of Wildlife Research 39: 1–10.
17. Thomas P, Balme G, Hunter L, McCabe-Parodi J. (2005) Using scent attractants to non-invasively col-lect hair samples from cheetahs, leopards and lions. Animal Keepers Forum 7/8: 342–384.
18. Braczkowski A, Watson L. (2013) Observations of leopard and caracal responses to novel scents inSouth Africa. CAT News 58: 13–15.
19. du Preez BD, Loveridge AJ, Macdonald DW. (2014) To bait or not to bait: a comparison of camera-trap-ping methods for estimating leopard Panthera pardus density. Biological Conservation, 176, 153–161.
20. Ariefiandy A, Purwandana D, Seno A, Ciofi C, Jessop TS. (2013) Can camera traps monitor komododragons a large ectothermic predator? PLOSONE. doi: 10.1371/journal.pone.0058800
21. Grant TL. (2012) Leopard population density, home range size and movement patterns in a mixed land-use area of the Mangwe District of Zimbabwe. PhD dissertation. Rhodes University, Grahamstown.
22. Royle JA, Chandler RB, Sollmann R, Gardner B. (2013) Spatial Capture-Recapture. Academic Press,USA.
23. Ray JC, Hunter L, Zigouris J. (2005) Setting conservation and research priorities for larger African car-nivores. Wildlife Conservation Society, New York.
24. Lindsey PA, Alexander R, Frank LG, Mathieson A, Romanach SS. (2006) Potential of trophy hunting tocreate incentives for wildlife conservation in Africa where alternative wildlife‐based land uses may notbe viable. Animal Conservation, 9(3), 283–291.
25. Di Minin E, Fraser I, Slotow R, MacMillan DC. (2012) Understanding heterogeneous preference of tour-ists for big game species: implications for conservation and management. Animal Conservation 16:249–258.
Lure Effect on Leopard Density Estimates
PLOS ONE | DOI:10.1371/journal.pone.0151033 April 6, 2016 12 / 14
26. Balme GA, Lindsey PA, Swanepoel LH, Hunter LT. (2013) Failure of research to address the rangewideconservation needs of large carnivores: leopards in South Africa as a case study. Conservation Letters7: 3–11
27. Balme G, Hunter L, Slotow R. (2007) Feeding habitat selection by hunting leopards Panthera pardus ina woodland savanna: prey catchability versus abundance. Animal Behaviour, 74(3), 589–598.
28. Fattebert J. (2013) Spatial ecology of a leopard population recovering from over-harvest. PhD thesis.University of Kwazulu-Natal, Kwazulu-Natal.
29. Bailey TN. (1993) The African leopard: ecology and behavior of a solitary felid. New York, ColumbiaUniversity Press, USA.
30. Bothma JDP, Walker C. (1999) Larger carnivores of the African savannas. Berlin, Springer, Germany.
31. Braczkowski AR, Balme GA, Dickman A, Macdonald DW, Fattebert J, Dickerson T, et al. (2015) WhoBites the Bullet First? The Susceptibility of LeopardsPanthera pardus to Trophy Hunting. PLOSONE10(4): e0123100. doi: 10.1371/journal.pone.0123100 PMID: 25860139
32. Miththapala S, Seidensticker J, Phillips LG, Fernando SBU, Smallwood JA. (1989) Identification of indi-vidual leopards (Panthera pardus kotiya) using spot pattern variation. Journal of Zoology 218: 527–536.
33. Balme GA, Hunter L, Braczkowski AR. (2012) Applicability of age-based hunting regulations for Africanleopards. PLOS ONE. doi: 10.1371/journal.pone.0035209
34. Zar JH. (1999) Biostatistical analysis. Prentice Hall, New Jersey.
35. Otis DL, Burnham KP, White GC, Anderson DR. (1978) Statistical inference from capture data onclosed animal populations. Wildlife Monographs 62: 1–135.
36. Stanley TR, Burnham KP. (1999) A closure test for time-specific capture-recapture data. Environmentaland Ecological Statistics 6: 197–209.
37. Efford M. (2015) Package secr version 2.9.3.R language for statistical computing.
38. R Development Core Team. (2008) R: A language and environment for statistical computing. R Foun-dation for Statistical Computing, Vienna: Austria.
39. Athreya V, Odden M, Linnell JD, Krishnaswamy J, Karanth U. (2013) Big cats in our backyards: persis-tence of large carnivores in a human dominated landscape in India. PLOS ONE. doi: 10.1371/journal.pone.0057872
40. Hijmans RJ. (2013) Raster package in R. Version 2.2–2.31.
41. Keitt T. (2013) Rgdal package in R. Version 0.8–16.
42. Maputla NW, Chimimba CT, Ferreira SM. (2013) Calibrating a camera trap–based biased mark–recap-ture sampling design to survey the leopard population in the N'wanetsi concession, Kruger NationalPark, South Africa. Afr J Ecol 51: 422–430.
43. Martins Q, Harris S. (2013) Movement, activity and hunting behaviour of leopards in the Cederbergmountains, South Africa. Afr J Ecol 51: 571–579.
44. Mazerolle MJ. (2006) Improving data analysis in herpetology: using Akaike's Information Criterion (AIC)to assess the strength of biological hypotheses. Amphibia Reptilia, 27(2), 169–180.
45. Gelman A, Rubin DB. (1992) Inference from iterative simulation using multiple sequences. Statisticalscience, 457–472.
46. Grey JNC, Kent VT, Hill RA. (2013) Evidence of a High Density Population of Harvested Leopards in aMontane Environment. PloS One. doi: 10.1371/journal.pone.0082832
47. Pradel R (1996) Utilization of capture-mark-recapture for the study of recruitment and population growthrate. Biometrics 52: 703–709.
48. Sunquist M, Sunquist F. (2002) Wild cats of the world. Chicago, University of Chicago Press, USA.
49. Balme GA, Slotow R, Hunter LTB. (2010) Edge effects and the impact of non‐protected areas in carni-vore conservation: leopards in the Phinda–Mkhuze Complex, SouthAfrica. Animal Conservation 13:315–323.
50. Balme G, Hunter L, Robinson H. (2014) Baited camera-trap surveys—Marginally more precise but atwhat cost? A response to du Preez et al. (2014). Biological Conservation 179: 144–145.
51. Obbard ME, Howe EJ, Kyle CJ. (2010) Empirical comparison of density estimators for large carnivores.Journal of Applied Ecology 47: 76–84.
52. Noss AJ, Gardner B, Maffei L, Cuéllar E, Montaño R, Romero‐Muñoz A, et al. (2012) Comparison ofdensity estimation methods for mammal populations with camera traps in the Kaa‐Iya del Gran Chacolandscape. Animal Conservation 15: 527–535.
Lure Effect on Leopard Density Estimates
PLOS ONE | DOI:10.1371/journal.pone.0151033 April 6, 2016 13 / 14
53. Pesenti E, Zimmermann F. (2013) Density estimations of the Eurasian lynx (Lynx lynx) in the SwissAlps. Journal of Mammalogy 94: 73–81.
54. Sollmann R, Furtado MM, Gardner B, Hofer H, Jácomo AT, Tôrres N, et al. (2011) Improving densityestimates for elusive carnivores: accounting for sex-specific detection and movements using spatialcapture–recapture models for jaguars in central Brazil. Biological Conservation, 144(3): 1017–1024.
55. Gray TNE, Prum S. (2012) Leopard density in post‐conflict landscape, Cambodia: Evidence from spa-tially explicit capture–recapture. Journal of Wildlife Management 76: 163–169.
56. Borchers D, Distiller G, Foster R, Harmsen B, Milazzo L. (2014) Continuous‐time spatially explicit cap-ture–recapture models, with an application to a jaguar camera‐trap survey. Methods in Ecology andEvolution, 5: 656–665.
Lure Effect on Leopard Density Estimates
PLOS ONE | DOI:10.1371/journal.pone.0151033 April 6, 2016 14 / 14


